UNITED STATES
SECURITIES AND EXCHANGE COMMISSION
Washington, D.C. 20549
FORM N-CSR
CERTIFIED SHAREHOLDER REPORT OF REGISTERED
MANAGEMENT INVESTMENT COMPANIES
Investment Company Act file number:
811-22175
ALPS ETF TRUST
(Exact name of registrant as specified in charter)
1290 Broadway, Suite 1100, Denver, Colorado 80203
(Address of principal executive offices) (Zip code)
Andrea E. Kuchli, Esq., Secretary
ALPS ETF Trust
1290 Broadway, Suite 1100
Denver, Colorado 80203
(Name and address of agent for service)
Registrant’s Telephone Number, including Area Code:(303) 623-2577
Date of fiscal year end:November 30
Date of reporting period:November 30, 2018
Item 1.Report to Stockholders.
TABLE OF
CONTENTS
| Performance Overview | |
| Alerian MLP ETF | 1 |
| Alerian Energy Infrastructure ETF | 4 |
| Disclosure of Fund Expenses | 7 |
| Report of Independent Registered Public Accounting Firm | 8 |
| Financial Statements | |
| Alerian MLP ETF | |
| Schedule of Investments | 9 |
| Statement of Assets and Liabilities | 10 |
| Statement of Operations | 11 |
| Statements of Changes in Net Assets | 12 |
| Financial Highlights | 13 |
| Alerian Energy Infrastructure ETF | |
| Schedule of Investments | 14 |
| Statement of Assets and Liabilities | 15 |
| Statement of Operations | 16 |
| Statements of Changes in Net Assets | 17 |
| Financial Highlights | 18 |
| Notes to Financial Statements | 19 |
| Additional Information | 31 |
| Trustees & Officers | 33 |
Beginning on January 1, 2021, as permitted by regulations adopted by the U.S. Securities and Exchange Commission, paper copies of the Funds’ annual and semi-annual shareholder reports will no longer be sent by mail, unless you specifically request paper copies of the reports from your financial intermediary (such as a broker-dealer or bank). Instead, the reports will be made available on the Funds’ website (www.alpsfunds.com), and you will be notified by mail each time a report is posted and provided with a website link to access the report.
If you already elected to receive shareholder reports electronically, you will not be affected by this change and you need not take any action. You may elect to receive shareholder reports and other communications from a Fund electronically anytime by contacting your financial intermediary.
You may elect to receive all future reports in paper free of charge. You can contact your financial intermediary to request that you continue to receive paper copies of your shareholder reports. Your election to receive reports in paper will apply to all funds held in your account with your financial intermediary.
alpsfunds.com
| Performance Overview | November 30, 2018 (Unaudited) |
INVESTMENT OBJECTIVE
The Alerian MLP ETF (the “Fund” or “AMLP”) seeks investment results that correspond (before fees and expenses) generally to the price and yield performance of its underlying index, the Alerian MLP Infrastructure Index (the “Underlying Index” or “AMZI”). The Shares of the Fund are listed and trade on the NYSE Arca, Inc. (“NYSE”) under the ticker symbol AMLP. The Fund generally will invest in all of the securities that comprise the Underlying Index in proportion to their weightings in the Underlying Index.
The Underlying Index is a rules based, modified capitalization weighted, float-adjusted index intended to give investors a means of tracking the overall performance of the United States energy infrastructure Master Limited Partnership (“MLP”) asset class. The Underlying Index is comprised of energy infrastructure MLPs that earn a majority of their cash flow from the transportation, storage, and processing of energy commodities.
PERFORMANCE OVERVIEW
During the twelve-month period from December 1, 2017 to November 30, 2018 the Fund delivered a total return of -0.55%. This compares to the Fund’s Underlying Index, which was down -7.06% on a price-return basis and up 0.38% on a total-return basis. The difference in performance between the AMZI and AMLP is primarily attributable to the Fund’s operating expenses and the tax impact of the Fund’s C-corporation structure.
During the period, the Fund paid four distributions:
| • | $0.2066 on February 15, 2018 |
| • | $0.2066 on August 16, 2018 |
| • | $0.1913 on November 15, 2018 |
For distributions reflecting the third calendar quarter of 2018, twelve of the 25 constituents in the AMZI increased their distributions, eleven MLPs maintained their distributions, and two MLPs lowered their distributions.
During the period, NGL Energy Partners (NGL), Crestwood Equity Partners (CEQP), Cheniere Energy Partners (CQP), and Enable Midstream Partners (ENBL) were added to the Underlying Index. Dominion Energy Midstream Partners (DM) was removed from the Underlying Index. Multiple constituents were removed from the Underlying Index in special rebalancings in conjunction with acquisitions. Constituents removed in relation to their acquisition by another entity included Boardwalk Pipeline Partners (BWP), Rice Midstream Partners (RMP), and Williams Partners (WPZ). Tallgrass Energy Partners LP (TEP) merged with Tallgrass Energy GP (TEGP), and Tallgrass Energy (TGE) is the surviving Underlying Index constituent. Energy Transfer Partners (ETP) merged with Energy Transfer Equity (ETE), and Energy Transfer LP (ET) is the surviving constituent in the Underlying Index.
There were no methodology updates for the Underlying Index for the time period.
Energy infrastructure MLPs rose from the start of the period through January, against a backdrop of rising West Texas Intermediate (WTI) oil prices. Though WTI oil prices would reach higher levels, the end of January proved to be the peak for the AMZI in the period.
Uncertainty weighed on the space as companies announced reorganization transactions, which often involved the consolidation of MLPs by their parents. The Federal Energy Regulatory Commission (FERC) policy revision on March 15, 2018 further added to uncertainty, as MLPs broadly sold off on the news that they would no longer be able to include an income tax allowance in their cost-of-service pipeline rates. A July announcement from the FERC providing positive clarification helped jumpstart MLP performance, along with strong second quarter 2018 earnings results and the announced simplification of the Energy Transfer (ETE/ETP) family. The positive momentum was short-lived, as WTI oil prices sharply declined from $76 per barrel in early October to end November at $51 per barrel. While WTI fell 33.35% in that timeframe, the AMZI fell by only 12.64% on a price-return basis, outperforming other energy sectors that are more sensitive to the absolute price of oil. To be clear, MLPs are not immune to oil price swings, but the fee-based nature of their businesses makes MLPs in our view more defensive relative to other energy sectors in a falling crude price environment. Persistent oil price weakness represents a risk for energy infrastructure MLPs in terms of sentiment and its potential to interrupt U.S. production growth.
While MLP performance has been challenged, we believe that current fundamentals remain strong. The record high production of oil and natural gas in the U.S. has created strong demand for energy infrastructure assets, with MLPs continuing to announce new growth projects to facilitate rising production. Notably, the US became the world’s largest oil producer in 2018, and US energy exports continue to increase, requiring new pipelines and export facilities. As volume-driven businesses, MLPs stand to benefit from growing energy production and rising exports from the US.
Many MLPs have made strides this year to better position their businesses by eliminating incentive distribution rights, right-sizing distributions, and shifting to rely more on retained cash flow than equity markets for funding growth projects (self-funding equity). MLP consolidation transactions and corporate restructurings have been a distraction and source of uncertainty this year, but we expect structure questions to be largely resolved in early 2019. With these growing pains starting to subside, investor focus can return to the constructive fundamentals for midstream MLPs given the staggering growth in US oil and gas production.
| Performance Overview | November 30, 2018 (Unaudited) |
Performance(as of November 30, 2018)
| | 1 Year | 3 Year | 5 Year | Since Inception^ |
| Alerian MLP ETF – NAV | -0.55% | -0.32% | -4.64% | 1.55% |
| Alerian MLP ETF – Market Price* | -0.66% | -0.41% | -4.66% | 1.53% |
| Alerian MLP Infrastructure Index | 0.38% | 0.58% | -5.10% | 3.87% |
| Alerian MLP Total Return Index** | 1.21% | 1.00% | -5.16% | 3.45% |
| S&P 500® Total Return Index** | 6.27% | 12.16% | 11.12% | 14.76% |
Total Expense Ratio (per the current prospectus) 0.85%.
Performance data quoted represents past performance. Past performance does not guarantee future results. The table does not reflect the deduction of taxes that a shareholder would pay on Fund distributions or the redemption of Fund shares. Investment return and principal value of an investment will fluctuate so that an investor’s shares, when sold or redeemed, may be worth more or less than the original cost. Current performance data may be higher or lower than actual data quoted. For the most current month-end performance data please visit www.alpsfunds.com or call 1.877.398.8461. The Fund accrues deferred income taxes for future tax liabilities associated with the portion of MLP distributions considered to be a tax-deferred return of capital and for any net operating gains as well as capital appreciation of its investment. This deferred tax liability is reflected in the daily NAV and as a result the fund's after-tax performance could differ significantly from the underlying assets even if the pre-tax performance is closely tracked.
NAV is an exchange-traded fund’s per-share value. The per-share dollar amount of the Fund is derived by dividing the total value of all the securities in its portfolio, less any liabilities, by the number of Fund shares outstanding. Market Price is the price at which a share can currently be traded in the market. Information detailing the number of days the Market Price of the Fund was greater than the Fund’s NAV and the number of days it was less than the Fund’s NAV can be obtained at www.alpsfunds.com.
| ^ | The Fund commenced Investment Operations on August 24, 2010 with an Inception Date, the first day of trading on the NYSE ARCA, of August 25, 2010. |
| * | Market Price is based on the midpoint of the bid-ask spread at 4 p.m. ET and does not represent the returns an investor would receive if shares were traded at other times. |
| ** | Effective June 29, 2018, the Fund replaced the S&P 500 Index as the Fund’s primary benchmark for performance comparison purposes. The Adviser made this recommendation to the Board because the Fund’s new primary benchmark, the Alerian MLP Total Return Index, more closely aligns with the Fund’s investment strategies and investment restrictions. |
The Alerian MLP Infrastructure Index is comprised of 25 midstream energy Master Limited Partnerships and provides investors with an unbiased benchmark for the infrastructure component of this emerging asset class.
S&P 500® Total Return Index is the Standard & Poor’s composite index of 500 stocks, a widely recognized, unmanaged index of common stock prices. Total return assumes reinvestment of any dividends and distributions realized during a given time period.
The Alerian MLP Total Return Index is the leading gauge of energy infrastructure Master Limited Partnerships (MLPs). The capped, float-adjusted, capitalization-weighted index, whose constituents earn the majority of their cash flow from midstream activities involving energy commodities, is reported on a total-return basis (AMZX), which assumes reinvestment of any dividends and distributions realized during a given period.
The index is not actively managed and does not reflect any deductions for fees, expenses or taxes. One cannot invest directly in an index. Index performance does not reflect fund performance.
The Fund’s shares are not individually redeemable. Investors buy and sell shares of the Fund on a secondary market. Only market makers or “authorized participants” may trade directly with the Fund, typically in blocks of 50,000 shares.
The Alerian MLP ETF is not suitable for all investors. Investments in the Fund are subject to investment risks, including possible loss of the principal amount invested.
ALPS Portfolio Solutions Distributor, Inc., a FINRA member, is the distributor for the Fund.
| Performance Overview | November 30, 2018 (Unaudited) |
Top 10 Holdings*(as of November 30, 2018)
| Magellan Midstream Partners LP | 10.39% |
| Enterprise Products Partners LP | 10.30% |
| Plains All American Pipeline LP | 9.84% |
| Energy Transfer LP | 9.62% |
| MPLX LP | 9.56% |
| Western Gas Partners LP | 4.47% |
| Buckeye Partners LP | 4.33% |
| EQM Midstream Partners LP | 3.97% |
| Andeavor Logistics LP | 3.33% |
| Tallgrass Energy LP | 3.16% |
| Total % of Top 10 Holdings | 68.97% |
Future holdings are subject to change.
Growth of $10,000(as of November 30, 2018)
Comparison of change in value of a $10,000 investment in the Fund and the Indexes
The chart above represents historical performance of a hypothetical investment of $10,000 in the Fund over the life of the Fund. Past performance does not guarantee future results. This chart does not reflect the deduction of taxes that a shareholder would pay on Fund distributions or the redemption of Fund shares.
| Alerian Energy Infrastructure ETF | |
| Performance Overview | November 30, 2018 (Unaudited) |
INVESTMENT OBJECTIVE
The Alerian Energy Infrastructure ETF (the “Fund” or “ENFR”) seeks investment results that correspond (before fees and expenses) generally to the price and yield performance of its underlying index, the Alerian Midstream Energy Select Index (the “Underlying Index” or “AMEI”). As a secondary objective, the Fund seeks to provide total return through income and capital appreciation. The Shares of the Fund are listed and trade on the NYSE Acra, Inc. (“NYSE”) under the ticker symbol ENFR. The Fund generally will invest in all of the securities that comprise the Underlying Index in proportion to their weightings in the Underlying Index.
The Underlying Index is a composite of North American energy infrastructure companies engaged in the pipeline transportation, storage, and processing of energy commodities (also known as “midstream energy businesses”). The Underlying Index has a 25% limit for companies taxed as pass-through entities.
PERFORMANCE OVERVIEW
During the twelve-month period from December 1, 2017, to November 30, 2018, the Fund delivered a total return of -6.27%. This compares to the Fund’s Underlying Index, which fell -10.88% on a price return basis and fell -5.47% on a total return basis.
During the period, the Fund paid four distributions:
| • | $0.04878 on December 28, 2017 |
| • | $0.17445 on March 29, 2018 |
| • | $0.19209 on June 28, 2018 |
| • | $0.16953 on September 27, 2018 |
The Underlying Index name was changed in June from the Alerian Energy Infrastructure Index to the Alerian Midstream Energy Select Index. The methodology was updated in July to make the AMEI a pure midstream index – a change that coincides with growing representation of C-corporations in the North American midstream universe. Utility general partners were removed from the Underlying Index. The 25% limit for companies taxed as pass-through entities was maintained. The methodology was updated again in September to, among other things, better capture the investable universe, reflect established guidelines for diversified portfolios, mirror industry trends, and minimize future Underlying Index turnover.
During the period, Antero Midstream GP (AMGP) was added to the Underlying Index. Antero Midstream Partners (AM), Archrock Inc (AROC), and Altagas Ltd (ALA) were removed. In accordance with the methodology change in July, the following companies were added: Buckeye Partners (BPL), BP Midstream Partners (BPMP), Crestwood Equity Partners (CEQP), Dominion Energy Midstream Partners (DM), Enable Midstream Partners (ENBL), Genesis Energy (GEL), Holly Energy Partners (HEP), Cheniere Energy Inc (LNG), Noble Midstream Partners (NBLX), NGL Energy Partners (NGL), NuStar Energy (NS), Shell Midstream Partners (SHLX), Summit Midstream Partners (SMLP), Tellurian (TELL), and Valero Energy Partners (VLP). The following companies were removed as part of the methodology change in July: CenterPoint Energy (CNP), Cheniere Energy Partners (CQP), Dominion Energy (D), NuStar GP Holdings (NSH), and OGE Energy (OGE).
Energy infrastructure companies rose from the start of the period through January, against a backdrop of rising West Texas Intermediate (WTI) oil prices. Though WTI oil prices would reach higher levels, the end of January proved to be the peak for the AMEI in the period.
February and March saw a series of negative headlines weigh on the energy infrastructure space, including dividend cuts from two AMEI constituents, corporate reorganizations, and a negative announcement from the Federal Energy Regulatory Commission (FERC) on March 15th related to MLP cost-of-service pipeline rates. The FERC announcement, corporate structure questions, and the potential for consolidation transactions created uncertainty in the space. Energy infrastructure companies gradually recovered from April through August as oil prices gained, fundamentals remained supportive, and the FERC announced positive clarification on their policy revision in July that was beneficial for MLPs.
Energy infrastructure companies were pressured in October and November, as WTI oil prices sharply declined from $76 per barrel in early October to end November at $51 per barrel. While WTI fell 33.35% in that timeframe, the AMEI fell by only 11.07% on a price-return basis, outperforming other energy sectors that are more sensitive to the absolute price of oil. To be clear, midstream companies are not immune to oil price swings, but the fee-based nature of their businesses makes energy infrastructure companies in our view more defensive relative to other energy sectors in a falling crude price environment. Persistent oil price weakness represents a risk for midstream companies in terms of sentiment and its potential to interrupt production growth.
Despite the recent weakness in oil prices, we believe that the fundamentals for midstream energy infrastructure in the US and Canada remain strong. The US became the world’s largest oil producer in 2018. Production of oil and natural gas in the US is at record highs, and growth is expected to continue assuming oil prices remain supportive. In Canada, oil production grew through 2018, and natural gas production has also increased relative to 2017. Combining robust production trends with a significant oil and natural gas resource base in both Canada and the US, North American midstream companies are poised to enjoy a runway of growth opportunities for years to come.
| Alerian Energy Infrastructure ETF | |
| Performance Overview | November 30, 2018 (Unaudited) |
Performance(as of November 30, 2018)
| | 1 Year | 3 Year | Since Inception^ |
| Alerian Energy Infrastructure ETF - NAV | -6.27% | 5.67% | -1.27% |
| Alerian Energy Infrastructure ETF - Market Price* | -6.32% | 5.62% | -1.29% |
| Alerian Midstream Energy Select Index | -5.47% | 6.58% | -0.45% |
| S&P 500® Total Return Index | 6.27% | 12.16% | 11.59% |
Total Expense Ratio (per the current prospectus) 0.65%.
Performance data quoted represents past performance. Past performance does not guarantee future results. The table does not reflect the deduction of taxes that a shareholder would pay on Fund distributions or the redemption of Fund shares. Investment return and principal value of an investment will fluctuate so that an investor’s shares, when sold or redeemed, may be worth more or less than the original cost. Current performance data may be higher or lower than actual data quoted. For most current month-end performance data please visit www.alpsfunds.com or call 1.866.675.2639.
NAV is an exchange-traded fund’s per-share value. The per-share dollar amount of the Fund is derived by dividing the total value of all the securities in its portfolio, less any liabilities, by the number of Fund shares outstanding. Market Price is the price at which a share can currently be traded in the market. Information detailing the number of days the Market Price of the Fund was greater than the Fund’s NAV and the number of days it was less than the Fund’s NAV can be obtained at www.alpsfunds.com.
| ^ | The Fund commenced Investment Operations on November 1, 2013. |
| * | Market Price is based on the midpoint of the bid-ask spread at 4 p.m. ET and does not represent the returns an investor would receive if shares were traded at other times. |
The Alerian Midstream Energy Select Index is comprised of 32 equity securities of issuers headquartered or incorporated in the United States and Canada that engage in the transportation, storage, and processing of energy commodities.
S&P 500® Total Return Index: the Standard & Poor’s composite index of 500 stocks, a widely recognized, unmanaged index of common stock prices. Total return assumes reinvestment of any dividends and distributions realized during a given time period.
The index is not actively managed and does not reflect any deductions for fees, expenses or taxes. One cannot invest directly in an index. Index performance does not reflect fund performance.
The Fund’s shares are not individually redeemable. Investors buy and sell shares of the Fund on a secondary market. Only market makers or “authorized participants” may trade directly with the Fund, typically in blocks of 50,000 shares.
The Alerian Energy Infrastructure ETF is not suitable for all investors. Investments in the Fund are subject to investment risks, including possible loss of the principal amount invested.
ALPS Portfolio Solutions Distributor, Inc., a FINRA member, is the distributor for the Fund.
| Alerian Energy Infrastructure ETF | |
| Performance Overview | November 30, 2018 (Unaudited) |
Top 10 Holdings*(as of November 30, 2018)
| Enbridge, Inc. | 10.83% |
| TransCanada Corp. | 8.30% |
| Enterprise Products Partners LP | 7.23% |
| Kinder Morgan, Inc. | 7.21% |
| The Williams Cos., Inc. | 6.56% |
| Energy Transfer LP | 6.31% |
| Pembina Pipeline Corp. | 4.86% |
| ONEOK, Inc. | 4.84% |
| Plains GP Holdings LP, Class A | 4.83% |
| Cheniere Energy, Inc. | 4.71% |
| Total % of Top 10 Holdings | 65.68% |
| * | % of Total Investments (excluding investments purchased with collateral from securities loaned) Future holdings are subject to change. |
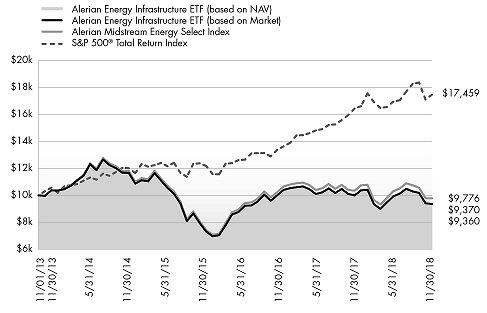
Growth of $10,000(as of November 30, 2018)
Comparison of change in value of a $10,000 investment in the Fund and the Indexes
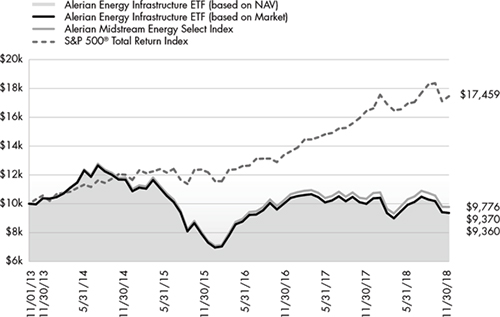
The chart above represents historical performance of a hypothetical investment of $10,000 in the Fund over the life of the Fund. Past performance does not guarantee future results. This chart does not reflect the deduction of taxes that a shareholder would pay on Fund distributions or the redemption of Fund shares.
| Alerian Exchange Traded Funds | |
| Disclosure of Fund Expenses | November 30, 2018 (Unaudited) |
Shareholder Expense Example: As a shareholder of a Fund, you incur two types of costs: (1) transaction costs which may include creation and redemption fees or brokerage charges, and (2) ongoing costs, including management fees and other Fund expenses. These examples are intended to help you understand your ongoing costs (in dollars) of investing in the Fund and to compare these costs with the ongoing costs of investing in other funds. It is based on an investment of $1,000 invested at the beginning of the (six month) period and held through November 30, 2018.
Actual Return: The first line of the table provides information about actual account values and actual expenses. You may use the information in this line, together with the amount you invested, to estimate the expenses that you incurred over the period. Simply divide your account value by $1,000 (for example, an $8,600 account value divided by $1,000 = 8.6), then multiply the result by the number in the first line under the heading entitled “Expenses Paid During Period” to estimate the expenses attributable to your investment during this period.
Hypothetical 5% Return: The second line of the table provides information about hypothetical account values and hypothetical expenses based on the Fund’s actual expense ratio and an assumed rate of return of 5% per year before expenses, which is not the Fund’s actual return. The hypothetical account values and expenses may not be used to estimate the actual ending account balance or expenses you paid for the period. You may use this information to compare ongoing costs of investing in the Fund and other funds. To do so, compare this 5% hypothetical example with the 5% hypothetical examples that appear in the shareholder reports of other funds.
The expenses shown in the table are meant to highlight ongoing Fund costs only and do not reflect any transaction costs, such as creation and redemption fees or brokerage charges. Therefore, the second line is useful in comparing ongoing costs only, and will not help you deter- mine the relative total costs of owning different funds. In addition, if these costs were included, your costs would have been higher.
| | Beginning Account Value 6/1/18 | Ending Account Value 11/30/18 | Expense Ratio(a) | Expenses Paid During Period 6/1/18 - 11/30/18(b) |
| Alerian MLP ETF | | | | |
| Actual | $1,000.00 | $960.50 | 0.86% | $4.23 |
| Hypothetical (5% return before expenses) | $1,000.00 | $1,020.76 | 0.86% | $4.36 |
| Alerian Energy Infrastructure ETF | | | | |
| Actual | $1,000.00 | $944.60 | 0.65% | $3.17 |
| Hypothetical (5% return before expenses) | $1,000.00 | $1,021.81 | 0.65% | $3.29 |
| (a) | Annualized, based on the Fund's most recent fiscal half-year expenses. |
| (b) | Expenses are equal to the Fund's annualized expense ratio multiplied by the average account value over the period, multiplied by the number of days in the most recent fiscal half year (183), divided by 365. |
| Alerian Exchange Traded Funds |
| Report of Independent Registered Public Accounting Firm |
To the shareholders and the Board of Trustees of ALPS ETF Trust:
Opinion on the Financial Statements and Financial Highlights
We have audited the accompanying statements of assets and liabilities, including the schedules of investments, of Alerian MLP ETF and Alerian Energy Infrastructure ETF (the “Funds”), two of the funds constituting the ALPS ETF Trust, as of November 30, 2018, the related statements of operations for the year then ended, the statements of changes in net assets for each of the two years in the period then ended, the financial highlights for each of the five years in the period then ended, and the related notes. In our opinion, the financial statements and financial highlights present fairly, in all material respects, the financial position of Alerian MLP ETF and Alerian Energy Infrastructure ETF of ALPS ETF Trust as of November 30, 2018, and the results of their operations for the year then ended, the changes in their net assets for each of the two years in the period then ended, and the financial highlights for each of the five years in the period then ended, in conformity with accounting principles generally accepted in the United States of America.
Basis for Opinion
These financial statements and financial highlights are the responsibility of the Funds’ management. Our responsibility is to express an opinion on the Funds’ financial statements and financial highlights based on our audits. We are a public accounting firm registered with the Public Company Accounting Oversight Board (United States) (PCAOB) and are required to be independent with respect to the Funds in accordance with the U.S. federal securities laws and the applicable rules and regulations of the Securities and Exchange Commission and the PCAOB.
We conducted our audits in accordance with the standards of the PCAOB. Those standards require that we plan and perform the audit to obtain reasonable assurance about whether the financial statements and financial highlights are free of material misstatement, whether due to error or fraud. The Funds are not required to have, nor were we engaged to perform, an audit of their internal control over financial reporting. As part of our audits we are required to obtain an understanding of internal control over financial reporting but not for the purpose of expressing an opinion on the effectiveness of the Funds’ internal control over financial reporting. Accordingly, we express no such opinion.
Our audits included performing procedures to assess the risks of material misstatement of the financial statements and financial highlights, whether due to error or fraud, and performing procedures that respond to those risks. Such procedures included examining, on a test basis, evidence regarding the amounts and disclosures in the financial statements and financial highlights. Our audits also included evaluating the accounting principles used and significant estimates made by management, as well as evaluating the overall presentation of the financial statements and financial highlights. Our procedures included confirmation of securities owned as of November 30, 2018, by correspondence with the custodian and brokers; when replies were not received from brokers, we performed other auditing procedures. We believe that our audits provide a reasonable basis for our opinion.
DELOITTE & TOUCHE LLP
Denver, Colorado
January 24, 2019
We have served as the auditor of one or more investment companies advised by ALPS Advisors, Inc. since 2007.
Alerian MLP ETF
| Schedule of Investments | November 30, 2018 |
| Security Description | | Shares | | | Value | |
| MASTER LIMITED PARTNERSHIPS (99.90%) | | | | |
| Gathering & Processing| Natural Gas (24.42%) | | | | | | | | |
| Antero Midstream Partners LP | | | 7,662,300 | | | $ | 211,939,218 | |
| Crestwood Equity Partners LP(a) | | | 4,276,648 | | | | 127,016,446 | |
| DCP Midstream LP(a) | | | 7,897,589 | | | | 269,149,833 | |
| Enable Midstream Partners LP | | | 7,652,898 | | | | 102,089,659 | |
| EnLink Midstream Partners LP | | | 14,508,605 | | | | 191,948,844 | |
| MPLX LP | | | 25,131,473 | | | | 832,605,701 | |
| Western Gas Partners LP(a) | | | 8,761,525 | | | | 389,362,171 | |
| Total Gathering & Processing | Natural Gas | | | | | | | 2,124,111,872 | |
| | | | | | | | | |
| Other | Liquefaction (1.54%) | | | | | | | | |
| Cheniere Energy Partners LP | | | 3,556,159 | | | | 133,996,071 | |
| | | | | | | | | |
| Pipeline Transportation | Natural Gas (28.50%) | | | | | | | | |
| Energy Transfer LP | | | 57,490,018 | | | | 837,629,563 | |
| Enterprise Products Partners LP | | | 34,168,565 | | | | 896,924,831 | |
| EQM Midstream Partners LP(a) | | | 7,247,759 | | | | 345,428,194 | |
| Spectra Energy Partners LP | | | 7,140,312 | | | | 258,836,310 | |
| TC PipeLines LP(a) | | | 4,728,180 | | | | 140,852,482 | |
| Total Pipeline Transportation | Natural Gas | | | | | | | 2,479,671,380 | |
| | | | | | | | | |
| Pipeline Transportation | Petroleum (45.44%) | | | | | | | | |
| Andeavor Logistics LP | | | 7,757,837 | | | | 289,522,477 | |
| Buckeye Partners LP(a) | | | 12,761,673 | | | | 377,235,054 | |
| Enbridge Energy Partners LP | | | 18,820,309 | | | | 204,576,759 | |
| Genesis Energy LP(a) | | | 9,545,334 | | | | 210,474,615 | |
| Holly Energy Partners LP | | | 3,990,405 | | | | 112,250,093 | |
| Magellan Midstream Partners LP(a) | | | 14,961,861 | | | | 904,893,353 | |
| NGL Energy Partners LP(a) | | | 9,846,434 | | | | 91,374,908 | |
| NuStar Energy LP(a) | | | 8,525,973 | | | | 206,072,767 | |
| Phillips 66 Partners LP | | | 4,707,195 | | | | 220,767,445 | |
| Plains All American Pipeline LP(a) | | | 37,215,207 | | | | 857,066,217 | |
| Shell Midstream Partners LP | | | 10,799,735 | | | | 203,467,007 | |
| Tallgrass Energy LP | | | 12,885,583 | | | | 275,236,053 | |
| Total Pipeline Transportation | Petroleum | | | | | | | 3,952,936,748 | |
| | | | | | | | | |
| TOTAL MASTER LIMITED PARTNERSHIPS | |
| (Cost $9,902,370,992) | | | | | | | 8,690,716,071 | |
| | | 7 Day Yield | | | Shares | | | Value | |
| SHORT TERM INVESTMENTS (0.17%) | | | | | |
| State Street Institutional Treasury Plus Money Market Fund | | | 2.146 | % | | | 15,209,446 | | | $ | 15,209,446 | |
| TOTAL SHORT TERM INVESTMENTS | | | | | |
| (Cost $15,209,446) | | | | | | | | | | | 15,209,446 | |
| | | | | | | | | | | | | |
| TOTAL INVESTMENTS (100.07%) | | | | | |
| (Cost $9,917,580,438) | | | | | | | | | | $ | 8,705,925,517 | |
| LIABILITIES IN EXCESS OF OTHER ASSETS (-0.07%) | | | | (6,177,490 | ) |
| NET ASSETS - 100.00% | | | | | | | $ | 8,699,748,027 | |
| (a) | Affiliated Company. See Note 8 in Notes to Financial Statements. |
See Notes to Financial Statements.
Alerian MLP ETF
| Statement of Assets and Liabilities | November 30, 2018 |
| ASSETS: | | | |
| Investments, at value | | $ | 4,786,999,477 | |
| Investments in affiliates, at value | | | 3,918,926,040 | |
| Receivable for investments sold | | | 1,909,495 | |
| Interest receivable | | | 32,724 | |
| Deferred tax asset (Note 2) | | | – | (a) |
| Income tax receivable | | | 300,000 | |
| Total Assets | | | 8,708,167,736 | |
| | | | | |
| LIABILITIES: | | | | |
| Payable for shares redeemed | | | 1,910,433 | |
| Franchise tax payable | | | 241,367 | |
| Payable to adviser | | | 6,267,909 | |
| Total Liabilities | | | 8,419,709 | |
| NET ASSETS | | $ | 8,699,748,027 | |
| | | | | |
| NET ASSETS CONSIST OF: | | | | |
| Paid-in capital | | $ | 10,659,061,183 | |
| Distributable earnings | | | (1,959,313,156 | ) |
| NET ASSETS | | $ | 8,699,748,027 | |
| | | | | |
| INVESTMENTS, AT COST | | $ | 5,237,798,883 | |
| INVESTMENTS IN AFFILIATES, AT COST | | | 4,679,781,555 | |
| | | | | |
| PRICING OF SHARES | | | | |
| Net Assets | | $ | 8,699,748,027 | |
| Shares of beneficial interest outstanding (Unlimited number of shares authorized, par value $0.01 per share) | | | 910,762,100 | |
| Net Asset Value, offering and redemption price per share | | $ | 9.55 | |
| (a) | Net Deferred Tax Asset of $207,701,445 is offset 100% by Valuation Allowance. |
See Notes to Financial Statements.
Alerian MLP ETF
| Statement of Operations | For the Year Ended November 30, 2018 |
| INVESTMENT INCOME: | | | |
| Distributions from master limited partnerships | | $ | 757,687,821 | |
| Less return of capital distributions | | | (757,687,821 | ) |
| Total Investment Income | | | – | |
| | | | | |
| EXPENSES: | | | | |
| Franchise tax expense | | | 427,419 | |
| Investment adviser fee | | | 83,031,267 | |
| Total Expenses | | | 83,458,686 | |
| NET INVESTMENT LOSS, BEFORE INCOME TAXES | | | (83,458,686 | ) |
| Deferred income tax benefit/(expense) | | | – | |
| NET INVESTMENT LOSS | | | (83,458,686 | ) |
| | | | | |
| REALIZED AND UNREALIZED GAIN/(LOSS): | | | | |
| Net realized gain on investments, before income taxes | | | 784,053,390 | |
| Net realized gain on affiliated investments, before income taxes | | | 389,480,453 | |
| Deferred income tax benefit/(expense) | | | – | |
| Net realized gain | | | 1,173,533,843 | |
| Net change in unrealized depreciation on investments, before income taxes | | | (295,853,607 | ) |
| Net change in unrealized depreciation on affiliated investments, before income taxes | | | (713,593,458 | ) |
| Deferred income tax benefit/(expense) | | | – | |
| Net change in unrealized depreciation | | | (1,009,447,065 | ) |
| NET REALIZED AND UNREALIZED GAIN ON INVESTMENTS | | | 164,086,778 | |
| NET INCREASE IN NET ASSETS RESULTING FROM OPERATIONS | | $ | 80,628,092 | |
See Notes to Financial Statements.
Alerian MLP ETF
Statements of Changes in Net Assets
| | | For the
Year Ended
November 30, 2018 | | | For the
Year Ended
November 30, 2017 | |
| OPERATIONS: | | | | | | |
| Net investment loss | | $ | (83,458,686 | ) | | $ | (182,634,315 | ) |
| Net realized gain/(loss) | | | 1,173,533,843 | | | | (62,647,432 | ) |
| Net change in unrealized depreciation | | | (1,009,447,065 | ) | | | (774,374,707 | ) |
| Net increase/(decrease) in net assets resulting from operations | | | 80,628,092 | | | | (1,019,656,454 | ) |
| | | | | | | | | |
| DISTRIBUTIONS TO SHAREHOLDERS: | | | | | | | | |
| From distributable earnings | | | (763,495,134 | ) | | | – | |
| From tax return of capital | | | – | | | | (738,470,998 | ) |
| Total distributions | | | (763,495,134 | ) | | | (738,470,998 | ) |
| | | | | | | | | |
| CAPITAL SHARE TRANSACTIONS: | | | | | | | | |
| Proceeds from sale of shares | | | 3,121,090,140 | | | | 2,858,164,282 | |
| Cost of shares redeemed | | | (3,143,758,848 | ) | | | (1,072,772,241 | ) |
| Net increase/(decrease) from share transactions | | | (22,668,708 | ) | | | 1,785,392,041 | |
| | | | | | | | | |
| Net increase/(decrease) in net assets | | | (705,535,750 | ) | | | 27,264,589 | |
| | | | | | | | | |
| NET ASSETS: | | | | | | | | |
| Beginning of year | | | 9,405,283,777 | | | | 9,378,019,188 | |
| End of year | | $ | 8,699,748,027 | | | $ | 9,405,283,777 | (a) |
| | | | | | | | | |
| OTHER INFORMATION: | | | | | | | | |
| SHARE TRANSACTIONS: | | | | | | | | |
| Beginning shares | | | 907,362,100 | | | | 761,612,100 | |
| Shares sold | | | 301,050,000 | | | | 238,500,000 | |
| Shares redeemed | | | (297,650,000 | ) | | | (92,750,000 | ) |
| Shares outstanding, end of period | | | 910,762,100 | | | | 907,362,100 | |
| (a) | For the year ended November 30, 2017, net assets included accumulated net investment loss, net of deferred income taxes of $(390,629,039). |
See Notes to Financial Statements.
Alerian MLP ETF
| Financial Highlights | For a Share Outstanding Throughout the Periods Presented |
| | | For the Year
Ended
November 30,
2018 | | | For the Year
Ended
November 30,
2017 | | | For the Year
Ended
November 30,
2016 | | | For the Year
Ended
November 30,
2015 | | | For the Year
Ended
November 30,
2014 | |
| NET ASSET VALUE, BEGINNING OF PERIOD | | $ | 10.37 | | | $ | 12.31 | | | $ | 12.25 | | | $ | 18.10 | | | $ | 17.69 | |
| | | | | | | | | | | | | | | | | | | | | |
| INCOME/(LOSS) FROM OPERATIONS: | | | | | | | | | | | | | | | | | | | | |
| Net investment income/(loss)(a) | | | (0.09 | ) | | | (0.22 | ) | | | 0.04 | | | | (0.13 | ) | | | (0.16 | ) |
| Net realized and unrealized gain/(loss) on investments | | | 0.08 | | | | (0.86 | ) | | | 1.04 | | | | (4.53 | ) | | | 1.70 | |
| Total from investment operations | | | (0.01 | ) | | | (1.08 | ) | | | 1.08 | | | | (4.66 | ) | | | 1.54 | |
| | | | | | | | | | | | | | | | | | | | | |
| DISTRIBUTIONS: | | | | | | | | | | | | | | | | | | | | |
| From net realized gains | | | (0.81 | ) | | | – | | | | – | | | | – | | | | (0.73 | ) |
| From tax return of capital | | | – | | | | (0.86 | ) | | | (1.02 | ) | | | (1.19 | ) | | | (0.40 | ) |
| Total distributions | | | (0.81 | ) | | | (0.86 | ) | | | (1.02 | ) | | | (1.19 | ) | | | (1.13 | ) |
| | | | | | | | | | | | | | | | | | | | | |
| NET INCREASE/(DECREASE) IN NET ASSET VALUE | | | (0.82 | ) | | | (1.94 | ) | | | 0.06 | | | | (5.85 | ) | | | 0.41 | |
| NET ASSET VALUE, END OF PERIOD | | $ | 9.55 | | | $ | 10.37 | | | $ | 12.31 | | | $ | 12.25 | | | $ | 18.10 | |
| TOTAL RETURN(b) | | | (0.55 | )% | | | (9.27 | )% | | | 9.76 | % | | | (26.84 | )% | | | 8.82 | % |
| | | | | | | | | | | | | | | | | | | | | |
| RATIOS/SUPPLEMENTAL DATA: | | | | | | | | | | | | | | | | | | | | |
| Net assets, end of period (000s) | | $ | 8,699,748 | | | $ | 9,405,284 | | | $ | 9,378,019 | | | $ | 7,203,754 | | | $ | 9,349,001 | |
| | | | | | | | | | | | | | | | | | | | | |
| RATIO TO AVERAGE NET ASSETS: | | | | | | | | | | | | | | | | | | | | |
| Expenses (excluding net current and deferred tax expenses/benefits and franchise tax expense) | | | 0.85 | % | | | 0.85 | % | | | 0.85 | % | | | 0.85 | % | | | 0.85 | % |
| Expenses (including net current anddeferred tax expenses/benefits)(c) | | | 0.85 | % | | | 0.41 | % | | | 1.42 | % | | | (11.40 | )% | | | 5.43 | % |
| Expenses (including current and deferredtax expenses/benefits)(d) | | | 0.85 | % | | | 1.81 | % | | | (0.36 | )% | | | 1.57 | % | | | 0.55 | % |
| Net investment loss (excluding deferred tax expenses/benefits and franchise tax expense) | | | (0.85 | )% | | | (0.85 | )% | | | (0.85 | )% | | | (0.85 | )% | | | (0.85 | )% |
| Net investment income/(loss)(includingdeferred tax expenses/benefits)(d) | | | (0.85 | )% | | | (1.81 | )% | | | 0.36 | % | | | (1.57 | )% | | | (0.55 | )% |
| PORTFOLIO TURNOVER RATE(e) | | | 26 | % | | | 23 | % | | | 31 | % | | | 21 | % | | | 29 | % |
| (a) | Based on average shares outstanding during the period. |
| (b) | Total return is calculated assuming an initial investment made at the net assets value at the beginning of the period and redemption at the net asset value on the last day of the period and assuming all distributions are reinvested at actual reinvestment prices. Total return calculated for a period of less than one year is not annualized. |
| (c) | Includes amount of current and deferred taxes/benefits for all components of the Statement of Operations. |
| (d) | Includes amount of current and deferred tax benefit associated with net investment income/(loss). |
| (e) | Portfolio turnover for periods less than one year is not annualized and does not include securities received or delivered from processing creations or redemptions in-kind. |
See Notes to Financial Statements.
Alerian Energy Infrastructure ETF
| Schedule of Investments | November 30, 2018 |
| Security Description | | Shares | | | Value | |
| CANADIAN ENERGY INFRASTRUCTURE COMPANIES (32.06%) | |
| Energy (32.06%) | | | | | | | | |
| Enbridge, Inc. | | | 136,074 | | | $ | 4,471,449 | |
| Gibson Energy, Inc. | | | 38,332 | | | | 615,955 | |
| Inter Pipeline, Ltd. | | | 102,607 | | | | 1,649,558 | |
| Keyera Corp. | | | 54,713 | | | | 1,198,320 | |
| Pembina Pipeline Corp. | | | 59,546 | | | | 2,007,798 | |
| TransCanada Corp. | | | 83,610 | | | | 3,426,459 | |
| Total Energy | | | | | | | 13,369,539 | |
| | | | | | | | | |
| TOTAL CANADIAN ENERGY INFRASTRUCTURE COMPANIES | |
| (Cost $15,353,659) | | | | | | | 13,369,539 | |
| | | | | | | | | |
| U.S. ENERGY INFRASTRUCTURE COMPANIES (24.33%) | |
| Energy (22.35%) | | | | | | | | |
| Cheniere Energy, Inc.(a) | | | 31,849 | | | | 1,946,611 | |
| Kinder Morgan, Inc. | | | 174,382 | | | | 2,976,701 | |
| ONEOK, Inc. | | | 32,523 | | | | 1,997,888 | |
| SemGroup Corp., Class A | | | 20,824 | | | | 337,973 | |
| Targa Resources Corp. | | | 42,170 | | | | 1,882,047 | |
| Tellurian, Inc.(a)(b) | | | 24,489 | | | | 177,055 | |
| Total Energy | | | | | | | 9,318,275 | |
| | | | | | | | | |
| Industrials (1.98%) | | | | | | | | |
| Macquarie Infrastructure Corp. | | | 19,798 | | | | 825,577 | |
| | | | | | | | | |
| TOTAL U.S. ENERGY INFRASTRUCTURE COMPANIES | |
| (Cost $12,175,964) | | | | | | | 10,143,852 | |
| | | | | | | | | |
| U.S. ENERGY INFRASTRUCTURE MLPS (26.00%) | |
| Energy (26.00%) | | | | | | | | |
| Andeavor Logistics LP | | | 6,808 | | | | 254,074 | |
| BP Midstream Partners LP | | | 3,659 | | | | 61,727 | |
| Buckeye Partners LP | | | 11,251 | | | | 332,579 | |
| Crestwood Equity Partners LP | | | 3,753 | | | | 111,464 | |
| Dominion Energy Midstream Partners LP | | | 3,770 | | | | 70,047 | |
| Enable Midstream Partners LP | | | 6,717 | | | | 89,605 | |
| Energy Transfer LP | | | 178,836 | | | | 2,605,640 | |
| Enterprise Products Partners LP | | | 113,687 | | | | 2,984,284 | |
| EQGP Holdings LP | | | 9,329 | | | | 186,767 | |
| Genesis Energy LP | | | 8,379 | | | | 184,757 | |
| Holly Energy Partners LP | | | 3,502 | | | | 98,511 | |
| Magellan Midstream Partners LP | | | 17,508 | | | | 1,058,884 | |
| MPLX LP | | | 22,129 | | | | 733,134 | |
| NGL Energy Partners LP | | | 8,642 | | | | 80,198 | |
| Noble Midstream Partners LP | | | 1,652 | | | | 54,731 | |
| NuStar Energy LP | | | 7,484 | | | | 180,888 | |
| Phillips 66 Partners LP | | | 4,133 | | | | 193,838 | |
| Shell Midstream Partners LP | | | 9,480 | | | | 178,603 | |
| Summit Midstream Partners LP | | | 3,147 | | | | 38,677 | |
| Tallgrass Energy LP | | | 39,422 | | | | 842,054 | |
| Valero Energy Partners LP | | | 1,711 | | | | 71,982 | |
| Security Description | | Shares | | | Value | |
| Energy (continued) | | | | | | | | |
| Western Gas Equity Partners LP | | | 14,843 | | | $ | 430,150 | |
| Total Energy | | | | | | | 10,842,594 | |
| | | | | | | | | |
| TOTAL U.S. ENERGY INFRASTRUCTURE MLPS | |
| (Cost $13,271,964) | | | | | | | 10,842,594 | |
| | | | | | | | | |
| U.S. GENERAL PARTNERS (15.22%) | |
| Energy (15.22%) | | | | | | | | |
| Antero Midstream GP LP | | | 60,734 | | | | 899,470 | |
| EnLink Midstream LLC | | | 65,405 | | | | 747,579 | |
| Plains GP Holdings LP, Class A | | | 90,085 | | | | 1,993,581 | |
| The Williams Cos., Inc. | | | 106,943 | | | | 2,707,797 | |
| Total Energy | | | | | | | 6,348,427 | |
| | | | | | | | | |
| TOTAL U.S. GENERAL PARTNERS | |
| (Cost $8,300,766) | | | | | | | 6,348,427 | |
| | | 7 Day Yield | | | Shares | | | Value | |
| SHORT TERM INVESTMENTS (1.78%) | |
| Money Market Fund (1.40%) | | | | | | | | | | | | |
| State Street Institutional Treasury Plus Money Market Fund | | | | | | | | | | | | |
| (Cost $581,981) | | | 2.146 | % | | | 581,981 | | | | 581,981 | |
| | | | | | | | | | | | | |
| Investments Purchased with Collateral from Securities Loaned (0.38%) | | | | | | | | |
| State Street Navigator Securities Lending Government Money Market Portfolio, 2.24% | | | | | | | | | | | | |
| (Cost $157,170) | | | | | | | 157,170 | | | | 157,170 | |
| TOTAL SHORT TERM INVESTMENTS | | | | | | | | | |
| (Cost $739,151) | | | | | | | | | | | 739,151 | |
| | | | | | | | | | | | | |
| TOTAL INVESTMENTS (99.39%) | | | | | | | |
| (Cost $49,841,504) | | | | | | | | | | $ | 41,443,563 | |
| NET LIABILITIES LESS OTHER ASSETS (0.61%) | | | | 255,908 | |
| NET ASSETS - 100.00% | | | | | | | | | | $ | 41,699,471 | |
| (a) | Non-income producing security. |
| (b) | Security, or a portion of the security position is currently on loan. The total market value of securities on loan is $151,512. |
See Notes to Financial Statements.
Alerian Energy Infrastructure ETF
| Statement of Assets and Liabilities | November 30, 2018 |
| ASSETS: | | | |
| Investments, at value | | $ | 41,443,563 | |
| Receivable for Investments Sold | | | 356,602 | |
| Dividends receivable | | | 78,102 | |
| Total Assets | | | 41,878,267 | |
| | | | | |
| LIABILITIES: | | | | |
| Payable to adviser | | | 21,626 | |
| Payable for collateral upon return of securities loaned | | | 157,170 | |
| Total Liabilities | | | 178,796 | |
| NET ASSETS | | $ | 41,699,471 | |
| | | | | |
| NET ASSETS CONSIST OF: | | | | |
| Paid-in capital | | $ | 51,340,231 | |
| Distributable earnings | | | (9,640,760 | ) |
| NET ASSETS | | $ | 41,699,471 | |
| | | | | |
| INVESTMENTS, AT COST | | $ | 49,841,504 | |
| | | | | |
| PRICING OF SHARES | | | | |
| Net Assets | | $ | 41,699,471 | |
| Shares of beneficial interest outstanding (Unlimited number of shares authorized, par value $0.01 per share) | | | 2,050,000 | |
| Net Asset Value, offering and redemption price per share | | $ | 20.34 | |
See Notes to Financial Statements.
Alerian Energy Infrastructure ETF
| Statement of Operations | For the Year Ended November 30, 2018 |
| INVESTMENT INCOME: | | | |
| Dividends | | $ | 1,984,970 | |
| Foreign taxes withheld | | | (97,842 | ) |
| Securities lending income | | | 1,206 | |
| Total Investment Income | | | 1,888,334 | |
| | | | | |
| EXPENSES: | | | | |
| Investment adviser fees | | | 272,374 | |
| Total Expenses | | | 272,374 | |
| NET INVESTMENT INCOME | | | 1,615,960 | |
| | | | | |
| REALIZED AND UNREALIZED GAIN/(LOSS): | | | | |
| Net realized loss on investments | | | (1,673,122 | ) |
| Net realized loss on foreign currency transactions | | | (1,967 | ) |
| Net realized loss | | | (1,675,089 | ) |
| Net change in unrealized depreciation on investments | | | (3,100,204 | ) |
| Net change in unrealized appreciation on translation of assets and liabilities denominated in foreign currencies | | | 279 | |
| Net change in unrealized depreciation | | | (3,099,925 | ) |
| NET REALIZED AND UNREALIZED LOSS ON INVESTMENTS AND FOREIGN CURRENCIES | | | (4,775,014 | ) |
| NET DECREASE IN NET ASSETS RESULTING FROM OPERATIONS | | $ | (3,159,054 | ) |
See Notes to Financial Statements.
Alerian Energy Infrastructure ETF
Statements of Changes in Net Assets
| | | For the
Year Ended
November 30, 2018 | | | For the
Year Ended
November 30, 2017 | |
| OPERATIONS: | | | | | | |
| Net investment income | | $ | 1,615,960 | | | $ | 1,127,429 | |
| Net realized gain/(loss) | | | (1,675,089 | ) | | | 278,219 | |
| Net change in unrealized depreciation | | | (3,099,925 | ) | | | (2,284,049 | ) |
| Net decrease in net assets resulting from operations | | | (3,159,054 | ) | | | (878,401 | ) |
| | | | | | | | | |
| DISTRIBUTIONS: | | | | | | | | |
| From distributable earnings | | | (882,519 | ) | | | (671,029 | )(a) |
| Dividends to shareholders from tax return of capital | | | (207,836 | ) | | | (376,837 | ) |
| Total distributions | | | (1,090,355 | ) | | | (1,047,866 | ) |
| | | | | | | | | |
| CAPITAL SHARE TRANSACTIONS: | | | | | | | | |
| Proceeds from sale of shares | | | 11,228,448 | | | | 28,328,448 | |
| Cost of shares redeemed | | | (7,649,908 | ) | | | (2,388,525 | ) |
| Net increase from share transactions | | | 3,578,540 | | | | 25,939,923 | |
| Net increase/(decrease) in net assets | | | (670,869 | ) | | | 24,013,656 | |
| | | | | | | | | |
| NET ASSETS: | | | | | | | | |
| Beginning of period | | | 42,370,340 | | | | 18,356,684 | |
| End of period | | $ | 41,699,471 | | | $ | 42,370,340 | (b) |
| | | | | | | | | |
| OTHER INFORMATION: | | | | | | | | |
| CAPITAL SHARE TRANSACTIONS: | | | | | | | | |
| Beginning shares | | | 1,900,000 | | | | 800,000 | |
| Shares sold | | | 500,000 | | | | 1,200,000 | |
| Shares redeemed | | | (350,000 | ) | | | (100,000 | ) |
| Shares outstanding, end of period | | | 2,050,000 | | | | 1,900,000 | |
| (a) | For the year ended November 30, 2017, total distributions from distributable earnings consisted of distributions from net investment income of $671,029. |
| (b) | For the year ended November 30, 2017, net assets included accumulated net investment loss of $(551,359). |
See Notes to Financial Statements.
Alerian Energy Infrastructure ETF
| Financial Highlights | For a Share Outstanding Throughout the Periods Presented |
| | | For the Year
Ended
November 30,
2018 | | | For the Year
Ended
November 30,
2017 | | | For the Year
Ended
November 30,
2016 | | | For the Year
Ended
November 30,
2015 | | | For the Year
Ended
November 30,
2014 | |
| NET ASSET VALUE, BEGINNING OF PERIOD | | $ | 22.30 | | | $ | 22.95 | | | $ | 18.97 | | | $ | 28.55 | | | $ | 24.86 | |
| | | | | | | | | | | | | | | | | | | | | |
| INCOME/(LOSS) FROM INVESTMENT OPERATIONS: | | | | | | | | | | | | | | | | | | | | |
| Net investment income(a) | | | 0.85 | | | | 0.79 | | | | 0.80 | | | | 0.83 | | | | 0.85 | |
| Net realized and unrealized gain/(loss) on investments | | | (2.23 | ) | | | (0.72 | ) | | | 3.95 | | | | (9.78 | ) | | | 3.40 | |
| Total from investment operations | | | (1.38 | ) | | | 0.07 | | | | 4.75 | | | | (8.95 | ) | | | 4.25 | |
| | | | | | | | | | | | | | | | | | | | | |
| DISTRIBUTIONS: | | | | | | | | | | | | | | | | | | | | |
| From net investment income | | | (0.47 | ) | | | (0.47 | ) | | | (0.63 | ) | | | (0.48 | ) | | | (0.56 | ) |
| Tax return of capital | | | (0.11 | ) | | | (0.25 | ) | | | (0.14 | ) | | | (0.15 | ) | | | – | |
| Total distributions | | | (0.58 | ) | | | (0.72 | ) | | | (0.77 | ) | | | (0.63 | ) | | | (0.56 | ) |
| | | | | | | | | | | | | | | | | | | | | |
| NET INCREASE/(DECREASE) IN NET ASSET VALUE | | | (1.96 | ) | | | (0.65 | ) | | | 3.98 | | | | (9.58 | ) | | | 3.69 | |
| NET ASSET VALUE, END OF PERIOD | | $ | 20.34 | | | $ | 22.30 | | | $ | 22.95 | | | $ | 18.97 | | | $ | 28.55 | |
| TOTAL RETURN(b) | | | (6.27 | )% | | | 0.21 | % | | | 25.63 | % | | | (31.83 | )% | | | 17.12 | % |
| | | | | | | | | | | | | | | | | | | | | |
| RATIOS/SUPPLEMENTAL DATA: | | | | | | | | | | | | | | | | | | | | |
| Net assets, end of period (000s) | | $ | 41,699 | | | $ | 42,370 | | | $ | 18,357 | | | $ | 12,331 | | | $ | 17,131 | |
| | | | | | | | | | | | | | | | | | | | | |
| Ratio of expenses to average net assets | | | 0.65 | % | | | 0.65 | % | | | 0.65 | % | | | 0.65 | % | | | 0.65 | % |
| Ratio of net investment income to average net assets | | | 3.86 | % | | | 3.39 | % | | | 4.04 | % | | | 3.31 | % | | | 2.98 | % |
| PORTFOLIO TURNOVER RATE(c) | | | 73 | % | | | 37 | % | | | 38 | % | | | 47 | % | | | 27 | % |
| (a) | Based on average shares outstanding during the period. |
| (b) | Total return is calculated assuming an initial investment made at the net assets value at the beginning of the period and redemption at the net asset value on the last day of the period and assuming all distributions are reinvested at actual reinvestment prices. Total return calculated for a period of less than one year is not annualized. |
| (c) | Portfolio turnover for periods less than one year is not annualized and does not include securities received or delivered from processing creations or redemptions in-kind. |
See Notes to Financial Statements.
Alerian Exchange Traded Funds
| Notes to Financial Statements | November 30, 2018 |
1. ORGANIZATION
ALPS ETF Trust (the “Trust”), a Delaware statutory trust, is an open-end management investment company registered under the Investment Company Act of 1940, as amended (the “1940 Act”). As of November 30, 2018, the Trust consisted of twenty separate portfolios. Each portfolio represents a separate series of the Trust. This report pertains to the Alerian MLP ETF and the Alerian Energy Infrastructure ETF (each a “Fund” and collectively, the “Funds”).
The investment objective of the Alerian MLP ETF is to seek investment results that correspond (before fees and expenses) generally to the price and yield performance of its underlying index, the Alerian MLP Infrastructure Index. The investment objective of the Alerian Energy Infrastructure ETF is to seek investment results that correspond (before fees and expenses) generally to the price and yield performance of its underlying index, the Alerian Midstream Energy Select Index. The investment advisor uses a “passive management” or indexing investment approach to try to achieve each Fund’s investment objective. Each Fund is considered non-diversified and may invest a greater portion of assets in securities of individual issuers than a diversified fund. As a result, changes in the market value of a single investment could cause greater fluctuations in share price than would occur in a diversified fund.
Each Fund’s Shares (“Shares”) are listed on the NYSE Arca, Inc. (“the NYSE Arca”). Each Fund issues and redeems Shares at net asset value (“NAV”), in blocks of 50,000 Shares, each of which is called a “Creation Unit”. Creation Units are issued and redeemed principally in-kind for securities included in the Underlying Index. Except when aggregated in Creation Units, Shares are not redeemable securities of the Fund.
Pursuant to the Trust’s organizational documents, its Officers and Trustees are indemnified against certain liability arising out of the performance of their duties to the Trust. Additionally, in the normal course of business, the Trust enters into contracts with service providers that contain general indemnification clauses. The Trust’s maximum exposure under these arrangements is unknown, as this would involve future claims that may be made against the Trust that have not yet occurred.
2. SIGNIFICANT ACCOUNTING POLICIES
The following is a summary of significant accounting policies consistently followed by the Funds in the preparation of the financial statements. The accompanying financial statements were prepared in accordance with accounting principles generally accepted in the United States of America (“U.S. GAAP”). The preparation of financial statements in conformity with U.S. GAAP requires management to make certain estimates and assumptions that affect the reported amounts of assets and liabilities and disclosures of contingent assets and liabilities at the date of the financial statements and the reported amounts of revenue and expenses during the period. Actual results could differ from those estimates. Each Fund is considered an investment company under U.S. GAAP and follows the accounting and reporting guidance applicable to investment companies in the Financial Accounting Standards Board Accounting Standards Codification Topic 946.
A. Portfolio Valuation
Each Fund’s NAV is determined daily, as of the close of regular trading on the New York Stock Exchange (“NYSE”), normally 4:00 p.m. Eastern Time, on each day the NYSE is open for trading. The NAV is computed by dividing the value of all assets of the Fund (including accrued interest and dividends), less all liabilities (including accrued expenses and dividends declared but unpaid), by the total number of shares outstanding.
Portfolio securities listed on any exchange other than the NASDAQ Stock Market LLC (“NASDAQ”) are valued at the last sale price on the business day as of which such value is being determined. If there has been no sale on such day, the securities are valued at the mean of the most recent bid and ask prices on such day. Securities traded on the NASDAQ are valued at the NASDAQ Official Closing Price as determined by NASDAQ. Portfolio securities traded on more than one securities exchange are valued at the last sale price on the business day as of which such value is being determined at the close of the exchange representing the principal market for such securities. Portfolio securities traded in the over-the-counter market, but excluding securities traded on the NASDAQ, are valued at the latest quoted sale price in such market.
The Funds’ investments are valued at market value or, in the absence of market value with respect to any portfolio securities, at fair value according to procedures adopted by the Trust’s Board of Trustees (the “Board”). When market quotations are not readily available or when events occur that make established valuation methods unreliable, securities of the Funds may be valued in good faith by or under the direction of the Board. These securities generally include, but are not limited to, restricted securities (securities which may not be publicly sold without registration under the Securities Act of 1933) for which a pricing service is unable to provide a market price; securities whose trading has been formally suspended; a security whose market price is not available from a pre-established primary pricing source or the pricing source is not willing to provide a price; a security with respect to which an event has occurred that is most likely to materially affect the value of the security after the market has closed but before the calculation of the Funds’ NAV or make it difficult or impossible to obtain a reliable market quotation; or a security whose price, as provided by the pricing service, does not reflect the security’s “fair value” due to the security being de-listed from a national exchange or the security’s primary trading market is temporarily closed at a time when, under normal conditions, it would be open. As a general principle, the current “fair value” of a security would be the amount which the owner might reasonably expect to receive from the sale on the applicable exchange or principal market. A variety of factors may be considered in determining the fair value of such securities.
Alerian Exchange Traded Funds
| Notes to Financial Statements | November 30, 2018 |
B. Fair Value Measurements
Each Fund discloses the classification of its fair value measurements following a three-tier hierarchy based on the inputs used to measure fair value. Inputs refer broadly to the assumptions that market participants would use in pricing the asset or liability, including assumptions about risk. Inputs may be observable or unobservable. Observable inputs reflect the assumptions market participants would use in pricing the asset or liability that are developed based on market data obtained from sources independent of the reporting entity. Unobservable inputs reflect the reporting entity’s own assumptions about the assumptions market participants would use in pricing the asset or liability that are developed based on the best information available.
Valuation techniques used to value the Funds’ investments by major category are as follows:
Equity securities, including restricted securities, and Limited Partnerships for which market quotations are readily available, are valued at the last reported sale price or official closing price as reported by a third party pricing vendor on the primary market or exchange on which they are traded and are categorized as Level 1 in the hierarchy. In the event there were no sales during the day or closing prices are not available, securities are valued at the mean of the most recent quoted bid and ask prices on such day and are generally categorized as Level 2 in the hierarchy. Investments in open-end mutual funds are valued at their closing NAV each business day and are categorized as Level 1 in the hierarchy.
Changes in valuation techniques may result in transfers in or out of an assigned level within the disclosure hierarchy.
Various inputs are used in determining the value of the Funds’ investments as of the end of the reporting period. When inputs used fall into different levels of the fair value hierarchy, the level in the hierarchy within which the fair value measurement falls is determined based on the lowest level input that is significant to the fair value measurement in its entirety. The designated input levels are not necessarily an indication of the risk or liquidity associated with these investments.
These inputs are categorized in the following hierarchy under applicable financial accounting standards:
| Level 1 – | Unadjusted quoted prices in active markets for identical investments, unrestricted assets or liabilities that a Fund has the ability to access at the measurement date; |
| Level 2 – | Quoted prices which are not active, quoted prices for similar assets or liabilities in active markets or inputs other than quoted prices that are observable (either directly or indirectly) for substantially the full term of the asset or liability; and |
| Level 3 – | Significant unobservable prices or inputs (including the Fund’s own assumptions in determining the fair value of investments) where there is little or no market activity for the asset or liability at the measurement date. |
The following is a summary of the inputs used to value each Fund’s investments at November 30, 2018:
Alerian MLP ETF
| Investments in Securities at Value* | | Level 1- Unadjusted Quoted Prices | | | Level 2- Other Significant Observable Inputs | | | Level 3- Significant Unobservable Inputs | | | Total | |
| Master Limited Partnerships | | | 8,690,716,071 | | | | – | | | | – | | | | 8,690,716,071 | |
| Short Term Investments | | | 15,209,446 | | | | – | | | | – | | | | 15,209,446 | |
| TOTAL | | $ | 8,705,925,517 | | | $ | – | | | $ | – | | | $ | 8,705,925,517 | |
Alerian Exchange Traded Funds
| Notes to Financial Statements | November 30, 2018 |
Alerian Energy Infrastructure ETF
| Investments in Securities at Value* | | Level 1- Unadjusted Quoted Prices | | | Level 2- Other Significant Observable Inputs | | | Level 3- Significant Unobservable Inputs | | | Total | |
| Canadian Energy Infrastructure Companies | | | 13,369,539 | | | | – | | | | – | | | | 13,369,539 | |
| U.S. Energy Infrastructure Companies | | | 10,143,852 | | | | – | | | | – | | | | 10,143,852 | |
| U.S. Energy Infrastructure MLPs | | | 10,842,594 | | | | – | | | | – | | | | 10,842,594 | |
| U.S. General Partners | | | 6,348,427 | | | | – | | | | – | | | | 6,348,427 | |
| Short Term Investments | | | | | | | | | | | | | | | | |
| Money Market Fund | | | 581,981 | | | | – | | | | – | | | | 581,981 | |
| Investments Purchased with Collateral from Securities Loaned | | | 157,170 | | | | – | | | | – | | | | 157,170 | |
| TOTAL | | $ | 41,443,563 | | | $ | – | | | $ | – | | | $ | 41,443,563 | |
| * | For a detailed breakdown of sectors, see the accompanying Schedule of Investments. |
The Funds did not have any securities that used significant unobservable inputs (Level 3) in determining fair value and there were no transfers into or out of Level 3.
C. Foreign Currency Translation
The books and records of the Funds are maintained in U.S. dollars. Investment valuations and other assets and liabilities initially expressed in foreign currencies are converted each business day into U.S. dollars based upon current exchange rates. The portion of realized and unrealized gains or losses on investments due to fluctuations in foreign currency exchange rates is not separately disclosed and is included in realized and unrealized gains or losses on investments, when applicable.
D. Securities Transactions and Investment Income
Securities transactions are recorded as of the trade date. Realized gains and losses from securities transactions are recorded using the specific identification method. Previously, the Funds recorded realized gains and losses based on the last in, first out cost basis. Dividend income and capital gains distributions, if any, are recorded on the ex-dividend date, net of any foreign taxes withheld. Interest income, if any, is recorded on the accrual basis, including amortization of premiums and accretion of discounts.
E. Dividends and Distributions to Shareholders
Each Fund intends to declare and make quarterly distributions, or as the Board may determine from time to time. Distributions of net realized capital gains earned by the Alerian Energy Infrastructure ETF, if any, are distributed at least annually. Distributions from net investment income and capital gains are determined in accordance with income tax regulations, which may differ from U.S. GAAP. These differences are primarily due to differing treatments of income and gains on various investment securities held by the Funds, timing differences and differing characterization of distributions made by the Funds.
Distributions received from each Fund’s investments in Master Limited Partnerships (“MLPs”) may be comprised of both income and return of capital. Each Fund records investment income and return of capital based on estimates made at the time such distributions are received. Such estimates are based on historical information available from each MLP and other industry sources. These estimates may subsequently be revised based on information received from MLPs after their tax reporting periods are concluded.
The Funds each expect a portion of its distributions to shareholders might be comprised of tax deferred return of capital. Return of capital distributions are not taxable income to the shareholder, but reduce the investor’s tax basis in the investor’s Fund Shares. Such a reduction in tax basis will result in larger taxable gains and/or lower tax losses on a subsequent sale of Fund Shares. Shareholders who periodically receive the payment of dividends or other distributions consisting of a return of capital may be under the impression that they are receiving net profits from the Funds when, in fact, they are not. Shareholders should not assume that the source of the distributions is from the net profits of the Funds.
Alerian Exchange Traded Funds
| Notes to Financial Statements | November 30, 2018 |
F. Federal Income Taxation and Tax Basis Information
Alerian MLP ETF
The Fund is taxed as a regular C-corporation for federal income tax purposes and as such is obligated to pay federal and state income tax. This treatment differs from most investment companies, which elect to be treated as “regulated investment companies” under the Internal Revenue Code of 1986, as amended (the “Code”) in order to avoid paying entity level income taxes. Under current law, the Fund is not eligible to elect treatment as a regulated investment company due to its investments primarily in MLPs invested in energy assets. The Fund expects that substantially all of the distributions it receives from MLPs may be treated as a tax-deferred return of capital, thus reducing the Fund’s current tax liability. However, the amount of taxes paid by the Fund will vary depending on the amount of income and gains derived from investments and/or sales of MLP interests and such taxes will reduce your return from an investment in the Fund.
Since the Fund will be subject to taxation on its taxable income, the NAV of the Fund shares will also be reduced by the accrual of any deferred tax liabilities. The Underlying Index however is calculated without any deductions for taxes. As a result, the Fund's after tax performance could differ significantly from the Underlying Index even if the pretax performance of the Fund and the performance of Underlying Index are closely related.
Cash distributions from MLPs to the Fund that exceed the Fund’s allocable share of such MLP’s net taxable income are considered a tax deferred return of capital that will reduce the Fund’s adjusted tax basis in the equity securities of the MLP. These reductions in the Fund’s adjusted tax basis in the MLP equity securities will increase the amount of any taxable gain (or decrease the amount of any tax loss) recognized by the Fund on a subsequent sale of the securities. The Fund will accrue deferred income taxes for any future tax liability associated with (i) that portion of MLP distributions considered to be a tax-deferred return of capital as well as (ii) capital appreciation of its investments. Upon the sale of an MLP security, the Fund may be liable for previously deferred taxes. The Fund will rely to some extent on information provided by the MLPs, which is not necessarily timely, to estimate the deferred tax liability for purposes of financial statement reporting and determining the Fund’s NAV. From time to time, the Adviser will modify the estimates or assumptions related to the Fund’s deferred tax liability as new information becomes available. The Fund will generally compute deferred income taxes based on the federal income tax rate applicable to corporations and an assumed rate attributable to state taxes.
The Tax Cuts and Jobs Act (“TCJA”) was signed into law on December 22, 2017. The TCJA includes changes to the corporate income tax rate, alternative minimum tax (“AMT”), and modifications to the net operating loss (“NOL”) deduction. Prior to enactment, the highest marginal federal income tax rate was 35%. The TCJA reduced the corporate rate to a flat income tax rate of 21%. The change in the rate was reflected in the Fund's NAV at the time the new tax law was enacted. The Fund may also be subject to a 20% AMT to the extent that the Fund's alternative minimum tax exceeds the Fund's regular federal income tax. For tax years beginning after December 31, 2017 the TCJA repealed the corporate AMT. The TCJA also eliminated the NOL carryback ability and replaced the 20 year carryforward period with an indefinite carryforward period for any NOLs arising in tax years ending after December 31, 2017. The TCJA also established a limitation for any NOLs generated in tax years beginning after December 31, 2017 to the lesser of the aggregate of available NOLs or 80% of taxable income before any NOL utilization. These changes may affect the Fund’s daily estimates of its current taxes and deferred tax liability and/or asset balances used in the calculation of its daily NAV. The Fund is evaluating this tax legislation for its potential effects on these estimates and for its potential effects on the amounts of income taxes actually incurred. This recent tax legislation may also affect information provided to the Fund by MLPs, information that may not be provided to the Fund on a timely basis. As disclosed above, the daily estimate of current taxes and deferred tax liability and/or asset balances used to calculate the Fund’s NAV could vary significantly from the Fund’s actual tax liability or benefit, which may have a material impact on the Fund’s NAV. The Fund may modify its estimates and assumptions regarding its current taxes and deferred tax liability and/or asset balances as this evaluation of the tax legislation occurs and as new information regarding the legislation or other matters becomes available, such modifications in estimates or assumptions may have a material impact on the Fund’s NAV.
The Fund’s income tax expense/(benefit) consists of the following:
| Alerian MLP ETF | | Year ended November 30, 2018 | |
| | | Current | | | Deferred | | | Total | |
| Federal | | $ | – | | | $ | 146,588,611 | | | $ | 146,588,611 | |
| State | | | – | | | | (10,761,406 | ) | | | (10,761,406 | ) |
| Valuation Allowance | | | – | | | | (135,827,205 | ) | | | (135,827,205 | ) |
| Total tax expense/(benefit) | | $ | – | | | $ | – | | | $ | – | |
Deferred income taxes reflect the net tax effect of temporary differences between the carrying amount of assets and liabilities for financial reporting and tax purposes.
Alerian Exchange Traded Funds
| Notes to Financial Statements | November 30, 2018 |
Components of the Fund’s deferred tax assets and liabilities are as follows:
| Alerian MLP ETF | | As of November 30, 2018 | |
| Deferred tax assets: | | | | |
| Net operating loss carryforward | | $ | 301,745,237 | |
| Income recognized from MLP investments | | | 520,085,998 | |
| Charitable contribution carryforward | | | 597,721 | |
| Credit for prior year minimum tax | | | 331,761 | |
| Accrued franchise taxes | | | 58,742 | |
| Valuation allowance | | | (207,701,445 | ) |
| Less Deferred tax liabilities: | | | | |
| Net unrealized gain on investment securities | | | (615,118,014 | ) |
| Net Deferred Tax Asset/Liability | | $ | – | |
Due to the activities of the MLPs that the fund is invested in, the Fund is required to pay franchise tax in certain states. Generally speaking, franchise tax expense is a tax on equity of a corporation, or base minimum fees, imposed by various jurisdictions. The amounts of the tax are estimated throughout the year based upon the Fund's estimate of underlying activities conducted in the states and reconciled to actual amounts paid upon the filing of the tax returns for the states. These taxes are paid as either estimated tax payments, extension payments, or with the tax return filings of the various states.
The net operating loss carryforward is available to offset future taxable income. The Fund has net operating loss carryforwards for federal income tax purposes as follows:
| Alerian MLP ETF | Period-Ended | Amount | | Expiration |
| Federal | 11/30/2013 | | 120,775,605 | | 11/30/2033 |
| Federal | 11/30/2014 | | 64,228,395 | | 11/30/2034 |
| Federal | 11/30/2015 | | 270,791,678 | | 11/30/2035 |
| Federal | 11/30/2016 | | 481,506,187 | | 11/30/2036 |
| Federal | 11/30/2017 | | 343,920,174 | | 11/30/2037 |
| Total | | $ | 1,281,222,039 | | |
The Fund also has state tax net operating loss carryforwards of various amounts per state. The Deferred Tax Assets associated with these state tax net operating losses are as follows:
| Alerian MLP ETF | Period-Ended | Amount | | Expiration |
| State | 11/30/2013 | | 6,600,645 | | Varies by State (5-20 years) |
| State | 11/30/2014 | | 1,500,663 | | Varies by State (5-20 years) |
| State | 11/30/2015 | | 7,185,746 | | Varies by State (5-20 years) |
| State | 11/30/2016 | | 11,572,162 | | Varies by State (5-20 years) |
| State | 11/30/2017 | | 5,829,393 | | Varies by State (5-20 years) |
| Total | | $ | 32,688,609 | | |
The Fund reviews the recoverability of its deferred tax assets based upon the weight of available evidence. When assessing the recoverability of its deferred tax assets, significant weight was given to the effects of potential future realized and unrealized gains on investments and the period over which these deferred tax assets can be realized. Currently, any capital losses that may be generated by the Fund are eligible to be carried back up to three years and can be carried forward for five years to offset capital gains recognized by the Fund in those years. Any NOL generated in the current year can be carried forward indefinitely and any NOL generated in prior years is eligible for a two year carryback and 20 year carryforward period.
Based upon the Fund’s assessment, it has determined that it is “more-likely-than-not” that a portion of its deferred tax assets will not be realized through future taxable income of the appropriate character. Accordingly, a valuation allowance has been established for the Fund’s deferred tax assets. The Fund will continue to assess the need for a valuation allowance in the future. Significant increases in the fair value of its portfolio of investments may change the Fund’s assessment of the recoverability of these assets and may result in the removal of the valuation allowance against all or a portion of the Fund’s gross deferred tax assets.
Alerian Exchange Traded Funds
| Notes to Financial Statements | November 30, 2018 |
Total income tax expense/(benefit) (current and deferred) differs from the amount computed by applying the federal statutory income tax rate of 21% to net investment income and realized and unrealized gain/(losses) on investment before taxes as follows:
| Alerian MLP ETF | | As of November 30, 2018 | |
| Income tax expense at statutory rate | | $ | 17,872,560 | |
| State income tax benefit (net of federal benefit) | | | 1,894,760 | |
| Permanent differences, net | | | (12,092,432 | ) |
| Effect of tax rate change* | | | 127,952,664 | |
| Other | | | 199,653 | |
| Valuation allowance | | | (135,827,205 | ) |
| Net income tax expense | | $ | – | |
| * | The tax rate change listed in the table above is reflective of the change in deferred tax assets and liabilities due to the federal corporate tax rate change enacted by the TCJA as of December 22, 2017. For tax years beginning after December 31, 2017, corporations will be taxed at a flat rate of 21%. All positions reflect enacted tax law changes and are finalized within the context of Staff Accounting Bulletin No. 118. |
The following is a tabular reconciliation of the total amounts of unrecognized tax benefits:
| Alerian MLP ETF | | | Inception to November 30, 2018 | |
| Unrecognized tax benefit - Beginning | | $ | – | |
| Gross increases - tax positions in prior period | | | – | |
| Gross decreases - tax positions in prior period | | | – | |
| Gross increases - tax positions in current period | | | – | |
| Settlement | | | – | |
| Lapse of statute of limitations | | | – | |
| Unrecognized tax benefit - Ending | | $ | – | |
For the period from inception to November 30, 2018, the Fund had no tax penalties or interest.
The Fund recognizes interest accrued related to unrecognized tax benefits and penalties as income tax expense. The Fund recognizes the tax benefits of uncertain tax positions only where the position is “more-likely-than-not” to be sustained assuming examination by tax authorities. Management has analyzed the Fund’s tax positions, and has concluded that no liability for unrecognized tax benefits should be recorded related to uncertain tax positions taken on U.S. tax returns and state tax returns filed since inception of the Fund. Tax periods ended November 30, 2015 through November 30, 2017 remain subject to examination by tax authorities in the United States. Due to the nature of the Fund’s investments, the Fund may be required to file income tax returns in several states. The Fund is not aware of any tax positions for which it is reasonably possible that the total amounts of unrecognized tax benefits will change materially in the next 12 months.
Alerian Energy Infrastructure ETF
The timing and character of income and capital gain distributions are determined in accordance with income tax regulations, which may differ from U.S. GAAP. Reclassifications are made to the Fund’s capital accounts for permanent tax differences to reflect income and gains available for distribution (or available capital loss carryforwards) under income tax regulations.
No provision for income taxes is included in the accompanying financial statements, as the Alerian Energy Infrastructure ETF intends to distribute to shareholders all taxable investment income and realized gains and otherwise comply with Subchapter M of the Internal Revenue Code of 1986, as amended, applicable to regulated investment companies. The Alerian Energy Infrastructure ETF evaluates tax positions taken (or expected to be taken) in the course of preparing the Fund’s tax returns to determine whether these positions meet a “more-likely-than-not” standard that, based on the technical merits, have a more than fifty percent likelihood of being sustained by a taxing authority upon examination. A tax position that meets the “more-likely-than-not” recognition threshold is measured to determine the amount of benefit to recognize in the financial statements.
For the year ended November 30, 2018, the Alerian Energy Infrastructure ETF did not have a liability for any unrecognized tax benefits. The Alerian Energy Infrastructure ETF files U.S. federal, state, and local tax returns as required. The Fund’s tax returns are subject to examination by the relevant tax authorities until expiration of the applicable statute of limitations, which is generally three years after the filing of the tax return, but may extend to four years in certain jurisdictions. Tax returns for open years have incorporated no uncertain tax positions that require a provision for income taxes.
Alerian Exchange Traded Funds
| Notes to Financial Statements | November 30, 2018 |
For the year ended November 30, 2018, permanent book and tax differences resulting primarily from differing treatment of investments in partnerships were identified and reclassified among components of the Fund’s net assets as follows:
| Fund | | Paid-in Capital | | | Total Distributable Earnings | |
| Alerian Energy Infrastructure ETF | | $ | 505,774 | | | $ | (505,774 | ) |
The tax character of the distributions paid during the fiscal year ended November 30, 2018 and November 30, 2017 were as follows:
| | | Ordinary Income | | | Long-Term Capital Gain | | | Return of Capital | |
| November 30, 2018 | | | | | | | | | |
| Alerian Energy Infrastructure ETF | | $ | 882,519 | | | $ | – | | | $ | 207,836 | |
| November 30, 2017 | | | | | | | | | | | | |
| Alerian Energy Infrastructure ETF | | $ | 671,029 | | | | – | | | $ | 376,837 | |
As of November 30, 2018, the components of distributable earnings on a tax basis were as follows:
| | | Alerian Energy Infrastructure ETF | |
| Accumulated net realized loss on investments | | $ | (2,321,194 | ) |
| Net unrealized depreciation on investments | | | (6,346,464 | ) |
| Other accumulated losses | | | (973,102 | ) |
| Total | | $ | (9,640,760 | ) |
As of November 30, 2018, the costs of investments for federal income tax purposes and accumulated net unrealized appreciation/(depreciation) on investments were as follows:
| | | Alerian MLP ETF | | | Alerian Energy
Infrastructure ETF | |
| Cost of investments for income tax purposes | | $ | 8,163,697,089 | | | $ | 47,789,739 | |
| Gross appreciation (excess of value over tax cost) | | $ | 1,671,158,680 | | | $ | 2,984,743 | |
| Gross depreciation (excess of tax cost over value) | | | (1,128,930,252 | ) | | | (9,330,919 | ) |
| Net depreciation of foreign currency | | | – | | | | (288 | ) |
| Net unrealized appreciation/(depreciation) | | $ | 542,228,428 | | | $ | (6,346,464 | ) |
The difference between cost amounts for financial statement purposes is due primarily to the recognition of pass-through income from a Fund’s investments in master limited partnerships and wash sales.
Under current law, capital losses maintain their character as short-term or long-term and are carried forward to the next tax year without expiration. As of November 30, 2018, the following amounts are available as carry forwards to the next tax year:
| | | Short-Term | | | Long-Term | |
| Alerian Energy Infrastructure ETF | | $ | 1,491,438 | | | $ | 829,756 | |
G. Lending of Portfolio Securities
The Alerian Energy Infrastructure ETF has entered into a securities lending agreement with State Street Bank & Trust Co. (“SSB”), the Fund’s lending agent. The Fund may lend its portfolio securities only to borrowers that are approved by SSB. The Fund will limit such lending to not more than 33 1/3% of the value of its total assets. The Fund’s securities held at SSB as custodian shall be available to be lent except those securities the Fund or ALPS Advisors, Inc. specifically identifies in writing as not being available for lending. The borrower pledges and maintains with the Fund collateral consisting of cash (U.S. Dollars only), securities issued or guaranteed by the U.S. government or its agencies or instrumentalities, and cash equivalents (including irrevocable bank letters of credit) issued by a person other than the borrower or an affiliate of the borrower. The initial collateral received by the Fund is required to have a value of no less than 102% of the market value of the loaned securities for U.S equity securities and a value of no less than 105% of the market value for non-U.S. equity securities. The collateral is maintained thereafter, at a market value equal to not less than 102% of the current value of the U.S. equity securities on loan and not less than 105% of the current value of the non-U.S. equity securities on loan. The market value of the loaned securities is determined at the close of each business day and any additional required collateral is delivered to the Fund on the next business day. During the term of the loan, the Fund is entitled to all distributions made on or in respect of the loaned securities. Loans of securities are terminable at any time and the borrower, after notice, is required to return borrowed securities within the customary time period for settlement of securities transactions.
Alerian Exchange Traded Funds
| Notes to Financial Statements | November 30, 2018 |
Any cash collateral received is reinvested in a money market fund managed by SSB as disclosed in the Fund’s Schedule of Investments and is reflected in the Statements of Assets and Liabilities as a payable for collateral upon return of securities loaned. Non-cash collateral, in the form of securities issued or guaranteed by the U.S. government or its agencies or instrumentalities, is not disclosed in the Fund’s Statements of Assets and Liabilities as it is held by the lending agent on behalf of the Fund, and the Fund does not have the ability to re-hypothecate these securities. Income earned by the Fund from securities lending activity is disclosed in the Statement of Operations.
The following is a summary of the Fund's securities lending agreement and related cash and non-cash collateral received as of November 30, 2018.
| | | Market Value of Securities on Loan | | | Cash Collateral Recieved | | | Non-Cash Collateral Received | | | Total Collateral Received | |
| ALPS Alerian Energy Infrastructure ETF | | $ | 151,512 | | | $ | 157,170 | | | $ | – | | | $ | 157,170 | |
The risks of securities lending include the risk that the borrower may not provide additional collateral when required or may not return the securities when due. To mitigate these risks, the Fund benefits from a borrower default indemnity provided by SSB. SSB’s indemnity allows for full replacement of securities lent wherein SSB will purchase the unreturned loaned securities on the open market by applying the proceeds of the collateral, or to the extent such proceeds are insufficient or the collateral is unavailable, SSB will purchase the unreturned loan securities at SSB’s expense. However, the Fund could suffer a loss if the value of the investments purchased with cash collateral falls below the value of the cash collateral received.
The following table reflects a breakdown of transactions accounted for as secured borrowings, the gross obligation by the type of collateral pledged or securities loaned, and the remaining contractual maturity of those transactions as of November 30, 2018:
| ALPS Alerian Energy Infrastructure ETF | | Remaining contractual maturity of the agreements | |
| | | | | | | | | | | | | | | | |
| Securities Lending Transactions | | | Overnight & Continuous | | | | Up to 30 days | | | | 30-90 days | | | | Greater than 90 days | | | | Total | |
| Common Stocks | | $ | 157,170 | | | $ | – | | | $ | – | | | $ | – | | | $ | 157,170 | |
| Total Borrowings | | | | | | | | | | | | | | | | | | | 157,170 | |
| Gross amount of recognized liabilities for securities lending (collateral received) | | | | | | | $ | 157,170 | |
Alerian Exchange Traded Funds
| Notes to Financial Statements | November 30, 2018 |
3. INVESTMENT ADVISORY FEE AND OTHER AFFILIATED TRANSACTIONS
ALPS Advisors, Inc. (“Adviser”) serves as the Funds’ investment adviser pursuant to an Investment Advisory Agreement with the Trust on behalf of each Fund (the “Advisory Agreement”). Pursuant to the Advisory Agreement, each Fund pays the Adviser an annual management fee for the services and facilities it provides as a percentage of the relevant Fund’s average daily net assets, as set out below. The Adviser served under the previous investment advisory agreement, since the commencement of each Fund until these agreements were terminated on April 16, 2018, due to a change of control of the Adviser’s parent company. Beginning April 16, 2018, the Adviser served under an interim investment advisory agreement, until the current investment advisory agreement was approved by the Fund’s shareholders.
| Fund | | Advisory Fee |
| Alerian MLP ETF* | 0.85% | up to and including $10 billion |
| | 0.80% | greater than $10 billion up to and including $15 billion |
| | 0.70% | greater than $15 billion up to and including $20 billion |
| | 0.55% | greater than $20 billion up to and including $25 billion |
| | 0.40% | greater than $25 billion |
| Fund | | Advisory Fee |
| Alerian Energy Infrastructure ETF | 0.65% | |
| * | Prior to June 29, 2018, the unitary advisory fee as a percentage of net assets was subject to the following breakpoints: (i) 0.85% for average net assets up to and including $10 billion, (ii) 0.80% for average net assets greater than $10 billion up to and including $15 billion, (iii) 0.755% for average net assets greater than $15 billion up to and including $20 billion, and (iv) 0.715% for average net assets greater than $20 billion. |
Out of the unitary management fees, the Adviser pays substantially all expenses of the Funds, including the cost of transfer agency, custody, fund administration, legal, audit, independent trustees and other services, except for taxes, interest expenses, distribution fees or expenses, brokerage expenses, and extraordinary expenses such as litigation, and other expenses not incurred in the ordinary course of the each Fund's business. The Adviser’s unitary management fee is designed to pay substantially all the Funds’ expenses and to compensate the Adviser for providing services for each Fund.
ALPS Fund Services, Inc., an affiliate of the Adviser, is the administrator of the Funds.
Each Trustee who is not an officer or employee of the Adviser, any sub-adviser or any of their affiliates (“Independent Trustees”) receives (1) a quarterly retainer of $5,000, (2) a per meeting fee for regularly scheduled meetings of $3,750, (3) $1,500 for any special meeting held outside of a regularly scheduled board meeting, and (4) reimbursement for all reasonable out-of-pocket expenses relating to attendance at meetings. In addition, both the Chairman of the Board and Chairman of the Audit Committee each receives a quarterly retainer of $2,000, in connection with their respective roles.
4. PURCHASES AND SALES OF SECURITIES
For the year ended November 30, 2018, the cost of purchases and proceeds from sales of investment securities, excluding short-term investments and in-kind transactions, were as follows:
| Fund | | Purchases | | | Sales | |
| Alerian MLP ETF | | $ | 2,501,123,079 | | | $ | 5,741,790,353 | |
| Alerian Energy Infrastructure ETF | | | 30,336,041 | | | | 30,282,552 | |
For the year ended November 30, 2018, the cost of in-kind purchases and proceeds from in-kind sales were as follows:
| Fund | | Purchases | | | Sales | |
| Alerian MLP ETF | | $ | 3,116,716,858 | | | $ | – | |
| Alerian Energy Infrastructure ETF | | | 11,226,970 | | | | 7,646,195 | |
For the year ended November 30, 2018, the Alerian Energy Infrastructure ETF had in-kind net realized gain of $381,980.
Alerian Exchange Traded Funds
| Notes to Financial Statements | November 30, 2018 |
Gains on in-kind transactions are not considered taxable for federal income tax purposes and losses on in-kind transactions are also not deductible for tax purposes.
5. MASTER LIMITED PARTNERSHIPS
MLPs are publicly traded partnerships engaged in, among other things, the transportation, storage and processing of minerals and natural resources, and are treated as partnerships for U.S. federal income tax purposes. By confining their operations to these specific activities, their interests, or units, are able to trade on public securities exchanges exactly like the shares of a corporation, without entity level taxation. To qualify as a MLP and to not be taxed as a corporation, a partnership must receive at least 90% of its income from qualifying sources as set forth in Section 7704(d) of the Code. These qualifying sources include, among other things, natural resource-based activities such as the processing, transportation and storage of mineral or natural resources. MLPs generally have two classes of owners, the general partner and limited partners. The general partner of an MLP is typically owned by a major energy company, an investment fund, the direct management of the MLP, or is an entity owned by one or more of such parties. The general partner may be structured as a private or publicly traded corporation or other entity. The general partner typically controls the operations and management of the MLP through an up to 2% equity interest in the MLP plus, in many cases, ownership of common units and subordinated units. Limited partners typically own the remainder of the partnership, through ownership of common units, and have a limited role in the partnership’s operations and management.
MLPs are typically structured such that common units and general partner interests have first priority to receive quarterly cash distributions up to an established minimum amount (“minimum quarterly distributions” or “MQD”). Common and general partner interests also accrue arrearages in distributions to the extent the MQD is not paid. Once common and general partner interests have been paid, subordinated units receive distributions of up to the MQD; however, subordinated units do not accrue arrearages. Distributable cash in excess of the MQD is distributed to both common and subordinated units and generally on a pro rata basis. The general partner is also eligible to receive incentive distributions if the general partner operates the business in a manner which results in distributions paid per common unit surpassing specified target levels. As the general partner increases cash distributions to the limited partners, the general partner receives an increasingly higher percentage of the incremental cash distributions.
6. CAPITAL SHARE TRANSACTIONS
Shares are created and redeemed by each Fund only in Creation Unit size aggregations of 50,000 Shares. Only broker-dealers or large institutional investors with creation and redemption agreements called Authorized Participants (“AP”) are permitted to purchase or redeem Creation Units from the Funds. Such transactions are generally permitted on an in-kind basis, with a balancing cash component to equate the transaction to the NAV per unit of each Fund on the transaction date. Cash may be substituted equivalent to the value of certain securities generally when they are not available in sufficient quantity for delivery, not eligible for trading by the AP or as a result of other market circumstances.
7. RELATED PARTY TRANSACTIONS
The Funds engaged in cross trades between other funds in the Trust during the year ended November 30, 2018 pursuant to Rule 17a-7 under the 1940 Act. Cross trading is the buying or selling of portfolio securities between funds to which the Adviser serves as the investment adviser. The Board previously adopted procedures that apply to transactions between the Funds of the Trust pursuant to Rule 17a-7. These transactions related to cross trades during the period complied with the requirements set forth by Rule 17a-7 and the Trust’s procedures.
Transactions related to cross trades during the year ended November 30, 2018, were as follows:
| Fund | | Purchase cost paid | | | Sale proceeds received | | | Realized gain/(loss) on sales | |
| Alerian MLP ETF | | $ | 339,821 | | | $ | 1,373,372 | | | $ | 196,230 | |
| Alerian Energy Infrastructure ETF | | | 1,373,372 | | | | 1,492,438 | | | | (25,885 | ) |
8. AFFILIATED COMPANIES
As defined by the Investment Company Act of 1940, an affiliated person, including an affiliated company, is one in which a Fund owns 5% or more of the outstanding voting securities, or a company which is under common ownership or control with the Fund.
Alerian Exchange Traded Funds
| Notes to Financial Statements | November 30, 2018 |
For the year ended November 30, 2018, the Alerian MLP ETF held shares in the following affiliates, as defined by the Investment Company Act of 1940.
| Security Name | | Share Balance as of November 30, 2017 | | Purchases | | Purchases In-Kind | | Sales | | Corporate Actions | | Share Balance as of November 30, 2018 | | Market Value as of November 30, 2018 | | | Dividends* | | Change in Unrealized Gain (Loss) | | Realized Gain/(Loss) | |
| Master Limited Partnerships | | | | | | | | | | | | | | | | | | |
| Buckeye Partners LP | | | 11,471,355 | | | 2,084,330 | | | 3,906,427 | | | (4,700,439 | ) | | – | | | 12,761,673 | | $ | 377,235,054 | | | $ | – | | $ | (166,026,208 | ) | $ | 23,092,128 | |
| Crestwood Equity Partners LP | | | – | | | 4,724,984 | | | 457,716 | | | (906,052 | ) | | – | | | 4,276,648 | | | 127,016,446 | | | | – | | | (8,440,488 | ) | | 3,976,564 | |
| DCP Midstream LP | | | 7,380,879 | | | 1,255,150 | | | 2,423,112 | | | (3,161,552 | ) | | – | | | 7,897,589 | | | 269,149,833 | | | | – | | | (25,632,151 | ) | | 34,834,542 | |
| EQM Midstream Partners LP(1)(2) | | | 4,781,272 | | | 1,112,986 | | | 1,751,277 | | | (2,387,650 | ) | | 1,989,874 | | | 7,247,759 | | | 345,428,194 | | | | – | | | (120,601,330 | ) | | (3,348,662 | ) |
| Genesis Energy LP | | | 8,762,589 | | | 1,647,595 | | | 2,912,718 | | | (3,777,568 | ) | | – | | | 9,545,334 | | | 210,474,615 | | | | – | | | 9,806,059 | | | 13,991,234 | |
| Magellan Midstream Partners LP | | | 15,052,756 | | | 2,333,398 | | | 4,776,125 | | | (7,200,418 | ) | | – | | | 14,961,861 | | | 904,893,353 | | | | – | | | (257,966,756 | ) | | 225,289,472 | |
| NGL Energy Partners LP | | | – | | | 10,522,469 | | | 2,818,977 | | | (3,495,012 | ) | | – | | | 9,846,434 | | | 91,374,908 | | | | – | | | (29,568,746 | ) | | 859,557 | |
| NuStar Energy LP | | | 6,453,764 | | | 2,645,436 | | | 2,193,230 | | | (2,766,457 | ) | | – | | | 8,525,973 | | | 206,072,767 | | | | – | | | (14,198,853 | ) | | (1,502,820 | ) |
| Plains All American Pipeline LP | | | 34,141,368 | | | 6,097,765 | | | 11,323,589 | | | (14,347,515 | ) | | – | | | 37,215,207 | | | 857,066,217 | | | | – | | | 88,079,660 | | | 54,737,922 | |
| TC PipeLines LP | | | 4,253,931 | | | 852,002 | | | 1,438,223 | | | (1,815,976 | ) | | – | | | 4,728,180 | | | 140,852,482 | | | | – | | | (75,175,092 | ) | | (711,392 | ) |
| Western Gas Partners LP | | | 8,181,076 | | | 1,394,371 | | | 2,687,459 | | | (3,501,381 | ) | | – | | | 8,761,525 | | | 389,362,171 | | | | – | | | (25,226,896 | ) | | 48,752,474 | |
| | | | | | | | | | | | | | | | | | | | | $ | 3,918,926,040 | | | $ | – | | $ | (624,950,801 | ) | $ | 399,971,019 | |
| | | | | | | | | | | | | |
| Investments no longer affiliated as of November 30, 2018 | | | | | | | | | | | | |
| Dominion Midstream Partners LP | | | 3,944,909 | | | 45,300 | | | 853,279 | | | (4,843,488 | ) | | – | | | – | | $ | – | | | $ | – | | $ | (9,070,121 | ) | $ | (62,799,023 | ) |
| Enbridge Energy Partners LP | | | 17,579,625 | | | 2,957,845 | | | 5,773,554 | | | (7,490,715 | ) | | – | | | 18,820,309 | | | 204,576,759 | | | | – | | | (29,964,403 | ) | | (4,727,033 | ) |
| MPLX LP | | | 23,433,562 | | | 4,018,950 | | | 7,703,259 | | | (10,024,298 | ) | | – | | | 25,131,473 | | | 832,605,701 | | | | – | | | (56,022,758 | ) | | 41,524,439 | |
| Rice Midstream Partners LP(2) | | | 5,981,093 | | | 117,055 | | | 1,418,732 | | | (1,521,479 | ) | | (5,995,401 | ) | | – | | | – | | | | – | | | 19,377,954 | | | 7,512 | |
| Tallgrass Energy LP(3) | | | – | | | 6,343,788 | | | 1,179,189 | | | (2,495,422 | ) | | 7,858,028 | | | 12,885,583 | | | 275,236,053 | | | | – | | | (8,801,990 | ) | | 4,363,699 | |
| Tallgrass Energy Partners LP(3) | | | 3,835,924 | | | – | | | 879,243 | | | (786,153 | ) | | (3,929,014 | ) | | – | | | – | | | | – | | | (4,161,339 | ) | | 11,139,840 | |
| | | | | | | | | | | | | | | | | | | | | $ | 1,312,418,513 | | | $ | – | | $ | (88,642,657 | ) | $ | (10,490,566 | ) |
| | | | | | | | | | | | | | | | | | | | | | | | | | | | | | | | | |
| GRAND TOTAL | | | | | | | | | | | | | | | | | | | | $ | 5,231,344,553 | | | $ | – | | $ | (713,593,458 | ) | $ | 389,480,453 | |
| * | 100% of the Income received was estimated as Return of Capital |
| (1) | On 10/12/2018, EQM Midstream Partners LP changed its name from EQT Midstream Partners LP to EQM Midstream Partners LP. |
| (2) | On 07/23/2018, EQM Midstream Partners LP (EQM) completed its previously announced acquisition of Rice Midstream Partners LP (RMP). At the effective time of the merger, each RMP common unit converted into the right to receive .3319 EQM common units. |
| (3) | On 06/30/2018, Tallgrass Energy Partners LP (TEP) and Tallgrass Energy GP (TEGP) merged to form Tallgrass Energy LP. |
Alerian Exchange Traded Funds
| Notes to Financial Statements | November 30, 2018 |
9. SHAREHOLDER MEETING
A Special Meeting of Shareholders of Alerian Energy Infrastructure ETF, each a series of the Trust, was held at the offices of ALPS Fund Services, Inc., at 1290 Broadway, Suite 1100, Denver, CO 80203 on August 3, 2018. At the meeting, the following matters were voted on by the Shareholders. The results of the Special Meeting of Shareholders are noted below:
Proposal 1: To approve a new investment advisory agreement (the “New Advisory Agreement”) between the Trust, on behalf of each Fund, and the Adviser.
| | Shares Voted In Favor | Shares Voted Against/Withheld or Abstentions | Proposal Approved |
| Alerian Energy Infrastructure ETF | 884,085 | 81,344 | Yes |
Proposal 2: To approve a proposal that would authorize the Adviser to enter into and materially amend sub-advisory agreements in the future with wholly-owned sub-advisers and unaffiliated sub-advisers, with the approval of the Board, but without obtaining additional Shareholder approval.
| | Shares Voted In Favor | Shares Voted Against/Withheld or Abstentions | Proposal Approved |
| Alerian Energy Infrastructure ETF | 679,067 | 286,363 | Yes |
10. NEW ACCOUNTING PRONOUNCEMENTS
In August 2018, the FASB issued ASU 2018-13, which changes the fair value measurement disclosure requirements of FASB ASC Topic 820, Fair Value Measurement. The update to Topic 820 includes new, eliminated, and modified disclosure requirements. ASU 2018-13 is effective for fiscal years beginning after December 15, 2019, including interim periods. Early adoption is permitted for any eliminated or modified disclosures. The Funds have elected to early adopt the eliminated and modified disclosures effective with the financial statements prepared as of November 30, 2018.
11. SEC REGULATIONS
On October 4, 2018, the SEC amended Regulation S-X to require certain financial statement disclosure requirements to conform them to GAAP for investment companies. Effective November 4, 2018, the Fund adopted disclosure requirement changes for Regulation S-X, these changes are reflected throughout this report. The Fund’s adoption of the amendments, effective with the financial statements prepared as of November 30, 2018, had no effect on the Fund’s net assets or results of operations.
Alerian Exchange Traded Funds
| Additional Information | November 30, 2018 (Unaudited) |
PROXY VOTING RECORDS, POLICIES AND PROCEDURES
Information regarding how each Fund voted proxies relating to portfolio securities during the most recent 12-month period ended June 30 and a description of the Funds’ proxy voting policies and procedures used in determining how to vote for proxies are available without charge on the SEC’s website at www.sec.gov and upon request, by calling (toll-free) 1-866-675-2639.
PORTFOLIO HOLDINGS
The Trust is required to disclose, after its first and third fiscal quarters, the complete schedule of each Fund’s portfolio holdings with the SEC on Form N-Q. Form N-Q for each Fund will be available on the SEC’s website at www.sec.gov. Each Fund’s Form N-Q may also be reviewed and copied at the SEC’s Public Reference Room in Washington, D.C. and information on the operation of the Public Reference Room may be obtained by calling 1-800-SEC-0330. Each Fund’s Form N-Q will be available without charge, upon request, by calling (toll-free) 1-866-675-2639 or by writing to ALPS ETF Trust at 1290 Broadway, Suite 1100, Denver, Colorado 80203.
TAX INFORMATION
The Fund designates the following for federal income tax purposes for distributions made during the calendar year ended December 31, 2017:
| | Qualified Dividend Income | Dividend Received Deduction |
| Alerian Energy Infrastructure ETF | 100.00% | 48.71% |
In early 2018, if applicable, shareholders of record received this information for the distribution paid to them by the Fund during the calendar year 2017 via Form 1099. The Fund will notify shareholders in early 2019 of amounts paid to them by the Fund, if any, during the calendar year 2018.
LICENSING AGREEMENTS
Alerian (the “Licensor”) has entered into an index licensing agreement with ALPS Advisors Inc. (the “Adviser”) with respect to each of the Alerian MLP ETF and the Alerian Energy Infrastructure ETF, to allow the Adviser’s use of AMZI and AMEI. The following disclosure relates to the Licensor:
Alerian is the designer of the construction and methodology for the underlying index (each an “Underlying Index”) for each of the Alerian MLP ETF and the Alerian Energy Infrastructure ETF (each a “Fund” and collectively, the “Funds”). “Alerian,” “Alerian MLP Infrastructure Index,” “Alerian Energy Infrastructure Index,” “Alerian Index Series” and “AMZI” are service marks or trademarks of Alerian. Alerian acts as brand licensor for each Underlying Index. Alerian is not responsible for the descriptions of either Underlying Index or the Funds that appear herein. Alerian is not affiliated with the Trust, the Adviser or the Distributor.
Neither Fund is issued, sponsored, endorsed, sold or promoted by Alerian (“Licensor”) or its affiliates. Licensor makes no representation or warranty, express or implied, to the owners of the Fund or any member of the public regarding the advisability of investing in securities generally or in the Fund particularly or the ability of the Alerian MLP Infrastructure Index (“Index”) to track general market performance. Licensor’s only relationship to the Licensee is the licensing of the Index which is determined, composed and calculated by Licensor without regard to the Licensee or the Fund. Licensor has no obligation to take the needs of the Licensee or the owners of the Fund into consideration in determining, composing or calculating the Index. Licensor is not responsible for and has not participated in the determination of the timing of, prices at, or quantities of the Fund to be issued or in the determination or calculation of the equation by which the Fund is to be converted into cash. Licensor has no obligation or liability in connection with the issuance, administration, marketing or trading of either Fund and is not responsible for and has not participated in the determination of pricing or the timing of the issuance or sale of the Shares of either Fund or in the determination or calculation of the NAV of the relevant Fund. Alerian MLP Infrastructure Index, Alerian MLP Infrastructure Total Return Index, AMZI and AMZIX are trademarks of GKD Index Partners, LLC and their general use is granted under a license from GKD Index Partners, LLC.
LICENSOR DOES NOT GUARANTEE THE QUALITY, ACCURACY AND/OR THE COMPLETENESS OF THE INDEX OR ANY DATA INCLUDED THEREIN AND SHALL HAVE NO LIABILITY FOR ERRORS OR OMISSIONS OF ANY KIND RELATED TO THE INDEX OR DATA. LICENSOR MAKES NO WARRANTY, EXPRESS OR IMPLIED, AS TO RESULTS TO BE OBTAINED BY LICENSEE, OWNERS OF THE FUND, OR ANY OTHER PERSON OR ENTITY FROM THE USE OF THE INDEX OR ANY DATA INCLUDED THEREIN IN CONNECTION WITH THE RIGHTS LICENSED TO LICENSEE OR FOR ANY OTHER USE. LICENSOR MAKES NO EXPRESS OR IMPLIED WARRANTIES, AND HEREBY EXPRESSLY DISCLAIMS ALL WARRANTIES OF MERCHANTABILITY OR FITNESS FOR A PARTICULAR PURPOSE OR USE WITH RESPECT TO THE INDEX OR ANY DATA INCLUDED THEREIN. WITHOUT LIMITING ANY OF THE FOREGOING, IN NO EVENT SHALL LICENSOR HAVE ANY LIABILITY FOR ANY SPECIAL, PUNITIVE, INDIRECT, OR CONSEQUENTIAL DAMAGES (INCLUDING LOST PROFITS), EVEN IF NOTIFIED OF THE POSSIBILITY OF SUCH DAMAGES.
Alerian Exchange Traded Funds
| Additional Information | November 30, 2018 (Unaudited) |
The Adviser does not guarantee the accuracy and/or the completeness of either Underlying Index or any data included therein, and the Adviser shall have no liability for any errors, omissions or interruptions therein. The Adviser makes no warranty, express or implied, as to results to be obtained by either Fund, owners of the Shares of the relevant Fund or any other person or entity from the use of either Underlying Index or any data included therein. The Adviser makes no express or implied warranties, and expressly disclaims all warranties of merchantability or fitness for a particular purpose or use with respect to either Underlying Index or any data included therein. Without limiting any of the foregoing, in no event shall the Adviser have any liability for any special, punitive, direct, indirect, or consequential damages (including lost profits) arising out of matters relating to the use of either Underlying Index, even if notified of the possibility of such damages.
(Applicable to the Alerian Energy Infrastructure ETF only)
The Underlying Index is the exclusive property of GKD Index Partners LLC d/b/a Alerian, which has contracted with S&P Opco, LLC (a subsidiary of S&P Dow Jones Indices LLC) (“S&P Dow Jones Indices”) to calculate and maintain the Underlying Index. S&P® is a registered trademark of Standard & Poor’s Financial Services LLC (“SPFS”); Dow Jones® is a registered trademark of Dow Jones Trademark Holdings LLC (“Dow Jones”); and these trademarks have been licensed to S&P Dow Jones Indices. “Calculated by S&P Dow Jones Indices” and its related stylized mark(s) have been licensed for use by Alerian.
The Fund is not sponsored, endorsed, sold or promoted by S&P Dow Jones Indices, SPFS, Dow Jones or any of their affiliates (collectively, “S&P Dow Jones Indices Entities”). S&P Dow Jones Indices Entities do not make any representation or warranty, express or implied, to the owners of the Fund or any member of the public regarding the advisability of investing in securities generally or in the Fund particularly or the ability of the Underlying Index to track general market performance. S&P Dow Jones Indices Entities only relationship to Alerian with respect to the Underlying Index is the licensing of certain trademarks, service marks and trade names of S&P Dow Jones Indices Entities and for the providing of calculation and maintenance services related to the Underlying Index. S&P Dow Jones Indices Entities are not responsible for and have not participated in the determination of the prices and amount of the Fund or the timing of the issuance or sale of the Fund or in the determination or calculation of the equation by which the Fund is to be converted into cash. S&P Dow Jones Indices Entities have no obligation or liability in connection with the administration, marketing or trading of the Fund. S&P Dow Jones Indices LLC is not an investment advisor. Inclusion of a security within the Underlying Index is not a recommendation by S&P Dow Jones Indices Entities to buy, sell, or hold such security, nor is it considered to be investment advice.
S&P DOW JONES INDICES ENTITIES DO NOT GUARANTEE THE ADEQUACY, ACCURACY, TIMELINESS AND/OR THE COMPLETENESS OF THE UNDERLYING INDEX OR ANY DATA RELATED THERETO OR ANY COMMUNICATION, INCLUDING BUT NOT LIMITED TO, ORAL OR WRITTEN COMMUNICATION (INCLUDING ELECTRONIC COMMUNICATIONS) WITH RESPECT THERETO. S&P DOW JONES INDICES ENTITIES SHALL NOT BE SUBJECT TO ANY DAMAGES OR LIABILITY FOR ANY ERRORS, OMISSIONS, OR DELAYS THEREIN. S&P DOW JONES INDICES ENTITIES MAKE NO EXPRESS OR IMPLIED WARRANTIES, AND EXPRESSLY DISCLAIMS ALL WARRANTIES, OF MERCHANTABILITY OR FITNESS FOR A PARTICULAR PURPOSE OR USE OR AS TO RESULTS TO BE OBTAINED BY ALERIAN, OWNERS OF THE FUND, OR ANY OTHER PERSON OR ENTITY FROM THE USE OF THE UNDERLYING INDEX OR WITH RESPECT TO ANY DATA RELATED THERETO. WITHOUT LIMITING ANY OF THE FOREGOING, IN NO EVENT WHATSOEVER SHALL S&P DOW JONES INDICES ENTITIES BE LIABLE FOR ANY INDIRECT, SPECIAL, INCIDENTAL, PUNITIVE, OR CONSEQUENTIAL DAMAGES INCLUDING BUT NOT LIMITED TO, LOSS OF PROFITS, TRADING LOSSES, LOST TIME OR GOODWILL, EVEN IF THEY HAVE BEEN ADVISED OF THE POSSIBILITY OF SUCH DAMAGES, WHETHER IN CONTRACT, TORT, STRICT LIABILITY, OR OTHERWISE.
Alerian Exchange Traded Funds
| Trustees & Officers | November 30, 2018 (Unaudited) |
The general supervision of the duties performed by the Adviser for the Fund under the Investment Advisory Agreement is the responsibility of the Board of Trustees. The Trust currently has four Trustees. Three Trustees have no affiliation or business connection with the Adviser or any of its affiliated persons and do not own any stock or other securities issued by the Adviser. These are the “non-interested” or “independent” Trustees (“Independent Trustees”). The other Trustee (the “Interested Trustee”) is affiliated with the Adviser.
The Independent Trustees of the Trust, their term of office and length of time served, their principal business occupations during the past five years, the number of portfolios in the Fund Complex overseen by each Independent Trustee, and other directorships, if any, held by the Trustee are shown below.
| INDEPENDENT TRUSTEES |
Name, Address & Year of Birth* | Position(s) Held with Trust | Term of Office and Length of Time Served** | Principal Occupation(s) During Past 5 Years | Number of Portfolios in Fund Complex Overseen by Trustees*** | Other Directorships Held by Trustees |
Mary K. Anstine, 1940 | Trustee | Since March 2008 | Ms. Anstine was President/Chief Executive Officer of HealthONE Alliance, Denver, Colorado, and former Executive Vice President of First Interstate Bank of Denver. Ms. Anstine is also Trustee/Director of AV Hunter Trust and Colorado Uplift Board. Ms. Anstine was formerly a Director of the Trust Bank of Colorado (later purchased and now known as Northern Trust Bank), HealthONE and Denver Area Council of the Boy Scouts of America and a member of the American Bankers Association Trust Executive Committee. | 41 | Ms. Anstine is a Trustee of ALPS Variable Investment Trust (9 funds); Financial Investors Trust (33 funds); Reaves Utility Income Fund (1 fund); and Segall Bryant & Hamill Trust (14 funds). |
Jeremy W. Deems, 1976 | Trustee | Since March 2008 | Mr. Deems is the Co-Founder, Chief Compliance Officer and Chief Financial Officer of Green Alpha Advisors, LLC. Mr. Deems is Co-Portfolio Manager of the Shelton Green Alpha Fund. Prior to joining Green Alpha Advisors, Mr. Deems was CFO and Treasurer of Forward Management, LLC, ReFlow Management Co., LLC, ReFlow Fund, LLC, a private investment fund, and Sutton Place Management, LLC, an administrative services company. | 41 | Mr. Deems is a Trustee of ALPS Variable Investment Trust (9 funds); Financial Investors Trust (33 funds); and Reaves Utility Income Fund (1 fund); and Clough Funds Trust (1 fund). |
Rick A. Pederson, 1952 | Trustee and Chairman | Since March 2008. Has served as Chairman since July 2017. | Mr. Pederson is Partner, Bow River Capital Partners (private equity management), 2003 - present; Board Member, Prosci Inc. (private business services) 2013-2016; Board Member, Citywide Banks (Colorado community bank) 2014-present; Board Member, Strong-Bridge Consulting (management consulting) 2015-present; Board Member, IRI/ODMS Holdings LLC, 2017 – present; Director, National Western Stock Show (not-for-profit organization) 2010 – present; Board Member, History Colorado, 2015 – present; Trustee, Boettcher Foundation, 2018. | 21 | Mr. Pederson is Trustee of Segall Bryant & Hamill Trust (14 funds) and Principal Real Estate Income Fund (1 fund) |
| * | The business address of the Trustee is c/o ALPS Advisors, Inc., 1290 Broadway, Suite 1100, Denver, Colorado 80203. |
| ** | This is the period for which the Trustee began serving the Trust. Each Trustee serves an indefinite term, until his successor is elected. |
| *** | The Fund Complex includes all series of the Trust and any other investment companies for which ALPS Advisors, Inc. provides investment advisory services. |
Alerian Exchange Traded Funds
| Trustees & Officers | November 30, 2018 (Unaudited) |
The Trustee who is affiliated with the Adviser or affiliates of the Adviser and executive officers of the Trust, his term of office and length of time served, his principal business occupations during the past five years, the number of portfolios in the Fund Complex overseen by the Interested Trustee and the other directorships, if any, held by the Trustee, are shown below.
| INTERESTED TRUSTEE | | | |
Name, Address and Year of Birth of Interested Trustee* | Position(s) Held with Trust | Term of Office and Length of Time Served** | Principal Occupation(s) During Past 5 Years | Number of Portfolios in Fund Complex Overseen by Trustees*** | Other Directorships Held by Trustee |
Edmund J. Burke, 1961 | Trustee and President | Since December 2017 | Mr. Burke is President and a Director of ALPS Holdings, Inc. (“AHI”) (since 2005) and Director of Boston Financial Data Services, Inc. (“BFDS”), ALPS Advisors, Inc. (“AAI”), ALPS Distributors, Inc. (“ADI”), ALPS Fund Services, Inc. (“AFS”) and ALPS Portfolio Solutions Distributor, Inc. (“APSD”). Because of his positions with AHI, BFDS, AAI, ADI, AFS and APSD, Mr. Burke is deemed an affiliate of the Trust as defined under the 1940 Act. | 36 | Mr. Burke is a Trustee of Clough Global Dividend and Income Fund (1 fund); Clough Global Equity Fund (1 fund); Clough Global Opportunities Fund (1 fund); Clough Funds Trust (1 fund); Liberty All-Star Equity Fund (1 fund); Director of the Liberty All-Star Growth Fund, Inc. (1 fund) and Financial Investors Trust (33 funds). |
| * | The business address of the Trustee is c/o ALPS Advisors, Inc., 1290 Broadway, Suite 1100, Denver, Colorado 80203. |
| ** | This is the period for which the Trustee began serving the Trust. Each Trustee serves an indefinite term, until his successor is elected. |
| *** | The Fund Complex includes all series of the Trust and any other investment companies for which ALPS Advisors, Inc. provides investment advisory services. |
Alerian Exchange Traded Funds
| Trustees & Officers | November 30, 2018 (Unaudited) |
| OFFICERS |
Name, Address and Year of Birth of Officer* | Position(s) Held with Trust | Length of Time Served** | Principal Occupation(s) During Past 5 Years |
Erin D. Nelson, 1977 | Chief Compliance Officer (“CCO”) | Since December 2015 | Ms. Nelson became Senior Vice-President and Chief Compliance Officer of ALPS Advisors, Inc. (“AAI”) on July 1, 2015 and prior to that served as Vice President and Deputy Chief Compliance Officer of AAI since January 1, 2015. Prior to January 1, 2015, Ms. Nelson was Vice-President and Assistant General Counsel of ALPS Fund Services, Inc. Because of her position with AAI, Ms. Nelson is deemed an affiliate of the Trust as defined under the 1940 Act. Ms. Nelson is also the CCO of ALPS Variable Investment Trust, Liberty All-Star Growth Fund, Inc., Liberty All- Star Equity Fund, Principal Real Estate Income Fund, RiverNorth Opportunities Fund, Inc. and Red Rocks Capital, LLC. |
Kathryn Burns, 1976 | Treasurer | Since September 2018 | Ms. Burns serves as Vice President, Director of Fund Operations of AAI since 2018. From 2013 to 2018, she served as Vice President and Fund Controller at ALPS Fund Services. Prior to joining ALPS, she worked at Old Mutual Capital where she served as Vice President and Chief Compliance Officer (2010 – 2012) and Regulatory Reporting Manager and Assistant Treasurer to the Old Mutual Funds Trusts (2006 – 2012). She also served as a CPA for PricewaterhouseCoopers LLP. Ms. Burns is also Treasurer of ALPS Variable Investment Trust, the Boulder Growth & Income Fund, Inc., Principal Real Estate Income Fund and the RiverNorth Opportunities Fund Inc. |
Andrea E. Kuchli, 1985 | Secretary | Since December 2017 | Ms. Kuchli joined ALPS in 2015 and is currently Vice President and Senior Counsel of ALPS. Prior to joining ALPS, Ms. Kuchli was an Associate with Davis Graham & Stubbs LLP from April 2014 to February 2015, and an Associate with Dechert LLP from 2011 to April 2014. Because of her position with ALPS, Ms. Kuchli is deemed an affiliate of the Trust as defined under the 1940 Act. Ms. Kuchli is also Secretary of ALPS Variable Investment Trust and Principal Real Estate Income Fund as well as Assistant Secretary of the James Advantage Funds. |
Sharon Akselrod, 1974 | Assistant Secretary | Since December 2016 | Ms. Akselrod joined ALPS in August 2014 and is currently Senior Investment Company Act Paralegal of ALPS Fund Services, Inc. Prior to joining ALPS, Ms. Akselrod served as Corporate Governance and Regulatory Associate for Nordstrom fsb (2013-2014) and Senior Legal Assistant – Legal Manager for AXA Equitable Life Insurance Company (2008-2013). Because of her position with ALPS, Ms. Akselrod is deemed an affiliate of the Trust as defined under the 1940 Act. Ms. Akselrod is also Assistant Secretary of Financial Investors Trust, ALPS Variable Investment Trust, Principal Real Estate Income Fund and Clough Funds Trust. |
| * | The business address of each Officer is c/o ALPS Advisors, Inc., 1290 Broadway, Suite 1100, Denver, Colorado 80203. |
| ** | This is the period for which the Officer began serving the Trust. Each Officer serves an indefinite term, until his/her successor is elected. |

TABLE OF
CONTENTS
| Performance Overview | 1 |
| Disclosure of Fund Expenses | 4 |
| Report of Independent Registered Public Accounting Firm | 5 |
| Schedule of Investments | 6 |
| Statement of Assets & Liabilities | 7 |
| Statement of Operations | 8 |
| Statements of Changes In Net Assets | 9 |
| Financial Highlights | 10 |
| Notes to Financial Statements | 11 |
| Additional Information | 17 |
| Trustees & Officers | 18 |
Beginning on January 1, 2021, as permitted by regulations adopted by the U.S. Securities and Exchange Commission, paper copies of the Fund’s annual and semi-annual shareholder reports will no longer be sent by mail, unless you specifically request paper copies of the reports from your financial intermediary (such as a broker-dealer or bank). Instead, the reports will be made available on the Fund’s website (www.alpsfunds.com), and you will be notified by mail each time a report is posted and provided with a website link to access the report.
If you already elected to receive shareholder reports electronically, you will not be affected by this change and you need not take any action. You may elect to receive shareholder reports and other communications from a Fund electronically anytime by contacting your financial intermediary.
You may elect to receive all future reports in paper free of charge. You can contact your financial intermediary to request that you continue to receive paper copies of your shareholder reports. Your election to receive reports in paper will apply to all funds held in your account with your financial intermediary.
alpsfunds.com
ALPS Equal Sector Weight ETF
| Performance Overview | November 30, 2018 (Unaudited) |
Investment Objective
The ALPS Equal Sector Weight ETF (the “Fund”) seeks investment results that replicate as closely as possible, before fees and expenses, the performance of the NYSE Select Sector Equal Weight IndexSM(the “Underlying Index”).
The Underlying Index is an index of ETFs comprised of all active Select Sector SPDR® ETFs in an equal weighted portfolio. These are the Communication Services Select Sector SPDR® Fund, Consumer Discretionary Select Sector SPDR® Fund, Consumer Staples Select Sector SPDR® Fund, Materials Select Sector SPDR® Fund, Energy Select Sector SPDR® Fund, Technology Select Sector SPDR® Fund, Utilities Select Sector SPDR® Fund, Financial Select Sector SPDR® Fund, Industrial Select Sector SPDR® Fund, Health Care Select Sector SPDR®Fund and Real Estate Select Sector SPDR® Fund (each, an “Underlying Sector ETF” and collectively, the “Underlying Sector ETFs”). In order to track the Underlying Index, the Fund will use a “fund of funds” approach, and seek to achieve its investment objective by investing at least 90% of its total assets in the shares of the Underlying Sector ETFs.
The Underlying Index is designed to track performance of the equally weighted Underlying Sector ETFs. Accordingly, the Underlying Index is rebalanced to an equal weighting quarterly during the months of March, June, September, and December.
Each Underlying Sector ETF is an “index fund” that invests in the equity securities of companies in a particular sector or group of industries. The objective of each Underlying Sector ETF is to track its respective underlying sector index by replicating the securities in the underlying sector index. Together, the Underlying Sector ETFs represent the Underlying Index as a whole.
Performance Overview
The Fund, for the twelve month period ended November 30, 2018, generated a total return of 3.66%, compared with the Fund’s Underlying Index, net of fees, which returned 1.52%. The Fund underperformed the S&P 500® Total Return Index, which returned 6.27% for the same period.
The S&P 500 Total Return Index ended 11/30/2018 up 6.27%, after an October sell-off caused the US broad-based benchmark to give back most of the year’s gains. This is after hitting its all-time high on September 20, 2018, ending that month up 11.78% from 11/30/17. The year started with a boost from corporate tax cuts, positive macro data, and strong corporate earnings and stock buybacks. After a market correction between February and March as interest rates spiked, the market rebounded throughout most of Q2 and Q3. Higher inflationary outlooks continued to drive interest rates to highs last seen in 2011, and an escalating U.S. – China trade war sent the market into a tailspin in October, down almost 8% for the month amid heightened volatility. From an FOMC perspective, the US economy saw 3 interest rate hikes in 2018, leading many investors to question whether the federal funds rate was being raised too quickly as the housing market weakened throughout the year. At the end of November 30, 2018, crude oil had fallen from its highs amid record production by the U.S. and OPEC. Despite the pull back in the equity markets, Q3 corporate earnings were largely positive, however, the U.S. – China trade war started to affect 2019 earnings estimates even with a quasi “trade truce” announced by the U.S. and China.
Compared to the S&P 500®Total Return Index, the Fund experienced a negative impact (-2.50%) from allocation effect during the period. This impact was largely driven by relative underweight to the Information Technology sector (average weight for the period of 9.81% vs. 20.01% in the S&P 500®).
The best performing fund holdings for the period were the Health Care Select Sector SPDR® Fund (XLV), which increased 16.59% and the Consumer Discretionary Select Sector SPDR® Fund (XLY), which saw a gain of 13.07%. The Financial Select Sector SPDR® Fund (XLF), the Industrial Select Sector SPDR® Fund (XLI), and the Energy Select Sector SPDR® Fund (XLE) were relatively flat over the last 12 month period ended November 30th, 2018. The worst performing fund holdings for the period were the Materials Select Sector SPDR® Fund (XLB) which dropped 6.64% and the Communication Services Select Sector SPDR® Fund (XLC) which fell 7.29%.
Looking forward we believe the Fund’s strategy of holding each of the ten sectors (with Information Technology and Telecommunication Service sectors combined) in the S&P 500® Total Return Index via the Select SPDR® Funds can result in a diversified core holding, and potential for market participation in all economic cycles through equal sector weighting.
ALPS Equal Sector Weight ETF
| Performance Overview | November 30, 2018 (Unaudited) |
Performance(as of November 30, 2018)
| | 1 Year | 3 Year | 5 Year | Since Inception^ |
| ALPS Equal Sector Weight ETF - NAV | 3.66% | 10.39% | 9.36% | 13.87% |
| ALPS Equal Sector Weight ETF - Market Price* | 3.45% | 10.35% | 9.32% | 13.88% |
| NYSE® Select Sector Equal Weight Index | 1.52% | 8.09% | 7.20% | 11.74% |
| S&P 500® Total Return Index | 6.27% | 12.16% | 11.12% | 15.06% |
Total Expense Ratio (per the current Prospectus) 0.51%. Net Expense Ratio (per the current Prospectus) 0.48%. Net expense ratio reflects the reimbursement of distribution fees for underlying sector ETFs. Please see the prospectus for additional information.
Performance data quoted represents past performance. Past performance does not guarantee future results. The table does not reflect the deduction of taxes that a shareholder would pay on Fund distributions or the redemption of Fund shares. Investment return and principal value of an investment will fluctuate so that an investor’s shares, when sold or redeemed, may be worth more or less than the original cost. Current performance data may be higher or lower than actual data quoted. For the most current month-end performance data please visit www.alpsfunds.com or call 1.866.675.2639.
NAV is an exchange-traded fund’s per-share value. The per-share dollar amount of the Fund is derived by dividing the total value of all the securities in its portfolio, less any liabilities, by the number of Fund shares outstanding. Market Price is the price at which a share can currently be traded in the market. Information detailing the number of days the Market Price of the Fund was greater than the Fund’s NAV and the number of days it was less than the Fund’s NAV can be obtained at www.alpsfunds.com.
| ^ | The Fund commenced Investment Operations on July 6, 2009 with an Inception Date, the first day of trading on the Exchange, of July 7, 2009. |
| * | Market Price is based on the midpoint of the bid/ask spread at 4 p.m. ET and does not represent the returns an investor would receive if shares were traded at other times. |
The NYSE®Select Sector Equal Weight Index consists of a strategy that holds all active Select Sector SPDR®ETFs in an equal-weighted portfolio.
S&P 500®Total Return Index:the Standard & Poor’s composite index of 500 stocks, a widely recognized, unmanaged index of common stock prices. Total return assumes reinvestment of any dividends and distributions realized during a given time period.
The indexes are not actively managed and do not reflect any deductions for fees, expenses or taxes. The indexes are reported on a total return basis, which assumes reinvestment of any dividends and distributions realized during a given time period. One cannot invest directly in an index. Index performance does not reflect fund performance.
The Fund’s shares are not individually redeemable. Investors buy and sell shares of the Fund on a secondary market. Only market makers or “authorized participants” may trade directly with the Fund, typically in blocks of 50,000 shares.
The ALPS Equal Sector Weight ETF is not suitable for all investors. Investments in the Fund are subject to investment risks, including possible loss of the principal amount invested.
ALPS Portfolio Solutions Distributor, Inc., a FINRA member, is the distributor for the Fund.
ALPS Equal Sector Weight ETF
| Performance Overview | November 30, 2018 (Unaudited) |
The following table shows the sector weights of both the Fund and the S&P 500®Total Return Index as of November 30, 2018:
Sector Weighting Comparison(as of November 30, 2018)
| | EQL* | S&P 500® | +/- |
| Utilities | 10.0% | 3.1% | 6.9% |
| Consumer Staples | 9.8% | 7.4% | 2.4% |
| Health Care | 9.7% | 15.8% | -6.1% |
| Real Estate | 9.7% | 2.9% | 6.8% |
| Financials | 8.9% | 13.7% | -4.8% |
| Communication Services | 8.8% | 9.9% | -1.1% |
| Consumer Discretionary | 8.8% | 9.9% | -1.1% |
| Technology | 8.7% | 19.9% | -11.2% |
| Materials | 8.6% | 2.6% | 6.0% |
| Industrials | 8.6% | 9.4% | -0.8% |
| Energy | 8.4% | 5.4% | 3.0% |
| Total | 100.0% | 100.0% | |
Source: S&P 500®
| * | % of Total Investments (excluding investments purchased with collateral from securities loaned). |
Future holdings are subject to change.
Growth of $10,000(as of November 30, 2018)
Comparison of Change in Value of $10,000 Investment in the Fund and the Indexes
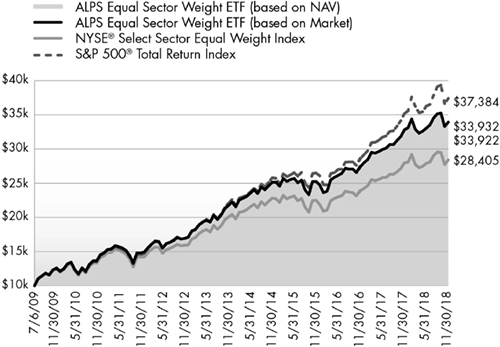
The chart above represents historical performance of a hypothetical investment of $10,000 in the Fund over the life of the Fund. Past performance does not guarantee future results. This chart does not reflect the deduction of taxes that a shareholder would pay on Fund distributions or the redemption of Fund shares.
ALPS Equal Sector Weight ETF
| Disclosure of Fund Expenses | November 30, 2018 (Unaudited) |
Shareholder Expense Example:As a shareholder of the Fund, you incur two types of costs: (1) transaction costs which may include creation and redemption fees or brokerage charges, and (2) ongoing costs, including management fees and other Fund expenses. These examples are intended to help you understand your ongoing costs (in dollars) of investing in the Fund and to compare these costs with the ongoing costs of investing in other funds. The example is based on an investment of $1,000 invested at the beginning of the (six month) period and held through November 30, 2018.
Actual Return:The first line of the table provides information about actual account values and actual expenses. You may use the information in this line, together with the amount you invested, to estimate the expenses that you incurred over the period. Simply divide your account value by $1,000 (for example, an $8,600 account value divided by $1,000 = 8.6), then multiply the result by the number in the first line under the heading entitled “Expenses Paid During Period” to estimate the expenses attributable to your investment during this period.
Hypothetical 5% Return:The second line of the table provides information about hypothetical account values and hypothetical expenses based on the Fund’s actual expense ratio and an assumed rate of return of 5% per year before expenses, which is not the Fund’s actual return. The hypothetical account values and expenses may not be used to estimate the actual ending account balance or expenses you paid for the period. You may use this information to compare ongoing costs of investing in the Fund and other funds. To do so, compare this 5% hypothetical example with the 5% hypothetical examples that appear in the shareholder reports of other funds.
The expenses shown in the table are meant to highlight ongoing Fund costs only and do not reflect any transaction costs, such as creation and redemption fees or brokerage charges. Therefore, the second line of the table is useful in comparing ongoing costs only, and will not help you determine the relative total costs of owning different funds. In addition, if these costs were included, your costs would have been higher.
| Beginning Account
Value 6/1/18 | Ending Account
Value 11/30/18 | Expense
Ratio(a) | Expenses Paid
During Period
6/1/18 - 11/30/18(b) |
| ALPS Equal Sector Weight ETF | | | | |
| Actual | $1,000.00 | $1,028.90 | 0.15% | $0.76 |
| Hypothetical (5% return before expenses) | $1,000.00 | $1,024.32 | 0.15% | $0.76 |
| (a) | Annualized, based on the Fund's most recent fiscal half year expenses. |
| (b) | Expenses are equal to the Fund's annualized expense ratio multiplied by the average account value over the period, multiplied by the number of days in the most recent fiscal half year (183), divided by 365. |
ALPS Equal Sector Weight ETF
Report of Independent Registered Public Accounting Firm
To the shareholders and the Board of Trustees of ALPS ETF Trust:
Opinion on the Financial Statements and Financial Highlights
We have audited the accompanying statement of assets and liabilities, including the schedule of investments, of ALPS Equal Sector Weight ETF (the “Fund”), one of the funds constituting the ALPS ETF Trust, as of November 30, 2018, the related statement of operations for the year then ended, the statements of changes in net assets for each of the two years in the period then ended, the financial highlights for each of the five years in the period then ended, and the related notes. In our opinion, the financial statements and financial highlights present fairly, in all material respects, the financial position of ALPS Equal Sector Weight ETF of ALPS ETF Trust as of November 30, 2018, and the results of its operations for the year then ended, the changes in its net assets for each of the two years in the period then ended, and the financial highlights for each of the five years in the period then ended, in conformity with accounting principles generally accepted in the United States of America.
Basis for Opinion
These financial statements and financial highlights are the responsibility of the Fund's management. Our responsibility is to express an opinion on the Fund’s financial statements and financial highlights based on our audits. We are a public accounting firm registered with the Public Company Accounting Oversight Board (United States) (PCAOB) and are required to be independent with respect to the Fund in accordance with the U.S. federal securities laws and the applicable rules and regulations of the Securities and Exchange Commission and the PCAOB.
We conducted our audits in accordance with the standards of the PCAOB. Those standards require that we plan and perform the audit to obtain reasonable assurance about whether the financial statements and financial highlights are free of material misstatement, whether due to error or fraud. The Fund is not required to have, nor were we engaged to perform, an audit of its internal control over financial reporting. As part of our audits we are required to obtain an understanding of internal control over financial reporting but not for the purpose of expressing an opinion on the effectiveness of the Fund’s internal control over financial reporting. Accordingly, we express no such opinion.
Our audits included performing procedures to assess the risks of material misstatement of the financial statements and financial highlights, whether due to error or fraud, and performing procedures that respond to those risks. Such procedures included examining, on a test basis, evidence regarding the amounts and disclosures in the financial statements and financial highlights. Our audits also included evaluating the accounting principles used and significant estimates made by management, as well as evaluating the overall presentation of the financial statements and financial highlights. Our procedures included confirmation of securities owned as of November 30, 2018, by correspondence with the custodian and brokers; when replies were not received from brokers, we performed other auditing procedures. We believe that our audits provide a reasonable basis for our opinion.
DELOITTE & TOUCHE LLP
Denver, Colorado
January 24, 2019
We have served as the auditor of one or more investment companies advised by ALPS Advisors, Inc. since 2007.
ALPS Equal Sector Weight ETF
| Schedule of Investments | November 30, 2018 |
| Security Description | | Shares | | | Value | |
| EXCHANGE TRADED FUNDS (99.96%) | | | | | | | | |
| Communication Services (8.83%) | | | | | | | | |
| Communication Services Select Sector SPDR® Fund | | | 303,529 | | | $ | 13,661,840 | |
| | | | | | | | | |
| Consumer Discretionary (8.80%) | | | | | | | | |
| Consumer Discretionary Select Sector SPDR® Fund(a) | | | 126,038 | | | | 13,610,844 | |
| | | | | | | | | |
| Consumer Staples (9.74%) | | | | | | | | |
| Consumer Staples Select Sector SPDR® Fund | | | 267,836 | | | | 15,068,453 | |
| | | | | | | | | |
| Energy (8.38%) | | | | | | | | |
| Energy Select Sector SPDR® Fund | | | 196,223 | | | | 12,972,303 | |
| | | | | | | | | |
| Financials (8.93%) | | | | | | | | |
| Financial Select Sector SPDR® Fund | | | 512,746 | | | | 13,828,759 | |
| | | | | | | | | |
| Healthcare (9.68%) | | | | | | | | |
| Health Care Select Sector SPDR® Fund(a) | | | 156,320 | | | | 14,986,398 | |
| | | | | | | | | |
| Industrials (8.64%) | | | | | | | | |
| Industrial Select Sector SPDR® Fund | | | 184,204 | | | | 13,362,158 | |
| | | | | | | | | |
| Materials (8.59%) | | | | | | | | |
| Materials Select Sector SPDR® Fund | | | 243,334 | | | | 13,288,470 | |
| | | | | | | | | |
| Real Estate (9.72%) | | | | | | | | |
| Real Estate Select Sector SPDR® Fund | | | 444,535 | | | | 15,047,510 | |
| | | | | | | | | |
| Technology (8.67%) | | | | | | | | |
| Technology Select Sector SPDR® Fund | | | 197,511 | | | | 13,418,897 | |
| | | | | | | | | |
| Utilities (9.98%) | | | | | | | | |
| Utilities Select Sector SPDR® Fund(a) | | | 277,730 | | | | 15,439,011 | |
| | | | | | | | | |
| TOTAL EXCHANGE TRADED FUNDS | | | | | | | | |
| (Cost $121,086,474) | | | | | | | 154,684,643 | |
| | | 7 Day Yield | | | Shares | | | Value | |
| SHORT TERM INVESTMENTS (0.51%) | | | | | | | | | | | | |
| Money Market Fund (0.04%) | | | | | | | | | | | | |
| State Street Institutional Treasury Plus Money Market Fund | | | | | | | | | | | | |
| (Cost $68,499) | | | 2.146 | % | | | 68,499 | | | | 68,499 | |
| | | Shares | | | Value | |
| Investments Purchased with Collateral from Securities Loaned (0.47%) | | | | | | | | |
| State Street Navigator Securities Lending Government Money Market Portfolio, 2.24% | | | | | | | | |
| (Cost $716,800) | | | 716,800 | | | $ | 716,800 | |
| TOTAL SHORT TERM INVESTMENTS | | | | | | | | |
| (Cost $785,299) | | | | | | | 785,299 | |
| | | | | | | | | |
| TOTAL INVESTMENTS (100.47%) | | | | | | | | |
| (Cost $121,871,773) | | | | | | $ | 155,469,942 | |
| LIABILITIES IN EXCESS OF OTHER ASSETS (-0.47%) | | | | | | | (727,912 | ) |
| NET ASSETS - 100.00% | | | | | | $ | 154,742,030 | |
| (a) | Security, or a portion of the security position is currently on loan. The total market value of securities on loan is $15,468,259. |
Common Abbreviations:
SPDR®- Standard & Poor's Depositary Receipts
See Notes to Financial Statements.
ALPS Equal Sector Weight ETF
| Statement of Assets and Liabilities | November 30, 2018 |
| ASSETS: | | | |
| Investments, at value | | $ | 155,469,942 | |
| Dividends receivable | | | 8,594 | |
| Total Assets | | | 155,478,536 | |
| | | | | |
| LIABILITIES: | | | | |
| Payable to adviser | | | 19,706 | |
| Payable for collateral upon return of securities loaned | | | 716,800 | |
| Total Liabilities | | | 736,506 | |
| NET ASSETS | | $ | 154,742,030 | |
| | | | | |
| NET ASSETS CONSIST OF: | | | | |
| Paid-in capital | | $ | 121,459,530 | |
| Total distributable earnings | | | 33,282,500 | |
| NET ASSETS | | $ | 154,742,030 | |
| | | | | |
| INVESTMENTS, AT COST | | $ | 121,871,773 | |
| | | | | |
| PRICING OF SHARES | | | | |
| Net Assets | | $ | 154,742,030 | |
| Shares of beneficial interest outstanding (Unlimited number of shares authorized, par value $0.01 per share) | | | 2,200,000 | |
| Net Asset Value, offering and redemption price per share | | $ | 70.34 | |
See Notes to Financial Statements.
ALPS Equal Sector Weight ETF
| Statement of Operations | For the Year Ended November 30, 2018 |
| INVESTMENT INCOME: | | | |
| Dividends | | $ | 3,665,380 | |
| Securities Lending Income | | | 41,204 | |
| Total Investment Income | | | 3,706,584 | |
| | | | | |
| EXPENSES: | | | | |
| Investment adviser fees | | | 597,982 | |
| Total Expenses before waiver/reimbursement | | | 597,982 | |
| Less fees waiver/reimbursement by investment advisor | | | (354,657 | ) |
| Net Expenses | | | 243,325 | |
| NET INVESTMENT INCOME | | | 3,463,259 | |
| | | | | |
| REALIZED AND UNREALIZED GAIN/(LOSS) | | | | |
| Net realized gain on investments | | | 13,803,509 | |
| Net change in unrealized depreciation on investments | | | (11,552,035 | ) |
| NET REALIZED AND UNREALIZED GAIN ON INVESTMENTS | | | 2,251,474 | |
| NET INCREASE IN NET ASSETS RESULTING FROM OPERATIONS | | $ | 5,714,733 | |
See Notes to Financial Statements.
ALPS Equal Sector Weight ETF
| Statements of Changes in Net Assets |
| | | For the Year Ended November 30, 2018 | | | For the Year Ended November 30, 2017 | |
| OPERATIONS: | | | | | | |
| Net investment income | | $ | 3,463,259 | | | $ | 3,390,145 | |
| Net realized gain | | | 13,803,509 | | | | 6,257,769 | |
| Net change in unrealized appreciation/depreciation | | | (11,552,035 | ) | | | 18,185,874 | |
| Net increase in net assets resulting from operations | | | 5,714,733 | | | | 27,833,788 | |
| | | | | | | | | |
| DISTRIBUTIONS TO SHAREHOLDERS: | | | | | | | | |
| From distributable earnings | | | (3,383,829 | ) | | | (4,499,673 | )(a) |
| Total distributions | | | (3,383,829 | ) | | | (4,499,673 | ) |
| | | | | | | | | |
| CAPITAL SHARE TRANSACTIONS: | | | | | | | | |
| Proceeds from sale of shares | | | 17,967,851 | | | | 18,897,952 | |
| Cost of shares redeemed | | | (31,840,276 | ) | | | (16,339,186 | ) |
| Net increase/(decrease) from capital share transactions | | | (13,872,425 | ) | | | 2,558,766 | |
| Net increase/(decrease) in net assets | | | (11,541,521 | ) | | | 25,892,881 | |
| | | | | | | | | |
| NET ASSETS: | | | | | | | | |
| Beginning of year | | | 166,283,551 | | | | 140,390,670 | |
| End of year | | $ | 154,742,030 | | | $ | 166,283,551 | (b) |
| | | | | | | | | |
| OTHER INFORMATION: | | | | | | | | |
| CAPITAL SHARE TRANSACTIONS: | | | | | | | | |
| Beginning shares | | | 2,400,000 | | | | 2,350,000 | |
| Shares sold | | | 250,000 | | | | 300,000 | |
| Shares redeemed | | | (450,000 | ) | | | (250,000 | ) |
| Shares outstanding, end of period | | | 2,200,000 | | | | 2,400,000 | |
| (a) | For the year ended November 30, 2017, total distributions from distributable earnings consisted of distributions from net investment income of $4,499,673. |
| (b) | For the year ended November 30, 2017, net assets included accumulated net investment income of $21,136. |
See Notes to Financial Statements.
ALPS Equal Sector Weight ETF
| Financial Highlights | For a Share Outstanding Throughout the Years Presented |
| | | | | | | | | | | | | | | | |
| | | For the Year Ended November 30, 2018 | | | For the Year Ended November 30, 2017 | | | For the Year Ended November 30, 2016 | | | For the Year Ended November 30, 2015 | | | For the Year Ended November 30, 2014 | |
| NET ASSET VALUE, BEGINNING OF PERIOD | | $ | 69.28 | | | $ | 59.74 | | | $ | 56.16 | | | $ | 57.01 | | | $ | 50.11 | |
| | | | | | | | | | | | | | | | | | | | | |
| INCOME FROM OPERATIONS: | | | | | | | | | | | | | | | | | | | | |
| Net investment income(a) | | | 1.50 | | | | 1.37 | | | | 1.66 | | | | 1.09 | | | | 0.90 | |
| Net realized and unrealized gain/(loss) | | | 1.02 | | | | 10.03 | | | | 3.11 | | | | (0.84 | ) | | | 6.90 | |
| Total from investment operations | | | 2.52 | | | | 11.40 | | | | 4.77 | | | | 0.25 | | | | 7.80 | |
| | | | | | | | | | | | | | | | | | | | | |
| DISTRIBUTIONS: | | | | | | | | | | | | | | | | | | | | |
| From net investment income | | | (1.46 | ) | | | (1.86 | ) | | | (1.19 | ) | | | (1.10 | ) | | | (0.90 | ) |
| Total distributions | | | (1.46 | ) | | | (1.86 | ) | | | (1.19 | ) | | | (1.10 | ) | | | (0.90 | ) |
| | | | | | | | | | | | | | | | | | | | | |
| NET INCREASE/(DECREASE) IN NET ASSET VALUE | | | 1.06 | | | | 9.54 | | | | 3.58 | | | | (0.85 | ) | | | 6.90 | |
| NET ASSET VALUE, END OF PERIOD | | $ | 70.34 | | | $ | 69.28 | | | $ | 59.74 | | | $ | 56.16 | | | $ | 57.01 | |
| TOTAL RETURN(b) | | | 3.66 | % | | | 19.46 | % | | | 8.62 | % | | | 0.48 | % | | | 15.71 | % |
| | | | | | | | | | | | | | | | | | | | | |
| RATIOS/SUPPLEMENTAL DATA: | | | | | | | | | | | | | | | | | | | | |
| Net assets, end of period (in 000s) | | $ | 154,742 | | | $ | 166,284 | | | $ | 140,391 | | | $ | 140,407 | | | $ | 139,686 | |
| | | | | | | | | | | | | | | | | | | | | |
| RATIOS TO AVERAGE NET ASSETS | | | | | | | | | | | | | | | | | | | | |
| Ratio of expenses excluding waiver/reimbursement to average net assets | | | 0.37 | % | | | 0.37 | % | | | 0.37 | % | | | 0.37 | % | | | 0.37 | % |
| Ratio of expenses including waiver/reimbursement to average net assets | | | 0.15 | % | | | 0.15 | % | | | 0.15 | % | | | 0.21 | %(c) | | | 0.34 | % |
| Ratio of net investment income excluding waiver/reimbursement to average net assets | | | 1.92 | % | | | 1.92 | % | | | 2.71 | % | | | 1.78 | % | | | 1.67 | % |
| Ratio of net investment income including waiver/reimbursement to average net assets | | | 2.14 | % | | | 2.14 | % | | | 2.93 | % | | | 1.94 | %(c) | | | 1.70 | % |
| Portfolio turnover rate(d) | | | 14 | % | | | 5 | % | | | 13 | % | | | 6 | % | | | 3 | % |
| (a) | Based on average shares outstanding during the period. |
| (b) | Total return is calculated assuming an initial investment made at the net asset value at the beginning of the period and redemption at the net asset value on the last day of the period and assuming all distributions are reinvested at the reinvestment prices. |
| (c) | The effective expense ratio including waivers changed from 0.34% to 0.15% effective April 1, 2015 through March 31, 2016. |
| (d) | Portfolio turnover for periods less than one year are not annualized and does not include securities received or delivered from processing creations or redemptions in-kind. |
See Notes to Financial Statements.
ALPS Equal Sector Weight ETF
| Notes to Financial Statements | November 30, 2018 |
1. ORGANIZATION
ALPS ETF Trust (the “Trust”), a Delaware statutory trust, is an open-end management investment company registered under the Investment Company Act of 1940, as amended (the “1940 Act”). As of November 30, 2018, the Trust consists of twenty separate portfolios. Each portfolio represents a separate series of the Trust. This report pertains solely to the ALPS Equal Sector Weight ETF (the “Fund”). The investment objective of the Fund is to seek investment results that replicate as closely as possible, before fees and expenses, the performance of the NYSE® Select Sector Equal Weight Index (the “Underlying Index”). The Fund is considered non-diversified and may invest a greater portion of assets in securities of individual issuers than a diversified fund. As a result, changes in the market value of a single investment could cause greater fluctuations in share price than would occur in a diversified fund.
The Fund’s Shares (“Shares”) are listed on the NYSE Arca, Inc. The Fund issues and redeems Shares at net asset value (“NAV”) in blocks of 50,000 Shares each of which is called a “Creation Unit”. Creation Units are issued and redeemed principally in-kind for securities included in the Underlying Index. Except when aggregated in Creation Units, Shares are not redeemable securities of the Fund.
Pursuant to the Trust’s organizational documents, its Officers and Trustees are indemnified against certain liability arising out of the performance of their duties to the Trust. Additionally, in the normal course of business, the Trust enters into contracts with service providers that contain general indemnification clauses. The Trust’s maximum exposure under these arrangements is unknown, as this would involve future claims that may be made against the Trust that have not yet occurred.
2. SIGNIFICANT ACCOUNTING POLICIES
The following is a summary of significant accounting policies consistently followed by the Fund in the preparation of the financial statements. The accompanying financial statements were prepared in accordance with accounting principles generally accepted in the United States of America (“U.S. GAAP”). The preparation of financial statements in conformity with U.S. GAAP requires management to make certain estimates and assumptions that affect the reported amounts of assets and liabilities and disclosures of contingent assets and liabilities at the date of the financial statements and the reported amounts of revenue and expenses during the period. Actual results could differ from those estimates. The Fund is considered an investment company under U.S. GAAP and follows the accounting and reporting guidance applicable to investment companies in the Financial Accounting Standards BoardAccounting Standards CodificationTopic 946.
A. Portfolio Valuation
The Fund’s NAV is determined daily, as of the close of regular trading on the New York Stock Exchange (the “NYSE”), normally 4:00 p.m. Eastern Time, on each day the NYSE is open for trading. The NAV is computed by dividing the value of all assets of the Fund (including accrued interest and dividends), less all liabilities (including accrued expenses and dividends declared but unpaid), by the total number of shares outstanding.
Portfolio securities listed on any exchange other than the NASDAQ Stock Market LLC (“NASDAQ”) are valued at the last sale price on the business day as of which such value is being determined. If there has been no sale on such day, the securities are valued at the mean of the most recent bid and ask prices on such day. Securities traded on the NASDAQ are valued at the NASDAQ Official Closing Price as determined by NASDAQ. Portfolio securities traded on more than one securities exchange are valued at the last sale price on the business day as of which such value is being determined at the close of the exchange representing the principal market for such securities. Portfolio securities traded in the over-the-counter market, but excluding securities traded on the NASDAQ, are valued at the last quoted sale price in such market.
The Fund’s investments are valued at market value or, in the absence of market value with respect to any portfolio securities, at fair value according to procedures adopted by the Trust’s Board of Trustees (the “Board”). When market quotations are not readily available or when events occur that make established valuation methods unreliable, securities of the Fund may be valued in good faith by or under the direction of the Board. These securities generally include, but are not limited to, restricted securities (securities which may not be publicly sold without registration under the Securities Act of 1933) for which a pricing service is unable to provide a market price; securities whose trading has been formally suspended; a security whose market price is not available from a pre-established primary pricing source or the pricing source is not willing to provide a price; a security with respect to which an event has occurred that is most likely to materially affect the value of the security after the market has closed but before the calculation of the Fund’s NAV or make it difficult or impossible to obtain a reliable market quotation; or a security whose price, as provided by the pricing service, does not reflect the security’s “fair value” due to the security being de-listed from a national exchange or the security’s primary trading market is temporarily closed at a time when, under normal conditions, it would be open. As a general principle, the current “fair value” of a security would be the amount which the owner might reasonably expect to receive from the sale on the applicable exchange or principal market. A variety of factors may be considered in determining the fair value of such securities.
ALPS Equal Sector Weight ETF
| Notes to Financial Statements | November 30, 2018 |
B. Fair Value Measurements
The Fund discloses the classification of its fair value measurements following a three-tier hierarchy based on the inputs used to measure fair value. Inputs refer broadly to the assumptions that market participants would use in pricing the asset or liability, including assumptions about risk. Inputs may be observable or unobservable. Observable inputs reflect the assumptions market participants would use in pricing the asset or liability that are developed based on market data obtained from sources independent of the reporting entity. Unobservable inputs reflect the reporting entity’s own assumptions about the assumptions market participants would use in pricing the asset or liability that are developed based on the best information available.
Valuation techniques used to value the Fund’s investments by major category are as follows:
Exchange Traded Funds, for which market quotations are readily available, are valued at the last reported sale price or official closing price as reported by a third party pricing vendor on the primary market or exchange on which they are traded and are categorized as Level 1 in the hierarchy. In the event there were no sales during the day or closing prices are not available, securities are valued at the mean of the most recent quoted bid and ask prices on such day and are generally categorized as Level 2 in the hierarchy. Investments in open-end mutual funds are valued at their closing NAV each business day and are categorized as Level 1 in the hierarchy.
Changes in valuation techniques may result in transfers in or out of an assigned level within the disclosure hierarchy.
Various inputs are used in determining the value of the Fund’s investments as of the end of the reporting period. When inputs used fall into different levels of the fair value hierarchy, the level in the hierarchy within which the fair value measurement falls is determined based on the lowest level input that is significant to the fair value measurement in its entirety. The designated input levels are not necessarily an indication of the risk or liquidity associated with these investments.
These inputs are categorized in the following hierarchy under applicable financial accounting standards:
| Level 1 | – | Unadjusted quoted prices in active markets for identical investments, unrestricted assets or liabilities that a Fund has the ability to access at the measurement date; |
| Level 2 | – | Quoted prices which are not active, quoted prices for similar assets or liabilities in active markets or inputs other than quoted prices that are observable (either directly or indirectly) for substantially the full term of the asset or liability; and |
| Level 3 | – | Significant unobservable prices or inputs (including the Fund’s own assumptions in determining the fair value of investments) where there is little or no market activity for the asset or liability at the measurement date. |
The following is a summary of inputs used to value the Fund’s investments at November 30, 2018:
ALPS EQUAL SECTOR WEIGHT ETF
| Investments in Securities at Value* | | Level 1 - Quoted and Unadjusted Prices | | | Level 2 - Other Significant Observable Inputs | | | Level 3 - Significant Unobservable Inputs | | | Total | |
| Exchange Traded Funds | | $ | 154,684,643 | | | $ | – | | | $ | – | | | $ | 154,684,643 | |
| Short Term Investments | | | | | | | | | | | | | | | | |
| Money Market Fund | | | 68,499 | | | | – | | | | – | | | | 68,499 | |
| Investments Purchased with Collateral from Securities Loaned | | | 716,800 | | | | – | | | | – | | | | 716,800 | |
| Total | | $ | 155,469,942 | | | $ | – | | | $ | – | | | $ | 155,469,942 | |
| * | For a detailed breakdown of sectors, see the accompanying Schedule of Investments. |
The Fund did not have any securities that used significant unobservable inputs (Level 3) in determining fair value and there were no transfers into or out of Level 3.
C. Securities Transactions and Investment Income
Securities transactions are recorded as of the trade date. Realized gains and losses from securities transactions are recorded on the highest cost basis. Dividend income and capital gains distributions, if any, are recorded on the ex-dividend date. Interest income, if any, is recorded on the accrual basis.
ALPS Equal Sector Weight ETF
| Notes to Financial Statements | November 30, 2018 |
D. Dividends and Distributions to Shareholders
Dividends from net investment income of the Fund, if any, are declared and paid quarterly or as the Board may determine from time to time. Distributions of net realized capital gains earned by the Fund, if any, are distributed at least annually.
E. Federal Tax and Tax Basis Information
The timing and character of income and capital gain distributions are determined in accordance with income tax regulations, which may differ from U.S. GAAP. Reclassifications are made to the Fund’s capital accounts for permanent tax differences to reflect income and gains available for distribution (or available capital loss carryforwards) under income tax regulations.
For the year ended November 30, 2018, the following reclassifications, which had no impact on results of operations or net assets, were recorded to reflect permanent tax differences resulting primarily from in-kind transactions:
| Fund | | Paid-in Capital | | | Distributable Earnings | |
| ALPS Equal Sector Weight ETF | | $ | 13,792,457 | | | $ | (13,792,457 | ) |
The tax character of the distributions paid during the fiscal year ended November 30, 2018 and November 30, 2017 were as follows:
| | | Ordinary Income | |
| November 30, 2018 | | | |
| ALPS Equal Sector Weight ETF | | $ | 3,383,829 | |
| November 30, 2017 | | | | |
| ALPS Equal Sector Weight ETF | | $ | 4,499,673 | |
Under current law, capital losses maintain their character as short-term or long-term and are carried forward to the next year without expiration. As of November 30, 2018, the following amounts are available as carry forwards to the next tax year:
| Fund | | Short-Term | | | Long-Term | |
| ALPS Equal Sector Weight ETF | | $ | – | | | $ | 377,895 | |
As of November 30, 2018, the components of distributable earnings on a tax basis for the Fund were as follows:
| Undistributed net investment income | | $ | 100,566 | |
| Accumulated net realized loss on investments | | | (377,895 | ) |
| Net unrealized appreciation on investments | | | 33,559,829 | |
| Total | | $ | 33,282,500 | |
As of November 30, 2018, the cost of investments for federal income tax purposes and accumulated net unrealized appreciation/(depreciation) on investments were as follows:
| Gross appreciation (excess of value over tax cost) | | $ | 36,267,979 | |
| Gross depreciation (excess of tax cost over value) | | | (2,708,150 | ) |
| Net unrealized appreciation (depreciation) | | | 33,559,829 | |
| Cost of investments for income tax purposes | | $ | 121,910,113 | |
The differences between book-basis and tax-basis are due to the deferral of losses from wash sales.
F. Income Taxes
No provision for income taxes is included in the accompanying financial statements, as the Fund intends to distribute to shareholders all taxable investment income and realized gains and otherwise comply with Subchapter M of the Internal Revenue Code of 1986, as amended, applicable to regulated investment companies. The Fund evaluates tax positions taken (or expected to be taken) in the course of preparing the Fund’s tax returns to determine whether these positions meet a “more-likely-than-not” standard that, based on the technical merits, have a more than fifty percent likelihood of being sustained by a taxing authority upon examination. A tax position that meets the “more-likely-than-not” recognition threshold is measured to determine the amount of benefit to recognize in the financial statements.
ALPS Equal Sector Weight ETF
| Notes to Financial Statements | November 30, 2018 |
As of and during the year ended November 30, 2018, the Fund did not have a liability for any unrecognized tax benefits. The Fund files U.S. federal, state, and local tax returns as required. The Fund’s tax returns are subject to examination by the relevant tax authorities until expiration of the applicable statute of limitations, which is generally three years after the filing of the tax return, but may extend to four years in certain jurisdictions. Tax returns for open years have incorporated no uncertain tax positions that require a provision for income taxes.
G. Lending of Portfolio Securities
TheFund has entered into a securities lending agreement with State Street Bank & Trust Co. (“SSB”), the Fund’s lending agent. The Fund may lend its portfolio securities only to borrowers that are approved by SSB. The Fund will limit such lending to not more than 33 1/3% of the value of its total assets. The Fund’s securities held at SSB as custodian shall be available to be lent except those securities the Fund or ALPS Advisors, Inc. specifically identifies in writing as not being available for lending. The borrower pledges and maintains with the Fund collateral consisting of cash (U.S. Dollars only), securities issued or guaranteed by the U.S. government or its agencies or instrumentalities, and cash equivalents (including irrevocable bank letters of credit) issued by a person other than the borrower or an affiliate of the borrower. The initial collateral received by the Fund is required to have a value of no less than 102% of the market value of the loaned securities for U.S equity securities and a value of no less than 105% of the market value for non-U.S. equity securities. The collateral is maintained thereafter, at a market value equal to not less than 102% of the current value of the U.S. equity securities on loan and not less than 105% of the current value of the non-U.S. equity securities on loan. The market value of the loaned securities is determined at the close of each business day and any additional required collateral is delivered to the Fund on the next business day. During the term of the loan, the Fund is entitled to all distributions made on or in respect of the loaned securities. Loans of securities are terminable at any time and the borrower, after notice, is required to return borrowed securities within the customary time period for settlement of securities transactions.
Any cash collateral received is reinvested in a money market fund managed by SSB as disclosed in the Fund’s Schedule of Investments and is reflected in the Statements of Assets and Liabilities as a payable for collateral upon return of securities loaned. Non-cash collateral, in the form of securities issued or guaranteed by the U.S. government or its agencies or instrumentalities, is not disclosed in the Fund’s Statements of Assets and Liabilities as it is held by the lending agent on behalf of the Fund, and the Fund does not have the ability to re-hypothecate these securities. Income earned by the Fund from securities lending activity is disclosed in the Statement of Operations.
The following is a summary of the Fund's securities lending agreement and related cash and non-cash collateral received as of November 30, 2018.
| | | Market Value of Securities on Loan | | | Cash Collateral Received | | | Non-Cash Collateral Received | | | Total Collateral Received | |
| ALPS Equal Sector Weight ETF | | $ | 15,468,259 | | | $ | 716,800 | | | $ | 14,816,670 | | | $ | 15,533,470 | |
The risks of securities lending include the risk that the borrower may not provide additional collateral when required or may not return the securities when due. To mitigate these risks, the Fund benefits from a borrower default indemnity provided by SSB. SSB’s indemnity allows for full replacement of securities lent wherein SSB will purchase the unreturned loaned securities on the open market by applying the proceeds of the collateral, or to the extent such proceeds are insufficient or the collateral is unavailable, SSB will purchase the unreturned loan securities at SSB’s expense. However, the Fund could suffer a loss if the value of the investments purchased with cash collateral falls below the value of the cash collateral received.
The following table reflects a breakdown of transactions accounted for as secured borrowings, the gross obligation by the type of collateral pledged or securities loaned, and the remaining contractual maturity of those transactions as of November 30, 2018:
| ALPS Equal Sector Weight ETF | | Remaining contractual maturity of the agreements |
| Securities Lending Transactions | | Overnight & Continuous | | Up to 30 days | | | 30-90 days | | | Greater than 90 days | | | Total | |
| Common Stocks | | $ | 716,800 | | $ | – | | | $ | – | | | $ | – | | | $ | 716,800 | |
| Total Borrowings | | | | | | | | | | | | | | | | | 716,800 | |
| Gross amount of recognized liabilities for securities lending (collateral received) | | | | | | | | $ | 716,800 | |
ALPS Equal Sector Weight ETF
| Notes to Financial Statements | November 30, 2018 |
3. INVESTMENT ADVISORY FEE AND OTHER AFFILIATED TRANSACTIONS
ALPS Advisors, Inc. (“Adviser”) serves as the Fund’s investment adviser pursuant to an Investment Advisory Agreement with the Fund. As compensation for its services to the Fund, the Adviser receives an annual unitary fee of 0.37% based on the Fund’s average daily net assets payable monthly. The Adviser served under the previous investment advisory agreement, since the commencement of the Fund until these agreements were terminated on April 16, 2018, due to a change of control of the Adviser’s parent company. Beginning April 16, 2018, the Adviser served under an interim investment advisory agreement, until the current investment advisory agreement was approved by the Fund’s shareholders.
The Adviser has agreed to waive 0.19% of its annual unitary fee payable by the Fund on a voluntary basis.
ALPS Portfolio Solutions Distributor, Inc. (“APSD”) is both the distributor for the Fund as well as the Select Sector SPDR exchange traded funds (“Underlying Sector ETFs”) that the Fund invests in. As required by exemptive relief obtained by the Underlying Sector ETFs, the Adviser will reimburse the Fund an amount equal to the distribution fee received by APSD from the Underlying Sector ETFs attributable to the Fund’s investment in the Underlying Sector ETFs, for so long as APSD acts as the distributor to the Fund and the Underlying Sector ETFs. Such reimbursement is generally expected to equal 0.03% annually.
Out of the unitary management fee, the Adviser pays substantially all expenses of the Fund, including the cost of transfer agency, custody, fund administration, legal, audit, independent trustees and other services, except for acquired fund fees and expenses, interest expenses, distribution fees or expenses, brokerage expenses, taxes and extraordinary expenses not incurred in the ordinary course of the Fund’s business. The Adviser’s unitary management fee is designed to pay substantially all of the Fund’s expenses and to compensate the Adviser for providing services for the Fund.
ALPS Fund Services, Inc., an affiliate of the Adviser, is the administrator of the Fund.
Each Trustee who is not an officer or employee of the Adviser, any sub-adviser or any of their affiliates (“Independent Trustees”) receives (1) a quarterly retainer of $5,000, (2) a per meeting fee for regularly scheduled meetings of $3,750, (3) $1,500 for any special meeting held outside of a regularly scheduled board meeting, and (4) reimbursement for all reasonable out-of-pocket expenses relating to attendance at meetings. In addition, both the Chairman of the Board and Chairman of the Audit Committee each receives a quarterly retainer of $2,000, in connection with their respective roles.
4. PURCHASES AND SALES OF SECURITIES
For the year ended November 30, 2018 the cost of purchases and proceeds from sales of investment securities, excluding short-term investments and in-kind transactions, were as follows:
| Fund | | Purchases | | | Sales | |
| ALPS Equal Sector Weight ETF | | $ | 22,711,807 | | | $ | 22,294,860 | |
For the year ended November 30, 2018, the cost of in-kind purchases and proceeds from in-kind sales were as follows:
| Fund | | Purchases | | | Sales | |
| ALPS Equal Sector Weight ETF | | $ | 17,967,507 | | | $ | 32,175,471 | |
For the year ended November 30, 2018, the ALPS Equal Sector Weight ETF had in-kind net realized gain of $13,438,836.
Gains on in-kind transactions are generally not considered taxable gains for federal income tax purposes and losses on in kind transactions are also not deductible for tax purposes.
5. CAPITAL SHARE TRANSACTIONS
Shares are created and redeemed by the Fund only in Creation Unit size aggregations of 50,000 Shares. Only broker-dealers or large institutional investors with creation and redemption agreements called Authorized Participants (“AP”) are permitted to purchase or redeem Creation Units from the Fund. Such transactions are generally permitted on an in-kind basis, with a balancing cash component to equate the transaction to the NAV per unit of the Fund on the transaction date. Cash may be substituted equivalent to the value of certain securities generally when they are not available in sufficient quantity for delivery, not eligible for trading by the AP or as a result of other market circumstances.
ALPS Equal Sector Weight ETF
| Notes to Financial Statements | November 30, 2018 |
6. NEW ACCOUNTING PRONOUNCEMENTS
In August 2018, the Financial Accounting Standards Board (“FASB”) issued Accounting Standards Update (“ASU”) 2018-13, which changes the fair value measurement disclosure requirements of FASB ASC Topic 820, Fair Value Measurement. The update to Topic 820 includes new, eliminated, and modified disclosure requirements. ASU 2018-13 is effective for fiscal years beginning after December 15, 2019, including interim periods. Early adoption is permitted for any eliminated or modified disclosures. The Fund has elected to early adopt the eliminated and modified disclosures effective with the financial statements prepared as of November 30, 2018.
7. SHAREHOLDER MEETING
A Special Meeting of Shareholders of the Fund, a series of the Trust, was held at the offices of ALPS Fund Services, Inc., at 1290 Broadway, Suite 1100, Denver, CO 80203 on May 31, 2018. At the meeting, the following matters were voted on by the Shareholders. The results of the Special Meeting of Shareholders are noted below:
Proposal 1: To approve a new investment advisory agreement (the “New Advisory Agreement”) between the Trust, on behalf of the Fund, and the Adviser.
| | Shares Voted In Favor | Shares Voted Against/Withheld or Abstentions | Proposal Approved |
| ALPS Equal Sector Weight ETF | 1,207,794 | 69,057 | Yes |
Proposal 2: To approve a proposal that would authorize the Adviser to enter into and materially amend sub-advisory agreements in the future with wholly-owned sub-advisers and unaffiliated sub-advisers, with the approval of the Board, but without obtaining additional Shareholder approval.
| | Shares Voted In Favor | Shares Voted Against/Withheld or Abstentions | Proposal Approved |
| ALPS Equal Sector Weight ETF | 508,732 | 764,119 | No |
8. SEC REGULATIONS
On October 4, 2018, the SEC amended Regulation S-X to require certain financial statement disclosure requirements to conform them to GAAP for investment companies. Effective November 4, 2018, the Fund adopted disclosure requirement changes for Regulation S-X, these changes are reflected throughout this report. The Fund’s adoption of the amendments, effective with the financial statements prepared as of November 30, 2018, had no effect on the Fund’s net assets or results of operations.
ALPS Equal Sector Weight ETF
| Additional Information | November 30, 2018 (Unaudited) |
PROXY VOTING RECORDS, POLICIES AND PROCEDURES
Information regarding how the Fund voted proxies relating to portfolio securities during the most recent 12-month period ended June 30 and a description of the Fund’s proxy voting policies and procedures used in determining how to vote for proxies are available without charge on the SEC’s website at www.sec.gov and upon request, by calling (toll-free) 1-866-675-2639.
PORTFOLIO HOLDINGS
The Trust is required to disclose, after its first and third fiscal quarters, the complete schedule of the Fund’s portfolio holdings with the SEC on Form N-Q. Forms N-Q for the Fund are available on the SEC’s website at www.sec.gov. The Fund’s Forms N-Q may also be reviewed and copied at the SEC’s Public Reference Room in Washington, D.C. and information on the operation of the Public Reference Room may be obtained by calling 1-800-SEC-0330. The Fund’s Forms N-Q are available without charge, upon request, by calling (toll-free) 1-866-675-2639 or by writing to ALPS ETF Trust at 1290 Broadway, Suite 1100, Denver, Colorado 80203.
TAX INFORMATION
The Fund designates the following for federal income tax purposes for distributions made during the calendar year ended December 31, 2017:
| | Qualified Dividend Income | Dividend Received Deduction |
| ALPS Equal Sector Weight ETF | 86.38% | 86.89% |
In early 2018, if applicable, shareholders of record received this information for the distribution paid to them by the Fund during the calendar year 2017 via Form 1099. The Fund will notify shareholders in early 2019 of amounts paid to them by the Fund, if any, during the calendar year 2018.
LICENSING AGREEMENT
ICE Data Indices, LLC (“ICE Data” or the “Licensor”) has entered into an index licensing agreement with ALPS Advisors Inc. to allow ALPS Advisors Inc.’s use of the Underlying Index of the ALPS Equal Sector Weight ETF. The following disclosure relates to the Licensor:
NYSE Select Sector Equal Weight IndexSM is a service mark of ICE Data Indices, LLC or its affiliates (“ICE Data”) and has been licensed for use by ALPS Advisors, Inc. (the “Adviser”) in connection with ALPS Equal Sector Weight ETF (the “Fund”). Neither the Trust nor the Fund is sponsored, endorsed, sold or promoted by ICE Data. ICE Data makes no representations or warranties regarding the Adviser or the Fund or the ability of the NYSE Select Sector Equal Weight IndexSM to track general stock market performance.
ICE DATA MAKES NO EXPRESS OR IMPLIED WARRANTIES, AND HEREBY EXPRESSLY DISCLAIMS ALL WARRANTIES OF MERCHANTABILITY OR FITNESS FOR A PARTICULAR PURPOSE WITH RESPECT TO THE NYSE SELECT SECTOR EQUAL WEIGHT INDEXSM OR ANY DATA INCLUDED THEREIN. IN NO EVENT SHALL ICE DATA HAVE ANY LIABILITY FOR ANY SPECIAL, PUNITIVE, INDIRECT, OR CONSEQUENTIAL DAMAGES (INCLUDING LOST PROFITS), EVEN IF NOTIFIED OF THE POSSIBILITY OF SUCH DAMAGES.
The Adviser does not guarantee the accuracy and/or the completeness of the Underlying Index or any data included therein, and the Adviser shall have no liability for any errors, omissions or interruptions therein. The Adviser makes no warranty, express or implied, as to results to be obtained by the Fund, owners of the Shares of the Fund or any other person or entity from the use of the Underlying Index or any data included therein. The Adviser makes no express or implied warranties, and expressly disclaims all warranties of merchantability or fitness for a particular purpose or use with respect to the Underlying Index or any data included therein. Without limiting any of the foregoing, in no event shall the Adviser have any liability for any special, punitive, direct, indirect or consequential damages (including lost profits) arising out of matters relating to the use of the Underlying Index even if notified of the possibility of such damages.
| ALPS Equal Sector Weight ETF | |
| Trustees & Officers | November 30, 2018 (Unaudited) |
The general supervision of the duties performed by the Adviser for the Fund under the Investment Advisory Agreement is the responsibility of the Board of Trustees. The Trust currently has four Trustees. Three Trustees have no affiliation or business connection with the Adviser or any of its affiliated persons and do not own any stock or other securities issued by the Adviser. These are the “non-interested” or “independent” Trustees (“Independent Trustees”). The other Trustee (the “Interested Trustee”) is affiliated with the Adviser.
The Independent Trustees of the Trust, their term of office and length of time served, their principal business occupations during the past five years, the number of portfolios in the Fund Complex overseen by each Independent Trustee, and other directorships, if any, held by the Trustee are shown below.
INDEPENDENT TRUSTEES
Name, Address & Year of Birth* | Position(s) Held with Trust | Term of Office and Length of Time Served** | Principal Occupation(s) During Past 5 Years | Number of Portfolios in Fund Complex Overseen by Trustees*** | Other Directorships Held by Trustees |
Mary K. Anstine,
1940 | Trustee | Since March 2008 | Ms. Anstine was President/Chief Executive Officer of HealthONE Alliance, Denver, Colorado, and former Executive Vice President of First Interstate Bank of Denver. Ms. Anstine is also Trustee/Director of AV Hunter Trust and Colorado Uplift Board. Ms. Anstine was formerly a Director of the Trust Bank of Colorado (later purchased and now known as Northern Trust Bank), HealthONE and Denver Area Council of the Boy Scouts of America and a member of the American Bankers Association Trust Executive Committee. | 41 | Ms. Anstine is a Trustee of ALPS Variable Investment Trust (9 funds); Financial Investors Trust (33 funds); Reaves Utility Income Fund (1 fund); and Segall Bryant & Hamill Trust (14 funds). |
Jeremy W. Deems,
1976 | Trustee | Since March 2008 | Mr. Deems is the Co-Founder, Chief Compliance Officer and Chief Financial Officer of Green Alpha Advisors, LLC. Mr. Deems is Co-Portfolio Manager of the Shelton Green Alpha Fund. Prior to joining Green Alpha Advisors, Mr. Deems was CFO and Treasurer of Forward Management, LLC, ReFlow Management Co., LLC, ReFlow Fund, LLC, a private investment fund, and Sutton Place Management, LLC, an administrative services company. | 41 | Mr. Deems is a Trustee of ALPS Variable Investment Trust (9 funds); Financial Investors Trust (33 funds); and Reaves Utility Income Fund (1 fund); and Clough Funds Trust (1 fund). |
Rick A. Pederson,
1952 | Trustee and Chairman | Since March 2008. Has served as Chairman since July 2017. | Mr. Pederson is Partner, Bow River Capital Partners (private equity management), 2003 - present; Board Member, Prosci Inc. (private business services) 2013-2016; Board Member, Citywide Banks (Colorado community bank) 2014-present; Board Member, Strong-Bridge Consulting (management consulting) 2015-present; Board Member, IRI/ODMS Holdings LLC, 2017 – present; Director, National Western Stock Show (not-for-profit organization) 2010 – present; Board Member, History Colorado, 2015 – present; Trustee, Boettcher Foundation, 2018. | 21 | Mr. Pederson is Trustee of Segall Bryant & Hamill Trust (14 funds) and Principal Real Estate Income Fund (1 fund) |
| * | The business address of the Trustee is c/o ALPS Advisors, Inc., 1290 Broadway, Suite 1100, Denver, Colorado 80203. |
| ** | This is the period for which the Trustee began serving the Trust. Each Trustee serves an indefinite term, until his successor is elected. |
| *** | The Fund Complex includes all series of the Trust and any other investment companies for which ALPS Advisors, Inc. provides investment advisory services. |
| ALPS Equal Sector Weight ETF | |
| Trustees & Officers | November 30, 2018 (Unaudited) |
The Trustee who is affiliated with the Adviser or affiliates of the Adviser and executive officers of the Trust, his term of office and length of time served, his principal business occupations during the past five years, the number of portfolios in the Fund Complex overseen by the Interested Trustee and the other directorships, if any, held by the Trustee, are shown below.
INTERESTED TRUSTEE
Name, Address and Year of Birth of Interested Trustee* | Position(s) Held with Trust | Term ofOffice and Length of Time Served** | Principal Occupation(s) During Past 5 Years | Number of Portfolios in Fund Complex Overseen by Trustees*** | Other Directorships Held by Trustee |
Edmund J. Burke, 1961 | Trustee and President | Since December 2017 | Mr. Burke is President and a Director of ALPS Holdings, Inc. (“AHI”) (since 2005) and Director of Boston Financial Data Services, Inc. (“BFDS”), ALPS Advisors, Inc. (“AAI”), ALPS Distributors, Inc. (“ADI”), ALPS Fund Services, Inc. (“AFS”) and ALPS Portfolio Solutions Distributor, Inc. (“APSD”). Because of his positions with AHI, BFDS, AAI, ADI, AFS and APSD, Mr. Burke is deemed an affiliate of the Trust as defined under the 1940 Act. | 36 | Mr. Burke is a Trustee of Clough Global Dividend and Income Fund (1 fund); Clough Global Equity Fund (1 fund); Clough Global Opportunities Fund (1 fund); Clough Funds Trust (1 fund); Liberty All-Star Equity Fund (1 fund); Director of the Liberty All-Star Growth Fund, Inc. (1 fund) and Financial Investors Trust (33 funds). |
| * | The business address of the Trustee is c/o ALPS Advisors, Inc., 1290 Broadway, Suite 1100, Denver, Colorado 80203. |
| ** | This is the period for which the Trustee began serving the Trust. Each Trustee serves an indefinite term, until his successor is elected. |
| *** | The Fund Complex includes all series of the Trust and any other investment companies for which ALPS Advisors, Inc. provides investment advisory services. |
| ALPS Equal Sector Weight ETF | |
| Trustees & Officers | November 30, 2018 (Unaudited) |
OFFICERS
Name, Address and Year of Birth of Officer* | Position(s) Held with Trust | Length of Time Served** | Principal Occupation(s) During Past 5 Years |
Erin D. Nelson, 1977 | Chief Compliance Officer (“CCO”) | Since December 2015 | Ms. Nelson became Senior Vice-President and Chief Compliance Officer of ALPS Advisors, Inc. on July 1, 2015 and prior to that served as Vice President and Deputy Chief Compliance Officer of AAI since January 1, 2015. Prior to January 1, 2015, Ms. Nelson was Vice-President and Assistant General Counsel of ALPS Fund Services. Because of her position with AAI, Ms. Nelson is deemed an affiliate of the Trust as defined under the 1940 Act. Ms. Nelson is also the CCO of ALPS Variable Investment Trust, Liberty All-Star Growth Fund, Inc., Liberty All-Star Equity Fund, Principal Real Estate Income Fund, RiverNorth Opportunities Fund, Inc. and Red Rocks Capital, LLC. |
Kathryn Burns, 1976 | Treasurer | Since September 2018 | Ms. Burns serves as Vice President, Director of Fund Operations of AAI since 2018. From 2013 to 2018, she served as Vice President and Fund Controller at ALPS Fund Services. Prior to joining ALPS, she worked at Old Mutual Capital where she served as Vice President and Chief Compliance Officer (2010 – 2012) and Regulatory Reporting Manager and Assistant Treasurer to the Old Mutual Funds Trusts (2006 – 2012). She also served as a CPA for PricewaterhouseCoopers LLP. Ms. Burns is also Treasurer of ALPS Variable Investment Trust, the Boulder Growth & Income Fund, Inc., Principal Real Estate Income Fund and the RiverNorth Opportunities Fund Inc. |
Andrea E. Kuchli, 1985 | Secretary | Since December 2017 | Ms. Kuchli joined ALPS in 2015 and is currently Vice President and Senior Counsel of ALPS. Prior to joining ALPS, Ms. Kuchli was an Associate with Davis Graham & Stubbs LLP from April 2014 to February 2015, and an Associate with Dechert LLP from 2011 to April 2014. Because of her position with ALPS, Ms. Kuchli is deemed an affiliate of the Trust as defined under the 1940 Act. Ms. Kuchli is also Secretary of ALPS Variable Investment Trust and Principal Real Estate Income Fund as well as Assistant Secretary of the James Advantage Funds. |
Sharon Akselrod, 1974 | Assistant Secretary | Since December 2016 | Ms. Akselrod joined ALPS in August 2014 and is currently Senior Investment Company Act Paralegal of ALPS Fund Services, Inc. Prior to joining ALPS, Ms. Akselrod served as Corporate Governance and Regulatory Associate for Nordstrom fsb (2013-2014) and Senior Legal Assistant – Legal Manager for AXA Equitable Life Insurance Company (2008-2013). Because of her position with ALPS, Ms. Akselrod is deemed an affiliate of the Trust as defined under the 1940 Act. Ms. Akselrod is also Assistant Secretary of Financial Investors Trust, ALPS Variable Investment Trust, Principal Real Estate Income Fund and Clough Funds Trust. |
| * | The business address of each Officer is c/o ALPS Advisors, Inc., 1290 Broadway, Suite 1100, Denver, Colorado 80203. |
| ** | This is the period for which the Officer began serving the Trust. Each Officer serves an indefinite term, until his/her successor is elected. |
The Statement of Additional Information includes additional information about the Fund's Trustees and is available, without charge, upon request by calling (toll-free) 1-866-675-2639.


TABLE OF
CONTENTS
| Performance Overview | |
| ALPS Clean Energy ETF | 1 |
| ALPS Disruptive Technologies ETF | 4 |
| ALPS Medical Breakthroughs ETF | 7 |
| Disclosure of Fund Expenses | 10 |
| Report of Independent Registered Public Accounting Firm | 11 |
| Financial Statements | |
| Schedule of Investments | |
| ALPS Clean Energy ETF | 12 |
| ALPS Disruptive Technologies ETF | 13 |
| ALPS Medical Breakthroughs ETF | 15 |
| Statements of Assets and Liabilities | 17 |
| Statements of Operations | 18 |
| Statements of Changes in Net Assets | |
| ALPS Clean Energy ETF | 19 |
| ALPS Disruptive Technologies ETF | 20 |
| ALPS Medical Breakthroughs ETF | 21 |
| Financial Highlights | 22 |
| Notes to Financial Statements | 25 |
| Additional Information | 34 |
| Board Considerations Regarding Approval of Investment Advisory Agreements | 37 |
| Trustees & Officers | 38 |
Beginning on January 1, 2021, as permitted by regulations adopted by the U.S. Securities and Exchange Commission, paper copies of the Funds’ annual and semi-annual shareholder reports will no longer be sent by mail, unless you specifically request paper copies of the reports from your financial intermediary (such as a broker-dealer or bank). Instead, the reports will be made available on the Funds’ website (www.alpsfunds.com), and you will be notified by mail each time a report is posted and provided with a website link to access the report.
If you already elected to receive shareholder reports electronically, you will not be affected by this change and you need not take any action. You may elect to receive shareholder reports and other communications from a Fund electronically anytime by contacting your financial intermediary.
You may elect to receive all future reports in paper free of charge. You can contact your financial intermediary to request that you continue to receive paper copies of your shareholder reports. Your election to receive reports in paper will apply to all funds held in your account with your financial intermediary.
alpsfunds.com
ALPS Clean Energy ETF
| Performance Overview | November 30, 2018 (Unaudited) |
Investment Objective
The ALPS Clean Energy ETF (the “Fund” or “ACES”) seeks investment results that correspond (before fees and expenses) generally to the performance of its underlying index, the CIBC Atlas Clean Energy Index (NACEX) (the “Underlying Index”). The Underlying Index utilizes a rules-based methodology developed by CIBC National Trust Company, which is designed to provide exposure to a diverse set of U.S. and Canadian companies involved in the clean energy sector including renewables and clean technology.
Performance Overview
The Fund was launched on June 29, 2018 and has generated a total return of 0.32% as of November 30, 2018. Performance was in-line with the Fund’s Underlying Index, net of fees, which returned 0.55%. The Fund outperformed the S&P 1000®Index, which returned -3.54% for the same period.
The U.S. markets started 2018 with a boost from corporate tax cuts, positive macro data, and strong corporate earnings and stock buybacks. After a market correction between February and March as interest rates spiked, the market rebounded throughout most of Q2 and Q3. Higher inflationary outlooks continued to drive interest rates to highs last seen in 2011, and an escalating U.S.-China trade war sent the market into a tailspin in October, down almost 8% for the month amid heightened volatility. From the Federal Open Market Committee perspective, the U.S. economy saw 3 rate hikes in 2018, leading many investors to question whether the Federal funds rate was being raised too quickly as the housing market weakened throughout the year. At the end of November 30, 2018, crude oil had fallen from its highs amid record production by the U.S. and OPEC. Despite the pull back in the equity markets, Q3 corporate earnings were largely positive, however, the U.S.-China trade war started to affect 2019 earnings estimates even with a quasi “trade truce” announced by the U.S. and China.
U.S. midterm elections results were generally favorable for the renewable energy space. Seven governor seats shifted from the Republican Party to the Democratic Party. Democratic Party affiliated legislators generally have clean energy favorable agendas. For example, Jared Polis, Governor elect of Colorado, plans to propose a 100% renewable energy goal by 2040 to Colorado legislators in 2019—which would be the most aggressive goal among states.
The best performing stocks since inception of the Fund were Renewable Energy Group Inc. (REGI), which increased 50.98%, Ameresco, Inc. (AMRC), which saw a gain of 31.00%, and Hannon Armstrong Sustainable Infrastructure Capital, Inc. (HASI), which rose 19.49%. The largest detractors were Enphase Energy, Inc. (ENPH), which decreased 19.76%, First Solar, Inc. (FSLR), which fell 15.59%, and Boralex, Inc. (BLX), which lost 14.13%.
We believe the Fund’s Underlying Index has a differentiated approach to investing in the clean energy. First, by narrowing the list of constituents to companies whose primary operations are focused on clean energy, the Fund offers more pure-play exposure to the clean energy sector. Second, constituents are diversified across the sector and offer exposure to the full opportunity set of the transition from fossil fuels to renewable energy. Lastly, focusing on U.S. and Canadian based companies helps to further minimize the risk of investing in a global industry by reducing risks related to foreign holdings, including currency exchange rates, financial disclosures, and regulatory and policy changes.
ALPS Clean Energy ETF
| Performance Overview | November 30, 2018 (Unaudited) |
Fund Performance(as of November 30, 2018)
| | Since Inception^ |
| ALPS Clean Energy ETF - NAV | 0.32% |
| ALPS Clean Energy ETF - Market Price* | 0.92% |
| S&P 1000® Index | -3.54% |
| CIBC Atlas Clean Energy Index | 0.55% |
Total Expense Ratio (per the current prospectus) 0.65%.
Performance data quoted represents past performance. Past performance does not guarantee future results. The table does not reflect the deduction of taxes that a shareholder would pay on Fund distributions or the redemption of Fund shares. Investment return and principal value of an investment will fluctuate so that an investor’s shares, when sold or redeemed, may be worth more or less than the original cost. Current performance data may be higher or lower than actual data quoted. For the most current month-end performance data please visit www.alpsfunds.com or call 1.866.759.5679.
NAV is an exchange-traded fund’s per-share value. The per-share dollar amount of the fund is derived by dividing the total value of all the securities in its portfolio, less any liabilities, by the number of fund shares outstanding. Market Price is the price at which a share can currently be traded in the market. Information detailing the number of days the Market Price of the Fund was greater than the Fund’s NAV and the number of days it was less than the Fund’s NAV can be obtained at www.alpsfunds.com.
| ^ | The Fund commenced operations on June 28, 2018, with the first day of trading on the exchange of June 29, 2018. Total return for a period of less than one year is not annualized. |
| * | Market Price is based on the midpoint of the bid-ask spread at 4 p.m. ET and does not represent the returns an investor would receive if shares were traded at other times. |
The Fund is new with limited operating history.
CIBC Atlas Clean Energy Indexis an adjusted market cap weighted index designed to provide exposure to a diverse set of U.S. or Canadian based companies involved in the clean energy sector including renewables and clean technology. The clean energy sector is comprised of companies that provide the products and services which enable the evolution of a more sustainable energy sector. Clean energy business segments include but are not limited to: solar, wind, hydro, geothermal, electric vehicles, LED, biomass, smart grid, energy efficiency and storage.
The S&P 1000® Indexcombines the S&P MidCap 400® and the S&P SmallCap 600® to form an investable benchmark for the mid- to small-cap segment of the U.S. equity market. Total return assumes reinvestment of any dividends and distributions realized during a given time period.
One cannot invest directly in an index. Index performance does not reflect fund performance.
The Fund’s shares are not individually redeemable. Investors buy and sell shares of the Fund on a secondary market. Only market makers or “authorized participants” may trade directly with the Fund, typically in blocks of 50,000 shares.
The ALPS Clean Energy ETF is not suitable for all investors. Investments in the Fund are subject to investment risks, including possible loss of the principal amount invested.
ALPS Portfolio Solutions Distributor, Inc., a FINRA member, is the Distributor for the ALPS Clean Energy ETF.
ALPS Clean Energy ETF
| Performance Overview | November 30, 2018 (Unaudited) |
Top Ten Holdings*(as of November 30, 2018)
| Tesla, Inc. | 6.83% |
| Ormat Technologies, Inc. | 5.45% |
| Pattern Energy Group, Inc., Class A | 5.41% |
| Northland Power, Inc. | 5.16% |
| Cree, Inc. | 5.02% |
| NextEra Energy Partners LP | 5.01% |
| Covanta Holding Corp. | 4.77% |
| Brookfield Renewable Partners LP | 4.77% |
| First Solar, Inc. | 4.70% |
| Sunrun, Inc. | 4.27% |
| Total% of Top 10 Holdings | 51.39% |
| * | % of Total Investments (excluding investments purchased with collateral from securities loaned) |
Future holdings are subject to change.
Clean Energy Segment Allocation*(as of November 30, 2018)
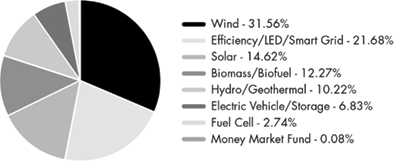
Growth of $10,000(as of November 30, 2018)
Comparison of change in value of a $10,000 investment in the Fund and the Index
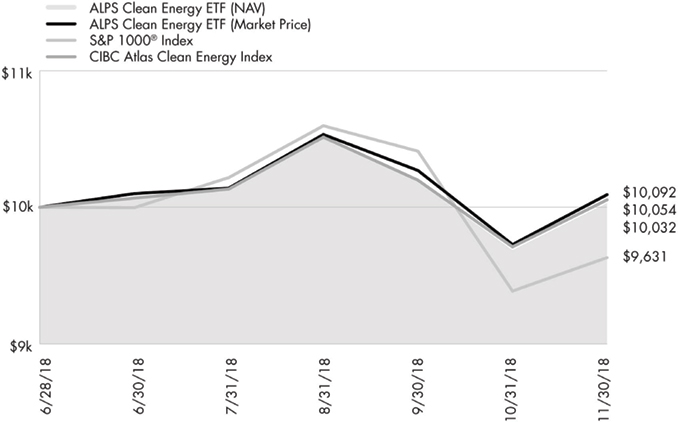
The chart above represents historical performance of a hypothetical investment of $10,000 in the Fund over the life of the Fund. Performancecalculations are as of the end of each month. Past performance does not guarantee future results. This chart does not reflect the deduction of taxes that a shareholder would pay on Fund distributions or the redemption of Fund shares.
ALPS Disruptive Technologies ETF
| Performance Overview | November 30, 2018 (Unaudited) |
Investment Objective
ALPS Disruptive Technologies ETF (the “Fund” or “DTEC”) employs a “passive management” – or indexing – investment approach designed to seek investment results that correspond (before fees and expenses) generally to the performance of the Indxx Disruptive Technologies Index (the “Underlying Index”). The Shares of the Fund are listed and trade on the Cboe BZX under the ticker symbol DTEC. The Fund will invest at least 80% of its net assets in securities that comprise the Underlying Index.
The Underlying Index utilizes a rules-based methodology developed by Indxx, LLC (the “Index Provider”), which is designed to identify the companies using disruptive technologies in each of ten thematic areas: Healthcare Innovation, Internet of Things, Clean Energy and Smart Grid, Cloud Computing, Data and Analytics, FinTech, Robotics and Artificial Intelligence, Cybersecurity, 3D Printing, and Mobile Payments (each a “Theme” and together, the “Themes”). Companies using disruptive technologies are those that are entering traditional markets with new digital forms of production and distribution, seek to disrupt an existing market and value network, displace established market-leading firms, products and alliances and increasingly gain market share. The Underlying Index is compiled by the Index Provider and may be comprised of U.S. and non-U.S. companies, including foreign and emerging markets companies. In order to be eligible for inclusion in the Underlying Index’s Index Universe, a company’s stock must be traded on one or more major global securities exchanges, have a minimum market capitalization of at least $500 million, and have a six month minimum average daily trading volume of $2 million, and the company must derive a minimum of 50% of its revenue from a single Theme. All equity securities meeting the above criteria are selected for inclusion in the Index Universe. From the Index Universe, the Underlying Index methodology selects ten stocks in each Theme according to proprietary quantitative and qualitative factors. The eligible stocks that are selected for inclusion in the Index’s portfolio are equally weighted. The Underlying Index is reconstituted annually on the third Friday of September and rebalanced quarterly.
Performance Overview
The Fund was launched on December 29, 2017 and returned 4.47% through November 30, 2018. The fund outperformed the MSCI ACWI Index’s return of -2.64%.
From a U.S. perspective, the S&P 500 ended November 30, 2018 up 5.11% for the same time period, after an October sell-off caused the U.S. broad-based benchmark to give back most of the year’s gains. This is after hitting its all-time high on September 20, 2018, ending that month up 11.78% from November 30, 2017. The year started with a boost from corporate tax cuts, positive macro data, and strong corporate earnings and stock buybacks. After a market correction between February and March as interest rates spiked, the market rebounded throughout most of Q2 and Q3. Higher inflationary outlooks continued to drive interest rates to highs last seen in 2011, and an escalating U.S.-China trade war sent the market into a tailspin in October, down almost 8% for the month amid heightened volatility. From the Federal Open Market Committee perspective, the US economy saw 3 rate hikes in 2018, leading many investors to question whether the fed funds rate was being raised too quickly as the housing market weakened throughout the year. At the end of November 30, 2018, crude oil had fallen from its highs amid record production by the U.S. and OPEC. Despite the pull back in the equity markets, Q3 corporate earnings were largely positive, however, the U.S.-China trade war started to affect 2019 earnings estimates even with a quasi “trade truce” announced by the U.S. and China.
Developed markets (ex-U.S.) generally saw a negative decline in equity prices. In the Eurozone, the European Central Bank (ECB) started 2018 by lowering its bond buying program to 30 billion euros a month from 60 billion euros a month in the previous year. The program is expected to end in December of 2018. Consequently, the end of the massive stimulus program partly contributed to downward revisions of economic growth in the region. In addition, persistent negative factors related to geopolitical tensions and threats of protectionism added to developed market volatility. Country-specific related events in the U.K., Italy, France, and Australia partly contributed to the overall negative sentiment in the developed markets, as well as an increase in the consumption tax in Japan that created fears of an economic slowdown. Equity markets among other developed markets (ex-U.S.) finished the year with flat or negative returns, following fears regarding the trajectory of US interest rates and trade tariffs.
The Fund employs an equal weighted strategy to its disruptive themes, resulting in 10 sub-themes, each with a 10% holding. The Fund picks the top 10 names from its universe that most represent the specific theme. 7 out of 10 themes were positive since the launch of the fund. Healthcare Innovation, adding 2.32% to return, was the largest contributor for the time period. Within that theme, Dexcom Inc. (DXCM), a medical device company, accounted for 1.08% of that contribution after doubling in value. The worst performing thematic category was Clean Energy & Smart Grid, which lost -1.77%. Prysmian SpA (PRY IM), a supplier of power cables for smart grids, was the worst performer in the Clean Energy & Smart Grid, losing -41.11% and detracting -.52%.
Looking forward, we believe the Fund’s strategy of selecting the top disruptive themes in the market today will provide exposure to high-growth areas of the market relative to the MSCI ACWI®.
ALPS Disruptive Technologies ETF
| Performance Overview | November 30, 2018 (Unaudited) |
Fund Performance(as of November 30, 2018)
| | Since Inception^ |
| ALPS Disruptive Technologies ETF - NAV | 4.47% |
| ALPS Disruptive Technologies ETF - Market Price* | 4.51% |
| MSCI ACWI Index | -2.64% |
| Indxx Disruptive Technologies Index | 5.57% |
Total Expense Ratio (per the current prospectus) 0.50%.
Performance data quoted represents past performance. Past performance does not guarantee future results. The table does not reflect the deduction of taxes that a shareholder would pay on Fund distributions or the redemption of Fund shares. Investment return and principal value of an investment will fluctuate so that an investor’s shares, when sold or redeemed, may be worth more or less than the original cost. Current performance data may be higher or lower than actual data quoted. For the most current month-end performance data please visit www.alpsfunds.com or call 1.866.759.5679.
NAV is an exchange-traded fund’s per-share value. The per-share dollar amount of the fund is derived by dividing the total value of all the securities in its portfolio, less any liabilities, by the number of fund shares outstanding. Market Price is the price at which a share can currently be traded in the market. Information detailing the number of days the Market Price of the Fund was greater than the Fund’s NAV and the number of days it was less than the Fund’s NAV can be obtained at www.alpsfunds.com.
| ^ | The Fund commenced operations on December 28, 2017, with the first day of trading on the exchange of December 29, 2017. Total return for a period of less than one year is not annualized. |
| * | Market Price is based on the midpoint of the bid-ask spread at 4 p.m. ET and does not represent the returns an investor would receive if shares were traded at other times. |
The Fund is new with limited operating history.
Indxx Disruptive Technologies Index (Ticker: IDTEC)is based around companies that enter traditional markets with new digital forms of production and distribution, are likely to disrupt an existing market and value network, displace established market leading firms, products and alliances and increasingly gain market share. The index is reported on a total return basis, which assumes reinvestment of any dividends and distributions realized during a given time period.
The MSCI ACWI Index, MSCI’s flagship global equity index, is designed to represent performance of the full opportunity set of large- and mid-cap stocks across 23 developed and 24 emerging markets. As of September 2018, it covers more than 2,700 constituents across 11 sectors and approximately 85% of the free float-adjusted market capitalization in each market.
One cannot invest directly in an index. Index performance does not reflect fund performance.
The Fund’s shares are not individually redeemable. Investors buy and sell shares of the Fund on a secondary market. Only market makers or “authorized participants” may trade directly with the Fund, typically in blocks of 50,000 shares.
The ALPS Disruptive Technologies ETF is not suitable for all investors. Investments in the Fund are subject to investment risks, including possible loss of the principal amount invested.
ALPS Portfolio Solutions Distributor, Inc., a FINRA member, is the Distributor for the ALPS Disruptive Technologies ETF.
ALPS Disruptive Technologies ETF
| Performance Overview | November 30, 2018 (Unaudited) |
Top Ten Holdings*(as of November 30, 2018)
| Red Hat, Inc. | 1.37% |
| Mazor Robotics, Ltd., Sponsored ADR | 1.32% |
| Vestas Wind Systems A/S | 1.30% |
| LendingTree, Inc. | 1.27% |
| Symantec Corp. | 1.25% |
| Omron Corp. | 1.24% |
| VMware, Inc., Class A | 1.22% |
| Siemens Gamesa Renewable Energy SA | 1.19% |
| American Express Co. | 1.17% |
| Keyence Corp. | 1.16% |
| Total % of Top 10 Holdings | 12.49% |
| * | % of Total Investments (excluding investments purchased with collateral from securities loaned) |
Future holdings are subject to change.
Thematic Allocation*(as of November 30, 2018)
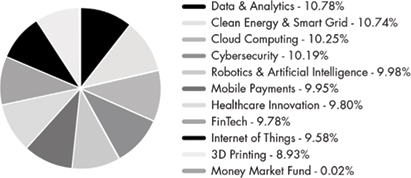
Growth of $10,000(as of November 30, 2018)
Comparison of change in value of a $10,000 investment in the Fund and the Index
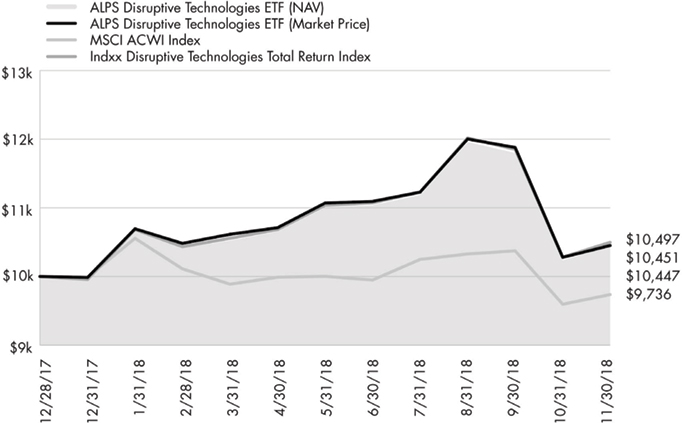
The chart above represents historical performance of a hypothetical investment of $10,000 in the Fund over the life of the Fund. Performancecalculations are as of the end of each month. Past performance does not guarantee future results. This chart does not reflect the deduction of taxes that a shareholder would pay on Fund distributions or the redemption of Fund shares.
ALPS Medical Breakthroughs ETF
| Performance Overview | November 30, 2018 (Unaudited) |
Investment Objective
ALPS Medical Breakthroughs ETF (the “Fund” or “SBIO”) employs a “passive management” – or indexing – investment approach designed to seek investment results that correspond (before fees and expenses) generally to the performance of the Poliwogg Medical Breakthroughs IndexSM (the “Underlying Index”).
The Underlying Index is comprised of small- and mid-cap stocks of biotechnology and pharmaceutical companies that have one or more drugs in either Phase II or Phase III U.S. Food and Drug Administration (“FDA”) clinical trials. In a Phase II trial, the drug is administered to a group of 100-300 people to see if it is effective and to evaluate its safety. In a Phase III trial, the drug is given to a larger group, between 500-3,000 people, to confirm its effectiveness, monitor side effects, compare it to commonly used treatments and collect information that will allow the drug or treatment to be used safely. Stocks selected for inclusion in the Underlying Index must be listed on a U.S. stock exchange. Underlying Index constituents must have a market capitalization of no less than $200 million and no more than $5 billion. Stocks included in the Underlying Index must also sustain an average daily trading volume in excess of $1 million for the 90-day period preceding an Underlying Index reconstitution. Constituents must be able to sustain the monthly rates at which they use shareholder capital (“cash burn rates”) for at least 24 months. The Underlying Index is reconstituted semi-annually on the third Fridays of June and December.
Performance Overview
The Fund, for the one year period ended November 30, 2018, generated a total return of 7.81%, in-line with the Fund’s Underlying Index, net of fees, which returned 7.93%. The Fund outperformed the broad market’s return of 6.27% as represented by the S&P 500® while almost doubling the NASDAQ Biotechnology Total Return Index’s return of 4.19% as the small and mid-cap developmental space outperformed.
2018 started off strong for biotech, a continuation of the price returns seen in 2017. Corporate tax cuts as well as a reduced repatriation tax rate on cash held overseas lifted the biotech space throughout most of 2018. With the looming “patent cliff” at major pharmaceutical companies, sentiment for small-to-mid cap biotech’s improved as those larger companies flush with cash look to engage in mergers & acquisitions (M&A) of their smaller peers to replenish their drug pipelines. Indeed, a wave of M&A occurred in the biotech space in January 2018 alone, amounting to $32 billion dollars.
At its peak at the end of September, SBIO was up 26% on the year but October brought the worst monthly return for the Fund since October 2016, losing 14% as risk off selling hit small and mid-cap names disproportionately. In addition, the Fund saw a string of poor drug data early in Q4, specifically around higher profile cancer companies. This hit valuations across the biotech space. Despite the pullback, SBIO is still up almost 42% over a two-year period and has vastly outperformed the broader markets. With such a volatile space in terms of single stock picking, owning a basket of small-mid cap biotech companies can provide investors downside protection while participating in the growing opportunity of discovering unmet medical needs.
The best performing stocks in the Fund for the period were Amarin Corp. PLC, ADR (AMRN), Arrowhead Pharmaceuticals, Inc. (ARWR), and Atara Biotherapeutics, Inc. (ATRA) up 430.97%, 252.55%, and 176.47%, respectively, while the bottom performers, Lannet Corp Co., Inc (LCI), Akorn, Inc. (AKRX) and Clearside Biomedical, Inc. (CLSD) were down 77.69%, 78.92%, and 86.26%, respectively.
Due to the high failure rate of companies within the space, the non-traditional metrics used to evaluate biotech companies, volatility, and specialized knowledge required to succeed in the space, biotechnology is a difficult industry for stock pickers. This environment makes a passive strategy attractive, as it provides a diversified, rules- based access vehicle for those looking to gain exposure to the biotechnology space, while eliminating single name risk. The Fund and its Underlying Index focus on innovation, seeking to capture research and development opportunities in the biotechnology industry. Looking forward we believe the Fund’s strategy of providing exposure to small- and mid-cap biotechnology companies that have one or more drugs in either Phase II or Phase III FDA clinical trials can provide potential alpha and pure-play exposure to the biotech space.
ALPS Medical Breakthroughs ETF
| Performance Overview | November 30, 2018 (Unaudited) |
Fund Performance(as of November 30, 2018)
| | 1 Year | 3 Year | Since Inception^ |
| ALPS Medical Breakthroughs ETF - NAV | 7.81% | 1.97% | 8.71% |
| ALPS Medical Breakthroughs ETF - Market Price* | 7.88% | 1.98% | 8.72% |
| Poliwogg Medical Breakthroughs Total Return Index | 7.93% | 2.23% | 9.05% |
| NASDAQ Biotechnology Total Return Index | 4.19% | -0.20% | 2.34% |
Total Expense Ratio (per the current prospectus) 0.50%
Performance data quoted represents past performance. Past performance does not guarantee future results. Investment return and principal value of an investment will fluctuate so that an investor’s shares, when sold or redeemed, may be worth more or less than the original cost. Current performance data may be higher or lower than actual data quoted. For most current month-end performance data please visit www.alpsfunds.com or call 1.844.234.5852.
NAV is an exchange-traded fund’s per-share value. The per-share dollar amount of the fund is derived by dividing the total value of all the securities in its portfolio, less any liabilities, by the number of fund shares outstanding. Market Price is the price at which a share can currently be traded in the market. Information detailing the number of days the Market Price of the Fund was greater than the Fund’s NAV and the number of days it was less than the Fund’s NAV can be obtained at www.alpsfunds.com.
| ^ | The Fund commenced investment operations on December 31, 2014. |
| * | Market Price is based on the midpoint of the bid-ask spread at 4 p.m. ET and does not represent the returns an investor would receive if shares were traded at other times. |
NASDAQ Biotechnology Total Return Index (Ticker: NBI)is a modified market capitalization-weighted index designed to measure the performance of the all NASDAQ stocks in the biotechnology sector. Total return assumes reinvestment of any dividends and distributions realized during a given time period.
Poliwogg Medical Breakthroughs Total Return Indexis designed to capture research and development opportunities in the pharmaceutical industry. PMBI consists of small-cap and mid-cap pharmaceutical and biotechnology stocks listed on U.S. stock exchanges that have one or more drugs in either Phase II or Phase III U.S. FDA clinical trials. Total return assumes reinvestment of any dividends and distributions realized during a given time period.
One cannot invest directly in an index. Index performance does not reflect fund performance.
Companies in the pharmaceuticals and biotechnology industry may be subject to extensive litigation based on product liability and similar claims. Legislation introduced or considered by certain governments on such industries or on the healthcare sector cannot be predicted.
Companies in the pharmaceuticals industry are subject to competitive forces that may make it difficult to raise prices and, in fact, may result in price discounting. The profitability of some companies in the pharmaceuticals industry may be dependent on a relatively limited number of products. In addition, their products can become obsolete due to industry innovation, changes in technologies or other market developments. Many new products in the pharmaceuticals industry are subject to government approvals, regulation and reimbursement rates. The process of obtaining government approvals may be long and costly. Many companies in the pharmaceuticals industry are heavily dependent on patents and intellectual property rights. The loss or impairment of these rights may adversely affect the profitability of these companies.
The development of new drugs generally has a high failure rate, and such failures may negatively impact the stock price of the company developing the failed drug. Biotechnology companies may have persistent losses during a new product’s transition from development to production. In order to fund operations, biotechnology companies may require financing from the capital markets, which may not always be available on satisfactory terms or at all.
The Fund’s shares are not individually redeemable. Investors buy and sell shares of the Fund on a secondary market. Only market makers or “authorized participants” may trade directly with the Fund, typically in blocks of 50,000 shares.
The ALPS Medical Breakthroughs ETF is not suitable for all investors. Investments in the Fund are subject to investment risks, including possible loss of the principal amount invested.
ALPS Portfolio Solutions Distributor, Inc., a FINRA member, is the Distributor for the ALPS Medical Breakthroughs ETF.
ALPS Portfolio Solutions Distributor, Inc. is not affiliated with S-Network Global Indexes, Inc.
ALPS Medical Breakthroughs ETF
| Performance Overview | November 30, 2018 (Unaudited) |
Top Ten Holdings*(as of November 30, 2018)
| Amarin Corp. PLC, ADR | 3.83% |
| Galapagos NV, Sponsored ADR | 3.75% |
| United Therapeutics Corp. | 3.73% |
| Hutchison China MediTech, Ltd., ADR | 3.32% |
| Loxo Oncology, Inc. | 3.11% |
| Taro Pharmaceutical Industries, Ltd. | 3.09% |
| Agios Pharmaceuticals, Inc. | 2.77% |
| FibroGen, Inc. | 2.65% |
| Emergent BioSolutions, Inc. | 2.64% |
| Immunomedics, Inc. | 2.63% |
| Total % of Top 10 Holdings | 31.52% |
| * | % of Total Investments (excluding investments purchased with collateral from securities loaned) |
Future holdings are subject to change.
Sector Allocation*(as of November 30, 2018)
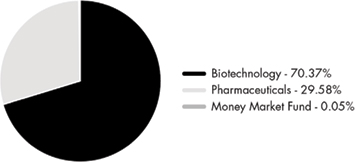
Growth of $10,000(as of November 30, 2018)
Comparison of change in value of a $10,000 investment in the Fund and the Index
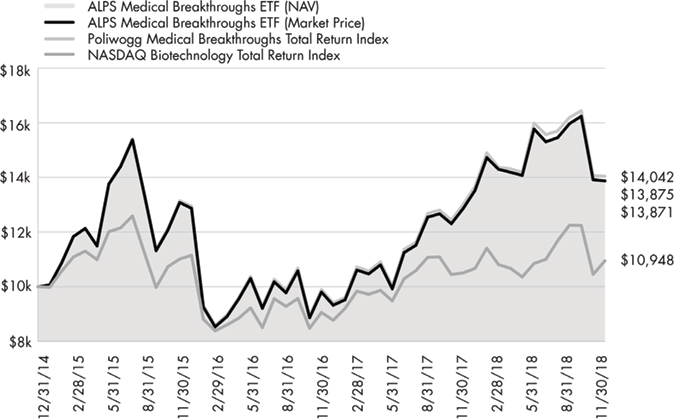
The chart above represents historical performance of a hypothetical investment of $10,000 in the Fund over the life of the Fund. Performancecalculations are as of the end of each month. Past performance does not guarantee future results. This chart does not reflect the deduction of taxes that a shareholder would pay on Fund distributions or the redemption of Fund shares.
ALPS ETF Trust
| Disclosure of Fund Expenses | November 30, 2018 (Unaudited) |
Shareholder Expense Example:As a shareholder of a Fund, you incur two types of costs: (1) transaction costs which may include creation and redemption fees or brokerage charges, and (2) ongoing costs, including management fees and other Fund expenses. These examples are intended to help you understand your ongoing costs (in dollars) of investing in a Fund and to compare these costs with the ongoing costs of investing in other funds. It is based on an investment of $1,000 invested at the beginning of the (six month) period and held through November 30, 2018.
Actual Return:The first line of the table provides information about actual account values and actual expenses. You may use the information in this line, together with the amount you invested, to estimate the expenses that you incurred over the period. Simply divide your account value by $1,000 (for example, an $8,600 account value divided by $1,000 = 8.6), then multiply the result by the number in the first line under the heading entitled “Expenses Paid During Period” to estimate the expenses attributable to your investment during this period.
Hypothetical 5% Return:The second line of the table provides information about hypothetical account values and hypothetical expenses based on the Fund’s actual expense ratio and an assumed rate of return of 5% per year before expenses, which is not the Fund’s actual return. The hypothetical account values and expenses may not be used to estimate the actual ending account balance or expenses you paid for the period. You may use this information to compare ongoing costs of investing in the Fund and other funds. To do so, compare this 5% hypothetical example with the 5% hypothetical examples that appear in the shareholder reports of the other funds.
The expenses shown in the table are meant to highlight ongoing Fund costs only and do not reflect any transaction costs, such as creation and redemption fees or brokerage charges. Therefore, the second line is useful in comparing ongoing costs only, and will not help you determine the relative total costs of owning different funds. In addition, if these costs were included, your costs would have been higher.
| | Beginning Account Value 6/1/18 | Ending Account Value 11/30/18 | Expense Ratio(a) | Expenses Paid During Period 6/1/18 - 11/30/18(b) |
| ALPS Clean Energy ETF(c) | | | | |
| Actual | $1,000.00 | $1,003.20 | 0.65% | $2.78 |
| Hypothetical (5% return before expenses) | $1,000.00 | $1,021.81 | 0.65% | $3.29 |
| ALPS Disruptive Technologies ETF | | | | |
| Actual | $1,000.00 | $949.30 | 0.50% | $2.44 |
| Hypothetical (5% return before expenses) | $1,000.00 | $1,022.56 | 0.50% | $2.54 |
| ALPS Medical Breakthroughs ETF | | | | |
| Actual | $1,000.00 | $879.30 | 0.50% | $2.36 |
| Hypothetical (5% return before expenses) | $1,000.00 | $1,022.56 | 0.50% | $2.54 |
| (a) | Annualized, based on the Fund's most recent fiscal half year expenses. |
| (b) | Expenses are equal to the Fund's annualized expense ratio multiplied by the average account value over the period, multiplied by the number of days in the most recent fiscal half year (183), divided by 365. |
| (c) | The ALPS Clean Energy ETF commenced operations on June 28, 2018. Actual expenses on this Fund are equal to the Fund's annualized expense ratio multiplied by the average account value of the period, multiplied by the number of days since the Fund launched (156), divided by 365. |
ALPS ETF Trust
Report of Independent Registered Public Accounting Firm
To the shareholders and the Board of Trustees of ALPS ETF Trust:
Opinion on the Financial Statements and Financial Highlights
We have audited the accompanying statements of assets and liabilities, including the schedules of investments, of ALPS Medical Breakthroughs ETF, ALPS Disruptive Technologies ETF and ALPS Clean Energy ETF (the “Funds”), three of the funds constituting the ALPS ETF Trust, as of November 30, 2018; the related statement of operations for the year then ended, the statements of changes in net assets for each of the two years in the period then ended, and the financial highlights for the years ended November 30, 2018, 2017, 2016 and for the period December 31, 2014 (commencement of operations) to November 30, 2015, for ALPS Medical Breakthroughs ETF; the related statements of operations, changes in net assets and financial highlights for the period from December 28, 2017 (commencement of operations) to November 30, 2018 for ALPS Disruptive Technologies ETF; the related statements of operations, changes in net assets and financial highlights for the period from June 28, 2018 (commencement of operations) to November 30, 2018, for ALPS Clean Energy ETF; and the related notes.
In our opinion, the financial statements and financial highlights present fairly, in all material respects, the financial position of ALPS Medical Breakthroughs ETF as of November 30, 2018, and the results of its operations for the year then ended, the changes in its net assets for each of the two years in the period then ended, and the financial highlights for the years ended November 30, 2018, 2017, 2016 and for the period December 31, 2014 (commencement of operations) to November 30, 2015, in conformity with accounting principles generally accepted in the United States of America. Also, in our opinion, the financial statements and financial highlights present fairly, in all material respects, the financial position of ALPS Disruptive Technologies ETF and ALPS Clean Energy ETF as of November 30, 2018; the results of operations, the changes in net assets, and financial highlights for ALPS Disruptive Technologies ETF for the period from December 28, 2017 (commencement of operations) to November 30, 2018; and the results of operations, changes in its net assets and financial highlights for the period from June 28, 2018 (commencement of operations) to November 30, 2018, for ALPS Clean Energy ETF, in conformity with accounting principles generally accepted in the United States of America.
Basis for Opinion
These financial statements and financial highlights are the responsibility of the Funds’ management. Our responsibility is to express an opinion on the Funds’ financial statements and financial highlights based on our audits. We are a public accounting firm registered with the Public Company Accounting Oversight Board (United States) (PCAOB) and are required to be independent with respect to the Funds in accordance with the U.S. federal securities laws and the applicable rules and regulations of the Securities and Exchange Commission and the PCAOB.
We conducted our audits in accordance with the standards of the PCAOB. Those standards require that we plan and perform the audit to obtain reasonable assurance about whether the financial statements and financial highlights are free of material misstatement, whether due to error or fraud. The Funds are not required to have, nor were we engaged to perform, an audit of their internal control over financial reporting. As part of our audits we are required to obtain an understanding of internal control over financial reporting but not for the purpose of expressing an opinion on the effectiveness of the Funds’ internal control over financial reporting. Accordingly, we express no such opinion.
Our audits included performing procedures to assess the risks of material misstatement of the financial statements and financial highlights, whether due to error or fraud, and performing procedures that respond to those risks. Such procedures included examining, on a test basis, evidence regarding the amounts and disclosures in the financial statements and financial highlights. Our audits also included evaluating the accounting principles used and significant estimates made by management, as well as evaluating the overall presentation of the financial statements and financial highlights. Our procedures included confirmation of securities owned as of November 30, 2018, by correspondence with the custodian and brokers; when replies were not received from brokers, we performed other auditing procedures. We believe that our audits provide a reasonable basis for our opinion.
DELOITTE & TOUCHE LLP
Denver, Colorado
January 24, 2019
We have served as the auditor of one or more investment companies advised by ALPS Advisors, Inc. since 2007.
ALPS Clean Energy ETF
| Schedule of Investments | November 30, 2018 |
| Security Description | | Shares | | | Value | |
| COMMON STOCKS (88.63%) | | | | | | | | |
| Consumer Discretionary (6.81%) | | | | | | | | |
| Tesla, Inc.(a) | | | 3,162 | | | $ | 1,108,218 | |
| | | | | | | | | |
| Energy (6.18%) | | | | | | | | |
| Green Plains, Inc. | | | 19,615 | | | | 318,744 | |
| Renewable Energy Group,Inc.(a) | | | 18,266 | | | | 492,268 | |
| REX American ResourcesCorp.(a) | | | 2,788 | | | | 194,017 | |
| Total Energy | | | | | | | 1,005,029 | |
| | | | | | | | | |
| Industrials (20.75%) | | | | | | | | |
| Acuity Brands, Inc. | | | 5,324 | | | | 692,226 | |
| Ameresco, Inc., Class A(a) | | | 8,797 | | | | 138,289 | |
| Ballard Power Systems, Inc.(a)(b) | | | 86,223 | | | | 256,945 | |
| Covanta Holding Corp. | | | 46,785 | | | | 774,760 | |
| Enphase Energy, Inc.(a)(b) | | | 43,292 | | | | 233,777 | |
| Plug Power, Inc.(a) | | | 107,023 | | | | 187,290 | |
| Sunrun, Inc.(a) | | | 47,333 | | | | 693,428 | |
| TPI Composites, Inc.(a) | | | 11,507 | | | | 312,875 | |
| Vivint Solar, Inc.(a)(b) | | | 16,132 | | | | 88,242 | |
| Total Industrials | | | | | | | 3,377,832 | |
| | | | | | | | | |
| Information Technology (19.01%) | | | | | | | | |
| Cree, Inc.(a) | | | 18,467 | | | | 815,133 | |
| First Solar, Inc.(a) | | | 17,164 | | | | 762,940 | |
| Itron, Inc.(a) | | | 12,661 | | | | 685,720 | |
| SunPower Corp.(a)(b) | | | 30,959 | | | | 212,069 | |
| Universal Display Corp. | | | 6,707 | | | | 615,971 | |
| Total Information Technology | | | | | | | 3,091,833 | |
| | | | | | | | | |
| Real Estate (3.51%) | | | | | | | | |
| Hannon Armstrong Sustainable Infrastructure Capital, Inc. | | | 25,014 | | | | 571,570 | |
| | | | | | | | | |
| Utilities (32.37%) | | | | | | | | |
| Boralex, Inc., Class A | | | 38,497 | | | | 518,644 | |
| Clearway Energy, Inc., Class C | | | 34,810 | | | | 635,631 | |
| Innergex Renewable Energy, Inc. | | | 61,395 | | | | 581,304 | |
| Northland Power, Inc. | | | 49,846 | | | | 838,114 | |
| Ormat Technologies, Inc. | | | 15,787 | | | | 885,493 | |
| Pattern Energy Group, Inc., Class A | | | 42,476 | | | | 878,827 | |
| TerraForm Power, Inc., Class A | | | 33,400 | | | | 384,100 | |
| Security Description | | Shares | | | Value | |
| Utilities (continued) | | | | | | | | |
| TransAlta Renewables, Inc. | | | 64,870 | | | $ | 545,852 | |
| Total Utilities | | | | | | | 5,267,965 | |
| | | | | | | | | |
| TOTAL COMMON STOCKS | | | | | | | | |
| (Cost $14,576,636) | | | | | | | 14,422,447 | |
| | | | | | | | | |
| MASTER LIMITED PARTNERSHIPS (11.06%) | | | | | | | | |
| Energy (1.31%) | | | | | | | | |
| Enviva Partners LP | | | 7,400 | | | | 212,602 | |
| | | | | | | | | |
| Utilities (9.75%) | | | | | | | | |
| Brookfield Renewable Partners LP | | | 27,020 | | | | 773,598 | |
| NextEra Energy Partners LP | | | 17,407 | | | | 812,907 | |
| Total Utilities | | | | | | | 1,586,505 | |
| | | | | | | | | |
| TOTAL MASTER LIMITED PARTNERSHIPS | | | | | | | | |
| (Cost $1,834,357) | | | | | | | 1,799,107 | |
| | | 7 Day Yield | | | Shares | | | Value | |
| SHORT TERM INVESTMENTS (3.88%) | | | | | | | | | | | | |
| Money Market Fund (0.08%) | | | | | | | | | | | | |
| State Street Institutional Treasury Plus Money Market Fund | | | | | | | | | | | | |
| (Cost $12,277) | | | 2.146 | % | | | 12,277 | | | | 12,277 | |
| | | | | | | | | | | | | |
| Investments Purchased with Collateral from Securities Loaned (3.80%) | | | | | | | | | | | | |
| State Street Navigator Securities Lending Government Money Market Portfolio, 2.24% | | | | | | | | | | | | |
| (Cost $617,752) | | | | | | | 617,752 | | | | 617,752 | |
| TOTAL SHORT TERM INVESTMENTS | | | | | | | | | | | | |
| (Cost $630,029) | | | | | | | | | | | 630,029 | |
| | | | | | | | | | | | | |
| TOTAL INVESTMENTS (103.57%) | | | | | | | | | | | | |
| (Cost $17,041,022) | | | | | | | | | | $ | 16,851,583 | |
| LIABILITIES IN EXCESS OF OTHER ASSETS (-3.57%) | | | | | | | | | | | (580,534 | ) |
| NET ASSETS - 100.00% | | | | | | | | | | $ | 16,271,049 | |
| (a) | Non-income producing security. |
| (b) | Security, or a portion of the security position is currently on loan. The total market value of securities on loan is $619,032. |
See Notes to Financial Statements.
ALPS Disruptive Technologies ETF
| Schedule of Investments | November 30, 2018 |
| Security Description | | Shares | | | Value | |
| COMMON STOCKS (98.73%) | | | | | | | | |
| Communication Services (1.71%) | | | | | | | | |
| Netflix, Inc.(a) | | | 1,485 | | | $ | 424,903 | |
| Spotify Technology SA(a) | | | 2,960 | | | | 403,685 | |
| Total Communication Services | | | | | | | 828,588 | |
| | | | | | | | | |
| Consumer Discretionary (1.01%) | | | | | | | | |
| iRobot Corp.(a)(b) | | | 5,125 | | | | 488,925 | |
| | | | | | | | | |
| Financials (6.69%) | | | | | | | | |
| American Express Co. | | | 5,030 | | | | 564,718 | |
| LendingClub Corp.(a) | | | 161,658 | | | | 554,487 | |
| LendingTree, Inc.(a)(b) | | | 2,368 | | | | 616,485 | |
| Moody's Corp. | | | 3,050 | | | | 485,163 | |
| S&P Global, Inc. | | | 2,579 | | | | 471,596 | |
| Thomson Reuters Corp. | | | 10,904 | | | | 550,924 | |
| Total Financials | | | | | | | 3,243,373 | |
| | | | | | | | | |
| Health Care (12.84%) | | | | | | | | |
| ABIOMED, Inc.(a) | | | 1,400 | | | | 465,752 | |
| Align Technology, Inc.(a) | | | 1,438 | | | | 330,582 | |
| Boston Scientific Corp.(a) | | | 14,544 | | | | 547,873 | |
| Cochlear, Ltd. | | | 3,764 | | | | 465,708 | |
| CYBERDYNE, Inc.(a)(b) | | | 77,000 | | | | 548,086 | |
| DENTSPLY SIRONA, Inc. | | | 14,142 | | | | 534,285 | |
| DexCom, Inc.(a) | | | 3,775 | | | | 489,202 | |
| DiaSorin SpA | | | 5,242 | | | | 445,679 | |
| Intuitive Surgical, Inc.(a) | | | 974 | | | | 517,067 | |
| Mazor Robotics, Ltd.,Sponsored ADR(a)(b) | | | 10,956 | | | | 638,625 | |
| Smith & Nephew PLC,Sponsored ADR(b) | | | 14,742 | | | | 549,287 | |
| TransEnterix, Inc.(a)(b) | | | 96,140 | | | | 298,995 | |
| William Demant Holding A/S(a) | | | 13,636 | | | | 398,172 | |
| Total Health Care | | | | | | | 6,229,313 | |
| | | | | | | | | |
| Industrials (18.21%) | | | | | | | | |
| ABB, Ltd., Sponsored ADR | | | 22,779 | | | | 461,958 | |
| ADT, Inc. | | | 63,794 | | | | 498,231 | |
| Aerovironment, Inc.(a) | | | 4,925 | | | | 377,255 | |
| ATS Automation Tooling Systems, Inc.(a) | | | 29,701 | | | | 380,470 | |
| Experian PLC | | | 21,708 | | | | 527,365 | |
| FANUC Corp. | | | 2,915 | | | | 497,924 | |
| IHS Markit, Ltd.(a) | | | 9,876 | | | | 527,082 | |
| Proto Labs, Inc.(a) | | | 3,404 | | | | 438,061 | |
| Prysmian SpA | | | 22,568 | | | | 413,131 | |
| RELX PLC, ADR(b) | | | 26,137 | | | | 548,354 | |
| Schneider Electric SE | | | 6,930 | | | | 504,305 | |
| Security Description | | Shares | | | Value | |
| Industrials (continued) | | | | | | | | |
| Sensata Technologies Holding PLC(a) | | | 10,530 | | | $ | 487,118 | |
| Siemens Gamesa Renewable Energy SA(a)(b) | | | 40,958 | | | | 577,289 | |
| SLM Solutions Group AG(a) | | | 22,300 | | | | 321,632 | |
| Verisk Analytics, Inc.(a) | | | 4,470 | | | | 551,240 | |
| Vestas Wind Systems A/S | | | 8,453 | | | | 630,855 | |
| Wolters Kluwer NV | | | 8,880 | | | | 536,029 | |
| Xinjiang Goldwind Science & Technology Co., Ltd., Class H | | | 556,600 | | | | 550,624 | |
| Total Industrials | | | | | | | 8,828,923 | |
| | | | | | | | | |
| Information Technology (54.09%) | | | | | | | | |
| 3D Systems Corp.(a)(b) | | | 29,735 | | | | 368,119 | |
| Alarm.com Holdings, Inc.(a) | | | 9,504 | | | | 483,278 | |
| ams AG | | | 7,936 | | | | 220,831 | |
| ANSYS, Inc.(a) | | | 2,905 | | | | 470,668 | |
| Autodesk, Inc.(a) | | | 3,626 | | | | 523,957 | |
| Black Knight, Inc.(a) | | | 10,214 | | | | 463,103 | |
| Check Point Software Technologies, Ltd.(a) | | | 4,560 | | | | 509,854 | |
| Cognex Corp. | | | 9,856 | | | | 433,861 | |
| Dassault Systemes SE | | | 3,634 | | | | 436,090 | |
| Ellie Mae, Inc.(a)(b) | | | 5,444 | | | | 366,218 | |
| FARO Technologies, Inc.(a) | | | 8,527 | | | | 423,962 | |
| First Data Corp., Class A(a) | | | 21,291 | | | | 406,232 | |
| First Solar, Inc.(a) | | | 11,315 | | | | 502,952 | |
| Fiserv, Inc.(a) | | | 6,755 | | | | 534,524 | |
| Fitbit, Inc., Class A(a) | | | 97,166 | | | | 535,385 | |
| FleetCor Technologies, Inc.(a) | | | 2,473 | | | | 478,278 | |
| Fortinet, Inc.(a) | | | 6,083 | | | | 449,169 | |
| Gartner, Inc.(a) | | | 3,465 | | | | 530,803 | |
| Gemalto NV(a) | | | 9,341 | | | | 534,669 | |
| Guidewire Software, Inc.(a) | | | 5,186 | | | | 482,091 | |
| InterDigital, Inc. | | | 6,685 | | | | 503,114 | |
| Intuit, Inc. | | | 2,397 | | | | 514,228 | |
| Keyence Corp. | | | 1,037 | | | | 562,738 | |
| Mastercard, Inc., Class A | | | 2,521 | | | | 506,897 | |
| Nemetschek SE | | | 3,198 | | | | 387,751 | |
| NetApp, Inc. | | | 6,402 | | | | 428,102 | |
| NETGEAR, Inc.(a) | | | 8,161 | | | | 452,119 | |
| Okta, Inc.(a) | | | 7,556 | | | | 480,939 | |
| Omron Corp. | | | 13,700 | | | | 602,238 | |
| Palo Alto Networks, Inc.(a) | | | 2,320 | | | | 401,244 | |
| PayPal Holdings, Inc.(a) | | | 5,945 | | | | 510,140 | |
| Proofpoint, Inc.(a) | | | 4,792 | | | | 464,872 | |
| PTC, Inc.(a) | | | 5,178 | | | | 447,845 | |
| Qorvo, Inc.(a) | | | 7,278 | | | | 478,965 | |
ALPS Disruptive Technologies ETF
| Schedule of Investments | November 30, 2018 |
| Security Description | | Shares | | | Value | |
| Information Technology (continued) | | | | | | | | |
| Qualys, Inc.(a) | | | 5,768 | | | $ | 454,288 | |
| Red Hat, Inc.(a) | | | 3,725 | | | | 665,135 | |
| salesforce.com, Inc.(a) | | | 3,459 | | | | 493,807 | |
| SAP SE, Sponsored ADR(b) | | | 4,516 | | | | 468,219 | |
| ServiceNow, Inc.(a) | | | 2,668 | | | | 494,300 | |
| Silicon Laboratories, Inc.(a) | | | 5,884 | | | | 519,970 | |
| SimCorp A/S | | | 6,135 | | | | 390,670 | |
| Skyworks Solutions, Inc. | | | 6,281 | | | | 457,068 | |
| Splunk, Inc.(a) | | | 4,372 | | | | 488,484 | |
| Square, Inc.(a) | | | 6,066 | | | | 423,649 | |
| SS&C Technologies Holdings, Inc. | | | 9,498 | | | | 457,329 | |
| Stratasys, Ltd.(a) | | | 23,569 | | | | 504,141 | |
| Symantec Corp. | | | 27,342 | | | | 604,531 | |
| Temenos AG | | | 3,367 | | | | 416,894 | |
| Trend Micro, Inc. | | | 9,126 | | | | 523,369 | |
| Visa, Inc., Class A | | | 3,712 | | | | 526,028 | |
| VMware, Inc., Class A(a) | | | 3,537 | | | | 591,882 | |
| Wirecard AG | | | 2,590 | | | | 391,294 | |
| Worldpay, Inc., Class A(a) | | | 5,507 | | | | 472,556 | |
| Xero, Ltd.(a) | | | 16,167 | | | | 471,241 | |
| Zscaler, Inc.(a) | | | 12,906 | | | | 506,690 | |
| Total Information Technology | | | | | | | 26,216,781 | |
| | | | | | | | | |
| Real Estate (2.04%) | | | | | | | | |
| Digital Realty Trust, Inc. | | | 4,474 | | | | 514,689 | |
| Equinix, Inc. | | | 1,230 | | | | 473,894 | |
| Total Real Estate | | | | | | | 988,583 | |
| | | | | | | | | |
| Utilities (2.14%) | | | | | | | | |
| Brookfield Renewable Partners LP | | | 17,650 | | | | 505,329 | |
| China Longyuan Power Group Corp., Ltd., Class H | | | 680,000 | | | | 534,509 | |
| Total Utilities | | | | | | | 1,039,838 | |
| | | | | | | | | |
| TOTAL COMMON STOCKS | | | | | | | | |
| (Cost $51,612,568) | | | | | | | 47,864,324 | |
| | | | | | | | | |
| LIMITED PARTNERSHIPS (1.06%) | | | | | | | | |
| Utilities (1.06%) | | | | | | | | |
| NextEra Energy Partners LP | | | 11,054 | | | | 516,222 | |
| | | | | | | | | |
| TOTAL LIMITED PARTNERSHIPS | | | | | | | | |
| (Cost $534,734) | | | | | | | 516,222 | |
| | | 7 Day Yield | | | Shares | | | Value | |
| SHORT TERM INVESTMENTS (5.67%) | | | | | | | | | | | | |
| Money Market Fund (0.02%) | | | | | | | | | | | | |
| State Street Institutional Treasury Plus Money Market Fund | | | | | | | | | | | | |
| (Cost $8,403) | | | 2.146 | % | | | 8,403 | | | $ | 8,403 | |
| | | | | | | | | | | | | |
| Investments Purchased with Collateral from Securities Loaned (5.65%) | | | | | | | | | | | | |
| State Street Navigator Securities Lending Government Money Market Portfolio, 2.24% | | | | | | | | | | | | |
| (Cost $2,737,909) | | | | | | | 2,737,909 | | | | 2,737,909 | |
| TOTAL SHORT TERM INVESTMENTS | | | | | | | | | | | | |
| (Cost $2,746,312) | | | | | | | | | | | 2,746,312 | |
| | | | | | | | | | | | | |
| TOTAL INVESTMENTS (105.46%) | | | | | | | | | | | | |
| (Cost $54,893,614) | | | | | | | | | | $ | 51,126,858 | |
| LIABILITIES IN EXCESS OF OTHER ASSETS (-5.46%) | | | | | | | | | | | (2,643,912 | ) |
| NET ASSETS - 100.00% | | | | | | | | | | $ | 48,482,946 | |
| (a) | Non-income producing security. |
| (b) | Security, or a portion of the security position is currently on loan. The total market value of securities on loan is $3,504,064. |
See Notes to Financial Statements.
ALPS Medical Breakthroughs ETF
| Schedule of Investments | November 30, 2018 |
| Security Description | | Shares | | | Value | |
| COMMON STOCKS (99.63%) | | | | | | | | |
| Biotechnology (70.15%) | | | | | | | | |
| Acceleron Pharma, Inc.(a)(b) | | | 73,775 | | | $ | 3,904,911 | |
| Achillion Pharmaceuticals, Inc.(a) | | | 222,256 | | | | 642,320 | |
| Acorda Therapeutics, Inc.(a) | | | 76,150 | | | | 1,555,744 | |
| Adamas Pharmaceuticals, Inc.(a)(b) | | | 43,602 | | | | 446,484 | |
| Aduro Biotech, Inc.(a) | | | 126,796 | | | | 314,454 | |
| Agios Pharmaceuticals, Inc.(a) | | | 93,006 | | | | 6,119,795 | |
| Aimmune Therapeutics, Inc.(a) | | | 93,782 | | | | 2,227,322 | |
| Akebia Therapeutics, Inc.(a) | | | 91,484 | | | | 739,191 | |
| Albireo Pharma, Inc.(a) | | | 19,197 | | | | 507,761 | |
| Allena Pharmaceuticals, Inc.(a) | | | 33,277 | | | | 311,805 | |
| AMAG Pharmaceuticals, Inc.(a) | | | 55,286 | | | | 997,912 | |
| Amarin Corp. PLC, ADR(a)(b) | | | 470,836 | | | | 8,475,048 | |
| AnaptysBio, Inc.(a)(b) | | | 38,552 | | | | 2,875,208 | |
| Apellis Pharmaceuticals, Inc.(a) | | | 90,094 | | | | 1,382,042 | |
| Aquinox Pharmaceuticals, Inc.(a)(b) | | | 37,638 | | | | 89,202 | |
| Ardelyx, Inc.(a) | | | 99,522 | | | | 270,700 | |
| Arena Pharmaceuticals, Inc.(a) | | | 79,141 | | | | 3,245,572 | |
| ArQule, Inc.(a) | | | 174,515 | | | | 647,451 | |
| Array BioPharma, Inc.(a)(b) | | | 339,460 | | | | 5,407,598 | |
| Ascendis Pharma A/S, ADR(a) | | | 59,315 | | | | 4,004,356 | |
| Atara Biotherapeutics, Inc.(a) | | | 72,715 | | | | 2,904,964 | |
| Athersys, Inc.(a)(b) | | | 222,252 | | | | 426,724 | |
| Calithera Biosciences, Inc.(a) | | | 57,718 | | | | 284,550 | |
| CASI Pharmaceuticals, Inc.(a)(b) | | | 138,866 | | | | 601,290 | |
| Catalyst Biosciences, Inc.(a) | | | 19,152 | | | | 204,543 | |
| Catalyst Pharmaceuticals, Inc.(a) | | | 164,536 | | | | 417,099 | |
| ChemoCentryx, Inc.(a) | | | 80,796 | | | | 812,000 | |
| Concert Pharmaceuticals, Inc.(a) | | | 37,548 | | | | 538,063 | |
| Corbus Pharmaceuticals Holdings, Inc.(a)(b) | | | 91,744 | | | | 633,034 | |
| CTI BioPharma Corp.(a)(b) | | | 92,987 | | | | 156,218 | |
| Dynavax Technologies Corp.(a)(b) | | | 100,420 | | | | 1,134,746 | |
| Emergent BioSolutions, Inc.(a) | | | 80,223 | | | | 5,843,443 | |
| Enanta Pharmaceuticals, Inc.(a) | | | 31,077 | | | | 2,459,434 | |
| Epizyme, Inc.(a) | | | 111,460 | | | | 827,033 | |
| Fate Therapeutics, Inc.(a) | | | 85,669 | | | | 1,315,876 | |
| Security Description | | Shares | | | Value | |
| Biotechnology (continued) | | | | | | | | |
| FibroGen, Inc.(a) | | | 135,251 | | | $ | 5,864,483 | |
| Five Prime Therapeutics, Inc.(a) | | | 57,063 | | | | 732,689 | |
| Flexion Therapeutics, Inc.(a)(b) | | | 60,650 | | | | 989,202 | |
| G1 Therapeutics, Inc.(a) | | | 53,575 | | | | 2,048,172 | |
| Galapagos NV, Sponsored ADR(a) | | | 82,336 | | | | 8,292,882 | |
| Global Blood Therapeutics, Inc.(a)(b) | | | 83,477 | | | | 2,632,865 | |
| GlycoMimetics, Inc.(a)(b) | | | 69,054 | | | | 793,430 | |
| Halozyme Therapeutics, Inc.(a) | | | 231,431 | | | | 3,820,926 | |
| Heron Therapeutics, Inc.(a)(b) | | | 124,668 | | | | 3,581,712 | |
| Idera Pharmaceuticals, Inc.(a)(b) | | | 43,585 | | | | 299,429 | |
| Immune Design Corp.(a) | | | 77,248 | | | | 123,597 | |
| ImmunoGen, Inc.(a) | | | 238,993 | | | | 1,316,851 | |
| Immunomedics, Inc.(a)(b) | | | 289,391 | | | | 5,813,865 | |
| Insmed, Inc.(a)(b) | | | 123,555 | | | | 2,212,870 | |
| Intercept Pharmaceuticals, Inc.(a)(b) | | | 47,417 | | | | 5,259,019 | |
| Ironwood Pharmaceuticals, Inc.(a) | | | 223,213 | | | | 3,084,804 | |
| Jounce Therapeutics, Inc.(a) | | | 52,321 | | | | 226,027 | |
| Kiniksa Pharmaceuticals, Ltd., Class A(a) | | | 25,279 | | | | 511,141 | |
| Kura Oncology, Inc.(a) | | | 60,904 | | | | 773,481 | |
| Ligand Pharmaceuticals, Inc.(a) | | | 33,843 | | | | 5,339,410 | |
| Loxo Oncology, Inc.(a) | | | 48,870 | | | | 6,862,325 | |
| MacroGenics, Inc.(a) | | | 67,738 | | | | 1,165,771 | |
| Madrigal Pharmaceuticals, Inc.(a)(b) | | | 24,647 | | | | 2,850,426 | |
| MediciNova, Inc.(a)(b) | | | 67,159 | | | | 668,904 | |
| Minerva Neurosciences, Inc.(a) | | | 62,184 | | | | 491,875 | |
| Mirati Therapeutics, Inc.(a)(b) | | | 51,897 | | | | 2,002,705 | |
| NuCana PLC, ADR(a)(b) | | | 51,128 | | | | 996,485 | |
| PDL BioPharma, Inc.(a) | | | 233,184 | | | | 715,875 | |
| Progenics Pharmaceuticals, Inc.(a) | | | 134,473 | | | | 697,915 | |
| PTC Therapeutics, Inc.(a) | | | 74,919 | | | | 2,661,123 | |
| Ra Pharmaceuticals, Inc.(a) | | | 51,867 | | | | 817,943 | |
| Radius Health, Inc.(a)(b) | | | 72,934 | | | | 1,215,810 | |
| Rhythm Pharmaceuticals, Inc.(a) | | | 54,811 | | | | 1,618,569 | |
| Rocket Pharmaceuticals, Inc.(a)(b) | | | 63,604 | | | | 1,024,660 | |
| Savara, Inc.(a) | | | 56,284 | | | | 504,867 | |
ALPS Medical Breakthroughs ETF
| Schedule of Investments | November 30, 2018 |
| Security Description | | Shares | | | Value | |
| Biotechnology (continued) | | | | | | | | |
| Spark Therapeutics, Inc.(a)(b) | | | 59,689 | | | $ | 2,514,698 | |
| Syndax Pharmaceuticals, Inc.(a) | | | 37,454 | | | | 191,015 | |
| Syros Pharmaceuticals, Inc.(a) | | | 53,972 | | | | 367,549 | |
| Tocagen, Inc.(a)(b) | | | 31,994 | | | | 412,723 | |
| United Therapeutics Corp.(a) | | | 69,864 | | | | 8,250,938 | |
| UroGen Pharma, Ltd.(a) | | | 25,427 | | | | 1,246,940 | |
| Vericel Corp.(a) | | | 68,522 | | | | 1,204,617 | |
| Voyager Therapeutics, Inc.(a) | | | 52,020 | | | | 593,028 | |
| Total Biotechnology | | | | | | | 155,517,509 | |
| | | | | | | | | |
| Pharmaceuticals (29.48%) | | | | | | | | |
| Aclaris Therapeutics, Inc.(a) | | | 49,680 | | | | 463,018 | |
| Aerie Pharmaceuticals, Inc.(a)(b) | | | 72,526 | | | | 2,893,062 | |
| Akcea Therapeutics, Inc.(a)(b) | | | 137,472 | | | | 4,658,926 | |
| Akorn, Inc.(a) | | | 201,189 | | | | 1,380,157 | |
| Assembly Biosciences, Inc.(a) | | | 40,816 | | | | 1,052,236 | |
| Assertio Therapeutics, Inc.(a) | | | 102,503 | | | | 510,977 | |
| Avadel Pharmaceuticals PLC, ADR(a)(b) | | | 64,284 | | | | 196,709 | |
| Clearside Biomedical, Inc.(a) | | | 51,359 | | | | 75,498 | |
| Cymabay Therapeutics, Inc.(a) | | | 94,704 | | | | 845,707 | |
| Dova Pharmaceuticals, Inc.(a)(b) | | | 45,228 | | | | 673,897 | |
| Durect Corp.(a) | | | 259,809 | | | | 230,918 | |
| Endo International PLC(a) | | | 359,131 | | | | 4,320,346 | |
| Endocyte, Inc.(a) | | | 112,281 | | | | 2,653,200 | |
| GW Pharmaceuticals PLC, ADR(a)(b) | | | 45,511 | | | | 5,598,763 | |
| Horizon Pharma PLC(a) | | | 267,234 | | | | 5,339,335 | |
| Hutchison China MediTech, Ltd., ADR(a) | | | 213,089 | | | | 7,345,178 | |
| Intersect ENT, Inc.(a) | | | 48,845 | | | | 1,465,838 | |
| Kala Pharmaceuticals, Inc.(a) | | | 39,439 | | | | 248,466 | |
| Lannett Co., Inc.(a)(b) | | | 62,387 | | | | 368,083 | |
| Marinus Pharmaceuticals, Inc.(a)(b) | | | 64,986 | | | | 303,485 | |
| MyoKardia, Inc.(a)(b) | | | 64,336 | | | | 3,993,335 | |
| Odonate Therapeutics, Inc.(a)(b) | | | 43,124 | | | | 679,634 | |
| Omeros Corp.(a)(b) | | | 77,878 | | | | 1,086,398 | |
| Pacira Pharmaceuticals, Inc.(a) | | | 65,685 | | | | 3,174,556 | |
| Paratek Pharmaceuticals, Inc.(a)(b) | | | 50,882 | | | | 385,177 | |
| resTORbio, Inc.(a)(b) | | | 44,979 | | | | 587,426 | |
| Revance Therapeutics, Inc.(a) | | | 59,238 | | | | 1,210,825 | |
| Strongbridge Biopharma PLC(a)(b) | | | 74,909 | | | | 391,025 | |
| Security Description | | Shares | | | Value | |
| Pharmaceuticals (continued) | | | | | | | | |
| Supernus Pharmaceuticals, Inc.(a) | | | 83,737 | | | $ | 3,970,809 | |
| Taro Pharmaceutical Industries, Ltd.(a) | | | 63,234 | | | | 6,824,213 | |
| Theravance Biopharma, Inc.(a)(b) | | | 88,372 | | | | 2,439,951 | |
| Total Pharmaceuticals | | | | | | | 65,367,148 | |
| | | | | | | | | |
| TOTAL COMMON STOCKS | | | | | | | | |
| (Cost $234,923,349) | | | | | | | 220,884,657 | |
| | | | | | | | | |
| WARRANTS(0.00%)(c) | | | | | | | | |
| (0.00%) | | | | | | | | |
| Corium International Inc | | | | | | | | |
| (Expiring 4/1/2020) | | | 59,464 | | | | 595 | |
| | | | | | | | | |
| TOTAL WARRANTS | | | | | | | | |
| (Cost $–) | | | | | | | 595 | |
| | | 7 Day Yield | | | Shares | | | Value | |
| SHORT TERM INVESTMENTS (3.60%) | | | | | | |
| Money Market Fund (0.05%) | | | | | | | | | |
| State Street Institutional Treasury Plus Money Market Fund (Cost $112,748) | | | 2.146 | % | | | 112,748 | | | | 112,748 | |
| | | | | | | | | | | | | |
| Investments Purchased with Collateral from Securities Loaned (3.55%) | | | | | | | | | | | | |
| State Street Navigator Securities Lending Government Money Market Portfolio, 2.24% | | | | | | | | | | | | |
| (Cost $7,865,089) | | | | | | | 7,865,089 | | | | 7,865,089 | |
| TOTAL SHORT TERM INVESTMENTS | | | | | | | | | | | | |
| (Cost $7,977,837) | | | | | | | | | | | 7,977,837 | |
| | | | | | | | | | | | | |
| TOTAL INVESTMENTS (103.23%) | | | | | | | | | | | | |
| (Cost $242,901,186) | | | | | | | | | | $ | 228,863,089 | |
| LIABILITIES IN EXCESS OF OTHER ASSETS (-3.23%) | | | | | | | | | | | (7,169,083 | ) |
| NET ASSETS - 100.00% | | | | | | | | | | $ | 221,694,006 | |
| (a) | Non-income producing security. |
| (b) | Security, or a portion of the security position is currently on loan. The total market value of securities on loan is $46,250,339. |
See Notes to Financial Statements.
ALPS ETF Trust
| Statements of Assets and Liabilities | November 30, 2018 |
| | | ALPS Clean Energy ETF | | | ALPS Disruptive Technologies ETF | | | ALPS Medical Breakthroughs ETF | |
| ASSETS: | | | | | | | | | |
| Investments, at value | | $ | 16,851,583 | | | $ | 51,126,858 | | | $ | 228,863,089 | |
| US Cash | | | – | | | | 8,017 | | | | – | |
| Foreign Currency, at value (Cost $3,244, $53,449 and $–) | | | 3,244 | | | | 53,449 | | | | – | |
| Dividends receivable | | | 42,328 | | | | 52,207 | | | | 48,043 | |
| Receivable for investments sold | | | – | | | | – | | | | 743,295 | |
| Total Assets | | | 16,897,155 | | | | 51,240,531 | | | | 229,654,427 | |
| | | | | | | | | | | | | |
| LIABILITIES: | | | | | | | | | | | | |
| Payable to adviser | | | 8,354 | | | | 19,676 | | | | 95,332 | |
| Payable for collateral upon return of securities loaned | | | 617,752 | | | | 2,737,909 | | | | 7,865,089 | |
| Total Liabilities | | | 626,106 | | | | 2,757,585 | | | | 7,960,421 | |
| NET ASSETS | | $ | 16,271,049 | | | $ | 48,482,946 | | | $ | 221,694,006 | |
| | | | | | | | | | | | | |
| NET ASSETS CONSIST OF: | | | | | | | | | | | | |
| Paid-in capital | | $ | 16,458,421 | | | $ | 52,526,121 | | | $ | 283,011,557 | |
| Total distributable earnings | | | (187,372 | ) | | | (4,043,175 | ) | | | (61,317,551 | ) |
| NET ASSETS | | $ | 16,271,049 | | | $ | 48,482,946 | | | $ | 221,694,006 | |
| | | | | | | | | | | | | |
| INVESTMENTS, AT COST | | $ | 17,041,022 | | | $ | 54,893,614 | | | $ | 242,901,186 | |
| | | | | | | | | | | | | |
| PRICING OF SHARES | | | | | | | | | | | | |
| Net Assets | | $ | 16,271,049 | | | $ | 48,482,946 | | | $ | 221,694,006 | |
| Shares of beneficial interest outstanding (Unlimited number of shares authorized, par value $0.01 per share) | | | 650,002 | | | | 1,850,002 | | | | 6,600,000 | |
| Net Asset Value, offering and redemption price per share | | $ | 25.03 | | | $ | 26.21 | | | $ | 33.59 | |
See Notes to Financial Statements.
ALPS ETF Trust
| Statements of Operations | For the Year Ended November 30, 2018 |
| | | ALPS Clean Energy ETF(a) | | | ALPS Disruptive Technologies ETF(b) | | | ALPS Medical Breakthroughs ETF | |
| INVESTMENT INCOME: | | | | | | | | | |
| Dividends* | | $ | 80,198 | | | $ | 217,794 | | | $ | 2,031 | |
| Securities Lending Income | | | 3,781 | | | | 38,344 | | | | 462,041 | |
| Total Investment Income | | | 83,979 | | | | 256,138 | | | | 464,072 | |
| | | | | | | | | | | | | |
| EXPENSES: | | | | | | | | | | | | |
| Investment adviser fees | | | 35,339 | | | | 124,548 | | | | 1,021,628 | |
| Total Expenses | | | 35,339 | | | | 124,548 | | | | 1,021,628 | |
| NET INVESTMENT INCOME/(LOSS) | | | 48,640 | | | | 131,590 | | | | (557,556 | ) |
| | | | | | | | | | | | | |
| REALIZED AND UNREALIZED GAIN/LOSS | | | | | | | | | | | | |
| Net realized gain/(loss) on investments | | | (30,303 | ) | | | 623,200 | | | | 15,057,328 | |
| Net realized gain/(loss) on foreign currency transactions | | | (230 | ) | | | 1,809 | | | | – | |
| Total net realized gain/(loss) | | | (30,533 | ) | | | 625,009 | | | | 15,057,328 | |
| Net change in unrealized depreciation on investments | | | (189,439 | ) | | | (3,766,756 | ) | | | (15,342,539 | ) |
| Net change in unrealized depreciation on translation of assets and liabilities denominated in foreign currencies | | | (12 | ) | | | (127 | ) | | | – | |
| Total net change in unrealized depreciation | | | (189,451 | ) | | | (3,766,883 | ) | | | (15,342,539 | ) |
| NET REALIZED AND UNREALIZED LOSS ON INVESTMENTS | | | (219,984 | ) | | | (3,141,874 | ) | | | (285,211 | ) |
| NET DECREASE IN NET ASSETS RESULTING FROM OPERATIONS | | $ | (171,344 | ) | | $ | (3,010,284 | ) | | $ | (842,767 | ) |
| *Net of foreign tax withholding. | | $ | 6,955 | | | $ | 11,229 | | | $ | – | |
| (a) | The ALPS Clean Energy ETF commenced operations on June 28, 2018. |
| (b) | The ALPS Disruptive Technologies ETF commenced operations on December 28, 2017. |
See Notes to Financial Statements.
ALPS Clean Energy ETF
Statement of Changes in Net Assets
| | | For the Period June 28, 2018 (Commencement of Operations) to November 30, 2018 | |
| OPERATIONS: | | | |
| Net investment income | | $ | 48,640 | |
| Net realized loss | | | (30,533 | ) |
| Net change in unrealized depreciation | | | (189,451 | ) |
| Net decrease in net assets resulting from operations | | | (171,344 | ) |
| | | | | |
| CAPITAL SHARE TRANSACTIONS: | | | | |
| Proceeds from sale of shares | | | 18,954,155 | |
| Cost of shares redeemed | | | (2,511,762 | ) |
| Net increase from capital share transactions | | | 16,442,393 | |
| Net increase in net assets | | | 16,271,049 | |
| | | | | |
| NET ASSETS: | | | | |
| Beginning of period | | | – | |
| End of period | | $ | 16,271,049 | |
| | | | | |
| OTHER INFORMATION: | | | | |
| CAPITAL SHARE TRANSACTIONS: | | | | |
| Beginning shares | | | – | |
| Shares sold | | | 750,002 | |
| Shares redeemed | | | (100,000 | ) |
| Shares outstanding, end of period | | | 650,002 | |
See Notes to Financial Statements.
ALPS Disruptive Technologies ETF
Statement of Changes in Net Assets
| | | For the Period December 28, 2017 (Commencement of Operations) to November 30, 2018 | |
| OPERATIONS: | | | |
| Net investment income | | $ | 131,590 | |
| Net realized gain | | | 625,009 | |
| Net change in unrealized depreciation | | | (3,766,883 | ) |
| Net decrease in net assets resulting from operations | | | (3,010,284 | ) |
| | | | | |
| CAPITAL SHARE TRANSACTIONS: | | | | |
| Proceeds from sale of shares | | | 57,258,516 | |
| Cost of shares redeemed | | | (5,765,286 | ) |
| Net increase from capital share transactions | | | 51,493,230 | |
| Net increase in net assets | | | 48,482,946 | |
| | | | | |
| NET ASSETS: | | | | |
| Beginning of period | | | – | |
| End of period | | $ | 48,482,946 | |
| | | | | |
| OTHER INFORMATION: | | | | |
| CAPITAL SHARE TRANSACTIONS: | | | | |
| Beginning shares | | | – | |
| Shares sold | | | 2,050,002 | |
| Shares redeemed | | | (200,000 | ) |
| Shares outstanding, end of period | | | 1,850,002 | |
See Notes to Financial Statements.
ALPS Medical Breakthroughs ETF
Statements of Changes in Net Assets
| | | For the Year Ended November 30, 2018 | | | For the Year Ended November 30, 2017 | |
| OPERATIONS: | | | | | | |
| Net investment income/(loss) | | $ | (557,556 | ) | | $ | 745,791 | |
| Net realized gain/(loss) | | | 15,057,328 | | | | (4,937,819 | ) |
| Net change in unrealized appreciation/(depreciation) | | | (15,342,539 | ) | | | 34,206,761 | |
| Net increase/(decrease) in net assets resulting from operations | | | (842,767 | ) | | | 30,014,733 | |
| | | | | | | | | |
| DISTRIBUTIONS TO SHAREHOLDERS: | | | | | | | | |
| From distributable earnings | | | (2,404,884 | ) | | | – | |
| Total distributions | | | (2,404,884 | ) | | | – | |
| | | | | | | | | |
| CAPITAL SHARE TRANSACTIONS: | | | | | | | | |
| Proceeds from sale of shares | | | 141,518,675 | | | | 27,695,734 | |
| Cost of shares redeemed | | | (44,979,196 | ) | | | (47,678,198 | ) |
| Net increase/(decrease) from capital share transactions | | | 96,539,479 | | | | (19,982,464 | ) |
| Net increase in net assets | | | 93,291,828 | | | | 10,032,269 | |
| | | | | | | | | |
| NET ASSETS: | | | | | | | | |
| Beginning of year | | | 128,402,178 | | | | 118,369,909 | |
| End of year | | $ | 221,694,006 | | | $ | 128,402,178 | (a) |
| | | | | | | | | |
| OTHER INFORMATION: | | | | | | | | |
| CAPITAL SHARE TRANSACTIONS: | | | | | | | | |
| Beginning shares | | | 4,050,000 | | | | 4,900,000 | |
| Shares sold | | | 3,900,000 | | | | 950,000 | |
| Shares redeemed | | | (1,350,000 | ) | | | (1,800,000 | ) |
| Shares outstanding, end of period | | | 6,600,000 | | | | 4,050,000 | |
| (a) | For the year ended November 30, 2017, Net Assets included accumulated net investment income of $721,564. |
See Notes to Financial Statements.
ALPS Clean Energy ETF
| Financial Highlights | For a Share Outstanding Throughout the Periods Presented |
| | | For the Period June 28, 2018 (Commencement of Operations) to November 30, 2018 | |
| NET ASSET VALUE, BEGINNING OF PERIOD | | $ | 24.95 | |
| | | | | |
| INCOME/(LOSS) FROM INVESTMENT OPERATIONS: | | | | |
| Net investment income(a) | | | 0.09 | |
| Net realized and unrealized loss | | | (0.01 | ) |
| Total from investment operations | | | 0.08 | |
| | | | | |
| Net increase in net asset value | | | 0.08 | |
| NET ASSET VALUE, END OF PERIOD | | $ | 25.03 | |
| TOTAL RETURN(b) | | | 0.32 | % |
| | | | | |
| RATIOS/SUPPLEMENTAL DATA: | | | | |
| Net assets, end of period (000s) | | $ | 16,271 | |
| | | | | |
| Ratio of expenses to average net assets | | | 0.65 | %(c) |
| Ratio of net investment income to average net assets | | | 0.89 | %(c) |
| Portfolio turnover rate(d) | | | 9 | % |
| (a) | Based on average shares outstanding during the period. |
| (b) | Total return is calculated assuming an initial investment made at the net asset value at the beginning of the period and redemption at the net asset value on the last day of the period and assuming all distributions are reinvested at reinvestment prices. Total return calculated for a period of less than one year is not annualized. |
| (d) | Portfolio turnover for periods less than one year are not annualized and does not include securities received or delivered from processing creations or redemptions in-kind. |
See Notes to Financial Statements.
ALPS Disruptive Technologies ETF
| Financial Highlights | For a Share Outstanding Throughout the Periods Presented |
| | | For the Period December 28, 2017 (Commencement of Operations) to November 30, 2018 | |
| NET ASSET VALUE, BEGINNING OF PERIOD | | $ | 25.08 | |
| | | | | |
| INCOME/(LOSS) FROM INVESTMENT OPERATIONS: | | | | |
| Net investment income(a) | | | 0.13 | |
| Net realized and unrealized gain | | | 1.00 | (b) |
| Total from investment operations | | | 1.13 | |
| | | | | |
| Net increase in net asset value | | | 1.13 | |
| NET ASSET VALUE, END OF PERIOD | | $ | 26.21 | |
| TOTAL RETURN(c) | | | 4.47 | % |
| | | | | |
| RATIOS/SUPPLEMENTAL DATA: | | | | |
| Net assets, end of period (000s) | | $ | 48,483 | |
| | | | | |
| Ratio of expenses to average net assets | | | 0.50 | %(d) |
| Ratio of net investment income to average net assets | | | 0.53 | %(d) |
| Portfolio turnover rate(e) | | | 33 | % |
| (a) | Based on average shares outstanding during the period. |
| (b) | Net realized and unrealized gain on investments per share does not correlate to the aggregate of the net realized and unrealized loss in the Statements of Operations for the year ended November 30, 2018, primarily due to the timing of the sales and repurchases of the Fund's shares in relation to the fluctuating market values for the Fund's portfolio. |
| (c) | Total return is calculated assuming an initial investment made at the net asset value at the beginning of the period and redemption at the net asset value on the last day of the period and assuming all distributions are reinvested at reinvestment prices. Total return calculated for a period of less than one year is not annualized. |
| (e) | Portfolio turnover for periods less than one year are not annualized and does not include securities received or delivered from processing creations or redemptions in-kind. |
See Notes to Financial Statements.
ALPS Medical Breakthroughs ETF
| Financial Highlights | For a Share Outstanding Throughout the Periods Presented |
| | | For the Year Ended November 30, 2018 | | | For the Year Ended November 30, 2017 | | | For the Year Ended November 30, 2016 | | | For the Period December 31, 2014 (Commencement of Operations) to November 30, 2015 | |
| NET ASSET VALUE, BEGINNING OF PERIOD | | $ | 31.70 | | | $ | 24.16 | | | $ | 32.23 | | | $ | 24.64 | |
| | | | | | | | | | | | | | | | | |
| INCOME/(LOSS) FROM INVESTMENT OPERATIONS: | | | | | | | | | | | | | | | | |
| Net investment income/(loss)(a) | | | (0.10 | ) | | | 0.18 | | | | (0.09 | ) | | | (0.13 | ) |
| Net realized and unrealized gain/(loss) | | | 2.57 | (b) | | | 7.36 | | | | (7.98 | ) | | | 7.72 | |
| Total from investment operations | | | 2.47 | | | | 7.54 | | | | (8.07 | ) | | | 7.59 | |
| | | | | | | | | | | | | | | | | |
| DISTRIBUTIONS: | | | | | | | | | | | | | | | | |
| From net investment income | | | (0.58 | ) | | | – | | | | – | | | | – | |
| Total distributions | | | (0.58 | ) | | | – | | | | – | | | | – | |
| | | | | | | | | | | | | | | | | |
| Net increase/(decrease) in net asset value | | | 1.89 | | | | 7.54 | | | | (8.07 | ) | | | 7.59 | |
| NET ASSET VALUE, END OF PERIOD | | $ | 33.59 | | | $ | 31.70 | | | $ | 24.16 | | | $ | 32.23 | |
| TOTAL RETURN(c) | | | 7.81 | % | | | 31.21 | % | | | (25.04 | )% | | | 30.80 | % |
| | | | | | | | | | | | | | | | | |
| RATIOS/SUPPLEMENTAL DATA: | | | | | | | | | | | | | | | | |
| Net assets, end of period (000s) | | $ | 221,694 | | | $ | 128,402 | | | $ | 118,370 | | | $ | 170,824 | |
| | | | | | | | | | | | | | | | | |
| Ratio of expenses to average net assets | | | 0.50 | % | | | 0.50 | % | | | 0.50 | % | | | 0.50 | %(d) |
| Ratio of net investment income/(loss) to average net assets | | | (0.27 | )% | | | 0.66 | % | | | (0.38 | )% | | | (0.42 | )%(d) |
| Portfolio turnover rate(e) | | | 48 | % | | | 43 | % | | | 62 | % | | | 25 | % |
| (a) | Based on average shares outstanding during the period. |
| (b) | Net realized and unrealized gain on investments per share does not correlate to the aggregate of the net realized and unrealized loss in the Statements of Operations for the year ended November 30, 2018, primarily due to the timing of the sales and repurchases of the Fund's shares in relation to the fluctuating market values for the Fund's portfolio. |
| (c) | Total return is calculated assuming an initial investment made at the net asset value at the beginning of the period and redemption at the net asset value on the last day of the period and assuming all distributions are reinvested at reinvestment prices. Total return calculated for a period of less than one year is not annualized. |
| (e) | Portfolio turnover for periods less than one year are not annualized and does not include securities received or delivered from processing creations or redemptions in-kind. |
See Notes to Financial Statements.
ALPS ETF Trust
| Notes to Financial Statements | November 30, 2018 |
1. ORGANIZATION
ALPS ETF Trust (the “Trust”), a Delaware statutory trust, is an open-end management investment company registered under the Investment Company Act of 1940, as amended (the “1940 Act”). As of November 30, 2018, the Trust consisted of twenty separate portfolios. Each portfolio represents a separate series of the Trust. This report pertains to the ALPS Clean Energy ETF, ALPS Disruptive Technologies ETF, and the ALPS Medical Breakthroughs ETF (each a “Fund” and collectively, the “Funds”). ALPS Clean Energy ETF and ALPS Disruptive Technologies ETF are considered non-diversified and may invest a greater portion of assets in securities of individual issuers than a diversified fund. As a result, changes in the market value of a single investment could cause greater fluctuations in share price than would occur in a diversified fund. ALPS Medical Breakthroughs ETF has elected to qualify as a diversified series of the Trust under the 1940 Act.
The ALPS Disruptive Technologies ETF commenced operations on December 28, 2017. The ALPS Clean Energy ETF commenced operations on June 28, 2018.
The investment objective of the ALPS Clean Energy ETF is to seek investment results that correspond generally, before fees and expenses, to the performance of the CIBC Atlas Clean Energy Index. The investment objective of the ALPS Disruptive Technologies ETF is to seek investment results that correspond generally, before fees and expenses, to the performance of the Indxx Disruptive Technologies Index. The investment objective of the ALPS Medical Breakthroughs ETF is to seek investment results that correspond generally, before fees and expenses, to the performance of the Poliwogg Medical Breakthroughs IndexSM.
The shares of the ALPS Clean Energy ETF and ALPS Disruptive Technologies ETF (“Shares”) are listed on the Cboe BZX Exchange, Inc. (the “Cboe BZX”). The shares of the ALPS Medical Breakthroughs ETF (“Shares”) are listed on the NYSE Arca, Inc. (the “NYSE Arca”). Each Fund issues and redeems Shares at net asset value (“NAV”) in blocks of 50,000 Shares, each of which is called a “Creation Unit”. Creation Units are issued and redeemed principally in-kind for securities included in the Underlying Index. Except when aggregated in Creation Units, Shares are not redeemable securities of the Fund.
Pursuant to the Trust’s organizational documents, its Officers and Trustees are indemnified against certain liability arising out of the performance of their duties to the Trust. Additionally, in the normal course of business, the Trust enters into contracts with service providers that contain general indemnification clauses. The Trust’s maximum exposure under these arrangements is unknown, as this would involve future claims that may be made against the Trust that have not yet occurred.
2. SIGNIFICANT ACCOUNTING POLICIES
The following is a summary of significant accounting policies consistently followed by the Funds in the preparation of the financial statements. The accompanying financial statements were prepared in accordance with accounting principles generally accepted in the United States of America (“U.S. GAAP”). The preparation of financial statements in conformity with U.S. GAAP requires management to make certain estimates and assumptions that affect the reported amounts of assets and liabilities and disclosures of contingent assets and liabilities at the date of the financial statements and the reported amounts of revenue and expenses during the period. Actual results could differ from those estimates. Each Fund is considered an investment company under U.S. GAAP and follows the accounting and reporting guidance applicable to investment companies in the Financial Accounting Standards Board Accounting Standards Codification Topic 946.
A. Portfolio Valuation
Each Fund’s NAV is determined daily, as of the close of regular trading on the New York Stock Exchange (the “NYSE”), normally 4:00 p.m. Eastern time, on each day the NYSE is open for trading. The NAV is computed by dividing the value of all assets of the Fund (including accrued interest and dividends), less all liabilities (including accrued expenses and dividends declared but unpaid), by the total number of shares outstanding.
Portfolio securities listed on any exchange other than the NASDAQ Stock Market LLC (“NASDAQ”) are valued at the last sale price on the business day as of which such value is being determined. If there has been no sale on such day, the securities are valued at the mean of the most recent bid and ask prices on such day. Securities traded on the NASDAQ are valued at the NASDAQ Official Closing Price as determined by NASDAQ. Portfolio securities traded on more than one securities exchange are valued at the last sale price on the business day as of which such value is being determined at the close of the exchange representing the principal market for such securities. Portfolio securities traded in the over-the-counter market, but excluding securities traded on the NASDAQ, are valued at the last quoted sale price in such market.
The Funds’ investments are valued at market value or, in the absence of market value with respect to any portfolio securities, at fair value according to procedures adopted by the Trust’s Board of Trustees (the “Board”). When market quotations are not readily available or when events occur that make established valuation methods unreliable, securities of the Funds may be valued in good faith by or under the direction of the Board. These securities generally include, but are not limited to, restricted securities (securities which may not be publicly sold without registration under the Securities Act of 1933) for which a pricing service is unable to provide a market price; securities whose trading has been formally suspended; a security whose market price is not available from a pre-established primary pricing source or the pricing source is not willing to provide a price; a security with respect to which an event has occurred that is most likely to materially affect the value of the security after the market has closed but before the calculation of the Fund’s NAV or make it difficult or impossible to obtain a reliable market quotation; or a security whose price, as provided by the pricing service, does not reflect the security’s “fair value” due to the security being de-listed from a national exchange or the security’s primary trading market is temporarily closed at a time when, under normal conditions, it would be open. As a general principle, the current “fair value” of a security would be the amount which the owner might reasonably expect to receive from the sale on the applicable exchange or principal market. A variety of factors may be considered in determining the fair value of such securities.
ALPS ETF Trust
| Notes to Financial Statements | November 30, 2018 |
B. Fair Value Measurements
Each Fund discloses the classification of its fair value measurements following a three-tier hierarchy based on the inputs used to measure fair value. Inputs refer broadly to the assumptions that market participants would use in pricing the asset or liability; including assumptions about risk. Inputs may be observable or unobservable. Observable inputs reflect the assumptions market participants would use in pricing the asset or liability that are developed based on market data obtained from sources independent of the reporting entity. Unobservable inputs reflect the reporting entity’s own assumptions about the assumptions market participants would use in pricing the asset or liability that are developed based on the best information available.
Valuation techniques used to value the Funds’ investments by major category are as follows:
Equity securities, including restricted securities, for which market quotations are readily available, are valued at the last reported sale price or official closing price as reported by a third party pricing vendor on the primary market or exchange on which they are traded and are categorized as Level 1 in the hierarchy. In the event there were no sales during the day or closing prices are not available, securities are valued at the mean of the most recent quoted bid and ask prices on such day and are generally categorized as Level 2 in the hierarchy. Investments in open-end mutual funds are valued at their closing NAV each business day and are categorized as Level 1 in the hierarchy.
Changes in valuation techniques may result in transfers in or out of an assigned level within the disclosure hierarchy.
Various inputs are used in determining the value of each Fund’s investments as of the end of the reporting period. When inputs used fall into different levels of the fair value hierarchy, the level in the hierarchy within which the fair value measurement falls is determined based on the lowest level input that is significant to the fair value measurement in its entirety. The designated input levels are not necessarily an indication of the risk or liquidity associated with these investments.
These inputs are categorized in the following hierarchy under applicable financial accounting standards:
| Level 1 – | Unadjusted quoted prices in active markets for identical investments, unrestricted assets or liabilities that a Fund has the ability to access at the measurement date; |
| Level 2 – | Quoted prices which are not active, quoted prices for similar assets or liabilities in active markets or inputs other than quoted prices that are observable (either directly or indirectly) for substantially the full term of the asset or liability; and |
| Level 3 – | Significant unobservable prices or inputs (including the Fund’s own assumptions in determining the fair value of investments) where there is little or no market activity for the asset or liability at the measurement date. |
The following is a summary of the inputs used to value the Funds’ investments at November 30, 2018:
ALPS Clean Energy ETF
| Investments in Securities at Value | | Level 1 - Quoted and Unadjusted Prices | | | Level 2 - Other Significant Observable Inputs | | | Level 3 - Significant Unobservable Inputs | | | Total | |
| Common Stocks* | | $ | 14,422,447 | | | $ | – | | | $ | – | | | $ | 14,422,447 | |
| Master Limited Partnerships* | | | 1,799,107 | | | | – | | | | – | | | | 1,799,107 | |
| Short Term Investments | | | | | | | | | | | | | | | | |
| Money Market Fund | | | 12,277 | | | | – | | | | – | | | | 12,277 | |
| Investments Purchased with Collateral from Securities Loaned | | | 617,752 | | | | – | | | | – | | | | 617,752 | |
| Total | | $ | 16,851,583 | | | $ | – | | | $ | – | | | $ | 16,851,583 | |
ALPS ETF Trust
| Notes to Financial Statements | November 30, 2018 |
ALPS Disruptive Technologies ETF
| Investments in Securities at Value | | Level 1 - Quoted and Unadjusted Prices | | | Level 2 - Other Significant Observable Inputs | | | Level 3 - Significant Unobservable Inputs | | | Total | |
| Common Stocks* | | $ | 47,864,324 | | | $ | – | | | $ | – | | | $ | 47,864,324 | |
| Limited Partnerships* | | | 516,222 | | | | – | | | | – | | | | 516,222 | |
| Short Term Investments | | | | | | | | | | | | | | | | |
| Money Market Fund | | | 8,403 | | | | – | | | | – | | | | 8,403 | |
| Investments Purchased with Collateral from Securities Loaned | | | 2,737,909 | | | | – | | | | – | | | | 2,737,909 | |
| Total | | $ | 51,126,858 | | | $ | – | | | $ | – | | | $ | 51,126,858 | |
ALPS Medical Breakthroughs ETF
| Investments in Securities at Value | | Level 1 - Quoted and Unadjusted Prices | | | Level 2 - Other Significant Observable Inputs | | | Level 3 - Significant Unobservable Inputs | | | Total | |
| Common Stocks* | | $ | 220,884,657 | | | $ | – | | | $ | – | | | $ | 220,884,657 | |
| Warrants* | | | – | | | | 595 | | | | – | | | | 595 | |
| Short Term Investments | | | | | | | | | | | | | | | | |
| Money Market Fund | | | 112,748 | | | | – | | | | – | | | | 112,748 | |
| Investments Purchased with Collateral from Securities Loaned | | | 7,865,089 | | | | – | | | | – | | | | 7,865,089 | |
| Total | | $ | 228,862,494 | | | $ | 595 | | | $ | – | | | $ | 228,863,089 | |
| * | For a detailed sector breakdown, see the accompanying Schedule of Investments. |
The Funds did not have any securities that used significant unobservable inputs (Level 3) in determining fair value and there were no transfers into or out of Level 3.
C. Foreign Investment Risk
The ALPS Clean Energy ETF and the ALPS Disruptive Technologies ETF may directly purchase securities of foreign issuers. Investments in non-U.S. issuers may involve unique risks compared to investing in securities of U.S. issuers, including, among others, less liquidity generally, greater market volatility than U.S. securities and less complete financial information than for U.S. issuers. In addition, adverse political, economic or social developments could undermine the value of the Fund’s investments or prevent the Fund from realizing the full value of its investments. Financial reporting standards for companies based in foreign markets differ from those in the United States. Finally, the value of the currency of the country in which the Fund has invested could decline relative to the value of the U.S. dollar, which may affect the value of the investment to U.S. investors. The Fund will not enter into transactions to hedge against declines in the value of the Fund’s assets that are denominated in foreign currency.
Countries with emerging markets may have relatively unstable governments and may present the risks of nationalization of businesses, restrictions on foreign ownership and prohibitions on the repatriation of assets. The economies of emerging markets countries also may be based on only a few industries, making them more vulnerable to changes in local or global trade conditions and more sensitive to debt burdens, inflation rates or adverse news and events.
Because foreign markets may be open on different days than the days during which investors may purchase the shares of the Fund, the value of the Funds’ securities may change on the days when investors are not able to purchase the shares of the Fund. The value of securities denominated in foreign currencies is converted into U.S. dollars using exchange rates determined daily as of the close of regular trading on the NYSE. Any use of a different rate from the rates used by the Index may adversely affect a Fund's ability to track its Index.
D. Foreign Currency Translation
The books and records of the Funds are maintained in U.S. dollars. Investment valuations and other assets and liabilities initially expressed in foreign currencies are converted each business day into U.S. dollars based upon current exchange rates. The portion of realized and unrealized gains or losses on investments due to fluctuations in foreign currency exchange rates is not separately disclosed and is included in realized and unrealized gains or losses on investments, when applicable.
ALPS ETF Trust
| Notes to Financial Statements | November 30, 2018 |
E. Other Risks
Equity Risk: A principal risk of investing in the Funds is equity risk, which is the risk that the value of the securities held by the Fund will fall due to general market and economic conditions, perceptions regarding the industries in which the issuers of securities held by the Fund participate or factors relating to specific companies in which the Fund invests. For example, an adverse event, such as an unfavorable earnings report, may depress the value of equity securities of an issuer held by a Fund; the price of common stock of an issuer may be particularly sensitive to general movements in the stock market; or a drop in the stock market may depress the price of most or all of the common stocks and other equity securities held by a Fund. In addition, common stock of an issuer in a Fund’s portfolio may decline in price if the issuer fails to make anticipated dividend payments because, among other reasons, the issuer of the security experiences a decline in its financial condition.
Small- and Mid- Capitalization Company Risk:Investments in securities of small and mid-capitalization companies are subject to the risks of common stocks. Investments in smaller companies may involve greater risks because these companies generally have a limited track record. Smaller companies often have narrower markets, more limited managerial and financial resources and a less diversified product offering than larger, more established companies. As a result, their performance can be more volatile, which may increase the volatility of the Fund’s portfolio.
Concentration Risk: Each Fund seeks to track its respective Underlying Index, which may have concentration in certain industries or sectors, as well as regions, economies or markets. Underperformance or increased risk in such other concentrated areas may result in underperformance or increased risk in a Fund.
Non-Correlation Risk:Each Fund’s return may not match the return of its respective Underlying Index for a number of reasons. For example, a Fund incurs a number of operating expenses not applicable to its Underlying Index, and incurs costs in buying and selling securities, especially when rebalancing the Fund’s securities holdings to reflect changes in the composition of the Underlying Index. In addition, the performance of a Fund and its Underlying Index may vary due to asset valuation differences and differences between the Fund’s portfolio and the Underlying Index resulting from legal restrictions. Due to legal and regulatory rules and limitations, a Fund may not be able to invest in all securities included in its Underlying Index. For tax efficiency purposes, a Fund may sell certain securities to realize losses, causing it to deviate from the Underlying Index. The Fund may not be fully invested at times, either as a result of cash flows into the Fund or reserves of cash held by the Fund to meet redemptions and expenses. If a Fund utilizes a sampling approach or otherwise does not hold all of the securities in the Underlying Index, its return may not correlate as well with the return on its Underlying Index, as would be the case if it purchased all of the securities in the Underlying Index with the same weightings as the Underlying Index.
F. Securities Transactions and Investment Income
Securities transactions are recorded as of the trade date. Realized gains and losses from securities transactions are recorded on the highest cost basis. Dividend income and capital gains distributions, if any, are recorded on the ex-dividend date, net of any foreign taxes withheld. Interest income, if any, is recorded on the accrual basis.
G. Dividends and Distributions to Shareholders
Dividends from net investment income for both ALPS Disruptive Technology ETF and ALPS Medical Breakthroughs ETF, if any, are declared and paid annually or as the Board may determine from time to time. Dividends from net investment income for ALPS Clean Energy ETF, if any, are declared and paid quarterly or as the Board may determine from time to time. Distributions of net realized capital gains earned by the Funds, if any, are distributed at least annually.
H. Federal Tax and Tax Basis Information
The timing and character of income and capital gain distributions are determined in accordance with income tax regulations, which may differ from U.S. GAAP. Reclassifications are made to the Funds’ capital accounts for permanent tax differences to reflect income and gains available for distribution (or available capital loss carryforwards) under income tax regulations.
For the year ended November 30, 2018, the following reclassifications, which had no impact on results of operations or net assets, were recorded to reflect permanent tax differences resulting primarily from in-kind transactions:
| Fund | | Paid-in Capital | | | Distributable Earnings | |
| ALPS Clean Energy ETF | | $ | 16,028 | | | $ | (16,028 | ) |
| ALPS Disruptive Technologies ETF | | $ | 1,032,891 | | | $ | (1,032,891 | ) |
| ALPS Medical Breakthroughs ETF | | $ | 18,265,647 | | | $ | (18,265,647 | ) |
ALPS ETF Trust
| Notes to Financial Statements | November 30, 2018 |
The tax character of the distributions paid during the fiscal year ended November 30, 2018 were as follows:
| | | Ordinary Income | | | Long-Term Capital Gain | | | Return of Capital | |
| November 30, 2018 | | | | | | | | | |
| ALPS Clean Energy ETF | | $ | – | | | $ | – | | | $ | – | |
| ALPS Disruptive Technologies ETF | | | – | | | | – | | | | – | |
| ALPS Medical Breakthroughs ETF | | | 2,404,884 | | | | – | | | | – | |
There were no distributions paid during the fiscal year ended November 30, 2017.
As of November 30, 2018, the components of distributable earnings on a tax basis for each Fund were as follows:
| | | Undistributed net investment income | | | Accumulated net realized loss on investments | | | Net unrealized appreciation/depreciation on investments | | | Total | |
| ALPS Clean Energy ETF | | | 17,597 | | | $ | (45,617 | ) | | $ | (159,352 | ) | | $ | (187,372 | ) |
| ALPS Disruptive Technologies ETF | | | 113,499 | | | | (405,478 | ) | | | (3,751,196 | ) | | | (4,043,175 | ) |
| ALPS Medical Breakthroughs ETF | | | 3,892,744 | | | | (50,274,087 | ) | | | (14,936,208 | ) | | | (61,317,551 | ) |
As of November 30, 2018, the cost of investments for federal income tax purposes and accumulated net unrealized appreciation/(depreciation) on investments were as follows:
| | | ALPS Clean Energy ETF | | | ALPS Disruptive Technologies ETF | | | ALPS Medical Breakthroughs ETF | |
| Gross appreciation (excess of value over tax cost) | | $ | 716,202 | | | $ | 1,952,682 | | | $ | 33,610,372 | |
| Gross depreciation (excess of tax cost over value) | | | (875,542 | ) | | | (5,703,751 | ) | | | (48,546,580 | ) |
| Net depreciation of foreign currency | | | (12 | ) | | | (127 | ) | | | – | |
| Net unrealized appreciation (depreciation) | | $ | (159,352 | ) | | $ | (3,751,196 | ) | | $ | (14,936,208 | ) |
| Cost of investments for income tax purposes | | $ | 17,010,923 | | | $ | 54,877,927 | | | $ | 243,799,297 | |
The differences between book-basis and tax-basis are primarily due to deferral of losses from wash sales, investments in partnerships and Passive Foreign Investment Company (“PFIC”) adjustments.
Under current law, capital losses maintain their character as short-term or long-term and are carried forward to the next tax year without expiration. As of November 30, 2018, the following amounts are available as carry forwards to the next tax year:
| Fund | | Short-Term | | | Long-Term | |
| ALPS Clean Energy ETF | | $ | 45,617 | | | $ | – | |
| ALPS Disruptive Technologies ETF | | | 405,478 | | | | – | |
| ALPS Medical Breakthroughs ETF | | | 29,843,793 | | | | 20,430,294 | |
I. Income Taxes
No provision for income taxes is included in the accompanying financial statements, as each Fund intends to distribute to shareholders all taxable investment income and realized gains and otherwise comply with Subchapter M of the Internal Revenue Code of 1986, as amended, applicable to regulated investment companies. Each Fund evaluates tax positions taken (or expected to be taken) in the course of preparing the Fund’s tax returns to determine whether these positions meet a “more-likely-than-not” standard that, based on the technical merits, have a more than fifty percent likelihood of being sustained by a taxing authority upon examination. A tax position that meets the “more-likely-than-not” recognition threshold is measured to determine the amount of benefit to recognize in the financial statements.
ALPS ETF Trust
| Notes to Financial Statements | November 30, 2018 |
As of and during the year or period ended November 30, 2018, each Fund did not have a liability for any unrecognized tax benefits. Each Fund files U.S. federal, state, and local tax returns as required. Each Fund’s tax returns are subject to examination by the relevant tax authorities until expiration of the applicable statute of limitations, which is generally three years after the filing of the tax return, but may extend to four years in certain jurisdictions. Tax returns for open years have incorporated no uncertain tax positions that require a provision for income taxes. As the ALPS Disruptive Technologies ETF commenced operations on December 28, 2017, and the ALPS Clean Energy ETF commenced operations on June 28, 2018, no tax returns have been filed for either Fund as of the date of this report.
J. Lending of Portfolio Securities
The Funds have entered into a securities lending agreement with State Street Bank & Trust Co. (“SSB”), the Funds’ lending agent. Each Fund may lend their portfolio securities only to borrowers that are approved by SSB. Each Fund will limit such lending to not more than 33 1/3% of the value of its total assets. Each Funds’ securities held at SSB as custodian shall be available to be lent except those securities the Fund or ALPS Advisors, Inc. specifically identifies in writing as not being available for lending. The borrower pledges and maintains with each Fund collateral consisting of cash (U.S. Dollars only), securities issued or guaranteed by the U.S. government or its agencies or instrumentalities, and cash equivalents (including irrevocable bank letters of credit) issued by a person other than the borrower or an affiliate of the borrower. The initial collateral received by each Fund is required to have a value of no less than 102% of the market value of the loaned securities for U.S equity securities and a value of no less than 105% of the market value for non-U.S. equity securities. The collateral is maintained thereafter, at a market value equal to not less than 102% of the current value of the U.S. equity securities on loan and not less than 105% of the current value of the non-U.S. equity securities on loan. The market value of the loaned securities is determined at the close of each business day and any additional required collateral is delivered to each Fund on the next business day. During the term of the loan, each Fund is entitled to all distributions made on or in respect of the loaned securities. Loans of securities are terminable at any time and the borrower, after notice, is required to return borrowed securities within the customary time period for settlement of securities transactions.
Any cash collateral received is reinvested in a money market fund managed by SSB as disclosed in the Fund’s Schedule of Investments and is reflected in the Statements of Assets and Liabilities as a payable for collateral upon return of securities loaned. Non-cash collateral, in the form of securities issued or guaranteed by the U.S. government or its agencies or instrumentalities, is not disclosed in a Fund’s Statements of Assets and Liabilities as it is held by the lending agent on behalf of each Fund, and each Fund does not have the ability to re-hypothecate these securities. Income earned by the Fund from securities lending activity is disclosed in the Statement of Operations.
The following is a summary of each Fund's securities lending agreement and related cash and non-cash collateral received as of November 30, 2018:
| | | Market Value of Securities on Loan | | | Cash Collateral Received | | | Non-Cash Collateral Received | | | Total Collateral Received | |
| ALPS Clean Energy ETF | | $ | 619,032 | | | $ | 617,752 | | | $ | 48,076 | | | $ | 665,828 | |
| ALPS Disruptive Technologies ETF | | | 3,504,064 | | | | 2,737,909 | | | | 872,628 | | | | 3,610,537 | |
| ALPS Medical Breakthroughs ETF | | | 46,250,339 | | | | 7,865,089 | | | | 38,670,121 | | | | 46,535,210 | |
The risks of securities lending include the risk that the borrower may not provide additional collateral when required or may not return the securities when due. To mitigate these risks, each Fund benefits from a borrower default indemnity provided by SSB. SSB’s indemnity allows for full replacement of securities lent wherein SSB will purchase the unreturned loaned securities on the open market by applying the proceeds of the collateral, or to the extent such proceeds are insufficient or the collateral is unavailable, SSB will purchase the unreturned loan securities at SSB’s expense. However, the Funds could suffer a loss if the value of the investments purchased with cash collateral falls below the value of the cash collateral received.
ALPS ETF Trust
| Notes to Financial Statements | November 30, 2018 |
The following tables reflect a breakdown of transactions accounted for as secured borrowings, the gross obligation by the type of collateral pledged or securities loaned, and the remaining contractual maturity of those transactions as of November 30, 2018:
| ALPS Clean Energy ETF | | Remaining contractual maturity of the agreements | |
| Securities Lending Transactions | | Overnight & Continuous | | | Up to 30 days | | | 30-90 days | | | Greater than 90 days | | | Total | |
| Common Stocks | | $ | 617,752 | | | $ | – | | | $ | – | | | $ | – | | | $ | 617,752 | |
| Total Borrowings | | | | | | | | | | | | | | | | | | | 617,752 | |
| Gross amount of recognized liabilities for securities lending (collateral received) | | | $ | 617,752 | |
| ALPS Disruptive Technologies ETF | | Remaining contractual maturity of the agreements | |
| Securities Lending Transactions | | Overnight & Continuous | | | Up to 30 days | | | 30-90 days | | | Greater than 90 days | | | Total | |
| Common Stocks | | $ | 2,737,909 | | | $ | – | | | $ | – | | | $ | – | | | $ | 2,737,909 | |
| Total Borrowings | | | | | | | | | | | | | | | | | | | 2,737,909 | |
| Gross amount of recognized liabilities for securities lending (collateral received) | | | $ | 2,737,909 | |
| ALPS Medical Breakthroughs ETF | | Remaining contractual maturity of the agreements | |
| Securities Lending Transactions | | Overnight & Continuous | | | Up to 30 days | | | 30-90 days | | | Greater than 90 days | | | Total | |
| Common Stocks | | $ | 7,865,089 | | | $ | – | | | $ | – | | | $ | – | | | $ | 7,865,089 | |
| Total Borrowings | | | | | | | | | | | | | | | | | | | 7,865,089 | |
| Gross amount of recognized liabilities for securities lending (collateral received) | | | | $ | 7,865,089 | |
3. INVESTMENT ADVISORY FEE AND OTHER AFFILIATED TRANSACTIONS
ALPS Advisors, Inc. (“Adviser”) serves as the Funds’ investment adviser pursuant to an Investment Advisory Agreement with the Trust on behalf of each Fund (the “Advisory Agreement”). Pursuant to the Advisory Agreement, each Fund pays the Adviser an annual management fee for the services and facilities it provides as a percentage of the relevant Fund’s average daily net assets, as set out below. The Adviser served under the previous investment advisory agreement, since the commencement of each Fund until these agreements were terminated on April 16, 2018, due to a change of control of the Adviser’s parent company. Beginning April 16, 2018, the Adviser served under an interim investment advisory agreement, until the current investment advisory agreement was approved by the Fund’s shareholders.
| Fund | Advisory Fee |
| ALPS Clean Energy ETF | 0.65% |
| ALPS Disruptive Technologies ETF | 0.50% |
| ALPS Medical Breakthroughs ETF | 0.50% |
Out of the unitary management fee, the Adviser pays substantially all expenses for each Fund, including the licensing fees to the Index provider, the cost of transfer agency, custody, fund administration, legal, audit, independent trustees and other services, except for interest expenses, distribution fees or expenses, brokerage expenses, taxes and extraordinary expenses not incurred in the ordinary course of each Fund’s business. The Adviser’s unitary management fee is designed to pay substantially all of each Fund’s expenses and to compensate the Adviser for providing services for each Fund.
ALPS Fund Services, Inc., an affiliate of the Adviser, is the administrator for the Funds.
Each Trustee who is not an officer or employee of the Adviser, any sub-adviser or any of their affiliates (“Independent Trustees”) receives (1) a quarterly retainer of $5,000, (2) a per meeting fee for regularly scheduled meetings of $3,750, (3) $1,500 for any special meeting held outside of a regularly scheduled board meeting, and (4) reimbursement for all reasonable out-of-pocket expenses relating to attendance at meetings. In addition, both the Chairman of the Board and Chairman of the Audit Committee each receives a quarterly retainer of $2,000, in connection with their respective roles.
ALPS ETF Trust
| Notes to Financial Statements | November 30, 2018 |
4. PURCHASES AND SALES OF SECURITIES
For the year or period ended November 30, 2018, the cost of purchases and proceeds from sales of investment securities, excluding short-term investments and in-kind transactions, were as follows:
| Fund | | Purchases | | | Sales | |
| ALPS Clean Energy ETF | | $ | 1,193,396 | | | $ | 1,114,430 | |
| ALPS Disruptive Technologies ETF | | | 9,112,479 | | | | 9,028,611 | |
| ALPS Medical Breakthroughs ETF | | | 97,795,291 | | | | 100,970,016 | |
For the year or period ended November 30, 2018, the cost of in-kind purchases and proceeds from in-kind sales were as follows:
| Fund | | Purchases | | | Sales | |
| ALPS Clean Energy ETF | | $ | 18,952,602 | | | $ | 2,511,858 | |
| ALPS Disruptive Technologies ETF | | | 55,837,017 | | | | 4,381,805 | |
| ALPS Medical Breakthroughs ETF | | | 141,522,999 | | | | 45,570,103 | |
For the year or period ended November 30, 2018, the in-kind net realized gains/(losses) were as follows:
| Fund | | Net Realized Gain/(Loss) | |
| ALPS Clean Energy ETF | | $ | 17,035 | |
| ALPS Disruptive Technologies ETF | | | 1,032,891 | |
| ALPS Medical Breakthroughs ETF | | | 18,479,906 | |
Gains on in-kind transactions are not considered taxable for federal income tax purposes and losses on in-kind transactions are also not deductible for tax purposes.
5. CAPITAL SHARE TRANSACTIONS
Shares are created and redeemed by each Fund only in Creation Unit size aggregations of 50,000 Shares. Only broker-dealers or large institutional investors with creation and redemption agreements called Authorized Participants (“AP”) are permitted to purchase or redeem Creation Units from the Funds. Such transactions are generally permitted on an in-kind basis, with a balancing cash component to equate the transaction to the NAV per unit of each Fund on the transaction date. Cash may be substituted equivalent to the value of certain securities generally when they are not available in sufficient quantity for delivery, not eligible for trading by the AP or as a result of other market circumstances.
6. RELATED PARTY TRANSACTIONS
The ALPS Medical Breakthroughs ETF engaged in cross trades between other funds in the Trust during the year or period ended November 30, 2018 pursuant to Rule 17a-7 under the 1940 Act. Cross trading is the buying or selling of portfolio securities between funds to which the Adviser serves as the investment adviser. The Board previously adopted procedures that apply to transactions between the Funds of the Trust pursuant to Rule 17a-7. These transactions related to cross trades during the period complied with the requirements set forth by Rule 17a-7 and the Trust’s procedures.
Transactions related to cross trades during the year or period ended November 30, 2018, were as follows:
| Fund | | Purchase cost paid | | | Sale proceeds received | | | Realized gain/(loss) on sales | |
| ALPS Medical Breakthroughs ETF | | $ | 258,138 | | | $ | – | | | $ | – | |
ALPS ETF Trust
| Notes to Financial Statements | November 30, 2018 |
7. NEW ACCOUNTING PRONOUNCEMENTS
In August 2018, the Financial Accounting Standards Board (“FASB”) issued Accounting Standards Update (“ASU”) 2018-13, which changes the fair value measurement disclosure requirements of FASB ASC Topic 820, Fair Value Measurement. The update to Topic 820 includes new, eliminated, and modified disclosure requirements. ASU 2018-13 is effective for fiscal years beginning after December 15, 2019, including interim periods. Early adoption is permitted for any eliminated or modified disclosures. The Funds have elected to early adopt the eliminated and modified disclosures effective with the financial statements prepared as of November 30, 2018.
8. SHAREHOLDER MEETING
A Special Meeting of Shareholders of the Funds, each a series of the Trust, was held at the offices of ALPS Fund Services, Inc., at 1290 Broadway, Suite 1100, Denver, CO 80203 on August 3, 2018. At the meeting, the following matters were voted on by the Shareholders. The results of the Special Meeting of Shareholders are noted below:
Proposal 1: To approve a new investment advisory agreement (the “New Advisory Agreement”) between the Trust, on behalf of each Fund, and the Adviser.
| | Shares Voted In Favor | Shares Voted Against/Withheld or Abstentions | Proposal Approved |
| ALPS Disruptive Technologies ETF | 237,426 | 15,131 | Yes |
| ALPS Medical Breakthroughs ETF | 2,528,833 | 195,833 | Yes |
Proposal 2: To approve a proposal that would authorize the Adviser to enter into and materially amend sub-advisory agreements in the future with wholly-owned sub-advisers and unaffiliated sub-advisers, with the approval of the Board, but without obtaining additional Shareholder approval.
| | Shares Voted In Favor | Shares Voted Against/Withheld or Abstentions | Proposal Approved |
| ALPS Disruptive Technologies ETF | 109,252 | 143,305 | No |
| ALPS Medical Breakthroughs ETF | 1,826,724 | 897,942 | Yes |
9. SEC REGULATIONS
On October 4, 2018, the SEC amended Regulation S-X to require certain financial statement disclosure requirements to conform them to GAAP for investment companies. Effective November 4, 2018, the Fund adopted disclosure requirement changes for Regulation S-X, these changes are reflected throughout this report. The Fund’s adoption of the amendments, effective with the financial statements prepared as of November 30, 2018, had no effect on the Fund’s net assets or results of operations.
ALPS ETF Trust
| Additional Information | November 30, 2018 (Unaudited) |
PROXY VOTING RECORDS, POLICIES AND PROCEDURES
Information regarding how each Fund voted proxies relating to portfolio securities during the most recent 12-month period ended June 30 and a description of the Fund’s proxy voting policies and procedures used in determining how to vote for proxies are available without charge on the SEC’s website at www.sec.gov and upon request, by calling (toll-free) 1-866-675-2639.
PORTFOLIO HOLDINGS
The Trust is required to disclose, after its first and third fiscal quarters, the complete schedule of each Fund’s portfolio holdings with the SEC on Form N-Q. Forms N-Q for each Fund will be available on the SEC’s website at www.sec.gov. Each Fund’s Forms N-Q may also be reviewed and copied at the SEC’s Public Reference Room in Washington, D.C. and information on the operation of the Public Reference Room may be obtained by calling 1-800-SEC-0330. Each Fund’s Forms N-Q will be available without charge, upon request, by calling (toll-free) 1-866-675-2639 or by writing to ALPS ETF Trust at 1290 Broadway, Suite 1100, Denver, Colorado 80203.
TAX INFORMATION
The Fund designates the following for federal income tax purposes for distributions made during the calendar year ended December 31, 2017:
| | Qualified Dividend Income | Dividend Received Deduction |
| ALPS Medical Breakthroughs ETF | 0.00% | 0.00% |
In early 2018, if applicable, shareholders of record received this information for the distribution paid to them by the Fund during the calendar year 2017 via Form 1099. The Fund will notify shareholders in early 2019 of amounts paid to them by the Fund, if any, during the calendar year 2018.
LICENSING AGREEMENT
ALPS Disruptive Technology ETF
The Indxx Disruptive Technologies Index (the “Underlying Index”) is a service mark of Indxx, LLC (“Indxx” or the “Index Provider”) and has been licensed for use for certain purposes by ALPS Advisors, Inc. The ALPS Disruptive Technologies ETF is not sponsored, endorsed, sold or promoted by Indxx and Indxx makes no representation regarding the advisability of investing in the ALPS Disruptive Technologies ETF.
The ALPS Disruptive Technologies ETF is not sponsored, endorsed, sold or promoted by Indxx. Indxx makes no representation or warranty, express or implied, to the owners of the ALPS Disruptive Technologies ETF or any member of the public regarding the advisability of investing in securities generally or in the ALPS Disruptive Technologies ETF particularly. Indxx has no obligation to take the needs of ALPS Advisors, Inc. or the shareholders of ALPS Disruptive Technologies ETF into consideration in determining, composing, or calculating the Underlying Index. Indxx is not responsible for and has not participated in the determination of the timing, amount or pricing of the ALPS Disruptive Technologies ETF shares to be issued or in the determination or calculation of the equation by which the ALPS Disruptive Technologies ETF is to be converted into cash. Indxx has no obligation or liability in connection with the administration, marketing or trading of the ALPS Disruptive Technologies ETF.
INDXX MAKES NO WARRANTY, EXPRESS OR IMPLIED, AS TO THE RESULTS TO BE OBTAINED BY ANY PERSON OR ENTITY FROM THE USE OF THE INDEX(ES), TRADING BASED ON THE INDEX(ES), OR ANY DATA INCLUDED THEREIN IN CONNECTION WITH THE PRODUCTS, OR FOR ANY OTHER USE. INDXX EXPRESSLY DISCLAIMS ALL WARRANTIES AND CONDITIONS, EXPRESS, STATUTORY, OR IMPLIED, EXCEPT AS SET FORTH IN THIS AGREEMENT. EXCEPT AS OTHERWISE SPECIFICALLY SET FORTH IN THIS AGREEMENT, INDXX HEREBY EXPRESSLY DISCLAIMS ALL IMPLIED WARRANTIES AND CONDITIONS OF MERCHANTABILITY, TITLE, OR FITNESS FOR A PARTICULAR PURPOSE OR USE WITH RESPECT TO THE INDEX(ES) OR ANY DATA INCLUDED THEREIN. INDXX DOES NOT GUARANTEE THE ACCURACY AND/OR THE COMPLETENESS OF ANY DATA SUPPLIED BY IT OR ANY DATA INCLUDED THEREIN. INDXX MAKES NO WARRANTY, EXPRESS OR IMPLIED, AS TO RESULTS TO BE OBTAINED BY THE FUNDS, ITS SHAREHOLDERS OR AFFILIATES, OR ANY OTHER PERSON OR ENTITY FROM THE USE OF THE DATA SUPPLIED BY INDXX OR ANY DATA INCLUDED THEREIN. INDXX MAKES NO EXPRESS OR IMPLIED WARRANTIES, AND EXPRESSLY DISCLAIMS ALL WARRANTIES OF MERCHANTABILITY OR FITNESS FOR A PARTICULAR PURPOSE OR USE WITH RESPECT TO THE DATA SUPPLIED BY INDXX OR ANY DATA INCLUDED THEREIN. WITHOUT LIMITING ANY OF THE FOREGOING, IN NO EVENT SHALL INDXX HAVE ANY LIABILITY FOR ANY SPECIAL, PUNITIVE, INDIRECT, OR CONSEQUENTIAL DAMAGES (INCLUDING LOST PROFITS), EVEN IF NOTIFIED OF THE POSSIBILITY OF SUCH DAMAGES.
The Adviser does not guarantee the accuracy and/or the completeness of the Underlying Index or any data included therein, and the Adviser shall have no liability for any errors, omissions or interruptions therein. The Adviser makes no warranty, express or implied, as to results to be obtained by the Fund, owners of the Shares of the Fund or any other person or entity from the use of the Underlying Index or any data included therein. The Adviser makes no express or implied warranties, and expressly disclaims all warranties of merchantability or fitness for a particular purpose or use with respect to the Underlying Index or any data included therein. Without limiting any of the foregoing, in no event shall the Adviser have any liability for any special, punitive, direct, indirect or consequential damages (including lost profits) arising out of matters relating to the use of the Underlying Index, even if notified of the possibility of such damages.
ALPS ETF Trust
| Additional Information | November 30, 2018 (Unaudited) |
ALPS Medical Breakthroughs ETF
The Poliwogg Medical Breakthroughs IndexSM is a service mark of S-Network Global Indexes, Inc. and has been licensed for use by ALPS Advisors, Inc. The ALPS Medical Breakthroughs ETF is not sponsored, endorsed, sold or promoted by S-Network Global Indexes, Inc. and S-Network Global Indexes, Inc. makes no representation regarding the advisability of investing in the ALPS Medical Breakthroughs ETF.
The ALPS Medical Breakthroughs ETF is not sponsored, endorsed, sold or promoted by Standard & Poor’s, a division of The McGraw-Hill Companies, Inc. (“S&P”) or its third party licensors. Neither S&P nor its third party licensors make any representation or warranty, express or implied, to the owners of the ALPS Medical Breakthroughs ETF or any member of the public regarding the advisability of investing in securities generally or in the ALPS Medical Breakthroughs ETF particularly or the ability of the Poliwogg Medical Breakthroughs IndexSM to track general stock market performance. S&P’s and its third party licensor’s only relationship to S-Network Global Indexes, LLC is the licensing of certain trademarks, service marks and trade names of S&P and/or its third party licensors and for the providing of calculation and maintenance services related to the Poliwogg Medical Breakthroughs IndexSM. Neither S&P nor its third party licensors is responsible for and has not participated in the determination of the prices and amount of the ALPS Medical Breakthroughs ETF or the timing of the issuance or sale of the ALPS Medical Breakthroughs ETF or in the determination or calculation of the equation by which the ALPS Medical Breakthroughs ETF is to be converted into cash. S&P has no obligation or liability in connection with the administration, marketing or trading of the ALPS Medical Breakthroughs ETF.
NEITHER S&P, ITS AFFILIATES NOR THEIR THIRD PARTY LICENSORS GUARANTEE THE ADEQUACY, ACCURACY, TIMELINESS OR COMPLETENESS OF THE POLIWOGG MEDICAL BREAKTHROUGHS INDEXSM OR ANY DATA INCLUDED THEREIN OR ANY COMMUNICATIONS, INCLUDING BUT NOT LIMITED TO, ORAL OR WRITTEN COMMUNICATIONS (INCLUDING ELECTRONIC COMMUNICATIONS) WITH RESPECT THERETO. S&P, ITS AFFILIATES AND THEIR THIRD PARTY LICENSORS SHALL NOT BE SUBJECT TO ANY DAMAGES OR LIABILITY FOR ANY ERRORS, OMISSIONS OR DELAYS THEREIN. S&P MAKES NO EXPRESS OR IMPLIED WARRANTIES, AND EXPRESSLY DISCLAIMS ALL WARRANTIES OF MERCHANTABILITY OR FITNESS FOR A PARTICULAR PURPOSE OR USE WITH RESPECT TO ITS TRADEMARKS, THE INDEX OR ANY DATA INCLUDED THEREIN. WITHOUT LIMITING ANY OF THE FOREGOING, IN NO EVENT WHATSOEVER SHALL S&P, ITS AFFILIATES OR THEIR THIRD PARTY LICENSORS BE LIABLE FOR ANY INDIRECT, SPECIAL, INCIDENTAL, PUNITIVE OR CONSEQUENTIAL DAMAGES, INCLUDING BUT NOT LIMITED TO, LOSS OF PROFITS, TRADING LOSSES, LOST TIME OR GOODWILL, EVEN IF THEY HAVE BEEN ADVISED OF THE POSSIBILITY OF SUCH DAMAGES, WHETHER IN CONTRACT, TORT, STRICT LIABILITY OR OTHERWISE.
Standard & Poor’s®, and S&P® are registered trademarks of The McGraw-Hill Companies, Inc.; “Calculated by S&P Custom Indices” and its related stylized mark are service marks of The McGraw-Hill Companies, Inc. These marks have been licensed for use by S-Network Global Indexes, LLC. The Adviser does not guarantee the accuracy and/or the completeness of either Underlying Index or any data included therein, and the Adviser shall have no liability for any errors, omissions or interruptions therein. The Adviser makes no warranty, express or implied, as to results to be obtained by the Funds, owners of the Shares of the Funds or any other person or entity from the use of either Underlying Index or any data included therein. The Adviser makes no express or implied warranties, and expressly disclaims all warranties of merchantability or fitness for a particular purpose or use with respect to either Underlying Index or any data included therein. Without limiting any of the foregoing, in no event shall the Adviser have any liability for any special, punitive, direct, indirect or consequential damages (including lost profits) arising out of matters relating to the use of either Underlying Index even if notified of the possibility of such damages.
ALPS Clean Energy ETF
The CIBC Atlantic Trust Clean Energy Index (the “Underlying Index”) was created by CIBC National Trust Company (“CIBC NTC,” or the “Index Provider”). The Index Provider has entered into a license agreement with ALPS Advisors, Inc. (the “Adviser”) to use the Underlying Index (the “License Agreement”) in connection with the ALPS Clean Energy ETF (“Fund”). The following disclosure relates to the Index Provider and Adviser:
CIBC NTC is the designer of the construction and methodology for the Underlying Index. “CIBC NTC” and “CIBC Atlas Clean Energy Index” are service marks or trademarks of the Index Provider. CIBC NTC acts solely as brand licensor for the Underlying Index, and is not responsible for the descriptions of the Underlying Index or the Fund that appear herein.
The Fund is not sponsored, endorsed, sold or promoted by CIBC NTC or any of its affiliates. CIBC NTC makes no representation or warranty, express or implied, to the owners of the Fund or any member of the public regarding the advisability of investing in securities or commodities generally or in the Fund particularly or the ability of the Underlying Index to track the market generally. CIBC NTC does not guarantee the quality, accuracy or completeness of the Underlying Index or any Underlying Index data included herein or derived therefrom and assume no liability in connection with their use. The Underlying Index is determined and composed without regard to the Adviser or the Fund. CIBC NTC has no obligation to take the needs of the Adviser, the Fund or the shareholders of the Fund into consideration in determining, composing or calculating the Underlying Index. CIBC NTC is not responsible for and has not participated in the determination of the timing of, prices at, or quantities of the Fund to be issued or in the determination or calculation of the equation by which the Fund is to be converted into cash. CIBC NTC has no obligation or liability in connection with the administration, marketing or trading of the Fund and is not responsible for and has not participated in the determination of pricing or the timing of the issuance or sale of the Shares of the Fund or in the determination or calculation of the NAV of the Fund.
ALPS ETF Trust
| Additional Information | November 30, 2018 (Unaudited) |
CIBC NTC does not guarantee the quality, accuracy and/or completeness of the Underlying Index or any data included therein, and CIBC NTC shall have no liability for any errors, omissions, or interruptions of any kind related to the Underlying Index or related data. CIBC NTC makes no warranty, express or implied, as to results to be obtained by the Adviser, the Fund, Fund shareholders or any other person or entity from the use of the Underlying Index or any data included therein. CIBC NTC makes no express or implied warranties, and expressly disclaims all warranties of merchantability or fitness for a particular purpose or use with respect to the Underlying Index or any data included therein. Without limiting any of the foregoing, in no event shall CIBC NTC have any liability for any special, punitive, indirect, or consequential damages (including lost profits) arising out of matters relating to the use of the Underlying Index, even if notified of the possibility of such damages.
All intellectual property rights in the Underlying Index vests in CIBC NTC. www.alpsfunds.com 15 ALPS CLEAN ENERGY ETF The Underlying Index is the property of CIBC NTC, which has contracted with S&P Opco, LLC (a subsidiary of S&P Dow Jones Indices LLC) to calculate and maintain the Underlying Index. The Underlying Index is not sponsored by S&P Dow Jones Indices or its affiliates or its third party licensors (collectively, “S&P Dow Jones Indices”). S&P Dow Jones Indices will not be liable for any errors or omissions in calculating the Underlying Index. “Calculated by S&P Dow Jones Indices” and the related stylized mark(s) are service marks of S&P Dow Jones Indices and have been licensed for use by CIBC NTC. S&P®is a registered trademark of Standard & Poor’s Financial Services LLC (“SPFS”), and Dow Jones®is a registered trademark of Dow Jones Trademark Holdings LLC (“Dow Jones”).
The Fund is not sponsored, endorsed, sold or promoted by S&P Dow Jones Indices. S&P Dow Jones Indices does not make any representation or warranty, express or implied, to the owners of the Fund or any member of the public regarding the advisability of investing in securities generally or in the Fund particularly or the ability of the Underlying Index to track general market performance. S&P Dow Jones Indices’ only relationship to CIBC NTC with respect to the Underlying Index is the licensing of certain trademarks, service marks and trade names of S&P Dow Jones Indices, and the provision of the calculation services related to the Underlying Index. S&P Dow Jones Indices is not responsible for and has not participated in the determination of the prices and amount of the Fund or the timing of the issuance or sale of the Fund or in the determination or calculation of the equation by which the Fund may be converted into cash or other redemption mechanics. S&P Dow Jones Indices has no obligation or liability in connection with the administration, marketing or trading of the Fund. S&P Dow Jones Indices LLC is not an investment advisor. Inclusion of a security within the Underlying Index is not a recommendation by S&P Dow Jones Indices to buy, sell, or hold such security, nor is it investment advice.
S&P DOW JONES INDICES DOES NOT GUARANTEE THE ADEQUACY, ACCURACY, TIMELINESS AND/OR THE COMPLETENESS OF THE UNDERLYING INDEX OR ANY DATA RELATED THERETO OR ANY COMMUNICATION WITH RESPECT THERETO, INCLUDING, ORAL, WRITTEN, OR ELECTRONIC COMMUNICATIONS. S&P DOW JONES INDICES SHALL NOT BE SUBJECT TO ANY DAMAGES OR LIABILITY FOR ANY ERRORS, OMISSIONS, OR DELAYS THEREIN. S&P DOW JONES INDICES MAKES NO EXPRESS OR IMPLIED WARRANTIES, AND EXPRESSLY DISCLAIMS ALL WARRANTIES, OF MERCHANTABILITY OR FITNESS FOR A PARTICULAR PURPOSE OR USE OR AS TO RESULTS TO BE OBTAINED BY CIBC NTC, OWNERS OF THE FUND, OR ANY OTHER PERSON OR ENTITY FROM THE USE OF THE UNDERLYING INDEX OR WITH RESPECT TO ANY DATA RELATED THERETO. WITHOUT LIMITING ANY OF THE FOREGOING, IN NO EVENT WHATSOEVER SHALL S&P DOW JONES INDICES BE LIABLE FOR ANY INDIRECT, SPECIAL, INCIDENTAL, PUNITIVE, OR CONSEQUENTIAL DAMAGES, INCLUDING BUT NOT LIMITED TO, LOSS OF PROFITS, TRADING LOSSES, LOST TIME, OR GOODWILL, EVEN IF THEY HAVE BEEN ADVISED OF THE POSSIBILITY OF SUCH DAMAGES, WHETHER IN CONTRACT, TORT, STRICT LIABILITY, OR OTHERWISE.
The Index Provider is not affiliated with the Trust, the Adviser or ALPS Portfolio Solutions Distributor, Inc. (the “Distributor”). The Index Provider has entered into a license agreement with the Adviser (the “License Agreement”). The use of the Underlying Index by the Adviser and the Fund is subject to the terms of the License Agreement, which impose certain limitations and conditions on the Fund’s ability to use the Underlying Index.
The Adviser does not guarantee the accuracy and/or the completeness of the Underlying Index or any data included therein, and the Adviser shall have no liability for any errors, omissions or interruptions therein. The Adviser makes no warranty, express or implied, as to results to be obtained by the Fund, owners of the Shares of the Fund or any other person or entity from the use of the Underlying Index or any data included therein. The Adviser makes no express or implied warranties, and expressly disclaims all warranties of merchantability or fitness for a particular purpose or use with respect to the Underlying Index or any data included therein. Without limiting any of the foregoing, in no event shall the Adviser have any liability for any special, punitive, direct, indirect, or consequential damages (including lost profits) arising out of matters relating to the use of the Underlying Index, even if notified of the possibility of such damages.
ALPS ETF Trust
Board Considerations Regarding Approval of Investment Advisory Agreements | November 30, 2018 (Unaudited) |
At an in-person meeting held on March 5, 2018, the Board of Trustees of the Trust (the “Board” or the “Trustees”), including the Trustees who are not “interested persons” of the Trust within the meaning of the 1940 Act, as amended (the “Independent Trustees”), evaluated a proposal to approve the Investment Advisory Agreement between the Trust and ALPS Advisors, Inc. (the “Adviser” or “AAI”) with respect to the ALPS Clean Energy ETF (“ACES” or the “Fund”). The Independent Trustees also met separately to consider the Investment Advisory Agreement.
In evaluating the Advisory Agreement, the Independent Trustees considered various factors, including (i) the nature, extent and quality of the services expected to be provided by the Adviser to ACES under the ACES Advisory Agreement; (ii) the advisory fees and other expenses proposed to be paid by ACES compared to those of similar funds managed by other investment advisers; (iii) the expected profitability to the Adviser of its proposed advisory relationship with ACES and reasonableness of compensation to the Adviser; (iv) the extent to which economies of scale would be realized if and as ACES’ assets increase and whether the fee level in the ACES Advisory Agreement reflects these economies of scale; and (v) any additional benefits and other considerations.
With respect to the nature, extent and quality of the services to be provided by the Adviser under the ACES Advisory Agreement, the Independent Trustees considered and reviewed information concerning the services proposed to be provided under the ACES Advisory Agreement, the proposed investment parameters of the index for ACES, financial information regarding the Adviser and its parent company, information describing the Adviser’s current organizations and the background and experience of the persons who would be responsible for the day-to-day management of ACES, the anticipated financial support of ACES, and the nature and quality of services provided to other ETFs, open-end and closed-end funds sponsored by the Adviser. Based upon their review, the Independent Trustees concluded that the Adviser was qualified to oversee the services to be provided by other service providers and that the services to be provided by the Adviser to ACES are expected to be satisfactory.
With respect to the costs of services to be provided and profits to be realized by the Adviser, the Independent Trustees considered the resources involved in managing ACES as well as the fact that the Adviser agreed to pay all of ACES’ expenses (except for interest expenses, distribution fees or expenses, brokerage expenses, taxes and extraordinary expenses such as litigation and other expenses not incurred in the ordinary course of ACES’ business) out of the unitary advisory fee. Based on their review, the Independent Trustees concluded that the expected profitability of ACES to the Adviser was not unreasonable.
The Independent Trustees also reviewed comparative fee and expense data provided by Broadridge regarding ACES. The Independent Trustees noted the proposed advisory fee for services to be provided to ACES by the Adviser was 0.65% of ACES’ average daily net assets. The Independent Trustees also considered that the advisory fee with respect to ACES was a unitary one and that, as set forth above, the Adviser had agreed to pay all of ACES’ expenses (except for interest expenses, marketing fees, distribution fees or expenses, brokerage expenses, taxes and extraordinary expenses such as litigation and other expenses not incurred in the ordinary course of ACES’ business) out of the unitary fee. The Independent Trustees considered that, taking into account the impact of ACES’ unitary advisory fee, ACES’ expense ratio was higher than the median of its Broadridge expense group. The Independent Trustees also took into account AAI’s belief that the Broadridge peer group was not appropriate for ACES and noted that AAI had also prepared a peer group which invests directly in the same clean energy themes and securities contained within ACES. The fees in the peer universe prepared by AAI ranged from 0.47% to 0.81% of average daily net assets. Based on the foregoing and the other information available to them, the Independent Trustees concluded that the advisory fees for ACES were reasonable under the circumstances and in light of the quality of services provided.
The Independent Trustees also considered other benefits that may be realized by the Adviser from its relationship with ACES and concluded that the advisory fees were reasonable taking into account such benefits.
The Independent Trustees considered the extent to which economies of scale would be realized as ACES grows and whether fee levels reflect a reasonable sharing of such economies of scale for the benefit of ACES investors. Because ACES is newly organized, the Independent Trustees reviewed ACES’ proposed unitary advisory fee and anticipated expenses and determined to review economies of scale in the future when ACES had attracted assets.
In voting to approve the ACES Advisory Agreement, the Independent Trustees concluded that the terms of the ACES Advisory Agreement are reasonable and fair in light of the services to be performed, the fees paid by certain other funds, expenses to be incurred and such other matters as the Independent Trustees considered relevant in the exercise of their reasonable business judgment. The Independent Trustees did not identify any single factor or group of factors as all important or controlling and considered all factors together.
ALPS ETF Trust
| Trustees & Officers | November 30, 2018 (Unaudited) |
The general supervision of the duties performed by the Adviser for the Fund under the Investment Advisory Agreement is the responsibility of the Board of Trustees. The Trust currently has four Trustees. Three Trustees have no affiliation or business connection with the Adviser or any of its affiliated persons and do not own any stock or other securities issued by the Adviser. These are the “non-interested” or “independent” Trustees (“Independent Trustees”). The other Trustee (the “Interested Trustee”) is affiliated with the Adviser.
The Independent Trustees of the Trust, their term of office and length of time served, their principal business occupations during the past five years, the number of portfolios in the Fund Complex overseen by each Independent Trustee, and other directorships, if any, held by the Trustee are shown below.
| INDEPENDENT TRUSTEES | | | |
Name, Address
& Year of Birth* | Position(s)
Held
with Trust | Term of Office and Length of Time Served** | Principal Occupation(s)
During Past 5 Years | Number of
Portfolios in
Fund Complex
Overseen by
Trustees*** | Other Directorships
Held by Trustees |
Mary K. Anstine, 1940 | Trustee | Since March 2008 | Ms. Anstine was President/Chief Executive Officer of HealthONE Alliance, Denver, Colorado, and former Executive Vice President of First Interstate Bank of Denver. Ms. Anstine is also Trustee/Director of AV Hunter Trust and Colorado Uplift Board. Ms. Anstine was formerly a Director of the Trust Bank of Colorado (later purchased and now known as Northern Trust Bank), HealthONE and Denver Area Council of the Boy Scouts of America and a member of the American Bankers Association Trust Executive Committee. | 41 | Ms. Anstine is a Trustee of ALPS Variable Investment Trust (9 funds); Financial Investors Trust (33 funds); Reaves Utility Income Fund (1 fund); and Segall Bryant & Hamill Trust (14 funds). |
Jeremy W. Deems, 1976 | Trustee | Since March 2008 | Mr. Deems is the Co-Founder, Chief Compliance Officer and Chief Financial Officer of Green Alpha Advisors, LLC. Mr. Deems is Co-Portfolio Manager of the Shelton Green Alpha Fund. Prior to joining Green Alpha Advisors, Mr. Deems was CFO and Treasurer of Forward Management, LLC, ReFlow Management Co., LLC, ReFlow Fund, LLC, a private investment fund, and Sutton Place Management, LLC, an administrative services company. | 41 | Mr. Deems is a Trustee of ALPS Variable Investment Trust (9 funds); Financial Investors Trust (33 funds); and Reaves Utility Income Fund (1 fund); and Clough Funds Trust (1 fund). |
Rick A. Pederson, 1952 | Trustee and Chairman | Since March 2008. Has served as Chairman since July 2017. | Mr. Pederson is Partner, Bow River Capital Partners (private equity management), 2003 - present; Board Member, Prosci Inc. (private business services) 2013-2016; Board Member, Citywide Banks (Colorado community bank) 2014-present; Board Member, Strong-Bridge Consulting (management consulting) 2015-present; Board Member, IRI/ODMS Holdings LLC, 2017 – present; Director, National Western Stock Show (not-for-profit organization) 2010 – present; Board Member, History Colorado, 2015 – present; Trustee, Boettcher Foundation, 2018. | 21 | Mr. Pederson is Trustee of Segall Bryant & Hamill Trust (14 funds) and Principal Real Estate Income Fund (1 fund) |
| * | The business address of the Trustee is c/o ALPS Advisors, Inc., 1290 Broadway, Suite 1100, Denver, Colorado 80203. |
| ** | This is the period for which the Trustee began serving the Trust. Each Trustee serves an indefinite term, until his successor is elected. |
| *** | The Fund Complex includes all series of the Trust and any other investment companies for which ALPS Advisors, Inc. provides investment advisory services. |
ALPS ETF Trust
| Trustees & Officers | November 30, 2018 (Unaudited) |
The Trustee who is affiliated with the Adviser or affiliates of the Adviser and executive officers of the Trust, his term of office and length of time served, his principal business occupations during the past five years, the number of portfolios in the Fund Complex overseen by the Interested Trustee and the other directorships, if any, held by the Trustee, are shown below.
| INTERESTED TRUSTEE | | | | |
Name, Address
and Year of
Birth of
Interested
Trustee* | Position(s) Held with Trust | Term of Office
and Length of
Time Served** | Principal Occupation(s)
During Past 5 Years | Number of Portfolios in Fund Complex Overseen by Trustees*** | Other Directorships
Held by Trustee |
Edmund J. Burke, 1961 | Trustee and President | Since December 2017 | Mr. Burke is President and a Director of ALPS Holdings, Inc. (“AHI”) (since 2005) and Director of Boston Financial Data Services, Inc. (“BFDS”), ALPS Advisors, Inc. (“AAI”), ALPS Distributors, Inc. (“ADI”), ALPS Fund Services, Inc. (“AFS”) and ALPS Portfolio Solutions Distributor, Inc. (“APSD”). Because of his positions with AHI, BFDS, AAI, ADI, AFS and APSD, Mr. Burke is deemed an affiliate of the Trust as defined under the 1940 Act. | 36 | Mr. Burke is a Trustee of Clough Global Dividend and Income Fund (1 fund); Clough Global Equity Fund (1 fund); Clough Global Opportunities Fund (1 fund); Clough Funds Trust (1 fund); Liberty All-Star Equity Fund (1 fund); Director of the Liberty All-Star Growth Fund, Inc. (1 fund) and Financial Investors Trust (33 funds). |
| * | The business address of the Trustee is c/o ALPS Advisors, Inc., 1290 Broadway, Suite 1100, Denver, Colorado 80203. |
| ** | This is the period for which the Trustee began serving the Trust. Each Trustee serves an indefinite term, until his successor is elected. |
| *** | The Fund Complex includes all series of the Trust and any other investment companies for which ALPS Advisors, Inc. provides investment advisory services. |
ALPS ETF Trust
| Trustees & Officers | November 30, 2018 (Unaudited) |
| OFFICERS | | | |
Name, Address
and Year of
Birth of Officer* | Position(s) Held
with Trust | Length of
Time Served** | Principal Occupation(s) During Past 5 Years |
Erin D. Nelson, 1977 | Chief Compliance Officer (“CCO”) | Since December 2015 | Ms. Nelson became Senior Vice-President and Chief Compliance Officer of ALPS Advisors, Inc. on July 1, 2015 and prior to that served as Vice President and Deputy Chief Compliance Officer of AAI since January 1, 2015. Prior to January 1, 2015, Ms. Nelson was Vice-President and Assistant General Counsel of ALPS Fund Services. Because of her position with AAI, Ms. Nelson is deemed an affiliate of the Trust as defined under the 1940 Act. Ms. Nelson is also the CCO of ALPS Variable Investment Trust, Liberty All-Star Growth Fund, Inc., Liberty All-Star Equity Fund, Principal Real Estate Income Fund, RiverNorth Opportunities Fund, Inc. and Red Rocks Capital, LLC. |
Kathryn Burns, 1976 | Treasurer | Since September 2018 | Ms. Burns serves as Vice President, Director of Fund Operations of AAI since 2018. From 2013 to 2018, she served as Vice President and Fund Controller at ALPS Fund Services. Prior to joining ALPS, she worked at Old Mutual Capital where she served as Vice President and Chief Compliance Officer (2010 – 2012) and Regulatory Reporting Manager and Assistant Treasurer to the Old Mutual Funds Trusts (2006 – 2012). She also served as a CPA for PricewaterhouseCoopers LLP. Ms. Burns is also Treasurer of ALPS Variable Investment Trust, the Boulder Growth & Income Fund, Inc., Principal Real Estate Income Fund and the RiverNorth Opportunities Fund Inc. |
Andrea E. Kuchli, 1985 | Secretary | Since December 2017 | Ms. Kuchli joined ALPS in 2015 and is currently Vice President and Senior Counsel of ALPS. Prior to joining ALPS, Ms. Kuchli was an Associate with Davis Graham & Stubbs LLP from April 2014 to February 2015, and an Associate with Dechert LLP from 2011 to April 2014. Because of her position with ALPS, Ms. Kuchli is deemed an affiliate of the Trust as defined under the 1940 Act. Ms. Kuchli is also Secretary of ALPS Variable Investment Trust and Principal Real Estate Income Fund as well as Assistant Secretary of the James Advantage Funds. |
Sharon Akselrod, 1974 | Assistant Secretary | Since December 2016 | Ms. Akselrod joined ALPS in August 2014 and is currently Senior Investment Company Act Paralegal of ALPS Fund Services, Inc. Prior to joining ALPS, Ms. Akselrod served as Corporate Governance and Regulatory Associate for Nordstrom fsb (2013-2014) and Senior Legal Assistant – Legal Manager for AXA Equitable Life Insurance Company (2008-2013). Because of her position with ALPS, Ms. Akselrod is deemed an affiliate of the Trust as defined under the 1940 Act. Ms. Akselrod is also Assistant Secretary of Financial Investors Trust, ALPS Variable Investment Trust, Principal Real Estate Income Fund and Clough Funds Trust. |
| * | The business address of each Officer is c/o ALPS Advisors, Inc., 1290 Broadway, Suite 1100, Denver, Colorado 80203. |
| ** | This is the period for which the Officer began serving the Trust. Each Officer serves an indefinite term, until his/her successor is elected. |

TABLE OF
CONTENTS
| Performance Overview | 1 |
| Disclosure of Fund Expenses | 10 |
| Report of Independent Registered Public Accounting Firm | 11 |
| Schedule of Investments | 12 |
| Statements of Assets and Liabilities | 17 |
| Statements of Operations | 18 |
| Statements of Changes in Net Assets | 19 |
| Financial Highlights | 22 |
| Notes to Financial Statements | 25 |
| Additional Information | 32 |
| Trustees & Officers | 34 |
Beginning on January 1, 2021, as permitted by regulations adopted by the U.S. Securities and Exchange Commission, paper copies of the Funds’ annual and semi-annual shareholder reports will no longer be sent by mail, unless you specifically request paper copies of the reports from your financial intermediary (such as a broker-dealer or bank). Instead, the reports will be made available on the Funds’ website (www.alpsfunds.com), and you will be notified by mail each time a report is posted and provided with a website link to access the report.
If you already elected to receive shareholder reports electronically, you will not be affected by this change and you need not take any action. You may elect to receive shareholder reports and other communications from a Fund electronically anytime by contacting your financial intermediary.
You may elect to receive all future reports in paper free of charge. You can contact your financial intermediary to request that you continue to receive paper copies of your shareholder reports. Your election to receive reports in paper will apply to all funds held in your account with your financial intermediary.
alpsfunds.com
ALPS Sector Dividend Dogs ETF
| Performance Overview | November 30, 2018 (Unaudited) |
Investment Objective
The ALPS Sector Dividend Dogs ETF (the “Fund”) seeks investment results that replicate as closely as possible, before fees and expenses, the performance of the S-Network® Sector Dividend Dogs Index (the “Underlying Index”). The Shares of the Fund are listed and trade on the NYSE Arca under the ticker symbol SDOG. The Fund generally will invest in all of the securities that comprise the Underlying Index in proportion to their weightings in the Underlying Index.
The Underlying Index is a rules based index intended to give investors a means of tracking the overall performance of the highest dividend paying stocks (i.e. “Dividend Dogs”) in the S&P 500® Total Return Index (“SPX”) on a sector-by-sector basis. “Dividend Dogs” refers to the five stocks in each of the ten Global Industry Classification Standard (“GICS”) sectors that make up the S&P 500® Total Return Index which offer the highest dividend yields.
Performance Overview
The Fund, for the twelve month period ended November 30, 2018, generated a total return of 0.51%, in-line with the Fund’s Underlying Index, net of fees, which returned 0.91%. The Fund underperformed the S&P 500® Total Return Index, which returned 6.27% for the same period.
The trailing twelve month yield for the Fund’s underlying constituents as of November 30, 2018 was 4.30% vs. 1.94% for the S&P 500® Total Return Index.
The S&P 500 Total Return Index ended November 30, 2018 up 6.27%, after an October sell-off caused the U.S. broad-based benchmark to give back most of the year’s gains. This is after hitting its all-time high on September 20, 2018, ending that month up 11.78% from November 30, 2017. The year started with a boost from corporate tax cuts, positive macro data, and strong corporate earnings and stock buybacks. After a market correction between February and March as interest rates spiked, the market rebounded throughout most of Q2 and Q3. Higher inflationary outlooks continued to drive interest rates to highs last seen in 2011, and an escalating U.S. – China trade war sent the market into a tailspin in October, down almost 8% for the month amid heightened volatility. From the Federal Open Market Committee perspective, the U.S. economy saw 3 rate hikes in 2018, leading many investors to question whether the fed funds rate was being raised too quickly as the housing market weakened throughout the year. At the end of November 30, 2018, crude oil had fallen from its highs amid record production by the U.S. and OPEC. Despite the pull back in the equity markets, Q3 corporate earnings were largely positive, however, the U.S. – China trade war started to affect 2019 earnings estimates even with a quasi “trade truce” announced by the U.S. and China.
Compared to the S&P 500® Total Return Index, the Fund saw a negative impact (-1.81%) from sector allocation effect for the period. This was largely driven by relative over-weighting in Materials (average weight for the period of 10.24% vs. 2.73% in SPX) and relative under-weight in Information Technology (average weight for the period of 10.32% vs. 20.01% in SPX); a result of the equal sector weight strategy. The Fund also saw a negative impact (-3.29%) from selection effect, as the constituents in Financials, Industrials, and Information Technology underperformed. The Fund’s Energy names exhibited the strongest positive contribution to overall selection effect for the period.
The best performing stocks in the Fund for the period were Eli Lilly & Co. (LLY), which increased 53.37% and Macy’s, Inc. (M), which saw a gain of 50.92%. AES Corp. (AES), which rose 49.31%, and Merck & Co. Inc. (MRK), which climbed 48.20%, were other top performers. The largest detractors were General Electric Co. (GE), which decreased 57.60%, Invesco Ltd. (IVZ), which fell 41.10%, and L Brands, Inc. (LB), which lost 38.82%.
Looking forward we believe the Fund’s strategy of annually selecting the five highest yielding securities in each of the ten sectors (excluding Real Estate) in the S&P 500® Total Return Index will provide meaningfully higher yield relative to the S&P 500® Total Return Index, potential for market participation in all economic cycles through equal sector weighting, and a deep value portfolio of securities as identified through high yield relative to their sector peers.
Performance(as of November 30, 2018)
| | 1 Year | 3 Year | 5 Year | Since Inception^ |
| ALPS Sector Dividend Dogs ETF – NAV | 0.51% | 10.67% | 9.31% | 13.21% |
| ALPS Sector Dividend Dogs ETF – Market Price* | 0.46% | 10.63% | 9.29% | 13.21% |
| S-Network® Sector Dividend Dogs Total Return Index | 0.91% | 11.20% | 9.82% | 13.75% |
| S&P 500® Total Return Index | 6.27% | 12.16% | 11.12% | 13.99% |
Total Expense Ratio (per the current prospectus) 0.40%.
Performance data quoted represents past performance. Past performance does not guarantee future results. The table does not reflect the deduction of taxes that a shareholder would pay on Fund distributions or the redemption of Fund shares. Investment return and principal value of an investment will fluctuate so that an investor’s shares, when sold or redeemed, may be worth more or less than the original cost. Current performance data may be higher or lower than actual data quoted. For the most current month-end performance data please visit www.alpsfunds.com or call 1.866.675.2639.
ALPS Sector Dividend Dogs ETF
| Performance Overview | November 30, 2018 (Unaudited) |
NAV is an exchange-traded fund’s per-share value. The per-share dollar amount of the Fund is derived by dividing the total value of all the securities in its portfolio, less any liabilities, by the number of Fund shares outstanding. Market Price is the price at which a share can currently be traded in the market. Information detailing the number of days the Market Price of the Fund was greater than the Fund’s NAV and the number of days it was less than the Fund’s NAV can be obtained at www.alpsfunds.com.
| ^ | The Fund Commencement Date was June 29, 2012. |
| * | Market Price is based on the midpoint of the bid-ask spread at 4 p.m. ET and does not represent the returns an investor would receive if shares were traded at other times. |
The S-Network®Sector Dividend Dogs Total Return Index is designed to serve as a fair, impartial and transparent measure of the performance of US large cap equities with above average dividend yields. The Underlying Index is a portfolio of fifty stocks derived from the S&P 500® Index. The index is reported on a total return basis, which assumes reinvestment of any dividends and distributions realized during a given time period.
The S&P 500® Total Return Index is an index of 500 stocks chosen for market size, liquidity and industry grouping among other factors. Total return assumes reinvestment of any dividends and distributions realized during a given time period.
The indexes are not actively managed and do not reflect any deductions for fees, expenses or taxes. One cannot invest directly in an index. Index performance does not reflect fund performance.
The Fund’s shares are not individually redeemable. Investors buy and sell shares of the Fund on a secondary market. Only market makers or “authorized participants” may trade directly with the Fund, typically in blocks of 50,000 shares.
The ALPS Sector Dividend Dogs ETF is not suitable for all investors. Investments in the Fund are subject to investment risks, including possible loss of the principal amount invested.
ALPS Portfolio Solutions Distributor, Inc., a FINRA member, is the distributor for the ETF.
ALPS Sector Dividend Dogs ETF
| Performance Overview | November 30, 2018 (Unaudited) |
Top 10 Holdings*(as of November 30, 2018)
| SCANA Corp. | 2.88% |
| AES Corp. | 2.50% |
| L Brands, Inc. | 2.48% |
| Merck & Co., Inc. | 2.48% |
| Eli Lilly & Co. | 2.46% |
| Verizon Communications, Inc. | 2.41% |
| Coca-Cola Co. | 2.40% |
| Philip Morris International, Inc. | 2.38% |
| Southern Co. | 2.36% |
| Pfizer, Inc. | 2.34% |
| Total % of Top 10 Holdings | 24.69% |
Sector Allocation*(as of November 30, 2018)
| Utilities | 12.13% |
| Health Care | 11.73% |
| Consumer Staples | 10.62% |
| Consumer Discretionary | 10.29% |
| Energy | 10.08% |
| Financials | 10.07% |
| Information Technology | 9.75% |
| Materials | 9.54% |
| Industrials | 9.39% |
| Communication Services | 6.22% |
| Money Market Fund | 0.18% |
| Total | 100.00% |
Future holdings are subject to change.
Growth of $10,000(as of November 30, 2018)
Comparison of Change in Value of $10,000 Investment in the Fund and the Indexes
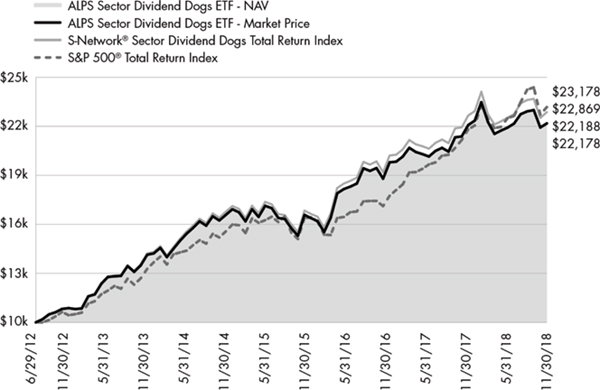
The chart above represents historical performance of a hypothetical investment of $10,000 in the Fund over the life of the Fund. Past performance does not guarantee future results. This chart does not reflect the deduction of taxes that a shareholder would pay on Fund distributions or the redemption of Fund shares.
ALPS International Sector Dividend Dogs ETF
| Performance Overview | November 30, 2018 (Unaudited) |
Investment Objective
The ALPS International Sector Dividend Dogs ETF (the “Fund”) seeks investment results that replicate as closely as possible, before fees and expenses, the performance of the S-Network® International Sector Dividend Dogs Net Total Return Index (the “Underlying Index”). The Shares of the Fund are listed and trade on the NYSE Arca under the ticker symbol IDOG. The Fund generally will invest in all of the securities that comprise the Underlying Index in proportion to their weightings in the Underlying Index.
The Underlying Index is a rules-based index intended to give investors a means of tracking the overall performance of the highest dividend paying stocks (i.e. “Dividend Dogs”) in the S-Net International Developed Markets (ex-Americas) Index, a universe of mainly large capitalization stocks in international developed markets not located in the Americas (the “S-Net Developed Markets”) on a sector-by-sector basis. “Dividend Dogs” refers to the five stocks in each of the ten Global Industry Classification Standard (“GICS”) sectors that make up the S-Net Developed Markets which offer the highest dividend yields.
Performance Overview
The Fund, for the one year period ended November 30, 2018, generated a total return of -7.47%, relatively in-line with the Fund’s Net Total Return Index, net of fees, which returned -7.25%. The Fund outperformed the MSCI EAFE® Index (MXEA) which returned -7.94% for the same period.
The trailing twelve month yield for the Fund’s constituents as of November 30, 2018 was 5.56% vs. 3.48% on the MSCI EAFE®Index.
From a macroeconomic perspective, developed markets (ex-U.S.) generally saw a negative decline in equity prices. In the Eurozone, the European Central Bank (ECB) started 2018 by lowering its bond buying program to 30 billion euros a month from 60 billion euros a month in the previous year. The program is expected to end in December of 2018. Consequently, the end of the massive stimulus program partly contributed to downward revisions of economic growth in the region. In addition, persistent negative factors related to geopolitical tensions and threats of protectionism added to developed market volatility. Country-specific related events in the U.K., Italy, France, and Australia partly contributed to the overall negative sentiment in the developed markets, as well as an increase in the consumption tax in Japan that created fears of an economic slowdown. Equity markets among other developed markets (ex-U.S.) finished the year with flat or negative returns, following fears regarding the trajectory of US interest rates and trade tariffs.
Compared to the MSCI EAFE® Index, the Fund saw a moderately positive impact (+1.37%) from sector allocation which was largely driven by the relative underweight allocation in Financials (average weight for the period of 9.67% vs. 20.51% in MXEA), a result of the equal sector weighting strategy. The Fund’s relative overweight to the Information Technology sector (average weight for the period of 9.78% vs. 6.04% in MXEA) detracted from performance. The Fund also saw relative outperformance (+0.56%) attributed to selection effect.
From a geographical perspective, the highest contribution to return was attributed by holdings based in Sweden. The Fund’s performance was adversely impacted by holdings based in Japan. Overall, currency effect lowered the overall performance of the Fund by roughly -1.05%.
The best performing stocks for the period were Telefonaktiebolaget LM Ericsson, Class B (ERICB SS), which increased 35.57% and GlaxoSmithKline PLC (GSK LN), which rose 26.06%. The worst performing stocks were AMP Ltd. (AMP AU), which decreased 51.14% and Pandora A/S (PNDORA DC), which fell 43.01%.
Looking forward, we believe the Fund’s strategy of annually selecting the five highest yielding securities in each of the ten sectors in the S-Network Developed Markets (Ex N.A.) Index will provide high yield relative to the MSCI EAFE® Index, potential for market participation in all economic cycles through equal sector weighting, and a deep value portfolio of securities as identified through high yield relative to their sector peers.
Performance(as of November 30, 2018)
| | 1 Year | 3 Year | 5 Year | Since Inception^ |
| ALPS International Sector Dividend Dogs ETF – NAV | -7.47% | 5.18% | 0.91% | 3.91% |
| ALPS International Sector Dividend Dogs ETF – Market Price* | -7.82% | 5.28% | 0.84% | 3.93% |
| S-Network® International Sector Dividend Dogs Net Total Return Index | -7.25% | 5.57% | 1.29% | 4.30% |
| MSCI EAFE® Index | -7.94% | 4.12% | 1.84% | 4.57% |
Total Expense Ratio (per the current prospectus) 0.50%.
Performance data quoted represents past performance. Past performance does not guarantee future results. The table does not reflect the deduction of taxes that a shareholder would pay on Fund distributions or the redemption of Fund shares. Investment return and principal value of an investment will fluctuate so that an investor’s shares, when sold or redeemed, may be worth more or less than the original cost. Current performance data may be higher or lower than actual data quoted. For the most current month-end performance data please visit www.alpsfunds.com or call 1.866.675.2639.
ALPS International Sector Dividend Dogs ETF
| Performance Overview | November 30, 2018 (Unaudited) |
NAV is an exchange-traded fund’s per-share value. The per-share dollar amount of the Fund is derived by dividing the total value of all the securities in its portfolio, less any liabilities, by the number of Fund shares outstanding. Market Price is the price at which a share can currently be traded in the market. Information detailing the number of days the Market Price of the Fund was greater than the Fund’s NAV and the number of days it was less than the Fund’s NAV can be obtained at www.alpsfunds.com.
| ^ | The Fund Commencement Date was June 28, 2013. |
| * | Market Price is based on the midpoint of the bid-ask spread at 4 p.m. ET and does not represent the returns an investor would receive if shares were traded at other times. |
The S-Network®International Sector Dividend Dogs Net Total Return Index is designed to serve as a fair, impartial and transparent measure of the performance of international large cap equities with above average dividend yields. The Underlying Index is a portfolio of fifty stocks derived from the S-Net International Developed Markets Index (ex-Americas) Index. Total Return assumes reinvestment of any dividends and distributions realized during a given time period. Net Total Return (NTR) is obtained by reinvesting the net dividend, which is equal to the ordinary gross dividend minus the amount of withholding tax.
MSCI EAFE®Index is a stock market index that is designed to measure the equity market performance of developed markets outside of the U.S. & Canada.
The indexes are not actively managed and do not reflect any deductions for fees, expenses or taxes. One cannot invest directly in an index. Index performance does not reflect fund performance.
The Fund’s shares are not individually redeemable. Investors buy and sell shares of the Fund on a secondary market. Only market makers or “authorized participants” may trade directly with the Fund, typically in blocks of 50,000 shares.
The ALPS International Sector Dividend Dogs ETF is not suitable for all investors. Investments in the Fund are subject to investment risks, including possible loss of the principal amount invested.
ALPS Portfolio Solutions Distributor, Inc., a FINRA member, is the distributor for the ETF.
| ALPS International Sector Dividend Dogs ETF | |
| Performance Overview | November 30, 2018 (Unaudited) |
Top 10 Holdings*(as of November 30, 2018)
| Hennes & Mauritz AB, Class B | 2.82% |
| Proximus SADP | 2.41% |
| Micro Focus International PLC | 2.39% |
| Fortescue Metals Group, Ltd. | 2.33% |
| Woolworths Group, Ltd. | 2.25% |
| GlaxoSmithKline PLC | 2.22% |
| AstraZeneca PLC | 2.21% |
| Roche Holding AG | 2.20% |
| Sanofi | 2.14% |
| Rio Tinto, Ltd. | 2.14% |
| Total % of Top 10 Holdings | 23.11% |
Future holdings are subject to change.
Sector Allocation*(as of November 30, 2018)
| Consumer Discretionary | 12.18% |
| Health Care | 10.60% |
| Communication Services | 10.59% |
| Information Technology | 10.40% |
| Industrials | 9.99% |
| Utilities | 9.77% |
| Materials | 9.50% |
| Financials | 9.33% |
| Energy | 9.33% |
| Consumer Staples | 8.08% |
| Money Market Fund | 0.23% |
| Total | 100.00% |
Growth of $10,000(as of November 30, 2018)
Comparison of Change in Value of $10,000 Investment in the Fund and the Indexes
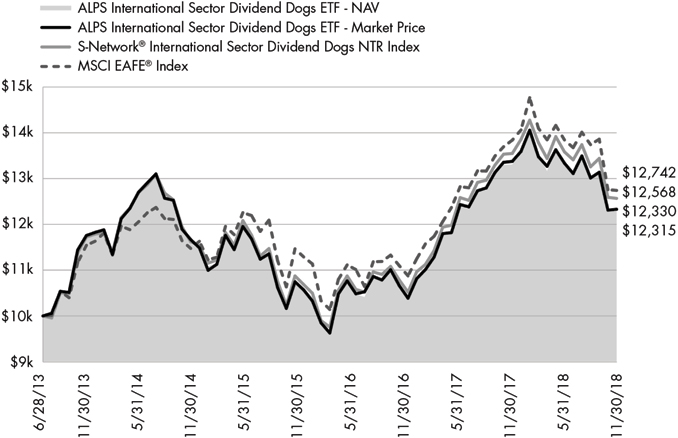
The chart above represents historical performance of a hypothetical investment of $10,000 in the Fund over the life of the Fund. Past performance does not guarantee future results. This chart does not reflect the deduction of taxes that a shareholder would pay on Fund distributions or the redemption of Fund shares.
| ALPS Emerging Sector Dividend Dogs ETF | |
| Performance Overview | November 30, 2018 (Unaudited) |
Investment Objective
The ALPS Emerging Sector Dividend Dogs ETF (the “Fund”) seeks investment results that replicate as closely as possible, before fees and expenses, the performance of the S-Network® Emerging Sector Dividend Dogs Net Total Return Index (the “Underlying Index”). The Shares of the Fund are listed and trade on the NYSE Arca under the ticker symbol EDOG. The Fund generally will invest in all of the securities that comprise the Underlying Index in proportion to their weightings in the Underlying Index.
The Underlying Index is a rules-based index intended to give investors a means of tracking the overall performance of the highest dividend paying stocks (i.e. “Dividend Dogs”) in the S-Network® Emerging Markets Index, a universe of mainly large capitalization stocks domiciled in emerging markets (the “S-Network Emerging Markets”) on a sector-by-sector basis. “Dividend Dogs” refers to the five stocks in each of the ten Global Industry Classification Standard (“GICS”) sectors that make up the S-Network®Emerging Markets which offer the highest dividend yields. Emerging market countries are countries that major international financial institutions, such as the World Bank, generally consider to be less economically mature than developed nations.
Performance Overview
The Fund, for the one year period ended November 30, 2018, generated a total return of -8.76%, relatively in-line with the Fund’s Net Total Return Index, net of fees, which returned -8.13%. The Fund outperformed the MSCI Emerging Markets Net Total Return Index®, which returned -9.09% for the same period.
The trailing twelve month yield for the Fund’s constituents as of November 30, 2018 was 5.51% vs. 2.91% on the MSCI Emerging Markets Net Total Return Index®.
From a macroeconomic perspective, investors retreated from emerging markets as risk appetite faltered with the U.S. – China trade war. Declines in emerging market equities prices were broadly driven by weakening local economies, a strong U.S. dollar, and trade tensions between the U.S. and China. In China, the decline in equity prices was partly driven by the $250 billion worth of tariffs that the U.S. had placed on Chinese imports. Although tariffs have yet to substantiate into explicit economic impacts, they have implicitly impacted the sentiment of China’s future economic outlook with capital outflows ensuing. Tech-heavy countries, South Korea and Taiwan, were also weak after global sales of mobile phones came in weaker than expected. Brazilian equities, on the other hand, have been one of the best performing emerging markets year-to-date. The decision by Brazilian legislators to uphold the criminal conviction of former President Luiz Inacio Lula Da affirmed investors’ confidence that the country’s governmental reform was trending in the right direction. GDP growth forecasts have been revised upward as presidential candidate, Jair Bolsonaro, was recently elected President. Bolsonaro’s administration aims to take a market-friendly and sustainable approach to economic policies.
Compared to the MSCI Emerging Markets Net Total Return Index®, the Fund saw a positive impact (2.47%) from sector allocation effect which was largely driven by the relative overweight in Energy (average weight for the period of 10.02% vs. 7.43% in MSCI Emerging Markets Net Total Return Index®) and a relative underweight to Consumer Discretionary over the one year period (average weight for the period of 7.60% vs. 11.01% in MSCI Emerging Markets Net Total Return Index®), a result of the equal sector weighting strategy. The Fund also saw a negative impact (-0.06%) due to selection effect, as the names in Energy and Communication Services were leading detractors, while constituents in Utilities and Information Technology propped up Fund performance.
From a geographical perspective, the highest contribution to return was attributed by holdings based in South Africa. The Fund’s performance was adversely impacted by holdings based in Turkey. Overall, currency effect lowered the overall performance of the fund by roughly -1.16%.
The best performing stocks for the period were Lukoil PJSC (LKOD LI), which increased 39.79%, Lenovo Group Ltd. (992 HK), which returned 35.06%, and Infosys Ltd. - ADR (INFY), which rose 31.20%. The worst performing stocks were Cielo SA (CIEL3 BZ), which lost 62.28%, Astro Malaysia Holdings Bhd (ASTRO MK), which fell 55.96%; and Great Wall Motor Co., Ltd (2333 HK), which decreased 42.57%.
Looking forward we believe the Fund’s strategy of annually selecting the five highest yielding securities in each of the ten sectors in the S-Net Emerging Markets Index will provide high yield relative to the MSCI Emerging Markets Net Total Return Index®, potential for market participation in all economic cycles through equal sector weighting, and a deep value portfolio of securities as identified through high yield relative to their sector peers.
Performance(as of November 30, 2018)
| | 1 Year | 3 Year | Since Inception^ |
| ALPS Emerging Sector Dividend Dogs ETF – NAV | -8.76% | 4.32% | 0.12% |
| ALPS Emerging Sector Dividend Dogs ETF – Market Price* | -9.39% | 4.25% | 0.06% |
| S-Network®Emerging Sector Dividend Dogs Net Total Return Index | -8.13% | 5.13% | 0.97% |
| MSCI Emerging Markets Net Total Return Index® | -9.09% | 9.41% | 2.88% |
| ALPS Emerging Sector Dividend Dogs ETF | |
| Performance Overview | November 30, 2018 (Unaudited) |
Total Expense Ratio (per the current prospectus) 0.60%.
Performance data quoted represents past performance. Past performance does not guarantee future results. The table does not reflect the deduction of taxes that a shareholder would pay on Fund distributions or the redemption of Fund shares. Investment return and principal value of an investment will fluctuate so that an investor’s shares, when sold or redeemed, may be worth more or less than the original cost. Current performance data may be higher or lower than actual data quoted. For the most current month-end performance data please visit www.alpsfunds.com or call 1.866.675.2639.
NAV is an exchange-traded fund’s per-share value. The per-share dollar amount of the Fund is derived by dividing the total value of all the securities in its portfolio, less any liabilities, by the number of Fund shares outstanding. Market Price is the price at which a share can currently be traded in the market. Information detailing the number of days the Market Price of the Fund was greater than the Fund’s NAV and the number of days it was less than the Fund’s NAV can be obtained at www.alpsfunds.com.
| ^ | The Fund Commencement Date was March 28, 2014. |
| * | Market Price is based on the midpoint of the bid-ask spread at 4 p.m. ET and does not represent the returns an investor would receive if shares were traded at other times. |
The S-Network® Emerging Sector Dividend Dogs Index is a portfolio of stocks derived from a universe of mainly large capitalization stocks domiciled in emerging markets (the “S-Network Emerging Markets Index” “SNEMX”). The index methodology selects the five stocks in each of the ten GICS sectors that make up the universe which offer the highest dividend yields as of the last trading day of November. The fifty stocks that are selected for inclusion in the portfolio are equally weighted. The universe includes stocks whose domicile and primary exchange listings are in countries identified by the World Bank as Upper Middle Income (certain lower middle income countries are also included, as well as stocks traded on the Taiwan Stock Exchange despite non-recognition by the World Bank). The selection criteria for the universe, in addition to the aforementioned country qualifications, also include requirements for sector inclusion, primary exchange listing, minimum market capitalization, share price, average daily trading volume and other factors. Total Return assumes reinvestment of any dividends and distributions realized during a given time period. Net Total Return (NTR) is obtained by reinvesting the net dividend, which is equal to the ordinary gross dividend minus the amount of withholding tax.
The MSCI Emerging Markets Net Total Return Index® is a free float-adjusted market capitalization index that is designed to measure equity market performance in the global emerging markets.
The indexes are not actively managed and do not reflect any deductions for fees, expenses or taxes. One cannot invest directly in an index. Index performance does not reflect fund performance.
The Fund’s shares are not individually redeemable. Investors buy and sell shares of the Fund on a secondary market. Only market makers or “authorized participants” may trade directly with the Fund, typically in blocks of 50,000 shares.
The ALPS Emerging Sector Dividend Dogs ETF is not suitable for all investors. Investments in the Fund are subject to investment risks, including possible loss of the principal amount invested.
ALPS Portfolio Solutions Distributor, Inc., a FINRA member, is the distributor for the ETF.
| ALPS Emerging Sector Dividend Dogs ETF | |
| Performance Overview | November 30, 2018 (Unaudited) |
Top 10 Holdings*(as of November 30, 2018)
| CCR SA | 3.14% |
| BB Seguridade Participacoes SA | 2.55% |
| Turkcell Iletisim Hizmetleri AS, ADR | 2.52% |
| Engie Brasil Energia SA | 2.51% |
| Kalbe Farma Tbk PT | 2.49% |
| Astra International Tbk PT | 2.38% |
| Woolworths Holdings, Ltd. | 2.29% |
| Indocement Tunggal Prakarsa Tbk PT | 2.26% |
| COSCO SHIPPING Energy Transportation Co., Ltd. | 2.18% |
| Gudang Garam Tbk PT | 2.18% |
| Total % of Top 10 Holdings | 24.50% |
| * | % of Total Investments (excluding investments purchased with collateral from securities loaned). |
Future holdings are subject to change.
Sector Allocation*(as of November 30, 2018)
| Industrials | 11.43% |
| Communication Services | 10.87% |
| Health Care | 10.70% |
| Utilities | 10.07% |
| Financials | 10.06% |
| Energy | 9.85% |
| Consumer Staples | 9.66% |
| Information Technology | 9.24% |
| Consumer Discretionary | 8.87% |
| Materials | 8.86% |
| Money Market Fund | 0.39% |
| Total | 100.00% |
Growth of $10,000(as of November 30, 2018)
Comparison of Change in Value of $10,000 Investment in the Fund and the Indexes
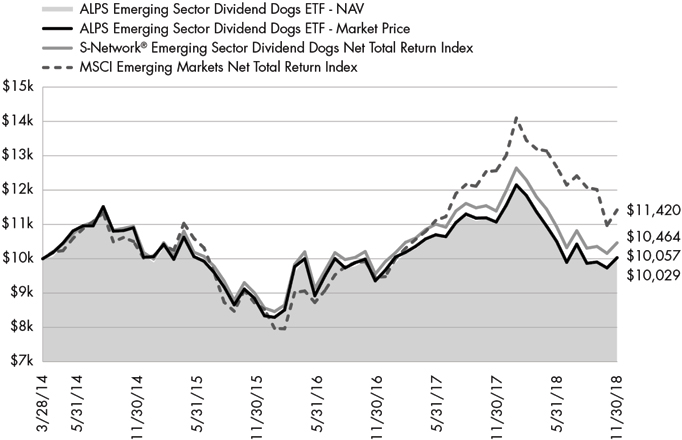
The chart above represents historical performance of a hypothetical investment of $10,000 in the Fund over the life of the Fund. Past performance does not guarantee future results. This chart does not reflect the deduction of taxes that a shareholder would pay on Fund distributions or the redemption of Fund shares.
| Disclosure of Fund Expenses | November 30, 2018 (Unaudited) |
Shareholder Expense Example:As a shareholder of a Fund, you incur two types of costs: (1) transaction costs which may include creation and redemption fees or brokerage charges, and (2) ongoing costs, including management fees and other Fund expenses. These examples are intended to help you understand your ongoing costs (in dollars) of investing in the Fund and to compare these costs with the ongoing costs of investing in other funds. It is based on an investment of $1,000 invested at the beginning of the (six month) period and held through November 30, 2018.
Actual Return:The first line of the table provides information about actual account values and actual expenses. You may use the information in this line, together with the amount you invested, to estimate the expenses that you incurred over the period. Simply divide your account value by $1,000 (for example, an $8,600 account value divided by $1,000 = 8.6), then multiply the result by the number in the first line under the heading entitled “Expenses Paid During Period” to estimate the expenses attributable to your investment during this period.
Hypothetical 5% Return:The second line of the table provides information about hypothetical account values and hypothetical expenses based on the Fund’s actual expense ratio and an assumed rate of return of 5% per year before expenses, which is not the Fund’s actual return. The hypothetical account values and expenses may not be used to estimate the actual ending account balance or expenses you paid for the period. You may use this information to compare ongoing costs of investing in the Fund and other funds. To do so, compare this 5% hypothetical example with the 5% hypothetical examples that appear in the shareholder reports of other funds.
The expenses shown in the table are meant to highlight ongoing Fund costs only and do not reflect any transaction costs, such as creation and redemption fees or brokerage charges. Therefore, the second line is useful in comparing ongoing costs only, and will not help you determine the relative total costs of owning different funds. In addition, if these costs were included, your costs would have been higher.
| | Beginning Account Value 6/1/18 | Ending Account Value 11/30/18 | Expense Ratio(a) | Expenses Paid During Period 6/1/18 - 11/30/18(b) |
| ALPS Sector Dividend Dogs ETF | | | | |
| Actual | $1,000.00 | $1,013.10 | 0.40% | $2.02 |
| Hypothetical (5% return before expenses) | $1,000.00 | $1,023.06 | 0.40% | $2.03 |
| | | | | |
| ALPS International Sector Dividend Dogs ETF | | | | |
| Actual | $1,000.00 | $923.50 | 0.50% | $2.41 |
| Hypothetical (5% return before expenses) | $1,000.00 | $1,022.56 | 0.50% | $2.54 |
| | | | | |
| ALPS Emerging Sector Dividend Dogs ETF | | | | |
| Actual | $1,000.00 | $954.40 | 0.60% | $2.94 |
| Hypothetical (5% return before expenses) | $1,000.00 | $1,022.06 | 0.60% | $3.04 |
| (a) | Annualized based on the Fund's most recent half-year expenses. |
| (b) | Expenses are equal to the Fund's annualized expense ratio multiplied by the average account value over the period, multiplied by the number of days in the most recent fiscal half year (183), divided by 365. |
| Report of Independent Registered Public Accounting Firm | |
To the shareholders and the Board of Trustees of ALPS ETF Trust:
Opinion on the Financial Statements and Financial Highlights
We have audited the accompanying statements of assets and liabilities, including the schedules of investments, of ALPS Sector Dividend Dogs ETF, ALPS International Sector Dividend Dogs ETF and ALPS Emerging Sector Dividend Dogs ETF (the “Funds”), three of the funds constituting the ALPS ETF Trust, as of November 30, 2018, the related statements of operations for the year then ended, the statements of changes in net assets for each of the two years in the period then ended, the financial highlights for each of the five years in the period then ended for ALPS Sector Dividend Dogs ETF and ALPS International Sector Dividend Dogs ETF; the related statement of operations for the year then ended, the statements of changes in net assets for each of the two years in the period then ended, the financial highlights for the years ended November 30, 2018, 2017, 2016, 2015 and for the period March 28, 2014 (commencement of operations) to November 30, 2014, for ALPS Emerging Sector Dividend Dogs ETF; and the related notes.
In our opinion, the financial statements and financial highlights present fairly, in all material respects, the financial position of ALPS Sector Dividend Dogs ETF and ALPS International Sector Dividend Dogs ETF as of November 30, 2018, and the results of their operations for the year then ended, the changes in their net assets for each of the two years in the period then ended, and the financial highlights for each of the five years in the period then ended, in conformity with accounting principles generally accepted in the United States of America. Also, in our opinion, the financial statements and financial highlights present fairly, in all material respects, the financial position of ALPS Emerging Sector Dividend Dogs ETF as of November 30, 2018, the results of its operations for the year then ended, the changes in its net assets for each of the two years in the period then ended, and the financial highlights for the years ended November 30, 2018, 2017, 2016, 2015 and for the period March 28, 2014 (commencement of operations) to November 30, 2014, in conformity with accounting principles generally accepted in the United States of America.
Basis for Opinion
These financial statements and financial highlights are the responsibility of the Funds’ management. Our responsibility is to express an opinion on the Funds’ financial statements and financial highlights based on our audits. We are a public accounting firm registered with the Public Company Accounting Oversight Board (United States) (PCAOB) and are required to be independent with respect to the Funds in accordance with the U.S. federal securities laws and the applicable rules and regulations of the Securities and Exchange Commission and the PCAOB.
We conducted our audits in accordance with the standards of the PCAOB. Those standards require that we plan and perform the audit to obtain reasonable assurance about whether the financial statements and financial highlights are free of material misstatement, whether due to error or fraud. The Funds are not required to have, nor were we engaged to perform, an audit of their internal control over financial reporting. As part of our audits we are required to obtain an understanding of internal control over financial reporting but not for the purpose of expressing an opinion on the effectiveness of the Funds’ internal control over financial reporting. Accordingly, we express no such opinion.
Our audits included performing procedures to assess the risks of material misstatement of the financial statements and financial highlights, whether due to error or fraud, and performing procedures that respond to those risks. Such procedures included examining, on a test basis, evidence regarding the amounts and disclosures in the financial statements and financial highlights. Our audits also included evaluating the accounting principles used and significant estimates made by management, as well as evaluating the overall presentation of the financial statements and financial highlights. Our procedures included confirmation of securities owned as of November 30, 2018, by correspondence with the custodian and brokers; when replies were not received from brokers, we performed other auditing procedures. We believe that our audits provide a reasonable basis for our opinion.
DELOITTE & TOUCHE LLP
Denver, Colorado
January 24, 2019
We have served as the auditor of one or more investment companies advised by ALPS Advisors, Inc. since 2007.
ALPS Sector Dividend Dogs ETF
| Schedule of Investments | November 30, 2018 |
| Security Description | | Shares | | | Value | |
| COMMON STOCKS (99.53%) | | | | | | | | |
| Communication Services (6.20%) | | | | | | | | |
| AT&T, Inc. | | | 1,397,230 | | | $ | 43,649,465 | |
| CenturyLink, Inc. | | | 2,064,523 | | | | 38,813,032 | |
| Verizon Communications, Inc. | | | 862,213 | | | | 51,991,444 | |
| Total Communication Services | | | | | | | 134,453,941 | |
| | | | | | | | | |
| Consumer Discretionary (10.26%) | | | | | | | | |
| Ford Motor Co. | | | 4,966,844 | | | | 46,738,002 | |
| Kohl's Corp. | | | 584,809 | | | | 39,281,621 | |
| L Brands, Inc. | | | 1,620,163 | | | | 53,643,597 | |
| Macy's, Inc. | | | 1,303,234 | | | | 44,596,667 | |
| Target Corp. | | | 535,597 | | | | 38,005,963 | |
| Total Consumer Discretionary | | | | | | | 222,265,850 | |
| | | | | | | | | |
| Consumer Staples (10.59%) | | | | | | | | |
| Altria Group, Inc. | | | 757,919 | | | | 41,556,698 | |
| Archer-Daniels-Midland Co. | | | 937,889 | | | | 43,161,652 | |
| Coca-Cola Co. | | | 1,027,492 | | | | 51,785,597 | |
| General Mills, Inc. | | | 982,780 | | | | 41,581,422 | |
| Philip Morris International, Inc. | | | 593,528 | | | | 51,357,978 | |
| Total Consumer Staples | | | | | | | 229,443,347 | |
| | | | | | | | | |
| Energy (10.05%) | | | | | | | | |
| Exxon Mobil Corp. | | | 567,856 | | | | 45,144,552 | |
| Helmerich & Payne, Inc. | | | 720,546 | | | | 43,665,088 | |
| Occidental Petroleum Corp. | | | 609,222 | | | | 42,810,030 | |
| ONEOK, Inc. | | | 708,843 | | | | 43,544,225 | |
| Williams Cos., Inc. | | | 1,682,956 | | | | 42,612,446 | |
| Total Energy | | | | | | | 217,776,341 | |
| | | | | | | | | |
| Financials (10.04%) | | | | | | | | |
| Invesco, Ltd. | | | 1,976,008 | | | | 40,211,763 | |
| MetLife, Inc. | | | 1,008,459 | | | | 45,007,525 | |
| People's United Financial, Inc. | | | 2,656,590 | | | | 44,790,107 | |
| Principal Financial Group, Inc. | | | 830,297 | | | | 40,950,248 | |
| Wells Fargo & Co. | | | 857,585 | | | | 46,549,714 | |
| Total Financials | | | | | | | 217,509,357 | |
| | | | | | | | | |
| Health Care (11.69%) | | | | | | | | |
| Cardinal Health, Inc. | | | 906,765 | | | | 49,717,925 | |
| Eli Lilly & Co. | | | 447,739 | | | | 53,119,755 | |
| Gilead Sciences, Inc. | | | 644,074 | | | | 46,334,683 | |
| Merck & Co., Inc. | | | 675,199 | | | | 53,570,289 | |
| Pfizer, Inc. | | | 1,095,287 | | | | 50,635,118 | |
| Total Health Care | | | | | | | 253,377,770 | |
| | | | | | | | | |
| Industrials (9.36%) | | | | | | | | |
| Eaton Corp. PLC | | | 543,591 | | | | 41,823,892 | |
| Emerson Electric Co. | | | 609,275 | | | | 41,138,248 | |
| General Electric Co. | | | 3,710,163 | | | | 27,826,222 | |
| Nielsen Holdings PLC | | | 1,720,850 | | | | 46,755,495 | |
| Security Description | | Shares | | | Value | |
| Industrials (continued) | | | | | | | | |
| United Parcel Service, Inc., Class B | | | 393,156 | | | $ | 45,326,955 | |
| Total Industrials | | | | | | | 202,870,812 | |
| | | | | | | | | |
| Information Technology (9.72%) | | | | | | | | |
| International Business Machines Corp. | | | 316,496 | | | | 39,330,958 | |
| QUALCOMM, Inc. | | | 629,718 | | | | 36,687,371 | |
| Seagate Technology PLC | | | 978,864 | | | | 42,179,250 | |
| Western Union Co. | | | 2,511,620 | | | | 47,042,642 | |
| Xerox Corp. | | | 1,683,890 | | | | 45,330,319 | |
| Total Information Technology | | | | | | | 210,570,540 | |
| | | | | | | | | |
| Materials (9.52%) | | | | | | | | |
| CF Industries Holdings, Inc. | | | 917,796 | | | | 38,721,813 | |
| International Paper Co. | | | 887,447 | | | | 40,991,177 | |
| LyondellBasell Industries NV, Class A | | | 445,553 | | | | 41,574,551 | |
| Nucor Corp. | | | 749,892 | | | | 45,300,976 | |
| Westrock Co. | | | 840,666 | | | | 39,603,775 | |
| Total Materials | | | | | | | 206,192,292 | |
| | | | | | | | | |
| Utilities (12.10%) | | | | | | | | |
| AES Corp. | | | 3,483,701 | | | | 53,962,528 | |
| FirstEnergy Corp. | | | 1,243,538 | | | | 47,043,042 | |
| PPL Corp. | | | 1,567,032 | | | | 47,935,509 | |
| SCANA Corp. | | | 1,331,842 | | | | 62,143,748 | |
| Southern Co. | | | 1,078,111 | | | | 51,026,994 | |
| Total Utilities | | | | | | | 262,111,821 | |
| | | | | | | | | |
| TOTAL COMMON STOCKS | | | | | | | | |
| (Cost $2,168,691,573) | | | | | | | 2,156,572,071 | |
| | | | | | | | | | |
| | | 7 Day Yield | | | Shares | | | Value | |
| SHORT TERM INVESTMENTS (0.18%) | | |
| Money Market Fund | | | | | | | | | | | | |
| State Street Institutional Treasury Plus Money Market Fund | | | 2.146 | % | | | 3,899,464 | | | | 3,899,464 | |
| TOTAL SHORT TERM INVESTMENTS | | |
| (Cost $3,899,464) | | | | | | | | | | | 3,899,464 | |
| | | | | | | | | | | | | |
| TOTAL INVESTMENTS (99.71%) | | | |
| (Cost $2,172,591,037) | | | | | | | | | | $ | 2,160,471,535 | |
| OTHER ASSETS IN EXCESS OF LIABILITIES (0.29%) | | | 6,236,973 | |
| NET ASSETS - 100.00% | | $ | 2,166,708,508 | |
See Notes to Financial Statements.
ALPS International Sector Dividend Dogs ETF
| Schedule of Investments | November 30, 2018 |
| Security Description | | Shares | | | Value | |
| COMMON STOCKS (99.25%) | | | | | | | | |
| Australia (17.73%) | | | | | | | | |
| AMP, Ltd. | | | 2,636,443 | | | $ | 4,682,555 | |
| BHP Billiton, Ltd. | | | 259,895 | | | | 5,829,791 | |
| Fortescue Metals Group, Ltd. | | | 2,265,803 | | | | 6,624,305 | |
| National Australia Bank, Ltd. | | | 302,169 | | | | 5,441,878 | |
| Telstra Corp., Ltd. | | | 2,595,577 | | | | 5,558,527 | |
| Wesfarmers, Ltd. | | | 230,082 | | | | 5,312,396 | |
| Westpac Banking Corp. | | | 298,018 | | | | 5,656,824 | |
| Woodside Petroleum, Ltd. | | | 224,190 | | | | 5,089,509 | |
| Woolworths Group, Ltd. | | | 302,567 | | | | 6,395,552 | |
| Total Australia | | | | | | | 50,591,337 | |
| | | | | | | | | |
| Belgium (2.40%) | | | | | | | | |
| Proximus SADP | | | 247,695 | | | | 6,853,356 | |
| | | | | | | | | |
| Denmark (1.91%) | | | | | | | | |
| Pandora A/S | | | 101,008 | | | | 5,456,082 | |
| | | | | | | | | |
| Finland (6.93%) | | | | | | | | |
| Fortum OYJ | | | 231,911 | | | | 4,833,481 | |
| Nokia OYJ | | | 1,076,340 | | | | 5,917,156 | |
| Nordea Bank Abp | | | 551,803 | | | | 4,896,955 | |
| UPM-Kymmene OYJ | | | 154,548 | | | | 4,116,899 | |
| Total Finland | | | | | | | 19,764,491 | |
| | | | | | | | | |
| France (7.86%) | | | | | | | | |
| Bouygues SA | | | 140,332 | | | | 5,395,222 | |
| Carrefour SA | | | 315,229 | | | | 5,674,246 | |
| Sanofi | | | 67,353 | | | | 6,085,540 | |
| TOTAL SA | | | 94,521 | | | | 5,261,011 | |
| Total France | | | | | | | 22,416,019 | |
| | | | | | | | | |
| Germany (5.36%) | | | | | | | | |
| Bayer AG | | | 70,833 | | | | 5,178,674 | |
| Evonik Industries AG | | | 160,550 | | | | 4,316,769 | |
| Telefonica Deutschland Holding AG | | | 1,432,054 | | | | 5,799,135 | |
| Total Germany | | | | | | | 15,294,578 | |
| | | | | | | | | |
| Great Britain (1.61%) | | | | | | | | |
| Persimmon PLC | | | 189,886 | | | | 4,597,285 | |
| | | | | | | | | |
| Hong Kong (2.00%) | | | | | | | | |
| Sands China, Ltd. | | | 1,319,400 | | | | 5,708,294 | |
| | | | | | | | | |
| Italy (3.86%) | | | | | | | | |
| Atlantia SpA | | | 286,425 | | | | 5,872,381 | |
| Eni SpA | �� | | 318,588 | | | | 5,138,156 | |
| Total Italy | | | | | | | 11,010,537 | |
| | | | | | | | | |
| Japan (9.87%) | | | | | | | | |
| Canon, Inc. | | | 192,163 | | | | 5,450,952 | |
| Japan Airlines Co., Ltd. | | | 166,500 | | | | 6,004,942 | |
| Japan Tobacco, Inc. | | | 223,800 | | | | 5,566,659 | |
| Nissan Motor Co., Ltd. | | | 624,000 | | | | 5,465,738 | |
| Security Description | | Shares | | | Value | |
| Japan (continued) | | | | | | | | |
| Tokyo Electron, Ltd. | | | 40,500 | | | $ | 5,663,899 | |
| Total Japan | | | | | | | 28,152,190 | |
| | | | | | | | | |
| Netherlands (1.94%) | | | | | | | | |
| Royal Dutch Shell PLC, Class A | | | 183,395 | | | | 5,544,533 | |
| | | | | | | | | |
| Portugal (1.92%) | | | | | | | | |
| EDP - Energias de Portugal SA | | | 1,569,168 | | | | 5,483,918 | |
| | | | | | | | | |
| Spain (4.15%) | | | | | | | | |
| Endesa SA | | | 270,960 | | | | 6,036,917 | |
| Ferrovial SA | | | 282,562 | | | | 5,812,374 | |
| Total Spain | | | | | | | 11,849,291 | |
| | | | | | | | | |
| Sweden (8.96%) | | | | | | | | |
| Hennes & Mauritz AB, Class B | | | 435,125 | | | | 8,012,649 | |
| Swedbank AB, Class A | | | 250,423 | | | | 5,817,937 | |
| Telefonaktiebolaget LM Ericsson, Class B | | | 683,780 | | | | 5,702,392 | |
| Telia Co. AB | | | 1,306,645 | | | | 6,026,816 | |
| Total Sweden | | | | | | | 25,559,794 | |
| | | | | | | | | |
| Switzerland (2.19%) | | | | | | | | |
| Roche Holding AG | | | 24,036 | | | | 6,233,650 | |
| | | | | | | | | |
| United Kingdom (20.56%) | | | | | | | | |
| AstraZeneca PLC | | | 80,401 | | | | 6,266,929 | |
| BP PLC | | | 822,131 | | | | 5,447,525 | |
| Centrica PLC | | | 3,161,431 | | | | 5,549,197 | |
| GlaxoSmithKline PLC | | | 305,344 | | | | 6,309,399 | |
| Imperial Brands PLC | | | 172,902 | | | | 5,309,723 | |
| International Consolidated Airlines Group SA | | | 662,485 | | | | 5,281,139 | |
| Micro Focus International PLC | | | 345,487 | | | | 6,775,248 | |
| Rio Tinto, Ltd. | | | 113,376 | | | | 6,072,462 | |
| SSE PLC | | | 418,083 | | | | 5,836,194 | |
| Vodafone Group PLC | | | 2,706,767 | | | | 5,826,908 | |
| Total United Kingdom | | | | | | | 58,674,724 | |
| | | | | | | | | |
| TOTAL COMMON STOCKS | | | | | | | | |
| (Cost $318,718,550) | | | | | | | 283,190,079 | |
ALPS International Sector Dividend Dogs ETF
| Schedule of Investments | November 30, 2018 |
| | | 7 Day Yield | | | Shares | | | Value | |
| SHORT TERM INVESTMENTS (0.23%) | | | | |
| Money Market Fund | | | | |
| State Street Institutional Treasury Plus Money Market Fund | | | 2.146 | % | | | 650,140 | | | | 650,140 | |
| TOTAL SHORT TERM INVESTMENTS | | | | |
| (Cost $650,140) | | | | | | | | | | | 650,140 | |
| | | | | | | | | | | | | |
| TOTAL INVESTMENTS (99.48%) | | | | |
| (Cost $319,368,690) | | | | | | | | | | $ | 283,840,219 | |
| OTHER ASSETS IN EXCESS OF LIABILITIES (0.52%) | | | 1,486,928 | |
| NET ASSETS - 100.00% | | $ | 285,327,147 | |
See Notes to Financial Statements.
ALPS Emerging Sector Dividend Dogs ETF
| Schedule of Investments | November 30, 2018 |
| Security Description | | Shares | | | Value | |
| COMMON STOCKS (99.49%) | | | | | | | | |
| Argentina (1.92%) | | | | | | | | |
| Telecom Argentina SA, Sponsored ADR(a) | | | 39,314 | | | $ | 675,415 | |
| | | | | | | | | |
| Brazil (11.65%) | | | | | | | | |
| BB Seguridade Participacoes SA | | | 122,896 | | | | 900,030 | |
| CCR SA | | | 329,711 | | | | 1,107,563 | |
| Cielo SA | | | 203,822 | | | | 501,780 | |
| Engie Brasil Energia SA | | | 79,304 | | | | 882,044 | |
| Fleury SA | | | 126,798 | | | | 708,259 | |
| Total Brazil | | | | | | | 4,099,676 | |
| | | | | | | | | |
| Chile (3.51%) | | | | | | | | |
| AES Gener SA | | | 2,499,637 | | | | 680,149 | |
| Cencosud SA | | | 298,436 | | | | 553,922 | |
| Total Chile | | | | | | | 1,234,071 | |
| | | | | | | | | |
| China (9.91%) | | | | | | | | |
| COSCO SHIPPING Energy Transportation Co., Ltd., Class H | | | 1,419,000 | | | | 767,174 | |
| Great Wall Motor Co., Ltd., Class H | | | 1,193,000 | | | | 762,398 | |
| Huaneng Power International, Inc., Sponsored ADR(a) | | | 26,880 | | | | 677,376 | |
| Lenovo Group, Ltd. | | | 1,010,000 | | | | 729,358 | |
| Sinopec Shanghai Petrochemical Co., Ltd., Class H | | | 1,218,000 | | | | 552,646 | |
| Total China | | | | | | | 3,488,952 | |
| | | | | | | | | |
| Czech Republic (1.78%) | | | | | | | | |
| CEZ AS | | | 26,242 | | | | 625,370 | |
| | | | | | | | | |
| Hungary (2.12%) | | | | | | | | |
| Richter Gedeon Nyrt | | | 38,014 | | | | 747,932 | |
| | | | | | | | | |
| India (5.43%) | | | | | | | | |
| Infosys, Ltd., Sponsored ADR | | | 66,786 | | | | 658,510 | |
| Vedanta, Ltd., ADR | | | 51,881 | | | | 578,473 | |
| Wipro, Ltd., ADR | | | 129,333 | | | | 675,118 | |
| Total India | | | | | | | 1,912,101 | |
| | | | | | | | | |
| Indonesia (11.23%) | | | | | | | | |
| Astra International Tbk PT | | | 1,400,400 | | | | 837,156 | |
| Gudang Garam Tbk PT | | | 133,600 | | | | 765,964 | |
| Indocement Tunggal Prakarsa Tbk PT | | | 594,900 | | | | 794,448 | |
| Kalbe Farma Tbk PT | | | 8,192,400 | | | | 873,512 | |
| Perusahaan Gas Negara Persero Tbk | | | 4,985,000 | | | | 681,397 | |
| Total Indonesia | | | | | | | 3,952,477 | |
| | | | | | | | | |
| Malaysia (7.27%) | | | | | | | | |
| Astro Malaysia Holdings Bhd | | | 1,589,600 | | | | 455,854 | |
| Security Description | | Shares | | | Value | |
| Malaysia (continued) | | | | | | | | |
| British American Tobacco Malaysia Bhd | | | 83,927 | | | $ | 756,135 | |
| Malayan Banking Bhd | | | 285,700 | | | | 641,109 | |
| MISC Bhd | | | 480,200 | | | | 705,755 | |
| Total Malaysia | | | | | | | 2,558,853 | |
| | | | | | | | | |
| Mexico (1.58%) | | | | | | | | |
| Banco Santander Mexico SA Institucion de Banca Multiple Grupo Financiero Santand, ADR | | | 91,081 | | | | 555,594 | |
| | | | | | | | | |
| Philippines (3.42%) | | | | | | | | |
| PLDT, Inc., Sponsored ADR | | | 26,254 | | | | 566,561 | |
| Semirara Mining & Power Corp. | | | 1,276,100 | | | | 637,807 | |
| Total Philippines | | | | | | | 1,204,368 | |
| | | | | | | | | |
| Poland (1.95%) | | | | | | | | |
| Bank Polska Kasa Opieki SA | | | 23,664 | | | | 685,388 | |
| | | | | | | | | |
| Russia (7.76%) | | | | | | | | |
| Gazprom PJSC, ADR | | | 153,102 | | | | 728,765 | |
| LUKOIL PJSC, Sponsored ADR | | | 10,171 | | | | 747,569 | |
| Mobile TeleSystems PJSC, Sponsored ADR | | | 83,983 | | | | 622,314 | |
| Severstal PJSC, GDR(b) | | | 43,109 | | | | 633,271 | |
| Total Russia | | | | | | | 2,731,919 | |
| | | | | | | | | |
| South Africa (10.38%) | | | | | | | | |
| Absa Group, Ltd. | | | 68,209 | | | | 757,946 | |
| AVI, Ltd. | | | 91,623 | | | | 658,938 | |
| Life Healthcare Group Holdings, Ltd. | | | 401,254 | | | | 752,781 | |
| Netcare, Ltd. | | | 369,153 | | | | 681,903 | |
| Woolworths Holdings, Ltd. | | | 198,896 | | | | 803,693 | |
| Total South Africa | | | | | | | 3,655,261 | |
| | | | | | | | | |
| Thailand (9.23%) | | | | | | | | |
| BTS Group Holdings PCL | | | 2,428,420 | | | | 697,790 | |
| Charoen Pokphand Foods PCL | | | 867,900 | | | | 659,749 | |
| Delta Electronics Thailand PCL | | | 320,924 | | | | 680,637 | |
| Intouch Holdings PCL, NVDR | | | 406,400 | | | | 611,685 | |
| Thai Oil PCL | | | 259,800 | | | | 600,374 | |
| Total Thailand | | | | | | | 3,250,235 | |
| | | | | | | | | |
| Turkey (10.35%) | | | | | | | | |
| Enka Insaat ve Sanayi AS | | | 818,969 | | | | 736,664 | |
| Eregli Demir ve Celik Fabrikalari TAS | | | 381,747 | | | | 555,708 | |
| Ford Otomotiv Sanayi AS | | | 68,712 | | | | 712,291 | |
| Tupras Turkiye Petrol Rafinerileri AS | | | 31,480 | | | | 754,095 | |
ALPS Emerging Sector Dividend Dogs ETF
| Schedule of Investments | November 30, 2018 |
| Security Description | | Shares | | | Value | |
| Turkey (continued) | | | | | | | | |
| Turkcell Iletisim Hizmetleri AS, ADR(a) | | | 146,832 | | | $ | 883,928 | |
| Total Turkey | | | | | | | 3,642,686 | |
| | | | | | | | | |
| TOTAL COMMON STOCKS | | | | | | | | |
| (Cost $39,270,221) | | | | | | | 35,020,298 | |
| | | | | | | | | |
| WARRANTS(0.00%)(c) | | | | | | | | |
| Thailand (0.00%) | | | | | | | | |
| BTS Group Holdings PCL (Expiring 1/1/2020) | | | 287,902 | | | | – | |
| Total Thailand | | | | | | | – | |
| | | | | | | | | |
| TOTAL WARRANTS | | | | | | | | |
| (Cost $–) | | | | | | | – | |
| | | 7 Day Yield | | | Shares | | | Value | |
| SHORT TERM INVESTMENTS (1.63%) | | | | |
| Money Market Fund (0.38%) | | | | |
| State Street Institutional Treasury Plus Money Market Fund | | | | | |
| (Cost $135,767) | | | 2.146 | % | | | 135,767 | | | | 135,767 | |
| | | | | | | | | | | | | |
| Investments Purchased with Collateral from Securities Loaned (1.25%) | | | | |
| State Street Navigator Securities Lending Government Money Market Portfolio, 2.24% | | | | | | | 439,625 | | | | 439,625 | |
| (Cost $439,625) | | | | | | | | | | | | |
| TOTAL SHORT TERM INVESTMENTS | | | | |
| (Cost $575,392) | | | | | | | | | | | 575,392 | |
| | | | | | | | | | | | | |
| TOTAL INVESTMENTS (101.12%) | | | | |
| (Cost $39,845,613) | | $ | 35,595,690 | |
| LIABILITIES IN EXCESS OF OTHER ASSETS (-1.12%) | | | (395,097 | ) |
| NET ASSETS - 100.00% | | $ | 35,200,593 | |
| (a) | Security, or a portion of the security position is currently on loan. The total market value of securities on loan is $589,696. |
| (b) | These securities initially sold to other parties pursuant to Regulation S under the 1933 Act and subsequently resold to the Fund. As of November 30, 2018, the aggregate market values of these securities were $633,271, representing 1.80% of the Fund’s net assets. |
See Notes to Financial Statements.
ALPS ETF Trust
| Statements of Assets and Liabilities | November 30, 2018 |
| | | ALPS Sector Dividend Dogs ETF | | | ALPS International Sector Dividend Dogs ETF | | | ALPS Emerging Sector Dividend Dogs ETF | |
| ASSETS: | | | | | | | | | |
| Investments, at value | | $ | 2,160,471,535 | | | $ | 283,840,219 | | | $ | 35,595,690 | |
| Foreign currency, at value (Cost $–, $– and $7,784) | | | – | | | | – | | | | 7,745 | |
| Foreign tax reclaims | | | – | | | | 493,996 | | | | 1,542 | |
| Dividends receivable | | | 10,704,886 | | | | 1,111,400 | | | | 114,761 | |
| Total Assets | | | 2,171,176,421 | | | | 285,445,615 | | | | 35,719,738 | |
| | | | | | | | | | | | | |
| LIABILITIES: | | | | | | | | | | | | |
| Payable for investments purchased | | | 3,754,051 | | | | – | | | | 62,339 | |
| Payable to adviser | | | 713,862 | | | | 118,468 | | | | 17,181 | |
| Payable for collateral upon return of securities loaned | | | – | | | | – | | | | 439,625 | |
| Total Liabilities | | | 4,467,913 | | | | 118,468 | | | | 519,145 | |
| NET ASSETS | | $ | 2,166,708,508 | | | $ | 285,327,147 | | | $ | 35,200,593 | |
| | | | | | | | | | | | | |
| NET ASSETS CONSIST OF: | | | | | | | | | | | | |
| Paid-in capital | | $ | 2,290,798,737 | | | $ | 339,974,496 | | | $ | 43,482,130 | |
| Total Distributable earnings | | | (124,090,229 | ) | | | (54,647,349 | ) | | | (8,281,537 | ) |
| NET ASSETS | | $ | 2,166,708,508 | | | $ | 285,327,147 | | | $ | 35,200,593 | |
| | | | | | | | | | | | | |
| INVESTMENTS, AT COST | | $ | 2,172,591,037 | | | $ | 319,368,690 | | | $ | 39,845,613 | |
| | | | | | | | | | | | | |
| PRICING OF SHARES: | | | | | | | | | | | | |
| Net Assets | | $ | 2,166,708,508 | | | $ | 285,327,147 | | | $ | 35,200,593 | |
| Shares of beneficial interest outstanding (Unlimited number of shares authorized, par value $0.01 per share) | | | 48,959,141 | | | | 11,350,000 | | | | 1,650,000 | |
| Net Asset Value, offering and redemption price per share | | $ | 44.26 | | | $ | 25.14 | | | $ | 21.33 | |
See Notes to Financial Statements.
ALPS ETF Trust
| Statements of Operations | For the Year Ended November 30, 2018 |
| | | ALPS Sector Dividend Dogs ETF | | | ALPS International Sector Dividend Dogs ETF | | | ALPS Emerging Sector Dividend Dogs ETF | |
| INVESTMENT INCOME: | | | | | | | | | |
| Dividends* | | $ | 86,469,930 | | | $ | 15,434,691 | | | $ | 1,953,102 | |
| Securities Lending Income | | | 21,820 | | | | 14,264 | | | | 24,328 | |
| Total Investment Income | | | 86,491,750 | | | | 15,448,955 | | | | 1,977,430 | |
| | | | | | | | | | | | | |
| EXPENSES: | | | | | | | | | | | | |
| Investment adviser fees | | | 9,116,138 | | | | 1,656,503 | | | | 264,947 | |
| Total Expenses | | | 9,116,138 | | | | 1,656,503 | | | | 264,947 | |
| NET INVESTMENT INCOME | | | 77,375,612 | | | | 13,792,452 | | | | 1,712,483 | |
| | | | | | | | | | | | | |
| REALIZED AND UNREALIZED GAIN/(LOSS) | | | | | | | | | | | | |
| Net realized gain on investments | | | 206,685,007 | | | | 26,139,597 | | | | 734,237 | |
| Net realized loss on foreign currency transactions | | | – | | | | (249,071 | ) | | | (51,195 | ) |
| Total net realized gain | | | 206,685,007 | | | | 25,890,526 | | | | 683,042 | |
| Net change in unrealized depreciation on investments | | | (272,966,359 | ) | | | (63,583,414 | ) | | | (6,853,431 | ) |
| Net change in unrealized appreciation/(depreciation) on translation of assets and liabilities denominated in foreign currencies | | | – | | | | (27,144 | ) | | | 1,340 | |
| Total net change in unrealized depreciation | | | (272,966,359 | ) | | | (63,610,558 | ) | | | (6,852,091 | ) |
| NET REALIZED AND UNREALIZED LOSS ON INVESTMENTS | | | (66,281,352 | ) | | | (37,720,032 | ) | | | (6,169,049 | ) |
| NET INCREASE/(DECREASE) IN NET ASSETS RESULTING FROM OPERATIONS | | $ | 11,094,260 | | | $ | (23,927,580 | ) | | $ | (4,456,566 | ) |
| *Net of foreign tax withholding: | | $ | – | | | $ | 1,221,229 | | | $ | 227,663 | |
See Notes to Financial Statements.
ALPS Sector Dividend Dogs ETF
Statements of Changes in Net Assets | |
| | | For the Year Ended November 30, 2018 | | | For the Year Ended November 30, 2017 | |
| OPERATIONS: | | | | | | | | |
| Net investment income | | $ | 77,375,612 | | | $ | 70,692,559 | |
| Net realized gain | | | 206,685,007 | | | | 79,876,828 | |
| Net change in unrealized appreciation/(depreciation) | | | (272,966,359 | ) | | | 84,019,526 | |
| Net increase in net assets resulting from operations | | | 11,094,260 | | | | 234,588,913 | |
| | | | | | | | | |
| Net Equalization Credits | | | 2,185,761 | | | | 1,506,585 | |
| | | | | | | | | |
| DISTRIBUTIONS TO SHAREHOLDERS: | | | | | | | | |
| From distributable earnings | | | (80,000,025 | ) | | | (70,756,115 | )(a) |
| From tax return of capital | | | – | | | | (2,592,040 | ) |
| Total distributions | | | (80,000,025 | ) | | | (73,348,155 | ) |
| | | | | | | | | |
| CAPITAL SHARE TRANSACTIONS: | | | | | | | | |
| Proceeds from sale of shares | | | 565,538,675 | | | | 1,098,967,514 | |
| Cost of shares redeemed | | | (652,128,952 | ) | | | (640,408,820 | ) |
| Net income equalization (Note 2) | | | (2,185,761 | ) | | | (1,506,585 | ) |
| Net increase/(decrease) from share transactions | | | (88,776,038 | ) | | | 457,052,109 | |
| Net increase/(decrease) in net assets | | | (155,496,042 | ) | | | 619,799,452 | |
| | | | | | | | | |
| NET ASSETS: | | | | | | | | |
| Beginning of period | | | 2,322,204,550 | | | | 1,702,405,098 | |
| End of period | | $ | 2,166,708,508 | | | $ | 2,322,204,550 | |
| | | | | | | | | |
| OTHER INFORMATION: | | | | | | | | |
| CAPITAL SHARE TRANSACTIONS: | | | | | | | | |
| Beginning shares | | | 50,909,141 | | | | 40,259,141 | |
| Shares sold | | | 12,350,000 | | | | 25,600,000 | |
| Shares redeemed | | | (14,300,000 | ) | | | (14,950,000 | ) |
| Shares outstanding, end of period | | | 48,959,141 | | | | 50,909,141 | |
| (a) | For the year ended November 30, 2017, total distributions from distributable earnings consisted of distributions from net investment income of $70,756,115. |
See Notes to Financial Statements.
ALPS International Sector Dividend Dogs ETF
Statements of Changes in Net Assets
| | | | | | | |
| | | For the Year Ended November 30, 2018 | | | For the Year Ended November 30, 2017 | |
| OPERATIONS: | | | | | | | | |
| Net investment income | | $ | 13,792,452 | | | $ | 8,948,867 | |
| Net realized gain/(loss) | | | 25,890,526 | | | | (2,156,351 | ) |
| Net change in unrealized appreciation/(depreciation) | | | (63,610,558 | ) | | | 49,755,411 | |
| Net increase/(decrease) in net assets resulting from operations | | | (23,927,580 | ) | | | 56,547,927 | |
| | | | | | | | | |
| Net Equalization Credits | | | 584,886 | | | | 1,103,408 | |
| | | | | | | | | |
| DISTRIBUTIONS TO SHAREHOLDERS: | | | | | | | | |
| From distributable earnings | | | (13,263,685 | ) | | | (8,514,874 | )(a) |
| Total distributions | | | (13,263,685 | ) | | | (8,514,874 | ) |
| | | | | | | | | |
| CAPITAL SHARE TRANSACTIONS: | | | | | | | | |
| Proceeds from sale of shares | | | 92,142,123 | | | | 167,824,202 | |
| Cost of shares redeemed | | | (118,807,393 | ) | | | (27,715,964 | ) |
| Net income equalization (Note 2) | | | (584,886 | ) | | | (1,103,408 | ) |
| Net increase/(decrease) from share transactions | | | (27,250,156 | ) | | | 139,004,830 | |
| Net increase/(decrease) in net assets | | | (63,856,535 | ) | | | 188,141,291 | |
| | | | | | | | | |
| NET ASSETS: | | | | | | | | |
| Beginning of period | | | 349,183,682 | | | | 161,042,391 | |
| End of period | | $ | 285,327,147 | | | $ | 349,183,682 | (b) |
| | | | | | | | | |
| OTHER INFORMATION: | | | | | | | | |
| CAPITAL SHARE TRANSACTIONS: | | | | | | | | |
| Beginning shares | | | 12,350,000 | | | | 7,050,000 | |
| Shares sold | | | 3,250,000 | | | | 6,400,000 | |
| Shares redeemed | | | (4,250,000 | ) | | | (1,100,000 | ) |
| Shares outstanding, end of period | | | 11,350,000 | | | | 12,350,000 | |
| (a) | For the year ended November 30, 2017, total distributions from distributable earnings consisted of distributions from net investment income of $8,514,874. |
| (b) | For the year ended November 30, 2017, net assets included accumulated net investment income of $830,175. |
See Notes to Financial Statements.
ALPS Emerging Sector Dividend Dogs ETF
Statements of Changes in Net Assets
| | | For the Year Ended November 30, 2018 | | For the Year Ended November 30, 2017 |
| OPERATIONS: | | | | | | | | |
| Net investment income | | $ | 1,712,483 | | | $ | 1,221,858 | |
| Net realized gain | | | 683,042 | | | | 143,336 | |
| Net change in unrealized appreciation/(depreciation) | | | (6,852,091 | ) | | | 3,453,932 | |
| Net increase/(decrease) in net assets resulting from operations | | | (4,456,566 | ) | | | 4,819,126 | |
| Net Equalization Credits | | | 181,291 | | | | 80,789 | |
| | | | | | | | | |
| DISTRIBUTIONS TO SHAREHOLDERS: | | | | | | | | |
| From distributable earnings | | | (1,535,255 | ) | | | (1,225,826 | )(a) |
| Total distributions | | | (1,535,255 | ) | | | (1,225,826 | ) |
| | | | | | | | | |
| CAPITAL SHARE TRANSACTIONS: | | | | | | | | |
| Proceeds from sale of shares | | | 18,738,927 | | | | 26,866,382 | |
| Cost of shares redeemed | | | (24,902,706 | ) | | | (2,160,243 | ) |
| Net income equalization (Note 2) | | | (181,291 | ) | | | (80,789 | ) |
| Net increase/(decrease) from share transactions | | | (6,345,070 | ) | | | 24,625,350 | |
| Net increase/(decrease) in net assets | | | (12,155,600 | ) | | | 28,299,439 | |
| | | | | | | | | |
| NET ASSETS: | | | | | | | | |
| Beginning of period | | | 47,356,193 | | | | 19,056,754 | |
| End of period | | $ | 35,200,593 | | | $ | 47,356,193 | (b) |
| | | | | | | | | |
| OTHER INFORMATION: | | | | | | | | |
| CAPITAL SHARE TRANSACTIONS: | | | | | | | | |
| Beginning shares | | | 1,950,000 | | | | 900,000 | |
| Shares sold | | | 750,000 | | | | 1,150,000 | |
| Shares redeemed | | | (1,050,000 | ) | | | (100,000 | ) |
| Shares outstanding, end of period | | | 1,650,000 | | | | 1,950,000 | |
| (a) | For the year ended November 30, 2017, total distributions from distributable earnings consisted of distributions from net investment income of $1,225,826. |
| (b) | For the year ended November 30, 2017, net assets included accumulated net investment income of $135,674. |
See Notes to Financial Statements.
ALPS Sector Dividend Dogs ETF
| Financial Highlights | For a Share Outstanding Throughout the Periods Presented |
| | | For the Year Ended November 30, 2018 | | For the Year Ended November 30, 2017 | | For the Year Ended November 30, 2016 | | For the Year Ended November 30, 2015 | | For the Year Ended November 30, 2014 |
| NET ASSET VALUE, BEGINNING OF PERIOD | | $ | 45.61 | | | $ | 42.29 | | | $ | 36.23 | | | $ | 38.80 | | | $ | 33.76 | |
| | | | | | | | | | | | | | | | | | | | | |
| INCOME/(LOSS) FROM INVESTMENT OPERATIONS: | | | | | | | | | | | | | | | | | | | | |
| Net investment income(a) | | | 1.54 | | | | 1.40 | | | | 1.26 | | | | 1.21 | | | | 1.35 | |
| Net realized and unrealized gain/(loss) | | | (1.31 | ) | | | 3.39 | | | | 6.15 | | | | (2.47 | ) | | | 4.94 | |
| Total from investment operations | | | 0.23 | | | | 4.79 | | | | 7.41 | | | | (1.26 | ) | | | 6.29 | |
| | | | | | | | | | | | | | | | | | | | | |
| DISTRIBUTIONS: | | | | | | | | | | | | | | | | | | | | |
| From net investment income | | | (1.58 | ) | | | (1.42 | ) | | | (1.34 | ) | | | (1.31 | ) | | | (1.25 | ) |
| Tax return of capital | | | – | | | | (0.05 | ) | | | (0.01 | ) | | | – | | | | – | |
| Total distributions | | | (1.58 | ) | | | (1.47 | ) | | | (1.35 | ) | | | (1.31 | ) | | | (1.25 | ) |
| | | | | | | | | | | | | | | | | | | | | |
| Net increase/(decrease) in net asset value | | | (1.35 | ) | | | 3.32 | | | | 6.06 | | | | (2.57 | ) | | | 5.04 | |
| NET ASSET VALUE, END OF PERIOD | | $ | 44.26 | | | $ | 45.61 | | | $ | 42.29 | | | $ | 36.23 | | | $ | 38.80 | |
| TOTAL RETURN(b) | | | 0.51 | % | | | 11.59 | % | | | 20.86 | % | | | (3.21 | )% | | | 18.96 | % |
| | | | | | | | | | | | | | | | | | | | | |
| RATIOS/SUPPLEMENTAL DATA: | | | | | | | | | | | | | | | | | | | | |
| Net assets, end of period (000s) | | $ | 2,166,709 | | | $ | 2,322,205 | | | $ | 1,702,405 | | | $ | 1,014,899 | | | $ | 1,024,473 | |
| | | | | | | | | | | | | | | | | | | | | |
| Ratio of expenses to average net assets | | | 0.40 | % | | | 0.40 | % | | | 0.40 | % | | | 0.40 | % | | | 0.40 | % |
| Ratio of net investment income to average net assets | | | 3.40 | % | | | 3.24 | % | | | 3.23 | % | | | 3.25 | % | | | 3.74 | % |
| Portfolio turnover rate(c) | | | 61 | % | | | 48 | % | | | 49 | % | | | 55 | % | | | 12 | % |
| Undistributed net investment income included in price of units issued and redeemed(a)(d) | | $ | 0.04 | | | $ | 0.03 | | | $ | 0.06 | | | $ | 0.06 | | | $ | 0.09 | |
| (a) | Based on average shares outstanding during the period. |
| (b) | Total return is calculated assuming an initial investment made at the net asset value at the beginning of the period and redemption at the net asset value on the last day of the period and assuming all distributions are reinvested at reinvestment prices. Total return calculated for a period of less than one year is not annualized. |
| (c) | Portfolio turnover for periods less than one year is not annualized and does not include securities received or delivered from processing creations or redemptions in-kind. |
| (d) | The per share amount of equalization is presented to show the impact of equalization on distributable earnings per share. |
See Notes to Financial Statements.
ALPS International Sector Dividend Dogs ETF
| Financial Highlights | For a Share Outstanding Throughout the Periods Presented |
| | | For the Year Ended November 30, 2018 | | | For the Year Ended November 30, 2017 | | | For the Year Ended November 30, 2016 | | | For the Year Ended November 30, 2015 | | | For the Year Ended November 30, 2014 | |
| NET ASSET VALUE, BEGINNING OF PERIOD | | $ | 28.27 | | | $ | 22.84 | | | $ | 24.25 | | | $ | 27.33 | | | $ | 29.21 | |
| | | | | | | | | | | | | | | | | | | | | |
| INCOME/(LOSS) FROM INVESTMENT OPERATIONS: | | | | | | | | | | | | | | | | | | | | |
| Net investment income(a) | | | 1.15 | | | | 0.94 | | | | 1.00 | | | | 1.06 | | | | 1.19 | |
| Net realized and unrealized gain/(loss) | | | (3.19 | ) | | | 5.41 | | | | (1.47 | ) | | | (3.13 | ) | | | (1.83 | ) |
| Total from investment operations | | | (2.04 | ) | | | 6.35 | | | | (0.47 | ) | | | (2.07 | ) | | | (0.64 | ) |
| | | | | | | | | | | | | | | | | | | | | |
| DISTRIBUTIONS: | | | | | | | | | | | | | | | | | | | | |
| From net investment income | | | (1.09 | ) | | | (0.92 | ) | | | (0.94 | ) | | | (0.99 | ) | | | (1.17 | ) |
| Tax return of capital | | | – | | | | – | | | | – | | | | (0.02 | ) | | | (0.07 | ) |
| Total distributions | | | (1.09 | ) | | | (0.92 | ) | | | (0.94 | ) | | | (1.01 | ) | | | (1.24 | ) |
| | | | | | | | | | | | | | | | | | | | | |
| Net increase/(decrease) in net asset value | | | (3.13 | ) | | | 5.43 | | | | (1.41 | ) | | | (3.08 | ) | | | (1.88 | ) |
| NET ASSET VALUE, END OF PERIOD | | $ | 25.14 | | | $ | 28.27 | | | $ | 22.84 | | | $ | 24.25 | | | $ | 27.33 | |
| TOTAL RETURN(b) | | | (7.47 | )% | | | 28.21 | % | | | (1.95 | )% | | | (7.76 | )% | | | (2.53 | )% |
| | | | | | | | | | | | | | | | | | | | | |
| RATIOS/SUPPLEMENTAL DATA: | | | | | | | | | | | | | | | | | | | | |
| Net assets, end of period (000s) | | $ | 285,327 | | | $ | 349,184 | | | $ | 161,042 | | | $ | 135,778 | | | $ | 143,461 | |
| | | | | | | | | | | | | | | | | | | | | |
| Ratio of expenses to average net assets | | | 0.50 | % | | | 0.50 | % | | | 0.50 | % | | | 0.50 | % | | | 0.50 | % |
| Ratio of net investment income to average net assets | | | 4.16 | % | | | 3.55 | % | | | 4.28 | % | | | 4.05 | % | | | 4.05 | % |
| Portfolio turnover rate(c) | | | 72 | % | | | 37 | % | | | 47 | % | | | 67 | % | | | 19 | % |
| Undistributed net investment income included in price of units issued and redeemed(a)(d) | | $ | 0.05 | | | $ | 0.12 | | | $ | 0.09 | | | $ | 0.05 | | | $ | 0.09 | |
| (a) | Based on average shares outstanding during the period. |
| (b) | Total return is calculated assuming an initial investment made at the net asset value at the beginning of the period and redemption at the net asset value on the last day of the period and assuming all distributions are reinvested at reinvestment prices. Total return calculated for a period of less than one year is not annualized. |
| (c) | Portfolio turnover for periods less than one year is not annualized and does not include securities received or delivered from processing creations or redemptions in-kind. |
| (d) | The per share amount of equalization is presented to show the impact of equalization on distributable earnings per share. |
See Notes to Financial Statements.
ALPS Emerging Sector Dividend Dogs ETF
| Financial Highlights | For a Share Outstanding Throughout the Periods Presented |
| | | For the Year Ended November 30, 2018 | | | For the Year Ended November 30, 2017 | | | For the Year Ended November 30, 2016 | | | For the Year Ended November 30, 2015 | | | For the Period March 28, 2014 (Commencement) to November 30, 2014 | |
| NET ASSET VALUE, BEGINNING OF PERIOD | | $ | 24.29 | | | $ | 21.17 | | | $ | 20.78 | | | $ | 26.57 | | | $ | 25.00 | |
| | | | | | | | | | | | | | | | | | | | | |
| INCOME/(LOSS) FROM INVESTMENT OPERATIONS: | | | | | | | | | | | | | | | | | | | | |
| Net investment income(a) | | | 0.91 | | | | 0.80 | | | | 0.67 | | | | 1.26 | | | | 0.64 | |
| Net realized and unrealized gain/(loss) | | | (3.02 | ) | | | 3.06 | | | | 0.39 | | | | (6.15 | ) | | | 1.59 | |
| Total from investment operations | | | (2.11 | ) | | | 3.86 | | | | 1.06 | | | | (4.89 | ) | | | 2.23 | |
| | | | | | | | | | | | | | | | | | | | | |
| DISTRIBUTIONS: | | | | | | | | | | | | | | | | | | | | |
| From net investment income | | | (0.85 | ) | | | (0.74 | ) | | | (0.67 | ) | | | (0.90 | ) | | | (0.54 | ) |
| Tax return of capital | | | – | | | | – | | | | – | | | | – | | | | (0.12 | ) |
| Total distributions | | | (0.85 | ) | | | (0.74 | ) | | | (0.67 | ) | | | (0.90 | ) | | | (0.66 | ) |
| | | | | | | | | | | | | | | | | | | | | |
| Net increase/(decrease) in net asset value | | | (2.96 | ) | | | 3.12 | | | | 0.39 | | | | (5.79 | ) | | | 1.57 | |
| NET ASSET VALUE, END OF PERIOD | | $ | 21.33 | | | $ | 24.29 | | | $ | 21.17 | | | $ | 20.78 | | | $ | 26.57 | |
| TOTAL RETURN(b) | | | (8.76 | )% | | | 18.37 | % | | | 5.10 | % | | | (18.66 | )% | | | 8.93 | % |
| | | | | | | | | | | | | | | | | | | | | |
| RATIOS/SUPPLEMENTAL DATA: | | | | | | | | | | | | | | | | | | | | |
| Net assets, end of period (000s) | | $ | 35,201 | | | $ | 47,356 | | | $ | 19,057 | | | $ | 9,349 | | | $ | 10,629 | |
| | | | | | | | | | | | | | | | | | | | | |
| Ratio of expenses to average net assets | | | 0.60 | % | | | 0.60 | % | | | 0.60 | % | | | 0.60 | % | | | 0.60 | %(c) |
| Ratio of net investment income to average net assets | | | 3.88 | % | | | 3.33 | % | | | 3.11 | % | | | 5.34 | % | | | 3.54 | %(c) |
| Portfolio turnover rate(d) | | | 85 | % | | | 42 | % | | | 68 | % | | | 96 | % | | | 19 | % |
| Undistributed net investment income included in price of units issued and redeemed(a)(e) | | $ | 0.10 | | | $ | 0.05 | | | $ | 0.36 | | | $ | 0.03 | | | $ | 0.16 | |
| (a) | Based on average shares outstanding during the period. |
| (b) | Total return is calculated assuming an initial investment made at the net asset value at the beginning of the period and redemption at the net asset value on the last day of the period and assuming all distributions are reinvested at reinvestment prices. Total return calculated for a period of less than one year is not annualized. |
| (d) | Portfolio turnover for periods less than one year is not annualized and does not include securities received or delivered from processing creations or redemptions in-kind. |
| (e) | The per share amount of equalization is presented to show the impact of equalization on distributable earnings per share. |
See Notes to Financial Statements.
ALPS ETF Trust
| Notes to Financial Statements | November 30, 2018 |
1. ORGANIZATION
ALPS ETF Trust (the “Trust”), a Delaware statutory trust, is an open-end management investment company under the Investment Company Act of 1940, as amended (the “1940 Act”). As of November 30, 2018, the Trust consisted of twenty separate portfolios. Each portfolio represents a separate series of the Trust. This report pertains to the ALPS Sector Dividend Dogs ETF, the ALPS International Sector Dividend Dogs ETF, and the ALPS Emerging Sector Dividend Dogs ETF (each a “Fund” and collectively, the “Funds”). Each Fund has elected to qualify as a diversified series of the Trust under the 1940 Act.
The investment objective of the ALPS Sector Dividend Dogs ETF is to seek investment results that replicate as closely as possible, before fees and expenses, the performance of the S-Network® Sector Dividend Dogs Index. The investment objective of the ALPS International Sector Dividend Dogs ETF is to seek investment results that replicate as closely as possible, before fees and expenses, the performance of the S-Network®International Sector Dividend Dogs Index. The investment objective of the ALPS Emerging Sector Dividend Dogs ETF is to seek investment results that replicate as closely as possible, before fees and expenses, the performance of the S-Network®Emerging Sector Dividend Dogs Index.
The shares of the ALPS Sector Dividend Dogs ETF, the ALPS International Sector Dividend Dogs ETF, and the ALPS Emerging Sector Dividend Dogs ETF (“Shares”) are listed on the NYSE Arca, Inc. (the “NYSE Arca”). Each Fund issues and redeems Shares, at net asset value (“NAV”) in blocks of 50,000 Shares, each of which is called a “Creation Unit”. Creation Units are issued and redeemed principally in-kind for securities included in the Underlying Index. Except when aggregated in Creation Units, Shares are not redeemable securities of the Fund.
Pursuant to the Trust’s organizational documents, its Officers and Trustees are indemnified against certain liability arising out of the performance of their duties to the Trust. Additionally, in the normal course of business, the Trust enters into contracts with service providers that contain general indemnification clauses. The Trust’s maximum exposure under these arrangements is unknown, as this would involve future claims that may be made against the Trust that have not yet occurred.
2. SIGNIFICANT ACCOUNTING POLICIES
The following is a summary of significant accounting policies consistently followed by the Funds in the preparation of the financial statements. The accompanying financial statements were prepared in accordance with accounting principles generally accepted in the United States of America (“U.S. GAAP”). The preparation of financial statements in conformity with U.S. GAAP requires management to make certain estimates and assumptions that affect the reported amounts of assets and liabilities and disclosures of contingent assets and liabilities at the date of the financial statements and the reported amounts of revenue and expenses during the period. Actual results could differ from those estimates. Each Fund is considered an investment company under U.S. GAAP and follows the accounting and reporting guidance applicable to investment companies in the Financial Accounting Standards BoardAccounting Standards CodificationTopic 946.
A. Portfolio Valuation
Each Fund’s NAV is determined daily, as of the close of regular trading on the New York Stock Exchange (“NYSE”), normally 4:00 p.m. Eastern time, on each day the NYSE is open for trading. The NAV is computed by dividing the value of all assets of the Fund (including accrued interest and dividends), less all liabilities (including accrued expenses and dividends declared but unpaid), by the total number of shares outstanding.
Portfolio securities listed on any exchange other than the NASDAQ are valued at the last sale price on the business day as of which such value is being determined. If there has been no sale on such day, the securities are valued at the mean of the most recent bid and ask prices on such day. Securities traded on the NASDAQ are valued at the NASDAQ Official Closing Price as determined by NASDAQ. Portfolio securities traded on more than one securities exchange are valued at the last sale price on the business day as of which such value is being determined at the close of the exchange representing the principal market for such securities. Portfolio securities traded in the over-the-counter market, but excluding securities traded on the NASDAQ, are valued at the latest quoted sale price in such market.
The Funds’ investments are valued at market value or, in the absence of market value with respect to any portfolio securities, at fair value according to procedures adopted by the Trust’s Board of Trustees (the “Board”). When market quotations are not readily available or when events occur that make established valuation methods unreliable, securities of the Funds may be valued in good faith by or under the direction of the Board. These securities generally include, but are not limited to, restricted securities (securities which may not be publicly sold without registration under the Securities Act of 1933) for which a pricing service is unable to provide a market price; securities whose trading has been formally suspended; a security whose market price is not available from a pre-established primary pricing source or the pricing source is not willing to provide a price; a security with respect to which an event has occurred that is most likely to materially affect the value of the security after the market has closed but before the calculation of the Fund’s NAV or make it difficult or impossible to obtain a reliable market quotation; or a security whose price, as provided by the pricing service, does not reflect the security’s “fair value” due to the security being de-listed from a national exchange or the security’s primary trading market is temporarily closed at a time when, under normal conditions, it would be open. As a general principle, the current “fair value” of a security would be the amount which the owner might reasonably expect to receive from the sale on the applicable exchange or principal market. A variety of factors may be considered in determining the fair value of such securities.
ALPS ETF Trust
| Notes to Financial Statements | November 30, 2018 |
B. Fair Value Measurements
Each Fund discloses the classification of its fair value measurements following a three-tier hierarchy based on the inputs used to measure fair value. Inputs refer broadly to the assumptions that market participants would use in pricing the asset or liability, including assumptions about risk. Inputs may be observable or unobservable. Observable inputs reflect the assumptions market participants would use in pricing the asset or liability that are developed based on market data obtained from sources independent of the reporting entity. Unobservable inputs reflect the reporting entity’s own assumptions about the assumptions market participants would use in pricing the asset or liability that are developed based on the best information available.
Valuation techniques used to value the Funds’ investments by major category are as follows:
Equity securities, including restricted securities, for which market quotations are readily available, are valued at the last reported sale price or official closing price as reported by a third party pricing vendor on the primary market or exchange on which they are traded and are categorized as Level 1 in the hierarchy. In the event there were no sales during the day or closing prices are not available, securities are valued at the mean of the most recent quoted bid and ask prices on such day and are generally categorized as Level 2 in the hierarchy. Investments in open-end mutual funds are valued at their closing NAV each business day and are categorized as Level 1 in the hierarchy.
Changes in valuation techniques may result in transfers in or out of an assigned level within the disclosure hierarchy.
Various inputs are used in determining the value of each Fund’s investments as of the end of the reporting period. When inputs used fall into different levels of the fair value hierarchy, the level in the hierarchy within which the fair value measurement falls is determined based on the lowest level input that is significant to the fair value measurement in its entirety. The designated input levels are not necessarily an indication of the risk or liquidity associated with these investments.
These inputs are categorized in the following hierarchy under applicable financial accounting standards:
| Level 1 | – | Unadjusted quoted prices in active markets for identical investments, unrestricted assets or liabilities that a Fund has the ability to access at the measurement date; |
| Level 2 | – | Quoted prices which are not active, quoted prices for similar assets or liabilities in active markets or inputs other than quoted prices that are observable (either directly or indirectly) for substantially the full term of the asset or liability; and |
| Level 3 | – | Significant unobservable prices or inputs (including the Fund’s own assumptions in determining the fair value of investments) where there is little or no market activity for the asset or liability at the measurement date. |
The following is a summary of the inputs used to value the Funds’ investments at November 30, 2018:
ALPS Sector Dividend Dogs ETF
| Investments in Securities at Value | | Level 1 - Unadjusted Quoted Prices | | | Level 2 - Other Significant Observable Inputs | | | Level 3 - Significant Unobservable Inputs | | | Total | |
| Common Stocks* | | $ | 2,156,572,071 | | | $ | – | | | $ | – | | | $ | 2,156,572,071 | |
| Short Term Investments | | | 3,899,464 | | | | – | | | | – | | | | 3,899,464 | |
| TOTAL | | $ | 2,160,471,535 | | | $ | – | | | $ | – | | | $ | 2,160,471,535 | |
ALPS ETF Trust
| Notes to Financial Statements | November 30, 2018 |
ALPS International Sector Dividend Dogs ETF
| Investments in Securities at Value | | Level 1 - Unadjusted Quoted Prices | | | Level 2 - Other Significant Observable Inputs | | | Level 3 - Significant Unobservable Inputs | | | Total | |
| Common Stocks* | | $ | 283,190,079 | | | $ | – | | | $ | – | | | $ | 283,190,079 | |
| Short Term Investments | | | 650,140 | | | | – | | | | – | | | | 650,140 | |
| TOTAL | | $ | 283,840,219 | | | $ | – | | | $ | – | | | $ | 283,840,219 | |
ALPS Emerging Sector Dividend Dogs ETF
| Investments in Securities at Value | | Level 1 - Unadjusted Quoted Prices | | | Level 2 - Other Significant Observable Inputs | | | Level 3 - Significant Unobservable Inputs | | | Total | |
| Common Stocks* | | $ | 35,020,298 | | | $ | – | | | $ | – | | | $ | 35,020,298 | |
| Warrants* | | | – | | | | – | | | | – | | | | – | |
| Short Term Investments | | | | | | | | | | | | | | | | |
| Money Market Fund | | | 135,767 | | | | – | | | | – | | | | 135,767 | |
| Investments Purchased with Collateral from Securities Loaned | | | 439,625 | | | | – | | | | – | | | | 439,625 | |
| TOTAL | | $ | 35,595,690 | | | $ | – | | | $ | – | | | $ | 35,595,690 | |
| * | For a detailed sector/country breakdown, see the accompanying Schedule of Investments. |
The Funds did not have any securities that used significant unobservable inputs (Level 3) in determining fair value and there were no transfers into or out of Level 3.
C. Foreign Securities
The ALPS International Sector Dividend Dogs ETF and the ALPS Emerging Sector Dividend Dogs ETF may directly purchase securities of foreign issuers. Investments in non-U.S. issuers may involve unique risks compared to investing in securities of U.S. issuers, including, among others, less liquidity generally, greater market volatility than U.S. securities and less complete financial information than for U.S. issuers. In addition, adverse political, economic or social developments could undermine the value of the Fund’s investments or prevent the Fund from realizing the full value of its investments. Financial reporting standards for companies based in foreign markets differ from those in the United States. Finally, the value of the currency of the country in which the Fund has invested could decline relative to the value of the U.S. dollar, which may affect the value of the investment to U.S. investors.
Because foreign markets may be open on different days than the days during which investors may purchase the shares of each Fund, the value of each Fund's securities may change on the days when investors are not able to purchase the shares of the Funds. The value of securities denominated in foreign currencies is converted into U.S. dollars using exchange rates determined daily as of the close of regular trading on the NYSE or NASDAQ. Any use of a different rate from the rates used by the Index may adversely affect a Fund's ability to track its Index.
D. Foreign Currency Translation
The books and records of the Funds are maintained in U.S. dollars. Investment valuations and other assets and liabilities initially expressed in foreign currencies are converted each business day into U.S. dollars based upon current exchange rates. The portion of realized and unrealized gains or losses on investments due to fluctuations in foreign currency exchange rates is not separately disclosed and is included in realized and unrealized gains or losses on investments, when applicable.
E. Securities Transactions and Investment Income
Securities transactions are recorded as of the trade date. Realized gains and losses from securities transactions are recorded on the highest cost basis. Dividend income and capital gains distributions, if any, are recorded on the ex-dividend date, net of any foreign taxes withheld. Interest income, if any, is recorded on the accrual basis, including any amortization of premiums and accretion of discounts.
F. Dividends and Distributions to Shareholders
Dividends from net investment income for each Fund, if any, are declared and paid quarterly or as the Board may determine from time to time. Distributions of net realized capital gains earned by the Funds, if any, are distributed at least annually.
ALPS ETF Trust
| Notes to Financial Statements | November 30, 2018 |
G. Equalization
The ALPS Sector Dividend Dogs ETF, the ALPS International Sector Dividend Dogs ETF, and the ALPS Emerging Sector Dividend Dogs ETF utilize the accounting practice known as “Equalization” by which a portion of the proceeds from sales and costs of reacquiring the Funds’ shares, equivalent on a per share basis to the amount of distributable net investment income on the date of the transaction, is credited or charged to undistributed net investment income. As a result, undistributed net investment income per share is unaffected by sales or reacquisitions of the Funds’ shares. Amounts related to Equalization can be found on the Statement of Changes in Net Assets.
H. Federal Tax and Tax Basis Information
The timing and character of income and capital gain distributions are determined in accordance with income tax regulations, which may differ from U.S. GAAP. Reclassifications are made to the Funds’ capital accounts for permanent tax differences to reflect income and gains available for distribution (or available capital loss carryforwards) under income tax regulations.
For the year ended November 30, 2018, the following reclassifications, which had no impact on results of operations or net assets, were recorded to reflect permanent tax differences resulting primarily from in-kind transactions:
| Fund | | Paid-in Capital | | | Total Distributable Earnings | |
| ALPS Sector Dividend Dogs ETF | | $ | 164,202,675 | | | $ | (164,202,675 | ) |
| ALPS International Sector Dividend Dogs ETF | | | 19,910,946 | | | | (19,910,946 | ) |
| ALPS Emerging Sector Dividend Dogs ETF | | | 2,369,602 | | | | (2,369,602 | ) |
The tax character of the distributions paid during the fiscal year ended November 30, 2018 and November 30, 2017 were as follows:
| Fund | | Ordinary Income | | | Return of Capital | |
| November 30, 2018 | | | | | | |
| ALPS Sector Dividend Dogs ETF | | $ | 80,000,025 | | | $ | – | |
| ALPS International Sector Dividend Dogs ETF | | | 13,263,685 | | | | – | |
| ALPS Emerging Sector Dividend Dogs ETF | | | 1,535,255 | | | | – | |
| November 30, 2017 | | | | | | | | |
| ALPS Sector Dividend Dogs ETF | | | 70,756,115 | | | | 2,592,040 | |
| ALPS International Sector Dividend Dogs ETF | | | 8,514,874 | | | | – | |
| ALPS Emerging Sector Dividend Dogs ETF | | | 1,225,826 | | | | – | |
The character of distributions made during the year may differ from its ultimate characterization for federal income tax purposes.
Under current law, capital losses maintain their character as short-term or long-term and are carried forward to the next tax year without expiration. As of November 30, 2018, the following amounts are available as carry forwards to the next tax year:
| Fund | | Short-Term | | | Long-Term | |
| ALPS Sector Dividend Dogs ETF | | $ | 16,090,987 | | | $ | 89,247,096 | |
| ALPS International Sector Dividend Dogs ETF | | | 6,138,216 | | | | 13,404,064 | |
| ALPS Emerging Sector Dividend Dogs ETF | | | 1,387,625 | | | | 2,660,474 | |
The ALPS Sector Dividend Dogs ETF and ALPS International Sector Dividend Dogs ETF used capital loss carryovers during the period ended November 30, 2018 in the amounts of $39,433,714 and $5,752,134, respectively.
As of November 30, 2018, the components of distributable earnings on a tax basis for each Fund were as follows:
| | | Undistributed net investment income | | | Accumulated net realized loss on investments | | | Net unrealized appreciation/ (depreciation) on investments | | | Total | |
| ALPS Sector Dividend Dogs ETF | | $ | 172,346 | | | $ | (105,338,083 | ) | | $ | (18,924,492 | ) | | $ | (124,090,229 | ) |
| ALPS International Sector Dividend Dogs ETF | | | 1,109,871 | | | | (19,542,280 | ) | | | (36,214,940 | ) | | | (54,647,349 | ) |
| ALPS Emerging Sector Dividend Dogs ETF | | | 750,375 | | | | (4,048,099 | ) | | | (4,983,813 | ) | | | (8,281,537 | ) |
ALPS ETF Trust
| Notes to Financial Statements | November 30, 2018 |
As of November 30, 2018, the cost of investments for federal income tax purposes and accumulated net unrealized appreciation/(depreciation) on investments were as follows:
| | | Gross Appreciation (excess of value over tax cost) | | | Gross Depreciation (excess of tax cost over value) | | | Net Appreciation/
(Depreciation) of Foreign Currency | | | Net Unrealized Appreciation/(Depreciation) | | | Cost of Investments for Income Tax Purposes | |
| ALPS Sector Dividend Dogs ETF | | $ | 207,219,684 | | | $ | (226,144,176 | ) | | $ | – | | | $ | (18,924,492 | ) | | $ | 2,179,396,027 | |
| ALPS International Sector Dividend Dogs ETF | | | 8,530,358 | | | | (44,735,215 | ) | | | (10,083 | ) | | | (36,214,940 | ) | | | 320,045,076 | |
| ALPS Emerging Sector Dividend Dogs ETF | | | 907,490 | | | | (5,892,750 | ) | | | 1,447 | | | | (4,983,813 | ) | | | 40,580,950 | |
The differences between book-basis and tax-basis are primarily due to the deferral of losses from wash sales.
I. Income Taxes
No provision for income taxes is included in the accompanying financial statements, as each Fund intends to distribute to shareholders all taxable investment income and realized gains and otherwise comply with Subchapter M of the Internal Revenue Code of 1986, as amended, applicable to regulated investment companies. Each Fund evaluates tax positions taken (or expected to be taken) in the course of preparing the Fund’s tax returns to determine whether these positions meet a “more-likely-than-not” standard that, based on the technical merits, have a more than fifty percent likelihood of being sustained by a taxing authority upon examination. A tax position that meets the “more-likely-than-not” recognition threshold is measured to determine the amount of benefit to recognize in the financial statements.
As of and during the year ended November 30, 2018, each Fund did not have a liability for any unrecognized tax benefits. Each Fund files U.S. federal, state, and local tax returns as required. Each Fund’s tax returns are subject to examination by the relevant tax authorities until expiration of the applicable statute of limitations, which is generally three years after the filing of the tax return, but may extend to four years in certain jurisdictions. Each Fund’s tax returns for open years have incorporated no uncertain tax positions that require a provision for income taxes.
J. Lending of Portfolio Securities
The Funds have entered into a securities lending agreement with State Street Bank & Trust Co. (“SSB”), the Funds’ lending agent. Each Fund may lend its portfolio securities only to borrowers that are approved by SSB. Each Fund will limit such lending to not more than 33 1/3% of the value of its total assets. The Fund’s securities held at SSB as custodian shall be available to be lent except those securities the Fund or ALPS Advisors, Inc. specifically identifies in writing as not being available for lending. The borrower pledges and maintains with the Fund collateral consisting of cash (U.S. Dollars only), securities issued or guaranteed by the U.S. government or its agencies or instrumentalities, and cash equivalents (including irrevocable bank letters of credit) issued by a person other than the borrower or an affiliate of the borrower. The initial collateral received by the Fund is required to have a value of no less than 102% of the market value of the loaned securities for U.S equity securities and a value of no less than 105% of the market value for non-U.S. equity securities. The collateral is maintained thereafter, at a market value equal to not less than 102% of the current value of the U.S. equity securities on loan and not less than 105% of the current value of the non-U.S. equity securities on loan. The market value of the loaned securities is determined at the close of each business day and any additional required collateral is delivered to the Fund on the next business day. During the term of the loan, each Fund is entitled to all distributions made on or in respect of the loaned securities. Loans of securities are terminable at any time and the borrower, after notice, is required to return borrowed securities within the customary time period for settlement of securities transactions.
Any cash collateral received is reinvested in a money market fund managed by SSB as disclosed in the Fund’s Schedule of Investments and is reflected in the Statements of Assets and Liabilities as a payable for collateral upon return of securities loaned. Non-cash collateral, in the form of securities issued or guaranteed by the U.S. government or its agencies or instrumentalities, is not disclosed in the Fund’s Statement of Assets and Liabilities as it is held by the lending agent on behalf of the Fund, and the Fund does not have the ability to re-hypothecate these securities. Income earned by the Fund from securities lending activity is disclosed in the Statement of Operations.
| | | Market Value of Securities on Loan | | | Cash Collateral Received | | | Non-Cash Collateral Received | | | Total Collateral Received | |
| ALPS Emerging Sector Dividend Dogs ETF | | $ | 589,696 | | | $ | 439,625 | | | $ | 163,150 | | | $ | 602,775 | |
ALPS ETF Trust
| Notes to Financial Statements | November 30, 2018 |
The risks of securities lending include the risk that the borrower may not provide additional collateral when required or may not return the securities when due. To mitigate these risks, the Funds benefit from a borrower default indemnity provided by SSB. SSB’s indemnity allows for full replacement of securities lent wherein SSB will purchase the unreturned loaned securities on the open market by applying the proceeds of the collateral, or to the extent such proceeds are insufficient or the collateral is unavailable, SSB will purchase the unreturned loan securities at SSB’s expense. However, the Funds could suffer a loss if the value of the investments purchased with cash collateral falls below the value of the cash collateral received.
The following table reflects a breakdown of transactions accounted for as secured borrowings, the gross obligation by the type of collateral pledged or securities loaned, and the remaining contractual maturity of those transactions as of November 30, 2018:
| ALPS Emerging Sector Dividend Dogs ETF | | Remaining contractual maturity of the agreements |
| | | | | | | | | | | | | | | |
| Securities Lending Transactions | | Overnight & Continuous | | Up to 30 days | | 30-90 days | | | Greater than 90 days | | | Total | |
| Common Stocks | | $ | 439,625 | | $ | – | | $ | – | | | $ | – | | | $ | 439,625 | |
| Total Borrowings | | | | | | | | | | | | | | | | | 439,625 | |
| Gross amount of recognized liabilities for securities lending (collateral received) | | | $ | 439,625 | |
3. INVESTMENT ADVISORY FEE AND OTHER AFFILIATED TRANSACTIONS
ALPS Advisors, Inc. (“Adviser”) serves as the Funds’ investment adviser pursuant to an Investment Advisory Agreement with the Trust on behalf of each Fund (the “Advisory Agreement). Pursuant to the Advisory Agreement, each Fund pays the Adviser an annual management fee for the services and facilities it provides as a percentage of the relevant Fund’s average daily net assets, as set out below. The Adviser served under the previous investment advisory agreement, since the commencement of each Fund until these agreements were terminated on April 16, 2018, due to a change of control of Adviser’s parent company. Beginning April 16, 2018, the Adviser served under an interim investment advisory agreement, until the current investment advisory agreement was approved by the Fund’s shareholders.
| Fund | Advisory Fee |
| ALPS Sector Dividend Dogs ETF | 0.40% |
| ALPS International Sector Dividend Dogs ETF | 0.50% |
| ALPS Emerging Sector Dividend Dogs ETF | 0.60% |
Out of the unitary management fee, the Adviser pays substantially all expenses of each Fund, including the cost of transfer agency, custody, fund administration, legal, audit, independent trustees and other services, except for interest expenses, distribution fees or expenses, brokerage expenses, taxes and extraordinary expenses not incurred in the ordinary course of each Fund's business. The Adviser’s unitary management fee is designed to pay substantially all of each Fund's expenses and to compensate the Adviser for providing services for each Fund.
ALPS Fund Services, Inc., an affiliate of the Adviser, is the administrator for the Funds.
Each Trustee who is not an officer or employee of the Adviser, any sub-adviser or any of their affiliates (“Independent Trustees”) receives (1) a quarterly retainer of $5,000, (2) a per meeting fee for regularly scheduled meetings of $3,750, (3) $1,500 for any special meeting held outside of a regularly scheduled board meeting, and (4) reimbursement for all reasonable out-of-pocket expenses relating to attendance at meetings. In addition, both the Chairman of the Board and Chairman of the Audit Committee each receives a quarterly retainer of $2,000, in connection with their respective roles.
4. PURCHASES AND SALES OF SECURITIES
For the year ended November 30, 2018, the cost of purchases and proceeds from sales of investment securities, excluding short-term investments and in-kind transactions, were as follows:
| Fund | | Purchases | | | Sales | |
| ALPS Sector Dividend Dogs ETF | | $ | 1,394,496,103 | | | $ | 1,391,456,774 | |
| ALPS International Sector Dividend Dogs ETF | | | 238,668,789 | | | | 236,362,095 | |
| ALPS Emerging Sector Dividend Dogs ETF | | | 38,558,564 | | | | 37,426,415 | |
ALPS ETF Trust
| Notes to Financial Statements | November 30, 2018 |
For the year ended November 30, 2018, the cost of in-kind purchases and proceeds from in-kind sales were as follows:
| Fund | | Purchases | | | Sales | |
| ALPS Sector Dividend Dogs ETF | | $ | 565,089,695 | | | $ | 652,040,876 | |
| ALPS International Sector Dividend Dogs ETF | | | 90,543,663 | | | | 119,541,982 | |
| ALPS Emerging Sector Dividend Dogs ETF | | | 14,960,878 | | | | 22,218,422 | |
For the year ended November 30, 2018, the in-kind net realized gains/(losses) were as follows:
| Fund | | Net Realized Gain/(Loss) | |
| ALPS Sector Dividend Dogs ETF | | $ | 170,567,110 | |
| ALPS International Sector Dividend Dogs ETF | | | 20,482,868 | |
| ALPS Emerging Sector Dividend Dogs ETF | | | 2,991,269 | |
Gains on in-kind transactions are not considered taxable for federal income tax purposes and losses on in kind transactions are also not deductible for tax purposes.
5. CAPITAL SHARE TRANSACTIONS
Shares are created and redeemed by each Fund only in Creation Unit size aggregations of 50,000 shares. Only broker-dealers or large institutional investors with creation and redemption agreements called Authorized Participants (“AP”) are permitted to purchase or redeem Creation Units from the Funds. Such transactions are generally permitted on an in-kind basis, with a balancing cash component to equate the transaction to the NAV per unit of each Fund on the transaction date. Cash may be substituted equivalent to the value of certain securities generally when they are not available in sufficient quantity for delivery, not eligible for trading by the AP or as a result of other market circumstances.
6. RELATED PARTY TRANSACTIONS
The ALPS Sector Dvidend Dogs ETF engaged in cross trades between other funds in the Trust during the year ended November 30, 2018 pursuant to Rule 17a-7 under the 1940 Act. Cross trading is the buying or selling of portfolio securities between funds to which the Adviser serves as the investment adviser. The Board previously adopted procedures that apply to transactions between the Funds of the Trust pursuant to Rule 17a-7. These transactions related to cross trades during the period complied with the requirements set forth by Rule 17a-7 and the Trust’s procedures.
Transactions related to cross trades during the year ended November 30, 2018, were as follows:
| Fund | | Purchase cost paid | | | Sale proceeds received | | | Realized gain/(loss) on sales | |
| ALPS Sector Dividend Dogs ETF | | $ | 2,203,500 | | | $ | 1,988,777 | | | $ | (84,220 | ) |
7. NEW ACCOUNTING PRONOUNCEMENTS
In August 2018, the Financial Accounting Standards Board (“FASB”) issued Accounting Standards Update (“ASU”) 2018-13, which changes the fair value measurement disclosure requirements of FASB ASC Topic 820, Fair Value Measurement. The update to Topic 820 includes new, eliminated, and modified disclosure requirements. ASU 2018-13 is effective for fiscal years beginning after December 15, 2019, including interim periods. Early adoption is permitted for any eliminated or modified disclosures. The Funds have elected to early adopt the eliminated and modified disclosures effective with the financial statements prepared as of November 30, 2018.
8. SEC REGULATIONS
On October 4, 2018, the SEC amended Regulation S-X to require certain financial statement disclosure requirements to conform them to GAAP for investment companies. Effective November 4, 2018, the Fund adopted disclosure requirement changes for Regulation S-X, these changes are reflected throughout this report. The Fund’s adoption of the amendments, effective with the financial statements prepared as of November 30, 2018, had no effect on the Fund’s net assets or results of operations.
ALPS ETF Trust
| Additional Information | November 30, 2018 (Unaudited) |
PROXY VOTING POLICIES AND PROCEDURES
Information regarding how the Fund voted proxies relating to portfolio securities during the most recent 12-month period ended June 30 and a description of the Fund’s proxy voting policies and procedures used in determining how to vote for proxies are available without charge on the SEC’s website at www.sec.gov and upon request, by calling (toll-free) 1-866-675-2639.
PORTFOLIO HOLDINGS
The Trust is required to disclose, after its first and third fiscal quarters, the complete schedule of each Fund’s portfolio holdings with the SEC on Form N-Q. Form N-Q for each Fund will be available on the SEC’s website at www.sec.gov. Each Fund’s Form N-Q may also be reviewed and copied at the SEC’s Public Reference Room in Washington, D.C. and information on the operation of the Public Reference Room may be obtained by calling 1-800-SEC-0330. Each Fund’s Form N-Q will be available without charge, upon request, by calling (toll-free) 1-866-675-2639 or by writing to ALPS ETF Trust at 1290 Broadway, Suite 1100, Denver, Colorado 80203.
TAX INFORMATION
The Funds designated the following for federal income tax purposes for distributions made during the calendar year ended December 31, 2017:
| | Qualified Dividend Income | Dividend Received Deduction |
| ALPS Sector Dividend Dogs ETF | 100.00% | 93.85% |
| ALPS International Sector Dividend Dogs ETF | 98.20% | 0.00% |
| ALPS Emerging Sector Dividend Dogs ETF | 76.38% | 0.00% |
In early 2018, if applicable, shareholders of record received this information for the distributions paid to them by the Funds during the calendar year 2017 via Form 1099. The Funds will notify shareholders in early 2019 of amounts paid to them by the Funds, if any, during the calendar year 2018.
Pursuant to Section 853(c) of the Internal Revenue Code, the following Funds designated the following for the calendar year ended December 31, 2018:
| | Foreign Taxes Paid | Foreign Source Income |
| ALPS International Sector Dividend Dogs ETF | $1,165,122 | $16,920,860 |
| ALPS Emerging Sector Dividend Dogs ETF | $200,008 | $2,111,433 |
LICENSING AGREEMENTS
ALPS Sector Dividend Dogs ETF, ALPS International Sector Dividend Dogs ETF, and ALPS Emerging Sector Dividend Dogs ETF
The Funds are not sponsored, endorsed, sold or promoted by the Index Provider. The Index Provider makes no representation or warranty, express or implied, to the owners of each Fund or any member of the public regarding the advisability of investing in securities generally or in each Fund particularly or the ability of each Fund to track the performance of the physical commodities market. The Index Provider’s only relationship to the Adviser or each Fund is the licensing of certain service marks and trade names of the Index Provider and of each Underlying Index that is determined, composed and calculated by the Index Provider without regard to the Adviser or the Funds. The Index Provider has no obligation to take the needs of the Adviser or the Funds or the owners of each Fund into consideration in determining, composing or calculating each Underlying Index. The Index Provider is not responsible for and has not participated in the determination of the timing of, prices at, or quantities of each Fund to be issued or in the determination or calculation of the equation by which each Fund is to be converted into cash. The Index Provider has no obligation or liability in connection with the administration, marketing or trading of each Fund.
THE INDEX PROVIDER DOES NOT GUARANTEE THE ACCURACY AND/OR THE COMPLETENESS OF EACH UNDERLYING INDEX OR ANY DATA INCLUDED THEREIN AND THE INDEX PROVIDER SHALL HAVE NO LIABILITY FOR ANY ERRORS, OMISSIONS, OR INTERRUPTIONS THEREIN. THE INDEX PROVIDER MAKES NO WARRANTY, EXPRESS OR IMPLIED, AS TO RESULTS TO BE OBTAINED BY THE ADVISER, EACH FUND, OWNERS OF EACH FUND, OR ANY OTHER PERSON OR ENTITY FROM THE USE OF THE UNDERLYING INDEX OR ANY DATA INCLUDED THEREIN. THE INDEX PROVIDER MAKES NO EXPRESS OR IMPLIED WARRANTIES, AND EXPRESSLY DISCLAIMS ALL WARRANTIES OF MERCHANTABILITY OR FITNESS FOR A PARTICULAR PURPOSE OR USE WITH RESPECT TO EACH UNDERLYING INDEX OR ANY DATA INCLUDED THEREIN. WITHOUT LIMITING ANY OF THE FOREGOING, IN NO EVENT SHALL THE INDEX PROVIDER HAVE ANY LIABILITY FOR ANY SPECIAL, PUNITIVE, INDIRECT, OR CONSEQUENTIAL DAMAGES (INCLUDING LOST PROFITS), EVEN IF NOTIFIED OF THE POSSIBILITY OF SUCH DAMAGES.
ALPS ETF Trust
| Additional Information | November 30, 2018 (Unaudited) |
The Funds are not sponsored, endorsed, sold or promoted by Standard & Poor’s, a division of The McGraw-Hill Companies, Inc. (“S&P”) or its third party licensors. Neither S&P nor its third party licensors make any representation or warranty, express or implied, to the owners of each Fund or any member of the public regarding the advisability of investing in securities generally or in each Fund particularly or the ability of each Underlying Index to track general stock market performance. S&P’s and its third party licensor’s only relationship to the Index Provider is the licensing of certain trademarks, service marks and trade names of S&P and/or its third party licensors and for the providing of calculation and maintenance services related to the Underlying Index. Neither S&P nor its third party licensors is responsible for and has not participated in the determination of the prices and amount of each Fund or the timing of the issuance or sale of each Fund or in the determination or calculation of the equation by which each Fund is to be converted into cash. S&P has no obligation or liability in connection with the administration, marketing or trading of each Fund.
NEITHER S&P, ITS AFFILIATES NOR THEIR THIRD PARTY LICENSORS GUARANTEE THE ADEQUACY, ACCURACY, TIMELINESS OR COMPLETENESS OF EACH UNDERLYING INDEX OR ANY DATA INCLUDED THEREIN OR ANY COMMUNICATIONS, INCLUDING BUT NOT LIMITED TO, ORAL OR WRITTEN COMMUNICATIONS (INCLUDING ELECTRONIC COMMUNICATIONS) WITH RESPECT THERETO. S&P, ITS AFFILIATES AND THEIR THIRD PARTY LICENSORS SHALL NOT BE SUBJECT TO ANY DAMAGES OR LIABILITY FOR ANY ERRORS, OMISSIONS OR DELAYS THEREIN. S&P MAKES NO EXPRESS OR IMPLIED WARRANTIES, AND EXPRESSLY DISCLAIMS ALL WARRANTIES OF MERCHANTABILITY OR FITNESS FOR A PARTICULAR PURPOSE OR USE WITH RESPECT TO ITS TRADEMARKS, EACH UNDERLYING INDEX OR ANY DATA INCLUDED THEREIN. WITHOUT LIMITING ANY OF THE FOREGOING, IN NO EVENT WHATSOEVER SHALL S&P, ITS AFFILIATES OR THEIR THIRD PARTY LICENSORS BE LIABLE FOR ANY INDIRECT, SPECIAL, INCIDENTAL, PUNITIVE OR CONSEQUENTIAL DAMAGES, INCLUDING BUT NOT LIMITED TO, LOSS OF PROFITS, TRADING LOSSES, LOST TIME OR GOODWILL, EVEN IF THEY HAVE BEEN ADVISED OF THE POSSIBILITY OF SUCH DAMAGES, WHETHER IN CONTRACT, TORT, STRICT LIABILITY OR OTHERWISE.
Standard & Poor’s®and S&P® are registered trademarks of The McGraw-Hill Companies, Inc.; “Calculated by S&P Custom Indices” and its related stylized mark are service marks of The McGraw-Hill Companies, Inc. These marks have been licensed for use by the Index Provider.
The S&P 500® is the property of Standard and Poor’s Financial Services LLC (“S&P”) and has been licensed by S&P for use by S-Network® Global Indexes, Inc. in connection with the S-Network® Sector Dividend Dogs Index (Ticker: SDOGX), the S-Network®Emerging Sector Dividend Dogs Index (Ticker: EDOGX), and the S-Network®International Sector Dividend Dogs Index (Ticker: IDOGX).
The Adviser does not guarantee the accuracy and/or the completeness of each Underlying Index or any data included therein, and the Adviser shall have no liability for any errors, omissions or interruptions therein. The Adviser makes no warranty, express or implied, as to results to be obtained by each Fund, owners of the Shares of each Fund or any other person or entity from the use of each Underlying Index or any data included therein. The Adviser makes no express or implied warranties, and expressly disclaims all warranties of merchantability or fitness for a particular purpose or use with respect to each Underlying Index or any data included therein. Without limiting any of the foregoing, in no event shall the Adviser have any liability for any special, punitive, direct, indirect or consequential damages (including lost profits) arising out of matters relating to the use of each Underlying Index, even if notified of the possibility of such damages.
| Trustees & Officers | November 30, 2018 (Unaudited) |
The general supervision of the duties performed by the Adviser for the Fund under the Investment Advisory Agreement is the responsibility of the Board of Trustees. The Trust currently has four Trustees. Three Trustees have no affiliation or business connection with the Adviser or any of its affiliated persons and do not own any stock or other securities issued by the Adviser. These are the “non-interested” or “independent” Trustees (“Independent Trustees”). The other Trustee (the “Interested Trustee”) is affiliated with the Adviser.
The Independent Trustees of the Trust, their term of office and length of time served, their principal business occupations during the past five years, the number of portfolios in the Fund Complex overseen by each Independent Trustee, and other directorships, if any, held by the Trustee are shown below.
INDEPENDENT TRUSTEES
Name, Address & Year of Birth* | Position(s) Held with Trust | Term of Office and Length of Time Served** | Principal Occupation(s) During Past 5 Years | Number of Portfolios in Fund Complex Overseen by Trustees*** | Other Directorships Held by Trustees |
Mary K. Anstine,
1940 | Trustee | Since March 2008 | Ms. Anstine was President/Chief Executive Officer of HealthONE Alliance, Denver, Colorado, and former Executive Vice President of First Interstate Bank of Denver. Ms. Anstine is also Trustee/Director of AV Hunter Trust and Colorado Uplift Board. Ms. Anstine was formerly a Director of the Trust Bank of Colorado (later purchased and now known as Northern Trust Bank), HealthONE and Denver Area Council of the Boy Scouts of America and a member of the American Bankers Association Trust Executive Committee. | 41 | Ms. Anstine is a Trustee of ALPS Variable Investment Trust (9 funds); Financial Investors Trust (33 funds); Reaves Utility Income Fund (1 fund); and Segall Bryant & Hamill Trust (14 funds). |
Jeremy W. Deems,
1976 | Trustee | Since March 2008 | Mr. Deems is the Co-Founder, Chief Compliance Officer and Chief Financial Officer of Green Alpha Advisors, LLC. Mr. Deems is Co-Portfolio Manager of the Shelton Green Alpha Fund. Prior to joining Green Alpha Advisors, Mr. Deems was CFO and Treasurer of Forward Management, LLC, ReFlow Management Co., LLC, ReFlow Fund, LLC, a private investment fund, and Sutton Place Management, LLC, an administrative services company. | 41 | Mr. Deems is a Trustee of ALPS Variable Investment Trust (9 funds); Financial Investors Trust (33 funds); and Reaves Utility Income Fund (1 fund); and Clough Funds Trust (1 fund). |
Rick A. Pederson,
1952 | Trustee and Chairman | Since March 2008. Has served as Chairman since July 2017. | Mr. Pederson is Partner, Bow River Capital Partners (private equity management), 2003 - present; Board Member, Prosci Inc. (private business services) 2013-2016; Board Member, Citywide Banks (Colorado community bank) 2014-present; Board Member, Strong-Bridge Consulting (management consulting) 2015-present; Board Member, IRI/ODMS Holdings LLC, 2017 – present; Director, National Western Stock Show (not-for-profit organization) 2010 – present; Board Member, History Colorado, 2015 – present; Trustee, Boettcher Foundation, 2018. | 21 | Mr. Pederson is Trustee of Segall Bryant & Hamill Trust (14 funds) and Principal Real Estate Income Fund (1 fund) |
| * | The business address of the Trustee is c/o ALPS Advisors, Inc., 1290 Broadway, Suite 1100, Denver, Colorado 80203. |
| ** | This is the period for which the Trustee began serving the Trust. Each Trustee serves an indefinite term, until his successor is elected. |
| *** | The Fund Complex includes all series of the Trust and any other investment companies for which ALPS Advisors, Inc. provides investment advisory services. |
| Trustees & Officers | November 30, 2018 (Unaudited) |
The Trustee who is affiliated with the Adviser or affiliates of the Adviser and executive officers of the Trust, his term of office and length of time served, his principal business occupations during the past five years, the number of portfolios in the Fund Complex overseen by the Interested Trustee and the other directorships, if any, held by the Trustee, are shown below.
INTERESTED TRUSTEE
Name, Address and Year of Birth of Interested Trustee* | Position(s) Held with Trust | Term of Office and Length of Time Served** | Principal Occupation(s) During Past 5 Years | Number of Portfolios in Fund Complex Overseen by Trustees*** | Other Directorships Held by Trustee |
Edmund J. Burke, 1961 | Trustee and President | Since December 2017 | Mr. Burke is President and a Director of ALPS Holdings, Inc. (“AHI”) (since 2005) and Director of Boston Financial Data Services, Inc. (“BFDS”), ALPS Advisors, Inc. (“AAI”), ALPS Distributors, Inc. (“ADI”), ALPS Fund Services, Inc. (“AFS”) and ALPS Portfolio Solutions Distributor, Inc. (“APSD”). Because of his positions with AHI, BFDS, AAI, ADI, AFS and APSD, Mr. Burke is deemed an affiliate of the Trust as defined under the 1940 Act. | 36 | Mr. Burke is a Trustee of Clough Global Dividend and Income Fund (1 fund); Clough Global Equity Fund (1 fund); Clough Global Opportunities Fund (1 fund); Clough Funds Trust (1 fund); Liberty All-Star Equity Fund (1 fund); Director of the Liberty All-Star Growth Fund, Inc. (1 fund) and Financial Investors Trust (33 funds). |
| * | The business address of the Trustee is c/o ALPS Advisors, Inc., 1290 Broadway, Suite 1100, Denver, Colorado 80203. |
| ** | This is the period for which the Trustee began serving the Trust. Each Trustee serves an indefinite term, until his successor is elected. |
| *** | The Fund Complex includes all series of the Trust and any other investment companies for which ALPS Advisors, Inc. provides investment advisory services. |
| Trustees & Officers | November 30, 2018 (Unaudited) |
OFFICERS
Name, Address and Year of Birth of Officer* | Position(s) Held with Trust | Length of Time Served** | Principal Occupation(s) During Past 5 Years |
Erin D. Nelson,
1977 | Chief Compliance Officer (“CCO”) | Since December 2015 | Ms. Nelson became Senior Vice-President and Chief Compliance Officer of ALPS Advisors, Inc. on July 1, 2015 and prior to that served as Vice President and Deputy Chief Compliance Officer of AAI since January 1, 2015. Prior to January 1, 2015, Ms. Nelson was Vice-President and Assistant General Counsel of ALPS Fund Services. Because of her position with AAI, Ms. Nelson is deemed an affiliate of the Trust as defined under the 1940 Act. Ms. Nelson is also the CCO of ALPS Variable Investment Trust, Liberty All-Star Growth Fund, Inc., Liberty All-Star Equity Fund, Principal Real Estate Income Fund, RiverNorth Opportunities Fund, Inc. and Red Rocks Capital, LLC. |
Kathryn Burns,
1976 | Treasurer | Since September 2018 | Ms. Burns serves as Vice President, Director of Fund Operations of AAI since 2018. From 2013 to 2018, she served as Vice President and Fund Controller at ALPS Fund Services. Prior to joining ALPS, she worked at Old Mutual Capital where she served as Vice President and Chief Compliance Officer (2010 – 2012) and Regulatory Reporting Manager and Assistant Treasurer to the Old Mutual Funds Trusts (2006 – 2012). She also served as a CPA for PricewaterhouseCoopers LLP. Ms. Burns is also Treasurer of ALPS Variable Investment Trust, the Boulder Growth & Income Fund, Inc., Principal Real Estate Income Fund and the RiverNorth Opportunities Fund Inc. |
Andrea E. Kuchli,
1985 | Secretary | Since December 2017 | Ms. Kuchli joined ALPS in 2015 and is currently Vice President and Senior Counsel of ALPS. Prior to joining ALPS, Ms. Kuchli was an Associate with Davis Graham & Stubbs LLP from April 2014 to February 2015, and an Associate with Dechert LLP from 2011 to April 2014. Because of her position with ALPS, Ms. Kuchli is deemed an affiliate of the Trust as defined under the 1940 Act. Ms. Kuchli is also Secretary of ALPS Variable Investment Trust and Principal Real Estate Income Fund as well as Assistant Secretary of the James Advantage Funds. |
Sharon Akselrod,
1974 | Assistant Secretary | Since December 2016 | Ms. Akselrod joined ALPS in August 2014 and is currently Senior Investment Company Act Paralegal of ALPS Fund Services, Inc. Prior to joining ALPS, Ms. Akselrod served as Corporate Governance and Regulatory Associate for Nordstrom fsb (2013-2014) and Senior Legal Assistant – Legal Manager for AXA Equitable Life Insurance Company (2008-2013). Because of her position with ALPS, Ms. Akselrod is deemed an affiliate of the Trust as defined under the 1940 Act. Ms. Akselrod is also Assistant Secretary of Financial Investors Trust, ALPS Variable Investment Trust, Principal Real Estate Income Fund and Clough Funds Trust. |
| * | The business address of each Officer is c/o ALPS Advisors, Inc., 1290 Broadway, Suite 1100, Denver, Colorado 80203. |
| ** | This is the period for which the Officer began serving the Trust. Each Officer serves an indefinite term, until his/her successor is elected. |
TABLE OF CONTENTS
| Performance Overview | 1 |
| Disclosure of Fund Expenses | 5 |
| Report of Independent Registered Public Accounting Firm | 6 |
| Schedule of Investments | 7 |
| Statement of Assets and Liabilities | 12 |
| Statement of Operations | 13 |
| Statements of Changes in Net Assets | 14 |
| Financial Highlights | 15 |
| Notes to Financial Statements | 16 |
| Additional Information | 22 |
| Trustees & Officers | 24 |
Beginning on January 1, 2021, as permitted by regulations adopted by the U.S. Securities and Exchange Commission, paper copies of the Fund’s annual and semi-annual shareholder reports will no longer be sent by mail, unless you specifically request paper copies of the reports from your financial intermediary (such as a broker-dealer or bank). Instead, the reports will be made available on the Fund’s website (www.alpsfunds.com), and you will be notified by mail each time a report is posted and provided with a website link to access the report.
If you already elected to receive shareholder reports electronically, you will not be affected by this change and you need not take any action. You may elect to receive shareholder reports and other communications from the Fund electronically anytime by contacting your financial intermediary.
You may elect to receive all future reports in paper free of charge. You can contact your financial intermediary to request that you continue to receive paper copies of your shareholder reports. Your election to receive reports in paper will apply to all funds held in your account with your financial intermediary.
Barron’s 400SM ETF
| Performance Overview | November 30, 2018 (Unaudited) |
Investment Objective
The Barron’s 400SM ETF (the “Fund”) seeks investment results that correspond generally, before fees and expenses, to the performance of the Barron’s 400 IndexSM (the “Underlying Index”). The Underlying Index is a rules-based index intended to give investors a means of tracking the overall performance of high performing equity securities of U.S. companies. The Fund will invest at least 80% of its total assets in the equity securities which comprise the Underlying Index.
The Underlying Index generally consists of 400 stocks. The Underlying Index’s stocks are constituents of the MarketGrader U.S. Coverage Universe. In compiling the Underlying Index, MarketGrader Capital, LLC (the “Index Provider”) selects the 400 stocks from the MarketGrader U.S. Coverage Universe by using a methodology that selects components based on the strength of their fundamentals in growth, value, profitability and cash flow and then screens such potential Underlying Index components for certain criteria regarding concentration, market capitalization and liquidity. The eligible stocks that are selected for inclusion in the Underlying Index’s portfolio are equally weighted. The Underlying Index is rebalanced by the Index Provider semiannually, on the third Friday of March and September each year.
Performance Overview
The Barron’s 400SM ETF (BFOR) closed its fiscal year ended November 30th, 2018 very differently from how it started, as the Fund gave up all of its year-to-date returns during the months of September and October. As a result of its late-year decline, the Fund ended down 2.12% for the year (total return), trailing its benchmark, the Barron’s 400 Index SM (B400T), which fell 1.51% during the same period. Thus, the Barron’s 400 SM ETF (BFOR) ended the year 835 basis points behind the Dow Jones U.S. Total Stock Market Index (DWCFT), the broadest measure of the U.S. equity market, which gained 5.49% on a cumulative, total return basis for the 12-month period ended on November 30, 2018. Figure 1 illustrates the fund’s monthly performance for the year just ended.
Figure 1. Monthly Performance of the Barron’s 400SM ETF (BFOR) During Its Fiscal Year 20181
| Month | Return | Month | Return |
| December 2017 | +0.03% | June 2018 | +0.60% |
| January 2018 | +3.87% | July 2018 | +1.35% |
| February 2018 | -3.52% | August 2018 | +4.39% |
| March 2018 | -0.05% | September 2018 | -2.18% |
| April 2018 | -0.39% | October 2018 | -10.86% |
| May 2018 | +4.11% | November 2018 | +0.69% |
During the most recently ended fiscal year, a total of 731 stocks were members of the Barron’s 400 Index, which rebalances semi-annually in March and September. Of these, 315 stocks had a net positive return during the index’s fiscal year while 416 had a net negative return. The fact that the number of total stocks in the index during a single fiscal year is higher than its 400-constituent cap is explained by the fact that each fiscal year includes stocks from three selection periods (in the most recent year’s case these included the selections from September 2017, March 2018 and September 2018). A total of 148 stocks were selected in all three periods, with only 41.2% of them delivering a positive return and 58.8% of them delivering a net negative return.
A close look at the ratio of negative to positive performers by sector for the full year helps explain the Fund’s relatively poor return, as only two of the sectors to which it had a sizable exposure had a lower number of stocks with a negative return than those with a positive return. This is summarized in Figure 2.
| 1 | All returns are based on the market value of the fund at each month’s end relative to the value at the end of the preceding month. Source: Bloomberg. |
| Performance Overview | November 30, 2018 (Unaudited) |
Figure 2. Ratio of Stocks with Negative to Positive Returns in the Barron’s 400 Index (B400) During Fiscal Year 20182
| Sector | Total Stocks | # with Neg. Returns | # with Pos. Return | Neg./Pos. Ratio |
| Consumer Discretionary | 114 | 60 | 54 | 1.11 |
| Consumer Staples | 32 | 15 | 17 | 0.88 |
| Energy | 63 | 50 | 13 | 3.85 |
| Financials | 151 | 89 | 62 | 1.44 |
| Health Care | 58 | 31 | 27 | 1.15 |
| Industrials | 150 | 87 | 63 | 1.38 |
| Materials | 35 | 25 | 10 | 2.50 |
| Technology | 119 | 59 | 60 | 0.98 |
| Telecommunications | 3 | 0 | 3 | NM |
| Utilities | 6 | 0 | 6 | NM |
The average price return among all 416 stocks that lost in value during the period they were held by the Barron’s 400 Index (B400) was -15.60%. Meanwhile, the average return among all 315 gainers was +18.24%. Figure 3 illustrates the top and bottom 10 performers in B400 during fiscal year 2018.
Figure 3. Top and Bottom 10 Performing Stocks in the Barron’s 400 Index (B400) During Fiscal Year 20183
Top Ten Performing Stocks Name | Ticker | Sector | Return (%) |
| Vantiv, Inc. | WP | Technology | 209.99% |
| Trade Desk, Inc. | TTD | Consumer Discretionary | 189.89% |
| Health Insurance Innovations, Inc. | HIIQ | Financials | 145.82% |
| Denbury Resources Inc. | DNR | Energy | 134.87% |
| Medifast, Inc. | MED | Consumer Discretionary | 116.69% |
| Bioverativ, Inc. | BIVV | Health Care | 109.88% |
| R1 RCM Inc. | RCM | Industrials | 100.26% |
| Insperity, Inc. | NSP | Industrials | 95.08% |
| HealthEquity Inc. | HQY | Financials | 78.25% |
| Etsy, Inc. | ETSY | Industrials | 70.82% |
Bottom Ten Performing Stocks Name | Ticker | Sector | Return (%) |
| Laredo Petroleum, Inc. | LPI | Energy | -59.12% |
| Thor Industries, Inc. | THO | Consumer Discretionary | -55.84% |
| Kronos Worldwide, Inc. | KRO | Materials | -55.68% |
| Winnebago Industries | WGO | Consumer Discretionary | -54.28% |
| Hi-Crush Partners LP | HCLP | Materials | -52.93% |
| Coherent, Inc. | COHR | Technology | -52.68% |
| McDermott International, Inc. | MDR | Energy | -52.64% |
| Casa Systems, Inc. | CASA | Technology | -51.56% |
| WageWorks, Inc. | WAGE | Technology | -48.04% |
| Pilgrim’s Pride Corporation | PPC | Consumer Staples | -45.9% |
| 2 | This table includes the total number of stocks held in each sector throughout fiscal year 2018, regardless of hold period. Their performance is based on price returns for the period held. The last column denotes the ratio of stocks with a negative return to those with a positive return for each sector. The ratio is not meaningful (NM) for Telecommunications and Utilities since these two sectors only held three and six stocks respectively, with all having a positive return during the period they were held in the index, resulting in a ratio of zero. |
| 3 | Based on cumulative price return for every stock while they were members of the Barron’s 400 Index between December 1, 2017 and November 30, 2018. Sources: FactSet and MarketGrader Research. |
Barron’s 400SM ETF
| Performance Overview | November 30, 2018 (Unaudited) |
Performance(as of November 30, 2018)
| | 1 Year | 3 Year | 5 Year | Since Inception^ |
| Barron’s 400SM ETF – NAV | -2.12% | 9.19% | 7.31% | 9.76% |
| Barron’s 400SM ETF – Market Price* | -2.09% | 9.23% | 7.32% | 9.77% |
| Barron’s 400 IndexSM | -1.51% | 9.88% | 8.02% | 10.49% |
Total Expense Ratio (per the current prospectus) 0.66%
Performance data quoted represents past performance. Past performance does not guarantee future results. The table does not reflect the deduction of taxes that a shareholder would pay on Fund distributions or the redemption of Fund shares. Investment return and principal value of an investment will fluctuate so that an investor’s shares, when sold or redeemed, may be worth more or less than the original cost. Current performance data may be higher or lower than actual data quoted. For the most current month-end performance data please visit www.alpsfunds.com or call 1.855.724.0450.
NAV is an exchange-traded fund’s per-share value. The per-share dollar amount of the Fund is derived by dividing the total value of all the securities in its portfolio, less any liabilities, by the number of Fund shares outstanding. Market Price is the price at which a share can currently be traded in the market. Information detailing the number of days the Market Price of the Fund was greater than the Fund’s NAV and the number of days it was less than the Fund’s NAV can be obtained at www.alpsfunds.com.
| ^ | The Fund commenced Investment Operations on June 4, 2013. |
| * | Market Price is based on the midpoint of the bid/ask spread at 4 p.m. ET and does not represent the returns an investor would receive if shares were traded at other times. |
The Barron’s 400 IndexSM, calculated by NYSE Arca or its affiliates, measures the performance of a diversified group of U.S. companies selected in part based on fundamentals-related rules-based criteria. The index includes companies that have scored highest according to fundamentals-related rankings calculated by MarketGrader Capital, LLC. Additional rules-based screening provides for sector and market cap diversification. The Underlying Index has been licensed by MarketGrader for use with the Barron’s 400SMETF.
The index is not actively managed and does not reflect any deductions for fees, expenses or taxes. One cannot invest directly in an index. Index performance does not reflect Fund performance.
Funds that emphasize investments in small/mid cap companies will generally experience greater price volatility.
Barron’s 400SM ETF shares are not individually redeemable. Investors buy and sell shares of the Barron’s 400SM ETF on a secondary market. Only market makers or “authorized participants” may trade directly with the Fund, typically in blocks of 50,000 shares.
The Barron’s 400SM ETF is not suitable for all investors. Investments in the Fund are subject to investment risks, including possible loss of the principal amount invested.
ALPS Portfolio Solutions Distributor, Inc., a FINRA member, is the distributor for the Fund.
Barron’s 400SM ETF
| Performance Overview | November 30, 2018 (Unaudited) |
Top 10 Holdings*(as of November 30, 2018)
| Electro Scientific Industries, Inc. | 0.47% |
| Marathon Petroleum Corp. | 0.44% |
| Cabot Microelectronics Corp. | 0.37% |
| Cracker Barrel Old Country Store, Inc. | 0.36% |
| AMN Healthcare Services, Inc. | 0.35% |
| Cohu, Inc. | 0.35% |
| Exelixis, Inc. | 0.34% |
| Starbucks Corp. | 0.34% |
| Deckers Outdoor Corp. | 0.34% |
| Valero Energy Partners LP | 0.33% |
| Total % of Top 10 Holdings | 3.69% |
| * | % of Total Investments (excluding investments purchased with collateral from securities loaned). |
Future holdings are subject to change.
Sector Allocation*(as of November 30, 2018)

Growth of $10,000(as of November 30, 2018)
Comparison of change in value of a $10,000 investment in the Fund and the Underlying Index
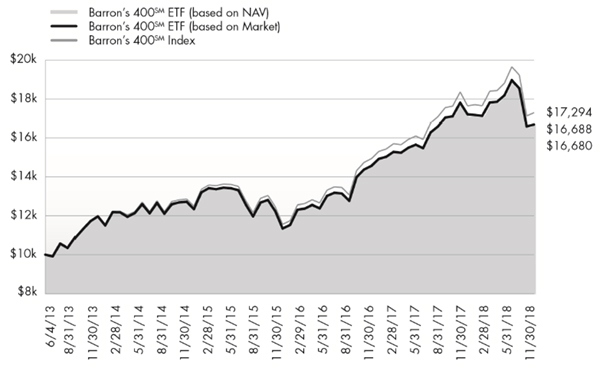
The chart above represents historical performance of a hypothetical investment of $10,000 in the Fund over the life of the Fund. Past performance does not guarantee future results. This chart does not reflect the deduction of taxes that a shareholder would pay on Fund distributions or the redemption of Fund shares.
Barron’s 400SM ETF
| Disclosure of Fund Expenses | November 30, 2018 (Unaudited) |
Shareholder Expense Example: As a shareholder of the Fund, you incur two types of costs: (1) transaction costs which may include creation and redemption fees or brokerage charges, and (2) ongoing costs, including management fees and other Fund expenses. These examples are intended to help you understand your ongoing costs (in dollars) of investing in the Fund and to compare these costs with the ongoing costs of investing in other funds. It is based on an investment of $1,000 invested at the beginning of the (six month) period and held through November 30, 2018.
Actual Return: The first line of the table provides information about actual account values and actual expenses. You may use the information in this line, together with the amount you invested, to estimate the expenses that you incurred over the period. Simply divide your account value by $1,000 (for example, an $8,600 account value divided by $1,000 = 8.6), then multiply the result by the number in the first line under the heading entitled “Expenses Paid During Period” to estimate the expenses attributable to your investment during this period.
Hypothetical 5% Return: The second line of the table provides information about hypothetical account values and hypothetical expenses based on the Fund’s actual expense ratio and an assumed rate of return of 5% per year before expenses, which is not the Fund’s actual return. The hypothetical account values and expenses may not be used to estimate the actual ending account balance or expenses you paid for the period. You may use this information to compare ongoing costs of investing in the Fund and other funds. To do so, compare this 5% hypothetical example with the 5% hypothetical examples that appear in the shareholder reports of other funds.
The expenses shown in the table are meant to highlight ongoing Fund costs only and do not reflect any transaction costs, such as creation and redemption fees or brokerage charges. Therefore, the second line is useful in comparing ongoing costs only, and will not help you determine the relative total costs of owning different funds. In addition, if these costs were included, your costs would have been higher.
| | Beginning Account Value 6/1/18 | Ending Account Value 11/30/18 | Expense Ratio(a) | Expenses Paid During Period 6/1/18 - 11/30/18(b) |
| Barron's 400 ETF | | | | |
| Actual | $1,000.00 | $936.90 | 0.65% | $3.16 |
| Hypothetical (5% return before expenses) | $1,000.00 | $1,021.81 | 0.65% | $3.29 |
| (a) | Annualized, based on the Fund's most recent fiscal half year expenses. |
| (b) | Expenses are equal to the Fund's annualized expense ratio multiplied by the average account value over the period, multiplied by the number of days in the most recent fiscal half year (183), divided by 365. |
Barron’s 400SM ETF
Report of Independent Registered Public Accounting Firm
To the shareholders and the Board of Trustees of ALPS ETF Trust:
Opinion on the Financial Statements and Financial Highlights
We have audited the accompanying statement of assets and liabilities, including the schedule of investments, of Barron’s 400 SM ETF (the “Fund”), one of the funds constituting the ALPS ETF Trust, as of November 30, 2018, the related statement of operations for the year then ended, the statements of changes in net assets for each of the two years in the period then ended, the financial highlights for each of the five years in the period then ended, and the related notes. In our opinion, the financial statements and financial highlights present fairly, in all material respects, the financial position of Barron’s 400 SM ETF of ALPS ETF Trust as of November 30, 2018, and the results of its operations for the year then ended, the changes in its net assets for each of the two years in the period then ended, and the financial highlights for each of the five years in the period then ended, in conformity with accounting principles generally accepted in the United States of America.
Basis for Opinion
These financial statements and financial highlights are the responsibility of the Fund's management. Our responsibility is to express an opinion on the Fund’s financial statements and financial highlights based on our audits. We are a public accounting firm registered with the Public Company Accounting Oversight Board (United States) (PCAOB) and are required to be independent with respect to the Fund in accordance with the U.S. federal securities laws and the applicable rules and regulations of the Securities and Exchange Commission and the PCAOB.
We conducted our audits in accordance with the standards of the PCAOB. Those standards require that we plan and perform the audit to obtain reasonable assurance about whether the financial statements and financial highlights are free of material misstatement, whether due to error or fraud. The Fund is not required to have, nor were we engaged to perform, an audit of its internal control over financial reporting. As part of our audits we are required to obtain an understanding of internal control over financial reporting but not for the purpose of expressing an opinion on the effectiveness of the Fund’s internal control over financial reporting. Accordingly, we express no such opinion.
Our audits included performing procedures to assess the risks of material misstatement of the financial statements and financial highlights, whether due to error or fraud, and performing procedures that respond to those risks. Such procedures included examining, on a test basis, evidence regarding the amounts and disclosures in the financial statements and financial highlights. Our audits also included evaluating the accounting principles used and significant estimates made by management, as well as evaluating the overall presentation of the financial statements and financial highlights. Our procedures included confirmation of securities owned as of November 30, 2018, by correspondence with the custodian and brokers; when replies were not received from brokers, we performed other auditing procedures. We believe that our audits provide a reasonable basis for our opinion.
DELOITTE & TOUCHE LLP
Denver, Colorado
January 24, 2019
We have served as the auditor of one or more investment companies advised by ALPS Advisors, Inc. since 2007.
Barron’s 400SM ETF
| Schedule of Investments | November 30, 2018 |
| Security Description | | Shares | | | Value | |
| COMMON STOCKS (94.36%) | | | | | | | | |
| Communication Services (2.73%) | | | | | | | | |
| AMC Networks, Inc., Class A(a) | | | 7,245 | | | $ | 433,686 | |
| Cable One, Inc. | | | 524 | | | | 471,228 | |
| Comcast Corp., Class A | | | 12,447 | | | | 485,558 | |
| Facebook, Inc., Class A(a) | | | 2,878 | | | | 404,676 | |
| Gray Television, Inc.(a) | | | 27,458 | | | | 507,698 | |
| IAC/InterActiveCorp(a) | | | 2,124 | | | | 377,987 | |
| Marcus Corp. | | | 11,242 | | | | 477,335 | |
| Match Group, Inc.(a) | | | 7,834 | | | | 315,475 | |
| Nexstar Media Group, Inc., Class A | | | 5,763 | | | | 476,254 | |
| Sinclair Broadcast Group, Inc., Class A | | | 16,437 | | | | 516,944 | |
| Total Communication Services | | | | | | | 4,466,841 | |
| | | | | | | | | |
| Consumer Discretionary (16.23%) | | | | | | | | |
| Aaron's, Inc. | | | 8,804 | | | | 412,026 | |
| Acushnet Holdings Corp. | | | 17,480 | | | | 399,418 | |
| American Axle & Manufacturing Holdings, Inc.(a) | | | 25,669 | | | | 319,579 | |
| American Eagle Outfitters, Inc. | | | 19,550 | | | | 409,182 | |
| Booking Holdings, Inc.(a) | | | 239 | | | | 452,159 | |
| Boot Barn Holdings, Inc.(a) | | | 15,913 | | | | 360,270 | |
| BorgWarner, Inc. | | | 10,758 | | | | 425,802 | |
| Burlington Stores, Inc.(a) | | | 2,848 | | | | 472,085 | |
| Callaway Golf Co. | | | 20,061 | | | | 343,645 | |
| Carter's, Inc. | | | 4,994 | | | | 461,945 | |
| Cavco Industries, Inc.(a) | | | 1,840 | | | | 302,790 | |
| Citi Trends, Inc. | | | 15,377 | | | | 315,229 | |
| Cooper-Standard Holding, Inc.(a) | | | 3,809 | | | | 278,514 | |
| Cracker Barrel Old Country Store, Inc.(b) | | | 3,216 | | | | 581,485 | |
| Dave & Buster's Entertainment, Inc. | | | 7,253 | | | | 412,406 | |
| Deckers Outdoor Corp.(a) | | | 4,118 | | | | 548,682 | |
| Dollar General Corp. | | | 4,231 | | | | 469,599 | |
| DR Horton, Inc. | | | 10,817 | | | | 402,609 | |
| Five Below, Inc.(a) | | | 3,609 | | | | 378,187 | |
| Floor & Decor Holdings, Inc., Class A(a) | | | 13,284 | | | | 440,099 | |
| Fox Factory Holding Corp.(a) | | | 6,631 | | | | 422,461 | |
| Gap, Inc. | | | 17,136 | | | | 467,641 | |
| Gentex Corp. | | | 21,221 | | | | 477,897 | |
| Grand Canyon Education, Inc.(a) | | | 4,239 | | | | 518,684 | |
| GrubHub, Inc.(a) | | | 3,271 | | | | 256,087 | |
| H&R Block, Inc. | | | 18,281 | | | | 493,770 | |
| Hilton Grand Vacations, Inc.(a) | | | 14,214 | | | | 455,701 | |
| International Speedway Corp., Class A | | | 10,498 | | | | 444,485 | |
| iRobot Corp.(a)(b) | | | 4,122 | | | | 393,239 | |
| Johnson Outdoors, Inc., Class A | | | 4,694 | | | | 334,682 | |
| Kohl's Corp. | | | 5,879 | | | | 394,892 | |
| Las Vegas Sands Corp. | | | 7,659 | | | | 420,785 | |
| Security Description | | Shares | | | Value | |
| Consumer Discretionary (continued) | | | | | | | | |
| La-Z-Boy, Inc. | | | 14,592 | | | $ | 426,524 | |
| LCI Industries | | | 4,977 | | | | 385,120 | |
| Lear Corp. | | | 2,977 | | | | 405,616 | |
| Lennar Corp. | | | 11,303 | | | | 390,632 | |
| LGI Homes, Inc.(a)(b) | | | 9,220 | | | | 425,595 | |
| Lowe's Cos., Inc. | | | 3,968 | | | | 374,460 | |
| Malibu Boats, Inc., Class A(a) | | | 8,514 | | | | 412,248 | |
| MasterCraft Boat Holdings, Inc.(a) | | | 12,122 | | | | 314,081 | |
| Nordstrom, Inc. | | | 7,306 | | | | 386,268 | |
| Norwegian Cruise Line Holdings, Ltd.(a) | | | 8,055 | | | | 413,383 | |
| Nutrisystem, Inc. | | | 12,721 | | | | 473,094 | |
| NVR, Inc.(a) | | | 172 | | | | 421,400 | |
| Ollie's Bargain Outlet Holdings, Inc.(a) | | | 4,970 | | | | 440,839 | |
| O'Reilly Automotive, Inc.(a) | | | 1,355 | | | | 469,887 | |
| PetMed Express, Inc. | | | 12,587 | | | | 303,221 | |
| PulteGroup, Inc. | | | 17,419 | | | | 461,952 | |
| Qurate Retail, Inc.(a) | | | 20,933 | | | | 465,131 | |
| Ross Stores, Inc. | | | 4,768 | | | | 417,677 | |
| Ruth's Hospitality Group, Inc. | | | 14,884 | | | | 364,211 | |
| Stamps.com, Inc.(a) | | | 1,990 | | | | 341,205 | |
| Starbucks Corp. | | | 8,396 | | | | 560,181 | |
| Steven Madden, Ltd. | | | 12,229 | | | | 394,141 | |
| Thor Industries, Inc. | | | 4,563 | | | | 309,417 | |
| Tilly's, Inc. | | | 25,233 | | | | 290,432 | |
| TJX Cos., Inc. | | | 8,477 | | | | 414,101 | |
| Toll Brothers, Inc. | | | 12,864 | | | | 424,126 | |
| TopBuild Corp.(a) | | | 7,394 | | | | 376,724 | |
| TRI Pointe Group, Inc.(a) | | | 33,927 | | | | 423,409 | |
| Ulta Beauty, Inc.(a) | | | 1,631 | | | | 485,696 | |
| Vail Resorts, Inc. | | | 1,569 | | | | 438,033 | |
| Wendy's Co. | | | 26,401 | | | | 473,370 | |
| Winnebago Industries, Inc. | | | 12,884 | | | | 322,487 | |
| ZAGG, Inc.(a) | | | 29,818 | | | | 299,671 | |
| Total Consumer Discretionary | | | | | | | 26,570,367 | |
| | | | | | | | | |
| Consumer Staples (2.89%) | | | | | | | | |
| Church & Dwight Co., Inc. | | | 7,747 | | | | 512,774 | |
| Constellation Brands, Inc., Class A | | | 2,165 | | | | 423,820 | |
| Hershey Co. | | | 4,472 | | | | 484,318 | |
| McCormick & Co., Inc. | | | 3,524 | | | | 528,600 | |
| Medifast, Inc. | | | 2,078 | | | | 308,583 | |
| National Beverage Corp. | | | 4,002 | | | | 349,255 | |
| Nu Skin Enterprises, Inc., Class A | | | 5,425 | | | | 357,887 | |
| Pilgrim's Pride Corp.(a) | | | 24,580 | | | | 487,667 | |
| Post Holdings, Inc.(a) | | | 4,677 | | | | 452,500 | |
| Sprouts Farmers Market, Inc.(a) | | | 16,762 | | | | 385,861 | |
| Tyson Foods, Inc., Class A | | | 7,411 | | | | 436,878 | |
| Total Consumer Staples | | | | | | | 4,728,143 | |
| | | | | | | | | |
| Energy (7.04%) | | | | | | | | |
| Arch Coal, Inc., Class A | | | 5,099 | | | | 414,396 | |
| BP Prudhoe Bay Royalty Trust | | | 14,304 | | | | 360,461 | |
Barron’s 400SM ETF
| Schedule of Investments | November 30, 2018 |
| Security Description | | Shares | | | Value | |
| Energy (continued) | | | | | | | | |
| Cactus, Inc.(a) | | | 12,763 | | | $ | 368,595 | |
| Callon Petroleum Co.(a) | | | 39,729 | | | | 339,683 | |
| Centennial Resource Development, Inc., Class A(a) | | | 21,810 | | | | 338,491 | |
| Cimarex Energy Co. | | | 5,110 | | | | 418,918 | |
| Concho Resources, Inc.(a) | | | 3,222 | | | | 419,956 | |
| CONSOL Energy, Inc.(a) | | | 11,034 | | | | 379,128 | |
| Continental Resources, Inc.(a) | | | 7,373 | | | | 337,094 | |
| Diamondback Energy, Inc. | | | 3,703 | | | | 408,737 | |
| EOG Resources, Inc. | | | 3,867 | | | | 399,500 | |
| FTS International, Inc.(a) | | | 41,462 | | | | 409,645 | |
| Gulfport Energy Corp.(a) | | | 41,452 | | | | 353,171 | |
| HollyFrontier Corp. | | | 6,654 | | | | 415,675 | |
| Laredo Petroleum, Inc.(a) | | | 55,105 | | | | 240,809 | |
| Mammoth Energy Services, Inc. | | | 16,332 | | | | 410,913 | |
| Marathon Petroleum Corp. | | | 11,061 | | | | 720,735 | |
| Matador Resources Co.(a) | | | 14,445 | | | | 329,346 | |
| McDermott International, Inc.(a) | | | 24,542 | | | | 213,761 | |
| Newfield Exploration Co.(a) | | | 16,555 | | | | 280,607 | |
| Parsley Energy, Inc., Class A(a) | | | 16,391 | | | | 329,951 | |
| PBF Energy, Inc., Class A | | | 9,216 | | | | 356,475 | |
| Phillips 66 | | | 4,047 | | | | 378,475 | |
| Pioneer Natural Resources Co. | | | 2,657 | | | | 392,572 | |
| ProPetro Holding Corp.(a) | | | 27,411 | | | | 444,606 | |
| Renewable Energy Group, Inc.(a) | | | 16,762 | | | | 451,736 | |
| Ring Energy, Inc.(a) | | | 41,181 | | | | 287,855 | |
| RPC, Inc. | | | 30,117 | | | | 393,930 | |
| SRC Energy, Inc.(a) | | | 52,396 | | | | 302,325 | |
| Texas Pacific Land Trust | | | 550 | | | | 318,555 | |
| Valero Energy Corp. | | | 3,976 | | | | 317,682 | |
| Total Energy | | | | | | | 11,533,783 | |
| | | | | | | | | |
| Financials (16.91%) | | | | | | | | |
| American Equity Investment Life Holding Co. | | | 12,772 | | | | 435,908 | |
| Associated Banc-Corp | | | 17,691 | | | | 409,900 | |
| Athene Holding, Ltd., Class A(a) | | | 8,941 | | | | 388,844 | |
| BancFirst Corp. | | | 7,616 | | | | 425,125 | |
| Bank of NT Butterfield & Son, Ltd. | | | 9,189 | | | | 364,620 | |
| Bank OZK | | | 11,966 | | | | 324,279 | |
| BankUnited, Inc. | | | 12,695 | | | | 438,485 | |
| Cathay General Bancorp | | | 10,951 | | | | 433,331 | |
| CenterState Bank Corp. | | | 15,835 | | | | 396,033 | |
| Citizens Financial Group, Inc. | | | 11,616 | | | | 422,358 | |
| Cohen & Steers, Inc. | | | 10,925 | | | | 408,158 | |
| Comerica, Inc. | | | 5,001 | | | | 395,979 | |
| Commerce Bancshares, Inc. | | | 7,095 | | | | 447,130 | |
| Community Bank System, Inc. | | | 7,353 | | | | 482,798 | |
| Credit Acceptance Corp.(a) | | | 1,047 | | | | 428,663 | |
| Cullen/Frost Bankers, Inc. | | | 4,282 | | | | 429,570 | |
| Discover Financial Services | | | 5,905 | | | | 421,027 | |
| Security Description | | Shares | | | Value | |
| Financials (continued) | | | | | | | | |
| E*TRADE Financial Corp. | | | 8,598 | | | $ | 449,589 | |
| East West Bancorp, Inc. | | | 7,433 | | | | 399,078 | |
| Enterprise Financial Services Corp. | | | 8,625 | | | | 385,451 | |
| Essent Group, Ltd.(a) | | | 10,411 | | | | 401,448 | |
| Evercore, Inc., Class A | | | 4,540 | | | | 374,822 | |
| Federated Investors, Inc., Class B | | | 19,013 | | | | 503,464 | |
| Fifth Third Bancorp | | | 16,032 | | | | 447,774 | |
| First Busey Corp. | | | 14,913 | | | | 427,854 | |
| First Commonwealth Financial Corp. | | | 28,265 | | | | 394,014 | |
| First Financial Bankshares, Inc. | | | 7,664 | | | | 502,145 | |
| First Interstate BancSystem, Inc., Class A | | | 10,067 | | | | 437,210 | |
| First Merchants Corp. | | | 9,789 | | | | 411,530 | |
| Great Western Bancorp, Inc. | | | 10,663 | | | | 397,943 | |
| Guaranty Bancorp | | | 15,490 | | | | 396,699 | |
| Huntington Bancshares, Inc. | | | 29,867 | | | | 435,760 | |
| Independent Bank Corp./Rockland MA | | | 5,238 | | | | 420,978 | |
| JPMorgan Chase & Co. | | | 4,040 | | | | 449,208 | |
| KeyCorp | | | 23,436 | | | | 429,816 | |
| Lakeland Financial Corp. | | | 9,739 | | | | 450,916 | |
| Live Oak Bancshares, Inc. | | | 16,063 | | | | 287,688 | |
| Meridian Bancorp, Inc. | | | 26,741 | | | | 437,215 | |
| Moody's Corp. | | | 2,577 | | | | 409,923 | |
| MSCI, Inc. | | | 2,572 | | | | 404,036 | |
| Pacific Premier Bancorp, Inc.(a) | | | 12,001 | | | | 370,471 | |
| PacWest Bancorp | | | 9,283 | | | | 373,548 | |
| Park National Corp. | | | 4,279 | | | | 409,201 | |
| Peapack Gladstone Financial Corp. | | | 14,680 | | | | 419,995 | |
| People's United Financial, Inc. | | | 26,318 | | | | 443,721 | |
| PNC Financial Services Group, Inc. | | | 3,305 | | | | 448,753 | |
| Preferred Bank | | | 7,704 | | | | 394,599 | |
| Primerica, Inc. | | | 3,943 | | | | 468,744 | |
| SEI Investments Co. | | | 7,372 | | | | 395,876 | |
| ServisFirst Bancshares, Inc. | | | 11,321 | | | | 445,708 | |
| Simmons First National Corp., Class A | | | 14,753 | | | | 433,738 | |
| State Bank Financial Corp. | | | 14,865 | | | | 358,247 | |
| SunTrust Banks, Inc. | | | 6,752 | | | | 423,283 | |
| SVB Financial Group(a) | | | 1,447 | | | | 368,710 | |
| Synchrony Financial | | | 13,900 | | | | 361,122 | |
| Synovus Financial Corp. | | | 9,783 | | | | 369,895 | |
| T Rowe Price Group, Inc. | | | 4,195 | | | | 416,815 | |
| TCF Financial Corp. | | | 18,561 | | | | 417,437 | |
| Texas Capital Bancshares, Inc.(a) | | | 5,334 | | | | 318,226 | |
| TriState Capital Holdings, Inc.(a) | | | 16,545 | | | | 415,445 | |
| Universal Insurance Holdings, Inc. | | | 10,067 | | | | 441,841 | |
| Walker & Dunlop, Inc. | | | 8,599 | | | | 406,131 | |
Barron’s 400SM ETF
| Schedule of Investments | November 30, 2018 |
| Security Description | | Shares | | | Value | |
| Financials (continued) | | | | | | | | |
| Webster Financial Corp. | | | 7,535 | | | $ | 453,381 | |
| Western Alliance Bancorp(a) | | | 8,037 | | | | 376,694 | |
| Wintrust Financial Corp. | | | 5,274 | | | | 407,944 | |
| WSFS Financial Corp. | | | 9,571 | | | | 402,652 | |
| Zions Bancorp NA | | | 8,980 | | | | 436,967 | |
| Total Financials | | | | | | | 27,685,913 | |
| | | | | | | | | |
| Health Care (8.39%) | | | | | | | | |
| ABIOMED, Inc.(a) | | | 1,218 | | | | 405,204 | |
| Align Technology, Inc.(a) | | | 1,186 | | | | 272,649 | |
| AMN Healthcare Services, Inc.(a) | | | 9,043 | | | | 576,039 | |
| athenahealth, Inc.(a) | | | 3,419 | | | | 455,069 | |
| Biogen, Inc.(a) | | | 1,370 | | | | 457,196 | |
| Cambrex Corp.(a) | | | 7,370 | | | | 352,507 | |
| Cerner Corp.(a) | | | 7,122 | | | | 412,435 | |
| Chemed Corp. | | | 1,491 | | | | 472,319 | |
| ChemoCentryx, Inc.(a) | | | 39,798 | | | | 399,970 | |
| Concert Pharmaceuticals, Inc.(a) | | | 34,474 | | | | 494,012 | |
| Corcept Therapeutics, Inc.(a) | | | 32,441 | | | | 451,903 | |
| Eagle Pharmaceuticals, Inc.(a)(b) | | | 6,758 | | | | 340,603 | |
| Emergent BioSolutions, Inc.(a) | | | 7,029 | | | | 511,992 | |
| Enanta Pharmaceuticals, Inc.(a) | | | 5,140 | | | | 406,780 | |
| Encompass Health Corp. | | | 5,790 | | | | 435,466 | |
| Exelixis, Inc.(a) | | | 27,752 | | | | 563,643 | |
| Halozyme Therapeutics, Inc.(a) | | | 26,927 | | | | 444,565 | |
| Illumina, Inc.(a) | | | 1,317 | | | | 444,487 | |
| Laboratory Corp. of America Holdings(a) | | | 2,697 | | | | 392,791 | |
| LeMaitre Vascular, Inc. | | | 13,200 | | | | 368,148 | |
| Ligand Pharmaceuticals, Inc.(a) | | | 1,726 | | | | 272,311 | |
| Medpace Holdings, Inc.(a) | | | 7,313 | | | | 452,748 | |
| Nektar Therapeutics(a) | | | 7,858 | | | | 317,385 | |
| Pfizer, Inc. | | | 10,627 | | | | 491,286 | |
| Regeneron Pharmaceuticals, Inc.(a) | | | 1,189 | | | | 434,758 | |
| REGENXBIO, Inc.(a) | | | 6,404 | | | | 383,664 | |
| Supernus Pharmaceuticals, Inc.(a) | | | 9,866 | | | | 467,846 | |
| United Therapeutics Corp.(a) | | | 3,663 | | | | 432,600 | |
| Universal Health Services, Inc., Class B | | | 3,616 | | | | 498,972 | |
| Veeva Systems, Inc., Class A(a) | | | 4,398 | | | | 422,912 | |
| Zimmer Biomet Holdings, Inc. | | | 3,543 | | | | 414,602 | |
| Zoetis, Inc. | | | 5,180 | | | | 486,247 | |
| Total Health Care | | | | | | | 13,733,109 | |
| | | | | | | | | |
| Industrials (18.91%) | | | | | | | | |
| Acuity Brands, Inc. | | | 2,866 | | | | 372,637 | |
| Aerovironment, Inc.(a) | | | 3,925 | | | | 300,655 | |
| Allied Motion Technologies, Inc. | | | 9,350 | | | | 442,348 | |
| Allison Transmission Holdings, Inc. | | | 8,878 | | | | 418,243 | |
| Security Description | | Shares | | | Value | |
| Industrials (continued) | | | | | | | | |
| Apogee Enterprises, Inc. | | | 10,792 | | | $ | 393,368 | |
| ASGN, Inc.(a) | | | 5,730 | | | | 396,802 | |
| Atkore International Group, Inc.(a) | | | 17,669 | | | | 360,801 | |
| BMC Stock Holdings, Inc.(a) | | | 21,949 | | | | 373,352 | |
| CAI International, Inc.(a) | | | 17,402 | | | | 426,523 | |
| Caterpillar, Inc. | | | 3,076 | | | | 417,321 | |
| Cintas Corp. | | | 2,134 | | | | 399,869 | |
| Comfort Systems USA, Inc. | | | 8,405 | | | | 442,607 | |
| Continental Building Products, Inc.(a) | | | 11,956 | | | | 341,702 | |
| Copart, Inc.(a) | | | 7,343 | | | | 375,815 | |
| CoStar Group, Inc.(a) | | | 1,080 | | | | 398,941 | |
| Covenant Transportation Group, Inc., Class A(a) | | | 14,779 | | | | 336,666 | |
| CSX Corp. | | | 6,236 | | | | 452,921 | |
| Curtiss-Wright Corp. | | | 3,267 | | | | 360,677 | |
| Energy Recovery, Inc.(a)(b) | | | 51,184 | | | | 418,173 | |
| EnPro Industries, Inc. | | | 6,051 | | | | 425,869 | |
| ESCO Technologies, Inc. | | | 6,913 | | | | 485,846 | |
| Expeditors International of Washington, Inc. | | | 6,254 | | | | 475,867 | |
| Fastenal Co. | | | 7,964 | | | | 471,947 | |
| Federal Signal Corp. | | | 17,182 | | | | 403,090 | |
| FedEx Corp. | | | 1,906 | | | | 436,474 | |
| Fortive Corp. | | | 5,247 | | | | 399,139 | |
| Forward Air Corp. | | | 6,756 | | | | 441,032 | |
| FTI Consulting, Inc.(a) | | | 6,201 | | | | 435,620 | |
| Generac Holdings, Inc.(a) | | | 7,913 | | | | 450,408 | |
| Global Brass & Copper Holdings, Inc. | | | 12,578 | | | | 407,150 | |
| Graco, Inc. | | | 9,743 | | | | 429,179 | |
| H&E Equipment Services, Inc. | | | 12,889 | | | | 285,491 | |
| Harris Corp. | | | 2,798 | | | | 399,974 | |
| Hawaiian Holdings, Inc. | | | 11,633 | | | | 466,949 | |
| HEICO Corp., Class A | | | 6,199 | | | | 418,556 | |
| Hexcel Corp. | | | 6,847 | | | | 422,254 | |
| Hub Group, Inc., Class A(a) | | | 9,591 | | | | 426,224 | |
| Huntington Ingalls Industries, Inc. | | | 1,777 | | | | 382,943 | |
| IDEX Corp. | | | 2,958 | | | | 406,429 | |
| Insteel Industries, Inc. | | | 12,562 | | | | 345,957 | |
| JB Hunt Transport Services, Inc. | | | 3,716 | | | | 395,234 | |
| John Bean Technologies Corp. | | | 3,817 | | | | 315,055 | |
| KAR Auction Services, Inc. | | | 7,356 | | | | 420,322 | |
| Knight-Swift Transportation Holdings, Inc. | | | 12,829 | | | | 444,653 | |
| Landstar System, Inc. | | | 3,697 | | | | 403,269 | |
| Lincoln Electric Holdings, Inc. | | | 4,851 | | | | 416,943 | |
| ManpowerGroup, Inc. | | | 5,210 | | | | 422,948 | |
| Marten Transport, Ltd. | | | 21,338 | | | | 415,664 | |
| Matson, Inc. | | | 12,253 | | | | 482,156 | |
| McGrath RentCorp | | | 8,762 | | | | 468,154 | |
| Meritor, Inc.(a) | | | 23,096 | | | | 381,084 | |
| MSC Industrial Direct Co., Inc., Class A, Class A | | | 5,270 | | | | 466,869 | |
Barron’s 400SM ETF
| Schedule of Investments | November 30, 2018 |
| Security Description | | Shares | | | Value | |
| Industrials (continued) | | | | | | | | |
| NCI Building Systems, Inc.(a) | | | 29,483 | | | $ | 334,632 | |
| Norfolk Southern Corp. | | | 2,456 | | | | 419,337 | |
| NV5 Global, Inc.(a) | | | 5,080 | | | | 372,821 | |
| Old Dominion Freight Line, Inc. | | | 2,815 | | | | 384,895 | |
| PACCAR, Inc. | | | 6,446 | | | | 401,070 | |
| Patrick Industries, Inc.(a) | | | 7,111 | | | | 282,449 | |
| PGT Innovations, Inc.(a) | | | 21,774 | | | | 419,585 | |
| Raven Industries, Inc. | | | 9,833 | | | | 396,762 | |
| Saia, Inc.(a) | | | 5,731 | | | | 345,637 | |
| Schneider National, Inc., Class B | | | 17,844 | | | | 398,457 | |
| Simpson Manufacturing Co., Inc. | | | 6,035 | | | | 353,047 | |
| Snap-on, Inc. | | | 2,449 | | | | 407,122 | |
| Southwest Airlines Co. | | | 7,272 | | | | 397,124 | |
| Systemax, Inc. | | | 13,413 | | | | 374,089 | |
| Tetra Tech, Inc. | | | 6,607 | | | | 402,763 | |
| The Timken Co. | | | 9,433 | | | | 378,735 | |
| Trex Co., Inc.(a) | | | 5,563 | | | | 354,530 | |
| Triton International, Ltd. | | | 12,294 | | | | 418,980 | |
| Union Pacific Corp. | | | 2,819 | | | | 433,506 | |
| United Parcel Service, Inc., Class B, Class B | | | 3,908 | | | | 450,553 | |
| United Rentals, Inc.(a) | | | 2,745 | | | | 321,522 | |
| Vectrus, Inc.(a) | | | 14,137 | | | | 342,540 | |
| WABCO Holdings, Inc.(a) | | | 4,019 | | | | 488,108 | |
| WageWorks, Inc.(a) | | | 11,232 | | | | 374,363 | |
| Werner Enterprises, Inc. | | | 12,741 | | | | 431,410 | |
| Total Industrials | | | | | | | 30,962,207 | |
| | | | | | | | | |
| Information Technology (13.49%) | | | | | | | | |
| Adobe, Inc.(a) | | | 1,703 | | | | 427,266 | |
| Advanced Energy Industries, Inc.(a) | | | 8,653 | | | | 407,037 | |
| Alarm.com Holdings, Inc.(a) | | | 8,210 | | | | 417,478 | |
| Alliance Data Systems Corp. | | | 1,857 | | | | 372,068 | |
| Analog Devices, Inc. | | | 5,031 | | | | 462,450 | |
| Appfolio, Inc., Class A(a) | | | 5,407 | | | | 331,395 | |
| Apple, Inc. | | | 2,101 | | | | 375,197 | |
| Applied Materials, Inc. | | | 11,799 | | | | 439,867 | |
| Arista Networks, Inc.(a) | | | 1,717 | | | | 409,470 | |
| Axcelis Technologies, Inc.(a) | | | 22,474 | | | | 447,682 | |
| Broadcom, Inc. | | | 1,921 | | | | 456,065 | |
| Brooks Automation, Inc. | | | 13,196 | | | | 400,631 | |
| Cabot Microelectronics Corp. | | | 5,606 | | | | 602,533 | |
| Casa Systems, Inc.(a)(b) | | | 29,298 | | | | 455,584 | |
| Ciena Corp.(a) | | | 15,068 | | | | 491,518 | |
| Cognex Corp. | | | 8,199 | | | | 360,920 | |
| Coherent, Inc.(a) | | | 2,541 | | | | 351,065 | |
| Cohu, Inc. | | | 28,921 | | | | 566,852 | |
| Control4 Corp.(a) | | | 12,985 | | | | 282,683 | |
| Electro Scientific Industries, Inc.(a) | | | 26,016 | | | | 764,871 | |
| F5 Networks, Inc.(a) | | | 2,376 | | | | 408,601 | |
| Ichor Holdings, Ltd.(a)(b) | | | 21,152 | | | | 384,966 | |
| Immersion Corp.(a) | | | 44,888 | | | | 425,987 | |
| Intel Corp. | | | 10,036 | | | | 494,875 | |
| Security Description | | Shares | | | Value | |
| Information Technology (continued) | | | | | | | | |
| Intuit, Inc. | | | 2,059 | | | $ | 441,717 | |
| IPG Photonics Corp.(a) | | | 2,889 | | | | 410,671 | |
| Jack Henry & Associates, Inc. | | | 2,844 | | | | 397,307 | |
| KLA-Tencor Corp. | | | 4,465 | | | | 440,070 | |
| Lam Research Corp. | | | 3,004 | | | | 471,508 | |
| Lumentum Holdings, Inc.(a) | | | 7,591 | | | | 337,572 | |
| Micron Technology, Inc.(a) | | | 10,202 | | | | 393,389 | |
| Microsoft Corp. | | | 4,080 | | | | 452,431 | |
| MKS Instruments, Inc. | | | 5,515 | | | | 432,707 | |
| Nanometrics, Inc.(a) | | | 12,893 | | | | 414,123 | |
| NIC, Inc. | | | 31,154 | | | | 405,002 | |
| NVIDIA Corp. | | | 1,691 | | | | 276,360 | |
| ON Semiconductor Corp.(a) | | | 24,348 | | | | 466,995 | |
| Paychex, Inc. | | | 6,193 | | | | 438,217 | |
| Paycom Software, Inc.(a) | | | 2,978 | | | | 395,389 | |
| Photronics, Inc.(a) | | | 48,197 | | | | 467,511 | |
| Progress Software Corp. | | | 10,868 | | | | 382,119 | |
| Rudolph Technologies, Inc.(a) | | | 18,868 | | | | 400,379 | |
| SMART Global Holdings, Inc.(a) | | | 15,453 | | | | 529,883 | |
| Texas Instruments, Inc. | | | 4,410 | | | | 440,338 | |
| Total System Services, Inc. | | | 4,724 | | | | 412,736 | |
| Trade Desk, Inc., Class A(a) | | | 3,248 | | | | 462,678 | |
| Ubiquiti Networks, Inc. | | | 4,682 | | | | 510,244 | |
| Versum Materials, Inc. | | | 12,990 | | | | 449,974 | |
| Visa, Inc., Class A | | | 3,134 | | | | 444,119 | |
| Vishay Precision Group, Inc.(a) | | | 11,786 | | | | 399,899 | |
| Zebra Technologies Corp., Class A(a) | | | 2,622 | | | | 471,436 | |
| Total Information Technology | | | | | | | 22,081,835 | |
| | | | | | | | | |
| Materials (5.86%) | | | | | | | | |
| AdvanSix, Inc.(a) | | | 13,327 | | | | 382,618 | |
| Berry Global Group, Inc.(a) | | | 9,221 | | | | 464,001 | |
| Boise Cascade Co. | | | 11,482 | | | | 305,192 | |
| Celanese Corp., Series A | | | 4,071 | | | | 410,886 | |
| Chase Corp. | | | 3,714 | | | | 418,456 | |
| Chemours Co. | | | 11,377 | | | | 324,017 | |
| Eagle Materials, Inc. | | | 5,278 | | | | 385,294 | |
| FMC Corp. | | | 5,368 | | | | 444,148 | |
| Freeport-McMoRan, Inc. | | | 32,725 | | | | 390,736 | |
| Gold Resource Corp. | | | 91,396 | | | | 349,133 | |
| Huntsman Corp. | | | 16,170 | | | | 326,957 | |
| Ingevity Corp.(a) | | | 4,543 | | | | 445,259 | |
| Kronos Worldwide, Inc. | | | 27,502 | | | | 340,200 | |
| Louisiana-Pacific Corp. | | | 15,668 | | | | 358,170 | |
| Myers Industries, Inc. | | | 18,449 | | | | 304,409 | |
| Nucor Corp. | | | 7,192 | | | | 434,469 | |
| Packaging Corp. of America | | | 3,936 | | | | 385,020 | |
| Rayonier Advanced Materials, Inc. | | | 22,096 | | | | 325,916 | |
| Reliance Steel & Aluminum Co. | | | 5,357 | | | | 430,971 | |
| Schnitzer Steel Industries, Inc., Class A | | | 17,288 | | | | 484,237 | |
| Sherwin-Williams Co. | | | 969 | | | | 410,924 | |
| Steel Dynamics, Inc. | | | 9,974 | | | | 351,085 | |
| Trinseo SA | | | 5,900 | | | | 298,127 | |
Barron’s 400SM ETF
| Schedule of Investments | November 30, 2018 |
| Security Description | | Shares | | | Value | |
| Materials (continued) | | | | | | | | |
| Warrior Met Coal, Inc. | | | 17,829 | | | $ | 422,547 | |
| Westlake Chemical Corp. | | | 5,464 | | | | 396,085 | |
| Total Materials | | | | | | | 9,588,857 | |
| | | | | | | | | |
| Real Estate (0.45%) | | | | | | | | |
| HFF, Inc., Class A | | | 10,198 | | | | 411,999 | |
| RMR Group, Inc., Class A | | | 4,997 | | | | 323,006 | |
| Total Real Estate | | | | | | | 735,005 | |
| | | | | | | | | |
| Utilities (1.46%) | | | | | | | | |
| CenterPoint Energy, Inc. | | | 16,430 | | | | 460,205 | |
| Dominion Energy, Inc. | | | 6,424 | | | | 478,588 | |
| NextEra Energy, Inc. | | | 2,662 | | | | 483,712 | |
| OGE Energy Corp. | | | 12,465 | | | | 493,863 | |
| UGI Corp. | | | 8,405 | | | | 482,867 | |
| Total Utilities | | | | | | | 2,399,235 | |
| | | | | | | | | |
| TOTAL COMMON STOCKS | | | | | | | | |
| (Cost $157,890,256) | | | | | | | 154,485,295 | |
| | | | | | | | | |
| LIMITED PARTNERSHIPS (4.76%) | | | | | | | | |
| Energy (4.51%) | | | | | | | | |
| Alliance Resource Partners LP | | | 23,843 | | | | 468,515 | |
| Andeavor Logistics LP | | | 9,298 | | | | 347,001 | |
| Antero Midstream Partners LP | | | 15,161 | | | | 419,353 | |
| CNX Midstream Partners LP | | | 23,375 | | | | 423,088 | |
| Dominion Energy Midstream Partners LP | | | 26,068 | | | | 484,343 | |
| EQGP Holdings LP | | | 21,687 | | | | 434,174 | |
| EQM Midstream Partners LP | | | 8,340 | | | | 397,484 | |
| Hi-Crush Partners LP | | | 37,273 | | | | 218,420 | |
| Holly Energy Partners LP | | | 14,605 | | | | 410,839 | |
| Magellan Midstream Partners LP | | | 6,717 | | | | 406,244 | |
| MPLX LP | | | 13,166 | | | | 436,190 | |
| Noble Midstream Partners LP | | | 12,452 | | | | 412,535 | |
| Phillips 66 Partners LP | | | 8,934 | | | | 419,005 | |
| Shell Midstream Partners LP | | | 20,914 | | | | 394,020 | |
| TC PipeLines LP | | | 13,996 | | | | 416,941 | |
| Valero Energy Partners LP | | | 12,935 | | | | 544,175 | |
| Viper Energy Partners LP | | | 11,278 | | | | 338,678 | |
| Western Gas Equity Partners LP | | | 13,983 | | | | 405,227 | |
| Total Energy | | | | | | | 7,376,232 | |
| | | | | | | | | |
| Financials (0.25%) | | | | | | | | |
| Blackstone Group LP | | | 12,215 | | | | 412,012 | |
| | | | | | | | | |
| TOTAL LIMITED PARTNERSHIPS | | | | | | | | |
| (Cost $9,177,963) | | | | | | | 7,788,244 | |
| | | 7 Day Yield | | | Shares | | | Value | |
| SHORT TERM INVESTMENTS (1.44%) | | | | | | | | | | | | |
| Money Market Fund (0.79%) | | | | | | | | | | | | |
| State Street Institutional Treasury Plus Money Market Fund | | | | | | | | | | | | |
| (Cost $1,292,233) | | | 2.146 | % | | | 1,292,233 | | | $ | 1,292,233 | |
| | | | | | | | | | | | | |
| Investments Purchased with Collateral from Securities Loaned (0.65%) | | | | | | | | | | | | |
| State Street Navigator Securities Lending Government Money Market Portfolio, 2.24% | | | | | | | | | | | | |
| (Cost $1,071,589) | | | | | | | 1,071,589 | | | | 1,071,589 | |
| TOTAL SHORT TERM INVESTMENTS | | | | | | | | | | | | |
| (Cost $2,363,822) | | | | | | | | | | | 2,363,822 | |
| | | | | | | | | | | | | |
| TOTAL INVESTMENTS (100.56%) | | | | | | | | | | | | |
| (Cost $169,432,041) | | | | | | | | | | $ | 164,637,361 | |
| LIABILITIES IN EXCESS OF OTHER ASSETS (-0.56%) | | | | | | | | | | | (928,997 | ) |
| NET ASSETS - 100.00% | | | | | | | | | | $ | 163,708,364 | |
| (a) | Non-income producing security. |
| (b) | Security, or a portion of the security position is currently on loan. The total market value of securities on loan is $2,065,137. |
See Notes to Financial Statements.
Barron’s 400SM ETF
| Statement of Assets and Liabilities | November 30, 2018 |
| ASSETS: | | | |
| Investments, at value | | $ | 164,637,361 | |
| Receivable for investments sold | | | 2,005,537 | |
| Dividends receivable | | | 246,916 | |
| Total Assets | | | 166,889,814 | |
| | | | | |
| LIABILITIES: | | | | |
| Payable for capital shares redeemed | | | 2,021,091 | |
| Payable to adviser | | | 88,770 | |
| Payable for collateral upon return of securities loaned | | | 1,071,589 | |
| Total Liabilities | | | 3,181,450 | |
| NET ASSETS | | $ | 163,708,364 | |
| | | | | |
| NET ASSETS CONSIST OF: | | | | |
| Paid-in capital | | $ | 196,831,134 | |
| Total distributable earnings | | | (33,122,770 | ) |
| NET ASSETS | | $ | 163,708,364 | |
| | | | | |
| INVESTMENTS, AT COST | | $ | 169,432,041 | |
| | | | | |
| PRICING OF SHARES | | | | |
| Net Assets | | $ | 163,708,364 | |
| Shares of beneficial interest outstanding (Unlimited number of shares authorized, par value $0.01 per share) | | | 4,050,000 | |
| Net Asset Value, offering and redemption price per share | | $ | 40.42 | |
See Notes to Financial Statements.
Barron’s 400SM ETF
| Statement of Operations | For the Year Ended November 30, 2018 |
| INVESTMENT INCOME: | | | |
| Dividends(a) | | $ | 2,872,911 | |
| Securities Lending Income | | | 137,559 | |
| Total Investment Income | | | 3,010,470 | |
| | | | | |
| EXPENSES: | | | | |
| Investment adviser fees | | | 1,237,516 | |
| Net Expenses | | | 1,237,516 | |
| NET INVESTMENT INCOME | | | 1,772,954 | |
| | | | | |
| REALIZED AND UNREALIZED GAIN/(LOSS) | | | | |
| Net realized gain on investments | | | 34,798,091 | |
| Net change in unrealized depreciation on investments | | | (39,573,824 | ) |
| NET REALIZED AND UNREALIZED LOSS ON INVESTMENTS | | | (4,775,733 | ) |
| NET DECREASE IN NET ASSETS RESULTING FROM OPERATIONS | | $ | (3,002,779 | ) |
| (a) | Net of foreign tax withholding of $31. |
See Notes to Financial Statements.
Barron’s 400SM ETF
Statements of Changes in Net Assets
| | | For the
Year Ended
November 30, 2018 | | | For the
Year Ended
November 30, 2017 | |
| OPERATIONS: | | | | | | |
| Net investment income | | $ | 1,772,954 | | | $ | 1,530,468 | |
| Net realized gain | | | 34,798,091 | | | | 23,132,804 | |
| Net change in unrealized appreciation/depreciation | | | (39,573,824 | ) | | | 13,971,313 | |
| Net increase/(decrease) in net assets resulting from operations | | | (3,002,779 | ) | | | 38,634,585 | |
| | | | | | | | | |
| DISTRIBUTIONS TO SHAREHOLDERS: | | | | | | | | |
| From distributable earnings | | | (1,229,976 | ) | | | (1,450,001 | )(a) |
| Total distributions | | | (1,229,976 | ) | | | (1,450,001 | ) |
| | | | | | | | | |
| CAPITAL SHARE TRANSACTIONS: | | | | | | | | |
| Proceeds from sale of shares | | | 82,914,634 | | | | 99,009,478 | |
| Cost of shares redeemed | | | (120,574,045 | ) | | | (109,205,210 | ) |
| Net decrease from capital share transactions | | | (37,659,411 | ) | | | (10,195,732 | ) |
| Net increase/(decrease) in net assets | | | (41,892,166 | ) | | | 26,988,852 | |
| | | | | | | | | |
| NET ASSETS: | | | | | | | | |
| Beginning of year | | | 205,600,530 | | | | 178,611,678 | |
| End of year | | $ | 163,708,364 | | | $ | 205,600,530 | (b) |
| | | | | | | | | |
| OTHER INFORMATION: | | | | | | | | |
| CAPITAL SHARE TRANSACTIONS: | | | | | | | | |
| Beginning shares | | | 4,950,000 | | | | 5,200,000 | |
| Shares sold | | | 1,900,000 | | | | 2,650,000 | |
| Shares redeemed | | | (2,800,000 | ) | | | (2,900,000 | ) |
| Shares outstanding, end of period | | | 4,050,000 | | | | 4,950,000 | |
| (a) | For the year ended November 30, 2017, total distributions from distributable earnings consisted of distributions from net investment income of $1,450,001. |
| (b) | For the year ended November 30, 2017, net assets included accumulated net investment income of $1,009,278. |
See Notes to Financial Statements.
Barron’s 400SM ETF
| Financial Highlights | For a Share Outstanding Throughout the Periods Presented |
| | | For the Year Ended November 30, 2018 | | | For the Year Ended November 30, 2017 | | | For the Year Ended November 30, 2016 | | | For the Year Ended November 30, 2015 | | | For the Year Ended November 30, 2014 | |
| NET ASSET VALUE, BEGINNING OF PERIOD | | $ | 41.54 | | | $ | 34.35 | | | $ | 31.75 | | | $ | 31.64 | | | $ | 29.30 | |
| | | | | | | | | | | | | | | | | | | | | |
| INCOME FROM OPERATIONS: | | | | | | | | | | | | | | | | | | | | |
| Net investment income(a) | | | 0.40 | | | | 0.29 | | | | 0.33 | | | | 0.32 | | | | 0.23 | |
| Net realized and unrealized gain/(loss) | | | (1.27 | ) | | | 7.17 | | | | 2.53 | | | | 0.02 | | | | 2.16 | |
| Total from investment operations | | | (0.87 | ) | | | 7.46 | | | | 2.86 | | | | 0.34 | | | | 2.39 | |
| | | | | | | | | | | | | | | | | | | | | |
| DISTRIBUTIONS: | | | | | | | | | | | | | | | | | | | | |
| From net investment income | | | (0.25 | ) | | | (0.27 | ) | | | (0.26 | ) | | | (0.23 | ) | | | (0.05 | ) |
| Total distributions | | | (0.25 | ) | | | (0.27 | ) | | | (0.26 | ) | | | (0.23 | ) | | | (0.05 | ) |
| | | | | | | | | | | | | | | | | | | | | |
| NET INCREASE/(DECREASE) IN NET ASSET VALUE | | | (1.12 | ) | | | 7.19 | | | | 2.60 | | | | 0.11 | | | | 2.34 | |
| NET ASSET VALUE, END OF PERIOD | | $ | 40.42 | | | $ | 41.54 | | | $ | 34.35 | | | $ | 31.75 | | | $ | 31.64 | |
| TOTAL RETURN(b) | | | (2.12 | )% | | | 21.87 | % | | | 9.12 | % | | | 1.07 | % | | | 8.18 | % |
| | | | | | | | | | | | | | | | | | | | | |
| RATIOS/SUPPLEMENTAL DATA: | | | | | | | | | | | | | | | | | | | | |
| Net assets, end of period (in 000s) | | $ | 163,708 | | | $ | 205,601 | | | $ | 178,612 | | | $ | 204,805 | | | $ | 219,901 | |
| | | | | | | | | | | | | | | | | | | | | |
| RATIOS TO AVERAGE NET ASSETS | | | | | | | | | | | | | | | | | | | | |
| Ratio of expenses to average net assets | | | 0.65 | % | | | 0.65 | % | | | 0.65 | % | | | 0.65 | % | | | 0.65 | % |
| Ratio of net investment income to average net assets | | | 0.93 | % | | | 0.78 | % | | | 1.07 | % | | | 1.00 | % | | | 0.75 | % |
| Portfolio turnover rate(c) | | | 88 | % | | | 84 | % | | | 88 | % | | | 87 | % | | | 55 | % |
| (a) | Based on average shares outstanding during the period. |
| (b) | Total return is calculated assuming an initial investment made at the net asset value at the beginning of the period and redemption at the net asset value on the last day of the period and assuming all distributions are reinvested at the reinvestment prices. |
| (c) | Portfolio turnover for periods less than one year are not annualized and does not include securities received or delivered from processing creations or redemptions in-kind. |
See Notes to Financial Statements.
| Notes to Financial Statements | November 30, 2018 |
1. ORGANIZATION
ALPS ETF Trust (the “Trust”), a Delaware statutory trust, is an open-end management investment company registered under the Investment Company Act of 1940, as amended (the “1940 Act”). As of November 30, 2018, the Trust consisted of twenty separate portfolios. Each portfolio represents a separate series of the Trust. This report pertains solely to the Barron’s 400SM ETF (the “Fund”). The investment objective of the Fund is to seek investment results that correspond generally, before fees and expenses, to the performance of the Barron’s 400 IndexSM (the “Underlying Index”). The Fund has elected to qualify as a diversified series of the Trust under the 1940 Act.
The Fund’s Shares (“Shares”) are listed on the NYSE Arca, Inc. (the “NYSE Arca”). The Fund issues and redeems Shares at net asset value (“NAV”) in blocks of 50,000 Shares, each of which is called a “Creation Unit”. Creation Units are issued and redeemed principally in-kind for securities included in the Underlying Index. Except when aggregated in Creation Units, Shares are not redeemable securities of the Fund.
Pursuant to the Trust’s organizational documents, its Officers and Trustees are indemnified against certain liability arising out of the performance of their duties to the Trust. Additionally, in the normal course of business, the Trust enters into contracts with service providers that contain general indemnification clauses. The Trust’s maximum exposure under these arrangements is unknown, as this would involve future claims that may be made against the Trust that have not yet occurred.
2. SIGNIFICANT ACCOUNTING POLICIES
The following is a summary of significant accounting policies consistently followed by the Fund in the preparation of the financial statements. The accompanying financial statements were prepared in accordance with accounting principles generally accepted in the United States of America (“U.S. GAAP”). The preparation of financial statements in conformity with U.S. GAAP requires management to make certain estimates and assumptions that affect the reported amounts of assets and liabilities and disclosures of contingent assets and liabilities at the date of the financial statements and the reported amounts of revenue and expenses during the period. Actual results could differ from those estimates. The Fund is considered an investment company under U.S. GAAP and follows the accounting and reporting guidance applicable to investment companies in the Financial Accounting Standards BoardAccounting Standards CodificationTopic 946.
A. Portfolio Valuation
The Fund’s NAV is determined daily, as of the close of regular trading on the New York Stock Exchange (the “NYSE”), normally 4:00 p.m. Eastern time, on each day the NYSE is open for trading. The NAV is computed by dividing the value of all assets of the Fund (including accrued interest and dividends), less all liabilities (including accrued expenses and dividends declared but unpaid), by the total number of shares outstanding.
Portfolio securities listed on any exchange other than the NASDAQ Stock Market LLC (“NASDAQ”) are valued at the last sale price on the business day as of which such value is being determined. If there has been no sale on such day, the securities are valued at the mean of the most recent bid and ask prices on such day. Securities traded on the NASDAQ are valued at the NASDAQ Official Closing Price as determined by NASDAQ. Portfolio securities traded on more than one securities exchange are valued at the last sale price on the business day as of which such value is being determined at the close of the exchange representing the principal market for such securities. Portfolio securities traded in the over-the-counter market, but excluding securities traded on the NASDAQ, are valued at the latest quoted sale price in such market.
The Fund’s investments are valued at market value or, in the absence of market value with respect to any portfolio securities, at fair value according to procedures adopted by the Trust’s Board of Trustees (the “Board”). When market quotations are not readily available or when events occur that make established valuation methods unreliable, securities of the Fund may be valued in good faith by or under the direction of the Board. These securities generally include, but are not limited to, restricted securities (securities which may not be publicly sold without registration under the Securities Act of 1933) for which a pricing service is unable to provide a market price; securities whose trading has been formally suspended; a security whose market price is not available from a pre-established primary pricing source or the pricing source is not willing to provide a price; a security with respect to which an event has occurred that is most likely to materially affect the value of the security after the market has closed but before the calculation of the Fund’s NAV or make it difficult or impossible to obtain a reliable market quotation; or a security whose price, as provided by the pricing service, does not reflect the security’s “fair value” due to the security being de-listed from a national exchange or the security’s primary trading market is temporarily closed at a time when, under normal conditions, it would be open. As a general principle, the current “fair value” of a security would be the amount which the owner might reasonably expect to receive from the sale on the applicable exchange or principal market. A variety of factors may be considered in determining the fair value of such securities.
| Notes to Financial Statements | November 30, 2018 |
B. Fair Value Measurements
The Fund discloses the classification of its fair value measurements following a three-tier hierarchy based on the inputs used to measure fair value. Inputs refer broadly to the assumptions that market participants would use in pricing the asset or liability; including assumptions about risk. Inputs may be observable or unobservable. Observable inputs reflect the assumptions market participants would use in pricing the asset or liability that are developed based on market data obtained from sources independent of the reporting entity. Unobservable inputs reflect the reporting entity’s own assumptions about the assumptions market participants would use in pricing the asset or liability that are developed based on the best information available.
Valuation techniques used to value the Fund's investments by major category are as follows:
Equity securities and Limited Partnerships, including restricted securities, for which market quotations are readily available, are valued at the last reported sale price or official closing price as reported by a third party pricing vendor on the primary market or exchange on which they are traded and are categorized as Level 1 in the hierarchy. In the event there were no sales during the day or closing prices are not available, securities are valued at the mean of the most recent quoted bid and ask prices on such day and are generally categorized as Level 2 in the hierarchy. Investments in open-end mutual funds are valued at their closing NAV each business day and are categorized as Level 1 in the hierarchy.
Changes in valuation techniques may result in transfers in or out of an assigned level within the disclosure hierarchy.
Various inputs are used in determining the value of the Fund’s investments as of the end of the reporting period. When inputs used fall into different levels of the fair value hierarchy, the level in the hierarchy within which the fair value measurement falls is determined based on the lowest level input that is significant to the fair value measurement in its entirety. The designated input levels are not necessarily an indication of the risk or liquidity associated with these investments.
These inputs are categorized in the following hierarchy under applicable financial accounting standards:
| Level 1 – | Unadjusted quoted prices in active markets for identical investments, unrestricted assets or liabilities that a Fund has the ability to access at the measurement date; |
| Level 2 – | Quoted prices which are not active, quoted prices for similar assets or liabilities in active markets or inputs other than quoted prices that are observable (either directly or indirectly) for substantially the full term of the asset or liability; and |
| Level 3 – | Significant unobservable prices or inputs (including the Fund’s own assumptions in determining the fair value of investments) where there is little or no market activity for the asset or liability at the measurement date. |
The following is a summary of the inputs used to value the Fund’s investments as of November 30, 2018:
BARRON'S 400 ETF
| Investments in Securities at Value* | | Level 1 - Quoted and Unadjusted Prices | | | Level 2 - Other Significant Observable Inputs | | | Level 3 - Significant Unobservable Inputs | | | Total | |
| Common Stocks | | $ | 154,485,295 | | | $ | – | | | $ | – | | | $ | 154,485,295 | |
| Limited Partnerships | | | 7,788,244 | | | | – | | | | – | | | | 7,788,244 | |
| Short Term Investments | | | | | | | | | | | – | | | | | |
| Money Market Fund | | | 1,292,233 | | | | – | | | | – | | | | 1,292,233 | |
| Investments Purchased with Collateral from Securities Loaned | | | 1,071,589 | | | | – | | | | – | | | | 1,071,589 | |
| Total | | $ | 164,637,361 | | | $ | – | | | $ | – | | | $ | 164,637,361 | |
| * | For a detailed sector breakdown, see the accompanying Schedule of Investments. |
The Fund did not have any securities that used significant unobservable inputs (Level 3) in determining fair value and there were no transfers into or out of Level 3.
C. Securities Transactions and Investment Income
Securities transactions are recorded as of the trade date. Realized gains and losses from securities transactions are recorded on the highest cost basis. Dividend income and capital gains distributions, if any, are recorded on the ex-dividend date. Interest income, if any, is recorded on the accrual basis.
| Notes to Financial Statements | November 30, 2018 |
D. Dividends and Distributions to Shareholders
Dividends from net investment income of the Fund, if any, are declared and paid annually or as the Board may determine from time to time. Distributions of net realized capital gains earned by the Fund, if any, are distributed at least annually.
E. Federal Tax and Tax Basis Information
The timing and character of income and capital gain distributions are determined in accordance with income tax regulations, which may differ from U.S. GAAP. Reclassifications are made to the Fund’s capital accounts for permanent tax differences to reflect income and gains available for distribution (or available capital loss carryforwards) under income tax regulations.
For the year ended November 30, 2018, the following reclassifications, which had no impact on results of operations or net assets, were recorded to reflect permanent tax differences resulting primarily from in-kind transactions:
| Fund | | Paid-in Capital | | | Distributable Earnings | |
| Barron’s 400SM ETF | | $ | 33,737,765 | | | $ | (33,737,765 | ) |
The tax character of the distributions paid during the fiscal years ended November 30, 2018 and November 30, 2017 were as follows:
| | | Ordinary Income | |
| November 30, 2018 | | | | |
| Barron’s 400SM ETF | | $ | 1,229,976 | |
| November 30, 2017 | | | | |
| Barron’s 400SM ETF | | $ | 1,450,001 | |
Under current law, capital losses maintain their character as short-term or long-term and are carried forward to the next year without expiration. As of November 30, 2018, the following amounts are available as carry forwards to the next tax year:
| Fund | | Short-Term | | | Long-Term | |
| Barron’s 400SMETF | | $ | 20,057,005 | | | $ | 9,850,985 | |
The Barron’s 400 ETF used capital loss carryovers during the year ended November 30, 2018 of $1,301,110.
As of November 30, 2018, the components of distributable earnings on a tax basis for the Fund were as follows:
| | | Barron’s 400SM ETF | |
| Undistributed net investment income | | $ | 1,092,022 | |
| Accumulated net realized loss on investments | | | (29,907,990 | ) |
| Net unrealized depreciation on investments | | | (4,047,870 | ) |
| Other accumulated losses | | | (258,932 | ) |
| Total | | $ | (33,122,770 | ) |
Other accumulated losses are mostly due to partnership losses being suspended for tax purposes.
As of November 30, 2018, the cost of investments for federal income tax purposes and accumulated net unrealized appreciation/(depreciation) on investments were as follows:
| | | Barron’s 400SM ETF | |
| Gross appreciation (excess of value over tax cost) | | $ | 15,608,637 | |
| Gross depreciation (excess of tax cost over value) | | | (19,656,507 | ) |
| Net unrealized appreciation (depreciation) | | | (4,047,870 | ) |
| Cost of investments for income tax purposes | | $ | 168,685,231 | |
The differences between book-basis and tax-basis are primarily due to the deferral of losses from wash sales and investments in partnerships.
| Notes to Financial Statements | November 30, 2018 |
F. Income Taxes
No provision for income taxes is included in the accompanying financial statements, as the Fund intends to distribute to shareholders all taxable investment income and realized gains and otherwise comply with Subchapter M of the Internal Revenue Code of 1986, as amended, applicable to regulated investment companies. The Fund evaluates tax positions taken (or expected to be taken) in the course of preparing the Fund’s tax returns to determine whether these positions meet a “more-likely-than-not” standard that, based on the technical merits, have a more than fifty percent likelihood of being sustained by a taxing authority upon examination. A tax position that meets the “more-likely-than-not” recognition threshold is measured to determine the amount of benefit to recognize in the financial statements.
As of and during the year ended November 30, 2018, the Fund did not have a liability for any unrecognized tax benefits. The Fund files U.S. federal, state, and local tax returns as required. The Fund’s tax returns are subject to examination by the relevant tax authorities until expiration of the applicable statute of limitations, which is generally three years after the filing of the tax return, but may extend to four years in certain jurisdictions. Tax returns for open years have incorporated no uncertain tax positions that require a provision for income taxes.
G.Lending of Portfolio Securities
The Fund has entered into a securities lending agreement with State Street Bank & Trust Co. (“SSB”), the Fund’s lending agent. The Fund may lend its portfolio securities only to borrowers that are approved by SSB. The Fund will limit such lending to not more than 33 1/3% of the value of its total assets. The Fund’s securities held at SSB as custodian shall be available to be lent except those securities the Fund or ALPS Advisors, Inc. specifically identifies in writing as not being available for lending. The borrower pledges and maintains with the Fund collateral consisting of cash (U.S. Dollars only), securities issued or guaranteed by the U.S. government or its agencies or instrumentalities, and cash equivalents (including irrevocable bank letters of credit) issued by a person other than the borrower or an affiliate of the borrower. The initial collateral received by the Fund is required to have a value of no less than 102% of the market value of the loaned securities for U.S equity securities and a value of no less than 105% of the market value for non-U.S. equity securities. The collateral is maintained thereafter, at a market value equal to not less than 102% of the current value of the U.S. equity securities on loan and not less than 105% of the current value of the non-U.S. equity securities on loan. The market value of the loaned securities is determined at the close of each business day and any additional required collateral is delivered to the Fund on the next business day. During the term of the loan, the Fund is entitled to all distributions made on or in respect of the loaned securities. Loans of securities are terminable at any time and the borrower, after notice, is required to return borrowed securities within the customary time period for settlement of securities transactions.
Any cash collateral received is reinvested in a money market fund managed by SSB as disclosed in the Fund’s Schedule of Investments and is reflected in the Statements of Assets and Liabilities as a payable for collateral upon return of securities loaned. Non-cash collateral, in the form of securities issued or guaranteed by the U.S. government or its agencies or instrumentalities, is not disclosed in the Fund’s Statements of Assets and Liabilities as it is held by the lending agent on behalf of the Fund, and the Fund does not have the ability to re-hypothecate these securities. Income earned by the Fund from securities lending activity is disclosed in the Statement of Operations.
The following is a summary of the Fund's securities lending agreement and related cash and non-cash collateral received as of November 30, 2018:
| | | Market Value of Securities on Loan | | | Cash Collateral Received | | | Non-Cash Collateral Received | | | Total Collateral Received | |
| Barron's 400 ETF | | $ | 2,065,137 | | | $ | 1,071,589 | | | $ | 1,025,383 | | | $ | 2,096,972 | |
The risks of securities lending include the risk that the borrower may not provide additional collateral when required or may not return the securities when due. To mitigate these risks, the Fund benefits from a borrower default indemnity provided by SSB. SSB’s indemnity allows for full replacement of securities lent wherein SSB will purchase the unreturned loaned securities on the open market by applying the proceeds of the collateral, or to the extent such proceeds are insufficient or the collateral is unavailable, SSB will purchase the unreturned loan securities at SSB’s expense. However, the Fund could suffer a loss if the value of the investments purchased with cash collateral falls below the value of the cash collateral received.
The following table reflects a breakdown of transactions accounted for as secured borrowings, the gross obligation by the type of collateral pledged or securities loaned, and the remaining contractual maturity of those transactions as of November 30, 2018:
| Barron's 400 ETF | | Remaining contractual maturity of the agreements | |
| | | | |
| Securities Lending Transactions | | Overnight & Continuous | | Up to 30 days | | | 30-90 days | | | Greater than 90 days | | | Total | |
| Common Stocks | $ | 1,071,589 | | $ | – | | | $ | – | | | $ | – | | | $ | 1,071,589 | |
| Total Borrowings | | | | | | | | | | | | | | | | | 1,071,589 | |
| Gross amount of recognized liabilities for securities lending (collateral received) | | | | | | | | | | | $ | 1,071,589 | |
| Notes to Financial Statements | November 30, 2018 |
3. INVESTMENT ADVISORY FEE AND OTHER AFFILIATED TRANSACTIONS
ALPS Advisors, Inc. (“Adviser”) serves as the Fund’s investment adviser pursuant to an Investment Advisory Agreement with the Fund. As compensation for its services to the Fund, the Adviser receives an annual unitary fee of 0.65% based on the Fund’s average daily net assets payable monthly. The Adviser served under the previous investment advisory agreement, since the commencement of the Fund until these agreements were terminated on April 16, 2018, due to a change of control of the Adviser’s parent company. Beginning April 16, 2018, the Adviser served under an interim investment advisory agreement, until the current investment advisory agreement was approved by the Fund’s shareholders.
Out of the unitary management fee, the Adviser pays substantially all expenses of the Fund, the cost of transfer agency, custody, fund administration, legal, audit, independent trustees and other services, except for interest expenses, distribution fees or expenses, brokerage expenses, taxes and extraordinary expenses not incurred in the ordinary course of the Fund’s business. The Adviser’s unitary management fee is designed to pay substantially all of the Fund’s expenses and to compensate the Adviser for providing services for the Fund.
ALPS Fund Services, Inc., an affiliate of the Adviser, is the administrator of the Fund.
Each Trustee who is not an officer or employee of the Adviser, any sub-adviser or any of their affiliates (“Independent Trustees”) receives (1) a quarterly retainer of $5,000, (2) a per meeting fee for regularly scheduled meetings of $3,750, (3) $1,500 for any special meeting held outside of a regularly scheduled board meeting, and (4) reimbursement for all reasonable out-of-pocket expenses relating to attendance at meetings. In addition, both the Chairman of the Board and Chairman of the Audit Committee each receives a quarterly retainer of $2,000, in connection with their respective roles.
4. PURCHASES AND SALES OF SECURITIES
For the year ended November 30, 2018, the cost of purchases and proceeds from sales of investment securities, excluding in-kind transactions and short-term investments, were as follows:
| Fund | | Purchases | | | Sales | |
| Barron's 400 ETF | | $ | 168,126,251 | | | $ | 164,869,208 | |
For the year ended November 30, 2018, the cost of in-kind purchases and proceeds from in-kind sales were as follows:
| Fund | | Purchases | | | Sales | |
| Barron's 400 ETF | | $ | 81,219,547 | | | $ | 120,157,119 | |
For the year ended November 30, 2018, the Barron's 400SM ETF had in-kind net realized gain of $33,809,033.
Gains on in-kind transactions are not considered taxable for federal income tax purposes and losses on in-kind transactions are also not deductible for tax purposes.
5. CAPITAL SHARE TRANSACTIONS
Shares are created and redeemed by the Fund only in Creation Unit size aggregations of 50,000 Shares. Only broker-dealers or large institutional investors with creation and redemption agreements called Authorized Participants (“AP”) are permitted to purchase or redeem Creation Units from the Fund. Such transactions are generally permitted on an in-kind basis, with a balancing cash component to equate the transaction to the NAV per unit of the Fund on the transaction date. Cash may be substituted equivalent to the value of certain securities generally when they are not available in sufficient quantity for delivery, not eligible for trading by the AP or as a result of other market circumstances.
6. RELATED PARTY TRANSACTIONS
The Fund engaged in cross trades between other funds in the Trust during the year ended November 30, 2018 pursuant to Rule 17a-7 under the 1940 Act. Cross trading is the buying or selling of portfolio securities between funds to which the Adviser serves as the investment adviser. The Board previously adopted procedures that apply to transactions between the Funds of the Trust pursuant to Rule 17a-7. These transactions related to cross trades during the period complied with the requirements set forth by Rule 17a-7 and the Trust’s procedures.
| Notes to Financial Statements | November 30, 2018 |
Transactions related to cross trades during the year ended November 30, 2018, were as follows:
| Fund | | Purchase cost paid | | | Sale proceeds received | | | Realized gain/(loss) on sales | |
| Barron's 400 ETF | | $ | 1,910,339 | | | $ | 1,309,021 | | | $ | (71,429 | ) |
7. NEW ACCOUNTING PRONOUNCEMENTS
In August 2018, the Financial Accounting Standards Board (“FASB”) issued Accounting Standards Update (“ASU”) 2018-13, which changes the fair value measurement disclosure requirements of FASB ASC Topic 820, Fair Value Measurement. The update to Topic 820 includes new, eliminated, and modified disclosure requirements. ASU 2018-13 is effective for fiscal years beginning after December 15, 2019, including interim periods. Early adoption is permitted for any eliminated or modified disclosures. The Fund has elected to early adopt the eliminated and modified disclosures effective with the financial statements prepared as of November 30, 2018.
8. SEC REGULATIONS
On October 4, 2018, the SEC amended Regulation S-X to require certain financial statement disclosure requirements to conform them to GAAP for investment companies. Effective November 4, 2018, the Fund adopted disclosure requirement changes for Regulation S-X, these changes are reflected throughout this report. The Fund’s adoption of the amendments, effective with the financial statements prepared as of November 30, 2018, had no effect on the Fund’s net assets or results of operations.
| Additional Information | November 30, 2018 (Unaudited) |
PROXY VOTING RECORDS, POLICIES AND PROCEDURES
Information regarding how the Fund voted proxies relating to portfolio securities during the most recent 12-month period ended June 30 and a description of the Fund’s proxy voting policies and procedures used in determining how to vote for proxies are available without charge on the SEC’s website at www.sec.gov and upon request, by calling (toll-free) 1-866-675-2639.
PORTFOLIO HOLDINGS
The Trust is required to disclose, after its first and third fiscal quarters, the complete schedule of the Fund’s portfolio holdings with the SEC on Form N-Q. Forms N-Q for the Fund are available on the SEC’s website at www.sec.gov. The Fund’s Forms N-Q may also be reviewed and copied at the SEC’s Public Reference Room in Washington, D.C. and information on the operation of the Public Reference Room may be obtained by calling 1-800-SEC-0330. The Fund’s Forms N-Q are available without charge, upon request, by calling (toll-free) 1-866-675-2639 or by writing to ALPS ETF Trust at 1290 Broadway, Suite 1100, Denver, Colorado 80203.
TAX INFORMATION
The Fund designates the following for federal income tax purposes for distributions made during the calendar year ended December 31, 2017:
| | Qualified Dividend Income | Dividend Received Deduction |
| Barron's 400 ETF | 100.00% | 100.00% |
In early 2018, if applicable, shareholders of record received this information for the distribution paid to them by the Fund during the calendar year 2017 via Form 1099. The Fund will notify shareholders in early 2019 of amounts paid to them by the Fund, if any, during the calendar year 2018.
LICENSING AGREEMENT
MarketGrader Capital, LLC has entered into a license agreement with Dow Jones & Company to use the “Barron’s” name and certain related intellectual property in connection with the Underlying Index. MarketGrader Capital, LLC also has entered into a license and services agreement with its parent company, MarketGrader.com, to use the methodology for constructing the Underlying Index. MarketGrader Capital, LLC in turn has entered into the Sublicense Agreement with ALPS Advisers, Inc. to use the Underlying Index. The following disclosure relates to such licensing agreements:
The Barron’s 400SM ETF (the “Fund”) is not sponsored, endorsed, sold or promoted by the MarketGrader Capital, LLC (the “Index Provider”). The Index Provider makes no representation or warranty, express or implied, to the owners of the Fund or any member of the public regarding the advisability of investing in securities generally or in the Fund particularly or the ability of the Fund to track the performance of the physical commodities market. The Index Provider’s only relationship to the ALPS Advisors, Inc. (the “Adviser”) or the Fund is the licensing of certain service marks and trade names of the Index Provider and of the Underlying Index that is determined, composed and calculated by the Index Provider without regard to the Adviser or the Fund. The Index Provider has no obligation to take the needs of the Adviser or the Fund or the owners of the Fund into consideration in determining, composing or calculating the Underlying Index. The Index Provider is not responsible for and has not participated in the determination of the timing of, prices at, or quantities of the Fund to be issued or in the determination or calculation of the equation by which the Fund is to be converted into cash. The Index Provider has no obligation or liability in connection with the administration, marketing or trading of the Fund.
THE INDEX PROVIDER DOES NOT GUARANTEE THE ACCURACY AND/OR THE COMPLETENESS OF THE UNDERLYING INDEX OR ANY DATA INCLUDED THEREIN AND THE INDEX PROVIDER SHALL HAVE NO LIABILITY FOR ANY ERRORS, OMISSIONS, OR INTERRUPTIONS THEREIN. THE INDEX PROVIDER MAKES NO WARRANTY, EXPRESS OR IMPLIED, AS TO RESULTS TO BE OBTAINED BY THE ADVISER, THE FUND, OWNERS OF THE FUND, OR ANY OTHER PERSON OR ENTITY FROM THE USE OF THE UNDERLYING INDEX OR ANY DATA INCLUDED THEREIN. THE INDEX PROVIDER MAKES NO EXPRESS OR IMPLIED WARRANTIES, AND EXPRESSLY DISCLAIMS ALL WARRANTIES OF MERCHANTABILITY OR FITNESS FOR A PARTICULAR PURPOSE OR USE WITH RESPECT TO THE UNDERLYING INDEX OR ANY DATA INCLUDED THEREIN. WITHOUT LIMITING ANY OF THE FOREGOING, IN NO EVENT SHALL THE INDEX PROVIDER HAVE ANY LIABILITY FOR ANY SPECIAL, PUNITIVE, INDIRECT, OR CONSEQUENTIAL DAMAGES (INCLUDING LOST PROFITS), EVEN IF NOTIFIED OF THE POSSIBILITY OF SUCH DAMAGES.
| Additional Information | November 30, 2018 (Unaudited) |
“The Barron’s 400 IndexSM” is calculated and published by MarketGrader Capital, LLC (“MarketGrader”). “Barron’s,” “Barron’s 400” and “Barron’s 400 Index” are trademarks or service marks of DJC & Company, Inc. or its affiliates and have been licensed to MarketGrader and sublicensed for certain purposes by Barron’s 400 Exchange Traded Fund, a sub-fund of that certain ALPS ETF Trust, a Delaware Statutory Trust (“Sub-Licensee”). The Barron’s 400 ETF (the “Product”) is not sponsored, endorsed, sold or promoted by DJC or its affiliates. DJC and its affiliates make no representation or warranty, express or implied, to the owners of the Fund or any member of the public regarding the advisability of trading in the Fund particularly. DJC and its affiliates’ only relationship to the Licensee is the licensing of certain trademarks and trade names of DJC. DJC has no obligation to take the needs of the Licensee or the owners of the Fund into consideration in connection with its licensing of the Barron’s 400 Index to MarketGrader or the sublicense to Licensee. DJC and its affiliates are not responsible for and have not participated in the determination of the timing of, prices at, or quantities of the Fund to be sold or in the determination or calculation of the equation by which the Product are to be converted into cash. DJC and its affiliates have no obligation or liability in connection with the administration, marketing or trading of the Barron’s 400 Index or the Product.
DOW JONES DOES NOT GUARANTEE THE ACCURACY AND/OR THE COMPLETENESS OF THE BARRON’S 400 INDEX OR ANY DATA INCLUDED THEREIN AND DOW JONES AND ITS AFFILIATES SHALL HAVE NO LIABILITY FOR ANY ERRORS, OMISSIONS, OR INTERRUPTIONS THEREIN. DOW JONESAND ITS AFFILIATES MAKE NO WARRANTY, EXPRESS OR IMPLIED, AS TO RESULTS TO BE OBTAINED BY THE LICENSEE, OWNERS OF THE FUND, OR ANY OTHER PERSON OR ENTITY FROM THE USE OF THE BARRON’S 400 INDEX OR ANY DATA INCLUDED THEREIN. DOW JONES AND ITS AFFILIATES MAKE NO EXPRESS OR IMPLIED WARRANTIES. AND EXPRESSLY DISCLAIM ALL WARRANTIES, OF MERCHANTABILITY OR FITNESS FOR A PARTICULAR PURPOSE OR USE WITH RESPECT TO THE BARRON’S 400 INDEX OR ANY DATA INCLUDED THEREIN. WITHOUT LIMITING ANY OF THE FOREGOING, IN NO EVENT SHALL DOW JONES AND ITS AFFILIATES HAVE ANY LIABILITY FOR ANY LOST PROFITS OR INDIRECT, PUNITIVE, SPECIAL OR CONSEQUENTIAL DAMAGES OR LOSSES, EVEN IF NOTIFIED OF THE POSSIBILITY OF SUCH DAMAGES. THERE ARE NO THIRD PARTY BENEFICIARIES OF ANY AGREEMENTS OR ARRANGEMENTS BETWEEN DJC AND THE LICENSEE, OTHER THAN THE LICENSORS OF MARKETGRADER.
The Adviser does not guarantee the accuracy and/or the completeness of the Underlying Index or any data included therein, and the Adviser shall have no liability for any errors, omissions or interruptions therein. The Adviser makes no warranty, express or implied, as to results to be obtained by the Fund, owners of the Shares of the Fund or any other person or entity from the use of the Underlying Index or any data included therein. The Adviser makes no express or implied warranties, and expressly disclaims all warranties of merchantability or fitness for a particular purpose or use with respect to the Underlying Index or any data included therein. Without limiting any of the foregoing, in no event shall the Adviser have any liability for any special, punitive, direct, indirect or consequential damages (including lost profits) arising out of matters relating to the use of the Underlying Index, even if notified of the possibility of such damages.
Barron’s 400SM ETF
| Trustees & Officers | November 30, 2018 (Unaudited) |
The general supervision of the duties performed by the Adviser for the Fund under the Investment Advisory Agreement is the responsibility of the Board of Trustees. The Trust currently has four Trustees. Three Trustees have no affiliation or business connection with the Adviser or any of its affiliated persons and do not own any stock or other securities issued by the Adviser. These are the “non-interested” or “independent” Trustees (“Independent Trustees”). The other Trustee (the “Interested Trustee”) is affiliated with the Adviser.
The Independent Trustees of the Trust, their term of office and length of time served, their principal business occupations during the past five years, the number of portfolios in the Fund Complex overseen by each Independent Trustee, and other directorships, if any, held by the Trustee are shown below.
INDEPENDENT TRUSTEES
Name, Address
& Year of Birth* | Position(s) Held
with Trust | Term of Office
and Length of
Time Served** | Principal Occupation(s)
During Past 5 Years | Number of
Portfolios in
Fund Complex
Overseen by
Trustees*** | Other Directorships
Held by Trustees |
Mary K. Anstine,
1940 | Trustee | Since March 2008 | Ms. Anstine was President/Chief Executive Officer of HealthONE Alliance, Denver, Colorado, and former Executive Vice President of First Interstate Bank of Denver. Ms. Anstine is also Trustee/Director of AV Hunter Trust and Colorado Uplift Board. Ms. Anstine was formerly a Director of the Trust Bank of Colorado (later purchased and now known as Northern Trust Bank), HealthONE and Denver Area Council of the Boy Scouts of America and a member of the American Bankers Association Trust Executive Committee. | 41 | Ms. Anstine is a Trustee of ALPS Variable Investment Trust (9 funds); Financial Investors Trust (33 funds); Reaves Utility Income Fund (1 fund); and Segall Bryant & Hamill Trust (14 funds). |
Jeremy W. Deems,
1976 | Trustee | Since March 2008 | Mr. Deems is the Co-Founder, Chief Compliance Officer and Chief Financial Officer of Green Alpha Advisors, LLC. Mr. Deems is Co-Portfolio Manager of the Shelton Green Alpha Fund. Prior to joining Green Alpha Advisors, Mr. Deems was CFO and Treasurer of Forward Management, LLC, ReFlow Management Co., LLC, ReFlow Fund, LLC, a private investment fund, and Sutton Place Management, LLC, an administrative services company. | 41 | Mr. Deems is a Trustee of ALPS Variable Investment Trust (9 funds); Financial Investors Trust (33 funds); and Reaves Utility Income Fund (1 fund); and Clough Funds Trust (1 fund). |
Rick A. Pederson,
1952 | Trustee and Chairman | Since March 2008. Has served as Chairman since July 2017. | Mr. Pederson is Partner, Bow River Capital Partners (private equity management), 2003 - present; Board Member, Prosci Inc. (private business services) 2013-2016; Board Member, Citywide Banks (Colorado community bank) 2014-present; Board Member, Strong-Bridge Consulting (management consulting) 2015-present; Board Member, IRI/ODMS Holdings LLC, 2017 – present; Director, National Western Stock Show (not-for- profit organization) 2010 – present; Board Member, History Colorado, 2015 – present; Trustee, Boettcher Foundation, 2018. | 21 | Mr. Pederson is Trustee of Segall Bryant & Hamill Trust (14 funds) and Principal Real Estate Income Fund (1 fund) |
| * | The business address of the Trustee is c/o ALPS Advisors, Inc., 1290 Broadway, Suite 1100, Denver, Colorado 80203. |
| ** | This is the period for which the Trustee began serving the Trust. Each Trustee serves an indefinite term, until his successor is elected. |
| *** | The Fund Complex includes all series of the Trust and any other investment companies for which ALPS Advisors, Inc. provides investment advisory services. |
Barron’s 400SM ETF
| Trustees & Officers | November 30, 2018 (Unaudited) |
The Trustee who is affiliated with the Adviser or affiliates of the Adviser and executive officers of the Trust, his term of office and length of time served, his principal business occupations during the past five years, the number of portfolios in the Fund Complex overseen by the Interested Trustee and the other directorships, if any, held by the Trustee, are shown below.
INTERESTED TRUSTEE
Name, Address
and Year of
Birth of
Interested
Trustee* | Position(s) Held
with Trust | Term of Office
and Length of
Time Served** | Principal Occupation(s)
During Past 5 Years | Number of
Portfolios in Fund
Complex Overseen
by Trustees*** | Other Directorships
Held by Trustee |
Edmund J. Burke,
1961 | Trustee and President | Since December 2017 | Mr. Burke is President and a Director of ALPS Holdings, Inc. (“AHI”) (since 2005) and Director of Boston Financial Data Services, Inc. (“BFDS”), ALPS Advisors, Inc. (“AAI”), ALPS Distributors, Inc. (“ADI”), ALPS Fund Services, Inc. (“AFS”) and ALPS Portfolio Solutions Distributor, Inc. (“APSD”). Because of his positions with AHI, BFDS, AAI, ADI, AFS and APSD, Mr. Burke is deemed an affiliate of the Trust as defined under the 1940 Act. | 36 | Mr. Burke is a Trustee of Clough Global Dividend and Income Fund (1 fund); Clough Global Equity Fund (1 fund); Clough Global Opportunities Fund (1 fund); Clough Funds Trust (1 fund); Liberty All-Star Equity Fund (1 fund); Director of the Liberty All-Star Growth Fund, Inc. (1 fund) and Financial Investors Trust (33 funds). |
| * | The business address of the Trustee is c/o ALPS Advisors, Inc., 1290 Broadway, Suite 1100, Denver, Colorado 80203. |
| ** | This is the period for which the Trustee began serving the Trust. Each Trustee serves an indefinite term, until his successor is elected. |
| *** | The Fund Complex includes all series of the Trust and any other investment companies for which ALPS Advisors, Inc. provides investment advisory services. |
Barron’s 400SM ETF
| Trustees & Officers | November 30, 2018 (Unaudited) |
OFFICERS
Name, Address
and Year of
Birth of Officer* | Position(s) Held
with Trust | Length of
Time Served** | Principal Occupation(s) During Past 5 Years |
Erin D. Nelson,
1977 | Chief Compliance Officer (“CCO”) | Since December 2015 | Ms. Nelson became Senior Vice-President and Chief Compliance Officer of ALPS Advisors, Inc. on July 1, 2015 and prior to that served as Vice President and Deputy Chief Compliance Officer of AAI since January 1, 2015. Prior to January 1, 2015, Ms. Nelson was Vice-President and Assistant General Counsel of ALPS Fund Services. Because of her position with AAI, Ms. Nelson is deemed an affiliate of the Trust as defined under the 1940 Act. Ms. Nelson is also the CCO of ALPS Variable Investment Trust, Liberty All-Star Growth Fund, Inc., Liberty All-Star Equity Fund, Principal Real Estate Income Fund, RiverNorth Opportunities Fund, Inc. and Red Rocks Capital, LLC. |
Kathryn Burns,
1976 | Treasurer | Since September 2018 | Ms. Burns serves as Vice President, Director of Fund Operations of AAI since 2018. From 2013 to 2018, she served as Vice President and Fund Controller at ALPS Fund Services. Prior to joining ALPS, she worked at Old Mutual Capital where she served as Vice President and Chief Compliance Officer (2010 – 2012) and Regulatory Reporting Manager and Assistant Treasurer to the Old Mutual Funds Trusts (2006 – 2012). She also served as a CPA for PricewaterhouseCoopers LLP. Ms. Burns is also Treasurer of ALPS Variable Investment Trust, Boulder Growth & Income Fund, Inc., Principal Real Estate Income Fund and RiverNorth Opportunities Fund Inc. |
Andrea E. Kuchli,
1985 | Secretary | Since December 2017 | Ms. Kuchli joined ALPS in 2015 and is currently Vice President and Senior Counsel of ALPS. Prior to joining ALPS, Ms. Kuchli was an Associate with Davis Graham & Stubbs LLP from April 2014 to February 2015, and an Associate with Dechert LLP from 2011 to April 2014. Because of her position with ALPS, Ms. Kuchli is deemed an affiliate of the Trust as defined under the 1940 Act. Ms. Kuchli is also Secretary of ALPS Variable Investment Trust and Principal Real Estate Income Fund as well as Assistant Secretary of the James Advantage Funds. |
Sharon Akselrod,
1974 | Assistant Secretary | Since December 2016 | Ms. Akselrod joined ALPS in August 2014 and is currently Senior Investment Company Act Paralegal of ALPS Fund Services, Inc. Prior to joining ALPS, Ms. Akselrod served as Corporate Governance and Regulatory Associate for Nordstrom fsb (2013-2014) and Senior Legal Assistant – Legal Manager for AXA Equitable Life Insurance Company (2008-2013). Because of her position with ALPS, Ms. Akselrod is deemed an affiliate of the Trust as defined under the 1940 Act. Ms. Akselrod is also Assistant Secretary of Financial Investors Trust, ALPS Variable Investment Trust, Principal Real Estate Income Fund and Clough Funds Trust. |
| * | The business address of each Officer is c/o ALPS Advisors, Inc., 1290 Broadway, Suite 1100, Denver, Colorado 80203. |
| ** | This is the period for which the Officer began serving the Trust. Each Officer serves an indefinite term, until his/her successor is elected. |
Page Intentionally Left Blank

Must be accompanied or preceded by a prospectus.
ALPS Portfolio Solutions Distributor, Inc., a FINRA member, is the Distributor for the Barron’s 400SM ETF.
TABLE OF
CONTENTS
| Performance Overview | 1 |
| Disclosure of Fund Expenses | 4 |
| Report of Independent Registered Public Accounting Firm | 5 |
| Schedule of Investments | 6 |
| Statement of Assets and Liabilities | 8 |
| Statement of Operations | 9 |
| Statements of Changes in Net Assets | 10 |
| Financial Highlights | 11 |
| Notes to Financial Statements | 12 |
| Additional Information | 18 |
| Trustees & Officers | 20 |
Beginning on January 1, 2021, as permitted by regulations adopted by the U.S. Securities and Exchange Commission, paper copies of the Fund’s annual and semi-annual shareholder reports will no longer be sent by mail, unless you specifically request paper copies of the reports from your financial intermediary (such as a broker-dealer or bank). Instead, the reports will be made available on the Fund’s website (www.alpsfunds.com), and you will be notified by mail each time a report is posted and provided with a website link to access the report.
If you already elected to receive shareholder reports electronically, you will not be affected by this change and you need not take any action. You may elect to receive shareholder reports and other communications from a Fund electronically anytime by contacting your financial intermediary.
You may elect to receive all future reports in paper free of charge. You can contact your financial intermediary to request that you continue to receive paper copies of your shareholder reports. Your election to receive reports in paper will apply to all funds held in your account with your financial intermediary.
alpsfunds.com
BUZZ US Sentiment Leaders ETF
| Performance Overview | November 30, 2018 (Unaudited) |
Investment Objective
The BUZZ US Sentiment Leaders ETF (the “Fund” or “BUZ”) employs a “passive management” - or indexing - investment approach designed to seek investment results that correspond (before fees and expenses) generally to the performance of its underlying index, the BUZZ NextGen AI US Sentiment Leaders Index (the “Underlying Index”).
The Underlying Index utilizes a rules-based quantitative methodology developed by BUZZ Indexes Inc. (the “Index Provider”), which is designed to identify the U.S. common stocks with the most “positive insights” collected from social media networks. Such positive insights are a measure of the degree of positive company sentiment as well as the breadth of active discussion about each company by participants on social media networks. The Index Provider then selects the 75 companies with the highest positive insight scores for inclusion in the Underlying Index and weights the 75 constituent common stocks of the Underlying Index based on a proprietary scoring model.
Performance Overview
The Fund for the twelve month period ended November 30, 2018, generated a total return of 10.34%, in line with the Fund’s Underlying Index, net of fees, which returned 10.83%. The Fund outperformed the S&P 500® Total Return Index, which returned 6.27% for the same period.
The S&P 500® Total Return Index ended November 30, 2018 up 6.27%, after an October sell-off caused the US broad-based benchmark to give back most of the year’s gains. This is after hitting its all-time high on September 20, 2018, ending that month up 11.78% from November 30, 2017. The year started with a boost from corporate tax cuts, positive macro data, and strong corporate earnings and stock buybacks. After a market correction between February and March as interest rates spiked, the market rebounded throughout most of Q2 and Q3. Higher inflationary outlooks continued to drive interest rates to highs last seen in 2011, and an escalating U.S. - China trade war sent the market into a tailspin in October, down almost 8% for the month amid heightened volatility. From the Federal Open Market Committee perspective, the U.S. economy saw 3 rate hikes in 2018, leading many investors to question whether the fed funds rate was being raised too quickly as the housing market weakened throughout the year. At the end of November 30, 2018, crude oil had fallen from its highs amid record production by the U.S. and OPEC. Despite the pull back in the equity markets, Q3 corporate earnings were largely positive, however, the U.S. – China trade war started to affect 2019 earnings estimates even with a quasi “trade truce” announced by the U.S. and China.
The BUZZ US Sentiment Leaders ETF outperformed the S&P 500® Total Return Index by 4.07%. Outperformance was driven solely by selection effect from holdings in the information technology sector. The two names that provided a bulk of the relative outperformance for the year were Advanced Micro Devices, Inc. (AMD) and Square Inc., Class A (SQ). Both names had the highest sentiment scores in the fund, garnering a maximum weighting allocation of 3% each on rebalancing dates. Blackberry, Ltd. (BBRY) and First Solar (FLSR) were the two largest detractors from performance for the time period.
Looking forward we believe the Fund’s strategy of using Artificial Intelligence, Natural Language Processing, and Machine learning to identify the top names within the social universe with positive sentiment may lead to market participation in all economic cycles.
Performance(as of November 30, 2018)
| | 1 Year | Since Inception^ |
| BUZZ US Sentiment Leaders ETF - NAV | 10.34% | 13.79% |
| BUZZ US Sentiment Leaders ETF - Market Price* | 10.07% | 13.75% |
| BUZZ NextGen AI US Sentiment Leaders Total Return Index | 10.83% | 14.29% |
| S&P 500® Total Return Index | 6.27% | 13.40% |
Total Expense Ratio (per the current prospectus) 0.75%
Performance data quoted represents past performance. Past performance does not guarantee future results. The table does not reflect the deduction of taxes that a shareholder would pay on Fund distributions or the redemption of Fund shares. Investment return and principal value of an investment will fluctuate so that an investor’s shares, when redeemed, may be worth more or less than their original cost. Current performance may be higher or lower than actual data quoted. For the most current month-end performance data please visit www.alpsfunds.com or call 1.855.215.1425.
BUZZ US Sentiment Leaders ETF
| Performance Overview | November 30, 2018 (Unaudited) |
NAV is an exchange-traded fund’s per-share value. The per-share dollar amount of the Fund is derived by dividing the total value of all the securities in its portfolio, less any liabilities, by the number of Fund shares outstanding. Market Price is the price at which a share can currently be traded in the market. Information detailing the number of days the Market Price of the Fund was greater than the Fund’s NAV and the number of days it was less than the Fund’s NAV can be obtained at www.alpsfunds.com.
| ^ | The Fund’s Commencement date was April 19, 2016. |
| * | Market Price is based on the midpoint of the bid-ask spread at 4 p.m. ET and does not represent the returns an investor would receive if shares were traded at other times. |
BUZZ NextGen AI US Sentiment Leaders Total Return Index is comprised of 75 stocks with the highest “positive insight” rankings collected from online forums. These stocks must meet certain market capitalization and average daily trading volume requirements to be included in the index and are weighted based on a proprietary scoring model developed by BUZZ Indexes Inc.
S&P 500® Total Return Index is the Standard & Poor’s composite index of 500 stocks, a widely recognized, unmanaged index of common stock prices.
The indexes are reported on a total return basis, which assumes reinvestment of any dividends and distributions realized during a given time period. The indexes are not actively managed and do not reflect any deductions for fees, expenses or taxes. One cannot invest directly in an index. Index performance does not reflect fund performance.
Funds that invest in securities of medium capitalization companies involve greater risk than customarily is associated with investing in larger, more established companies. A medium capitalization company is defined as a company with a market capitalization between $2 billion and $10 billion. These companies’ securities may be more volatile and less liquid than those of more established companies. These securities may have returns that vary, sometimes significantly, from the overall securities market. Often medium capitalization companies and the industries in which they focus are still evolving and, as a result, they may be more sensitive to changing market conditions.
The Fund’s shares are not individually redeemable. Investors buy and sell shares of the Fund on a secondary market. Only market makers or “authorized participants” may trade directly with the Fund, typically in blocks of 50,000 shares.
The BUZZ US Sentiment Leaders ETF is not suitable for all investors. Investments in the Fund are subject to investment risks, including possible loss of the principal amount invested.
ALPS Portfolio Solutions Distributor, Inc., a FINRA member, is the distributor for the BUZZ US Sentiment Leaders ETF.
ALPS Portfolio Solutions Distributor, Inc. is not affiliated with BUZZ Indexes Inc.
BUZZ US Sentiment Leaders ETF
| Performance Overview | November 30, 2018 (Unaudited) |
Top 10 Holdings*(asof November 30, 2018)
| Amazon.com, Inc. | 3.12% |
| Microsoft Corp. | 3.09% |
| ConocoPhillips | 3.03% |
| Tesla, Inc. | 3.00% |
| BlackBerry, Ltd. | 2.96% |
| Advanced Micro Devices, Inc. | 2.96% |
| Facebook, Inc., Class A | 2.92% |
| Square, Inc., Class A | 2.84% |
| Apple, Inc. | 2.79% |
| Netflix, Inc. | 2.78% |
| Total % of Top 10 Holdings | 29.49% |
Sector Allocation*(asof November 30, 2018)
| |
| Information Technology | 34.47% |
| Communication Services | 19.59% |
| Consumer Discretionary | 13.04% |
| Health Care | 10.64% |
| Financials | 7.58% |
| Industrials | 5.30% |
| Consumer Staples | 4.69% |
| Energy | 4.54% |
| Money Market Fund | 0.15% |
| Total | 100.00% |
* % of Total Investments
Future holdings are subject to change.
Growth of $10,000(as of November 30, 2018)
Comparison of Change in Value of $10,000 Investment in the Fund and the Underlying Index
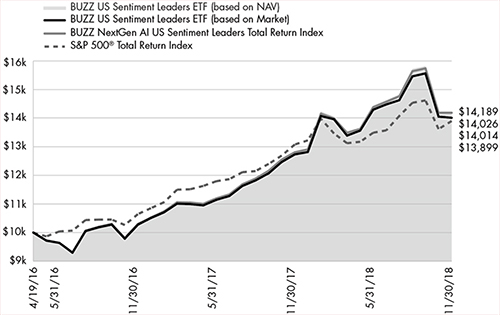
The chart above represents historical performance of a hypothetical investment of $10,000 in the Fund over the life of the Fund. Past performance does not guarantee future results. This chart does not reflect the deduction of taxes that a shareholder would pay on Fund distributions or the redemption of Fund shares.
BUZZ US Sentiment Leaders ETF
| Disclosure of Fund Expenses | November 30, 2018 (Unaudited) |
Shareholder Expense Example: As a shareholder of the Fund, you incur two types of costs: (1) transaction costs which may include creation and redemption fees or brokerage charges, and (2) ongoing costs, including management fees and other Fund expenses. These examples are intended to help you understand your ongoing costs (in dollars) of investing in a Fund and to compare these costs with the ongoing costs of investing in other funds. It is based on an investment of $1,000 invested at the beginning of the (six month) period and held through November 30, 2018.
Actual Return: The first line of the table provides information about actual account values and actual expenses. You may use the information in this line, together with the amount you invested, to estimate the expenses that you incurred over the period. Simply divide your account value by $1,000 (for example, an $8,600 account value divided by $1,000 = 8.6), then multiply the result by the number in the first line under the heading entitled “Expenses Paid During Period” to estimate the expenses attributable to your investment during this period.
Hypothetical 5% Return: The second line of the table provides information about hypothetical account values and hypothetical expenses based on the Fund’s actual expense ratio and an assumed rate of return of 5% per year before expenses, which is not the Fund’s actual return. The hypothetical account values and expenses may not be used to estimate the actual ending account balance or expenses you paid for the period. You may use this information to compare ongoing costs of investing in the Fund and other funds. To do so, compare this 5% hypothetical example with the 5% hypothetical examples that appear in the shareholder reports of other funds.
The expenses shown in the table are meant to highlight ongoing Fund costs only and do not reflect any transaction costs, such as creation and redemption fees or brokerage charges. Therefore, the second line is useful in comparing ongoing costs only, and will not help you determine the relative total costs of owning different funds. In addition, if these costs were included, your costs would have been higher.
| | Beginning Account Value 6/1/18 | Ending Account Value 11/30/18 | Expense Ratio(a) | Expenses Paid During Period 6/1/18 - 11/30/18(b) |
| BUZZ US Sentiment Leaders ETF | | | | |
| Actual | $1,000.00 | $984.80 | 0.75% | $3.73 |
| Hypothetical (5% return before expenses) | $1,000.00 | $1,021.31 | 0.75% | $3.80 |
| (a) | Annualized, based on the Fund's most recent fiscal half year expenses. |
| (b) | Expenses are equal to the Fund's annualized expense ratio multiplied by the average account value over the period, multiplied by the number of days in the most recent fiscal half year (183), divided by 365. |
BUZZ US Sentiment Leaders ETF
| Report of Independent Registered Public Accounting Firm | |
To the shareholders and the Board of Trustees of ALPS ETF Trust:
Opinion on the Financial Statements and Financial Highlights
We have audited the accompanying statement of assets and liabilities, including the schedule of investments, of Buzz US Sentiment Leaders ETF (the “Fund”), one of the funds constituting the ALPS ETF Trust, as of November 30, 2018, the related statement of operations for the year then ended, the statements of changes in net assets for each of the two years in the period then ended, the financial highlights for the years ended November 30, 2018, 2017 and for the period April 19, 2016 (commencement of operations) to November 30, 2016, and the related notes. In our opinion, the financial statements and financial highlights present fairly, in all material respects, the financial position of Buzz US Sentiment Leaders ETF of ALPS ETF Trust as of November 30, 2018, and the results of its operations for the year then ended, the changes in its net assets for each of the two years in the period then ended, and the financial highlights for the years ended November 30, 2018, 2017 and for the period April 19, 2016 (commencement of operations) to November 30, 2016, in conformity with accounting principles generally accepted in the United States of America.
Basis for Opinion
These financial statements and financial highlights are the responsibility of the Fund’s management. Our responsibility is to express an opinion on the Fund’s financial statements and financial highlights based on our audits. We are a public accounting firm registered with the Public Company Accounting Oversight Board (United States) (PCAOB) and are required to be independent with respect to the Fund in accordance with the U.S. federal securities laws and the applicable rules and regulations of the Securities and Exchange Commission and the PCAOB.
We conducted our audits in accordance with the standards of the PCAOB. Those standards require that we plan and perform the audit to obtain reasonable assurance about whether the financial statements and financial highlights are free of material misstatement, whether due to error or fraud. The Fund is not required to have, nor were we engaged to perform, an audit of its internal control over financial reporting. As part of our audits we are required to obtain an understanding of internal control over financial reporting but not for the purpose of expressing an opinion on the effectiveness of the Fund’s internal control over financial reporting. Accordingly, we express no such opinion.
Our audits included performing procedures to assess the risks of material misstatement of the financial statements and financial highlights, whether due to error or fraud, and performing procedures that respond to those risks. Such procedures included examining, on a test basis, evidence regarding the amounts and disclosures in the financial statements and financial highlights. Our audits also included evaluating the accounting principles used and significant estimates made by management, as well as evaluating the overall presentation of the financial statements and financial highlights. Our procedures included confirmation of securities owned as of November 30, 2018, by correspondence with the custodian and brokers; when replies were not received from brokers, we performed other auditing procedures. We believe that our audits provide a reasonable basis for our opinion.
DELOITTE & TOUCHE LLP
Denver, Colorado
January 24, 2019
We have served as the auditor of one or more investment companies advised by ALPS Advisors, Inc. since 2007.
BUZZ US Sentiment Leaders ETF
| Schedule of Investments | November 30, 2018 |
| Security Description | | Shares | | | Value | |
| COMMON STOCKS (99.72%) | | | | | | | | |
| Communication Services (19.56%) | | | | | | | | |
| Activision Blizzard, Inc. | | | 2,530 | | | $ | 126,196 | |
| Alphabet, Inc., Class A(a) | | | 154 | | | | 170,886 | |
| AT&T, Inc. | | | 4,803 | | | | 150,046 | |
| CenturyLink, Inc. | | | 5,096 | | | | 95,805 | |
| Facebook, Inc., Class A(a) | | | 2,171 | | | | 305,264 | |
| Match Group, Inc.(a) | | | 1,907 | | | | 76,795 | |
| Netflix, Inc.(a) | | | 1,014 | | | | 290,136 | |
| Take-Two Interactive Software, Inc.(a) | | | 1,114 | | | | 122,172 | |
| T-Mobile US, Inc.(a) | | | 951 | | | | 65,096 | |
| TripAdvisor, Inc.(a) | | | 1,255 | | | | 80,395 | |
| Twitter, Inc.(a) | | | 7,186 | | | | 226,000 | |
| Verizon Communications, Inc. | | | 2,217 | | | | 133,685 | |
| Walt Disney Co. | | | 1,775 | | | | 204,995 | |
| Total Communication Services | | | | | | | 2,047,471 | |
| | | | | | | | | |
| Consumer Discretionary (13.02%) | | | | | | | | |
| Amazon.com, Inc.(a) | | | 193 | | | | 326,203 | |
| Booking Holdings, Inc.(a) | | | 34 | | | | 64,324 | |
| Caesars Entertainment Corp.(a) | | | 9,238 | | | | 78,708 | |
| Ford Motor Co. | | | 20,518 | | | | 193,074 | |
| McDonald's Corp. | | | 629 | | | | 118,573 | |
| Starbucks Corp. | | | 2,201 | | | | 146,851 | |
| Tesla, Inc.(a) | | | 896 | | | | 314,030 | |
| Under Armour, Inc., Class C(a) | | | 5,441 | | | | 121,497 | |
| Total Consumer Discretionary | | | | | | | 1,363,260 | |
| | | | | | | | | |
| Consumer Staples (4.68%) | | | | | | | | |
| Coca-Cola Co. | | | 1,984 | | | | 99,994 | |
| PepsiCo, Inc. | | | 522 | | | | 63,653 | |
| Philip Morris International, Inc. | | | 752 | | | | 65,070 | |
| Procter & Gamble Co. | | | 904 | | | | 85,437 | |
| Walmart, Inc. | | | 1,800 | | | | 175,770 | |
| Total Consumer Staples | | | | | | | 489,924 | |
| | | | | | | | | |
| Energy (4.54%) | | | | | | | | |
| Chevron Corp. | | | 547 | | | | 65,060 | |
| ConocoPhillips | | | 4,790 | | | | 317,002 | |
| Exxon Mobil Corp. | | | 1,167 | | | | 92,777 | |
| Total Energy | | | | | | | 474,839 | |
| | | | | | | | | |
| Financials (7.57%) | | | | | | | | |
| American Express Co. | | | 634 | | | | 71,179 | |
| Bank of America Corp. | | | 4,997 | | | | 141,915 | |
| Citigroup, Inc. | | | 1,135 | | | | 73,537 | |
| Discover Financial Services | | | 1,381 | | | | 98,466 | |
| Goldman Sachs Group, Inc. | | | 670 | | | | 127,762 | |
| JPMorgan Chase & Co. | | | 801 | | | | 89,063 | |
| KeyCorp | | | 6,218 | | | | 114,038 | |
| Morgan Stanley | | | 1,718 | | | | 76,262 | |
| Total Financials | | | | | | | 792,222 | |
| | | | | | | | | |
| Health Care (10.63%) | | | | | | | | |
| AbbVie, Inc. | | | 915 | | | | 86,257 | |
| Amgen, Inc. | | | 386 | | | | 80,384 | |
| Security Description | | | Shares | | | | Value | |
| Health Care (continued) | | | | | | | | |
| Biogen, Inc.(a) | | | 206 | | | $ | 68,746 | |
| Celgene Corp.(a) | | | 1,624 | | | | 117,285 | |
| CVS Health Corp. | | | 974 | | | | 78,115 | |
| Gilead Sciences, Inc. | | | 1,852 | | | | 133,233 | |
| Intuitive Surgical, Inc.(a) | | | 126 | | | | 66,890 | |
| Johnson & Johnson | | | 653 | | | | 95,926 | |
| Merck & Co., Inc. | | | 1,681 | | | | 133,370 | |
| Pfizer, Inc. | | | 2,400 | | | | 110,952 | |
| Regeneron Pharmaceuticals, Inc.(a) | | | 201 | | | | 73,496 | |
| UnitedHealth Group, Inc. | | | 242 | | | | 68,089 | |
| Total Health Care | | | | | | | 1,112,743 | |
| | | | | | | | | |
| Industrials (5.29%) | | | | | | | | |
| American Airlines Group, Inc. | | | 2,076 | | | | 83,372 | |
| Boeing Co. | | | 356 | | | | 123,447 | |
| Caterpillar, Inc. | | | 551 | | | | 74,754 | |
| Delta Air Lines, Inc. | | | 2,008 | | | | 121,906 | |
| ManpowerGroup, Inc. | | | 952 | | | | 77,283 | |
| United Continental Holdings, Inc.(a) | | | 754 | | | | 72,912 | |
| Total Industrials | | | | | | | 553,674 | |
| | | | | | | | | |
| Information Technology (34.43%) | | | | | | | | |
| Adobe, Inc.(a) | | | 260 | | | | 65,231 | |
| Advanced Micro Devices, Inc.(a) | | | 14,535 | | | | 309,595 | |
| Apple, Inc. | | | 1,632 | | | | 291,443 | |
| BlackBerry, Ltd.(a) | | | 35,255 | | | | 309,891 | |
| Intel Corp. | | | 3,656 | | | | 180,277 | |
| International Business Machines Corp. | | | 767 | | | | 95,315 | |
| Lam Research Corp. | | | 498 | | | | 78,166 | |
| Mastercard, Inc., Class A | | | 388 | | | | 78,015 | |
| Micron Technology, Inc.(a) | | | 6,621 | | | | 255,306 | |
| Microsoft Corp. | | | 2,912 | | | | 322,912 | |
| NVIDIA Corp. | | | 948 | | | | 154,932 | |
| PayPal Holdings, Inc.(a) | | | 2,969 | | | | 254,770 | |
| QUALCOMM, Inc. | | | 1,212 | | | | 70,611 | |
| Shopify, Inc., Class A(a) | | | 1,114 | | | | 170,063 | |
| Square, Inc., Class A(a) | | | 4,244 | | | | 296,401 | |
| Symantec Corp. | | | 3,436 | | | | 75,970 | |
| TE Connectivity, Ltd. | | | 2,358 | | | | 181,401 | |
| Twilio, Inc., Class A(a) | | | 1,497 | | | | 141,452 | |
| Visa, Inc., Class A | | | 1,453 | | | | 205,905 | |
| Xilinx, Inc. | | | 717 | | | | 66,308 | |
| Total Information Technology | | | | | | | 3,603,964 | |
| | | | | | | | | |
| TOTAL COMMON STOCKS | | | | | | | | |
| (Cost $10,281,311) | | | | | | | 10,438,097 | |
BUZZ US Sentiment Leaders ETF
| Schedule of Investments | November 30, 2018 |
| | | 7 Day Yield | | | Shares | | | Value | |
| SHORT TERM INVESTMENTS (0.15%) | | | | | | | | | | | | |
| Money Market Fund | | | | | | | | | | | | |
| State Street Institutional Treasury Plus Money Market Fund | | | 2.146 | % | | | 15,820 | | | $ | 15,820 | |
| TOTAL SHORT TERM INVESTMENTS | | | | | | | | | | | | |
| (Cost $15,820) | | | | | | | | | | | 15,820 | |
| | | | | | | | | | | | | |
| TOTAL INVESTMENTS (99.87%) | | | | | | | | | | | | |
| (Cost $10,297,131) | | | | | | | | | | $ | 10,453,917 | |
| OTHER ASSETS IN EXCESS OF LIABILITIES (0.13%) | | | | | | | | | | | 13,882 | |
| NET ASSETS - 100.00% | | | | | | | | | | $ | 10,467,799 | |
| (a) | Non-income producing security. |
See Notes to Financial Statements.
BUZZ US Sentiment Leaders ETF
| Statement of Assets and Liabilities | November 30, 2018 |
| ASSETS: | | | |
| Investments, at value | | $ | 10,453,917 | |
| Dividends receivable | | | 20,273 | |
| Total Assets | | | 10,474,190 | |
| | | | | |
| LIABILITIES: | | | | |
| Payable to adviser | | | 6,391 | |
| Total Liabilities | | | 6,391 | |
| NET ASSETS | | $ | 10,467,799 | |
| | | | | |
| NET ASSETS CONSIST OF: | | | | |
| Paid-in capital | | $ | 11,252,432 | |
| Total distributable earnings | | | (784,633 | ) |
| NET ASSETS | | $ | 10,467,799 | |
| | | | | |
| INVESTMENTS, AT COST | | $ | 10,297,131 | |
| | | | | |
| PRICING OF SHARES | | | | |
| Net Assets | | $ | 10,467,799 | |
| Shares of beneficial interest outstanding (Unlimited number of shares authorized, par value $0.01 per share) | | | 300,002 | |
| Net Asset Value, offering and redemption price per share | | $ | 34.89 | |
See Notes to Financial Statements.
BUZZ US Sentiment Leaders ETF
| Statement of Operations | For the Year Ended November 30, 2018 |
| INVESTMENT INCOME: | | | |
| Dividends | | $ | 141,274 | |
| Securities Lending Income | | | 2,880 | |
| Total Investment Income | | | 144,154 | |
| | | | | |
| EXPENSES: | | | | |
| Investment adviser fees | | | 79,095 | |
| Net Expenses | | | 79,095 | |
| NET INVESTMENT INCOME | | | 65,059 | |
| | | | | |
| REALIZED AND UNREALIZED GAIN/(LOSS) | | | | |
| Net realized gain on investments | | | 1,383,244 | |
| Net change in unrealized depreciation on investments | | | (908,374 | ) |
| Total net change in unrealized depreciation | | | (908,374 | ) |
| NET REALIZED AND UNREALIZED GAIN ON INVESTMENTS | | | 474,870 | |
| NET INCREASE IN NET ASSETS RESULTING FROM OPERATIONS | | $ | 539,929 | |
See Notes to Financial Statements.
BUZZ US Sentiment Leaders ETF
Statements of Changes in Net Assets
| | | For the Year Ended November 30, 2018 | | | For the Year Ended November 30, 2017 | |
| OPERATIONS: | | | | | | |
| Net investment income | | $ | 65,059 | | | $ | 48,030 | |
| Net realized gain | | | 1,383,244 | | | | 779,407 | |
| Net change in unrealized appreciation/depreciation | | | (908,374 | ) | | | 909,683 | |
| Net increase in net assets resulting from operations | | | 539,929 | | | | 1,737,123 | |
| | | | | | | | | |
| DISTRIBUTIONS TO SHAREHOLDERS: | | | | | | | | |
| From distributable earnings | | | (50,001 | ) | | | (35,000 | )(a) |
| Total distributions | | | (50,001 | ) | | | (35,000 | ) |
| | | | | | | | | |
| CAPITAL SHARE TRANSACTIONS: | | | | | | | | |
| Proceeds from sale of shares | | | 14,380,282 | | | | 11,412,195 | |
| Cost of shares redeemed | | | (13,930,242 | ) | | | (8,755,528 | ) |
| Net increase from capital share transactions | | | 450,040 | | | | 2,656,667 | |
| Net increase in net assets | | | 939,968 | | | | 4,358,790 | |
| | | | | | | | | |
| NET ASSETS: | | | | | | | | |
| Beginning of year | | | 9,527,831 | | | | 5,169,041 | |
| End of year | | $ | 10,467,799 | | | $ | 9,527,831 | (b) |
| | | | | | | | | |
| OTHER INFORMATION: | | | | | | | | |
| CAPITAL SHARE TRANSACTIONS: | | | | | | | | |
| Beginning shares | | | 300,002 | | | | 200,002 | |
| Shares sold | | | 400,000 | | | | 400,000 | |
| Shares redeemed | | | (400,000 | ) | | | (300,000 | ) |
| Shares outstanding, end of period | | | 300,002 | | | | 300,002 | |
| (a) | For the year ended November 30, 2017, total distributions from distributable earnings consisted of distributions from net investment income of $35,000. |
| (b) | For the year ended November 30, 2017, net assets included accumulated net investment income of $39,558. |
See Notes to Financial Statements.
BUZZ US Sentiment Leaders ETF
| Financial Highlights | For a Share Outstanding Throughout the Period Presented |
| | | For the Year Ended November 30, 2018 | | | For the Year Ended November 30, 2017 | | | For the Period April 19, 2016 (Commencement of Operations) to November 30, 2016 | |
| NET ASSET VALUE, BEGINNING OF PERIOD | | $ | 31.76 | | | $ | 25.84 | | | $ | 25.15 | |
| | | | | | | | | | | | | |
| INCOME FROM OPERATIONS: | | | | | | | | | | | | |
| Net investment income(a) | | | 0.22 | | | | 0.18 | | | | 0.13 | |
| Net realized and unrealized gain | | | 3.05 | | | | 5.92 | | | | 0.56 | |
| Total from investment operations | | | 3.27 | | | | 6.10 | | | | 0.69 | |
| | | | | | | | | | | | | |
| DISTRIBUTIONS: | | | | | | | | | | | | |
| From net investment income | | | (0.14 | ) | | | (0.18 | ) | | | – | |
| Total distributions | | | (0.14 | ) | | | (0.18 | ) | | | – | |
| | | | | | | | | | | | | |
| NET INCREASE IN NET ASSET VALUE | | | 3.13 | | | | 5.92 | | | | 0.69 | |
| NET ASSET VALUE, END OF PERIOD | | $ | 34.89 | | | $ | 31.76 | | | $ | 25.84 | |
| TOTAL RETURN(b) | | | 10.34 | % | | | 23.72 | % | | | 2.74 | % |
| | | | | | | | | | | | | |
| RATIOS/SUPPLEMENTAL DATA: | | | | | | | | | | | | |
| Net assets, end of period (in 000s) | | $ | 10,468 | | | $ | 9,528 | | | $ | 5,169 | |
| | | | | | | | | | | | | |
| RATIOS TO AVERAGE NET ASSETS | | | | | | | | | | | | |
| Ratio of expenses to average net assets | | | 0.75 | % | | | 0.75 | % | | | 0.75 | %(c) |
| Ratio of net investment income to average net assets | | | 0.62 | % | | | 0.64 | % | | | 0.87 | %(c) |
| Portfolio turnover rate(d) | | | 353 | % | | | 260 | % | | | 157 | % |
| (a) | Based on average shares outstanding during the period. |
| (b) | Total return is calculated assuming an initial investment made at the net asset value at the beginning of the period and redemption at the net asset value on the last day of the period and assuming all distributions are reinvested at the reinvestment prices. Total return calcualted for a period of less than one year is not annualized. |
| (d) | Portfolio turnover for periods less than one year are not annualized and does not include securities received or delivered from processing creations or redemptions in-kind. |
See Notes to Financial Statements.
BUZZ US Sentiment Leaders ETF
| Notes to Financial Statements | November 30, 2018 |
1. ORGANIZATION
ALPS ETF Trust (the “Trust”), a Delaware statutory trust, is an open-end management investment company registered under the Investment Company Act of 1940, as amended (the “1940 Act”). As of November 30, 2018, the Trust consisted of twenty separate portfolios. Each portfolio represents a separate series of the Trust. This report pertains solely to the BUZZ US Sentiment Leaders ETF (the “Fund”). Prior to March 31, 2017, the Fund was known as the Sprott BUZZ Social Media Insights ETF. The investment objective of the Fund is to seek investment results that correspond (before fees and expenses) generally to the performance of the BUZZ NextGen AI US Sentiment Leaders Index (the “Underlying Index”). The Fund has elected to qualify as a diversified series of the Trust under the 1940 Act.
The Fund’s Shares (“Shares”) are listed on the NYSE Arca, Inc. (the “NYSE Arca”). The Fund issues and redeems Shares at net asset value (“NAV”) in blocks of 50,000 Shares, each of which is called a “Creation Unit”. Creation Units are issued and redeemed principally in-kind for securities included in the Underlying Index. Except when aggregated in Creation Units, Shares are not redeemable securities of the Fund.
Pursuant to the Trust’s organizational documents, its Officers and Trustees are indemnified against certain liability arising out of the performance of their duties to the Trust. Additionally, in the normal course of business, the Trust enters into contracts with service providers that contain general indemnification clauses. The Trust’s maximum exposure under these arrangements is unknown, as this would involve future claims that may be made against the Trust that have not yet occurred.
2. SIGNIFICANT ACCOUNTING POLICIES
The following is a summary of significant accounting policies consistently followed by the Fund in the preparation of the financial statements. The accompanying financial statements were prepared in accordance with accounting principles generally accepted in the United States of America (“U.S. GAAP”). The preparation of financial statements in conformity with U.S. GAAP requires management to make certain estimates and assumptions that affect the reported amounts of assets and liabilities and disclosures of contingent assets and liabilities at the date of the financial statements and the reported amounts of revenue and expenses during the period. Actual results could differ from those estimates. The Fund is considered an investment company under U.S. GAAP and follows the accounting and reporting guidance applicable to investment companies in the Financial Accounting Standards BoardAccounting Standards CodificationTopic 946.
A. Portfolio Valuation
The Fund’s NAV is determined daily, as of the close of regular trading on the New York Stock Exchange (the “NYSE”), normally 4:00 p.m. Eastern time, on each day the NYSE is open for trading. The NAV is computed by dividing the value of all assets of the Fund (including accrued interest and dividends), less all liabilities (including accrued expenses and dividends declared but unpaid), by the total number of shares outstanding.
Portfolio securities listed on any exchange other than the NASDAQ Stock Market LLC (“NASDAQ”) are valued at the last sale price on the business day as of which such value is being determined. If there has been no sale on such day, the securities are valued at the mean of the most recent bid and ask prices on such day. Securities traded on the NASDAQ are valued at the NASDAQ Official Closing Price as determined by NASDAQ. Portfolio securities traded on more than one securities exchange are valued at the last sale price on the business day as of which such value is being determined at the close of the exchange representing the principal market for such securities. Portfolio securities traded in the over-the-counter market, but excluding securities traded on the NASDAQ, are valued at the latest quoted sale price in such market.
The Fund’s investments are valued at market value or, in the absence of market value with respect to any portfolio securities, at fair value according to procedures adopted by the Trust’s Board of Trustees (the “Board”). When market quotations are not readily available or when events occur that make established valuation methods unreliable, securities of the Fund may be valued in good faith by or under the direction of the Board. These securities generally include, but are not limited to, restricted securities (securities which may not be publicly sold without registration under the Securities Act of 1933) for which a pricing service is unable to provide a market price; securities whose trading has been formally suspended; a security whose market price is not available from a pre-established primary pricing source or the pricing source is not willing to provide a price; a security with respect to which an event has occurred that is most likely to materially affect the value of the security after the market has closed but before the calculation of the Fund’s NAV or make it difficult or impossible to obtain a reliable market quotation; or a security whose price, as provided by the pricing service, does not reflect the security’s “fair value” due to the security being de-listed from a national exchange or the security’s primary trading market is temporarily closed at a time when, under normal conditions, it would be open. As a general principle, the current “fair value” of a security would be the amount which the owner might reasonably expect to receive from the sale on the applicable exchange or principal market. A variety of factors may be considered in determining the fair value of such securities.
BUZZ US Sentiment Leaders ETF
| Notes to Financial Statements | November 30, 2018 |
B. Fair Value Measurements
The Fund discloses the classification of its fair value measurements following a three-tier hierarchy based on the inputs used to measure fair value. Inputs refer broadly to the assumptions that market participants would use in pricing the asset or liability; including assumptions about risk. Inputs may be observable or unobservable. Observable inputs reflect the assumptions market participants would use in pricing the asset or liability that are developed based on market data obtained from sources independent of the reporting entity. Unobservable inputs reflect the reporting entity’s own assumptions about the assumptions market participants would use in pricing the asset or liability that are developed based on the best information available.
Valuation techniques used to value the Fund's investments by major category are as follows:
Equity securities and Limited Partnerships, including restricted securities, for which market quotations are readily available, are valued at the last reported sale price or official closing price as reported by a third party pricing vendor on the primary market or exchange on which they are traded and are categorized as Level 1 in the hierarchy. In the event there were no sales during the day or closing prices are not available, securities are valued at the mean of the most recent quoted bid and ask prices on such day and are generally categorized as Level 2 in the hierarchy. Investments in open-end mutual funds are valued at their closing NAV each business day and are categorized as Level 1 in the hierarchy.
Changes in valuation techniques may result in transfers in or out of an assigned level within the disclosure hierarchy.
Various inputs are used in determining the value of the Fund’s investments as of the end of the reporting period. When inputs used fall into different levels of the fair value hierarchy, the level in the hierarchy within which the fair value measurement falls is determined based on the lowest level input that is significant to the fair value measurement in its entirety. The designated input levels are not necessarily an indication of the risk or liquidity associated with these investments.
These inputs are categorized in the following hierarchy under applicable financial accounting standards:
| Level 1 – | Unadjusted quoted prices in active markets for identical investments, unrestricted assets or liabilities that a Fund has the ability to access at the measurement date; |
| Level 2 – | Quoted prices which are not active, quoted prices for similar assets or liabilities in active markets or inputs other than quoted prices that are observable (either directly or indirectly) for substantially the full term of the asset or liability; and |
| Level 3 – | Significant unobservable prices or inputs (including the Fund’s own assumptions in determining the fair value of investments) where there is little or no market activity for the asset or liability at the measurement date. |
The following is a summary of the inputs used to value the Fund’s investments as of November 30, 2018:
BUZZ US SENTIMENT LEADERS ETF
| Investments in Securities at Value* | | Level 1 - Quoted and
Unadjusted Prices | | | Level 2 - Other Significant
Observable Inputs | | | Level 3 - Significant
Unobservable Inputs | | | Total | |
| Common Stocks | | $ | 10,438,097 | | | $ | – | | | $ | – | | | $ | 10,438,097 | |
| Short Term Investments | | | 15,820 | | | | – | | | | – | | | | 15,820 | |
| Total | | $ | 10,453,917 | | | $ | – | | | $ | – | | | $ | 10,453,917 | |
The Fund did not have any securities that used significant unobservable inputs (Level 3) in determining fair value and there were no transfers into or out of Level 3.
C. Securities Transactions and Investment Income
Securities transactions are recorded as of the trade date. Realized gains and losses from securities transactions are recorded on the highest cost basis. Dividend income and capital gains distributions, if any, are recorded on the ex-dividend date. Interest income, if any, is recorded on the accrual basis.
BUZZ US Sentiment Leaders ETF
| Notes to Financial Statements | November 30, 2018 |
D. Dividends and Distributions to Shareholders
Dividends from net investment income of the Fund, if any, are declared and paid annually or as the Board may determine from time to time. Distributions of net realized capital gains earned by the Fund, if any, are distributed at least annually.
E. Federal Tax and Tax Basis Information
The timing and character of income and capital gain distributions are determined in accordance with income tax regulations, which may differ from U.S. GAAP. Reclassifications are made to the Fund’s capital accounts for permanent tax differences to reflect income and gains available for distribution (or available capital loss carryforwards) under income tax regulations.
For the year ended November 30, 2018, the following reclassifications, which had no impact on results of operations or net assets, were recorded to reflect permanent tax differences resulting primarily from in-kind transactions:
| Fund | | Paid-in Capital | | | Distributable Earnings | |
| BUZZ US Sentiment Leaders ETF | | $ | 1,857,490 | | | $ | (1,857,490 | ) |
The tax character of the distributions paid during the fiscal year ended November 30, 2018 and November 30, 2017 were as follows:
| | | Ordinary Income | |
| November 30, 2018 | | | |
| BUZZ US Sentiment Leaders ETF | | $ | 50,001 | |
| November 30, 2017 | | | | |
| BUZZ US Sentiment Leaders ETF | | $ | 35,000 | |
Under current law, capital losses maintain their character as short-term or long-term and are carried forward to the next tax year without expiration. As of November 30, 2018, the following amounts are available as carry forwards to the next tax year:
| Fund | | Short-Term | | | Long-Term | |
| BUZZ US Sentiment Leaders ETF | | $ | 817,257 | | | $ | 42,187 | |
As of November 30, 2018, the components of distributable earnings on a tax basis for the Fund were as follows:
| Undistributed net investment income | | $ | 46,279 | |
| Accumulated net realized loss on investments | | | (859,444 | ) |
| Net unrealized appreciation on investments | | | 28,532 | |
| Total | | $ | (784,633 | ) |
As of November 30, 2018, the cost of investments for federal income tax purposes and accumulated net unrealized appreciation/(depreciation) on investments were as follows:
| | | | BUZZ US Sentiment Leaders ETF | |
| Gross appreciation (excess of value over tax cost) | | $ | 546,448 | |
| Gross depreciation (excess of tax cost over value) | | | (517,916 | ) |
| Net unrealized appreciation (depreciation) | | | 28,532 | |
| Cost of investments for income tax purposes | | $ | 10,425,385 | |
The differences between book-basis and tax-basis are due to the deferral of losses from wash sales.
F. Income Taxes
No provision for income taxes is included in the accompanying financial statements, as the Fund intends to distribute to shareholders all taxable investment income and realized gains and otherwise comply with Subchapter M of the Internal Revenue Code of 1986, as amended, applicable to regulated investment companies. The Fund evaluates tax positions taken (or expected to be taken) in the course of preparing the Fund’s tax returns to determine whether these positions meet a “more-likely-than-not” standard that, based on the technical merits, have a more than fifty percent likelihood of being sustained by a taxing authority upon examination. A tax position that meets the “more-likely-than-not” recognition threshold is measured to determine the amount of benefit to recognize in the financial statements.
BUZZ US Sentiment Leaders ETF
| Notes to Financial Statements | November 30, 2018 |
As of and during the year ended November 30, 2018, the Fund did not have a liability for any unrecognized tax benefits. The Fund files U.S. federal, state, and local tax returns as required. The Fund’s tax returns are subject to examination by the relevant tax authorities until expiration of the applicable statute of limitations, which is generally three years after the filing of the tax return, but may extend to four years in certain jurisdictions. Tax returns for open years have incorporated no uncertain tax positions that require a provision for income taxes.
G. Lending of Portfolio Securities
The Fund has entered into a securities lending agreement with State Street Bank & Trust Co. (“SSB”), the Fund’s lending agent. The Fund may lend its portfolio securities only to borrowers that are approved by SSB. The Fund will limit such lending to not more than 33 1/3% of the value of its total assets. The Fund’s securities held at SSB as custodian shall be available to be lent except those securities the Fund or ALPS Advisors, Inc. specifically identifies in writing as not being available for lending. The borrower pledges and maintains with the Fund collateral consisting of cash (U.S. Dollars only), securities issued or guaranteed by the U.S. government or its agencies or instrumentalities, and cash equivalents (including irrevocable bank letters of credit) issued by a person other than the borrower or an affiliate of the borrower. The initial collateral received by the Fund is required to have a value of no less than 102% of the market value of the loaned securities for U.S equity securities and a value of no less than 105% of the market value for non-U.S. equity securities. The collateral is maintained thereafter, at a market value equal to not less than 102% of the current value of the U.S. equity securities on loan and not less than 105% of the current value of the non-U.S. equity securities on loan. The market value of the loaned securities is determined at the close of each business day and any additional required collateral is delivered to the Fund on the next business day. During the term of the loan, the Fund is entitled to all distributions made on or in respect of the loaned securities. Loans of securities are terminable at any time and the borrower, after notice, is required to return borrowed securities within the customary time period for settlement of securities transactions.
Any cash collateral received is reinvested in a money market fund managed by SSB as disclosed in the Fund’s Schedule of Investments and is reflected in the Statement of Assets and Liabilities as a payable for collateral upon return of securities loaned. Non-cash collateral, in the form of securities issued or guaranteed by the U.S. government or its agencies or instrumentalities, is not disclosed in the Fund’s Statement of Assets and Liabilities as it is held by the lending agent on behalf of the Fund, and the Fund does not have the ability to re-hypothecate these securities. Income earned by the Fund from securities lending activity is disclosed in the Statement of Operations. As of November 30, 2018, the Funds had no securities on loan.
The risks of securities lending include the risk that the borrower may not provide additional collateral when required or may not return the securities when due. To mitigate these risks, the Fund benefits from a borrower default indemnity provided by SSB. SSB’s indemnity allows for full replacement of securities lent wherein SSB will purchase the unreturned loaned securities on the open market by applying the proceeds of the collateral, or to the extent such proceeds are insufficient or the collateral is unavailable, SSB will purchase the unreturned loan securities at SSB’s expense. However, the Fund could suffer a loss if the value of the investments purchased with cash collateral falls below the value of the cash collateral received.
H. Risks Related to Social Media Analytics
The Underlying Index for the Fund utilizes a rules-based quantitative methodology developed by BUZZ Indexes Inc. (the “Index Provider”), which is designed to identify the U.S. common stocks with the most “positive insights” collected from social media networks. The ability to invest based on social media analytics is relatively new and untested. “Social media” is an umbrella term that encompasses various activities that integrate technology, social interaction and content creation. Social media may use many technologies, including, but not limited to, blogs, microblogs, wikis, photos and video sharing, podcasts, social networking, and virtual worlds. Some examples of social media sites may include, but are not limited to, the following: Facebook, Twitter, LinkedIn, Digg, Reddit, RSS, blogs, Investopedia, stock forums, etc. Investing in companies based on social media analytics involves the potential for market manipulation because social media posts may be made with an intent to inflate, or otherwise manipulate, the public perception of a stock or other investment. Although the Underlying Index attempts to mitigate the potential for such market manipulation by employing screens to identify posts which may be computer generated or deceptive, and by employing market capitalization and trading volume criteria to remove small and penny-cap stocks which may be more likely targets for such manipulation, there is no guarantee that the Underlying Index’s model will successfully reduce such risk. Furthermore, text and sentiment analysis of social media postings may prove inaccurate; that is, high positive sentiment may not correlate with positive change in the value of a company’s stock and low positive or negative sentiment may not correlate with negative change in the value of a company’s stock. Additionally, as data suppliers for the Index Provider’s algorithm, social media companies are susceptible to the following risks which may disrupt the Index Provider’s ability to receive meaningful data from such sites: permanent cessation of operations, disruption in service caused by hardware or software failure, interruptions or delays in service by third-party data center hosting facilities and maintenance providers, security breaches involving certain private, sensitive, proprietary and confidential information managed and transmitted by social media companies, and privacy concerns and laws, evolving Internet regulation and other foreign or domestic regulations that may limit or otherwise affect the operations of social media companies.
BUZZ US Sentiment Leaders ETF
| Notes to Financial Statements | November 30, 2018 |
3. INVESTMENT ADVISORY FEE AND OTHER AFFILIATED TRANSACTIONS
ALPS Advisors, Inc. (“Adviser”) serves as the Fund’s investment adviser pursuant to an Investment Advisory Agreement with the Fund. As compensation for its services to the Fund, the Adviser receives an annual unitary fee of 0.75% based on the Fund’s average daily net assets payable monthly. The Adviser served under the previous investment advisory agreement, since the commencement of the Fund until these agreements were terminated on April 16, 2018, due to a change of control of the Adviser’s parent company. Beginning April 16, 2018, the Adviser served under an interim investment advisory agreement, until the current investment advisory agreement was approved by the Fund’s shareholders.
Out of the unitary management fee, the Adviser pays substantially all expenses of the Fund, including the cost of transfer agency, custody, fund administration, legal, audit, and other services, except for interest expenses, distribution fees or expenses, brokerage expenses, taxes and extraordinary expenses not incurred in the ordinary course of the Fund’s business. The Adviser’s unitary management fee is designed to pay substantially all of the Fund’s expenses and to compensate the Adviser for providing services for the Fund.
ALPS Fund Services, Inc., an affiliate of the Adviser, is the administrator of the Fund.
Each Trustee who is not an officer or employee of the Adviser, any sub-adviser or any of their affiliates (“Independent Trustees”) receives (1) a quarterly retainer of $5,000, (2) a per meeting fee for regularly scheduled meetings of $3,750, (3) $1,500 for any special meeting held outside of a regularly scheduled board meeting, and (4) reimbursement for all reasonable out-of-pocket expenses relating to attendance at meetings. In addition, both the Chairman of the Board and Chairman of the Audit Committee each receives a quarterly retainer of $2,000, in connection with their respective roles.
4. PURCHASES AND SALES OF SECURITIES
For the year ended November 30, 2018, the cost of purchases and proceeds from sales of investment securities, excluding in-kind transactions and short-term investments, were as follows:
| Fund | | Purchases | | | Sales | |
| BUZZ US Sentiment Leaders ETF | | $ | 37,530,157 | | | $ | 37,397,742 | |
For the year ended November 30, 2018, the cost of in-kind purchases and proceeds from in-kind sales were as follows:
| Fund | | Purchases | | | Sales | |
| BUZZ US Sentiment Leaders ETF | | $ | 14,380,173 | | | $ | 14,067,042 | |
For the year ended November 30, 2018, the BUZZ US Sentiment Leaders ETF had in-kind net realized gains of $2,038,363.
Gains on in-kind transactions are not considered taxable for federal income tax purposes and losses on in kind transactions are also not deductible for tax purposes.
5. CAPITAL SHARE TRANSACTIONS
Shares are created and redeemed by the Fund only in Creation Unit size aggregations of 50,000 Shares. Only broker-dealers or large institutional investors with creation and redemption agreements called Authorized Participants (“AP”) are permitted to purchase or redeem Creation Units from the Fund. Such transactions are generally permitted on an in-kind basis, with a balancing cash component to equate the transaction to the NAV per unit of the Fund on the transaction date. Cash may be substituted equivalent to the value of certain securities generally when they are not available in sufficient quantity for delivery, not eligible for trading by the AP or as a result of other market circumstances.
6. NEW ACCOUNTING PRONOUNCEMENTS
In August 2018, the Financial Accounting Standards Board (“FASB”) issued Accounting Standards Update (“ASU”) 2018-13, which changes the fair value measurement disclosure requirements of FASB ASC Topic 820, Fair Value Measurement. The update to Topic 820 includes new, eliminated, and modified disclosure requirements. ASU 2018-13 is effective for fiscal years beginning after December 15, 2019, including interim periods. Early adoption is permitted for any eliminated or modified disclosures. The Fund has elected to early adopt the eliminated and modified disclosures effective with the financial statements prepared as of November 30, 2018.
BUZZ US Sentiment Leaders ETF
| Notes to Financial Statements | November 30, 2018 |
7. SHAREHOLDER MEETING
A Special Meeting of Shareholders of the Fund, a series of the Trust, was held at the offices of ALPS Fund Services, Inc., at 1290 Broadway, Suite 1100, Denver, CO 80203 on August 3, 2018. At the meeting, the following matters were voted on by the Shareholders. The results of the Special Meeting of Shareholders are noted below:
Proposal 1: To approve a new investment advisory agreement (the “New Advisory Agreement”) between the Trust, on behalf of the Fund, and the Adviser.
| | | Shares Voted In Favor | | | Shares Voted Against/Withheld or Abstentions | | | Proposal Approved |
| BUZZ US Sentiment Leaders ETF | | | 254,319 | | | | 6,137 | | | Yes |
Proposal 2: To approve a proposal that would authorize the Adviser to enter into and materially amend sub-advisory agreements in the future with wholly-owned sub-advisers and unaffiliated sub-advisers, with the approval of the Board, but without obtaining additional Shareholder approval.
| | | Shares Voted In Favor | | | Shares Voted Against/Withheld or Abstentions | | | Proposal Approved |
| BUZZ US Sentiment Leaders ETF | | | 248,937 | | | | 11,519 | | | Yes |
8. SEC REGULATIONS
On October 4, 2018, the SEC amended Regulation S-X to require certain financial statement disclosure requirements to conform them to GAAP for investment companies. Effective November 4, 2018, the Fund adopted disclosure requirement changes for Regulation S-X, these changes are reflected throughout this report. The Fund’s adoption of the amendments, effective with the financial statements prepared as of November 30, 2018, had no effect on the Fund’s net assets or results of operations.
BUZZ US Sentiment Leaders ETF
| Additional Information | November 30, 2018 (Unaudited) |
PROXY VOTING RECORDS, POLICIES AND PROCEDURES
Information regarding how the Fund voted proxies relating to portfolio securities during the most recent 12-month period ended June 30 and a description of the Fund’s proxy voting policies and procedures used in determining how to vote for proxies are available without charge on the SEC’s website at www.sec.gov and upon request, by calling (toll-free) 1-866-675-2639.
PORTFOLIO HOLDINGS
The Trust is required to disclose, after its first and third fiscal quarters, the complete schedule of the Fund’s portfolio holdings with the SEC on Form N-Q. Forms N-Q for the Fund are available on the SEC’s website at www.sec.gov. The Fund’s Forms N-Q may also be reviewed and copied at the SEC’s Public Reference Room in Washington, D.C. and information on the operation of the Public Reference Room may be obtained by calling 1-800-SEC-0330. The Fund’s Forms N-Q are available without charge, upon request, by calling (toll-free) 1-866-675-2639 or by writing to ALPS ETF Trust at 1290 Broadway, Suite 1100, Denver, Colorado 80203.
TAX INFORMATION
The Fund designated the following for federal income tax purposes for distributions made during the calendar year ended December 31, 2017:
| | Qualified Dividend Income | Dividend Received Deduction |
| BUZZ US Sentiment Leaders ETF | 100.00 % | 100.00 % |
In early 2018, if applicable, shareholders of record received this information for the distribution paid to them by the Fund during the calendar year 2017 via Form 1099. The Fund will notify shareholders in early 2019 of amounts paid to them by the Fund, if any, during the calendar year 2018.
LICENSING AGREEMENT
BUZZ NextGen AI US Sentiment Leaders Index (the “BUZZ Index”) is a product of BUZZ Indexes Inc. (“BUZZ Indexes”), and has been licensed to ALPS Advisors, Inc. for use in connection with the BUZZ US Sentiment Leaders ETF.
“BUZZ” is a trademark of BUZZ Indexes, which have been licensed by ALPS Advisors, Inc. for use in connection with the BUZZ Index.
BUZZ US Sentiment Leaders ETF is not sponsored, endorsed, sold or promoted by BUZZ Indexes, or its shareholders, or the licensor of the BUZZ Index and/or its affiliates and third party licensors. BUZZ Indexes makes no representation or warranty, express or implied, to the owners of the BUZZ US Sentiment Leaders ETF or any member of the public regarding the advisability of investing in securities generally or in BUZZ US Sentiment Leaders ETF, particularly or the ability of the BUZZ Index to track general market performance.
BUZZ Indexes’ only relationship to ALPS Advisors, Inc. with respect to the BUZZ Index is the licensing of the BUZZ Index and certain trademarks of BUZZ Indexes. The BUZZ Indexes are determined and composed by BUZZ Indexes without regard to ALPS Advisors, Inc. or the BUZZ US Sentiment Leaders ETF. BUZZ Indexes has no obligation to take the needs of ALPS Advisors, Inc. or the owners of BUZZ US Sentiment Leaders ETF into consideration in determining and composing the BUZZ Index.
BUZZ Indexes are not responsible for and have not participated in the determination of the prices of BUZZ US Sentiment Leaders ETF or the timing of the issuance or sale of securities of BUZZ US Sentiment Leaders ETF or in the determination or calculation of the equation by which BUZZ US Sentiment Leaders ETF securities may be converted into cash, surrendered, or redeemed, as the case may be. BUZZ Indexes have no obligation or liability in connection with the administration, marketing or trading of BUZZ US Sentiment Leaders ETF. There is no assurance that investment products based on the BUZZ Index will accurately track index performance or provide positive investment returns.
BUZZ Indexes is not an investment advisor and the inclusion of a security in the BUZZ Index is not a recommendation by BUZZ Indexes to buy, sell, or hold such security, nor should it be considered investment advice.
BUZZ US Sentiment Leaders ETF
| Additional Information | November 30, 2018 (Unaudited) |
BUZZ INDEXES DOES NOT GUARANTEE THE ADEQUACY, ACCURACY, TIMELINESS AND/OR THE COMPLETENESS OF THE BUZZ INDEX OR ANY DATA RELATED THERETO OR ANY COMMUNICATION WITH RESPECT THERETO, INCLUDING BUT NOT LIMITED TO, ORAL OR WRITTEN COMMUNICATION (INCLUDING ELECTRONIC COMMUNICATIONS). BUZZ INDEXES SHALL NOT BE SUBJECT TO ANY DAMAGES OR LIABILITY FOR ANY ERRORS, OMISSIONS, OR DELAYS THEREIN. BUZZ INDEXES MAKES NO EXPRESS OR IMPLIED WARRANTIES, AND EXPRESSLY DISCLAIMS ALL WARRANTIES, OF MERCHANTABILITY OR FITNESS FOR A PARTICULAR PURPOSE OR USE OR AS TO RESULTS TO BE OBTAINED BY ALPS ADVISORS, INC., OWNERS OF THE BUZZ US SENTIMENT LEADERS ETF, OR ANY OTHER PERSON OR ENTITY FROM THE USE OF THE BUZZ INDEX OR WITH RESPECT TO ANY DATA RELATED THERETO. WITHOUT LIMITING ANY OF THE FOREGOING, IN NO EVENT WHATSOEVER SHALL BUZZ INDEXES BE LIABLE FOR ANY INDIRECT, SPECIAL, INCIDENTAL, PUNITIVE, OR CONSEQUENTIAL DAMAGES INCLUDING BUT NOT LIMITED TO, LOSS OF PROFITS, TRADING LOSSES, LOST TIME OR GOODWILL, EVEN IF THEY HAVE BEEN ADVISED OF THE POSSIBILITY OF SUCH DAMAGES, WHETHER IN CONTRACT, TORT, STRICT LIABILITY, OR OTHERWISE. THERE ARE NO THIRD PARTY BENEFICIARIES OF ANY AGREEMENTS OR ARRANGEMENTS BETWEEN BUZZ INDEXES AND ALPS ADVISORS, INC., OTHER THAN THE LICENSORS OF BUZZ INDEXES.
The Adviser does not guarantee the accuracy and/or the completeness of the Underlying Index or any data included therein, and the Adviser shall have no liability for any errors, omissions or interruptions therein. The Adviser makes no warranty, express or implied, as to results to be obtained by the Fund, owners of the Shares of the Fund or any other person or entity from the use of the Underlying Index or any data included therein. The Adviser makes no express or implied warranties, and expressly disclaims all warranties of merchantability or fitness for a particular purpose or use with respect to the Underlying Index or any data included therein. Without limiting any of the foregoing, in no event shall the Adviser have any liability for any special, punitive, direct, indirect, or consequential damages (including lost profits) arising out of matters relating to the use of the Underlying Index, even if notified of the possibility of such damages.
BUZZ US Sentiment Leaders ETF
| Trustees & Officers | November 30, 2018 (Unaudited) |
The general supervision of the duties performed by the Adviser for the Fund under the Investment Advisory Agreement is the responsibility of the Board of Trustees. The Trust currently has four Trustees. Three Trustees have no affiliation or business connection with the Adviser or any of its affiliated persons and do not own any stock or other securities issued by the Adviser. These are the “non-interested” or “independent” Trustees (“Independent Trustees”). The other Trustee (the “Interested Trustee”) is affiliated with the Adviser.
The Independent Trustees of the Trust, their term of office and length of time served, their principal business occupations during the past five years, the number of portfolios in the Fund Complex overseen by each Independent Trustee, and other directorships, if any, held by the Trustee are shown below.
INDEPENDENT TRUSTEES
Name, Address & Year of Birth* | Position(s) Held with Trust | Term of Office and Length of Time Served** | Principal Occupation(s) During Past 5 Years | Number of Portfolios in Fund Complex Overseen by Trustees*** | Other Directorships Held by Trustees |
Mary K. Anstine, 1940 | Trustee | Since March 2008 | Ms. Anstine was President/Chief Executive Officer of HealthONE Alliance, Denver, Colorado, and former Executive Vice President of First Interstate Bank of Denver. Ms. Anstine is also Trustee/Director of AV Hunter Trust and Colorado Uplift Board. Ms. Anstine was formerly a Director of the Trust Bank of Colorado (later purchased and now known as Northern Trust Bank), HealthONE and Denver Area Council of the Boy Scouts of America and a member of the American Bankers Association Trust Executive Committee. | 41 | Ms. Anstine is a Trustee of ALPS Variable Investment Trust (9 funds); Financial Investors Trust (33 funds); Reaves Utility Income Fund (1 fund); and Segall Bryant & Hamill Trust (14 funds). |
Jeremy W. Deems, 1976 | Trustee | Since March 2008 | Mr. Deems is the Co-Founder, Chief Compliance Officer and Chief Financial Officer of Green Alpha Advisors, LLC. Mr. Deems is Co-Portfolio Manager of the Shelton Green Alpha Fund. Prior to joining Green Alpha Advisors, Mr. Deems was CFO and Treasurer of Forward Management, LLC, ReFlow Management Co., LLC, ReFlow Fund, LLC, a private investment fund, and Sutton Place Management, LLC, an administrative services company. | 41 | Mr. Deems is a Trustee of ALPS Variable Investment Trust (9 funds); Financial Investors Trust (33 funds); and Reaves Utility Income Fund (1 fund); and Clough Funds Trust (1 fund). |
Rick A. Pederson, 1952 | Trustee and Chairman | Since March 2008. Has served as Chairman since July 2017. | Mr. Pederson is Partner, Bow River Capital Partners (private equity management), 2003 -present; Board Member, Prosci Inc. (private business services) 2013-2016; Board Member, Citywide Banks (Colorado community bank) 2014-present; Board Member, Strong-Bridge Consulting (management consulting) 2015-present; Board Member, IRI/ODMS Holdings LLC, 2017 -present; Director, National Western Stock Show (not-for-profit organization) 2010 -present; Board Member, History Colorado, 2015 -present; Trustee, Boettcher Foundation, 2018. | 21 | Mr. Pederson is Trustee of Segall Bryant & Hamill Trust (14 funds) and Principal Real Estate Income Fund (1 fund) |
| * | The business address of the Trustee is c/o ALPS Advisors, Inc., 1290 Broadway, Suite 1100, Denver, Colorado 80203. |
| ** | This is the period for which the Trustee began serving the Trust. Each Trustee serves an indefinite term, until his successor is elected. |
| *** | The Fund Complex includes all series of the Trust and any other investment companies for which ALPS Advisors, Inc. provides investment advisory services. |
BUZZ US Sentiment Leaders ETF
| Trustees & Officers | November 30, 2018 (Unaudited) |
The Trustee who is affiliated with the Adviser or affiliates of the Adviser and executive officers of the Trust, his term of office and length of time served, his principal business occupations during the past five years, the number of portfolios in the Fund Complex overseen by the Interested Trustee and the other directorships, if any, held by the Trustee, are shown below.
INTERESTED TRUSTEE
Name, Address and Year of Birth of Interested Trustee* | Position(s) Held with Trust | Term of Office and Length of Time Served** | Principal Occupation(s) During Past 5 Years | Number of Portfolios in Fund Complex Overseen by Trustees*** | Other Directorships Held by Trustee |
Edmund J. Burke, 1961 | Trustee and President | Since December 2017 | Mr. Burke is President and a Director of ALPS Holdings, Inc. (“AHI”) (since 2005) and Director of Boston Financial Data Services, Inc. (“BFDS”), ALPS Advisors, Inc. (“AAI”), ALPS Distributors, Inc. (“ADI”), ALPS Fund Services, Inc. (“AFS”) and ALPS Portfolio Solutions Distributor, Inc. (“APSD”). Because of his positions with AHI, BFDS, AAI, ADI, AFS and APSD, Mr. Burke is deemed an affiliate of the Trust as defined under the 1940 Act. | 36 | Mr. Burke is a Trustee of Clough Global Dividend and Income Fund (1 fund); Clough Global Equity Fund (1 fund); Clough Global Opportunities Fund (1 fund); Clough Funds Trust (1 fund); Liberty All-Star Equity Fund (1 fund); Director of the Liberty All-Star Growth Fund, Inc. (1 fund) and Financial Investors Trust (33 funds). |
| * | The business address of the Trustee is c/o ALPS Advisors, Inc., 1290 Broadway, Suite 1100, Denver, Colorado 80203. |
| ** | This is the period for which the Trustee began serving the Trust. Each Trustee serves an indefinite term, until his successor is elected. |
| *** | The Fund Complex includes all series of the Trust and any other investment companies for which ALPS Advisors, Inc. provides investment advisory services. |
BUZZ US Sentiment Leaders ETF
| Trustees & Officers | November 30, 2018 (Unaudited) |
OFFICERS
| Name, Address and Year of Birth of Officer* | Position(s) Held with Trust | Length of Time Served** | Principal Occupation(s) During Past 5 Years |
Erin D. Nelson, 1977 | Chief Compliance Officer (“CCO”) | Since December 2015 | Ms. Nelson became Senior Vice-President and Chief Compliance Officer of ALPS Advisors, Inc. on July 1, 2015 and prior to that served as Vice President and Deputy Chief Compliance Officer of AAI since January 1, 2015. Prior to January 1, 2015, Ms. Nelson was Vice-President and Assistant General Counsel of ALPS Fund Services. Because of her position with AAI, Ms. Nelson is deemed an affiliate of the Trust as defined under the 1940 Act. Ms. Nelson is also the CCO of ALPS Variable Investment Trust, Liberty All-Star Growth Fund, Inc., Liberty All-Star Equity Fund, Principal Real Estate Income Fund, RiverNorth Opportunities Fund, Inc. and Red Rocks Capital, LLC. |
Kathryn Burns, 1976 | Treasurer | Since September 2018 | Ms. Burns serves as Vice President, Director of Fund Operations of AAI since 2018. From 2013 to 2018, she served as Vice President and Fund Controller at ALPS Fund Services. Prior to joining ALPS, she worked at Old Mutual Capital where she served as Vice President and Chief Compliance Officer (2010 – 2012) and Regulatory Reporting Manager and Assistant Treasurer to the Old Mutual Funds Trusts (2006 – 2012). She also served as a CPA for PricewaterhouseCoopers LLP. Ms. Burns is also Treasurer of ALPS Variable Investment Trust, the Boulder Growth & Income Fund, Inc., Principal Real Estate Income Fund and the RiverNorth Opportunities Fund Inc. |
Andrea E. Kuchli, 1985 | Secretary | Since December 2017 | Ms. Kuchli joined ALPS in 2015 and is currently Vice President and Senior Counsel of ALPS. Prior to joining ALPS, Ms. Kuchli was an Associate with Davis Graham & Stubbs LLP from April 2014 to February 2015, and an Associate with Dechert LLP from 2011 to April 2014. Because of her position with ALPS, Ms. Kuchli is deemed an affiliate of the Trust as defined under the 1940 Act. Ms. Kuchli is also Secretary of ALPS Variable Investment Trust and Principal Real Estate Income Fund as well as Assistant Secretary of the James Advantage Funds. |
Sharon Akselrod, 1974 | Assistant Secretary | Since December 2016 | Ms. Akselrod joined ALPS in August 2014 and is currently Senior Investment Company Act Paralegal of ALPS Fund Services, Inc. Prior to joining ALPS, Ms. Akselrod served as Corporate Governance and Regulatory Associate for Nordstrom fsb (2013-2014) and Senior Legal Assistant – Legal Manager for AXA Equitable Life Insurance Company (2008-2013). Because of her position with ALPS, Ms. Akselrod is deemed an affiliate of the Trust as defined under the 1940 Act. Ms. Akselrod is also Assistant Secretary of Financial Investors Trust, ALPS Variable Investment Trust, Principal Real Estate Income Fund and Clough Funds Trust. |
| * | The business address of each Officer is c/o ALPS Advisors, Inc., 1290 Broadway, Suite 1100, Denver, Colorado 80203. |
| ** | This is the period for which the Officer began serving the Trust. Each Officer serves an indefinite term, until his/her successor is elected. |
Intentionally Left Blank


TABLE OF
CONTENTS
| Performance Overview | 1 |
| Disclosure of Fund Expenses | 4 |
| Report of Independent Registered Public Accounting Firm | 5 |
| Schedule of Investments | 6 |
| Statement of Assets and Liabilities | 8 |
| Statement of Operations | 9 |
| Statements of Changes in Net Assets | 10 |
| Financial Highlights | 11 |
| Notes to Financial Statements | 12 |
| Additional Information | 18 |
| Trustees & Officers | 19 |
Beginning on January 1, 2021, as permitted by regulations adopted by the U.S. Securities and Exchange Commission, paper copies of the Fund’s annual and semi-annual shareholder reports will no longer be sent by mail, unless you specifically request paper copies of the reports from your financial intermediary (such as a broker-dealer or bank). Instead, the reports will be made available on the Fund’s website (www.alpsfunds.com), and you will be notified by mail each time a report is posted and provided with a website link to access the report.
If you already elected to receive shareholder reports electronically, you will not be affected by this change and you need not take any action. You may elect to receive shareholder reports and other communications from a Fund electronically anytime by contacting your financial intermediary.
You may elect to receive all future reports in paper free of charge. You can contact your financial intermediary to request that you continue to receive paper copies of your shareholder reports. Your election to receive reports in paper will apply to all funds held in your account with your financial intermediary.
alpsfunds.com
Cohen & Steers Global Realty Majors ETF
| Performance Overview | November 30, 2018 (Unaudited) |
Investment Objective
The Cohen & Steers Global Realty Majors ETF (the “Fund”) seeks investment results that correspond generally to the performance, before the Fund’s fees and expenses, of an index called the Cohen & Steers Global Realty Majors Index (the “Underlying Index”). The Fund will normally invest at least 90% of its total assets in common stocks and other equity securities (which may include American Depositary Receipts (“ADRs”), American Depositary Shares (“ADSs”) and Global Depositary Receipts (“GDRs”)) that comprise the Underlying Index.
The Underlying Index consists of the largest and most liquid securities within the global real estate universe that Cohen & Steers Capital Management, Inc. (“Cohen & Steers” or the “Index Provider”) believes are likely to lead the global securitization of real estate. The Underlying Index is free float and modified market-capitalization weighted, with a limit of 4.0% on any security’s weighting. Underlying Index constituents must have a free float adjusted market-capitalization of $750 million or greater for initial inclusion in the Underlying Index. Cohen & Steers considers country weights relative to each country’s GDP share representing the real estate securities universe and share of the private market for real estate, with up to 10% being allocated to securities of emerging markets. The Underlying Index is rebalanced quarterly.
Performance Overview
For the year ended November 30, 2018, the Fund’s market price increased 1.2% and the Fund’s net asset value (NAV) increased 1.5%.
Global real estate stocks had a slightly positive total return as a group in the period, modestly outperforming the broader stock market. However, markets were often volatile and performance varied widely by country.
The group initially declined amid an early-period spike in bond yields, even as broad-based economic growth continued to benefit real estate fundamentals. Markets were then calmer for a spell, as inflation remained generally benign. But other macro concerns—such as political uncertainty in Italy and Spain, increased global trade tensions and a sharp downturn in oil prices—drove considerable volatility in the final two months of the period.
U.S. REITs (3.6% total return1) outperformed, even as the U.S. Federal Reserve continued to raise short-term interest rates. Most property types advanced, led by free-standing retail and health care landlords, which were favored for their relatively stable cash flows in a period of increasing uncertainty. While most regional mall stocks declined, the sector performed well due to a large gain by Simon Property Group, which owns high-quality properties and has a strong balance sheet. Data center REITs were a notable underperformer, down nearly 10% following two years of exceptionally strong performance.
The U.K. (-3.1%) was hindered by uncertainty regarding ongoing Brexit negotiations that by the end of the period were in disarray. Retail landlords were among the poorer performers, while certain less-cyclical companies such as self storage and student housing operators had significant gains.
Markets in continental Europe were mixed. Germany (13.6%) was a positive standout, led by apartment landlords that continued to benefit from strong residential fundamentals. France (-10.0%) and the Netherlands (-24.5%) saw sizable declines in retail landlords. Unibail-Rodamco-Westfield (listed in the Netherlands), which owns retail properties in Europe and the U.S., was among the weaker performers as management indicated that rental growth and returns on developments could soften.
Most real estate stocks in Japan (7.8%) advanced, with large J-REITs such as Nippon Office Fund among the stronger performers. Hong Kong (-4.1%), which moved up and down in reaction to China economic and trade news, ultimately ended the period lower as growth on the mainland continued to slow from high levels. The market’s development companies generally declined. Link REIT, whose portfolio includes non-discretionary retail properties, had a sizable gain.
Australia (2.3%) saw rallies in most stocks, although retail landlord Scentre Group, the largest Australian company in the index, declined as the last remaining founding family member announced an intent to resign from the Board, signaling that the family could sell its 4% stake in the company. Charter Hall Retail REIT outperformed, benefiting from its more defensive underlying supermarket exposure. Singapore (-6.2%), which is typically sensitive to global trade news, underperformed as the trade picture remained clouded.
| 1 | Country returns are in local currencies. |
Cohen & Steers Global Realty Majors ETF
| Performance Overview | November 30, 2018 (Unaudited) |
Performance(as of November 30, 2018)
| | 1 Year | 5 Year | 10 Year | Since Inception^ |
| Cohen & Steers Global Realty Majors ETF - NAV | 1.47% | 5.67% | 10.98% | 2.73% |
| Cohen & Steers Global Realty Majors ETF - Market Price* | 1.22% | 5.60% | 10.99% | 2.71% |
| Cohen & Steers Global Realty Majors® Index | 2.20% | 6.43% | 11.86% | 3.54% |
| FTSE EPRA/ NAREIT Developed Real Estate Index | 2.15% | 6.47% | 12.17% | 3.69% |
| S&P 500® Total Return Index | 6.27% | 11.12% | 14.31% | 9.01% |
Total Expense Ratio (per the current Prospectus) 0.55%
Data quoted represents past performance, which is no guarantee of future results. The table does not reflect the deduction of taxes that a shareholder would pay on Fund distributions or the redemption of Fund shares. The Fund's portfolio holdings are subject to change without notice. Investment return and principal value of an investment will fluctuate so that an investor’s shares, when sold or redeemed, may be worth more or less than the original cost. Current performance data may be higher or lower than actual data quoted. For the most current month-end performance data please visit www.alpsfunds.com or call 1.866.513.5856.
NAV is an exchange-traded fund’s per-share value. The per-share dollar amount of the Fund is derived by dividing the total value of all the securities in its portfolio, less any liabilities, by the number of Fund shares outstanding. Market Price is the price at which a share can currently be traded in the market. Information detailing the number of days the Market Price of the Fund was greater than the Fund’s NAV and the number of days it was less than the Fund’s NAV can be obtained at www.alpsfunds.com.
| ^ | Fund Inception May 7, 2008. |
| * | Market Price is based on the midpoint of the bid/ask spread at 4p.m. ET and does not represent the returns an investor would receive if shares were traded at other times. |
Risks of Investing in Real Estate Securities
Risks of investing in real estate securities are similar to those associated with direct investments in real estate, including falling property values due to increasing vacancies or declining rents resulting from economic, legal, political or technological developments, lack of liquidity, limited diversification and sensitivity to certain economic factors such as interest rate changes and market recessions. Foreign securities involve special risks, including currency fluctuations, lower liquidity, political and economic uncertainties, and differences in accounting standards. Some international securities may represent small- and medium-sized companies, which may be more susceptible to price volatility and less liquidity than larger companies.
Cohen & Steers Global Realty Majors® Index: A free-float adjusted, modified market capitalization-weighted index of global real estate equities. The modified market capitalization weighting approach and qualitative screening process emphasize those companies that, in the opinion of the Cohen & Steers investment committee, are leading the securitization of real estate globally.
FTSE EPRA/NAREIT Developed Real Estate Index: An unmanaged market-weighted total return index that consists of many companies from developed markets whose floats are larger than $100 million and which derive more than half of their revenue from property-related activities.
S&P 500® Total Return Index: The Standard & Poor’s composite index of 500 stocks, a widely recognized, unmanaged index of common stock prices.
The indexes are not actively managed and do not reflect any deductions for fees, expenses or taxes. Total return assumes reinvestment of any dividends and distributions realized during a given time period. One cannot invest directly in an index. Index performance does not reflect fund performance.
The Fund’s shares are not individually redeemable. Investors buy and sell shares of the Fund on a secondary market. Only market makers or “authorized participants” may trade directly with the Fund, typically in blocks of 50,000 shares.
The Cohen & Steers Global Realty Majors ETF is not suitable for all investors. An investor should consider investment objectives, risks, charges and expenses carefully before investing. Investments in the Fund are subject to investment risks, including possible loss of the principal amount invested.
ALPS Portfolio Solutions Distributor, Inc., a FINRA member, is the distributor for the Cohen & Steers Global Realty Majors ETF.
ALPS Portfolio Solutions Distributor, Inc. is not affiliated with Cohen & Steers.
Cohen & Steers Global Realty Majors ETF
| Performance Overview | November 30, 2018 (Unaudited) |
Top 10 Holdings*(as of November 30, 2018)
| American Tower Corp. | 4.14% |
| Prologis, Inc. | 4.00% |
| Simon Property Group, Inc. | 3.93% |
| Public Storage | 3.46% |
| Equinix, Inc. | 3.31% |
| Welltower, Inc. | 2.91% |
| AvalonBay Communities, Inc. | 2.86% |
| Equity Residential | 2.84% |
| Vonovia SE | 2.72% |
| Unibail-Rodamco-Westfield | 2.58% |
| Total % of Top 10 Holdings | 32.75% |
Future holdings are subject to change.
Country Allocation*(as of November 30, 2018)
| United States | 55.53% |
| Japan | 10.36% |
| Hong Kong | 10.07% |
| Australia | 5.90% |
| Germany | 5.58% |
| France | 4.69% |
| United Kingdom | 3.31% |
| Singapore | 2.02% |
| Canada | 1.12% |
| Sweden | 0.51% |
| Switzerland | 0.42% |
| Spain | 0.32% |
| Brazil | 0.17% |
| Total | 100.00% |
Growth of $10,000(as of November 30, 2018)
Comparison of Change in Value of $10,000 Investment in the Fund and the Indexes
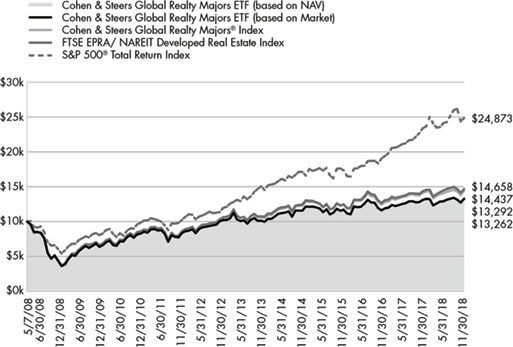
The chart above represents historical performance of a hypothetical investment of $10,000 in the Fund over the life of the Fund. Past performance does not guarantee future results. This chart does not reflect the deduction of taxes that a shareholder would pay on Fund distributions or the redemption of Fund shares.
Cohen & Steers Global Realty Majors ETF
| Disclosure of Fund Expenses | November 30, 2018 (Unaudited) |
Shareholder Expense Example: As a shareholder of the Fund, you incur two types of costs: (1) transaction costs which may include creation and redemption fees or brokerage charges, and (2) ongoing costs, including management fees and other Fund expenses. These examples are intended to help you understand your ongoing costs (in dollars) of investing in the Fund and to compare these costs with the ongoing costs of investing in other funds. It is based on an investment of $1,000 invested at the beginning of the (six month) period and held through November 30, 2018.
Actual Return: The first line of the table provides information about actual account values and actual expenses. You may use the information in this line, together with the amount you invested, to estimate the expenses that you incurred over the period. Simply divide your account value by $1,000 (for example, an $8,600 account value divided by $1,000 = 8.6), then multiply the result by the number in the first line under the heading entitled “Expenses Paid During Period” to estimate the expenses attributable to your investment during this period.
Hypothetical 5% Return: The second line of the table provides information about hypothetical account values and hypothetical expenses based on the Fund’s actual expense ratio and an assumed rate of return of 5% per year before expenses, which is not the Fund’s actual return. The hypothetical account values and expenses may not be used to estimate the actual ending account balance or expenses you paid for the period. You may use this information to compare ongoing costs of investing in the Fund and other funds. To do so, compare this 5% hypothetical example with the 5% hypothetical examples that appear in the shareholder reports of other funds.
The expenses shown in the table are meant to highlight ongoing Fund costs only and do not reflect any transaction costs, such as creation and redemption fees or brokerage charges. Therefore, the second line is useful in comparing ongoing costs only, and will not help you determine the relative total costs of owning different funds. In addition, if these costs were included, your costs would have been higher.
| | Beginning Account Value 6/1/18 | Ending Account Value 11/30/18 | Expense Ratio(a) | Expenses Paid During Period 6/1/18 - 11/30/18(b) |
| Cohen & Steers Global Realty Majors ETF | | | | |
| Actual | $1,000.00 | $1,025.60 | 0.55% | $2.79 |
| Hypothetical (5% return before expenses) | $1,000.00 | $1,022.31 | 0.55% | $2.79 |
| (a) | Annualized, based on the Fund's most recent fiscal half year expenses. |
| (b) | Expenses are equal to the Fund's annualized expense ratio multiplied by the average account value over the period, multiplied by the number of days in the most recent fiscal half year (183), divided by 365. |
Cohen & Steers Global Realty Majors ETF
Report of Independent Registered Public Accounting Firm
To the shareholders and the Board of Trustees of ALPS ETF Trust:
Opinion on the Financial Statements and Financial Highlights
We have audited the accompanying statement of assets and liabilities, including the schedule of investments, of Cohen & Steers Global Realty Majors ETF (the “Fund”), one of the funds constituting the ALPS ETF Trust, as of November 30, 2018, the related statement of operations for the year then ended, the statements of changes in net assets for each of the two years in the period then ended, the financial highlights for each of the five years in the period then ended, and the related notes. In our opinion, the financial statements and financial highlights present fairly, in all material respects, the financial position of Cohen & Steers Global Realty Majors ETF of ALPS ETF Trust as of November 30, 2018, and the results of its operations for the year then ended, the changes in its net assets for each of the two years in the period then ended, and the financial highlights for each of the five years in the period then ended, in conformity with accounting principles generally accepted in the United States of America.
Basis for Opinion
These financial statements and financial highlights are the responsibility of the Fund's management. Our responsibility is to express an opinion on the Fund’s financial statements and financial highlights based on our audits. We are a public accounting firm registered with the Public Company Accounting Oversight Board (United States) (PCAOB) and are required to be independent with respect to the Fund in accordance with the U.S. federal securities laws and the applicable rules and regulations of the Securities and Exchange Commission and the PCAOB.
We conducted our audits in accordance with the standards of the PCAOB. Those standards require that we plan and perform the audit to obtain reasonable assurance about whether the financial statements and financial highlights are free of material misstatement, whether due to error or fraud. The Fund is not required to have, nor were we engaged to perform, an audit of its internal control over financial reporting. As part of our audits we are required to obtain an understanding of internal control over financial reporting but not for the purpose of expressing an opinion on the effectiveness of the Fund’s internal control over financial reporting. Accordingly, we express no such opinion.
Our audits included performing procedures to assess the risks of material misstatement of the financial statements and financial highlights, whether due to error or fraud, and performing procedures that respond to those risks. Such procedures included examining, on a test basis, evidence regarding the amounts and disclosures in the financial statements and financial highlights. Our audits also included evaluating the accounting principles used and significant estimates made by management, as well as evaluating the overall presentation of the financial statements and financial highlights. Our procedures included confirmation of securities owned as of November 30, 2018, by correspondence with the custodian and brokers; when replies were not received from brokers, we performed other auditing procedures. We believe that our audits provide a reasonable basis for our opinion.
DELOITTE & TOUCHE LLP
Denver, Colorado
January 24, 2019
We have served as the auditor of one or more investment companies advised by ALPS Advisors, Inc. since 2007.
Cohen & Steers Global Realty Majors ETF
| Schedule of Investments | November 30, 2018 |
| Security Description | | Shares | | | Value | |
| COMMON STOCKS (99.55%) | | | | | | | | |
| Australia (5.89%) | | | | | | | | |
| Dexus | | | 60,207 | | | $ | 460,296 | |
| Goodman Group | | | 95,923 | | | | 718,629 | |
| Scentre Group, Ltd. | | | 318,494 | | | | 907,871 | |
| Stockland | | | 145,308 | | | | 386,589 | |
| The GPT Group | | | 106,030 | | | | 408,411 | |
| Vicinity Centres | | | 190,272 | | | | 371,316 | |
| Total Australia | | | | | | | 3,253,112 | |
| | | | | | | | | |
| Brazil (0.17%) | | | | | | | | |
| Multiplan Empreendimentos Imobiliarios SA | | | 15,934 | | | | 95,637 | |
| | | | | | | | | |
| Canada (1.11%) | | | | | | | | |
| Allied Properties Real Estate Investment Trust | | | 5,952 | | | | 202,036 | |
| Boardwalk Real Estate Investment Trust | | | 2,152 | | | | 67,201 | |
| RioCan Real Estate Investment Trust | | | 18,604 | | | | 346,274 | |
| Total Canada | | | | | | | 615,511 | |
| | | | | | | | | |
| France (4.68%) | | | | | | | | |
| Covivio | | | 3,172 | | | | 309,007 | |
| Gecina SA | | | 3,246 | | | | 453,838 | |
| Klepierre SA | | | 12,302 | | | | 402,772 | |
| Unibail-Rodamco-Westfield | | | 8,260 | | | | 1,419,878 | |
| Total France | | | | | | | 2,585,495 | |
| | | | | | | | | |
| Germany (5.57%) | | | | | | | | |
| alstria office REIT-AG | | | 9,543 | | | | 133,101 | |
| Deutsche Wohnen SE | | | 21,216 | | | | 1,016,949 | |
| LEG Immobilien AG | | | 3,704 | | | | 425,830 | |
| Vonovia SE | | | 30,963 | | | | 1,499,226 | |
| Total Germany | | | | | | | 3,075,106 | |
| | | | | | | | | |
| Hong Kong (10.05%) | | | | | | | | |
| China Overseas Land & Investment, Ltd. | | | 223,000 | | | | 778,106 | |
| CK Asset Holdings, Ltd. | | | 159,000 | | | | 1,145,149 | |
| Hang Lung Properties, Ltd. | | | 120,000 | | | | 242,945 | |
| Hongkong Land Holdings, Ltd. | | | 69,800 | | | | 454,398 | |
| Link REIT | | | 126,664 | | | | 1,206,092 | |
| Sun Hung Kai Properties, Ltd. | | | 91,500 | | | | 1,303,969 | |
| Wharf Real Estate Investment Co., Ltd. | | | 70,000 | | | | 420,948 | |
| Total Hong Kong | | | | | | | 5,551,607 | |
| | | | | | | | | |
| Japan (10.35%) | | | | | | | | |
| Japan Real Estate Investment Corp. | | | 85 | | | | 469,497 | |
| Japan Retail Fund Investment Corp. | | | 157 | | | | 301,096 | |
| Mitsubishi Estate Co., Ltd. | | | 83,100 | | | | 1,333,085 | |
| Mitsui Fudosan Co., Ltd. | | | 59,200 | | | | 1,415,919 | |
| Nippon Building Fund, Inc. | | | 85 | | | | 529,401 | |
| Security Description | | Shares | | | Value | |
| Japan (continued) | | | | | | | | |
| Nippon Prologis REIT, Inc. | | | 130 | | | $ | 269,242 | |
| Nomura Real Estate Master Fund, Inc. | | | 257 | | | | 343,225 | |
| Sumitomo Realty & Development Co., Ltd. | | | 28,400 | | | | 1,052,788 | |
| Total Japan | | | | | | | 5,714,253 | |
| | | | | | | | | |
| Singapore (2.02%) | | | | | | | | |
| Ascendas Real Estate Investment Trust | | | 153,205 | | | | 287,001 | |
| CapitaLand Mall Trust | | | 160,247 | | | | 262,815 | |
| CapitaLand, Ltd. | | | 149,300 | | | | 339,541 | |
| City Developments, Ltd. | | | 36,600 | | | | 224,898 | |
| Total Singapore | | | | | | | 1,114,255 | |
| | | | | | | | | |
| Spain (0.32%) | | | | | | | | |
| Inmobiliaria Colonial Socimi SA | | | 17,365 | | | | 174,473 | |
| | | | | | | | | |
| Sweden (0.51%) | | | | | | | | |
| Castellum AB | | | 16,224 | | | | 283,717 | |
| | | | | | | | | |
| Switzerland (0.42%) | | | | | | | | |
| PSP Swiss Property AG | | | 2,383 | | | | 231,132 | |
| | | | | | | | | |
| United Kingdom (3.30%) | | | | | | | | |
| British Land Co. PLC | | | 59,379 | | | | 427,198 | |
| Derwent London PLC | | | 6,572 | | | | 239,507 | |
| Hammerson PLC | | | 47,079 | | | | 231,563 | |
| Land Securities Group PLC | | | 44,908 | | | | 465,346 | |
| Segro PLC | | | 59,766 | | | | 459,378 | |
| Total United Kingdom | | | | | | | 1,822,992 | |
| | | | | | | | | |
| United States (55.16%) | | | | | | | | |
| Alexandria Real Estate Equities, Inc. | | | 6,309 | | | | 785,471 | |
| American Campus Communities, Inc. | | | 8,086 | | | | 354,409 | |
| American Homes 4 Rent | | | 15,427 | | | | 321,344 | |
| American Tower Corp. | | | 13,869 | | | | 2,281,312 | |
| AvalonBay Communities, Inc. | | | 8,260 | | | | 1,574,108 | |
| Boston Properties, Inc. | | | 9,233 | | | | 1,211,370 | |
| Digital Realty Trust, Inc. | | | 12,301 | | | | 1,415,107 | |
| Douglas Emmett, Inc. | | | 9,624 | | | | 355,318 | |
| Duke Realty Corp. | | | 21,305 | | | | 606,340 | |
| Equinix, Inc. | | | 4,738 | | | | 1,825,457 | |
| Equity LifeStyle Properties, Inc. | | | 5,332 | | | | 530,694 | |
| Equity Residential | | | 21,972 | | | | 1,565,505 | |
| Essex Property Trust, Inc. | | | 3,947 | | | | 1,036,127 | |
| Extra Space Storage, Inc. | | | 7,546 | | | | 724,265 | |
| Federal Realty Investment Trust | | | 4,398 | | | | 580,932 | |
| Highwoods Properties, Inc. | | | 6,220 | | | | 269,761 | |
| Host Hotels & Resorts, Inc. | | | 44,258 | | | | 840,902 | |
| Kilroy Realty Corp. | | | 6,002 | | | | 420,680 | |
Cohen & Steers Global Realty Majors ETF
| Schedule of Investments | November 30, 2018 |
| Security Description | | Shares | | | Value | |
| United States (continued) | | | | | | | | |
| National Retail Properties, Inc. | | | 9,364 | | | $ | 468,762 | |
| Park Hotels & Resorts, Inc. | | | 12,039 | | | | 371,042 | |
| Prologis, Inc. | | | 32,733 | | | | 2,204,240 | |
| Public Storage | | | 8,939 | | | | 1,906,331 | |
| Realty Income Corp. | | | 17,304 | | | | 1,109,013 | |
| Regency Centers Corp. | | | 10,142 | | | | 645,640 | |
| Simon Property Group, Inc. | | | 11,678 | | | | 2,168,488 | |
| SL Green Realty Corp. | | | 5,228 | | | | 504,084 | |
| UDR, Inc. | | | 15,966 | | | | 680,471 | |
| Ventas, Inc. | | | 21,274 | | | | 1,350,686 | |
| Vornado Realty Trust | | | 10,361 | | | | 745,578 | |
| Welltower, Inc. | | | 22,198 | | | | 1,605,581 | |
| Total United States | | | | | | | 30,459,018 | |
| | | | | | | | | |
| TOTAL COMMON STOCKS | | | | | | | | |
| (Cost $48,556,743) | | | | | | | 54,976,308 | |
| | | 7 Day Yield | | | Shares | | | Value | |
| SHORT TERM INVESTMENTS (0.28%) | | | | |
| State Street Institutional Treasury Plus Money Market Fund | | | 2.146 | % | | | 152,832 | | | | 152,832 | |
| TOTAL SHORT TERM INVESTMENTS | | | | |
| (Cost $152,832) | | | | | | | | | | | 152,832 | |
| | | | | | | | | | | | | |
| TOTAL INVESTMENTS (99.83%) | | | | |
| (Cost $48,709,575) | | | | | | | | | | $ | 55,129,140 | |
| NET LIABILITIES LESS OTHER ASSETS (0.17%) | | | 92,948 | |
| NET ASSETS - 100.00% | | $ | 55,222,088 | |
See Notes to Financial Statements.
Cohen & Steers Global Realty Majors ETF
| Statement of Assets and Liabilities | November 30, 2018 |
| ASSETS: | | | |
| Investments, at value | | $ | 55,129,140 | |
| Foreign currency, at value (Cost $4,520) | | | 4,520 | |
| Foreign tax reclaims | | | 33,146 | |
| Dividends receivable | | | 79,790 | |
| Total Assets | | | 55,246,596 | |
| | | | | |
| LIABILITIES: | | | | |
| Payable to adviser | | | 24,508 | |
| Total Liabilities | | | 24,508 | |
| NET ASSETS | | $ | 55,222,088 | |
| | | | | |
| NET ASSETS CONSIST OF: | | | | |
| Paid-in capital | | $ | 54,891,660 | |
| Total distributable earnings | | | 330,428 | |
| NET ASSETS | | $ | 55,222,088 | |
| | | | | |
| INVESTMENTS, AT COST | | $ | 48,709,575 | |
| | | | | |
| PRICING OF SHARES | | | | |
| Net Assets | | $ | 55,222,088 | |
| Shares of beneficial interest outstanding (Unlimited number of shares authorized, par value $0.01 per share) | | | 1,250,000 | |
| Net Asset Value, offering and redemption price per share | | $ | 44.18 | |
See Notes to Financial Statements.
Cohen & Steers Global Realty Majors ETF
| Statement of Operations | For the Year Ended November 30, 2018 |
| INVESTMENT INCOME: | | | |
| Dividends(a) | | $ | 1,934,445 | |
| Total Investment Income | | | 1,934,445 | |
| | | | | |
| EXPENSES: | | | | |
| Investment adviser fees | | | 330,310 | |
| Total Expenses | | | 330,310 | |
| NET INVESTMENT INCOME | | | 1,604,135 | |
| | | | | |
| REALIZED AND UNREALIZED GAIN/(LOSS) | | | | |
| Net realized gain on investments | | | 1,549,757 | |
| Net realized loss on foreign currency transactions | | | (4,560 | ) |
| Total Net realized gain | | | 1,545,197 | |
| Net change in unrealized appreciation on investments | | | (2,488,207 | ) |
| Net change in unrealized depreciation on translation of assets and liabilities denominated in foreign currencies | | | (954 | ) |
| Total net change in unrealized depreciation | | | (2,489,161 | ) |
| NET REALIZED AND UNREALIZED LOSS ON INVESTMENTS | | | (943,964 | ) |
| NET INCREASE IN NET ASSETS RESULTING FROM OPERATIONS | | $ | 660,171 | |
| (a) | Net of foreign tax withholding of $79,344. |
See Notes to Financial Statements.
Cohen & Steers Global Realty Majors ETF
Statements of Changes in Net Assets
| | | For the Year Ended November 30, 2018 | | | For the Year Ended November 30, 2017 | |
| OPERATIONS: | | | | | | | | |
| Net investment income | | $ | 1,604,135 | | | $ | 1,267,980 | |
| Net realized gain | | | 1,545,197 | | | | 5,272,774 | |
| Net change in unrealized appreciation/depreciation | | | (2,489,161 | ) | | | 2,684,359 | |
| Net increase in net assets resulting from operations | | | 660,171 | | | | 9,225,113 | |
| | | | | | | | | |
| DISTRIBUTIONS TO SHAREHOLDERS: | | | | | | | | |
| From distributable earnings | | | (2,627,653 | ) | | | (1,968,767 | )(a) |
| Total distributions | | | (2,627,653 | ) | | | (1,968,767 | ) |
| | | | | | | | | |
| CAPITAL SHARE TRANSACTIONS: | | | | | | | | |
| Cost of shares redeemed | | | (10,860,609 | ) | | | (19,756,525 | ) |
| Net decrease from capital share transactions | | | (10,860,609 | ) | | | (19,756,525 | ) |
| Net decrease in net assets | | | (12,828,091 | ) | | | (12,500,179 | ) |
| | | | | | | | | |
| NET ASSETS: | | | | | | | | |
| Beginning of year | | | 68,050,179 | | | | 80,550,358 | |
| End of year | | $ | 55,222,088 | | | $ | 68,050,179 | (b) |
| | | | | | | | | |
| OTHER INFORMATION: | | | | | | | | |
| CAPITAL SHARE TRANSACTIONS: | | | | | | | | |
| Beginning shares | | | 1,500,000 | | | | 1,950,000 | |
| Shares sold | | | – | | | | – | |
| Shares redeemed | | | (250,000 | ) | | | (450,000 | ) |
| Shares outstanding, end of period | | | 1,250,000 | | | | 1,500,000 | |
| (a) | For the year ended November 30, 2017, total distributions from distributable earnings consisted of distributions from net investment income of $1,968,767. |
| (b) | For the year ended November 30, 2017, net assets included accumulated net investment loss of $(862,251). |
See Notes to Financial Statements.
Cohen & Steers Global Realty Majors ETF
| Financial Highlights | For a Share Outstanding Throughout the Periods Presented |
| | | For the Year Ended November 30, 2018 | | | For the Year Ended November 30, 2017 | | | For the Year Ended November 30, 2016 | | | For the Year Ended November 30, 2015 | | | For the Year Ended November 30, 2014 | |
| NET ASSET VALUE, BEGINNING OF PERIOD | | $ | 45.37 | | | $ | 41.31 | | | $ | 42.25 | | | $ | 44.07 | | | $ | 39.32 | |
| | | | | | | | | | | | | | | | | | | | | |
| INCOME FROM OPERATIONS: | | | | | | | | | | | | | | | | | | | | |
| Net investment income(a) | | | 1.17 | | | | 0.75 | | | | 1.24 | | | | 1.41 | | | | 0.92 | |
| Net realized and unrealized gain/(loss) | | | (0.53 | ) | | | 4.45 | | | | (0.90 | ) | | | (1.57 | ) | | | 4.85 | |
| Total from investment operations | | | 0.64 | | | | 5.20 | | | | 0.34 | | | | (0.16 | ) | | | 5.77 | |
| | | | | | | | | | | | | | | | | | | | | |
| DISTRIBUTIONS: | | | | | | | | | | | | | | | | | | | | |
| From net investment income | | | (1.83 | ) | | | (1.14 | ) | | | (1.28 | ) | | | (1.66 | ) | | | (1.02 | ) |
| Total distributions | | | (1.83 | ) | | | (1.14 | ) | | | (1.28 | ) | | | (1.66 | ) | | | (1.02 | ) |
| | | | | | | | | | | | | | | | | | | | | |
| NET INCREASE/(DECREASE) IN NET ASSET VALUE | | | (1.19 | ) | | | 4.06 | | | | (0.94 | ) | | | (1.82 | ) | | | 4.75 | |
| NET ASSET VALUE, END OF PERIOD | | $ | 44.18 | | | $ | 45.37 | | | $ | 41.31 | | | $ | 42.25 | | | $ | 44.07 | |
| TOTAL RETURN(b) | | | 1.47 | % | | | 12.77 | % | | | 0.61 | % | | | (0.38 | )% | | | 14.90 | % |
| | | | | | | | | | | | | | | | | | | | | |
| RATIOS/SUPPLEMENTAL DATA: | | | | | | | | | | | | | | | | | | | | |
| Net assets, end of period (in 000s) | | $ | 55,222 | | | $ | 68,050 | | | $ | 80,550 | | | $ | 99,298 | | | $ | 96,953 | |
| | | | | | | | | | | | | | | | | | | | | |
| RATIOS TO AVERAGE NET ASSETS | | | | | | | | | | | | | | | | | | | | |
| Ratio of expenses to average net assets | | | 0.55 | % | | | 0.55 | % | | | 0.55 | % | | | 0.55 | % | | | 0.55 | % |
| Ratio of net investment income to average net assets | | | 2.67 | % | | | 1.71 | % | | | 2.86 | % | | | 3.24 | % | | | 2.21 | % |
| Portfolio turnover rate(c) | | | 14 | % | | | 10 | % | | | 8 | % | | | 7 | % | | | 11 | % |
| (a) | Based on average shares outstanding during the period. |
| (b) | Total return is calculated assuming an initial investment made at the net asset value at the beginning of the period and redemption at the net asset value on the last day of the period and assuming all distributions are reinvested at the reinvestment prices. |
| (c) | Portfolio turnover for periods less than one year are not annualized and does not include securities received or delivered from processing creations or redemptions in-kind. |
See Notes to Financial Statements.
Cohen & Steers Global Realty Majors ETF
| Notes to Financial Statements | November 30, 2018 |
1. ORGANIZATION
ALPS ETF Trust (the “Trust”), a Delaware statutory trust, is an open-end management investment company registered under the Investment Company Act of 1940, as amended (the “1940 Act”). As of November 30, 2018, the Trust consisted of twenty separate portfolios. Each portfolio represents a separate series of the Trust. This report pertains solely to the Cohen & Steers Global Realty Majors ETF (the “Fund”). The investment objective of the Fund is to seek investment results that correspond generally to the performance, before the Fund’s fees and expenses, of an index called the Cohen & Steers Global Realty Majors Index (the “Underlying Index”). The investment advisor uses a “passive” or indexing approach to try to achieve the Fund’s investment objective. The Fund has elected to qualify as a diversified series of the Trust under the 1940 Act.
The Fund’s Shares (“Shares”) are listed on the NYSE Arca, Inc. (the "NYSE Arca"). The Fund issues and redeems Shares at net asset value (“NAV”) in blocks of 50,000 Shares, each of which is called a “Creation Unit”. Creation Units are issued and redeemed principally in-kind for securities included in the Underlying Index. Except when aggregated in Creation Units, Shares are not redeemable securities of the Fund.
Pursuant to the Trust’s organizational documents, its Officers and Trustees are indemnified against certain liability arising out of the performance of their duties to the Trust. Additionally, in the normal course of business, the Trust enters into contracts with service providers that contain general indemnification clauses. The Trust’s maximum exposure under these arrangements is unknown, as this would involve future claims that may be made against the Trust that have not yet occurred.
2. SIGNIFICANT ACCOUNTING POLICIES
The following is a summary of significant accounting policies consistently followed by the Fund in the preparation of the financial statements. The accompanying financial statements were prepared in accordance with accounting principles generally accepted in the United States of America (“U.S. GAAP”). The preparation of financial statements in conformity with U.S. GAAP requires management to make certain estimates and assumptions that affect the reported amounts of assets and liabilities and disclosures of contingent assets and liabilities at the date of the financial statements and the reported amounts of revenue and expenses during the period. Actual results could differ from those estimates. The Fund is considered an investment company under U.S. GAAP and follows the accounting and reporting guidance applicable to investment companies in the Financial Accounting Standards BoardAccounting Standards Codification Topic 946.
A. Portfolio Valuation
The Fund’s NAV is determined daily, as of the close of regular trading on the New York Stock Exchange (the “NYSE”), normally 4:00 p.m. Eastern time, on each day the NYSE is open for trading. The NAV is computed by dividing the value of all assets of the Fund (including accrued interest and dividends), less all liabilities (including accrued expenses and dividends declared but unpaid), by the total number of shares outstanding.
Portfolio securities listed on any exchange other than the NASDAQ Stock Market LLC (“NASDAQ”) are valued at the last sale price on the business day as of which such value is being determined. If there has been no sale on such day, the securities are valued at the mean of the most recent bid and asked prices on such day. Securities traded on the NASDAQ are valued at the NASDAQ Official Closing Price as determined by NASDAQ. Portfolio securities traded on more than one securities exchange are valued at the last sale price on the business day as of which such value is being determined at the close of the exchange representing the principal market for such securities. Portfolio securities traded in the over-the-counter market, but excluding securities traded on the NASDAQ, are valued at the latest quoted sale price in such market.
The Fund’s investments are valued at market value or, in the absence of market value with respect to any portfolio securities, at fair value according to procedures adopted by the Trust’s Board of Trustees (the “Board”). When market quotations are not readily available or when events occur that make established valuation methods unreliable, securities of the Fund may be valued in good faith by or under the direction of the Board. These securities generally include, but are not limited to, restricted securities (securities which may not be publicly sold without registration under the Securities Act of 1933) for which a pricing service is unable to provide a market price; securities whose trading has been formally suspended; a security whose market price is not available from a pre-established primary pricing source or the pricing source is not willing to provide a price; a security with respect to which an event has occurred that is most likely to materially affect the value of the security after the market has closed but before the calculation of the Fund’s NAV or make it difficult or impossible to obtain a reliable market quotation; or a security whose price, as provided by the pricing service, does not reflect the security’s “fair value” due to the security being de-listed from a national exchange or the security’s primary trading market is temporarily closed at a time when, under normal conditions, it would be open. As a general principle, the current “fair value” of a security would be the amount which the owner might reasonably expect to receive from the sale on the applicable exchange or principal market. A variety of factors may be considered in determining the fair value of such securities.
Cohen & Steers Global Realty Majors ETF
| Notes to Financial Statements | November 30, 2018 |
B. Fair Value Measurements
The Fund discloses the classification of its fair value measurements following a three-tier hierarchy based on the inputs used to measure fair value. Inputs refer broadly to the assumptions that market participants would use in pricing the asset or liability, including assumptions about risk. Inputs may be observable or unobservable. Observable inputs reflect the assumptions market participants would use in pricing the asset or liability that are developed based on market data obtained from sources independent of the reporting entity. Unobservable inputs reflect the reporting entity’s own assumptions about the assumptions market participants would use in pricing the asset or liability that are developed based on the best information available.
Valuation techniques used to value the Fund’s investments by major category are as follows:
Equity securities, including restricted securities, for which market quotations are readily available, are valued at the last reported sale price or official closing price as reported by a third party pricing vendor on the primary market or exchange on which they are traded and are categorized as Level 1 in the hierarchy. In the event there were no sales during the day or closing prices are not available, securities are valued at the mean of the most recent quoted bid and ask prices on such day and are generally categorized as Level 2 in the hierarchy. Investments in open-end mutual funds are valued at their NAV each business day and are categorized as Level 1 in the hierarchy.
Changes in valuation techniques may result in transfers in or out of an assigned level within the disclosure hierarchy.
Various inputs are used in determining the value of the Fund’s investments as of the end of the reporting period. When inputs used fall into different levels of the fair value hierarchy, the level in the hierarchy within which the fair value measurement falls is determined based on the lowest level input that is significant to the fair value measurement in its entirety. The designated input levels are not necessarily an indication of the risk or liquidity associated with these investments.
These inputs are categorized in the following hierarchy under applicable financial accounting standards:
| Level 1 – | Unadjusted quoted prices in active markets for identical investments, unrestricted assets or liabilities that a Fund has the ability to access at the measurement date; |
| Level 2 – | Quoted prices which are not active, quoted prices for similar assets or liabilities in active markets or inputs other than quoted prices that are observable (either directly or indirectly) for substantially the full term of the asset or liability; and |
| Level 3 – | Significant unobservable prices or inputs (including the Fund’s own assumptions in determining the fair value of investments) where there is little or no market activity for the asset or liability at the measurement date. |
The following is a summary of the inputs used to value the Fund’s investments as of November 30, 2018:
| Investments in Securities at Value* | | Level 1- Unadjusted Quoted Prices | | | Level 2- Other Significant Observable Inputs | | | Level 3- Significant Unobservable Inputs | | | Total | |
| Common Stocks | | $ | 54,976,308 | | | $ | – | | | $ | – | | | $ | 54,976,308 | |
| Short Term Investments | | | 152,832 | | | | – | | | | – | | | | 152,832 | |
| TOTAL | | $ | 55,129,140 | | | $ | – | | | $ | – | | | $ | 55,129,140 | |
| * | For a detailed geographical breakdown, see the accompanying Schedule of Investments. |
The Fund did not have any securities that used significant unobservable inputs (Level 3) in determining fair value and there were no transfers into or out of Level 3.
C. Foreign Securities
The Fund may directly purchase securities of non-U.S. issuers. Investing in securities of non-U.S. issuers may involve unique risks compared to investing in securities of U.S. issuers, including, among others, less liquidity generally, greater market volatility than U.S. securities and less complete financial information than for U.S. issuers. In addition, adverse political, economic or social developments could undermine the value of the Fund’s investments or prevent the Fund from realizing the full value of its investments. Financial reporting standards for companies based in foreign markets differ from those in the United States. Finally, the value of the currency of the country in which the Fund has invested could decline relative to the value of the U.S. dollar, which may affect the value of the investment to U.S. investors.
Cohen & Steers Global Realty Majors ETF
| Notes to Financial Statements | November 30, 2018 |
D. Foreign Currency Translation
The books and records of the Fund are maintained in U.S. dollars. Investment valuations and other assets and liabilities initially expressed in foreign currencies are converted each business day into U.S. dollars based upon current exchange rates. The portion of realized and unrealized gains or losses on investments due to fluctuations in foreign currency exchange rates is not separately disclosed and is included in realized and unrealized gains or losses on investments, when applicable.
E. Securities Transactions and Investment Income
Securities transactions are recorded as of the trade date. Realized gains and losses from securities transactions are recorded on the highest cost basis. Dividend income and capital gains distributions, if any, are recorded on the ex-dividend date, net of any foreign taxes withheld. Interest income, if any, is recorded on the accrual basis.
F. Dividends and Distributions to Shareholders
Dividends from net investment income of the Fund, if any, are declared and paid quarterly or as the Board may determine from time to time. Distributions of net realized capital gains earned by the Fund, if any, are distributed at least annually.
G. Real Estate Investment Trusts (“REITs”)
As part of its investments in real estate related securities, the Fund will invest in REITs and is subject to certain risks associated with direct investment in REITs. REITs possess certain risks which differ from an investment in common stocks. REITs are financial vehicles that pool investors’ capital to acquire, develop and/or finance real estate and provide services to their tenants. REITs may concentrate their investments in specific geographic areas or in specific property types, e.g., regional malls, shopping centers, office buildings, apartment buildings and industrial warehouses. REITs may be affected by changes in the value of their underlying properties and by defaults by borrowers or tenants. REITs depend generally on their ability to generate cash flow to make distributions to shareowners, and certain REITs have self-liquidation provisions by which mortgages held may be paid in full and distributions of capital returns may be made at any time.
As REITs generally pay a higher rate of dividends than most other operating companies, to the extent application of the Fund’s investment strategy results in the Fund investing in REIT shares, the percentage of the Fund’s dividend income received from REIT shares will likely exceed the percentage of the Fund’s portfolio that is comprised of REIT shares. Distributions received by the Fund from REITs may consist of dividends, capital gains and/or return of capital.
Dividend income from REITs is recognized on the ex-dividend date. The calendar year-end amounts of ordinary income, capital gains, and return of capital included in distributions received from the Fund’s investments in REITs are reported to the Fund after the end of the calendar year; accordingly, the Fund estimates these amounts for accounting purposes until the characterization of REIT distributions is reported to the Fund after the end of the calendar year. Estimates are based on the most recent REIT distribution information available.
The performance of a REIT may be affected by its failure to qualify for tax-free pass-through of income under the Internal Revenue Code of 1986, as amended (the “Code”), or its failure to maintain exemption from registration under the 1940 Act. Due to the Fund’s investments in REITs, the Fund may also make distributions in excess of the Fund’s earnings and capital gains. Distributions, if any, in excess of the Fund’s earnings and profits will first reduce the adjusted tax basis of a holder’s shares and, after that basis has been reduced to zero, will constitute capital gains to the shareholder.
H. Federal Tax and Tax Basis Information
The timing and character of income and capital gain distributions are determined in accordance with income tax regulations, which may differ from U.S. GAAP. Reclassifications are made to the Fund’s capital accounts for permanent tax differences to reflect income and gains available for distribution (or available capital loss carryforwards) under income tax regulations.
For the year ended November 30, 2018, the following reclassifications, which had no impact on results of operations or net assets, were recorded to reflect permanent tax differences resulting primarily from in-kind transactions and expiring capital loss carryforwards:
| Fund | | Paid-in Capital | | | Distributable Earnings | |
| Cohen & Steers Global Realty Majors ETF | | $ | 1,333,816 | | | $ | (1,333,816 | ) |
Cohen & Steers Global Realty Majors ETF
| Notes to Financial Statements | November 30, 2018 |
The tax character of the distributions paid during the fiscal year ended November 30, 2018 and November 30, 2017 were as follows:
| | | Ordinary Income | |
| November 30, 2018 | | | | |
| Cohen & Steers Global Realty Majors ETF | | $ | 2,627,653 | |
| November 30, 2017 | | | | |
| Cohen & Steers Global Realty Majors ETF | | $ | 1,968,767 | |
Under current law, capital losses maintain their character as short-term or long-term and are carried forward to the next year without expiration.
At November 30, 2018, the following amounts are available as carry forwards to the next tax year:
| Fund | | Short-Term | | | Long-Term | |
| Cohen & Steers Global Realty Majors ETF | | $ | 1,091,915 | | | $ | 3,452,476 | |
As of November 30, 2018, the components of distributable earnings on a tax basis for the Fund were as follows:
| Undistributed net investment income | | $ | 383,384 | |
| Accumulated net realized loss on investments | | | (4,544,391 | ) |
| Net unrealized appreciation on investments | | | 4,491,435 | |
| Total | | $ | 330,428 | |
As of November 30, 2018, the cost of investments for federal income tax purposes and accumulated net unrealized appreciation/(depreciation) on investments were as follows:
| Gross appreciation (excess of value over tax cost) | | $ | 7,537,118 | |
| Gross depreciation (excess of tax cost over value) | | | (3,044,364 | ) |
| Net depreciation on foreign currency transactions | | | (1,319 | ) |
| Net unrealized appreciation (depreciation) | | | 4,491,435 | |
| Cost of investments for income tax purposes | | $ | 50,636,386 | |
The differences between book-basis and tax-basis are due to the deferral of losses from wash sales, Passive Foreign Investment Companies and partnerships.
I. Income Taxes
No provision for income taxes is included in the accompanying financial statements, as the Fund intends to distribute to shareholders all taxable investment income and realized gains and otherwise comply with Subchapter M of the Internal Revenue Code of 1986, as amended, applicable to regulated investment companies. The Fund evaluates tax positions taken (or expected to be taken) in the course of preparing the Fund’s tax returns to determine whether these positions meet a “more-likely-than-not” standard that, based on the technical merits, have a more than fifty percent likelihood of being sustained by a taxing authority upon examination. A tax position that meets the “more-likely-than-not” recognition threshold is measured to determine the amount of benefit to recognize in the financial statements.
As of and during the year ended November 30, 2018, the Fund did not have a liability for any unrecognized tax benefits. The Fund files U.S. federal, state, and local tax returns as required. The Fund’s tax returns are subject to examination by the relevant tax authorities until expiration of the applicable statute of limitations, which is generally three years after the filing of the tax return, but may extend to four years in certain jurisdictions. Tax returns for open years have incorporated no uncertain tax positions that require a provision for income taxes.
J. Lending of Portfolio Securities
The Fund has entered into a securities lending agreement with State Street Bank & Trust Co. (“SSB”), the Fund’s lending agent. The Fund may lend its portfolio securities only to borrowers that are approved by SSB. The Fund will limit such lending to not more than 33 1/3% of the value of its total assets. The Fund’s securities held at SSB as custodian shall be available to be lent except those securities the Fund or ALPS Advisors, Inc. specifically identifies in writing as not being available for lending. The borrower pledges and maintains with the Fund collateral consisting of cash (U.S. Dollars only), securities issued or guaranteed by the U.S. government or its agencies or instrumentalities, and cash equivalents (including irrevocable bank letters of credit) issued by a person other than the borrower or an affiliate of the borrower. The initial collateral received by the Fund is required to have a value of no less than 102% of the market value of the loaned securities for U.S equity securities and a value of no less than 105% of the market value for non-U.S. equity securities. The collateral is maintained thereafter, at a market value equal to not less than 102% of the current value of the U.S. equity securities on loan and not less than 105% of the current value of the non-U.S. equity securities on loan. The market value of the loaned securities is determined at the close of each business day and any additional required collateral is delivered to the Fund on the next business day. During the term of the loan, the Fund is entitled to all distributions made on or in respect of the loaned securities. Loans of securities are terminable at any time and the borrower, after notice, is required to return borrowed securities within the customary time period for settlement of securities transactions.
Cohen & Steers Global Realty Majors ETF
| Notes to Financial Statements | November 30, 2018 |
Any cash collateral received is reinvested in a money market fund managed by SSB as disclosed in the Fund’s Schedule of Investments and is reflected in the Statement of Assets and Liabilities as a payable for collateral upon return of securities loaned. Non-cash collateral, in the form of securities issued or guaranteed by the U.S. government or its agencies or instrumentalities, is not disclosed in the Fund’s Statement of Assets and Liabilities as it is held by the lending agent on behalf of the Fund, and the Fund does not have the ability to re-hypothecate these securities. Income earned by the Fund from securities lending activity is disclosed in the Statement of Operations. As of November 30, 2018, the Fund had no securities on loan.
The risks of securities lending include the risk that the borrower may not provide additional collateral when required or may not return the securities when due. To mitigate these risks, the Fund benefits from a borrower default indemnity provided by SSB. SSB’s indemnity allows for full replacement of securities lent wherein SSB will purchase the unreturned loaned securities on the open market by applying the proceeds of the collateral, or to the extent such proceeds are insufficient or the collateral is unavailable, SSB will purchase the unreturned loan securities at SSB’s expense. However, the Fund could suffer a loss if the value of the investments purchased with cash collateral falls below the value of the cash collateral received.
3. INVESTMENT ADVISORY FEE AND OTHER AFFILIATED TRANSACTIONS
ALPS Advisors, Inc. (“Adviser”) serves as the Fund’s investment adviser pursuant to an Investment Advisory Agreement with the Fund. As compensation for its services to the Fund, the Adviser receives an annual unitary fee of 0.55% based on the Fund’s average daily net assets payable monthly. The Adviser served under the previous investment advisory agreement, since the commencement of the Fund until these agreements were terminated on April 16, 2018, due to a change of control of the Adviser’s parent company. Beginning April 16, 2018, the Adviser served under an interim investment advisory agreement, until the current investment advisory agreement was approved by the Fund’s shareholders.
Out of the unitary management fee, the Adviser pays substantially all expenses of the Fund, including the cost of transfer agency, custody, fund administration, legal, audit, independent trustees and other services, except for interest expenses, distribution fees or expenses, brokerage expenses, taxes and extraordinary expenses such as litigation and other expenses not incurred in the ordinary course of the Fund’s business. The Adviser’s unitary management fee is designed to pay substantially all the Fund's expenses and to compensate the Adviser for providing services for the Fund.
ALPS Fund Services, Inc., an affiliate of the Adviser, is the administrator of the Fund.
Each Trustee who is not an officer or employee of the Adviser, any sub-adviser or any of their affiliates (“Independent Trustees”) receives (1) a quarterly retainer of $5,000, (2) a per meeting fee for regularly scheduled meetings of $3,750, (3) $1,500 for any special meeting held outside of a regularly scheduled board meeting, and (4) reimbursement for all reasonable out-of-pocket expenses relating to attendance at meetings. In addition, both the Chairman of the Board and Chairman of the Audit Committee each receives a quarterly retainer of $2,000, in connection with their respective roles.
Cohen & Steers Global Realty Majors ETF
| Notes to Financial Statements | November 30, 2018 |
4. PURCHASES AND SALES OF SECURITIES
For the year ended November 30, 2018, the cost of purchases and proceeds from sales of investment securities, excluding in-kind transactions and short-term investments, were as follows:
| | | Purchases | | | Sales | |
| | | $ | 8,197,575 | | | $ | 9,195,840 | |
For the year ended November 30, 2018, the cost of in-kind purchases and proceeds from in-kind sales were as follows:
| | | Purchases | | | Sales | |
| | | $ | – | | | $ | 10,815,264 | |
For the year ended November 30, 2018, the Cohen and Steers Global Realty Majors ETF had in-kind net realized gains of $2,006,502.
Gains on in-kind transactions are not considered taxable for federal income tax purposes and losses on in-kind transactions are also not deductible for tax purposes.
5. CAPITAL SHARE TRANSACTIONS
Shares are created and redeemed by the Fund only in Creation Unit size aggregations of 50,000 Shares. Only broker-dealers or large institutional investors with creation and redemption agreements called Authorized Participants (“AP”) are permitted to purchase or redeem Creation Units from the Fund. Such transactions are generally permitted on an in-kind basis, with a balancing cash component to equate the transaction to the NAV per unit of the Fund on the transaction date. Cash may be substituted equivalent to the value of certain securities generally when they are not available in sufficient quantity for delivery, not eligible for trading by the AP or as a result of other market circumstances.
6. NEW ACCOUNTING PRONOUNCEMENTS
In August 2018, the Financial Accounting Standards Board (“FASB”) issued Accounting Standards Update (“ASU”) 2018-13, which changes the fair value measurement disclosure requirements of FASB ASC Topic 820, Fair Value Measurement. The update to Topic 820 includes new, eliminated, and modified disclosure requirements. ASU 2018-13 is effective for fiscal years beginning after December 15, 2019, including interim periods. Early adoption is permitted for any eliminated or modified disclosures. The Funds have elected to early adopt the eliminated and modified disclosures effective with the financial statements prepared as of November 30, 2018.
7. SEC REGULATIONS
On October 4, 2018, the SEC amended Regulation S-X to require certain financial statement disclosure requirements to conform them to GAAP for investment companies. Effective November 4, 2018, the Fund adopted disclosure requirement changes for Regulation S-X, these changes are reflected throughout this report. The Fund’s adoption of the amendments, effective with the financial statements prepared as of November 30, 2018, had no effect on the Fund’s net assets or results of operations.
Cohen & Steers Global Realty Majors ETF
| Additional Information | November 30, 2018 (Unaudited) |
PROXY VOTING POLICIES AND PROCEDURES
Information regarding how the Fund voted proxies relating to portfolio securities during the most recent 12-month period ended June 30 and a description of the Fund’s proxy voting policies and procedures used in determining how to vote for proxies are available without charge on the SEC’s website at www.sec.gov and upon request, by calling (toll-free) 1-866-675-2639.
PORTFOLIO HOLDINGS
The Trust is required to disclose, after its first and third fiscal quarters, the complete schedule of the Fund’s portfolio holdings with the SEC on Form N-Q. Forms N-Q for the Fund are available on the SEC’s website at www.sec.gov. The Fund’s Forms N-Q may also be reviewed and copied at the SEC’s Public Reference Room in Washington, D.C. and information on the operation of the Public Reference Room may be obtained by calling 1-800-SEC-0330. The Fund’s Forms N-Q are available without charge, upon request, by calling (toll-free) 1-866-675-2639 or by writing to ALPS ETF Trust at 1290 Broadway, Suite 1100, Denver, Colorado 80203.
TAX INFORMATION
The Fund designated the following for federal income tax purposes for distributions made during the calendar year ended December 31, 2017:
| | Qualified Dividend Income | Dividend Received Deduction |
| Cohen and Steers Global Realty Majors ETF | 15.06% | 0.00% |
In early 2018, if applicable, shareholders of record received this information for the distribution paid to them by the Fund during the calendar year 2017 via Form 1099. The Fund will notify shareholders in early 2019 of amounts paid to them by the Fund, if any, during the calendar year 2018.
LICENSING AGREEMENT
Cohen & Steers is the Index Provider for the Cohen & Steers Global Realty Majors ETF. Cohen & Steers is not affiliated with the Trust, the Adviser or the Distributor. ALPS, an affiliate of the Adviser, and the Trust have entered into a license agreement with Cohen & Steers to use the Index.
THE FUND IS NOT SPONSORED, MANAGED OR ADVISED BY COHEN & STEERS CAPTIAL MANAGEMENT, INC. (“C&S”). C&S MAKES NO REPRESENTATION OR WARRANTY, EXPRESS OR IMPLIED, TO THE SHAREHOLDERS OF THE FUND OR ANY MEMBER OF THE PUBLIC REGARDING THE ADVISABILITY OF INVESTING IN SECURITIES GENERALLY OR IN THE FUND PARTICULARLY OR THE ABILITY OF THE COHEN & STEERS GLOBAL REALTY MAJORS INDEX TO TRACK PERFORMANCE OF A MARKET OR SECTOR. C&S’S ONLY RELATIONSHIP TO ALPS IS IN RELATION TO THE LICENSING OF CERTAIN TRADEMARKS AND TRADE NAMES OF C&S AND OF ONE OR MORE C&S INDEXES, INCLUDING THE COHEN & STEERS GLOBAL REALTY MAJORS INDEX WHICH IS DETERMINED, COMPOSED AND CALCULATED BY C&S WITHOUT REGARD TO ALPS OR THE FUND. C&S HAS NO OBLIGATION TO TAKE THE NEEDS OF ALPS, THE FUND OR THE FUND SHAREHOLDERS INTO CONSIDERATION IN DETERMINING, COMPOSING OR CALCULATING THE COHEN & STEERS GLOBAL REALTY MAJORS INDEX. C&S IS NOT RESPONSIBLE FOR AND HAS NOT PARTICIPATED IN THE TIMING OF THE ISSUANCE OR SALE OF FUND SHARES OR IN THE DETERMINATION OR CALCULATION OF THE VALUATION OF THE FUND’S ASSETS. C&S HAS NO OBLIGATION OR LIABILITY IN CONNECTION WITH THE ADMINISTRATION, MARKETING OR PORTFOLIO MANAGEMENT OF THE FUND. C&S DOES NOT GUARANTEE THE ACCURACY AND/OR THE COMPLETENESS OF THE COHEN & STEERS GLOBAL REALTY MAJORS INDEX OR ANY DATA INCLUDED THEREIN AND C&S SHALL HAVE NO LIABILITY FOR ANY ERRORS, OMISSIONS, OR INTERRUPTIONS THEREIN. C&S MAKES NO WARRANTY, EXPRESS OR IMPLIED, AS TO RESULTS TO BE OBTAINED BY ALPS, THE FUND, FUND SHAREHOLDERS, OR ANY OTHER PERSON OR ENTITY FROM THE USE OF THE COHEN & STEERS GLOBAL REALTY MAJORS INDEX OR ANY DATA INCLUDED THEREIN. C&S MAKES NO EXPRESS OR IMPLIED WARRANTIES, AND EXPRESSLY DISCLAIMS ALL WARRANTIES OF MERCHANTABILITY OR FITNESS FOR A PARTICULAR PURPOSE OF USE WITH RESPECT TO THE COHEN & STEERS GLOBAL REALTY MAJORS INDEX OR ANY DATA INCLUDED THEREIN. WITHOUT LIMITING ANY OF THE FOREGOING, IN NO EVENT SHALL C&S HAVE ANY LIABILITY FOR ANY SPECIAL, PUNITIVE, INDIRECT OR CONSEQUENTIAL DAMAGES (INCLUDING LOST PROFITS) RESULTING FROM THE USE OF THE COHEN & STEERS GLOBAL REALTY MAJORS INDEX OR ANY DATA INCLUDED THEREIN, EVEN IF NOTIFIED OF THE POSSIBILITY OF SUCH DAMAGES.
The Advisor does not guarantee the accuracy and/or the completeness of the Index or any data included therein, and the Advisor shall have no liability for any errors, omissions or interruptions therein. The Advisor makes no warranty, express or implied, as to results to be obtained by the Fund, owners of the Shares of the Fund or any other person or entity from the use of the Index or any data included therein. The Advisor makes no express or implied warranties, and expressly disclaims all warranties of merchantability or fitness for a particular purpose or use with respect to the Index or any data included therein. Without limiting any of the foregoing, in no event shall the Advisor have any liability for any special, punitive, direct, indirect or consequential damages (including lost profits) arising out of matters relating to the use of the Index even if notified of the possibility of such damages.
| Cohen & Steers Global Realty Majors ETF | |
| Trustees & Officers | November 30, 2018 (Unaudited) |
The general supervision of the duties performed by the Adviser for the Fund under the Investment Advisory Agreement is the responsibility of the Board of Trustees. The Trust currently has four Trustees. Three Trustees have no affiliation or business connection with the Adviser or any of its affiliated persons and do not own any stock or other securities issued by the Adviser. These are the “non-interested” or “independent” Trustees (“Independent Trustees”). The other Trustee (the “Interested Trustee”) is affiliated with the Adviser.
The Independent Trustees of the Trust, their term of office and length of time served, their principal business occupations during the past five years, the number of portfolios in the Fund Complex overseen by each Independent Trustee, and other directorships, if any, held by the Trustee are shown below.
INDEPENDENT TRUSTEES
Name, Address & Year of Birth* | Position(s) Held with Trust | Term of Office and Length of Time Served** | Principal Occupation(s) During Past 5 Years | Number of Portfolios in Fund Complex Overseen by Trustees*** | Other Directorships Held by Trustees |
Mary K. Anstine, 1940 | Trustee | Since March 2008 | Ms. Anstine was President/Chief Executive Officer of HealthONE Alliance, Denver, Colorado, and former Executive Vice President of First Interstate Bank of Denver. Ms. Anstine is also Trustee/Director of AV Hunter Trust and Colorado Uplift Board. Ms. Anstine was formerly a Director of the Trust Bank of Colorado (later purchased and now known as Northern Trust Bank), HealthONE and Denver Area Council of the Boy Scouts of America and a member of the American Bankers Association Trust Executive Committee. | 41 | Ms. Anstine is a Trustee of ALPS Variable Investment Trust (9 funds); Financial Investors Trust (33 funds); Reaves Utility Income Fund (1 fund); and Segall Bryant & Hamill Trust (14 funds). |
Jeremy W. Deems, 1976 | Trustee | Since March 2008 | Mr. Deems is the Co-Founder, Chief Compliance Officer and Chief Financial Officer of Green Alpha Advisors, LLC. Mr. Deems is Co-Portfolio Manager of the Shelton Green Alpha Fund. Prior to joining Green Alpha Advisors, Mr. Deems was CFO and Treasurer of Forward Management, LLC, ReFlow Management Co., LLC, ReFlow Fund, LLC, a private investment fund, and Sutton Place Management, LLC, an administrative services company. | 41 | Mr. Deems is a Trustee of ALPS Variable Investment Trust (9 funds); Financial Investors Trust (33 funds); and Reaves Utility Income Fund (1 fund); and Clough Funds Trust (1 fund). |
Rick A. Pederson, 1952 | Trustee and Chairman | Since March 2008. Has served as Chairman since July 2017. | Mr. Pederson is Partner, Bow River Capital Partners (private equity management), 2003 - present; Board Member, Prosci Inc. (private business services) 2013-2016; Board Member, Citywide Banks (Colorado community bank) 2014-present; Board Member, Strong-Bridge Consulting (management consulting) 2015-present; Board Member, IRI/ODMS Holdings LLC, 2017 – present; Director, National Western Stock Show (not-for-profit organization) 2010 – present; Board Member, History Colorado, 2015 – present; Trustee, Boettcher Foundation, 2018. | 21 | Mr. Pederson is Trustee of Segall Bryant & Hamill Trust (14 funds) and Principal Real Estate Income Fund (1 fund) |
| * | The business address of the Trustee is c/o ALPS Advisors, Inc., 1290 Broadway, Suite 1100, Denver, Colorado 80203. |
| ** | This is the period for which the Trustee began serving the Trust. Each Trustee serves an indefinite term, until his successor is elected. |
| *** | The Fund Complex includes all series of the Trust and any other investment companies for which ALPS Advisors, Inc. provides investment advisory services. |
| Cohen & Steers Global Realty Majors ETF | |
| Trustees & Officers | November 30, 2018 (Unaudited) |
The Trustee who is affiliated with the Adviser or affiliates of the Adviser and executive officers of the Trust, his term of office and length of time served, his principal business occupations during the past five years, the number of portfolios in the Fund Complex overseen by the Interested Trustee and the other directorships, if any, held by the Trustee, are shown below.
INTERESTED TRUSTEE
Name, Address and Year of Birth of Interested Trustee* | Position(s) Held with Trust | Term of Office and Length of Time Served** | Principal Occupation(s) During Past 5 Years | Number of Portfolios in Fund Complex Overseen by Trustees*** | Other Directorships Held by Trustee |
Edmund J. Burke, 1961 | Trustee and President | Since December 2017 | Mr. Burke is President and a Director of ALPS Holdings, Inc. (“AHI”) (since 2005) and Director of Boston Financial Data Services, Inc. (“BFDS”), ALPS Advisors, Inc. (“AAI”), ALPS Distributors, Inc. (“ADI”), ALPS Fund Services, Inc. (“AFS”) and ALPS Portfolio Solutions Distributor, Inc. (“APSD”). Because of his positions with AHI, BFDS, AAI, ADI, AFS and APSD, Mr. Burke is deemed an affiliate of the Trust as defined under the 1940 Act. | 36 | Mr. Burke is a Trustee of Clough Global Dividend and Income Fund (1 fund); Clough Global Equity Fund (1 fund); Clough Global Opportunities Fund (1 fund); Clough Funds Trust (1 fund); Liberty All-Star Equity Fund (1 fund); Director of the Liberty All-Star Growth Fund, Inc. (1 fund) and Financial Investors Trust (33 funds). |
| * | The business address of the Trustee is c/o ALPS Advisors, Inc., 1290 Broadway, Suite 1100, Denver, Colorado 80203. |
| ** | This is the period for which the Trustee began serving the Trust. Each Trustee serves an indefinite term, until his successor is elected. |
| *** | The Fund Complex includes all series of the Trust and any other investment companies for which ALPS Advisors, Inc. provides investment advisory services. |
| Cohen & Steers Global Realty Majors ETF | |
| Trustees & Officers | November 30, 2018 (Unaudited) |
OFFICERS
Name, Address and Year of Birth of Officer* | Position(s) Held with Trust | Length of Time Served** | Principal Occupation(s) During Past 5 Years |
Erin D. Nelson, 1977 | Chief Compliance Officer (“CCO”) | Since December 2015 | Ms. Nelson became Senior Vice-President and Chief Compliance Officer of ALPS Advisors, Inc. on July 1, 2015 and prior to that served as Vice President and Deputy Chief Compliance Officer of AAI since January 1, 2015. Prior to January 1, 2015, Ms. Nelson was Vice-President and Assistant General Counsel of ALPS Fund Services. Because of her position with AAI, Ms. Nelson is deemed an affiliate of the Trust as defined under the 1940 Act. Ms. Nelson is also the CCO of ALPS Variable Investment Trust, Liberty All-Star Growth Fund, Inc., Liberty All-Star Equity Fund, Principal Real Estate Income Fund, RiverNorth Opportunities Fund, Inc. and Red Rocks Capital, LLC. |
Kathryn Burns, 1976 | Treasurer | Since September 2018 | Ms. Burns serves as Vice President, Director of Fund Operations of AAI since 2018. From 2013 to 2018, she served as Vice President and Fund Controller at ALPS Fund Services. Prior to joining ALPS, she worked at Old Mutual Capital where she served as Vice President and Chief Compliance Officer (2010 – 2012) and Regulatory Reporting Manager and Assistant Treasurer to the Old Mutual Funds Trusts (2006 – 2012). She also served as a CPA for PricewaterhouseCoopers LLP. Ms. Burns is also Treasurer of ALPS Variable Investment Trust, the Boulder Growth & Income Fund, Inc., Principal Real Estate Income Fund and the RiverNorth Opportunities Fund Inc. |
Andrea E. Kuchli, 1985 | Secretary | Since December 2017 | Ms. Kuchli joined ALPS in 2015 and is currently Vice President and Senior Counsel of ALPS. Prior to joining ALPS, Ms. Kuchli was an Associate with Davis Graham & Stubbs LLP from April 2014 to February 2015, and an Associate with Dechert LLP from 2011 to April 2014. Because of her position with ALPS, Ms. Kuchli is deemed an affiliate of the Trust as defined under the 1940 Act. Ms. Kuchli is also Secretary of ALPS Variable Investment Trust and Principal Real Estate Income Fund as well as Assistant Secretary of the James Advantage Funds. |
Sharon Akselrod, 1974 | Assistant Secretary | Since December 2016 | Ms. Akselrod joined ALPS in August 2014 and is currently Senior Investment Company Act Paralegal of ALPS Fund Services, Inc. Prior to joining ALPS, Ms. Akselrod served as Corporate Governance and Regulatory Associate for Nordstrom fsb (2013-2014) and Senior Legal Assistant – Legal Manager for AXA Equitable Life Insurance Company (2008-2013). Because of her position with ALPS, Ms. Akselrod is deemed an affiliate of the Trust as defined under the 1940 Act. Ms. Akselrod is also Assistant Secretary of Financial Investors Trust, ALPS Variable Investment Trust, Principal Real Estate Income Fund and Clough Funds Trust. |
| * | The business address of each Officer is c/o ALPS Advisors, Inc., 1290 Broadway, Suite 1100, Denver, Colorado 80203. |
| ** | This is the period for which the Officer began serving the Trust. Each Officer serves an indefinite term, until his/her successor is elected. |

TABLE OF
CONTENTS
| Performance Overview | |
| RiverFront Dynamic Core Income ETF | 1 |
| RiverFront Dynamic Unconstrained Income ETF | 4 |
| RiverFront Dynamic US Dividend Advantage ETF | 7 |
| RiverFront Dynamic US Flex-Cap ETF | 10 |
| RiverFront Strategic Income Fund | 13 |
| Disclosure of Fund Expenses | 16 |
| Report of Independent Registered Public Accounting Firm | 17 |
| Financial Statements | |
| Schedule of Investments | |
| RiverFront Dynamic Core Income ETF | 18 |
| RiverFront Dynamic Unconstrained Income ETF | 25 |
| RiverFront Dynamic US Dividend Advantage ETF | 29 |
| RiverFront Dynamic US Flex-Cap ETF | 31 |
| RiverFront Strategic Income Fund | 33 |
| Statement of Assets and Liabilities | 36 |
| Statement of Operations | 37 |
| Statements of Changes in Net Assets | 38 |
| RiverFront Dynamic Core Income ETF | 38 |
| RiverFront Dynamic Unconstrained Income ETF | 39 |
| RiverFront Dynamic US Dividend Advantage ETF | 40 |
| RiverFront Dynamic US Flex-Cap ETF | 41 |
| RiverFront Strategic Income Fund | 42 |
| Financial Highlights | 43 |
| Notes to Financial Statements | 48 |
| Additional Information | 57 |
| Trustees & Officers | 58 |
Beginning on January 1, 2021, as permitted by regulations adopted by the U.S. Securities and Exchange Commission, paper copies of the Funds’ annual and semi-annual shareholder reports will no longer be sent by mail, unless you specifically request paper copies of the reports from your financial intermediary (such as a broker-dealer or bank). Instead, the reports will be made available on the Funds’ website (www.alpsfunds. com), and you will be notified by mail each time a report is posted and provided with a website link to access the report.
If you already elected to receive shareholder reports electronically, you will not be affected by this change and you need not take any action. You may elect to receive shareholder reports and other communications from a Fund electronically anytime by contacting your financial intermediary.
You may elect to receive all future reports in paper free of charge. You can contact your financial intermediary to request that you continue to receive paper copies of your shareholder reports. Your election to receive reports in paper will apply to all funds held in your account with your financial intermediary.
alpsfunds.com
RiverFront Dynamic Core Income ETF
| Performance Overview | November 30, 2018 (Unaudited) |
Investment Objective
RiverFront Dynamic Core Income ETF (the “Fund”) seeks total return, with an emphasis on income as the source of that total return. The Fund seeks to achieve its investment objective by investing in a global portfolio of fixed income securities of various maturities, ratings and currency denominations.
Market Outlook
Broadly, we remain constructive on global equity markets. First, valuations remain attractive, in our opinion, particularly after recent downdrafts. Second, although monetary policy remains less accommodative than previous years, we believe a recession is unlikely. Third, economic and earnings growth remain decidedly positive on a trailing basis and positive trajectories should remain intact. Fourth, trade tensions seem to be largely priced into the markets. As such, we remain positive on both domestic and international equity markets moving forward, acknowledging heightened volatility, bouts of negative geopolitical news and elevated shorter maturity interest rates. Finally, we also believe geographic participation will broaden and domestic and international equity markets should repair themselves throughout 2019. While “value” and “quality” factors were not rewarded in 2018, we believe companies with these characteristics should once again return into favor and garner additional support from renewed technical momentum.
2018 Performance Attribution
The Fund underperformed its benchmark for the twelve-month period ended November 30, 2018. The underperformance of the Fund relative to its benchmark was primarily due to the Fund’s overweight exposure to investment grade bonds.
Negative Contributors:
| • | Overweight IG Corporates – During the attribution period, IG credit spreads widened 42 basis points as leverage concerns negatively impacted the corporate bond market. As such, the ICE BAML US Corporate Index was down almost 3% for this time period, posting one of the worst returns for this sector of the fixed income market since the Financial Crisis. |
| • | Underweight UST – The Fund has maintained an underweight to the US Treasury market, with a preference for the income advantage offered through corporate bonds. Furthermore, we held much longer dated securities within our UST allocation, which also underperformed as rates went higher. |
Positive Contributors:
| • | Selection within IG Corporates – The Fund benefited from positive selection within the corporate bond allocation. Specifically, the portfolio targeted the front end of the yield curve for most of its credit exposure, which dampened the volatility of bond prices as corporate spreads widened. |
| • | Allocation to High Yield – The Fund held an allocation to high yield bonds, which outperformed during the attribution period. We believe improving credit metrics and limited issuance/supply were two important factors supporting the high yield sector. |
Performance(as of November 30, 2018)
| | 1 Year | Since Inception^ |
| RiverFront Dynamic Core Income ETF – NAV | -1.74% | -0.18% |
| RiverFront Dynamic Core Income ETF – Market Price* | -1.86% | -0.18% |
| Bloomberg Barclays U.S. Aggregate Bond Index | -1.34% | -0.07% |
Total Expense Ratio (per the current prospectus) 0.52%.
Performance data quoted represents past performance. Past performance does not guarantee future results. The table does not reflect the deduction of taxes that a shareholder would pay on Fund distributions or the redemption of Fund shares. Investment return and principal value of an investment will fluctuate so that an investor’s shares, when sold or redeemed, may be worth more or less than the original cost. Current performance data may be higher or lower than actual data quoted. For the most current month-end performance data please visit www.alpsfunds.com or call 1.866.759.5679.
NAV is an exchange-traded fund’s per-share value. The per-share dollar amount of the fund is derived by dividing the total value of all the securities in its portfolio, less any liabilities, by the number of fund shares outstanding. Market Price is the price at which a share can currently be traded in the market. Information detailing the number of days the Market Price of the Fund was greater than the Fund’s NAV and the number of days it was less than the Fund’s NAV can be obtained at www.alpsfunds.com.
| ^ | The Fund commenced operations on June 14, 2016. |
| * | Market Price is based on the midpoint of the bid-ask spread at 4 p.m. ET and does not represent the returns an investor would receive if shares were traded at other times. |
Bloomberg Barclays U.S. Aggregate Bond Index is a broad-based benchmark that measures the investment grade, U.S. dollar-denominated, fixed-rate taxable bond market, including Treasuries, government-related and corporate securities, MBS (agency fixed-rate and hybrid ARM pass-throughs), ABS, and CMBS (agency and non-agency). The index is reported on a total return basis, which assumes reinvestment of any dividends and distributions realized during a given time period. The index is not actively managed and does not reflect any deductions for fees, expenses or taxes. One cannot invest directly in an index. Index performance does not reflect fund performance.
RiverFront Dynamic Core Income ETF
| Performance Overview | November 30, 2018 (Unaudited) |
The RiverFront Dynamic Core Income ETF is not suitable for all investors. Investments in the Fund are subject to investment risks, including possible loss of the principal amount invested.
The Fund’s shares are not individually redeemable. Investors buy and sell shares of the Fund on a secondary market. Only market makers or “authorized participants” may trade directly with the Fund, typically in blocks of 50,000 shares.
ALPS Portfolio Solutions Distributor, Inc., a FINRA member, is the Distributor for the RiverFront Dynamic Core Income ETF.
RiverFront Dynamic Core Income ETF
| Performance Overview | November 30, 2018 (Unaudited) |
Top 10 Holdings*(as of November 30, 2018)
| United States Treasury Note 3.00%, 10/31/2025 | 3.51% |
| United States Treasury Note 2.88%, 10/31/2023 | 3.49% |
| United States Treasury Strip Principal 0.00%, 08/15/2039 | 2.15% |
| United States Treasury Note 2.88%, 11/15/2021 | 2.10% |
| United States Treasury Strip Principal 0.00%, 02/15/2038 | 1.91% |
| United States Treasury Bond 2.75%, 02/15/2028 | 1.37% |
| United States Treasury Bond 2.75%, 11/15/2047 | 1.19% |
| United States Treasury Bond 3.88%, 08/15/2040 | 1.07% |
| United States Treasury Strip Principal 0.00%, 05/15/2048 | 1.05% |
| United States Treasury Strip Principal 0.00%, 11/15/2046 | 0.83% |
| Total% of Top 10 Holdings | 18.67% |
Future holdings are subject to change.
Asset Allocation*(as of November 30, 2018)

Growth of $10,000(as of November 30, 2018)
Comparison of Change in Value of $10,000 Investment in the Fund and the Fund’s benchmark
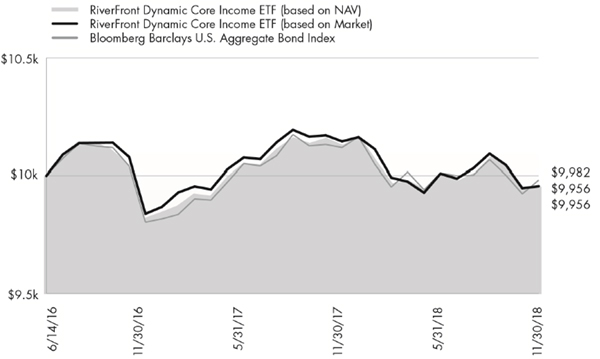
The chart above represents historical performance of a hypothetical investment of $10,000 in the Fund over the life of the Fund. Past performance does not guarantee future results. This chart does not reflect the deduction of taxes that a shareholder would pay on Fund distributions or the redemption of Fund shares.
RiverFront Dynamic Unconstrained Income ETF
| Performance Overview | November 30, 2018 (Unaudited) |
Investment Objective
RiverFront Dynamic Unconstrained Income ETF (the “Fund”) seeks total return, with an emphasis on income as the source of that total return. The Fund seeks to achieve its investment objective by investing in a global portfolio of fixed income securities of various maturities, ratings and currency denominations.
Market Outlook
Broadly, we remain constructive on global equity markets. First, valuations remain attractive, in our opinion, particularly after recent downdrafts. Second, although monetary policy remains less accommodative than previous years, we believe a recession is unlikely. Third, economic and earnings growth remain decidedly positive on a trailing basis and positive trajectories should remain intact. Fourth, trade tensions seem to be largely priced into the markets. As such, we remain positive on both domestic and international equity markets moving forward, acknowledging heightened volatility, bouts of negative geopolitical news and elevated shorter maturity interest rates. Finally, we also believe geographic participation will broaden and domestic and international equity markets should repair themselves throughout 2019. While “value” and “quality” factors were not rewarded in 2018, we believe companies with these characteristics should once again return into favor and garner additional support from renewed technical momentum.
2018 Performance Attribution
RFUN underperformed its benchmark over the twelve-month ended November 30, 2018, based upon its return at NAV. The underperformance of the Fund was primarily due to its higher credit quality. The Fund was overweight higher quality (BB-rated) bonds early in the year, when lower quality bonds (B-rated and CCC-rated) outperformed significantly. We believe that this higher quality strategy will outperform over a full credit cycle however, due to the lower historical defaults on higher quality bonds.
Negative Contributors:
| • | Quality Bias: The 12-month returns for the different rating categories within the high yield universe, based upon ICE BofAML High Yield Indices, were as follows: BB-rated (1.02%), B-rated 1.31%, CCC-rated 1.2%. |
| • | Overweight to Energy Sector |
Positive Contributor:
| • | Security Selection Within the Energy Sector: Security selection helped to offset some of the negative impact of being overweight the sector. |
2019 Outlook
We believe the US fixed income market is likely to face continued headwinds over the coming year including decelerating global growth, global trade tensions, heightened geopolitical risk and uncertainty surround future Federal Reserve policy moves. These factors are likely to contribute to a heightened level of volatility in the financial markets over the coming year. Interest rates rose sharply over the past 12 months and the yield curve flattened significantly, as shorter-term rates rose more than longer-term rates. We think rates may move modestly higher during the next 12 months, reversing the sharp drop in rates during November 2018. We believe that the Federal Reserve is likely to hike rates another 25 bps at their 12/19/18 meeting to 2.25-2.5% and a couple more times during 2019.
Performance(as of November 30, 2018)
| | 1 Year | Since Inception^ |
| RiverFront Dynamic Unconstrained Income ETF – NAV | -1.52% | 4.10% |
| RiverFront Dynamic Unconstrained Income ETF – Market Price* | -2.11% | 3.93% |
| ICE BofAML U.S. High Yield Master II TR Index | 0.22% | 6.16% |
Total Expense Ratio (per the current prospectus) 0.52%.
Performance data quoted represents past performance. Past performance does not guarantee future results. The table does not reflect the deduction of taxes that a shareholder would pay on Fund distributions or the redemption of Fund shares. Investment return and principal value of an investment will fluctuate so that an investor’s shares, when sold or redeemed, may be worth more or less than the original cost. Current performance data may be higher or lower than actual data quoted. For the most current month-end performance data please visit www.alpsfunds.com or call 1.866.759.5679.
NAV is an exchange-traded fund’s per-share value. The per-share dollar amount of the fund is derived by dividing the total value of all the securities in its portfolio, less any liabilities, by the number of fund shares outstanding. Market Price is the price at which a share can currently be traded in the market. Information detailing the number of days the Market Price of the Fund was greater than the Fund’s NAV and the number of days it was less than the Fund’s NAV can be obtained at www.alpsfunds.com.
| ^ | The Fund commenced operations on June 14, 2016. |
RiverFront Dynamic Unconstrained Income ETF
| Performance Overview | November 30, 2018 (Unaudited) |
| * | Market Price is based on the midpoint of the bid-ask spread at 4 p.m. ET and does not represent the returns an investor would receive if shares were traded at other times. |
ICE BofAML U.S. High Yield Master II TR Index tracks the performance of below-investment grade U.S. dollar-denominated corporate bonds issued in the U.S. Domestic market. The index is reported on a total return basis, which assumes reinvestment of any dividends and distributions realized during a given time period. The index is not actively managed and does not reflect any deductions for fees, expenses or taxes. One cannot invest directly in an index. Index performance does not reflect fund performance.
The RiverFront Dynamic Unconstrained Income ETF is not suitable for all investors. Investments in the Fund are subject to investment risks, including possible loss of the principal amount invested.
The Fund’s shares are not individually redeemable. Investors buy and sell shares of the Fund on a secondary market. Only market makers or “authorized participants” may trade directly with the Fund, typically in blocks of 50,000 shares.
ALPS Portfolio Solutions Distributor, Inc., a FINRA member, is the Distributor for the RiverFront Dynamic Unconstrained Income ETF.
RiverFront Dynamic Unconstrained Income ETF
| Performance Overview | November 30, 2018 (Unaudited) |
Top 10 Holdings*^(as of November 30, 2018)
| CSC Holdings LLC | 1.24% |
| Altice Financing SA | 1.23% |
| Kinetic Concepts, Inc. / KCI USA, Inc. | 1.09% |
| Vistra Energy Corp. | 1.08% |
| T-Mobile USA, Inc. | 1.07% |
| CenturyLink, Inc. | 1.06% |
| CIT Group, Inc. | 0.98% |
| HCA, Inc. | 0.97% |
| Cablevision Systems Corp. | 0.94% |
| CSC Holdings LLC | 0.90% |
| Total % of Top 10 Holdings | 10.56% |
Asset Allocation*(as of November 30, 2018)
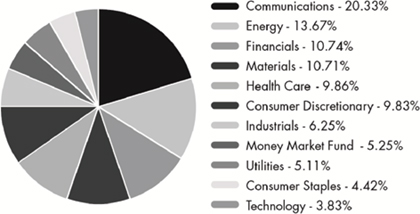
| ^ | Excludes Money Market Fund |
Future holdings are subject to change.
Growth of $10,000(as of November 30, 2018)
Comparison of Change in Value of $10,000 Investment in the Fund and the Fund’s benchmark

The chart above represents historical performance of a hypothetical investment of $10,000 in the Fund over the life of the Fund. Past performance does not guarantee future results. This chart does not reflect the deduction of taxes that a shareholder would pay on Fund distributions or the redemption of Fund shares.
RiverFront Dynamic US Dividend Advantage ETF
| Performance Overview | November 30, 2018 (Unaudited) |
Investment Objective
RiverFront Dynamic US Dividend Advantage ETF (the “Fund”) seeks to provide capital appreciation and dividend income. The Fund seeks to achieve its investment objective by investing at least 65% of its net assets in a portfolio of equity securities of publicly traded U.S. companies with the potential for dividend growth. Equity securities include common stocks and common or preferred shares of real estate investment trusts (“REITs”).
Market Outlook
Broadly, we remain constructive on global equity markets. First, valuations remain attractive, in our opinion, particularly after recent downdrafts. Second, although monetary policy remains less accommodative than previous years, we believe a recession is unlikely. Third, economic and earnings growth remain decidedly positive on a trailing basis and positive trajectories should remain intact. Fourth, trade tensions seem to be largely priced into the markets. As such, we remain positive on both domestic and international equity markets moving forward, acknowledging heightened volatility, bouts of negative geopolitical news and elevated shorter maturity interest rates. Finally, we also believe geographic participation will broaden and domestic and international equity markets should repair themselves throughout 2019. While “value” and “quality” factors were not rewarded in 2018, we believe companies with these characteristics should once again return into favor and garner additional support from renewed technical momentum.
2018 Performance Attribution
Broadly, the Fund underperformed its benchmark in the twelve-month period ended November 30, 2018 due to allocation and selection decisions.
| 1. | Sector Allocation: The sector allocations in the Fund are determined through a bottoms-up process that ranks stocks on three fundamental cornerstones: value, quality and momentum/sentiment. If a sector produces more highly ranked stocks relative to another sector, that sector’s allocation is allowed to exceed its benchmark by a tolerable level, and vice versa. Sector allocation was a negative contributor for the Fund in FY 2018. |
| a. | Positive contributors: The underweights to industrials and non-energy materials and our overweight to utilities were positive contributors. |
| b. | Negative contributors: The portfolio’s underweight to healthcare and frictional cash and over-weighted exposure to finance and telecommunications negatively impacted portfolio returns. |
| 2. | Security Selection: The investment selection process behind the Fund is built on making a number of security selection choices. This means that there are rarely just one or two things contributing to the returns in the Fund. In the twelve-month period ended November 30, 2018, our equity selection posted negative results in aggregate. A few of the top themes that contributed most to performance in the year were: |
| a. | Positive contributors: Security selection in consumer non-cyclicals, industrials, consumer services, utilities and energy were additive. |
| b. | Negative contributors: Security selection in technology, consumer cyclicals, finance, healthcare and business services detracted from returns. |
Performance(as of November 30, 2018)
| | 1 Year | Since Inception^ |
| RiverFront Dynamic US Dividend Advantage ETF – NAV | 1.45% | 11.26% |
| RiverFront Dynamic US Dividend Advantage ETF – Market Price* | 1.39% | 11.21% |
| S&P 500® Total Return Index | 6.27% | 13.69% |
Total Expense Ratio (per the current prospectus) 0.52%.
Performance data quoted represents past performance. Past performance does not guarantee future results. The table does not reflect the deduction of taxes that a shareholder would pay on Fund distributions or the redemption of Fund shares. Investment return and principal value of an investment will fluctuate so that an investor’s shares, when sold or redeemed, may be worth more or less than the original cost. Current performance data may be higher or lower than actual data quoted. For the most current month-end performance data please visit www.alpsfunds.com or call 1.866.759.5679.
NAV is an exchange-traded fund’s per-share value. The per-share dollar amount of the fund is derived by dividing the total value of all the securities in its portfolio, less any liabilities, by the number of fund shares outstanding. Market Price is the price at which a share can currently be traded in the market. Information detailing the number of days the Market Price of the Fund was greater than the Fund’s NAV and the number of days it was less than the Fund’s NAV can be obtained at www.alpsfunds.com.
| ^ | The Fund commenced operations on June 7, 2016. |
RiverFront Dynamic US Dividend Advantage ETF
| Performance Overview | November 30, 2018 (Unaudited) |
| * | Market Price is based on the midpoint of the bid-ask spread at 4 p.m. ET and does not represent the returns an investor would receive if shares were traded at other times. |
S&P 500® Total Return Indexis the Standard & Poor’s composite index of 500 stocks, a widely recognized, unmanaged index of common stock prices. The index is reported on a total return basis, which assumes reinvestment of any dividends and distributions realized during a given time period. The index is not actively managed and does not reflect any deductions for fees, expenses or taxes. One cannot invest directly in an index. Index performance does not reflect fund performance.
The RiverFront Dynamic US Dividend Advantage ETF is not suitable for all investors. Investments in the Fund are subject to investment risks, including possible loss of the principal amount invested.
The Fund’s shares are not individually redeemable. Investors buy and sell shares of the Fund on a secondary market. Only market makers or “authorized participants” may trade directly with the Fund, typically in blocks of 50,000 shares.
ALPS Portfolio Solutions Distributor, Inc., a FINRA member, is the Distributor for the RiverFront Dynamic US Dividend Advantage ETF.
RiverFront Dynamic US Dividend Advantage ETF
| Performance Overview | November 30, 2018 (Unaudited) |
Top 10 Holdings*(as of November 30, 2018)
| Amazon.com, Inc. | 3.73% |
| Apple, Inc. | 3.05% |
| Eli Lilly & Co. | 1.79% |
| JPMorgan Chase & Co. | 1.72% |
| Amgen, Inc. | 1.71% |
| Netflix, Inc. | 1.66% |
| Texas Instruments, Inc. | 1.49% |
| TripAdvisor, Inc. | 1.42% |
| AbbVie, Inc. | 1.29% |
| Accenture PLC, Class A | 1.26% |
| Total % of Top 10 Holdings | 19.12% |
Asset Allocation*(as of November 30, 2018)
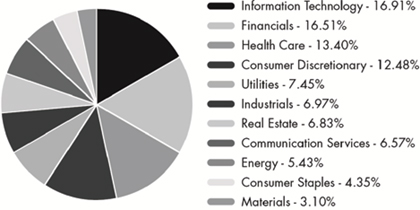
Future holdings are subject to change
Growth of $10,000(as of November 30, 2018)
Comparison of Change in Value of $10,000 Investment in the Fund and the Fund’s benchmark

The chart above represents historical performance of a hypothetical investment of $10,000 in the Fund over the life of the Fund. Past performance does not guarantee future results. This chart does not reflect the deduction of taxes that a shareholder would pay on Fund distributions or the redemption of Fund shares.
RiverFront Dynamic US Flex-Cap ETF
| Performance Overview | November 30, 2018 (Unaudited) |
Investment Objective
RiverFront Dynamic US Flex-Cap ETF (the “Fund”) seeks to provide capital appreciation. The Fund seeks to achieve its investment objective by investing at least 65% of its net assets in a portfolio of equity securities of publicly traded U.S. companies. Equity securities include common stocks and common or preferred shares of real estate investment trusts (“REITs”).
Market Outlook
Broadly, we remain constructive on global equity markets. First, valuations remain attractive, in our opinion, particularly after recent downdrafts. Second, although monetary policy remains less accommodative than previous years, we believe a recession is unlikely. Third, economic and earnings growth remain decidedly positive on a trailing basis and positive trajectories should remain intact. Fourth, trade tensions seem to be largely priced into the markets. As such, we remain positive on both domestic and international equity markets moving forward, acknowledging heightened volatility, bouts of negative geopolitical news and elevated shorter maturity interest rates. Finally, we also believe geographic participation will broaden and domestic and international equity markets should repair themselves throughout 2019. While “value” and “quality” factors were not rewarded in 2018, we believe companies with these characteristics should once again return into favor and garner additional support from renewed technical momentum.
2018 Performance Attribution
Broadly, the Fund underperformed its benchmark in the twelve-month period ended November 30, 2018 due to both allocation and selection decisions.
| 1. | Sector Allocation: The sector allocations in the Fund are determined through a bottoms-up process that ranks stocks on three fundamental cornerstones: value, quality and momentum/sentiment. If a sector produces more highly ranked stocks relative to another sector, that sector’s allocation is allowed to exceed its benchmark by a tolerable level, and vice versa. Sector allocation was a negative contributor for the Fund in the twelve-month period ended November 30, 2018. |
| a. | Positive contributors: The over-weight to technology, developed international healthcare and underweight to telecommunications were positive contributors. |
| b. | Negative contributors: The portfolio’s over-weights to consumer cyclicals, industrials, and non-energy materials and under-weight to finance and healthcare, as well as cash positions, negatively impacted portfolio returns. |
| 2. | Security Selection: The investment selection process behind the Fund is built on making a number of security selection choices. This means that there are rarely just one or two things contributing to the returns in the Fund. In the twelve-month period ended November 30, 2018, our equity selection posted negative results in aggregate. A few of the top themes that contributed most to performance in the year were: |
| a. | Positive contributors: Security selection in industrials, healthcare, consumer non-cyclicals, telecommunications and developed international energy were net positives. |
| b. | Negative contributors: Security selection in energy, finance, consumer cyclicals, non-energy materials and utilities were detractors. |
Performance(as of November 30, 2018)
| | 1 Year | Since Inception^ |
| RiverFront Dynamic US Flex-Cap ETF – NAV | 2.16% | 12.50% |
| RiverFront Dynamic US Flex-Cap ETF – Market Price* | 2.16% | 12.51% |
| S&P Composite 1500® Index | 5.79% | 13.52% |
Total Expense Ratio (per the current prospectus) 0.52%.
Performance data quoted represents past performance. Past performance does not guarantee future results. The table does not reflect the deduction of taxes that a shareholder would pay on Fund distributions or the redemption of Fund shares. Investment return and principal value of an investment will fluctuate so that an investor’s shares, when sold or redeemed, may be worth more or less than the original cost. Current performance data may be higher or lower than actual data quoted. For the most current month-end performance data please visit www.alpsfunds.com or call 1.866.759.5679.
NAV is an exchange-traded fund’s per-share value. The per-share dollar amount of the fund is derived by dividing the total value of all the securities in its portfolio, less any liabilities, by the number of fund shares outstanding. Market Price is the price at which a share can currently be traded in the market. Information detailing the number of days the Market Price of the Fund was greater than the Fund’s NAV and the number of days it was less than the Fund’s NAV can be obtained at www.alpsfunds.com.
| ^ | The Fund commenced operations on June 7, 2016. |
RiverFront Dynamic US Flex-Cap ETF
| Performance Overview | November 30, 2018 (Unaudited) |
| * | Market Price is based on the midpoint of the bid-ask spread at 4 p.m. ET and does not represent the returns an investor would receive if shares were traded at other times. |
S&P Composite 1500® Index is the Standard & Poor’s broad-based unmanaged capitalization-weighted index comprising 1,500 stocks of Large-cap, Mid-cap, and Small-cap U.S. companies. The index is reported on a total return basis, which assumes reinvestment of any dividends and distributions realized during a given time period. The index is not actively managed and does not reflect any deductions for fees, expenses or taxes. One cannot invest directly in an index. Index performance does not reflect fund performance.
The RiverFront Dynamic US Flex-Cap ETF is not suitable for all investors. Investments in the Fund are subject to investment risks, including possible loss of the principal amount invested.
The Fund’s shares are not individually redeemable. Investors buy and sell shares of the Fund on a secondary market. Only market makers or “authorized participants” may trade directly with the Fund, typically in blocks of 50,000 shares.
ALPS Portfolio Solutions Distributor, Inc., a FINRA member, is the Distributor for the RiverFront Dynamic US Flex-Cap ETF.
RiverFront Dynamic US Flex-Cap ETF
| Performance Overview | November 30, 2018 (Unaudited) |
Top 10 Holdings*(as of November 30, 2018)
| Alphabet, Inc., Class C | 3.69% |
| Amazon.com, Inc. | 3.08% |
| Apple, Inc. | 2.75% |
| Microsoft Corp. | 2.41% |
| Johnson & Johnson | 2.09% |
| JPMorgan Chase & Co. | 1.99% |
| Exxon Mobil Corp. | 1.82% |
| Facebook, Inc., Class A | 1.79% |
| UnitedHealth Group, Inc. | 1.68% |
| Procter & Gamble Co. | 1.59% |
| Total % of Top 10 Holdings | 22.89% |
Asset Allocation*(as of November 30, 2018)
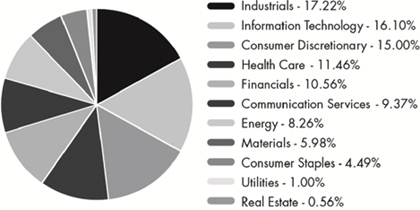
Future holdings are subject to change.
Growth of $10,000(as of November 30, 2018)
Comparison of Change in Value of $10,000 Investment in the Fund and the Fund’s benchmark
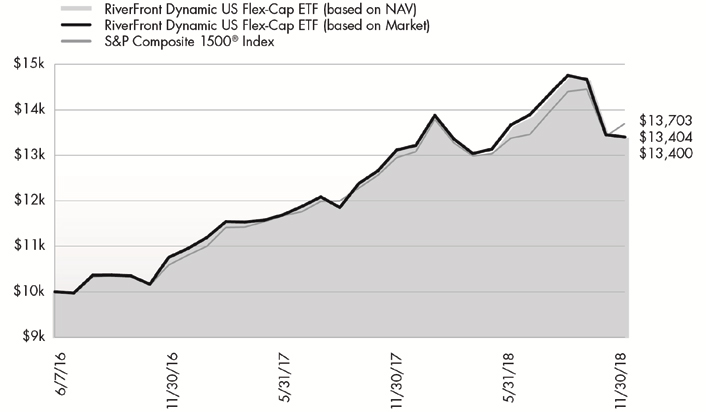
The chart above represents historical performance of a hypothetical investment of $10,000 in the Fund over the life of the Fund. Past performance does not guarantee future results. This chart does not reflect the deduction of taxes that a shareholder would pay on Fund distributions or the redemption of Fund shares.
RiverFront Strategic Income Fund
| Performance Overview | November 30, 2018 (Unaudited) |
Investment Objective
The RiverFront Strategic Income Fund (the “Fund”) seeks total return, with an emphasis on income as the source of that total return. The Fund seeks to achieve its investment objective by investing in a global portfolio of fixed income securities of various maturities, ratings and currency denominations. The Fund intends to utilize various investment strategies in a broad array of fixed income sectors.
Market Outlook
Broadly, we remain constructive on global equity markets. First, valuations remain attractive, in our opinion, particularly after recent downdrafts. Second, although monetary policy remains less accommodative than previous years, we believe a recession is unlikely. Third, economic and earnings growth remain decidedly positive on a trailing basis and positive trajectories should remain intact. Fourth, trade tensions seem to be largely priced into the markets. As such, we remain positive on both domestic and international equity markets moving forward, acknowledging heightened volatility, bouts of negative geopolitical news and elevated shorter maturity interest rates. Finally, we also believe geographic participation will broaden and domestic and international equity markets should repair themselves throughout 2019. While “value” and “quality” factors were not rewarded in 2018, we believe companies with these characteristics should once again return into favor and garner additional support from renewed technical momentum.
2018 Performance Attribution
The Fund outperformed its benchmark for the twelve-month period ended November 30, 2018. The outperformance of the Fund relative to its benchmark was primarily due to its shorter duration and sector allocation. The duration structure in the Fund is determined by RiverFront’s expectations for changes in interest rates and the yield curve. Sector allocations in the Fund are determined through a relative value framework that allocates to sectors of the bond market that offer the best income opportunities on and favorable risk/reward profiles.
Negative Contributors:
| ● | Quality Bias in High Yield Security Selection: The 12-month returns for the different rating categories within the high yield universe, based upon ICE BofAML High Yield Indices, were as follows: BB-rated (1.02%), B-rated 1.31%, CCC-rated 1.2%. |
Positive Contributors:
| ● | Shorter than Benchmark Duration: Throughout the course of the 12-month period, the Fund maintained a shorter duration than its benchmark and was primarily invested in bonds with maturities of less than 5 years. The shorter duration was advantageous as interest rates rose significantly. |
| ● | Sector Allocation: Throughout the course of the 12-month period, the Fund was primarily invested in shorter maturity, higher quality, non-investment grade bonds. This sector of the bond market provided a meaningful yield advantage versus the benchmark, despite having shorter average maturities, and was able to provide positive returns despite rising interest rates and widening credit spreads. |
Performance(as of November 30, 2018)
| | 1 Year | 3 Year | 5 Year | Since Inception^ |
| RiverFront Strategic Income Fund – NAV | 0.57% | 4.38% | 3.56% | 3.87% |
| RiverFront Strategic Income Fund – Market Price* | 0.33% | 4.32% | 3.43% | 3.85% |
| Bloomberg Barclays U.S. Aggregate Bond Index | -1.34% | 1.33% | 2.03% | 2.06% |
Total Expense Ratio (per the current prospectus) 0.47%. The Fund's management fee consists of a fee of 0.11% paid to the Fund's investment adviser and a fee of 0.35% paid to the Fund's sub-adviser. Prior to November 1, 2018, the Fund's management fee consisted of a fee of 0.16% paid to the Fund's investment adviser and a fee of 0.30% paid to the Fund's sub-adviser. Prior to November 1, 2018, the Fund's sub-adviser agreed to waive all of its 0.30% annual sub-advisory fee on a voluntary basis.
Performance data quoted represents past performance. Past performance does not guarantee future results. The table does not reflect the deduction of taxes that a shareholder would pay on Fund distributions or the redemption of Fund shares. Investment return and principal value of an investment will fluctuate so that an investor’s shares, when sold or redeemed, may be worth more or less than the original cost. Current performance data may be higher or lower than actual data quoted. For most current month-end performance data please visit www.alpsfunds.com or call 1.866.759.5679.
NAV is an exchange-traded fund’s per-share value. The per-share dollar amount of the Fund is derived by dividing the total value of all the securities in its portfolio, less any liabilities, by the number of Fund shares outstanding. Market Price is the price at which a share can currently be traded in the market. Information detailing the number of days the Market Price of the Fund was greater than the Fund’s NAV and the number of days it was less than the Fund’s NAV can be obtained at www.alpsfunds.com.
| ^ | The Fund commenced Investment Operations on October 8, 2013. |
| * | Market Price is based on the midpoint of the bid/ask spread at 4 p.m. ET and does not represent the returns an investor would receive if shares were traded at other times |
RiverFront Strategic Income Fund
| Performance Overview | November 30, 2018 (Unaudited) |
Duration is a measure of the sensitivity of the price (the value of principal) of a fixed-income investment to a change in interest rates. Duration is expressed as a number of years. The duration number is a calculation involving present value, yield, coupon, final maturity and call features. The bigger the duration number, the greater the interest-rate risk or reward for bond prices. Rising interest rates mean falling bond prices, while declining interest rates mean rising bond prices.
Bloomberg Barclays U.S. Aggregate Bond Indexis a broad-based benchmark that measures the investment grade, U.S. dollar-denominated, fixed-rate taxable bond market, including Treasuries, government-related and corporate securities, MBS (agency fixed-rate and hybrid ARM pass-throughs), ABS, and CMBS (agency and non-agency). The index is reported on a total return basis, which assumes reinvestment of any dividends and distributions realized during a given time period. The index is not actively managed and does not reflect any deductions for fees, expenses or taxes. One cannot invest directly in an index. Index performance does not reflect fund performance.
The RiverFront Strategic Income Fund is not suitable for all investors. Investments in the Fund are subject to investment risks, including possible loss of the principal amount invested.
ALPS Portfolio Solutions Distributor, Inc., a FINRA member, is the distributor for the RiverFront Strategic Income Fund.
RiverFront Strategic Income Fund
| Performance Overview | November 30, 2018 (Unaudited) |
Top 10 Holdings*^(as of November 30, 2018)
| Sprint Communications, Inc. | 1.50% |
| DISH DBS Corp. | 1.42% |
| Cablevision Systems Corp. | 1.42% |
| HCA, Inc. | 1.41% |
| DPL, Inc. | 1.41% |
| CIT Group, Inc. | 1.39% |
| Navient Corp. | 1.36% |
| DCP Midstream Operating LP | 1.34% |
| Celanese US Holdings LLC | 1.33% |
| CenturyLink, Inc. | 1.32% |
| Total % of Top 10 Holdings | 13.90% |
| ^ | Excludes Money Market Fund |
Future holdings are subject to change.
Asset Allocation*(as of November 30, 2018)
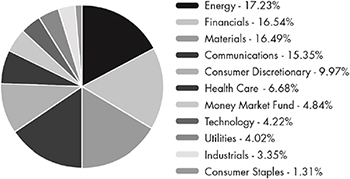
Growth of $10,000(as of November 30, 2018)
Comparison of Change in Value of $10,000 Investment in the Fund and the Fund’s benchmark
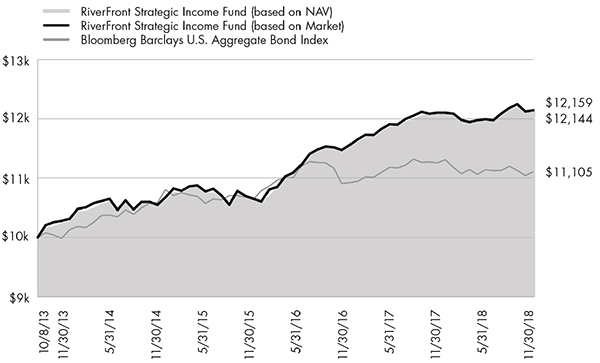
The chart above represents historical performance of a hypothetical investment of $10,000 in the Fund over the life of the Fund. Past performance does not guarantee future results. This chart does not reflect the deduction of taxes that a shareholder would pay on Fund distributions or the redemption of Fund shares.
RiverFront ETFs
| Disclosure of Fund Expenses | November 30, 2018 (Unaudited) |
Shareholder Expense Example: As a shareholder of a Fund, you incur two types of costs: (1) transaction costs which may include creation and redemption fees or brokerage charges, and (2) ongoing costs, including management fees and other Fund expenses. These examples are intended to help you understand your ongoing costs (in dollars) of investing in a Fund and to compare these costs with the ongoing costs of investing in other funds. It is based on an investment of $1,000 invested at the beginning of the (six month) period and held through November 30, 2018.
Actual Return: The first line of the table provides information about actual account values and actual expenses. You may use the information in this line, together with the amount you invested, to estimate the expenses that you incurred over the period. Simply divide your account value by $1,000 (for example, an $8,600 account value divided by $1,000 = 8.6), then multiply the result by the number in the first line under the heading entitled “Expenses Paid During Period” to estimate the expenses attributable to your investment during this period.
Hypothetical 5% Return: The second line of the table provides information about hypothetical account values and hypothetical expenses based on the Fund’s actual expense ratio and an assumed rate of return of 5% per year before expenses, which is not the Fund’s actual return. The hypothetical account values and expenses may not be used to estimate the actual ending account balance or expenses you paid for the period. You may use this information to compare ongoing costs of investing in the Fund and other funds. To do so, compare this 5% hypothetical example with the 5% hypothetical examples that appear in the shareholder reports of other funds.
The expenses shown in the table are meant to highlight ongoing Fund costs only and do not reflect any transaction costs, such as creation and redemption fees or brokerage charges. Therefore, the second line is useful in comparing ongoing costs only, and will not help you determine the relative total costs of owning different funds. In addition, if these costs were included, your costs would have been higher.
| | Beginning Account Value 6/1/18 | Ending Account Value 11/30/18 | Expense
Ratio(a) | Expenses Paid
During Period
6/1/18 - 11/30/18(b) |
| RiverFront Dynamic Core Income ETF | | | | |
| Actual | $1,000.00 | $995.10 | 0.51% | $2.55 |
| Hypothetical (5% return before expenses) | $1,000.00 | $1,022.51 | 0.51% | $2.59 |
| RiverFront Dynamic Unconstrained Income ETF | | | | |
| Actual | $1,000.00 | $1,002.50 | 0.51% | $2.56 |
| Hypothetical (5% return before expenses) | $1,000.00 | $1,022.51 | 0.51% | $2.59 |
| RiverFront Dynamic US Dividend Advantage ETF | | | | |
| Actual | $1,000.00 | $982.20 | 0.52% | $2.58 |
| Hypothetical (5% return before expenses) | $1,000.00 | $1,022.46 | 0.52% | $2.64 |
| RiverFront Dynamic US Flex-Cap ETF | | | | |
| Actual | $1,000.00 | $981.30 | 0.52% | $2.58 |
| Hypothetical (5% return before expenses) | $1,000.00 | $1,022.46 | 0.52% | $2.64 |
| RiverFront Strategic Income Fund | | | | |
| Actual | $1,000.00 | $1,011.80 | 0.19% | $0.96 |
| Hypothetical (5% return before expenses) | $1,000.00 | $1,024.12 | 0.19% | $0.96 |
| (a) | Annualized, based on the Fund's most recent fiscal half year expenses. |
| (b) | Expenses are equal to the Fund's annualized expense ratio multiplied by the average account value over the period, multiplied by the number of days in the most recent fiscal half year (183), divided by 365. |
RiverFront ETFs
Report of Independent Registered Public Accounting Firm
To the shareholders and the Board of Trustees of ALPS ETF Trust:
Opinion on the Financial Statements and Financial Highlights
We have audited the accompanying statements of assets and liabilities, including the schedules of investments, of RiverFront Dynamic Core Income ETF, RiverFront Dynamic Unconstrained Income ETF, RiverFront Dynamic US Dividend Advantage ETF, RiverFront Dynamic US Flex-Cap ETF and RiverFront Strategic Income Fund (the “Funds”), five of the funds constituting the ALPS ETF Trust, as of November 30, 2018; the related statement of operations for the year then ended, the statements of changes in net assets for each of the two years in the period then ended, and the financial highlights for each of the five years in the period then ended for RiverFront Strategic Income Fund; the related statements of operations, changes in net assets, and the financial highlights for the periods indicated in the table below for RiverFront Dynamic Core Income ETF, RiverFront Dynamic Unconstrained Income ETF, RiverFront Dynamic US Dividend Advantage ETF and RiverFront Dynamic US Flex-Cap ETF; and the related notes. In our opinion, the financial statements and financial highlights present fairly, in all material respects, the financial position of each of the five funds listed above constituting ALPS ETF Trust as of November 30, 2018, and the results of their operations for the year then ended, the changes in their net assets for each of the two years in the period then ended, and the financial highlights for each of the five years in the period then ended (or for the period listed in the table below), in conformity with accounting principles generally accepted in the United States of America.
| Individual Fund Comprising the ALPS ETF Trust | Statements of Operation | Statements of Changes
in Net Assets | Financial Highlights |
RiverFront Dynamic Core Income ETF RiverFront Dynamic Unconstrained Income ETF | For the year ended November 30, 2018 | For the years ended November 30, 2018 and 2017 | For the years ended November 30, 2018, 2017, and for the period June 14, 2016 (commencement of operations) to November 30, 2016 |
RiverFront Dynamic US Dividend Advantage ETF RiverFront Dynamic US Flex-Cap ETF | For the year ended November 30, 2018 | For the years ended November 30, 2018 and 2017 | For the years ended November 30, 2018, 2017 and for the period June 7, 2016 (commencement of operations) to November 30, 2016 |
Basis for Opinion
These financial statements and financial highlights are the responsibility of the Funds’ management. Our responsibility is to express an opinion on the Funds’ financial statements and financial highlights based on our audits. We are a public accounting firm registered with the Public Company Accounting Oversight Board (United States) (PCAOB) and are required to be independent with respect to the Funds in accordance with the U.S. federal securities laws and the applicable rules and regulations of the Securities and Exchange Commission and the PCAOB.
We conducted our audits in accordance with the standards of the PCAOB. Those standards require that we plan and perform the audit to obtain reasonable assurance about whether the financial statements and financial highlights are free of material misstatement, whether due to error or fraud. The Funds are not required to have, nor were we engaged to perform, an audit of their internal control over financial reporting. As part of our audits we are required to obtain an understanding of internal control over financial reporting but not for the purpose of expressing an opinion on the effectiveness of the Funds’ internal control over financial reporting. Accordingly, we express no such opinion.
Our audits included performing procedures to assess the risks of material misstatement of the financial statements and financial highlights, whether due to error or fraud, and performing procedures that respond to those risks. Such procedures included examining, on a test basis, evidence regarding the amounts and disclosures in the financial statements and financial highlights. Our audits also included evaluating the accounting principles used and significant estimates made by management, as well as evaluating the overall presentation of the financial statements and financial highlights. Our procedures included confirmation of securities owned as of November 30, 2018, by correspondence with the custodian and brokers; when replies were not received from brokers, we performed other auditing procedures. We believe that our audits provide a reasonable basis for our opinion.
DELOITTE & TOUCHE LLP
Denver, Colorado
January 24, 2019
We have served as the auditor of one or more investment companies advised by ALPS Advisors, Inc. since 2007.
RiverFront Dynamic Core Income ETF
| Schedule of Investments | November 30, 2018 |
| Security Description | | Principal Amount | | | Value | |
| CORPORATE BONDS (76.24%) | | | | | | | | |
| Communications (5.10%) | | | | | | | | |
| 21st Century Fox America, Inc. | | | | | | | | |
| 3.00%, 09/15/2022 | | $ | 200,000 | | | $ | 195,513 | |
| Alphabet, Inc. | | | | | | | | |
| 2.00%, 08/15/2026 | | | 345,000 | | | | 308,650 | |
| AT&T, Inc. | | | | | | | | |
| 3.40%, 05/15/2025 | | | 200,000 | | | | 186,361 | |
| 4.10%, 02/15/2028 | | | 800,000 | | | | 754,734 | |
| CBS Corp. | | | | | | | | |
| 2.50%, 02/15/2023 | | | 150,000 | | | | 140,936 | |
| 3.50%, 01/15/2025 | | | 539,000 | | | | 510,448 | |
| 3.70%, 06/01/2028(a) | | | 54,000 | | | | 49,520 | |
| Charter Communications Operating LLC / Charter Communications Operating Capital | | | | | | | | |
| 3.58%, 07/23/2020 | | | 400,000 | | | | 398,329 | |
| Comcast Corp. | | | | | | | | |
| 5.15%, 03/01/2020 | | | 400,000 | | | | 408,975 | |
| 3.60%, 03/01/2024 | | | 106,000 | | | | 105,364 | |
| 3.55%, 05/01/2028 | | | 300,000 | | | | 283,884 | |
| 4.15%, 10/15/2028 | | | 200,000 | | | | 198,451 | |
| Discovery Communications LLC | | | | | | | | |
| 2.95%, 03/20/2023 | | | 200,000 | | | | 190,122 | |
| 3.95%, 03/20/2028 | | | 200,000 | | | | 186,272 | |
| Lamar Media Corp. | | | | | | | | |
| 5.00%, 05/01/2023 | | | 400,000 | | | | 401,000 | |
| 5.38%, 01/15/2024 | | | 200,000 | | | | 202,500 | |
| Level 3 Financing, Inc. | | | | | | | | |
| 5.13%, 05/01/2023 | | | 90,000 | | | | 89,325 | |
| 5.38%, 01/15/2024 | | | 75,000 | | | | 73,799 | |
| Time Warner Cable LLC | | | | | | | | |
| 5.00%, 02/01/2020 | | | 390,000 | | | | 395,145 | |
| 4.00%, 09/01/2021 | | | 125,000 | | | | 124,737 | |
| T-Mobile USA, Inc. | | | | | | | | |
| 4.00%, 04/15/2022 | | | 300,000 | | | | 295,875 | |
| VeriSign, Inc. | | | | | | | | |
| 4.63%, 05/01/2023 | | | 300,000 | | | | 300,750 | |
| Verizon Communications, Inc. | | | | | | | | |
| 3.38%, 02/15/2025 | | | 200,000 | | | | 192,779 | |
| 3M US L + 1.10%, | | | | | | | | |
| 05/15/2025(b) | | | 175,000 | | | | 173,636 | |
| 4.33%, 09/21/2028 | | | 800,000 | | | | 794,382 | |
| Virgin Media Secured Finance PLC | | | | | | | | |
| 5.25%, 01/15/2021 | | | 350,000 | | | | 355,250 | |
| Walt Disney Co. | | | | | | | | |
| 2.45%, 03/04/2022 | | | 100,000 | | | | 96,831 | |
| 3.15%, 09/17/2025 | | | 67,000 | | | | 64,265 | |
| Warner Media LLC | | | | | | | | |
| 4.75%, 03/29/2021 | | | 200,000 | | | | 204,854 | |
| Total Communications | | | | | | | 7,682,687 | |
| | | | | | | | | |
| Consumer Discretionary (6.58%) | | | | | | | | |
| ADT Security Corp. | | | | | | | | |
| 4.13%, 06/15/2023 | | | 125,000 | | | | 116,875 | |
| Security Description | | Principal Amount | | | Value | |
| Consumer Discretionary (continued) | | | | | | | | |
| Alibaba Group Holding, Ltd. | | | | | | | | |
| 3.60%, 11/28/2024 | | $ | 400,000 | | | $ | 387,346 | |
| 3.40%, 12/06/2027 | | | 300,000 | | | | 274,777 | |
| Amazon.com, Inc. | | | | | | | | |
| 3.15%, 08/22/2027 | | | 577,000 | | | | 548,215 | |
| 3.88%, 08/22/2037 | | | 300,000 | | | | 284,187 | |
| American Honda Finance Corp. | | | | | | | | |
| 2.60%, 11/16/2022 | | | 218,000 | | | | 210,673 | |
| Aramark Services, Inc. | | | | | | | | |
| 5.13%, 01/15/2024 | | | 320,000 | | | | 322,400 | |
| Delta Air Lines, Inc. | | | | | | | | |
| 3.40%, 04/19/2021 | | | 300,000 | | | | 296,747 | |
| eBay, Inc. | | | | | | | | |
| 2.88%, 08/01/2021 | | | 200,000 | | | | 195,925 | |
| 3.45%, 08/01/2024 | | | 200,000 | | | | 189,716 | |
| Ford Motor Credit Co. LLC | | | | | | | | |
| 3M US L + 1.00%, | | | | | | | | |
| 01/09/2020(b) | | | 300,000 | | | | 299,763 | |
| General Motors Financial Co., Inc. | | | | | | | | |
| 3.20%, 07/13/2020 | | | 150,000 | | | | 148,425 | |
| 4.38%, 09/25/2021 | | | 100,000 | | | | 99,966 | |
| 3.70%, 05/09/2023 | | | 500,000 | | | | 476,406 | |
| Goodyear Tire & Rubber Co. | | | | | | | | |
| 5.13%, 11/15/2023 | | | 300,000 | | | | 296,063 | |
| Hilton Worldwide Finance LLC / Hilton Worldwide Finance Corp. | | | | | | | | |
| 4.63%, 04/01/2025 | | | 100,000 | | | | 96,750 | |
| Home Depot, Inc. | | | | | | | | |
| 2.70%, 04/01/2023 | | | 400,000 | | | | 389,247 | |
| Hyatt Hotels Corp. | | | | | | | | |
| 4.38%, 09/15/2028 | | | 1,000,000 | | | | 959,031 | |
| Lennar Corp. | | | | | | | | |
| 4.50%, 06/15/2019 | | | 100,000 | | | | 100,500 | |
| 4.50%, 11/15/2019 | | | 300,000 | | | | 301,875 | |
| Lowe's Cos., Inc. | | | | | | | | |
| 2.50%, 04/15/2026 | | | 550,000 | | | | 500,377 | |
| 3.10%, 05/03/2027 | | | 200,000 | | | | 188,622 | |
| Marriott International, Inc. | | | | | | | | |
| 4.00%, 04/15/2028 | | | 250,000 | | | | 234,716 | |
| McDonald's Corp. | | | | | | | | |
| 3.70%, 01/30/2026 | | | 300,000 | | | | 292,777 | |
| 3.50%, 03/01/2027 | | | 100,000 | | | | 96,034 | |
| Newell Brands, Inc. | | | | | | | | |
| 4.20%, 04/01/2026 | | | 100,000 | | | | 95,349 | |
| PulteGroup, Inc. | | | | | | | | |
| 4.25%, 03/01/2021 | | | 300,000 | | | | 301,125 | |
| Service Corp. International | | | | | | | | |
| 5.38%, 01/15/2022 | | | 18,000 | | | | 18,124 | |
| 5.38%, 05/15/2024 | | | 300,000 | | | | 302,625 | |
| Starbucks Corp. | | | | | | | | |
| 3.85%, 10/01/2023 | | | 300,000 | | | | 302,467 | |
| TJX Cos., Inc. | | | | | | | | |
| 2.75%, 06/15/2021 | | | 100,000 | | | | 98,451 | |
See Notes to Financial Statements.
RiverFront Dynamic Core Income ETF
| Schedule of Investments | November 30, 2018 |
| Security Description | | Principal Amount | | | Value | |
| Consumer Discretionary (continued) | | | | | | | | |
| Toyota Motor Credit Corp. | | | | | | | | |
| 3M US L + 0.39%, | | | | | | | | |
| 01/11/2023(b) | | $ | 300,000 | | | $ | 298,662 | |
| 3.42%, 07/20/2023 | | | 1,000,000 | | | | 994,260 | |
| 3.20%, 01/11/2027 | | | 200,000 | | | | 190,601 | |
| Total Consumer Discretionary | | | | | | | 9,909,077 | |
| | | | | | | | | |
| Consumer Staples (3.19%) | | | | | | | | |
| Anheuser-Busch InBev Finance, Inc. | | | | | | | | |
| 2.65%, 02/01/2021 | | | 500,000 | | | | 490,128 | |
| Anheuser-Busch InBev Worldwide, Inc. | | | | | | | | |
| 4.00%, 04/13/2028 | | | 200,000 | | | | 191,448 | |
| Constellation Brands, Inc. | | | | | | | | |
| 2.70%, 05/09/2022 | | | 100,000 | | | | 96,214 | |
| 4.25%, 05/01/2023 | | | 300,000 | | | | 301,812 | |
| 4.75%, 12/01/2025 | | | 100,000 | | | | 101,713 | |
| Dollar Tree, Inc. | | | | | | | | |
| 4.20%, 05/15/2028 | | | 250,000 | | | | 233,891 | |
| Kellogg Co. | | | | | | | | |
| 3.25%, 05/14/2021 | | | 300,000 | | | | 297,524 | |
| Kraft Heinz Foods Co. | | | | | | | | |
| 5.38%, 02/10/2020 | | | 200,000 | | | | 204,242 | |
| Kroger Co. | | | | | | | | |
| 3.70%, 08/01/2027 | | | 101,000 | | | | 94,777 | |
| PepsiCo, Inc. | | | | | | | | |
| 1.70%, 10/06/2021 | | | 700,000 | | | | 669,460 | |
| 3.10%, 07/17/2022 | | | 300,000 | | | | 297,232 | |
| Procter & Gamble Co. | | | | | | | | |
| 2.45%, 11/03/2026 | | | 300,000 | | | | 276,681 | |
| Tyson Foods, Inc. | | | | | | | | |
| 2.65%, 08/15/2019 | | | 200,000 | | | | 198,957 | |
| Walmart, Inc. | | | | | | | | |
| 3.40%, 06/26/2023 | | | 261,000 | | | | 260,682 | |
| 3.30%, 04/22/2024 | | | 300,000 | | | | 296,735 | |
| 3.70%, 06/26/2028 | | | 800,000 | | | | 792,458 | |
| Total Consumer Staples | | | | | | | 4,803,954 | |
| | | | | | | | | |
| Energy (8.13%) | | | | | | | | |
| Andeavor Logistics LP / Tesoro Logistics Finance Corp. | | | | | | | | |
| 5.25%, 01/15/2025 | | | 300,000 | | | | 305,025 | |
| BP Capital Markets PLC | | | | | | | | |
| 3.25%, 05/06/2022 | | | 1,000,000 | | | | 987,202 | |
| 3.51%, 03/17/2025 | | | 250,000 | | | | 243,914 | |
| 3.72%, 11/28/2028 | | | 200,000 | | | | 192,957 | |
| Chevron Corp. | | | | | | | | |
| 2.90%, 03/03/2024 | | | 500,000 | | | | 481,793 | |
| 3.33%, 11/17/2025 | | | 300,000 | | | | 292,295 | |
| 2.95%, 05/16/2026 | | | 280,000 | | | | 263,628 | |
| Concho Resources, Inc. | | | | | | | | |
| 3.75%, 10/01/2027 | | | 200,000 | | | | 186,062 | |
| ConocoPhillips Co. | | | | | | | | |
| 4.95%, 03/15/2026 | | | 200,000 | | | | 211,072 | |
| Security Description | | Principal Amount | | | Value | |
| Energy (continued) | | | | | | | | |
| Continental Resources, Inc. | | | | | | | | |
| 4.50%, 04/15/2023 | | $ | 300,000 | | | $ | 293,576 | |
| 3.80%, 06/01/2024 | | | 300,000 | | | | 283,499 | |
| 4.38%, 01/15/2028 | | | 150,000 | | | | 141,326 | |
| DCP Midstream Operating LP | | | | | | | | |
| 5.35%, 03/15/2020(a) | | | 200,000 | | | | 202,500 | |
| Energy Transfer LP | | | | | | | | |
| 4.25%, 03/15/2023 | | | 35,000 | | | | 34,256 | |
| Energy Transfer Operating LP | | | | | | | | |
| 3.60%, 02/01/2023 | | | 178,000 | | | | 171,859 | |
| Enterprise Products Operating LLC | | | | | | | | |
| 3.35%, 03/15/2023 | | | 500,000 | | | | 489,069 | |
| Exxon Mobil Corp. | | | | | | | | |
| 2.22%, 03/01/2021 | | | 500,000 | | | | 488,787 | |
| 3.04%, 03/01/2026 | | | 1,000,000 | | | | 960,874 | |
| 4.11%, 03/01/2046 | | | 100,000 | | | | 96,854 | |
| Halliburton Co. | | | | | | | | |
| 3.80%, 11/15/2025 | | | 500,000 | | | | 478,344 | |
| Hess Corp. | | | | | | | | |
| 7.30%, 08/15/2031 | | | 68,000 | | | | 75,119 | |
| Kinder Morgan Energy Partners LP | | | | | | | | |
| 4.25%, 09/01/2024 | | | 300,000 | | | | 296,322 | |
| Kinder Morgan, Inc. | | | | | | | | |
| 3.05%, 12/01/2019 | | | 500,000 | | | | 496,467 | |
| Marathon Oil Corp. | | | | | | | | |
| 4.40%, 07/15/2027 | | | 56,000 | | | | 53,712 | |
| Marathon Petroleum Corp. | | | | | | | | |
| 3.80%, 04/01/2028(a) | | | 400,000 | | | | 368,310 | |
| MPLX LP | | | | | | | | |
| 4.50%, 07/15/2023 | | | 250,000 | | | | 251,191 | |
| Nabors Industries, Inc. | | | | | | | | |
| 5.00%, 09/15/2020 | | | 300,000 | | | | 298,435 | |
| Newfield Exploration Co. | | | | | | | | |
| 5.63%, 07/01/2024 | | | 300,000 | | | | 307,500 | |
| ONEOK Partners LP | | | | | | | | |
| 3.38%, 10/01/2022 | | | 500,000 | | | | 485,044 | |
| Sabine Pass Liquefaction LLC | | | | | | | | |
| 5.63%, 02/01/2021 | | | 100,000 | | | | 102,954 | |
| 5.63%, 04/15/2023 | | | 400,000 | | | | 417,331 | |
| 5.75%, 05/15/2024 | | | 378,000 | | | | 398,415 | |
| Schlumberger Investment SA | | | | | | | | |
| 3.65%, 12/01/2023 | | | 1,125,000 | | | | 1,105,009 | |
| Shell International Finance BV | | | | | | | | |
| 2.88%, 05/10/2026 | | | 300,000 | | | | 281,440 | |
| Williams Cos., Inc. | | | | | | | | |
| 4.55%, 06/24/2024 | | | 200,000 | | | | 200,394 | |
| 3.90%, 01/15/2025 | | | 313,000 | | | | 302,429 | |
| Total Energy | | | | | | | 12,244,964 | |
| | | | | | | | | |
| Financials (28.34%) | | | | | | | | |
| Aflac, Inc. | | | | | | | | |
| 3.63%, 11/15/2024 | | | 500,000 | | | | 491,675 | |
| Aircastle, Ltd. | | | | | | | | |
| 5.50%, 02/15/2022 | | | 400,000 | | | | 410,578 | |
See Notes to Financial Statements.
RiverFront Dynamic Core Income ETF
| Schedule of Investments | November 30, 2018 |
| Security Description | | Principal Amount | | | Value | |
| Financials (continued) | | | | | | | | |
| Ally Financial, Inc. | | | | | | | | |
| 4.13%, 02/13/2022 | | $ | 723,000 | | | $ | 714,866 | |
| 4.63%, 03/30/2025 | | | 100,000 | | | | 98,375 | |
| American Express Credit Corp. | | | | | | | | |
| 2.25%, 05/05/2021 | | | 400,000 | | | | 388,022 | |
| American International Group, Inc. | | | | | | | | |
| 4.13%, 02/15/2024 | | | 150,000 | | | | 148,509 | |
| 3.90%, 04/01/2026 | | | 200,000 | | | | 189,770 | |
| Bank of America Corp. | | | | | | | | |
| 3M US L + 0.77%, | | | | | | | | |
| 02/05/2026(b) | | | 1,204,000 | | | | 1,159,353 | |
| 4.25%, 10/22/2026 | | | 500,000 | | | | 484,762 | |
| 3M US L + 1.37%, | | | | | | | | |
| 07/21/2028(b) | | | 300,000 | | | | 282,863 | |
| Bank of Montreal | | | | | | | | |
| 1.90%, 08/27/2021 | | | 1,000,000 | | | | 960,062 | |
| 2.35%, 09/11/2022 | | | 300,000 | | | | 287,075 | |
| 2.55%, 11/06/2022 | | | 200,000 | | | | 192,136 | |
| Bank of New York Mellon Corp. | | | | | | | | |
| 2.45%, 11/27/2020 | | | 652,000 | | | | 640,210 | |
| 3M US L + 1.05%, | | | | | | | | |
| 10/30/2023(b) | | | 484,000 | | | | 491,796 | |
| 3.25%, 05/16/2027 | | | 85,000 | | | | 81,064 | |
| Barclays PLC | | | | | | | | |
| 3M US L + 1.38%, | | | | | | | | |
| 05/16/2024(b) | | | 740,000 | | | | 720,570 | |
| BB&T Corp. | | | | | | | | |
| 2.63%, 06/29/2020 | | | 150,000 | | | | 148,331 | |
| Berkshire Hathaway, Inc. | | | | | | | | |
| 3.13%, 03/15/2026 | | | 671,000 | | | | 640,936 | |
| BNP Paribas SA | | | | | | | | |
| 2.38%, 05/21/2020 | | | 200,000 | | | | 197,356 | |
| 5.00%, 01/15/2021 | | | 150,000 | | | | 154,771 | |
| 3.25%, 03/03/2023 | | | 250,000 | | | | 243,845 | |
| Boston Properties LP | | | | | | | | |
| 3.85%, 02/01/2023 | | | 1,000,000 | | | | 989,752 | |
| Branch Banking & Trust Co. | | | | | | | | |
| 2.10%, 01/15/2020 | | | 300,000 | | | | 296,373 | |
| 2.25%, 06/01/2020 | | | 300,000 | | | | 295,262 | |
| Capital One Financial Corp. | | | | | | | | |
| 3.50%, 06/15/2023 | | | 600,000 | | | | 583,862 | |
| 3.30%, 10/30/2024 | | | 125,000 | | | | 116,866 | |
| 4.20%, 10/29/2025 | | | 150,000 | | | | 143,329 | |
| 3.80%, 01/31/2028 | | | 72,000 | | | | 66,276 | |
| Capital One NA | | | | | | | | |
| 2.25%, 09/13/2021 | | | 300,000 | | | | 286,229 | |
| Charles Schwab Corp. | | | | | | | | |
| 2.65%, 01/25/2023 | | | 300,000 | | | | 289,399 | |
| Chubb INA Holdings, Inc. | | | | | | | | |
| 2.70%, 03/13/2023 | | | 115,000 | | | | 111,222 | |
| 3.35%, 05/03/2026 | | | 475,000 | | | | 459,059 | |
| Security Description | | Principal Amount | | | Value | |
| Financials (continued) | | | | | | | | |
| Citigroup, Inc. | | | | | | | | |
| 2.65%, 10/26/2020 | | $ | 300,000 | | | $ | 294,938 | |
| 2.70%, 03/30/2021 | | | 350,000 | | | | 342,445 | |
| 3M US L + 1.43%, | | | | | | | | |
| 09/01/2023(b) | | | 500,000 | | | | 504,154 | |
| 4.45%, 09/29/2027 | | | 500,000 | | | | 483,202 | |
| CME Group, Inc. | | | | | | | | |
| 3.75%, 06/15/2028 | | | 100,000 | | | | 99,356 | |
| Cooperatieve Rabobank UA | | | | | | | | |
| 4.63%, 12/01/2023 | | | 700,000 | | | | 704,231 | |
| CoreCivic, Inc. | | | | | | | | |
| 4.63%, 05/01/2023 | | | 300,000 | | | | 279,000 | |
| Credit Suisse Group Funding Guernsey, Ltd. | | | | | | | | |
| 3.13%, 12/10/2020 | | | 175,000 | | | | 172,600 | |
| 3.45%, 04/16/2021 | | | 150,000 | | | | 148,804 | |
| 4.55%, 04/17/2026 | | | 700,000 | | | | 688,524 | |
| Crown Castle International Corp. | | | | | | | | |
| 4.88%, 04/15/2022 | | | 135,000 | | | | 138,590 | |
| Deutsche Bank AG | | | | | | | | |
| 4.25%, 10/14/2021 | | | 300,000 | | | | 292,844 | |
| 3.95%, 02/27/2023 | | | 200,000 | | | | 189,155 | |
| Discover Bank | | | | | | | | |
| 7.00%, 04/15/2020 | | | 175,000 | | | | 182,174 | |
| 3.20%, 08/09/2021 | | | 100,000 | | | | 98,343 | |
| 4.65%, 09/13/2028 | | | 750,000 | | | | 727,665 | |
| Discover Financial Services | | | | | | | | |
| 4.10%, 02/09/2027 | | | 224,000 | | | | 208,520 | |
| Fidelity National Information Services, Inc. | | | | | | | | |
| 2.25%, 08/15/2021 | | | 200,000 | | | | 192,238 | |
| 3.50%, 04/15/2023 | | | 152,000 | | | | 149,458 | |
| GE Capital International Funding Co. | | | | | | | | |
| 2.34%, 11/15/2020 | | | 200,000 | | | | 190,289 | |
| GLP Capital LP / GLP Financing II, Inc. | | | | | | | | |
| 4.88%, 11/01/2020 | | | 500,000 | | | | 504,750 | |
| Goldman Sachs Group, Inc. | | | | | | | | |
| 3M US L + 0.75%, | | | | | | | | |
| 02/23/2023(b) | | | 800,000 | | | | 783,166 | |
| 3M US L + 1.60%, | | | | | | | | |
| 11/29/2023(b) | | | 854,000 | | | | 863,736 | |
| 3.50%, 11/16/2026 | | | 40,000 | | | | 36,874 | |
| Host Hotels & Resorts LP | | | | | | | | |
| 4.00%, 06/15/2025 | | | 200,000 | | | | 192,879 | |
| HSBC Holdings PLC | | | | | | | | |
| 4.30%, 03/08/2026 | | | 250,000 | | | | 243,804 | |
| 3.90%, 05/25/2026 | | | 400,000 | | | | 380,080 | |
| 3M US L + 1.38%, | | | | | | | | |
| 09/12/2026(b) | | | 500,000 | | | | 499,166 | |
| 4.38%, 11/23/2026 | | | 200,000 | | | | 192,028 | |
| Huntington Bancshares, Inc. | | | | | | | | |
| 3.15%, 03/14/2021 | | | 400,000 | | | | 395,407 | |
| 4.00%, 05/15/2025 | | | 45,000 | | | | 44,775 | |
See Notes to Financial Statements.
RiverFront Dynamic Core Income ETF
| Schedule of Investments | November 30, 2018 |
| Security Description | | Principal Amount | | | Value | |
| Financials (continued) | | | | | | | | |
| Huntington National Bank | | | | | | | | |
| 3.25%, 05/14/2021 | | $ | 400,000 | | | $ | 396,834 | |
| Intercontinental Exchange, Inc. | | | | | | | | |
| 3.75%, 12/01/2025 | | | 400,000 | | | | 397,328 | |
| 3.10%, 09/15/2027 | | | 244,000 | | | | 229,433 | |
| 3.75%, 09/21/2028 | | | 300,000 | | | | 294,615 | |
| International Lease Finance Corp. | | | | | | | | |
| 8.25%, 12/15/2020 | | | 750,000 | | | | 807,021 | |
| 5.88%, 08/15/2022 | | | 250,000 | | | | 262,202 | |
| Iron Mountain, Inc. | | | | | | | | |
| 6.00%, 08/15/2023 | | | 60,000 | | | | 61,350 | |
| iStar, Inc. | | | | | | | | |
| 4.63%, 09/15/2020 | | | 200,000 | | | | 198,750 | |
| JPMorgan Chase & Co. | | | | | | | | |
| 3.38%, 05/01/2023 | | | 400,000 | | | | 389,612 | |
| 3M US L + 1.23%, | | | | | | | | |
| 10/24/2023(b) | | | 1,159,000 | | | | 1,165,291 | |
| KeyBank NA/Cleveland OH | | | | | | | | |
| 3.38%, 03/07/2023 | | | 250,000 | | | | 246,802 | |
| KeyCorp | | | | | | | | |
| 5.10%, 03/24/2021 | | | 600,000 | | | | 620,877 | |
| Lincoln National Corp. | | | | | | | | |
| 3.35%, 03/09/2025 | | | 400,000 | | | | 384,007 | |
| 3.80%, 03/01/2028 | | | 100,000 | | | | 95,178 | |
| Lloyds Banking Group PLC | | | | | | | | |
| 4.50%, 11/04/2024 | | | 250,000 | | | | 240,265 | |
| 3M US L + 1.205%, | | | | | | | | |
| 11/07/2028(b) | | | 100,000 | | | | 88,068 | |
| M&T Bank Corp. | | | | | | | | |
| 3M US L + 0.68%, | | | | | | | | |
| 07/26/2023(b) | | | 500,000 | | | | 499,903 | |
| Manufacturers & Traders Trust Co. | | | | | | | | |
| 3M US L + 0.27%, | | | | | | | | |
| 01/25/2021(b) | | | 600,000 | | | | 599,386 | |
| MetLife, Inc. | | | | | | | | |
| 3.60%, 04/10/2024 | | | 477,000 | | | | 473,794 | |
| 6.50%, 12/15/2032 | | | 50,000 | | | | 60,702 | |
| Mitsubishi UFJ Financial Group, Inc. | | | | | | | | |
| 3.85%, 03/01/2026 | | | 700,000 | | | | 689,177 | |
| Mizuho Financial Group, Inc. | | | | | | | | |
| 2.95%, 02/28/2022 | | | 300,000 | | | | 292,493 | |
| 3M US L + 1.00%, | | | | | | | | |
| 09/11/2024(b) | | | 1,100,000 | | | | 1,110,953 | |
| 3.17%, 09/11/2027 | | | 100,000 | | | | 93,183 | |
| Morgan Stanley | | | | | | | | |
| 5.63%, 09/23/2019 | | | 400,000 | | | | 407,280 | |
| 3M US L + 1.40%, | | | | | | | | |
| 10/24/2023(b) | | | 1,000,000 | | | | 1,004,200 | |
| 5.00%, 11/24/2025 | | | 600,000 | | | | 608,550 | |
| National Australia Bank, Ltd. | | | | | | | | |
| 2.50%, 07/12/2026 | | | 300,000 | | | | 269,189 | |
| Security Description | | Principal Amount | | | Value | |
| Financials (continued) | | | | | | | | |
| PNC Financial Services Group, Inc. | | | | | | | | |
| 3.15%, 05/19/2027 | | $ | 400,000 | | | $ | 378,556 | |
| Prudential Financial, Inc. | | | | | | | | |
| 4.50%, 11/16/2021 | | | 200,000 | | | | 205,074 | |
| Royal Bank of Canada | | | | | | | | |
| 2.15%, 10/26/2020 | | | 300,000 | | | | 293,541 | |
| Royal Bank of Scotland Group PLC | | | | | | | | |
| 3M US L + 1.48%, | | | | | | | | |
| 05/15/2023(b) | | | 400,000 | | | | 381,386 | |
| 3M US L + 1.47%, | | | | | | | | |
| 05/15/2023(b) | | | 500,000 | | | | 488,987 | |
| Simon Property Group LP | | | | | | | | |
| 4.13%, 12/01/2021 | | | 400,000 | | | | 406,215 | |
| 3.38%, 10/01/2024 | | | 100,000 | | | | 97,303 | |
| 3.38%, 12/01/2027 | | | 200,000 | | | | 188,347 | |
| Starwood Property Trust, Inc. | | | | | | | | |
| 5.00%, 12/15/2021 | | | 250,000 | | | | 250,281 | |
| State Street Corp. | | | | | | | | |
| 3.30%, 12/16/2024 | | | 300,000 | | | | 291,046 | |
| 3.55%, 08/18/2025 | | | 125,000 | | | | 122,615 | |
| SunTrust Bank/Atlanta GA | | | | | | | | |
| 3.30%, 05/15/2026 | | | 400,000 | | | | 376,031 | |
| Toronto-Dominion Bank | | | | | | | | |
| 3.15%, 09/17/2020 | | | 500,000 | | | | 499,420 | |
| UBS Group Funding Switzerland AG | | | | | | | | |
| 3.49%, 05/23/2023(a) | | | 300,000 | | | | 291,325 | |
| 4.13%, 09/24/2025(a) | | | 150,000 | | | | 147,517 | |
| 4.13%, 04/15/2026(a) | | | 100,000 | | | | 98,107 | |
| US Bancorp | | | | | | | | |
| 2.63%, 01/24/2022 | | | 200,000 | | | | 195,220 | |
| 3.00%, 03/15/2022 | | | 400,000 | | | | 394,399 | |
| Visa, Inc. | | | | | | | | |
| 3.15%, 12/14/2025 | | | 300,000 | | | | 289,773 | |
| 2.75%, 09/15/2027 | | | 250,000 | | | | 231,539 | |
| Wells Fargo & Co. | | | | | | | | |
| 2.55%, 12/07/2020 | | | 200,000 | | | | 195,797 | |
| 3M US L + 0.93%, | | | | | | | | |
| 02/11/2022(b) | | | 200,000 | | | | 200,375 | |
| 3M US L + 1.23%, | | | | | | | | |
| 10/31/2023(b) | | | 567,000 | | | | 568,506 | |
| 3.00%, 04/22/2026 | | | 401,000 | | | | 369,814 | |
| Westpac Banking Corp. | | | | | | | | |
| 2.10%, 05/13/2021 | | | 340,000 | | | | 328,672 | |
| 3.65%, 05/15/2023 | | | 300,000 | | | | 299,004 | |
| 2.70%, 08/19/2026 | | | 100,000 | | | | 90,951 | |
| Total Financials | | | | | | | 42,653,993 | |
| | | | | | | | | |
| Health Care (7.84%) | | | | | | | | |
| Abbott Laboratories | | | | | | | | |
| 2.90%, 11/30/2021 | | | 250,000 | | | | 244,357 | |
| AbbVie, Inc. | | | | | | | | |
| 2.90%, 11/06/2022 | | | 600,000 | | | | 578,484 | |
| 3.60%, 05/14/2025 | | | 100,000 | | | | 95,527 | |
See Notes to Financial Statements.
RiverFront Dynamic Core Income ETF
| Schedule of Investments | November 30, 2018 |
| Security Description | | Principal Amount | | | Value | |
| Health Care (continued) | | | | | | | | |
| Aetna, Inc. | | | | | | | | |
| 3.50%, 11/15/2024 | | $ | 411,000 | | | $ | 396,430 | |
| Allergan Funding SCS | | | | | | | | |
| 3.00%, 03/12/2020 | | | 700,000 | | | | 695,648 | |
| 3.85%, 06/15/2024 | | | 300,000 | | | | 291,236 | |
| Amgen, Inc. | | | | | | | | |
| 3.63%, 05/22/2024 | | | 400,000 | | | | 392,431 | |
| Anthem, Inc. | | | | | | | | |
| 3.50%, 08/15/2024 | | | 100,000 | | | | 96,593 | |
| Becton Dickinson and Co. | | | | | | | | |
| 2.13%, 06/06/2019 | | | 200,000 | | | | 198,866 | |
| 3M US L + 0.875%, | | | | | | | | |
| 12/29/2020(b) | | | 200,000 | | | | 199,741 | |
| Centene Corp. | | | | | | | | |
| 5.63%, 02/15/2021 | | | 37,000 | | | | 37,581 | |
| 4.75%, 05/15/2022 | | | 400,000 | | | | 403,000 | |
| CVS Health Corp. | | | | | | | | |
| 2.25%, 08/12/2019 | | | 300,000 | | | | 298,019 | |
| 3M US L + 0.63%, | | | | | | | | |
| 03/09/2020(b) | | | 400,000 | | | | 400,373 | |
| 4.00%, 12/05/2023 | | | 150,000 | | | | 149,012 | |
| 4.30%, 03/25/2028 | | | 300,000 | | | | 292,111 | |
| Eli Lilly & Co. | | | | | | | | |
| 2.75%, 06/01/2025 | | | 140,000 | | | | 132,533 | |
| Endo Dac / Endo Finance LLC / Endo Finco, Inc. | | | | | | | | |
| 5.88%, 10/15/2024(a) | | | 200,000 | | | | 199,626 | |
| Express Scripts Holding Co. | | | | | | | | |
| 4.75%, 11/15/2021 | | | 250,000 | | | | 256,441 | |
| 3.00%, 07/15/2023 | | | 500,000 | | | | 476,541 | |
| Fresenius Medical Care US Finance II, Inc. | | | | | | | | |
| 4.13%, 10/15/2020(a) | | | 400,000 | | | | 401,008 | |
| Gilead Sciences, Inc. | | | | | | | | |
| 4.40%, 12/01/2021 | | | 200,000 | | | | 205,177 | |
| 2.50%, 09/01/2023 | | | 200,000 | | | | 189,529 | |
| Halfmoon Parent, Inc. | | | | | | | | |
| 4.38%, 10/15/2028(a) | | | 500,000 | | | | 493,139 | |
| HCA, Inc. | | | | | | | | |
| 6.50%, 02/15/2020 | | | 600,000 | | | | 618,000 | |
| Johnson & Johnson | | | | | | | | |
| 2.45%, 03/01/2026 | | | 500,000 | | | | 463,151 | |
| Medtronic, Inc. | | | | | | | | |
| 3.50%, 03/15/2025 | | | 600,000 | | | | 588,015 | |
| Merck & Co., Inc. | | | | | | | | |
| 2.80%, 05/18/2023 | | | 980,000 | | | | 954,320 | |
| Pfizer, Inc. | | | | | | | | |
| 3.20%, 09/15/2023 | | | 423,000 | | | | 419,481 | |
| 3.00%, 12/15/2026 | | | 500,000 | | | | 476,304 | |
| Teva Pharmaceutical Finance Netherlands III BV | | | | | | | | |
| 1.70%, 07/19/2019 | | | 152,000 | | | | 150,298 | |
| Thermo Fisher Scientific, Inc. | | | | | | | | |
| 3.65%, 12/15/2025 | | | 150,000 | | | | 145,648 | |
| Security Description | | Principal Amount | | | Value | |
| Health Care (continued) | | | | | | | | |
| UnitedHealth Group, Inc. | | | | | | | | |
| 2.88%, 03/15/2023 | | $ | 300,000 | | | $ | 291,555 | |
| 3.75%, 07/15/2025 | | | 400,000 | | | | 398,589 | |
| 3.10%, 03/15/2026 | | | 183,000 | | | | 173,697 | |
| Total Health Care | | | | | | | 11,802,461 | |
| | | | | | | | | |
| Industrials (5.05%) | | | | | | | | |
| Boeing Co. | | | | | | | | |
| 3.45%, 11/01/2028 | | | 600,000 | | | | 583,942 | |
| 3.50%, 03/01/2045 | | | 100,000 | | | | 88,018 | |
| Burlington Northern Santa Fe LLC | | | | | | | | |
| 3.05%, 09/01/2022 | | | 300,000 | | | | 294,886 | |
| Caterpillar Financial Services Corp. | | | | | | | | |
| 2.75%, 08/20/2021 | | | 50,000 | | | | 49,123 | |
| 2.40%, 06/06/2022 | | | 300,000 | | | | 288,767 | |
| CNH Industrial Capital LLC | | | | | | | | |
| 4.88%, 04/01/2021 | | | 300,000 | | | | 302,250 | |
| CNH Industrial NV | | | | | | | | |
| 4.50%, 08/15/2023 | | | 400,000 | | | | 401,000 | |
| CSX Corp. | | | | | | | | |
| 3.40%, 08/01/2024 | | | 300,000 | | | | 294,704 | |
| 2.60%, 11/01/2026 | | | 100,000 | | | | 89,434 | |
| FedEx Corp. | | | | | | | | |
| 3.40%, 02/15/2028 | | | 300,000 | | | | 280,399 | |
| General Dynamics Corp. | | | | | | | | |
| 3.50%, 05/15/2025 | | | 375,000 | | | | 371,332 | |
| 2.63%, 11/15/2027 | | | 300,000 | | | | 273,710 | |
| General Electric Co. | | | | | | | | |
| 2.70%, 10/09/2022 | | | 200,000 | | | | 180,614 | |
| 3M US L + 0.38%, | | | | | | | | |
| 05/05/2026(b) | | | 200,000 | | | | 163,000 | |
| Honeywell International, Inc. | | | | | | | | |
| 2.50%, 11/01/2026 | | | 300,000 | | | | 275,562 | |
| John Deere Capital Corp. | | | | | | | | |
| 3M US L + 0.16%, | | | | | | | | |
| 01/08/2021(b) | | | 200,000 | | | | 199,652 | |
| 2.65%, 06/24/2024 | | | 400,000 | | | | 378,884 | |
| Lockheed Martin Corp. | | | | | | | | |
| 3.55%, 01/15/2026 | | | 300,000 | | | | 294,537 | |
| Northrop Grumman Corp. | | | | | | | | |
| 3.50%, 03/15/2021 | | | 35,000 | | | | 35,034 | |
| 3.25%, 01/15/2028 | | | 300,000 | | | | 279,403 | |
| Textron, Inc. | | | | | | | | |
| 3.65%, 03/01/2021 | | | 89,000 | | | | 88,832 | |
| 3.65%, 03/15/2027 | | | 250,000 | | | | 235,957 | |
| United Parcel Service, Inc. | | | | | | | | |
| 2.50%, 04/01/2023 | | | 587,000 | | | | 565,747 | |
| 2.40%, 11/15/2026 | | | 72,000 | | | | 65,301 | |
| United Rentals North America, Inc. | | | | | | | | |
| 4.63%, 07/15/2023 | | | 500,000 | | | | 498,750 | |
See Notes to Financial Statements.
RiverFront Dynamic Core Income ETF
| Schedule of Investments | November 30, 2018 |
| Security Description | | Principal Amount | | | Value | |
| Industrials (continued) | | | | | | | | |
| United Technologies Corp. | | | | | | | | |
| 2.80%, 05/04/2024 | | $ | 400,000 | | | $ | 377,214 | |
| 4.50%, 06/01/2042 | | | 100,000 | | | | 93,846 | |
| 4.15%, 05/15/2045 | | | 50,000 | | | | 44,804 | |
| WESCO Distribution, Inc. | | | | | | | | |
| 5.38%, 12/15/2021 | | | 200,000 | | | | 201,000 | |
| XPO Logistics, Inc. | | | | | | | | |
| 6.13%, 09/01/2023(a) | | | 300,000 | | | | 303,000 | |
| Total Industrials | | | | | | | 7,598,702 | |
| | | | | | | | | |
| Materials (4.24%) | | | | | | | | |
| 3M Co. | | | | | | | | |
| 3.25%, 02/14/2024 | | | 1,000,000 | | | | 991,801 | |
| Ashland LLC | | | | | | | | |
| 4.75%, 08/15/2022 | | | 300,000 | | | | 298,875 | |
| Ball Corp. | | | | | | | | |
| 4.00%, 11/15/2023 | | | 300,000 | | | | 293,250 | |
| Celanese US Holdings LLC | | | | | | | | |
| 5.88%, 06/15/2021 | | | 200,000 | | | | 208,928 | |
| 4.63%, 11/15/2022 | | | 200,000 | | | | 203,380 | |
| Dow Chemical Co. | | | | | | | | |
| 4.25%, 11/15/2020 | | | 200,000 | | | | 202,228 | |
| 3.00%, 11/15/2022 | | | 300,000 | | | | 289,606 | |
| Freeport-McMoRan, Inc. | | | | | | | | |
| 4.55%, 11/14/2024 | | | 100,000 | | | | 93,250 | |
| Glencore Funding LLC | | | | | | | | |
| 3.00%, 10/27/2022(a) | | | 500,000 | | | | 478,547 | |
| Graphic Packaging International LLC | | | | | | | | |
| 4.75%, 04/15/2021 | | | 200,000 | | | | 200,250 | |
| Huntsman International LLC | | | | | | | | |
| 4.88%, 11/15/2020 | | | 300,000 | | | | 304,125 | |
| International Paper Co. | | | | | | | | |
| 3.00%, 02/15/2027 | | | 300,000 | | | | 270,588 | |
| LyondellBasell Industries NV | | | | | | | | |
| 5.75%, 04/15/2024 | | | 600,000 | | | | 641,194 | |
| Nutrien, Ltd. | | | | | | | | |
| 3.50%, 06/01/2023 | | | 300,000 | | | | 293,961 | |
| Sealed Air Corp. | | | | | | | | |
| 6.50%, 12/01/2020(a) | | | 200,000 | | | | 208,500 | |
| Sherwin-Williams Co. | | | | | | | | |
| 3.45%, 08/01/2025 | | | 300,000 | | | | 283,432 | |
| 3.45%, 06/01/2027 | | | 200,000 | | | | 183,448 | |
| Steel Dynamics, Inc. | | | | | | | | |
| 5.50%, 10/01/2024 | | | 100,000 | | | | 100,000 | |
| USG Corp. | | | | | | | | |
| 4.88%, 06/01/2027(a) | | | 400,000 | | | | 401,500 | |
| Vale Overseas, Ltd. | | | | | | | | |
| 6.25%, 08/10/2026 | | | 400,000 | | | | 428,000 | |
| Total Materials | | | | | | | 6,374,863 | |
| Security Description | | Principal Amount | | | Value | |
| Technology (5.08%) | | | | | | |
| Apple, Inc. | | | | | | | | |
| 2.40%, 05/03/2023 | | $ | 500,000 | | | $ | 476,975 | |
| 3.45%, 05/06/2024 | | | 300,000 | | | | 297,633 | |
| 2.75%, 01/13/2025 | | | 125,000 | | | | 118,305 | |
| 3.20%, 05/11/2027 | | | 525,000 | | | | 499,648 | |
| Broadcom Corp. / Broadcom Cayman Finance, Ltd. | | | | | | | | |
| 3.00%, 01/15/2022 | | | 200,000 | | | | 192,495 | |
| 3.63%, 01/15/2024 | | | 300,000 | | | | 283,933 | |
| Cisco Systems, Inc. | | | | | | | | |
| 4.95%, 02/15/2019 | | | 200,000 | | | | 200,808 | |
| 2.20%, 09/20/2023 | | | 200,000 | | | | 188,958 | |
| Corning, Inc. | | | | | | | | |
| 2.90%, 05/15/2022 | | | 100,000 | | | | 98,037 | |
| Dell International LLC / EMC Corp. | | | | | | | | |
| 4.42%, 06/15/2021(a) | | | 300,000 | | | | 300,326 | |
| 5.88%, 06/15/2021(a) | | | 50,000 | | | | 50,822 | |
| Flex, Ltd. | | | | | | | | |
| 5.00%, 02/15/2023 | | | 400,000 | | | | 396,700 | |
| IBM Credit LLC | | | | | | | | |
| 3M US L + 0.16%, | | | | | | | | |
| 02/05/2021(b) | | | 750,000 | | | | 751,178 | |
| Intel Corp. | | | | | | | | |
| 2.60%, 05/19/2026 | | | 300,000 | | | | 277,572 | |
| International Business Machines Corp. | | | | | | | | |
| 2.50%, 01/27/2022 | | | 500,000 | | | | 482,239 | |
| 3.63%, 02/12/2024 | | | 425,000 | | | | 418,452 | |
| Microsoft Corp. | | | | | | | | |
| 3.45%, 08/08/2036 | | | 250,000 | | | | 231,153 | |
| 4.10%, 02/06/2037 | | | 300,000 | | | | 299,904 | |
| 3.70%, 08/08/2046 | | | 200,000 | | | | 185,425 | |
| Moody's Corp. | | | | | | | | |
| 4.50%, 09/01/2022 | | | 72,000 | | | | 73,637 | |
| NCR Corp. | | | | | | | | |
| 5.00%, 07/15/2022 | | | 100,000 | | | | 95,500 | |
| Oracle Corp. | | | | | | | | |
| 3.40%, 07/08/2024 | | | 300,000 | | | | 294,906 | |
| QUALCOMM, Inc. | | | | | | | | |
| 2.60%, 01/30/2023 | | | 400,000 | | | | 380,697 | |
| 2.90%, 05/20/2024 | | | 375,000 | | | | 353,946 | |
| S&P Global, Inc. | | | | | | | | |
| 4.00%, 06/15/2025 | | | 600,000 | | | | 600,470 | |
| Xerox Corp. | | | | | | | | |
| 3.50%, 08/20/2020 | | | 100,000 | | | | 98,265 | |
| Total Technology | | | | | | | 7,647,984 | |
| | | | | | | | | |
| Utilities (2.69%) | | | | | | | | |
| AES Corp. | | | | | | | | |
| 4.50%, 03/15/2023 | | | 300,000 | | | | 298,500 | |
| Alabama Power Co. | | | | | | | | |
| 3.55%, 12/01/2023 | | | 150,000 | | | | 149,106 | |
| CMS Energy Corp. | | | | | | | | |
| 3.60%, 11/15/2025 | | | 150,000 | | | | 145,253 | |
See Notes to Financial Statements.
RiverFront Dynamic Core Income ETF
| Schedule of Investments | November 30, 2018 |
| Security Description | | Principal Amount | | | Value | |
| Utilities (continued) | | | | | | | | |
| Consumers Energy Co. | | | | | | | | |
| 3.38%, 08/15/2023 | | $ | 200,000 | | | $ | 198,779 | |
| 3.13%, 08/31/2024 | | | 200,000 | | | | 195,146 | |
| Dominion Energy, Inc. | | | | | | | | |
| 5.20%, 08/15/2019 | | | 150,000 | | | | 151,957 | |
| 3.63%, 12/01/2024 | | | 400,000 | | | | 390,761 | |
| 4.25%, 06/01/2028 | | | 250,000 | | | | 248,040 | |
| Duke Energy Carolinas LLC | | | | | | | | |
| 2.95%, 12/01/2026 | | | 200,000 | | | | 188,664 | |
| 6.10%, 06/01/2037 | | | 70,000 | | | | 81,441 | |
| Duke Energy Corp. | | | | | | | | |
| 1.80%, 09/01/2021 | | | 600,000 | | | | 570,958 | |
| Exelon Corp. | | | | | | | | |
| 3.50%, 06/01/2022 | | | 200,000 | | | | 194,079 | |
| 3.40%, 04/15/2026 | | | 175,000 | | | | 163,683 | |
| Exelon Generation Co. LLC | | | | | | | | |
| 4.25%, 06/15/2022 | | | 100,000 | | | | 100,864 | |
| Southern Co. | | | | | | | | |
| 2.95%, 07/01/2023 | | | 500,000 | | | | 478,874 | |
| Southwestern Electric Power Co. | | | | | | | | |
| 4.10%, 09/15/2028 | | | 500,000 | | | | 492,813 | |
| Total Utilities | | | | | | | 4,048,918 | |
| | | | | | | | | |
| TOTAL CORPORATE BONDS | | | | | | | | |
| (Cost $116,615,795) | | | | | | | 114,767,603 | |
| | | | | | | | | |
| GOVERNMENT BONDS (18.19%) | | | | | | | | |
| United States Treasury Bond | | | | | | | | |
| 2.75%, 02/15/2028 | | | 2,000,000 | | | | 1,958,906 | |
| 3.88%, 08/15/2040 | | | 1,402,300 | | | | 1,538,121 | |
| 2.75%, 11/15/2047 | | | 1,900,000 | | | | 1,699,832 | |
| United States Treasury Inflation Indexed Bonds | | | | | | | | |
| 2.13%, 02/15/2040(c) | | | 556,855 | | | | 649,120 | |
| United States Treasury Note | | | | | | | | |
| 2.88%, 11/15/2021 | | | 3,000,000 | | | | 3,003,867 | |
| 2.88%, 10/31/2023 | | | 5,000,000 | | | | 5,005,176 | |
| 3.00%, 10/31/2025 | | | 5,000,000 | | | | 5,025,000 | |
| United States Treasury Strip Principal | | | | | | | | |
| 0.00%, 02/15/2038(d) | | | 5,000,000 | | | | 2,736,169 | |
| 0.00%, 08/15/2039(d) | | | 6,000,000 | | | | 3,083,455 | |
| 0.00%, 11/15/2046(d) | | | 3,000,000 | | | | 1,184,078 | |
| 0.00%, 05/15/2048(d) | | | 4,000,000 | | | | 1,502,390 | |
| TOTALGOVERNMENT BONDS | | | | | | | | |
| (Cost $27,851,417) | | | | | | | 27,386,114 | |
| | | 7 Day Yield | | | Shares | | | Value | |
| SHORT TERM INVESTMENTS (0.73%) | | | | | | | | | | | | |
| State Street Institutional Treasury Plus Money Market Fund | | | 2.146 | % | | | 1,099,883 | | | | 1,099,883 | |
| TOTAL SHORT TERM INVESTMENTS | | | | | | | | | | | | |
| (Cost $1,099,883) | | | | | | | | | | | 1,099,883 | |
| | | Value | |
| TOTAL INVESTMENTS (95.16%) | | | | |
| (Cost $145,567,095) | | $ | 143,253,600 | |
| OTHER ASSETS IN EXCESS OF LIABILITIES (4.84%) | | | 7,273,317 | |
| NET ASSETS - 100.00% | | $ | 150,526,917 | |
Investment Abbreviations:
LIBOR - London Interbank Offered Rate
LIBOR Rate:
3M US L - 3 Month LIBOR as of November 30, 2018 was 2.74%
| (a) | Securities exempt from registration under Rule 144A of the Securities Act of 1933. These securities may be sold in the ordinary course of business in transactions exempt from registration, normally to qualified institutional buyers. At period end, the aggregate market value of those securities was $3,993,747, representing 2.65% of net assets. |
| (b) | Floating or variable rate security. The reference rate is described above. The rate in effect as of November 30, 2018 is based on the reference rate plus the displayed spread as of the security's last reset date. |
| (c) | Principal amount of security is adjusted for inflation. |
See Notes to Financial Statements.
RiverFront Dynamic Unconstrained Income ETF
| Schedule of Investments | November 30, 2018 |
| Security Description | | Principal Amount | | | Value | |
| CORPORATE BONDS (93.34%) | | | | | | | | |
| Communications (20.02%) | | | | | | | | |
| Altice Financing SA | | | | | | | | |
| 6.63%, 02/15/2023(a) | | $ | 300,000 | | | $ | 297,000 | |
| Cablevision Systems Corp. | | | | | | | | |
| 5.88%, 09/15/2022 | | | 225,000 | | | | 225,562 | |
| CCO Holdings LLC / CCO Holdings Capital Corp. | | | | | | | | |
| 5.13%, 05/01/2027(a) | | | 200,000 | | | | 190,000 | |
| CenturyLink, Inc. | | | | | | | | |
| 6.45%, 06/15/2021 | | | 250,000 | | | | 256,563 | |
| 7.50%, 04/01/2024 | | | 100,000 | | | | 102,875 | |
| Clear Channel Worldwide Holdings, Inc. | | | | | | | | |
| 6.50%, 11/15/2022 | | | 150,000 | | | | 153,045 | |
| CSC Holdings LLC | | | | | | | | |
| 5.13%, 12/15/2021(a) | | | 200,000 | | | | 199,750 | |
| 10.13%, 01/15/2023(a) | | | 200,000 | | | | 217,020 | |
| 5.38%, 07/15/2023(a) | | | 300,000 | | | | 298,500 | |
| DISH DBS Corp. | | | | | | | | |
| 5.88%, 07/15/2022 | | | 150,000 | | | | 143,625 | |
| Hughes Satellite Systems Corp. | | | | | | | | |
| 7.63%, 06/15/2021 | | | 100,000 | | | | 104,845 | |
| 6.63%, 08/01/2026 | | | 100,000 | | | | 93,500 | |
| Lamar Media Corp. | | | | | | | | |
| 5.75%, 02/01/2026 | | | 100,000 | | | | 102,125 | |
| Level 3 Financing, Inc. | | | | | | | | |
| 5.38%, 01/15/2024 | | | 150,000 | | | | 147,599 | |
| Netflix, Inc. | | | | | | | | |
| 5.50%, 02/15/2022 | | | 180,000 | | | | 184,500 | |
| Outfront Media Capital LLC / Outfront Media Capital Corp. | | | | | | | | |
| 5.25%, 02/15/2022 | | | 200,000 | | | | 200,645 | |
| Sinclair Television Group, Inc. | | | | | | | | |
| 5.13%, 02/15/2027(a) | | | 100,000 | | | | 89,500 | |
| Sirius XM Radio, Inc. | | | | | | | | |
| 4.63%, 05/15/2023(a) | | | 150,000 | | | | 146,100 | |
| Sprint Communications, Inc. | | | | | | | | |
| 6.00%, 11/15/2022 | | | 210,000 | | | | 210,441 | |
| Sprint Corp. | | | | | | | | |
| 7.88%, 09/15/2023 | | | 100,000 | | | | 105,470 | |
| 7.13%, 06/15/2024 | | | 150,000 | | | | 152,625 | |
| T-Mobile USA, Inc. | | | | | | | | |
| 6.50%, 01/15/2024 | | | 250,000 | | | | 258,125 | |
| Unitymedia GmbH | | | | | | | | |
| 6.13%, 01/15/2025(a) | | | 150,000 | | | | 153,704 | |
| Univision Communications, Inc. | | | | | | | | |
| 5.13%, 05/15/2023(a) | | | 160,000 | | | | 150,200 | |
| Viacom, Inc. | | | | | | | | |
| 3M US L + 3.895%, | | | | | | | | |
| 02/28/2057(b) | | | 160,000 | | | | 154,144 | |
| Virgin Media Finance PLC | | | | | | | | |
| 6.00%, 10/15/2024(a) | | | 150,000 | | | | 146,250 | |
| Zayo Group LLC / Zayo Capital, Inc. | | | | | | | | |
| 6.38%, 05/15/2025 | | | 137,000 | | | | 134,945 | |
| 5.75%, 01/15/2027(a) | | | 100,000 | | | | 95,750 | |
| Security Description | | Principal Amount | | | Value | |
| Communications (continued) | | | | | | | | |
| Ziggo BV | | | | | | | | |
| 5.50%, 01/15/2027(a) | | $ | 200,000 | | | $ | 186,750 | |
| Total Communications | | | | | | | 4,901,158 | |
| | | | | | | | | |
| Consumer Discretionary (9.69%) | | | | | | | | |
| ADT Security Corp. | | | | | | | | |
| 6.25%, 10/15/2021 | | | 200,000 | | | | 207,750 | |
| Aramark Services, Inc. | | | | | | | | |
| 5.13%, 01/15/2024 | | | 150,000 | | | | 151,125 | |
| Avis Budget Car Rental LLC / Avis Budget Finance, Inc. | | | | | | | | |
| 5.50%, 04/01/2023 | | | 150,000 | | | | 148,500 | |
| Boyd Gaming Corp. | | | | | | | | |
| 6.38%, 04/01/2026 | | | 200,000 | | | | 199,500 | |
| Dana, Inc. | | | | | | | | |
| 5.50%, 12/15/2024 | | | 150,000 | | | | 143,625 | |
| Hertz Corp. | | | | | | | | |
| 7.63%, 06/01/2022(a) | | | 100,000 | | | | 98,500 | |
| International Game Technology PLC | | | | | | | | |
| 6.25%, 02/15/2022(a) | | | 195,000 | | | | 201,825 | |
| KB Home | | | | | | | | |
| 7.50%, 09/15/2022 | | | 127,000 | | | | 132,715 | |
| LKQ Corp. | | | | | | | | |
| 4.75%, 05/15/2023 | | | 150,000 | | | | 143,625 | |
| Mattamy Group Corp. | | | | | | | | |
| 6.88%, 12/15/2023(a) | | | 100,000 | | | | 96,500 | |
| MGM Resorts International | | | | | | | | |
| 6.63%, 12/15/2021 | | | 100,000 | | | | 105,000 | |
| Scientific Games International, Inc. | | | | | | | | |
| 10.00%, 12/01/2022 | | | 150,000 | | | | 155,985 | |
| ServiceMaster Co. LLC | | | | | | | | |
| 5.13%, 11/15/2024(a) | | | 175,000 | | | | 168,875 | |
| Toll Brothers Finance Corp. | | | | | | | | |
| 4.88%, 03/15/2027 | | | 100,000 | | | | 92,900 | |
| Wynn Las Vegas LLC / Wynn Las Vegas Capital Corp. | | | | | | | | |
| 5.50%, 03/01/2025(a) | | | 150,000 | | | | 143,250 | |
| Wynn Macau, Ltd. | | | | | | | | |
| 4.88%, 10/01/2024(a) | | | 200,000 | | | | 182,000 | |
| Total Consumer Discretionary | | | | | | | 2,371,675 | |
| | | | | | | | | |
| Consumer Staples (3.78%) | | | | | | | | |
| B&G Foods, Inc. | | | | | | | | |
| 5.25%, 04/01/2025 | | | 200,000 | | | | 189,770 | |
| JBS Investments GmbH | | | | | | | | |
| 7.25%, 04/03/2024(a) | | | 200,000 | | | | 201,470 | |
| Pilgrim's Pride Corp. | | | | | | | | |
| 5.75%, 03/15/2025(a) | | | 150,000 | | | | 146,625 | |
| Post Holdings, Inc. | | | | | | | | |
| 5.50%, 03/01/2025(a) | | | 100,000 | | | | 95,750 | |
| Spectrum Brands, Inc. | | | | | | | | |
| 5.75%, 07/15/2025 | | | 150,000 | | | | 142,688 | |
See Notes to Financial Statements.
RiverFront Dynamic Unconstrained Income ETF
| Schedule of Investments | November 30, 2018 |
| Security Description | | Principal Amount | | | Value | |
| Consumer Staples (continued) | | | | | | | | |
| TreeHouse Foods, Inc. | | | | | | | | |
| 6.00%, 02/15/2024(a) | | $ | 150,000 | | | $ | 148,875 | |
| Total Consumer Staples | | | | | | | 925,178 | |
| | | | | | | | | |
| Energy (13.46%) | | | | | | | | |
| Antero Resources Corp. | | | | | | | | |
| 5.38%, 11/01/2021 | | | 175,000 | | | | 174,781 | |
| Ascent Resources Utica Holdings LLC / ARU Finance Corp. | | | | | | | | |
| 10.00%, 04/01/2022(a) | | | 195,000 | | | | 207,187 | |
| Bruin E&P Partners LLC | | | | | | | | |
| 8.88%, 08/01/2023(a) | | | 100,000 | | | | 93,375 | |
| Callon Petroleum Co. | | | | | | | | |
| 6.38%, 07/01/2026 | | | 100,000 | | | | 96,750 | |
| Chesapeake Energy Corp. | | | | | | | | |
| 8.00%, 01/15/2025 | | | 150,000 | | | | 144,937 | |
| Citgo Holding, Inc. | | | | | | | | |
| 10.75%, 02/15/2020(a) | | | 200,000 | | | | 207,000 | |
| CNX Resources Corp. | | | | | | | | |
| 5.88%, 04/15/2022 | | | 150,000 | | | | 147,188 | |
| CrownRock LP / CrownRock Finance, Inc. | | | | | | | | |
| 5.63%, 10/15/2025(a) | | | 100,000 | | | | 94,000 | |
| Endeavor Energy Resources LP / EER Finance, Inc. | | | | | | | | |
| 5.50%, 01/30/2026(a) | | | 150,000 | | | | 154,875 | |
| Gulfport Energy Corp. | | | | | | | | |
| 6.00%, 10/15/2024 | | | 150,000 | | | | 138,000 | |
| Murphy Oil Corp. | | | | | | | | |
| 5.75%, 08/15/2025 | | | 150,000 | | | | 145,035 | |
| Nabors Industries, Inc. | | | | | | | | |
| 5.75%, 02/01/2025 | | | 50,000 | | | | 40,687 | |
| Parkland Fuel Corp. | | | | | | | | |
| 6.00%, 04/01/2026(a) | | | 150,000 | | | | 145,875 | |
| Parsley Energy LLC / Parsley Finance Corp. | | | | | | | | |
| 5.38%, 01/15/2025(a) | | | 150,000 | | | | 144,375 | |
| Peabody Energy Corp. | | | | | | | | |
| 6.00%, 03/31/2022(a) | | | 100,000 | | | | 99,188 | |
| Range Resources Corp. | | | | | | | | |
| 5.00%, 08/15/2022 | | | 160,000 | | | | 152,200 | |
| Rowan Cos., Inc. | | | | | | | | |
| 4.88%, 06/01/2022 | | | 100,000 | | | | 90,375 | |
| SESI LLC | | | | | | | | |
| 7.13%, 12/15/2021 | | | 100,000 | | | | 94,750 | |
| SM Energy Co. | | | | | | | | |
| 6.13%, 11/15/2022 | | | 143,000 | | | | 141,213 | |
| Sunoco LP / Sunoco Finance Corp. | | | | | | | | |
| 5.50%, 02/15/2026(a) | | | 150,000 | | | | 143,250 | |
| Targa Resources Partners LP / Targa Resources Partners Finance Corp. | | | | | | | | |
| 5.88%, 04/15/2026(a) | | | 150,000 | | | | 150,000 | |
| Transocean, Inc. | | | | | | | | |
| 9.00%, 07/15/2023(a) | | | 100,000 | | | | 102,875 | |
| Security Description | | Principal Amount | | | Value | |
| Energy (continued) | | | | | | | | |
| USA Compression Partners LP / USA Compression Finance Corp. | | | | | | | | |
| 6.88%, 04/01/2026(a) | | $ | 150,000 | | | $ | 147,000 | |
| Whiting Petroleum Corp. | | | | | | | | |
| 6.63%, 01/15/2026 | | | 100,000 | | | | 96,750 | |
| WPX Energy, Inc. | | | | | | | | |
| 5.75%, 06/01/2026 | | | 150,000 | | | | 144,750 | |
| Total Energy | | | | | | | 3,296,416 | |
| | | | | | | | | |
| Financials (10.58%) | | | | | | | | |
| Ally Financial, Inc. | | | | | | | | |
| 5.75%, 11/20/2025 | | | 200,000 | | | | 205,250 | |
| CIT Group, Inc. | | | | | | | | |
| 5.00%, 08/15/2022 | | | 236,000 | | | | 237,482 | |
| 5.25%, 03/07/2025 | | | 75,000 | | | | 75,548 | |
| Equinix, Inc. | | | | | | | | |
| 5.75%, 01/01/2025 | | | 150,000 | | | | 153,345 | |
| First Data Corp. | | | | | | | | |
| 5.38%, 08/15/2023(a) | | | 150,000 | | | | 151,312 | |
| Genworth Holdings, Inc. | | | | | | | | |
| 7.70%, 06/15/2020 | | | 200,000 | | | | 204,500 | |
| Icahn Enterprises LP / Icahn Enterprises Finance Corp. | | | | | | | | |
| 5.88%, 02/01/2022 | | | 150,000 | | | | 151,077 | |
| Iron Mountain, Inc. | | | | | | | | |
| 5.75%, 08/15/2024 | | | 150,000 | | | | 143,250 | |
| iStar, Inc. | | | | | | | | |
| 5.25%, 09/15/2022 | | | 150,000 | | | | 143,625 | |
| Jefferies Finance LLC / JFIN Co.- Issuer Corp. | | | | | | | | |
| 7.38%, 04/01/2020(a) | | | 174,000 | | | | 175,305 | |
| Jefferies Financial Group, Inc. | | | | | | | | |
| 5.50%, 10/18/2023 | | | 150,000 | | | | 154,004 | |
| MGM Growth Properties Operating Partnership LP / MGP Finance Co.-Issuer, Inc. | | | | | | | | |
| 5.63%, 05/01/2024 | | | 100,000 | | | | 101,360 | |
| Navient Corp. | | | | | | | | |
| 8.00%, 03/25/2020 | | | 75,000 | | | | 77,625 | |
| 6.50%, 06/15/2022 | | | 175,000 | | | | 175,875 | |
| Park Aerospace Holdings, Ltd. | | | | | | | | |
| 5.25%, 08/15/2022(a) | | | 150,000 | | | | 150,562 | |
| Springleaf Finance Corp. | | | | | | | | |
| 5.25%, 12/15/2019 | | | 140,000 | | | | 140,875 | |
| 5.63%, 03/15/2023 | | | 155,000 | | | | 149,575 | |
| Total Financials | | | | | | | 2,590,570 | |
| | | | | | | | | |
| Health Care (9.71%) | | | | | | | | |
| Avantor, Inc. | | | | | | | | |
| 6.00%, 10/01/2024(a) | | | 200,000 | | | | 198,750 | |
| Bausch Health Cos., Inc. | | | | | | | | |
| 5.50%, 03/01/2023(a) | | | 200,000 | | | | 194,000 | |
| 6.13%, 04/15/2025(a) | | | 100,000 | | | | 94,120 | |
| Centene Corp. | | | | | | | | |
| 6.13%, 02/15/2024 | | | 200,000 | | | | 208,480 | |
See Notes to Financial Statements.
RiverFront Dynamic Unconstrained Income ETF
| Schedule of Investments | November 30, 2018 |
| Security Description | | Principal Amount | | | Value | |
| Health Care (continued) | | | | | | | | |
| CHS/Community Health Systems, Inc. | | | | | | | | |
| 5.13%, 08/01/2021 | | $ | 210,000 | | | $ | 199,894 | |
| DaVita, Inc. | | | | | | | | |
| 5.00%, 05/01/2025 | | | 200,000 | | | | 188,250 | |
| Encompass Health Corp. | | | | | | | | |
| 5.75%, 11/01/2024 | | | 180,000 | | | | 179,775 | |
| HCA, Inc. | | | | | | | | |
| 5.88%, 05/01/2023 | | | 225,000 | | | | 233,438 | |
| Kinetic Concepts, Inc. / KCI USA, Inc. | | | | | | | | |
| 7.88%, 02/15/2021(a) | | | 259,000 | | | | 263,856 | |
| Mallinckrodt International Finance SA / Mallinckrodt CB LLC | | | | | | | | |
| 5.63%, 10/15/2023(a) | | | 150,000 | | | | 129,000 | |
| Tenet Healthcare Corp. | | | | | | | | |
| 4.38%, 10/01/2021 | | | 200,000 | | | | 198,500 | |
| 8.13%, 04/01/2022 | | | 100,000 | | | | 104,375 | |
| Teva Pharmaceutical Finance Netherlands III BV | | | | | | | | |
| 6.75%, 03/01/2028 | | | 181,000 | | | | 184,791 | |
| Total Health Care | | | | | | | 2,377,229 | |
| | | | | | | | | |
| Industrials (6.73%) | | | | | | | | |
| Bombardier, Inc. | | | | | | | | |
| 7.75%, 03/15/2020(a) | | | 125,000 | | | | 127,812 | |
| 6.13%, 01/15/2023(a) | | | 100,000 | | | | 95,250 | |
| Covanta Holding Corp. | | | | | | | | |
| 5.88%, 03/01/2024 | | | 150,000 | | | | 144,938 | |
| Energizer Gamma Acquisition, Inc. | | | | | | | | |
| 6.38%, 07/15/2026(a) | | | 150,000 | | | | 141,375 | |
| Novelis Corp. | | | | | | | | |
| 6.25%, 08/15/2024(a) | | | 150,000 | | | | 148,875 | |
| Terex Corp. | | | | | | | | |
| 5.63%, 02/01/2025(a) | | | 200,000 | | | | 184,310 | |
| TransDigm, Inc. | | | | | | | | |
| 6.00%, 07/15/2022 | | | 200,000 | | | | 200,500 | |
| United Rentals North America, Inc. | | | | | | | | |
| 5.75%, 11/15/2024 | | | 150,000 | | | | 149,625 | |
| 5.88%, 09/15/2026 | | | 100,000 | | | | 97,500 | |
| WESCO Distribution, Inc. | | | | | | | | |
| 5.38%, 06/15/2024 | | | 150,000 | | | | 144,563 | |
| XPO Logistics, Inc. | | | | | | | | |
| 6.50%, 06/15/2022(a) | | | 209,000 | | | | 213,441 | |
| Total Industrials | | | | | | | 1,648,189 | |
| | | | | | | | | |
| Materials (10.55%) | | | | | | | | |
| AK Steel Corp. | | | | | | | | |
| 7.63%, 10/01/2021 | | | 100,000 | | | | 96,000 | |
| 7.50%, 07/15/2023 | | | 164,000 | | | | 166,050 | |
| Allegheny Technologies, Inc. | | | | | | | | |
| 5.95%, 01/15/2021 | | | 171,000 | | | | 170,572 | |
| Security Description | | Principal Amount | | | Value | |
| Materials (continued) | | | | | | | | |
| Ardagh Packaging Finance PLC / Ardagh Holdings USA, Inc. | | | | | | | | |
| 7.25%, 05/15/2024(a) | | $ | 150,000 | | | $ | 152,062 | |
| BWAY Holding Co. | | | | | | | | |
| 5.50%, 04/15/2024(a) | | | 150,000 | | | | 144,187 | |
| Cascades, Inc. | | | | | | | | |
| 5.50%, 07/15/2022(a) | | | 199,000 | | | | 198,005 | |
| Chemours Co. | | | | | | | | |
| 7.00%, 05/15/2025 | | | 200,000 | | | | 203,500 | |
| FMG Resources August 2006 Pty, Ltd. | | | | | | | | |
| 5.13%, 03/15/2023(a) | | | 150,000 | | | | 142,500 | |
| Freeport-McMoRan, Inc. | | | | | | | | |
| 3.88%, 03/15/2023 | | | 150,000 | | | | 140,063 | |
| Koppers, Inc. | | | | | | | | |
| 6.00%, 02/15/2025(a) | | | 100,000 | | | | 90,000 | |
| NOVA Chemicals Corp. | | | | | | | | |
| 5.25%, 06/01/2027(a) | | | 150,000 | | | | 138,000 | |
| OCI NV | | | | | | | | |
| 6.63%, 04/15/2023(a) | | | 175,000 | | | | 178,281 | |
| Owens-Brockway Glass Container, Inc. | | | | | | | | |
| 5.00%, 01/15/2022(a) | | | 150,000 | | | | 149,813 | |
| Rayonier AM Products, Inc. | | | | | | | | |
| 5.50%, 06/01/2024(a) | | | 150,000 | | | | 138,000 | |
| Reynolds Group Issuer, Inc. / Reynolds Group Issuer LLC / Reynolds Group Issuer Lu | | | | | | | | |
| 5.13%, 07/15/2023(a) | | | 190,000 | | | | 185,725 | |
| SunCoke Energy Partners LP / SunCoke Energy Partners Finance Corp. | | | | | | | | |
| 7.50%, 06/15/2025(a) | | | 150,000 | | | | 147,750 | |
| United States Steel Corp. | | | | | | | | |
| 6.88%, 08/15/2025 | | | 150,000 | | | | 142,421 | |
| Total Materials | | | | | | | 2,582,929 | |
| | | | | | | | | |
| Technology (3.78%) | | | | | | | | |
| Anixter, Inc. | | | | | | | | |
| 5.50%, 03/01/2023 | | | 150,000 | | | | 151,125 | |
| CommScope Technologies LLC | | | | | | | | |
| 6.00%, 06/15/2025(a) | | | 100,000 | | | | 93,130 | |
| Dell International LLC / EMC Corp. | | | | | | | | |
| 5.88%, 06/15/2021(a) | | | 150,000 | | | | 152,465 | |
| 7.13%, 06/15/2024(a) | | | 50,000 | | | | 52,301 | |
| j2 Cloud Services LLC / j2 Global Co.-Obligor, Inc. | | | | | | | | |
| 6.00%, 07/15/2025(a) | | | 171,000 | | | | 171,641 | |
| NCR Corp. | | | | | | | | |
| 5.00%, 07/15/2022 | | | 164,000 | | | | 156,620 | |
| Nielsen Finance LLC / Nielsen Finance Co. | | | | | | | | |
| 5.00%, 04/15/2022(a) | | | 150,000 | | | | 147,060 | |
| Total Technology | | | | | | | 924,342 | |
See Notes to Financial Statements.
RiverFront Dynamic Unconstrained Income ETF
| Schedule of Investments | November 30, 2018 |
| Security Description | | Principal Amount | | | Value | |
| Utilities (5.04%) | | | | | | |
| AmeriGas Partners LP / AmeriGas Finance Corp. | | | | | | | | |
| 5.75%, 05/20/2027 | | $ | 150,000 | | | $ | 136,267 | |
| Calpine Corp. | | | | | | | | |
| 5.38%, 01/15/2023 | | | 200,000 | | | | 190,000 | |
| Cemig Geracao e Transmissao SA | | | | | | | | |
| 9.25%, 12/05/2024(a) | | | 150,000 | | | | 159,892 | |
| NGL Energy Partners LP / NGL Energy Finance Corp. | | | | | | | | |
| 6.13%, 03/01/2025 | | | 185,000 | | | | 165,575 | |
| NRG Energy, Inc. | | | | | | | | |
| 6.63%, 01/15/2027 | | | 175,000 | | | | 178,924 | |
| Suburban Propane Partners LP/Suburban Energy Finance Corp. | | | | | | | | |
| 5.50%, 06/01/2024 | | | 150,000 | | | | 142,875 | |
| Vistra Energy Corp. | | | | | | | | |
| 7.38%, 11/01/2022 | | | 250,000 | | | | 260,000 | |
| Total Utilities | | | | | | | 1,233,533 | |
| | | | | | | | | |
| TOTAL CORPORATE BONDS | | | | | | | | |
| (Cost $23,268,684) | | | | | | | 22,851,219 | |
| | | 7 Day Yield | | | Shares | | | Value | |
| SHORT TERM INVESTMENTS (5.17%) | | | | | | | | | | | | |
| State Street Institutional Treasury Plus Money Market Fund | | | 2.146 | % | | | 1,264,915 | | | | 1,264,915 | |
| TOTAL SHORT TERM INVESTMENTS | | | | | | | | | | | | |
| (Cost $1,264,915) | | | | | | | | | | | 1,264,915 | |
| | | | | | | | | | | | | |
| TOTAL INVESTMENTS (98.51%) | | | | | | | | | | | | |
| (Cost $24,533,599) | | | | | | | | | | $ | 24,116,134 | |
| OTHER ASSETS IN EXCESS OF LIABILITIES (1.49%) | | | | | | | | | | | 364,823 | |
| NET ASSETS - 100.00% | | | | | | | | | | $ | 24,480,957 | |
Investment Abbreviations:
LIBOR - London Interbank Offered Rate
LIBOR Rate:
3M US L - 3 Month LIBOR as of November 30, 2018 was 2.74%
| (a) | Securities exempt from registration under Rule 144A of the Securities Act of 1933. These securities may be sold in the ordinary course of business in transactions exempt from registration, normally to qualified institutional buyers. At period end, the aggregate market value of those securities was $10,051,974, representing 41.06% of net assets. |
| (b) | Floating or variable rate security. The reference rate is described above. The rate in effect as of November 30, 2018 is based on the reference rate plus the displayed spread as of the security's last reset date. |
See Notes to Financial Statements.
RiverFront Dynamic US Dividend Advantage ETF
| Schedule of Investments | November 30, 2018 |
| Security Description | | Shares | | | Value | |
| COMMON STOCKS (99.82%) | | | | | | | | |
| Communication Services (6.56%) | | | | | | | | |
| AT&T, Inc. | | | 39,361 | | | $ | 1,229,638 | |
| CenturyLink, Inc. | | | 52,936 | | | | 995,197 | |
| Facebook, Inc., Class A(a) | | | 8,565 | | | | 1,204,325 | |
| Meredith Corp. | | | 22,485 | | | | 1,287,491 | |
| Netflix, Inc.(a) | | | 8,734 | | | | 2,499,059 | |
| TripAdvisor, Inc.(a) | | | 33,486 | | | | 2,145,113 | |
| Verizon Communications, Inc. | | | 9,388 | | | | 566,096 | |
| Total Communication Services | | | | | | | 9,926,919 | |
| | | | | | | | | |
| Consumer Discretionary (12.46%) | | | | | | | | |
| Abercrombie & Fitch Co., Class A | | | 63,387 | | | | 1,325,422 | |
| Amazon.com, Inc.(a) | | | 3,337 | | | | 5,640,097 | |
| Best Buy Co., Inc. | | | 15,641 | | | | 1,010,252 | |
| Dana, Inc. | | | 54,260 | | | | 787,313 | |
| Expedia Group, Inc. | | | 9,284 | | | | 1,121,414 | |
| Ford Motor Co. | | | 101,115 | | | | 951,492 | |
| H&R Block, Inc. | | | 60,171 | | | | 1,625,219 | |
| Kohl's Corp. | | | 15,225 | | | | 1,022,663 | |
| Modine Manufacturing Co.(a) | | | 54,454 | | | | 710,625 | |
| NVR, Inc.(a) | | | 295 | | | | 722,750 | |
| Six Flags Entertainment Corp. | | | 13,091 | | | | 803,264 | |
| Thor Industries, Inc. | | | 11,381 | | | | 771,746 | |
| Tiffany & Co. | | | 10,358 | | | | 942,578 | |
| Tupperware Brands Corp. | | | 37,313 | | | | 1,416,401 | |
| Total Consumer Discretionary | | | | | | | 18,851,236 | |
| | | | | | | | | |
| Consumer Staples (4.34%) | | | | | | | | |
| Edgewell Personal Care Co.(a) | | | 21,828 | | | | 912,411 | |
| Molson Coors Brewing Co., Class B | | | 15,206 | | | | 1,000,099 | |
| Philip Morris International, Inc. | | | 12,155 | | | | 1,051,772 | |
| TreeHouse Foods, Inc.(a) | | | 19,528 | | | | 1,027,173 | |
| Unilever NV | | | 18,179 | | | | 1,009,116 | |
| Walgreens Boots Alliance, Inc. | | | 11,457 | | | | 970,064 | |
| Walmart, Inc. | | | 6,105 | | | | 596,153 | |
| Total Consumer Staples | | | | | | | 6,566,788 | |
| | | | | | | | | |
| Energy (5.43%) | | | | | | | | |
| Chevron Corp. | | | 12,741 | | | | 1,515,415 | |
| Exxon Mobil Corp. | | | 22,200 | | | | 1,764,900 | |
| Marathon Petroleum Corp. | | | 9,653 | | | | 628,989 | |
| Occidental Petroleum Corp. | | | 14,579 | | | | 1,024,466 | |
| ONEOK, Inc. | | | 17,848 | | | | 1,096,403 | |
| PBF Energy, Inc., Class A | | | 15,884 | | | | 614,393 | |
| Phillips 66 | | | 6,625 | | | | 619,570 | |
| Williams Cos., Inc. | | | 37,218 | | | | 942,360 | |
| Total Energy | | | | | | | 8,206,496 | |
| | | | | | | | | |
| Financials (16.48%) | | | | | | | | |
| Ameriprise Financial, Inc. | | | 8,171 | | | | 1,060,187 | |
| Bank of America Corp. | | | 63,257 | | | | 1,796,499 | |
| Cboe Global Markets, Inc. | | | 11,363 | | | | 1,222,886 | |
| Cullen/Frost Bankers, Inc. | | | 7,382 | | | | 740,562 | |
| Security Description | | Shares | | | Value | |
| Financials (continued) | | | | | | | | |
| Discover Financial Services | | | 15,892 | | | $ | 1,133,100 | |
| Everest Re Group, Ltd. | | | 5,771 | | | | 1,281,624 | |
| Fifth Third Bancorp | | | 49,735 | | | | 1,389,098 | |
| Goldman Sachs Group, Inc. | | | 7,110 | | | | 1,355,806 | |
| JPMorgan Chase & Co. | | | 23,422 | | | | 2,604,292 | |
| M&T Bank Corp. | | | 1,098 | | | | 185,573 | |
| MetLife, Inc. | | | 26,321 | | | | 1,174,706 | |
| Morgan Stanley | | | 27,045 | | | | 1,200,527 | |
| Navient Corp. | | | 116,106 | | | | 1,335,219 | |
| New York Community Bancorp, Inc. | | | 57,211 | | | | 608,153 | |
| Northern Trust Corp. | | | 9,360 | | | | 928,793 | |
| Old Republic International Corp. | | | 49,604 | | | | 1,118,570 | |
| Principal Financial Group, Inc. | | | 21,252 | | | | 1,048,149 | |
| Prudential Financial, Inc. | | | 7,963 | | | | 746,611 | |
| Regions Financial Corp. | | | 69,463 | | | | 1,142,666 | |
| SunTrust Banks, Inc. | | | 19,649 | | | | 1,231,796 | |
| Synchrony Financial | | | 47,666 | | | | 1,238,363 | |
| Wells Fargo & Co. | | | 7,204 | | | | 391,033 | |
| Total Financials | | | | | | | 24,934,213 | |
| | | | | | | | | |
| Health Care (13.38%) | | | | | | | | |
| AbbVie, Inc. | | | 20,589 | | | | 1,940,925 | |
| Agilent Technologies, Inc. | | | 14,087 | | | | 1,019,194 | |
| Amgen, Inc. | | | 12,420 | | | | 2,586,465 | |
| Biogen, Inc.(a) | | | 4,014 | | | | 1,339,552 | |
| Bristol-Myers Squibb Co. | | | 28,958 | | | | 1,548,095 | |
| CVS Health Corp. | | | 11,380 | | | | 912,676 | |
| Edwards Lifesciences Corp.(a) | | | 7,898 | | | | 1,279,555 | |
| Eli Lilly & Co. | | | 22,831 | | | | 2,708,670 | |
| IDEXX Laboratories, Inc.(a) | | | 3,969 | | | | 808,723 | |
| Nektar Therapeutics(a) | | | 13,928 | | | | 562,552 | |
| Pfizer, Inc. | | | 14,343 | | | | 663,077 | |
| Quest Diagnostics, Inc. | | | 12,338 | | | | 1,092,777 | |
| Thermo Fisher Scientific, Inc. | | | 5,076 | | | | 1,266,716 | |
| Waters Corp.(a) | | | 5,795 | | | | 1,150,771 | |
| Zoetis, Inc. | | | 14,522 | | | | 1,363,180 | |
| Total Health Care | | | | | | | 20,242,928 | |
| | | | | | | | | |
| Industrials (6.96%) | | | | | | | | |
| AO Smith Corp. | | | 11,723 | | | | 555,436 | |
| Avis Budget Group, Inc.(a) | | | 24,199 | | | | 708,789 | |
| Cummins, Inc. | | | 12,103 | | | | 1,828,279 | |
| Eaton Corp. PLC | | | 2,961 | | | | 227,819 | |
| Honeywell International, Inc. | | | 12,002 | | | | 1,761,293 | |
| Lennox International, Inc. | | | 5,453 | | | | 1,231,887 | |
| Matson, Inc. | | | 38,543 | | | | 1,516,667 | |
| Pitney Bowes, Inc. | | | 66,256 | | | | 559,201 | |
| Rockwell Automation, Inc. | | | 7,080 | | | | 1,234,327 | |
| Ryder System, Inc. | | | 16,070 | | | | 909,080 | |
| Total Industrials | | | | | | | 10,532,778 | |
| | | | | | | | | |
| Information Technology (16.87%) | | | | | | | | |
| Accenture PLC, Class A | | | 11,557 | | | | 1,901,358 | |
| Apple, Inc. | | | 25,774 | | | | 4,602,721 | |
| Broadcom, Inc. | | | 7,760 | | | | 1,842,302 | |
See Notes to Financial Statements.
RiverFront Dynamic US Dividend Advantage ETF
| Schedule of Investments | November 30, 2018 |
| Security Description | | Shares | | | Value | |
| Information Technology (continued) | | | | | | | | |
| Cadence Design Systems, Inc.(a) | | | 27,320 | | | $ | 1,230,493 | |
| CommVault Systems, Inc.(a) | | | 21,281 | | | | 1,254,302 | |
| Cypress Semiconductor Corp. | | | 75,867 | | | | 1,054,551 | |
| InterDigital, Inc. | | | 12,982 | | | | 977,025 | |
| Intuit, Inc. | | | 5,170 | | | | 1,109,120 | |
| j2 Global, Inc. | | | 13,101 | | | | 966,985 | |
| Juniper Networks, Inc. | | | 29,027 | | | | 833,365 | |
| KLA-Tencor Corp. | | | 13,263 | | | | 1,307,201 | |
| Lam Research Corp. | | | 4,459 | | | | 699,885 | |
| Manhattan Associates, Inc.(a) | | | 28,967 | | | | 1,434,735 | |
| Micron Technology, Inc.(a) | | | 23,327 | | | | 899,489 | |
| National Instruments Corp. | | | 34,221 | | | | 1,675,460 | |
| NVIDIA Corp. | | | 2,983 | | | | 487,512 | |
| Texas Instruments, Inc. | | | 22,603 | | | | 2,256,910 | |
| Western Digital Corp. | | | 21,669 | | | | 983,556 | |
| Total Information Technology | | | | | | | 25,516,970 | |
| | | | | | | | | |
| Materials (3.09%) | | | | | | | | |
| CF Industries Holdings, Inc. | | | 25,124 | | | | 1,059,982 | |
| Freeport-McMoRan, Inc. | | | 43,737 | | | | 522,220 | |
| Linde PLC | | | 6,138 | | | | 976,249 | |
| LyondellBasell Industries NV, Class A | | | 12,300 | | | | 1,147,713 | |
| Westrock Co. | | | 20,668 | | | | 973,669 | |
| Total Materials | | | | | | | 4,679,833 | |
| | | | | | | | | |
| Real Estate (6.81%) | | | | | | | | |
| CoreCivic, Inc. | | | 54,272 | | | | 1,191,270 | |
| Hospitality Properties Trust | | | 44,499 | | | | 1,194,353 | |
| Iron Mountain, Inc. | | | 23,023 | | | | 782,091 | |
| Kimco Realty Corp. | | | 47,726 | | | | 780,320 | |
| Macerich Co. | | | 22,681 | | | | 1,140,628 | |
| RMR Group, Inc., Class A | | | 10,195 | | | | 659,005 | |
| SITE Centers Corp. | | | 85,650 | | | | 1,065,486 | |
| Tanger Factory Outlet Centers, Inc. | | | 46,423 | | | | 1,097,904 | |
| The GEO Group, Inc. | | | 54,132 | | | | 1,258,028 | |
| Uniti Group, Inc. | | | 57,160 | | | | 1,139,199 | |
| Total Real Estate | | | | | | | 10,308,284 | |
| | | | | | | | | |
| Utilities (7.44%) | | | | | | | | |
| AES Corp. | | | 64,863 | | | | 1,004,728 | |
| Black Hills Corp. | | | 18,949 | | | | 1,254,613 | |
| Dominion Energy, Inc. | | | 16,250 | | | | 1,210,625 | |
| Duke Energy Corp. | | | 13,875 | | | | 1,228,909 | |
| FirstEnergy Corp. | | | 32,408 | | | | 1,225,995 | |
| PG&E Corp.(a) | | | 20,596 | | | | 543,322 | |
| PPL Corp. | | | 37,204 | | | | 1,138,070 | |
| SCANA Corp. | | | 34,147 | | | | 1,593,299 | |
| Sempra Energy | | | 9,672 | | | | 1,114,408 | |
| Security Description | | Shares | | | Value | |
| Utilities (continued) | | | | | | | | |
| Southern Co. | | | 19,806 | | | $ | 937,418 | |
| Total Utilities | | | | | | | 11,251,387 | |
| | | | | | | | | |
| TOTAL COMMON STOCKS | | | | | | | | |
| (Cost $154,594,094) | | | | | | | 151,017,832 | |
| | | | | | | | | |
| TOTAL INVESTMENTS (99.82%) | | | | | | | | |
| (Cost $154,594,094) | | | | | | $ | 151,017,832 | |
| OTHER ASSETS IN EXCESS OF LIABILITIES (0.18%) | | | | | | | 274,797 | |
| NET ASSETS - 100.00% | | | | | | $ | 151,292,629 | |
| (a) | Non-income producing security. |
See Notes to Financial Statements.
RiverFront Dynamic US Flex-Cap ETF
| Schedule of Investments | November 30, 2018 |
| Security Description | | Shares | | | Value | |
| COMMON STOCKS (99.91%) | | | | | | | | |
| Communication Services (9.36%) | | | | | | | | |
| Alphabet, Inc., Class C(a) | | | 5,108 | | | $ | 5,629,677 | |
| CBS Corp., Class B | | | 19,858 | | | | 1,075,907 | |
| Charter Communications, Inc., Class A(a) | | | 4,119 | | | | 1,355,975 | |
| Comcast Corp., Class A | | | 51,519 | | | | 2,009,756 | |
| Facebook, Inc., Class A(a) | | | 19,381 | | | | 2,725,162 | |
| Netflix, Inc.(a) | | | 5,178 | | | | 1,481,581 | |
| Total Communication Services | | | | | | | 14,278,058 | |
| | | | | | | | | |
| Consumer Discretionary (14.99%) | | | | | | | | |
| Abercrombie & Fitch Co., Class A | | | 52,633 | | | | 1,100,556 | |
| Amazon.com, Inc.(a) | | | 2,776 | | | | 4,691,912 | |
| Best Buy Co., Inc. | | | 14,287 | | | | 922,797 | |
| DSW, Inc., Class A | | | 33,133 | | | | 919,110 | |
| Expedia Group, Inc. | | | 8,363 | | | | 1,010,167 | |
| Fox Factory Holding Corp.(a) | | | 15,000 | | | | 955,650 | |
| Genesco, Inc.(a) | | | 20,868 | | | | 871,448 | |
| H&R Block, Inc. | | | 41,535 | | | | 1,121,860 | |
| Home Depot, Inc. | | | 10,913 | | | | 1,967,832 | |
| Kohl's Corp. | | | 13,526 | | | | 908,541 | |
| PVH Corp. | | | 7,708 | | | | 851,811 | |
| Shoe Carnival, Inc. | | | 25,521 | | | | 968,012 | |
| Shutterfly, Inc.(a) | | | 14,097 | | | | 704,709 | |
| Signet Jewelers, Ltd. | | | 20,007 | | | | 1,054,369 | |
| Tailored Brands, Inc. | | | 40,878 | | | | 936,106 | |
| Tiffany & Co. | | | 8,560 | | | | 778,960 | |
| Ulta Beauty, Inc.(a) | | | 3,895 | | | | 1,159,892 | |
| Yum! Brands, Inc. | | | 13,184 | | | | 1,215,829 | |
| Zumiez, Inc.(a) | | | 35,896 | | | | 707,869 | |
| Total Consumer Discretionary | | | | | | | 22,847,430 | |
| | | | | | | | | |
| Consumer Staples (4.48%) | | | | | | | | |
| Philip Morris International, Inc. | | | 20,828 | | | | 1,802,247 | |
| Procter & Gamble Co. | | | 25,601 | | | | 2,419,551 | |
| Unilever NV | | | 17,791 | | | | 987,578 | |
| Walmart, Inc. | | | 16,645 | | | | 1,625,384 | |
| Total Consumer Staples | | | | | | | 6,834,760 | |
| | | | | | | | | |
| Energy (8.26%) | | | | | | | | |
| Baker Hughes, a GE Co. | | | 33,577 | | | | 766,227 | |
| Chevron Corp. | | | 11,662 | | | | 1,387,078 | |
| Ensco PLC, Class A | | | 136,112 | | | | 771,755 | |
| Exxon Mobil Corp. | | | 34,768 | | | | 2,764,056 | |
| ION Geophysical Corp.(a) | | | 27,201 | | | | 240,729 | |
| Kinder Morgan, Inc. | | | 64,698 | | | | 1,104,395 | |
| Marathon Petroleum Corp. | | | 14,463 | | | | 942,409 | |
| National Oilwell Varco, Inc. | | | 24,449 | | | | 785,058 | |
| Phillips 66 | | | 11,064 | | | | 1,034,705 | |
| Schlumberger Ltd. | | | 23,869 | | | | 1,076,492 | |
| Transocean, Ltd.(a) | | | 90,172 | | | | 836,796 | |
| Valero Energy Corp. | | | 11,010 | | | | 879,699 | |
| Total Energy | | | | | | | 12,589,399 | |
| Security Description | | Shares | | | Value | |
| Financials (10.55%) | | | | | | |
| Bank of America Corp. | | | 85,043 | | | $ | 2,415,221 | |
| Brighthouse Financial, Inc.(a) | | | 24,275 | | | | 977,312 | |
| Capstead Mortgage Corp. | | | 123,308 | | | | 953,171 | |
| Citigroup, Inc. | | | 10,931 | | | | 708,219 | |
| Everest Re Group, Ltd. | | | 4,703 | | | | 1,044,442 | |
| Genworth Financial, Inc., Class A(a) | | | 252,804 | | | | 1,178,067 | |
| Goldman Sachs Group, Inc. | | | 6,326 | | | | 1,206,305 | |
| JPMorgan Chase & Co. | | | 27,294 | | | | 3,034,820 | |
| Maiden Holdings, Ltd. | | | 93,242 | | | | 235,902 | |
| Morgan Stanley | | | 28,568 | | | | 1,268,134 | |
| PNC Financial Services Group, Inc. | | | 9,730 | | | | 1,321,139 | |
| Prudential Financial, Inc. | | | 12,389 | | | | 1,161,593 | |
| Synchrony Financial | | | 10,476 | | | | 272,166 | |
| Wells Fargo & Co. | | | 5,587 | | | | 303,262 | |
| Total Financials | | | | | | | 16,079,753 | |
| | | | | | | | | |
| Health Care (11.45%) | | | | | | | | |
| Abbott Laboratories | | | 24,143 | | | | 1,787,789 | |
| Amgen, Inc. | | | 8,561 | | | | 1,782,828 | |
| Bristol-Myers Squibb Co. | | | 25,096 | | | | 1,341,632 | |
| Cardinal Health, Inc. | | | 20,627 | | | | 1,130,978 | |
| Eli Lilly & Co. | | | 15,080 | | | | 1,789,091 | |
| Endo International PLC(a) | | | 65,650 | | | | 789,770 | |
| Gilead Sciences, Inc. | | | 20,940 | | | | 1,506,424 | |
| Johnson & Johnson | | | 21,628 | | | | 3,177,153 | |
| Thermo Fisher Scientific, Inc. | | | 6,399 | | | | 1,596,871 | |
| UnitedHealth Group, Inc. | | | 9,070 | | | | 2,551,935 | |
| Total Health Care | | | | | | | 17,454,471 | |
| | | | | | | | | |
| Industrials (17.21%) | | | | | | | | |
| AECOM(a) | | | 32,936 | | | | 1,059,222 | |
| ArcBest Corp. | | | 26,343 | | | | 1,060,569 | |
| Arconic, Inc. | | | 52,364 | | | | 1,124,779 | |
| Boeing Co. | | | 221 | | | | 76,634 | |
| CSX Corp. | | | 18,280 | | | | 1,327,676 | |
| Cummins, Inc. | | | 7,774 | | | | 1,174,340 | |
| Echo Global Logistics, Inc.(a) | | | 29,198 | | | | 740,753 | |
| Esterline Technologies Corp.(a) | | | 11,466 | | | | 1,361,358 | |
| Fluor Corp. | | | 17,963 | | | | 735,226 | |
| Hillenbrand, Inc. | | | 19,881 | | | | 880,927 | |
| Honeywell International, Inc. | | | 10,486 | | | | 1,538,821 | |
| Hub Group, Inc., Class A(a) | | | 21,408 | | | | 951,372 | |
| Illinois Tool Works, Inc. | | | 8,571 | | | | 1,191,798 | |
| Kaman Corp. | | | 15,933 | | | | 904,516 | |
| KBR, Inc. | | | 51,458 | | | | 955,575 | |
| Matson, Inc. | | | 27,378 | | | | 1,077,324 | |
| Nordson Corp. | | | 7,534 | | | | 907,169 | |
| Norfolk Southern Corp. | | | 6,916 | | | | 1,180,838 | |
| Northrop Grumman Corp. | | | 4,100 | | | | 1,065,508 | |
| Old Dominion Freight Line, Inc. | | | 2,564 | | | | 350,576 | |
| Parker-Hannifin Corp. | | | 6,087 | | | | 1,047,207 | |
| Raytheon Co. | | | 6,386 | | | | 1,119,721 | |
| Rockwell Automation, Inc. | | | 5,921 | | | | 1,032,267 | |
| SkyWest, Inc. | | | 17,246 | | | | 994,749 | |
See Notes to Financial Statements.
RiverFront Dynamic US Flex-Cap ETF
| Schedule of Investments | November 30, 2018 |
| Security Description | | Shares | | | Value | |
| Industrials (continued) | | | | | | | | |
| Tennant Co. | | | 13,543 | | | $ | 810,549 | |
| Union Pacific Corp. | | | 10,191 | | | | 1,567,172 | |
| Total Industrials | | | | | | | 26,236,646 | |
| | | | | | | | | |
| Information Technology (16.08%) | | | | | | | | |
| Alliance Data Systems Corp. | | | 4,339 | | | | 869,362 | |
| Apple, Inc. | | | 23,471 | | | | 4,191,451 | |
| Avnet, Inc. | | | 10,606 | | | | 464,755 | |
| Broadcom, Inc. | | | 6,257 | | | | 1,485,474 | |
| Broadridge Financial Solutions, Inc. | | | 2,559 | | | | 270,921 | |
| CACI International, Inc., Class A(a) | | | 5,676 | | | | 936,029 | |
| Cisco Systems, Inc. | | | 5,035 | | | | 241,026 | |
| Cognizant Technology Solutions Corp., Class A | | | 16,161 | | | | 1,151,148 | |
| LogMeIn, Inc. | | | 12,446 | | | | 1,147,895 | |
| Mastercard, Inc., Class A | | | 415 | | | | 83,444 | |
| Micron Technology, Inc.(a) | | | 28,345 | | | | 1,092,983 | |
| Microsoft Corp. | | | 33,028 | | | | 3,662,475 | |
| Science Applications International Corp. | | | 13,568 | | | | 943,247 | |
| Seagate Technology PLC | | | 22,492 | | | | 969,180 | |
| SYNNEX Corp. | | | 11,160 | | | | 901,058 | |
| Tech Data Corp.(a) | | | 14,301 | | | | 1,286,375 | |
| Total System Services, Inc. | | | 11,129 | | | | 972,341 | |
| TTEC Holdings, Inc. | | | 41,267 | | | | 1,207,060 | |
| Virtusa Corp.(a) | | | 18,605 | | | | 824,760 | |
| Western Digital Corp. | | | 18,824 | | | | 854,421 | |
| Xperi Corp. | | | 68,466 | | | | 965,371 | |
| Total Information Technology | | | | | | | 24,520,776 | |
| | | | | | | | | |
| Materials (5.98%) | | | | | | | | |
| Air Products & Chemicals, Inc. | | | 7,121 | | | | 1,145,555 | |
| Boise Cascade Co. | | | 24,713 | | | | 656,872 | |
| CF Industries Holdings, Inc. | | | 20,420 | | | | 861,520 | |
| Kraton Corp.(a) | | | 21,695 | | | | 568,409 | |
| Linde PLC | | | 7,884 | | | | 1,253,950 | |
| Louisiana-Pacific Corp. | | | 35,339 | | | | 807,850 | |
| LyondellBasell Industries NV, Class A | | | 11,727 | | | | 1,094,246 | |
| Reliance Steel & Aluminum Co. | | | 12,525 | | | | 1,007,636 | |
| Tredegar Corp. | | | 45,378 | | | | 755,997 | |
| Westrock Co. | | | 19,319 | | | | 910,118 | |
| WR Grace & Co. | | | 751 | | | | 47,944 | |
| Total Materials | | | | | | | 9,110,097 | |
| | | | | | | | | |
| Real Estate (0.56%) | | | | | | | | |
| Washington Prime Group, Inc. | | | 137,160 | | | | 857,250 | |
| | | | | | | | | |
| Utilities (0.99%) | | | | | | | | |
| PG&E Corp.(a) | | | 24,196 | | | | 638,290 | |
| Sempra Energy | | | 6,248 | | | | 719,895 | |
| Security Description | | Shares | | | Value | |
| Utilities (continued) | | | | | | | | |
| UGI Corp. | | | 2,744 | | | $ | 157,643 | |
| Total Utilities | | | | | | | 1,515,828 | |
| | | | | | | | | |
| TOTAL COMMON STOCKS | | | | | | | | |
| (Cost $160,478,806) | | | | | | | 152,324,468 | |
| | | | | | | | | |
| TOTAL INVESTMENTS (99.91%) | | | | | | | | |
| (Cost $160,478,806) | | | | | | $ | 152,324,468 | |
| OTHER ASSETS IN EXCESS OF LIABILITIES (0.09%) | | | | 140,029 | |
| NET ASSETS - 100.00% | | | | | | $ | 152,464,497 | |
| (a) | Non-income producing security. |
See Notes to Financial Statements.
RiverFront Strategic Income Fund
| Schedule of Investments | November 30, 2018 |
| Security Description | | Principal Amount | | | Value | |
| CORPORATE BONDS (93.92%) | | | | | | | | |
| Communications (15.15%) | | | | | | | | |
| Cablevision Systems Corp. | | | | | | | | |
| 8.00%, 04/15/2020 | | $ | 2,050,000 | | | $ | 2,137,125 | |
| CenturyLink, Inc. | | | | | | | | |
| 5.63%, 04/01/2020 | | | 1,967,000 | | | | 1,989,129 | |
| Charter Communications Operating LLC / Charter Communications Operating Capital | | | | | | | | |
| 3.58%, 07/23/2020 | | | 1,800,000 | | | | 1,792,478 | |
| DISH DBS Corp. | | | | | | | | |
| 7.88%, 09/01/2019 | | | 2,085,000 | | | | 2,144,944 | |
| Hughes Satellite Systems Corp. | | | | | | | | |
| 6.50%, 06/15/2019 | | | 813,000 | | | | 825,703 | |
| 7.63%, 06/15/2021 | | | 1,200,000 | | | | 1,258,140 | |
| Lamar Media Corp. | | | | | | | | |
| 5.00%, 05/01/2023 | | | 1,767,000 | | | | 1,771,417 | |
| Level 3 Financing, Inc. | | | | | | | | |
| 5.38%, 08/15/2022 | | | 1,619,000 | | | | 1,619,000 | |
| Netflix, Inc. | | | | | | | | |
| 5.38%, 02/01/2021 | | | 1,500,000 | | | | 1,537,500 | |
| Sinclair Television Group, Inc. | | | | | | | | |
| 5.38%, 04/01/2021 | | | 1,400,000 | | | | 1,403,500 | |
| Sprint Communications, Inc. | | | | | | | | |
| 7.00%, 08/15/2020 | | | 2,175,000 | | | | 2,256,563 | |
| T-Mobile USA, Inc. | | | | | | | | |
| 6.50%, 01/15/2024 | | | 1,908,000 | | | | 1,970,010 | |
| Videotron, Ltd. | | | | | | | | |
| 5.00%, 07/15/2022 | | | 1,000,000 | | | | 998,750 | |
| Virgin Media Secured Finance PLC | | | | | | | | |
| 5.25%, 01/15/2021 | | | 1,432,000 | | | | 1,453,480 | |
| Total Communications | | | | | | | 23,157,739 | |
| | | | | | | | | |
| Consumer Discretionary (9.84%) | | | | | | | | |
| ADT Security Corp. | | | | | | | | |
| 6.25%, 10/15/2021 | | | 1,550,000 | | | | 1,610,062 | |
| Allegiant Travel Co. | | | | | | | | |
| 5.50%, 07/15/2019 | | | 1,350,000 | | | | 1,356,750 | |
| American Airlines Group, Inc. | | | | | | | | |
| 5.50%, 10/01/2019(a) | | | 1,850,000 | | | | 1,870,812 | |
| DR Horton, Inc. | | | | | | | | |
| 4.38%, 09/15/2022 | | | 1,740,000 | | | | 1,744,760 | |
| International Game Technology PLC | | | | | | | | |
| 6.25%, 02/15/2022(a) | | | 1,708,000 | | | | 1,767,780 | |
| KB Home | | | | | | | | |
| 4.75%, 05/15/2019 | | | 1,600,000 | | | | 1,604,000 | |
| Lennar Corp. | | | | | | | | |
| 4.50%, 11/15/2019 | | | 1,650,000 | | | | 1,660,313 | |
| MGM Resorts International | | | | | | | | |
| 6.75%, 10/01/2020 | | | 1,800,000 | | | | 1,880,100 | |
| Service Corp. International | | | | | | | | |
| 5.38%, 01/15/2022 | | | 1,545,000 | | | | 1,555,622 | |
| Total Consumer Discretionary | | | | | | | 15,050,199 | |
| Security Description | | Principal Amount | | | Value | |
| Consumer Staples (1.29%) | | | | | | | | |
| B&G Foods, Inc. | | | | | | | | |
| 4.63%, 06/01/2021 | | $ | 1,000,000 | | | $ | 986,250 | |
| TreeHouse Foods, Inc. | | | | | | | | |
| 6.00%, 02/15/2024(a) | | | 1,000,000 | | | | 992,500 | |
| Total Consumer Staples | | | | | | | 1,978,750 | |
| | | | | | | | | |
| Energy (17.01%) | | | | | | | | |
| Antero Resources Corp. | | | | | | | | |
| 5.38%, 11/01/2021 | | | 1,500,000 | | | | 1,498,125 | |
| Concho Resources, Inc. | | | | | | | | |
| 4.38%, 01/15/2025 | | | 1,530,000 | | | | 1,497,585 | |
| Continental Resources, Inc. | | | | | | | | |
| 5.00%, 09/15/2022 | | | 1,498,000 | | | | 1,499,226 | |
| DCP Midstream Operating LP | | | | | | | | |
| 5.35%, 03/15/2020(a) | | | 1,999,000 | | | | 2,023,987 | |
| Energy Transfer LP | | | | | | | | |
| 7.50%, 10/15/2020 | | | 1,625,000 | | | | 1,718,437 | |
| Kinder Morgan Energy Partners LP | | | | | | | | |
| 5.00%, 10/01/2021 | | | 1,270,000 | | | | 1,296,291 | |
| Marathon Petroleum Corp. | | | | | | | | |
| 5.38%, 10/01/2022(a) | | | 1,894,000 | | | | 1,927,125 | |
| MPLX LP | | | | | | | | |
| 5.50%, 02/15/2023 | | | 1,650,000 | | | | 1,680,696 | |
| Nabors Industries, Inc. | | | | | | | | |
| 5.00%, 09/15/2020 | | | 1,395,000 | | | | 1,387,723 | |
| Newfield Exploration Co. | | | | | | | | |
| 5.75%, 01/30/2022 | | | 1,726,000 | | | | 1,766,992 | |
| Petroleos Mexicanos | | | | | | | | |
| 8.00%, 05/03/2019 | | | 1,700,000 | | | | 1,724,650 | |
| Range Resources Corp. | | | | | | | | |
| 5.00%, 08/15/2022 | | | 1,300,000 | | | | 1,236,625 | |
| Rockies Express Pipeline LLC | | | | | | | | |
| 5.63%, 04/15/2020(a) | | | 1,600,000 | | | | 1,624,000 | |
| SESI LLC | | | | | | | | |
| 7.13%, 12/15/2021 | | | 598,000 | | | | 566,605 | |
| Southwestern Energy Co. | | | | | | | | |
| 4.10%, 03/15/2022 | | | 1,569,000 | | | | 1,518,008 | |
| Tallgrass Energy Partners LP / Tallgrass Energy Finance Corp. | | | | | | | | |
| 4.75%, 10/01/2023(a) | | | 850,000 | | | | 841,500 | |
| Targa Resources Partners LP / Targa Resources Partners Finance Corp. | | | | | | | | |
| 5.25%, 05/01/2023 | | | 1,700,000 | | | | 1,700,000 | |
| Whiting Petroleum Corp. | | | | | | | | |
| 5.75%, 03/15/2021 | | | 500,000 | | | | 496,250 | |
| Total Energy | | | | | | | 26,003,825 | |
| | | | | | | | | |
| Financials (16.33%) | | | | | | | | |
| AerCap Ireland Capital DAC / AerCap Global Aviation Trust | | | | | | | | |
| 4.63%, 10/30/2020 | | | 1,730,000 | | | | 1,740,544 | |
| Aircastle, Ltd. | | | | | | | | |
| 6.25%, 12/01/2019 | | | 1,850,000 | | | | 1,891,749 | |
See Notes to Financial Statements.
RiverFront Strategic Income Fund
| Schedule of Investments | November 30, 2018 |
| Security Description | | Principal Amount | | | Value | |
| Financials (continued) | | | | | | | | |
| Ally Financial, Inc. | | | | | | | | |
| 4.25%, 04/15/2021 | | $ | 1,525,000 | | | $ | 1,517,375 | |
| CIT Group, Inc. | | | | | | | | |
| 5.00%, 08/15/2022 | | | 2,085,000 | | | | 2,098,094 | |
| GLP Capital LP / GLP Financing II, Inc. | | | | | | | | |
| 4.88%, 11/01/2020 | | | 1,500,000 | | | | 1,514,250 | |
| Icahn Enterprises LP / Icahn Enterprises Finance Corp. | | | | | | | | |
| 6.00%, 08/01/2020 | | | 1,600,000 | | | | 1,614,000 | |
| Iron Mountain, Inc. | | | | | | | | |
| 4.38%, 06/01/2021(a) | | | 1,591,000 | | | | 1,579,067 | |
| iStar, Inc. | | | | | | | | |
| 5.00%, 07/01/2019 | | | 896,000 | | | | 897,792 | |
| 4.63%, 09/15/2020 | | | 1,800,000 | | | | 1,788,750 | |
| Navient Corp. | | | | | | | | |
| 5.50%, 01/15/2019 | | | 2,050,000 | | | | 2,051,537 | |
| Omega Healthcare Investors, Inc. | | | | | | | | |
| 4.38%, 08/01/2023 | | | 1,600,000 | | | | 1,580,021 | |
| Park Aerospace Holdings, Ltd. | | | | | | | | |
| 5.25%, 08/15/2022(a) | | | 1,945,000 | | | | 1,952,294 | |
| SBA Communications Corp. | | | | | | | | |
| 4.88%, 07/15/2022 | | | 1,102,500 | | | | 1,099,744 | |
| Springleaf Finance Corp. | | | | | | | | |
| 5.25%, 12/15/2019 | | | 1,650,000 | | | | 1,660,312 | |
| 8.25%, 12/15/2020 | | | 600,000 | | | | 634,980 | |
| Starwood Property Trust, Inc. | | | | | | | | |
| 5.00%, 12/15/2021 | | | 1,335,000 | | | | 1,336,502 | |
| Total Financials | | | | | | | 24,957,011 | |
| | | | | | | | | |
| Health Care (6.59%) | | | | | | | | |
| Centene Corp. | | | | | | | | |
| 5.63%, 02/15/2021 | | | 1,750,000 | | | | 1,777,475 | |
| DaVita, Inc. | | | | | | | | |
| 5.75%, 08/15/2022 | | | 1,500,000 | | | | 1,524,375 | |
| HCA, Inc. | | | | | | | | |
| 5.88%, 03/15/2022 | | | 2,049,000 | | | | 2,134,546 | |
| Kinetic Concepts, Inc. / KCI USA, Inc. | | | | | | | | |
| 7.88%, 02/15/2021(a) | | | 1,050,000 | | | | 1,069,687 | |
| Tenet Healthcare Corp. | | | | | | | | |
| 6.00%, 10/01/2020 | | | 1,625,000 | | | | 1,661,969 | |
| Teva Pharmaceutical Finance Netherlands III BV | | | | | | | | |
| 1.70%, 07/19/2019 | | | 756,000 | | | | 747,533 | |
| 2.20%, 07/21/2021 | | | 1,250,000 | | | | 1,161,165 | |
| Total Health Care | | | | | | | 10,076,750 | |
| | | | | | | | | |
| Industrials (3.31%) | | | | | | | | |
| United Rentals North America, Inc. | | | | | | | | |
| 5.75%, 11/15/2024 | | | 1,386,000 | | | | 1,382,535 | |
| WESCO Distribution, Inc. | | | | | | | | |
| 5.38%, 12/15/2021 | | | 1,850,000 | | | | 1,859,250 | |
| Security Description | | Principal Amount | | | Value | |
| Industrials (continued) | | | | | | | | |
| XPO Logistics, Inc. | | | | | | | | |
| 6.50%, 06/15/2022(a) | | $ | 1,775,000 | | | $ | 1,812,719 | |
| Total Industrials | | | | | | | 5,054,504 | |
| | | | | | | | | |
| Materials (16.27%) | | | | | | | | |
| AK Steel Corp. | | | | | | | | |
| 7.50%, 07/15/2023 | | | 1,450,000 | | | | 1,468,125 | |
| ArcelorMittal | | | | | | | | |
| 5.13%, 06/01/2020 | | | 500,000 | | | | 507,731 | |
| 6.00%, 08/05/2020 | | | 1,100,000 | | | | 1,120,596 | |
| Ashland LLC | | | | | | | | |
| 4.75%, 08/15/2022 | | | 1,715,000 | | | | 1,708,569 | |
| Ball Corp. | | | | | | | | |
| 4.38%, 12/15/2020 | | | 1,300,000 | | | | 1,311,700 | |
| Cascades, Inc. | | | | | | | | |
| 5.50%, 07/15/2022(a) | | | 634,000 | | | | 630,830 | |
| 5.75%, 07/15/2023(a) | | | 1,362,000 | | | | 1,334,760 | |
| Celanese US Holdings LLC | | | | | | | | |
| 5.88%, 06/15/2021 | | | 1,920,000 | | | | 2,005,704 | |
| CF Industries, Inc. | | | | | | | | |
| 7.13%, 05/01/2020 | | | 1,300,000 | | | | 1,353,625 | |
| Freeport-McMoRan, Inc. | | | | | | | | |
| 3.10%, 03/15/2020 | | | 1,675,000 | | | | 1,654,062 | |
| Graphic Packaging International LLC | | | | | | | | |
| 4.75%, 04/15/2021 | | | 745,000 | | | | 745,931 | |
| 4.88%, 11/15/2022 | | | 1,461,000 | | | | 1,450,043 | |
| Huntsman International LLC | | | | | | | | |
| 4.88%, 11/15/2020 | | | 1,650,000 | | | | 1,672,687 | |
| Owens-Brockway Glass Container, Inc. | | | | | | | | |
| 5.00%, 01/15/2022(a) | | | 1,463,000 | | | | 1,461,171 | |
| Reynolds Group Issuer, Inc. / Reynolds Group Issuer, LLC | | | | | | | | |
| 5.75%, 10/15/2020 | | | 1,259,840 | | | | 1,259,840 | |
| Sealed Air Corp. | | | | | | | | |
| 6.50%, 12/01/2020(a) | | | 1,595,000 | | | | 1,662,787 | |
| Vale Overseas, Ltd. | | | | | | | | |
| 5.88%, 06/10/2021 | | | 1,590,000 | | | | 1,669,500 | |
| WR Grace & Co.-Conn | | | | | | | | |
| 5.13%, 10/01/2021(a) | | | 1,841,000 | | | | 1,858,858 | |
| Total Materials | | | | | | | 24,876,519 | |
| | | | | | | | | |
| Technology (4.16%) | | | | | | | | |
| Flex, Ltd. | | | | | | | | |
| 5.00%, 02/15/2023 | | | 1,070,000 | | | | 1,061,173 | |
| NCR Corp. | | | | | | | | |
| 4.63%, 02/15/2021 | | | 1,700,000 | | | | 1,678,750 | |
| Nielsen Finance LLC / Nielsen Finance Co. | | | | | | | | |
| 4.50%, 10/01/2020 | | | 1,500,000 | | | | 1,495,800 | |
| NXP BV / NXP Funding LLC | | | | | | | | |
| 4.13%, 06/15/2020(a) | | | 1,500,000 | | | | 1,501,905 | |
See Notes to Financial Statements.
RiverFront Strategic Income Fund
| Schedule of Investments | November 30, 2018 |
| Security Description | | Principal Amount | | | Value | |
| Technology (continued) | | | | | | | | |
| Seagate HDD Cayman | | | | | | | | |
| 4.25%, 03/01/2022 | | $ | 650,000 | | | $ | 625,000 | |
| Total Technology | | | | | | | 6,362,628 | |
| | | | | | | | | |
| Utilities (3.97%) | | | | | | | | |
| AmeriGas Partners LP / AmeriGas Finance Corp. | | | | | | | | |
| 5.63%, 05/20/2024 | | | 487,000 | | | | 465,085 | |
| Calpine Corp. | | | | | | | | |
| 6.00%, 01/15/2022(a) | | | 1,650,000 | | | | 1,658,250 | |
| DPL, Inc. | | | | | | | | |
| 7.25%, 10/15/2021 | | | 1,991,000 | | | | 2,122,904 | |
| Vistra Energy Corp. | | | | | | | | |
| 7.38%, 11/01/2022 | | | 1,750,000 | | | | 1,820,000 | |
| Total Utilities | | | | | | | 6,066,239 | |
| | | | | | | | | |
| TOTAL CORPORATE BONDS | | | | | | | | |
| (Cost $144,297,421) | | | | | | | 143,584,164 | |
| | | 7 Day Yield | | | Shares | | | Value | |
| SHORT TERM INVESTMENTS (4.77%) | | | | | | | | | |
| State Street Institutional Treasury Plus Money Market Fund | | | 2.146 | % | | | 7,298,925 | | | | 7,298,925 | |
| TOTAL SHORT TERM INVESTMENTS | | | | | | | | | |
| (Cost $7,298,925) | | | | | | | | | | | 7,298,925 | |
| | | | | | | | | | | | | |
| TOTAL INVESTMENTS (98.69%) | | | | | | | | | |
| (Cost $151,596,346) | | | | | | | | | | $ | 150,883,089 | |
| OTHER ASSETS IN EXCESS OF LIABILITIES (1.31%) | | | | | | | | 1,996,901 | |
| NET ASSETS - 100.00% | | | | | | | | | | $ | 152,879,990 | |
| (a) | Securities exempt from registration under Rule 144A of the Securities Act of 1933. These securities may be sold in the ordinary course of business in transactions exempt from registration, normally to qualified institutional buyers. At period end, the aggregate market value of those securities was $27,570,032, representing 18.03% of net assets. |
See Notes to Financial Statements.
RiverFront ETFs
| Statement of Assets and Liabilities | November 30, 2018 |
| | | RiverFront Dynamic Core Income ETF | | | RiverFront Dynamic Unconstrained Income ETF | | | RiverFront Dynamic US Dividend Advantage ETF | | | RiverFront Dynamic US Flex-Cap ETF | | | RiverFront Strategic Income Fund | |
| ASSETS: | | | | | | | | | | | | | | | | | | | | |
| Investments, at value | | $ | 143,253,600 | | | $ | 24,116,134 | | | $ | 151,017,832 | | | $ | 152,324,468 | | | $ | 150,883,089 | |
| Dividend receivable | | | – | | | | – | | | | 399,977 | | | | 312,456 | | | | – | |
| Interest receivable | | | 1,127,493 | | | | 383,075 | | | | – | | | | – | | | | 2,047,264 | |
| Receivable for investments sold | | | 6,204,986 | | | | – | | | | – | | | | – | | | | – | |
| Total Assets | | | 150,586,079 | | | | 24,499,209 | | | | 151,417,809 | | | | 152,636,924 | | | | 152,930,353 | |
| | | | | | | | | | | | | | | | | | | | | |
| LIABILITIES: | | | | | | | | | | | | | | | | | | | | |
| Payable to adviser | | | 59,162 | | | | 18,252 | | | | 63,946 | | | | 66,090 | | | | 50,363 | |
| Due to custodian | | | – | | | | – | | | | 61,234 | | | | 106,337 | | | | – | |
| Total Liabilities | | | 59,162 | | | | 18,252 | | | | 125,180 | | | | 172,427 | | | | 50,363 | |
| NET ASSETS | | $ | 150,526,917 | | | $ | 24,480,957 | | | $ | 151,292,629 | | | $ | 152,464,497 | | | $ | 152,879,990 | |
| | | | | | | | | | | | | | | | | | | | | |
| NET ASSETS CONSIST OF: | | | | | | | | | | | | | | | | | | | | |
| Paid-in capital | | $ | 153,311,780 | | | $ | 25,253,820 | | | $ | 159,609,685 | | | $ | 163,010,464 | | | $ | 162,679,455 | |
| Total distributable earnings | | | (2,784,863 | ) | | | (772,863 | ) | | | (8,317,056 | ) | | | (10,545,967 | ) | | | (9,799,465 | ) |
| NET ASSETS | | $ | 150,526,917 | | | $ | 24,480,957 | | | $ | 151,292,629 | | | $ | 152,464,497 | | | $ | 152,879,990 | |
| | | | | | | | | | | | | | | | | | | | | |
| INVESTMENTS, AT COST | | $ | 145,567,095 | | | $ | 24,533,599 | | | $ | 154,594,094 | | | $ | 160,478,806 | | | $ | 151,596,346 | |
| | | | | | | | | | | | | | | | | | | | | |
| PRICING OF SHARES | | | | | | | | | | | | | | | | | | | | |
| Net Assets | | $ | 150,526,917 | | | $ | 24,480,957 | | | $ | 151,292,629 | | | $ | 152,464,497 | | | $ | 152,879,990 | |
| Shares of beneficial interest outstanding (Unlimited number of shares authorized, par value $0.01 per share) | | | 6,400,000 | | | | 1,000,000 | | | | 4,850,002 | | | | 4,650,002 | | | | 6,300,000 | |
| Net Asset Value, offering and redemption price per share | | $ | 23.52 | | | $ | 24.48 | | | $ | 31.19 | | | $ | 32.79 | | | $ | 24.27 | |
See Notes to Financial Statements.
RiverFront ETFs
| Statement of Operations | For the Year Ended November 30, 2018 |
| | | RiverFront Dynamic Core Income ETF | | | RiverFront Dynamic Unconstrained Income ETF | | | RiverFront Dynamic US Dividend Advantage ETF | | | RiverFront Dynamic US Flex-Cap ETF | | | RiverFront Strategic Income Fund | |
| INVESTMENT INCOME: | | | | | | | | | | | | | | | |
| Interest | | $ | 3,385,236 | | | $ | 2,032,959 | | | $ | – | | | $ | – | | | $ | 11,021,612 | |
| Dividends(a) | | | 55,115 | | | | 14,267 | | | | 3,145,633 | | | | 1,996,855 | | | | 190,575 | |
| Securities Lending Income | | | – | | | | – | | | | 622 | | | | 4,787 | | | | – | |
| Total Investment Income | | | 3,440,351 | | | | 2,047,226 | | | | 3,146,255 | | | | 2,001,642 | | | | 11,212,187 | |
| | | | | | | | | | | | | | | | | | | | | |
| EXPENSES: | | | | | | | | | | | | | | | | | | | | |
| Investment adviser and sub-adviser fees (Note 3) | | | 524,833 | | | | 191,758 | | | | 586,915 | | | | 571,626 | | | | 1,150,544 | |
| Total Expenses before waiver/reimbursement | | | 524,833 | | | | 191,758 | | | | 586,915 | | | | 571,626 | | | | 1,150,544 | |
| Less fees waived/reimbursed by sub-adviser (Note 3) | | | – | | | | – | | | | – | | | | – | | | | (717,509 | ) |
| Net Expenses | | | 524,833 | | | | 191,758 | | | | 586,915 | | | | 571,626 | | | | 433,035 | |
| NET INVESTMENT INCOME | | | 2,915,518 | | | | 1,855,468 | | | | 2,559,340 | | | | 1,430,016 | | | | 10,779,152 | |
| | | | | | | | | | | | | | | | | | | | | |
| REALIZED AND UNREALIZED GAIN/(LOSS) | | | | | | | | | | | | | | | | | | | | |
| Net realized gain/(loss) on investments | | | (1,596,850 | ) | | | (1,550,548 | ) | | | 5,455,178 | | | | 9,907,232 | | | | (2,535,051 | ) |
| Net realized gain/(loss) on foreign currency transactions | | | – | | | | – | | | | 71 | | | | (24 | ) | | | – | |
| NET REALIZED GAIN/(LOSS) | | | (1,596,850 | ) | | | (1,550,548 | ) | | | 5,455,249 | | | | 9,907,208 | | | | (2,535,051 | ) |
| Net change in unrealized depreciation on investments | | | (2,358,587 | ) | | | (579,055 | ) | | | (9,969,237 | ) | | | (13,055,066 | ) | | | (8,164,421 | ) |
| NET CHANGE IN UNREALIZED DEPRECIATION | | | (2,358,587 | ) | | | (579,055 | ) | | | (9,969,237 | ) | | | (13,055,066 | ) | | | (8,164,421 | ) |
| NET REALIZED AND UNREALIZED LOSS ON INVESTMENTS | | | (3,955,437 | ) | | | (2,129,603 | ) | | | (4,513,988 | ) | | | (3,147,858 | ) | | | (10,699,472 | ) |
| NET INCREASE/(DECREASE) IN NET ASSETS RESULTING FROM OPERATIONS | | $ | (1,039,919 | ) | | $ | (274,135 | ) | | $ | (1,954,648 | ) | | $ | (1,717,842 | ) | | $ | 79,680 | |
| (a) | Net of foreign tax withholding in the amounts of $1,736, $1,018, $2,853, $4,875 and $0 respectively. |
See Notes to Financial Statements.
RiverFront Dynamic Core Income ETF
Statements of Changes in Net Assets
| | | For the Year Ended November 30, 2018 | | | For the Year Ended November 30, 2017 | |
| OPERATIONS: | | | | | | |
| Net investment income | | $ | 2,915,518 | | | $ | 629,408 | |
| Net realized loss | | | (1,596,850 | ) | | | (27,864 | ) |
| Net change in unrealized appreciation/(depreciation) | | | (2,358,587 | ) | | | 168,683 | |
| Net Increase/(Decrease) in net assets resulting from operations | | | (1,039,919 | ) | | | 770,227 | |
| | | | | | | | | |
| DISTRIBUTIONS TO SHAREHOLDERS: | | | | | | | | |
| From distributable earnings | | | (2,905,391 | ) | | | (621,587 | )(a) |
| Total distributions | | | (2,905,391 | ) | | | (621,587 | ) |
| | | | | | | | | |
| CAPITAL SHARE TRANSACTIONS: | | | | | | | | |
| Proceeds from sale of shares | | | 175,961,356 | | | | 41,731,911 | |
| Shares redeemed | | | (69,450,831 | ) | | | – | |
| Net increase from share transactions | | | 106,510,525 | | | | 41,731,911 | |
| | | | | | | | | |
| Net increase in net assets | | | 102,565,215 | | | | 41,880,551 | |
| | | | | | | | | |
| NET ASSETS: | | | | | | | | |
| Beginning of period | | | 47,961,702 | | | | 6,081,151 | |
| End of period | | $ | 150,526,917 | | | $ | 47,961,702 | (b) |
| | | | | | | | | |
| OTHER INFORMATION: | | | | | | | | |
| CAPITAL SHARE TRANSACTIONS: | | | | | | | | |
| Beginning shares | | | 1,950,000 | | | | 250,000 | |
| Shares sold | | | 7,350,000 | | | | 1,700,000 | |
| Shares redeemed | | | (2,900,000 | ) | | | – | |
| Shares outstanding, end of period | | | 6,400,000 | | | | 1,950,000 | |
| (a) | For the year ended November 30, 2017, total distributions from distributable earnings consisted of distributions from net investment income of $621,587. |
| (b) | For the year ended November 30, 2017, net assets included accumulated net investment income of $8,013. |
See Notes to Financial Statements.
RiverFront Dynamic Unconstrained Income ETF
Statements of Changes in Net Assets
| | | For the Year Ended November 30, 2018 | | | For the Year Ended November 30, 2017 | |
| OPERATIONS: | | | | | | |
| Net investment income | | $ | 1,855,468 | | | $ | 409,270 | |
| Net realized gain/(loss) | | | (1,550,548 | ) | | | 40,613 | |
| Net change in unrealized appreciation/(depreciation) | | | (579,055 | ) | | | 43,582 | |
| Net Increase/(Decrease) in net assets resulting from operations | | | (274,135 | ) | | | 493,465 | |
| | | | | | | | | |
| DISTRIBUTIONS TO SHAREHOLDERS: | | | | | | | | |
| From distributable earnings | | | (1,895,888 | ) | | | (408,541 | )(a) |
| From return of capital | | | (38,248 | ) | | | – | |
| Total distributions | | | (1,934,136 | ) | | | (408,541 | ) |
| | | | | | | | | |
| CAPITAL SHARE TRANSACTIONS: | | | | | | | | |
| Proceeds from sale of shares | | | 45,458,974 | | | | 9,141,531 | |
| Shares redeemed | | | (30,529,047 | ) | | | (2,576,982 | ) |
| Net increase from share transactions | | | 14,929,927 | | | | 6,564,549 | |
| | | | | | | | | |
| Net increase in net assets | | | 12,721,656 | | | | 6,649,473 | |
| | | | | | | | | |
| NET ASSETS: | | | | | | | | |
| Beginning of period | | | 11,759,301 | | | | 5,109,828 | |
| End of period | | $ | 24,480,957 | | | $ | 11,759,301 | (b) |
| | | | | | | | | |
| OTHER INFORMATION: | | | | | | | | |
| CAPITAL SHARE TRANSACTIONS: | | | | | | | | |
| Beginning shares | | | 450,000 | | | | 200,000 | |
| Shares sold | | | 1,800,000 | | | | 350,000 | |
| Shares redeemed | | | (1,250,000 | ) | | | (100,000 | ) |
| Shares outstanding, end of period | | | 1,000,000 | | | | 450,000 | |
| (a) | For the year ended November 30, 2017, total distributions from distributable earnings consisted of distributions from net investment income of $408,541. |
| (b) | For the year ended November 30, 2017, net assets included accumulated net investment income of $1,356. |
See Notes to Financial Statements.
RiverFront Dynamic US Dividend Advantage ETF
Statements of Changes in Net Assets
| | | For the Year Ended November 30, 2018 | | | For the Year Ended November 30, 2017 | |
| OPERATIONS: | | | | | | |
| Net investment income | | $ | 2,559,340 | | | $ | 774,486 | |
| Net realized gain | | | 5,455,249 | | | | 553,688 | |
| Net change in unrealized appreciation/(depreciation) | | | (9,969,237 | ) | | | 5,893,754 | |
| Net Increase/(Decrease) in net assets resulting from operations | | | (1,954,648 | ) | | | 7,221,928 | |
| | | | | | | | | |
| DISTRIBUTIONS TO SHAREHOLDERS: | | | | | | | | |
| From distributable earnings | | | (2,425,732 | ) | | | (753,106 | )(a) |
| Total distributions | | | (2,425,732 | ) | | | (753,106 | ) |
| | | | | | | | | |
| CAPITAL SHARE TRANSACTIONS: | | | | | | | | |
| Proceeds from sale of shares | | | 153,655,693 | | | | 49,651,673 | |
| Shares redeemed | | | (57,626,629 | ) | | | (9,773,232 | ) |
| Net increase from share transactions | | | 96,029,064 | | | | 39,878,441 | |
| | | | | | | | | |
| Net increase in net assets | | | 91,648,684 | | | | 46,347,263 | |
| | | | | | | | | |
| NET ASSETS: | | | | | | | | |
| Beginning of period | | | 59,643,945 | | | | 13,296,682 | |
| End of period | | $ | 151,292,629 | | | $ | 59,643,945 | (b) |
| | | | | | | | | |
| OTHER INFORMATION: | | | | | | | | |
| CAPITAL SHARE TRANSACTIONS: | | | | | | | | |
| Beginning shares | | | 1,900,002 | | | | 500,002 | |
| Shares sold | | | 4,750,000 | | | | 1,750,000 | |
| Shares redeemed | | | (1,800,000 | ) | | | (350,000 | ) |
| Shares outstanding, end of period | | | 4,850,002 | | | | 1,900,002 | |
| (a) | For the year ended November 30, 2017, total distributions from distributable earnings consisted of distributions from net investment income of $753,106. |
| (b) | For the year ended November 30, 2017, net assets included accumulated net investment income of $25,697. |
See Notes to Financial Statements.
RiverFront Dynamic US Flex-Cap ETF
Statements of Changes in Net Assets
| | | For the Year Ended
November 30,
2018 | | | For the Year Ended
November 30,
2017 | |
| OPERATIONS: | | | | | | |
| Net investment income | | $ | 1,430,016 | | | $ | 271,035 | |
| Net realized gain | | | 9,907,208 | | | | 210,656 | |
| Net change in unrealized appreciation/(depreciation) | | | (13,055,066 | ) | | | 4,586,573 | |
| Net Increase/(Decrease) in net assets resulting from operations | | | (1,717,842 | ) | | | 5,068,264 | |
| | | | | | | | | |
| DISTRIBUTIONS TO SHAREHOLDERS: | | | | | | | | |
| From distributable earnings | | | (1,321,640 | ) | | | (254,258 | )(a) |
| Total distributions | | | (1,321,640 | ) | | | (254,258 | ) |
| | | | | | | | | |
| CAPITAL SHARE TRANSACTIONS: | | | | | | | | |
| Proceeds from sale of shares | | | 177,753,277 | | | | 36,346,437 | |
| Shares redeemed | | | (62,825,568 | ) | | | (8,637,056 | ) |
| Net increase from share transactions | | | 114,927,709 | | | | 27,709,381 | |
| | | | | | | | | |
| Net increase in net assets | | | 111,888,227 | | | | 32,523,387 | |
| | | | | | | | | |
| NET ASSETS: | | | | | | | | |
| Beginning of period | | | 40,576,270 | | | | 8,052,883 | |
| End of period | | $ | 152,464,497 | | | $ | 40,576,270 | (b) |
| | | | | | | | | |
| OTHER INFORMATION: | | | | | | | | |
| CAPITAL SHARE TRANSACTIONS: | | | | | | | | |
| Beginning shares | | | 1,250,002 | | | | 300,002 | |
| Shares sold | | | 5,250,000 | | | | 1,250,000 | |
| Shares redeemed | | | (1,850,000 | ) | | | (300,000 | ) |
| Shares outstanding, end of period | | | 4,650,002 | | | | 1,250,002 | |
| (a) | For the year ended November 30, 2017, total distributions from distributable earnings consisted of distributions from net investment income of $254,258. |
| (b) | For the year ended November 30, 2017, net assets included accumulated net investment income of $17,211. |
See Notes to Financial Statements.
RiverFront Strategic Income Fund
Statements of Changes in Net Assets
| | | For the Year Ended
November 30,
2018 | | | For the Year Ended
November 30,
2017 | |
| OPERATIONS: | | | | | | |
| Net investment income | | $ | 10,779,152 | | | $ | 14,069,184 | |
| Net realized gain/(loss) | | | (2,535,051 | ) | | | 1,790,752 | |
| Net change in unrealized appreciation/(depreciation) | | | (8,164,421 | ) | | | 136,438 | |
| Net increase in net assets resulting from operations | | | 79,680 | | | | 15,996,374 | |
| | | | | | | | | |
| DISTRIBUTIONS TO SHAREHOLDERS: | | | | | | | | |
| From distributable earnings | | | (10,733,170 | ) | | | (14,055,252 | )(a) |
| Total distributions | | | (10,733,170 | ) | | | (14,055,252 | ) |
| | | | | | | | | |
| CAPITAL SHARE TRANSACTIONS: | | | | | | | | |
| Proceeds from sale of shares | | | 70,270,323 | | | | 49,315,186 | |
| Shares redeemed | | | (244,506,109 | ) | | | (40,002,027 | ) |
| Net increase/(decrease) from share transactions | | | (174,235,786 | ) | | | 9,313,159 | |
| | | | | | | | | |
| Net increase/(decrease) in net assets | | | (184,889,276 | ) | | | 11,254,281 | |
| | | | | | | | | |
| NET ASSETS: | | | | | | | | |
| Beginning of period | | | 337,769,266 | | | | 326,514,985 | |
| End of period | | $ | 152,879,990 | | | $ | 337,769,226 | (b) |
| | | | | | | | | |
| OTHER INFORMATION: | | | | | | | | |
| CAPITAL SHARE TRANSACTIONS: | | | | | | | | |
| Beginning shares | | | 13,400,000 | | | | 13,050,000 | |
| Shares sold | | | 2,850,000 | | | | 1,950,000 | |
| Shares redeemed | | | (9,950,000 | ) | | | (1,600,000 | ) |
| Shares outstanding, end of period | | | 6,300,000 | | | | 13,400,000 | |
| (a) | For the year ended November 30, 2017, total distributions from distributable earnings consisted of distributions from net investment income of $14,055,252. |
| (b) | For the year ended November 30, 2017, net assets included accumulated net investment income of $35,631. |
See Notes to Financial Statements.
RiverFront Dynamic Core Income ETF
| Financial Highlights | For a share outstanding throughout the periods presented |
| | | For the Year Ended
November 30,
2018 | | | For the Year Ended
November 30,
2017 | | | For the Period
June 14, 2016
(Commencement)
to November 30,
2016 | |
| NET ASSET VALUE, BEGINNING OF PERIOD | | $ | 24.60 | | | $ | 24.32 | | | $ | 25.00 | |
| | | | | | | | | | | | | |
| INCOME/(LOSS) FROM INVESTMENT OPERATIONS: | | | | | | | | | | | | |
| Net investment income(a) | | | 0.68 | | | | 0.53 | | | | 0.24 | |
| Net realized and unrealized gain/(loss) | | | (1.10 | ) | | | 0.23 | | | | (0.68 | ) |
| Total from investment operations | | | (0.42 | ) | | | 0.76 | | | | (0.44 | ) |
| | | | | | | | | | | | | |
| DISTRIBUTIONS: | | | | | | | | | | | | |
| From net investment income | | | (0.66 | ) | | | (0.48 | ) | | | (0.24 | ) |
| Total distributions | | | (0.66 | ) | | | (0.48 | ) | | | (0.24 | ) |
| | | | | | | | | | | | | |
| NET INCREASE/(DECREASE) IN NET ASSET VALUE | | | (1.08 | ) | | | 0.28 | | | | (0.68 | ) |
| NET ASSET VALUE, END OF PERIOD | | $ | 23.52 | | | $ | 24.60 | | | $ | 24.32 | |
| TOTAL RETURN(b) | | | (1.74 | )% | | | 3.15 | % | | | (1.77 | )% |
| | | | | | | | | | | | | |
| RATIOS/SUPPLEMENTAL DATA: | | | | | | | | | | | | |
| Net assets, end of period (000s) | | $ | 150,527 | | | $ | 47,962 | | | $ | 6,081 | |
| | | | | | | | | | | | | |
| Ratio of expenses excluding waiver/reimbursement to average net assets | | | 0.51 | % | | | 0.51 | % | | | 0.51 | %(c) |
| Ratio of expenses including waiver/reimbursement to average net assets | | | 0.51 | % | | | 0.51 | % | | | 0.51 | %(c) |
| Ratio of net investment income including expenses waiver/reimbursement to average net assets | | | 2.83 | % | | | 2.15 | % | | | 2.12 | %(c) |
| Portfolio turnover rate(d) | | | 15 | % | | | 18 | % | | | 26 | % |
| (a) | Based on average shares outstanding during the period. |
| (b) | Total return is calculated assuming an initial investment made at the net asset value at the beginning of the period and the redemption at the net asset value on the last day of the period and assuming all distributions are reinvested at the actual reinvestment prices. Total return calculated for a period of less than one year is not annualized. |
| (d) | Portfolio turnover for periods less than one year are not annualized and does not include securities received or delivered from processing creations or redemptions in-kind. |
See Notes to Financial Statements.
RiverFront Dynamic Unconstrained Income ETF
| Financial Highlights | For a share outstanding throughout the periods presented |
| | | For the Year Ended
November 30,
2018 | | | For the Year Ended
November 30,
2017 | | | For the Period
June 14, 2016
(Commencement)
to November 30,
2016 | |
| NET ASSET VALUE, BEGINNING OF PERIOD | | $ | 26.13 | | | $ | 25.55 | | | $ | 25.00 | |
| | | | | | | | | | | | | |
| INCOME/(LOSS) FROM INVESTMENT OPERATIONS: | | | | | | | | | | | | |
| Net investment income(a) | | | 1.24 | | | | 1.22 | | | | 0.63 | |
| Net realized and unrealized gain/(loss) | | | (1.63 | ) | | | 0.56 | | | | 0.55 | |
| Total from investment operations | | | (0.39 | ) | | | 1.78 | | | | 1.18 | |
| | | | | | | | | | | | | |
| DISTRIBUTIONS: | | | | | | | | | | | | |
| From net investment income | | | (1.15 | ) | | | (1.20 | ) | | | (0.63 | ) |
| From net realized gains | | | (0.09 | ) | | | – | | | | – | |
| Tax return of capital | | | (0.02 | ) | | | – | | | | – | |
| Total distributions | | | (1.26 | ) | | | (1.20 | ) | | | (0.63 | ) |
| | | | | | | | | | | | | |
| NET INCREASE/(DECREASE) IN NET ASSET VALUE | | | (1.65 | ) | | | 0.58 | | | | 0.55 | |
| NET ASSET VALUE, END OF PERIOD | | $ | 24.48 | | | $ | 26.13 | | | $ | 25.55 | |
| TOTAL RETURN(b) | | | (1.52 | )% | | | 7.06 | % | | | 4.72 | % |
| | | | | | | | | | | | | |
| RATIOS/SUPPLEMENTAL DATA: | | | | | | | | | | | | |
| Net assets, end of period (000s) | | $ | 24,481 | | | $ | 11,759 | | | $ | 5,110 | |
| | | | | | | | | | | | | |
| Ratio of expenses excluding waiver/reimbursement to average net assets | | | 0.51 | % | | | 0.51 | % | | | 0.51 | %(c) |
| Ratio of expenses including waiver/reimbursement to average net assets | | | 0.51 | % | | | 0.51 | % | | | 0.51 | %(c) |
| Ratio of net investment income including expenses waiver/reimbursement to average net assets | | | 4.93 | % | | | 4.65 | % | | | 5.31 | %(c) |
| Portfolio turnover rate(d) | | | 51 | % | | | 30 | % | | | 11 | % |
| (a) | Based on average shares outstanding during the period. |
| (b) | Total return is calculated assuming an initial investment made at the net asset value at the beginning of the period and the redemption at the net asset value on the last day of the period and assuming all distributions are reinvested at the actual reinvestment prices. Total return calculated for a period of less than one year is not annualized. |
| (d) | Portfolio turnover for periods less than one year are not annualized and does not include securities received or delivered from processing creations or redemptions in-kind. |
See Notes to Financial Statements.
RiverFront Dynamic US Dividend Advantage ETF
| Financial Highlights | For a share outstanding throughout the periods presented |
| | | For the Year Ended
November 30,
2018 | | | For the Year Ended
November 30,
2017 | | | For the Period
June 7, 2016
(Commencement)
to November 30,
2016 | |
| NET ASSET VALUE, BEGINNING OF PERIOD | | $ | 31.39 | | | $ | 26.59 | | | $ | 25.14 | |
| | | | | | | | | | | | | |
| INCOME/(LOSS) FROM INVESTMENT OPERATIONS: | | | | | | | | | | | | |
| Net investment income(a) | | | 0.73 | | | | 0.63 | | | | 0.26 | |
| Net realized and unrealized gain/(loss) | | | (0.26 | ) | | | 4.76 | | | | 1.40 | |
| Total from investment operations | | | 0.47 | | | | 5.39 | | | | 1.66 | |
| | | | | | | | | | | | | |
| DISTRIBUTIONS: | | | | | | | | | | | | |
| From net investment income | | | (0.67 | ) | | | (0.59 | ) | | | (0.21 | ) |
| Total distributions | | | (0.67 | ) | | | (0.59 | ) | | | (0.21 | ) |
| | | | | | | | | | | | | |
| NET INCREASE/(DECREASE) IN NET ASSET VALUE | | | (0.20 | ) | | | 4.80 | | | | 1.45 | |
| NET ASSET VALUE, END OF PERIOD | | $ | 31.19 | | | $ | 31.39 | | | $ | 26.59 | |
| TOTAL RETURN(b) | | | 1.45 | % | | | 20.49 | % | | | 6.64 | % |
| | | | | | | | | | | | | |
| RATIOS/SUPPLEMENTAL DATA: | | | | | | | | | | | | |
| Net assets, end of period (000s) | | $ | 151,293 | | | $ | 59,644 | | | $ | 13,297 | |
| | | | | | | | | | | | | |
| Ratio of expenses excluding waiver/reimbursement to average net assets | | | 0.52 | % | | | 0.52 | % | | | 0.52 | %(c) |
| Ratio of expenses including waiver/reimbursement to average net assets | | | 0.52 | % | | | 0.52 | % | | | 0.52 | %(c) |
| Ratio of net investment income including expenses waiver/reimbursement to average net assets | | | 2.27 | % | | | 2.19 | % | | | 2.13 | %(c) |
| Portfolio turnover rate(d) | | | 96 | % | | | 54 | % | | | 45 | % |
| (a) | Based on average shares outstanding during the period. |
| (b) | Total return is calculated assuming an initial investment made at the net asset value at the beginning of the period and the redemption at the net asset value on the last day of the period and assuming all distributions are reinvested at the actual reinvestment prices. Total return calculated for a period of less than one year is not annualized. |
| (d) | Portfolio turnover for periods less than one year are not annualized and does not include securities received or delivered from processing creations or redemptions in-kind. |
See Notes to Financial Statements.
RiverFront Dynamic US Flex-Cap ETF
| Financial Highlights | For a share outstanding throughout the periods presented |
| | | For the Year Ended
November 30,
2018 | | | For the Year Ended
November 30,
2017 | | | For the Period
June 7, 2016
(Commencement)
to November 30,
2016 | |
| NET ASSET VALUE, BEGINNING OF PERIOD | | $ | 32.46 | | | $ | 26.84 | | | $ | 25.13 | |
| | | | | | | | | | | | | |
| INCOME/(LOSS) FROM INVESTMENT OPERATIONS: | | | | | | | | | | | | |
| Net investment income(a) | | | 0.44 | | | | 0.31 | | | | 0.17 | |
| Net realized and unrealized gain | | | 0.27 | (b) | | | 5.59 | | | | 1.70 | |
| Total from investment operations | | | 0.71 | | | | 5.90 | | | | 1.87 | |
| | | | | | | | | | | | | |
| DISTRIBUTIONS: | | | | | | | | | | | | |
| From net investment income | | | (0.38 | ) | | | (0.28 | ) | | | (0.16 | ) |
| Total distributions | | | (0.38 | ) | | | (0.28 | ) | | | (0.16 | ) |
| | | | | | | | | | | | | |
| NET INCREASE IN NET ASSET VALUE | | | 0.33 | | | | 5.62 | | | | 1.71 | |
| NET ASSET VALUE, END OF PERIOD | | $ | 32.79 | | | $ | 32.46 | | | $ | 26.84 | |
| TOTAL RETURN(c) | | | 2.16 | % | | | 22.08 | % | | | 7.45 | % |
| | | | | | | | | | | | | |
| RATIOS/SUPPLEMENTAL DATA: | | | | | | | | | | | | |
| Net assets, end of period (000s) | | $ | 152,464 | | | $ | 40,576 | | | $ | 8,053 | |
| | | | | | | | | | | | | |
| Ratio of expenses excluding waiver/reimbursement to average net assets | | | 0.52 | % | | | 0.52 | % | | | 0.52 | %(d) |
| Ratio of expenses including waiver/reimbursement to average net assets | | | 0.52 | % | | | 0.52 | % | | | 0.52 | %(d) |
| Ratio of net investment income including expenses waiver/reimbursement to average net assets | | | 1.30 | % | | | 1.05 | % | | | 1.34 | %(d) |
| Portfolio turnover rate(e) | | | 152 | % | | | 86 | % | | | 41 | % |
| (a) | Based on average shares outstanding during the period. |
| (b) | Net realized and unrealized gain on investments per share does not correlate to aggregate of the net realized and unrealized loss in the Statements of Operations for the year ended November 30, 2018, primarily due to the timing of the sales and repurchases of the Fund's shares in relation to the fluctuating market values for the Fund's portfolio. |
| (c) | Total return is calculated assuming an initial investment made at the net asset value at the beginning of the period and the redemption at the net asset value on the last day of the period and assuming all distributions are reinvested at the actual reinvestment prices. Total return calculated for a period of less than one year is not annualized. |
| (e) | Portfolio turnover for periods less than one year are not annualized and does not include securities received or delivered from processing creations or redemptions in-kind. |
See Notes to Financial Statements.
RiverFront Strategic Income Fund
| Financial Highlights | For a share outstanding throughout the periods presented |
| | | For the Year Ended
November 30,
2018 | | | For the Year Ended
November 30,
2017 | | | For the Year Ended
November 30,
2016 | | | For the Year Ended
November 30,
2015 | | | For the Year Ended
November 30,
2014 | |
| NET ASSET VALUE, BEGINNING OF PERIOD | | $ | 25.21 | | | $ | 25.02 | | | $ | 24.36 | | | $ | 25.02 | | | $ | 24.90 | |
| | | | | | | | | | | | | | | | | | | | | |
| INCOME/(LOSS) FROM INVESTMENT OPERATIONS: | | | | | | | | | | | | | | | | | | | | |
| Net investment income(a) | | | 1.06 | | | | 1.11 | | | | 1.05 | | | | 0.88 | | | | 0.83 | |
| Net realized and unrealized gain/(loss) | | | (0.92 | ) | | | 0.19 | | | | 0.71 | | | | (0.65 | ) | | | 0.11 | |
| Total from investment operations | | | 0.14 | | | | 1.30 | | | | 1.76 | | | | 0.23 | | | | 0.94 | |
| | | | | | | | | | | | | | | | | | | | | |
| DISTRIBUTIONS: | | | | | | | | | | | | | | | | | | | | |
| From net investment income | | | (1.08 | ) | | | (1.11 | ) | | | (1.10 | ) | | | (0.87 | ) | | | (0.82 | ) |
| From net realized gains | | | – | | | | – | | | | – | | | | (0.02 | ) | | | – | |
| Total distributions | | | (1.08 | ) | | | (1.11 | ) | | | (1.10 | ) | | | (0.89 | ) | | | (0.82 | ) |
| | | | | | | | | | | | | | | | | | | | | |
| NET INCREASE/(DECREASE) IN NET ASSET VALUE | | | (0.94 | ) | | | 0.19 | | | | 0.66 | | | | (0.66 | ) | | | 0.12 | |
| NET ASSET VALUE, END OF PERIOD | | $ | 24.27 | | | $ | 25.21 | | | $ | 25.02 | | | $ | 24.36 | | | $ | 25.02 | |
| TOTAL RETURN(b) | | | 0.57 | % | | | 5.29 | % | | | 7.38 | % | | | 0.91 | % | | | 3.80 | % |
| | | | | | | | | | | | | | | | | | | | | |
| RATIOS/SUPPLEMENTAL DATA: | | | | | | | | | | | | | | | | | | | | |
| Net assets, end of period (000s) | | $ | 152,880 | | | $ | 337,769 | | | $ | 326,515 | | | $ | 464,007 | | | $ | 369,065 | |
| | | | | | | | | | | | | | | | | | | | | |
| Ratio of expenses excluding waiver/reimbursement to average net assets | | | 0.46 | % | | | 0.46 | % | | | 0.46 | % | | | 0.46 | % | | | 0.46 | % |
| Ratio of expenses including waiver/reimbursement to average net assets | | | 0.17 | %(c) | | | 0.16 | %(d) | | | 0.17 | %(d) | | | 0.22 | % | | | 0.22 | % |
| Ratio of net investment income including expenses waiver/reimbursement to average net assets | | | 4.31 | % | | | 4.41 | % | | | 4.26 | % | | | 3.54 | % | | | 3.30 | % |
| Portfolio turnover rate(e) | | | 35 | % | | | 32 | % | | | 52 | % | | | 36 | % | | | 27 | % |
| (a) | Based on average shares outstanding during the period. |
| (b) | Total return is calculated assuming an initial investment made at the net asset value at the beginning of the period and the redemption at the net asset value on the last day of the period and assuming all distributions are reinvested at the actual reinvestment prices. Total return calculated for a period of less than one year is not annualized. |
| (c) | Effective November 1, 2018, the Fund’s management fee consists of a fee of 0.11% paid to the Fund’s investment adviser and a fee of 0.35% paid to the Fund’s sub-adviser. The Fund’s sub-adviser ceased its voluntary waiver effective November 1, 2018. |
| (d) | Effective July 1, 2016, the Fund’s management fee consists of a fee of 0.16% paid to the Fund’s investment adviser and a fee of 0.30% paid to the Fund’s sub-adviser. The Fund’s sub-adviser voluntarily waived all of its 0.30% annual sub-advisory fee payable by the Fund until November 1, 2018. |
| (e) | Portfolio turnover for periods less than one year are not annualized and does not include securities received or delivered from processing creations or redemptions in-kind. |
See Notes to Financial Statements.
RiverFront ETFs
| Notes to Financial Statements | November 30, 2018 |
1. ORGANIZATION
ALPS ETF Trust (the “Trust”), a Delaware statutory trust, is an open-end management investment company registered under the Investment Company Act of 1940, as amended (the “1940 Act”). As of November 30, 2018, the Trust consists of twenty separate portfolios. Each portfolio represents a separate series of the Trust. This report pertains solely to the RiverFront Dynamic Core Income ETF, the RiverFront Dynamic Unconstrained Income ETF, the RiverFront Dynamic US Dividend Advantage ETF, the RiverFront Dynamic US Flex-Cap ETF, and the RiverFront Strategic Income Fund (each a “Fund” and collectively, the “Funds”).
The investment objective of the RiverFront Dynamic Core Income ETF Fund is to seek total return, with an emphasis on income as the source of that total return. The Fund is considered non-diversified and may invest a greater portion of assets in securities of individual issuers than a diversified fund. As a result, changes in the market value of a single investment could cause greater fluctuations in share price than would occur in a diversified fund.
The investment objective of the RiverFront Dynamic Unconstrained Income ETF Fund is to seek total return, with an emphasis on income as the source of that total return. The Fund is considered non-diversified and may invest a greater portion of assets in securities of individual issuers than a diversified fund. As a result, changes in the market value of a single investment could cause greater fluctuations in share price than would occur in a diversified fund.
The investment objective of the RiverFront Dynamic US Dividend Advantage ETF Fund is to seek to provide capital appreciation and dividend income. The Fund is considered non-diversified and may invest a greater portion of assets in securities of individual issuers than a diversified fund. As a result, changes in the market value of a single investment could cause greater fluctuations in share price than would occur in a diversified fund.
The investment objective of the RiverFront Dynamic US Flex-Cap ETF Fund is to seek to provide capital appreciation. The Fund is considered non-diversified and may invest a greater portion of assets in securities of individual issuers than a diversified fund. As a result, changes in the market value of a single investment could cause greater fluctuations in share price than would occur in a diversified fund.
The investment objective of the RiverFront Strategic Income Fund is to seek total return, with an emphasis on income as the source of that total return. The Fund has elected to qualify as a diversified series of the Trust under the 1940 Act.
Each Fund’s Shares (“Shares”) are listed on the NYSE Arca, Inc. Each Fund issues and redeems Shares at net asset value (“NAV”) in blocks of 50,000 Shares, each of which is called a “Creation Unit”. Creation Units are issued and redeemed principally in-kind for securities and/or cash. Except when aggregated in Creation Units, Shares are not redeemable securities of a Fund.
Pursuant to the Trust’s organizational documents, its Officers and Trustees are indemnified against certain liability arising out of the performance of their duties to the Trust. Additionally, in the normal course of business, the Trust enters into contracts with service providers that contain general indemnification clauses. The Trust’s maximum exposure under these arrangements is unknown, as this would involve future claims that may be made against the Trust that have not yet occurred.
2. SIGNIFICANT ACCOUNTING POLICIES
The following is a summary of significant accounting policies consistently followed by the Funds in the preparation of the financial statements. The accompanying financial statements were prepared in accordance with accounting principles generally accepted in the United States of America (“U.S. GAAP”). The preparation of financial statements in conformity with U.S. GAAP requires management to make certain estimates and assumptions that affect the reported amounts of assets and liabilities and disclosures of contingent assets and liabilities at the date of the financial statements and the reported amounts of revenue and expenses during the period. Actual results could differ from those estimates. Each Fund is considered an investment company under U.S. GAAP and follows the accounting and reporting guidance applicable to investment companies in the Financial Accounting Standards BoardAccounting Standards Codification Topic 946.
A. Portfolio Valuation
Each Fund’s NAV is determined daily, as of the close of regular trading on the New York Stock Exchange (the “NYSE”), normally 4:00 p.m. Eastern time, on each day the NYSE is open for trading. The NAV is computed by dividing the value of all assets of each Fund (including accrued interest and dividends), less all liabilities (including accrued expenses and dividends declared but unpaid), by the total number of shares outstanding.
Portfolio securities listed on any exchange other than the NASDAQ Stock Market LLC (“NASDAQ”) are valued at the last sale price on the business day as of which such value is being determined. If there has been no sale on such day, the securities are valued at the mean of the most recent bid and ask prices on such day. Securities traded on the NASDAQ are valued at the NASDAQ Official Closing Price as determined by NASDAQ. Portfolio securities traded on more than one securities exchange are valued at the last sale price on the business day as of which such value is being determined at the close of the exchange representing the principal market for such securities. Portfolio securities traded in the over-the-counter market, but excluding securities traded on the NASDAQ, are valued at the last quoted sale price in such market.
RiverFront ETFs
| Notes to Financial Statements | November 30, 2018 |
Corporate bonds and United States government bonds are typically valued at the mean between the evaluated bid and ask prices formulated by an independent pricing service.
Each Fund’s investments are valued at market value or, in the absence of market value with respect to any portfolio securities, at fair value according to procedures adopted by the Trust’s Board of Trustees (the “Board”). When market quotations are not readily available or when events occur that make established valuation methods unreliable, securities of the Funds may be valued in good faith by or under the direction of the Board. These securities generally include, but are not limited to, restricted securities (securities which may not be publicly sold without registration under the Securities Act of 1933) for which a pricing service is unable to provide a market price; securities whose trading has been formally suspended; a security whose market price is not available from a pre-established primary pricing source or the pricing source is not willing to provide a price; a security with respect to which an event has occurred that is most likely to materially affect the value of the security after the market has closed but before the calculation of a Fund’s NAV or make it difficult or impossible to obtain a reliable market quotation; or a security whose price, as provided by the pricing service, does not reflect the security’s “fair value” due to the security being de-listed from a national exchange or the security’s primary trading market is temporarily closed at a time when, under normal conditions, it would be open. As a general principle, the current “fair value” of a security would be the amount which the owner might reasonably expect to receive from the sale on the applicable exchange or principal market. A variety of factors may be considered in determining the fair value of such securities.
B. Fair Value Measurements
Each Fund discloses the classification of its fair value measurements following a three-tier hierarchy based on the inputs used to measure fair value. Inputs refer broadly to the assumptions that market participants would use in pricing the asset or liability, including assumptions about risk. Inputs may be observable or unobservable. Observable inputs reflect the assumptions market participants would use in pricing the asset or liability that are developed based on market data obtained from sources independent of the reporting entity. Unobservable inputs reflect the reporting entity’s own assumptions about the assumptions market participants would use in pricing the asset or liability that are developed based on the best information available.
Valuation techniques used to value the Funds’ investments by major category are as follows:
Equity securities, including restricted securities, for which market quotations are readily available, are valued at the last reported sale price or official closing price as reported by a third party pricing vendor on the primary market or exchange on which they are traded and are categorized as Level 1 in the hierarchy. In the event there were no sales during the day or closing prices are not available, securities are valued at the mean of the most recent quoted bid and ask prices on such day and are generally categorized as Level 2 in the hierarchy. Investments in open-end mutual funds are valued at their closing NAV each business day and are categorized as Level 1 in the hierarchy.
Debt securities, including restricted securities, are valued based on evaluated prices received from third party pricing vendors or from brokers who make markets in such securities. For corporate bonds, pricing vendors utilize matrix pricing which considers yield or price of bonds of comparable quality, coupon, maturity and type as well as broker-supplied prices. When independent prices are unavailable or unreliable, debt securities may be valued utilizing pricing methodologies which consider similar factors that would be used by third party pricing vendors. Debt securities are generally categorized as Level 2 in the hierarchy but may be Level 3 depending on the circumstances. The RiverFront Dynamic Core Income ETF, the RiverFront Dynamic Unconstrained Income ETF, and the RiverFront Strategic Income Fund may invest a significant portion of their assets in below investment grade securities. The value of these securities can be more volatile due to changes in the credit quality of the issuer and is sensitive to changes in economic, market and regulatory conditions.
Changes in valuation techniques may result in transfers in or out of an assigned level within the disclosure hierarchy.
Various inputs are used in determining the value of each Fund’s investments as of the end of the reporting period. When inputs used fall into different levels of the fair value hierarchy, the level in the hierarchy within which the fair value measurement falls is determined based on the lowest level input that is significant to the fair value measurement in its entirety. The designated input levels are not necessarily an indication of the risk or liquidity associated with these investments.
RiverFront ETFs
| Notes to Financial Statements | November 30, 2018 |
These inputs are categorized in the following hierarchy under applicable financial accounting standards:
| Level 1 – | Unadjusted quoted prices in active markets for identical investments, unrestricted assets or liabilities that a Fund has the ability to access at the measurement date; |
| Level 2 – | Quoted prices which are not active, quoted prices for similar assets or liabilities in active markets or inputs other than quoted prices that are observable (either directly or indirectly) for substantially the full term of the asset or liability; and |
| Level 3 – | Significant unobservable prices or inputs (including the Fund’s own assumptions in determining the fair value of investments) where there is little or no market activity for the asset or liability at the measurement date. |
The following is a summary of the inputs used to value the Funds’ investments as of November 30, 2018:
RiverFront Dynamic Core Income ETF
| Investments in Securities at Value | | Level 1 - Unadjusted Quoted Prices | | | Level 2 - Other Significant Observable Inputs | | | Level 3 - Significant Unobservable Inputs | | | Total | |
| Corporate Bonds* | | $ | – | | | $ | 114,767,603 | | | $ | – | | | $ | 114,767,603 | |
| Government Bonds | | | – | | | | 27,386,114 | | | | – | | | | 27,386,114 | |
| Short-Term Investments | | | 1,099,883 | | | | – | | | | – | | | | 1,099,883 | |
| TOTAL | | $ | 1,099,883 | | | $ | 142,153,717 | | | $ | – | | | $ | 143,253,600 | |
RiverFront Dynamic Unconstrained Income ETF
| Investments in Securities at Value | | Level 1 - Unadjusted Quoted Prices | | | Level 2 - Other Significant Observable Inputs | | | Level 3 - Significant Unobservable Inputs | | | Total | |
| Corporate Bonds* | | $ | – | | | $ | 22,851,219 | | | $ | – | | | $ | 22,851,219 | |
| Short-Term Investments | | | 1,264,915 | | | | – | | | | – | | | | 1,264,915 | |
| TOTAL | | $ | 1,264,915 | | | $ | 22,851,219 | | | $ | – | | | $ | 24,116,134 | |
RiverFront Dynamic US Dividend Advantage ETF
| Investments in Securities at Value | | Level 1 - Unadjusted Quoted Prices | | | Level 2 - Other Significant Observable Inputs | | | Level 3 - Significant Unobservable Inputs | | | Total | |
| Common Stocks* | | $ | 151,017,832 | | | $ | – | | | $ | – | | | $ | 151,017,832 | |
| TOTAL | | $ | 151,017,832 | | | $ | – | | | $ | – | | | $ | 151,017,832 | |
RiverFront Dynamic US Flex-Cap ETF
| Investments in Securities at Value | | Level 1 - Unadjusted Quoted Prices | | | Level 2 - Other Significant Observable Inputs | | | Level 3 - Significant Unobservable Inputs | | | Total | |
| Common Stocks* | | $ | 152,324,468 | | | $ | – | | | $ | – | | | $ | 152,324,468 | |
| TOTAL | | $ | 152,324,468 | | | $ | – | | | $ | – | | | $ | 152,324,468 | |
RiverFront ETFs
| Notes to Financial Statements | November 30, 2018 |
RiverFront Strategic Income Fund
| Investments in Securities at Value | | Level 1 - Unadjusted Quoted Prices | | | Level 2 - Other Significant Observable Inputs | | | Level 3 - Significant Unobservable Inputs | | | Total | |
| Corporate Bonds* | | $ | – | | | $ | 143,584,164 | | | $ | – | | | $ | 143,584,164 | |
| Short-Term Investments | | | 7,298,925 | | | | – | | | | – | | | | 7,298,925 | |
| TOTAL | | $ | 7,298,925 | | | $ | 143,584,164 | | | $ | – | | | $ | 150,883,089 | |
| * | For a detailed sector breakdown, see the accompanying Schedule of Investments. |
The Funds did not have any securities that used significant unobservable inputs (Level 3) in determining fair value and there were no transfers into or out of Level 3.
For liabilities arising from overdrafts in the custody account, the carrying amount reported in the Statement of Assets and Liabilities approximates fair value due to the relatively short-term maturity of these financial instruments. As of November 30, 2018, the liability related to custody overdrafts in RiverFront Dynamic US Dividend Advantage ETF and RiverFront Dynamic US Flex-Cap ETF are based on level 2 inputs.
C. Securities Transactions and Investment Income
Securities transactions are recorded as of the trade date. Realized gains and losses from securities transactions are recorded on the highest cost basis. Dividend income and capital gains distributions, if any, are recorded on the ex-dividend date. Interest income, if any, is recorded on the accrual basis, including amortization of premiums and accretion of discounts.
D. Dividends and Distributions to Shareholders
Dividends from net investment income for each Fund, if any, are declared and paid monthly or as the Board may determine from time to time. Distributions of net realized capital gains earned by the Funds, if any, are distributed at least annually.
E. Federal Tax and Tax Basis Information
The timing and character of income and capital gain distributions are determined in accordance with income tax regulations, which may differ from U.S. GAAP. Reclassifications are made to the Funds’ capital accounts for permanent tax differences to reflect income and gains available for distribution (or available capital loss carryforwards) under income tax regulations.
For the year ended November 30, 2018, the following reclassifications, which had no impact on results of operations or net assets, were recorded to reflect permanent tax differences resulting primarily from in-kind transactions:
| Fund | | Paid-in Capital | | | Distributable Earnings | |
| RiverFront Dynamic Core Income ETF | | $ | (1,183,217 | ) | | $ | 1,183,217 | |
| RiverFront Dynamic Unconstrained Income ETF | | | (1,195,150 | ) | | | 1,195,150 | |
| RiverFront Dynamic US Dividend Advantage ETF | | | 9,755,512 | | | | (9,755,512 | ) |
| RiverFront Dynamic US Flex-Cap ETF | | | 11,427,252 | | | | (11,427,252 | ) |
| RiverFront Strategic Income Fund | | | (1,850,058 | ) | | | 1,850,058 | |
The tax character of the distributions paid during the fiscal year ended November 30, 2018 were as follows:
| | | Ordinary Income | | | Long-Term Capital Gain | | | Return of Capital | |
| November 30, 2018 | | | | | | | | | |
| RiverFront Dynamic Core Income ETF | | $ | 2,905,391 | | | $ | – | | | $ | – | |
| RiverFront Dynamic Unconstrained Income ETF | | | 1,868,455 | | | | 27,433 | | | | 38,248 | |
| RiverFront Dynamic US Dividend Advantage ETF | | | 2,425,732 | | | | – | | | | – | |
| RiverFront Dynamic US Flex-Cap ETF | | | 1,321,640 | | | | – | | | | – | |
| RiverFront Strategic Income Fund | | | 10,733,170 | | | | – | | | | – | |
RiverFront ETFs
| Notes to Financial Statements | November 30, 2018 |
The tax character of the distributions paid during the fiscal year ended November 30, 2017 were as follows:
| | | Ordinary Income | |
| November 30, 2017 | | | |
| RiverFront Dynamic Core Income ETF | | $ | 621,587 | |
| RiverFront Dynamic Unconstrained Income ETF | | | 408,541 | |
| RiverFront Dynamic US Dividend Advantage ETF | | | 753,106 | |
| RiverFront Dynamic US Flex-Cap ETF | | | 254,258 | |
| RiverFront Strategic Income Fund | | | 14,055,252 | |
As of November 30, 2018, the components of distributable earnings on a tax basis were as follows:
| | | RiverFront Dynamic Core Income ETF | | | RiverFront Dynamic Unconstrained Income ETF | | | RiverFront Dynamic US Dividend Advantage ETF | | | RiverFront Dynamic US Flex-Cap ETF | | | RiverFront Strategic Income Fund | |
| Accumulated net investment income | | $ | 18,140 | | | $ | – | | | $ | 159,374 | | | $ | 125,563 | | | $ | 81,613 | |
| Accumulated net realized loss on investments | | | (488,760 | ) | | | (355,398 | ) | | | (4,899,426 | ) | | | (2,515,360 | ) | | | (9,167,821 | ) |
| Net unrealized depreciation on investments | | | (2,314,243 | ) | | | (417,465 | ) | | | (3,577,004 | ) | | | (8,156,170 | ) | | | (713,257 | ) |
| Total | | $ | (2,784,863 | ) | | $ | (772,863 | ) | | $ | (8,317,056 | ) | | $ | (10,545,967 | ) | | $ | (9,799,465 | ) |
As of November 30, 2018, the cost of investments for federal income tax purposes and accumulated net unrealized appreciation/(depreciation) on investments were as follows:
| | | RiverFrontDynamic Core Income ETF | | | RiverFront Dynamic Unconstrained Income ETF | | | RiverFront Dynamic US Dividend Advantage ETF | | | RiverFront Dynamic US Flex-Cap ETF | | | RiverFrontStrategic Income Fund | |
| Gross appreciation (excess of value over tax cost) | | $ | 80,938 | | | $ | 72,108 | | | $ | 8,400,986 | | | $ | 6,411,793 | | | $ | 575,492 | |
| Gross depreciation (excess of tax cost over value) | | | (2,395,181 | ) | | | (489,573 | ) | | | (11,977,990 | ) | | | (14,567,963 | ) | | | (1,288,749 | ) |
| Net unrealized appreciation/(depreciation) | | | (2,314,243 | ) | | | (417,465 | ) | | | (3,577,004 | ) | | | (8,156,170 | ) | | | (713,257 | ) |
| Cost of investments for income tax purposes | | $ | 145,567,843 | | | $ | 24,533,599 | | | $ | 154,594,836 | | | $ | 160,480,638 | | | $ | 151,596,346 | |
The differences between book-basis and tax-basis are primarily due to the deferral of losses from wash sales.
Under current law, capital losses maintain their character as short-term or long-term and are carried forward to the next tax year without expiration. As of November 30, 2018, the following amounts are available as carry forwards to the next tax year:
| Fund | | Short-Term | | | Long-Term | |
| RiverFront Dynamic Core Income ETF | | $ | 343,434 | | | $ | 145,326 | |
| RiverFront Dynamic Unconstrained Income ETF | | | 355,398 | | | | – | |
| RiverFront Dynamic US Dividend Advantage ETF | | | 4,899,426 | | | | – | |
| RiverFront Dynamic US Flex-Cap ETF | | | 2,515,359 | | | | – | |
| RiverFront Strategic Income Fund | | | 6,037,902 | | | | 3,129,919 | |
F. Income Taxes
No provision for income taxes is included in the accompanying financial statements, as each Fund intends to distribute to shareholders all taxable investment income and realized gains and otherwise comply with Subchapter M of the Internal Revenue Code of 1986, as amended, applicable to regulated investment companies. Each Fund evaluates tax positions taken (or expected to be taken) in the course of preparing the Funds’ tax returns to determine whether these positions meet a “more-likely-than-not” standard that, based on the technical merits, have a more than fifty percent likelihood of being sustained by a taxing authority upon examination. A tax position that meets the “more-likely-than-not” recognition threshold is measured to determine the amount of benefit to recognize in the financial statements.
RiverFront ETFs
| Notes to Financial Statements | November 30, 2018 |
As of and during the year ended November 30, 2018, the Funds did not have a liability for any unrecognized tax benefits. Each Fund files U.S. federal, state, and local tax returns as required. Each Fund’s tax returns are subject to examination by the relevant tax authorities until expiration of the applicable statute of limitations, which is generally three years after the filing of the tax return, but may extend to four years in certain jurisdictions. Tax returns for open years have incorporated no uncertain tax positions that require a provision for income taxes.
G. Lending of Portfolio Securities
The Funds have entered into a securities lending agreement with State Street Bank & Trust Co. (“SSB”), the Funds’ lending agent. Each Fund may lend its portfolio securities only to borrowers that are approved by SSB. Each Fund will limit such lending to not more than 33 1/3% of the value of its total assets. Each Fund’s securities held at SSB as custodian shall be available to be lent except those securities the Fund or ALPS Advisors, Inc. specifically identifies in writing as not being available for lending. The borrower pledges and maintains with the Fund collateral consisting of cash (U.S. Dollars only), securities issued or guaranteed by the U.S. government or its agencies or instrumentalities, and cash equivalents (including irrevocable bank letters of credit) issued by a person other than the borrower or an affiliate of the borrower. The initial collateral received by each Fund is required to have a value of no less than 102% of the market value of the loaned securities for U.S equity securities and a value of no less than 105% of the market value for non-U.S. equity securities. The collateral is maintained thereafter, at a market value equal to not less than 102% of the current value of the U.S. equity securities on loan and not less than 105% of the current value of the non-U.S. equity securities on loan. The market value of the loaned securities is determined at the close of each business day and any additional required collateral is delivered to each Fund on the next business day. During the term of the loan, each Fund is entitled to all distributions made on or in respect of the loaned securities. Loans of securities are terminable at any time and the borrower, after notice, is required to return borrowed securities within the customary time period for settlement of securities transactions.
Any cash collateral received is reinvested in a money market fund managed by SSB as disclosed in the Fund’s Schedule of Investments and is reflected in the Statements of Assets and Liabilities as a payable for collateral upon return of securities loaned. Non-cash collateral, in the form of securities issued or guaranteed by the U.S. government or its agencies or instrumentalities, is not disclosed in the Fund’s Statements of Assets and Liabilities as it is held by the lending agent on behalf of the Fund, and the Fund does not have the ability to re-hypothecate these securities. Income earned by the Fund from securities lending activity is disclosed in the Statement of Operations. As of November 30, 2018, the Funds had no securities on loan.
The risks of securities lending include the risk that the borrower may not provide additional collateral when required or may not return the securities when due. To mitigate these risks, the Funds benefit from a borrower default indemnity provided by SSB. SSB’s indemnity allows for full replacement of securities lent wherein SSB will purchase the unreturned loaned securities on the open market by applying the proceeds of the collateral, or to the extent such proceeds are insufficient or the collateral is unavailable, SSB will purchase the unreturned loan securities at SSB’s expense. However, the Funds could suffer a loss if the value of the investments purchased with cash collateral falls below the value of the cash collateral received.
3. INVESTMENT ADVISORY FEE AND OTHER AFFILIATED TRANSACTIONS
ALPS Advisors, Inc. (the “Adviser”) acts as each Fund’s investment adviser pursuant to an Advisory Agreement with the Trust on behalf of each Fund (the “Advisory Agreement”). Pursuant to the Advisory Agreement, each Fund pays the Adviser an annual management fee for the services and facilities it provides as a percentage of the relevant Fund’s average daily net assets as set out below:
| Fund | Advisory Fee |
| RiverFront Dynamic Core Income ETF | 0.51%(a) |
| RiverFront Dynamic Unconstrained Income ETF | 0.51%(a) |
| RiverFront Dynamic US Dividend Advantage ETF | 0.52%(b) |
| RiverFront Dynamic US Flex-Cap ETF | 0.52%(b) |
| RiverFront Strategic Income Fund | 0.46% |
| (a) | The unitary advisory fee as a percentage of net assets is subject to the following breakpoints: (i) 0.51% for average net assets up to $600 million, (ii) 0.48% for average net assets equal to or greater than $600 million. |
| (b) | The unitary advisory fee as a percentage of net assets is subject to the following breakpoints: (i) 0.52% for average net assets up to $600 million, (ii) 0.49% for average net assets equal to or greater than $600 million. |
The Adviser and RiverFront Investment Group, LLC (“the Sub-Adviser”) each served under previous investment advisory and sub-advisory agreements, respectively, since the commencement of the Fund until these agreements were terminated on April 16, 2018, due to a change of control of the Adviser’s parent company. Beginning April 16, 2018, the Adviser and the Sub-Adviser each served under an interim investment advisory agreement and interim sub-advisory agreement, respectively, until the current investment advisory and sub-advisory agreements were approved by the Fund’s shareholders.
RiverFront ETFs
| Notes to Financial Statements | November 30, 2018 |
Out of the advisory fee, the Adviser pays substantially all expenses of each Fund, including the cost of transfer agency, custody, fund administration, legal, audit, independent trustees and other services, except for interest expenses, distribution fees or expenses, brokerage expenses, taxes and extraordinary expenses such as litigation and other expenses not incurred in the ordinary course of the Fund’s business. The Adviser’s unitary management fee is designed to pay substantially all of each Fund’s expenses and to compensate the Adviser for providing services for the Funds.
Pursuant to a sub-advisory agreement with the Trust (the ‘‘Sub-Advisory Agreement’’), the Adviser pays the Sub-Adviser a sub-advisory fee out of the Adviser’s advisory fee for the services it provides besides RiverFront Strategic Income Fund, in which the Fund directly pays the Sub-Adviser. The fee is payable on a monthly basis at the annual rate of the relevant Fund’s average daily net assets as set out below:
| Fund | Sub-Advisory Fee |
| RiverFront Dynamic Core Income ETF | 0.35% |
| RiverFront Dynamic Unconstrained Income ETF | 0.35% |
| RiverFront Dynamic US Dividend Advantage ETF | 0.35% |
| RiverFront Dynamic US Flex-Cap ETF | 0.35% |
| RiverFront Strategic Income Fund | 0.35%(a)(b) |
| (a) | Prior to November 1, 2018, the Fund's Sub-Adviser voluntarily waived all of the annual sub-advisory fee. Effective November 1, 2018, the Fund’s Sub-Adviser ceased its voluntary waiver of all of its annual sub-advisory fee payable by the Fund. |
| (b) | Prior to November 1, 2018, the Fund’s Sub-Advisory Fee was 0.30%. |
ALPS Fund Services, Inc., an affiliate of the Adviser, is the administrator of the Funds.
Each Trustee who is not an officer or employee of the Adviser, any sub-adviser or any of their affiliates (“Independent Trustees”) receives (1) a quarterly retainer of $5,000, (2) a per meeting fee for regularly scheduled meetings of $3,750, (3) $1,500 for any special meeting held outside of a regularly scheduled board meeting, and (4) reimbursement for all reasonable out-of-pocket expenses relating to attendance at meetings. In addition, both the Chairman of the Board and Chairman of the Audit Committee each receives a quarterly retainer of $2,000, in connection with their respective roles.
RiverFront ETFs
| Notes to Financial Statements | November 30, 2018 |
4. PURCHASES AND SALES OF SECURITIES
For the year ended November 30, 2018, the cost of purchases and proceeds from sales of investment securities, excluding in-kind transactions and short-term investments, were as follows:
| Fund | | Purchases | | | Sales | |
| RiverFront Dynamic Core Income ETF | | $ | 2,230,286 | | | $ | 17,058,653 | |
| RiverFront Dynamic Unconstrained Income ETF | | | 17,453,438 | | | | 19,415,350 | |
| RiverFront Dynamic US Dividend Advantage ETF | | | 106,898,486 | | | | 107,020,713 | |
| RiverFront Dynamic US Flex-Cap ETF | | | 164,273,198 | | | | 163,480,971 | |
| RiverFront Strategic Income Fund | | | 79,993,965 | | | | 81,876,681 | |
For the year ended November 30, 2018, the cost of U.S. Government security purchases and proceeds from U.S. Government security sales were as follows:
| Fund | | Purchases | | | Sales | |
| RiverFront Dynamic Core Income ETF | | $ | 12,300,816 | | | $ | 292,969 | |
| RiverFront Strategic Income Fund | | | 6,657,359 | | | | 6,312,609 | |
For the year ended November 30, 2018, the cost of in-kind purchases and proceeds from in-kind sales were as follows:
| Fund | | Purchases | | | Sales | |
| RiverFront Dynamic Core Income ETF | | $ | 172,057,642 | | | $ | 69,055,972 | |
| RiverFront Dynamic Unconstrained Income ETF | | | 44,537,780 | | | | 28,780,118 | |
| RiverFront Dynamic US Dividend Advantage ETF | | | 153,547,926 | | | | 57,211,148 | |
| RiverFront Dynamic US Flex-Cap ETF | | | 177,414,054 | | | | 63,097,653 | |
| RiverFront Strategic Income Fund | | | 69,954,614 | | | | 238,263,522 | |
For the year ended November 30, 2018, the in-kind net realized gains/(losses) were as follows:
| Fund | | Net Realized Gain/(Loss) | |
| RiverFront Dynamic Core Income ETF | | $ | (1,183,570 | ) |
| RiverFront Dynamic Unconstrained Income ETF | | | (1,195,150 | ) |
| RiverFront Dynamic US Dividend Advantage ETF | | | 9,730,860 | |
| RiverFront Dynamic US Flex-Cap ETF | | | 11,427,144 | |
| RiverFront Strategic Income Fund | | | (1,844,026 | ) |
Gains on in-kind transactions are not considered taxable for federal income tax purposes.
5. CAPITAL SHARE TRANSACTIONS
Shares are created and redeemed by each Fund only in Creation Unit size aggregations of 50,000 Shares. Only broker-dealers or large institutional investors with creation and redemption agreements called Authorized Participants (“AP”) are permitted to purchase or redeem Creation Units from each Fund. Such transactions are generally permitted on an in-kind basis, with a balancing cash component to equate the transaction to the NAV per unit of each Fund on the transaction date. Cash may be substituted equivalent to the value of certain securities generally when they are not available in sufficient quantity for delivery, not eligible for trading by the AP or as a result of other market circumstances.
6. RELATED PARTY TRANSACTIONS
The Fund engaged in cross trades between other funds in the Trust during the year ended November 30, 2018 pursuant to Rule 17a-7 under the 1940 Act. Cross trading is the buying or selling of portfolio securities between funds to which the Adviser serves as the investment adviser. The Board previously adopted procedures that apply to transactions between the Funds of the Trust pursuant to Rule 17a-7. These transactions related to cross trades during the period complied with the requirements set forth by Rule 17a-7 and the Trust’s procedures.
RiverFront ETFs
| Notes to Financial Statements | November 30, 2018 |
Transactions related to cross trades during the year ended November 30, 2018, were as follows:
| Fund | | Purchase cost paid | | | Sale proceeds received | | | Realized gain/(loss) on sales | |
| Riverfront Dynamic US Dividend Advantage ETF | | $ | 4,480,763 | | | $ | 3,387,610 | | | $ | (51,211 | ) |
| Riverfront Dynamic US Flex-Cap ETF | | $ | 3,387,610 | | | $ | 4,480,763 | | | $ | (251,241 | ) |
7. NEW ACCOUNTING PRONOUNCEMENTS
In March 2017, Financial Accounting Standards Board (“FASB”) issued Accounting Standards Update (“ASU”) “Premium Amortization on Purchased Callable Debt Securities” which amends the amortization period for a callable debt security held at a premium from the maturity date to the earliest call date. The guidance is effective for annual periods beginning after December 15, 2018, and interim periods within those annual periods. At this time, management is currently evaluating the impact of this ASU to the Funds’ financial statements.
In August 2018, the FASB issued ASU 2018-13, which changes the fair value measurement disclosure requirements of FASB ASC Topic 820, Fair Value Measurement. The update to Topic 820 includes new, eliminated, and modified disclosure requirements. ASU 2018-13 is effective for fiscal years beginning after December 15, 2019, including interim periods. Early adoption is permitted for any eliminated or modified disclosures. The Funds have elected to early adopt the eliminated and modified disclosures effective with the financial statements prepared as of November 30, 2018.
8. SEC REGULATIONS
On October 4, 2018, the SEC amended Regulation S-X to require certain financial statement disclosure requirements to conform them to GAAP for investment companies. Effective November 4, 2018, the Fund adopted disclosure requirement changes for Regulation S-X, these changes are reflected throughout this report. The Fund’s adoption of the amendments, effective with the financial statements prepared as of November 30, 2018, had no effect on the Fund’s net assets or results of operations.
RiverFront ETFs
| Additional Information | November 30, 2018 (Unaudited) |
PROXY VOTING RECORDS, POLICIES AND PROCEDURES
Information regarding how each Fund voted proxies relating to portfolio securities during the most recent 12-month period ended June 30 and a description of the Funds’ proxy voting policies and procedures used in determining how to vote for proxies are available without charge on the SEC’s website at www.sec.gov and upon request, by calling (toll-free) 1-866-675-2639.
PORTFOLIO HOLDINGS
The Trust is required to disclose, after its first and third fiscal quarters, the complete schedule of each Fund’s portfolio holdings with the SEC on Form N-Q. Forms N-Q for each Fund are available on the SEC’s website at www.sec.gov. Each Fund’s Forms N-Q may also be reviewed and copied at the SEC’s Public Reference Room in Washington, D.C. and information on the operation of the Public Reference Room may be obtained by calling 1-800-SEC-0330. Each Fund’s Forms N-Q are available without charge, upon request, by calling (toll-free) 1-866-675-2639 or by writing to ALPS ETF Trust at 1290 Broadway, Suite 1100, Denver, Colorado 80203.
TAX INFORMATION
The Funds designate the following for federal income tax purposes for distributions made during the calendar year ended December 31, 2017:
| | Qualified Dividend Income | Dividend Received Deduction |
| RiverFront Dynamic Core Income ETF | 0.00% | 0.00% |
| RiverFront Dynamic Unconstrained Income ETF | 0.00% | 0.00% |
| Riverfront Dynamic US Dividend Advantage ETF | 100.00% | 99.16% |
| Riverfront Dynamic US Flex-Cap ETF | 100.00% | 100.00% |
| Riverfront Strategic Income Fund | 0.00% | 0.00% |
In early 2018, if applicable, shareholders of record received this information for the distributions paid to them by the Funds during the calendar year 2017 via Form 1099. The Funds will notify shareholders in early 2019 of amounts paid to them by the Funds, if any, during the calendar year 2018.
Pursuant to Section 852(b)(3) of the Internal Revenue Code, the ALPS RiverFront Dynamic Unconstrained Income ETF designated $27,433 as long term capital gain dividends made during the fiscal year ended November 30, 2018.
RiverFront ETFs
| Trustees & Officers | November 30, 2018 (Unaudited) |
The general supervision of the duties performed by the Adviser for the Fund under the Investment Advisory Agreement is the responsibility of the Board of Trustees. The Trust currently has four Trustees. Three Trustees have no affiliation or business connection with the Adviser or any of its affiliated persons and do not own any stock or other securities issued by the Adviser. These are the “non-interested” or “independent” Trustees (“Independent Trustees”). The other Trustee (the “Interested Trustee”) is affiliated with the Adviser.
The Independent Trustees of the Trust, their term of office and length of time served, their principal business occupations during the past five years, the number of portfolios in the Fund Complex overseen by each Independent Trustee, and other directorships, if any, held by the Trustee are shown below.
INDEPENDENT TRUSTEES
| Name, Address & Year of Birth* | Position(s) Held with Trust | Term of Office and Length of Time Served** | Principal Occupation(s)
During Past 5 Years | Number of Portfolios in Fund Complex Overseen by Trustees*** | Other Directorships Held by Trustees |
Mary K. Anstine, 1940 | Trustee | Since March 2008 | Ms. Anstine was President/Chief Executive Officer of HealthONE Alliance, Denver, Colorado, and former Executive Vice President of First Interstate Bank of Denver. Ms. Anstine is also Trustee/Director of AV Hunter Trust and Colorado Uplift Board. Ms. Anstine was formerly a Director of the Trust Bank of Colorado (later purchased and now known as Northern Trust Bank), HealthONE and Denver Area Council of the Boy Scouts of America and a member of the American Bankers Association Trust Executive Committee. | 41 | Ms. Anstine is a Trustee of ALPS Variable Investment Trust (9 funds); Financial Investors Trust (33 funds); Reaves Utility Income Fund (1 fund); and Segall Bryant & Hamill Trust (14 funds). |
Jeremy W. Deems, 1976 | Trustee | Since March 2008 | Mr. Deems is the Co-Founder, Chief Compliance Officer and Chief Financial Officer of Green Alpha Advisors, LLC. Mr. Deems is Co-Portfolio Manager of the Shelton Green Alpha Fund. Prior to joining Green Alpha Advisors, Mr. Deems was CFO and Treasurer of Forward Management, LLC, ReFlow Management Co., LLC, ReFlow Fund, LLC, a private investment fund, and Sutton Place Management, LLC, an administrative services company. | 41 | Mr. Deems is a Trustee of ALPS Variable Investment Trust (9 funds); Financial Investors Trust (33 funds); and Reaves Utility Income Fund (1 fund); and Clough Funds Trust (1 fund). |
Rick A. Pederson, 1952 | Trustee and Chairman | Since March 2008. Has served as Chairman since July 2017. | Mr. Pederson is Partner, Bow River Capital Partners (private equity management), 2003 - present; Board Member, Prosci Inc. (private business services) 2013-2016; Board Member, Citywide Banks (Colorado community bank) 2014-present; Board Member, Strong-Bridge Consulting (management consulting) 2015-present; Board Member, IRI/ODMS Holdings LLC, 2017 – present; Director, National Western Stock Show (not-for-profit organization) 2010 – present; Board Member, History Colorado, 2015 – present; Trustee, Boettcher Foundation, 2018. | 21 | Mr. Pederson is Trustee of Segall Bryant & Hamill Trust (14 funds) and Principal Real Estate Income Fund (1 fund) |
| * | The business address of the Trustee is c/o ALPS Advisors, Inc., 1290 Broadway, Suite 1100, Denver, Colorado 80203. |
| ** | This is the period for which the Trustee began serving the Trust. Each Trustee serves an indefinite term, until his successor is elected. |
| *** | The Fund Complex includes all series of the Trust and any other investment companies for which ALPS Advisors, Inc. provides investment advisory services. |
RiverFront ETFs
| Trustees & Officers | November 30, 2018 (Unaudited) |
The Trustee who is affiliated with the Adviser or affiliates of the Adviser and executive officers of the Trust, his term of office and length of time served, his principal business occupations during the past five years, the number of portfolios in the Fund Complex overseen by the Interested Trustee and the other directorships, if any, held by the Trustee, are shown below.
INTERESTED TRUSTEE
| Name, Address and Year of Birth of Interested Trustee* | Position(s) Held with Trust | Term of Office and Length of Time Served** | Principal Occupation(s) During Past 5 Years | Number of Portfolios in Fund Complex Overseen by Trustees*** | Other Directorships Held by Trustee |
| Edmund J. Burke, 1961 | Trustee and President | Since December 2017 | Mr. Burke is President and a Director of ALPS Holdings, Inc. (“AHI”) (since 2005) and Director of Boston Financial Data Services, Inc. (“BFDS”), ALPS Advisors, Inc. (“AAI”), ALPS Distributors, Inc. (“ADI”), ALPS Fund Services, Inc. (“AFS”) and ALPS Portfolio Solutions Distributor, Inc. (“APSD”). Because of his positions with AHI, BFDS, AAI, ADI, AFS and APSD, Mr. Burke is deemed an affiliate of the Trust as defined under the 1940 Act. | 36 | Mr. Burke is a Trustee of Clough Global Dividend and Income Fund (1 fund); Clough Global Equity Fund (1 fund); Clough Global Opportunities Fund (1 fund); Clough Funds Trust (1 fund); Liberty All-Star Equity Fund (1 fund); Director of the Liberty All-Star Growth Fund, Inc. (1 fund) and Financial Investors Trust (33 funds). |
| * | The business address of the Trustee is c/o ALPS Advisors, Inc., 1290 Broadway, Suite 1100, Denver, Colorado 80203. |
| ** | This is the period for which the Trustee began serving the Trust. Each Trustee serves an indefinite term, until his successor is elected. |
| *** | The Fund Complex includes all series of the Trust and any other investment companies for which ALPS Advisors, Inc. provides investment advisory services. |
RiverFront ETFs
| Trustees & Officers | November 30, 2018 (Unaudited) |
OFFICERS
Name, Address and Year of Birth of Officer* | Position(s) Held with Trust | Length of Time Served** | Principal Occupation(s) During Past 5 Years |
Erin D. Nelson, 1977 | Chief Compliance Officer (“CCO”) | Since December 2015 | Ms. Nelson became Senior Vice-President and Chief Compliance Officer of ALPS Advisors, Inc. on July 1, 2015 and prior to that served as Vice President and Deputy Chief Compliance Officer of AAI since January 1, 2015. Prior to January 1, 2015, Ms. Nelson was Vice-President and Assistant General Counsel of ALPS Fund Services. Because of her position with AAI, Ms. Nelson is deemed an affiliate of the Trust as defined under the 1940 Act. Ms. Nelson is also the CCO of ALPS Variable Investment Trust, Liberty All-Star Growth Fund, Inc., Liberty All-Star Equity Fund, Principal Real Estate Income Fund, RiverNorth Opportunities Fund, Inc. and Red Rocks Capital, LLC. |
Kathryn Burns, 1976 | Treasurer | Since September 2018 | Ms. Burns serves as Vice President, Director of Fund Operations of AAI since 2018. From 2013 to 2018, she served as Vice President and Fund Controller at ALPS Fund Services. Prior to joining ALPS, she worked at Old Mutual Capital where she served as Vice President and Chief Compliance Officer (2010 – 2012) and Regulatory Reporting Manager and Assistant Treasurer to the Old Mutual Funds Trusts (2006 – 2012). She also served as a CPA for PricewaterhouseCoopers LLP. Ms. Burns is also Treasurer of ALPS Variable Investment Trust, the Boulder Growth & Income Fund, Inc., Principal Real Estate Income Fund and the RiverNorth Opportunities Fund Inc. |
Andrea E. Kuchli, 1985 | Secretary | Since December 2017 | Ms. Kuchli joined ALPS in 2015 and is currently Vice President and Senior Counsel of ALPS. Prior to joining ALPS, Ms. Kuchli was an Associate with Davis Graham & Stubbs LLP from April 2014 to February 2015, and an Associate with Dechert LLP from 2011 to April 2014. Because of her position with ALPS, Ms. Kuchli is deemed an affiliate of the Trust as defined under the 1940 Act. Ms. Kuchli is also Secretary of ALPS Variable Investment Trust and Principal Real Estate Income Fund as well as Assistant Secretary of the James Advantage Funds. |
Sharon Akselrod, 1974 | Assistant Secretary | Since December 2016 | Ms. Akselrod joined ALPS in August 2014 and is currently Senior Investment Company Act Paralegal of ALPS Fund Services, Inc. Prior to joining ALPS, Ms. Akselrod served as Corporate Governance and Regulatory Associate for Nordstrom fsb (2013-2014) and Senior Legal Assistant – Legal Manager for AXA Equitable Life Insurance Company (2008-2013). Because of her position with ALPS, Ms. Akselrod is deemed an affiliate of the Trust as defined under the 1940 Act. Ms. Akselrod is also Assistant Secretary of Financial Investors Trust, ALPS Variable Investment Trust, Principal Real Estate Income Fund and Clough Funds Trust. |
| * | The business address of each Officer is c/o ALPS Advisors, Inc., 1290 Broadway, Suite 1100, Denver, Colorado 80203. |
| ** | This is the period for which the Officer began serving the Trust. Each Officer serves an indefinite term, until his/her successor is elected. |

TABLE OF
CONTENTS
| Performance Overview | |
| Sprott Gold Miners ETF | 1 |
| Sprott Junior Gold Miners ETF | 4 |
| Disclosure of Fund Expenses | 7 |
| Report of Independent Registered Public Accounting Firm | 8 |
| Financial Statements | |
| Schedule of Investments | |
| Sprott Gold Miners ETF | 9 |
| Sprott Junior Gold Miners ETF | 10 |
| Statements of Assets and Liabilities | 11 |
| Statements of Operations | 12 |
| Statements of Changes in Net Assets | |
| Sprott Gold Miners ETF | 13 |
| Sprott Junior Gold Miners ETF | 14 |
| Financial Highlights | 15 |
| Notes to Financial Statements | 17 |
| Additional Information | 25 |
| Trustees & Officers | 27 |
Beginning on January 1, 2021, as permitted by regulations adopted by the U.S. Securities and Exchange Commission, paper copies of the Funds’ annual and semi-annual shareholder reports will no longer be sent by mail, unless you specifically request paper copies of the reports from your financial intermediary (such as a broker-dealer or bank). Instead, the reports will be made available on the Funds’ website (www.alpsfunds.com), and you will be notified by mail each time a report is posted and provided with a website link to access the report.
If you already elected to receive shareholder reports electronically, you will not be affected by this change and you need not take any action. You may elect to receive shareholder reports and other communications from a Fund electronically anytime by contacting your financial intermediary.
You may elect to receive all future reports in paper free of charge. You can contact your financial intermediary to request that you continue to receive paper copies of your shareholder reports. Your election to receive reports in paper will apply to all funds held in your account with your financial intermediary.
alpsfunds.com
Sprott Gold Miners ETF
| Performance Overview | November 30, 2018 (Unaudited) |
Investment Objective
Sprott Gold Miners ETF (the “Fund”) employs a “passive management”—or indexing—investment approach designed to seek investment results that correspond (before fees and expenses) generally to the performance of the Sprott Zacks Gold Miners Index (the “Underlying Index”).
The Underlying Index was created by Zacks Index Services to provide a means of generally tracking the performance of gold and silver mining companies whose stocks are traded on major U.S. exchanges. The Underlying Index uses a transparent, rules-based methodology that is designed to identify the stocks of 25 gold and silver mining companies with the highest beta† to the spot price of gold, with each stock’s weighting in the index adjusted based on its quarterly revenue growth on a year-over-year basis and the quality of its balance sheet, as measured by long-term debt to equity. The Underlying Index is rebalanced on a quarterly basis to incorporate the latest financial data into the screening process. At least 80% of the Underlying Index (by weight) must consist of gold mining companies while no more than 20% may consist of silver mining companies.
SGDM Performance Overview
The Fund for the one-year period ended November 30, 2018 generated a total return of -22.56%, in line with the Underlying Index, which fell -22.03%. The Fund’s Underlying Index emphasizes companies with the highest historical revenue growth and the lowest long-term debt to equity. We believe these are important factors in determining the long-run success of gold miners.
Gold fell 5.27% for the year ended November 30, 2018, pressured by interest rate increases and quantitative tightening by the Federal Reserve, as well as a higher U.S dollar. Gold stocks which are sensitive to the price of gold fell sharply, further exacerbated by investors rotating away from many natural resource sectors in response to the growing trade war and tension with China.
More recently, we have seen investor sentiment shift as U.S. equity markets entered into a price correction in early October. Over the last 2 months of the fiscal year, gold increased by 2.48% as investors sought safe haven assets, while the S&P 500 Total Return index fell -4.94% and the Sprott Gold Miners ETF declined by 2.33% during the same time period. Gold stock valuations remain at very low levels compared to historical levels and should the U.S. equities continue to trend lower in 2019, gold, and thus gold miners, may experience stronger relative performance. One other factor impacting gold stocks is renewed merger and acquisition activity as companies seek strategic transactions to grow their reserves and/or reduce costs. One notable merger announced was between Barrick Gold Corp. and Randgold Resources Ltd., both constituents in the underlying index. The companies will merge on January 1, 2019 and will become the highest producing gold company in the world. We believe that other companies will be pressured to consider mergers if market valuations remain depressed.
Of the 29 positions that were held at some point in the portfolio during the time period, 3 contributed positively while 26 detracted. The top contributor for the period was SSR Mining, Inc. (SSRM), returning 27.88% and contributing .22% to the portfolio. Cia De Minas Buenaventure SAA, ADR (BVN) and Hecla Mining, Inc. (HL) ranked 2nd and 3rd, contributing .17% and .13%, respectively, while returning 1.68% and 5.95%, respectively. Goldcorp, Inc. (GG) detracted the most from the portfolio losing 26.11% resulting in 2.96% off the return. Rangold Resources Ltd-ADR (GOLD) also detracted from the fund, pulling 2.73% from return, down 8.94% for the year.
Performance(as of November 30, 2018)
| | 1 Year | 3 Year | Since Inception^ |
| Sprott Gold Miners ETF - NAV | -22.56% | 6.29% | -10.18% |
| Sprott Gold Miners ETF - Market Price* | -22.84% | 6.17% | -10.24% |
| Sprott Zacks Gold Miners Total Return Index | -22.03% | 7.08% | -9.53% |
| S&P 500®Total Return Index | 6.27% | 12.16% | 10.16% |
Total Expense Ratio (per the current prospectus) 0.57%
Performance data quoted represents past performance. Past performance does not guarantee future results. The table does not reflect the deduction of taxes that a shareholder would pay on Fund distributions or the redemption of Fund shares. Investment return and principal value of an investment will fluctuate so that an investor’s shares, when sold or redeemed, may be worth more or less than the original cost. Current performance data may be higher or lower than actual data quoted. For the most current month-end performance data please visit www.alpsfunds.com or call 1.855.215.1425.
NAV is an exchange-traded fund’s per-share value. The per-share dollar amount of the Fund is derived by dividing the total value of all the securities in its portfolio, less any liabilities, by the number of Fund shares outstanding. Market Price is the price at which a share can currently be traded in the market. Information detailing the number of days the Market Price of the Fund was greater than the Fund’s NAV and the number of days it was less than the Fund’s NAV can be obtained at www.alpsfunds.com.
| † | Beta is defined as a sensitivity measure based on regression against the spot gold price movement during the trailing 36 months. |
| ^ | The Fund’s Commencement date was July 15, 2014. |
Sprott Gold Miners ETF
| Performance Overview | November 30, 2018 (Unaudited) |
| * | Market Price is based on the midpoint of the bid-ask spread at 4 p.m. ET and does not represent the returns an investor would receive if shares were traded at other times. |
Sprott Zacks Gold Miners Total Return Indexis comprised of approximately 25 stocks selected, based on investment and other criteria, from a universe of gold and silver mining companies whose stock is listed on a major U.S. exchange. The stocks are selected using a proprietary, quantitative rules-based methodology developed by Zacks Index Services.
S&P 500® Total Return Indexis the Standard & Poor’s composite index of 500 stocks, a widely recognized, unmanaged index of common stock prices.
The indexes are reported on a total return basis, which assumes reinvestment of any dividends and distributions realized during a given time period. The indexes are not actively managed and do not reflect any deductions for fees, expenses or taxes. One cannot invest directly in an index. Index performance does not reflect fund performance.
The Fund is concentrated in the gold and silver mining industry. As a result, the Fund will be sensitive to changes in, and its performance will depend to a greater extent on, the overall condition of the gold and silver mining industry. Also, gold and silver mining companies are highly dependent on the price of gold and silver bullion. These prices may fluctuate substantially over short periods of time so the Fund’s Share price may be more volatile than other types of investments.
Funds that emphasize investments in small-cap and mid-cap companies will generally experience greater price volatility.
Funds investing in foreign and emerging markets will also generally experience greater price volatility.
The Fund’s shares are not individually redeemable. Investors buy and sell shares of the Fund on a secondary market. Only market makers or “authorized participants” may trade directly with the Fund, typically in blocks of 50,000 shares.
The Sprott Gold Miners ETF is not suitable for all investors. Investments in the Fund are subject to investment risks, including possible loss of the principal amount invested.
ALPS Portfolio Solutions Distributor, Inc., a FINRA member, is the distributor for the Sprott Gold Miners ETF.
ALPS Portfolio Solutions Distributor, Inc. is not affiliated with Sprott or Zacks Index Services, a division of Zacks Investment Management.
Sprott Gold Miners ETF
| Performance Overview | November 30, 2018 (Unaudited) |
Top 10 Holdings*(as of November 30, 2018)
| Royal Gold, Inc. | 12.36% |
| Agnico Eagle Mines, Ltd. | 11.78% |
| Goldcorp, Inc. | 11.78% |
| Wheaton Precious Metals Corp. | 9.07% |
| Kirkland Lake Gold, Ltd. | 4.93% |
| Cia de Minas Buenaventura SAA, ADR | 4.52% |
| Barrick Gold Corp. | 4.48% |
| B2Gold Corp. | 4.37% |
| IAMGOLD Corp. | 3.71% |
| AngloGold Ashanti, Ltd., Sponsored ADR | 3.39% |
| Total % of Top 10 Holdings | 70.39% |
Country Allocation*(as of November 30, 2018)
| Canada | 74.23% |
| United States | 13.06% |
| South Africa | 8.14% |
| Peru | 4.52% |
| Money Market Fund | 0.05% |
| Total | 100.00% |
| * | % of Total Investments (excluding investments purchased with collateral from securities loaned) |
Future holdings are subject to change.
Growth of $10,000(as of November 30, 2018)
Comparison of Change in Value of $10,000 Investment in the Fund and the Underlying Index
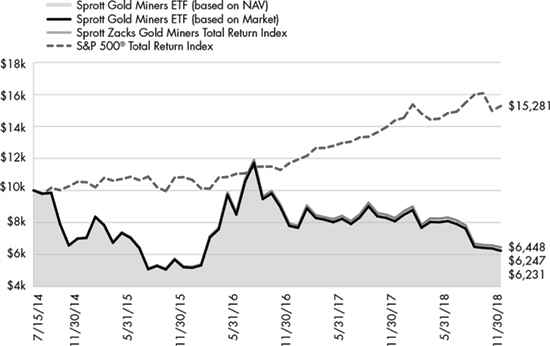
The chart above represents historical performance of a hypothetical investment of $10,000 in the Fund over the life of the Fund. Past performance does not guarantee future results. This chart does not reflect the deduction of taxes that a shareholder would pay on Fund distributions or the redemption of Fund shares.
Sprott Junior Gold Miners ETF
| Performance Overview | November 30, 2018 (Unaudited) |
Investment Objective
Sprott Junior Gold Miners ETF (the “Fund”) employs a “passive management”—or indexing—investment approach designed to seek investment results that correspond (before fees and expenses) generally to the performance of the Sprott Zacks Junior Gold Miners Index (the “Underlying Index”).
The Underlying Index was created by Zacks Index Services to provide a means of generally tracking the performance of “junior” gold and silver mining companies whose stocks are traded on major U.S. or Canadian exchanges. Junior companies include early stage mining companies that are in the exploration stage only or that hold properties that might not ultimately produce gold or silver. The Underlying Index uses a transparent, rules-based methodology that is designed to identify between 30 to 40 junior gold and silver stocks with market capitalization between $250 million and $2 billion. Excluding companies with market capitalization below $250 million aims to exclude very early stage exploration companies whose historical success rate is low. Each stock’s weighting in the Underlying Index is adjusted based on 2 company factors: 1) Revenue Growth and 2) Price Momentum. The Underlying Index is reconstituted on a semi-annual basis, in November and May, to incorporate the latest factor scores into the selection and weighting process. At least 80% of the Underlying Index (by weight) must consist of junior gold mining companies while no more than 20% may consist of junior silver mining companies.
SGDJ Performance Overview
The Fund for the one-year period ended November 30, 2018 generated a total return of -31.19%, in-line with the Underlying Index, which returned -30.78%. The Fund’s Underlying Index emphasizes companies with the highest historical revenue growth and the strongest relative stock price momentum. We believe these are important factors in determining the long-run success of junior gold miners.
Gold fell 5.27% for the year ended November 30, 2018, pressured by interest rate increases and quantitative tightening by the Federal Reserve, as well as a higher U.S dollar and. Gold stocks which are sensitive to the price of gold fell sharply, further exacerbated by investors rotating away from many natural resource sectors in response to the growing trade war and tension with China. Junior gold stocks lagged their larger market value gold stocks as their share prices have historically been more impacted by changes in the price of gold, their ability to raise investor capital to finance exploration and development and investor sentiment.
More recently, we have seen investor sentiment shift as U.S. equity markets entered into a price correction in early October. Over the last 2 months of the fiscal year, gold increased by 2.48% as investors sought safe haven assets, while the S&P 500 Total Return index fell 4.94% and the Sprott Junior Gold Miners ETF declined 9.76% during the same time period. Gold stock valuations remain at very low levels compared to historical levels and should the U.S. equities continue to trend lower in 2019, gold, and thus gold miners, may experience stronger relative performance. One other factor impacting gold stocks is renewed merger and acquisition activity as companies seek strategic transactions to grow their reserves and/or reduce costs. One notable merger announced was between Barrick Gold Corp. and Randgold Resources Ltd. We believe that other companies will be pressured to consider mergers if market valuations remain depressed. In this scenario, junior gold companies could become attractive takeover candidates by the senior gold companies.
Of the 43 positions that were held at some point in the portfolio for the time period, 6 contributed positively to return while 37 detracted. Oceana Gold Corp (OGC CN) contributed the most to return, adding .89% on a 14.52% gain. SSR Mining Inc (SSRM) contributed ..43%, after returning 27.88% for the year. The bottom two performers in the Fund were New Gold, Inc (NGD) and Guyana Goldfields Inc (GUY CN) detracting 3.46% and 1.14%, respectively. NGD and GUY CN were down 75.45% and 68.92% in total return, respectively, for the period.
Performance(as of November 30, 2018)
| | 1 Year | 3 Year | Since Inception^ |
| Sprott Junior Gold Miners ETF - NAV | -31.19% | 4.17% | -2.29% |
| Sprott Junior Gold Miners ETF - Market Price* | -31.26% | 4.11% | -2.35% |
| Sprott Zacks Junior Gold Miners Total Return Index | -30.78% | 5.05% | -1.46% |
| S&P 500® Total Return Index | 6.27% | 12.16% | 10.18% |
Total Expense Ratio (per the current prospectus) 0.57%
Performance data quoted represents past performance. Past performance does not guarantee future results. The table does not reflect the deduction of taxes that a shareholder would pay on Fund distributions or the redemption of Fund shares. Investment return and principal value of an investment will fluctuate so that an investor’s shares, when sold or redeemed, may be worth more or less than the original cost. Current performance data may be higher or lower than actual data quoted. For the most current month-end performance data please visit www.alpsfunds.com or call 1.855.215.1425.
NAV is an exchange-traded fund’s per-share value. The per-share dollar amount of the Fund is derived by dividing the total value of all the securities in its portfolio, less any liabilities, by the number of Fund shares outstanding. Market Price is the price at which a share can currently be traded in the market. Information detailing the number of days the Market Price of the Fund was greater than the Fund’s NAV and the number of days it was less than the Fund’s NAV can be obtained at www.alpsfunds.com.
Sprott Junior Gold Miners ETF
| Performance Overview | November 30, 2018 (Unaudited) |
| ^ | The Fund’s Commencement date was March 31, 2015. |
| * | Market Price is based on the midpoint of the bid-ask spread at 4 p.m. ET and does not represent the returns an investor would receive if shares were traded at other times. |
Sprott Zacks Junior Gold Miners Total Return Indexis comprised of between 30 to 40 stocks selected, based on investment and other criteria, from a universe of gold and silver mining companies whose stocks are listed on a major U.S. or Canadian exchange. The stocks are selected using a proprietary, quantitative rules-based methodology developed by Zacks Index Services.
S&P 500® Total Return Indexis the Standard & Poor’s composite index of 500 stocks, a widely recognized, unmanaged index of common stock prices.
The indexes are reported on a total return basis, which assumes reinvestment of any dividends and distributions realized during a given time period. The indexes are not actively managed and do not reflect any deductions for fees, expenses or taxes. One cannot invest directly in an index. Index performance does not reflect fund performance.
The Fund is concentrated in the gold and silver mining industry. As a result, the Fund will be sensitive to changes in, and its performance will depend to a greater extent on, the overall condition of the gold and silver mining industry. Also, gold and silver mining companies are highly dependent on the price of gold and silver bullion. These prices may fluctuate substantially over short periods of time so the Fund’s Share price may be more volatile than other types of investments.
Funds that emphasize investments in small-cap and mid-cap companies will generally experience greater price volatility. Micro-cap stocks involve substantially greater risks of loss and price fluctuations because their earnings and revenues tend to be less predictable. These companies may be newly formed or in the early stages of development, with limited product lines, markets or financial resources and may lack management depth.
Funds investing in foreign and emerging markets will also generally experience greater price volatility.
The Fund’s shares are not individually redeemable. Investors buy and sell shares of the Fund on a secondary market. Only market makers or “authorized participants” may trade directly with the Fund, typically in blocks of 50,000 shares.
The Sprott Junior Gold Miners ETF is not suitable for all investors. Investments in the Fund are subject to investment risks, including possible loss of the principal amount invested.
ALPS Portfolio Solutions Distributor, Inc., a FINRA member, is the distributor for the Sprott Junior Gold Miners ETF.
ALPS Portfolio Solutions Distributor, Inc. is not affiliated with Sprott or Zacks Index Services, a division of Zacks Investment Management.
Sprott Junior Gold Miners ETF
| Performance Overview | November 30, 2018 (Unaudited) |
Top 10 Holdings*(as of November 30, 2018)
| OceanaGold Corp. | 8.22% |
| Sibanye Gold, Ltd., Sponsored ADR | 6.58% |
| Endeavour Mining Corp. | 6.53% |
| Detour Gold Corp. | 6.28% |
| Pretium Resources, Inc. | 5.93% |
| SSR Mining, Inc. | 5.62% |
| Osisko Gold Royalties, Ltd. | 5.54% |
| Alamos Gold, Inc., Class A | 4.61% |
| Centerra Gold, Inc. | 4.34% |
| Harmony Gold Mining Co., Ltd., Sponsored ADR | 3.88% |
| Total % of Top 10 Holdings | 57.53% |
Country Allocation*(as of November 30, 2018)
| Canada | 65.85% |
| South Africa | 10.47% |
| United States | 8.88% |
| Australia | 8.22% |
| Monaco | 6.53% |
| Money Market Fund | 0.05% |
| Total | 100.00% |
| | |
| * | % of Total Investments (excluding investments purchased with collateral from securities loaned) |
Future holdings are subject to change.
Growth of $10,000(as of November 30, 2018)
Comparison of Change in Value of $10,000 Investment in the Fund and the Underlying Index
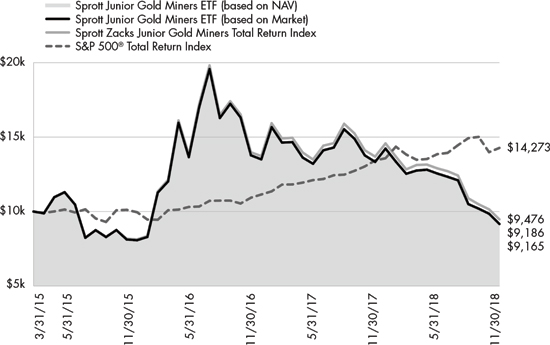
The chart above represents historical performance of a hypothetical investment of $10,000 in the Fund over the life of the Fund. Past performance does not guarantee future results. This chart does not reflect the deduction of taxes that a shareholder would pay on Fund distributions or the redemption of Fund shares.
Sprott ETFs
| Disclosure of Fund Expenses | November 30, 2018 (Unaudited) |
Shareholder Expense Example:As a shareholder of a Fund, you incur two types of costs: (1) transaction costs which may include creation and redemption fees or brokerage charges, and (2) ongoing costs, including management fees and other Fund expenses. These examples are intended to help you understand your ongoing costs (in dollars) of investing in a Fund and to compare these costs with the ongoing costs of investing in other funds. It is based on an investment of $1,000 invested at the beginning of the (six month) period and held through May 31, 2018.
Actual Return:The first line of the table provides information about actual account values and actual expenses. You may use the information in this line, together with the amount you invested, to estimate the expenses that you incurred over the period. Simply divide your account value by $1,000 (for example, an $8,600 account value divided by $1,000 = 8.6), then multiply the result by the number in the first line under the heading entitled “Expenses Paid During Period” to estimate the expenses attributable to your investment during this period.
Hypothetical 5% Return:The second line of the table provides information about hypothetical account values and hypothetical expenses based on each Fund’s actual expense ratio and an assumed rate of return of 5% per year before expenses, which is not the Fund’s actual return. The hypothetical account values and expenses may not be used to estimate the actual ending account balance or expenses you paid for the period. You may use this information to compare ongoing costs of investing in each Fund and other funds. To do so, compare this 5% hypothetical example with the 5% hypothetical examples that appear in the shareholder reports of other funds.
The expenses shown in the table are meant to highlight ongoing Fund costs only and do not reflect any transaction costs, such as creation and redemption fees or brokerage charges. Therefore, the second line is useful in comparing ongoing costs only, and will not help you determine the relative total costs of owning different funds. In addition, if these costs were included, your costs would have been higher.
| | Beginning Account Value 6/1/18 | Ending Account Value 11/30/18 | Expense Ratio(a) | Expenses Paid During Period 6/1/18 - 11/30/18(b) |
| Sprott Gold Miners ETF | | | | |
| Actual | $1,000.00 | $770.20 | 0.57% | $2.53 |
| Hypothetical (5% return before expenses) | $1,000.00 | $1,022.21 | 0.57% | $2.89 |
| Sprott Junior Gold Miners ETF | | | | |
| Actual | $1,000.00 | $732.50 | 0.57% | $2.48 |
| Hypothetical (5% return before expenses) | $1,000.00 | $1,022.21 | 0.57% | $2.89 |
| (a) | Annualized, based on the Fund's most recent fiscal half year expenses. |
| (b) | Expenses are equal to the Fund's annualized expense ratio multiplied by the average account value over the period, multiplied by the number of days in the most recent fiscal half year (183), divided by 365. |
Sprott ETFs
Report of Independent Registered Public Accounting Firm
To the shareholders and the Board of Trustees of ALPS ETF Trust:
Opinion on the Financial Statements and Financial Highlights
We have audited the accompanying statements of assets and liabilities, including the schedules of investments, of Sprott Gold Miners ETF and Sprott Junior Gold Miners ETF (the “Funds”), two of the funds constituting the ALPS ETF Trust, as of November 30, 2018; the related statement of operations for the year then ended, the statements of changes in net assets for each of the two years in the period then ended, and the financial highlights for the years ended November 30, 2018, 2017, 2016, 2015 and for the period July 15, 2014 (commencement of operations) to November 30, 2014, for Sprott Gold Miners ETF; the related statement of operations for the year then ended, the statements of changes in net assets for each of the two years in the period then ended, and the financial highlights for the years ended November 30, 2018, 2017, 2016 and for the period March 31, 2015 (commencement of operations) to November 30, 2015, for Sprott Junior Gold Miners ETF; and the related notes.
In our opinion, the financial statements and financial highlights present fairly, in all material respects, the financial position of Sprott Gold Miners ETF as of November 30, 2018, and the results of its operations for the year then ended, the changes in its net assets for each of the two years in the period then ended, and the financial highlights for the years ended November 30, 2018, 2017, 2016. 2015 and for the period July 15, 2014 (commencement of operations) to November 30, 2014, in conformity with accounting principles generally accepted in the United States of America. Also, in our opinion, the financial statements and financial highlights present fairly, in all material respects, the financial position of Sprott Junior Gold Miners ETF as of November 30, 2018, and the results of its operations for the year then ended, the changes in its net assets for each of the two years in the period then ended, and the financial highlights for the years ended November 30, 2018, 2017, 2016 and for the period March 31, 2015 (commencement of operations) to November 30, 2015, in conformity with accounting principles generally accepted in the United States of America.
Basis for Opinion
These financial statements and financial highlights are the responsibility of the Funds’ management. Our responsibility is to express an opinion on the Funds’ financial statements and financial highlights based on our audits. We are a public accounting firm registered with the Public Company Accounting Oversight Board (United States) (PCAOB) and are required to be independent with respect to the Funds in accordance with the U.S. federal securities laws and the applicable rules and regulations of the Securities and Exchange Commission and the PCAOB.
We conducted our audits in accordance with the standards of the PCAOB. Those standards require that we plan and perform the audit to obtain reasonable assurance about whether the financial statements and financial highlights are free of material misstatement, whether due to error or fraud. The Funds are not required to have, nor were we engaged to perform, an audit of their internal control over financial reporting. As part of our audits we are required to obtain an understanding of internal control over financial reporting but not for the purpose of expressing an opinion on the effectiveness of the Funds’ internal control over financial reporting. Accordingly, we express no such opinion.
Our audits included performing procedures to assess the risks of material misstatement of the financial statements and financial highlights, whether due to error or fraud, and performing procedures that respond to those risks. Such procedures included examining, on a test basis, evidence regarding the amounts and disclosures in the financial statements and financial highlights. Our audits also included evaluating the accounting principles used and significant estimates made by management, as well as evaluating the overall presentation of the financial statements and financial highlights. Our procedures included confirmation of securities owned as of November 30, 2018, by correspondence with the custodian and brokers; when replies were not received from brokers, we performed other auditing procedures. We believe that our audits provide a reasonable basis for our opinion.
DELOITTE & TOUCHE LLP
Denver, Colorado
January 24, 2019
We have served as the auditor of one or more investment companies advised by ALPS Advisors, Inc. since 2007.
Sprott Gold Miners ETF
| Schedule of Investments | November 30, 2018 |
| Security Description | | Shares | | | Value | |
| COMMON STOCKS (99.88%) | | | | | | | | |
| Gold Mining (84.41%) | | | | | | | | |
| Agnico Eagle Mines, Ltd. | | | 414,248 | | | $ | 14,548,390 | |
| Alamos Gold, Inc., Class A | | | 1,267,166 | | | | 4,080,275 | |
| AngloGold Ashanti, Ltd., Sponsored ADR | | | 421,859 | | | | 4,184,841 | |
| B2Gold Corp.(a) | | | 2,203,189 | | | | 5,397,813 | |
| Barrick Gold Corp. | | | 434,231 | | | | 5,536,445 | |
| Cia de Minas Buenaventura SAA, ADR | | | 394,900 | | | | 5,583,886 | |
| Gold Fields, Ltd., Sponsored ADR | | | 980,111 | | | | 2,871,725 | |
| Goldcorp, Inc. | | | 1,567,544 | | | | 14,546,808 | |
| Harmony Gold Mining Co., Ltd., Sponsored ADR(a) | | | 945,697 | | | | 1,418,546 | |
| IAMGOLD Corp.(a) | | | 1,501,727 | | | | 4,580,267 | |
| Kinross Gold Corp.(a) | | | 1,394,042 | | | | 3,777,854 | |
| Kirkland Lake Gold, Ltd. | | | 293,241 | | | | 6,093,548 | |
| McEwen Mining, Inc.(b) | | | 1,471,754 | | | | 2,590,287 | |
| New Gold, Inc.(a) | | | 2,405,872 | | | | 1,830,869 | |
| Royal Gold, Inc. | | | 208,709 | | | | 15,267,063 | |
| Sandstorm Gold, Ltd.(a)(b) | | | 714,783 | | | | 2,994,941 | |
| Seabridge Gold, Inc.(a)(b) | | | 125,764 | | | | 1,473,954 | |
| Sibanye Gold, Ltd., Sponsored ADR(a)(b) | | | 648,651 | | | | 1,582,709 | |
| SSR Mining, Inc.(a) | | | 169,855 | | | | 1,807,257 | |
| Yamana Gold, Inc. | | | 1,991,150 | | | | 4,141,592 | |
| Total Gold Mining | | | | | | | 104,309,070 | |
| | | | | | | | | |
| Silver Mining (15.47%) | | | | | | | | |
| Coeur Mining, Inc.(a) | | | 217,749 | | | | 860,108 | |
| First Majestic Silver Corp.(a)(b) | | | 337,647 | | | | 1,620,706 | |
| Fortuna Silver Mines, Inc.(a) | | | 496,242 | | | | 1,592,937 | |
| Pan American Silver Corp. | | | 297,681 | | | | 3,840,085 | |
| Wheaton Precious Metals Corp. | | | 716,052 | | | | 11,199,053 | |
| Total Silver Mining | | | | | | | 19,112,889 | |
| | | | | | | | | |
| TOTAL COMMON STOCKS | | | | | | | | |
| (Cost $143,816,432) | | | | | | | 123,421,959 | |
| | | | 7 Day Yield | | | | Shares | | | | Value | |
| SHORT TERM INVESTMENTS (4.47%) | | | | | | | |
| Money Market Fund (0.05%) | | | | | | | |
| State Street Institutional Treasury Plus Money Market Fund | | | | | | | | | |
| (Cost $62,741) | | | 2.146 | % | | | 62,741 | | | | 62,741 | |
| | | Shares | | | Value | |
| Investments Purchased with Collateral from Securities Loaned (4.42%) | | | | | | | | |
| State Street Navigator Securities Lending Government Money Market Portfolio, 2.24% | | | | | | | | |
| (Cost $5,466,850) | | | 5,466,850 | | | $ | 5,466,850 | |
| TOTAL SHORT TERM INVESTMENTS | | | | | | | | |
| (Cost $5,529,591) | | | | | | | 5,529,591 | |
| | | | | | | | | |
| TOTAL INVESTMENTS (104.35%) | | | | | | | | |
| (Cost $149,346,023) | | | | | | $ | 128,951,550 | |
| LIABILITIES IN EXCESS OF OTHER ASSETS (-4.35%) | | | | | | | (5,375,974 | ) |
| NET ASSETS - 100.00% | | | | | | $ | 123,575,576 | |
| (a) | Non-income producing security. |
| (b) | Security, or a portion of the security position is currently on loan. The total market value of securities on loan is $5,696,443. |
See Notes to Financial Statements.
Sprott Junior Gold Miners ETF
| Schedule of Investments | November 30, 2018 |
| Security Description | | Shares | | | Value | |
| COMMON STOCKS (99.96%) | | | | | | | | |
| Gold Mining (87.49%) | | | | | | | | |
| Alacer Gold Corp.(a) | | | 381,579 | | | $ | 594,490 | |
| Alamos Gold, Inc., Class A | | | 526,088 | | | | 1,694,003 | |
| Centerra Gold, Inc.(a) | | | 392,318 | | | | 1,594,489 | |
| China Gold International Resources Corp., Ltd.(a) | | | 522,467 | | | | 707,817 | |
| Continental Gold, Inc.(a)(b) | | | 130,106 | | | | 205,639 | |
| Detour Gold Corp.(a) | | | 311,074 | | | | 2,310,842 | |
| Eldorado Gold Corp.(a) | | | 1,088,262 | | | | 617,589 | |
| Endeavour Mining Corp.(a) | | | 192,704 | | | | 2,401,820 | |
| Gold Standard Ventures Corp.(a) | | | 188,001 | | | | 227,481 | |
| Golden Star Resources, Ltd.(a) | | | 163,819 | | | | 483,266 | |
| Harmony Gold Mining Co., Ltd., Sponsored ADR | | | 952,410 | | | | 1,428,615 | |
| IAMGOLD Corp.(a) | | | 316,984 | | | | 966,801 | |
| New Gold, Inc.(a) | | | 744,472 | | | | 566,543 | |
| Novagold Resources, Inc.(a)(b) | | | 215,887 | | | | 792,305 | |
| OceanaGold Corp. | | | 1,037,525 | | | | 3,022,031 | |
| Osisko Gold Royalties, Ltd. | | | 271,368 | | | | 2,036,307 | |
| Premier Gold Mines, Ltd.(a) | | | 135,476 | | | | 160,085 | |
| Pretium Resources, Inc.(a)(b) | | | 306,579 | | | | 2,179,777 | |
| Sandstorm Gold, Ltd.(a)(b) | | | 249,059 | | | | 1,043,557 | |
| Seabridge Gold, Inc.(a)(b) | | | 40,872 | | | | 479,020 | |
| SEMAFO, Inc.(a) | | | 219,717 | | | | 396,885 | |
| Sibanye Gold, Ltd., Sponsored ADR(a)(b) | | | 992,283 | | | | 2,421,171 | |
| SSR Mining, Inc.(a) | | | 194,202 | | | | 2,066,309 | |
| Tahoe Resources, Inc.(a) | | | 209,935 | | | | 736,872 | |
| Teranga Gold Corp.(a) | | | 192,538 | | | | 466,618 | |
| TMAC Resources, Inc.(a)(b)(c) | | | 144,549 | | | | 684,314 | |
| Torex Gold Resources, Inc.(a) | | | 150,792 | | | | 1,183,728 | |
| Wesdome Gold Mines, Ltd.(a) | | | 255,427 | | | | 707,463 | |
| Total Gold Mining | | | | | | | 32,175,837 | |
| | | | | | | | | |
| Silver Mining (12.47%) | | | | | | | | |
| Coeur Mining, Inc. | | | 287,475 | | | | 1,135,526 | |
| Endeavour Silver Corp.(a)(b) | | | 185,796 | | | | 343,723 | |
| First Majestic Silver Corp.(a)(b) | | | 273,948 | | | | 1,314,951 | |
| Fortuna Silver Mines, Inc.(a) | | | 111,461 | | | | 357,790 | |
| Hecla Mining Co. | | | 335,422 | | | | 798,304 | |
| MAG Silver Corp.(a) | | | 60,475 | | | | 408,735 | |
| Silvercorp Metals, Inc. | | | 116,830 | | | | 227,742 | |
| Total Silver Mining | | | | | | | 4,586,771 | |
| | | | | | | | | |
| TOTAL COMMON STOCKS | | | | | | | | |
| (Cost $49,912,669) | | | | | | | 36,762,608 | |
| | | 7 Day Yield | | | Shares | | | Value | |
| SHORT TERM INVESTMENTS (15.49%) | | | | | | | | |
| Money Market Fund (0.05%) | | | | | | | | |
| State Street Institutional Treasury Plus Money Market Fund | | | | | | | | | |
| (Cost $17,779) | | | 2.146 | % | | | 17,779 | | | | 17,779 | |
| | | Shares | | | Value | |
| Investments Purchased with Collateral from Securities Loaned (15.44%) | | | | | | | | |
| State Street Navigator Securities Lending Government Money Market Portfolio, 2.24% | | | | | | | | |
| (Cost $5,678,103) | | | 5,678,103 | | | $ | 5,678,103 | |
| TOTAL SHORT TERM INVESTMENTS | | | | | | | | |
| (Cost $5,695,882) | | | | | | | 5,695,882 | |
| | | | | | | | | |
| TOTAL INVESTMENTS (115.45%) | | | | | | | | |
| (Cost $55,608,551) | | | | | | $ | 42,458,490 | |
| LIABILITIES IN EXCESS OF OTHER ASSETS (-15.45%) | | | | | | | (5,682,322 | ) |
| NET ASSETS - 100.00% | | | | | | $ | 36,776,168 | |
| (a) | Non-income producing security. |
| (b) | Security, or a portion of the security position is currently on loan. The total market value of securities on loan is $5,964,337. |
| (c) | Securities were purchased pursuant to Regulation S under the Securities Act of 1933, which exempts securities offered and sold outside of the United States from registration. Such securities cannot be sold in the United States without either an effective registration statement filed pursuant to the Securities Act of 1933, or pursuant to an exemption from registration. As of November 30, 2018, the market value of those securities was $684,314 representing 1.86% of net assets. |
See Notes to Financial Statements.
Sprott ETFs
| Statements of Assets and Liabilities | November 30, 2018 |
| | | | Sprott Gold
Miners ETF | | | | Sprott Junior
Gold Miners ETF | |
| ASSETS: | | | | | | | | |
| Investments, at value | | $ | 128,951,550 | | | $ | 42,458,490 | |
| Foreign tax reclaims | | | 10,782 | | | | 4,416 | |
| Dividends receivable | | | 140,228 | | | | 9,766 | |
| Total Assets | | | 129,102,560 | | | | 42,472,672 | |
| | | | | | | | | |
| LIABILITIES: | | | | | | | | |
| Payable to adviser | | | 60,134 | | | | 18,401 | |
| Payable for collateral upon return of securities loaned | | | 5,466,850 | | | | 5,678,103 | |
| Total Liabilities | | | 5,526,984 | | | | 5,696,504 | |
| NET ASSETS | | $ | 123,575,576 | | | $ | 36,776,168 | |
| | | | | | | | | |
| NET ASSETS CONSIST OF: | | | | | | | | |
| Paid-in capital | | $ | 239,678,868 | | | $ | 78,166,841 | |
| Total distributable earnings | | | (116,103,292 | ) | | | (41,390,673 | ) |
| NET ASSETS | | $ | 123,575,576 | | | $ | 36,776,168 | |
| | | | | | | | | |
| INVESTMENTS, AT COST | | $ | 149,346,023 | | | $ | 55,608,551 | |
| | | | | | | | | |
| PRICING OF SHARES | | | | | | | | |
| Net Assets | | $ | 123,575,576 | | | $ | 36,776,168 | |
| Shares of beneficial interest outstanding (Unlimited number of shares authorized, par value $0.01 per share) | | | 8,100,000 | | | | 1,700,000 | |
| Net Asset Value, offering and redemption price per share | | $ | 15.26 | | | $ | 21.63 | |
See Notes to Financial Statements.
Sprott ETFs
| Statements of Operations | For the Year Ended November 30, 2018 |
| | | Sprott Gold
Miners ETF | | | Sprott Junior
Gold Miners ETF | |
| INVESTMENT INCOME: | | | | | | |
| Dividends(a) | | $ | 1,429,606 | | | $ | 205,198 | |
| Securities lending income | | | 144,462 | | | | 213,906 | |
| Total Investment Income | | | 1,574,068 | | | | 419,104 | |
| | | | | | | | | |
| EXPENSES: | | | | | | | | |
| Investment adviser fees | | | 933,224 | | | | 685,301 | |
| Total Expense | | | 933,224 | | | | 685,301 | |
| NET INVESTMENT INCOME/(LOSS) | | | 640,844 | | | | (266,197 | ) |
| | | | | | | | | |
| REALIZED AND UNREALIZED GAIN/(LOSS) | | | | | | | | |
| Net realized loss on investments | | | (18,177,008 | ) | | | (31,413,751 | ) |
| Net realized gain on foreign currency transactions | | | 16 | | | | 703 | |
| Net realized gain/(loss) | | | (18,176,992 | ) | | | (31,413,048 | ) |
| Net change in unrealized depreciation on investments | | | (21,732,492 | ) | | | (5,838,552 | ) |
| Net change in unrealized appreciation on translation of assets and liabilities denominated in foreign currencies | | | – | | | | 50 | |
| Net change in unrealized appreciation/(depreciation) | | | (21,732,492 | ) | | | (5,838,502 | ) |
| NET REALIZED AND UNREALIZED LOSS ON INVESTMENTS | | | (39,909,484 | ) | | | (37,251,550 | ) |
| NET DECREASE IN NET ASSETS RESULTING FROM OPERATIONS | | $ | (39,268,640 | ) | | $ | (37,517,747 | ) |
| (a) | Net of foreign tax withholding in the amounts of $101,702 and $30,750 respectively. |
See Notes to Financial Statements.
Sprott Gold Miners ETF
Statements of Changes in Net Assets
| | | For the
Year Ended
November 30,
2018 | | | For the
Year Ended
November 30,
2017 | |
| OPERATIONS: | | | | | | |
| Net investment income | | $ | 640,844 | | | $ | 387,681 | |
| Net realized loss | | | (18,176,992 | ) | | | (18,766,501 | ) |
| Net change in unrealized appreciation/(depreciation) | | | (21,732,492 | ) | | | 24,893,190 | |
| Net increase/(decrease) in net assets resulting from operations | | | (39,268,640 | ) | | | 6,514,370 | |
| | | | | | | | | |
| DISTRIBUTIONS TO SHAREHOLDERS: | | | | | | | | |
| From distributable earnings | | | (1,074,960 | ) | | | (35,497 | )(a) |
| Total distributions | | | (1,074,960 | ) | | | (35,497 | ) |
| | | | | | | | | |
| CAPITAL SHARE TRANSACTIONS: | | | | | | | | |
| Proceeds from sale of shares | | | 26,707,445 | | | | 30,281,812 | |
| Cost of shares redeemed | | | (27,333,679 | ) | | | (56,080,225 | ) |
| Net decrease from capital share transactions | | | (626,234 | ) | | | (25,798,413 | ) |
| Net decrease in net assets | | | (40,969,834 | ) | | | (19,319,540 | ) |
| | | | | | | | | |
| NET ASSETS: | | | | | | | | |
| Beginning of year | | | 164,545,410 | | | | 183,864,950 | |
| End of year | | $ | 123,575,576 | | | $ | 164,545,410 | (b) |
| | | | | | | | | |
| OTHER INFORMATION: | | | | | | | | |
| CAPITAL SHARE TRANSACTIONS: | | | | | | | | |
| Beginning shares | | | 8,300,000 | | | | 9,600,000 | |
| Shares sold | | | 1,350,000 | | | | 1,500,000 | |
| Shares redeemed | | | (1,550,000 | ) | | | (2,800,000 | ) |
| Shares outstanding, end of period | | | 8,100,000 | | | | 8,300,000 | |
| (a) | For the year ended November 30, 2017, total distributions from distributable earnings consisted of distributions from net investment income of $35,497. |
| (b) | For the year ended November 30, 2017, Net Assets included accumulated net investment income of $1,061,993. |
See Notes to Financial Statements.
Sprott Junior Gold Miners ETF
Statements of Changes in Net Assets
| | | For the
Year Ended
November 30,
2018 | | | For the
Year Ended
November 30,
2017 | |
| OPERATIONS: | | | | | | |
| Net investment loss | | $ | (266,197 | ) | | $ | (294,722 | ) |
| Net realized gain/(loss) | | | (31,413,048 | ) | | | 5,266,703 | |
| Net change in unrealized depreciation | | | (5,838,502 | ) | | | (8,013,072 | ) |
| Net decrease in net assets resulting from operations | | | (37,517,747 | ) | | | (3,041,091 | ) |
| | | | | | | | | |
| DISTRIBUTIONS TO SHAREHOLDERS: | | | | | | | | |
| From distributable earnings | | | (223,108 | ) | | | (815,000 | )(a) |
| Total distributions | | | (223,108 | ) | | | (815,000 | ) |
| | | | | | | | | |
| CAPITAL SHARE TRANSACTIONS: | | | | | | | | |
| Proceeds from sale of shares | | | 8,988,193 | | | | 151,798,691 | |
| Cost of shares redeemed | | | (84,021,633 | ) | | | (46,248,833 | ) |
| Net increase/(decrease) from capital share transactions | | | (75,033,440 | ) | | | 105,549,858 | |
| Net increase/(decrease) in net assets | | | (112,774,295 | ) | | | 101,693,767 | |
| | | | | | | | | |
| NET ASSETS: | | | | | | | | |
| Beginning of year | | | 149,550,463 | | | | 47,856,696 | |
| End of year | | $ | 36,776,168 | | | $ | 149,550,463 | (b) |
| | | | | | | | | |
| OTHER INFORMATION: | | | | | | | | |
| CAPITAL SHARE TRANSACTIONS: | | | | | | | | |
| Beginning shares | | | 4,750,000 | | | | 1,450,000 | |
| Shares sold | | | 300,000 | | | | 4,700,000 | |
| Shares redeemed | | | (3,350,000 | ) | | | (1,400,000 | ) |
| Shares outstanding, end of period | | | 1,700,000 | | | | 4,750,000 | |
| (a) | For the year ended November 30, 2017, total distributions from distributable earnings consisted of distributions from net investment income of $815,000. |
| (b) | For the year ended November 30, 2017, Net Assets included accumulated net investment loss of $(370,715). |
See Notes to Financial Statements.
Sprott Gold Miners ETF
| Financial Highlights | For a Share Outstanding Throughout the Periods Presented |
| | | For the Year Ended November 30, 2018 | | | For the Year Ended November 30, 2017 | | | For the Year Ended November 30, 2016 | | | For the Year Ended November 30, 2015 | | | For the Period July 15, 2014 (Commencement of Operations) to November 30, 2014 | |
| NET ASSET VALUE, BEGINNING OF PERIOD | | $ | 19.82 | | | $ | 19.15 | | | $ | 12.97 | | | $ | 17.44 | | | $ | 25.00 | |
| | | | | | | | | | | | | | | | | | | | | |
| INCOME/(LOSS) FROM INVESTMENT OPERATIONS: | | | | | | | | | | | | | | | | | | | | |
| Net investment income(a) | | | 0.07 | | | | 0.04 | | | | (0.00 | )(b) | | | 0.10 | | | | 0.02 | |
| Net realized and unrealized gain/(loss) | | | (4.51 | ) | | | 0.63 | | | | 6.37 | | | | (4.52 | ) | | | (7.58 | ) |
| Total from investment operations | | | (4.44 | ) | | | 0.67 | | | | 6.37 | | | | (4.42 | ) | | | (7.56 | ) |
| | | | | | | | | | | | | | | | | | | | | |
| DISTRIBUTIONS: | | | | | | | | | | | | | | | | | | | | |
| From net investment income | | | (0.12 | ) | | | (0.00 | )(b) | | | (0.19 | ) | | | (0.05 | ) | | | – | |
| Total distributions | | | (0.12 | ) | | | (0.00 | )(b) | | | (0.19 | ) | | | (0.05 | ) | | | – | |
| | | | | | | | | | | | | | | | | | | | | |
| Net increase/(decrease) in net asset value | | | (4.56 | ) | | | 0.67 | | | | 6.18 | | | | (4.47 | ) | | | (7.56 | ) |
| NET ASSET VALUE, END OF PERIOD | | $ | 15.26 | | | $ | 19.82 | | | $ | 19.15 | | | $ | 12.97 | | | $ | 17.44 | |
| TOTAL RETURN(c) | | | (22.56 | )% | | | 3.52 | % | | | 49.82 | % | | | (25.44 | )% | | | (30.24 | )% |
| | | | | | | | | | | | | | | | | | | | | |
| RATIOS/SUPPLEMENTAL DATA: | | | | | | | | | | | | | | | | | | | | |
| Net assets, end of period (000s) | | $ | 123,576 | | | $ | 164,545 | | | $ | 183,865 | | | $ | 112,158 | | | $ | 88,956 | |
| | | | | | | | | | | | | | | | | | | | | |
| Ratio of expenses to average net assets | | | 0.57 | % | | | 0.57 | % | | | 0.57 | % | | | 0.57 | % | | | 0.57 | %(d) |
| Ratio of net investment income/(loss) to average net assets | | | 0.39 | % | | | 0.21 | % | | | (0.01 | )% | | | 0.61 | % | | | 0.31 | %(d) |
| Portfolio turnover rate(e) | | | 82 | % | | | 101 | % | | | 74 | % | | | 78 | % | | | 36 | % |
| (a) | Based on average shares outstanding during the period. |
| (b) | Less than $0.005 per share. |
| (c) | Total return is calculated assuming an initial investment made at the net asset value at the beginning of the period and redemption at the net asset value on the last day of the period and assuming all distributions are reinvested at reinvestment prices. Total return calculated for a period of less than one year is not annualized. |
| (e) | Portfolio turnover for periods less than one year are not annualized and does not include securities received or delivered from processing creations or redemptions in-kind. |
See Notes to Financial Statements.
Sprott Junior Gold Miners ETF
| Financial Highlights | For a Share Outstanding Throughout the Periods Presented |
| | | For the Year Ended November 30, 2018 | | | For the Year Ended November 30, 2017 | | | For the Year Ended November 30, 2016 | | | For the Period March 31, 2015 (Commencement of Operations) to November 30, 2015 | |
| NET ASSET VALUE, BEGINNING OF PERIOD | | $ | 31.48 | | | $ | 33.00 | | | $ | 19.65 | | | $ | 24.18 | |
| | | | | | | | | | | | | | | | | |
| INCOME/(LOSS) FROM INVESTMENT OPERATIONS: | | | | | | | | | | | | | | | | |
| Net investment income/(loss)(a) | | | (0.06 | ) | | | (0.09 | ) | | | (0.05 | ) | | | 0.04 | |
| Net realized and unrealized gain/(loss) | | | (9.74 | ) | | | (0.87 | ) | | | 13.56 | | | | (4.57 | ) |
| Total from investment operations | | | (9.80 | ) | | | (0.96 | ) | | | 13.51 | | | | (4.53 | ) |
| | | | | | | | | | | | | | | | | |
| DISTRIBUTIONS: | | | | | | | | | | | | | | | | |
| From net investment income | | | (0.05 | ) | | | (0.56 | ) | | | (0.16 | ) | | | – | |
| Total distributions | | | (0.05 | ) | | | (0.56 | ) | | | (0.16 | ) | | | – | |
| | | | | | | | | | | | | | | | | |
| Net increase/(decrease) in net asset value | | | (9.85 | ) | | | (1.52 | ) | | | 13.35 | | | | (4.53 | ) |
| NET ASSET VALUE, END OF PERIOD | | $ | 21.63 | | | $ | 31.48 | | | $ | 33.00 | | | $ | 19.65 | |
| TOTAL RETURN(b) | | | (31.19 | )% | | | (2.99 | )% | | | 69.35 | % | | | (18.73 | )% |
| | | | | | | | | | | | | | | | | |
| RATIOS/SUPPLEMENTAL DATA: | | | | | | | | | | | | | | | | |
| Net assets, end of period (000s) | | $ | 36,776 | | | $ | 149,550 | | | $ | 47,857 | | | $ | 23,579 | |
| | | | | | | | | | | | | | | | | |
| Ratio of expenses to average net assets | | | 0.57 | % | | | 0.57 | % | | | 0.57 | % | | | 0.57 | %(c) |
| Ratio of net investment income/(loss) to average net assets | | | (0.22 | )% | | | (0.26 | )% | | | (0.14 | )% | | | 0.29 | %(c) |
| Portfolio turnover rate(d) | | | 37 | % | | | 74 | % | | | 61 | % | | | 71 | % |
| (a) | Based on average shares outstanding during the period. |
| (b) | Total return is calculated assuming an initial investment made at the net asset value at the beginning of the period and redemption at the net asset value on the last day of the period and assuming all distributions are reinvested at reinvestment prices. Total return calculated for a period of less than one year is not annualized. |
| (d) | Portfolio turnover for periods less than one year are not annualized and does not include securities received or delivered from processing creations or redemptions in-kind. |
See Notes to Financial Statements.
| Notes to Financial Statements | November 30, 2018 |
1. ORGANIZATION
ALPS ETF Trust (the “Trust”), a Delaware statutory trust, is an open-end management investment company under the Investment Company Act of 1940, as amended (the “1940 Act”). As of November 30, 2018, the Trust consisted of twenty separate portfolios. Each portfolio represents a separate series of the Trust. This report pertains to the Sprott Gold Miners ETF and the Sprott Junior Gold Miners ETF (each a “Fund” and collectively, the “Funds”).
The investment objective of the Sprott Gold Miners ETF is to seek investment results that correspond (before fees and expenses) generally to the performance of its underlying index, the Sprott Zacks Gold Miners Index (the “Underlying Index”). The investment advisor uses a “passive” or indexing approach to try to achieve the Fund’s investment objective. The Sprott Gold Miners ETF is considered non-diversified and may invest a greater portion of assets in securities of individual issuers than a diversified fund. As a result, changes in the market value of a single investment could cause greater fluctuations in share price than would occur in a diversified fund.
The investment objective of the Sprott Junior Gold Miners ETF is to seek investment results that correspond (before fees and expenses) generally to the performance of its underlying index, the Sprott Zacks Junior Gold Miners Index (the “Underlying Index”). The investment advisor uses a “passive” or indexing approach to try to achieve the Fund’s investment objective. The Sprott Junior Gold Miners ETF is considered non-diversified and may invest a greater portion of assets in securities of individual issuers than a diversified fund. As a result, changes in the market value of a single investment could cause greater fluctuations in share price than would occur in a diversified fund.
The Funds’ Shares (“Shares”) are listed on the New York Stock Exchange (“NYSE”) Arca. Each Fund issues and redeems Shares, at net asset value (“NAV”) in blocks of 50,000 Shares, each of which is called a “Creation Unit”. Creation Units are issued and redeemed principally in-kind for securities included in the specified Underlying Index. Except when aggregated in Creation Units, Shares are not redeemable securities of the Fund.
Pursuant to the Trust’s organizational documents, its Officers and Trustees are indemnified against certain liability arising out of the performance of their duties to the Trust. Additionally, in the normal course of business, the Trust enters into contracts with service providers that contain general indemnification clauses. The Trust’s maximum exposure under these arrangements is unknown, as this would involve future claims that may be made against the Trust that have not yet occurred.
2. SIGNIFICANT ACCOUNTING POLICIES
The following is a summary of significant accounting policies consistently followed by the Funds in the preparation of the financial statements. The accompanying financial statements were prepared in accordance with accounting principles generally accepted in the United States of America (“U.S. GAAP”). The preparation of financial statements in conformity with U.S. GAAP requires management to make certain estimates and assumptions that affect the reported amounts of assets and liabilities and disclosures of contingent assets and liabilities at the date of the financial statements and the reported amounts of revenue and expenses during the period. Actual results could differ from those estimates. Each Fund is considered an investment company under U.S. GAAP and follows the accounting and reporting guidance applicable to investment companies in the Financial Accounting Standards BoardAccounting Standards CodificationTopic 946.
A. Portfolio Valuation
Each Fund’s NAV is determined daily, as of the close of regular trading on the NYSE, normally 4:00 p.m. Eastern time, on each day the NYSE is open for trading. The NAV is computed by dividing the value of all assets of the Fund (including accrued interest and dividends), less all liabilities (including accrued expenses and dividends declared but unpaid), by the total number of shares outstanding.
Portfolio securities listed on any exchange other than the NASDAQ Stock Market LLC (“NASDAQ”) are valued at the last sale price on the business day as of which such value is being determined. If there has been no sale on such day, the securities are valued at the mean of the most recent bid and ask prices on such day. Securities traded on the NASDAQ are valued at the NASDAQ Official Closing Price as determined by NASDAQ. Portfolio securities traded on more than one securities exchange are valued at the last sale price on the business day as of which such value is being determined at the close of the exchange representing the principal market for such securities. Portfolio securities traded in the over-the-counter market, but excluding securities traded on the NASDAQ, are valued at the last quoted sale price in such market.
The Funds’ investments are valued at market value or, in the absence of market value with respect to any portfolio securities, at fair value according to procedures adopted by the Trust’s Board of Trustees (the “Board”). When market quotations are not readily available or when events occur that make established valuation methods unreliable, securities of the Funds may be valued in good faith by or under the direction of the Board. These securities generally include, but are not limited to, restricted securities (securities which may not be publicly sold without registration under the Securities Act of 1933) for which a pricing service is unable to provide a market price; securities whose trading has been formally suspended; a security whose market price is not available from a pre-established primary pricing source or the pricing source is not willing to provide a price; a security with respect to which an event has occurred that is most likely to materially affect the value of the security after the market has closed but before the calculation of the Fund’s NAV or make it difficult or impossible to obtain a reliable market quotation; or a security whose price, as provided by the pricing service, does not reflect the security’s “fair value” due to the security being de-listed from a national exchange or the security’s primary trading market is temporarily closed at a time when, under normal conditions, it would be open. As a general principle, the current “fair value” of a security would be the amount which the owner might reasonably expect to receive from the sale on the applicable exchange or principal market. A variety of factors may be considered in determining the fair value of such securities.
| Notes to Financial Statements | November 30, 2018 |
B. Fair Value Measurements
Each Fund discloses the classification of its fair value measurements following a three-tier hierarchy based on the inputs used to measure fair value. Inputs refer broadly to the assumptions that market participants would use in pricing the asset or liability, including assumptions about risk. Inputs may be observable or unobservable. Observable inputs reflect the assumptions market participants would use in pricing the asset or liability that are developed based on market data obtained from sources independent of the reporting entity. Unobservable inputs reflect the reporting entity’s own assumptions about the assumptions market participants would use in pricing the asset or liability that are developed based on the best information available.
Valuation techniques used to value the Funds’ investments by major category are as follows:
Equity securities, including restricted securities, for which market quotations are readily available, are valued at the last reported sale price or official closing price as reported by a third party pricing vendor on the primary market or exchange on which they are traded and are categorized as Level 1 in the hierarchy. In the event there were no sales during the day or closing prices are not available, securities are valued at the mean of the most recent quoted bid and ask prices on such day and are generally categorized as Level 2 in the hierarchy. Investments in open-end mutual funds are valued at their closing NAV each business day and are categorized as Level 1 in the hierarchy.
Changes in valuation techniques may result in transfers in or out of an assigned level within the disclosure hierarchy.
Various inputs are used in determining the value of each Fund’s investments as of the end of the reporting period. When inputs used fall into different levels of the fair value hierarchy, the level in the hierarchy within which the fair value measurement falls is determined based on the lowest level input that is significant to the fair value measurement in its entirety. The designated input levels are not necessarily an indication of the risk or liquidity associated with these investments.
These inputs are categorized in the following hierarchy under applicable financial accounting standards:
| Level 1 – | Unadjusted quoted prices in active markets for identical investments, unrestricted assets or liabilities that a Fund has the ability to access at the measurement date; |
| Level 2 – | Quoted prices which are not active, quoted prices for similar assets or liabilities in active markets or inputs other than quoted prices that are observable (either directly or indirectly) for substantially the full term of the asset or liability; and |
| Level 3 – | Significant unobservable prices or inputs (including the Fund’s own assumptions in determining the fair value of investments) where there is little or no market activity for the asset or liability at the measurement date. |
The following is a summary of the inputs used to value the Funds’ investments at November 30, 2018:
Sprott Gold Miners ETF
| Investments in Securities at Value* | | Level 1 - Unadjusted Quoted Prices | | | Level 2 - Other Significant Observable Inputs | | | Level 3 - Significant Unobservable Inputs | | | Total | |
| Common Stocks | | $ | 123,421,959 | | | $ | – | | | $ | – | | | $ | 123,421,959 | |
| Short-Term Investments | | | | | | | | | | | | | | | | |
| Money Market Fund | | | 62,741 | | | | – | | | | – | | | | 62,741 | |
| Investments Purchased with Collateral from Securities Loaned | | | 5,466,850 | | | | – | | | | – | | | | 5,466,850 | |
| TOTAL | | $ | 128,951,550 | | | $ | – | | | $ | – | | | $ | 128,951,550 | |
| Notes to Financial Statements | November 30, 2018 |
| Sprott Junior Gold Miners ETF | | | | | | | | | | | | |
| Investments in Securities at Value* | | Level 1 - Unadjusted Quoted Prices | | | Level 2 - Other Significant Observable Inputs | | | Level 3 - Significant Unobservable Inputs | | | Total | |
| Common Stocks | | $ | 36,762,608 | | | $ | – | | | $ | – | | | $ | 36,762,608 | |
| Short-Term Investments | | | | | | | | | | | | | | | | |
| Money Market Fund | | | 17,779 | | | | – | | | | – | | | | 17,779 | |
| Investments Purchased with Collateral from Securities Loaned | | | 5,678,103 | | | | – | | | | – | | | | 5,678,103 | |
| TOTAL | | $ | 42,458,490 | | | $ | – | | | $ | – | | | $ | 42,458,490 | |
| * | For a detailed sector breakdown, see the accompanying Schedule of Investments. |
The Funds did not have any securities that used significant unobservable inputs (Level 3) in determining fair value and there were no transfers into or out of Level 3.
C. Gold and Silver Mining Industry Risk
The Funds are concentrated in the gold and silver mining industry. As a result, these Funds will be sensitive to changes in, and their performance will depend to a greater extent on, the overall condition of the gold and silver mining industry. Competitive pressures may have a significant effect on the financial condition of such companies in the gold and silver mining industry. Also, gold and silver mining companies are highly dependent on the price of gold and silver bullion. These prices may fluctuate substantially over short periods of time so a Fund’s Share price may be more volatile than other types of investments. In times of significant inflation or great economic uncertainty, gold, silver and other precious metals may outperform traditional investments such as bonds and stocks. However, in times of stable economic growth, traditional equity and debt investments could offer greater appreciation potential and the value of gold, silver and other precious metals may be adversely affected, which could in turn affect a Fund’s returns. The production and sale of precious metals by governments or central banks or other large holders can be affected by various economic, financial, social and political factors, which may be unpredictable and may have a significant impact on the supply and prices of precious metals. Economic and political conditions in those countries that are the largest producers of gold may have a direct effect on the production and marketing of gold and on sales of central bank gold holdings. Some gold and precious metals mining operation companies may hedge their exposure to falls in gold and precious metals prices by selling forward future production, which may result in lower returns during periods when the price of gold and precious metals increases. The gold and precious metals industry can be significantly affected by events relating to international political developments, the success of exploration projects, commodity prices and tax and government regulations. If a natural disaster or other event with a significant economic impact occurs in a region where the companies in which each Fund invests operate, such disaster or event could negatively affect the profitability of such companies and, in turn, the Funds’ investment in them.
D. Foreign Investment Risk
The Funds’ investments in non-U.S. issuers may involve unique risks compared to investing in securities of U.S. issuers, including, among others, greater market volatility than U.S. securities and less complete financial information than for U.S. issuers. In addition, adverse political, economic or social developments could undermine the value of a Fund’s investments or prevent a Fund from realizing the full value of its investments. Financial reporting standards for companies based in foreign markets differ from those in the United States. Finally, the value of the currency of the country in which a Fund has invested could decline relative to the value of the U.S. dollar, which may affect the value of the investment to U.S. investors. The Funds will not enter into transactions to hedge against declines in the value of a Fund’s assets that are denominated in a foreign currency.
Countries with emerging markets may have relatively unstable governments and may present the risks of nationalization of businesses, restrictions on foreign ownership and prohibitions on the repatriation of assets. The economies of emerging markets countries also may be based on only a few industries, making them more vulnerable to changes in local or global trade conditions and more sensitive to debt burdens or inflation rates.
E. Foreign Currency Translation
The books and records of the Funds are maintained in U.S. dollars. Investment valuations and other assets and liabilities initially expressed in foreign currencies are converted each business day into U.S. dollars based upon current exchange rates. The portion of realized and unrealized gains or losses on investments due to fluctuations in foreign currency exchange rates is not separately disclosed and is included in realized and unrealized gains or losses on investments, when applicable.
| Notes to Financial Statements | November 30, 2018 |
F. Concentration Risk
Each Fund seeks to track its respective Underlying Index, which itself may have concentration in certain regions, economies, countries, markets, industries or sectors. Based on the current composition of their respective Underlying Indexes, the Funds will be concentrated in the gold and silver mining industry. Underperformance or increased risk in such concentrated areas may result in underperformance or increased risk in each Fund.
G. Securities Transactions and Investment Income
Securities transactions are recorded as of the trade date. Realized gains and losses from securities transactions are recorded on the highest cost basis. Dividend income and capital gains distributions, if any, are recorded on the ex-dividend date. Interest income, if any, is recorded on the accrual basis.
H. Dividends and Distributions to Shareholders
Dividends from net investment income for each Fund, if any, are declared and paid annually or as the Board may determine from time to time. Distributions of net realized capital gains earned by the Funds, if any, are distributed at least annually.
I. Federal Tax and Tax Basis Information
The timing and character of income and capital gain distributions are determined in accordance with income tax regulations, which may differ from U.S. GAAP. Reclassifications are made to the Funds’ capital accounts for permanent tax differences to reflect income and gains available for distribution (or available capital loss carryforwards) under income tax regulations.
For the year ended November 30, 2018, the following reclassifications, which had no impact on results of operations or net assets, were recorded to reflect permanent tax differences resulting primarily from in-kind transactions:
| Fund | | Paid-in Capital | | | Total Distributable Earnings | |
| Sprott Gold Miners ETF | | $ | 2,085,908 | | | $ | (2,085,908 | ) |
| Sprott Junior Gold Miners ETF | | | (17,780,810 | ) | | | 17,780,810 | |
The tax character of the distributions paid during the fiscal year ended November 30, 2018 and November 30, 2017 were as follows:
| | | Ordinary Income | |
| November 30, 2018 | | | |
| Sprott Gold Miners ETF | | $ | 1,074,960 | |
| Sprott Junior Gold Miners ETF | | | 223,108 | |
| November 30, 2017 | | | | |
| Sprott Gold Miners ETF | | $ | 35,497 | |
| Sprott Junior Gold Miners ETF | | | 815,342 | |
Under current law, capital losses maintain their character as short-term or long-term and are carried forward to the next tax year without expiration. As of November 30, 2018, the following amounts are available as carry forwards to the next tax year:
| Fund | | Short-Term | | | Long-Term | |
| Sprott Gold Miners ETF | | $ | 67,552,573 | | | $ | 28,696,456 | |
| Sprott Junior Gold Miners ETF | | | 19,210,513 | | | | 8,511,041 | |
The following fund elected to defer to the period ending November 30, 2019, late year ordinary losses:
| Fund | | Amount | |
| Sprott Junior Gold Miners ETF | | $ | 220,134 | |
As of November 30, 2018, the components of distributable earnings on a tax basis for each Fund were as follows:
| | | Accumulated net investment income | | | Accumulated net realized loss on investments | | | Other accumulated differences | | | Net unrealized appreciation/(depreciation) on investments | | | Total | |
| Sprott Gold Miners ETF | | $ | 644,032 | | | $ | (96,249,029 | ) | | $ | – | | | $ | (20,498,295 | ) | | $ | (116,103,292 | ) |
| Sprott Junior Gold Miners ETF | | | – | | | | (27,721,554 | ) | | | (220,134 | ) | | | (13,448,985 | ) | | | (41,390,673 | ) |
| Notes to Financial Statements | November 30, 2018 |
As of November 30, 2018, the cost of investments for federal income tax purposes and accumulated net unrealized appreciation/(depreciation) on investments were as follows:
| | | | | | | |
| | | Sprott Gold Miners ETF | | | Sprott Junior Gold Miners ETF | |
| Gross appreciation (excess of value over tax cost) | | $ | 3,044,175 | | | $ | 124,583 | |
| Gross depreciation (excess of tax cost over value) | | | (23,542,470 | ) | | | (13,573,528 | ) |
| Net depreciation of foreign currency | | | – | | | | (40 | ) |
| Net unrealized appreciation (depreciation) | | | (20,498,295 | ) | | | (13,448,985 | ) |
| Cost of investments for income tax purposes | | $ | 149,449,845 | | | $ | 55,907,435 | |
The differences between book-basis and tax-basis are primarily due to Passive Foreign Investment Company (“PFIC”) adjustments and the deferral of losses due to wash sales.
J. Income Taxes
No provision for income taxes is included in the accompanying financial statements, as each Fund intends to distribute to shareholders all taxable investment income and realized gains and otherwise comply with Subchapter M of the Internal Revenue Code of 1986, as amended, applicable to regulated investment companies. Each Fund evaluates tax positions taken (or expected to be taken) in the course of preparing the Fund’s tax returns to determine whether these positions meet a “more-likely-than-not” standard that, based on the technical merits, have a more than fifty percent likelihood of being sustained by a taxing authority upon examination. A tax position that meets the “more-likely-than-not” recognition threshold is measured to determine the amount of benefit to recognize in the financial statements.
As of and during the year ended November 30, 2018, the Funds did not have a liability for any unrecognized tax benefits. Each Fund files U.S. federal, state, and local tax returns as required. Each Fund’s tax returns are subject to examination by the relevant tax authorities until expiration of the applicable statute of limitations, which is generally three years after the filing of the tax return, but may extend to four years in certain jurisdictions. Tax returns for open years for the Sprott Gold Miners ETF and the Sprott Junior Gold Miners ETF have incorporated no uncertain tax positions that require a provision for income taxes.
K. Lending of Portfolio Securities
The Funds have entered into a securities lending agreement with State Street Bank & Trust Co. (“SSB”), the Funds’ lending agent. The Funds may lend their portfolio securities only to borrowers that are approved by SSB. Each Fund will limit such lending to not more than 33 1/3% of the value of its total assets. Each Fund’s securities held at SSB as custodian shall be available to be lent except those securities the Fund or ALPS Advisors, Inc. specifically identifies in writing as not being available for lending. The borrower pledges and maintains with each Fund collateral consisting of cash (U.S. Dollars only), securities issued or guaranteed by the U.S. government or its agencies or instrumentalities, and by cash equivalents (including irrevocable bank letters of credit issued by a person other than the borrower or an affiliate of the borrower). The initial collateral received by each Fund is required to have a value of no less than 102% of the market value of the loaned securities for U.S. equity securities and a value of no less than 105% of the market value for non-U.S. equity securities. The collateral is maintained thereafter, at a market value equal to not less than 102% of the current value of the U.S. equity securities on loan and not less than 105% of the current value of the non-U.S. equity securities on loan. The market value of the loaned securities is determined at the close of each business day and any additional required collateral is delivered to each Fund on the next business day. During the term of the loan, each Fund is entitled to all distributions made on or in respect of the loaned securities. Loans of securities are terminable at any time and the borrower, after notice, is required to return borrowed securities within the customary time period for settlement of securities transactions.
Any cash collateral received is reinvested in a money market fund managed by SSB as disclosed in each Fund’s Schedule of Investments and is reflected in the Statements of Assets and Liabilities as a payable for collateral upon return of securities loaned. Non-cash collateral, in the form of securities issued or guaranteed by the U.S. government or its agencies or instrumentalities, is not disclosed in a Fund’s Statements of Assets and Liabilities as it is held by the lending agent on behalf of each Fund, and each Fund does not have the ability to re-hypothecate these securities. Income earned by the Fund from securities lending activity is disclosed in the Statement of Operations.
The following is a summary of each Fund’s securities lending agreements and related cash and non-cash collateral received as of November 30, 2018:
| | | Market Value of Securities on Loan | | | Cash Collateral Received | | | Non-Cash Collateral Received | | | Total Collateral Received | |
| Sprott Gold Miners ETF | | $ | 5,696,443 | | | $ | 5,466,850 | | | $ | 687,112 | | | $ | 6,153,962 | |
| Sprott Junior Gold Miners ETF | | | 5,964,337 | | | | 5,678,103 | | | | 609,501 | | | | 6,287,604 | |
| Notes to Financial Statements | November 30, 2018 |
The risks of securities lending include the risk that the borrower may not provide additional collateral when required or may not return the securities when due. To mitigate these risks, each Fund benefits from a borrower default indemnity provided by SSB. SSB’s indemnity allows for full replacement of securities lent wherein SSB will purchase the unreturned loaned securities on the open market by applying the proceeds of the collateral, or to the extent such proceeds are insufficient or the collateral is unavailable, SSB will purchase the unreturned loan securities at SSB’s expense. However, the Funds could suffer a loss if the value of the investments purchased with cash collateral falls below the value of the cash collateral received.
The following tables reflect a breakdown of transactions accounted for as secured borrowings, the gross obligation by the type of collateral pledged or securities loaned, and the remaining contractual maturity of those transactions as of November 30, 2018:
| | | | | | | | | | | | | | | |
| Sprott Gold Miners ETF | | Remaining contractual maturity of the agreements | |
| Securities Lending Transactions | | Overnight & Continuous | | Up to 30 days | | 30-90 days | | | Greater than 90 days | | | Total | |
| Common Stocks | | $ | 5,466,850 | | $ | – | | $ | – | | | $ | – | | | $ | 5,466,850 | |
| Total Borrowings | | | | | | | | | | | | | | | | | 5,466,850 | |
| Gross amount of recognized liabilities for securities lending (collateral received) | | | | | | $ | 5,466,850 | |
| Sprott Junior Gold Miners ETF | | Remaining contractual maturity of the agreements | |
| Securities Lending Transactions | | Overnight & Continuous | | Up to 30 days | | 30-90 days | | | Greater than 90 days | | | Total | |
| Common Stocks | | $ | 5,678,103 | | $ | – | | $ | – | | | $ | – | | | $ | 5,678,103 | |
| Total Borrowings | | | | | | | | | | | | | | | | | 5,678,103 | |
| Gross amount of recognized liabilities for securities lending (collateral received) | | $ | 5,678,103 | |
3. INVESTMENT ADVISORY FEE AND OTHER AFFILIATED TRANSACTIONS
ALPS Advisors, Inc. (“Adviser”) serves as the Fund’s investment adviser pursuant to an Investment Advisory Agreement with the Fund. As compensation for its services to the Fund, the Adviser receives an annual unitary fee stated below based on the Fund’s average daily net assets payable monthly. The Adviser served under the previous investment advisory agreement, since the commencement of the Fund until these agreements were terminated on April 16, 2018, due to a change of control of the Adviser’s parent company. Beginning April 16, 2018, the Adviser served under an interim investment advisory agreement, until the current investment advisory agreement was approved by the Fund’s shareholders.
| Fund | Advisory Fee |
| Sprott Gold Miners ETF | 0.57% |
| Sprott Junior Gold Miners ETF | 0.57% |
Out of the unitary management fee, the Adviser pays substantially all expenses for each Fund, including the cost of transfer agency, custody, fund administration, legal, audit, independent trustees and other services, except for interest expenses, distribution fees or expenses, brokerage expenses, taxes and extraordinary expenses, such as litigation, not incurred in the ordinary course of each Fund’s business. The Adviser’s unitary management fee is designed to pay substantially all of the Funds’ expenses and to compensate the Adviser for providing services for the Funds.
ALPS Fund Services, Inc., an affiliate of the Adviser, is the administrator to the Funds.
Each Trustee who is not an officer or employee of the Adviser, any sub-adviser or any of their affiliates (“Independent Trustees”) receives (1) a quarterly retainer of $5,000, (2) a per meeting fee for regularly scheduled meetings of $3,750, (3) $1,500 for any special meeting held outside of a regularly scheduled board meeting, and (4) reimbursement for all reasonable out-of-pocket expenses relating to attendance at meetings. In addition, both the Chairman of the Board and Chairman of the Audit Committee each receives a quarterly retainer of $2,000, in connection with their respective roles.
| Notes to Financial Statements | November 30, 2018 |
4. PURCHASES AND SALES OF SECURITIES
For the year ended November 30, 2018, the cost of purchases and proceeds from sales of investment securities, excluding short-term investments and in-kind transactions, were as follows:
| Fund | | Purchases | | | Sales | |
| Sprott Gold Miners ETF | | $ | 132,194,144 | | | $ | 132,620,113 | |
| Sprott Junior Gold Miners ETF | | | 43,724,775 | | | | 44,155,066 | |
For the year November 30, 2018, the cost of in-kind purchases and proceeds from in-kind sales were as follows:
| Fund | | Purchases | | | Sales | |
| Sprott Gold Miners ETF | | $ | 26,707,327 | | | $ | 27,353,475 | |
| Sprott Junior Gold Miners ETF | | | 8,988,293 | | | | 84,018,864 | |
For the year ended November 30, 2018, the Sprott Gold Miners ETF and the Sprott Junior Gold Miners ETF had in-kind net realized gains/(losses) of $2,314,328 and $(16,871,718) respectively.
Gains on in-kind transactions are not considered taxable for federal income tax purposes and losses on in kind transactions are also not deductible for tax purposes.
5. CAPITAL SHARE TRANSACTIONS
Shares are created and redeemed by each Fund only in Creation Unit size aggregations of 50,000 Shares. Only broker-dealers or large institutional investors with creation and redemption agreements called Authorized Participants (“AP”) are permitted to purchase or redeem Creation Units from the Funds. Such transactions are generally permitted on an in-kind basis, with a balancing cash component to equate the transaction to the NAV per unit of each Fund on the transaction date. Cash may be substituted equivalent to the value of certain securities generally when they are not available in sufficient quantity for delivery, not eligible for trading by the AP or as a result of other market circumstances.
6. RELATED PARTY TRANSACTIONS
Each Fund engaged in cross trades between other funds in the Trust during the year ended November 30, 2018 pursuant to Rule 17a-7 under the 1940 Act. Cross trading is the buying or selling of portfolio securities between funds to which the Adviser serves as the investment adviser. The Board previously adopted procedures that apply to transactions between the Funds of the Trust pursuant to Rule 17a-7. These transactions related to cross trades during the period complied with the requirements set forth by Rule 17a-7 and the Trust’s procedures.
Transactions related to cross trades during the year ended November 30, 2018 was as follows:
| | | | | | | | | | |
| Fund | | Purchase cost paid | | | Sale proceeds received | | | Realized gain/(loss) on sales | |
| Sprott Gold Miners ETF | | $ | 796,379 | | | $ | 994,357 | | | $ | (66,535 | ) |
| Sprott Junior Gold Miners ETF | | $ | 994,357 | | | $ | 897,601 | | | $ | (449,966 | ) |
7. NEW ACCOUNTING PRONOUNCEMENTS
In August 2018, the Financial Accounting Standards Board (“FASB”) issued Accounting Standards Update (“ASU”) 2018-13, which changes the fair value measurement disclosure requirements of FASB ASC Topic 820, Fair Value Measurement. The update to Topic 820 includes new, eliminated, and modified disclosure requirements. ASU 2018-13 is effective for fiscal years beginning after December 15, 2019, including interim periods. Early adoption is permitted for any eliminated or modified disclosures. The Funds have elected to early adopt the eliminated and modified disclosures effective with the financial statements prepared as of November 30, 2018.
| Notes to Financial Statements | November 30, 2018 |
8. SHAREHOLDER MEETING
A Special Meeting of Shareholders of the Funds, each a series of the Trust, was held at the offices of ALPS Fund Services, Inc., at 1290 Broadway, Suite 1100, Denver, CO 80203 on August 21, 2018. At the meeting, the following matters were voted on by the Shareholders. The results of the Special Meeting of Shareholders are noted below:
Proposal 1: To approve a new investment advisory agreement (the “New Advisory Agreement”) between the Trust, on behalf of each Fund, and the Adviser.
| | Shares Voted In Favor | Shares Voted Against/Withheld or Abstentions | Proposal Approved |
| Sprott Gold Miners ETF | 3,987,385 | 595,263 | Yes |
| Sprott Junior Gold Miners ETF | 2,076,846 | 623,738 | Yes |
Proposal 2: To approve a proposal that would authorize the Adviser to enter into and materially amend sub-advisory agreements in the future with wholly-owned sub-advisers and unaffiliated sub-advisers, with the approval of the Board, but without obtaining additional Shareholder approval.
| | Shares Voted In Favor | Shares Voted Against/Withheld or Abstentions | Proposal Approved |
| Sprott Gold Miners ETF | 3,453,699 | 1,128,949 | Yes |
| Sprott Junior Gold Miners ETF | 1,932,152 | 768,431 | Yes |
9. SEC REGULATIONS
On October 4, 2018, the SEC amended Regulation S-X to require certain financial statement disclosure requirements to conform them to GAAP for investment companies. Effective November 4, 2018, the Fund adopted disclosure requirement changes for Regulation S-X, these changes are reflected throughout this report. The Fund’s adoption of the amendments, effective with the financial statements prepared as of November 30, 2018, had no effect on the Fund’s net assets or results of operations.
10. SUBSEQUENT EVENTS
The Board has approved on September 20, 2018 an Agreement and Plan of Reorganization (“Agreement”) providing for the reorganization (the “Reorganizations”) of the Sprott Gold Miners ETF and the Sprott Junior Gold Miners ETF (each, a “Target Fund”) into corresponding newly-created exchange-traded funds (ETFs) of the Sprott ETF Trust (the “Acquiring Funds”). Each Acquiring Fund will have the same name as its corresponding Target Fund, and will be subject to substantially the same investment objective, investment strategies, policies, and risks as the corresponding Target Fund, except with respect to each Target Fund’s respective Underlying Index (as defined in each Target Fund’s prospectus). The change in indices will not be effective until after the closing of the Reorganizations. The Acquiring Funds will be advised by Sprott Asset Management LP and the Target Funds’ current investment adviser, ALPS Advisors, Inc., will continue to be responsible for day-to-day portfolio management as sub-adviser to the Acquiring Funds. Each Acquiring Fund is expected to have a lower expense ratio relative to its corresponding Target Fund. Pursuant to the Agreement, all of the assets and liabilities of each Target Fund will be transferred to its corresponding Acquiring Fund in exchange for shares of beneficial interest of the Acquiring Fund and cash in lieu of fractional shares. As a result of the Reorganizations, shareholders of each Target Fund will become shareholders of the corresponding Acquiring Fund. Shareholders of each Target Fund will receive shares of the corresponding Acquiring Fund (and cash with respect to any fractional shares held by a Target Fund shareholder) with a value equal to the aggregate net asset value of their shares of the Target Fund held immediately prior to the Reorganizations. Each of the Reorganizations is expected to be a tax-free transaction and is subject to shareholder approval.
| Additional Information | November 30, 2018 (Unaudited) |
PROXY VOTING RECORDS, POLICIES AND PROCEDURES
Information regarding how each Fund voted proxies relating to portfolio securities during the most recent 12-month period ended June 30 and a description of the Funds’ proxy voting policies and procedures used in determining how to vote for proxies are available without charge on the SEC’s website at www.sec.gov and upon request, by calling (toll-free) 1-866-675-2639.
PORTFOLIO HOLDINGS
The Trust is required to disclose, after its first and third fiscal quarters, the complete schedule of each Fund’s portfolio holdings with the SEC on Form N-Q. Form N-Q for each Fund will be available on the SEC’s website at www.sec.gov. Each Fund’s Form N-Q may also be reviewed and copied at the SEC’s Public Reference Room in Washington, D.C. and information on the operation of the Public Reference Room may be obtained by calling 1-800-SEC-0330. Each Fund’s Form N-Q will be available without charge, upon request, by calling (toll-free) 1-866-675-2639 or by writing to ALPS ETF Trust at 1290 Broadway, Suite 1100, Denver, Colorado 80203.
TAX INFORMATION
Pursuant to Section 853(c) of the Internal Revenue Code, the Funds designated the following for the calendar year ended December 31, 2018:
| | | Foreign Taxes Paid | | | Foreign Source Income | |
| Sprott Gold Miners ETF | | $ | 88,154 | | | $ | 1,135,874 | |
The Funds designate the following for federal income tax purposes for distributions made during the calendar year ended December 31, 2017:
| | Qualified Dividend Income | Dividend Received Deduction |
| Sprott Gold Miners ETF | 86.63% | 24.78% |
| Sprott Gold Miners Junior ETF | 76.06% | 0.00% |
In early 2018, if applicable, shareholders of record received this information for the distribution paid to them by the Funds during the calendar year 2017 via Form 1099. The Funds will notify shareholders in early 2019 of amounts paid to them by the Funds, if any, during the calendar year 2018.
LICENSING AGREEMENTS
Sprott Gold Miners ETF
Zacks Investment Management, Inc. (the “Licensor”) has entered into a license agreement with Sprott Asset Management LP (“Sprott”) to use the “Sprott” name and certain related intellectual property in connection with the underlying index, the Sprott Zacks Gold Miners Index (the “Underlying Index”) (the “Sprott License Agreement”). Pursuant to the Sprott License Agreement, Sprott in turn has entered into a sublicense agreement with ALPS Advisers, Inc. to use the Underlying Index (the “Sublicense Agreement”) in connection with the Sprott Gold Miners ETF (the “Product”).
The following disclosure relates to the Licensor and Sprott:
The Product(s) is not sponsored, endorsed, sold or promoted by ZACKS INVESTMENT MANAGEMENT, INC. (“Licensor”) Licensor makes no representation or warranty, express or implied, regarding the advisability of investing in securities generally or in the Product(s) particularly or the ability of the Index to track general market performance. Licensor’s only relationship to the Licensee is the licensing of the Index which is determined and composed by Licensor without regard to the Licensee or the owners of the Product(s). Licensor has no obligation to take the needs of the Licensee or the owners of the Product(s) into consideration in determining or composing the Index. Licensor shall not be liable to any person for any error in the Index nor shall it be under any obligation to advise any person of any error therein.
The Fund is not sponsored by Sprott. Sprott makes no representation or warranty, express or implied, to the owners of the Fund or any member of the public regarding the advisability of investing in securities or commodities generally or in the Fund particularly and does not guarantee the quality, accuracy or completeness of the Underlying Index or any Underlying Index data included herein or derived therefrom and assume no liability in connection with their use. The Underlying Index is determined and composed without regard to the Adviser or the Fund. Sprott has no obligation to take the needs of the Adviser, the Fund or the shareholders of the Fund into consideration in connection with the foregoing. Sprott is not responsible for and has not participated in the determination of pricing or the timing of the issuance or sale of the Shares of the Fund or in the determination or calculation of the NAV of the Fund. Sprott has no obligation or liability in connection with the administration or trading of the Fund.
| Additional Information | November 30, 2018 (Unaudited) |
Sprott does not guarantee the accuracy and/or completeness of the Underlying Index or any data included therein, and Sprott shall have no liability for any errors, omissions, or interruptions therein. Sprott makes no warranty, express or implied, as to results to be obtained by the Adviser, the Fund, Fund shareholders or any other person or entity from the use of the Underlying Index or any data included therein. Sprott makes no express or implied warranties, and expressly disclaims all warranties of merchantability or fitness for a particular purpose or use with respect to the Underlying Index or any data included therein. Without limiting any of the foregoing, in no event shall Sprott have any liability for any special, punitive, indirect, or consequential damages (including lost profits) arising out of matters relating to the use of the Underlying Index, even if notified of the possibility of such damages.
Sprott Junior Gold Miners ETF
Zacks Investment Management, Inc. (the “Licensor”) has entered into a license agreement with Sprott Asset Management LP (“Sprott”) to use the “Sprott” name and certain related intellectual property in connection with the underlying index, the Sprott Zacks Junior Gold Miners Index (the “Underlying Index”) (the “Sprott License Agreement”). Pursuant to the Sprott License Agreement, Sprott in turn has entered into a sublicense agreement with ALPS Advisers, Inc. to use the Underlying Index (the “Sublicense Agreement”) in connection with the Sprott Junior Gold Miners ETF (the “Product”).
The following disclosure relates to the Licensor and Sprott:
The Product(s) is not sponsored, endorsed, sold or promoted by ZACKS INVESTMENT MANAGEMENT, INC. (“Licensor”) Licensor makes no representation or warranty, express or implied, regarding the advisability of investing in securities generally or in the Product(s) particularly or the ability of the Index to track general market performance. Licensor’s only relationship to the Licensee is the licensing of the Index which is determined and composed by Licensor without regard to the Licensee or the owners of the Product(s). Licensor has no obligation to take the needs of the Licensee or the owners of the Product(s) into consideration in determining or composing the Index. Licensor shall not be liable to any person for any error in the Index nor shall it be under any obligation to advise any person of any error therein.
The Fund is not sponsored by Sprott. Sprott makes no representation or warranty, express or implied, to the owners of the Fund or any member of the public regarding the advisability of investing in securities or commodities generally or in the Fund particularly and does not guarantee the quality, accuracy or completeness of the Underlying Index or any Underlying Index data included herein or derived therefrom and assume no liability in connection with their use. The Underlying Index is determined and composed without regard to the Adviser or the Fund. Sprott has no obligation to take the needs of the Adviser, the Fund or the shareholders of the Fund into consideration in connection with the foregoing. Sprott is not responsible for and has not participated in the determination of pricing or the timing of the issuance or sale of the Shares of the Fund or in the determination or calculation of the NAV of the Fund. Sprott has no obligation or liability in connection with the administration or trading of the Fund.
Sprott does not guarantee the accuracy and/or completeness of the Underlying Index or any data included therein, and Sprott shall have no liability for any errors, omissions, or interruptions therein. Sprott makes no warranty, express or implied, as to results to be obtained by the Adviser, the Fund, Fund shareholders or any other person or entity from the use of the Underlying Index or any data included therein. Sprott makes no express or implied warranties, and expressly disclaims all warranties of merchantability or fitness for a particular purpose or use with respect to the Underlying Index or any data included therein. Without limiting any of the foregoing, in no event shall Sprott have any liability for any special, punitive, indirect, or consequential damages (including lost profits) arising out of matters relating to the use of the Underlying Index, even if notified of the possibility of such damages.
| Trustees & Officers | November 30, 2018 (Unaudited) |
The general supervision of the duties performed by the Adviser for the Fund under the Investment Advisory Agreement is the responsibility of the Board of Trustees. The Trust currently has four Trustees. Three Trustees have no affiliation or business connection with the Adviser or any of its affiliated persons and do not own any stock or other securities issued by the Adviser. These are the “non-interested” or “independent” Trustees (“Independent Trustees”). The other Trustee (the “Interested Trustee”) is affiliated with the Adviser.
The Independent Trustees of the Trust, their term of office and length of time served, their principal business occupations during the past five years, the number of portfolios in the Fund Complex overseen by each Independent Trustee, and other directorships, if any, held by the Trustee are shown below.
INDEPENDENT TRUSTEES
Name, Address & Year of Birth* | Position(s) Held with Trust | Term of Office and Length of Time Served** | Principal Occupation(s) During Past 5 Years | Number of Portfolios in Fund Complex Overseen by Trustees*** | Other Directorships Held by Trustees |
Mary K. Anstine,
1940 | Trustee | Since
March 2008 | Ms. Anstine was President/Chief Executive Officer of HealthONE Alliance, Denver, Colorado, and former Executive Vice President of First Interstate Bank of Denver. Ms. Anstine is also Trustee/Director of AV Hunter Trust and Colorado Uplift Board. Ms. Anstine was formerly a Director of the Trust Bank of Colorado (later purchased and now known as Northern Trust Bank), HealthONE and Denver Area Council of the Boy Scouts of America and a member of the American Bankers Association Trust Executive Committee. | 41 | Ms. Anstine is a Trustee of ALPS Variable Investment Trust (9 funds); Financial Investors Trust (33 funds); Reaves Utility Income Fund (1 fund); and Segall Bryant & Hamill Trust (14 funds). |
Jeremy W. Deems,
1976 | Trustee | Since
March 2008 | Mr. Deems is the Co-Founder, Chief Compliance Officer and Chief Financial Officer of Green Alpha Advisors, LLC. Mr. Deems is Co-Portfolio Manager of the Shelton Green Alpha Fund. Prior to joining Green Alpha Advisors, Mr. Deems was CFO and Treasurer of Forward Management, LLC, ReFlow Management Co., LLC, ReFlow Fund, LLC, a private investment fund, and Sutton Place Management, LLC, an administrative services company. | 41 | Mr. Deems is a Trustee of ALPS Variable Investment Trust (9 funds); Financial Investors Trust (33 funds); and Reaves Utility Income Fund (1 fund); and Clough Funds Trust (1 fund). |
Rick A. Pederson,
1952 | Trustee and
Chairman | Since March
2008. Has
served as
Chairman since
July 2017. | Mr. Pederson is Partner, Bow River Capital Partners (private equity management), 2003 - present; Board Member, Prosci Inc. (private business services) 2013-2016; Board Member, Citywide Banks (Colorado community bank) 2014-present; Board Member, Strong-Bridge Consulting (management consulting) 2015-present; Board Member, IRI/ODMS Holdings LLC, 2017 – present; Director, National Western Stock Show (not-for-profit organization) 2010 – present; Board Member, History Colorado, 2015 – present; Trustee, Boettcher Foundation, 2018. | 21 | Mr. Pederson is Trustee of Segall Bryant & Hamill Trust (14 funds) and Principal Real Estate Income Fund (1 fund) |
| * | The business address of the Trustee is c/o ALPS Advisors, Inc., 1290 Broadway, Suite 1100, Denver, Colorado 80203. |
| ** | This is the period for which the Trustee began serving the Trust. Each Trustee serves an indefinite term, until his successor is elected. |
| *** | The Fund Complex includes all series of the Trust and any other investment companies for which ALPS Advisors, Inc. provides investment advisory services. |
| Trustees & Officers | November 30, 2018 (Unaudited) |
The Trustee who is affiliated with the Adviser or affiliates of the Adviser and executive officers of the Trust, his term of office and length of time served, his principal business occupations during the past five years, the number of portfolios in the Fund Complex overseen by the Interested Trustee and the other directorships, if any, held by the Trustee, are shown below.
INTERESTED TRUSTEE
Name, Address and Year of Birth of Interested Trustee* | Position(s) Held with Trust | Term of Office and Length of Time Served** | Principal Occupation(s) During Past 5 Years | Number of Portfolios in Fund Complex Overseen by Trustees*** | Other Directorships Held by Trustee |
Edmund J. Burke, 1961 | Trustee and President | Since December 2017 | Mr. Burke is President and a Director of ALPS Holdings, Inc. (“AHI”) (since 2005) and Director of Boston Financial Data Services, Inc. (“BFDS”), ALPS Advisors, Inc. (“AAI”), ALPS Distributors, Inc. (“ADI”), ALPS Fund Services, Inc. (“AFS”) and ALPS Portfolio Solutions Distributor, Inc. (“APSD”). Because of his positions with AHI, BFDS, AAI, ADI, AFS and APSD, Mr. Burke is deemed an affiliate of the Trust as defined under the 1940 Act. | 36 | Mr. Burke is a Trustee of Clough Global Dividend and Income Fund (1 fund); Clough Global Equity Fund (1 fund); Clough Global Opportunities Fund (1 fund); Clough Funds Trust (1 fund); Liberty All-Star Equity Fund (1 fund); Director of the Liberty All-Star Growth Fund, Inc. (1 fund) and Financial Investors Trust (33 funds). |
| * | The business address of the Trustee is c/o ALPS Advisors, Inc., 1290 Broadway, Suite 1100, Denver, Colorado 80203. |
| ** | This is the period for which the Trustee began serving the Trust. Each Trustee serves an indefinite term, until his successor is elected. |
| *** | The Fund Complex includes all series of the Trust and any other investment companies for which ALPS Advisors, Inc. provides investment advisory services. |
| Trustees & Officers | November 30, 2018 (Unaudited) |
OFFICERS
Name, Address and Year of Birth of Officer* | Position(s) Held with Trust | Length of Time Served** | Principal Occupation(s) During Past 5 Years |
Erin D. Nelson,
1977 | Chief
Compliance
Officer (“CCO”) | Since
December 2015 | Ms. Nelson became Senior Vice-President and Chief Compliance Officer of ALPS Advisors, Inc. on July 1, 2015 and prior to that served as Vice President and Deputy Chief Compliance Officer of AAI since January 1, 2015. Prior to January 1, 2015, Ms. Nelson was Vice-President and Assistant General Counsel of ALPS Fund Services. Because of her position with AAI, Ms. Nelson is deemed an affiliate of the Trust as defined under the 1940 Act. Ms. Nelson is also the CCO of ALPS Variable Investment Trust, Liberty All-Star Growth Fund, Inc., Liberty All-Star Equity Fund, Principal Real Estate Income Fund, RiverNorth Opportunities Fund, Inc. and Red Rocks Capital, LLC. |
Kathryn Burns,
1976 | Treasurer | Since
September 2018 | Ms. Burns serves as Vice President, Director of Fund Operations of AAI since 2018. From 2013 to 2018, she served as Vice President and Fund Controller at ALPS Fund Services. Prior to joining ALPS, she worked at Old Mutual Capital where she served as Vice President and Chief Compliance Officer (2010 – 2012) and Regulatory Reporting Manager and Assistant Treasurer to the Old Mutual Funds Trusts (2006 - 2012). She also served as a CPA for PricewaterhouseCoopers LLP. Ms. Burns is also Treasurer of ALPS Variable Investment Trust, the Boulder Growth & Income Fund, Inc., Principal Real Estate Income Fund and the RiverNorth Opportunities Fund Inc. |
Andrea E. Kuchli,
1985 | Secretary | Since
December 2017 | Ms. Kuchli joined ALPS in 2015 and is currently Vice President and Senior Counsel of ALPS. Prior to joining ALPS, Ms. Kuchli was an Associate with Davis Graham & Stubbs LLP from April 2014 to February 2015, and an Associate with Dechert LLP from 2011 to April 2014. Because of her position with ALPS, Ms. Kuchli is deemed an affiliate of the Trust as defined under the 1940 Act. Ms. Kuchli is also Secretary of ALPS Variable Investment Trust and Principal Real Estate Income Fund as well as Assistant Secretary of the James Advantage Funds. |
Sharon Akselrod,
1974 | Assistant
Secretary | Since
December 2016 | Ms. Akselrod joined ALPS in August 2014 and is currently Senior Investment Company Act Paralegal of ALPS Fund Services, Inc. Prior to joining ALPS, Ms. Akselrod served as Corporate Governance and Regulatory Associate for Nordstrom fsb (2013-2014) and Senior Legal Assistant – Legal Manager for AXA Equitable Life Insurance Company (2008-2013). Because of her position with ALPS, Ms. Akselrod is deemed an affiliate of the Trust as defined under the 1940 Act. Ms. Akselrod is also Assistant Secretary of Financial Investors Trust, ALPS Variable Investment Trust, Principal Real Estate Income Fund and Clough Funds Trust. |
| * | The business address of each Officer is c/o ALPS Advisors, Inc., 1290 Broadway, Suite 1100, Denver, Colorado 80203. |
| ** | This is the period for which the Officer began serving the Trust. Each Officer serves an indefinite term, until his/her successor is elected. |

TABLE OF
CONTENTS
| Performance Overview | 1 |
| Disclosure of Fund Expenses | 4 |
| Report of Independent Registered Public Accounting Firm | 5 |
| Financial Statements | |
| Schedule of Investments | 6 |
| Statement of Assets and Liabilities | 10 |
| Statement of Operations | 11 |
| Statements of Changes in Net Assets | 12 |
| Financial Highlights | 13 |
| Notes to Financial Statements | 14 |
| Additional Information | 20 |
| Trustees & Officers | 21 |
Beginning on January 1, 2021, as permitted by regulations adopted by the U.S. Securities and Exchange Commission, paper copies of the Fund’s annual and semi-annual shareholder reports will no longer be sent by mail, unless you specifically request paper copies of the reports from your financial intermediary (such as a broker-dealer or bank). Instead, the reports will be made available on the Fund’s website (www.alpsfunds.com), and you will be notified by mail each time a report is posted and provided with a website link to access the report.
If you already elected to receive shareholder reports electronically, you will not be affected by this change and you need not take any action. You may elect to receive shareholder reports and other communications from the Fund electronically anytime by contacting your financial intermediary.
You may elect to receive all future reports in paper free of charge. You can contact your financial intermediary to request that you continue to receive paper copies of your shareholder reports. Your election to receive reports in paper will apply to all funds held in your account with your financial intermediary.
www.alpsfunds.com
Workplace Equality Portfolio
| Performance Overview | November 30, 2018 (Unaudited) |
Investment Objective
The Workplace Equality Portfolio (the “Fund”) seeks investment results that correspond (before fees and expenses) generally to the price and yield performance of its underlying index, the Workplace Equality Index™ (the “Underlying Index”).
The Underlying Index is designed to provide a means of tracking the performance of companies which support workplace equality for lesbian, gay, bisexual and transgender (“LGBT”) employees. The Underlying Index consists of approximately 200 publicly traded stocks of U.S. and foreign companies which support equality for LGBT employees through their workplace practices, including non-discrimination policies regarding sexual orientation and gender identity and providing full benefits to for same-sex spouses, domestic partners and transgender individuals. The Underlying Index is compiled by Segall Bryant & Hamill, LLC (“SBH” or the “Index Provider”). The Index Provider uses publicly available lists and screening sources such as the National Gay & Lesbian Chamber of Commerce®, Diversity Inc. Top 50®, Stonewall® or other screening sources, to identify companies with workplace policies that meet the Underlying Index’s criteria for equality for LGBT employees as described above (as well as market capitalization and liquidity requirements). The Index Provider also utilizes its own proprietary database for index screening. The criteria are subject to change in response to changes in law.
Performance Overview
For the fiscal year ended November 30, 2018, the equal-weighted Workplace Equality Index returned 3.42%. In contrast, the capitalization- weighted S&P 500 Total Return Index (the “S&P 500 Index”) returned 6.27% during the same period. Most of this performance gap was caused by the equal-weight construction of the index. Both financials and consumer discretionary are sectors with significant weight in the index (financials 19.7% average weight and consumer discretionary 17.43%). Both had negative contributions to return (financials reduced relative return by 128 basis points while consumer discretionary created a 228 basis point drag on performance).
Most of the damage in the financial sector underperformance came from our European bank holdings, Credit Suisse (down 29%) and Deutsche Bank (down 51%). Within the consumer discretionary sector, Amazon alone accounted for 80 basis points of relative underperformance. Although Amazon was added to the index in June, the stock had already rallied throughout the year. Combined with our relatively smaller weighting in the stock, the negative effect was 80 basis points in that stock alone.
Within the information technology sector, our equal-weight construction did not significantly detract from return even though the weights of technology titans such as Apple, Microsoft, Intel and Visa are significantly lower in the Workplace Equality Index than the S&P 500 index. Excellent performance by some of the smaller technology stocks in the index such as CA Inc., Conduent, Intuit and salesforce.com helped overall sector for the year. Our underweighting in both energy and healthcare, combined with index constituents that outperformed their peer sectors in the S&P 500 Index added to overall performance.
The top five contributors to relative return over the fiscal year ended November 30, 2018 were Norfolk Southern Corp., Abercrombie & Fitch Co., Facebook, Anthem and General Electric Company where our relative underweight benefited as the stock dropped 57% during the twelve-month period. The bottom five contributors were Owens Corning (overweight), Raytheon Company (overweight), Microsoft (underweight), Amazon (underweight) and Electronic Arts (underweight).
The Workplace Equality Index is made up of companies doing business in the U.S. that have best-of-class LGBT-inclusive workplace policies. These companies tend to be leaders in embracing a diverse workforce. The index has historically had a large overweighting of companies that represent what many refer to as the “new economy” such as communications services, consumer discretionary and financials, while being underweight “old economy” sectors like energy and utilities. It is our opinion, that companies where every employee is treated with dignity, respect and equality will lead to better shareholder returns in the long run.
Workplace Equality Portfolio
| Performance Overview | November 30, 2018 (Unaudited) |
Performance(as of November 30, 2018)
| | 1 Year | 3 Year | Since Inception^ |
| Workplace Equality Portfolio – NAV | 2.69% | 11.19% | 9.55% |
| Workplace Equality Portfolio – Market Price* | 2.72% | 11.21% | 9.57% |
| Workplace Equality IndexTM | 3.42% | 12.03% | 10.38% |
| S&P 500® Total Return Index | 6.27% | 12.16% | 11.05% |
Total Expense Ratio (per the current prospectus) 0.75%
Performance data quoted represents past performance. Past performance does not guarantee future results. The table does not reflect the deduction of taxes that a shareholder would pay on Fund distributions or the redemption of Fund shares. Investment return and principal value of an investment will fluctuate so that an investor’s shares, when sold or redeemed, may be worth more or less than the original cost. Current performance data may be higher or lower than actual data quoted. For the most current month-end performance data please visit www.alpsfunds.com or call 1.844.375.8383.
NAV is an exchange-traded fund’s per-share value. The per-share dollar amount of the Fund is derived by dividing the total value of all the securities in its portfolio, less any liabilities, by the number of Fund shares outstanding. Market Price is the price at which a share can currently be traded in the market. Information detailing the number of days the Market Price of the Fund was greater than the Fund’s NAV and the number of days it was less than the Fund’s NAV can be obtained at www.alpsfunds.com.
| ^ | The Fund Commencement date was February 25, 2014. |
| * | Market Price is based on the midpoint of the bid-ask spread at 4 p.m. ET and does not represent the returns an investor would receive if shares were traded at other times. |
The Workplace Equality IndexTM: an equal weighted index of companies that support lesbian, gay, bisexual and transgender (LGBT) equality in their workplace.
The S&P 500®Total Return Index: the Standard & Poor’s composite index of 500 stocks, a widely recognized, unmanaged index of common stock prices.
The indexes are not actively managed and do not reflect any deductions for fees, expenses or taxes. The indexes are reported on a total return basis, which assumes reinvestment of any dividends and distributions realized during a given time period. One cannot invest directly in an index. Index performance does not reflect Fund performance.
The Fund invests in stocks of companies which meet the Underlying Index's criteria for supporting workplace equality for LGBT employees. The trend of companies supporting workplace equality in this fashion is relatively recent, and there may be a limited number of companies which meet the Underlying Index's criteria.
The Fund’s shares are not individually redeemable. Investors buy and sell shares of the Fund on a secondary market. Only market makers or “authorized participants” may trade directly with the Fund, typically in blocks of 50,000 shares.
The Workplace Equality Portfolio is not suitable for all investors. Investments in the Fund are subject to investment risks, including possible loss of the principal amount invested.
ALPS Portfolio Solutions Distributor, Inc., a FINRA member, is the distributor for the Workplace Equality Portfolio.
ALPS Portfolio Solutions Distributor, Inc. is not affiliated with SBH.
Workplace Equality Portfolio
| Performance Overview | November 30, 2018 (Unaudited) |
Top 10 Holdings*(as of November 30, 2018)
| CVS Health Corp. | 0.52% |
| Under Armour, Inc., Class C | 0.47% |
| Tech Data Corp. | 0.47% |
| Workday, Inc., Class A | 0.46% |
| United Technologies Corp. | 0.45% |
| Tesla, Inc. | 0.45% |
| Starbucks Corp. | 0.45% |
| Walgreens Boots Alliance, Inc. | 0.45% |
| McDonald's Corp. | 0.44% |
| Hormel Foods Corp. | 0.44% |
| Total % of Top 10 Holdings | 4.60% |
| * | % of Total Investments (excluding investments purchased with collateral from securities loaned) |
Future holdings are subject to change.
Sector Allocation*(as of November 30, 2018)
| Financials | 19.88% |
| Consumer Discretionary | 16.16% |
| Health Care | 12.98% |
| Information Technology | 12.37% |
| Industrials | 10.90% |
| Consumer Staples | 8.86% |
| Communication Services | 7.99% |
| Utilities | 3.94% |
| Materials | 2.73% |
| Real Estate | 2.15% |
| Energy | 1.41% |
| Money Market Fund | 0.63% |
| Total | 100.00% |
Growth of $10,000(as of November 30, 2018)
Comparison of Change in Value of $10,000 Investment in the Fund and the Indexes
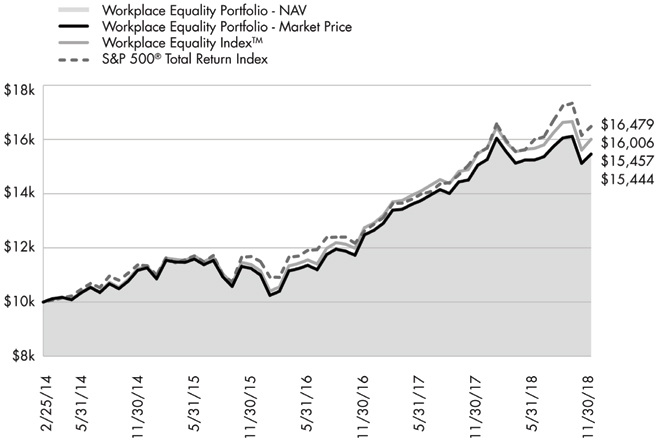
The chart above represents historical performance of a hypothetical investment of $10,000 in the Fund over the life of the Fund. Past performance does not guarantee future results. This chart does not reflect the deduction of taxes that a shareholder would pay on Fund distributions or the redemption of Fund shares.
Workplace Equality Portfolio
| Disclosure of Fund Expenses | November 30, 2018 (Unaudited) |
Shareholder Expense Example: As a shareholder of the Fund, you incur two types of costs: (1) transaction costs which may include creation and redemption fees or brokerage charges, and (2) ongoing costs, including management fees and other Fund expenses. These examples are intended to help you understand your ongoing costs (in dollars) of investing in the Fund and to compare these costs with the ongoing costs of investing in other funds. It is based on an investment of $1,000 invested at the beginning of the (six month) period and held through November 30, 2018.
Actual Return: The first line of the table provides information about actual account values and actual expenses. You may use the information in this line, together with the amount you invested, to estimate the expenses that you incurred over the period. Simply divide your account value by $1,000 (for example, an $8,600 account value divided by $1,000 = 8.6), then multiply the result by the number in the first line under the heading entitled “Expenses Paid During Period” to estimate the expenses attributable to your investment during this period.
Hypothetical 5% Return: The second line of the table provides information about hypothetical account values and hypothetical expenses based on the Fund’s actual expense ratio and an assumed rate of return of 5% per year before expenses, which is not the Fund’s actual return. The hypothetical account values and expenses may not be used to estimate the actual ending account balance or expenses you paid for the period. You may use this information to compare ongoing costs of investing in the Fund and other funds. To do so, compare this 5% hypothetical example with the 5% hypothetical examples that appear in the shareholder reports of other funds.
The expenses shown in the table are meant to highlight ongoing Fund costs only and do not reflect any transaction costs, such as creation and redemption fees or brokerage charges. Therefore, the second line is useful in comparing ongoing costs only, and will not help you determine the relative total costs of owning different funds. In addition, if these costs were included, your costs would have been higher.
| | Beginning Account
Value
6/1/18 | Ending Account
Value
11/30/18 | Expense
Ratio(a) | Expenses Paid
During Period
6/1/18 - 11/30/18(b) |
| Workplace Equality Portfolio | | | | |
| Actual | $1,000.00 | $1,017.80 | 0.75% | $3.79 |
| Hypothetical (5% return before expenses) | $1,000.00 | $1,021.31 | 0.75% | $3.80 |
| (a) | Annualized, based on the Fund's most recent fiscal half year expenses. |
| (b) | Expenses are equal to the Fund's annualized expense ratio multiplied by the average account value over the period, multiplied by the number of days in the most recent fiscal half year (183), divided by 365. |
Workplace Equality Portfolio
Report of Independent Registered Public Accounting Firm
To the shareholders and the Board of Trustees of ALPS ETF Trust:
Opinion on the Financial Statements and Financial Highlights
We have audited the accompanying statement of assets and liabilities, including the schedule of investments, of Workplace Equality Portfolio (the “Fund”), one of the funds constituting the ALPS ETF Trust, as of November 30, 2018, the related statement of operations for the year then ended, the statements of changes in net assets for each of the two years in the period then ended, the financial highlights for the years ended November 30, 2018, 2017, 2016, 2015 and for the period February 25, 2014 (commencement of operations) to November 30, 2014, and the related notes. In our opinion, the financial statements and financial highlights present fairly, in all material respects, the financial position of Workplace Equality Portfolio of ALPS ETF Trust as of November 30, 2018, and the results of its operations for the year then ended, the changes in its net assets for each of the two years in the period then ended, and the financial highlights for the years ended November 30, 2018, 2017, 2016, 2015 and for the period February 25, 2014 (commencement of operations) to November 30, 2014, in conformity with accounting principles generally accepted in the United States of America.
Basis for Opinion
These financial statements and financial highlights are the responsibility of the Fund's management. Our responsibility is to express an opinion on the Fund’s financial statements and financial highlights based on our audits. We are a public accounting firm registered with the Public Company Accounting Oversight Board (United States) (PCAOB) and are required to be independent with respect to the Fund in accordance with the U.S. federal securities laws and the applicable rules and regulations of the Securities and Exchange Commission and the PCAOB.
We conducted our audits in accordance with the standards of the PCAOB. Those standards require that we plan and perform the audit to obtain reasonable assurance about whether the financial statements and financial highlights are free of material misstatement, whether due to error or fraud. The Fund is not required to have, nor were we engaged to perform, an audit of its internal control over financial reporting. As part of our audits we are required to obtain an understanding of internal control over financial reporting but not for the purpose of expressing an opinion on the effectiveness of the Fund’s internal control over financial reporting. Accordingly, we express no such opinion.
Our audits included performing procedures to assess the risks of material misstatement of the financial statements and financial highlights, whether due to error or fraud, and performing procedures that respond to those risks. Such procedures included examining, on a test basis, evidence regarding the amounts and disclosures in the financial statements and financial highlights. Our audits also included evaluating the accounting principles used and significant estimates made by management, as well as evaluating the overall presentation of the financial statements and financial highlights. Our procedures included confirmation of securities owned as of November 30, 2018, by correspondence with the custodian and brokers; when replies were not received from brokers, we performed other auditing procedures. We believe that our audits provide a reasonable basis for our opinion.
DELOITTE & TOUCHE LLP
Denver, Colorado
January 24, 2019
We have served as the auditor of one or more investment companies advised by ALPS Advisors, Inc. since 2007.
Workplace Equality Portfolio
| Schedule of Investments | November 30, 2018 |
| Security Description | | Shares | | | Value | |
| COMMON STOCKS (99.21%) | | | | | | | | |
| Communication Services (7.98%) | | | | | | | | |
| Alphabet, Inc., Class C(a) | | | 73 | | | $ | 79,893 | |
| AT&T, Inc. | | | 2,534 | | | | 79,162 | |
| BT Group PLC, Sponsored ADR | | | 5,697 | | | | 95,197 | |
| CBS Corp., Class B | | | 1,519 | | | | 82,299 | |
| Comcast Corp., Class A | | | 2,264 | | | | 88,319 | |
| Electronic Arts, Inc.(a) | | | 743 | | | | 62,464 | |
| Facebook, Inc., Class A(a) | | | 519 | | | | 72,977 | |
| Global Eagle Entertainment,Inc.(a)(b) | | | 39,018 | | | | 95,984 | |
| Interpublic Group of Cos., Inc. | | | 3,650 | | | | 85,775 | |
| Live Nation Entertainment,Inc.(a) | | | 1,608 | | | | 89,534 | |
| Netflix, Inc.(a) | | | 236 | | | | 67,527 | |
| Pearson PLC, Sponsored ADR(b) | | | 7,508 | | | | 92,123 | |
| Sirius XM Holdings, Inc.(b) | | | 12,109 | | | | 75,439 | |
| Sprint Corp.(a) | | | 13,396 | | | | 84,127 | |
| TEGNA, Inc. | | | 7,218 | | | | 95,927 | |
| T-Mobile US, Inc.(a) | | | 1,238 | | | | 84,741 | |
| Twitter, Inc.(a) | | | 2,979 | | | | 93,690 | |
| Verizon Communications, Inc. | | | 1,593 | | | | 96,058 | |
| Viacom, Inc., Class B | | | 2,614 | | | | 80,668 | |
| Walt Disney Co. | | | 780 | | | | 90,082 | |
| Yelp, Inc.(a) | | | 1,709 | | | | 57,542 | |
| Total Communication Services | | | | | | | 1,749,528 | |
| | | | | | | | | |
| Consumer Discretionary (16.13%) | | | | | | | | |
| Abercrombie & Fitch Co., Class A | | | 4,187 | | | | 87,550 | |
| Amazon.com, Inc.(a) | | | 44 | | | | 74,367 | |
| American Eagle Outfitters, Inc. | | | 3,574 | | | | 74,804 | |
| Aramark | | | 1,991 | | | | 75,777 | |
| Best Buy Co., Inc. | | | 1,044 | | | | 67,432 | |
| Caesars Entertainment Corp.(a) | | | 7,839 | | | | 66,788 | |
| Choice Hotels International, Inc. | | | 1,027 | | | | 79,972 | |
| Darden Restaurants, Inc. | | | 768 | | | | 84,895 | |
| Dollar General Corp. | | | 790 | | | | 87,682 | |
| eBay, Inc.(a) | | | 2,473 | | | | 73,819 | |
| Ford Motor Co. | | | 8,895 | | | | 83,702 | |
| GameStop Corp., Class A(b) | | | 5,104 | | | | 69,721 | |
| Gap, Inc. | | | 3,124 | | | | 85,254 | |
| General Motors Co. | | | 2,393 | | | | 90,814 | |
| Groupon, Inc.(a) | | | 21,847 | | | | 67,070 | |
| Hilton Grand Vacations, Inc.(a) | | | 2,539 | | | | 81,400 | |
| Hilton Worldwide Holdings, Inc. | | | 1,059 | | | | 79,997 | |
| Home Depot, Inc. | | | 397 | | | | 71,587 | |
| Hyatt Hotels Corp., Class A | | | 1,087 | | | | 77,514 | |
| InterContinental Hotels GroupPLC, ADR(b) | | | 1,346 | | | | 73,936 | |
| Kohl's Corp. | | | 1,121 | | | | 75,298 | |
| L Brands, Inc. | | | 2,805 | | | | 92,874 | |
| Macy's, Inc. | | | 2,397 | | | | 82,025 | |
| Marriott International, Inc., Class A | | | 645 | | | | 74,194 | |
| Mattel, Inc.(a)(b) | | | 5,120 | | | | 71,168 | |
| Security Description | | Shares | | | Value | |
| Consumer Discretionary (continued) | |
| McDonald's Corp. | | | 514 | | | $ | 96,894 | |
| MGM Resorts International | | | 2,987 | | | | 80,530 | |
| NIKE, Inc., Class B | | | 987 | | | | 74,143 | |
| Nordstrom, Inc. | | | 1,410 | | | | 74,547 | |
| Office Depot, Inc. | | | 25,847 | | | | 83,486 | |
| Royal Caribbean Cruises, Ltd. | | | 650 | | | | 73,496 | |
| Sony Corp., Sponsored ADR | | | 1,478 | | | | 78,068 | |
| Starbucks Corp. | | | 1,470 | | | | 98,078 | |
| Tapestry, Inc. | | | 1,678 | | | | 65,325 | |
| Target Corp. | | | 987 | | | | 70,038 | |
| Tesla, Inc.(a) | | | 283 | | | | 99,186 | |
| Tiffany & Co. | | | 673 | | | | 61,243 | |
| TJX Cos., Inc. | | | 1,558 | | | | 76,108 | |
| Toyota Motor Corp., Sponsored ADR | | | 676 | | | | 82,120 | |
| Under Armour, Inc., Class C(a) | | | 4,572 | | | | 102,093 | |
| Visteon Corp.(a) | | | 823 | | | | 60,754 | |
| Whirlpool Corp. | | | 682 | | | | 86,021 | |
| Wyndham Destinations, Inc. | | | 1,947 | | | | 80,742 | |
| Wyndham Hotels & Resorts, Inc. | | | 1,530 | | | | 76,699 | |
| Wynn Resorts, Ltd. | | | 618 | | | | 67,609 | |
| Total Consumer Discretionary | | | | | | | 3,536,820 | |
| | | | | | | | | |
| Consumer Staples (8.85%) | | | | | | | | |
| Altria Group, Inc. | | | 1,353 | | | | 74,185 | |
| Avon Products, Inc.(a) | | | 35,123 | | | | 74,461 | |
| Brown-Forman Corp., Class B | | | 1,715 | | | | 81,840 | |
| Campbell Soup Co. | | | 2,171 | | | | 85,103 | |
| Clorox Co. | | | 561 | | | | 92,913 | |
| Coca-Cola Co. | | | 1,812 | | | | 91,325 | |
| Colgate-Palmolive Co. | | | 1,250 | | | | 79,400 | |
| Constellation Brands, Inc., Class A | | | 394 | | | | 77,129 | |
| Diageo PLC, Sponsored ADR | | | 610 | | | | 88,053 | |
| Estee Lauder Cos., Inc., Class A | | | 589 | | | | 84,027 | |
| General Mills, Inc. | | | 1,917 | | | | 81,108 | |
| Hain Celestial Group, Inc.(a) | | | 3,258 | | | | 67,441 | |
| Hershey Co. | | | 829 | | | | 89,781 | |
| Hormel Foods Corp. | | | 2,148 | | | | 96,853 | |
| Kellogg Co. | | | 1,165 | | | | 74,152 | |
| Kimberly-Clark Corp. | | | 733 | | | | 84,566 | |
| Kraft Heinz Co. | | | 1,497 | | | | 76,527 | |
| Kroger Co. | | | 2,834 | | | | 84,056 | |
| Mondelez International, Inc., Class A | | | 1,957 | | | | 88,026 | |
| PepsiCo, Inc. | | | 742 | | | | 90,479 | |
| Procter & Gamble Co. | | | 1,003 | | | | 94,794 | |
| Unilever NV, NY Shares | | | 1,533 | | | | 85,097 | |
| Walgreens Boots Alliance, Inc. | | | 1,158 | | | | 98,048 | |
| Total Consumer Staples | | | | | | | 1,939,364 | |
| | | | | | | | | |
| Energy (1.41%) | | | | | | | | |
| BP PLC, Sponsored ADR | | | 1,889 | | | | 76,221 | |
| Chevron Corp. | | | 699 | | | | 83,139 | |
| ConocoPhillips | | | 1,110 | | | | 73,460 | |
Workplace Equality Portfolio
| Schedule of Investments | November 30, 2018 |
| Security Description | | Shares | | | Value | |
| Energy (continued) | | | | | | | | |
| Royal Dutch Shell PLC, Class A | | | 1,254 | | | $ | 75,742 | |
| Total Energy | | | | | | | 308,562 | |
| | | | | | | | | |
| Financials (19.84%) | | | | | | | | |
| American Express Co. | | | 769 | | | | 86,336 | |
| American International Group, Inc. | | | 1,548 | | | | 66,951 | |
| Ameriprise Financial, Inc. | | | 573 | | | | 74,347 | |
| Aon PLC | | | 549 | | | | 90,645 | |
| Aviva PLC, Sponsored ADR | | | 6,563 | | | | 67,599 | |
| Bank of America Corp. | | | 2,736 | | | | 77,702 | |
| Bank of Montreal | | | 1,035 | | | | 77,107 | |
| Bank of New York Mellon Corp. | | | 1,624 | | | | 83,327 | |
| Barclays PLC, Sponsored ADR | | | 9,142 | | | | 75,604 | |
| BB&T Corp. | | | 1,638 | | | | 83,702 | |
| BlackRock, Inc. | | | 173 | | | | 74,046 | |
| Capital One Financial Corp. | | | 858 | | | | 76,945 | |
| Charles Schwab Corp. | | | 1,650 | | | | 73,920 | |
| Chubb, Ltd. | | | 604 | | | | 80,779 | |
| Citigroup, Inc. | | | 1,150 | | | | 74,508 | |
| CNA Financial Corp. | | | 1,777 | | | | 83,377 | |
| Comerica, Inc. | | | 892 | | | | 70,629 | |
| Credit Suisse Group AG, Sponsored ADR | | | 5,367 | | | | 63,438 | |
| Deutsche Bank AG | | | 6,829 | | | | 62,554 | |
| Discover Financial Services | | | 1,070 | | | | 76,291 | |
| FactSet Research Systems, Inc. | | | 368 | | | | 86,292 | |
| Fifth Third Bancorp | | | 2,907 | | | | 81,193 | |
| First American Financial Corp. | | | 1,602 | | | | 77,425 | |
| Franklin Resources, Inc. | | | 2,624 | | | | 88,927 | |
| Genworth Financial, Inc., Class A(a) | | | 19,845 | | | | 92,478 | |
| Goldman Sachs Group, Inc. | | | 363 | | | | 69,220 | |
| Hartford Financial Services Group, Inc. | | | 1,659 | | | | 73,311 | |
| HSBC Holdings PLC, Sponsored ADR | | | 1,936 | | | | 82,357 | |
| Huntington Bancshares, Inc. | | | 5,362 | | | | 78,232 | |
| JPMorgan Chase & Co. | | | 724 | | | | 80,502 | |
| KeyCorp | | | 4,060 | | | | 74,460 | |
| M&T Bank Corp. | | | 487 | | | | 82,308 | |
| Marsh & McLennan Cos., Inc. | | | 995 | | | | 88,257 | |
| MetLife, Inc. | | | 1,779 | | | | 79,397 | |
| Moody's Corp. | | | 486 | | | | 77,308 | |
| Morgan Stanley | | | 1,747 | | | | 77,549 | |
| Navient Corp. | | | 5,961 | | | | 68,552 | |
| Northern Trust Corp. | | | 794 | | | | 78,789 | |
| PNC Financial Services Group, Inc. | | | 596 | | | | 80,925 | |
| Principal Financial Group, Inc. | | | 1,434 | | | | 70,725 | |
| Progressive Corp. | | | 1,192 | | | | 79,018 | |
| Prudential Financial, Inc. | | | 817 | | | | 76,602 | |
| Royal Bank of Canada | | | 1,057 | | | | 77,436 | |
| S&P Global, Inc. | | | 398 | | | | 72,778 | |
| State Street Corp. | | | 969 | | | | 70,756 | |
| Sun Life Financial, Inc. | | | 2,084 | | | | 76,670 | |
| Security Description | | Shares | | | Value | |
| Financials (continued) | | | | | | | | |
| SunTrust Banks, Inc. | | | 1,189 | | | $ | 74,538 | |
| T Rowe Price Group, Inc. | | | 763 | | | | 75,812 | |
| Thomson Reuters Corp. | | | 1,710 | | | | 86,047 | |
| Toronto-Dominion Bank | | | 1,405 | | | | 77,697 | |
| Travelers Cos., Inc. | | | 641 | | | | 83,567 | |
| UBS Group AG | | | 5,100 | | | | 69,003 | |
| Unum Group | | | 2,138 | | | | 76,776 | |
| US Bancorp | | | 1,561 | | | | 85,012 | |
| Voya Financial, Inc. | | | 1,671 | | | | 75,111 | |
| Wells Fargo & Co. | | | 1,556 | | | | 84,460 | |
| Total Financials | | | | | | | 4,349,297 | |
| | | | | | | | | |
| Health Care (12.96%) | | | | | | | | |
| AbbVie, Inc. | | | 925 | | | | 87,200 | |
| AmerisourceBergen Corp. | | | 935 | | | | 83,121 | |
| Amgen, Inc. | | | 411 | | | | 85,591 | |
| Anthem, Inc. | | | 313 | | | | 90,792 | |
| AstraZeneca PLC, Sponsored ADR | | | 2,242 | | | | 89,276 | |
| athenahealth, Inc.(a) | | | 622 | | | | 82,788 | |
| Baxter International, Inc. | | | 1,088 | | | | 74,582 | |
| Becton Dickinson and Co. | | | 326 | | | | 82,397 | |
| Biogen, Inc.(a) | | | 245 | | | | 81,761 | |
| Boston Scientific Corp.(a) | | | 2,283 | | | | 86,001 | |
| Bristol-Myers Squibb Co. | | | 1,379 | | | | 73,721 | |
| Cardinal Health, Inc. | | | 1,562 | | | | 85,644 | |
| Centene Corp.(a) | | | 599 | | | | 85,208 | |
| Cerner Corp.(a) | | | 1,321 | | | | 76,499 | |
| Cigna Corp. | | | 421 | | | | 94,043 | |
| CVS Health Corp. | | | 1,427 | | | | 114,445 | |
| Eli Lilly & Co. | | | 794 | | | | 94,200 | |
| Express Scripts Holding Co.(a) | | | 897 | | | | 91,019 | |
| Gilead Sciences, Inc. | | | 1,117 | | | | 80,357 | |
| GlaxoSmithKline PLC, Sponsored ADR | | | 2,139 | | | | 89,560 | |
| Henry Schein, Inc.(a) | | | 989 | | | | 88,219 | |
| Humana, Inc. | | | 253 | | | | 83,356 | |
| Johnson & Johnson | | | 603 | | | | 88,581 | |
| Laboratory Corp. of America Holdings(a) | | | 499 | | | | 72,674 | |
| McKesson Corp. | | | 629 | | | | 78,311 | |
| Medtronic PLC | | | 884 | | | | 86,217 | |
| Merck & Co., Inc. | | | 1,194 | | | | 94,732 | |
| Novartis AG, Sponsored ADR | | | 1,005 | | | | 91,988 | |
| Pfizer, Inc. | | | 1,912 | | | | 88,392 | |
| Sanofi, Sponsored ADR | | | 1,964 | | | | 89,067 | |
| Teva Pharmaceutical Industries, Ltd., Sponsored ADR(a) | | | 3,469 | | | | 74,722 | |
| Thermo Fisher Scientific, Inc. | | | 351 | | | | 87,592 | |
| UnitedHealth Group, Inc. | | | 317 | | | | 89,191 | |
| Total Health Care | | | | | | | 2,841,247 | |
| | | | | | | | | |
| Industrials (10.89%) | | | | | | | | |
| 3M Co. | | | 390 | | | | 81,089 | |
| Alaska Air Group, Inc. | | | 1,202 | | | | 88,059 | |
| American Airlines Group, Inc. | | | 1,942 | | | | 77,991 | |
Workplace Equality Portfolio
| Schedule of Investments | November 30, 2018 |
| Security Description | | Shares | | | Value | |
| Industrials (continued) | | | | | | | | |
| Arconic, Inc. | | | 3,739 | | | $ | 80,314 | |
| Boeing Co. | | | 227 | | | | 78,715 | |
| Cummins, Inc. | | | 558 | | | | 84,292 | |
| Emerson Electric Co. | | | 1,083 | | | | 73,124 | |
| FedEx Corp. | | | 341 | | | | 78,089 | |
| Fortive Corp. | | | 970 | | | | 73,788 | |
| General Electric Co. | | | 7,007 | | | | 52,553 | |
| Harris Corp. | | | 514 | | | | 73,476 | |
| Herman Miller, Inc. | | | 2,164 | | | | 73,273 | |
| Huron Consulting Group, Inc.(a) | | | 1,702 | | | | 94,750 | |
| IHS Markit, Ltd.(a) | | | 1,555 | | | | 82,990 | |
| JetBlue Airways Corp.(a) | | | 4,239 | | | | 82,745 | |
| Lockheed Martin Corp. | | | 250 | | | | 75,108 | |
| ManpowerGroup, Inc. | | | 997 | | | | 80,936 | |
| Navigant Consulting, Inc. | | | 3,659 | | | | 93,744 | |
| Nielsen Holdings PLC | | | 3,099 | | | | 84,200 | |
| Norfolk Southern Corp. | | | 464 | | | | 79,223 | |
| Northrop Grumman Corp. | | | 275 | | | | 71,467 | |
| Owens Corning | | | 1,488 | | | | 77,599 | |
| Raytheon Co. | | | 424 | | | | 74,344 | |
| Republic Services, Inc. | | | 1,148 | | | | 88,786 | |
| Rockwell Automation, Inc. | | | 430 | | | | 74,966 | |
| Southwest Airlines Co. | | | 1,322 | | | | 72,194 | |
| Steelcase, Inc., Class A | | | 4,562 | | | | 73,904 | |
| United Continental Holdings, Inc.(a) | | | 939 | | | | 90,801 | |
| United Technologies Corp. | | | 815 | | | | 99,300 | |
| WW Grainger, Inc. | | | 237 | | | | 74,427 | |
| Total Industrials | | | | | | | 2,386,247 | |
| | | | | | | | | |
| Information Technology (12.35%) | | | | | | | | |
| Accenture PLC, Class A | | | 494 | | | | 81,273 | |
| Adobe, Inc.(a) | | | 327 | | | | 82,041 | |
| Alliance Data Systems Corp. | | | 340 | | | | 68,122 | |
| Apple, Inc. | | | 390 | | | | 69,646 | |
| Autodesk, Inc.(a) | | | 555 | | | | 80,198 | |
| Automatic Data Processing, Inc. | | | 561 | | | | 82,703 | |
| Booz Allen Hamilton Holding Corp. | | | 1,725 | | | | 88,510 | |
| Broadridge Financial Solutions, Inc. | | | 635 | | | | 67,228 | |
| CDW Corp. | | | 956 | | | | 88,602 | |
| Cisco Systems, Inc. | | | 1,770 | | | | 84,730 | |
| Corning, Inc. | | | 2,401 | | | | 77,360 | |
| Fidelity National Information Services, Inc. | | | 780 | | | | 84,201 | |
| Hewlett Packard Enterprise Co. | | | 4,948 | | | | 74,220 | |
| HP, Inc. | | | 3,266 | | | | 75,118 | |
| Intel Corp. | | | 1,856 | | | | 91,519 | |
| International Business Machines Corp. | | | 564 | | | | 70,088 | |
| Intuit, Inc. | | | 386 | | | | 82,809 | |
| Leidos Holdings, Inc. | | | 1,211 | | | | 76,293 | |
| Mastercard, Inc., Class A | | | 380 | | | | 76,407 | |
| Microsoft Corp. | | | 738 | | | | 81,837 | |
| Security Description | | Shares | | | Value | |
| Information Technology (continued) | | | | | | | | |
| NCR Corp.(a) | | | 2,935 | | | $ | 81,329 | |
| NetApp, Inc. | | | 990 | | | | 66,201 | |
| Nokia OYJ, Sponsored ADR | | | 15,399 | | | | 84,233 | |
| NVIDIA Corp. | | | 324 | | | | 52,951 | |
| Oracle Corp. | | | 1,691 | | | | 82,453 | |
| PayPal Holdings, Inc.(a) | | | 936 | | | | 80,318 | |
| QUALCOMM, Inc. | | | 1,143 | | | | 66,591 | |
| salesforce.com, Inc.(a) | | | 541 | | | | 77,233 | |
| Symantec Corp. | | | 4,094 | | | | 90,518 | |
| Tech Data Corp.(a) | | | 1,132 | | | | 101,823 | |
| Texas Instruments, Inc. | | | 787 | | | | 78,582 | |
| Visa, Inc., Class A | | | 562 | | | | 79,641 | |
| Workday, Inc., Class A(a) | | | 610 | | | | 100,040 | |
| Xerox Corp. | | | 3,085 | | | | 83,048 | |
| Total Information Technology | | | | | | | 2,707,866 | |
| | | | | | | | | |
| Materials (2.72%) | | | | | | | | |
| Alcoa Corp.(a) | | | 1,928 | | | | 61,329 | |
| Ball Corp. | | | 1,893 | | | | 92,965 | |
| Chemours Co. | | | 2,083 | | | | 59,324 | |
| DowDuPont, Inc. | | | 1,220 | | | | 70,577 | |
| Eastman Chemical Co. | | | 846 | | | | 66,682 | |
| Ecolab, Inc. | | | 530 | | | | 85,060 | |
| Linde PLC | | | 514 | | | | 81,752 | |
| PPG Industries, Inc. | | | 727 | | | | 79,483 | |
| Total Materials | | | | | | | 597,172 | |
| | | | | | | | | |
| Real Estate (2.15%) | | | | | | | | |
| CBRE Group, Inc., Class A(a) | | | 1,876 | | | | 81,943 | |
| DiamondRock Hospitality Co. | | | 7,309 | | | | 77,037 | |
| Iron Mountain, Inc. | | | 2,344 | | | | 79,626 | |
| Jones Lang LaSalle, Inc. | | | 589 | | | | 84,345 | |
| Park Hotels & Resorts, Inc. | | | 2,596 | | | | 80,009 | |
| Weyerhaeuser Co. | | | 2,575 | | | | 68,006 | |
| Total Real Estate | | | | | | | 470,966 | |
| | | | | | | | | |
| Utilities (3.93%) | | | | | | | | |
| American Electric Power Co., Inc. | | | 1,198 | | | | 93,132 | |
| Duke Energy Corp. | | | 1,075 | | | | 95,213 | |
| Entergy Corp. | | | 1,036 | | | | 90,194 | |
| Exelon Corp. | | | 1,967 | | | | 91,249 | |
| NiSource, Inc. | | | 3,397 | | | | 89,749 | |
| PG&E Corp.(a) | | | 1,824 | | | | 48,117 | |
| Portland General Electric Co. | | | 1,861 | | | | 89,607 | |
| PPL Corp. | | | 2,881 | | | | 88,130 | |
| Public Service Enterprise Group, Inc. | | | 1,640 | | | | 91,676 | |
| Sempra Energy | | | 732 | | | | 84,341 | |
| Total Utilities | | | | | | | 861,408 | |
| | | | | | | | | |
| TOTAL COMMON STOCKS | | | | | | | | |
| (Cost $19,226,441) | | | | | | | 21,748,477 | |
Workplace Equality Portfolio
| Schedule of Investments | November 30, 2018 |
| | | 7 Day Yield | | | Shares | | | Value | |
| SHORT TERM INVESTMENTS (2.31%) | | | | | | | | | | | | |
| Money Market Fund (0.63%) | | | | | | | | | | | | |
| State Street Institutional Treasury Plus Money Market Fund | | | | | | | | | | | | |
| (Cost $137,386) | | | 2.146 | % | | | 137,386 | | | $ | 137,386 | |
| | | | | | | | | | | | | |
| Investments Purchased with Collateral from Securities Loaned (1.68%) | | | | | | | | | | | | |
| State Street Navigator Securities Lending Government Money Market Portfolio, 2.24% | | | | | | | | | | | | |
| (Cost $368,556) | | | | | | | 368,556 | | | | 368,556 | |
| TOTAL SHORT TERM INVESTMENTS | | | | | | | | | | | | |
| (Cost $505,942) | | | | | | | | | | | 505,942 | |
| | | | | | | | | | | | | |
| TOTAL INVESTMENTS (101.52%) | | | | | | | | | | | | |
| (Cost $19,732,383) | | | | | | | | | | $ | 22,254,419 | |
| LIABILITIES IN EXCESS OF OTHER ASSETS (-1.52%) | | | | | | | | | | | (332,768 | ) |
| NET ASSETS - 100.00% | | | | | | | | | | $ | 21,921,651 | |
| (a) | Non-income producing security. |
| (b) | Security, or a portion of the security position is currently on loan. The total market value of securities on loan is $430,500. |
See Notes to Financial Statements.
Workplace Equality Portfolio
| Statement of Assets and Liabilities | November 30, 2018 |
| ASSETS: | | | |
| Investments, at value | | $ | 22,254,419 | |
| Foreign tax reclaims | | | 330 | |
| Dividends receivable | | | 48,799 | |
| Total Assets | | | 22,303,548 | |
| | | | | |
| LIABILITIES: | | | | |
| Payable to adviser | | | 13,341 | |
| Payable for collateral upon return of securities loaned | | | 368,556 | |
| Total Liabilities | | | 381,897 | |
| NET ASSETS | | $ | 21,921,651 | |
| | | | | |
| NET ASSETS CONSIST OF: | | | | |
| Paid-in capital | | $ | 19,137,735 | |
| Total distributable earnings | | | 2,783,916 | |
| NET ASSETS | | $ | 21,921,651 | |
| | | | | |
| INVESTMENTS, AT COST | | $ | 19,732,383 | |
| | | | | |
| PRICING OF SHARES | | | | |
| Net Assets | | $ | 21,921,651 | |
| Shares of beneficial interest outstanding (Unlimited number of shares authorized, par value $0.01 per share) | | | 600,000 | |
| Net Asset Value, offering and redemption price per share | | $ | 36.54 | |
See Notes to Financial Statements.
Workplace Equality Portfolio
| Statement of Operations | For the Year Ended November 30, 2018 |
| INVESTMENT INCOME: | | | |
| Dividends(a) | | $ | 452,823 | |
| Securities lending income | | | 8,507 | |
| Total Investment Income | | | 461,330 | |
| | | | | |
| EXPENSES: | | | | |
| Investment adviser fees | | | 157,736 | |
| NET INVESTMENT INCOME | | | 303,594 | |
| | | | | |
| REALIZED AND UNREALIZED GAIN/(LOSS) | | | | |
| Net realized gain on investments | | | 963,109 | |
| Net realized loss on foreign currency transactions | | | (80 | ) |
| Total Net realized gain | | | 963,029 | |
| Net change in unrealized depreciation on investments | | | (903,209 | ) |
| Net change in unrealized appreciation on translation of assets and liabilities denominated in foreign currencies | | | 4 | |
| Total net change in unrealized depreciation | | | (903,205 | ) |
| NET REALIZED AND UNREALIZED GAIN ON INVESTMENTS | | | 59,824 | |
| NET INCREASE IN NET ASSETS RESULTING FROM OPERATIONS | | $ | 363,418 | |
| (a) | Net of foreign tax withholding of $5,850. |
See Notes to Financial Statements.
Workplace Equality Portfolio
Statements of Changes in Net Assets
| | | For the
Year Ended
November 30, 2018 | | | For the
Year Ended
November 30, 2017 | |
| OPERATIONS: | | | | | | |
| Net investment income | | $ | 303,594 | | | $ | 201,164 | |
| Net realized gain | | | 963,029 | | | | 572,823 | |
| Net change in unrealized appreciation/depreciation | | | (903,205 | ) | | | 2,027,738 | |
| Net increase in net assets resulting from operations | | | 363,418 | | | | 2,801,725 | |
| | | | | | | | | |
| DISTRIBUTIONS TO SHAREHOLDERS: | | | | | | | | |
| From distributable earnings | | | (212,000 | ) | | | (183,001 | )(a) |
| Total distributions | | | (212,000 | ) | | | (183,001 | ) |
| | | | | | | | | |
| CAPITAL SHARE TRANSACTIONS: | | | | | | | | |
| Proceeds from sale of shares | | | 7,460,781 | | | | 4,813,655 | |
| Cost of shares redeemed | | | (3,692,322 | ) | | | (1,553,228 | ) |
| Net increase from capital share transactions | | | 3,768,459 | | | | 3,260,427 | |
| Net increase in net assets | | | 3,919,877 | | | | 5,879,151 | |
| | | | | | | | | |
| NET ASSETS: | | | | | | | | |
| Beginning of year | | | 18,001,774 | | | | 12,122,623 | |
| End of year | | $ | 21,921,651 | | | $ | 18,001,774 | (b) |
| | | | | | | | | |
| OTHER INFORMATION: | | | | | | | | |
| CAPITAL SHARE TRANSACTIONS: | | | | | | | | |
| Beginning shares | | | 500,000 | | | | 400,000 | |
| Shares sold | | | 200,000 | | | | 150,000 | |
| Shares redeemed | | | (100,000 | ) | | | (50,000 | ) |
| Shares outstanding, end of period | | | 600,000 | | | | 500,000 | |
| (a) | For the year ended November 30, 2017, total distributions from distributable earnings consisted of distributions from net investment income of $183,001. |
| (b) | For the year ended November 30, 2017, net assets included accumulated net investment loss of $184,792. |
See Notes to Financial Statements.
Workplace Equality Portfolio
| Financial Highlights | For a Share Outstanding Throughout the Periods Presented |
| | | For the Year Ended November 30, 2018 | | | For the Year Ended November 30, 2017 | | | For the Year Ended November 30, 2016 | | | For the Year Ended November 30, 2015 | | | For the Period February 25, 2014 (Commencement of Operations) to November 30, 2014 | |
| NET ASSET VALUE, BEGINNING OF PERIOD | | $ | 36.00 | | | $ | 30.31 | | | $ | 27.69 | | | $ | 27.92 | | | $ | 25.00 | |
| | | | | | | | | | | | | | | | | | | | | |
| INCOME FROM OPERATIONS: | | | | | | | | | | | | | | | | | | | | |
| Net investment income(a) | | | 0.53 | | | | 0.45 | | | | 0.46 | | | | 0.36 | | | | 0.28 | |
| Net realized and unrealized gain/(loss) | | | 0.43 | | | | 5.70 | | | | 2.55 | | | | (0.20 | ) | | | 2.64 | |
| Total from investment operations | | | 0.96 | | | | 6.15 | | | | 3.01 | | | | 0.16 | | | | 2.92 | |
| | | | | | | | | | | | | | | | | | | | | |
| DISTRIBUTIONS: | | | | | | | | | | | | | | | | | | | | |
| From net investment income | | | (0.42 | ) | | | (0.46 | ) | | | (0.39 | ) | | | (0.39 | ) | | | – | |
| Total distributions | | | (0.42 | ) | | | (0.46 | ) | | | (0.39 | ) | | | (0.39 | ) | | | – | |
| | | | | | | | | | | | | | | | | | | | | |
| NET INCREASE/(DECREASE) IN NET ASSET VALUE | | | 0.54 | | | | 5.69 | | | | 2.62 | | | | (0.23 | ) | | | 2.92 | |
| NET ASSET VALUE, END OF PERIOD | | $ | 36.54 | | | $ | 36.00 | | | $ | 30.31 | | | $ | 27.69 | | | $ | 27.92 | |
| TOTAL RETURN(b) | | | 2.69 | % | | | 20.56 | % | | | 11.04 | % | | | 0.59 | % | | | 11.68 | % |
| | | | | | | | | | | | | | | | | | | | | |
| RATIOS/SUPPLEMENTAL DATA: | | | | | | | | | | | | | | | | | | | | |
| Net assets, end of period (in 000s) | | $ | 21,922 | | | $ | 18,002 | | | $ | 12,123 | | | $ | 9,691 | | | $ | 6,979 | |
| | | | | | | | | | | | | | | | | | | | | |
| RATIOS TO AVERAGE NET ASSETS | | | | | | | | | | | | | | | | | | | | |
| Ratio of expenses to average net assets | | | 0.75 | % | | | 0.75 | % | | | 0.75 | % | | | 0.75 | % | | | 0.75 | %(c) |
| Ratio of net investment income to average net assets | | | 1.44 | % | | | 1.38 | % | | | 1.69 | % | | | 1.31 | % | | | 1.42 | %(c) |
| Portfolio turnover rate(d) | | | 31 | % | | | 22 | % | | | 34 | % | | | 26 | % | | | 8 | % |
| (a) | Based on average shares outstanding during the period. |
| (b) | Total return is calculated assuming an initial investment made at the net asset value at the beginning of the period and redemption at the net asset value on the last day of the period and assuming all distributions are reinvested at the reinvestment prices. Total return calcualted for a period of less than one year is not annualized. |
| (c) | Portfolio turnover for periods less than one year are not annualized and does not include securities received or delivered from processing creations or redemptions in-kind. |
See Notes to Financial Statements.
Workplace Equality Portfolio
| Notes to Financial Statements | November 30, 2018 |
1. ORGANIZATION
ALPS ETF Trust (the “Trust”), a Delaware statutory trust, is an open-end management investment company registered under the Investment Company Act of 1940, as amended (the “1940 Act”). As of November 30, 2018, the Trust consisted of twenty separate portfolios. Each portfolio represents a separate series of the Trust. This report pertains solely to the Workplace Equality Portfolio (the “Fund”). The investment objective of the Fund is to seek investment results that correspond generally, before fees and expenses, to the price and yield of the Workplace Equality IndexTM. The investment advisor uses a “passive” or indexing approach to try to achieve the Fund’s investment objective. The Fund has elected to qualify as a diversified series of the Trust under the 1940 Act.
The Fund’s Shares (“Shares”) are listed on the NYSE Arca, Inc. The Fund issues and redeems Shares at net asset value (“NAV”) in blocks of 50,000 Shares, each of which is called a “Creation Unit”. Creation Units are issued and redeemed principally in-kind for securities included in the Underlying Index. Except when aggregated in Creation Units, Shares are not redeemable securities of the Fund.
Pursuant to the Trust’s organizational documents, its Officers and Trustees are indemnified against certain liability arising out of the performance of their duties to the Trust. Additionally, in the normal course of business, the Trust enters into contracts with service providers that contain general indemnification clauses. The Trust’s maximum exposure under these arrangements is unknown, as this would involve future claims that may be made against the Trust that have not yet occurred.
2. SIGNIFICANT ACCOUNTING POLICIES
The following is a summary of significant accounting policies consistently followed by the Fund in the preparation of the financial statements. The accompanying financial statements were prepared in accordance with accounting principles generally accepted in the United States of America (“U.S. GAAP”). The preparation of financial statements in conformity with U.S. GAAP requires management to make certain estimates and assumptions that affect the reported amounts of assets and liabilities and disclosures of contingent assets and liabilities at the date of the financial statements and the reported amounts of revenue and expenses during the period. Actual results could differ from those estimates. The Fund is considered an investment company under U.S. GAAP and follows the accounting and reporting guidance applicable to investment companies in the Financial Accounting Standards BoardAccounting Standards Codification Topic 946.
A. Portfolio Valuation
The Fund’s NAV is determined daily, as of the close of regular trading on the New York Stock Exchange (the “NYSE”), normally 4:00 p.m. Eastern time, on each day the NYSE is open for trading. The NAV is computed by dividing the value of all assets of the Fund (including accrued interest and dividends), less all liabilities (including accrued expenses and dividends declared but unpaid), by the total number of shares outstanding.
Portfolio securities listed on any exchange other than the NASDAQ Stock Market LLC (“NASDAQ”) are valued at the last sale price on the business day as of which such value is being determined. If there has been no sale on such day, the securities are valued at the mean of the most recent bid and ask prices on such day. Securities traded on the NASDAQ are valued at the NASDAQ Official Closing Price as determined by NASDAQ. Portfolio securities traded on more than one securities exchange are valued at the last sale price on the business day as of which such value is being determined at the close of the exchange representing the principal market for such securities. Portfolio securities traded in the over-the-counter market, but excluding securities traded on the NASDAQ, are valued at the latest quoted sale price in such market.
The Fund’s investments are valued at market value or, in the absence of market value with respect to any portfolio securities, at fair value according to procedures adopted by the Trust’s Board of Trustees (the “Board”). When market quotations are not readily available or when events occur that make established valuation methods unreliable, securities of the Fund may be valued in good faith by or under the direction of the Board. These securities generally include, but are not limited to, restricted securities (securities which may not be publicly sold without registration under the Securities Act of 1933) for which a pricing service is unable to provide a market price; securities whose trading has been formally suspended; a security whose market price is not available from a pre-established primary pricing source or the pricing source is not willing to provide a price; a security with respect to which an event has occurred that is most likely to materially affect the value of the security after the market has closed but before the calculation of the Fund’s NAV or make it difficult or impossible to obtain a reliable market quotation; or a security whose price, as provided by the pricing service, does not reflect the security’s “fair value” due to the security being de-listed from a national exchange or the security’s primary trading market is temporarily closed at a time when, under normal conditions, it would be open. As a general principle, the current “fair value” of a security would be the amount which the owner might reasonably expect to receive from the sale on the applicable exchange or principal market. A variety of factors may be considered in determining the fair value of such securities.
Workplace Equality Portfolio
| Notes to Financial Statements | November 30, 2018 |
B. Fair Value Measurements
The Fund discloses the classification of its fair value measurements following a three-tier hierarchy based on the inputs used to measure fair value. Inputs refer broadly to the assumptions that market participants would use in pricing the asset or liability; including assumptions about risk. Inputs may be observable or unobservable. Observable inputs reflect the assumptions market participants would use in pricing the asset or liability that are developed based on market data obtained from sources independent of the reporting entity. Unobservable inputs reflect the reporting entity’s own assumptions about the assumptions market participants would use in pricing the asset or liability that are developed based on the best information available.
Valuation techniques used to value the Fund's investments by major category are as follows:
Equity securities, including restricted securities, for which market quotations are readily available, are valued at the last reported sale price or official closing price as reported by a third party pricing vendor on the primary market or exchange on which they are traded and are categorized as Level 1 in the hierarchy. In the event there were no sales during the day or closing prices are not available, securities are valued at the mean of the most recent quoted bid and ask prices on such day and are generally categorized as Level 2 in the hierarchy. Investments in open-end mutual funds are valued at their closing NAV each business day and are categorized as Level 1 in the hierarchy.
Changes in valuation techniques may result in transfers in or out of an assigned level within the disclosure hierarchy.
Various inputs are used in determining the value of the Fund’s investments as of the end of the reporting period. When inputs used fall into different levels of the fair value hierarchy, the level in the hierarchy within which the fair value measurement falls is determined based on the lowest level input that is significant to the fair value measurement in its entirety. The designated input levels are not necessarily an indication of the risk or liquidity associated with these investments.
These inputs are categorized in the following hierarchy under applicable financial accounting standards:
| Level 1 – | Unadjusted quoted prices in active markets for identical investments, unrestricted assets or liabilities that a Fund has the ability to access at the measurement date; |
| Level 2 – | Quoted prices which are not active, quoted prices for similar assets or liabilities in active markets or inputs other than quoted prices that are observable (either directly or indirectly) for substantially the full term of the asset or liability; and |
| Level 3 – | Significant unobservable prices or inputs (including the Fund’s own assumptions in determining the fair value of investments) where there is little or no market activity for the asset or liability at the measurement date. |
The following is a summary of the inputs used to value the Fund’s investments as of November 30, 2018:
WORKPLACE EQUALITY PORTFOLIO
| Investments in Securities at Value* | | Level 1 - Quoted and Unadjusted Prices | | | Level 2 - Other Significant Observable Inputs | | | Level 3 - Significant Unobservable Inputs | | | Total | |
| Common Stocks | | $ | 21,748,477 | | | $ | – | | | $ | – | | | $ | 21,748,477 | |
| Short Term Investments | | | | | | | | | | | | | | | | |
| Money Market Fund | | | 137,386 | | | | – | | | | – | | | | 137,386 | |
| Investments Purchased with Collateral from Securities Loaned | | | 368,556 | | | | – | | | | – | | | | 368,556 | |
| Total | | $ | 22,254,419 | | | $ | – | | | $ | – | | | $ | 22,254,419 | |
The Fund did not have any securities that used significant unobservable inputs (Level 3) in determining fair value, and there were no transfers into or out of Level 3.
C. Securities Transactions and Investment Income
Securities transactions are recorded as of the trade date. Realized gains and losses from securities transactions are recorded on the highest cost basis. Dividend income and capital gains distributions, if any, are recorded on the ex-dividend date. Interest income, if any, is recorded on the accrual basis.
D. Dividends and Distributions to Shareholders
Dividends from net investment income of the Fund, if any, are declared and paid annually or as the Board may determine from time to time. Distributions of net realized capital gains earned by the Fund, if any, are distributed at least annually.
Workplace Equality Portfolio
| Notes to Financial Statements | November 30, 2018 |
E. Federal Tax and Tax Basis Information
The timing and character of income and capital gain distributions are determined in accordance with income tax regulations, which may differ from U.S. GAAP. Reclassifications are made to the Fund’s capital accounts for permanent tax differences to reflect income and gains available for distribution (or available capital loss carryforwards) under income tax regulations.
For the year ended November 30, 2018, the following reclassifications, which had no impact on results of operations or net assets, were recorded to reflect permanent tax differences resulting primarily from in-kind transactions:
| Fund | | Paid-in Capital | | | Distributable Earnings | |
| Workplace Equality Portfolio | | $ | 861,714 | | | $ | (861,714 | ) |
Capital loss carryovers used during the period ended November 30, 2018 were $66,201.
The tax character of the distributions paid during the fiscal year ended November 30, 2018 and November 30, 2017 were as follows:
| | | Ordinary Income | |
| November 30, 2018 | | | |
| Workplace Equality Portfolio | | $ | 212,000 | |
| November 30, 2017 | | | | |
| Workplace Equality Portfolio | | $ | 183,001 | |
As of November 30, 2018, the components of distributable earnings on a tax basis for the Fund were as follows:
| | | Workplace Equality Portfolio | |
| Undistributed net investment income | | $ | 300,520 | |
| Net unrealized appreciation on investments | | | 2,483,396 | |
| Total | | $ | 2,783,916 | |
As of November 30, 2018, the cost of investments for federal income tax purposes and accumulated net unrealized appreciation/(depreciation) on investments were as follows:
| | | | Workplace Equality Portfolio | |
| Gross appreciation (excess of value over tax cost) | | $ | 3,693,709 | |
| Gross depreciation (excess of tax cost over value) | | | (1,210,313 | ) |
| Net unrealized appreciation (depreciation) | | $ | 2,483,396 | |
| Cost of investments for income tax purposes | | $ | 19,771,023 | |
The differences between book-basis and tax-basis are primarily due to the deferral of losses from wash sales.
F. Income Taxes
No provision for income taxes is included in the accompanying financial statements, as the Fund intends to distribute to shareholders all taxable investment income and realized gains and otherwise comply with Subchapter M of the Internal Revenue Code of 1986, as amended, applicable to regulated investment companies. The Fund evaluates tax positions taken (or expected to be taken) in the course of preparing the Fund’s tax returns to determine whether these positions meet a “more-likely-than-not” standard that, based on the technical merits, have a more than fifty percent likelihood of being sustained by a taxing authority upon examination. A tax position that meets the “more-likely-than-not” recognition threshold is measured to determine the amount of benefit to recognize in the financial statements.
As of and during the year ended November 30, 2018, the Fund did not have a liability for any unrecognized tax benefits. The Fund files U.S. federal, state, and local tax returns as required. The Fund’s tax returns are subject to examination by the relevant tax authorities until expiration of the applicable statute of limitations, which is generally three years after the filing of the tax return, but may extend to four years in certain jurisdictions. Tax returns for open years have incorporated no uncertain tax positions that require a provision for income taxes.
Workplace Equality Portfolio
| Notes to Financial Statements | November 30, 2018 |
G. Lending of Portfolio Securities
The Fund has entered into a securities lending agreement with State Street Bank & Trust Co. (“SSB”), the Fund’s lending agent. The Fund may lend its portfolio securities only to borrowers that are approved by SSB. The Fund will limit such lending to not more than 33 1/3% of the value of its total assets. The Fund’s securities held at SSB as custodian shall be available to be lent except those securities the Fund or ALPS Advisors, Inc. specifically identifies in writing as not being available for lending. The borrower pledges and maintains with the Fund collateral consisting of cash (U.S. Dollars only), securities issued or guaranteed by the U.S. government or its agencies or instrumentalities, and cash equivalents (including irrevocable bank letters of credit) issued by a person other than the borrower or an affiliate of the borrower. The initial collateral received by the Fund is required to have a value of no less than 102% of the market value of the loaned securities for U.S equity securities and a value of no less than 105% of the market value for non-U.S. equity securities. The collateral is maintained thereafter, at a market value equal to not less than 102% of the current value of the U.S. equity securities on loan and not less than 105% of the current value of the non-U.S. equity securities on loan. The market value of the loaned securities is determined at the close of each business day and any additional required collateral is delivered to the Fund on the next business day. During the term of the loan, the Fund is entitled to all distributions made on or in respect of the loaned securities. Loans of securities are terminable at any time and the borrower, after notice, is required to return borrowed securities within the customary time period for settlement of securities transactions.
Any cash collateral received is reinvested in a money market fund managed by SSB as disclosed in the Fund’s Schedule of Investments and is reflected in the Statements of Assets and Liabilities as a payable for collateral upon return of securities loaned. Non-cash collateral, in the form of securities issued or guaranteed by the U.S. government or its agencies or instrumentalities, is not disclosed in the Fund’s Statements of Assets and Liabilities as it is held by the lending agent on behalf of the Fund, and the Fund does not have the ability to re-hypothecate these securities. Income earned by the Fund from securities lending activity is disclosed in the Statement of Operations.
The following is a summary of the Fund's securities lending agreement and related cash and non-cash collateral received as of November 30, 2018:
| | | Market Value of
Securities on Loan | | | Cash Collateral
Received | | | Non-Cash
Collateral Received | | | Total Collateral
Received | |
| Workplace Equality Portfolio | | $ | 430,500 | | | $ | 368,556 | | | $ | 80,414 | | | $ | 448,970 | |
The risks of securities lending include the risk that the borrower may not provide additional collateral when required or may not return the securities when due. To mitigate these risks, the Fund benefits from a borrower default indemnity provided by SSB. SSB’s indemnity allows for full replacement of securities lent wherein SSB will purchase the unreturned loaned securities on the open market by applying the proceeds of the collateral, or to the extent such proceeds are insufficient or the collateral is unavailable, SSB will purchase the unreturned loan securities at SSB’s expense. However, the Fund could suffer a loss if the value of the investments purchased with cash collateral falls below the value of the cash collateral received.
The following table reflects a breakdown of transactions accounted for as secured borrowings, the gross obligation by the type of collateral pledged or securities loaned, and the remaining contractual maturity of those transactions as of November 30, 2018:
| Workplace Equality Portfolio | | Remaining contractual maturity of the agreements | |
| | | | |
| Securities Lending Transactions | | Overnight &
Continuous | | | Up to 30 days | | 30-90 days | | | Greater than 90 days | | | Total | |
| Common Stocks | | $ | 368,556 | | $ | – | | $ | – | | | $ | – | | | $ | 368,556 | |
| Total Borrowings | | | | | | | | | | | | | | | | | 368,556 | |
| Gross amount of recognized liabilities for securities lending (collateral received) | | | | | | | | | $ | 368,556 | |
3. INVESTMENT ADVISORY FEE AND OTHER AFFILIATED TRANSACTIONS
ALPS Advisors, Inc. (“Adviser”) serves as the Fund’s investment adviser pursuant to an Investment Advisory Agreement with the Fund. As compensation for its services to the Fund, the Adviser receives an annual unitary fee of 0.75% based on the Fund’s average daily net assets payable monthly. The Adviser served under the previous investment advisory agreement, since the commencement of the Fund until these agreements were terminated on April 16, 2018, due to a change of control of the Adviser’s parent company. Beginning April 16, 2018, the Adviser served under an interim investment advisory agreement, until the current investment advisory agreement was approved by the Fund’s shareholders.
Workplace Equality Portfolio
| Notes to Financial Statements | November 30, 2018 |
Out of the unitary management fee, the Adviser pays substantially all expenses of the Fund, including the licensing fees to the Index provider, the cost of transfer agency, custody, fund administration, legal, audit, independent trustees and other services, except for interest expenses, distribution fees or expenses, brokerage expenses, taxes and extraordinary expenses not incurred in the ordinary course of the Fund’s business. The Adviser’s unitary management fee is designed to pay substantially all the Fund’s expenses and to compensate the Adviser for providing services for the Fund.
ALPS Fund Services, Inc., an affiliate of the Adviser, is the administrator of the Fund.
Each Trustee who is not an officer or employee of the Adviser, any sub-adviser or any of their affiliates (“Independent Trustees”) receives (1) a quarterly retainer of $5,000, (2) a per meeting fee for regularly scheduled meetings of $3,750, (3) $1,500 for any special meeting held outside of a regularly scheduled board meeting, and (4) reimbursement for all reasonable out-of-pocket expenses relating to attendance at meetings. In addition, both the Chairman of the Board and Chairman of the Audit Committee each receives a quarterly retainer of $2,000, in connection with their respective roles.
4. PURCHASES AND SALES OF SECURITIES
For the year ended November 30, 2018, the cost of purchases and proceeds from sales of investment securities, excluding in-kind transactions and short-term investments, were as follows:
| Fund | | Purchases | | | Sales | |
| Workplace Equality Portfolio | | $ | 6,365,182 | | | $ | 7,705,745 | |
For the year ended November 30, 2018, the cost of in-kind purchases and proceeds from in-kind sales were as follows:
| Fund | | Purchases | | | Sales | |
| Workplace Equality Portfolio | | $ | 7,456,738 | | | $ | 2,367,615 | |
For the year ended November 30, 2018, the Workplace Equality Portfolio had in-kind net realized gain of $872,050.
Gains on in-kind transactions are not considered taxable for federal income tax purposes and losses on in kind transactions are also not deductible for tax purposes.
5. CAPITAL SHARE TRANSACTIONS
Shares are created and redeemed by the Fund only in Creation Unit size aggregations of 50,000 Shares. Only broker-dealers or large institutional investors with creation and redemption agreements called Authorized Participants (“AP”) are permitted to purchase or redeem Creation Units from the Fund. Such transactions are generally permitted on an in-kind basis, with a balancing cash component to equate the transaction to the NAV per unit of the Fund on the transaction date. Cash may be substituted equivalent to the value of certain securities generally when they are not available in sufficient quantity for delivery, not eligible for trading by the AP or as a result of other market circumstances.
6. RELATED PARTY TRANSACTIONS
The Fund engaged in cross trades between other funds in the Trust during the year ended November 30, 2018 pursuant to Rule 17a-7 under the 1940 Act. Cross trading is the buying or selling of portfolio securities between funds to which the Adviser serves as the investment adviser. The Board previously adopted procedures that apply to transactions between the Funds of the Trust pursuant to Rule 17a-7. These transactions related to cross trades during the period complied with the requirements set forth by Rule 17a-7 and the Trust’s procedures.
Transactions related to cross trades during the year ended November 30, 2018, were as follows:
| Fund | | Purchase cost paid | | | Sale proceeds received | | | Realized gain/(loss) on sales | |
| Workplace Equality Portfolio | | $ | 78,437 | | | $ | – | | | $ | – | |
Workplace Equality Portfolio
| Notes to Financial Statements | November 30, 2018 |
7. NEW ACCOUNTING PRONOUNCEMENTS
In August 2018, the Financial Accounting Standards Board (“FASB”) issued Accounting Standards Update (“ASU”) 2018-13, which changes the fair value measurement disclosure requirements of FASB ASC Topic 820, Fair Value Measurement. The update to Topic 820 includes new, eliminated, and modified disclosure requirements. ASU 2018-13 is effective for fiscal years beginning after December 15, 2019, including interim periods. Early adoption is permitted for any eliminated or modified disclosures. The Funds have elected to early adopt the eliminated and modified disclosures effective with the financial statements prepared as of November 30, 2018.
8. SEC REGULATIONS
On October 4, 2018, the SEC amended Regulation S-X to require certain financial statement disclosure requirements to conform them to GAAP for investment companies. Effective November 4, 2018, the Fund adopted disclosure requirement changes for Regulation S-X, these changes are reflected throughout this report. The Fund’s adoption of the amendments, effective with the financial statements prepared as of November 30, 2018, had no effect on the Fund’s net assets or results of operations.
Workplace Equality Portfolio
| Additional Information | November 30, 2018 (Unaudited) |
PROXY VOTING RECORDS, POLICIES AND PROCEDURES
Information regarding how the Fund voted proxies relating to portfolio securities during the most recent 12-month period ended June 30 and a description of the Fund’s proxy voting policies and procedures used in determining how to vote for proxies are available without charge on the SEC’s website at www.sec.gov and upon request, by calling (toll-free) 1-866-675-2639.
PORTFOLIO HOLDINGS
The Trust is required to disclose, after its first and third fiscal quarters, the complete schedule of the Fund’s portfolio holdings with the SEC on Form N-Q. Forms N-Q for the Fund are available on the SEC’s website at www.sec.gov. The Fund’s Forms N-Q may also be reviewed and copied at the SEC’s Public Reference Room in Washington, D.C. and information on the operation of the Public Reference Room may be obtained by calling 1-800-SEC-0330. The Fund’s Forms N-Q are available without charge, upon request, by calling (toll-free) 1-866-675-2639 or by writing to ALPS ETF Trust at 1290 Broadway, Suite 1100, Denver, Colorado 80203.
TAX INFORMATION
The Fund designates the following for federal income tax purposes for distributions made during the calendar year ended December 31, 2017:
| | Qualified Dividend Income | Dividend Received Deduction |
| Workplace Equality Portfolio | 100.00% | 100.00% |
In early 2018, if applicable, shareholders of record received this information for the distribution paid to them by the Fund during the calendar year 2017 via Form 1099. The Fund will notify shareholders in early 2019 of amounts paid to them by the Fund, if any, during the calendar year 2018.
LICENSING AGREEMENT
Segall Bryant & Hamill, LLC ("SBH") has entered into an index licensing agreement with ALPS Advisors Inc. (the “Adviser”) to allow the Adviser’s use of the Workplace Equality Index™, the underlying index of the Workplace Equality Portfolio (the “Fund”). The following disclosure relates to such licensing agreement:
SBH is the designer of the construction and methodology for the Index. “SBH” and “Workplace Equality Index™” are service marks or trademarks of SBH. SBH acts as brand licensor for the Index. SBH is not responsible for the descriptions of the Index or the Fund that appear herein. SBH is not affiliated with the Trust, the Adviser or the Distributor.
The Fund is not sponsored, endorsed or promoted by SBH. SBH makes no representation or warranty, express or implied, to the owners of the Fund or any member of the public regarding the advisability of investing in securities or commodities generally or in the Fund particularly and does not guarantee the quality, accuracy or completeness of the Index or any Index data included herein or derived there from and assume no liability in connection with their use. The Index is determined and composed without regard to the Adviser or the Fund. SBH has no obligation to take the needs of the Adviser, the Fund or the shareholders of the Fund into consideration in connection with the foregoing. SBH is not responsible for and has not participated in the determination of pricing or the timing of the issuance or sale of the Shares of the Fund or in the determination or calculation of the NAV of the Fund. SBH has no obligation or liability in connection with the administration or trading of the Fund.
SBH does not guarantee the accuracy and/or completeness of the Index or any data included therein, and SBH shall have no liability for any errors, omissions, or interruptions therein. SBH makes no warranty, express or implied, as to results to be obtained by the Adviser, the Fund, Fund shareholders or any other person or entity from the use of the Index or any data included therein. SBH makes no express or implied warranties, and expressly disclaims all warranties of merchantability or fitness for a particular purpose or use with respect to the Index or any data included therein. Without limiting any of the foregoing, in no event shall SBH have any liability for any special, punitive, indirect, or consequential damages (including lost profits) arising out of matters relating to the use of the Index, even if notified of the possibility of such damages.
The Adviser does not guarantee the accuracy and/or the completeness of the Index or any data included therein, and the Adviser shall have no liability for any errors, omissions or interruptions therein. The Adviser makes no warranty, express or implied, as to results to be obtained by the Fund, owners of the Shares of the Fund or any other person or entity from the use of the Index or any data included therein. The Adviser makes no express or implied warranties, and expressly disclaims all warranties of merchantability or fitness for a particular purpose or use with respect to the Index or any data included therein. Without limiting any of the foregoing, in no event shall the Adviser have any liability for any special, punitive, direct, indirect, or consequential damages (including lost profits) arising out of matters relating to the use of the Index, even if notified of the possibility of such damages.
Workplace Equality Portfolio
| Trustees & Officers | November 30, 2018 (Unaudited) |
The general supervision of the duties performed by the Adviser for the Fund under the Investment Advisory Agreement is the responsibility of the Board of Trustees. The Trust currently has four Trustees. Three Trustees have no affiliation or business connection with the Adviser or any of its affiliated persons and do not own any stock or other securities issued by the Adviser. These are the “non-interested” or “independent” Trustees (“Independent Trustees”). The other Trustee (the “Interested Trustee”) is affiliated with the Adviser.
The Independent Trustees of the Trust, their term of office and length of time served, their principal business occupations during the past five years, the number of portfolios in the Fund Complex overseen by each Independent Trustee, and other directorships, if any, held by the Trustee are shown below.
INDEPENDENT TRUSTEES |
Name, Address & Year of Birth* | Position(s) Held with Trust | Term of Office and Length of Time Served** | Principal Occupation(s) During Past 5 Years | Number of Portfolios in Fund Complex Overseen by Trustees*** | Other Directorships Held by Trustees |
Mary K. Anstine, 1940 | Trustee | Since March 2008 | Ms. Anstine was President/Chief Executive Officer of HealthONE Alliance, Denver, Colorado, and former Executive Vice President of First Interstate Bank of Denver. Ms. Anstine is also Trustee/Director of AV Hunter Trust and Colorado Uplift Board. Ms. Anstine was formerly a Director of the Trust Bank of Colorado (later purchased and now known as Northern Trust Bank), HealthONE and Denver Area Council of the Boy Scouts of America and a member of the American Bankers Association Trust Executive Committee. | 41 | Ms. Anstine is a Trustee of ALPS Variable Investment Trust (9 funds); Financial Investors Trust (33 funds); Reaves Utility Income Fund (1 fund); and Segall Bryant & Hamill Trust (14 funds). |
Jeremy W. Deems, 1976 | Trustee | Since March 2008 | Mr. Deems is the Co-Founder, Chief Compliance Officer and Chief Financial Officer of Green Alpha Advisors, LLC. Mr. Deems is Co-Portfolio Manager of the Shelton Green Alpha Fund. Prior to joining Green Alpha Advisors, Mr. Deems was CFO and Treasurer of Forward Management, LLC, ReFlow Management Co., LLC, ReFlow Fund, LLC, a private investment fund, and Sutton Place Management, LLC, an administrative services company. | 41 | Mr. Deems is a Trustee of ALPS Variable Investment Trust (9 funds); Financial Investors Trust (33 funds); and Reaves Utility Income Fund (1 fund); and Clough Funds Trust (1 fund). |
Rick A. Pederson, 1952 | Trustee and Chairman | Since March 2008. Has served as Chairman since July 2017. | Mr. Pederson is Partner, Bow River Capital Partners (private equity management), 2003 - present; Board Member, Prosci Inc. (private business services) 2013-2016; Board Member, Citywide Banks (Colorado community bank) 2014-present; Board Member, Strong-Bridge Consulting (management consulting) 2015-present; Board Member, IRI/ODMS Holdings LLC, 2017 – present; Director, National Western Stock Show (not-for-profit organization) 2010 – present; Board Member, History Colorado, 2015 – present; Trustee, Boettcher Foundation, 2018. | 21 | Mr. Pederson is Trustee of Segall Bryant & Hamill Trust (14 funds) and Principal Real Estate Income Fund (1 fund) |
| * | The business address of the Trustee is c/o ALPS Advisors, Inc., 1290 Broadway, Suite 1100, Denver, Colorado 80203. |
| ** | This is the period for which the Trustee began serving the Trust. Each Trustee serves an indefinite term, until his successor is elected. |
| *** | The Fund Complex includes all series of the Trust and any other investment companies for which ALPS Advisors, Inc. provides investment advisory services. |
Workplace Equality Portfolio
| Trustees & Officers | November 30, 2018 (Unaudited) |
The Trustee who is affiliated with the Adviser or affiliates of the Adviser and executive officers of the Trust, his term of office and length of time served, his principal business occupations during the past five years, the number of portfolios in the Fund Complex overseen by the Interested Trustee and the other directorships, if any, held by the Trustee, are shown below.
| INTERESTED TRUSTEE |
Name, Address and Year of Birth of Interested Trustee* | Position(s) Held with Trust | Term of Office and Length of Time Served** | Principal Occupation(s) During Past 5 Years | Number of Portfolios in Fund Complex Overseen by Trustees*** | Other Directorships Held by Trustee |
Edmund J. Burke, 1961 | Trustee and President | Since December 2017 | Mr. Burke is President and a Director of ALPS Holdings, Inc. (“AHI”) (since 2005) and Director of Boston Financial Data Services, Inc. (“BFDS”), ALPS Advisors, Inc. (“AAI”), ALPS Distributors, Inc. (“ADI”), ALPS Fund Services, Inc. (“AFS”) and ALPS Portfolio Solutions Distributor, Inc. (“APSD”). Because of his positions with AHI, BFDS, AAI, ADI, AFS and APSD, Mr. Burke is deemed an affiliate of the Trust as defined under the 1940 Act. | 36 | Mr. Burke is a Trustee of Clough Global Dividend and Income Fund (1 fund); Clough Global Equity Fund (1 fund); Clough Global Opportunities Fund (1 fund); Clough Funds Trust (1 fund); Liberty All-Star Equity Fund (1 fund); Director of the Liberty All-Star Growth Fund, Inc. (1 fund) and Financial Investors Trust (33 funds). |
| * | The business address of the Trustee is c/o ALPS Advisors, Inc., 1290 Broadway, Suite 1100, Denver, Colorado 80203. |
| ** | This is the period for which the Trustee began serving the Trust. Each Trustee serves an indefinite term, until his successor is elected. |
| *** | The Fund Complex includes all series of the Trust and any other investment companies for which ALPS Advisors, Inc. provides investment advisory services. |
Workplace Equality Portfolio
| Trustees & Officers | November 30, 2018 (Unaudited) |
| OFFICERS |
Name, Address and Year of Birth of Officer* | Position(s) Held with Trust | Length of Time Served** | Principal Occupation(s) During Past 5 Years |
| Erin D. Nelson, 1977 | Chief Compliance Officer (“CCO”) | Since December 2015 | Ms. Nelson became Senior Vice-President and Chief Compliance Officer of ALPS Advisors, Inc. on July 1, 2015 and prior to that served as Vice President and Deputy Chief Compliance Officer of AAI since January 1, 2015. Prior to January 1, 2015, Ms. Nelson was Vice-President and Assistant General Counsel of ALPS Fund Services. Because of her position with AAI, Ms. Nelson is deemed an affiliate of the Trust as defined under the 1940 Act. Ms. Nelson is also the CCO of ALPS Variable Investment Trust, Liberty All-Star Growth Fund, Inc., Liberty All-Star Equity Fund, Principal Real Estate Income Fund, RiverNorth Opportunities Fund, Inc. and Red Rocks Capital, LLC. |
| Kathryn Burns, 1976 | Treasurer | Since September 2018 | Ms. Burns serves as Vice President, Director of Fund Operations of AAI since 2018. From 2013 to 2018, she served as Vice President and Fund Controller at ALPS Fund Services. Prior to joining ALPS, she worked at Old Mutual Capital where she served as Vice President and Chief Compliance Officer (2010 – 2012) and Regulatory Reporting Manager and Assistant Treasurer to the Old Mutual Funds Trusts (2006 – 2012). She also served as a CPA for PricewaterhouseCoopers LLP. Ms. Burns is also Treasurer of ALPS Variable Investment Trust, the Boulder Growth & Income Fund, Inc., Principal Real Estate Income Fund and the RiverNorth Opportunities Fund Inc. |
| Andrea E. Kuchli, 1985 | Secretary | Since December 2017 | Ms. Kuchli joined ALPS in 2015 and is currently Vice President and Senior Counsel of ALPS. Prior to joining ALPS, Ms. Kuchli was an Associate with Davis Graham & Stubbs LLP from April 2014 to February 2015, and an Associate with Dechert LLP from 2011 to April 2014. Because of her position with ALPS, Ms. Kuchli is deemed an affiliate of the Trust as defined under the 1940 Act. Ms. Kuchli is also Secretary of ALPS Variable Investment Trust and Principal Real Estate Income Fund as well as Assistant Secretary of the James Advantage Funds. |
| Sharon Akselrod, 1974 | Assistant Secretary | Since December 2016 | Ms. Akselrod joined ALPS in August 2014 and is currently Senior Investment Company Act Paralegal of ALPS Fund Services, Inc. Prior to joining ALPS, Ms. Akselrod served as Corporate Governance and Regulatory Associate for Nordstrom fsb (2013-2014) and Senior Legal Assistant – Legal Manager for AXA Equitable Life Insurance Company (2008-2013). Because of her position with ALPS, Ms. Akselrod is deemed an affiliate of the Trust as defined under the 1940 Act. Ms. Akselrod is also Assistant Secretary of Financial Investors Trust, ALPS Variable Investment Trust, Principal Real Estate Income Fund and Clough Funds Trust. |
| * | The business address of each Officer is c/o ALPS Advisors, Inc., 1290 Broadway, Suite 1100, Denver, Colorado 80203. |
| ** | This is the period for which the Officer began serving the Trust. Each Officer serves an indefinite term, until his/her successor is elected. |
| (a) | The Registrant, as of the end of the period covered by this report, has adopted a code of ethics that applies to the Registrant's principal executive officer, principal financial officer, principal accounting officer or controller or any persons performing similar functions on behalf of the Registrant. |
| (c) | During the period covered by this report, no amendments to the provisions of the code of ethics adopted in 2(a) above were made. |
| (d) | During the period covered by this report, no implicit or explicit waivers to the provisions of the code of ethics adopted in 2(a) above were granted. |
| (f) | The Registrant's Code of Ethics is attached as an Exhibit hereto. |
| Item 3. | Audit Committee Financial Expert. |
The Board of Trustees of the Registrant has determined that the Registrant has at least one Audit Committee Financial Expert serving on its audit committee. The Board of Trustees of the Registrant has designated Jeremy W. Deems as the Registrant’s “Audit Committee Financial Expert”. Mr. Deems is “independent” as defined in paragraph (a)(2) of Item 3 to Form N-CSR.
| Item 4. | Principal Accountant Fees and Services. |
| (a) | Audit Fees: For the Registrant’s fiscal year ended November 30, 2018 and November 30, 2017, the aggregate fees billed for professional services rendered by the principal accountant for the audit of the Registrant’s annual financial statements were $362,845 and $342,670, respectively. |
| (b) | Audit-Related Fees: For the Registrant’s fiscal year ended November 30, 2018 and November 30, 2017, the aggregate fees billed for professional services rendered by the principal accountant for the verification of the Registrant’s securities and similar investments in accordance with Rule 17f-2 under the Investment Company Act of 1940 were $0 and $0, respectively. |
| (c) | Tax Fees: For the Registrant’s fiscal year ended November 30, 2018 and November 30, 2017, the aggregate fees billed for professional services rendered by the principal accountant for tax compliance, tax advice and tax planning were $117,010 and $110,455, respectively. The fiscal year 2018 and 2017 tax fees were for services pertaining to federal and state income tax return review, review of year end dividend distributions and excise tax preparation. |
| (d) | All Other Fees: For the Registrant’s fiscal year ended November 30, 2018 and November 30, 2017, aggregate fees billed to the Registrant by the principal accountant for services provided by the principal accountant other than the services reported in paragraphs (a) through (c) of this Item 4 were $0 and $0, respectively. |
| (e)(1) | Audit Committee Pre-Approval Policies and Procedures: All services to be performed by the Registrant's principal accountant must be pre-approved by the Registrant's audit committee. |
| (e)(2) | No services described in paragraphs (b) through (d) of this Item were approved by the Registrant’s audit committee pursuant to paragraph (c)(7)(i)(C) of Rule 2-01 of Regulation S-X. |
| (g) | The aggregate non-audit fees billed by the Registrant’s accountant for the fiscal year ended November 30, 2018 and November 30, 2017 of the Registrant were $442,410 and $415,355, respectively. These fees consisted of non-audit fees billed to (i) the Registrant of $117,010 and $110,455 as described in response to paragraph (c) above and (ii) to ALPS Fund Services, Inc. (“AFS”), an entity under common control with ALPS Advisors, Inc., the Registrant’s investment adviser, of $325,400 and $304,900, respectively. The non-audit fees billed to AFS related to SSAE 16 services and other compliance-related matters. |
| (h) | The Registrant’s audit committee has considered whether the provision of non- audit services that were rendered to the Registrant’s investment adviser (not including any sub-adviser whose role is primarily portfolio management and is subcontracted with or overseen by another investment adviser), and any entity controlling, controlled by, or under common control with the investment adviser that provides ongoing services to the Registrant that were not pre-approved pursuant to paragraph (c)(7)(ii) of Rule 2-01 of Regulation S-X, is compatible with maintaining the principal accountant’s independence. The Registrant’s audit committee determined that the provision of such non-audit services is compatible with maintaining the principal accountant’s independence. |
| Item 5. | Audit Committee of Listed Registrants. |
Not applicable to the Registrant.
| (a) | Schedule of Investments is included as part of the Report to Stockholders filed under Item 1 of this Form N-CSR. |
| Item 7. | Disclosure of Proxy Voting Policies and Procedures for Closed-End Management Investment Companies. |
Not applicable to Registrant.
| Item 8. | Portfolio Managers of Closed-End Management Investment Companies. |
Not applicable to Registrant.
| Item 9. | Purchases of Equity Securities by Closed-End Management Investment Company and Affiliated Purchasers. |
Not applicable to Registrant.
| Item 10. | Submission of Matters to a Vote of Security Holders. |
No material changes to the procedures by which the shareholders may recommend nominees to the Registrant’s Board of Trustees have been implemented after the Registrant’s last provided disclosure in response to the requirements of Item 407(c)(2)(iv) of Regulation S-K (17 CFR 229.407) (as required by Item 22(b)(15) of Schedule 14A (17 CFR 240.14a-101)), or this Item.
| Item 11. | Controls and Procedures. |
| (a) | The Registrant’s principal executive officer and principal financial officer have concluded that the Registrant’s disclosure controls and procedures (as defined in Rule 30a-3(c) under the Investment Company Act of 1940, as amended) are effective based on their evaluation of these controls and procedures as of a date within 90 days of the filing date of this report. |
| (b) | There was no change in the Registrant's internal control over financial reporting (as defined in Rule 30a-3(d) under the Investment Company Act of 1940, as amended) during the period covered by this report that has materially affected, or is reasonably likely to materially affect, the Registrant's internal control over financial reporting. |
| Item 12. | Disclosure of Securities Lending Activities for Closed-End Management Investment Companies. |
Not applicable.
| (a)(1) | Registrant’s Code of Ethics for Senior Financial Officers, which is the subject of the disclosure required by Item 2 of Form N-CSR, was filed as Exhibit 12(a)(1) to the Registrant’s Certified Shareholder Report on Form N-CSR, File No. 811-22175, on February 6, 2015. |
| (a)(2) | The certifications required by Rule 30a-2(a) of the Investment Company Act of 1940, as amended, and Section 302 of the Sarbanes-Oxley Act of 2002 are attached hereto as Exhibit 99.Cert. |
| (b) | The certifications by the Registrant’s principal executive officer and principal financial officer, as required by Rule 30a-2(b) of the Investment Company Act of 1940, as amended, and Section 906 of the Sarbanes-Oxley Act of 2002 are attached hereto as Exhibit 99.906Cert. |
SIGNATURES
Pursuant to the requirements of the Securities Exchange Act of 1934 and the Investment Company Act of 1940, the Registrant has duly caused this report to be signed on its behalf by the undersigned, thereunto duly authorized.
ALPS ETF TRUST
| By: | /s/ Edmund J. Burke | |
| | Edmund J. Burke (Principal Executive Officer) | |
| | President | |
| | | |
| Date: | February 5, 2019 | |
| | | |
| Pursuant to the requirements of the Securities Exchange Act of 1934 and the Investment Company Act of 1940, this report has been signed below by the following persons on behalf of the Registrant and in the capacities and on the dates indicated. |
| | | |
| By: | /s/ Edmund J. Burke | |
| | Edmund J. Burke (Principal Executive Officer) | |
| | President | |
| | | |
| Date: | February 5, 2019 | |
| | | |
| By: | /s/ Kathryn Burns | |
| | Kathryn Burns (Principal Financial Officer) | |
| | Treasurer | |
| | | |
| Date: | February 5, 2019 | |