UNITED STATES
SECURITIES AND EXCHANGE COMMISSION
Washington, D.C. 20549
FORM N-CSR
CERTIFIED SHAREHOLDER REPORT OF REGISTERED
MANAGEMENT INVESTMENT COMPANIES
Investment Company Act file number:
811-22175
ALPS ETF TRUST
(Exact name of registrant as specified in charter)
1290 Broadway, Suite 1000, Denver, Colorado 80203
(Address of principal executive offices) (Zip code)
Brendan Hamill, Esq., Secretary
ALPS ETF Trust
1290 Broadway, Suite 1000
Denver, Colorado 80203
(Name and address of agent for service)
Registrant’s Telephone Number, including Area Code: 877-398-8461
Date of fiscal year end: November 30
Date of reporting period: December 1, 2020 – November 30, 2021
| Item 1. | Report to Stockholders. |

Table of Contents
| Performance Overview | |
| Alerian MLP ETF | 1 |
| Alerian Energy Infrastructure ETF | 4 |
| Disclosure of Fund Expenses | 7 |
| Report of Independent Registered Public Accounting Firm | 8 |
| Financial Statements | |
| Alerian MLP ETF | |
| Schedule of Investments | 9 |
| Statement of Assets and Liabilities | 10 |
| Statement of Operations | 11 |
| Statements of Changes in Net Assets | 12 |
| Financial Highlights | 13 |
| Alerian Energy Infrastructure ETF | |
| Schedule of Investments | 14 |
| Statement of Assets and Liabilities | 16 |
| Statement of Operations | 17 |
| Statements of Changes in Net Assets | 18 |
| Financial Highlights | 19 |
| Notes to Financial Statements | 20 |
| Additional Information | 32 |
| Board Considerations Regarding Approval of Investment Advisory Agreements | 34 |
| Trustees & Officers | 36 |
alpsfunds.com
Alerian MLP ETF
| Performance Overview | November 30, 2021 (Unaudited) |
INVESTMENT OBJECTIVE
The Alerian MLP ETF (the “Fund” or “AMLP”) seeks investment results that correspond (before fees and expenses) generally to the price and yield performance of its underlying index, the Alerian MLP Infrastructure Total Return Index (the “Underlying Index” or “AMZI”). The shares of the Fund are listed and trade on the NYSE Arca, Inc. (“NYSE”) under the ticker symbol AMLP. The Fund will normally invest at least 90% of its total assets in securities that comprise the Underlying Index.
The Underlying Index is a rules based, modified capitalization weighted, float-adjusted index intended to give investors a means of tracking the overall performance of the United States energy infrastructure Master Limited Partnership (“MLP”) asset class. The Underlying Index is comprised of energy infrastructure MLPs that earn a majority of their cash flow from the transportation, storage, and processing of energy commodities.
PERFORMANCE OVERVIEW
During the twelve-month period from December 1, 2020, to November 30, 2021, the Fund delivered a total return of 38.04% (37.97% NAV). This compares to the Fund’s Underlying Index, which increased 28.42% on a price-return basis and 39.34% on a total-return basis. The difference in performance between the AMZI and AMLP is primarily attributable to the Fund’s operating expenses and the tax impact of the Fund’s C-Corporation structure.
During the period, the Fund paid four distributions:
| • | $0.6800 per share on February 18, 2021 |
| • | $0.6800 per share on May 20, 2021 |
| • | $0.6800 per share on August 19, 2021 |
| • | $0.7600 per share on November 18, 2021 |
Distributions from AMZI constituents were largely stable during the Fund's fiscal year as reflected by steady payouts from the Fund. In the latest distribution announcements for 3Q21 (paid in 4Q21), four constituents grew their payouts sequentially – MPLX (MPLX), Magellan Midstream Partners (MMP), Western Midstream Partners (WES), and Cheniere Energy Partners (CQP) – and the other constituents maintained their payouts. MPLX also announced a special distribution for the quarter. This helped drive the increased Fund distribution in November 2021.
During the fiscal year, NGL Energy Partners (NGL) was removed from the Underlying Index during a quarterly rebalancing, while TC PipeLines (TCP) and Noble Midstream Partners (NBLX) were removed from the Underlying Index in relation to their acquisition by another entity. There were no updates to the Underlying Index methodology.
In 2021, energy infrastructure MLPs continued to recover from the pandemic-related headwinds that weighed on 2020 performance. The widespread availability of COVID-19 vaccines supported energy demand as daily activities resumed and travel increased. US energy production largely stabilized, as capital discipline by producers kept volume growth in check. Producer discipline and improving demand was supportive for commodity prices and energy stocks in turn. After starting 2021 below $50 per barrel (bbl), West Texas Intermediate (WTI) oil prices had reached $70/bbl by mid-year and a multi-year high of $85/bbl in October. Even after a significant late November sell-off on Omicron variant concerns, WTI oil prices were up 36.40% year-to-date through November 30, 2021. Natural gas prices also strengthened to multi-year highs in 2021, briefly touching $6 per million British thermal unit in October. Rising energy prices contributed to mounting inflation concerns as the year progressed, which also boded well for energy infrastructure MLPs given their real asset exposure and the inflation adjustments often built into their contracts.
In addition to a supportive energy macro backdrop, energy infrastructure MLPs benefitted from company-level tailwinds as well. Free cash flow remained in focus for AMZI constituents, with many generating free cash flow even after generous distributions. Excess cash flow has been deployed for debt reduction and returning cash to shareholders, with many constituents active with buybacks. As of November 30, nearly 70% of the AMZI by weighting has a buyback authorization in place. AMZI constituents have also made strides with reporting environmental, social and governance metrics, while also pursuing energy transition opportunities in areas like carbon capture and renewable fuels. An ongoing recovery in energy markets broadly and company-level tailwinds from strong free cash flow generation could lend continued support to energy infrastructure MLPs.
1 | November 30, 2021
Alerian MLP ETF
| Performance Overview | November 30, 2021 (Unaudited) |
Performance (as of November 30, 2021)
| | 1 Year | 5 Year | 10 Year | Since Inception^ |
| Alerian MLP ETF – NAV | 37.97% | -4.47% | -1.39% | 0.01% |
| Alerian MLP ETF – Market Price* | 38.04% | -4.51% | -1.38% | 0.01% |
| Alerian MLP Infrastructure Total Return Index | 39.34% | -3.61% | -0.04% | 2.03% |
| Alerian MLP Total Return Index | 38.75% | -2.55% | -0.05% | 1.88% |
Total Expense Ratio (per the current prospectus) is 0.90%.
Performance data quoted represents past performance. Past performance does not guarantee future results. Total return figures assume reinvestment of dividends, if any. The table does not reflect the deduction of taxes that a shareholder would pay on Fund distributions or the redemption of Fund shares. Investment return and principal value of an investment will fluctuate so that an investor’s shares, when sold or redeemed, may be worth more or less than the original cost. Current performance data may be higher or lower than actual data quoted. For the most current month-end performance data please visit www.alpsfunds.com or call 1.877.398.8461. The Fund accrues deferred income taxes for future tax liabilities associated with the portion of MLP distributions considered to be a tax-deferred return of capital and for any net operating gains as well as capital appreciation of its investment. This deferred tax liability is reflected in the daily NAV and as a result the fund's after-tax performance could differ significantly from the underlying assets even if the pre-tax performance is closely tracked.
NAV is an exchange-traded fund’s per-share value. The per-share dollar amount of the Fund is derived by dividing the total value of all the securities in its portfolio, less any liabilities, by the number of Fund shares outstanding. Market Price is the price at which a share can currently be traded in the market. Information detailing the number of days the Market Price of the Fund was greater than the Fund’s NAV and the number of days it was less than the Fund’s NAV can be obtained at www.alpsfunds.com.
| ^ | The Fund commenced Investment Operations on August 24, 2010 with an Inception Date, the first day of trading on the NYSE ARCA, of August 25, 2010. |
| * | Market Price means the official closing price of a share or, if it more accurately reflects the market value of a share at the time as of which the Fund calculates current net asset value per share, the price that is the midpoint of the bid-ask spread as of that time. It does not represent the returns an investor would receive if shares were traded at other times. |
The Alerian MLP Infrastructure Total Return Index is comprised of 16 midstream energy Master Limited Partnerships and provides investors with an unbiased benchmark for the infrastructure component of this emerging asset class. Total return assumes reinvestment of any dividends and distributions realized during a given time period.
The Alerian MLP Total Return Index is recognized as a leading gauge of energy infrastructure Master Limited Partnerships (MLPs). The capped, float-adjusted, capitalization-weighted index, whose constituents earn the majority of their cash flow from midstream activities involving energy commodities, is reported on a total-return basis (AMZX), which assumes reinvestment of any dividends and distributions realized during a given period.
The index is not actively managed and does not reflect any deductions for fees, expenses or taxes. One cannot invest directly in an index. Index performance does not reflect fund performance.
The Fund’s shares are not individually redeemable. Investors buy and sell shares of the Fund on a secondary market. Only market makers or “authorized participants” may trade directly with the Fund, typically in blocks of 25,000 shares.
The Alerian MLP ETF is not suitable for all investors. Investments in the Fund are subject to investment risks, including possible loss of the principal amount invested.
ALPS Portfolio Solutions Distributor, Inc., a FINRA member, is the distributor for the Fund.
2 | November 30, 2021
Alerian MLP ETF
| Performance Overview | November 30, 2021 (Unaudited) |
Top 10 Holdings* (as of November 30, 2021)
| MPLX LP | 10.61% |
| Plains All American Pipeline LP | 9.98% |
| Enterprise Products Partners LP | 9.94% |
| Magellan Midstream Partners LP | 9.94% |
| Western Midstream Partners LP | 9.83% |
| Energy Transfer LP | 9.33% |
| Phillips 66 Partners LP | 6.45% |
| DCP Midstream LP | 6.14% |
| EnLink Midstream LLC | 5.61% |
| Cheniere Energy Partners LP | 4.50% |
| Total % of Top 10 Holdings | 82.33% |
Future holdings are subject to change.
Growth of $10,000 (as of November 30, 2021)
Comparison of change in value of a $10,000 investment in the Fund and the Indexes

The chart above compares historical performance of a hypothetical investment of $10,000 in the Fund over the past ten years with the performance of the Fund’s benchmark index. Results include the reinvestment of all dividends and capital gains distributions. Past performance does not guarantee future results. The chart does not reflect the deduction of taxes that a shareholder would pay on Fund distributions or the redemption of Fund shares.
3 | November 30, 2021
Alerian Energy Infrastructure ETF
| Performance Overview | November 30, 2021 (Unaudited) |
INVESTMENT OBJECTIVE
The Alerian Energy Infrastructure ETF (the “Fund” or “ENFR”) seeks investment results that correspond (before fees and expenses) generally to the price and yield performance of its underlying index, the Alerian Midstream Energy Select Total Return Index (the “Underlying Index” or “AMEI”). As a secondary objective, the Fund seeks to provide total return through income and capital appreciation. The Shares of the Fund are listed and trade on the NYSE Arca, Inc. (“NYSE”) under the ticker symbol ENFR. The Fund will normally invest at least 90% of its total assets in securities that comprise the Underlying Index.
The Underlying Index is a composite of North American energy infrastructure companies engaged in midstream activities involving energy commodities, including gathering and processing, liquefaction, pipeline transportation, rail terminaling, and storage (also known as “midstream energy businesses”). Midstream energy companies include midstream MLPs and midstream corporations, either based in the United States or Canada. The Underlying Index has a 25% limit for companies taxed as pass-through entities.
PERFORMANCE OVERVIEW
During the twelve-month period from December 1, 2020, to November 30, 2021, the Fund delivered a total return of 38.91% (38.93% NAV). This compares to the Fund’s Underlying Index, which increased 31.64% on a price-return basis and 40.13% on a total-return basis.
During the period, the Fund paid four quarterly distributions:
| • | $0.352220 per share on February 18, 2021 |
| • | $0.239010 per share on May 20, 2021 |
| • | $0.243490 per share on August 19, 2021 |
| • | $0.627280 per share on November 18, 2021 |
AMEI constituents largely maintained or increased their dividends during the fiscal year. In the latest distribution announcements for 3Q21 (paid in 4Q21), five constituents increased their payouts sequentially, and there were no dividend cuts for the quarter. The Fund’s February and November distributions were augmented by special dividends from Macquarie Infrastructure Corporation (MIC). MIC paid out special dividends of $11.00 per share in January and $37.39 per share in October as the company essentially sold itself in parts. Additionally, MPLX paid out a special distribution for 3Q21 that also contributed to the higher distribution from the Fund in November 2021.
During the fiscal year, Altus Midstream Company (ALTM) and Oasis Midstream Partners (OMP) were added to the Underlying Index while Delek Logistics Partners (DKL) was removed during quarterly rebalancings. Inter Pipeline (IPL CN) and Noble Midstream Partners (NBLX) were removed from the Underlying Index in relation to their acquisition by another entity. There were no updates to the Underlying Index methodology.
In 2021, energy infrastructure companies continued to recover from the pandemic-related headwinds that weighed on 2020 performance. The widespread availability of COVID-19 vaccines supported energy demand as daily activities resumed and travel increased. US energy production largely stabilized, as capital discipline by producers kept volume growth in check. Producer discipline and improving demand was supportive for commodity prices and energy stocks in turn. After starting 2021 below $50 per barrel (bbl), West Texas Intermediate (WTI) oil prices had reached $70/bbl by mid-year and a multi-year high of $85/bbl in October. Even after a significant late November sell-off on Omicron variant concerns, WTI oil prices were up 36.40% year-to-date through November 30, 2021. Natural gas prices also strengthened to multi-year highs in 2021, briefly touching $6 per million British thermal unit in October. Rising energy prices contributed to mounting inflation concerns as the year progressed, which also boded well for energy infrastructure companies given their real asset exposure and the inflation adjustments often built into their contracts.
In addition to a supportive energy macro backdrop, energy infrastructure companies benefitted from company-level tailwinds as well. Free cash flow remained in focus for AMEI constituents, with many generating free cash flow even after generous dividends. Excess cash flow has been deployed for debt reduction and returning cash to shareholders, with many constituents active with buybacks. As of November 30, approximately 64% of the AMEI Index by weighting has a buyback authorization in place.
AMEI constituents have also made strides with reporting environmental, social and governance metrics, and multiple constituents have targets to achieve net-zero emissions by 2050. Constituents are also pursuing energy transition opportunities in areas like carbon capture, hydrogen, and renewable fuels. The large Canadian constituents, Enbridge (ENB) and TC Energy (TRP), have been particularly active on this front. An ongoing recovery in energy markets broadly and company-level tailwinds from strong free cash flow generation could lend continued support to energy infrastructure corporations and MLPs.
4 | November 30, 2021
Alerian Energy Infrastructure ETF
| Performance Overview | November 30, 2021 (Unaudited) |
Performance (as of November 30, 2021)
| | 1 Year | 5 Year | Since Inception^ |
| Alerian Energy Infrastructure ETF - NAV | 38.93% | 1.38% | 0.82% |
| Alerian Energy Infrastructure ETF - Market Price* | 38.91% | 1.35% | 0.83% |
| Alerian Midstream Energy Select Total Return Index | 40.13% | 2.32% | 1.71% |
| Alerian MLP Total Return Index | 38.75% | -2.55% | -3.96% |
Total Expense Ratio (per the current prospectus) is 0.35%.
Performance data quoted represents past performance. Past performance does not guarantee future results. Total return figures assume reinvestment of dividends and capital gains distributions, if any. The table does not reflect the deduction of taxes that a shareholder would pay on Fund distributions or the redemption of Fund shares. Investment return and principal value of an investment will fluctuate so that an investor’s shares, when sold or redeemed, may be worth more or less than the original cost. Current performance data may be higher or lower than actual data quoted. For most current month-end performance data please visit www.alpsfunds.com or call 1.866.675.2639.
NAV is an exchange-traded fund’s per-share value. The per-share dollar amount of the Fund is derived by dividing the total value of all the securities in its portfolio, less any liabilities, by the number of Fund shares outstanding. Market Price is the price at which a share can currently be traded in the market. Information detailing the number of days the Market Price of the Fund was greater than the Fund’s NAV and the number of days it was less than the Fund’s NAV can be obtained at www.alpsfunds.com.
| ^ | The Fund commenced Investment Operations on November 1, 2013. |
| * | Market Price means the official closing price of a share or, if it more accurately reflects the market value of a share at the time as of which the Fund calculates current net asset value per share, the price that is the midpoint of the bid-ask spread as of that time. It does not represent the returns an investor would receive if shares were traded at other times. |
The Alerian Midstream Energy Select Total Return Index is comprised of 33 equity securities of issuers headquartered or incorporated in the United States and Canada that engage in the transportation, storage, and processing of energy commodities. Total return assumes reinvestment of any dividends and distributions realized during a given time period.
The Alerian MLP Total Return Index is recognized as a leading gauge of energy infrastructure Master Limited Partnerships (MLPs). The capped, float-adjusted, capitalization-weighted index, whose constituents earn the majority of their cash flow from midstream activities involving energy commodities, is reported on a total-return basis (AMZX), which assumes reinvestment of any dividends and distributions realized during a given period.
The index is not actively managed and does not reflect any deductions for fees, expenses or taxes. One cannot invest directly in an index. Index performance does not reflect fund performance.
The Fund’s shares are not individually redeemable. Investors buy and sell shares of the Fund on a secondary market. Only market makers or “authorized participants” may trade directly with the Fund, typically in blocks of 50,000 shares.
The Alerian Energy Infrastructure ETF is not suitable for all investors. Investments in the Fund are subject to investment risks, including possible loss of the principal amount invested.
ALPS Portfolio Solutions Distributor, Inc., a FINRA member, is the distributor for the Fund.
5 | November 30, 2021
Alerian Energy Infrastructure ETF
| Performance Overview | November 30, 2021 (Unaudited) |
Top 10 Holdings* (as of November 30, 2021)
| Enbridge, Inc. | 9.99% |
| Enterprise Products Partners LP | 8.58% |
| TC Energy Corp. | 8.29% |
| Cheniere Energy, Inc. | 6.38% |
| Targa Resources Corp. | 6.27% |
| ONEOK, Inc. | 6.10% |
| Plains GP Holdings LP | 4.90% |
| The Williams Cos., Inc. | 4.85% |
| Kinder Morgan, Inc. | 4.84% |
| Pembina Pipeline Corp. | 4.79% |
| Total % of Top 10 Holdings | 64.99% |
| * | % of Total Investments (excluding investments purchased with collateral from securities loaned) Future holdings are subject to change. |
Growth of $10,000 (as of November 30, 2021)
Comparison of change in value of a $10,000 investment in the Fund and the Indexes
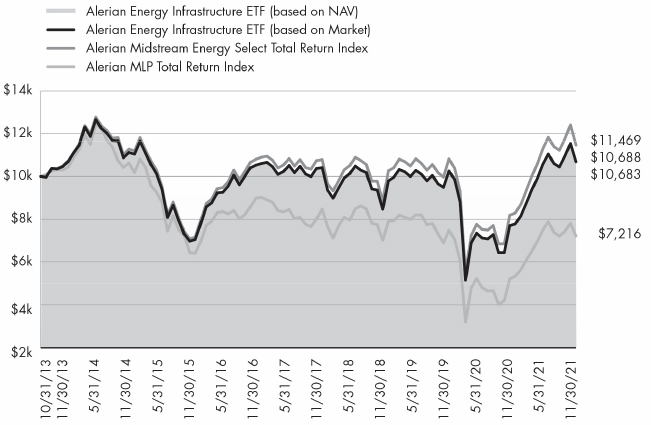
The chart above compares historical performance of a hypothetical investment of $10,000 in the Fund since inception with the performance of the Fund’s benchmark index. Results include the reinvestment of all dividends and capital gains distributions. Past performance does not guarantee future results. The chart does not reflect the deduction of taxes that a shareholder would pay on Fund distributions or the redemption of Fund shares.
6 | November 30, 2021
Alerian Exchange Traded Funds
| Disclosure of Fund Expenses | November 30, 2021 (Unaudited) |
Shareholder Expense Example: As a shareholder of a Fund, you incur certain ongoing costs, including management fees and other Fund expenses. These examples are intended to help you understand your ongoing costs (in dollars) of investing in the Fund and to compare these costs with the ongoing costs of investing in other funds. It is based on an investment of $1,000 invested at the beginning of the (six month) period and held through November 30, 2021.
Actual Return: The first line of the table provides information about actual account values and actual expenses. You may use the information in this line, together with the amount you invested, to estimate the expenses that you incurred over the period. Simply divide your account value by $1,000 (for example, an $8,600 account value divided by $1,000 = 8.6), then multiply the result by the number in the first line under the heading entitled “Expenses Paid During Period” to estimate the expenses attributable to your investment during this period.
Hypothetical 5% Return: The second line of the table provides information about hypothetical account values and hypothetical expenses based on the Fund’s actual expense ratio and an assumed rate of return of 5% per year before expenses, which is not the Fund’s actual return. The hypothetical account values and expenses may not be used to estimate the actual ending account balance or expenses you paid for the period. You may use this information to compare ongoing costs of investing in the Fund and other funds. To do so, compare this 5% hypothetical example with the 5% hypothetical examples that appear in the shareholder reports of other funds.
The expenses shown in the table are meant to highlight ongoing Fund costs only and do not reflect any transaction costs, such as brokerage commissions and other fees to financial intermediaries. Therefore, the second line is useful in comparing ongoing costs only, and will not help you determine the relative total costs of owning different funds. In addition, if these costs were included, your costs would have been higher.
| | Beginning Account Value 6/1/21 | Ending Account Value 11/30/21 | Expense Ratio(a) | Expenses Paid During Period 6/1/21 - 11/30/21(b) |
| Alerian MLP ETF | | | | |
| Actual | $1,000.00 | $964.20 | 0.89% | $4.38 |
| Hypothetical (5% return before expenses) | $1,000.00 | $1,020.61 | 0.89% | $4.51 |
| | | | | |
| Alerian Energy Infrastructure ETF | | | | |
| Actual | $1,000.00 | $1,011.00 | 0.40% | $2.02 |
| Hypothetical (5% return before expenses) | $1,000.00 | $1,023.06 | 0.40% | $2.03 |
| (a) | Annualized, based on the Fund's most recent fiscal half-year expenses. |
| (b) | Expenses are equal to the Fund's annualized expense ratio multiplied by the average account value over the period, multiplied by the number of days in the most recent fiscal half year (183), divided by 365. |
7 | November 30, 2021
Alerian Exchange Traded Funds
Report of Independent Registered Public Accounting Firm
To the Board of Trustees of ALPS ETF Trust and the shareholders of Alerian MLP ETF and Alerian Energy Infrastructure ETF:
Opinion on the Financial Statements and Financial Highlights
We have audited the accompanying statements of assets and liabilities, including the schedule of investments, of Alerian MLP ETF and Alerian Energy Infrastructure ETF (the "Funds"), two of the funds constituting the ALPS ETF Trust as of November 30, 2021, the related statements of operations for the year then ended, the statements of changes in net assets for each of the two years in the period then ended, and the financial highlights for each of the five years in the period then ended, and the related notes.
In our opinion, the financial statements and financial highlights present fairly, in all material respects, the financial position of the Funds as of November 30, 2021, and the results of their operations for the year then ended, the changes in their net assets for each of the two years in the period then ended, and the financial highlights for each of the five years in the period then ended in conformity with accounting principles generally accepted in the United States of America.
Basis for Opinion
These financial statements and financial highlights are the responsibility of the Funds’ management. Our responsibility is to express an opinion on the Funds’ financial statements and financial highlights based on our audits. We are a public accounting firm registered with the Public Company Accounting Oversight Board (United States) (PCAOB) and are required to be independent with respect to the Funds in accordance with the U.S. federal securities laws and the applicable rules and regulations of the Securities and Exchange Commission and the PCAOB.
We conducted our audits in accordance with the standards of the PCAOB. Those standards require that we plan and perform the audit to obtain reasonable assurance about whether the financial statements and financial highlights are free of material misstatement, whether due to error or fraud. The Funds are not required to have, nor were we engaged to perform, an audit of their internal control over financial reporting. As part of our audits we are required to obtain an understanding of internal control over financial reporting but not for the purpose of expressing an opinion on the effectiveness of the Funds’ internal control over financial reporting. Accordingly, we express no such opinion.
Our audits included performing procedures to assess the risks of material misstatement of the financial statements and financial highlights, whether due to error or fraud, and performing procedures that respond to those risks. Such procedures included examining, on a test basis, evidence regarding the amounts and disclosures in the financial statements and financial highlights. Our audits also included evaluating the accounting principles used and significant estimates made by management, as well as evaluating the overall presentation of the financial statements and financial highlights. Our procedures included confirmation of securities owned as of November 30, 2021, by correspondence with the custodian and brokers; when replies were not received from brokers, we performed other auditing procedures. We believe that our audits provide a reasonable basis for our opinion.
DELOITTE & TOUCHE LLP
Denver, Colorado
January 26, 2022
We have served as the auditor of one or more investment companies advised by ALPS Advisors, Inc. since 2007.
8 | November 30, 2021
Alerian MLP ETF
| Schedule of Investments | November 30, 2021 |
| Security Description | | Shares | | | Value | |
| MASTER LIMITED PARTNERSHIPS (100.03%) | | | | | | |
| Gathering + Processing (27.10%) | | | | | | |
| Crestwood Equity Partners LP(a) | | | 7,496,856 | | | $ | 191,619,639 | |
| DCP Midstream LP(a) | | | 11,614,338 | | | | 305,805,520 | |
| Enable Midstream Partners LP | | | 11,640,411 | | | | 83,112,535 | |
| EnLink Midstream LLC(a) | | | 42,917,395 | | | | 279,392,241 | |
| Western Midstream Partners LP(a) | | | 25,467,949 | | | | 489,748,659 | |
| Total Gathering + Processing | | | | | | | 1,349,678,594 | |
| | | | | | | | | |
| Liquefaction (4.50%) | | | | | | | | |
| Cheniere Energy Partners LP | | | 5,313,739 | | | | 224,292,923 | |
| | | | | | | | | |
| Pipeline Transportation | Natural Gas (19.28%) | | | | | | | | |
| Energy Transfer LP | | | 55,199,451 | | | | 464,779,377 | |
| Enterprise Products Partners LP | | | 23,163,294 | | | | 495,462,859 | |
| Total Pipeline Transportation | Natural Gas | | | | | | | 960,242,236 | |
| | | | | | | | | |
| Pipeline Transportation | Petroleum (49.15%) | | | | | | | | |
| Genesis Energy LP(a) | | | 14,145,817 | | | | 142,731,294 | |
| Holly Energy Partners LP(a) | | | 5,930,480 | | | | 99,394,845 | |
| Magellan Midstream Partners LP(a) | | | 10,672,793 | | | | 495,004,139 | |
| MPLX LP | | | 18,031,271 | | | | 528,496,553 | |
| NuStar Energy LP(a) | | | 12,831,134 | | | | 179,635,876 | |
| Phillips 66 Partners LP | | | 9,338,301 | | | | 321,611,086 | |
| Plains All American Pipeline LP(a) | | | 53,477,843 | | | | 497,343,940 | |
| Shell Midstream Partners LP | | | 16,084,012 | | | | 183,357,737 | |
| Total Pipeline Transportation | Petroleum | | | | | | | 2,447,575,470 | |
| | | | | | | | | |
| TOTAL MASTER LIMITED PARTNERSHIPS | | | | | | | | |
| (Cost $3,671,578,558) | | | | | | | 4,981,789,223 | |
| | | 7 Day Yield | | | Shares | | | Value | |
| SHORT TERM INVESTMENTS (0.01%) | | | | | | | | | |
| State Street Institutional | | | | | | | | | |
| Treasury Plus Money | | | | | | | | | |
| Market Fund | | | 0.01 | % | | | 606,733 | | | | 606,733 | |
| TOTAL SHORT TERM INVESTMENTS | | | | | | | | | | | | |
| (Cost $606,733) | | | | | | | | | | | 606,733 | |
| | | | | | | | | | | | | |
| TOTAL INVESTMENTS (100.04%) | | | | | | | | | | | | |
| (Cost $3,672,185,291) | | | | | | | | | | $ | 4,982,395,956 | |
| LIABILITIES IN EXCESS OF OTHER ASSETS (-0.04%) | | | | | | | | | | | (2,220,666 | ) |
| NET ASSETS - 100.00% | | | | | | | | | | $ | 4,980,175,290 | |
| (a) | Affiliated Company. See Note 8 in Notes to Financial Statement. |
See Notes to Financial Statements.
9 | November 30, 2021
Alerian MLP ETF
| Statement of Assets and Liabilities | November 30, 2021 |
| ASSETS: | | | |
| Investments, at value | | $ | 2,301,719,803 | |
| Investments in affiliates, at value | | | 2,680,676,153 | |
| Receivable for investments sold | | | 13,499,975 | |
| Receivable for fund shares sold | | | 790,718 | |
| Deferred tax asset (Note 2) | | | – | (a) |
| Income tax receivable | | | 1,229,058 | |
| Franchise tax receivable | | | 341,767 | |
| Total Assets | | | 4,998,257,474 | |
| | | | | |
| LIABILITIES: | | | | |
| Payable for investments purchased | | | 790,758 | |
| Payable for shares redeemed | | | 13,504,243 | |
| Payable to adviser | | | 3,787,183 | |
| Total Liabilities | | | 18,082,184 | |
| NET ASSETS | | $ | 4,980,175,290 | |
| | | | | |
| NET ASSETS CONSIST OF: | | | | |
| Paid-in capital | | $ | 8,253,797,724 | |
| Distributable earnings | | | (3,273,622,434 | ) |
| NET ASSETS | | $ | 4,980,175,290 | |
| | | | | |
| INVESTMENTS, AT COST | | $ | 1,699,888,252 | |
| INVESTMENTS IN AFFILIATES, AT COST | | | 1,972,297,039 | |
| | | | | |
| PRICING OF SHARES | | | | |
| Net Assets | | $ | 4,980,175,290 | |
| Shares of beneficial interest outstanding (Unlimited number of shares authorized, par value $0.01 per share) | | | 157,457,420 | |
| Net Asset Value, offering and redemption price per share | | $ | 31.63 | |
| (a) | Net Deferred Tax Asset of $467,857,482 is offset 100% by Valuation Allowance. |
See Notes to Financial Statements.
10 | November 30, 2021
Alerian MLP ETF
| Statement of Operations | For the Year Ended November 30, 2021 |
| INVESTMENT INCOME: | | | |
| Distributions from master limited partnerships | | $ | 423,726,349 | |
| Less return of capital distributions | | | (423,726,349 | ) |
| Total Investment Income | | | – | |
| | | | | |
| EXPENSES: | | | | |
| Franchise tax expense | | | 71,821 | |
| Investment adviser fee | | | 43,465,063 | |
| Total Expenses | | | 43,536,884 | |
| NET INVESTMENT LOSS, BEFORE INCOME TAXES | | | (43,536,884 | ) |
| Current income tax benefit/(expense) | | | 29,693 | |
| NET INVESTMENT LOSS | | | (43,507,191 | ) |
| | | | | |
| REALIZED AND UNREALIZED GAIN/(LOSS): | | | | |
| Net realized loss on investments, before income taxes | | | (110,702,669 | ) |
| Net realized loss on affiliated investments, before income taxes | | | (341,291,057 | ) |
| Current income tax benefit/(expense) | | | 308,268 | |
| Net realized loss | | | (451,685,458 | ) |
| Net change in unrealized appreciation on investments, before income taxes | | | 824,272,766 | |
| Net change in unrealized appreciation on affiliated investments, before income taxes | | | 1,152,802,285 | |
| Current income tax benefit/(expense) | | | (1,348,403 | ) |
| Net change in unrealized appreciation | | | 1,975,726,648 | |
| NET REALIZED AND UNREALIZED GAIN ON INVESTMENTS | | | 1,524,041,190 | |
| NET INCREASE IN NET ASSETS RESULTING FROM OPERATIONS | | $ | 1,480,533,999 | |
See Notes to Financial Statements.
11 | November 30, 2021
Alerian MLP ETF
| Statements of Changes in Net Assets |
| | | For the Year Ended November 30, 2021 | | | For the Year Ended November 30, 2020 | |
| OPERATIONS: | | | | | | |
| Net investment loss | | $ | (43,507,191 | ) | | $ | (39,857,320 | ) |
| Net realized loss | | | (451,685,458 | ) | | | (2,126,407,627 | ) |
| Net change in unrealized appreciation | | | 1,975,726,648 | | | | 166,156,216 | |
| Net increase/(decrease) in net assets resulting from operations | | | 1,480,533,999 | | | | (2,000,108,731 | ) |
| | | | | | | | | |
| DISTRIBUTIONS TO SHAREHOLDERS: | | | | | | | | |
| From tax return of capital | | | (444,037,776 | ) | | | (518,981,697 | ) |
| Total distributions | | | (444,037,776 | ) | | | (518,981,697 | ) |
| | | | | | | | | |
| CAPITAL SHARE TRANSACTIONS: | | | | | | | | |
| Proceeds from sale of shares | | | 1,051,399,959 | | | | 1,148,144,286 | |
| Cost of shares redeemed | | | (987,858,170 | ) | | | (1,997,921,707 | ) |
| Net increase/(decrease) from share transactions | | | 63,541,789 | | | | (849,777,421 | ) |
| | | | | | | | | |
| Net increase/(decrease) in net assets | | | 1,100,038,012 | | | | (3,368,867,849 | ) |
| | | | | | | | | |
| NET ASSETS: | | | | | | | | |
| Beginning of year | | | 3,880,137,278 | | | | 7,249,005,127 | |
| End of year | | $ | 4,980,175,290 | | | $ | 3,880,137,278 | |
| | | | | | | | | |
| OTHER INFORMATION: | | | | | | | | |
| SHARE TRANSACTIONS: | | | | | | | | |
| Beginning shares | | | 155,057,420 | | | | 926,062,100 | |
| Shares sold | | | 33,250,000 | | | | 130,075,000 | |
| Shares redeemed | | | (30,850,000 | ) | | | (240,750,000 | ) |
| Reverse stock split (Note 1) | | | – | | | | (660,329,680 | ) |
| Shares outstanding, end of year | | | 157,457,420 | | | | 155,057,420 | |
See Notes to Financial Statements.
12 | November 30, 2021
Alerian MLP ETF
| Financial Highlights | For a Share Outstanding Throughout the Periods Presented |
| | | For the Year Ended November 30, 2021 | | | For the Year Ended November 30, 2020 (a) | | | For the Year Ended November 30, 2019 (a) | | | For the Year Ended November 30, 2018 (a) | | | For the Year Ended November 30, 2017 (a) | |
| NET ASSET VALUE, BEGINNING OF PERIOD | | $ | 25.02 | | | $ | 39.15 | | | $ | 47.75 | | | $ | 51.85 | | | $ | 61.55 | |
| | | | | | | | | | | | | | | | | | | | | |
| INCOME/(LOSS) FROM OPERATIONS: | | | | | | | | | | | | | | | | | | | | |
| Net investment loss(b) | | | (0.27 | ) | | | (0.24 | ) | | | (0.35 | ) | | | (0.45 | ) | | | (1.10 | ) |
| Net realized and unrealized gain/(loss) on investments | | | 9.68 | | | | (10.73 | ) | | | (4.35 | ) | | | 0.40 | | | | (4.30 | ) |
| Total from investment operations | | | 9.41 | | | | (10.97 | ) | | | (4.70 | ) | | | (0.05 | ) | | | (5.40 | ) |
| | | | | | | | | | | | | | | | | | | | | |
| DISTRIBUTIONS: | | | | | | | | | | | | | | | | | | | | |
| From net realized gains | | | – | | | | – | | | | – | | | | (4.05 | ) | | | – | |
| From tax return of capital | | | (2.80 | ) | | | (3.16 | ) | | | (3.90 | ) | | | – | | | | (4.30 | ) |
| Total distributions | | | (2.80 | ) | | | (3.16 | ) | | | (3.90 | ) | | | (4.05 | ) | | | (4.30 | ) |
| | | | | | | | | | | | | | | | | | | | | |
| NET INCREASE/(DECREASE) IN NET ASSET VALUE | | | 6.61 | | | | (14.13 | ) | | | (8.60 | ) | | | (4.10 | ) | | | (9.70 | ) |
| NET ASSET VALUE, END OF PERIOD | | $ | 31.63 | | | $ | 25.02 | | | $ | 39.15 | | | $ | 47.75 | | | $ | 51.85 | |
| TOTAL RETURN(c) | | | 37.97 | % | | | (28.36 | )% | | | (10.79 | )% | | | (0.55 | )% | | | (9.27 | )% |
| | | | | | | | | | | | | | | | | | | | | |
| RATIOS/SUPPLEMENTAL DATA: | | | | | | | | | | | | | | | | | | | | |
| Net assets, end of period (000s) | | $ | 4,980,175 | | | $ | 3,880,137 | | | $ | 7,249,005 | | | $ | 8,699,748 | | | $ | 9,405,284 | |
| | | | | | | | | | | | | | | | | | | | | |
| RATIO TO AVERAGE NET ASSETS: | | | | | | | | | | | | | | | | | | | | |
| Expenses (excluding net current and deferred tax expenses/benefits and franchise tax expense) | | | 0.85 | % | | | 0.85 | % | | | 0.85 | % | | | 0.85 | % | | | 0.85 | % |
| Expenses (including net current and deferred tax expenses/benefits)(d) | | | 0.87 | % | | | 0.90 | % | | | 0.87 | % | | | 0.85 | % | | | 0.41 | % |
| Expenses (including current and deferred tax expenses/benefits)(e) | | | 0.85 | % | | | 0.85 | % | | | 0.85 | % | | | 0.85 | % | | | 1.81 | % |
| Net investment loss (excluding deferred tax expenses/benefits and franchise tax expense) | | | (0.85 | )% | | | (0.85 | )% | | | (0.77 | )% | | | (0.85 | )% | | | (0.85 | )% |
| Net investment income/(loss)(including deferred tax expenses/benefits)(e) | | | (0.85 | )% | | | (0.85 | )% | | | (0.77 | )% | | | (0.85 | )% | | | (1.81 | )% |
| PORTFOLIO TURNOVER RATE(f) | | | 20 | % | | | 23 | % | | | 34 | % | | | 26 | % | | | 23 | % |
| (a) | On May 18, 2020, the Alerian MLP ETF underwent a one for five reverse stock split. The capital share activity presented here has been retroactively adjusted to reflect this reverse split. See Note 1. |
| (b) | Based on average shares outstanding during the period. |
| (c) | Total return is calculated assuming an initial investment made at the net assets value at the beginning of the period and redemption at the net asset value on the last day of the period and assuming all distributions are reinvested at actual reinvestment prices. Total return calculated for a period of less than one year is not annualized. |
| (d) | Includes amount of current and deferred taxes/benefits for all components of the Statement of Operations. |
| (e) | Includes amount of current and deferred tax benefit associated with net investment income/(loss). |
| (f) | Portfolio turnover for periods less than one year is not annualized and does not include securities received or delivered from processing creations or redemptions in-kind. |
See Notes to Financial Statements.
13 | November 30, 2021
Alerian Energy Infrastructure ETF
| Schedule of Investments | November 30, 2021 |
| Security Description | | Shares | | | Value | |
| CANADIAN ENERGY INFRASTRUCTURE COMPANIES (29.00%) | | | | | | |
| Gathering + Processing (3.86%) | | | | | | |
| Keyera Corp. | | | 104,445 | | | $ | 2,294,201 | |
| | | | | | | | | |
| Pipeline Transportation | Natural Gas (8.28%) | | | | | | | | |
| TC Energy Corp.(a) | | | 104,983 | | | | 4,924,327 | |
| | | | | | | | | |
| Pipeline Transportation | Petroleum (14.76%) | | | | | | | | |
| Enbridge, Inc. | | | 158,259 | | | | 5,937,887 | |
| Pembina Pipeline Corp. | | | 96,154 | | | | 2,845,216 | |
| Total Pipeline Transportation | Petroleum | | | | | | | 8,783,103 | |
| | | | | | | | | |
| Storage (2.10%) | | | | | | | | |
| Gibson Energy, Inc. | | | 69,023 | | | | 1,248,676 | |
| | | | | | | | | |
| TOTAL CANADIAN ENERGY INFRASTRUCTURE COMPANIES | | | | | | | | |
| (Cost $17,563,282) | | | | | | | 17,250,307 | |
| Security Description | | Shares | | | Value | |
| EXCHANGE TRADED FUND (3.07%) | | | | | | |
| Exchange Traded Fund (3.07%) | | | | | | |
| Energy Select Sector SPDR Fund | | | 33,430 | | | | 1,824,944 | |
| | | | | | | | | |
| TOTAL EXCHANGE TRADED FUND | | | | | | | | |
| (Cost $1,825,195) | | | | | | | 1,824,944 | |
| Security Description | | Shares | | | Value | |
| U.S. ENERGY INFRASTRUCTURE COMPANIES (27.77%) | | | | | | |
| Gathering + Processing (12.35%) | | | | | | |
| ONEOK, Inc. | | | 60,548 | | | | 3,623,192 | |
| Targa Resources Corp. | | | 72,171 | | | | 3,726,189 | |
| Total Gathering + Processing | | | | | | | 7,349,381 | |
| | | | | | | | | |
| Liquefaction (7.25%) | | | | | | | | |
| Cheniere Energy, Inc. | | | 36,190 | | | | 3,793,074 | |
| Tellurian, Inc.(a)(b) | | | 159,340 | | | | 519,448 | |
| Total Liquefaction | | | | | | | 4,312,522 | |
| | | | | | | | | |
| Pipeline Transportation | Natural Gas (7.95%) | | | | | | | | |
| Equitrans Midstream Corp. | | | 192,824 | | | | 1,854,967 | |
| Kinder Morgan, Inc. | | | 186,088 | | | | 2,876,921 | |
| Total Pipeline Transportation | Natural Gas | | | | | | | 4,731,888 | |
| | | | | | | | | |
| Storage (0.22%) | | | | | | | | |
| Macquarie Infrastructure Holdings LLC | | | 35,444 | | | | 128,307 | |
| | | | | | | | | |
| TOTAL U.S. ENERGY INFRASTRUCTURE COMPANIES | | | | | | | | |
| (Cost $15,034,711) | | | | | | | 16,522,098 | |
| Security Description | | Shares | | | Value | |
| U.S. ENERGY INFRASTRUCTURE MLPS (25.66%) | | | | | | |
| Gathering + Processing (6.41%) | | | | | | |
| Crestwood Equity Partners LP | | | 11,037 | | | $ | 282,106 | |
| Enable Midstream Partners LP | | | 17,094 | | | | 122,051 | |
| Hess Midstream LP, Class A | | | 11,034 | | | | 273,202 | |
| MPLX LP | | | 72,680 | | | | 2,130,251 | |
| Oasis Midstream Partners LP | | | 2,866 | | | | 61,046 | |
| Rattler Midstream LP | | | 19,096 | | | | 203,372 | |
| Western Midstream Partners LP | | | 38,726 | | | | 744,701 | |
| Total Gathering + Processing | | | | | | | 3,816,729 | |
| | | | | | | | | |
| Pipeline Transportation | Natural Gas (13.22%) | | | | | | | | |
| Energy Transfer LP | | | 328,637 | | | | 2,767,123 | |
| Enterprise Products Partners LP | | | 238,333 | | | | 5,097,943 | |
| Total Pipeline Transportation | Natural Gas | | | | | | | 7,865,066 | |
| | | | | | | | | |
| | | | | | | | | |
| Pipeline Transportation | Petroleum (6.03%) | | | | | | | | |
| BP Midstream Partners LP | | | 9,396 | | | | 120,926 | |
| Genesis Energy LP | | | 20,986 | | | | 211,749 | |
| Holly Energy Partners LP | | | 8,676 | | | | 145,410 | |
| Magellan Midstream Partners LP | | | 42,612 | | | | 1,976,345 | |
| NGL Energy Partners LP(b) | | | 24,239 | | | | 49,448 | |
| NuStar Energy LP | | | 18,995 | | | | 265,930 | |
| PBF Logistics LP | | | 5,991 | | | | 67,878 | |
| Phillips 66 Partners LP | | | 13,814 | | | | 475,754 | |
| Shell Midstream Partners LP | | | 23,821 | | | | 271,559 | |
| Total Pipeline Transportation | Petroleum | | | | | | | 3,584,999 | |
| | | | | | | | | |
| | | | | | | | | |
| TOTAL U.S. ENERGY INFRASTRUCTURE MLPS | | | | | | | | |
| (Cost $18,361,968) | | | | | | | 15,266,794 | |
| Security Description | | Shares | | | Value | |
| U.S. GENERAL PARTNERS (14.35%) | | | | | | |
| Gathering + Processing (9.45%) | | | | | | |
| Altus Midstream Co. | | | 1,381 | | | | 87,528 | |
| Antero Midstream Corp. | | | 167,605 | | | | 1,627,444 | |
| EnLink Midstream LLC | | | 157,108 | | | | 1,022,773 | |
| The Williams Cos., Inc. | | | 107,561 | | | | 2,881,559 | |
| Total Gathering + Processing | | | | | | | 5,619,304 | |
| | | | | | | | | |
| Pipeline Transportation | Petroleum (4.90%) | | | | | | | | |
| Plains GP Holdings LP, Class A | | | 291,402 | | | | 2,914,020 | |
| | | | | | | | | |
| TOTAL U.S. GENERAL PARTNERS | | | | | | | | |
| (Cost $8,851,131) | | | | | | | 8,533,324 | |
See Notes to Financial Statements.
14 | November 30, 2021
Alerian Energy Infrastructure ETF
| Schedule of Investments | November 30, 2021 |
| | | 7 Day Yield | | | Shares | | | Value | |
| SHORT TERM INVESTMENTS (3.54%) | | | | | | | | | |
| Money Market Fund (0.02%) | | | | | | | | | | | | |
| State Street Institutional | | | | | | | | | | | | |
| Treasury Plus Money | | | | | | | | | | | | |
| Market Fund | | | | | | | | | | | | |
| (Cost $12,570) | | | 0.01 | % | | | 12,570 | | | $ | 12,570 | |
| | | | | | | | | | | | | |
| Investments Purchased with Collateral | | | | | | | | | | | | |
| from Securities Loaned (3.52%) | | | | | | | | | | | | |
| State Street Navigator | | | | | | | | | | | | |
| Securities Lending Government Money Market Portfolio, 0.03% | | | | | | | | | | | | |
| (Cost $2,092,086) | | | | | | | 2,092,086 | | | | 2,092,086 | |
| TOTAL SHORT TERM INVESTMENTS | | | | | | | | | | | | |
| (Cost $2,104,656) | | | | | | | | | | | 2,104,656 | |
| | | | | | | | | | | | | |
| TOTAL INVESTMENTS (103.39%) | | | | | | | | | | | | |
| (Cost $63,740,943) | | | | | | | | | | $ | 61,502,123 | |
| LIABILITIES IN EXCESS OF OTHER ASSETS (-3.39%) | | | | | | | | | | | (2,015,277 | ) |
| NET ASSETS - 100.00% | | | | | | | | | | $ | 59,486,846 | |
| (a) | Security, or a portion of the security position is currently on loan. The total market value of securities on loan is $1,952,226. |
| (b) | Non-income producing security. |
See Notes to Financial Statements.
15 | November 30, 2021
Alerian Energy Infrastructure ETF
| Statement of Assets and Liabilities | November 30, 2021 |
| ASSETS: | | | |
| Investments, at value | | $ | 61,502,123 | |
| Receivable for Investments Sold | | | 2,008,777 | |
| Dividends receivable | | | 117,361 | |
| Total Assets | | | 63,628,261 | |
| | | | | |
| LIABILITIES: | | | | |
| Payable for investments purchased | | | 2,030,806 | |
| Payable to adviser | | | 18,523 | |
| Payable for collateral upon return of securities loaned | | | 2,092,086 | |
| Total Liabilities | | | 4,141,415 | |
| NET ASSETS | | $ | 59,486,846 | |
| | | | | |
| NET ASSETS CONSIST OF: | | | | |
| Paid-in capital | | $ | 67,634,146 | |
| Distributable earnings | | | (8,147,300 | ) |
| NET ASSETS | | $ | 59,486,846 | |
| | | | | |
| INVESTMENTS, AT COST | | $ | 63,740,943 | |
| | | | | |
| PRICING OF SHARES | | | | |
| Net Assets | | $ | 59,486,846 | |
| Shares of beneficial interest outstanding (Unlimited number of shares authorized, par value $0.01 per share) | | | 3,200,000 | |
| Net Asset Value, offering and redemption price per share | | $ | 18.59 | |
See Notes to Financial Statements.
16 | November 30, 2021
Alerian Energy Infrastructure ETF
| Statement of Operations | For the Year Ended November 30, 2021 |
| INVESTMENT INCOME: | | | |
| Dividends* | | $ | 3,620,972 | |
| Securities lending income | | | 1,972 | |
| Total Investment Income | | | 3,622,944 | |
| | | | | |
| EXPENSES: | | | | |
| Investment adviser fees | | | 288,661 | |
| Total Expenses | | | 288,661 | |
| NET INVESTMENT INCOME | | | 3,334,283 | |
| | | | | |
| REALIZED AND UNREALIZED GAIN/(LOSS): | | | | |
| Net realized loss on investments(a) | | | (5,674,384 | ) |
| Net realized loss on foreign currency transactions | | | (4,623 | ) |
| Net realized loss | | | (5,679,007 | ) |
| Net change in unrealized appreciation on investments | | | 18,199,127 | |
| Net change in unrealized depreciation on translation of assets and liabilities denominated in foreign currencies | | | (2,657 | ) |
| Net change in unrealized appreciation | | | 18,196,470 | |
| NET REALIZED AND UNREALIZED GAIN ON INVESTMENTS AND FOREIGN CURRENCIES | | | 12,517,463 | |
| NET INCREASE IN NET ASSETS RESULTING FROM OPERATIONS | | $ | 15,851,746 | |
| * Net of foreign tax withholding. | | $ | 170,455 | |
| (a) | Includes realized gain or loss as a result of in-kind transactions (See Note 4 in Notes to Financial Statements). |
See Notes to Financial Statements.
17 | November 30, 2021
Alerian Energy Infrastructure ETF
Statements of Changes in Net Assets
| | | For the Year Ended November 30, 2021 | | | For the Year Ended November 30, 2020 | |
| OPERATIONS: | | | | | | |
| Net investment income | | $ | 3,334,283 | | | $ | 2,357,712 | |
| Net realized loss | | | (5,679,007 | ) | | | (5,570,975 | ) |
| Net change in unrealized appreciation/(depreciation) | | | 18,196,470 | | | | (10,122,824 | ) |
| Net increase/(decrease) in net assets resulting from operations | | | 15,851,746 | | | | (13,336,087 | ) |
| | | | | | | | | |
| DISTRIBUTIONS: | | | | | | | | |
| From distributable earnings | | | (2,301,342 | ) | | | (1,140,689 | ) |
| From tax return of capital | | | (2,346,411 | ) | | | (1,627,034 | ) |
| Total distributions | | | (4,647,753 | ) | | | (2,767,723 | ) |
| | | | | | | | | |
| CAPITAL SHARE TRANSACTIONS: | | | | | | | | |
| Proceeds from sale of shares | | | 22,119,720 | | | | 20,059,786 | |
| Cost of shares redeemed | | | (10,825,316 | ) | | | (18,776,258 | ) |
| Net increase from share transactions | | | 11,294,404 | | | | 1,283,528 | |
| Net increase/(decrease) in net assets | | | 22,498,397 | | | | (14,820,282 | ) |
| | | | | | | | | |
| NET ASSETS: | | | | | | | | |
| Beginning of year | | | 36,988,449 | | | | 51,808,731 | |
| End of year | | $ | 59,486,846 | | | $ | 36,988,449 | |
| | | | | | | | | |
| OTHER INFORMATION: | | | | | | | | |
| CAPITAL SHARE TRANSACTIONS: | | | | | | | | |
| Beginning shares | | | 2,550,000 | | | | 2,700,000 | |
| Shares sold | | | 1,250,000 | | | | 1,250,000 | |
| Shares redeemed | | | (600,000 | ) | | | (1,400,000 | ) |
| Shares outstanding, end of year | | | 3,200,000 | | | | 2,550,000 | |
See Notes to Financial Statements.
18 | November 30, 2021
Alerian Energy Infrastructure ETF
| Financial Highlights | For a Share Outstanding Throughout the Periods Presented |
| | | For the Year Ended November 30, 2021 | | | For the Year Ended November 30, 2020 | | | For the Year Ended November 30, 2019 | | | For the Year Ended November 30, 2018 | | | For the Year Ended November 30, 2017 | |
| NET ASSET VALUE, BEGINNING OF PERIOD | | $ | 14.51 | | | $ | 19.19 | | | $ | 20.34 | | | $ | 22.30 | | | $ | 22.95 | |
| | | | | | | | | | | | | | | | | | | | | |
| INCOME/(LOSS) FROM INVESTMENT OPERATIONS: | | | | | | | | | | | | | | | | | | | | |
| Net investment income(a) | | | 1.08 | | | | 0.90 | | | | 0.88 | | | | 0.85 | | | | 0.79 | |
| Net realized and unrealized gain/(loss) on investments | | | 4.49 | | | | (4.50 | ) | | | (0.64 | ) | | | (2.23 | ) | | | (0.72 | ) |
| Total from investment operations | | | 5.57 | | | | (3.60 | ) | | | 0.24 | | | | (1.38 | ) | | | 0.07 | |
| | | | | | | | | | | | | | | | | | | | | |
| DISTRIBUTIONS: | | | | | | | | | | | | | | | | | | | | |
| From net investment income | | | (0.74 | ) | | | (0.45 | ) | | | (0.50 | ) | | | (0.47 | ) | | | (0.47 | ) |
| Tax return of capital | | | (0.75 | ) | | | (0.63 | ) | | | (0.89 | ) | | | (0.11 | ) | | | (0.25 | ) |
| Total distributions | | | (1.49 | ) | | | (1.08 | ) | | | (1.39 | ) | | | (0.58 | ) | | | (0.72 | ) |
| | | | | | | | | | | | | | | | | | | | | |
| NET INCREASE/(DECREASE) IN NET ASSET VALUE | | | 4.08 | | | | (4.68 | ) | | | (1.15 | ) | | | (1.96 | ) | | | (0.65 | ) |
| NET ASSET VALUE, END OF PERIOD | | $ | 18.59 | | | $ | 14.51 | | | $ | 19.19 | | | $ | 20.34 | | | $ | 22.30 | |
| TOTAL RETURN(b) | | | 38.93 | % | | | (18.82 | )% | | | 1.09 | % | | | (6.27 | )% | | | 0.21 | % |
| | | | | | | | | | | | | | | | | | | | | |
| RATIOS/SUPPLEMENTAL DATA: | | | | | | | | | | | | | | | | | | | | |
| Net assets, end of period (000s) | | $ | 59,487 | | | $ | 36,988 | | | $ | 51,809 | | | $ | 41,699 | | | $ | 42,370 | |
| | | | | | | | | | | | | | | | | | | | | |
| Ratio of expenses to average net assets | | | 0.51 | %(c) | | | 0.65 | % | | | 0.65 | % | | | 0.65 | % | | | 0.65 | % |
| Ratio of net investment income to average net assets | | | 5.84 | % | | | 5.91 | % | | | 4.23 | % | | | 3.86 | % | | | 3.39 | % |
| PORTFOLIO TURNOVER RATE(d) | | | 34 | % | | | 34 | % | | | 26 | % | | | 73 | % | | | 37 | % |
| (a) | Based on average shares outstanding during the period. |
| (b) | Total return is calculated assuming an initial investment made at the net assets value at the beginning of the period and redemption at the net asset value on the last day of the period and assuming all distributions are reinvested at actual reinvestment prices. Total return calculated for a period of less than one year is not annualized. |
| (c) | Effective July 1, 2021, the Fund's Advisory Fee changed from 0.65% to 0.35%. |
| (d) | Portfolio turnover for periods less than one year is not annualized and does not include securities received or delivered from processing creations or redemptions in-kind. |
See Notes to Financial Statements.
19 | November 30, 2021
Alerian Exchange Traded Funds
| Notes to Financial Statements | November 30, 2021 |
1. ORGANIZATION
ALPS ETF Trust (the “Trust”), a Delaware statutory trust, is an open-end management investment company registered under the Investment Company Act of 1940, as amended (the “1940 Act”). As of November 30, 2021, the Trust consisted of eighteen separate portfolios. Each portfolio represents a separate series of the Trust. This report pertains to the Alerian MLP ETF and the Alerian Energy Infrastructure ETF (each a “Fund” and collectively, the “Funds”).
The investment objective of the Alerian MLP ETF is to seek investment results that correspond (before fees and expenses) generally to the price and yield performance of its underlying index, the Alerian MLP Infrastructure Total Return Index. The investment objective of the Alerian Energy Infrastructure ETF is to seek investment results that correspond (before fees and expenses) generally to the price and yield performance of its underlying index, the Alerian Midstream Energy Select Total Return Index. The investment advisor uses a “passive management” or indexing investment approach to try to achieve each Fund’s investment objective. Each Fund is considered non-diversified and may invest a greater portion of assets in securities of individual issuers than a diversified fund. As a result, changes in the market value of a single investment could cause greater fluctuations in share price than would occur in a diversified fund.
Each Fund’s Shares (“Shares”) are listed on the NYSE Arca, Inc. (“the NYSE Arca”). Each Fund issues and redeems Shares at net asset value (“NAV”), in blocks of 25,000 Shares, each of which is called a “Creation Unit”. Creation Units are issued and redeemed principally in-kind for securities included in the Underlying Index. Except when aggregated in Creation Units, Shares are not redeemable securities of the Fund. On October, 1, 2021, Alerian Energy Infrastructure ETF reduced its Creation Unit size from 50,000 to 25,000 shares.
The Board authorized a one-for-five reverse stock split of Alerian MLP ETF that was effective at the market open on May 18, 2020. The impact of the reverse stock split was to decrease the number of shares outstanding by a factor of five, while increasing the NAV of shares outstanding by a factor of five, resulting in no effect to the net assets of the Fund. The financial statements of the Fund have been adjusted to reflect the reverse stock split.
Pursuant to the Trust’s organizational documents, its Officers and Trustees are indemnified against certain liability arising out of the performance of their duties to the Trust. Additionally, in the normal course of business, the Trust enters into contracts with service providers that contain general indemnification clauses. The Trust’s maximum exposure under these arrangements is unknown, as this would involve future claims that may be made against the Trust that have not yet occurred.
2. SIGNIFICANT ACCOUNTING POLICIES
The following is a summary of significant accounting policies consistently followed by the Funds in the preparation of the financial statements. The accompanying financial statements were prepared in accordance with accounting principles generally accepted in the United States of America (“U.S. GAAP”). The preparation of financial statements in conformity with U.S. GAAP requires management to make certain estimates and assumptions that affect the reported amounts of assets and liabilities and disclosures of contingent assets and liabilities at the date of the financial statements and the reported amounts of revenue and expenses during the period. Actual results could differ from those estimates. Each Fund is considered an investment company under U.S. GAAP and follows the accounting and reporting guidance applicable to investment companies in the Financial Accounting Standards Board (“FASB”) Accounting Standards Codification Topic 946.
A. Portfolio Valuation
Each Fund’s NAV is determined daily, as of the close of regular trading on the New York Stock Exchange (“NYSE”), normally 4:00 p.m. Eastern Time, on each day the NYSE is open for trading. The NAV is computed by dividing the value of all assets of the Fund (including accrued interest and dividends), less all liabilities (including accrued expenses and dividends declared but unpaid), by the total number of shares outstanding.
Portfolio securities listed on any exchange other than the NASDAQ Stock Market LLC (“NASDAQ”) are valued at the last sale price on the business day as of which such value is being determined. If there has been no sale on such day, the securities are valued at the mean of the most recent bid and ask prices on such day. Securities traded on the NASDAQ are valued at the NASDAQ Official Closing Price as determined by NASDAQ. Portfolio securities traded on more than one securities exchange are valued at the last sale price on the business day as of which such value is being determined at the close of the exchange representing the principal market for such securities. Portfolio securities traded in the over-the-counter market, but excluding securities traded on the NASDAQ, are valued at the latest quoted sale price in such market.
20 | November 30, 2021
Alerian Exchange Traded Funds
| Notes to Financial Statements | November 30, 2021 |
The Funds’ investments are valued at market value or, in the absence of market value with respect to any portfolio securities, at fair value according to procedures adopted by the Trust’s Board of Trustees (the “Board”). When market quotations are not readily available or when events occur that make established valuation methods unreliable, securities of the Funds may be valued in good faith by or under the direction of the Board. These securities generally include, but are not limited to, restricted securities (securities which may not be publicly sold without registration under the Securities Act of 1933) for which a pricing service is unable to provide a market price; securities whose trading has been formally suspended; a security whose market price is not available from a pre-established primary pricing source or the pricing source is not willing to provide a price; a security with respect to which an event has occurred that is most likely to materially affect the value of the security after the market has closed but before the calculation of the Funds’ NAV or make it difficult or impossible to obtain a reliable market quotation; or a security whose price, as provided by the pricing service, does not reflect the security’s “fair value” due to the security being de-listed from a national exchange or the security’s primary trading market is temporarily closed at a time when, under normal conditions, it would be open. As a general principle, the current “fair value” of a security would be the amount which the owner might reasonably expect to receive from the sale on the applicable exchange or principal market. A variety of factors may be considered in determining the fair value of such securities.
B. Fair Value Measurements
Each Fund discloses the classification of its fair value measurements following a three-tier hierarchy based on the inputs used to measure fair value. Inputs refer broadly to the assumptions that market participants would use in pricing the asset or liability, including assumptions about risk. Inputs may be observable or unobservable. Observable inputs reflect the assumptions market participants would use in pricing the asset or liability that are developed based on market data obtained from sources independent of the reporting entity. Unobservable inputs reflect the reporting entity’s own assumptions about the assumptions market participants would use in pricing the asset or liability that are developed based on the best information available.
Valuation techniques used to value the Funds’ investments by major category are as follows:
Equity securities, including restricted securities, and Limited Partnerships for which market quotations are readily available, are valued at the last reported sale price or official closing price as reported by a third party pricing vendor on the primary market or exchange on which they are traded and are categorized as Level 1 in the hierarchy. In the event there were no sales during the day or closing prices are not available, securities are valued at the mean of the most recent quoted bid and ask prices on such day and are generally categorized as Level 2 in the hierarchy. Investments in open-end mutual funds are valued at their closing NAV each business day and are categorized as Level 1 in the hierarchy.
Changes in valuation techniques may result in transfers in or out of an assigned level within the disclosure hierarchy.
Various inputs are used in determining the value of the Funds’ investments as of the end of the reporting period. When inputs used fall into different levels of the fair value hierarchy, the level in the hierarchy within which the fair value measurement falls is determined based on the lowest level input that is significant to the fair value measurement in its entirety. The designated input levels are not necessarily an indication of the risk or liquidity associated with these investments.
These inputs are categorized in the following hierarchy under applicable financial accounting standards:
| Level 1 – | Unadjusted quoted prices in active markets for identical investments, unrestricted assets or liabilities that a Fund has the ability to access at the measurement date; |
| Level 2 – | Quoted prices which are not active, quoted prices for similar assets or liabilities in active markets or inputs other than quoted prices that are observable (either directly or indirectly) for substantially the full term of the asset or liability; and |
| Level 3 – | Significant unobservable prices or inputs (including the Fund’s own assumptions in determining the fair value of investments) where there is little or no market activity for the asset or liability at the measurement date. |
21 | November 30, 2021
Alerian Exchange Traded Funds
| Notes to Financial Statements | November 30, 2021 |
The following is a summary of the inputs used to value each Fund’s investments as of November 30, 2021:
Alerian MLP ETF
| Investments in Securities at Value | | Level 1 - Quoted and Unadjusted Prices | | | Level 2 - Other Significant Observable Inputs | | | Level 3 - Significant Unobservable Inputs | | | Total | |
| Master Limited Partnerships* | | $ | 4,981,789,223 | | | $ | – | | | $ | – | | | $ | 4,981,789,223 | |
| Short Term Investments | | | 606,733 | | | | – | | | | – | | | | 606,733 | |
| Total | | $ | 4,982,395,956 | | | $ | – | | | $ | – | | | $ | 4,982,395,956 | |
Alerian Energy Infrastructure ETF
| Investments in Securities at Value | | Level 1 - Quoted and Unadjusted Prices | | | Level 2 - Other Significant Observable Inputs | | | Level 3 - Significant Unobservable Inputs | | | Total | |
| Canadian Energy Infrastructure Companies* | | $ | 17,250,307 | | | $ | – | | | $ | – | | | $ | 17,250,307 | |
| Exchange Traded Fund | | | 1,824,944 | | | | – | | | | – | | | | 1,824,944 | |
| U.S. Energy Infrastructure Companies* | | | 16,522,098 | | | | – | | | | – | | | | 16,522,098 | |
| U.S. Energy Infrastructure MLPs* | | | 15,266,794 | | | | – | | | | – | | | | 15,266,794 | |
| U.S. General Partners* | | | 8,533,324 | | | | – | | | | – | | | | 8,533,324 | |
| Short Term Investments | | | 2,104,656 | | | | – | | | | – | | | | 2,104,656 | |
| Total | | $ | 61,502,123 | | | $ | – | | | $ | – | | | $ | 61,502,123 | |
| * | For a detailed breakdown of sectors, see the accompanying Schedule of Investments. |
The Funds did not have any securities that used significant unobservable inputs (Level 3) in determining fair value and there were no transfers into or out of Level 3 during the year ended November 30, 2021.
C. Foreign Currency Translation
The books and records of the Funds are maintained in U.S. dollars. Investment valuations and other assets and liabilities initially expressed in foreign currencies are converted each business day into U.S. dollars based upon current exchange rates. The portion of realized and unrealized gains or losses on investments due to fluctuations in foreign currency exchange rates is not separately disclosed and is included in realized and unrealized gains or losses on investments, when applicable.
D. Securities Transactions and Investment Income
Securities transactions are recorded as of the trade date. Realized gains and losses from securities transactions are recorded on the specific identification in accordance with GAAP. Dividend income and capital gains distributions, if any, are recorded on the ex-dividend date, net of any foreign taxes withheld. Interest income, if any, is recorded on the accrual basis, including amortization of premiums and accretion of discounts.
E. Dividends and Distributions to Shareholders
Each Fund intends to declare and make quarterly distributions, or as the Board may determine from time to time. Distributions of net realized capital gains earned by the Alerian Energy Infrastructure ETF, if any, are distributed at least annually. Distributions from net investment income and capital gains are determined in accordance with income tax regulations, which may differ from U.S. GAAP. These differences are primarily due to differing treatments of income and gains on various investment securities held by the Funds, timing differences and differing characterization of distributions made by the Funds.
Distributions received from each Fund’s investments in Master Limited Partnerships (“MLPs”) may be comprised of both income and return of capital. Each Fund records investment income and return of capital based on estimates made at the time such distributions are received. Such estimates are based on historical information available from each MLP and other industry sources. These estimates may subsequently be revised based on information received from MLPs after their tax reporting periods are concluded.
The Funds each expect a portion of its distributions to shareholders might be comprised of tax deferred return of capital. Return of capital distributions are not taxable income to the shareholder, but reduce the investor’s tax basis in the investor’s Fund Shares. Such a reduction in tax basis will result in larger taxable gains and/or lower tax losses on a subsequent sale of Fund Shares. Shareholders who periodically receive the payment of dividends or other distributions consisting of a return of capital may be under the impression that they are receiving net profits from the Funds when, in fact, they are not. Shareholders should not assume that the source of the distributions is from the net profits of the Funds.
22 | November 30, 2021
Alerian Exchange Traded Funds
| Notes to Financial Statements | November 30, 2021 |
F. Federal Income Taxation and Tax Basis Information
Alerian MLP ETF
The Fund is taxed as a regular C-corporation for federal income tax purposes and as such is obligated to pay federal and state income tax. This treatment differs from most investment companies, which elect to be treated as “regulated investment companies” under the Internal Revenue Code of 1986, as amended (the “Code”) in order to avoid paying entity level income taxes. Under current law, the Fund is not eligible to elect treatment as a regulated investment company due to its investments primarily in MLPs invested in energy assets. The Fund expects that substantially all of the distributions it receives from MLPs may be treated as a tax-deferred return of capital, thus reducing the Fund’s current tax liability. However, the amount of taxes paid by the Fund will vary depending on the amount of income and gains derived from investments and/or sales of MLP interests and such taxes will reduce your return from an investment in the Fund.
Since the Fund will be subject to taxation on its taxable income, the NAV of the Fund shares will also be reduced by the accrual of any deferred tax liabilities. The Underlying Index however is calculated without any deductions for taxes. As a result, the Fund's after tax performance could differ significantly from the Underlying Index even if the pretax performance of the Fund and the performance of Underlying Index are closely related.
Cash distributions from MLPs to the Fund that exceed the Fund’s allocable share of such MLP’s net taxable income are considered a tax deferred return of capital that will reduce the Fund’s adjusted tax basis in the equity securities of the MLP. These reductions in the Fund’s adjusted tax basis in the MLP equity securities will increase the amount of any taxable gain (or decrease the amount of any tax loss) recognized by the Fund on a subsequent sale of the securities. The Fund will accrue deferred income taxes for any future tax liability associated with (i) that portion of MLP distributions considered to be a tax-deferred return of capital as well as (ii) capital appreciation of its investments. Upon the sale of an MLP security, the Fund may be liable for previously deferred taxes. The Fund will rely to some extent on information provided by the MLPs, which is not necessarily timely, to estimate the deferred tax liability for purposes of financial statement reporting and determining the Fund’s NAV. From time to time, the Adviser will modify the estimates or assumptions related to the Fund’s deferred tax liability as new information becomes available. The Fund will generally compute deferred income taxes based on the federal income tax rate applicable to corporations and an assumed rate attributable to state taxes.
The Fund’s income tax expense/(benefit) consists of the following:
| Alerian MLP ETF | | | | | Year ended
November 30, 2021 | | | | |
| | | Current | | | Deferred | | | Total | |
| Federal | | $ | – | | | $ | 355,795,901 | | | $ | 355,795,901 | |
| State | | | 1,010,442 | | | | 33,559,734 | | | | 34,570,176 | |
| Valuation Allowance | | | – | | | | (389,355,635 | ) | | | (389,355,635 | ) |
| Total tax expense/(benefit) | | $ | 1,010,442 | | | $ | – | | | $ | 1,010,442 | |
Deferred income taxes reflect the net tax effect of temporary differences between the carrying amount of assets and liabilities for financial reporting and tax purposes.
Components of the Fund’s deferred tax assets and liabilities are as follows:
| Alerian MLP ETF | | As of November 30, 2021 | |
| Deferred tax assets: | | | |
| Capital loss carryforward | | $ | 555,109,326 | |
| Net operating loss carryforward | | | 145,850,354 | |
| Income recognized from MLP investments | | | 1,474,568,495 | |
| Other deferred tax assets | | | 9,517,179 | |
| Valuation allowance | | | (467,857,482 | ) |
| Less Deferred tax liabilities: | | | | |
| Net unrealized gain on investment securities | | | (1,717,187,872 | ) |
| Net Deferred Tax Asset/(Liability) | | $ | – | |
Due to the activities of the MLPs that the fund is invested in, the Fund is required to pay franchise tax in certain states. Generally speaking, franchise tax expense is a tax on equity of a corporation, or base minimum fees, imposed by various jurisdictions. The amounts of the tax are estimated throughout the year based upon the Fund's estimate of underlying activities conducted in the states and reconciled to actual amounts paid upon the filing of the tax returns for the states. These taxes are paid as either estimated tax payments, extension payments, or with the tax return filings of the various states.
23 | November 30, 2021
Alerian Exchange Traded Funds
| Notes to Financial Statements | November 30, 2021 |
The capital loss carryforward is available to offset future taxable income. The capital loss can be carried forward for 5 years and, accordingly, would begin to expire as of November 30, 2022. The Fund has net capital loss carryforwards for federal income tax purposes as follows:
| Alerian MLP ETF | | Period-Ended | | | Amount | | | Expiration | |
| Federal | | | 11/30/2017 | | | $ | 20,624,857 | | | | 11/30/2022 | |
| Federal | | | 11/30/2019 | | | | 757,980,977 | | | | 11/30/2024 | |
| Federal | | | 11/30/2020 | | | | 1,033,570,048 | | | | 11/30/2025 | |
| Federal | | | 11/30/2021 | | | | 632,162,849 | | | | 11/30/2026 | |
| Total | | | | | | $ | 2,444,338,731 | | | | | |
The net operating loss carryforward is available to offset future taxable income. The Fund has net operating loss carryforwards for federal income tax purposes as follows:
| Alerian MLP ETF | | Period-Ended | | | Amount | | | Expiration | |
| Federal | | | 11/30/2016 | | | | 67,938,510 | | | | 11/30/2036 | |
| Federal | | | 11/30/2017 | | | | 343,920,173 | | | | 11/30/2037 | |
| Federal | | | 11/30/2021 | | | | 152,430,737 | | | | Indefinite | |
| Total | | | | | | $ | 564,289,420 | | | | | |
The Fund also has state tax net operating loss carryforwards of various amounts per state. The Deferred Tax Assets associated with these state tax net operating losses are as follows:
| Alerian MLP ETF | | Period-Ended | | | Amount | | | Expiration |
| State | | | 11/30/2016 | | | | 3,913,692 | | | Varies by State |
| State | | | 11/30/2017 | | | | 7,472,303 | | | Varies by State |
| State | | | 11/30/2018 | | | | 2,553,292 | | | Varies by State |
| State | | | 11/30/2019 | | | | 2,244,759 | | | Varies by State |
| State | | | 11/30/2020 | | | | 8,558,965 | | | Varies by State |
| State | | | 11/30/2021 | | | | 2,606,566 | | | Varies by State |
| Total | | | | | | $ | 27,349,577 | | | |
The Tax Cuts and Jobs Act (“TCJA”) was signed into law on December 22, 2017. The TCJA made modifications to the net operating loss (“NOL”) deduction. The TCJA eliminated the NOL carryback ability and replaced the 20 year carryforward period with an indefinite carryforward period for any NOLs arising in tax years beginning after December 31, 2017. The TCJA also established a limitation for any NOLs generated in tax years beginning after December 31, 2017 to the lesser of the aggregate of available NOLs or 80% of taxable income before any NOL utilization. The Coronavirus Aid, Relief, and Economic Stability Act (“CARES Act”) was signed into law on March 27, 2020. The CARES Act delays the application of the 80% net operating loss limitation, established under TCJA, to tax years ending November 30, 2022 and beyond.
The Fund reviews the recoverability of its deferred tax assets based upon the weight of available evidence. When assessing the recoverability of its deferred tax assets, significant weight was given to the effects of potential future realized and unrealized gains on investments and the period over which these deferred tax assets can be realized. Currently, any capital losses that may be generated by the Fund are eligible to be carried back up to three years and can be carried forward for five years to offset capital gains recognized by the Fund in those years.
Based upon the Fund’s assessment, it has determined that it is “more-likely-than-not” that a portion of its deferred tax assets will not be realized through future taxable income of the appropriate character. Accordingly, a valuation allowance has been established for the Fund’s deferred tax assets. The Fund will continue to assess the need for a valuation allowance in the future. Significant increases in the fair value of its portfolio of investments may change the Fund’s assessment of the recoverability of these assets and may result in the removal of the valuation allowance against all or a portion of the Fund’s gross deferred tax assets.
24 | November 30, 2021
Alerian Exchange Traded Funds
| Notes to Financial Statements | November 30, 2021 |
Total income tax expense/(benefit) (current and deferred) differs from the amount computed by applying the federal statutory income tax rate of 21% to net investment income and realized and unrealized gain/(losses) on investment before taxes as follows:
| Alerian MLP ETF | | As of November 30, 2021 | |
| Income tax expense at statutory rate | | $ | 310,912,140 | |
| State income taxes (net of federal benefit) | | | 25,317,132 | |
| Permanent differences, net | | | 46,296,606 | |
| Effect of tax rate change | | | 7,840,198 | |
| Valuation allowance | | | (389,355,634 | ) |
| Net income tax expense | | $ | 1,010,442 | |
The following is a tabular reconciliation of the total amounts of unrecognized tax benefits:
| Alerian MLP ETF | | | Inception to November 30, 2021 | |
| Unrecognized tax benefit - Beginning | | $ | – | |
| Gross increases - tax positions in prior period | | | – | |
| Gross decreases - tax positions in prior period | | | – | |
| Gross increases - tax positions in current period | | | – | |
| Settlement | | | – | |
| Lapse of statute of limitations | | | – | |
| Unrecognized tax benefit - Ending | | $ | – | |
The Fund recognizes interest accrued related to unrecognized tax benefits and penalties as income tax expense. For the year ended November 30, 2021, the Fund paid $12,356 in penalties and interest.
The Fund recognizes the tax benefits of uncertain tax positions only where the position is “more-likely-than-not” to be sustained assuming examination by tax authorities. Management has analyzed the Fund’s tax positions, and has concluded that no liability for unrecognized tax benefits should be recorded related to uncertain tax positions taken on U.S. tax returns and state tax returns filed since inception of the Fund. Tax periods ended November 30, 2018 through November 30, 2020 remain subject to examination by tax authorities in the United States. Due to the nature of the Fund’s investments, the Fund may be required to file income tax returns in several states. The Fund is not aware of any tax positions for which it is reasonably possible that the total amounts of unrecognized tax benefits will change materially in the next 12 months.
Alerian Energy Infrastructure ETF
The timing and character of income and capital gain distributions are determined in accordance with income tax regulations, which may differ from U.S. GAAP. Reclassifications are made to the Fund’s capital accounts for permanent tax differences to reflect income and gains available for distribution (or available capital loss carryforwards) under income tax regulations.
No provision for income taxes is included in the accompanying financial statements, as the Alerian Energy Infrastructure ETF intends to distribute to shareholders all taxable investment income and realized gains and otherwise comply with Subchapter M of the Internal Revenue Code of 1986, as amended, applicable to regulated investment companies. The Alerian Energy Infrastructure ETF evaluates tax positions taken (or expected to be taken) in the course of preparing the Fund’s tax returns to determine whether these positions meet a “more-likely-than-not” standard that, based on the technical merits, have a more than fifty percent likelihood of being sustained by a taxing authority upon examination. A tax position that meets the “more-likely-than-not” recognition threshold is measured to determine the amount of benefit to recognize in the financial statements.
As of and during the year ended November 30, 2021, the Alerian Energy Infrastructure ETF did not have a liability for any unrecognized tax benefits. The Alerian Energy Infrastructure ETF files U.S. federal, state, and local tax returns as required. The Fund’s tax returns are subject to examination by the relevant tax authorities until expiration of the applicable statute of limitations, which is generally three years after the filing of the tax return, but may extend to four years in certain jurisdictions. Tax returns for open years have incorporated no uncertain tax positions that require a provision for income taxes.
25 | November 30, 2021
Alerian Exchange Traded Funds
| Notes to Financial Statements | November 30, 2021 |
For the year ended November 30, 2021, permanent book and tax differences resulting primarily from differing treatment of investments in partnerships and redemptions in kind were identified and reclassified among components of the Fund’s net assets as follows:
| Fund | | Paid-in Capital | | | Total Distributable Earnings | |
| Alerian Energy Infrastructure ETF | | $ | 2,354,429 | | | $ | (2,354,429 | ) |
The tax character of the distributions paid during the fiscal year ended November 30, 2021 and November 30, 2020 was as follows:
| | Ordinary Income | | | Long-Term Capital Gain | | | Return of Capital | |
| November 30, 2021 | | | | | | | | | |
| Alerian Energy Infrastructure ETF | | $ | 2,301,342 | | | $ | – | | | $ | 2,346,411 | |
| | Ordinary Income | | | Long-Term Capital Gain | | | Return of Capital | |
| November 30, 2020 | | | | | | | | | |
| Alerian Energy Infrastructure ETF | | $ | 1,140,689 | | | $ | – | | | $ | 1,627,034 | |
The character of distributions made during the year may differ from its ultimate characterization for federal income tax purposes.
Under current law, capital losses maintain their character as short-term or long-term and are carried forward to the next tax year without expiration. As of November 30, 2021, the following amounts are available as carry forwards to the next tax year:
| | | Short-Term | | | Long-Term | |
| Alerian Energy Infrastructure ETF | | $ | 309,653 | | | $ | 3,183,203 | |
As of November 30, 2021, the components of distributable earnings on a tax basis were as follows:
| | | Alerian Energy Infrastructure ETF | |
| Accumulated net realized loss on investments | | $ | (3,492,856 | ) |
| Net unrealized depreciation on investments | | | (78,149 | ) |
| Other accumulated losses | | | (4,576,295 | ) |
| Total | | $ | (8,147,300 | ) |
As of November 30, 2021, the costs of investments for federal income tax purposes and accumulated net unrealized appreciation/(depreciation) on investments were as follows:
| | | Alerian MLP ETF | | | Alerian Energy Infrastructure ETF | |
| Cost of investments for income tax purposes | | $ | 3,830,872,327 | | | $ | 61,578,366 | |
| Gross appreciation (excess of value over tax cost) | | $ | 2,214,241,369 | | | $ | 8,962,768 | |
| Gross depreciation (excess of tax cost over value) | | | (1,062,717,740 | ) | | | (9,039,011 | ) |
| Net appreciation (depreciation) of foreign currency | | | – | | | | (1,906 | ) |
| Net unrealized appreciation/(depreciation) | | $ | 1,151,523,629 | | | $ | (78,149 | ) |
The difference between cost amounts for financial statement purposes is due primarily to the recognition of pass-through income from a Fund’s investments in master limited partnerships and wash sales.
G. Lending of Portfolio Securities
The Alerian Energy Infrastructure ETF has entered into a securities lending agreement with State Street Bank & Trust Co. (“SSB”), the Fund’s lending agent. The Fund may lend its portfolio securities only to borrowers that are approved by SSB. The Fund will limit such lending to not more than 33 1/3% of the value of its total assets. The Fund’s securities held at SSB as custodian shall be available to be lent except those securities the Fund or ALPS Advisors, Inc. specifically identifies in writing as not being available for lending. The borrower pledges and maintains with the Fund collateral consisting of cash (U.S. Dollars only), securities issued or guaranteed by the U.S. government or its agencies or instrumentalities, and cash equivalents (including irrevocable bank letters of credit) issued by a person other than the borrower or an affiliate of the borrower. The initial collateral received by the Fund is required to have a value of no less than 102% of the market value of the loaned securities for U.S equity securities and a value of no less than 105% of the market value for non-U.S. equity securities. The collateral is maintained thereafter, at a market value equal to not less than 102% of the current value of the U.S. equity securities on loan and not less than 105% of the current value of the non-U.S. equity securities on loan. The market value of the loaned securities is determined at the close of each business day and any additional required collateral is delivered to the Fund on the next business day. During the term of the loan, the Fund is entitled to all distributions made on or in respect of the loaned securities. Loans of securities are terminable at any time and the borrower, after notice, is required to return borrowed securities within the customary time period for settlement of securities transactions.
26 | November 30, 2021
Alerian Exchange Traded Funds
| Notes to Financial Statements | November 30, 2021 |
Any cash collateral received is reinvested in a money market fund managed by SSB as disclosed in the Fund’s Schedule of Investments and is reflected in the Statements of Assets and Liabilities as a payable for collateral upon return of securities loaned. Non-cash collateral, in the form of securities issued or guaranteed by the U.S. government or its agencies or instrumentalities, is not disclosed in the Fund’s Statements of Assets and Liabilities as it is held by the lending agent on behalf of the Fund, and the Fund does not have the ability to re-hypothecate these securities. Income earned by the Fund from securities lending activity is disclosed in the Statement of Operations.
The following is a summary of the Fund's securities lending agreement and related cash and non-cash collateral received as of November 30, 2021:
| | | Market Value of Securities on Loan | | | Cash Collateral Received | | | Non-Cash Collateral Received | | | Total Collateral Received | |
| Alerian Energy Infrastructure ETF | | $ | 1,952,226 | | | $ | 2,092,086 | | | $ | – | | | $ | 2,092,086 | |
The risks of securities lending include the risk that the borrower may not provide additional collateral when required or may not return the securities when due. To mitigate these risks, the Fund benefits from a borrower default indemnity provided by SSB. SSB’s indemnity allows for full replacement of securities lent wherein SSB will purchase the unreturned loaned securities on the open market by applying the proceeds of the collateral, or to the extent such proceeds are insufficient or the collateral is unavailable, SSB will purchase the unreturned loan securities at SSB’s expense. However, the Fund could suffer a loss if the value of the investments purchased with cash collateral falls below the value of the cash collateral received.
The following table reflects a breakdown of transactions accounted for as secured borrowings, the gross obligation by the type of collateral pledged or securities loaned, and the remaining contractual maturity of those transactions as of November 30, 2021:
| Alerian Energy Infrastructure ETF | Remaining contractual maturity of the agreements |
| Securities Lending Transactions | | Overnight & Continuous | | | Up to 30 days | | | 30-90 days | | | Greater than 90 days | | | Total | |
| Common Stocks | | $ | 2,092,086 | | | $ | – | | | $ | – | | | $ | – | | | $ | 2,092,086 | |
| Total Borrowings | | | | | | | | | | | | | | | | | | | 2,092,086 | |
| Gross amount of recognized liabilities for securities lending (collateral received) | | | $ | 2,092,086 | |
3. INVESTMENT ADVISORY FEE AND OTHER AFFILIATED TRANSACTIONS
ALPS Advisors, Inc. (the “Adviser”) serves as the Funds’ investment adviser pursuant to an Investment Advisory Agreement with the Trust on behalf of each Fund (the “Advisory Agreement”). Pursuant to the Advisory Agreement, each Fund pays the Adviser an annual management fee for the services and facilities it provides, payable on a monthly basis as a percentage of the relevant Fund’s average daily net assets as set out below.
| Fund | | Advisory Fee |
| Alerian MLP ETF | 0.85% | up to and including $10 billion |
| | 0.80% | greater than $10 billion up to and including $15 billion |
| | 0.70% | greater than $15 billion up to and including $20 billion |
| | 0.55% | greater than $20 billion up to and including $25 billion |
| | 0.40% | greater than $25 billion |
| Fund | | Advisory Fee |
| Alerian Energy Infrastructure ETF | 0.35%* | |
| * | Effective July 1, 2021, the Alerian Energy Infrastructure ETF changed its management fee from 0.65% to 0.35%. |
27 | November 30, 2021
Alerian Exchange Traded Funds
| Notes to Financial Statements | November 30, 2021 |
Out of the unitary management fees, the Adviser pays substantially all expenses of each Fund, including the cost of transfer agency, custody, fund administration, legal, audit, trustees and other services, except for interest expenses, distribution fees or expenses, brokerage expenses, taxes and extraordinary expenses not incurred in the ordinary course of each Fund's business. The Adviser’s unitary management fee is designed to pay substantially all of each Fund’s expenses and to compensate the Adviser for providing services for each Fund.
ALPS Fund Services, Inc., an affiliate of the Adviser, is the administrator of the Funds.
Each Trustee receives (1) a quarterly retainer of $10,000, (2) a per meeting fee of $5,000, (3) $1,500 for any special meeting held outside of a regularly scheduled board meeting, and (4) reimbursement for all reasonable out-of-pocket expenses relating to attendance at meetings. In addition, the Chairman of the Board and Chairman of the Audit Committee each receives a quarterly retainer of $2,000, in connection with their respective roles.
4. PURCHASES AND SALES OF SECURITIES
For the year ended November 30, 2021, the cost of purchases and proceeds from sales of investment securities, excluding short-term investments and in-kind transactions, were as follows:
| Fund | | Purchases | | | Sales | |
| Alerian MLP ETF | | $ | 1,007,815,159 | | | $ | 2,056,333,024 | |
| Alerian Energy Infrastructure ETF | | | 19,624,493 | | | | 19,154,710 | |
For the year ended November 30, 2021, the cost of in-kind purchases and proceeds from in-kind sales were as follows:
| Fund | | Purchases | | | Sales | |
| Alerian MLP ETF | | $ | 1,050,746,881 | | | $ | – | |
| Alerian Energy Infrastructure ETF | | | 22,106,051 | | | | 10,824,164 | |
For the year ended November 30, 2021, the Alerian Energy Infrastructure ETF had in-kind net realized gain of $2,600,602.
Gains on in-kind transactions are not considered taxable for federal income tax purposes and losses on in-kind transactions are also not deductible for tax purposes.
5. MASTER LIMITED PARTNERSHIPS
MLPs are publicly traded partnerships engaged in, among other things, the transportation, storage and processing of minerals and natural resources, and are treated as partnerships for U.S. federal income tax purposes. By confining their operations to these specific activities, their interests, or units, are able to trade on public securities exchanges exactly like the shares of a corporation, without entity level taxation. To qualify as a MLP and to not be taxed as a corporation, a partnership must receive at least 90% of its income from qualifying sources as set forth in Section 7704(d) of the Code. These qualifying sources include, among other things, natural resource-based activities such as the processing, transportation and storage of mineral or natural resources. MLPs generally have two classes of owners, the general partner and limited partners. The general partner of an MLP is typically owned by a major energy company, an investment fund, the direct management of the MLP, or is an entity owned by one or more of such parties. The general partner may be structured as a private or publicly traded corporation or other entity. The general partner typically controls the operations and management of the MLP through an up to 2% equity interest in the MLP plus, in many cases, ownership of common units and subordinated units. Limited partners typically own the remainder of the partnership, through ownership of common units, and have a limited role in the partnership’s operations and management.
MLPs are typically structured such that common units and general partner interests have first priority to receive quarterly cash distributions up to an established minimum amount (“minimum quarterly distributions” or “MQD”). Common and general partner interests also accrue arrearages in distributions to the extent the MQD is not paid. Once common and general partner interests have been paid, subordinated units receive distributions of up to the MQD; however, subordinated units do not accrue arrearages. Distributable cash in excess of the MQD is distributed to both common and subordinated units and generally on a pro rata basis. The general partner is also eligible to receive incentive distributions if the general partner operates the business in a manner which results in distributions paid per common unit surpassing specified target levels. As the general partner increases cash distributions to the limited partners, the general partner receives an increasingly higher percentage of the incremental cash distributions.
28 | November 30, 2021
Alerian Exchange Traded Funds
| Notes to Financial Statements | November 30, 2021 |
6. CAPITAL SHARE TRANSACTIONS
Shares are created and redeemed by each Fund only in Creation Unit size aggregations of 25,000 Shares. On October 1, 2021, Alerian Energy Infrastructure ETF reduced its Creation Unit size from 50,000 to 25,000 Shares. Only broker-dealers or large institutional investors with creation and redemption agreements called Authorized Participants (“AP”) are permitted to purchase or redeem Creation Units from the Funds. Such transactions are generally permitted on an in-kind basis, with a balancing cash component to equate the transaction to the NAV per unit of each Fund on the transaction date. Cash may be substituted equivalent to the value of certain securities generally when they are not available in sufficient quantity for delivery, not eligible for trading by the AP or as a result of other market circumstances.
7. RELATED PARTY TRANSACTIONS
The Funds engaged in cross trades between other funds in the Trust during the year ended November 30, 2021 pursuant to Rule 17a-7 under the 1940 Act. Cross trading is the buying or selling of portfolio securities between funds to which the Adviser serves as the investment adviser. The Board previously adopted procedures that apply to transactions between the Funds of the Trust pursuant to Rule 17a-7. These transactions related to cross trades during the period complied with the requirements set forth by Rule 17a-7 and the Trust’s procedures.
Transactions related to cross trades during the year ended November 30, 2021, were as follows:
| Fund | | Purchase cost paid | | | Sale proceeds received | | | Realized gain/(loss) on sales | |
| Alerian MLP ETF | | $ | 487,497 | | | $ | 968,039 | | | $ | (67,830 | ) |
| Alerian Energy Infrastructure ETF | | | 605,557 | | | | 2,121,975 | | | | (1,835,906 | ) |
29 | November 30, 2021
Alerian Exchange Traded Funds
| Notes to Financial Statements | November 30, 2021 |
8. AFFILIATED COMPANIES
As defined by the Investment Company Act of 1940, an affiliated person, including an affiliated company, is one in which a Fund owns 5% or more of the outstanding voting securities, or a company which is under common ownership or control with the Fund.
For the year ended November 30, 2021, the Alerian MLP ETF held shares in the following affiliates, as defined by the Investment Company Act of 1940.
| Security Name | | Share Balance as of November 30, 2021 | | | Market Value as of November 30, 2020 | | | Purchases | | | Purchases In-Kind | | | Sales | | | Market Value as of November 30, 2021 | | | Dividends* | | | Change in Unrealized Gain/(Loss) | | | Realized Gain/(Loss) | |
| Affiliated Investments as of November 30, 2021 | | | | | | | | | | | | | | | | | | | |
| Crestwood Equity Partners LP | | | 7,496,856 | | | $ | 101,531,691 | | | $ | 41,085,833 | | | $ | 37,059,822 | | | $ | (42,727,153 | ) | | $ | 191,619,639 | | | $ | – | | | $ | 75,458,281 | | | $ | (3,250,496 | ) |
| DCP Midstream LP | | | 11,614,338 | | | | 179,947,999 | | | | 20,666,729 | | | | 60,691,003 | | | | (69,415,973 | ) | | | 305,805,520 | | | | – | | | | 134,150,882 | | | | (2,116,210 | ) |
| EnLink Midstream LLC | | | 42,917,395 | | | | 119,052,199 | | | | 69,823,102 | | | | 42,632,836 | | | | (42,889,916 | ) | | | 279,392,241 | | | | – | | | | 132,853,096 | | | | (28,578,559 | ) |
| Genesis Energy LP | | | 14,145,817 | | | | 86,198,857 | | | | 10,830,222 | | | | 27,115,669 | | | | (29,250,281 | ) | | | 142,731,294 | | | | – | | | | 89,232,882 | | | | (32,950,909 | ) |
| Holly Energy Partners LP | | | 5,930,480 | | | | 76,290,764 | | | | 9,621,102 | | | | 21,847,356 | | | | (25,757,986 | ) | | | 99,394,845 | | | | – | | | | 25,672,946 | | | | (19,954 | ) |
| Magellan Midstream Partners LP | | | 10,672,793 | | | | 375,129,243 | | | | 103,844,955 | | | | 100,929,554 | | | | (140,138,448 | ) | | | 495,004,139 | | | | – | | | | 100,650,536 | | | | (1,222,625 | ) |
| NuStar Energy LP | | | 12,831,134 | | | | 161,682,778 | | | | 19,567,890 | | | | 44,942,526 | | | | (51,067,546 | ) | | | 179,635,876 | | | | – | | | | 43,825,841 | | | | (18,915,425 | ) |
| Plains All American Pipeline LP | | | 53,477,843 | | | | 400,072,962 | | | | 78,854,524 | | | | 106,735,891 | | | | (161,923,449 | ) | | | 497,343,940 | | | | – | | | | 269,618,733 | | | | (158,691,185 | ) |
| Western Midstream Partners LP | | | 25,467,949 | | | | 319,874,889 | | | | 44,005,630 | | | | 101,134,923 | | | | (130,494,652 | ) | | | 489,748,659 | | | | – | | | | 219,603,617 | | | | (31,784,406 | ) |
| | | | | | | | | | | | | | | | | | | | | | | $ | 2,680,676,153 | | | $ | – | | | $ | 1,091,065,814 | | | $ | (277,529,769 | ) |
| Investments no longer affiliated as of November 30, 2021 | | | | | | | | | | | | | | |
| NGL Energy | | | | | | | | | | | | | | | | | | | | | | | | | | | |
| Partners LP | | | – | | | $ | 32,054,838 | | | $ | 1,483,677 | | | $ | 3,538,267 | | | $ | (39,331,963 | ) | | $ | – | | | $ | – | | | $ | 66,065,568 | | | $ | (63,810,387 | ) |
| TC PipeLines LP | | | – | | | | 206,078,373 | | | | – | | | | 15,443,118 | | | | (213,403,097 | ) | | | – | | | | – | | | | (4,330,097 | ) | | | 49,099 | |
| | | | | | | | | | | | | | | | | | | | | | | $ | – | | | $ | – | | | $ | 61,735,471 | | | $ | (63,761,288 | ) |
| | | | | | | | | | | | | | | | | | | | | | | | | | | | | | | | | | | | | |
| GRAND TOTAL | | | | | | | | | | | | | | | | | | | | | | | | | | $ | – | | | $ | 1,152,802,285 | $ | | | (341,291,057 | ) |
| * | 100% of the income received was estimated as Return of Capital. |
9. MARKET DISRUPTIONS RISK
The Funds are subject to investment and operational risks associated with financial, economic and other global market developments and disruptions, including the recent spread of an infectious respiratory illness caused by a novel strain of coronavirus (known as COVID-19), which can negatively impact the securities markets and cause each Fund to lose value.
The spread of COVID-19 has caused volatility, severe market dislocations and liquidity constraints in many markets, including markets for the securities each Fund holds, and may adversely affect each Fund’s investments and operations. The transmission of COVID-19 and efforts to contain its spread have resulted in travel restrictions and disruptions, closed international borders, enhanced health screenings at ports of entry and elsewhere, disruption of and delays in healthcare service preparation and delivery, quarantines, event and service cancellations or interruptions, disruptions to business operations and supply chains, and a reduction in consumer and business spending, as well as general concern and uncertainty that has negatively affected the economy. These disruptions have led to instability in the market place and the jobs market. The impact of COVID-19 could adversely affect the economies of many nations or the entire global economy, the financial well-being and performance of individual issuers, borrowers and sectors and the health of the markets generally in potentially significant and unforeseen ways.
The foregoing could lead to a significant economic downturn or recession, increased market volatility, a greater number of market closures, higher default rates and adverse effects on the values and liquidity of each Fund’s securities or other assets. Such impacts may adversely affect the performance of the Funds.
30 | November 30, 2021
Alerian Exchange Traded Funds
| Notes to Financial Statements | November 30, 2021 |
10. SUBSEQUENT EVENTS
Subsequent events, if any, after the date of the Statements of Assets and Liabilities have been evaluated through the date the financial statements were issued. Management has determined that there were no subsequent events to report through the issuance of these financial statements.
31 | November 30, 2021
Alerian Exchange Traded Funds
| Additional Information | November 30, 2021 (Unaudited) |
PROXY VOTING RECORDS, POLICIES AND PROCEDURES
Information regarding how each Fund voted proxies relating to portfolio securities during the most recent 12-month period ended June 30 and a description of the Funds’ proxy voting policies and procedures used in determining how to vote for proxies are available without charge on the SEC’s website at www.sec.gov and upon request, by calling (toll-free) 1-866-759-5679.
PORTFOLIO HOLDINGS
The Fund files a complete schedule of portfolio holdings with the U.S. Securities and Exchange Commission (“SEC”) for the first and third quarters of each fiscal year on Form N-PORT within 60 days after the end of the period. Copies of the Fund’s Form N-PORT are available without a charge, upon request, by contacting the Fund at 1-866-759-5679 and on the SEC’s website at https://www.sec.gov.
TAX INFORMATION
In early 2021, if applicable, shareholders of record received this information for the distributions paid to them by the Funds during the calendar year 2020 via Form 1099. The Funds will notify shareholders in early 2022 of amounts paid to them by the Funds, if any, during the calendar year 2021.
The Alerian Energy Infrastructure ETF designates the following as a percentage of taxable ordinary income distributions, or up to the maximum amount allowable, for the calendar year ended December 31, 2020:
| | Qualified Dividend Income | Dividend Received Deduction |
| Alerian Energy Infrastructure ETF | 71.85% | 11.91% |
LICENSING AGREEMENTS
Alerian (the “Licensor”) has entered into an index licensing agreement with ALPS Advisors Inc. (the “Adviser”) with respect to each of the Alerian MLP ETF and the Alerian Energy Infrastructure ETF, to allow the Adviser’s use of AMZI and AMEI. The following disclosure relates to the Licensor:
Alerian is the designer of the construction and methodology for the underlying index (each an “Underlying Index”) for each of the Alerian MLP ETF and the Alerian Energy Infrastructure ETF (each a “Fund” and collectively, the “Funds”). “Alerian,” “Alerian MLP Infrastructure Index,” “Alerian Energy Infrastructure Index,” “Alerian Index Series” and “AMZI” are service marks or trademarks of Alerian. Alerian acts as brand licensor for each Underlying Index. Alerian is not responsible for the descriptions of either Underlying Index or the Funds that appear herein. Alerian is not affiliated with the Trust, the Adviser or the Distributor.
Neither Fund is issued, sponsored, endorsed, sold or promoted by Alerian (“Licensor”) or its affiliates. Licensor makes no representation or warranty, express or implied, to the owners of the Fund or any member of the public regarding the advisability of investing in securities generally or in the Fund particularly or the ability of the Alerian MLP Infrastructure Index (“Index”) to track general market performance. Licensor’s only relationship to the Licensee is the licensing of the Index which is determined, composed and calculated by Licensor without regard to the Licensee or the Fund. Licensor has no obligation to take the needs of the Licensee or the owners of the Fund into consideration in determining, composing or calculating the Index. Licensor is not responsible for and has not participated in the determination of the timing of, prices at, or quantities of the Fund to be issued or in the determination or calculation of the equation by which the Fund is to be converted into cash. Licensor has no obligation or liability in connection with the issuance, administration, marketing or trading of either Fund and is not responsible for and has not participated in the determination of pricing or the timing of the issuance or sale of the Shares of either Fund or in the determination or calculation of the NAV of the relevant Fund. Alerian MLP Infrastructure Index, Alerian MLP Infrastructure Total Return Index, AMZI and AMZIX are trademarks of GKD Index Partners, LLC and their general use is granted under a license from GKD Index Partners, LLC.
LICENSOR DOES NOT GUARANTEE THE QUALITY, ACCURACY AND/OR THE COMPLETENESS OF THE INDEX OR ANY DATA INCLUDED THEREIN AND SHALL HAVE NO LIABILITY FOR ERRORS OR OMISSIONS OF ANY KIND RELATED TO THE INDEX OR DATA. LICENSOR MAKES NO WARRANTY, EXPRESS OR IMPLIED, AS TO RESULTS TO BE OBTAINED BY LICENSEE, OWNERS OF THE FUND, OR ANY OTHER PERSON OR ENTITY FROM THE USE OF THE INDEX OR ANY DATA INCLUDED THEREIN IN CONNECTION WITH THE RIGHTS LICENSED TO LICENSEE OR FOR ANY OTHER USE. LICENSOR MAKES NO EXPRESS OR IMPLIED WARRANTIES, AND HEREBY EXPRESSLY DISCLAIMS ALL WARRANTIES OF MERCHANTABILITY OR FITNESS FOR A PARTICULAR PURPOSE OR USE WITH RESPECT TO THE INDEX OR ANY DATA INCLUDED THEREIN. WITHOUT LIMITING ANY OF THE FOREGOING, IN NO EVENT SHALL LICENSOR HAVE ANY LIABILITY FOR ANY SPECIAL, PUNITIVE, INDIRECT, OR CONSEQUENTIAL DAMAGES (INCLUDING LOST PROFITS), EVEN IF NOTIFIED OF THE POSSIBILITY OF SUCH DAMAGES.
32 | November 30, 2021
Alerian Exchange Traded Funds
| Additional Information | November 30, 2021 (Unaudited) |
The Adviser does not guarantee the accuracy and/or the completeness of either Underlying Index or any data included therein, and the Adviser shall have no liability for any errors, omissions or interruptions therein. The Adviser makes no warranty, express or implied, as to results to be obtained by either Fund, owners of the Shares of the relevant Fund or any other person or entity from the use of either Underlying Index or any data included therein. The Adviser makes no express or implied warranties, and expressly disclaims all warranties of merchantability or fitness for a particular purpose or use with respect to either Underlying Index or any data included therein. Without limiting any of the foregoing, in no event shall the Adviser have any liability for any special, punitive, direct, indirect, or consequential damages (including lost profits) arising out of matters relating to the use of either Underlying Index, even if notified of the possibility of such damages.
(Applicable to the Alerian Energy Infrastructure ETF only)
The Underlying Index is the exclusive property of GKD Index Partners LLC d/b/a Alerian, which has contracted with S&P Opco, LLC (a subsidiary of S&P Dow Jones Indices LLC) (“S&P Dow Jones Indices”) to calculate and maintain the Underlying Index. S&P® is a registered trademark of Standard & Poor’s Financial Services LLC (“SPFS”); Dow Jones® is a registered trademark of Dow Jones Trademark Holdings LLC (“Dow Jones”); and these trademarks have been licensed to S&P Dow Jones Indices. “Calculated by S&P Dow Jones Indices” and its related stylized mark(s) have been licensed for use by Alerian.
The Fund is not sponsored, endorsed, sold or promoted by S&P Dow Jones Indices, SPFS, Dow Jones or any of their affiliates (collectively, “S&P Dow Jones Indices Entities”). S&P Dow Jones Indices Entities do not make any representation or warranty, express or implied, to the owners of the Fund or any member of the public regarding the advisability of investing in securities generally or in the Fund particularly or the ability of the Underlying Index to track general market performance. S&P Dow Jones Indices Entities only relationship to Alerian with respect to the Underlying Index is the licensing of certain trademarks, service marks and trade names of S&P Dow Jones Indices Entities and for the providing of calculation and maintenance services related to the Underlying Index. S&P Dow Jones Indices Entities are not responsible for and have not participated in the determination of the prices and amount of the Fund or the timing of the issuance or sale of the Fund or in the determination or calculation of the equation by which the Fund is to be converted into cash. S&P Dow Jones Indices Entities have no obligation or liability in connection with the administration, marketing or trading of the Fund. S&P Dow Jones Indices LLC is not an investment advisor. Inclusion of a security within the Underlying Index is not a recommendation by S&P Dow Jones Indices Entities to buy, sell, or hold such security, nor is it considered to be investment advice.
S&P DOW JONES INDICES ENTITIES DO NOT GUARANTEE THE ADEQUACY, ACCURACY, TIMELINESS AND/OR THE COMPLETENESS OF THE UNDERLYING INDEX OR ANY DATA RELATED THERETO OR ANY COMMUNICATION, INCLUDING BUT NOT LIMITED TO, ORAL OR WRITTEN COMMUNICATION (INCLUDING ELECTRONIC COMMUNICATIONS) WITH RESPECT THERETO. S&P DOW JONES INDICES ENTITIES SHALL NOT BE SUBJECT TO ANY DAMAGES OR LIABILITY FOR ANY ERRORS, OMISSIONS, OR DELAYS THEREIN. S&P DOW JONES INDICES ENTITIES MAKE NO EXPRESS OR IMPLIED WARRANTIES, AND EXPRESSLY DISCLAIMS ALL WARRANTIES, OF MERCHANTABILITY OR FITNESS FOR A PARTICULAR PURPOSE OR USE OR AS TO RESULTS TO BE OBTAINED BY ALERIAN, OWNERS OF THE FUND, OR ANY OTHER PERSON OR ENTITY FROM THE USE OF THE UNDERLYING INDEX OR WITH RESPECT TO ANY DATA RELATED THERETO. WITHOUT LIMITING ANY OF THE FOREGOING, IN NO EVENT WHATSOEVER SHALL S&P DOW JONES INDICES ENTITIES BE LIABLE FOR ANY INDIRECT, SPECIAL, INCIDENTAL, PUNITIVE, OR CONSEQUENTIAL DAMAGES INCLUDING BUT NOT LIMITED TO, LOSS OF PROFITS, TRADING LOSSES, LOST TIME OR GOODWILL, EVEN IF THEY HAVE BEEN ADVISED OF THE POSSIBILITY OF SUCH DAMAGES, WHETHER IN CONTRACT, TORT, STRICT LIABILITY, OR OTHERWISE.
33 | November 30, 2021
Alerian Exchange Traded Funds
| Board Considerations Regarding Approval of Investment Advisory Agreements | November 30, 2021 (Unaudited) |
At a meeting held on June 7, 2021 via electronic means (video-conference), the Board of Trustees of the Trust (the “Board” or the “Trustees”), including the Trustees who are not “interested persons” of the Trust within the meaning of the Investment Company Act of 1940, as amended (the “Independent Trustees”), evaluated a proposal to approve the continuance of the Investment Advisory Agreements between the Trust and ALPS Advisors, Inc. (the “Adviser” or “AAI”) with respect to the Alerian MLP ETF (“AMLP”) and the Alerian Energy Infrastructure ETF (“ENFR”) (each “a Fund” and collectively the “Funds”), as well as a proposed reduction to the advisory fees for ENFR. The Independent Trustees also met separately to consider (i) each Investment Advisory Agreement and (ii) the proposed reduction to the advisory fee for ENFR.
In evaluating the (i) proposed reduction to the advisory fee for ENFR and (ii) renewal of the Investment Advisory Agreements with respect to each Fund, the Board, including the Independent Trustees considered various factors, including (i) the nature, extent and quality of the services provided by AAI with respect to the applicable Fund under the Investment Advisory Agreements; (ii) the advisory fees and other expenses paid by the Fund compared to those of similar funds managed by other investment advisers; (iii) the costs of the services provided to the Fund by AAI and the profits realized by AAI and its affiliates from its relationship to the Fund; (iv) the extent to which economies of scale have been or would be realized if and as the assets of the Fund grow and whether fees reflect the economies of scale for the benefit of shareholders; and (v) any additional benefits and other considerations.
With respect to the nature, extent and quality of the services provided by AAI under the Investment Advisory Agreements, the Board considered and reviewed information concerning the services provided under the Investment Advisory Agreements, the investment parameters of the index of each Fund, financial information regarding AAI and its parent company, information describing AAI’s current organization and the background and experience of the persons responsible for the day-to-day management of the Funds. For ENFR, the Board noted that the amended Advisory Agreement was identical to the Advisory Agreement currently in place for ENFR other than with respect to the reduced advisory fee.
The Board reviewed information on the performance of each Fund and its applicable benchmark. The Board also evaluated the correlation and tracking error between each underlying index and its corresponding Fund’s performance. Based on this review, the Board, including the Independent Trustees. found that the nature and extent of services provided to each Fund under the Investment Advisory Agreements was appropriate and that the quality was satisfactory and, for ENFR, that there will be no diminution in the nature or level of services provided to ENFR.
The Board noted that the advisory fees for each Fund were unitary fees pursuant to which AAI assumes all expenses of the Funds (including the cost of transfer agency, custody, fund administration, legal, audit and other services) other than the payments under the Advisory Agreement, brokerage expenses, taxes, interest, litigation expenses and other extraordinary expenses.
With respect to advisory fee rates, the Board, including the Independent Trustees, noted the following:
The gross management fee rate for AMLP is higher than the median of its FUSE expense group. AMLP’s net expense ratio is also higher than the median of its FUSE expense group.
The gross management fee rate for ENFR is lower than the median of its FUSE expense group. ENFR’s net expense ratio is also below the median of their respective FUSE expense group.
With respect to AMLP, the Board took into account, among other things, supplemental information provided by the Adviser showing AMLP’s total expenses were in line with the total expenses of peer groups deemed by the Adviser to be more comparable, including peer groups comprised of (i) the master limited partnership (“MLP”) asset class as a whole and (ii) exchange-traded products focused solely on MLP investments. The Board also considered the brand recognition of AMLP’s index provider, the additional costs and expenses incurred by AAI in managing and administering the Fund, that AMLP’s investment advisory fee schedule included breakpoints and the fees charged by the index provider for licensing its indexes.
Based on the foregoing, and the other information available to them, the Board, including the Independent Trustees, concluded that the advisory fee rate for each Fund and the proposed reduction in advisory fee rate for ENFR was reasonable under the circumstances and in light of the quality of the services provided.
The Board, including the Independent Trustees considered other benefits available to AAI because of its relationship with the Funds and concluded that the advisory fees were reasonable taking into account any such benefits. With respect to ENFR, the Board, including the Independent Trustees, determined that the Adviser should continue to keep the Board informed on an ongoing basis of any significant developments (e.g., material increases in asset levels) so as to facilitate the Independent Trustees’ evaluation of whether economies of scale have been achieved.
The Board, including the Independent Trustees also considered with respect to each Fund the information provided by AAI about the costs and profitability of AAI with respect to each of the Funds, including the asset levels and other factors that influence the profitability and financial viability of the Funds. The Board, including the Independent Trustees reviewed and noted the relatively small size of ENFR and concluded that AAI was not realizing any economies of scale. With respect to AMLP, the Independent Trustees noted that neither Fund’s asset levels has not recovered to its historic high. The Independent Trustees determined that AAI should continue to keep the Board informed on an ongoing basis of any significant developments (e.g., material increases in asset levels) so as to facilitate the Independent Trustees’ evaluation of whether further economies of scale have been achieved.
34 | November 30, 2021
Alerian Exchange Traded Funds
| Board Considerations Regarding Approval of Investment Advisory Agreements | November 30, 2021 (Unaudited) |
With respect to AMLP, the Board considered, among other things the brand recognition of AMLP’s index provider as well as the trading volumes of the Fund and the narrow trading spreads. The Board considered the breakpoint schedule adopted previously and whether the breakpoints would benefit shareholders and appropriately reflect economies of scale achieved by AAI with respect to AMLP should AMLP’s assets increase, noting that AMLP’s assets were well below historical highs on account of market events related to COVID-19. The Board also considered the substance of its discussions with AAI regarding AMLP’s advisory fee rates. Upon discussion, the Board, including the Independent Trustees determined that the advisory fee rate for the Fund reflects an appropriate sharing of economies of scale.
In voting to renew each Investment Advisory Agreement, the Board, including the Independent Trustees concluded that the terms of each Investment Advisory Agreement are reasonable and fair in light of the services to be performed, the fees paid by certain other funds, expenses to be incurred and such other matters as the members of the Board, including the Independent Trustees, considered relevant in the exercise of their reasonable business judgment. The Board, including the Independent Trustees did not identify any single factor or group of factors as all important or controlling and considered all factors together.
35 | November 30, 2021
Alerian Exchange Traded Funds
| Trustees & Officers | November 30, 2021 (Unaudited) |
The general supervision of the duties performed by the Adviser for the Fund under the Investment Advisory Agreement is the responsibility of the Board of Trustees. The Trust currently has four Trustees. Three Trustees have no affiliation or business connection with the Adviser or any of its affiliated persons and do not own any stock or other securities issued by the Adviser. These are the “non-interested” or “independent” Trustees (“Independent Trustees”). The other Trustee (the “Interested Trustee”) is affiliated with the Adviser.
The Independent Trustees of the Trust, their term of office and length of time served, their principal business occupations during the past five years, the number of portfolios in the Fund Complex overseen by each Independent Trustee, and other directorships, if any, held by the Trustee are shown below.
INDEPENDENT TRUSTEES
|
| Name, Address & Year of Birth* | Position(s) Held with Trust | Term of Office and Length of Time Served** | Principal Occupation(s) During Past 5 Years | Number of Portfolios in Fund Complex Overseen by Trustees*** | Other Directorships Held by Trustees |
Mary K. Anstine,
1940 | Trustee | Since March 2008 | Ms. Anstine is Trustee/Director of AV Hunter Trust and Colorado Uplift Board. | 36 | Ms. Anstine is a Trustee of ALPS Variable Investment Trust (7 funds); Financial Investors Trust (32 funds); Reaves Utility Income Fund; and Segall Bryant & Hamill Trust (14 funds). |
Jeremy W. Deems,
1976 | Trustee | Since March 2008 | Mr. Deems is the Co-Founder and Chief Financial Officer of Green Alpha Advisors, LLC, a registered investment advisor, and Co-Portfolio Manager of the Shelton Green Alpha Fund. | 36 | Mr. Deems is a Trustee of ALPS Variable Investment Trust (7 funds); Financial Investors Trust (32 funds); and Reaves Utility Income Fund; and Clough Funds Trust (1 fund). |
Rick A. Pederson, 1952 | Trustee | Since March 2008 | Mr. Pederson is Partner, Bow River Capital Partners (private equity management), 2003 - present; Board Member, Prosci Inc. (private business services) 2013-2016; Advisory Board Member, Citywide Banks (Colorado community bank) 2014-2017; Board Member, Strong-Bridge Consulting, 2015-2019; Board Member, IRI/ODMS Holdings LLC, 2017-2019; Director, National Western Stock Show (not for profit) 2010 - present; Director, History Colorado (not for profit) 2015-present; Director, Citywide Bank Advisory Board 2017-present; Trustee, Boettcher Foundation, 2018 -present. | 19 | Mr. Pederson is Trustee of Segall Bryant & Hamill Trust (14 funds) and Principal Real Estate Income Fund (1 fund). |
| * | The business address of the Trustee is c/o ALPS Advisors, Inc., 1290 Broadway, Suite 1000, Denver, Colorado 80203. |
| ** | This is the period for which the Trustee began serving the Trust. Each Trustee serves an indefinite term, until his successor is elected. |
| *** | The Fund Complex includes all series of the Trust and any other investment companies for which ALPS Advisors, Inc. provides investment advisory services. |
36 | November 30, 2021
Alerian Exchange Traded Funds
| Trustees & Officers | November 30, 2021 (Unaudited) |
The Trustee who is an “interested person” of the Trust, his term of office and length of time served, his principal business occupations during the past five years, the number of portfolios in the Fund Complex overseen by the Interested Trustee and the other directorships, if any, held by the Trustee, are shown below.
INTERESTED TRUSTEE
| Name, Address and Year of Birth of Interested Trustee* | Position(s) Held with Trust | Term of Office and Length of Time Served** | Principal Occupation(s) During Past 5 Years | Number of Portfolios in Fund Complex Overseen by Trustees*** | Other Directorships Held by Trustees |
Edmund J. Burke,
1961 | Trustee | Since December 2017. | Mr. Burke joined ALPS in 1991 and served as the President and Director of ALPS Holdings, Inc., and ALPS Advisors, Inc. (“AAI”), and Director of ALPS Distributors, Inc. (“ADI”), ALPS Fund Services, Inc. (“AFS”), and ALPS Portfolio Solutions Distributor, Inc. (“APSD”). Mr. Burke retired from ALPS in June 2019. | 31 | Mr. Burke is a Trustee of Clough Global Dividend and Income Fund (1 fund); Clough Global Equity Fund (1 fund); Clough Global Opportunities Fund (1 fund); Clough Funds Trust (1 fund); Liberty All-Star Equity Fund (1 fund); Director of the Liberty All-Star Growth Fund, Inc. (1 fund) and Financial Investors Trust (32 funds). |
| * | The business address of the Trustee is c/o ALPS Advisors, Inc., 1290 Broadway, Suite 1000, Denver, Colorado 80203. Effective December 1, 2021, Mr. Burke is an Independent Trustee of the Trust. |
| ** | This is the period for which the Trustee began serving the Trust. Each Trustee serves an indefinite term, until his successor is elected. |
| *** | The Fund Complex includes all series of the Trust and any other investment companies for which ALPS Advisors, Inc. provides investment advisory services. |
37 | November 30, 2021
Alerian Exchange Traded Funds
| Trustees & Officers | November 30, 2021 (Unaudited) |
OFFICERS
| Name, Address and Year of Birth of Officer* | Position(s) Held with Trust | Length of Time Served** | Principal Occupation(s) During Past 5 Years |
| Laton Spahr, 1975 | President | Since June 2021 | Mr. Spahr joined ALPS in 2019 and currently serves as President and Portfolio Manager of AAI. Prior to his current role, Mr. Spahr was a Senior Vice President and Strategy Leader of the Value & Income Team for Oppenheimer Funds from 2013 to 2019. |
| Matthew Sutula, 1985 | Chief Compliance Officer (“CCO") | Since December 2019 | Mr. Sutula joined ALPS in 2012 and currently serves as Chief Compliance Officer of AAI. Prior to his current role, Mr. Sutula served as interim Compliance Officer of the Trust (September 2019 to December 2019). Compliance Manager and Senior Compliance Analyst for AAI, as well as Compliance Analyst for AFS. Prior to joining ALPS, he spent seven years at Morningstar, Inc. in various analyst roles supporting the registered investment company databases. Mr. Sutula is also Chief Compliance Officer of Principal Real Estate Income Fund, ALPS Variable Investment Trust, RiverNorth Opportunities Fund, Inc., Liberty All-Star Equity Fund and Liberty All-Star Growth Fund, Inc. |
| Kathryn Burns, 1976 | Treasurer | Since September 2018 | Ms. Burns serves as Vice President, Director of Fund Operations of AAI since 2018. From 2013 to 2018, she served as Vice President and Fund Controller at AFS. Prior to joining ALPS, she worked at Old Mutual Capital where she served as Vice President and Chief Compliance Officer (2010 – 2012) and Regulatory Reporting Manager and Assistant Treasurer to the Old Mutual Funds Trusts (2006 – 2012). She also served as a CPA for PricewaterhouseCoopers LLP. Ms. Burns also serves as President of ALPS Variable Investment Trust, Principal Real Estate Income Fund and RiverNorth Opportunities Fund, Inc. From June 2018 to November 2021 she also served as Treasurer of Boulder Growth & Income Fund, Inc. |
| Brendan Hamill, 1986 | Secretary | Since September 2021 | Mr. Hamill joined ALPS in August 2021, and is currently Vice President and Principal Legal Counsel. Prior to joining ALPS, Mr. Hamill was an attorney at Lewis Brisbois Bisgaard & Smith, LLP (law firm) (December 2018-August 2021) and Vedder Price, P.C. (law firm) (August 2015-December 2018). Mr. Hamill also serves as Secretary of Financial Investors Trust, Secretary of ALPS Variable Investment Trust, Secretary of Principal Real Estate Income Fund, and Assistant Secretary of James Advantage Funds. |
| * | The business address of each Officer is c/o ALPS Advisors, Inc., 1290 Broadway, Suite 1000, Denver, Colorado 80203. Each Officer is deemed an affiliate of the Trust as defined under the 1940 Act. |
| ** | This is the period for which the Officer began serving the Trust. Each Officer serves an indefinite term, until his/her successor is elected. |
The Statement of Additional Information includes additional information about the Fund’s Trustees and is available, without charge, upon request by calling (toll-free) 1-866-759-5679.
38 | November 30, 2021
Intentionally Left Blank


Table of Contents
| Performance Overview | 1 |
| Disclosure of Fund Expenses | 4 |
| Report of Independent Registered Public Accounting Firm | 5 |
| Financial Statements | |
| Schedule of Investments | 6 |
| Statement of Assets and Liabilities | 7 |
| Statement of Operations | 8 |
| Statements of Changes in Net Assets | 9 |
| Financial Highlights | 10 |
| Notes to Financial Statements | 11 |
| Additional Information | 17 |
| Trustees & Officers | 18 |
alpsfunds.com
ALPS Active REIT ETF
| Performance Overview | November 30, 2021 (Unaudited) |
Investment Objective
The ALPS Active REIT ETF (the "Fund") seeks total return through dividends and capital appreciation. The Fund will, under normal circumstances, seek to achieve its investment objective by investing at least 80% of its net assets in publicly traded equity securities of real estate investment trusts (“REITs”).
Performance Overview
The economic recovery continued its progression from the depths of the pandemic and real estate continued to be well positioned. Since inception (2/25/2021) through November 30, 2021, the ALPS Active REIT ETF returned 22.0%, outperforming the S&P 500 Total Return Index which returned 17.6%, and slightly underperforming its benchmark, the S&P US REIT Index which was up 24.6% for the same period.
In GSI Capital Advisors view, real estate represents an attractive investment opportunity with a favorable fundamental outlook and reasonable to compelling valuations. Notwithstanding potential headwinds from market anxiety related to the COVID variants, employment and supply chain concerns, and fears of rising interest rates, real estate valuations and REIT prices continued their upward trend. Despite the relative outperformance of the REIT market this year, we believe REIT valuations remain attractive. Real estate and REITs are priced to deliver unleveraged returns that remain abnormally wide relative to fixed income alternatives.
At current valuations, the Sub-Advisor believes REITS offer attractive operating cash flow. REITs are trading at an average adjusted funds from operations (“AFFO”) yield of 4.2%. AFFO is a conservative measurement of operating cash flow which is a more accurate metric in the assessment and relative valuation of REITs. In isolation, the Sub-Advisor believes an AFFO yield of 4.2% seems to represent fair value in today’s environment. However, when viewed in conjunction with a two-year average forecasted annual AFFO growth rate of 11.6%, the combination suggests the possibility of strong total returns. The current AFFO yield and growth rate is particularly compelling in an investment environment where current yield is hard to find with short term interest rates close to zero and the ten-year Treasury yield at 1.4%.
REIT prices have experienced a significant recovery since the market trough in March, 2020 and are now above the pre-pandemic levels. As investors begin to understand the longer-term implications of the pandemic on the economy and behavior patterns, the impact on different property types and geographic locations is coming into focus. This has resulted in a wide divergence in property sector performance. From the inception date of the Fund in February, top performing property sectors have included retail, storage, residential and industrial. Bottom performing property sectors have included health care, hotels, office and net lease.
Retail property has been the star of the year relative to other property sectors. It began the year in an oversold condition and, while a recovery was expected, the magnitude and velocity of the recovery has been surprising. The pent-up demand and wealth of the consumer has resulted in a significant increase in retail sales, much of it at brick-and-mortar locations. Residential and storage property have benefited from excellent and improving fundamentals combined with declining cap rates (net operating income/property value) throughout the year. Industrial property continued to benefit from a strong secular trend of increased on-line sales which enhances property sector fundamentals.
Net lease property has been an underperforming sector primarily impacted by the expectation of rising interest rates, without the ability to produce exceptional income growth due to the structure of their long-term leases, which causes the sector to have characteristics similar to intermediate bonds. Health care and office REITs are likely to be the two sectors most impacted by the pandemic over the long term. Both sectors are suffering from deterioration in demand, income and rental rates, as well as the resulting decline from the expected permanent impairment in valuation. Health care REITs are suffering from declining operating conditions and tenant credit quality, and office properties from permanent demand reduction as more companies transition to flexible office and work-from-home models. Hotel demand has been negatively impacted by the effects of the pandemic and related travel restrictions.
The Fund has benefited from its sector tilts as the residential overweight and the office property underweight have produced excess relative returns and enhanced total returns for the portfolio. Stock selection has been mixed with the portfolio holdings in health care property detracting from performance, in particular the positions in Sabra Health Care REIT and Ventas, Inc.
The debate among investors over the level of inflation in the economy and whether it is temporary or permanent continues. To the extent there is either actual inflation, higher expected inflation, or fears regarding inflation, real estate and REITs should be relative beneficiaries compared to other asset classes.
The Sub-Advisor believes it is not possible to accurately predict future levels of inflation. The Sub-Advisor further believes that high unexpected inflation can be very damaging to the purchasing power of an investment portfolio. If one can find an attractive hedge or partial hedge against inflation, it is a valuable component of a portfolio. It is the view of the Sub-Advisor that real estate is such an investment. If inflation escalates, real estate should perform well and partially hedge a portfolio. If inflation does not escalate, real estate should deliver attractive real rates of return based on current valuations and return potential.
1 | November 30, 2021
ALPS Active REIT ETF
| Performance Overview | November 30, 2021 (Unaudited) |
Fund Performance (as of November 30, 2021)
| | 6 Months | Since Inception^ |
| ALPS Active REIT ETF - NAV | 8.52% | 22.01% |
| ALPS Active REIT ETF - Market Price* | 8.71% | 20.31% |
| S&P United States REIT Index | 10.93% | 24.57% |
Total Expense Ratio (per the current prospectus) is 0.68%.
Performance data quoted represents past performance. Past performance does not guarantee future results. Total return figures assume reinvestment of dividends and capital gains distributions, if any. The table does not reflect the deduction of taxes that a shareholder would pay on Fund distributions or the redemption of Fund shares. Investment return and principal value of an investment will fluctuate so that an investor’s shares, when sold or redeemed, may be worth more or less than the original cost. Current performance data may be higher or lower than actual data quoted. For the most current month-end performance data please visit www.alpsfunds.com or call 1.866.759.5679.
NAV is an exchange-traded fund’s per-share value. The per-share dollar amount of the fund is derived by dividing the total value of all the securities in its portfolio, less any liabilities, by the number of fund shares outstanding. Market Price is the price at which a share can currently be traded in the market. Information detailing the number of days the Market Price of the Fund was greater than the Fund’s NAV and the number of days it was less than the Fund’s NAV can be obtained at www.alpsfunds.com.
| ^ | The Fund commenced operations on February 25, 2021, with the first day of trading on the exchange of February 26, 2021. |
| * | Market Price means the official closing price of a share or, if it more accurately reflects the market value of a share at the time as of which the Fund calculates current net asset value per share, the price that is the midpoint of the bid-ask spread as of that time. It does not represent the returns an investor would receive if shares were traded at other times. |
The Fund is new with limited operating history.
The S&P United States REIT Index defines and measures the investable universe of publicly traded real estate investment trusts domiciled in the United States.
One cannot invest directly in an index. Index performance does not reflect fund performance.
The Fund’s shares are not individually redeemable. Investors buy and sell shares of the Fund on a secondary market. Only market makers or “authorized participants” may trade directly with the Fund, typically in blocks of 5,000 shares.
The ALPS Active REIT ETF is not suitable for all investors. Investments in the Fund are subject to investment risks, including possible loss of the principal amount invested.
ALPS Portfolio Solutions Distributor, Inc., a FINRA member, is the Distributor for the ALPS Active REIT ETF.
2 | November 30, 2021
ALPS Active REIT ETF
| Performance Overview | November 30, 2021 (Unaudited) |
Top Ten Holdings* (as of November 30, 2021)
| AvalonBay Communities, Inc. | 7.50% |
| Equinix, Inc. | 6.89% |
| First Industrial Realty Trust, Inc. | 6.61% |
| Rexford Industrial Realty, Inc. | 6.48% |
| CubeSmart | 6.05% |
| Equity LifeStyle Properties, Inc. | 5.18% |
| WP Carey, Inc. | 4.73% |
| Essex Property Trust, Inc. | 4.70% |
| Prologis, Inc. | 3.59% |
| Host Hotels & Resorts, Inc. | 3.50% |
| Total % of Top 10 Holdings | 55.23% |
Sector Allocation* (as of November 30, 2021)
| Residential REITs | 23.36% |
| Specialized REITs | 22.32% |
| Industrial REITs | 16.67% |
| Retail REITs | 12.60% |
| Health Care REITs | 8.74% |
| Office REITs | 6.29% |
| Diversified REITs | 4.73% |
| Hotel & Resort REITs | 3.50% |
| Money Market Fund | 1.79% |
| Total | 100.00% |
Future holdings are subject to change.
Growth of $10,000 (as of November 30, 2021)
Comparison of change in value of a $10,000 investment in the Fund and the Index
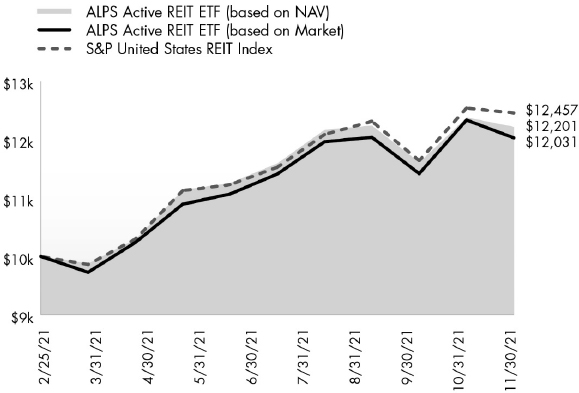
The chart above compares historical performance of a hypothetical investment of $10,000 in the Fund since inception with the performance of the Fund’s benchmark index. Results include the reinvestment of all dividends and capital gains distributions. Past performance does not guarantee future results. The chart does not reflect the deduction of taxes that a shareholder would pay on Fund distributions or the redemption of Fund shares.
3 | November 30, 2021
ALPS Active REIT ETF
| Disclosure of Fund Expenses | November 30, 2021 (Unaudited) |
Shareholder Expense Example: As a shareholder of a Fund, you incur certain ongoing costs, including management fees and other Fund expenses. These examples are intended to help you understand your ongoing costs (in dollars) of investing in the Fund and to compare these costs with the ongoing costs of investing in other funds. The example is based on an investment of $1,000 invested at the beginning of the (six month) period and held through November 30, 2021.
Actual Return: The first line of the table provides information about actual account values and actual expenses. You may use the information in this line, together with the amount you invested, to estimate the expenses that you incurred over the period. Simply divide your account value by $1,000 (for example, an $8,600 account value divided by $1,000 = 8.6), then multiply the result by the number in the first line under the heading entitled “Expenses Paid During Period” to estimate the expenses attributable to your investment during this period.
Hypothetical 5% Return: The second line of the table provides information about hypothetical account values and hypothetical expenses based on the Fund’s actual expense ratio and an assumed rate of return of 5% per year before expenses, which is not the Fund’s actual return. The hypothetical account values and expenses may not be used to estimate the actual ending account balance or expenses you paid for the period. You may use this information to compare ongoing costs of investing in the Fund and other funds. To do so, compare this 5% hypothetical example with the 5% hypothetical examples that appear in the shareholder reports of other funds.
The expenses shown in the table are meant to highlight ongoing Fund costs only and do not reflect any transaction costs, such as brokerage commissions and other fees to financial intermediaries. Therefore, the second line of the table is useful in comparing ongoing costs only, and will not help you determine the relative total costs of owning different funds. In addition, if these costs were included, your costs would have been higher.
| | | Beginning Account Value 6/1/21 | | | Ending Account Value 11/30/21 | | | Expense Ratio(a) | | | Expenses Paid During Period 6/1/21 - 11/30/21(b) | |
| ALPS Active REIT ETF | | | | | | | | | | | | |
| Actual | | $ | 1,000.00 | | | $ | 1,085.20 | | | | 0.68 | % | | $ | 3.55 | |
| Hypothetical (5% return before expenses) | | $ | 1,000.00 | | | $ | 1,021.66 | | | | 0.68 | % | | $ | 3.45 | |
| (a) | Annualized, based on the Fund's most recent fiscal half year expenses. |
| (b) | Expenses are equal to the Fund's annualized expense ratio multiplied by the average account value over the period, multiplied by the number of days in the most recent fiscal half year (183), divided by 365. |
4 | November 30, 2021
ALPS Active REIT ETF
Report of Independent Registered Public Accounting Firm
To the Board of Trustees of ALPS ETF Trust and the shareholders of ALPS Active REIT ETF:
Opinion on the Financial Statements and Financial Highlights
We have audited the accompanying statement of assets and liabilities, including the schedule of investments of ALPS Active REIT ETF (the "Fund"), one of the funds constituting the ALPS ETF Trust, as of November 30, 2021, the related statement of operations, the statements of changes in net assets, and the financial highlights for the period from February 25, 2021 (commencement of operations) through November 30, 2021, and the related notes.
In our opinion, the financial statements and financial highlights present fairly, in all material respects, the financial position of the Fund as of November 30, 2021, and the result of its operations, the changes in its net assets, and the financial highlights for the period from February 25, 2021 (commencement of operations) through November 30, 2021 in conformity with accounting principles generally accepted in the United States of America.
Basis for Opinion
These financial statements and financial highlights are the responsibility of the Fund's management. Our responsibility is to express an opinion on the Fund's financial statements and financial highlights based on our audit. We are a public accounting firm registered with the Public Company Accounting Oversight Board (United States) (PCAOB) and are required to be independent with respect to the Fund in accordance with the U.S. federal securities laws and the applicable rules and regulations of the Securities and Exchange Commission and the PCAOB.
We conducted our audit in accordance with the standards of the PCAOB. Those standards require that we plan and perform the audit to obtain reasonable assurance about whether the financial statements and financial highlights are free of material misstatement, whether due to error or fraud. The Fund is not required to have, nor were we engaged to perform, an audit of its internal control over financial reporting. As part of our audit we are required to obtain an understanding of internal control over financial reporting but not for the purpose of expressing an opinion on the effectiveness of the Fund’s internal control over financial reporting. Accordingly, we express no such opinion.
Our audit included performing procedures to assess the risks of material misstatement of the financial statements and financial highlights, whether due to error or fraud, and performing procedures that respond to those risks. Such procedures included examining, on a test basis, evidence regarding the amounts and disclosures in the financial statements and financial highlights. Our audit also included evaluating the accounting principles used and significant estimates made by management, as well as evaluating the overall presentation of the financial statements and financial highlights. Our procedures included confirmation of securities owned as of November 30, 2021, by correspondence with the custodian and brokers; when replies were not received from brokers, we performed other auditing procedures. We believe that our audit provides a reasonable basis for our opinion.
DELOITTE & TOUCHE LLP
Denver, Colorado
January 26, 2022
We have served as the auditor of one or more investment companies advised by ALPS Advisors, Inc. since 2007.
5 | November 30, 2021
ALPS Active REIT ETF
| Schedule of Investments | November 30, 2021 |
| Security Description | | Shares | | | Value | |
| COMMON STOCKS (97.69%) | | | | | | |
| Diversified REITs (4.70%) | | | | | | |
| WP Carey, Inc. | | | 14,922 | | | $ | 1,139,295 | |
| | | | | | | | | |
| Health Care REITs (8.69%) | | | | | | | | |
| Medical Properties Trust, Inc. | | | 28,915 | | | | 615,600 | |
| Omega Healthcare Investors, Inc. | | | 4,600 | | | | 128,524 | |
| Sabra Health Care REIT, Inc. | | | 19,521 | | | | 252,407 | |
| Ventas, Inc. | | | 15,609 | | | | 732,374 | |
| Welltower, Inc. | | | 4,750 | | | | 378,195 | |
| Total Health Care REITs | | | | | | | 2,107,100 | |
| | | | | | | | | |
| Hotel & Resort REITs (3.49%) | | | | | | | | |
| Host Hotels & Resorts, Inc.(a) | | | 53,808 | | | | 844,786 | |
| | | | | | | | | |
| Industrial REITs (16.59%) | | | | | | | | |
| First Industrial Realty Trust, | | | | | | | | |
| Inc. | | | 26,369 | | | | 1,592,951 | |
| Prologis, Inc. | | | 5,734 | | | | 864,401 | |
| Rexford Industrial Realty, Inc. | | | 22,296 | | | | 1,562,504 | |
| Total Industrial REITs | | | | | | | 4,019,856 | |
| | | | | | | | | |
| Office REITs (6.26%) | | | | | | | | |
| Cousins Properties, Inc. | | | 11,100 | | | | 419,136 | |
| Highwoods Properties, Inc. | | | 8,956 | | | | 386,899 | |
| Kilroy Realty Corp. | | | 10,658 | | | | 687,761 | |
| Orion Office REIT, Inc.(a) | | | 1,287 | | | | 22,866 | |
| Total Office REITs | | | | | | | 1,516,662 | |
| | | | | | | | | |
| Residential REITs (23.22%) | | | | | | | | |
| AvalonBay Communities, Inc. | | | 7,569 | | | | 1,808,006 | |
| Camden Property Trust | | | 4,134 | | | | 682,978 | |
| Equity LifeStyle Properties, Inc. | | | 15,365 | | | | 1,249,175 | |
| Essex Property Trust, Inc. | | | 3,336 | | | | 1,132,372 | |
| Invitation Homes, Inc. | | | 18,778 | | | | 759,382 | |
| Total Residential REITs | | | | | | | 5,631,913 | |
| | | | | | | | | |
| Retail REITs (12.54%) | | | | | | | | |
| Kite Realty Group Trust | | | 31,546 | | | | 634,706 | |
| Realty Income Corp. | | | 12,052 | | | | 818,572 | |
| Retail Opportunity Investments Corp. | | | 26,821 | | | | 470,977 | |
| Simon Property Group, Inc. | | | 3,945 | | | | 602,954 | |
| Tanger Factory Outlet Centers, Inc. | | | 25,758 | | | | 510,266 | |
| Total Retail REITs | | | | | | | 3,037,475 | |
| Security Description | | Shares | | | Value | |
| Specialized REITs (22.20%) | | | | | | |
| American Tower Corp. | | | 1,735 | | | $ | 455,403 | |
| CubeSmart | | | 27,062 | | | | 1,459,183 | |
| CyrusOne, Inc. | | | 4,652 | | | | 414,121 | |
| Equinix, Inc. | | | 2,044 | | | | 1,660,136 | |
| MGM Growth Properties LLC, Class A | | | 15,950 | | | | 583,930 | |
| Public Storage | | | 1,922 | | | | 629,224 | |
| VICI Properties, Inc. | | | 6,600 | | | | 179,520 | |
| Total Specialized REITs | | | | | | | 5,381,517 | |
| | | | | | | | | |
| TOTAL COMMON STOCKS | | | | | | | | |
| (Cost $21,585,853) | | | | | | | 23,678,604 | |
| | | 7 Day Yield | | | Shares | | | Value | |
| SHORT TERM INVESTMENTS (1.78%) | | | | | | | | | |
| State Street Institutional | | | | | | | | | | | | |
| Treasury Plus Money | | | | | | | | | | | | |
| Market Fund | | | 0.01 | % | | | 430,783 | | | | 430,783 | |
| TOTAL SHORT TERM INVESTMENTS | | | | | | | | | | | | |
| (Cost $430,783) | | | | | | | | | | | 430,783 | |
| | | | | | | | | | | | | |
| TOTAL INVESTMENTS (99.47%) | | | | | | | | | | | | |
| (Cost $22,016,636) | | | | | | | | | | $ | 24,109,387 | |
| OTHER ASSETS IN EXCESS OF LIABILITIES (0.53%) | | | | | | | | | | | 128,484 | |
| NET ASSETS - 100.00% | | | | | | | | | | $ | 24,237,871 | |
| (a) | Non-income producing security. |
See Notes to Financial Statements.
6 | November 30, 2021
ALPS Active REIT ETF
| Statement of Assets and Liabilities | November 30, 2021 |
| ASSETS: | | | |
| Investments, at value | | $ | 24,109,387 | |
| Receivable for investments sold | | | 402,272 | |
| Dividends receivable | | | 13,112 | |
| Total Assets | | | 24,524,771 | |
| | | | | |
| LIABILITIES: | | | | |
| Payable for investments purchased | | | 273,094 | |
| Payable to adviser | | | 13,806 | |
| Total Liabilities | | | 286,900 | |
| NET ASSETS | | $ | 24,237,871 | |
| | | | | |
| NET ASSETS CONSIST OF: | | | | |
| Paid-in capital | | $ | 21,461,485 | |
| Total distributable earnings | | | 2,776,386 | |
| NET ASSETS | | $ | 24,237,871 | |
| | | | | |
| INVESTMENTS, AT COST | | $ | 22,016,636 | |
| | | | | |
| PRICING OF SHARES | | | | |
| Net Assets | | $ | 24,237,871 | |
| Shares of beneficial interest outstanding (Unlimited number of shares authorized, par value $0.01 per share) | | | 820,002 | |
| Net Asset Value, offering and redemption price per share | | $ | 29.56 | |
See Notes to Financial Statements.
7 | November 30, 2021
ALPS Active REIT ETF
| Statement of Operations | For the Period Ended November 30, 2021(a) |
| INVESTMENT INCOME: | | | |
| Dividends | | $ | 334,085 | |
| Total Investment Income | | | 334,085 | |
| | | | | |
| EXPENSES: | | | | |
| Investment adviser fees | | | 95,975 | |
| Total Expenses | | | 95,975 | |
| NET INVESTMENT INCOME | | | 238,110 | |
| | | | | |
| REALIZED AND UNREALIZED GAIN: | | | | |
| Net realized gain on investments(b) | | | 718,062 | |
| Net change in unrealized appreciation on investments | | | 2,092,751 | |
| NET REALIZED AND UNREALIZED GAIN ON INVESTMENTS | | | 2,810,813 | |
| NET INCREASE IN NET ASSETS RESULTING FROM OPERATIONS | | $ | 3,048,923 | |
| (a) | The ALPS Active REIT ETF commenced operations on February 25, 2021. |
| (b) | Includes realized gain or loss as a result of in-kind transactions (See Note 4 in Notes to Financial Statements). |
See Notes to Financial Statements.
8 | November 30, 2021
ALPS Active REIT ETF
Statements of Changes in Net Assets
| | | For the Period February 25, 2021 (Commencement of Operations) to November 30, 2021 | |
| OPERATIONS: | | | |
| Net investment income | | $ | 238,110 | |
| Net realized gain | | | 718,062 | |
| Net change in unrealized appreciation | | | 2,092,751 | |
| Net increase in net assets resulting from operations | | | 3,048,923 | |
| | | | | |
| DISTRIBUTIONS TO SHAREHOLDERS: | | | | |
| From distributable earnings | | | (277,240 | ) |
| Total distributions | | | (277,240 | ) |
| | | | | |
| CAPITAL SHARE TRANSACTIONS: | | | | |
| Proceeds from sale of shares | | | 21,611,468 | |
| Cost of shares redeemed | | | (145,280 | ) |
| Net increase from capital share transactions | | | 21,466,188 | |
| Net increase in net assets | | | 24,237,871 | |
| | | | | |
| NET ASSETS: | | | | |
| Beginning of period | | | – | |
| End of period | | $ | 24,237,871 | |
| | | | | |
| OTHER INFORMATION: | | | | |
| CAPITAL SHARE TRANSACTIONS: | | | | |
| Beginning shares | | | – | |
| Shares sold | | | 825,002 | |
| Shares redeemed | | | (5,000 | ) |
| Shares outstanding, end of period | | | 820,002 | |
See Notes to Financial Statements.
9 | November 30, 2021
ALPS Active REIT ETF
| Financial Highlights | For a Share Outstanding Throughout the Periods Presented |
| | | For the Period February 25, 2021 (Commencement of Operations) to November 30, 2021 | |
| NET ASSET VALUE, BEGINNING OF PERIOD | | $ | 24.62 | |
| | | | | |
| INCOME FROM OPERATIONS: | | | | |
| Net investment income(a) | | | 0.37 | |
| Net realized and unrealized gain | | | 5.01 | |
| Total from investment operations | | | 5.38 | |
| | | | | |
| DISTRIBUTIONS: | | | | |
| From net investment income | | | (0.38 | ) |
| From net realized gains | | | (0.06 | ) |
| Total distributions | | | (0.44 | ) |
| | | | | |
| NET INCREASE IN NET ASSET VALUE | | | 4.94 | |
| NET ASSET VALUE, END OF PERIOD | | $ | 29.56 | |
| TOTAL RETURN(b) | | | 22.01 | % |
| | | | | |
| RATIOS/SUPPLEMENTAL DATA: | | | | |
| Net assets, end of period (in 000s) | | $ | 24,238 | |
| | | | | |
| RATIOS TO AVERAGE NET ASSETS | | | | |
| Ratio of expenses to average net assets | | | 0.68 | %(c) |
| Ratio of net investment income to average net assets | | | 1.69 | %(c) |
| Portfolio turnover rate(d) | | | 92 | % |
| (a) | Based on average shares outstanding during the period. |
| (b) | Total return is calculated assuming an initial investment made at the net asset value at the beginning of the period and redemption at the net asset value on the last day of the period and assuming all distributions are reinvested at the reinvestment prices. Total return calculated for a period of less than one year is not annualized. |
| (d) | Portfolio turnover for periods less than one year are not annualized and does not include securities received or delivered from processing creations or redemptions in-kind. |
See Notes to Financial Statements.
10 | November 30, 2021
ALPS Active REIT ETF
| Notes to Financial Statements | November 30, 2021 |
1. ORGANIZATION
ALPS ETF Trust (the “Trust”), a Delaware statutory trust, is an open-end management investment company registered under the Investment Company Act of 1940, as amended (the “1940 Act”). As of November 30, 2021, the Trust consists of eighteen separate portfolios. Each portfolio represents a separate series of the Trust. This report pertains solely to the ALPS Active REIT ETF (the “Fund”). The investment objective of the Fund is to seek total return through dividends and capital appreciation. The Fund is considered non-diversified and may invest a greater portion of assets in securities of individual issuers than a diversified fund. As a result, changes in the market value of a single investment could cause greater fluctuations in share price than would occur in a diversified fund.
The Fund’s Shares (“Shares”) are listed on the Nasdaq Stock Market LLC (“Nasdaq Exchange”). The Fund issues and redeems Shares at net asset value (“NAV”) in blocks of 5,000 Shares, each of which is called a “Creation Unit”. Creation Units are issued and redeemed principally in-kind for securities. Except when aggregated in Creation Units, Shares are not redeemable securities of the Fund.
Pursuant to the Trust’s organizational documents, its Officers and Trustees are indemnified against certain liability arising out of the performance of their duties to the Trust. Additionally, in the normal course of business, the Trust enters into contracts with service providers that contain general indemnification clauses. The Trust’s maximum exposure under these arrangements is unknown, as this would involve future claims that may be made against the Trust that have not yet occurred.
2. SIGNIFICANT ACCOUNTING POLICIES
The following is a summary of significant accounting policies consistently followed by the Fund in the preparation of the financial statements. The accompanying financial statements were prepared in accordance with accounting principles generally accepted in the United States of America (“U.S. GAAP”). The preparation of financial statements in conformity with U.S. GAAP requires management to make certain estimates and assumptions that affect the reported amounts of assets and liabilities and disclosures of contingent assets and liabilities at the date of the financial statements and the reported amounts of revenue and expenses during the period. Actual results could differ from those estimates. The Fund is considered an investment company under U.S. GAAP and follows the accounting and reporting guidance applicable to investment companies in the Financial Accounting Standards Board (“FASB”) Accounting Standards Codification Topic 946.
A. Portfolio Valuation
The Fund’s NAV is determined daily, as of the close of regular trading on the New York Stock Exchange ("NYSE"), normally 4:00 p.m. Eastern Time, on each day the NYSE is open for trading. The NAV is computed by dividing the value of all assets of the Fund (including accrued interest and dividends), less all liabilities (including accrued expenses and dividends declared but unpaid), by the total number of shares outstanding.
Portfolio securities listed on any exchange other than the NASDAQ Stock Market LLC (“NASDAQ”) are valued at the last sale price on the business day as of which such value is being determined. If there has been no sale on such day, the securities are valued at the mean of the most recent bid and ask prices on such day. Securities traded on the NASDAQ are valued at the NASDAQ Official Closing Price as determined by NASDAQ. Portfolio securities traded on more than one securities exchange are valued at the last sale price on the business day as of which such value is being determined at the close of the exchange representing the principal market for such securities. Portfolio securities traded in the over-the-counter market, but excluding securities traded on the NASDAQ, are valued at the last quoted sale price in such market.
The Fund’s investments are valued at market value or, in the absence of market value with respect to any portfolio securities, at fair value according to procedures adopted by the Trust’s Board of Trustees (the “Board”). When market quotations are not readily available or when events occur that make established valuation methods unreliable, securities of the Fund may be valued in good faith by or under the direction of the Board. These securities generally include, but are not limited to, restricted securities (securities which may not be publicly sold without registration under the Securities Act of 1933) for which a pricing service is unable to provide a market price; securities whose trading has been formally suspended; a security whose market price is not available from a pre-established primary pricing source or the pricing source is not willing to provide a price; a security with respect to which an event has occurred that is most likely to materially affect the value of the security after the market has closed but before the calculation of the Fund’s NAV or make it difficult or impossible to obtain a reliable market quotation; or a security whose price, as provided by the pricing service, does not reflect the security’s “fair value” due to the security being de-listed from a national exchange or the security’s primary trading market is temporarily closed at a time when, under normal conditions, it would be open. As a general principle, the current “fair value” of a security would be the amount which the owner might reasonably expect to receive from the sale on the applicable exchange or principal market. A variety of factors may be considered in determining the fair value of such securities.
11 | November 30, 2021
ALPS Active REIT ETF
| Notes to Financial Statements | November 30, 2021 |
B. Fair Value Measurements
The Fund discloses the classification of its fair value measurements following a three-tier hierarchy based on the inputs used to measure fair value. Inputs refer broadly to the assumptions that market participants would use in pricing the asset or liability, including assumptions about risk. Inputs may be observable or unobservable. Observable inputs reflect the assumptions market participants would use in pricing the asset or liability that are developed based on market data obtained from sources independent of the reporting entity. Unobservable inputs reflect the reporting entity’s own assumptions about the assumptions market participants would use in pricing the asset or liability that are developed based on the best information available.
Valuation techniques used to value the Fund’s investments by major category are as follows:
Equity securities, including restricted securities, for which market quotations are readily available, are valued at the last reported sale price or official closing price as reported by a third party pricing vendor on the primary market or exchange on which they are traded and are categorized as Level 1 in the hierarchy. In the event there were no sales during the day or closing prices are not available, securities are valued at the mean of the most recent quoted bid and ask prices on such day and are generally categorized as Level 2 in the hierarchy. Investments in open-end mutual funds are valued at their closing NAV each business day and are categorized as Level 1 in the hierarchy.
Changes in valuation techniques may result in transfers in or out of an assigned level within the disclosure hierarchy.
Various inputs are used in determining the value of the Fund’s investments as of the end of the reporting period. When inputs used fall into different levels of the fair value hierarchy, the level in the hierarchy within which the fair value measurement falls is determined based on the lowest level input that is significant to the fair value measurement in its entirety. The designated input levels are not necessarily an indication of the risk or liquidity associated with these investments.
These inputs are categorized in the following hierarchy under applicable financial accounting standards:
| Level 1 – | Unadjusted quoted prices in active markets for identical investments, unrestricted assets or liabilities that a Fund has the ability to access at the measurement date; |
| Level 2 – | Quoted prices which are not active, quoted prices for similar assets or liabilities in active markets or inputs other than quoted prices that are observable (either directly or indirectly) for substantially the full term of the asset or liability; and |
| Level 3 – | Significant unobservable prices or inputs (including the Fund’s own assumptions in determining the fair value of investments) where there is little or no market activity for the asset or liability at the measurement date. |
The following is a summary of inputs used to value the Fund’s investments as of November 30, 2021:
| ALPS Active REIT ETF | | | | | | | | | | | | |
| Investments in Securities at Value | | Level 1 - Quoted and Unadjusted Prices | | | Level 2 - Other Significant Observable Inputs | | | Level 3 - Significant Unobservable Inputs | | | Total | |
| Common Stocks* | | $ | 23,678,604 | | | $ | – | | | $ | – | | | $ | 23,678,604 | |
| Short Term Investments | | | 430,783 | | | | – | | | | – | | | | 430,783 | |
| Total | | $ | 24,109,387 | | | $ | – | | | $ | – | | | $ | 24,109,387 | |
| * | For a detailed breakdown of sectors, see the accompanying Schedule of Investments. |
The Fund did not have any securities that used significant unobservable inputs (Level 3) in determining fair value and there were no transfers into or out of Level 3 during the period ended November 30, 2021.
C. Securities Transactions and Investment Income
Securities transactions are recorded as of the trade date. Realized gains and losses from securities transactions are recorded on the specific identification in accordance with GAAP. Dividend income and capital gains distributions, if any, are recorded on the ex-dividend date. Interest income, if any, is recorded on the accrual basis.
D. Dividends and Distributions to Shareholders
Dividends from net investment income of the Fund, if any, are declared and paid quarterly or as the Board may determine from time to time. Distributions of net realized capital gains earned by the Fund, if any, are distributed at least annually.
12 | November 30, 2021
ALPS Active REIT ETF
| Notes to Financial Statements | November 30, 2021 |
E. Federal Tax and Tax Basis Information
The timing and character of income and capital gain distributions are determined in accordance with income tax regulations, which may differ from U.S. GAAP. Reclassifications are made to the Fund’s capital accounts for permanent tax differences to reflect income and gains available for distribution (or available capital loss carryforwards) under income tax regulations.
For the period starting with the commencement of operations and ending November 30, 2021, the following reclassifications, which had no impact on results of operations or net assets, were recorded to reflect permanent tax differences resulting primarily from in-kind transactions:
| Fund | | Paid-in Capital | | | Total Distributable Earnings | |
| ALPS Active REIT ETF | | $ | (4,703 | ) | | $ | 4,703 | |
The tax character of the distributions paid during the period starting with the commencement of operations and ending November 30, 2021 was as follows:
| | | Ordinary Income | | | Long-Term Capital Gain | | | Return of Capital | |
| November 30, 2021 | | | | | | | | | |
| ALPS Active REIT ETF | | $ | 277,240 | | | $ | – | | | $ | – | |
The character of distributions made during the year may differ from its ultimate characterization for federal income tax purposes.
As of November 30, 2021, the components of distributable earnings on a tax basis for each Fund were as follows:
| | | ALPS Active REIT ETF | |
| Undistributed net investment income | | $ | 672,958 | |
| Accumulated net realized gain on investments | | | 28,770 | |
| Net unrealized appreciation on investments | | | 2,074,658 | |
| Total | | $ | 2,776,386 | |
As of November 30, 2021, the cost of investments for federal income tax purposes and accumulated net unrealized appreciation/(depreciation) on investments were as follows:
| | | ALPS Active REIT ETF | |
| Gross appreciation (excess of value over tax cost) | | $ | 2,573,653 | |
| Gross depreciation (excess of tax cost over value) | | | (498,995 | ) |
| Net unrealized appreciation (depreciation) | | $ | 2,074,658 | |
| Cost of investments for income tax purposes | | $ | 22,034,729 | |
The differences between book-basis and tax-basis are primarily due to the deferral of losses from wash sales.
F. Real Estate Investment Trusts (“REITs”)
As part of its investments in real estate related securities, the Fund will invest in REITs and is subject to certain risks associated with direct investment in REITs. REITs possess certain risks which differ from an investment in common stocks. REITs are financial vehicles that pool investors’ capital to acquire, develop and/or finance real estate and provide services to their tenants. REITs may concentrate their investments in specific geographic areas or in specific property types, e.g., regional malls, shopping centers, office buildings, apartment buildings and industrial warehouses. REITs may be affected by changes in the value of their underlying properties and by defaults by borrowers or tenants. REITs depend generally on their ability to generate cash flow to make distributions to shareowners, and certain REITs have self-liquidation provisions by which mortgages held may be paid in full and distributions of capital returns may be made at any time.
13 | November 30, 2021
ALPS Active REIT ETF
| Notes to Financial Statements | November 30, 2021 |
As REITs generally pay a higher rate of dividends than most other operating companies, to the extent application of the Fund's investment strategy results in the Fund investing in REIT shares, the percentage of the Fund's dividend income received from REIT shares will likely exceed the percentage of the Fund's portfolio that is comprised of REIT shares. Distributions received by the Fund from REITs may consist of dividends, capital gains and/or return of capital.
Dividend income from REITs is recognized on the ex-dividend date. The calendar year-end amounts of ordinary income, capital gains, and return of capital included in distributions received from the Fund's investments in REITs are reported to the Fund after the end of the calendar year; accordingly, the Fund estimates these amounts for accounting purposes until the characterization of REIT distributions is reported to the Fund after the end of the calendar year. Estimates are based on the most recent REIT distribution information available.
The performance of a REIT may be affected by its failure to qualify for tax-free pass-through of income under the Internal Revenue Code of 1986, as amended (the “Code”), or its failure to maintain exemption from registration under the 1940 Act. Due to the Fund's investments in REITs, the Fund may also make distributions in excess of the Fund's earnings and capital gains. Distributions, if any, in excess of the Fund's earnings and profits will first reduce the adjusted tax basis of a holder’ shares and, after that basis has been reduced to zero, will constitute capital gains to the shareholder.
G. Income Taxes
No provision for income taxes is included in the accompanying financial statements, as the Fund intends to distribute to shareholders all taxable investment income and realized gains and otherwise comply with Subchapter M of the Code applicable to regulated investment companies. The Fund evaluates tax positions taken (or expected to be taken) in the course of preparing the Fund’s tax returns to determine whether these positions meet a “more-likely-than-not” standard that, based on the technical merits, have a more than fifty percent likelihood of being sustained by a taxing authority upon examination. A tax position that meets the “more-likely-than-not” recognition threshold is measured to determine the amount of benefit to recognize in the financial statements.
As of and during the period ended November 30, 2021, the Fund did not have a liability for any unrecognized tax benefits. The Fund files U.S. federal, state, and local tax returns as required. The Fund’s tax returns are subject to examination by the relevant tax authorities until expiration of the applicable statute of limitations, which is generally three years after the filing of the tax return, but may extend to four years in certain jurisdictions. Tax returns for open years have incorporated no uncertain tax positions that require a provision for income taxes.
H. Lending of Portfolio Securities
The Fund has entered into a securities lending agreement with State Street Bank & Trust Co. (“SSB”), the Fund’s lending agent. The Fund may lend its portfolio securities only to borrowers that are approved by SSB. The Fund will limit such lending to not more than 33 1/3% of the value of its total assets. The Fund’s securities held at SSB as custodian shall be available to be lent except those securities the Fund or ALPS Advisors, Inc. specifically identifies in writing as not being available for lending. The borrower pledges and maintains with the Fund collateral consisting of cash (U.S. Dollars only), securities issued or guaranteed by the U.S. government or its agencies or instrumentalities, and cash equivalents (including irrevocable bank letters of credit) issued by a person other than the borrower or an affiliate of the borrower. The initial collateral received by the Fund is required to have a value of no less than 102% of the market value of the loaned securities for U.S equity securities and a value of no less than 105% of the market value for non-U.S. equity securities. The collateral is maintained thereafter, at a market value equal to not less than 102% of the current value of the U.S. equity securities on loan and not less than 105% of the current value of the non-U.S. equity securities on loan. The market value of the loaned securities is determined at the close of each business day and any additional required collateral is delivered to the Fund on the next business day. During the term of the loan, the Fund is entitled to all distributions made on or in respect of the loaned securities. Loans of securities are terminable at any time and the borrower, after notice, is required to return borrowed securities within the customary time period for settlement of securities transactions.
Any cash collateral received is reinvested in a money market fund managed by SSB as disclosed in the Fund’s Schedule of Investments and is reflected in the Statements of Assets and Liabilities as a payable for collateral upon return of securities loaned. Non-cash collateral, in the form of securities issued or guaranteed by the U.S. government or its agencies or instrumentalities, is not disclosed in the Fund’s Statements of Assets and Liabilities as it is held by the lending agent on behalf of the Fund, and the Fund does not have the ability to re-hypothecate these securities. The fund did not participate in any securities lending during the period ended November 31, 2021.
14 | November 30, 2021
ALPS Active REIT ETF
| Notes to Financial Statements | November 30, 2021 |
3. INVESTMENT ADVISORY FEE AND OTHER AFFILIATED TRANSACTIONS
ALPS Advisors, Inc. (the “Adviser”) serves as the Fund’s investment adviser pursuant to an Investment Advisory Agreement with the Trust on behalf of the Fund (the “Advisory Agreement”). Pursuant to the Advisory Agreement, the Fund pays the Adviser an annual management fee for the services and facilities it provides, payable on a monthly basis at the annual rate of 0.68% of the Fund’s average daily net assets.
Out of the unitary management fee, the Adviser pays substantially all expenses of the Fund, including the cost of sub-advisory, transfer agency, custody, fund administration, legal, audit, trustees and other services, except for acquired fund fees and expenses, interest expenses, distribution fees or expenses, brokerage expenses, taxes and extraordinary expenses not incurred in the ordinary course of the Fund's business. The Adviser’s unitary management fee is designed to pay substantially all of the Fund’s expenses and to compensate the Adviser for providing services to the Fund.
GSI Capital Advisors LLC (the “Sub-Adviser”) serves as the Fund's sub-adviser pursuant to a sub-advisory agreement with the Trust (the ‘‘Sub-Advisory Agreement’’). Pursuant to the Sub-Advisory Agreement, the Adviser pays the Sub-Adviser a sub-advisory fee out of the Adviser’s advisory fee for the services it provides. The fee is payable on a monthly basis at the annual rate of 0.35% of the Fund's average daily net assets.
ALPS Fund Services, Inc., an affiliate of the Adviser, is the administrator of the Fund.
Each Trustee receives (1) a quarterly retainer of $10,000, (2) a per meeting fee of $5,000, (3) $1,500 for any special meeting held outside of a regularly scheduled board meeting, and (4) reimbursement for all reasonable out-of-pocket expenses relating to attendance at meetings. In addition, the Chairman of the Board and Chairman of the Audit Committee each receives a quarterly retainer of $2,000, in connection with their respective roles.
4. PURCHASES AND SALES OF SECURITIES
For the period starting with the commencement of operations and ending November 30, 2021, the cost of purchases and proceeds from sales of investment securities, excluding short-term investments and in-kind transactions, were as follows:
| Fund | | Purchases | | | Sales | |
| ALPS Active REIT ETF | | $ | 14,984,683 | | | $ | 15,089,929 | |
For the period starting with the commencement of operations and ended November 30, 2021, the cost of in-kind purchases and proceeds from in-kind sales were as follows:
| Fund | | Purchases | | | Sales | |
| ALPS Active REIT ETF | | $ | 21,177,548 | | | $ | 141,445 | |
For the period starting with the commencement of operations and ending November 30, 2021, the ALPS Active REIT ETF had in-kind net realized loss of $4,703.
Gains on in-kind transactions are not considered taxable for federal income tax purposes and losses on in-kind transactions are also not deductible for tax purposes.
5. CAPITAL SHARE TRANSACTIONS
Shares are created and redeemed by the Fund only in Creation Unit size aggregations of 5,000 Shares. Only broker-dealers or large institutional investors with creation and redemption agreements called Authorized Participants (“AP”) are permitted to purchase or redeem Creation Units from the Fund. Such transactions are generally permitted on an in-kind basis, with a balancing cash component to equate the transaction to the NAV per unit of the Fund on the transaction date. Cash may be substituted equivalent to the value of certain securities generally when they are not available in sufficient quantity for delivery, not eligible for trading by the AP or as a result of other market circumstances.
15 | November 30, 2021
ALPS Active REIT ETF
| Notes to Financial Statements | November 30, 2021 |
6. MARKET DISRUPTIONS RISK
The Fund is subject to investment and operational risks associated with financial, economic and other global market developments and disruptions, including the recent spread of an infectious respiratory illness caused by a novel strain of coronavirus (known as COVID-19), which can negatively impact the securities markets and cause the Fund to lose value.
The spread of COVID-19 has caused volatility, severe market dislocations and liquidity constraints in many markets, including markets for the securities the Fund holds, and may adversely affect the Fund’s investments and operations. The transmission of COVID-19 and efforts to contain its spread have resulted in travel restrictions and disruptions, closed international borders, enhanced health screenings at ports of entry and elsewhere, disruption of and delays in healthcare service preparation and delivery, quarantines, event and service cancellations or interruptions, disruptions to business operations and supply chains, and a reduction in consumer and business spending, as well as general concern and uncertainty that has negatively affected the economy. These disruptions have led to instability in the market place and the jobs market. The impact of COVID-19 could adversely affect the economies of many nations or the entire global economy, the financial well-being and performance of individual issuers, borrowers and sectors and the health of the markets generally in potentially significant and unforeseen ways.
The foregoing could lead to a significant economic downturn or recession, increased market volatility, a greater number of market closures, higher default rates and adverse effects on the values and liquidity of the Fund’s securities or other assets. Such impacts may adversely affect the performance of the Fund.
7. SUBSEQUENT EVENTS
Subsequent events, if any, after the date of the Statements of Assets and Liabilities have been evaluated through the date the financial statements were issued. Management has determined that there were no subsequent events to report through the issuance of these financial statements.
16 | November 30, 2021
ALPS Active REIT ETF
| Additional Information | November 30, 2021 (Unaudited) |
PROXY VOTING RECORDS, POLICIES AND PROCEDURES
Information regarding how the Fund voted proxies relating to portfolio securities during the most recent 12-month period ended June 30 and a description of the Fund’s proxy voting policies and procedures used in determining how to vote for proxies are available without charge on the SEC’s website at www.sec.gov and upon request, by calling (toll-free) 1-866-759-5679.
PORTFOLIO HOLDINGS
The Fund files a complete schedule of portfolio holdings with the U.S. Securities and Exchange Commission (“SEC”) for the first and third quarters of each fiscal year on Form N-PORT within 60 days after the end of the period. Copies of the Fund’s Form N-PORT are available without a charge, upon request, by contacting the Fund at 1-866-759-5679 and on the SEC’s website at https://www.sec.gov.
17 | November 30, 2021
ALPS Active REIT ETF
| Trustees & Officers | November 30, 2021 (Unaudited) |
The general supervision of the duties performed by the Adviser for the Fund under the Investment Advisory Agreement is the responsibility of the Board of Trustees. The Trust currently has four Trustees. Three Trustees have no affiliation or business connection with the Adviser or any of its affiliated persons and do not own any stock or other securities issued by the Adviser. These are the “non-interested” or “independent” Trustees (“Independent Trustees”). The other Trustee (the “Interested Trustee”) is affiliated with the Adviser.
The Independent Trustees of the Trust, their term of office and length of time served, their principal business occupations during the past five years, the number of portfolios in the Fund Complex overseen by each Independent Trustee, and other directorships, if any, held by the Trustee are shown below.
INDEPENDENT TRUSTEES
| Name, Address & Year of Birth* | Position(s) Held with Trust | Term of Office and Length of Time Served** | Principal Occupation(s) During Past 5 Years | Number of Portfolios in Fund Complex Overseen by Trustees*** | Other Directorships Held by Trustees |
Mary K. Anstine, 1940 | Trustee | Since March 2008 | Ms. Anstine is Trustee/Director of AV Hunter Trust and Colorado Uplift Board. | 36 | Ms. Anstine is a Trustee of ALPS Variable Investment Trust (7 funds); Financial Investors Trust (32 funds); Reaves Utility Income Fund; and Segall Bryant & Hamill Trust (14 funds). |
| Jeremy W. Deems, 1976 | Trustee | Since March 2008 | Mr. Deems is the Co-Founder and Chief Financial Officer of Green Alpha Advisors, LLC, a registered investment advisor, and Co-Portfolio Manager of the Shelton Green Alpha Fund. | 36 | Mr. Deems is a Trustee of ALPS Variable Investment Trust (7 funds); Financial Investors Trust (32 funds); and Reaves Utility Income Fund; and Clough Funds Trust (1 fund). |
Rick A. Pederson, 1952 | Trustee | Since March 2008 | Mr. Pederson is Partner, Bow River Capital Partners (private equity management), 2003 - present; Board Member, Prosci Inc. (private business services) 2013-2016; Advisory Board Member, Citywide Banks (Colorado community bank) 2014-2017; Board Member, Strong-Bridge Consulting, 2015-2019; Board Member, IRI/ODMS Holdings LLC, 2017-2019; Director, National Western Stock Show (not for profit) 2010 - present; Director, History Colorado (not for profit) 2015-present; Director, Citywide Bank Advisory Board 2017-present; Trustee, Boettcher Foundation, 2018 -present. | 19 | Mr. Pederson is Trustee of Segall Bryant & Hamill Trust (14 funds) and Principal Real Estate Income Fund (1 fund). |
| * | The business address of the Trustee is c/o ALPS Advisors, Inc., 1290 Broadway, Suite 1000, Denver, Colorado 80203. |
| ** | This is the period for which the Trustee began serving the Trust. Each Trustee serves an indefinite term, until his successor is elected. |
| *** | The Fund Complex includes all series of the Trust and any other investment companies for which ALPS Advisors, Inc. provides investment advisory services. |
18 | November 30, 2021
ALPS Active REIT ETF
| Trustees & Officers | November 30, 2021 (Unaudited) |
The Trustee who is an “interested person” of the Trust, his term of office and length of time served, his principal business occupations during the past five years, the number of portfolios in the Fund Complex overseen by the Interested Trustee and the other directorships, if any, held by the Trustee, are shown below.
INTERESTED TRUSTEE
| Name, Address and Year of Birth of Interested Trustee* | Position(s) Held with Trust | Term of Office and Length of Time Served** | Principal Occupation(s) During Past 5 Years | Number of Portfolios in Fund Complex Overseen by Trustees*** | Other Directorships Held by Trustees |
| Edmund J. Burke, 1961 | Trustee | Since December 2017. | Mr. Burke joined ALPS in 1991 and served as the President and Director of ALPS Holdings, Inc., and ALPS Advisors, Inc. (“AAI”), and Director of ALPS Distributors, Inc. (“ADI”), ALPS Fund Services, Inc. (“AFS”), and ALPS Portfolio Solutions Distributor, Inc. (“APSD”). Mr. Burke retired from ALPS in June 2019. | 31 | Mr. Burke is a Trustee of Clough Global Dividend and Income Fund (1 fund); Clough Global Equity Fund (1 fund); Clough Global Opportunities Fund (1 fund); Clough Funds Trust (1 fund); Liberty All-Star Equity Fund (1 fund); Director of the Liberty All- Star Growth Fund, Inc. (1 fund) and Financial Investors Trust (32 funds). |
| * | The business address of the Trustee is c/o ALPS Advisors, Inc., 1290 Broadway, Suite 1000, Denver, Colorado 80203. Effective December 1, 2021, Mr. Burke is an Independent Trustee of the Trust. |
| ** | This is the period for which the Trustee began serving the Trust. Each Trustee serves an indefinite term, until his successor is elected. |
| *** | The Fund Complex includes all series of the Trust and any other investment companies for which ALPS Advisors, Inc. provides investment advisory services. |
19 | November 30, 2021
ALPS Active REIT ETF
| Trustees & Officers | November 30, 2021 (Unaudited) |
OFFICERS
| Name, Address and Year of Birth of Officer* | Position(s) Held with Trust | Length of Time Served** | Principal Occupation(s) During Past 5 Years |
| Laton Spahr, 1975 | President | Since June 2021 | Mr. Spahr joined ALPS in 2019 and currently serves as President and Portfolio Manager of AAI. Prior to his current role, Mr. Spahr was a Senior Vice President and Strategy Leader of the Value & Income Team for Oppenheimer Funds from 2013 to 2019. |
| Matthew Sutula, 1985 | Chief Compliance Officer (“CCO”) | Since December 2019 | Mr. Sutula joined ALPS in 2012 and currently serves as Chief Compliance Officer of AAI. Prior to his current role, Mr. Sutula served as interim Compliance Officer of the Trust (September 2019 to December 2019). Compliance Manager and Senior Compliance Analyst for AAI, as well as Compliance Analyst for AFS. Prior to joining ALPS, he spent seven years at Morningstar, Inc. in various analyst roles supporting the registered investment company databases. Mr. Sutula is also Chief Compliance Officer of Principal Real Estate Income Fund, ALPS Variable Investment Trust, RiverNorth Opportunities Fund, Inc., Liberty All-Star Equity Fund and Liberty All-Star Growth Fund, Inc. |
| Kathryn Burns, 1976 | Treasurer | Since September 2018 | Ms. Burns serves as Vice President, Director of Fund Operations of AAI since 2018. From 2013 to 2018, she served as Vice President and Fund Controller at AFS. Prior to joining ALPS, she worked at Old Mutual Capital where she served as Vice President and Chief Compliance Officer (2010 – 2012) and Regulatory Reporting Manager and Assistant Treasurer to the Old Mutual Funds Trusts (2006 – 2012). She also served as a CPA for PricewaterhouseCoopers LLP. Ms. Burns also serves as President of ALPS Variable Investment Trust, Principal Real Estate Income Fund and RiverNorth Opportunities Fund, Inc. From June 2018 to November 2021 she also served as Treasurer of Boulder Growth & Income Fund, Inc. |
| Brendan Hamill, 1986 | Secretary | Since September 2021 | Mr. Hamill joined ALPS in August 2021, and is currently Vice President and Principal Legal Counsel. Prior to joining ALPS, Mr. Hamill was an attorney at Lewis Brisbois Bisgaard & Smith, LLP (law firm) (December 2018-August 2021) and Vedder Price, P.C. (law firm) (August 2015-December 2018). Mr. Hamill also serves as Secretary of Financial Investors Trust, Secretary of ALPS Variable Investment Trust, Secretary of Principal Real Estate Income Fund, and Assistant Secretary of James Advantage Funds. |
| * | The business address of each Officer is c/o ALPS Advisors, Inc., 1290 Broadway, Suite 1000, Denver, Colorado 80203. Each Officer is deemed an affiliate of the Trust as defined under the 1940 Act. |
| ** | This is the period for which the Officer began serving the Trust. Each Officer serves an indefinite term, until his/her successor is elected. |
The Statement of Additional Information includes additional information about the Fund’s Trustees and is available, without charge, upon request by calling (toll-free) 1-866-759-5679.
20 | November 30, 2021


Table of Contents
| Performance Overview | 1 |
| Disclosure of Fund Expenses | 4 |
| Report of Independent Registered Public Accounting Firm | 5 |
| Financial Statements | |
| Schedule of Investments | 6 |
| Statement of Assets and Liabilities | 7 |
| Statement of Operations | 8 |
| Statements of Changes in Net Assets | 9 |
| Financial Highlights | 10 |
| Notes to Financial Statements | 11 |
| Additional Information | 17 |
| Board Considerations Regarding Approval of Investment Advisory Agreement | 18 |
| Trustees & Officers | 19 |
alpsfunds.com
ALPS Equal Sector Weight ETF
| Performance Overview | November 30, 2021 (Unaudited) |
Investment Objective
The ALPS Equal Sector Weight ETF (the “Fund”) seeks investment results that replicate as closely as possible, before fees and expenses, the performance of the NYSE Equal Sector Weight IndexSM (the “Underlying Index”).
The Underlying Index is an index of ETFs comprised of all active Select Sector SPDR® ETFs in an equal weighted portfolio. These are the Communication Services Select Sector SPDR® Fund, Consumer Discretionary Select Sector SPDR® Fund, Consumer Staples Select Sector SPDR® Fund, Materials Select Sector SPDR® Fund, Energy Select Sector SPDR® Fund, Technology Select Sector SPDR® Fund, Utilities Select Sector SPDR® Fund, Financial Select Sector SPDR® Fund, Industrial Select Sector SPDR® Fund, Health Care Select Sector SPDR® Fund and Real Estate Select Sector SPDR® Fund (each, an “Underlying Sector ETF” and collectively, the “Underlying Sector ETFs”). In order to track the Underlying Index, the Fund will use a “fund of funds” approach, and seek to achieve its investment objective by investing at least 90% of its total assets in the shares of the Underlying Sector ETFs.
The Underlying Index is designed to track performance of the equally weighted Underlying Sector ETFs. Accordingly, the Underlying Index is rebalanced to an equal weighting quarterly during the months of March, June, September, and December.
Each Underlying Sector ETF is an “index fund” that invests in the equity securities of companies in a particular sector or group of industries. The objective of each Underlying Sector ETF is to track its respective underlying sector index by replicating the securities in the underlying sector index. Together, the eleven Underlying Sector ETFs represent the Underlying Index as a whole.
Performance Overview
The ALPS Equal Sector Weight ETF, for the twelve month period ended November 30, 2021, generated a total return of 25.89%, in-line with the Fund’s Underlying Index, net of fees, which returned 26.06%. The Fund underperformed the S&P 500® Total Return Index (the "S&P 500"), which returned 27.92% for the same period.
The S&P 500 returned 27.92% for the trailing twelve month period ended November 30, 2021, finishing near its all-time high. Unmoved by persistent talks of inflation and policy changes, markets surged without significant drawdowns until September. October proved resilient, as the drawdown was met by a swift bounce back to all-time-highs for most of the averages. Main macroeconomic talking points throughout 2021 centered on inflation and the question surrounding how transitory price increases would turn out to be. Inflation fears continued to be justified with the Consumer Price Index (CPI) surging 6.2% in October, along with core inflation readings increasing 4.6% for the same month; both indicators notching their largest increases since December 1990, and August 1991, respectively. Federal Reserve Chairman Powell was quick to reassure markets of the non-persistent inflation narrative throughout 2021 and announced a taper and reduction of balance sheet purchases starting in November of ‘21. Although the Fed plans to complete tapering before any rate hikes in 2022, projections of the magnitude for rate increases vary, as global supply chain woes and the newly discovered Omicron variant do not ensure a future without added policy support. Despite a murky outlook for 2021 and heading into the New Year, global GDP surpassed pre-pandemic levels in 2021, aided by policy support and strong consumer spending. Record profit margins for U.S. corporations led the way for record valuations through most of the year, but was matched by an earnings season in Q3 where many companies cut forward looking expectations amid a slowing global growth outlook.
The best performing Fund holdings for the period were the Energy Select Sector SPDR® (XLE), which increased 55.56% and the Financial Select Sector SPDR® (XLF), which saw a gain of 38.64%. The worst performing Fund holdings for the period were the Consumer Staples Select Sector SPDR® (XLP) which returned 7.87% and the Utilities Select Sector SPDR® (XLU) which returned 7.98%.
Looking forward the Fund's adviser believes the Fund’s strategy of holding each of the ten sectors (with Information Technology and Telecommunication Service combined) in the S&P 500® via the Select SPDR® Funds can result in a diversified core holding, and potential for market participation in all economic cycles through equal sector weighting.
1 | November 30, 2021
ALPS Equal Sector Weight ETF
| Performance Overview | November 30, 2021 (Unaudited) |
Performance (as of November 30, 2021)
| | 1 Year | 5 Year | 10 Year | Since Inception^ |
| ALPS Equal Sector Weight ETF - NAV | 25.89% | 14.40% | 13.77% | 14.51% |
| ALPS Equal Sector Weight ETF - Market Price* | 25.78% | 14.39% | 13.77% | 14.52% |
| NYSE® Equal Sector Weight Total Return Index | 26.06% | 14.57% | 14.02% | 14.78% |
| S&P 500® Total Return Index | 27.92% | 17.90% | 16.16% | 16.32% |
Total Expense Ratio (per the current Prospectus) is 0.50%. Net Expense Ratio (per the current Prospectus) is 0.28%. Net expense ratio reflects the reimbursement of distribution fees for underlying sector ETFs. In addition, the Adviser has contractually agreed, through March 31, 2022, to reduce its advisory fee by 0.19%. This fee waiver may only be terminated by the Fund’s Board of Trustees (and not by the Adviser) prior to such date. Please see the prospectus for additional information.
Performance data quoted represents past performance. Past performance does not guarantee future results. Total return figures assume reinvestment of dividends and capital gains distributions, if any. The table does not reflect the deduction of taxes that a shareholder would pay on Fund distributions or the redemption of Fund shares. Investment return and principal value of an investment will fluctuate so that an investor’s shares, when sold or redeemed, may be worth more or less than the original cost. Current performance data may be higher or lower than actual data quoted. For the most current month-end performance data please visit www.alpsfunds.com or call 1.866.675.2639.
NAV is an exchange-traded fund’s per-share value. The per-share dollar amount of the Fund is derived by dividing the total value of all the securities in its portfolio, less any liabilities, by the number of Fund shares outstanding. Market Price is the price at which a share can currently be traded in the market. Information detailing the number of days the Market Price of the Fund was greater than the Fund’s NAV and the number of days it was less than the Fund’s NAV can be obtained at www.alpsfunds.com.
| ^ | The Fund commenced Investment Operations on July 6, 2009 with an Inception Date, the first day of trading on the Exchange, of July 7, 2009. |
| * | Market Price means the official closing price of a share or, if it more accurately reflects the market value of a share at the time as of which the Fund calculates current net asset value per share, the price that is the midpoint of the bid-ask spread as of that time. It does not represent the returns an investor would receive if shares were traded at other times. |
The NYSE® Equal Sector Weight Total Return Index consists of a strategy that holds all active Select Sector SPDR® ETFs in an equal-weighted portfolio. Total return assumes reinvestment of any dividends and distributions realized during a given time period.
S&P 500® Total Return Index: the Standard & Poor’s composite index of 500 stocks, a widely recognized, unmanaged index of common stock prices. Total return assumes reinvestment of any dividends and distributions realized during a given time period.
The indexes are not actively managed and do not reflect any deductions for fees, expenses or taxes. The indexes are reported on a total return basis, which assumes reinvestment of any dividends and distributions realized during a given time period. One cannot invest directly in an index. Index performance does not reflect fund performance.
The Fund’s shares are not individually redeemable. Investors buy and sell shares of the Fund on a secondary market. Only market makers or “authorized participants” may trade directly with the Fund, typically in blocks of 25,000 shares.
The ALPS Equal Sector Weight ETF is not suitable for all investors. Investments in the Fund are subject to investment risks, including possible loss of the principal amount invested.
ALPS Portfolio Solutions Distributor, Inc., a FINRA member, is the distributor for the Fund.
2 | November 30, 2021
ALPS Equal Sector Weight ETF
| Performance Overview | November 30, 2021 (Unaudited) |
The following table shows the sector weights of both the Fund and the S&P 500® Total Return Index as of November 30, 2021:
Sector Weighting Comparison (as of November 30, 2021)
| | EQL* | S&P 500® | +/- |
| Consumer Discretionary | 9.9% | 13.2% | -3.3% |
| Energy | 9.9% | 2.7% | 7.2% |
| Technology | 9.7% | 29.4% | -19.7% |
| Materials | 9.3% | 2.5% | 6.8% |
| Real Estate | 9.0% | 2.6% | 6.4% |
| Financials | 9.0% | 10.8% | -1.8% |
| Industrials | 8.9% | 7.8% | 1.1% |
| Utilities | 8.8% | 2.4% | 6.4% |
| Consumer Staples | 8.8% | 5.6% | 3.2% |
| Healthcare | 8.7% | 12.7% | -4.0% |
| Communication Services | 8.1% | 10.4% | -2.3% |
| Total | 100.0% | 100.0% | |
Source: S&P 500®
| * | % of Total Investments (excluding investments purchased with collateral from securities loaned). Future holdings are subject to change. |
Growth of $10,000 (as of November 30, 2021)
Comparison of Change in Value of $10,000 Investment in the Fund and the Indexes
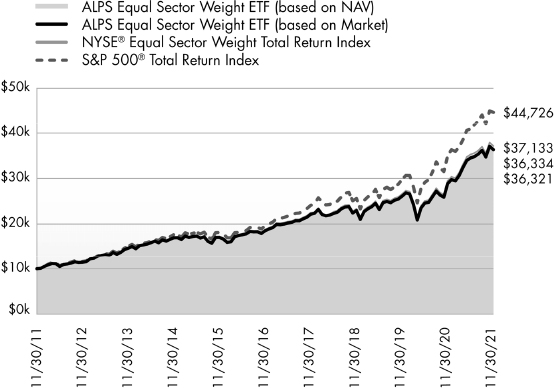
The chart above compares historical performance of a hypothetical investment of $10,000 in the Fund over the past ten years including dividend reinvestment with the performance of the Fund’s benchmark index. Results include the reinvestment of all dividends and capital gain distributions. Past performance does not guarantee future results. The chart does not reflect the deduction of taxes that a shareholder would pay on Fund distributions or the redemption of Fund shares.
3 | November 30, 2021
ALPS Equal Sector Weight ETF
| Disclosure of Fund Expenses | November 30, 2021 (Unaudited) |
Shareholder Expense Example: As a shareholder of the Fund, you incur certain ongoing costs, including management fees and other Fund expenses. These examples are intended to help you understand your ongoing costs (in dollars) of investing in the Fund and to compare these costs with the ongoing costs of investing in other funds. The example is based on an investment of $1,000 invested at the beginning of the (six month) period and held through November 30, 2021.
Actual Return: The first line of the table provides information about actual account values and actual expenses. You may use the information in this line, together with the amount you invested, to estimate the expenses that you incurred over the period. Simply divide your account value by $1,000 (for example, an $8,600 account value divided by $1,000 = 8.6), then multiply the result by the number in the first line under the heading entitled “Expenses Paid During Period” to estimate the expenses attributable to your investment during this period.
Hypothetical 5% Return: The second line of the table provides information about hypothetical account values and hypothetical expenses based on the Fund’s actual expense ratio and an assumed rate of return of 5% per year before expenses, which is not the Fund’s actual return. The hypothetical account values and expenses may not be used to estimate the actual ending account balance or expenses you paid for the period. You may use this information to compare ongoing costs of investing in the Fund and other funds. To do so, compare this 5% hypothetical example with the 5% hypothetical examples that appear in the shareholder reports of other funds.
The expenses shown in the table are meant to highlight ongoing Fund costs only and do not reflect any transaction costs, such as brokerage commissions and other fees to financial intermediaries. Therefore, the second line of the table is useful in comparing ongoing costs only, and will not help you determine the relative total costs of owning different funds. In addition, if these costs were included, your costs would have been higher.
| | | Beginning Account Value 6/1/21 | | | Ending Account Value 11/30/21 | | | Expense Ratio(a) | | | Expenses Paid During Period 6/1/21 - 11/30/21(b) | |
| ALPS Equal Sector Weight ETF | | | | | | | | | | | | |
| Actual | | $ | 1,000.00 | | | $ | 1,052.20 | | | | 0.15 | % | | $ | 0.77 | |
| Hypothetical (5% return before expenses) | | $ | 1,000.00 | | | $ | 1,024.32 | | | | 0.15 | % | | $ | 0.76 | |
| (a) | Annualized, based on the Fund's most recent fiscal half year expenses. |
| (b) | Expenses are equal to the Fund's annualized expense ratio multiplied by the average account value over the period, multiplied by the number of days in the most recent fiscal half year (183), divided by 365. |
4 | November 30, 2021
ALPS Equal Sector Weight ETF
Report of Independent Registered Public Accounting Firm
To the Board of Trustees of ALPS ETF Trust and the shareholders of ALPS Equal Sector Weight ETF:
Opinion on the Financial Statements and Financial Highlights
We have audited the accompanying statement of assets and liabilities, including the schedule of investments of ALPS Equal Sector Weight ETF (the "Fund"), one of the funds constituting the ALPS ETF Trust, as of November 30, 2021, the related statement of operations for the year then ended, the statements of changes in net assets for each of the two years in the period then ended, and the financial highlights for each of the five years in the period then ended, and the related notes.
In our opinion, the financial statements and financial highlights present fairly, in all material respects, the financial position of the Fund as of November 30, 2021, and the result of its operations for the year then ended, the changes in its net assets for each of the two years in the period then ended, and the financial highlights for each of the five years in the period then ended in conformity with accounting principles generally accepted in the United States of America.
Basis for Opinion
These financial statements and financial highlights are the responsibility of the Fund's management. Our responsibility is to express an opinion on the Fund's financial statements and financial highlights based on our audit. We are a public accounting firm registered with the Public Company Accounting Oversight Board (United States) (PCAOB) and are required to be independent with respect to the Fund in accordance with the U.S. federal securities laws and the applicable rules and regulations of the Securities and Exchange Commission and the PCAOB.
We conducted our audit in accordance with the standards of the PCAOB. Those standards require that we plan and perform the audit to obtain reasonable assurance about whether the financial statements and financial highlights are free of material misstatement, whether due to error or fraud. The Fund is not required to have, nor were we engaged to perform, an audit of its internal control over financial reporting. As part of our audit we are required to obtain an understanding of internal control over financial reporting but not for the purpose of expressing an opinion on the effectiveness of the Fund’s internal control over financial reporting. Accordingly, we express no such opinion.
Our audit included performing procedures to assess the risks of material misstatement of the financial statements and financial highlights, whether due to error or fraud, and performing procedures that respond to those risks. Such procedures included examining, on a test basis, evidence regarding the amounts and disclosures in the financial statements and financial highlights. Our audit also included evaluating the accounting principles used and significant estimates made by management, as well as evaluating the overall presentation of the financial statements and financial highlights. Our procedures included confirmation of securities owned as of November 30, 2021, by correspondence with the custodian and brokers; when replies were not received from brokers, we performed other auditing procedures. We believe that our audit provides a reasonable basis for our opinion.
DELOITTE & TOUCHE LLP
Denver, Colorado
January 26, 2022
We have served as the auditor of one or more investment companies advised by ALPS Advisors, Inc. since 2007.
5 | November 30, 2021
ALPS Equal Sector Weight ETF
| Schedule of Investments | November 30, 2021 |
| Security Description | | Shares | | | Value | |
| EXCHANGE TRADED FUNDS (99.99%) | | | | | | | | |
| Communication Services (8.07%) | | | | | | | | |
| Communication Services Select Sector SPDR Fund | | | 222,722 | | | $ | 16,786,557 | |
| | | | | | | | | |
| Consumer Discretionary (9.89%) | | | | | | | | |
| Consumer Discretionary Select Sector SPDR Fund(a) | | | 100,573 | | | | 20,561,144 | |
| | | | | | | | | |
| Consumer Staples (8.77%) | | | | | | | | |
| Consumer Staples Select Sector SPDR Fund | | | 259,491 | | | | 18,239,622 | |
| | | | | | | | | |
| Energy (9.86%) | | | | | | | | |
| Energy Select Sector SPDR Fund | | | 375,458 | | | | 20,496,252 | |
| | | | | | | | | |
| Financials (9.00%) | | | | | | | | |
| Financial Select Sector SPDR Fund | | | 492,747 | | | | 18,704,676 | |
| | | | | | | | | |
| Healthcare (8.69%) | | | | | | | | |
| Health Care Select Sector SPDR Fund | | | 139,224 | | | | 18,061,530 | |
| | | | | | | | | |
| Industrials (8.95%) | | | | | | | | |
| Industrial Select Sector SPDR Fund(a) | | | 184,560 | | | | 18,598,111 | |
| | | | | | | | | |
| Materials (9.27%) | | | | | | | | |
| Materials Select Sector SPDR Fund | | | 227,676 | | | | 19,272,774 | |
| | | | | | | | | |
| Real Estate (9.01%) | | | | | | | | |
| Real Estate Select Sector SPDR Fund(a) | | | 395,249 | | | | 18,730,850 | |
| | | | | | | | | |
| Technology (9.66%) | | | | | | | | |
| Technology Select Sector SPDR Fund | | | 119,096 | | | | 20,093,877 | |
| | | | | | | | | |
| Utilities (8.82%) | | | | | | | | |
| Utilities Select Sector SPDR Fund(a) | | | 278,872 | | | | 18,341,412 | |
| | | | | | | | | |
| TOTAL EXCHANGE TRADED FUNDS | | | | | | | | |
| (Cost $135,913,815) | | | | | | | 207,886,805 | |
| | | 7 Day Yield | | | Shares | | | Value | |
| SHORT TERM INVESTMENTS (11.21%) | | | | |
| Money Market Fund (0.02%) | | | | | | | | | |
| State Street Institutional | | | | | | | | | | | | |
| Treasury Plus Money | | | | | | | | | | | | |
| Market Fund | | | | | | | | | | | | |
| (Cost $32,849) | | | 0.01 | % | | | 32,849 | | | $ | 32,849 | |
| | | | | | | | | | | | | |
| Investments Purchased with Collateral from Securities Loaned (11.19%) | | | | | | | | | | | | |
| State Street Navigator | | | | | | | | | | | | |
| Securities Lending | | | | | | | | | | | | |
| Government Money | | | | | | | | | | | | |
| Market Portfolio, 0.03% | | | | | | | | | | | | |
| (Cost $23,271,365) | | | | | | | 23,271,365 | | | | 23,271,365 | |
| TOTAL SHORT TERM INVESTMENTS | | | | | | | | | | | | |
| (Cost $23,304,214) | | | | | | | | | | | 23,304,214 | |
| | | | | | | | | | | | | |
| TOTAL INVESTMENTS (111.20%) | | | | | | | | | | | | |
| (Cost $159,218,029) | | | | | | | | | | $ | 231,191,019 | |
| LIABILITIES IN EXCESS OF OTHER ASSETS (-11.20%) | | | | | | | | | | | (23,294,595 | ) |
| NET ASSETS - 100.00% | | | | | | | | | | $ | 207,896,424 | |
| (a) | Security, or a portion of the security position is currently on loan. The total market value of securities on loan is $39,848,327. |
Common Abbreviations:
SPDR® - Standard & Poor's Depositary Receipts
See Notes to Financial Statements.
6 | November 30, 2021
ALPS Equal Sector Weight ETF
| Statement of Assets and Liabilities | November 30, 2021 |
| ASSETS: | | | |
| Investments, at value | | $ | 231,191,019 | |
| Dividends receivable | | | 3,230 | |
| Total Assets | | | 231,194,249 | |
| | | | | |
| LIABILITIES: | | | | |
| Payable to adviser | | | 26,460 | |
| Payable for collateral upon return of securities loaned | | | 23,271,365 | |
| Total Liabilities | | | 23,297,825 | |
| NET ASSETS | | $ | 207,896,424 | |
| | | | | |
| NET ASSETS CONSIST OF: | | | | |
| Paid-in capital | | $ | 139,494,455 | |
| Total distributable earnings | | | 68,401,969 | |
| NET ASSETS | | $ | 207,896,424 | |
| | | | | |
| INVESTMENTS, AT COST | | $ | 159,218,029 | |
| | | | | |
| PRICING OF SHARES | | | | |
| Net Assets | | $ | 207,896,424 | |
| Shares of beneficial interest outstanding (Unlimited number of shares authorized, par value $0.01 per share) | | | 2,000,000 | |
| Net Asset Value, offering and redemption price per share | | $ | 103.95 | |
See Notes to Financial Statements.
7 | November 30, 2021
ALPS Equal Sector Weight ETF
| Statement of Operations | For the Year Ended November 30, 2021 |
| INVESTMENT INCOME: | | | |
| Dividends | | $ | 3,810,884 | |
| Securities Lending Income | | | 52,671 | |
| Total Investment Income | | | 3,863,555 | |
| | | | | |
| EXPENSES: | | | | |
| Investment adviser fees | | | 728,900 | |
| Total Expenses before waiver/reimbursement | | | 728,900 | |
| Less fee waiver/reimbursement by investment adviser | | | (433,400 | ) |
| Net Expenses | | | 295,500 | |
| NET INVESTMENT INCOME | | | 3,568,055 | |
| | | | | |
| REALIZED AND UNREALIZED GAIN: | | | | |
| Net realized gain on investments(a) | | | 7,438,861 | |
| Net change in unrealized appreciation/depreciation on investments | | | 32,612,619 | |
| NET REALIZED AND UNREALIZED GAIN ON INVESTMENTS | | | 40,051,480 | |
| NET INCREASE IN NET ASSETS RESULTING FROM OPERATIONS | | $ | 43,619,535 | |
| (a) | Includes realized gain or loss as a result of in-kind transactions (See Note 4 in Notes to Financial Statements). |
See Notes to Financial Statements.
8 | November 30, 2021
ALPS Equal Sector Weight ETF
Statements of Changes in Net Assets
| | | For the Year Ended November 30, 2021 | | | For the Year Ended November 30, 2020 | |
| OPERATIONS: | | | | | | |
| Net investment income | | $ | 3,568,055 | | | $ | 3,855,342 | |
| Net realized gain | | | 7,438,861 | | | | 17,484,465 | |
| Net change in unrealized appreciation/depreciation | | | 32,612,619 | | | | (6,901,203 | ) |
| Net increase in net assets resulting from operations | | | 43,619,535 | | | | 14,438,604 | |
| | | | | | | | | |
| DISTRIBUTIONS TO SHAREHOLDERS: | | | | | | | | |
| From distributable earnings | | | (3,568,055 | ) | | | (3,851,925 | ) |
| From tax return of capital | | | (37,609 | ) | | | (17,569 | ) |
| Total distributions | | | (3,605,664 | ) | | | (3,869,494 | ) |
| | | | | | | | | |
| CAPITAL SHARE TRANSACTIONS: | | | | | | | | |
| Proceeds from sale of shares | | | 27,797,544 | | | | 36,501,060 | |
| Cost of shares redeemed | | | (24,055,755 | ) | | | (51,336,731 | ) |
| Net increase/(decrease) from capital share transactions | | | 3,741,789 | | | | (14,835,671 | ) |
| Net increase/(decrease) in net assets | | | 43,755,660 | | | | (4,266,561 | ) |
| | | | | | | | | |
| NET ASSETS: | | | | | | | | |
| Beginning of year | | | 164,140,764 | | | | 168,407,325 | |
| End of year | | $ | 207,896,424 | | | $ | 164,140,764 | |
| | | | | | | | | |
| OTHER INFORMATION: | | | | | | | | |
| CAPITAL SHARE TRANSACTIONS: | | | | | | | | |
| Beginning shares | | | 1,950,000 | | | | 2,150,000 | |
| Shares sold | | | 300,000 | | | | 500,000 | |
| Shares redeemed | | | (250,000 | ) | | | (700,000 | ) |
| Shares outstanding, end of period | | | 2,000,000 | | | | 1,950,000 | |
See Notes to Financial Statements.
9 | November 30, 2021
ALPS Equal Sector Weight ETF
| Financial Highlights | For a Share Outstanding Throughout the Years Presented |
| | | For the Year Ended November 30, 2021 | | | For the Year Ended November 30, 2020 | | | For the Year Ended November 30, 2019 | | | For the Year Ended November 30, 2018 | | | For the Year Ended November 30, 2017 | |
| NET ASSET VALUE, BEGINNING OF PERIOD | | $ | 84.17 | | | $ | 78.33 | | | $ | 70.34 | | | $ | 69.28 | | | $ | 59.74 | |
| | | | | | | | | | | | | | | | | | | | | |
| INCOME FROM OPERATIONS: | | | | | | | | | | | | | | | | | | | | |
| Net investment income(a) | | | 1.76 | | | | 1.91 | | | | 1.53 | | | | 1.50 | | | | 1.37 | |
| Net realized and unrealized gain | | | 19.82 | | | | 5.84 | | | | 8.03 | | | | 1.02 | | | | 10.03 | |
| Total from investment operations | | | 21.58 | | | | 7.75 | | | | 9.56 | | | | 2.52 | | | | 11.40 | |
| | | | | | | | | | | | | | | | | | | | | |
| DISTRIBUTIONS: | | | | | | | | | | | | | | | | | | | | |
| From net investment income | | | (1.78 | ) | | | (1.90 | ) | | | (1.57 | ) | | | (1.46 | ) | | | (1.86 | ) |
| From tax return of capital | | | (0.02 | ) | | | (0.01 | ) | | | – | | | | – | | | | – | |
| Total distributions | | | (1.80 | ) | | | (1.91 | ) | | | (1.57 | ) | | | (1.46 | ) | | | (1.86 | ) |
| | | | | | | | | | | | | | | | | | | | | |
| NET INCREASE IN NET ASSET VALUE | | | 19.78 | | | | 5.84 | | | | 7.99 | | | | 1.06 | | | | 9.54 | |
| NET ASSET VALUE, END OF PERIOD | | $ | 103.95 | | | $ | 84.17 | | | $ | 78.33 | | | $ | 70.34 | | | $ | 69.28 | |
| TOTAL RETURN(b) | | | 25.89 | % | | | 10.37 | % | | | 13.86 | % | | | 3.66 | % | | | 19.46 | % |
| | | | | | | | | | | | | | | | | | | | | |
| RATIOS/SUPPLEMENTAL DATA: | | | | | | | | | | | | | | | | | | | | |
| Net assets, end of period (in 000s) | | $ | 207,896 | | | $ | 164,141 | | | $ | 168,407 | | | $ | 154,742 | | | $ | 166,284 | |
| | | | | | | | | | | | | | | | | | | | | |
| RATIOS TO AVERAGE NET ASSETS | | | | | | | | | | | | | | | | | | | | |
| Ratio of expenses excluding waiver/reimbursement to average net assets | | | 0.37 | % | | | 0.37 | % | | | 0.37 | % | | | 0.37 | % | | | 0.37 | % |
| Ratio of expenses including waiver/reimbursement to average net assets | | | 0.15 | % | | | 0.15 | % | | | 0.15 | % | | | 0.15 | % | | | 0.15 | % |
| Ratio of net investment income excluding waiver/reimbursement to average net assets | | | 1.59 | % | | | 2.31 | % | | | 1.89 | % | | | 1.92 | % | | | 1.92 | % |
| Ratio of net investment income including waiver/reimbursement to average net assets | | | 1.81 | % | | | 2.53 | % | | | 2.11 | % | | | 2.14 | % | | | 2.14 | % |
| Portfolio turnover rate(c) | | | 8 | % | | | 11 | % | | | 4 | % | | | 14 | % | | | 5 | % |
| (a) | Based on average shares outstanding during the period. |
| (b) | Total return is calculated assuming an initial investment made at the net asset value at the beginning of the period and redemption at the net asset value on the last day of the period and assuming all distributions are reinvested at the reinvestment prices. Total return calculated for a period of less than one year is not annualized. |
| (c) | Portfolio turnover for periods less than one year are not annualized and does not include securities received or delivered from processing creations or redemptions in-kind. |
See Notes to Financial Statements.
10 | November 30, 2021
ALPS Equal Sector Weight ETF
| Notes to Financial Statements | November 30, 2021 |
1. ORGANIZATION
ALPS ETF Trust (the “Trust”), a Delaware statutory trust, is an open-end management investment company registered under the Investment Company Act of 1940, as amended (the “1940 Act”). As of November 30, 2021, the Trust consists of eighteen separate portfolios. Each portfolio represents a separate series of the Trust. This report pertains solely to the ALPS Equal Sector Weight ETF (the “Fund”). The investment objective of the Fund is to seek investment results that replicate as closely as possible, before fees and expenses, the performance of the NYSE® Equal Sector Weight Index (the “Underlying Index”). The Fund is considered non-diversified and may invest a greater portion of assets in securities of individual issuers than a diversified fund. As a result, changes in the market value of a single investment could cause greater fluctuations in share price than would occur in a diversified fund.
The Fund’s Shares (“Shares”) are listed on the NYSE Arca, Inc. The Fund issues and redeems Shares at net asset value (“NAV”) in blocks of 25,000 Shares each of which is called a “Creation Unit”. Creation Units are issued and redeemed principally in-kind for securities included in the Underlying Index. Except when aggregated in Creation Units, Shares are not redeemable securities of the Fund. On October 1, 2021, the Fund reduced its Creation Unit size from 50,000 to 25,000 shares.
Pursuant to the Trust’s organizational documents, its Officers and Trustees are indemnified against certain liability arising out of the performance of their duties to the Trust. Additionally, in the normal course of business, the Trust enters into contracts with service providers that contain general indemnification clauses. The Trust’s maximum exposure under these arrangements is unknown, as this would involve future claims that may be made against the Trust that have not yet occurred.
2. SIGNIFICANT ACCOUNTING POLICIES
The following is a summary of significant accounting policies consistently followed by the Fund in the preparation of the financial statements. The accompanying financial statements were prepared in accordance with accounting principles generally accepted in the United States of America (“U.S. GAAP”). The preparation of financial statements in conformity with U.S. GAAP requires management to make certain estimates and assumptions that affect the reported amounts of assets and liabilities and disclosures of contingent assets and liabilities at the date of the financial statements and the reported amounts of revenue and expenses during the period. Actual results could differ from those estimates. The Fund is considered an investment company under U.S. GAAP and follows the accounting and reporting guidance applicable to investment companies in the Financial Accounting Standards Board (“FASB”) Accounting Standards Codification Topic 946.
A. Portfolio Valuation
The Fund’s NAV is determined daily, as of the close of regular trading on the New York Stock Exchange (the “NYSE”), normally 4:00 p.m. Eastern Time, on each day the NYSE is open for trading. The NAV is computed by dividing the value of all assets of the Fund (including accrued interest and dividends), less all liabilities (including accrued expenses and dividends declared but unpaid), by the total number of shares outstanding.
Portfolio securities listed on any exchange other than the NASDAQ Stock Market LLC (“NASDAQ”) are valued at the last sale price on the business day as of which such value is being determined. If there has been no sale on such day, the securities are valued at the mean of the most recent bid and ask prices on such day. Securities traded on the NASDAQ are valued at the NASDAQ Official Closing Price as determined by NASDAQ. Portfolio securities traded on more than one securities exchange are valued at the last sale price on the business day as of which such value is being determined at the close of the exchange representing the principal market for such securities. Portfolio securities traded in the over-the-counter market, but excluding securities traded on the NASDAQ, are valued at the last quoted sale price in such market.
The Fund’s investments are valued at market value or, in the absence of market value with respect to any portfolio securities, at fair value according to procedures adopted by the Trust’s Board of Trustees (the “Board”). When market quotations are not readily available or when events occur that make established valuation methods unreliable, securities of the Fund may be valued in good faith by or under the direction of the Board. These securities generally include, but are not limited to, restricted securities (securities which may not be publicly sold without registration under the Securities Act of 1933) for which a pricing service is unable to provide a market price; securities whose trading has been formally suspended; a security whose market price is not available from a pre-established primary pricing source or the pricing source is not willing to provide a price; a security with respect to which an event has occurred that is most likely to materially affect the value of the security after the market has closed but before the calculation of the Fund’s NAV or make it difficult or impossible to obtain a reliable market quotation; or a security whose price, as provided by the pricing service, does not reflect the security’s “fair value” due to the security being de-listed from a national exchange or the security’s primary trading market is temporarily closed at a time when, under normal conditions, it would be open. As a general principle, the current “fair value” of a security would be the amount which the owner might reasonably expect to receive from the sale on the applicable exchange or principal market. A variety of factors may be considered in determining the fair value of such securities.
11 | November 30, 2021
ALPS Equal Sector Weight ETF
| Notes to Financial Statements | November 30, 2021 |
B. Fair Value Measurements
The Fund discloses the classification of its fair value measurements following a three-tier hierarchy based on the inputs used to measure fair value. Inputs refer broadly to the assumptions that market participants would use in pricing the asset or liability, including assumptions about risk. Inputs may be observable or unobservable. Observable inputs reflect the assumptions market participants would use in pricing the asset or liability that are developed based on market data obtained from sources independent of the reporting entity. Unobservable inputs reflect the reporting entity’s own assumptions about the assumptions market participants would use in pricing the asset or liability that are developed based on the best information available.
Valuation techniques used to value the Fund’s investments by major category are as follows:
Exchange Traded Funds, for which market quotations are readily available, are valued at the last reported sale price or official closing price as reported by a third party pricing vendor on the primary market or exchange on which they are traded and are categorized as Level 1 in the hierarchy. In the event there were no sales during the day or closing prices are not available, securities are valued at the mean of the most recent quoted bid and ask prices on such day and are generally categorized as Level 2 in the hierarchy. Investments in open-end mutual funds are valued at their closing NAV each business day and are categorized as Level 1 in the hierarchy.
Changes in valuation techniques may result in transfers in or out of an assigned level within the disclosure hierarchy.
Various inputs are used in determining the value of the Fund’s investments as of the end of the reporting period. When inputs used fall into different levels of the fair value hierarchy, the level in the hierarchy within which the fair value measurement falls is determined based on the lowest level input that is significant to the fair value measurement in its entirety. The designated input levels are not necessarily an indication of the risk or liquidity associated with these investments.
These inputs are categorized in the following hierarchy under applicable financial accounting standards:
| Level 1 – | Unadjusted quoted prices in active markets for identical investments, unrestricted assets or liabilities that the Fund has the ability to access at the measurement date; |
| Level 2 – | Quoted prices which are not active, quoted prices for similar assets or liabilities in active markets or inputs other than quoted prices that are observable (either directly or indirectly) for substantially the full term of the asset or liability; and |
| Level 3 – | Significant unobservable prices or inputs (including the Fund’s own assumptions in determining the fair value of investments) where there is little or no market activity for the asset or liability at the measurement date. |
The following is a summary of inputs used to value the Fund’s investments as of November 30, 2021:
ALPS Equal Sector Weight ETF
| Investments in Securities at Value | | Level 1 - Quoted and Unadjusted Prices | | | Level 2 - Other Significant Observable Inputs | | | Level 3 - Significant Unobservable Inputs | | | Total | |
| Exchange Traded Funds* | | $ | 207,886,805 | | | $ | – | | | $ | – | | | $ | 207,886,805 | |
| Short Term Investments | | | 23,304,214 | | | | – | | | | – | | | | 23,304,214 | |
| Total | | $ | 231,191,019 | | | $ | – | | | $ | – | | | $ | 231,191,019 | |
| * | For a detailed breakdown of sectors, see the accompanying Schedule of Investments. |
The Fund did not have any securities that used significant unobservable inputs (Level 3) in determining fair value and there were no transfers into or out of Level 3 during the year ended November 30, 2021.
C. Securities Transactions and Investment Income
Securities transactions are recorded as of the trade date. Realized gains and losses from securities transactions are recorded on the specific identification in accordance with GAAP. Dividend income and capital gains distributions, if any, are recorded on the ex-dividend date. Interest income, if any, is recorded on the accrual basis.
D. Dividends and Distributions to Shareholders
Dividends from net investment income of the Fund, if any, are declared and paid quarterly or as the Board may determine from time to time. Distributions of net realized capital gains earned by the Fund, if any, are distributed at least annually.
12 | November 30, 2021
ALPS Equal Sector Weight ETF
| Notes to Financial Statements | November 30, 2021 |
E. Federal Tax and Tax Basis Information
The timing and character of income and capital gain distributions are determined in accordance with income tax regulations, which may differ from U.S. GAAP. Reclassifications are made to the Fund’s capital accounts for permanent tax differences to reflect income and gains available for distribution (or available capital loss carryforwards) under income tax regulations.
For the year ended November 30, 2021, the following reclassifications, which had no impact on results of operations or net assets, were recorded to reflect permanent tax differences resulting primarily from in-kind transactions:
| Fund | | Paid-in Capital | | | Accumulated Net Investment Loss | | | Accumulated Net Realized Gain/(Loss) on Investments | |
| ALPS Equal Sector Weight ETF | | $ | 9,035,078 | | | $ | – | | | $ | (9,035,078 | ) |
The tax character of the distributions paid during the fiscal years ended November 30, 2021 and November 30, 2020 was as follows:
| | | Ordinary Income | | | Long-Term Capital Gain | | | Return of Capital | |
| November 30, 2021 | | | | | | | | | |
| ALPS Equal Sector Weight ETF | | $ | 3,568,055 | | | $ | – | | | $ | 37,609 | |
| | | Ordinary Income | | | Long-Term Capital Gain | | | Return of Capital | |
| November 30, 2020 | | | | | | | | | |
| ALPS Equal Sector Weight ETF | | $ | 3,851,925 | | | $ | – | | | $ | 17,569 | |
The character of distributions made during the year may differ from its ultimate characterization for federal income tax purposes.
Under current law, capital losses maintain their character as short-term or long-term and are carried forward to the next tax year without expiration. As of November 30, 2021, the following amounts are available as carry forwards to the next tax year:
| Fund | | Short-Term | | | Long-Term | |
| ALPS Equal Sector Weight ETF | | $ | – | | | $ | 3,424,546 | |
As of November 30, 2021, the components of distributable earnings on a tax basis for each Fund were as follows:
| | | ALPS Equal Sector Weight ETF | |
| Accumulated net realized loss on investments | | | (3,424,546 | ) |
| Net unrealized appreciation on investments | | | 71,826,515 | |
| Total | | $ | 68,401,969 | |
As of November 30, 2021, the cost of investments for federal income tax purposes and accumulated net unrealized appreciation/(depreciation) on investments were as follows:
| | | ALPS Equal Sector Weight ETF | |
| Gross appreciation (excess of value over tax cost) | | $ | 73,395,168 | |
| Gross depreciation (excess of tax cost over value) | | | (1,568,653 | ) |
| Net unrealized appreciation (depreciation) | | $ | 71,826,515 | |
| Cost of investments for income tax purposes | | $ | 159,364,504 | |
The differences between book-basis and tax-basis are primarily due to the deferral of losses from wash sales.
13 | November 30, 2021
ALPS Equal Sector Weight ETF
| Notes to Financial Statements | November 30, 2021 |
F. Income Taxes
No provision for income taxes is included in the accompanying financial statements, as the Fund intends to distribute to shareholders all taxable investment income and realized gains and otherwise comply with Subchapter M of the Internal Revenue Code of 1986, as amended, applicable to regulated investment companies. The Fund evaluates tax positions taken (or expected to be taken) in the course of preparing the Fund’s tax returns to determine whether these positions meet a “more-likely-than-not” standard that, based on the technical merits, have a more than fifty percent likelihood of being sustained by a taxing authority upon examination. A tax position that meets the “more-likely-than-not” recognition threshold is measured to determine the amount of benefit to recognize in the financial statements.
As of and during the year ended November 30, 2021, the Fund did not have a liability for any unrecognized tax benefits. The Fund files U.S. federal, state, and local tax returns as required. The Fund’s tax returns are subject to examination by the relevant tax authorities until expiration of the applicable statute of limitations, which is generally three years after the filing of the tax return, but may extend to four years in certain jurisdictions. Tax returns for open years have incorporated no uncertain tax positions that require a provision for income taxes.
G. Lending of Portfolio Securities
The Fund has entered into a securities lending agreement with State Street Bank & Trust Co. (“SSB”), the Fund’s lending agent. The Fund may lend its portfolio securities only to borrowers that are approved by SSB. The Fund will limit such lending to not more than 33 1/3% of the value of its total assets. The Fund’s securities held at SSB as custodian shall be available to be lent except those securities the Fund or ALPS Advisors, Inc. specifically identifies in writing as not being available for lending. The borrower pledges and maintains with the Fund collateral consisting of cash (U.S. Dollars only), securities issued or guaranteed by the U.S. government or its agencies or instrumentalities, and cash equivalents (including irrevocable bank letters of credit) issued by a person other than the borrower or an affiliate of the borrower. The initial collateral received by the Fund is required to have a value of no less than 102% of the market value of the loaned securities for U.S equity securities and a value of no less than 105% of the market value for non-U.S. equity securities. The collateral is maintained thereafter, at a market value equal to not less than 102% of the current value of the U.S. equity securities on loan and not less than 105% of the current value of the non-U.S. equity securities on loan. The market value of the loaned securities is determined at the close of each business day and any additional required collateral is delivered to the Fund on the next business day. During the term of the loan, the Fund is entitled to all distributions made on or in respect of the loaned securities. Loans of securities are terminable at any time and the borrower, after notice, is required to return borrowed securities within the customary time period for settlement of securities transactions.
Any cash collateral received is reinvested in a money market fund managed by SSB as disclosed in the Fund’s Schedule of Investments and is reflected in the Statements of Assets and Liabilities as a payable for collateral upon return of securities loaned. Non-cash collateral, in the form of securities issued or guaranteed by the U.S. government or its agencies or instrumentalities, is not disclosed in the Fund’s Statements of Assets and Liabilities as it is held by the lending agent on behalf of the Fund, and the Fund does not have the ability to re-hypothecate these securities. Income earned by the Fund from securities lending activity is disclosed in the Statement of Operations.
The following is a summary of the Fund's securities lending agreement and related cash and non-cash collateral received as of November 30, 2021:
| | | Market Value of Securities on Loan | | | Cash Collateral Received | | | Non-Cash Collateral Received | | | Total Collateral Received | |
| ALPS Equal Sector Weight ETF | | $ | 39,848,327 | | | $ | 23,271,365 | | | $ | 18,712,637 | | | $ | 41,984,002 | |
The risks of securities lending include the risk that the borrower may not provide additional collateral when required or may not return the securities when due. To mitigate these risks, the Fund benefits from a borrower default indemnity provided by SSB. SSB’s indemnity allows for full replacement of securities lent wherein SSB will purchase the unreturned loaned securities on the open market by applying the proceeds of the collateral, or to the extent such proceeds are insufficient or the collateral is unavailable, SSB will purchase the unreturned loan securities at SSB’s expense. However, the Fund could suffer a loss if the value of the investments purchased with cash collateral falls below the value of the cash collateral received.
14 | November 30, 2021
ALPS Equal Sector Weight ETF
| Notes to Financial Statements | November 30, 2021 |
The following table reflects a breakdown of transactions accounted for as secured borrowings, the gross obligation by the type of collateral pledged or securities loaned, and the remaining contractual maturity of those transactions as of November 30, 2021:
| ALPS Equal Sector Weight ETF | Remaining contractual maturity of the agreements |
| Securities Lending Transactions | | Overnight & Continuous | | | Up to 30 days | | | 30-90 days | | | Greater than 90 days | | | Total | |
| Common Stocks | | $ | 23,271,365 | | | $ | – | | | $ | – | | | $ | – | | | $ | 23,271,365 | |
| Total Borrowings | | | | | | | | | | | | | | | | | | | 23,271,365 | |
| Gross amount of recognized liabilities for securities lending (collateral received) | | | | | | | | | | | | $ | 23,271,365 | |
3. INVESTMENT ADVISORY FEE AND OTHER AFFILIATED TRANSACTIONS
ALPS Advisors, Inc. (the “Adviser”) serves as the Fund’s investment adviser pursuant to an Investment Advisory Agreement with the Trust on behalf of the Fund (the “Advisory Agreement”). Pursuant to the Advisory Agreement, the Fund pays the Adviser an annual management fee for the services and facilities it provides, payable on a monthly basis at the annual rate of 0.37% of the Fund’s average daily net assets.
The Adviser has contractually agreed to waive 0.19% of its annual unitary fee payable by the Fund until at least March 31, 2022. The waiver may only be terminated by the Fund's Board of Trustees prior to such date.
ALPS Portfolio Solutions Distributor, Inc. (“APSD”) is both the distributor for the Fund as well as the Select Sector SPDR exchange traded funds (“Underlying Sector ETFs”) that the Fund invests in. As required by exemptive relief obtained by the Underlying Sector ETFs, the Adviser will reimburse the Fund an amount equal to the distribution fee received by APSD from the Underlying Sector ETFs attributable to the Fund’s investment in the Underlying Sector ETFs, for so long as APSD acts as the distributor to the Fund and the Underlying Sector ETFs. Such reimbursement is generally expected to equal 0.03% annually.
Out of the unitary management fees, the Adviser pays substantially all expenses of the Fund, including licensing fees to the Underlying Index provider, the cost of transfer agency, custody, fund administration, legal, audit, trustees and other services, except for acquired fund fees and expenses, interest expenses, distribution fees or expenses, brokerage expenses, taxes and extraordinary expenses not incurred in the ordinary course of the Fund's business. The Adviser’s unitary management fee is designed to pay substantially all of the Fund’s expenses and to compensate the Adviser for providing services to the Fund.
ALPS Fund Services, Inc., an affiliate of the Adviser, is the administrator of the Fund.
Each Trustee receives (1) a quarterly retainer of $10,000, (2) a per meeting fee of $5,000, (3) $1,500 for any special meeting held outside of a regularly scheduled board meeting, and (4) reimbursement for all reasonable out-of-pocket expenses relating to attendance at meetings. In addition, the Chairman of the Board and Chairman of the Audit Committee each receives a quarterly retainer of $2,000, in connection with their respective roles.
4. PURCHASES AND SALES OF SECURITIES
For the year ended November 30, 2021 the cost of purchases and proceeds from sales of investment securities, excluding short-term investments and in-kind transactions, were as follows:
| Fund | Purchases | Sales |
| ALPS Equal Sector Weight ETF | $ 15,391,996 | $ 15,392,360 |
For the ended ended November 30, 2021, the cost of in-kind purchases and proceeds from in-kind sales were as follows:
| Fund | Purchases | Sales |
| ALPS Equal Sector Weight ETF | $ 23,178,199 | $ 19,436,467 |
For the year ended November 30, 2021, the ALPS Equal Sector Weight ETF had in-kind net realized gain of $8,884,051.
15 | November 30, 2021
ALPS Equal Sector Weight ETF
| Notes to Financial Statements | November 30, 2021 |
Gains on in-kind transactions are not considered taxable for federal income tax purposes and losses on in-kind transactions are also not deductible for tax purposes.
5. CAPITAL SHARE TRANSACTIONS
Shares are created and redeemed by the Fund only in Creation Unit size aggregations of 25,000 Shares. Only broker-dealers or large institutional investors with creation and redemption agreements called Authorized Participants (“AP”) are permitted to purchase or redeem Creation Units from the Fund. Such transactions are generally permitted on an in-kind basis, with a balancing cash component to equate the transaction to the NAV per unit of the Fund on the transaction date. Cash may be substituted equivalent to the value of certain securities generally when they are not available in sufficient quantity for delivery, not eligible for trading by the AP or as a result of other market circumstances.
6. MARKET DISRUPTIONS RISK
The Fund is subject to investment and operational risks associated with financial, economic and other global market developments and disruptions, including the recent spread of an infectious respiratory illness caused by a novel strain of coronavirus (known as COVID-19), which can negatively impact the securities markets and cause the Fund to lose value.
The spread of COVID-19 has caused volatility, severe market dislocations and liquidity constraints in many markets, including markets for the securities the Fund holds, and may adversely affect the Fund’s investments and operations. The transmission of COVID-19 and efforts to contain its spread have resulted in travel restrictions and disruptions, closed international borders, enhanced health screenings at ports of entry and elsewhere, disruption of and delays in healthcare service preparation and delivery, quarantines, event and service cancellations or interruptions, disruptions to business operations and supply chains, and a reduction in consumer and business spending, as well as general concern and uncertainty that has negatively affected the economy. These disruptions have led to instability in the market place and the jobs market. The impact of COVID-19 could adversely affect the economies of many nations or the entire global economy, the financial well-being and performance of individual issuers, borrowers and sectors and the health of the markets generally in potentially significant and unforeseen ways.
The foregoing could lead to a significant economic downturn or recession, increased market volatility, a greater number of market closures, higher default rates and adverse effects on the values and liquidity of the Fund’s securities or other assets. Such impacts may adversely affect the performance of the Fund.
7. SUBSEQUENT EVENTS
Subsequent events, if any, after the date of the Statements of Assets and Liabilities have been evaluated through the date the financial statements were issued. Management has determined that there were no subsequent events to report through the issuance of these financial statements.
16 | November 30, 2021
ALPS Equal Sector Weight ETF
| Additional Information | November 30, 2021 (Unaudited) |
PROXY VOTING RECORDS, POLICIES AND PROCEDURES
Information regarding how the Fund voted proxies relating to portfolio securities during the most recent 12-month period ended June 30 and a description of the Fund’s proxy voting policies and procedures used in determining how to vote for proxies are available without charge on the SEC’s website at www.sec.gov and upon request, by calling (toll-free) 1-866-759-5679.
PORTFOLIO HOLDINGS
The Fund files a complete schedule of portfolio holdings with the U.S. Securities and Exchange Commission (“SEC”) for the first and third quarters of each fiscal year on Form N-PORT within 60 days after the end of the period. Copies of the Fund’s Form N-PORT are available without a charge, upon request, by contacting the Fund at 1-866-759-5679 and on the SEC’s website at https://www.sec.gov.
TAX INFORMATION
The ALPS Equal Sector Weight ETF designates the following as a percentage of taxable ordinary income distributions, or up to the maximum amount allowable, for the calendar year ended December 31, 2020:
| | | Qualified Dividend Income | | | Dividend Received Deduction | |
| ALPS Equal Sector Weight ETF | | | 73.77 | % | | | 73.60 | % |
In early 2021, if applicable, shareholders of record received this information for the distribution paid to them by the Fund during the calendar year 2020 via Form 1099. The Fund will notify shareholders in early 2022 of amounts paid to them by the Fund, if any, during the calendar year 2021.
LICENSING AGREEMENT
ICE Data Indices, LLC (the “Index Provider”) is not affiliated with the ALPS Equal Sector Weight ETF (the “Fund”) or ALPS Advisors, Inc. (the “Adviser”). The Fund is entitled to use the Underlying Index pursuant to a licensing agreement with the Index Provider and the Adviser. The Adviser pays a licensing fee to the Index Provider out of the management fee.
The only relationship that the Index Provider has with the Fund, the Adviser or Distributor of the Fund in connection with the Fund is that the Index Provider has licensed certain of its intellectual property, including the determination of the component stocks of the Underlying Index and the name of the Underlying Index. The Underlying Index is selected and calculated without regard to the Adviser, Distributor or owners of the Fund. The Index Provider has no obligation to take the specific needs of the Adviser, Distributor or owners of the Fund into consideration in the determination and calculation of the Underlying Index. The Index Provider is not responsible for and has not participated in the determination of pricing or the timing of the issuance or sale of the Shares of the Fund or in the determination or calculation of the net asset value of the Fund. The Index Provider has no obligation or liability in connection with the administration or trading of the Fund.
NYSE® Equal Sector Weight Index is a service mark of ICE Data Indices, LLC or its affiliates (“ICE Data”) and has been licensed for use by the Adviser in connection with the Fund. Neither the Trust nor the Fund is sponsored, endorsed, sold or promoted by ICE Data. ICE Data makes no representations or warranties regarding the Adviser or the Fund or the ability of the NYSE® Equal Sector Weight Index to track general stock market performance.
ICE DATA MAKES NO EXPRESS OR IMPLIED WARRANTIES, AND HEREBY EXPRESSLY DISCLAIMS ALL WARRANTIES OF MERCHANTABILITY OR FITNESS FOR A PARTICULAR PURPOSE WITH RESPECT TO THE NYSE® EQUAL SECTOR WEIGHT INDEX OR ANY DATA INCLUDED THEREIN. IN NO EVENT SHALL ICE DATA HAVE ANY LIABILITY FOR ANY SPECIAL, PUNITIVE, INDIRECT, OR CONSEQUENTIAL DAMAGES (INCLUDING LOST PROFITS), EVEN IF NOTIFIED OF THE POSSIBILITY OF SUCH DAMAGES.
The Adviser does not guarantee the accuracy and/or the completeness of the Underlying Index or any data included therein, and the Adviser shall have no liability for any errors, omissions or interruptions therein. The Adviser makes no warranty, express or implied, as to results to be obtained by the Fund, owners of the Shares of the Fund or any other person or entity from the use of the Underlying Index or any data included therein. The Adviser makes no express or implied warranties, and expressly disclaims all warranties of merchantability or fitness for a particular purpose or use with respect to the Underlying Index or any data included therein. Without limiting any of the foregoing, in no event shall the Adviser have any liability for any special, punitive, direct, indirect or consequential damages (including lost profits) arising out of matters relating to the use of the Underlying Index even if notified of the possibility of such damages.
17 | November 30, 2021
ALPS Equal Sector Weight ETF
| Board Considerations Regarding Approval of Investment Advisory Agreements | November 30, 2021 (Unaudited) |
At a meeting held on June 7, 2021 via electronic means (video-conference), the Board of Trustees of the Trust (the “Board” or the “Trustees”), including the Trustees who are not “interested persons” of the Trust within the meaning of the Investment Company Act of 1940, as amended (the “Independent Trustees”), evaluated a proposal to approve the continuance of the Investment Advisory Agreement between the Trust and ALPS Advisors, Inc. (the “Adviser” or “AAI”) with respect to the ALPS Equal Sector Weight ETF (“EQL” or the “Fund”). The Independent Trustees also met separately to consider the Investment Advisory Agreement.
In evaluating the Investment Advisory Agreement with respect to the Fund, the Board considered various factors, including (i) the nature, extent and quality of the services provided by AAI with respect to the Fund under the Investment Advisory Agreement; (ii) the advisory fees and other expenses paid by the Fund compared to those of similar funds managed by other investment advisers; (iii) the costs of the services provided to the Fund by AAI and the profits realized by AAI and its affiliates from its relationship to the Fund; (iv) the extent to which economies of scale have been or would be realized if and as the assets of the Fund grow and whether fees reflect the economies of scale for the benefit of shareholders; and (v) any additional benefits and other considerations.
With respect to the nature, extent and quality of the services provided by AAI under the Investment Advisory Agreement, the Board considered and reviewed information concerning the services provided under the Investment Advisory Agreement, the investment parameters of the index of the Fund, financial information regarding AAI and its parent company, information describing AAI’s current organization and the background and experience of the persons responsible for the day-to-day management of the Fund.
The Board reviewed information on the performance of the Fund and its applicable benchmark. The Board also evaluated the correlation and tracking error between the underlying index and the Fund’s performance. Based on this review, the Board, including the Independent Trustees, found that the nature and extent of services provided to the Fund under the Investment Advisory Agreement was appropriate and that the quality was satisfactory.
The Board noted that the advisory fee for the Fund was a unitary fee pursuant to which AAI assumes all expenses of the Fund (including the cost of transfer agency, custody, fund administration, legal, audit and other services) other than the payments under the Investment Advisory Agreement, brokerage expenses, taxes, interest, litigation expenses and other extraordinary expenses.
With respect to advisory fee rates, the Board, including the Independent Trustees, noted the following:
The gross management fee rate the Fund is higher than the median of its FUSE expense group. The Fund’s net expense ratio, however, is lower than the median of its FUSE expense group.
Based on the foregoing, and the other information available to them, the Board, including the Independent Trustees concluded that the advisory fee rate for the Fund was reasonable under the circumstances and in light of the quality of the services provided.
The Board, including the Independent Trustees considered other benefits available to AAI because of its relationship with the Fund and concluded that the advisory fees were reasonable taking into account any such benefits.
The Board, including the Independent Trustees, also considered, with respect to the Fund, the information provided by AAI about the costs and profitability of AAI with respect to the Fund, including the asset levels and other factors that influence the profitability and financial viability of the Fund. The Board, including the Independent Trustees reviewed and noted the relatively small size of the Fund and concluded that AAI was not realizing any economies of scale. The Independent Trustees determined that AAI should continue to keep the Board informed on an ongoing basis of any significant developments (e.g., material increases in asset levels) so as to facilitate the Independent Trustees’ evaluation of whether further economies of scale have been achieved.
In voting to renew the Investment Advisory Agreement, the Board, including the Independent Trustees concluded that the terms of the Investment Advisory Agreement are reasonable and fair in light of the services to be performed, the fees paid by certain other funds, expenses to be incurred and such other matters as the members of the Board, including the Independent Trustees, considered relevant in the exercise of their reasonable business judgment. The Board, including the Independent Trustees did not identify any single factor or group of factors as all important or controlling and considered all factors together.
18 | November 30, 2021
ALPS Equal Sector Weight ETF
| Trustees & Officers | November 30, 2021 (Unaudited) |
The general supervision of the duties performed by the Adviser for the Fund under the Investment Advisory Agreement is the responsibility of the Board of Trustees. The Trust currently has four Trustees. Three Trustees have no affiliation or business connection with the Adviser or any of its affiliated persons and do not own any stock or other securities issued by the Adviser. These are the “non-interested” or “independent” Trustees (“Independent Trustees”). The other Trustee (the “Interested Trustee”) is affiliated with the Adviser.
The Independent Trustees of the Trust, their term of office and length of time served, their principal business occupations during the past five years, the number of portfolios in the Fund Complex overseen by each Independent Trustee, and other directorships, if any, held by the Trustee are shown below.
INDEPENDENT TRUSTEES
| Name, Address & Year of Birth* | Position(s) Held with Trust | Term of Office and Length of Time Served** | Principal Occupation(s) During Past 5 Years | Number of Portfolios in Fund Complex Overseen by Trustees*** | Other Directorships Held by Trustees |
| Mary K. Anstine, 1940 | Trustee | Since March 2008 | Ms. Anstine is Trustee/Director of AV Hunter Trust and Colorado Uplift Board. | 36 | Ms. Anstine is a Trustee of ALPS Variable Investment Trust (7 funds); Financial Investors Trust (32 funds); Reaves Utility Income Fund; and Segall Bryant & Hamill Trust (14 funds). |
| Jeremy W. Deems, 1976 | Trustee | Since March 2008 | Mr. Deems is the Co-Founder and Chief Financial Officer of Green Alpha Advisors, LLC, a registered investment advisor, and Co-Portfolio Manager of the Shelton Green Alpha Fund. | 36 | Mr. Deems is a Trustee of ALPS Variable Investment Trust (7 funds); Financial Investors Trust (32 funds); and Reaves Utility Income Fund; and Clough Funds Trust (1 fund). |
| Rick A. Pederson, 1952 | Trustee | Since March 2008 | Mr. Pederson is Partner, Bow River Capital Partners (private equity management), 2003 - present; Board Member, Prosci Inc. (private business services) 2013-2016; Advisory Board Member, Citywide Banks (Colorado community bank) 2014-2017; Board Member, Strong-Bridge Consulting, 2015-2019; Board Member, IRI/ODMS Holdings LLC, 2017-2019; Director, National Western Stock Show (not for profit) 2010 - present; Director, History Colorado (not for profit) 2015-present; Director, Citywide Bank Advisory Board 2017-present; Trustee, Boettcher Foundation, 2018 -present. | 19 | Mr. Pederson is Trustee of Segall Bryant & Hamill Trust (14 funds) and Principal Real Estate Income Fund (1 fund). |
| * | The business address of the Trustee is c/o ALPS Advisors, Inc., 1290 Broadway, Suite 1000, Denver, Colorado 80203. |
| ** | This is the period for which the Trustee began serving the Trust. Each Trustee serves an indefinite term, until his successor is elected. |
| *** | The Fund Complex includes all series of the Trust and any other investment companies for which ALPS Advisors, Inc. provides investment advisory services. |
19 | November 30, 2021
ALPS Equal Sector Weight ETF
| Trustees & Officers | November 30, 2021 (Unaudited) |
The Trustee who is an “interested person” of the Trust, his term of office and length of time served, his principal business occupations during the past five years, the number of portfolios in the Fund Complex overseen by the Interested Trustee and the other directorships, if any, held by the Trustee, are shown below.
INTERESTED TRUSTEE
| Name, Address and Year of Birth of Interested Trustee* | Position(s) Held with Trust | Term of Office and Length of Time Served** | Principal Occupation(s) During Past 5 Years | Number of Portfolios in Fund Complex Overseen by Trustees*** | Other Directorships Held by Trustees |
| Edmund J. Burke, 1961 | Trustee | Since December 2017. | Mr. Burke joined ALPS in 1991 and served as the President and Director of ALPS Holdings, Inc., and ALPS Advisors, Inc. (“AAI”), and Director of ALPS Distributors, Inc. (“ADI”), ALPS Fund Services, Inc. (“AFS”), and ALPS Portfolio Solutions Distributor, Inc. (“APSD”). Mr. Burke retired from ALPS in June 2019. | 31 | Mr. Burke is a Trustee of Clough Global Dividend and Income Fund (1 fund); Clough Global Equity Fund (1 fund); Clough Global Opportunities Fund (1 fund); Clough Funds Trust (1 fund); Liberty All-Star Equity Fund (1 fund); Director of the Liberty All-Star Growth Fund, Inc. (1 fund) and Financial Investors Trust (32 funds). |
| * | The business address of the Trustee is c/o ALPS Advisors, Inc., 1290 Broadway, Suite 1000, Denver, Colorado 80203. Effective December 1, 2021, Mr. Burke is an Independent Trustee of the Trust. |
| ** | This is the period for which the Trustee began serving the Trust. Each Trustee serves an indefinite term, until his successor is elected. |
| *** | The Fund Complex includes all series of the Trust and any other investment companies for which ALPS Advisors, Inc. provides investment advisory services. |
20 | November 30, 2021
ALPS Equal Sector Weight ETF
| Trustees & Officers | November 30, 2021 (Unaudited) |
OFFICERS
| Name, Address and Year of Birth of Officer* | Position(s) Held with Trust | Length of Time Served** | Principal Occupation(s) During Past 5 Years |
| Laton Spahr, 1975 | President | Since June 2021 | Mr. Spahr joined ALPS in 2019 and currently serves as President and Portfolio Manager of AAI. Prior to his current role, Mr. Spahr was a Senior Vice President and Strategy Leader of the Value & Income Team for Oppenheimer Funds from 2013 to 2019. |
| Matthew Sutula, 1985 | Chief Compliance Officer (“CCO”) | Since December 2019 | Mr. Sutula joined ALPS in 2012 and currently serves as Chief Compliance Officer of AAI. Prior to his current role, Mr. Sutula served as interim Compliance Officer of the Trust (September 2019 to December 2019). Compliance Manager and Senior Compliance Analyst for AAI, as well as Compliance Analyst for AFS. Prior to joining ALPS, he spent seven years at Morningstar, Inc. in various analyst roles supporting the registered investment company databases. Mr. Sutula is also Chief Compliance Officer of Principal Real Estate Income Fund, ALPS Variable Investment Trust, RiverNorth Opportunities Fund, Inc., Liberty All-Star Equity Fund and Liberty All-Star Growth Fund, Inc. |
| Kathryn Burns, 1976 | Treasurer | Since September 2018 | Ms. Burns serves as Vice President, Director of Fund Operations of AAI since 2018. From 2013 to 2018, she served as Vice President and Fund Controller at AFS. Prior to joining ALPS, she worked at Old Mutual Capital where she served as Vice President and Chief Compliance Officer (2010 – 2012) and Regulatory Reporting Manager and Assistant Treasurer to the Old Mutual Funds Trusts (2006 – 2012). She also served as a CPA for PricewaterhouseCoopers LLP. Ms. Burns also serves as President of ALPS Variable Investment Trust, Principal Real Estate Income Fund and RiverNorth Opportunities Fund, Inc. From June 2018 to November 2021 she also served as Treasurer of Boulder Growth & Income Fund, Inc. |
| Brendan Hamill, 1986 | Secretary | Since September 2021 | Mr. Hamill joined ALPS in August 2021, and is currently Vice President and Principal Legal Counsel. Prior to joining ALPS, Mr. Hamill was an attorney at Lewis Brisbois Bisgaard & Smith, LLP (law firm) (December 2018-August 2021) and Vedder Price, P.C. (law firm) (August 2015-December 2018). Mr. Hamill also serves as Secretary of Financial Investors Trust, Secretary of ALPS Variable Investment Trust, Secretary of Principal Real Estate Income Fund, and Assistant Secretary of James Advantage Funds. |
| * | The business address of each Officer is c/o ALPS Advisors, Inc., 1290 Broadway, Suite 1000, Denver, Colorado 80203. Each Officer is deemed an affiliate of the Trust as defined under the 1940 Act. |
| ** | This is the period for which the Officer began serving the Trust. Each Officer serves an indefinite term, until his/her successor is elected. |
The Statement of Additional Information includes additional information about the Fund’s Trustees and is available, without charge, upon request by calling (toll-free) 1-866-759-5679.
21 | November 30, 2021

Table of Contents
| Performance Overview | 1 |
| Disclosure of Fund Expenses | 4 |
| Report of Independent Registered Public Accounting Firm | 5 |
| Financial Statements | |
| Schedule of Investments | 6 |
| Statement of Assets and Liabilities | 7 |
| Statement of Operations | 8 |
| Statements of Changes in Net Assets | 9 |
| Financial Highlights | 10 |
| Notes to Financial Statements | 11 |
| Additional Information | 16 |
| Board Considerations Regarding Approval of Investment Advisory Agreements | 17 |
| Trustees & Officers | 19 |
alpsfunds.com
ALPS Hillman Active Value ETF
| Performance Overview | November 30, 2021 (Unaudited) |
Investment Objective
The ALPS Hillman Active Value ETF (the "Fund") seeks long-term total return from a combination of income and capital gains. The Fund seeks to achieve its investment objective by investing in U.S. companies that Hillman Capital Management, Inc., the Fund's sub-adviser believes have competitive advantages and have temporarily fallen out of favor for reasons that are considered non-recurring or short-term; whose value is not currently well known; or whose value is not fully recognized by the public.
Performance Overview
For the period from July 15, 2021 (the Fund’s inception date) through November 30, 2021, the ALPS Hillman Active Value ETF returned, at NAV, -3.63% versus a return of 0.58% for the Russell 1000 Value Total Return Index. While the sub-adviser does not believe that reviewing performance over a 138 day period is meaningful, Hillman Capital Management, Inc. ("HCM") does feel that within this time frame shareholders can judge adherence to investment policy and strategy. With that in mind, HCM is pleased to report that the portfolio was invested in a diversified portfolio of companies that fulfill our criteria for sustainable competitive advantage, at a discount to our assessment of fair market value. It is HCM's philosophy that adherence to this discipline is in the best interest of shareholders.
During the period, investors appeared concerned by the rise of the Delta and Omicron COVID-19 variants as well as supply chain bottlenecks and the resulting input price volatility. Sensing that the transitory inflationary period may last longer than previously believed, bond traders pushed the yield on the Ten-Year US. Treasury Note up 12 basis points, from 1.31% to 1.43%. Rates in developed countries modestly declined, with the yield on the German Ten Year Government Bond and the Japanese Ten-Year Government Bond settling at -0.347% and 0.059%, respectively.
Over the 138 days, the Fund achieved notably positive returns in the Information Technology and Real Estate Sectors, while the Industrials, Communication Services, Consumer Staples, Health Care and Materials Sectors significantly detracted from results.
The top 5 performers for the period were Pfizer, Inc. (Ticker: PFE), Simon Property Group, Inc. (Ticker: SPG), salesforce.com, Inc. (Ticker: CRM), Microsoft Corporation (Ticker: MSFT), and ServiceNow, Inc. (Ticker: NOW).
The bottom 5 performers for the fiscal year were Compass Minerals International, Inc. (Ticker: CMP), Biogen, Inc. (Ticker: BIIB), Western Union Company (Ticker: WU), Nordstrom, Inc. (Ticker: JWN), and Bristol-Myers Squibb Company (Ticker: BMY).
HCM continues to believe that the road to pandemic and economic recovery will be bumpy, as new strains of COVID-19 appear and hiccups in vaccination distribution slow the road to global herd immunity. Vast sums of public and private debt have been assumed to help corporations and households weather the economic storm. Servicing and repaying these debts over time will have an impact on the economy. The medical profession and the population should eventually prevail, and we caution against investing based upon overly optimistic or unnecessarily dire scenarios. We implore investors to adhere to their long-term asset allocation programs.
HCM's equity strategies are driven by our core belief that competitively advantaged companies will outperform their peers through economic cycles and market cycles. The goal is to invest in great enterprises at attractive prices. HCM's investment team will continue to invest according to this precept for the long-term interest of our clients. HCM feels that the Fund is well positioned with investments in companies with sustainable competitive advantages, at prices that we believe to be reasonable.
1 | November 30, 2021
ALPS Hillman Active Value ETF
| Performance Overview | November 30, 2021 (Unaudited) |
Performance (as of November 30, 2021)
| | Since Inception^ |
| ALPS Hillman Active Value ETF - NAV | -3.63% |
| ALPS Hillman Active Value ETF – Market Price* | -3.55% |
| Russell 1000® Value Total Return Index | 0.58% |
Total Expense Ratio (per the current prospectus) is 0.55%.
Performance data quoted represents past performance. Past performance does not guarantee future results. Total return figures assume reinvestment of dividends and capital gains distributions, if any. The table does not reflect the deduction of taxes that a shareholder would pay on Fund distributions or the redemption of Fund shares. Investment return and principal value of an investment will fluctuate so that an investor’s shares, when sold or redeemed, may be worth more or less than the original cost. Current performance data may be higher or lower than actual data quoted. For the most current month-end performance data please visit www.alpsfunds.com or call 1.866.759.5679.
NAV is an exchange-traded fund’s per-share value. The per-share dollar amount of the Fund is derived by dividing the total value of all the securities in its portfolio, less any liabilities, by the number of Fund shares outstanding. Market Price is the price at which a share can currently be traded in the market. Information detailing the number of days the Market Price of the Fund was greater than the Fund’s NAV and the number of days it was less than the Fund’s NAV can be obtained at www.alpsfunds.com.
| ^ | The Fund commenced operations on July 15, 2021, with the first day of trading on the exchange of July 16, 2021. |
| * | Market Price means the official closing price of a share or, if it more accurately reflects the market value of a share at the time as of which the Fund calculates current net asset value per share, the price that is the midpoint of the bid-ask spread as of that time. It does not represent the returns an investor would receive if shares were traded at other times. |
The Fund is new with limited operating history.
Russell 1000® Value Total Return is a broad-based benchmark that measures the performance of the large cap value segment of the US equity universe. It includes those Russell 1000® companies with lower price-to-book ratios and lower expected growth values. The index is not actively managed and does not reflect any deductions for fees, expenses or taxes. The index is reported on a total return basis, which assumes reinvestment of any dividends and distributions realized during a given time period. One cannot invest directly in an index. Index performance does not reflect fund performance.
The Fund’s shares are not individually redeemable. Investors buy and sell shares of the Fund on a secondary market. Only market makers or “authorized participants” may trade directly with the Fund, typically in blocks of 25,000 shares.
The ALPS Hillman Active Value ETF is not suitable for all investors. Investments in the Fund are subject to investment risks, including possible loss of the principal amount invested.
ALPS Portfolio Solutions Distributor, Inc., a FINRA member, is the distributor for the Fund.
2 | November 30, 2021
ALPS Hillman Active Value ETF
| Performance Overview | November 30, 2021 (Unaudited) |
Top 10 Holdings* (as of November 30, 2021)
| Simon Property Group, Inc. | 2.77% |
| salesforce.com, Inc. | 2.73% |
| Microsoft Corp. | 2.72% |
| ServiceNow, Inc. | 2.67% |
| Alphabet, Inc. | 2.65% |
| Bank of New York Mellon Corp. | 2.57% |
| Air Products and Chemicals, Inc. | 2.56% |
| CVS Health Corp. | 2.50% |
| Wells Fargo & Co. | 2.46% |
| Amazon.com, Inc. | 2.36% |
| Total % of Top 10 Holdings | 25.99% |
Sector Allocation* (as of November 30, 2021)
| Health Care | 19.40% |
| Industrials | 14.76% |
| Consumer Staples | 12.64% |
| Communication Services | 12.61% |
| Information Technology | 11.87% |
| Energy | 8.70% |
| Financials | 5.03% |
| Consumer Discretionary | 4.16% |
| Materials | 3.79% |
| Real Estate | 2.77% |
| Basic Materials | 2.56% |
| Money Market Fund | 1.71% |
| Total Investments | 100.00% |
Future holdings are subject to change.
Growth of $10,000 (as of November 30, 2021)
Comparison of Change in Value of $10,000 Investment in the Fund and the Fund's benchmark
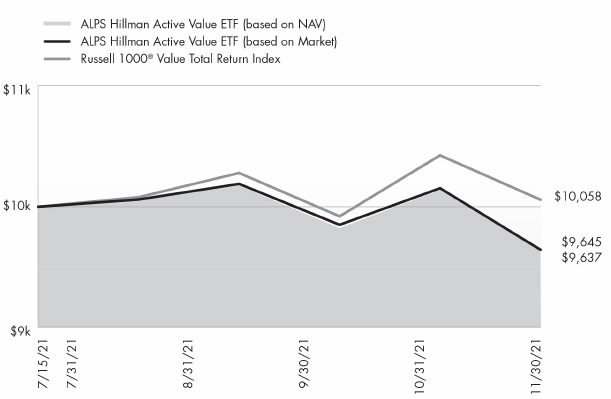
The chart above compares historical performance of a hypothetical investment of $10,000 in the Fund since inception with the performance of the Fund’s benchmark index. Past performance does not guarantee future results. The chart does not reflect the deduction of taxes that a shareholder would pay on Fund distributions or the redemption of Fund shares.
3 | November 30, 2021
ALPS Hillman Active Value ETF
| Disclosure of Fund Expenses | November 30, 2021 (Unaudited) |
Shareholder Expense Example: As a shareholder of a Fund, you incur certain ongoing costs, including management fees and other Fund expenses. These examples are intended to help you understand your ongoing costs (in dollars) of investing in the Fund and to compare these costs with the ongoing costs of investing in other funds. It is based on an investment of $1,000 invested at the beginning of the (six month) period and held through November 30, 2021.
Actual Return: The first line of the table provides information about actual account values and actual expenses. You may use the information in this line, together with the amount you invested, to estimate the expenses that you incurred over the period. Simply divide your account value by $1,000 (for example, an $8,600 account value divided by $1,000 = 8.6), then multiply the result by the number in the first line under the heading entitled “Expenses Paid During Period” to estimate the expenses attributable to your investment during this period.
Hypothetical 5% Return: The second line of the table provides information about hypothetical account values and hypothetical expenses based on the Fund’s actual expense ratio and an assumed rate of return of 5% per year before expenses, which is not the Fund’s actual return. The hypothetical account values and expenses may not be used to estimate the actual ending account balance or expenses you paid for the period. You may use this information to compare ongoing costs of investing in the Fund and other funds. To do so, compare this 5% hypothetical example with the 5% hypothetical examples that appear in the shareholder reports of other funds.
The expenses shown in the table are meant to highlight ongoing Fund costs only and do not reflect any transaction costs, such as brokerage commissions and other fees to financial intermediaries. Therefore, the second line is useful in comparing ongoing costs only, and will not help you determine the relative total costs of owning different funds. In addition, if these costs were included, your costs would have been higher.
| | | Beginning Account Value 6/1/21 | | | Ending Account Value 11/30/21 | | | Expense Ratio(a) | | | Expenses Paid During Period 6/1/21 - 11/30/21(b) | |
| ALPS Hillman Active Value ETF | | | | | | | | | | | | |
| Actual(c) | | $ | 1,000.00 | | | $ | 963.70 | | | | 0.55 | % | | $ | 2.06 | |
| Hypothetical (5% return before expenses) | | $ | 1,000.00 | | | $ | 1,022.31 | | | | 0.55 | % | | $ | 2.79 | |
| (a) | Annualized, based on the Fund's most recent fiscal half year expenses. |
| (b) | Expenses are equal to the Fund's annualized expense ratio multiplied by the average account value over the period, multiplied by the number of days in the most recent fiscal half year (183), divided by 365. |
| (c) | The ALPS Hillman Active Value ETF commenced operations on July 15, 2021. Actual expenses on this Fund are equal to the Fund's annualized expense ratio multiplied by the average account value of the period, multiplied by the number of days since the Fund launched (138) divided by 365. |
4 | November 30, 2021
ALPS Hillman Active Value ETF
Report of Independent Registered Public Accounting Firm
To the Board of Trustees of ALPS ETF Trust and the shareholders of ALPS Hillman Active Value ETF:
Opinion on the Financial Statements and Financial Highlights
We have audited the accompanying statement of assets and liabilities, including the schedule of investments of ALPS Hillman Active Value ETF (the "Fund"), one of the funds constituting the ALPS ETF Trust , as of November 30, 2021, the related statement of operations, the statements of changes in net assets, and the financial highlights for the period from July 15, 2021 (commencement of operations) through November 30, 2021, and the related notes.
In our opinion, the financial statements and financial highlights present fairly, in all material respects, the financial position of the Fund as of November 30, 2021, and the result of its operations, the changes in its net assets, and the financial highlights for the period from July 15, 2021 (commencement of operations) through November 30, 2021 in conformity with accounting principles generally accepted in the United States of America.
Basis for Opinion
These financial statements and financial highlights are the responsibility of the Fund's management. Our responsibility is to express an opinion on the Fund's financial statements and financial highlights based on our audit. We are a public accounting firm registered with the Public Company Accounting Oversight Board (United States) (PCAOB) and are required to be independent with respect to the Fund in accordance with the U.S. federal securities laws and the applicable rules and regulations of the Securities and Exchange Commission and the PCAOB.
We conducted our audit in accordance with the standards of the PCAOB. Those standards require that we plan and perform the audit to obtain reasonable assurance about whether the financial statements and financial highlights are free of material misstatement, whether due to error or fraud. The Fund is not required to have, nor were we engaged to perform, an audit of its internal control over financial reporting. As part of our audit we are required to obtain an understanding of internal control over financial reporting but not for the purpose of expressing an opinion on the effectiveness of the Fund’s internal control over financial reporting. Accordingly, we express no such opinion.
Our audit included performing procedures to assess the risks of material misstatement of the financial statements and financial highlights, whether due to error or fraud, and performing procedures that respond to those risks. Such procedures included examining, on a test basis, evidence regarding the amounts and disclosures in the financial statements and financial highlights. Our audit also included evaluating the accounting principles used and significant estimates made by management, as well as evaluating the overall presentation of the financial statements and financial highlights. Our procedures included confirmation of securities owned as of November 30, 2021, by correspondence with the custodian and brokers; when replies were not received from brokers, we performed other auditing procedures. We believe that our audit provides a reasonable basis for our opinion.
DELOITTE & TOUCHE LLP
Denver, Colorado
January 26, 2022
We have served as the auditor of one or more investment companies advised by ALPS Advisors, Inc. since 2007.
5 | November 30, 2021
ALPS Hillman Active Value ETF
| Schedule of Investments | November 30, 2021 |
| Security Description | | Shares | | | Value | |
| COMMON STOCKS (91.48%) | | | | | | |
| Communication Services (12.55%) | | | | | | |
| Alphabet, Inc., Class A(a) | | | 50 | | | $ | 141,897 | |
| AT&T, Inc. | | | 4,379 | | | | 99,973 | |
| Comcast Corp., Class A | | | 2,142 | | | | 107,057 | |
| Discovery, Inc., Class A(a) | | | 4,307 | | | | 100,224 | |
| Meta Platforms, Inc., Class A(a) | | | 356 | | | | 115,508 | |
| Verizon Communications, Inc. | | | 2,201 | | | | 110,644 | |
| Total Communication Services | | | | | | | 675,303 | |
| | | | | | | | | |
| Consumer Discretionary (4.14%) | | | | | | | | |
| Amazon.com, Inc.(a) | | | 36 | | | | 126,255 | |
| Nordstrom, Inc.(a) | | | 4,555 | | | | 96,429 | |
| Total Consumer Discretionary | | | | | | | 222,684 | |
| | | | | | | | | |
| Consumer Staples (12.58%) | | | | | | | | |
| Anheuser-Busch InBev SA, | | | | | | | | |
| ADR(b) | | | 1,782 | | | | 99,293 | |
| Coca-Cola Co. | | | 2,201 | | | | 115,442 | |
| Conagra Brands, Inc. | | | 3,654 | | | | 111,630 | |
| Constellation Brands, Inc., | | | | | | | | |
| Class A | | | 549 | | | | 123,707 | |
| Kellogg Co. | | | 1,958 | | | | 119,790 | |
| Kraft Heinz Co. | | | 3,177 | | | | 106,779 | |
| Total Consumer Staples | | | | | | | 676,641 | |
| | | | | | | | | |
| Energy (2.31%) | | | | | | | | |
| Exxon Mobil Corp. | | | 2,079 | | | | 124,407 | |
| | | | | | | | | |
| Financials (5.00%) | | | | | | | | |
| Bank of New York Mellon Corp. | | | 2,511 | | | | 137,578 | |
| Wells Fargo & Co. | | | 2,754 | | | | 131,586 | |
| Total Financials | | | | | | | 269,164 | |
| | | | | | | | | |
| Health Care (19.31%) | | | | | | | | |
| Becton Dickinson and Co. | | | 504 | | | | 119,519 | |
| Biogen, Inc.(a) | | | 501 | | | | 118,106 | |
| Bristol-Myers Squibb Co. | | | 1,823 | | | | 97,767 | |
| CVS Health Corp. | | | 1,503 | | | | 133,857 | |
| GlaxoSmithKline PLC, ADR | | | 3,060 | | | | 125,828 | |
| Medtronic PLC | | | 972 | | | | 103,712 | |
| Merck & Co., Inc. | | | 1,598 | | | | 119,707 | |
| Pfizer, Inc. | | | 2,191 | | | | 117,722 | |
| Zimmer Biomet Holdings, Inc. | | | 855 | | | | 102,258 | |
| Total Health Care | | | | | | | 1,038,476 | |
| | | | | | | | | |
| Industrials (14.69%) | | | | | | | | |
| 3M Co. | | | 612 | | | | 104,064 | |
| Boeing Co.(a) | | | 554 | | | | 109,609 | |
| Emerson Electric Co. | | | 1,265 | | | | 111,118 | |
| General Dynamics Corp. | | | 653 | | | | 123,398 | |
| General Electric Co. | | | 1,207 | | | | 114,653 | |
| Lockheed Martin Corp. | | | 329 | | | | 109,662 | |
| Raytheon Technologies Corp. | | | 1,458 | | | | 117,981 | |
| Total Industrials | | | | | | | 790,485 | |
| Security Description | | Shares | | | Value | |
| Information Technology (11.81%) | | | | | | |
| Intel Corp. | | | 2,192 | | | $ | 107,846 | |
| Microsoft Corp. | | | 441 | | | | 145,790 | |
| salesforce.com, Inc.(a) | | | 513 | | | | 146,185 | |
| ServiceNow, Inc.(a) | | | 221 | | | | 143,142 | |
| Western Union Co. | | | 5,850 | | | | 92,547 | |
| Total Information Technology | | | | | | | 635,510 | |
| | | | | | | | | |
| Materials (6.33%) | | | | | | | | |
| Air Products and Chemicals, Inc. | | | 477 | | | | 137,108 | |
| Compass Minerals International, Inc. | | | 1,809 | | | | 88,008 | |
| DuPont de Nemours, Inc. | | | 1,557 | | | | 115,156 | |
| Total Materials | | | | | | | 340,272 | |
| | | | | | | | | |
| Real Estate (2.76%) | | | | | | | | |
| Simon Property Group, Inc. | | | 972 | | | | 148,560 | |
| | | | | | | | | |
| TOTAL COMMON STOCKS | | | | | | | | |
| (Cost $5,207,790) | | | | | | | 4,921,502 | |
| | | | | | | | | |
| Security Description | | Shares | | | Value | |
| MASTER LIMITED PARTERSHIPS (6.34%) | | | | | | |
| Energy (6.34%) | | | | | | |
| Enterprise Products Partners LP | | | 5,121 | | | | 109,538 | |
| Magellan Midstream Partners LP | | | 2,637 | | | | 122,304 | |
| Plains All American Pipeline LP | | | 11,754 | | | | 109,312 | |
| Total Energy | | | | | | | 341,154 | |
| | | | | | | | | |
| TOTAL MASTER LIMITED PARTERSHIPS | | | | | | | | |
| (Cost $365,804) | | | | | | | 341,154 | |
| | | 7 Day Yield | | | Shares | | | Value | |
| SHORT TERM INVESTMENTS (1.70%) | | | | | | | | | |
| Money Market Fund | | | | | | | | | |
| State Street Institutional | | | | | | | | | | | | |
| Treasury Plus Money | | | | | | | | | | | | |
| Market Fund | | | 0.01 | % | | | 91,409 | | | | 91,409 | |
| TOTAL SHORT TERM INVESTMENTS | | | | | | | | | | | | |
| (Cost $91,409) | | | | | | | | | | | 91,409 | |
| | | | | | | | | | | | | |
| TOTAL INVESTMENTS (99.52%) | | | | | | | | | | | | |
| (Cost $5,665,003) | | | | | | | | | | $ | 5,354,065 | |
| NET ASSETS LESS OTHER LIABILITIES (0.48%) | | | | | | | | | | | 25,597 | |
| NET ASSETS - 100.00% | | | | | | | | | | $ | 5,379,662 | |
| (a) | Non-income producing security. |
| (b) | Security, or a portion of the security position is currently on loan. The total market value of securities on loan is $44,576. |
See Notes to Financial Statements.
6 | November 30, 2021
ALPS Hillman Active Value ETF
| Statement of Assets and Liabilities | November 30, 2021 |
| ASSETS: | | | |
| Investments, at value | | $ | 5,354,065 | |
| Receivable for investments sold | | | 49,754 | |
| Dividends receivable | | | 14,426 | |
| Total Assets | | | 5,418,245 | |
| | | | | |
| LIABILITIES: | | | | |
| Payable for investments purchased | | | 35,990 | |
| Payable to adviser | | | 2,593 | |
| Total Liabilities | | | 38,583 | |
| NET ASSETS | | $ | 5,379,662 | |
| | | | | |
| NET ASSETS CONSIST OF: | | | | |
| Paid-in capital | | $ | 5,610,203 | |
| Total distributable earnings | | | (230,541 | ) |
| NET ASSETS | | $ | 5,379,662 | |
| | | | | |
| INVESTMENTS, AT COST | | $ | 5,665,003 | |
| | | | | |
| PRICING OF SHARES | | | | |
| Net Assets | | $ | 5,379,662 | |
| Shares of beneficial interest outstanding (Unlimited number of shares authorized, par value $0.01 per share) | | | 225,002 | |
| Net Asset Value, offering and redemption price per share | | $ | 23.91 | |
See Notes to Financial Statements.
7 | November 30, 2021
ALPS Hillman Active Value ETF
| Statement of Operations | For the Period Ended November 30, 2021(a) |
| INVESTMENT INCOME: | | | |
| Dividends | | $ | 62,919 | |
| Securities Lending Income | | | 45 | |
| Total Investment Income | | | 62,964 | |
| | | | | |
| EXPENSES: | | | | |
| Investment adviser fees | | | 12,221 | |
| Net Expenses | | | 12,221 | |
| NET INVESTMENT INCOME | | | 50,743 | |
| | | | | |
| REALIZED AND UNREALIZED GAIN: | | | | |
| Net realized gain on investments(b) | | | 60,733 | |
| Net change in unrealized depreciation on investments | | | (310,938 | ) |
| NET REALIZED AND UNREALIZED LOSS ON INVESTMENTS | | | (250,205 | ) |
| NET DECREASE IN NET ASSETS RESULTING FROM OPERATIONS | | $ | (199,462 | ) |
| (a) | The ALPS Hillman Active Value ETF commenced operations on July 15, 2021. |
| (b) | Includes realized gain or loss as a result of in-kind transactions (See Note 4 in Notes to Financial Statements). |
See Notes to Financial Statements.
8 | November 30, 2021
ALPS Hillman Active Value ETF
Statements of Changes in Net Assets
| | | For the Period July 15, 2021 (Commencement of Operations) to November 30, 2021 | |
| OPERATIONS: | | | |
| Net investment income | | $ | 50,743 | |
| Net realized gain | | | 60,733 | |
| Net change in unrealized depreciation | | | (310,938 | ) |
| Net decrease in net assets resulting from operations | | | (199,462 | ) |
| | | | | |
| DISTRIBUTIONS TO SHAREHOLDERS: | | | | |
| From distributable earnings | | | (17,283 | ) |
| Total distributions | | | (17,283 | ) |
| | | | | |
| CAPITAL SHARE TRANSACTIONS: | | | | |
| Proceeds from sale of shares | | | 6,232,629 | |
| Cost of shares redeemed | | | (636,222 | ) |
| Net increase from capital share transactions | | | 5,596,407 | |
| Net increase in net assets | | | 5,379,662 | |
| | | | | |
| NET ASSETS: | | | | |
| Beginning of period | | | – | |
| End of period | | $ | 5,379,662 | |
| | | | | |
| OTHER INFORMATION: | | | | |
| CAPITAL SHARE TRANSACTIONS: | | | | |
| Beginning shares | | | – | |
| Shares sold | | | 250,002 | |
| Shares redeemed | | | (25,000 | ) |
| Shares outstanding, end of period | | | 225,002 | |
See Notes to Financial Statements.
9 | November 30, 2021
ALPS Hillman Active Value ETF
| Financial Highlights | For a Share Outstanding Throughout the Period Presented |
| | | For the Period July 15, 2021 (Commencement of Operations) to November 30, 2021 | |
| NET ASSET VALUE, BEGINNING OF PERIOD | | $ | 24.88 | |
| | | | | |
| INCOME FROM OPERATIONS: | | | | |
| Net investment income(a) | | | 0.22 | |
| Net realized and unrealized loss | | | (1.12 | ) |
| Total from investment operations | | | (0.90 | ) |
| | | | | |
| DISTRIBUTIONS: | | | | |
| From net investment income | | | (0.07 | ) |
| Total distributions | | | (0.07 | ) |
| | | | | |
| NET (DECREASE) IN NET ASSET VALUE | | | (0.97 | ) |
| NET ASSET VALUE, END OF PERIOD | | $ | 23.91 | |
| TOTAL RETURN(b) | | | (3.63 | )% |
| | | | | |
| RATIOS/SUPPLEMENTAL DATA: | | | | |
| Net assets, end of period (in 000s) | | $ | 5,380 | |
| | | | | |
| RATIOS TO AVERAGE NET ASSETS | | | | |
| Ratio of expenses to average net assets | | | 0.55 | %(c) |
| Ratio of net investment income to average net assets | | | 2.28 | %(c) |
| Portfolio turnover rate(d) | | | 10 | % |
| (a) | Based on average shares outstanding during the period. |
| (b) | Total return is calculated assuming an initial investment made at the net asset value at the beginning of the period and redemption at the net asset value on the last day of the period and assuming all distributions are reinvested at the reinvestment prices. Total return calculated for a period of less than one year is not annualized. |
| (d) | Portfolio turnover for periods less than one year are not annualized and does not include securities received or delivered from processing creations or redemptions in-kind. |
See Notes to Financial Statements.
10 | November 30, 2021
ALPS Hillman Active Value ETF
| Notes to Financial Statements | November 30, 2021 |
1. ORGANIZATION
ALPS ETF Trust (the “Trust”), a Delaware statutory trust, is an open-end management investment company registered under the Investment Company Act of 1940, as amended (the “1940 Act”). As of November 30, 2021, the Trust consisted of eighteen separate portfolios. Each portfolio represents a separate series of the Trust. This report pertains solely to the ALPS Hillman Active Value ETF (the “Fund”). The Fund seeks long-term total return from a combination of income and capital gains. The Fund has elected to qualify as a diversified series of the Trust under the 1940 Act.
The Fund’s Shares (“Shares”) are listed on the NYSE Arca, Inc. (the “NYSE Arca”). The Fund issues and redeems Shares at net asset value (“NAV”) in blocks of 25,000 Shares (prior to October 1, 2021 in blocks of 50,000 Shares), each of which is called a “Creation Unit”. Creation Units are issued and redeemed principally in-kind for securities. Except when aggregated in Creation Units, Shares are not redeemable securities of the Fund.
Pursuant to the Trust’s organizational documents, its Officers and Trustees are indemnified against certain liability arising out of the performance of their duties to the Trust. Additionally, in the normal course of business, the Trust enters into contracts with service providers that contain general indemnification clauses. The Trust’s maximum exposure under these arrangements is unknown, as this would involve future claims that may be made against the Trust that have not yet occurred.
2. SIGNIFICANT ACCOUNTING POLICIES
The following is a summary of significant accounting policies consistently followed by the Fund in the preparation of the financial statements. The accompanying financial statements were prepared in accordance with accounting principles generally accepted in the United States of America (“U.S. GAAP”). The preparation of financial statements in conformity with U.S. GAAP requires management to make certain estimates and assumptions that affect the reported amounts of assets and liabilities and disclosures of contingent assets and liabilities at the date of the financial statements and the reported amounts of revenue and expenses during the period. Actual results could differ from those estimates. The Fund is considered an investment company under U.S. GAAP and follows the accounting and reporting guidance applicable to investment companies in the Financial Accounting Standards Board (“FASB”) Accounting Standards Codification Topic 946.
A. Portfolio Valuation
The Fund’s NAV is determined daily, as of the close of regular trading on the New York Stock Exchange (the “NYSE”), normally 4:00 p.m. Eastern time, on each day the NYSE is open for trading. The NAV is computed by dividing the value of all assets of the Fund (including accrued interest and dividends), less all liabilities (including accrued expenses and dividends declared but unpaid), by the total number of shares outstanding.
Portfolio securities listed on any exchange other than the NASDAQ Stock Market LLC (“NASDAQ”) are valued at the last sale price on the business day as of which such value is being determined. If there has been no sale on such day, the securities are valued at the mean of the most recent bid and ask prices on such day. Securities traded on the NASDAQ are valued at the NASDAQ Official Closing Price as determined by NASDAQ. Portfolio securities traded on more than one securities exchange are valued at the last sale price on the business day as of which such value is being determined at the close of the exchange representing the principal market for such securities. Portfolio securities traded in the over-the-counter market, but excluding securities traded on the NASDAQ, are valued at the latest quoted sale price in such market.
The Fund’s investments are valued at market value or, in the absence of market value with respect to any portfolio securities, at fair value according to procedures adopted by the Trust’s Board of Trustees (the “Board”). When market quotations are not readily available or when events occur that make established valuation methods unreliable, securities of the Fund may be valued in good faith by or under the direction of the Board. These securities generally include, but are not limited to, restricted securities (securities which may not be publicly sold without registration under the Securities Act of 1933) for which a pricing service is unable to provide a market price; securities whose trading has been formally suspended; a security whose market price is not available from a pre-established primary pricing source or the pricing source is not willing to provide a price; a security with respect to which an event has occurred that is most likely to materially affect the value of the security after the market has closed but before the calculation of the Fund’s NAV or make it difficult or impossible to obtain a reliable market quotation; or a security whose price, as provided by the pricing service, does not reflect the security’s “fair value” due to the security being de-listed from a national exchange or the security’s primary trading market is temporarily closed at a time when, under normal conditions, it would be open. As a general principle, the current “fair value” of a security would be the amount which the owner might reasonably expect to receive from the sale on the applicable exchange or principal market. A variety of factors may be considered in determining the fair value of such securities.
11 | November 30, 2021
ALPS Hillman Active Value ETF
| Notes to Financial Statements | November 30, 2021 |
B. Fair Value Measurements
The Fund discloses the classification of its fair value measurements following a three-tier hierarchy based on the inputs used to measure fair value. Inputs refer broadly to the assumptions that market participants would use in pricing the asset or liability; including assumptions about risk. Inputs may be observable or unobservable. Observable inputs reflect the assumptions market participants would use in pricing the asset or liability that are developed based on market data obtained from sources independent of the reporting entity. Unobservable inputs reflect the reporting entity’s own assumptions about the assumptions market participants would use in pricing the asset or liability that are developed based on the best information available.
Valuation techniques used to value the Fund's investments by major category are as follows:
Equity securities and Limited Partnerships, including restricted securities, for which market quotations are readily available, are valued at the last reported sale price or official closing price as reported by a third party pricing vendor on the primary market or exchange on which they are traded and are categorized as Level 1 in the hierarchy. In the event there were no sales during the day or closing prices are not available, securities are valued at the mean of the most recent quoted bid and ask prices on such day and are generally categorized as Level 2 in the hierarchy. Investments in open-end mutual funds are valued at their closing NAV each business day and are categorized as Level 1 in the hierarchy.
Changes in valuation techniques may result in transfers in or out of an assigned level within the disclosure hierarchy.
Various inputs are used in determining the value of the Fund’s investments as of the end of the reporting period. When inputs used fall into different levels of the fair value hierarchy, the level in the hierarchy within which the fair value measurement falls is determined based on the lowest level input that is significant to the fair value measurement in its entirety. The designated input levels are not necessarily an indication of the risk or liquidity associated with these investments.
These inputs are categorized in the following hierarchy under applicable financial accounting standards:
| Level 1 – | Unadjusted quoted prices in active markets for identical investments, unrestricted assets or liabilities that a Fund has the ability to access at the measurement date; |
| Level 2 – | Quoted prices which are not active, quoted prices for similar assets or liabilities in active markets or inputs other than quoted prices that are observable (either directly or indirectly) for substantially the full term of the asset or liability; and |
| Level 3 – | Significant unobservable prices or inputs (including the Fund’s own assumptions in determining the fair value of investments) where there is little or no market activity for the asset or liability at the measurement date. |
The following is a summary of the inputs used to value the Fund’s investments as of November 30, 2021:
ALPS Hillman Active Value ETF
| Investments in Securities at Value | | Level 1 - Quoted and Unadjusted Prices | | | Level 2 - Other Significant Observable Inputs | | | Level 3 - Significant Unobservable Inputs | | | Total | |
| Common Stocks* | | $ | 4,921,502 | | | $ | – | | | $ | – | | | $ | 4,921,502 | |
| Master Limited Parterships* | | | 341,154 | | | | – | | | | – | | | | 341,154 | |
| Short Term Investments | | | 91,409 | | | | – | | | | – | | | | 91,409 | |
| Total | | $ | 5,354,065 | | | $ | – | | | $ | – | | | $ | 5,354,065 | |
| * | For a detailed sector breakdown, see the accompanying Schedule of Investments. |
The Fund did not have any securities that used significant unobservable inputs (Level 3) in determining fair value and there were no transfers into or out of Level 3 during the period ended November 30, 2021.
C. Securities Transactions and Investment Income
Securities transactions are recorded as of the trade date. Realized gains and losses from securities transactions are recorded on the specific identification in accordance with GAAP. Dividend income and capital gains distributions, if any, are recorded on the ex-dividend date. Interest income, if any, is recorded on the accrual basis.
12 | November 30, 2021
ALPS Hillman Active Value ETF
| Notes to Financial Statements | November 30, 2021 |
D. Dividends and Distributions to Shareholders
Dividends from net investment income of the Fund, if any, are declared and paid quarterly or as the Board may determine from time to time. Distributions of net realized capital gains earned by the Fund, if any, are declared and distributed at least annually.
E. Federal Tax and Tax Basis Information
The timing and character of income and capital gain distributions are determined in accordance with income tax regulations, which may differ from U.S. GAAP. Reclassifications are made to the Fund’s capital accounts for permanent tax differences to reflect income and gains available for distribution (or available capital loss carryforwards) under income tax regulations.
For the period ended November 30, 2021, the following reclassifications, which had no impact on results of operations or net assets, were recorded to reflect permanent tax differences resulting primarily from in-kind transactions:
| Fund | | Paid-in Capital | | | Total Distributable Earnings | |
| ALPS Hillman Active Value ETF | | $ | 13,796 | | | $ | (13,796 | ) |
The tax character of the distributions paid during the fiscal period ended November 30, 2021 was as follows:
| | | Ordinary Income | | | Long-Term Capital Gain | | | Return of Capital | |
| November 30, 2021 | | | | | | | | | |
| ALPS Hillman Active Value ETF | | $ | 17,283 | | | $ | – | | | $ | – | |
The character of distributions made during the year may differ from its ultimate characterization for federal income tax purposes.
As of November 30, 2021, the components of distributable earnings on a tax basis for each Fund were as follows:
| | | Accumulated net investment income | | | Accumulated net realized gain on investments | | | Other accumulated gains | | | Net unrealized (depreciation) on investments | | | Total | |
| ALPS Hillman Active Value ETF | | | 65,780 | | | $ | 38 | | | $ | – | | | $ | (296,359 | ) | | $ | (230,541 | ) |
As of November 30, 2021, the cost of investments for federal income tax purposes and accumulated net unrealized appreciation/(depreciation) on investments were as follows:
| | | ALPS Hillman Active Value ETF | |
| Gross appreciation (excess of value over tax cost) | | $ | 194,062 | |
| Gross depreciation (excess of tax cost over value) | | | (490,421 | ) |
| Net unrealized appreciation (depreciation) | | $ | (296,359 | ) |
| Cost of investments for income tax purposes | | $ | 5,650,424 | |
The differences between book-basis and tax-basis are primarily due to the deferral of losses from investments in partnerships.
13 | November 30, 2021
ALPS Hillman Active Value ETF
| Notes to Financial Statements | November 30, 2021 |
F. Income Taxes
No provision for income taxes is included in the accompanying financial statements, as the Fund intends to distribute to shareholders all taxable investment income and realized gains and otherwise comply with Subchapter M of the Internal Revenue Code of 1986, as amended, applicable to regulated investment companies. The Fund evaluates tax positions taken (or expected to be taken) in the course of preparing the Fund’s tax returns to determine whether these positions meet a “more-likely-than-not” standard that, based on the technical merits, have a more than fifty percent likelihood of being sustained by a taxing authority upon examination. A tax position that meets the “more-likely-than-not” recognition threshold is measured to determine the amount of benefit to recognize in the financial statements.
As of and during the period ended November 30, 2021, the Fund did not have a liability for any unrecognized tax benefits. The Fund files U.S. federal, state, and local tax returns as required. The Fund’s tax returns are subject to examination by the relevant tax authorities until expiration of the applicable statute of limitations, which is generally three years after the filing of the tax return, but may extend to four years in certain jurisdictions. Tax returns for open years have incorporated no uncertain tax positions that require a provision for income taxes.
G. Lending of Portfolio Securities
The Fund has entered into a securities lending agreement with State Street Bank & Trust Co. (“SSB”), the Fund’s lending agent. The Fund may lend its portfolio securities only to borrowers that are approved by SSB. The Fund will limit such lending to not more than 33 1/3% of the value of its total assets. The Fund’s securities held at SSB as custodian shall be available to be lent except those securities the Fund or ALPS Advisors, Inc. specifically identifies in writing as not being available for lending. The borrower pledges and maintains with the Fund collateral consisting of cash (U.S. Dollars only), securities issued or guaranteed by the U.S. government or its agencies or instrumentalities, and cash equivalents (including irrevocable bank letters of credit) issued by a person other than the borrower or an affiliate of the borrower. The initial collateral received by the Fund is required to have a value of no less than 102% of the market value of the loaned securities for U.S equity securities and a value of no less than 105% of the market value for non-U.S. equity securities. The collateral is maintained thereafter, at a market value equal to not less than 102% of the current value of the U.S. equity securities on loan and not less than 105% of the current value of the non-U.S. equity securities on loan. The market value of the loaned securities is determined at the close of each business day and any additional required collateral is delivered to the Fund on the next business day. During the term of the loan, the Fund is entitled to all distributions made on or in respect of the loaned securities. Loans of securities are terminable at any time and the borrower, after notice, is required to return borrowed securities within the customary time period for settlement of securities transactions.
Any cash collateral received is reinvested in a money market fund managed by SSB as disclosed in the Fund’s Schedule of Investments and is reflected in the Statements of Assets and Liabilities as a payable for collateral upon return of securities loaned. Non-cash collateral, in the form of securities issued or guaranteed by the U.S. government or its agencies or instrumentalities, is not disclosed in the Fund’s Statements of Assets and Liabilities as it is held by the lending agent on behalf of the Fund, and the Fund does not have the ability to re-hypothecate these securities. Income earned by the Fund from securities lending activity is disclosed in the Statement of Operations.
The following is a summary of the Fund's securities lending agreement and related cash and non-cash collateral received as of November 30, 2021:
| | | Market Value of Securities on Loan | | | Cash Collateral Received | | | Non-Cash Collateral Received | | | Total Collateral Received | |
| ALPS Hillman Active Value ETF | | $ | 44,576 | | | $ | – | | | $ | 47,937 | | | $ | 47,937 | |
3. INVESTMENT ADVISORY FEE AND OTHER AFFILIATED TRANSACTIONS
ALPS Advisors, Inc. (the “Adviser”) serves as the Fund’s investment adviser pursuant to an Investment Advisory Agreement with the Trust on behalf of the Fund (the “Advisory Agreement”). Pursuant to the Advisory Agreement, the Fund pays the Adviser an annual management fee for the services and facilities it provides, payable on a monthly basis at a rate of 0.55% as a percentage of the Fund’s average daily net assets.
Out of the unitary management fees, the Adviser pays substantially all expenses of the Fund, including the cost of sub-advisory, transfer agency, custody, fund administration, legal, audit, trustees and other services, except for interest expenses, distribution fees or expenses, brokerage expenses, taxes and extraordinary expenses not incurred in the ordinary course of the Fund's business. The Adviser’s unitary management fee is designed to pay substantially all of the Fund’s expenses and to compensate the Adviser for providing services to the Fund.
Hillman Capital Management, Inc. (the “Sub-Adviser”) serves as the Fund’s sub-adviser pursuant to a sub-advisory agreement with the Trust (the ‘‘Sub-Advisory Agreement’’). Pursuant to the Sub-Advisory Agreement, the Adviser pays the Sub-Adviser a sub-advisory fee out of the Adviser’s advisory fee for the services it provides. The fee is payable on a monthly basis at the annual rate of 0.25% of the Fund's average daily net assets.
14 | November 30, 2021
ALPS Hillman Active Value ETF
| Notes to Financial Statements | November 30, 2021 |
Each Trustee receives (1) a quarterly retainer of $10,000, (2) a per meeting fee of $5,000, (3) $1,500 for any special meeting held outside of a regularly scheduled board meeting, and (4) reimbursement for all reasonable out-of-pocket expenses relating to attendance at meetings. In addition, the Chairman of the Board and Chairman of the Audit Committee each receives a quarterly retainer of $2,000, in connection with their respective roles.
4. PURCHASES AND SALES OF SECURITIES
For the period ended November 30, 2021, the cost of purchases and proceeds from sales of investment securities, excluding in-kind transactions and short-term investments, were as follows:
| Fund | | Purchases | | | Sales | |
| ALPS Hillman Active Value ETF | | $ | 584,753 | | | $ | 499,018 | |
For the ended ended November 30, 2021, the cost of in-kind purchases and proceeds from in-kind sales were as follows:
| Fund | | Purchases | | | Sales | |
| ALPS Hillman Active Value ETF | | $ | 6,051,241 | | | $ | 624,077 | |
For the year ended November 30, 2021, Fund had in-kind net realized gains of $13,296.
Gains on in-kind transactions are not considered taxable for federal income tax purposes and losses on in-kind transactions are also not deductible for tax purposes.
5. CAPITAL SHARE TRANSACTIONS
Shares are created and redeemed by the Fund only in Creation Unit size aggregations of 25,000 Shares (prior to October 1, 2021, the Creation Unit size was 50,000 Shares). Only broker-dealers or large institutional investors with creation and redemption agreements called Authorized Participants (“AP”) are permitted to purchase or redeem Creation Units from the Fund. Such transactions are generally permitted on an in-kind basis, with a balancing cash component to equate the transaction to the NAV per unit of the Fund on the transaction date. Cash may be substituted equivalent to the value of certain securities generally when they are not available in sufficient quantity for delivery, not eligible for trading by the AP or as a result of other market circumstances.
6. MARKET DISRUPTIONS RISK
The Fund is subject to investment and operational risks associated with financial, economic and other global market developments and disruptions, including the recent spread of an infectious respiratory illness caused by a novel strain of coronavirus (known as COVID-19), which can negatively impact the securities markets and cause the Fund to lose value.
The spread of COVID-19 has caused volatility, severe market dislocations and liquidity constraints in many markets, including markets for the securities the Fund holds, and may adversely affect the Fund’s investments and operations. The transmission of COVID-19 and efforts to contain its spread have resulted in travel restrictions and disruptions, closed international borders, enhanced health screenings at ports of entry and elsewhere, disruption of and delays in healthcare service preparation and delivery, quarantines, event and service cancellations or interruptions, disruptions to business operations and supply chains, and a reduction in consumer and business spending, as well as general concern and uncertainty that has negatively affected the economy. These disruptions have led to instability in the market place and the jobs market. The impact of COVID-19 could adversely affect the economies of many nations or the entire global economy, the financial well-being and performance of individual issuers, borrowers and sectors and the health of the markets generally in potentially significant and unforeseen ways.
The foregoing could lead to a significant economic downturn or recession, increased market volatility, a greater number of market closures, higher default rates and adverse effects on the values and liquidity of the Fund’s securities or other assets. Such impacts may adversely affect the performance of the Fund.
7. SUBSEQUENT EVENTS
Subsequent events, if any, after the date of the Statements of Assets and Liabilities have been evaluated through the date the financial statements were issued. Management has determined that there were no subsequent events to report through the issuance of these financial statements.
15 | November 30, 2021
ALPS Hillman Active Value ETF
| Additional Information | November 30, 2021 (Unaudited) |
PROXY VOTING RECORDS, POLICIES AND PROCEDURES
Information regarding how the Fund voted proxies relating to portfolio securities during the most recent 12-month period ended June 30 and a description of the Fund’s proxy voting policies and procedures used in determining how to vote for proxies are available without charge on the SEC’s website at www.sec.gov and upon request, by calling (toll-free) 1-866-759-5679.
PORTFOLIO HOLDINGS
The Fund files a complete schedule of portfolio holdings with the U.S. Securities and Exchange Commission (“SEC”) for the first and third quarters of each fiscal year on Form N-PORT within 60 days after the end of the period. Copies of the Fund’s Form N-PORT are available without a charge, upon request, by contacting the Fund at 1-866-759-5679 and on the SEC’s website at https://www.sec.gov.
16 | November 30, 2021
ALPS Hillman Active Value ETF
| Board Considerations Regarding Approval of Investment Advisory Agreements | November 30, 2021 (Unaudited) |
At a meeting held on March 8, 2021 via electronic means (video-conference), the Board of Trustees of the Trust (the “Board” or the “Trustees”), including the Trustees who are not “interested persons” of the Trust within the meaning of the Investment Company Act of 1940, as amended (the “Independent Trustees”), evaluated a proposal to approve (i) the Investment Advisory Agreement (the “HVAL Advisory Agreement”) between the Trust and ALPS Advisors, Inc. (the “Adviser” or “AAI”) with respect to the ALPS Hillman Active Value ETF (“HVAL” or the “Fund”) and (ii) the Investment Sub-Advisory Agreement (the “HCM Sub-Advisory Agreement”) between the Trust or AAI and Hillman Capital Management, Inc. (the “Sub-Adviser” or “HCM”) with respect to the Fund. The Independent Trustees also met separately to consider each Investment Advisory Agreement and Investment Sub-Advisory Agreement.
In evaluating the HVAL Advisory Agreement, the Board, including the Independent Trustees, considered various factors, including (i) the nature, extent and quality of the services expected to be provided by the Adviser to HVAL under the HVAL Advisory Agreement; (ii) the advisory fees and other expenses proposed to be paid by HVAL compared to those of similar funds managed by other investment advisers; (iii) the expected costs of the services to be provided to HVAL and the projected profitability to be realized by the Adviser and its affiliates from the Adviser’s relationship with HVAL; (iv) the extent to which economies of scale would be realized if and as HVAL’s assets increase and whether the fee level in the HVAL Advisory Agreement reflects these economies of scale for the benefit of shareholders; and (v) any additional benefits and other considerations.
With respect to the nature, extent and quality of the services to be provided by the Adviser under the HVAL Advisory Agreement, the Board, including the Independent Trustees, considered and reviewed information concerning the services proposed to be provided under the HVAL Advisory Agreement, the proposed investment strategy, financial information regarding the Adviser and its parent company, information describing the Adviser’s current organization and the background and experience of the persons who would be responsible for the day-to-day management of HVAL, the anticipated financial support of HVAL, and the nature and quality of services provided to other ETFs, open-end and closed-end funds sponsored by the Adviser. Based upon their review, the Board, including the Independent Trustees, concluded that the Adviser was qualified to oversee the services to be provided by other service providers and that the services to be provided by the Adviser to HVAL are expected to be satisfactory.
With respect to the costs of services to be provided and profits to be realized by the Adviser, the Board, including the Independent Trustees, considered the resources involved in managing HVAL as well as the fact that the Adviser agreed to pay all of HVAL’s expenses (except for interest expenses, distribution fees or expenses, brokerage expenses, taxes and extraordinary expenses such as litigation and other expenses not incurred in the ordinary course of HVAL’s business) out of the unitary advisory fee. Based on their review, the Board, including the Independent Trustees, concluded that the expected profitability of HVAL to the Adviser was not unreasonable.
The Board, including the Independent Trustees, also reviewed comparative fee and expense data provided by FUSE regarding HVAL. The Trustees noted the proposed advisory fee for services to be provided to HVAL by the Adviser was 0.55% of HVAL’s average daily net assets. The Trustees also considered that the advisory fee with respect to HVAL was a unitary one and that, as set forth above, the Adviser had agreed to pay all of HVAL’s expenses (except for interest expenses, marketing fees, distribution fees or expenses, brokerage expenses, taxes and extraordinary expenses such as litigation and other expenses not incurred in the ordinary course of HVAL’s business) out of the unitary fee. The Board, including the Independent Trustees, considered that, taking into account the impact of HVAL’s unitary advisory fee, HVAL’s expense ratio was below the median of both of its FUSE gross advisory fees peer group and total net expenses peer group. Based on the foregoing and the other information available to them, the Board, including the Independent Trustees, concluded that the advisory fees for HVAL were reasonable under the circumstances and in light of the quality of services to be provided.
The Board, including the Independent Trustees, also considered other benefits that may be realized by the Adviser from its relationship with HVAL and concluded that the advisory fees were reasonable taking into account such benefits.
The Board, including the Independent Trustees, considered the extent to which economies of scale would be realized as HVAL grows and whether fee levels reflect a reasonable sharing of such economies of scale for the benefit of HVAL investors. Because HVAL is newly organized, the Trustees reviewed HVAL’s proposed unitary advisory fee and anticipated expenses and determined to review economies of scale in the future when HVAL had attracted assets.
In voting to approve the HVAL Advisory Agreement, the Board, including the Independent Trustees, concluded that the terms of the HVAL Advisory Agreement are reasonable and fair in light of the services to be performed, the fees paid by certain other funds, expenses to be incurred and such other matters as the Board, including the Independent Trustees, considered relevant in the exercise of their reasonable business judgment. The Board, including the Independent Trustees, did not identify any single factor or group of factors as all important or controlling and considered all factors together.
17 | November 30, 2021
ALPS Hillman Active Value ETF
| Board Considerations Regarding Approval of Investment Advisory Agreements | November 30, 2021 (Unaudited) |
HCM Sub-Advisory Agreement
In evaluating the HCM Sub-Advisory Agreement, the Board, including the Independent Trustees considered various factors, including (i) the nature, extent and quality of the services expected to be provided by HCM with respect to HVAL under the HCM Sub-Advisory Agreement; (ii) the advisory fees and other expenses proposed to be paid by HVAL compared to those of similar funds managed by other investment advisers; (iii) the projected profitability to HCM of its proposed sub-advisory relationship with HVAL and the reasonableness of compensation to HCM (iv) the extent to which economies of scale would be realized if, and as, HVAL’s assets increase, and whether the fee level in the HCM Sub-Advisory Agreement reflects these economies of scale; and (v) any additional benefits and other considerations.
With respect to the nature, extent and quality of the services to be provided by HCM under the HCM Sub-Advisory Agreement, the Board, including the Independent Trustees considered and reviewed information concerning the services to be provided under the HCM Sub-Advisory Agreement, the proposed investment strategy, financial information regarding HCM, information describing HCM’s current organization and the background and experience of the persons who would be responsible for the day-to-day management of HVAL. Based upon their review, the Board, including the Independent Trustees concluded that HCM was qualified to oversee the portfolio management of HVAL. The Board, including the Independent Trustees considered that the contractual sub-advisory fee to be paid to HCM is 0.25% of HVAL’s average daily net assets out of a total management fee of 0.55% with respect to HVAL. Based on the consideration of all factors deemed relevant by them, the Board, including the Independent Trustees concluded that the sub-advisory fees to be received by HCM under the HCM Sub-Advisory Agreement are reasonable under the circumstances and in light of the quality of services provided.
With respect to the costs of services provided and profits realized by HCM, the Board, including the Independent Trustees considered the resources involved in managing HVAL. Based on their review of the projected profitability of HVAL to HCM, the Board, including the Independent Trustees, concluded that the projected profitability of HVAL to HCM was not unreasonable.
The Board, including the Independent Trustees also considered other benefits that have been and may be realized by HCM from its relationships with HVAL and concluded that the sub-advisory fees with respect to HVAL were reasonable taking into account such benefits.
In voting to approve the HCM Sub-Advisory Agreement, the Board, including the Independent Trustees concluded that the terms of the HCM Sub-Advisory Agreement are reasonable and fair in light of the services to be performed, expenses to be incurred and such other matters as the Board, including the Independent Trustees considered relevant in the exercise of their reasonable business judgment. The Board, including the Independent Trustees did not identify any single factor or group of factors as all important or controlling and considered all factors together.
In voting to approve the Distribution Agreement, the Board, including the Independent Trustees concluded that the terms of Distribution Agreement are reasonable and fair in light of the services to be performed, expenses to be incurred and such other matters as the Board, including the Independent Trustees considered relevant in the exercise of their reasonable business judgment. The Board, including the Independent Trustees did not identify any single factor or group of factors as all important or controlling and considered all factors together.
18 | November 30, 2021
ALPS Hillman Active Value ETF
| Trustees & Officers | November 30, 2021 (Unaudited) |
The general supervision of the duties performed by the Adviser for the Fund under the Investment Advisory Agreement is the responsibility of the Board of Trustees. The Trust currently has four Trustees. Three Trustees have no affiliation or business connection with the Adviser or any of its affiliated persons and do not own any stock or other securities issued by the Adviser. These are the “non-interested” or “independent” Trustees (“Independent Trustees”). The other Trustee (the “Interested Trustee”) is affiliated with the Adviser.
The Independent Trustees of the Trust, their term of office and length of time served, their principal business occupations during the past five years, the number of portfolios in the Fund Complex overseen by each Independent Trustee, and other directorships, if any, held by the Trustee are shown below.
INDEPENDENT TRUSTEES
| Name, Address & Year of Birth* | Position(s) Held with Trust | Term of Office and Length of Time Served** | Principal Occupation(s) During Past 5 Years | Number of Portfolios in Fund Complex Overseen by Trustees*** | Other Directorships Held by Trustees |
Mary K. Anstine,
1940 | Trustee | Since March 2008 | Ms. Anstine is Trustee/Director of AV Hunter Trust and Colorado Uplift Board. | 36 | Ms. Anstine is a Trustee of ALPS Variable Investment Trust (7 funds); Financial Investors Trust (32 funds); Reaves Utility Income Fund; and Segall Bryant & Hamill Trust (14 funds). |
Jeremy W. Deems,
1976 | Trustee | Since March 2008 | Mr. Deems is the Co-Founder and Chief Financial Officer of Green Alpha Advisors, LLC, a registered investment advisor, and Co-Portfolio Manager of the Shelton Green Alpha Fund. | 36 | Mr. Deems is a Trustee of ALPS Variable Investment Trust (7 funds); Financial Investors Trust (32 funds); and Reaves Utility Income Fund; and Clough Funds Trust (1 fund). |
Rick A. Pederson,
1952 | Trustee | Since March 2008 | Mr. Pederson is Partner, Bow River Capital Partners (private equity management), 2003 - present; Board Member, Prosci Inc. (private business services) 2013-2016; Advisory Board Member, Citywide Banks (Colorado community bank) 2014-2017; Board Member, Strong-Bridge Consulting, 2015-2019; Board Member, IRI/ODMS Holdings LLC, 2017-2019; Director, National Western Stock Show (not for profit) 2010 - present; Director, History Colorado (not for profit) 2015-present; Director, Citywide Bank Advisory Board 2017-present; Trustee, Boettcher Foundation, 2018 -present. | 19 | Mr. Pederson is Trustee of Segall Bryant & Hamill Trust (14 funds) and Principal Real Estate Income Fund (1 fund). |
| * | The business address of the Trustee is c/o ALPS Advisors, Inc., 1290 Broadway, Suite 1000, Denver, Colorado 80203. |
| ** | This is the period for which the Trustee began serving the Trust. Each Trustee serves an indefinite term, until his successor is elected. |
| *** | The Fund Complex includes all series of the Trust and any other investment companies for which ALPS Advisors, Inc. provides investment advisory services. |
19 | November 30, 2021
ALPS Hillman Active Value ETF
| Trustees & Officers | November 30, 2021 (Unaudited) |
The Trustee who is an “interested person” of the Trust, his term of office and length of time served, his principal business occupations during the past five years, the number of portfolios in the Fund Complex overseen by the Interested Trustee and the other directorships, if any, held by the Trustee, are shown below.
INTERESTED TRUSTEE
| Name, Address and Year of Birth of Interested Trustee* | Position(s) Held with Trust | Term of Office and Length of Time Served** | Principal Occupation(s) During Past 5 Years | Number of Portfolios in Fund Complex Overseen by Trustees*** | Other Directorships Held by Trustees |
| Edmund J. Burke, 1961 | Trustee | Since December 2017. | Mr. Burke joined ALPS in 1991 and served as the President and Director of ALPS Holdings, Inc., and ALPS Advisors, Inc. (“AAI”), and Director of ALPS Distributors, Inc. (“ADI”), ALPS Fund Services, Inc. (“AFS”), and ALPS Portfolio Solutions Distributor, Inc. (“APSD”). Mr. Burke retired from ALPS in June 2019. | 31 | Mr. Burke is a Trustee of Clough Global Dividend and Income Fund (1 fund); Clough Global Equity Fund (1 fund); Clough Global Opportunities Fund (1 fund); Clough Funds Trust (1 fund); Liberty All-Star Equity Fund (1 fund); Director of the Liberty All- Star Growth Fund, Inc. (1 fund) and Financial Investors Trust (32 funds). |
| * | The business address of the Trustee is c/o ALPS Advisors, Inc., 1290 Broadway, Suite 1000, Denver, Colorado 80203. Effective December 1, 2021, Mr. Burke is an Independent Trustee of the Trust. |
| ** | This is the period for which the Trustee began serving the Trust. Each Trustee serves an indefinite term, until his successor is elected. |
| *** | The Fund Complex includes all series of the Trust and any other investment companies for which ALPS Advisors, Inc. provides investment advisory services. |
20 | November 30, 2021
ALPS Hillman Active Value ETF
| Trustees & Officers | November 30, 2021 (Unaudited) |
OFFICERS
| Name, Address and Year of Birth of Officer* | Position(s) Held with Trust | Length of Time Served** | Principal Occupation(s) During Past 5 Years |
Laton Spahr,
1975 | President | Since June 2021 | Mr. Spahr joined ALPS in 2019 and currently serves as President and Portfolio Manager of AAI. Prior to his current role, Mr. Spahr was a Senior Vice President and Strategy Leader of the Value & Income Team for Oppenheimer Funds from 2013 to 2019. |
Matthew Sutula,
1985 | Chief Compliance Officer (“CCO”) | Since December 2019 | Mr. Sutula joined ALPS in 2012 and currently serves as Chief Compliance Officer of AAI. Prior to his current role, Mr. Sutula served as interim Compliance Officer of the Trust (September 2019 to December 2019). Compliance Manager and Senior Compliance Analyst for AAI, as well as Compliance Analyst for AFS. Prior to joining ALPS, he spent seven years at Morningstar, Inc. in various analyst roles supporting the registered investment company databases. Mr. Sutula is also Chief Compliance Officer of Principal Real Estate Income Fund, ALPS Variable Investment Trust, RiverNorth Opportunities Fund, Inc., Liberty All-Star Equity Fund and Liberty All-Star Growth Fund, Inc. |
Kathryn Burns,
1976 | Treasurer | Since September 2018 | Ms. Burns serves as Vice President, Director of Fund Operations of AAI since 2018. From 2013 to 2018, she served as Vice President and Fund Controller at AFS. Prior to joining ALPS, she worked at Old Mutual Capital where she served as Vice President and Chief Compliance Officer (2010 – 2012) and Regulatory Reporting Manager and Assistant Treasurer to the Old Mutual Funds Trusts (2006 – 2012). She also served as a CPA for PricewaterhouseCoopers LLP. Ms. Burns also serves as President of ALPS Variable Investment Trust, Principal Real Estate Income Fund and RiverNorth Opportunities Fund, Inc. From June 2018 to November 2021 she also served as Treasurer of Boulder Growth & Income Fund, Inc. |
Brendan Hamill,
1986 | Secretary | Since September 2021 | Mr. Hamill joined ALPS in August 2021, and is currently Vice President and Principal Legal Counsel. Prior to joining ALPS, Mr. Hamill was an attorney at Lewis Brisbois Bisgaard & Smith, LLP (law firm) (December 2018-August 2021) and Vedder Price, P.C. (law firm) (August 2015-December 2018). Mr. Hamill also serves as Secretary of Financial Investors Trust, Secretary of ALPS Variable Investment Trust, Secretary of Principal Real Estate Income Fund, and Assistant Secretary of James Advantage Funds. |
| * | The business address of each Officer is c/o ALPS Advisors, Inc., 1290 Broadway, Suite 1000, Denver, Colorado 80203. Each Officer is deemed an affiliate of the Trust as defined under the 1940 Act. |
| ** | This is the period for which the Officer began serving the Trust. Each Officer serves an indefinite term, until his/her successor is elected. |
The Statement of Additional Information includes additional information about the Fund’s Trustees and is available, without charge, upon request by calling (toll-free) 1-866-759-5679.
21 | November 30, 2021


Table of Contents
| Performance Overview | |
| ALPS Clean Energy ETF | 1 |
| ALPS Disruptive Technologies ETF | 4 |
| ALPS Global Travel Beneficiaries ETF | 7 |
| ALPS Medical Breakthroughs ETF | 10 |
| Disclosure of Fund Expenses | 13 |
| Report of Independent Registered Public Accounting Firm | 14 |
| Financial Statements | |
| Schedule of Investments | |
| ALPS Clean Energy ETF | 15 |
| ALPS Disruptive Technologies ETF | 17 |
| ALPS Global Travel Beneficiaries ETF | 19 |
| ALPS Medical Breakthroughs ETF | 21 |
| Statements of Assets and Liabilities | 23 |
| Statements of Operations | 24 |
| Statements of Changes in Net Assets | |
| ALPS Clean Energy ETF | 25 |
| ALPS Disruptive Technologies ETF | 26 |
| ALPS Global Travel Beneficiaries ETF | 27 |
| ALPS Medical Breakthroughs ETF | 28 |
| Financial Highlights | 29 |
| Notes to Financial Statements | 33 |
| Additional Information | 42 |
| Board Considerations Regarding Approval of Investment Advisory Agreements | 46 |
| Trustees & Officers | 48 |
alpsfunds.com
| ALPS Clean Energy ETF | |
| Performance Overview | November 30, 2021 (Unaudited) |
Investment Objective
The ALPS Clean Energy ETF (the “Fund” or “ACES”) seeks investment results that correspond (before fees and expenses) generally to the performance of its underlying index, the CIBC Atlas Clean Energy Total Return Index (ticker symbol NACEX) (the “Underlying Index”). The Underlying Index utilizes a rules-based methodology developed by CIBC National Trust Company, which is designed to provide exposure to a diverse set of U.S. and Canadian companies involved in the clean energy sector including renewables and clean technology.
The Fund employs a “passive management” – or indexing – investment approach designed to track the performance of the Underlying Index. The Underlying Index utilizes a rules-based methodology developed by CIBC National Trust Company (the “Index Provider”), which is designed to provide exposure to a diverse set of U.S. and Canadian companies involved in the clean energy sector including renewables and clean technology. The clean energy sector is comprised of companies that provide the products and services that enable the evolution of a more sustainable energy sector. Clean energy business segments include, but are not limited to, the following activities: (i) renewable energy sources, including solar power, wind power, hydroelectricity, geothermal energy, biomass, biofuels, and tidal/wave energy, (ii) clean technologies, including electric vehicles, energy storage, lithium, fuel cell, smart grid, and energy efficiency technologies and (iii) other emerging clean energy activities and technologies. The Underlying Index is compiled by the Index Provider and may be comprised of U.S. or Canadian companies. In order to be eligible for inclusion in the Underlying Index, a company’s stock must be traded on one or more major U.S. or Canadian securities exchanges, be based in the U.S. or in Canada, have a minimum float-adjusted market capitalization and minimum average daily trading value thresholds established by the index rulebook of at least $300 million, and have a minimum median average daily trading liquidity of greater than $3 million over the last 60 trading days prior to the selection date, and the company must derive a majority of its value from clean energy business segments (as defined above). Such eligible companies shall be defined as the “Index Universe.” All equity securities meeting the above criteria are selected for inclusion in the Index Universe. The Underlying Index is reconstituted and rebalanced quarterly on the third Friday in March, June, September and December.
Performance Overview
The ALPS Clean Energy ETF for the twelve-month period ended November 30, 2021, generated a total return of 6.16%. Performance was in-line with the Fund’s Underlying Index, net of fees, which returned 6.57%. The Fund underperformed the S&P 1000 Total Return Index, which returned 27.91% for the same period.
The S&P 500 Total Return Index returned 27.92% for the trailing twelve-month (TTM) period ended November 30, 2021, finishing near its all-time high. Unmoved by persistent talks of inflation and policy changes, markets surged without significant drawdowns until September. October proved resilient, as the drawdown was met by a swift bounce back to all-time-highs for most of the averages. Main macroeconomic talking points throughout 2021 centered on inflation and the question of how transitory price increases would turn out to be. Inflation fears continued to be justified with the Consumer Price Index (CPI) surging 6.2% in October, along with core inflation readings increasing 4.6% for the same month; both indicators notching their largest increases since December 1990, and August 1991, respectively. Federal Reserve Chairman Powell was quick to reassure markets of the non-persistent inflation narrative throughout 2021 and announced a taper and reduction of balance sheet purchases starting in November of ‘21. Although the Fed plans to complete tapering before any rate hikes in 2022, projections of the magnitude for said rate increases vary, as global supply chain woes and the newly discovered COVID-19 Omicron variant do not ensure a future without added policy support. Despite a murky economic landscape for 2021 and heading into the New Year, global GDP surpassed pre-pandemic levels in 2021, aided by policy support and strong consumer spending. Record profit margins for U.S. corporations led the way for record valuations through most of the year, but were matched by an earnings season in Q3 where many companies cut forward-looking expectations amid a slowing global growth outlook.
2021 saw an acceleration of clean energy adoption and mandates driven by legislation. The Biden Administration has set forth initiatives to decarbonize the electric sector by 2035, setting the precedent for further infrastructure spending and tax credits aimed at achieving the lofty goals. The $1 trillion Bipartisan Infrastructure Bill was signed into law in November, with specific mandates targeting the funds towards initiatives that will reduce U.S. emissions by 50-52% from 2005 levels in 2030, and to create a 100% carbon pollution-free power sector by 2035. Electric vehicles stole the spotlight throughout the year with Tesla outperforming competitors and IPOs from the likes of Rivian and Lucid Motors. It is likely that North America will see more policy support targeted at clean energy infrastructure in the near future, as projections call for immediate increases in policy action in order to meet a net-zero global fleet by 2050.
The best performing stocks in the Fund for the period were Ameresco Inc., Class A (AMRC), which increased 72.91%, Enviva Partners LP (EVA), which saw a gain of 63.43%, and Tesla, Inc. (TSLA), which rose 62.22%. The largest detractors were Workhorse Group, Inc. (WKHS), which decreased 70.48%, XEBEC Adsorption, Inc. (XBC CN), which fell 68.48%, and TPI Composites, Inc. (TPIC), which lost 66.22%.
ACES Underlying Index has a differentiated approach to investing in the clean energy sector. First, by narrowing the list of constituents to companies whose primary operations are focused on clean energy, the Fund offers more pure-play exposure to the clean energy sector. Second, constituents are diversified across the sector and offer exposure to the full opportunity set of the transition from fossil fuels to renewable energy. Lastly, focusing on U.S. and Canadian-based companies helps to further minimize the risk of investing in a global industry by reducing risks related to foreign holdings, including currency exchange rates, financial disclosures, and regulatory and policy changes.
| ALPS Clean Energy ETF | |
| Performance Overview | November 30, 2021 (Unaudited) |
Fund Performance (as of November 30, 2021)
| | 1 Year | 3 Year | Since Inception^ |
| ALPS Clean Energy ETF - NAV | 6.16% | 45.38% | 38.92% |
| ALPS Clean Energy ETF - Market Price* | 6.07% | 45.08% | 38.91% |
| S&P 1000® Total Return Index | 27.91% | 14.32% | 11.21% |
| CIBC Atlas Clean Energy Total Return Index | 6.57% | 45.89% | 39.75% |
Total Expense Ratio (per the current prospectus) is 0.55%.
Performance data quoted represents past performance. Past performance does not guarantee future results. Total return figures assume reinvestment of dividends and capital gains distributions, if any. The table does not reflect the deduction of taxes that a shareholder would pay on Fund distributions or the redemption of Fund shares. Investment return and principal value of an investment will fluctuate so that an investor’s shares, when sold or redeemed, may be worth more or less than the original cost. Current performance data may be higher or lower than actual data quoted. For the most current month-end performance data please visit www.alpsfunds.com or call 1.866.759.5679.
NAV is an exchange-traded fund’s per-share value. The per-share dollar amount of the fund is derived by dividing the total value of all the securities in its portfolio, less any liabilities, by the number of fund shares outstanding. Market Price is the price at which a share can currently be traded in the market. Information detailing the number of days the Market Price of the Fund was greater than the Fund’s NAV and the number of days it was less than the Fund’s NAV can be obtained at www.alpsfunds.com.
| ^ | The Fund commenced operations on June 28, 2018, with the first day of trading on the exchange of June 29, 2018. |
| * | Market Price means the official closing price of a share or, if it more accurately reflects the market value of a share at the time as of which the Fund calculates current net asset value per share, the price that is the midpoint of the bid-ask spread as of that time. It does not represent the returns an investor would receive if shares were traded at other times. |
CIBC Atlas Clean Energy Total Return Index is an adjusted market cap weighted index designed to provide exposure to a diverse set of U.S. or Canadian based companies involved in the clean energy sector including renewables and clean technology. The clean energy sector is comprised of companies that provide the products and services which enable the evolution of a more sustainable energy sector. Clean energy business segments include but are not limited to: solar, wind, hydro, geothermal, electric vehicles, LED, biomass, smart grid, energy efficiency and storage. Total return assumes reinvestment of any dividends and distributions realized during a given time period.
The S&P 1000® Total Return Index combines the S&P MidCap 400® and the S&P SmallCap 600® to form an investable benchmark for the mid- to small-cap segment of the U.S. equity market. Total return assumes reinvestment of any dividends and distributions realized during a given time period.
One cannot invest directly in an index. Index performance does not reflect fund performance.
The Fund’s shares are not individually redeemable. Investors buy and sell shares of the Fund on a secondary market. Only market makers or “authorized participants” may trade directly with the Fund, typically in blocks of 25,000 shares.
The ALPS Clean Energy ETF is not suitable for all investors. Investments in the Fund are subject to investment risks, including possible loss of the principal amount invested.
ALPS Portfolio Solutions Distributor, Inc., a FINRA member, is the Distributor for the ALPS Clean Energy ETF.
| ALPS Clean Energy ETF | |
| Performance Overview | November 30, 2021 (Unaudited) |
Top Ten Holdings* (as of November 30, 2021)
| Tesla, Inc. | 7.42% |
| Plug Power, Inc. | 7.18% |
| Enphase Energy, Inc. | 6.84% |
| First Solar, Inc. | 5.24% |
| NextEra Energy Partners LP | 5.00% |
| Sunrun, Inc. | 4.81% |
| Northland Power, Inc. | 4.19% |
| Brookfield Renewable Partners LP | 4.15% |
| Hannon Armstrong Sustainable Infrastructure Capital, Inc. | 4.08% |
| ChargePoint Holdings, Inc. | 4.05% |
| Total % of Top 10 Holdings | 52.96% |
| * | % of Total Investments (excluding investments purchased with collateral from securities loaned) |
Future holdings are subject to change.
Clean Energy Segment Allocation* (as of November 30, 2021)
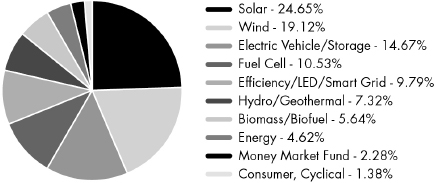
Growth of $10,000 (as of November 30, 2021)
Comparison of change in value of a $10,000 investment in the Fund and the Index
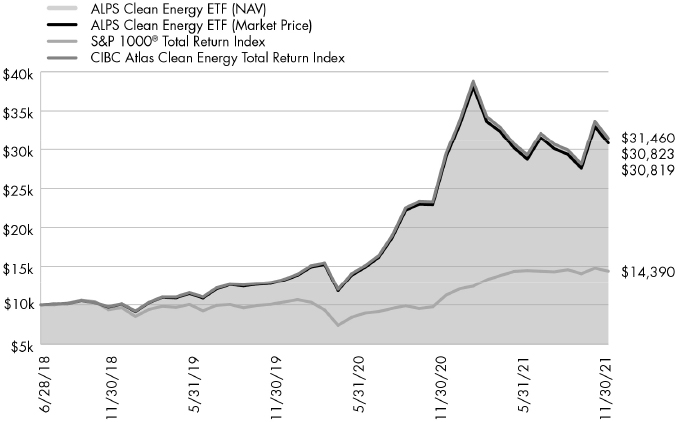
The chart above compares historical performance of a hypothetical investment of $10,000 in the Fund since inception with the performance of the Fund’s benchmark index. Results include the reinvestment of all dividends and capital gains distributions. Past performance does not guarantee future results. The chart does not reflect the deduction of taxes that a shareholder would pay on Fund distributions or the redemption of Fund shares.
| ALPS Disruptive Technologies ETF | |
| Performance Overview | November 30, 2021 (Unaudited) |
Investment Objective
ALPS Disruptive Technologies ETF (the “Fund” or “DTEC”) seeks investment results that correspond (before fees and expenses) generally to the performance of the Indxx Disruptive Technologies Net Total Return Index (ticker symbol IDTEC) (the “Underlying Index”). The Fund will invest at least 80% of its net assets in securities that comprise the Underlying Index.
The Fund employs a “passive management” – or indexing – investment approach designed to track the performance of the Underlying Index. The Underlying Index utilizes a rules-based methodology developed by Indxx, LLC (the “Index Provider”), which is designed to identify the companies using disruptive technologies in each of ten thematic areas: Healthcare Innovation, Internet of Things, Clean Energy and Smart Grid, Cloud Computing, Data and Analytics, FinTech, Robotics and Artificial Intelligence, Cybersecurity, 3D Printing, and Mobile Payments (each a “Theme” and together, the “Themes”). Companies using disruptive technologies are those that are entering traditional markets with new digital forms of production and distribution, seek to disrupt an existing market and value network, displace established market-leading firms, products and alliances and increasingly gain market share. The Underlying Index is compiled by the Index Provider and may be comprised of U.S. and non-U.S. companies, including foreign and emerging markets companies. In order to be eligible for inclusion in the Underlying Index’s Index Universe, a company’s stock must be traded on one or more major global securities exchanges, have a minimum market capitalization of at least $500 million, and have a six month minimum average daily trading volume of $2 million, and the company must derive a minimum of 50% of its revenue from a single Theme. All equity securities meeting the above criteria are selected for inclusion in the Index Universe. From the Index Universe, the Underlying Index methodology selects ten stocks in each Theme according to proprietary quantitative and qualitative factors. The eligible stocks that are selected for inclusion in the Underlying Index’s portfolio are equally weighted. The Underlying Index is reconstituted annually on the third Friday of September and rebalanced quarterly.
Performance Overview
The ALPS Disruptive Technologies ETF for the twelve-month period ended November 30, 2021, generated a total return of 12.60%. Performance was in-line with the Fund’s Underlying Index, net of fees, which returned 12.79%. The Fund underperformed the Morningstar Global Markets Index, which returned 18.76% for the same period.
The S&P 500 Total Return Index returned 27.92% for the trailing twelve-month (TTM) period ended November 30, 2021, finishing near its all-time high. Unmoved by persistent talks of inflation and policy changes, markets surged without significant drawdowns until September. October proved resilient, as the drawdown was met by a swift bounce back to all-time-highs for most of the averages. Main macroeconomic talking points throughout 2021 centered on inflation and the question surrounding how transitory price increases would turn out to be. Inflation fears continued to be justified with the Consumer Price Index (CPI) surging 6.2% in October, along with core inflation readings increasing 4.6% for the same month; both indicators notching their largest increases since December 1990, and August 1991, respectively. Federal Reserve Chairman Powell was quick to reassure markets of the non-persistent inflation narrative throughout 2021 and announced a taper and reduction of balance sheet purchases starting in November of ‘21. Although the Fed plans to complete tapering before any rate hikes in 2022, projections of the magnitude for rate increases vary, as global supply chain woes and the newly discovered Omicron variant do not ensure a future without added policy support. Despite a murky outlook for 2021 and heading into the New Year, global GDP surpassed pre-pandemic levels in 2021, aided by policy support and strong consumer spending. Record profit margins for U.S. corporations led the way for record valuations through most of the year, but was matched by an earnings season in Q3 where many companies cut forward-looking expectations amid a slowing global growth outlook.
DTEC outperformed the Morningstar Global Markets Index, which returned 18.76% for the trailing twelve-month period ended November 30, 2021. DTEC holds roughly 65% U.S. equities and 35% foreign. The U.S. Dollar strengthened relative to the Euro, however ex-U.S. markets did not see the historical drop in performance from the move. Similar to the U.S., Eurozone markets saw a strong earnings season and ongoing economic recovery from the pandemic. Value outperformed growth equities internationally for the majority of the year, with the gap in performance closing in recent months. Future growth prospects remain optimistic, predicated on lessening travel restrictions and temporary higher inflation. DTEC’s higher weight to the Information Technology sector has helped buoy its performance over broad-based indices.
Disruptive technologies pave the way for a brighter future through innovation and fundamentally alter the way industries operate. Furthermore, the potential to capture returns within different disruptive technology themes is compelling, and offers potential to supercharge a portfolio. DTEC employs an equal weighted strategy to its disruptive themes, resulting in 10 sub-themes (3D Printing, Clean Energy & Smart Grid, Cloud Computing, Cybersecurity, Data & Analytics, FinTech, Healthcare Innovation, Internet of Things, Mobile Payments, Robotics & AI), each with a 10% holding. The Fund picks the top 10 names from its universe that most represent the specific theme. 6 of the 10 DTEC themes were positive this year, with the Data & Analytics theme being the largest performance contributor at 2.83%. Cybersecurity was the second largest positive contributor, adding 2.65% to the portfolio return. Within that theme, Fortinet, Inc. (FTNT), a security network provider, had the largest individual equity performance, returning a whopping 123.6%, and contributing 0.91% to the Fund performance. The worst performing thematic category was Mobile Payments, detracting -1.38% from portfolio performance. StoneCo, Ltd. (STNE), a Brazilian payments firm, was the worst performer in the theme, losing -81.31% and detracting -1.24%.
Looking forward, the Fund’s strategy of selecting the top disruptive themes in the market today will provide exposure to areas of the market the Adviser believes will be high-growth relative to the Morningstar Global Markets Index.
| ALPS Disruptive Technologies ETF | |
| Performance Overview | November 30, 2021 (Unaudited) |
Fund Performance (as of November 30, 2021)
| | 1 Year | 3 Year | Since Inception^ |
| ALPS Disruptive Technologies ETF - NAV | 12.60% | 23.02% | 18.48% |
| ALPS Disruptive Technologies ETF - Market Price* | 12.61% | 23.04% | 18.50% |
| Indxx Disruptive Technologies Net Total Return Index | 12.79% | 23.27% | 18.77% |
| Morningstar® Global Markets Net Return Index | 18.76% | 15.51% | 10.80% |
Total Expense Ratio (per the current prospectus) is 0.50%.
Performance data quoted represents past performance. Past performance does not guarantee future results. Total return figures assume reinvestment of dividends and capital gains distributions, if any. The table does not reflect the deduction of taxes that a shareholder would pay on Fund distributions or the redemption of Fund shares. Investment return and principal value of an investment will fluctuate so that an investor’s shares, when sold or redeemed, may be worth more or less than the original cost. Current performance data may be higher or lower than actual data quoted. For the most current month-end performance data please visit www. alpsfunds.com or call 1.866.759.5679.
NAV is an exchange-traded fund’s per-share value. The per-share dollar amount of the fund is derived by dividing the total value of all the securities in its portfolio, less any liabilities, by the number of fund shares outstanding. Market Price is the price at which a share can currently be traded in the market. Information detailing the number of days the Market Price of the Fund was greater than the Fund’s NAV and the number of days it was less than the Fund’s NAV can be obtained at www.alpsfunds.com.
| ^ | The Fund commenced operations on December 28, 2017, with the first day of trading on the exchange of December 29, 2017. |
| * | Market Price means the official closing price of a share or, if it more accurately reflects the market value of a share at the time as of which the Fund calculates current net asset value per share, the price that is the midpoint of the bid-ask spread as of that time. It does not represent the returns an investor would receive if shares were traded at other times. |
Indxx Disruptive Technologies Net Total Return Index (Ticker: IDTEC) is based around companies that enter traditional markets with new digital forms of production and distribution, are likely to disrupt an existing market and value network, displace established market leading firms, products and alliances and increasingly gain market share. Total Return assumes reinvestment of any dividends and distributions realized during a given time period. Net Total Return (NTR) is obtained by reinvesting the net dividend, which is equal to the ordinary gross dividend minus the amount of withholding tax.
The Morningstar® Global Markets Net Return Index, measures the performance of the stocks located in the developed and emerging countries across the world. Stocks in the index are weighted by their float capital, which removes corporate cross ownership, government holdings and other locked-in shares.
One cannot invest directly in an index. Index performance does not reflect fund performance.
The Fund’s shares are not individually redeemable. Investors buy and sell shares of the Fund on a secondary market. Only market makers or “authorized participants” may trade directly with the Fund, typically in blocks of 25,000 shares.
The ALPS Disruptive Technologies ETF is not suitable for all investors. Investments in the Fund are subject to investment risks, including possible loss of the principal amount invested.
ALPS Portfolio Solutions Distributor, Inc., a FINRA member, is the Distributor for the ALPS Disruptive Technologies ETF.
| ALPS Disruptive Technologies ETF | |
| Performance Overview | November 30, 2021 (Unaudited) |
Top Ten Holdings* (as of November 30, 2021)
| Tesla, Inc. | 1.62% |
| Silicon Laboratories, Inc. | 1.45% |
| Datadog, Inc. | 1.35% |
| Azenta, Inc | 1.33% |
| Nemetschek SE | 1.32% |
| Zscaler, Inc. | 1.32% |
| SolarEdge Technologies, Inc. | 1.27% |
| Palo Alto Networks, Inc. | 1.25% |
| Intuit, Inc. | 1.22% |
| Kaspi.KZ JSC | 1.21% |
| Total % of Top 10 Holdings | 13.34% |
| * | % of Total Investments (excluding investments purchased with collateral from securities loaned) |
Future holdings are subject to change.
Thematic Allocation* (as of November 30, 2021)
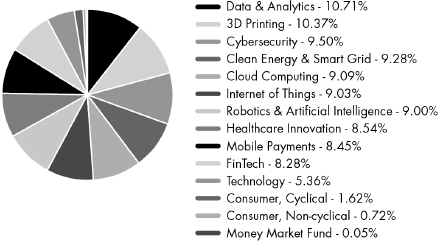
Growth of $10,000 (as of November 30, 2021)
Comparison of change in value of a $10,000 investment in the Fund and the Index
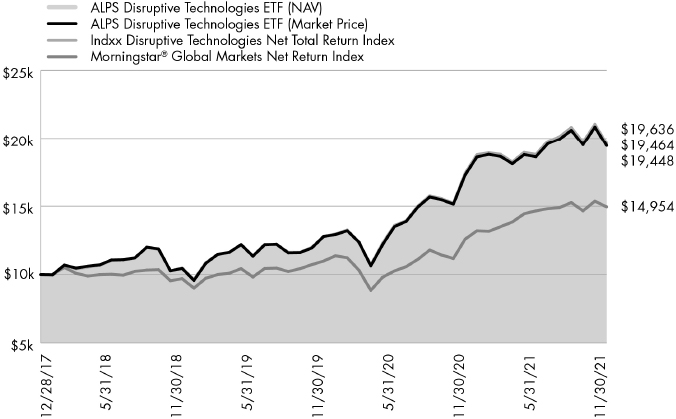
The chart above compares historical performance of a hypothetical investment of $10,000 in the Fund since inception with the performance of the Fund’s benchmark index. Results include the reinvestment of all dividends and capital gains distributions. Past performance does not guarantee future results. The chart does not reflect the deduction of taxes that a shareholder would pay on Fund distributions or the redemption of Fund shares.
| ALPS Global Travel Beneficiaries ETF | |
| Performance Overview | November 30, 2021 (Unaudited) |
Investment Objective
ALPS Global Travel Beneficiaries ETF (the "Fund" or "JRNY") seeks investment results that replicate as closely as possible, before fees and expenses, the performance of the S-Network Global Travel Index (ticker symbol TRAVEL) (the “Underlying Index”).
The Underlying Index uses a rules-based methodology developed by S-Network Global Indexes Inc. (the "Index Provider"), which is designed to identify exchange-traded stocks of companies that are materially engaged in the global travel industry, including four segments: Airlines & Airport Services; Hotels, Casinos, Cruise Lines; Booking & Rental Agencies; and Ancillary Beneficiaries. The Underlying Index is compiled by the Index Provider and may be comprised of U.S. and non-U.S. companies, including foreign and emerging markets companies. In order to be eligible for inclusion in the Underlying Index's Index Universe, a company's stock must be traded on one or more major global securities exchanges and is principally engaged in or derives significant revenue from on of the segments. In addition, a company's stock must have a minimum market capitalization of at least $100 million, a three-month minimum average daily trading volume of $1 million, and a minimum free float factor of 18%. All equity securities meeting the above criteria are selected for inclusion in the Index Universe. From the Index Universe, the Underlying Index methodology selects and weights twenty stocks in each segment, subject to a minimum of one constituent per geographic region (U.S. & Canada, Europe, Pacific (ex-Canada), and Emerging) and a 65% maximum weight per geographic region. The Underlying Index is rebalanced and reconstituted quarterly on the third Friday of the last month in each calendar quarter.
Performance Overview
The ALPS Global Travel Beneficiaries ETF since inception on September 8th, 2021 through the period ended November 30, 2021, generated a total return of -5.34%, in-line with the Fund’s Underlying Index, net of fees, which returned -5.28%. The Fund underperformed the Morningstar Global Markets Index, which returned -2.29% for the same period.
The S&P 500 Total Return Index returned 27.92% for the trailing twelve-month (TTM) period ended November 30, 2021, finishing near its all-time high. Unmoved by persistent talks of inflation and policy changes, markets surged without significant drawdowns until September. October proved resilient, as the drawdown was met by a swift bounce back to all-time-highs for most of the averages. Main macroeconomic talking points throughout 2021 centered on inflation and the question surrounding how transitory price increases would turn out to be. Inflation fears continued to be justified with the Consumer Price Index (CPI) surging 6.2% in October, along with core inflation readings increasing 4.6% for the same month; both indicators notching their largest increases since December 1990, and August 1991, respectively. Federal Reserve Chairman Powell was quick to reassure markets of the non-persistent inflation narrative throughout 2021 and announced a taper and reduction of balance sheet purchases starting in November of ‘21. Although the Fed plans to complete tapering before any rate hikes in 2022, projections of the magnitude for rate increases vary, as global supply chain woes and the newly discovered Omicron variant do not ensure a future without added policy support. Despite a murky outlook for 2021 and heading into the New Year, global GDP surpassed pre-pandemic levels in 2021, aided by policy support and strong consumer spending. Record profit margins for U.S. corporations led the way for record valuations through most of the year, but was matched by an earnings season in Q3 where many companies cut forward-looking expectations amid a slowing global growth outlook.
In terms of global travel, travel companies and beneficiaries are poised to benefit from the continued global re-opening. As of Thanksgiving, airline bookings were up 78% year-over-year and slightly higher than even 2019 numbers. Additionally, both searches and prices for car rentals have jumped significantly from 2019 (up 230%), and 2020 (up 243%). Travel beneficiaries have so far been able to pass the majority of increased costs related to inflation and supply chain disruptions on to consumers, retaining current profit margins. Unfortunately, recent news and spread of the COVID Omicron variant heading into 2022 has weighed global travel beneficiaries, who are sensitive to infection rates. Limited research suggests that Omicron may be more transmissible but less deadly than other variants, giving hope to a continued re-opening trade and minimal travel restrictions over the foreseeable future.
The best-performing stocks in the Fund since inception this year were AVIS Budget Group, Inc. (CAR), which increased 204.12%, and CIE Financiere Richemont SA (CFR SW), which saw a gain of 41.20%. The top-performing JRNY segment was Ancillary Beneficiaries, returning -1.49%. The largest individual detractors were HyreCar, Inc. (HYRE), which decreased 53.47%, Liberty TripAdvisor Holdings, Inc. (LTRPA), which fell 40.50%, and Penn National Gaming, Inc. (PENN), which lost 37.97%.
Looking forward, the Fund’s strategy of identifying companies that are materially engaged in global travel industries including airlines, hotels, casinos and cruise lines, and companies that support and stand to benefit from those industries, is designed to provide a holistic and more diversified exposure to the secular tailwinds in global travel.
| ALPS Global Travel Beneficiaries ETF | |
| Performance Overview | November 30, 2021 (Unaudited) |
Fund Performance (as of November 30, 2021)
| | Since Inception^ |
| ALPS Global Travel Beneficiaries ETF - NAV | -5.34% |
| ALPS Global Travel Beneficiaries ETF - Market Price* | -5.22% |
| S-Network Global Travel Net Total Return Index | -5.28% |
| Morningstar® Global Markets Net Return Index | -2.29% |
Total Expense Ratio (per the current prospectus) is 0.65%.
Performance data quoted represents past performance. Past performance does not guarantee future results. Total return figures assume reinvestment of dividends and capital gains distributions, if any. The table does not reflect the deduction of taxes that a shareholder would pay on Fund distributions or the redemption of Fund shares. Investment return and principal value of an investment will fluctuate so that an investor’s shares, when sold or redeemed, may be worth more or less than the original cost. Current performance data may be higher or lower than actual data quoted. For the most current month-end performance data please visit www. alpsfunds.com or call 1.866.759.5679.
NAV is an exchange-traded fund’s per-share value. The per-share dollar amount of the fund is derived by dividing the total value of all the securities in its portfolio, less any liabilities, by the number of fund shares outstanding. Market Price is the price at which a share can currently be traded in the market. Information detailing the number of days the Market Price of the Fund was greater than the Fund’s NAV and the number of days it was less than the Fund’s NAV can be obtained at www.alpsfunds.com.
| ^ | The Fund commenced operations on September 8, 2021, with the first day of trading on the exchange of September 9, 2021. |
| * | Market Price means the official closing price of a share or, if it more accurately reflects the market value of a share at the time as of which the Fund calculates current net asset value per share, the price that is the midpoint of the bid-ask spread as of that time. It does not represent the returns an investor would receive if shares were traded at other times. |
The Fund is new with limited operating history.
The S-Network Global Travel Net Total Return Index (Ticker: TRAVEL) is an Index of stocks listed on global recognized stock exchanges that are materially engaged in segments of the global travel industry, including Airlines & Airport Services; Hotels, Casinos, and Cruise Lines; Booking & Rental Agencies; and ancillary beneficiaries of global travel. Total Return assumes reinvestment of any dividends and distributions realized during a given time period. Net Total Return (NTR) is obtained by reinvesting the net dividend, which is equal to the ordinary gross dividend minus the amount of withholding tax.
The Morningstar® Global Markets Net Return Index, measures the performance of the stocks located in the developed and emerging countries across the world. Stocks in the index are weighted by their float capital, which removes corporate cross ownership, government holdings and other locked-in shares.
One cannot invest directly in an index. Index performance does not reflect fund performance.
The Fund’s shares are not individually redeemable. Investors buy and sell shares of the Fund on a secondary market. Only market makers or “authorized participants” may trade directly with the Fund, typically in blocks of 25,000 shares.
The ALPS Global Travel Beneficiaries ETF is not suitable for all investors. Investments in the Fund are subject to investment risks, including possible loss of the principal amount invested.
ALPS Portfolio Solutions Distributor, Inc., a FINRA member, is the Distributor for the ALPS Global Travel Beneficiaries ETF.
| ALPS Global Travel Beneficiaries ETF | |
| Performance Overview | November 30, 2021 (Unaudited) |
Top Ten Holdings* (as of November 30, 2021)
| Marriott International, Inc. | 5.12% |
| Hilton Worldwide Holdings, Inc. | 4.95% |
| LVMH Moet Hennessy Louis Vuitton SE | 4.75% |
| The Estee Lauder Company, Inc., Class A | 4.69% |
| American Express Co. | 4.55% |
| L'Oreal SA | 4.52% |
| Booking Holdings, Inc. | 4.30% |
| Cintas Corp. | 4.10% |
| Airbnb, Inc. | 3.99% |
| Walt Disney Co. | 3.71% |
| Total % of Top 10 Holdings | 44.68% |
| * | % of Total Investments (excluding investments purchased with collateral from securities loaned) |
Future holdings are subject to change.
Sector Allocation* (as of November 30, 2021)
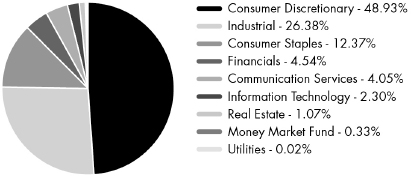
Growth of $10,000 (as of November 30, 2021)
Comparison of change in value of a $10,000 investment in the Fund and the Index
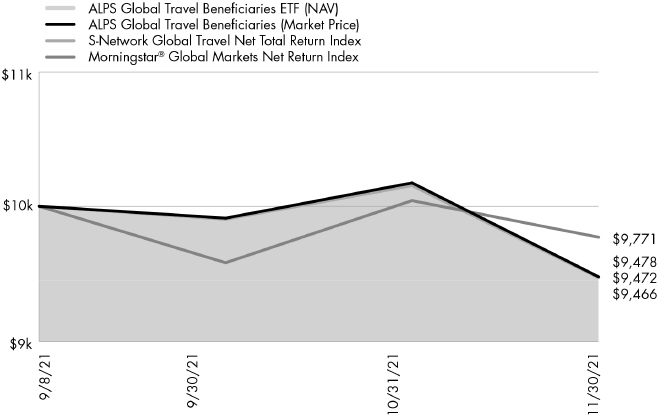
The chart above compares historical performance of a hypothetical investment of $10,000 in the Fund since inception with the performance of the Fund’s benchmark index. Results include the reinvestment of all dividends and capital gains distributions. Past performance does not guarantee future results. The chart does not reflect the deduction of taxes that a shareholder would pay on Fund distributions or the redemption of Fund shares.
| ALPS Medical Breakthroughs ETF | |
| Performance Overview | November 30, 2021 (Unaudited) |
Investment Objective
ALPS Medical Breakthroughs ETF (the “Fund” or “SBIO”) seeks investment results that correspond (before fees and expenses) generally to the performance of the S-Network® Medical Breakthroughs Total Return Index (the “Underlying Index”). The Fund will normally invest at least 80% of its net assets in securities that comprise the Underlying Index (or depository receipts based on such securities).
The Fund employs a “passive management” – or indexing – investment approach designed to track the performance of the Underlying Index. The Underlying Index is comprised of small- and mid-cap stocks of biotechnology companies that have one or more drugs in either Phase II or Phase III of the U.S. Food and Drug Administration ("FDA") clinical trials. In a Phase II trial, the drug is administered to a group of 100-300 people to see if it is effective and to evaluate its safety. In a Phase III trial, the drug is given to a larger group, between 500-3,000 people, to confirm its effectiveness, monitor side effects, compare it to commonly used treatments and collect information that will allow the drug or treatment to be used safely. Stocks selected for inclusion in the Underlying Index must be listed on a U.S. stock exchange. Underlying Index constituents must have a market capitalization of no less than $200 million and no more than $5 billion. Stocks included in the Underlying Index must also sustain an average daily trading volume in excess of $1 million for the 90-day period preceding an Underlying Index reconstitution. Constituents must be able to sustain the monthly rates at which they use shareholder capital ("cash burn rates") for at least 24 months. The Underlying Index is reconstituted semi-annually on the third Fridays of June and December.
Performance Overview
For the twelve-month period ended November 30, 2021, the Fund generated a total return of -12.37%, in-line with the Fund’s Underlying Index, net of fees, which returned -12.11%. The Fund underperformed the broad market, as represented by the S&P 500®, which returned 27.92% for the period, and also underperformed the NASDAQ Biotechnology Total Return Index’s (XNBI Index) return of 5.90% as the small and mid-cap (SMID) biotech companies have seen a less than stellar year in performance compared to 2020.
The S&P 500® returned 27.92% for the trailing twelve-month (TTM) period ended November 30, 2021, finishing near its all-time high. Main macroeconomic talking points throughout 2021 centered on inflation and the question surrounding how transitory price increases would turn out to be. Inflation fears continued to be justified with the Consumer Price Index (CPI) surging 6.2% in October, along with core inflation readings increasing 4.6% for the same month; both indicators notching their largest increases since December 1990, and August 1991, respectively. Despite a murky outlook for 2021 and heading into the New Year, global GDP surpassed pre-pandemic levels in 2021, aided by policy support and strong consumer spending. Record profit margins for U.S. corporations led the way for record valuations through most of the year, but was matched by an earnings season in Q3 where many companies cut forward-looking expectations amid a slowing global growth outlook.
Specifically for the biotech industry, regulatory concerns have weighed on the companies in 2021. Congress has made it clear they will aim to reduce drug pricing, with the most recent effort in the $1.7 trillion social spending bill. Although an argument can be made that lower drug prices will ultimately benefit the consumer, these efforts could potentially slow the pace of innovation for many drug companies. Despite headwinds, the biotech industry’s continued pace of acquisitions and positive treatment results paint an exciting future for drug therapies, and continued innovation. Through the halfway mark of 2021, 49 biotech IPOs had been completed, with the final year–end investment and IPO numbers expected to display the industry heating-up in the back half of the year.
The Fund’s volatility during the year was relatively higher than the S&P 500®, but not unusual for the biotech industry as the space typically caries a higher beta relative to the broad market. The best performing stocks in the Fund for the period were Prothena Corp. PLC (PRTA), Kezar Life Sciences, Inc. (KZR), and Kadmon Holdings Inc. (KDMN), which returned 284.00%, 154.31%, and 138.10%, respectively. In contrast, the worst-performing stocks for the period were Forte Biosciences, Inc. (FBRX), Immunovant, Inc. (IMVT), and Frequency Therapeutics, Inc. (FREQ), which declined 93.18%, 84.59%, and 82.23%, respectively.
Due to the high failure rate of companies within the space, the non-traditional metrics used to evaluate biotech companies, and the technical knowledge required to succeed in the space, biotechnology is a difficult industry for stock pickers. This environment makes a passive strategy attractive, as it provides a diversified, rules- based access vehicle for those looking to gain exposure to the biotechnology space, while mitigating single stock risk. The Fund and its Underlying Index focus on innovation, seeking to capture research and development opportunities in the biotechnology industry. Looking forward, the Fund’s strategy of providing exposure to small and mid-cap biotechnology companies that have one or more drugs in either Phase II or Phase III FDA clinical trials can provide potential alpha and pure-play exposure to the biotech space.
| ALPS Medical Breakthroughs ETF | |
| Performance Overview | November 30, 2021 (Unaudited) |
Fund Performance (as of November 30, 2021)
| | 1 Year | 5 Year | Since Inception^ |
| ALPS Medical Breakthroughs ETF - NAV | -12.37% | 13.22% | 9.08% |
| ALPS Medical Breakthroughs ETF - Market Price* | -12.54% | 13.20% | 9.06% |
| S-Network Medical Breakthroughs Total Return Index | -12.11% | 13.51% | 9.42% |
| NASDAQ Biotechnology Total Return Index | 5.90% | 11.45% | 6.61% |
Total Expense Ratio (per the current prospectus) is 0.50%
Performance data quoted represents past performance. Past performance does not guarantee future results. Total return figures assume reinvestment of dividends and capital gains distributions, if any. Investment return and principal value of an investment will fluctuate so that an investor’s shares, when sold or redeemed, may be worth more or less than the original cost. Current performance data may be higher or lower than actual data quoted. For most current month-end performance data please visit www.alpsfunds.com or call 1.844.234.5852.
NAV is an exchange-traded fund’s per-share value. The per-share dollar amount of the fund is derived by dividing the total value of all the securities in its portfolio, less any liabilities, by the number of fund shares outstanding. Market Price is the price at which a share can currently be traded in the market. Information detailing the number of days the Market Price of the Fund was greater than the Fund’s NAV and the number of days it was less than the Fund’s NAV can be obtained at www.alpsfunds.com.
| ^ | The Fund commenced investment operations on December 31, 2014. |
| * | Market Price means the official closing price of a share or, if it more accurately reflects the market value of a share at the time as of which the Fund calculates current net asset value per share, the price that is the midpoint of the bid-ask spread as of that time. It does not represent the returns an investor would receive if shares were traded at other times. |
NASDAQ Biotechnology Total Return Index (Ticker: NBI) is a modified market capitalization-weighted index designed to measure the performance of all the NASDAQ stocks in the biotechnology sector. Total return assumes reinvestment of any dividends and distributions realized during a given time period.
S-Network Medical Breakthroughs Total Return Index (Ticker: PMBI) is designed to capture research and development opportunities in the biotechnology industry. PMBI consists of small-cap and mid-cap biotechnology stocks listed on U.S. stock exchanges that have one or more drugs in either Phase II or Phase III U.S. FDA clinical trials. Total return assumes reinvestment of any dividends and distributions realized during a given time period.
One cannot invest directly in an index. Index performance does not reflect fund performance.
Companies in the pharmaceuticals and biotechnology industry may be subject to extensive litigation based on product liability and similar claims. Legislation introduced or considered by certain governments on such industries or on the healthcare sector cannot be predicted.
Companies in the pharmaceuticals industry are subject to competitive forces that may make it difficult to raise prices and, in fact, may result in price discounting. The profitability of some companies in the pharmaceuticals industry may be dependent on a relatively limited number of products. In addition, their products can become obsolete due to industry innovation, changes in technologies or other market developments. Many new products in the pharmaceuticals industry are subject to government approvals, regulation and reimbursement rates. The process of obtaining government approvals may be long and costly. Many companies in the pharmaceuticals industry are heavily dependent on patents and intellectual property rights. The loss or impairment of these rights may adversely affect the profitability of these companies.
The development of new drugs generally has a high failure rate, and such failures may negatively impact the stock price of the company developing the failed drug. Biotechnology companies may have persistent losses during a new product’s transition from development to production. In order to fund operations, biotechnology companies may require financing from the capital markets, which may not always be available on satisfactory terms or at all.
The Fund’s shares are not individually redeemable. Investors buy and sell shares of the Fund on a secondary market. Only market makers or “authorized participants” may trade directly with the Fund, typically in blocks of 25,000 shares.
The ALPS Medical Breakthroughs ETF is not suitable for all investors. Investments in the Fund are subject to investment risks, including possible loss of the principal amount invested.
ALPS Portfolio Solutions Distributor, Inc., a FINRA member, is the Distributor for the ALPS Medical Breakthroughs ETF.
ALPS Portfolio Solutions Distributor, Inc. is not affiliated with S-Network Global Indexes, Inc.
| ALPS Medical Breakthroughs ETF | |
| Performance Overview | November 30, 2021 (Unaudited) |
Top Ten Holdings* (as of November 30, 2021)
| Legend Biotech Corp. | 4.75% |
| Vir Biotechnology, Inc. | 3.94% |
| Kodiak Sciences, Inc. | 3.01% |
| Cerevel Therapeutics Holdings, Inc. | 2.88% |
| Karuna Therapeutics, Inc. | 2.41% |
| Apellis Pharmaceuticals, Inc. | 2.33% |
| Alkermes PLC | 2.26% |
| SpringWorks Therapeutics, Inc. | 2.25% |
| Arena Pharmaceuticals, Inc. | 2.12% |
| Cytokinetics, Inc. | 2.09% |
| Total % of Top 10 Holdings | 28.04% |
| * | % of Total Investments (excluding investments purchased with collateral from securities loaned) |
Future holdings are subject to change.
Sector Allocation* (as of November 30, 2021)
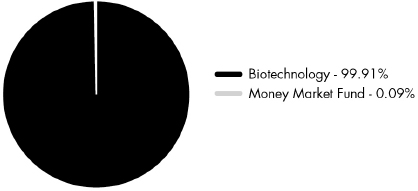
Growth of $10,000 (as of November 30, 2021)
Comparison of change in value of a $10,000 investment in the Fund and the Index
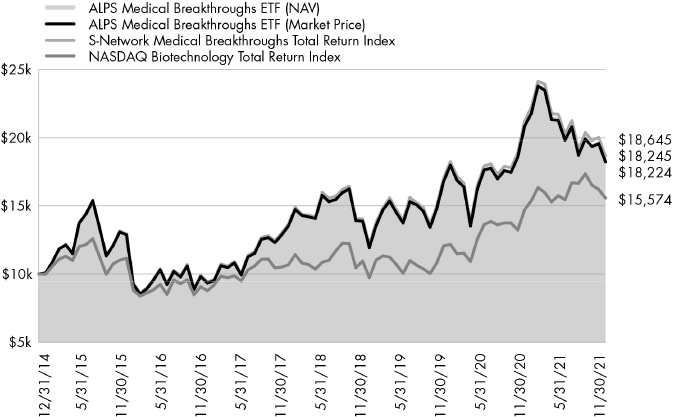
The chart above compares historical performance of a hypothetical investment of $10,000 in the Fund since inception with the performance of the Fund’s benchmark index. Results include the reinvestment of all dividends and capital gains distributions. Past performance does not guarantee future results. The chart does not reflect the deduction of taxes that a shareholder would pay on Fund distributions or the redemption of Fund shares.
| ALPS ETF Trust | |
| Disclosure of Fund Expenses | November 30, 2021 (Unaudited) |
Shareholder Expense Example: As a shareholder of a Fund, you incur certain ongoing costs, including management fees and other Fund expenses. These examples are intended to help you understand your ongoing costs (in dollars) of investing in a Fund and to compare these costs with the ongoing costs of investing in other funds. It is based on an investment of $1,000 invested at the beginning of the (six month) period and held through November 30, 2021.
Actual Return: The first line of the table provides information about actual account values and actual expenses. You may use the information in this line, together with the amount you invested, to estimate the expenses that you incurred over the period. Simply divide your account value by $1,000 (for example, an $8,600 account value divided by $1,000 = 8.6), then multiply the result by the number in the first line under the heading entitled “Expenses Paid During Period” to estimate the expenses attributable to your investment during this period.
Hypothetical 5% Return: The second line of the table provides information about hypothetical account values and hypothetical expenses based on the Fund’s actual expense ratio and an assumed rate of return of 5% per year before expenses, which is not the Fund’s actual return. The hypothetical account values and expenses may not be used to estimate the actual ending account balance or expenses you paid for the period. You may use this information to compare ongoing costs of investing in the Fund and other funds. To do so, compare this 5% hypothetical example with the 5% hypothetical examples that appear in the shareholder reports of the other funds.
The expenses shown in the table are meant to highlight ongoing Fund costs only and do not reflect any transaction costs, such as brokerage commissions and other fees to financial intermediaries. Therefore, the second line is useful in comparing ongoing costs only, and will not help you determine the relative total costs of owning different funds. In addition, if these costs were included, your costs would have been higher.
| | Beginning Account Value 6/1/21 | Ending Account Value 11/30/21 | Expense Ratio(a) | Expenses Paid During Period 6/1/21 - 11/30/21(b) |
| ALPS Clean Energy ETF | | | | |
| Actual | $1,000.00 | $1,073.50 | 0.55% | $2.86 |
| Hypothetical (5% return before expenses) | $1,000.00 | $1,022.31 | 0.55% | $2.79 |
| ALPS Disruptive Technologies ETF | | | | |
| Actual | $1,000.00 | $1,043.90 | 0.50% | $2.56 |
| Hypothetical (5% return before expenses) | $1,000.00 | $1,022.56 | 0.50% | $2.54 |
| ALPS Global Travel Beneficiaries ETF | | | | |
| Actual(c) | $1,000.00 | $946.60 | 0.65% | $1.46 |
| Hypothetical (5% return before expenses) | $1,000.00 | $1,021.81 | 0.65% | $3.29 |
| ALPS Medical Breakthroughs ETF | | | | |
| Actual | $1,000.00 | $920.30 | 0.50% | $2.41 |
| Hypothetical (5% return before expenses) | $1,000.00 | $1,022.56 | 0.50% | $2.54 |
| (a) | Annualized, based on the Fund's most recent fiscal half year expenses. |
| (b) | Expenses are equal to the Fund's annualized expense ratio multiplied by the average account value over the period, multiplied by the number of days in the most recent fiscal half year (183), divided by 365. |
| (c) | The ALPS Global Travel Beneficiaries ETF commenced operations on September 8, 2021. Actual expenses on this Fund are equal to the Fund's annualized expense ratio multiplied by the average account value of the period, multiplied by the number of days since the Fund launched (84) divided by 365. |
| ALPS ETF Trust |
| Report of Independent Registered Public Accounting Firm |
To the Board of Trustees of ALPS ETF Trust and the shareholders of ALPS Clean Energy ETF, ALPS Disruptive Technologies ETF, ALPS Global Travel Beneficiaries ETF, and ALPS Medical Breakthroughs ETF:
Opinion on the Financial Statements and Financial Highlights
We have audited the accompanying statements of assets and liabilities, including the schedules of investments, of ALPS Clean Energy ETF, ALPS Disruptive Technologies ETF, ALPS Global Travel Beneficiaries ETF, and ALPS Medical Breakthroughs ETF (the "Funds"), four of the funds constituting the ALPS ETF Trust as of November 30, 2021, the related statements of operations, the statements of changes in net assets, and the financial highlights for the periods indicated in the table below, and the related notes.
In our opinion, the financial statements and financial highlights present fairly, in all material respects, the financial position of the Funds as of November 30, 2021, and the results of their operations, the changes in their net assets, and the financial highlights for the periods indicated in the table below, in conformity with accounting principles generally accepted in the United States of America.
| Individual Fund Comprising the ALPS ETF Trust | Statement of Operations | Statements of Changes in Net Assets | Financial Highlights |
| ALPS Clean Energy ETF | For the year ended November 30, 2021 | For the years ended November 30, 2021 and November 30, 2020 | For the years ended November 30, 2021, 2020, 2019 and for the period from June 28, 2018 (commencement of operations) to November 30, 2018 |
| ALPS Disruptive Technologies ETF | For the year ended November 30, 2021 | For the years ended November 30, 2021 and November 30, 2020 | For the year ended November 30, 2021, 2020, 2019 and for the period from December 28, 2017 (commencement of operations) to November 30, 2018 |
| ALPS Global Travel Beneficiaries ETF | For the period from September 8, 2021 (commencement of operations) through November 30, 2021 |
| ALPS Medical Breakthroughs ETF | For the year ended November 30, 2021 | For the years ended November 30, 2021 and November 30, 2020 | For the five years ended November 30, 2021 |
Basis for Opinion
These financial statements and financial highlights are the responsibility of the Funds’ management. Our responsibility is to express an opinion on the Funds’ financial statements and financial highlights based on our audits. We are a public accounting firm registered with the Public Company Accounting Oversight Board (United States) (PCAOB) and are required to be independent with respect to the Funds in accordance with the U.S. federal securities laws and the applicable rules and regulations of the Securities and Exchange Commission and the PCAOB.
We conducted our audits in accordance with the standards of the PCAOB. Those standards require that we plan and perform the audit to obtain reasonable assurance about whether the financial statements and financial highlights are free of material misstatement, whether due to error or fraud. The Funds are not required to have, nor were we engaged to perform, an audit of their internal control over financial reporting. As part of our audits we are required to obtain an understanding of internal control over financial reporting but not for the purpose of expressing an opinion on the effectiveness of the Funds’ internal control over financial reporting. Accordingly, we express no such opinion.
Our audits included performing procedures to assess the risks of material misstatement of the financial statements and financial highlights, whether due to error or fraud, and performing procedures that respond to those risks. Such procedures included examining, on a test basis, evidence regarding the amounts and disclosures in the financial statements and financial highlights. Our audits also included evaluating the accounting principles used and significant estimates made by management, as well as evaluating the overall presentation of the financial statements and financial highlights. Our procedures included confirmation of securities owned as of November 30, 2021, by correspondence with the custodian and brokers; when replies were not received from brokers, we performed other auditing procedures. We believe that our audits provide a reasonable basis for our opinion.
DELOITTE & TOUCHE LLP
Denver, Colorado
January 26, 2022
We have served as the auditor of one or more investment companies advised by ALPS Advisors, Inc. since 2007.
| ALPS Clean Energy ETF | |
| Schedule of Investments | November 30, 2021 |
| Security Description | | Shares | | | Value | |
| COMMON STOCKS (89.36%) | | | | | | | | |
| Consumer Discretionary (8.96%) | | | | | | | | |
| Arcimoto, Inc.(a)(b) | | | 273,128 | | | $ | 2,794,099 | |
| Tesla, Inc.(a) | | | 67,248 | | | | 76,982,819 | |
| Workhorse Group, Inc.(a)(b) | | | 1,063,112 | | | | 6,208,575 | |
| XL Fleet Corp.(a)(b) | | | 1,093,404 | | | | 4,964,054 | |
| Total Consumer Discretionary | | | | | | | 90,949,547 | |
| | | | | | | | | |
| Energy (4.61%) | | | | | | | | |
| Aemetis, Inc.(a) | | | 259,454 | | | | 4,867,357 | |
| Green Plains, Inc.(a) | | | 498,570 | | | | 19,269,731 | |
| Renewable Energy Group, Inc.(a) | | | 474,568 | | | | 22,674,859 | |
| Total Energy | | | | | | | 46,811,947 | |
| | | | | | | | | |
| Financials (4.17%) | | | | | | | | |
| Hannon Armstrong Sustainable Infrastructure Capital, Inc.(b) | | | 743,166 | | | | 42,271,283 | |
| | | | | | | | | |
| Industrials (34.78%) | | | | | | | | |
| Ameresco, Inc., Class A(a) | | | 285,551 | | | | 25,793,822 | |
| American Superconductor Corp.(a) | | | 245,675 | | | | 3,144,640 | |
| Array Technologies, Inc.(a) | | | 1,218,987 | | | | 21,960,051 | |
| Ballard Power Systems, Inc.(a)(b) | | | 2,290,939 | | | | 34,730,635 | |
| Beam Global(a) | | | 77,867 | | | | 2,066,590 | |
| Blink Charging Co.(a)(b) | | | 350,728 | | | | 13,478,477 | |
| ChargePoint Holdings, Inc.(a)(b) | | | 1,646,176 | | | | 42,010,412 | |
| Eos Energy Enterprises, Inc.(a)(b) | | | 372,267 | | | | 3,704,057 | |
| Infrastructure and Energy Alternatives, Inc.(a)(b) | | | 385,809 | | | | 3,649,753 | |
| Lightning eMotors, Inc.(a)(b) | | | 368,699 | | | | 2,680,442 | |
| Lion Electric Co.(a)(b) | | | 1,069,070 | | | | 11,652,863 | |
| Plug Power, Inc.(a)(b) | | | 1,869,349 | | | | 74,493,558 | |
| Romeo Power, Inc.(a)(b) | | | 882,966 | | | | 3,496,545 | |
| Shoals Technologies Group, Inc., Class A(a) | | | 1,001,754 | | | | 28,149,287 | |
| Stem, Inc.(a) | | | 1,222,745 | | | | 25,946,649 | |
| Sunrun, Inc.(a) | | | 1,083,647 | | | | 49,891,108 | |
| TPI Composites, Inc.(a) | | | 347,067 | | | | 6,188,205 | |
| Total Industrials | | | | | | | 353,037,094 | |
| | | | | | | | | |
| Information Technology (17.27%) | | | | | | | | |
| Enphase Energy, Inc.(a) | | | 283,701 | | | | 70,925,249 | |
| First Solar, Inc.(a) | | | 524,670 | | | | 54,355,812 | |
| Itron, Inc.(a) | | | 434,140 | | | | 26,877,607 | |
| SunPower Corp.(a)(b) | | | 807,142 | | | | 23,124,618 | |
| Total Information Technology | | | | | | | 175,283,286 | |
| Security Description | | Shares | | | Value | |
| Utilities (19.57%) | | | | | | | | |
| Boralex, Inc., Class A(b) | | | 982,221 | | | $ | 27,880,022 | |
| Clearway Energy, Inc., Class C | | | 785,065 | | | | 29,298,626 | |
| Innergex Renewable Energy, Inc.(b) | | | 1,419,330 | | | | 21,065,793 | |
| Northland Power, Inc.(b) | | | 1,452,642 | | | | 43,484,308 | |
| Ormat Technologies, Inc.(b) | | | 434,920 | | | | 32,836,460 | |
| Sunnova Energy International, Inc.(a) | | | 784,178 | | | | 28,991,061 | |
| TransAlta Renewables, Inc.(b) | | | 1,030,297 | | | | 14,952,997 | |
| Total Utilities | | | | | | | 198,509,267 | |
| | | | | | | | | |
| TOTAL COMMON STOCKS | | | | | | | | |
| (Cost $793,754,282) | | | | | | | 906,862,424 | |
| Security Description | | Shares | | | Value | |
| MASTER LIMITED PARTNERSHIPS (10.51%) | | | | | | | | |
| Energy (1.16%) | | | | | | | | |
| Enviva Partners LP | | | 167,564 | | | | 11,734,507 | |
| | | | | | | | | |
| Utilities (9.35%) | | | | | | | | |
| Brookfield Renewable Partners LP | | | 1,185,879 | | | | 43,083,208 | |
| NextEra Energy Partners LP | | | 609,327 | | | | 51,823,262 | |
| Total Utilities | | | | | | | 94,906,470 | |
| | | | | | | | | |
| TOTAL MASTER LIMITED PARTNERSHIPS | | | | | | | | |
| (Cost $87,162,754) | | | | | | | 106,640,977 | |
| ALPS Clean Energy ETF | |
| Schedule of Investments | November 30, 2021 |
| | | 7 Day Yield | | | Shares | | | Value | |
| SHORT TERM INVESTMENTS (5.26%) | | | | | | | | | | | | |
| Money Market Fund (0.10%) | | | | | | | | | | | | |
| State Street Institutional Treasury Plus Money Market Fund | | | | | | | | | | | | |
| (Cost $977,776) | | | 0.01 | % | | | 977,776 | | | $ | 977,776 | |
| | | | | | | | | | | | | |
| Investments Purchased with Collateral from Securities Loaned (5.17%) | | | | | | | | | | | | |
| State Street Navigator Securities Lending Government Money Market Portfolio, 0.03% | | | | | | | | | | | | |
| (Cost $52,491,002) | | | | | | | 52,491,002 | | | | 52,491,002 | |
| TOTAL SHORT TERM INVESTMENTS | | | | | | | | | | | | |
| (Cost $53,468,778) | | | | | | | | | | | 53,468,778 | |
| | | | | | | | | | | | | |
| TOTAL INVESTMENTS (105.14%) | | | | | | | | | | | | |
| (Cost $934,385,814) | | | | | | | | | | $ | 1,066,972,179 | |
| LIABILITIES IN EXCESS OF OTHER ASSETS (-5.14%) | | | | | | | | | | | (52,205,220 | ) |
| NET ASSETS - 100.00% | | | | | | | | | | $ | 1,014,766,959 | |
| (a) | Non-income producing security. |
| (b) | Security, or a portion of the security position is currently on loan. The total market value of securities on loan is $132,255,922. |
See Notes to Financial Statements.
| ALPS Disruptive Technologies ETF | |
| Schedule of Investments | November 30, 2021 |
| Security Description | | Shares | | | Value | |
| COMMON STOCKS (98.98%) | | | | | | |
| Communication Services (1.14%) | | | | | | | | |
| Netflix, Inc.(a) | | | 4,236 | | | $ | 2,719,088 | |
| | | | | | | | | |
| Consumer Discretionary (3.41%) | | | | | | | | |
| Garmin, Ltd. | | | 14,554 | | | | 1,943,541 | |
| iRobot Corp.(a) | | | 30,285 | | | | 2,298,934 | |
| Tesla, Inc.(a) | | | 3,355 | | | | 3,840,670 | |
| Total Consumer Discretionary | | | | | | | 8,083,145 | |
| | | | | | | | | |
| Financials (4.39%) | | | | | | | | |
| American Express Co. | | | 15,907 | | | | 2,422,636 | |
| Kaspi.KZ JSC, GDR | | | 22,340 | | | | 2,881,860 | |
| Moody's Corp. | | | 6,589 | | | | 2,573,927 | |
| S&P Global, Inc. | | | 5,607 | | | | 2,555,278 | |
| Total Financials | | | | | | | 10,433,701 | |
| | | | | | | | | |
| Health Care (9.25%) | | | | | | | | |
| ABIOMED, Inc.(a) | | | 6,912 | | | | 2,175,759 | |
| Align Technology, Inc.(a) | | | 3,472 | | | | 2,123,232 | |
| Boston Scientific Corp.(a) | | | 55,504 | | | | 2,113,037 | |
| Cutera, Inc.(a)(b) | | | 48,955 | | | | 1,706,571 | |
| Dexcom, Inc.(a) | | | 4,581 | | | | 2,577,226 | |
| DiaSorin SpA | | | 10,368 | | | | 2,219,379 | |
| Insulet Corp.(a) | | | 8,387 | | | | 2,419,147 | |
| Intuitive Surgical, Inc.(a) | | | 7,097 | | | | 2,301,841 | |
| ResMed, Inc. | | | 8,571 | | | | 2,184,320 | |
| Smith & Nephew PLC, Sponsored ADR | | | 67,454 | | | | 2,168,646 | |
| Total Health Care | | | | | | | 21,989,158 | |
| | | | | | | | | |
| Industrials (16.11%) | | | | | | | | |
| ABB, Ltd., Sponsored ADR(b) | | | 69,060 | | | | 2,386,023 | |
| ADT, Inc.(b) | | | 300,095 | | | | 2,493,789 | |
| AeroVironment, Inc.(a) | | | 27,394 | | | | 2,212,339 | |
| Experian PLC | | | 55,982 | | | | 2,516,513 | |
| FANUC Corp. | | | 10,664 | | | | 2,098,648 | |
| Proto Labs, Inc.(a) | | | 34,032 | | | | 1,705,684 | |
| RELX PLC, Sponsored ADR(b) | | | 83,083 | | | | 2,576,404 | |
| Schneider Electric SE | | | 14,064 | | | | 2,491,696 | |
| Sensata Technologies Holding PLC(a) | | | 44,983 | | | | 2,505,553 | |
| Siemens Gamesa Renewable Energy SA(a) | | | 92,022 | | | | 2,455,632 | |
| Thomson Reuters Corp.(b) | | | 21,260 | | | | 2,543,811 | |
| TransUnion | | | 20,295 | | | | 2,256,601 | |
| Verisk Analytics, Inc. | | | 12,306 | | | | 2,767,250 | |
| Vestas Wind Systems A/S | | | 62,836 | | | | 2,108,012 | |
| Wolters Kluwer NV | | | 22,049 | | | | 2,482,063 | |
| Security Description | | Shares | | | Value | |
| Industrials (continued) | | | | | | | | |
| Xinjiang Goldwind Science & Technology Co., Ltd., Class H | | | 1,199,600 | | | $ | 2,645,950 | |
| Total Industrials | | | | | | | 38,245,968 | |
| | | | | | | | | |
| Information Technology (62.66%) | | | | | | | | |
| Adobe, Inc.(a) | | | 3,823 | | | | 2,560,837 | |
| Adyen NV(a)(c)(d) | | | 798 | | | | 2,215,007 | |
| Afterpay, Ltd.(a) | | | 27,002 | | | | 2,095,185 | |
| Alarm.com Holdings, Inc.(a) | | | 31,281 | | | | 2,495,911 | |
| Allegro MicroSystems, Inc.(a) | | | 82,271 | | | | 2,569,323 | |
| ams AG(a) | | | 133,609 | | | | 2,382,419 | |
| ANSYS, Inc.(a) | | | 6,823 | | | | 2,671,068 | |
| Autodesk, Inc.(a) | | | 8,806 | | | | 2,238,397 | |
| Avast PLC(a)(c)(d) | | | 309,637 | | | | 2,494,688 | |
| Azenta Inc | | | 27,876 | | | | 3,152,776 | |
| Black Knight, Inc.(a) | | | 33,504 | | | | 2,394,532 | |
| Cerence, Inc.(a)(b) | | | 23,910 | | | | 1,797,554 | |
| Check Point Software Technologies, Ltd.(a) | | | 20,603 | | | | 2,293,320 | |
| Cognex Corp. | | | 28,909 | | | | 2,233,220 | |
| Crowdstrike Holdings, Inc., Class A(a) | | | 9,547 | | | | 2,073,036 | |
| Dassault Systemes SE | | | 43,433 | | | | 2,619,989 | |
| Datadog, Inc., Class A(a) | | | 17,989 | | | | 3,207,259 | |
| Dynatrace, Inc.(a) | | | 35,678 | | | | 2,242,362 | |
| FARO Technologies, Inc.(a) | | | 37,960 | | | | 2,636,702 | |
| Fidelity National Information Services, Inc. | | | 19,836 | | | | 2,072,862 | |
| First Solar, Inc.(a) | | | 25,584 | | | | 2,650,502 | |
| Fiserv, Inc.(a) | | | 21,912 | | | | 2,114,946 | |
| FleetCor Technologies, Inc.(a) | | | 9,523 | | | | 1,972,499 | |
| Fortinet, Inc.(a) | | | 8,111 | | | | 2,693,744 | |
| Global Payments, Inc. | | | 14,644 | | | | 1,743,222 | |
| GMO Payment Gateway, Inc. | | | 18,100 | | | | 2,438,740 | |
| Intuit, Inc. | | | 4,459 | | | | 2,908,606 | |
| Itron, Inc.(a) | | | 31,735 | | | | 1,964,714 | |
| Keyence Corp. | | | 3,833 | | | | 2,384,880 | |
| Mastercard, Inc., Class A | | | 7,216 | | | | 2,272,462 | |
| Materialise NV, ADR(a) | | | 103,306 | | | | 2,515,501 | |
| McAfee Corp. | | | 108,096 | | | | 2,794,281 | |
| Nemetschek SE | | | 24,813 | | | | 3,146,087 | |
| NortonLifeLock, Inc. | | | 92,066 | | | | 2,287,840 | |
| Okta, Inc.(a) | | | 9,527 | | | | 2,050,496 | |
| Omron Corp. | | | 24,400 | | | | 2,366,931 | |
| Pagseguro Digital, Ltd., Class A(a)(b) | | | 44,703 | | | | 1,142,609 | |
| Palo Alto Networks, Inc.(a) | | | 5,419 | | | | 2,963,868 | |
| PayPal Holdings, Inc.(a) | | | 8,781 | | | | 1,623,519 | |
| PTC, Inc.(a) | | | 19,786 | | | | 2,168,150 | |
| ALPS Disruptive Technologies ETF | |
| Schedule of Investments | November 30, 2021 |
| Security Description | | Shares | | | Value | |
| Information Technology (continued) | | | | | | | | |
| Qorvo, Inc.(a) | | | 14,080 | | | $ | 2,058,918 | |
| Renishaw PLC | | | 33,935 | | | | 2,048,981 | |
| salesforce.com, Inc.(a) | | | 9,710 | | | | 2,766,962 | |
| SAP SE, Sponsored ADR | | | 17,302 | | | | 2,222,269 | |
| ServiceNow, Inc.(a) | | | 3,900 | | | | 2,526,030 | |
| Silicon Laboratories, Inc.(a) | | | 17,537 | | | | 3,441,988 | |
| Skyworks Solutions, Inc. | | | 14,201 | | | | 2,153,724 | |
| Snowflake, Inc.(a) | | | 7,920 | | | | 2,693,988 | |
| SolarEdge Technologies, Inc.(a) | | | 9,182 | | | | 3,009,492 | |
| Splunk, Inc.(a) | | | 16,235 | | | | 1,964,435 | |
| Square, Inc., Class A(a)(b) | | | 10,067 | | | | 2,097,258 | |
| SS&C Technologies Holdings, Inc. | | | 34,409 | | | | 2,626,439 | |
| StoneCo, Ltd., Class A(a) | | | 57,404 | | | | 895,502 | |
| Stratasys, Ltd.(a) | | | 106,276 | | | | 2,868,389 | |
| Temenos AG | | | 16,677 | | | | 2,140,825 | |
| Trend Micro, Inc. | | | 44,343 | | | | 2,569,528 | |
| Visa, Inc., Class A | | | 11,075 | | | | 2,146,003 | |
| VMware, Inc., Class A | | | 17,316 | | | | 2,021,470 | |
| Workday, Inc., Class A(a) | | | 9,338 | | | | 2,560,760 | |
| Xero, Ltd.(a) | | | 23,322 | | | | 2,407,977 | |
| Xinyi Solar Holdings, Ltd.(b) | | | 1,114,000 | | | | 2,042,857 | |
| Zoom Video Communications, Inc., Class A(a) | | | 8,559 | | | | 1,809,457 | |
| Zscaler, Inc.(a) | | | 9,039 | | | | 3,136,262 | |
| Total Information Technology | | | | | | | 148,859,558 | |
| | | | | | | | | |
| Real Estate (1.02%) | | | | | | | | |
| Equinix, Inc. | | | 2,970 | | | | 2,412,234 | |
| | | | | | | | | |
| Utilities (1.00%) | | | | | | | | |
| China Longyuan Power Group Corp., Ltd., Class H | | | 1,157,000 | | | | 2,373,942 | |
| | | | | | | | | |
| TOTAL COMMON STOCKS | | | | | | | | |
| (Cost $190,407,940) | | | | | | | 235,116,794 | |
| Security Description | | Shares | | | Value | |
| MASTER LIMITED PARTNERSHIPS (0.96%) | | | | | | |
| Utilities (0.96%) | | | | | | | | |
| Brookfield Renewable Partners LP | | | 62,605 | | | | 2,274,451 | |
| | | | | | | | | |
| TOTAL MASTER LIMITED PARTNERSHIPS | | | | | | | | |
| (Cost $1,790,702) | | | | | | | 2,274,451 | |
| | | 7 Day Yield | | | Shares | | | Value | |
| SHORT TERM INVESTMENTS (1.45%) | | | | | | | | | |
| Money Market Fund (0.05%) | | | | | | | | | | | | |
| State Street Institutional Treasury Plus Money Market Fund | | | | | | | | | | | | |
| (Cost $125,461) | | | 0.01 | % | | | 125,461 | | | $ | 125,461 | |
| | | | | | | | | | | | | |
| Investments Purchased with Collateral from Securities Loaned (1.39%) | | | | | | | | | | | | |
| State Street Navigator Securities Lending Government Money Market Portfolio, 0.03% | | | | | | | | | | | | |
| (Cost $3,307,091) | | | | | | | 3,307,091 | | | | 3,307,091 | |
| TOTAL SHORT TERM INVESTMENTS | | | | | | | | | | | | |
| (Cost $3,432,552) | | | | | | | | | | | 3,432,552 | |
| | | | | | | | | | | | | |
| TOTAL INVESTMENTS (101.38%) | | | | | | | | | | | | |
| (Cost $195,631,194) | | | | | | | | | | $ | 240,823,797 | |
| LIABILITIES IN EXCESS OF OTHER ASSETS (-1.38%) | | | | | | | | | | | (3,278,196 | ) |
| NET ASSETS - 100.00% | | | | | | | | | | $ | 237,545,601 | |
| (a) | Non-income producing security. |
| (b) | Security, or a portion of the security position is currently on loan. The total market value of securities on loan is $9,525,848. |
| (c) | Securities exempt from registration under Rule 144A of the Securities Act of 1933. These securities may be sold in the ordinary course of business in transactions exempt from registration, normally to qualified institutional buyers. At period end, the aggregate market value of those securities was $4,709,695, representing 1.98% of net assets. |
| (d) | Securities were purchased pursuant to Regulation S under the Securities Act of 1933, which exempts securities offered and sold outside of the United States from registration. Such securities cannot be sold in the United States without either an effective registration statement filed pursuant to the Securities Act of 1933, or pursuant to an exemption from registration. As of November 30, 2021, the market value of those securities was $4,709,695 representing 1.98% of net assets. |
See Notes to Financial Statements.
| ALPS Global Travel Beneficiaries ETF | |
| Schedule of Investments | November 30, 2021 |
| Security Description | | Shares | | | Value | |
| COMMON STOCKS (99.88%) | | | | | | | | |
| Communication Services (4.06%) | | | | | | | | |
| Liberty TripAdvisor Holdings, Inc.(a) | | | 5,463 | | | $ | 11,800 | |
| TripAdvisor, Inc.(a) | | | 585 | | | | 15,128 | |
| Walt Disney Co.(a) | | | 1,963 | | | | 284,439 | |
| Total Communication Services | | | | | | | 311,367 | |
| | | | | | | | | |
| Consumer Discretionary (49.04%) | | | | | | | | |
| Airbnb, Inc.(a) | | | 1,773 | | | | 305,913 | |
| Booking Holdings, Inc.(a) | | | 157 | | | | 329,991 | |
| Boyd Gaming Corp.(a) | | | 751 | | | | 44,016 | |
| Caesars Entertainment, Inc.(a) | | | 1,575 | | | | 141,860 | |
| Carnival Corp.(a)(b) | | | 3,055 | | | | 53,829 | |
| Choice Hotels International, Inc. | | | 397 | | | | 56,989 | |
| Cie Financiere Richemont SA | | | 1,646 | | | | 245,093 | |
| Expedia Group, Inc.(a) | | | 798 | | | | 128,550 | |
| Galaxy Entertainment Group, Ltd.(a) | | | 24,000 | | | | 131,264 | |
| Hilton Worldwide Holdings, Inc.(a) | | | 2,808 | | | | 379,277 | |
| Huazhu Group, Ltd., ADR(a) | | | 2,050 | | | | 81,016 | |
| HyreCar, Inc.(a) | | | 1,638 | | | | 8,681 | |
| Intercontinental Hotels Group(a) | | | 562 | | | | 33,253 | |
| Las Vegas Sands Corp.(a) | | | 2,556 | | | | 91,045 | |
| LVMH Moet Hennessy Louis Vuitton SE | | | 468 | | | | 364,418 | |
| Marriott International, Inc., Class A(a) | | | 2,662 | | | | 392,804 | |
| Marriott Vacations Worldwide Corp. | | | 349 | | | | 53,275 | |
| MGM Resorts International | | | 2,600 | | | | 102,908 | |
| Moncler SpA | | | 727 | | | | 52,833 | |
| Oriental Land Co., Ltd. | | | 1,500 | | | | 236,741 | |
| Penn National Gaming, Inc.(a) | | | 1,354 | | | | 69,365 | |
| Thule Group AB | | | 361 | | | | 20,542 | |
| Tongcheng-Elong Holdings Ltd(a) | | | 9,200 | | | | 19,065 | |
| Trainline PLC(a)(c)(d) | | | 3,968 | | | | 14,386 | |
| Trip.com Group, Ltd., ADR(a) | | | 4,350 | | | | 119,625 | |
| TUI AG(a) | | | 7,173 | | | | 18,954 | |
| Vail Resorts, Inc. | | | 360 | | | | 119,416 | |
| WH Smith PLC(a) | | | 965 | | | | 17,018 | |
| Wyndham Hotels & Resorts, Inc. | | | 1,045 | | | | 83,057 | |
| Wynn Resorts, Ltd.(a) | | | 531 | | | | 43,016 | |
| Total Consumer Discretionary | | | | | | | 3,758,200 | |
| Security Description | | Shares | | | Value | |
| Consumer Staples (12.40%) | | | | | | | | |
| Beyond Meat, Inc.(a) | | | 178 | | | $ | 12,506 | |
| L'Oreal SA | | | 769 | | | | 346,667 | |
| Premium Brands Holdings Corp. | | | 192 | | | | 18,683 | |
| Shiseido Co., Ltd. | | | 3,700 | | | | 212,864 | |
| The Estee Lauder Company, Inc., Class A, Class A | | | 1,083 | | | | 359,632 | |
| Total Consumer Staples | | | | | | | 950,352 | |
| | | | | | | | | |
| Financials (4.55%) | | | | | | | | |
| American Express Co. | | | 2,289 | | | | 348,615 | |
| | | | | | | | | |
| Industrials (26.44%) | | | | | | | | |
| Aena SME SA(a)(c)(d) | | | 350 | | | | 51,403 | |
| Airports of Thailand PCL(a) | | | 34,600 | | | | 61,350 | |
| Alaska Air Group, Inc.(a) | | | 983 | | | | 47,744 | |
| American Airlines Group, Inc.(a) | | | 3,536 | | | | 62,552 | |
| ANA Holdings, Inc.(a) | | | 4,300 | | | | 85,194 | |
| Auckland International Airport, Ltd.(a) | | | 10,799 | | | | 58,226 | |
| Avis Budget Group, Inc.(a) | | | 221 | | | | 60,684 | |
| CAE, Inc.(a) | | | 3,188 | | | | 76,615 | |
| China South Airlines(a) | | | 32,000 | | | | 17,687 | |
| Cintas Corp. | | | 745 | | | | 314,533 | |
| Dassault Aviation SA | | | 182 | | | | 17,255 | |
| Delta Air Lines, Inc.(a) | | | 4,381 | | | | 158,592 | |
| Elis SA(a) | | | 1,056 | | | | 16,587 | |
| Flight Centre Ltd.(a)(b) | | | 1,537 | | | | 19,448 | |
| Grupo Aeroportuario del Pacifico SAB de CV, ADR | | | 276 | | | | 31,878 | |
| Grupo Aeroportuario del Sureste SAB de CV, ADR | | | 117 | | | | 21,382 | |
| International Consolidated Airlines Group SA(a) | | | 9,639 | | | | 16,340 | |
| Japan Airlines Co Ltd(a) | | | 4,000 | | | | 72,756 | |
| JetBlue Airways Corp.(a) | | | 1,316 | | | | 17,661 | |
| Korean Air Lines Co. Ltd.(a) | | | 1,745 | | | | 38,928 | |
| Localiza Rent a Car SA | | | 5,700 | | | | 51,820 | |
| Lyft, Inc., Class A(a) | | | 400 | | | | 16,244 | |
| Qantas Airways, Ltd.(a) | | | 17,794 | | | | 64,183 | |
| Ryanair Holdings PLC(a) | | | 1,081 | | | | 17,452 | |
| Sixt SE(a) | | | 151 | | | | 24,574 | |
| Southwest Airlines Co.(a) | | | 4,685 | | | | 208,013 | |
| Textron, Inc. | | | 2,324 | | | | 164,539 | |
| Uber Technologies, Inc.(a) | | | 3,438 | | | | 130,644 | |
| United Airlines Holdings, Inc.(a) | | | 2,054 | | | | 86,802 | |
| Wizz Air Holdings PLC(a) | | | 297 | | | | 15,586 | |
| Total Industrials | | | | | | | 2,026,672 | |
| ALPS Global Travel Beneficiaries ETF | |
| Schedule of Investments | November 30, 2021 |
| Security Description | | Shares | | | Value | |
| Information Technology (2.30%) | | | | | | | | |
| Agilysys, Inc.(a) | | | 377 | | | $ | 16,418 | |
| Amadeus IT Holding SA, Class A(a) | | | 2,002 | | | | 128,236 | |
| Sabre Corp.(a)(b) | | | 1,810 | | | | 13,629 | |
| TravelSky Technology, Ltd. | | | 11,000 | | | | 18,197 | |
| Total Information Technology | | | | | | | 176,480 | |
| | | | | | | | | |
| Real Estate (1.07%) | | | | | | | | |
| Host Hotels & Resorts, Inc.(a) | | | 5,244 | | | | 82,331 | |
| | | | | | | | | |
| Utilities (0.02%) | | | | | | | | |
| Macquarie Infrastructure Corp. | | | 507 | | | | 1,835 | |
| | | | | | | | | |
| TOTAL COMMON STOCKS | | | | | | | | |
| (Cost $8,031,042) | | | | | | | 7,655,852 | |
| | | 7 Day Yield | | | Shares | | | Value | |
| SHORT TERM INVESTMENTS (0.33%) | | | | | | | | | |
| Money Market Fund (0.13%) | | | | | | | | | |
| State Street Institutional Treasury Plus Money Market Fund | | | | | | | | | | | | |
| (Cost $10,228) | | | 0.01 | % | | | 10,228 | | | | 10,228 | |
| | | | | | | | | | | | | |
| Investments Purchased with Collateral from Securities Loaned (0.20%) | | | | | | | | | | | | |
| State Street Navigator Securities Lending Government Money Market Portfolio, 0.03% | | | | | | | | | | | | |
| (Cost $15,322) | | | | | | | 15,322 | | | | 15,322 | |
| TOTAL SHORT TERM INVESTMENTS | | | | | | | | | | | | |
| (Cost $25,550) | | | | | | | | | | | 25,550 | |
| | | | | | | | | | | | | |
| TOTAL INVESTMENTS (100.21%) | | | | | | | | | | | | |
| (Cost $8,056,592) | | | | | | | | | | $ | 7,681,402 | |
| LIABILITIES IN EXCESS OF OTHER ASSETS (-0.21%) | | | | | | | | | | | (16,392 | ) |
| NET ASSETS - 100.00% | | | | | | | | | | $ | 7,665,010 | |
| (a) | Non-income producing security. |
| (b) | Security, or a portion of the security position is currently on loan. The total market value of securities on loan is $65,144. |
| (c) | Securities exempt from registration under Rule 144A of the Securities Act of 1933. These securities may be sold in the ordinary course of business in transactions exempt from registration, normally to qualified institutional buyers. At period end, the aggregate market value of those securities was $65,789, representing 0.86% of net assets. |
| (d) | Securities were purchased pursuant to Regulation S under the Securities Act of 1933, which exempts securities offered and sold outside of the United States from registration. Such securities cannot be sold in the United States without either an effective registration statement filed pursuant to the Securities Act of 1933, or pursuant to an exemption from registration. As of November 30, 2021, the market value of those securities was $65,789 representing 0.86% of net assets. |
See Notes to Financial Statements.
| ALPS Medical Breakthroughs ETF | |
| Schedule of Investments | November 30, 2021 |
| Security Description | | Shares | | | Value | |
| COMMON STOCKS (99.95%) | | | | | | |
| Biotechnology (99.95%) | | | | | | | | |
| 89bio, Inc.(a)(b) | | | 24,098 | | | $ | 318,335 | |
| AC Immune SA(a)(b) | | | 87,386 | | | | 448,290 | |
| ACADIA Pharmaceuticals, Inc.(a) | | | 193,264 | | | | 3,710,669 | |
| Adaptimmune Therapeutics PLC, ADR(a)(b) | | | 187,028 | | | | 776,166 | |
| ADC Therapeutics SA(a) | | | 92,217 | | | | 2,052,750 | |
| Adverum Biotechnologies, Inc.(a)(b) | | | 116,276 | | | | 202,320 | |
| Affimed NV(a) | | | 143,976 | | | | 981,916 | |
| Agios Pharmaceuticals, Inc.(a)(b) | | | 70,856 | | | | 2,523,891 | |
| Akero Therapeutics, Inc.(a)(b) | | | 41,913 | | | | 891,070 | |
| Albireo Pharma, Inc.(a)(b) | | | 23,111 | | | | 554,433 | |
| Aldeyra Therapeutics, Inc.(a) | | | 69,563 | | | | 533,548 | |
| Alector, Inc.(a) | | | 97,239 | | | | 2,007,985 | |
| Alkermes PLC(a) | | | 194,531 | | | | 4,264,120 | |
| Allovir, Inc.(a)(b) | | | 78,259 | | | | 1,366,402 | |
| Alpine Immune Sciences, Inc.(a)(b) | | | 28,734 | | | | 311,189 | |
| Altimmune, Inc.(a)(b) | | | 47,735 | | | | 500,740 | |
| ALX Oncology Holdings, Inc.(a) | | | 48,508 | | | | 1,560,017 | |
| Amicus Therapeutics, Inc.(a) | | | 320,674 | | | | 3,434,419 | |
| AnaptysBio, Inc.(a) | | | 33,007 | | | | 1,067,776 | |
| Annexon, Inc.(a) | | | 46,023 | | | | 749,715 | |
| Apellis Pharmaceuticals, Inc.(a) | | | 104,594 | | | | 4,401,316 | |
| Applied Molecular Transport, Inc.(a) | | | 46,231 | | | | 785,927 | |
| Arcturus Therapeutics Holdings, Inc.(a) | | | 31,587 | | | | 1,255,583 | |
| Arcus Biosciences, Inc.(a) | | | 85,801 | | | | 3,758,084 | |
| Arcutis Biotherapeutics, Inc.(a) | | | 60,436 | | | | 1,001,425 | |
| Arena Pharmaceuticals, Inc.(a) | | | 73,471 | | | | 4,003,435 | |
| Atara Biotherapeutics, Inc.(a) | | | 101,931 | | | | 1,823,546 | |
| Aurinia Pharmaceuticals, Inc.(a)(b) | | | 154,167 | | | | 2,904,506 | |
| AVEO Pharmaceuticals, Inc.(a)(b) | | | 40,726 | | | | 256,167 | |
| BioAtla, Inc.(a) | | | 40,660 | | | | 1,026,665 | |
| Bioxcel Therapeutics, Inc.(a)(b) | | | 33,640 | | | | 771,365 | |
| Bluebird Bio, Inc.(a) | | | 81,283 | | | | 821,771 | |
| Cardiff Oncology, Inc.(a)(b) | | | 46,865 | | | | 263,381 | |
| Catalyst Pharmaceuticals, Inc.(a) | | | 123,831 | | | | 866,817 | |
| Cerevel Therapeutics Holdings, Inc.(a)(b) | | | 174,377 | | | | 5,438,819 | |
| ChemoCentryx, Inc.(a) | | | 84,036 | | | | 3,048,826 | |
| Chimerix, Inc.(a) | | | 103,703 | | | | 652,292 | |
| Chinook Therapeutics, Inc.(a) | | | 74,583 | | | | 862,667 | |
| Clene, Inc.(a)(b) | | | 73,971 | | | | 420,895 | |
| Coherus Biosciences, Inc.(a)(b) | | | 91,922 | | | | 1,706,992 | |
| Cortexyme, Inc.(a)(b) | | | 35,678 | | | | 464,171 | |
| Security Description | | Shares | | | Value | |
| Biotechnology (continued) | | | | | | | | |
| Crinetics Pharmaceuticals, Inc.(a) | | | 46,368 | | | $ | 1,266,774 | |
| Cytokinetics, Inc.(a) | | | 100,460 | | | | 3,952,096 | |
| CytomX Therapeutics, Inc.(a) | | | 78,306 | | | | 517,603 | |
| Dicerna Pharmaceuticals, Inc.(a) | | | 93,518 | | | | 3,554,619 | |
| Eiger BioPharmaceuticals, Inc.(a)(b) | | | 40,833 | | | | 251,123 | |
| Emergent BioSolutions, Inc.(a) | | | 64,537 | | | | 2,847,372 | |
| Enanta Pharmaceuticals, Inc.(a) | | | 24,251 | | | | 2,140,878 | |
| Esperion Therapeutics, Inc.(a)(b) | | | 34,003 | | | | 296,846 | |
| FibroGen, Inc.(a) | | | 111,353 | | | | 1,393,026 | |
| Forma Therapeutics Holdings, Inc.(a)(b) | | | 60,016 | | | | 869,632 | |
| Forte Biosciences, Inc.(a) | | | 16,473 | | | | 43,818 | |
| Fortress Biotech, Inc.(a)(b) | | | 121,588 | | | | 346,526 | |
| Frequency Therapeutics, Inc.(a) | | | 40,778 | | | | 207,968 | |
| G1 Therapeutics, Inc.(a) | | | 50,876 | | | | 656,300 | |
| Gamida Cell, Ltd.(a)(b) | | | 70,236 | | | | 179,804 | |
| Gemini Therapeutics, Inc.(a)(b) | | | 51,079 | | | | 140,978 | |
| Geron Corp.(a)(b) | | | 385,713 | | | | 570,855 | |
| Global Blood Therapeutics, Inc.(a) | | | 75,059 | | | | 2,121,167 | |
| Gossamer Bio, Inc.(a)(b) | | | 91,344 | | | | 990,169 | |
| Immunic, Inc.(a) | | | 31,101 | | | | 265,292 | |
| Immunocore Holdings PLC, ADR(a)(b) | | | 52,585 | | | | 1,892,534 | |
| ImmunoGen, Inc.(a) | | | 249,992 | | | | 1,542,451 | |
| Immunovant, Inc.(a) | | | 138,276 | | | | 1,064,725 | |
| Immutep, Ltd., ADR(a)(b) | | | 97,991 | | | | 336,109 | |
| Infinity Pharmaceuticals, Inc.(a) | | | 105,135 | | | | 228,143 | |
| Inmune Bio, Inc.(a)(b) | | | 21,281 | | | | 273,461 | |
| Inovio Pharmaceuticals, Inc.(a)(b) | | | 253,076 | | | | 1,832,270 | |
| Intercept Pharmaceuticals, Inc.(a)(b) | | | 39,939 | | | | 687,350 | |
| Iovance Biotherapeutics, Inc.(a) | | | 186,515 | | | | 3,491,561 | |
| IVERIC bio, Inc.(a) | | | 125,048 | | | | 1,828,202 | |
| Karuna Therapeutics, Inc.(a) | | | 35,619 | | | | 4,555,670 | |
| Keros Therapeutics, Inc.(a)(b) | | | 28,051 | | | | 1,564,965 | |
| Kezar Life Sciences, Inc.(a) | | | 57,912 | | | | 802,660 | |
| Kiniksa Pharmaceuticals, Ltd., Class A(a)(b) | | | 82,399 | | | | 957,476 | |
| Kodiak Sciences, Inc.(a) | | | 61,971 | | | | 5,691,417 | |
| Krystal Biotech, Inc.(a) | | | 26,709 | | | | 2,151,410 | |
| Legend Biotech Corp., ADR(a) | | | 174,194 | | | | 8,972,733 | |
| Ligand Pharmaceuticals, Inc.(a) | | | 20,058 | | | | 3,247,791 | |
| MacroGenics, Inc.(a) | | | 73,513 | | | | 1,293,829 | |
| Madrigal Pharmaceuticals, Inc.(a) | | | 19,964 | | | | 1,651,222 | |
| Magenta Therapeutics, Inc.(a)(b) | | | 70,399 | | | | 396,346 | |
| ALPS Medical Breakthroughs ETF | |
| Schedule of Investments | November 30, 2021 |
| Security Description | | Shares | | | Value | |
| Biotechnology (continued) | | | | | | | | |
| Marker Therapeutics, Inc.(a) | | | 98,455 | | | $ | 116,177 | |
| MEI Pharma, Inc.(a) | | | 135,519 | | | | 456,699 | |
| MeiraGTx Holdings PLC(a) | | | 53,306 | | | | 942,450 | |
| Mirum Pharmaceuticals, Inc.(a)(b) | | | 36,659 | | | | 521,658 | |
| Molecular Templates, Inc.(a)(b) | | | 67,529 | | | | 270,791 | |
| MorphoSys AG, ADR(a) | | | 162,495 | | | | 1,642,824 | |
| Orchard Therapeutics PLC, ADR(a) | | | 142,988 | | | | 193,034 | |
| Organogenesis Holdings, Inc.(a) | | | 154,678 | | | | 1,556,061 | |
| Praxis Precision Medicines, Inc.(a) | | | 53,723 | | | | 919,201 | |
| Prothena Corp. PLC(a) | | | 54,174 | | | | 2,716,826 | |
| PTC Therapeutics, Inc.(a) | | | 84,861 | | | | 3,153,435 | |
| Puma Biotechnology, Inc.(a) | | | 48,316 | | | | 149,780 | |
| Radius Health, Inc.(a) | | | 56,810 | | | | 935,093 | |
| RAPT Therapeutics, Inc.(a) | | | 35,439 | | | | 1,157,083 | |
| REGENXBIO, Inc.(a)(b) | | | 51,182 | | | | 1,637,824 | |
| Replimune Group, Inc.(a)(b) | | | 56,221 | | | | 1,601,736 | |
| Rocket Pharmaceuticals, Inc.(a)(b) | | | 76,484 | | | | 1,868,504 | |
| Sage Therapeutics, Inc.(a) | | | 70,686 | | | | 2,750,392 | |
| Sangamo Therapeutics, Inc.(a) | | | 174,825 | | | | 1,449,299 | |
| Savara, Inc.(a)(b) | | | 138,772 | | | | 149,874 | |
| Scholar Rock Holding Corp.(a) | | | 41,429 | | | | 1,099,940 | |
| Selecta Biosciences, Inc.(a) | | | 138,372 | | | | 415,116 | |
| Sensei Biotherapeutics, Inc.(a) | | | 36,742 | | | | 252,785 | |
| Seres Therapeutics, Inc.(a)(b) | | | 110,284 | | | | 1,186,656 | |
| SpringWorks Therapeutics, Inc.(a) | | | 59,118 | | | | 4,247,628 | |
| Spruce Biosciences, Inc.(a)(b) | | | 27,696 | | | | 71,456 | |
| Stoke Therapeutics, Inc.(a) | | | 44,140 | | | | 1,099,086 | |
| Syndax Pharmaceuticals, Inc.(a) | | | 58,417 | | | | 932,919 | |
| Syros Pharmaceuticals, Inc.(a)(b) | | | 74,486 | | | | 294,965 | |
| TG Therapeutics, Inc.(a) | | | 171,759 | | | | 2,610,737 | |
| Travere Therapeutics, Inc.(a) | | | 73,043 | | | | 2,085,378 | |
| Vanda Pharmaceuticals, Inc.(a) | | | 66,933 | | | | 1,084,315 | |
| Verastem, Inc.(a) | | | 217,399 | | | | 580,455 | |
| Vericel Corp.(a)(b) | | | 56,056 | | | | 2,085,844 | |
| Viking Therapeutics, Inc.(a)(b) | | | 94,057 | | | | 499,443 | |
| Vir Biotechnology, Inc.(a) | | | 157,079 | | | | 7,448,686 | |
| VistaGen Therapeutics, Inc.(a) | | | 232,097 | | | | 447,947 | |
| XBiotech, Inc. | | | 36,494 | | | | 460,554 | |
| Xencor, Inc.(a) | | | 70,114 | | | | 2,539,529 | |
| Xenon Pharmaceuticals, Inc.(a) | | | 49,445 | | | | 1,320,182 | |
| Y-mAbs Therapeutics, Inc.(a)(b) | | | 52,337 | | | | 893,916 | |
| Security Description | | Shares | | | Value | |
| Biotechnology (continued) | | | | | | | | |
| Zymeworks, Inc.(a)(b) | | | 55,765 | | | $ | 1,121,434 | |
| Total Biotechnology | | | | | | | 188,833,284 | |
| | | | | | | | | |
| TOTAL COMMON STOCKS | | | | | | | | |
| (Cost $215,529,696) | | | | | | | 188,833,284 | |
| | | 7 Day Yield | | | Shares | | | Value | |
| SHORT TERM INVESTMENTS (3.62%) | | | | | | | | | |
| Money Market Fund (0.09%) | | | | | | | | | |
| State Street Institutional Treasury Plus Money Market Fund | | | | | | | | | | | | |
| (Cost $173,428) | | | 0.01 | % | | | 173,428 | | | | 173,428 | |
| | | | | | | | | | | | | |
| Investments Purchased with Collateral | | | | | | | | | | | | |
| from Securities Loaned (3.53%) | | | | | | | | | | | | |
| State Street Navigator Securities Lending Government Money Market Portfolio, 0.03% | | | | | | | | | | | | |
| (Cost $6,666,410) | | | | | | | 6,666,410 | | | | 6,666,410 | |
| TOTAL SHORT TERM INVESTMENTS | | | | | | | | | | | | |
| (Cost $6,839,838) | | | | | | | | | | | 6,839,838 | |
| | | | | | | | | | | | | |
| TOTAL INVESTMENTS (103.57%) | | | | | | | | | | | | |
| (Cost $222,369,534) | | | | | | | | | | $ | 195,673,122 | |
| LIABILITIES IN EXCESS OF OTHER ASSETS (-3.57%) | | | | | | | | | | | (6,743,807 | ) |
| NET ASSETS - 100.00% | | | | | | | | | | $ | 188,929,315 | |
| (a) | Non-income producing security. |
| (b) | Security, or a portion of the security position is currently on loan. The total market value of securities on loan is $16,199,748. |
See Notes to Financial Statements.
| ALPS ETF Trust | |
| Statements of Assets and Liabilities | November 30, 2021 |
| | | ALPS Clean Energy ETF | | | ALPS Disruptive Technologies ETF | | | ALPS Global Travel Beneficiaries ETF | | | ALPS Medical Breakthroughs ETF | |
| ASSETS: | | | | | | | | | | | | | | | | |
| Investments, at value | | $ | 1,066,972,179 | | | $ | 240,823,797 | | | $ | 7,681,402 | | | $ | 195,673,122 | |
| Foreign Currency, at value (Cost $52,743, $–, $– and $–) | | | 52,743 | | | | – | | | | – | | | | – | |
| Dividends receivable | | | 972,541 | | | | 131,840 | | | | 3,409 | | | | 6,673 | |
| Receivable for investments sold | | | 26,465,996 | | | | – | | | | – | | | | – | |
| Total Assets | | | 1,094,463,459 | | | | 240,955,637 | | | | 7,684,811 | | | | 195,679,795 | |
| | | | | | | | | | | | | | | | | |
| LIABILITIES: | | | | | | | | | | | | | | | | |
| Payable to adviser | | | 491,022 | | | | 102,945 | | | | 4,465 | | | | 84,070 | |
| Payable for investments purchased | | | 22,930,211 | | | | – | | | | – | | | | – | |
| Payable for capital shares redeemed | | | 3,784,265 | | | | – | | | | – | | | | – | |
| Payable for collateral upon return of securities loaned | | | 52,491,002 | | | | 3,307,091 | | | | 15,322 | | | | 6,666,410 | |
| Other payables | | | – | | | | – | | | | 14 | | | | – | |
| Total Liabilities | | | 79,696,500 | | | | 3,410,036 | | | | 19,801 | | | | 6,750,480 | |
| NET ASSETS | | $ | 1,014,766,959 | | | $ | 237,545,601 | | | $ | 7,665,010 | | | $ | 188,929,315 | |
| | | | | | | | | | | | | | | | | |
| NET ASSETS CONSIST OF: | | | | | | | | | | | | | | | | |
| Paid-in capital | | $ | 931,412,922 | | | $ | 196,610,272 | | | $ | 8,047,426 | | | $ | 294,227,122 | |
| Total distributable earnings | | | 83,354,037 | | | | 40,935,329 | | | | (382,416 | ) | | | (105,297,807 | ) |
| NET ASSETS | | $ | 1,014,766,959 | | | $ | 237,545,601 | | | $ | 7,665,010 | | | $ | 188,929,315 | |
| | | | | | | | | | | | | | | | | |
| INVESTMENTS, AT COST | | $ | 934,385,814 | | | $ | 195,631,194 | | | $ | 8,056,591 | | | $ | 222,369,534 | |
| | | | | | | | | | | | | | | | | |
| PRICING OF SHARES | | | | | | | | | | | | | | | | |
| Net Assets | | $ | 1,014,766,959 | | | $ | 237,545,601 | | | $ | 7,665,010 | | | $ | 188,929,315 | |
| Shares of beneficial interest outstanding (Unlimited number of shares authorized, par value $0.01 per share) | | | 13,725,002 | | | | 4,925,002 | | | | 325,002 | | | | 4,400,000 | |
| Net Asset Value, offering and redemption price per share | | $ | 73.94 | | | $ | 48.23 | | | $ | 23.58 | | | $ | 42.94 | |
See Notes to Financial Statements.
| ALPS ETF Trust | |
| Statements of Operations | For the Year or Period Ended November 30, 2021 |
| | | ALPS Clean Energy ETF | | | ALPS Disruptive Technologies ETF | | | ALPS Global Travel Beneficiaries ETF(a) | | | ALPS Medical Breakthroughs ETF | |
| INVESTMENT INCOME: | | | | | | | | | | | | | | | | |
| Dividends* | | $ | 5,433,351 | | | $ | 1,662,790 | | | $ | 22,409 | | | $ | 83,457 | |
| Securities Lending Income | | | 2,367,667 | | | | 100,942 | | | | 9 | | | | 257,389 | |
| Total Investment Income | | | 7,801,018 | | | | 1,763,732 | | | | 22,418 | | | | 340,846 | |
| | | | | | | | | | | | | | | | | |
| EXPENSES: | | | | | | | | | | | | | | | | |
| Investment adviser fees | | | 5,308,533 | | | | 1,087,310 | | | | 9,936 | | | | 1,193,016 | |
| Total Expenses | | | 5,308,533 | | | | 1,087,310 | | | | 9,936 | | | | 1,193,016 | |
| NET INVESTMENT INCOME/(LOSS) | | | 2,492,485 | | | | 676,422 | | | | 12,482 | | | | (852,170 | ) |
| | | | | | | | | | | | | | | | | |
| REALIZED AND UNREALIZED GAIN/LOSS | | | | | | | | | | | | | | | | |
| Net realized gain/(loss) on investments(b) | | | 85,375,057 | | | | 14,581,057 | | | | (19,426 | ) | | | 46,250,415 | |
| Net realized gain/(loss) on foreign currency transactions | | | 28,395 | | | | (15,248 | ) | | | (287 | ) | | | – | |
| Total net realized gain/(loss) | | | 85,403,452 | | | | 14,565,809 | | | | (19,713 | ) | | | 46,250,415 | |
| Net change in unrealized appreciation/(depreciation) on | | | | | | | | | | | | | | | | |
| investments | | | (103,055,187 | ) | | | 5,498,212 | | | | (375,189 | ) | | | (77,077,650 | ) |
| Net change in unrealized appreciation/(depreciation) on translation of assets and liabilities denominated in foreign currencies | | | (3,123 | ) | | | (627 | ) | | | 4 | | | | – | |
| Total net change in unrealized appreciation/(depreciation) | | | (103,058,310 | ) | | | 5,497,585 | | | | (375,185 | ) | | | (77,077,650 | ) |
| NET REALIZED AND UNREALIZED GAIN/LOSS ON INVESTMENTS | | | (17,654,858 | ) | | | 20,063,394 | | | | (394,898 | ) | | | (30,827,235 | ) |
| NET INCREASE/(DECREASE) IN NET ASSETS RESULTING FROM OPERATIONS | | $ | (15,162,373 | ) | | $ | 20,739,816 | | | $ | (382,416 | ) | | $ | (31,679,405 | ) |
| *Net of foreign tax withholding. | | $ | 472,545 | | | $ | 65,131 | | | $ | 757 | | | $ | 14,300 | |
| (a) | The ALPS Global Travel Beneficiaries ETF commenced operations on September 8, 2021. |
| (b) | Includes realized gain or loss as a result of in-kind transactions (See Note 4 in Notes to Financial Statements). |
See Notes to Financial Statements.
| ALPS Clean Energy ETF |
| Statement of Changes in Net Assets |
| | | For the Year Ended November 30, 2021 | | | For the Year Ended November 30, 2020 | |
| OPERATIONS: | | | | | | | | |
| Net investment income | | $ | 2,492,485 | | | $ | 1,394,194 | |
| Net realized gain | | | 85,403,452 | | | | 25,462,409 | |
| Net change in unrealized appreciation/(depreciation) | | | (103,058,310 | ) | | | 221,185,662 | |
| Net increase/(decrease) in net assets resulting from operations | | | (15,162,373 | ) | | | 248,042,265 | |
| | | | | | | | | |
| DISTRIBUTIONS TO SHAREHOLDERS: | | | | | | | | |
| From distributable earnings | | | (2,023,844 | ) | | | (671,822 | ) |
| From tax return of capital | | | (3,160,255 | ) | | | (1,796,052 | ) |
| Total distributions | | | (5,184,099 | ) | | | (2,467,874 | ) |
| | | | | | | | | |
| CAPITAL SHARE TRANSACTIONS: | | | | | | | | |
| Proceeds from sale of shares | | | 667,197,824 | | | | 307,508,147 | |
| Cost of shares redeemed | | | (241,541,495 | ) | | | (49,984,572 | ) |
| Net increase from capital share transactions | | | 425,656,329 | | | | 257,523,575 | |
| Net increase in net assets | | | 405,309,857 | | | | 503,097,966 | |
| | | | | | | | | |
| NET ASSETS: | | | | | | | | |
| Beginning of year | | | 609,457,102 | | | | 106,359,136 | |
| End of year | | $ | 1,014,766,959 | | | $ | 609,457,102 | |
| | | | | | | | | |
| OTHER INFORMATION: | | | | | | | | |
| CAPITAL SHARE TRANSACTIONS: | | | | | | | | |
| Beginning shares | | | 8,700,002 | | | | 3,300,002 | |
| Shares sold | | | 8,400,000 | | | | 6,400,000 | |
| Shares redeemed | | | (3,375,000 | ) | | | (1,000,000 | ) |
| Shares outstanding, end of period | | | 13,725,002 | | | | 8,700,002 | |
See Notes to Financial Statements.
| ALPS Disruptive Technologies ETF |
| Statement of Changes in Net Assets |
| | | For the Year Ended November 30, 2021 | | | For the Year Ended November 30, 2020 | |
| OPERATIONS: | | | | | | | | |
| Net investment income | | $ | 676,422 | | | $ | 680,608 | |
| Net realized gain/(loss) | | | 14,565,809 | | | | (27,973 | ) |
| Net change in unrealized appreciation | | | 5,497,585 | | | | 30,918,437 | |
| Net increase in net assets resulting from operations | | | 20,739,816 | | | | 31,571,072 | |
| | | | | | | | | |
| DISTRIBUTIONS TO SHAREHOLDERS: | | | | | | | | |
| From distributable earnings | | | (633,863 | ) | | | (330,120 | ) |
| Total distributions | | | (633,863 | ) | | | (330,120 | ) |
| | | | | | | | | |
| CAPITAL SHARE TRANSACTIONS: | | | | | | | | |
| Proceeds from sale of shares | | | 100,271,458 | | | | 50,822,701 | |
| Cost of shares redeemed | | | (33,290,851 | ) | | | (6,514,699 | ) |
| Net increase from capital share transactions | | | 66,980,607 | | | | 44,308,002 | |
| Net increase in net assets | | | 87,086,560 | | | | 75,548,954 | |
| | | | | | | | | |
| NET ASSETS: | | | | | | | | |
| Beginning of year | | | 150,459,041 | | | | 74,910,087 | |
| End of year | | $ | 237,545,601 | | | $ | 150,459,041 | |
| | | | | | | | | |
| OTHER INFORMATION: | | | | | | | | |
| CAPITAL SHARE TRANSACTIONS: | | | | | | | | |
| Beginning shares | | | 3,500,002 | | | | 2,350,002 | |
| Shares sold | | | 2,125,000 | | | | 1,350,000 | |
| Shares redeemed | | | (700,000 | ) | | | (200,000 | ) |
| Shares outstanding, end of period | | | 4,925,002 | | | | 3,500,002 | |
See Notes to Financial Statements.
| ALPS Global Travel Beneficiaries ETF |
| Statement of Changes in Net Assets |
| | | For the Period September 8, 2021 (Commencement of Operations) to November 30, 2021 | |
| OPERATIONS: | | | | |
| Net investment income | | $ | 12,482 | |
| Net realized loss | | | (19,713 | ) |
| Net change in unrealized depreciation | | | (375,185 | ) |
| Net decrease in net assets resulting from operations | | | (382,416 | ) |
| | | | | |
| CAPITAL SHARE TRANSACTIONS: | | | | |
| Proceeds from sale of shares | | | 8,047,426 | |
| Net increase from capital share transactions | | | 8,047,426 | |
| Net increase in net assets | | | 7,665,010 | |
| | | | | |
| NET ASSETS: | | | | |
| Beginning of period | | | – | |
| End of period | | $ | 7,665,010 | |
| | | | | |
| OTHER INFORMATION: | | | | |
| CAPITAL SHARE TRANSACTIONS: | | | | |
| Beginning shares | | | – | |
| Shares sold | | | 325,002 | |
| Shares outstanding, end of period | | | 325,002 | |
See Notes to Financial Statements.
| ALPS Medical Breakthroughs ETF |
| Statements of Changes in Net Assets |
| | | For the Year Ended November 30, 2021 | | | For the Year Ended November 30, 2020 | |
| OPERATIONS: | | | | | | | | |
| Net investment loss | | $ | (852,170 | ) | | $ | (647,914 | ) |
| Net realized gain | | | 46,250,415 | | | | 8,402,482 | |
| Net change in unrealized appreciation/(depreciation) | | | (77,077,650 | ) | | | 25,696,634 | |
| Net increase/(decrease) in net assets resulting from operations | | | (31,679,405 | ) | | | 33,451,202 | |
| | | | | | | | | |
| DISTRIBUTIONS TO SHAREHOLDERS: | | | | | | | | |
| From distributable earnings | | | – | | | | (84,005 | ) |
| Total distributions | | | – | | | | (84,005 | ) |
| | | | | | | | | |
| CAPITAL SHARE TRANSACTIONS: | | | | | | | | |
| Proceeds from sale of shares | | | 97,970,744 | | | | 67,423,531 | |
| Cost of shares redeemed | | | (119,904,054 | ) | | | (55,818,424 | ) |
| Net increase/(decrease) from capital share transactions | | | (21,933,310 | ) | | | 11,605,107 | |
| Net increase/(decrease) in net assets | | | (53,612,715 | ) | | | 44,972,304 | |
| | | | | | | | | |
| NET ASSETS: | | | | | | | | |
| Beginning of year | | | 242,542,030 | | | | 197,569,726 | |
| End of year | | $ | 188,929,315 | | | $ | 242,542,030 | |
| | | | | | | | | |
| OTHER INFORMATION: | | | | | | | | |
| CAPITAL SHARE TRANSACTIONS: | | | | | | | | |
| Beginning shares | | | 4,950,000 | | | | 5,000,000 | |
| Shares sold | | | 1,800,000 | | | | 1,550,000 | |
| Shares redeemed | | | (2,350,000 | ) | | | (1,600,000 | ) |
| Shares outstanding, end of period | | | 4,400,000 | | | | 4,950,000 | |
See Notes to Financial Statements.
| ALPS Clean Energy ETF | |
| Financial Highlights | For a Share Outstanding Throughout the Periods Presented |
| | | For the Year Ended November 30, 2021 | | | For the Year Ended November 30, 2020 | | | For the Year Ended November 30, 2019 | | | For the Period June 28, 2018 (Commencement of Operations) to November 30, 2018 | |
| NET ASSET VALUE, BEGINNING OF PERIOD | | $ | 70.05 | | | $ | 32.23 | | | $ | 25.03 | | | $ | 24.95 | |
| | | | | | | | | | | | | | | | | |
| INCOME/(LOSS) FROM INVESTMENT OPERATIONS: | | | | | | | | | | | | | | | | |
| Net investment income (a) | | | 0.20 | | | | 0.25 | | | | 0.32 | | | | 0.09 | |
| Net realized and unrealized gain/(loss) | | | 4.11 | | | | 38.08 | | | | 7.42 | | | | (0.01 | ) |
| Total from investment operations | | | 4.31 | | | | 38.33 | | | | 7.74 | | | | 0.08 | |
| | | | | | | | | | | | | | | | | |
| DISTRIBUTIONS: | | | | | | | | | | | | | | | | |
| From net investment income | | | (0.17 | ) | | | (0.18 | ) | | | (0.23 | ) | | | – | |
| Tax return of capital | | | (0.25 | ) | | | (0.33 | ) | | | (0.31 | ) | | | – | |
| Total distributions | | | (0.42 | ) | | | (0.51 | ) | | | (0.54 | ) | | | – | |
| | | | | | | | | | | | | | | | | |
| Net increase in net asset value | | | 3.89 | | | | 37.82 | | | | 7.20 | | | | 0.08 | |
| NET ASSET VALUE, END OF PERIOD | | $ | 73.94 | | | $ | 70.05 | | | $ | 32.23 | | | $ | 25.03 | |
| TOTAL RETURN(b) | | | 6.16 | % | | | 120.45 | % | | | 31.28 | % | | | 0.32 | % |
| | | | | | | | | | | | | | | | | |
| RATIOS/SUPPLEMENTAL DATA: | | | | | | | | | | | | | | | | |
| Net assets, end of period (000s) | | $ | 1,014,767 | | | $ | 609,457 | | | $ | 106,359 | | | $ | 16,271 | |
| | | | | | | | | | | | | | | | | |
| Ratio of expenses to average net assets | | | 0.56 | %(c) | | | 0.65 | % | | | 0.65 | % | | | 0.65 | %(d) |
| Ratio of net investment income to average net assets | | | 0.26 | % | | | 0.57 | % | | | 1.10 | % | | | 0.89 | %(d) |
| Portfolio turnover rate(e) | | | 39 | % | | | 34 | % | | | 15 | % | | | 9 | % |
| (a) | Based on average shares outstanding during the period. |
| (b) | Total return is calculated assuming an initial investment made at the net asset value at the beginning of the period and redemption at the net asset value on the last day of the period and assuming all distributions are reinvested at reinvestment prices. Total return calculated for a period of less than one year is not annualized. |
| (c) | Effective January 1, 2021, the Fund's Advisory Fee changed from 0.65% to 0.55%. |
| (e) | Portfolio turnover for periods less than one year are not annualized and does not include securities received or delivered from processing creations or redemptions in-kind. |
See Notes to Financial Statements.
| ALPS Disruptive Technologies ETF | |
| Financial Highlights | For a Share Outstanding Throughout the Periods Presented |
| | | For the Year Ended November 30, 2021 | | | For the Year Ended November 30, 2020 | | | For the Year Ended November 30, 2019 | | | For the Period December 28, 2017 (Commencement of Operations) to November 30, 2018 | |
| NET ASSET VALUE, BEGINNING OF PERIOD | | $ | 42.99 | | | $ | 31.88 | | | $ | 26.21 | | | $ | 25.08 | |
| | | | | | | | | | | | | | | | | |
| INCOME/(LOSS) FROM INVESTMENT OPERATIONS: | | | | | | | | | | | | | | | | |
| Net investment income (a) | | | 0.15 | | | | 0.25 | | | | 0.14 | | | | 0.13 | |
| Net realized and unrealized gain | | | 5.26 | | | | 11.00 | | | | 5.61 | | | | 1.00 | (b) |
| Total from investment operations | | | 5.41 | | | | 11.25 | | | | 5.75 | | | | 1.13 | |
| | | | | | | | | | | | | | | | | |
| DISTRIBUTIONS: | | | | | | | | | | | | | | | | |
| From net investment income | | | (0.17 | ) | | | (0.14 | ) | | | (0.08 | ) | | | – | |
| Total distributions | | | (0.17 | ) | | | (0.14 | ) | | | (0.08 | ) | | | – | |
| | | | | | | | | | | | | | | | | |
| Net increase in net asset value | | | 5.24 | | | | 11.11 | | | | 5.67 | | | | 1.13 | |
| NET ASSET VALUE, END OF PERIOD | | $ | 48.23 | | | $ | 42.99 | | | $ | 31.88 | | | $ | 26.21 | |
| TOTAL RETURN(c) | | | 12.60 | % | | | 35.42 | % | | | 22.04 | % | | | 4.47 | % |
| | | | | | | | | | | | | | | | | |
| RATIOS/SUPPLEMENTAL DATA: | | | | | | | | | | | | | | | | |
| Net assets, end of period (000s) | | $ | 237,546 | | | $ | 150,459 | | | $ | 74,910 | | | $ | 48,483 | |
| | | | | | | | | | | | | | | | | |
| Ratio of expenses to average net assets | | | 0.50 | % | | | 0.50 | % | | | 0.50 | % | | | 0.50 | %(d) |
| Ratio of net investment income to average net assets | | | 0.31 | % | | | 0.72 | % | | | 0.48 | % | | | 0.53 | %(d) |
| Portfolio turnover rate(e) | | | 26 | % | | | 38 | % | | | 42 | % | | | 33 | % |
| (a) | Based on average shares outstanding during the period. |
| (b) | Net realized and unrealized loss on investments per share does not correlate to aggregate of the net realized and unrealized gain in the Statements of Operations for the period ended November 30, 2018, primarily due to the timing of the sales and repurchases of the Fund's shares in relation to the fluctuating market values for the Fund's portfolio. |
| (c) | Total return is calculated assuming an initial investment made at the net asset value at the beginning of the period and redemption at the net asset value on the last day of the period and assuming all distributions are reinvested at reinvestment prices. Total return calculated for a period of less than one year is not annualized. |
| (e) | Portfolio turnover for periods less than one year are not annualized and does not include securities received or delivered from processing creations or redemptions in-kind. |
See Notes to Financial Statements.
| ALPS Global Travel Beneficiaries ETF | |
| Financial Highlights | For a Share Outstanding Throughout the Periods Presented |
| | | For the Period September 8, 2021 (Commencement of Operations) to November 30, 2021 | |
| NET ASSET VALUE, BEGINNING OF PERIOD | | $ | 24.91 | |
| | | | | |
| INCOME/(LOSS) FROM INVESTMENT OPERATIONS: | | | | |
| Net investment income (a) | | | 0.05 | |
| Net realized and unrealized loss | | | (1.38 | ) |
| Total from investment operations | | | (1.33 | ) |
| | | | | |
| Net (decrease) in net asset value | | | (1.33 | ) |
| NET ASSET VALUE, END OF PERIOD | | $ | 23.58 | |
| TOTAL RETURN(b) | | | (5.34 | )% |
| | | | | |
| RATIOS/SUPPLEMENTAL DATA: | | | | |
| Net assets, end of period (000s) | | $ | 7,665 | |
| | | | | |
| Ratio of expenses to average net assets | | | 0.65 | %(c) |
| Ratio of net investment income to average net assets | | | 0.82 | %(c) |
| Portfolio turnover rate(d) | | | 19 | % |
| (a) | Based on average shares outstanding during the period. |
| (b) | Total return is calculated assuming an initial investment made at the net asset value at the beginning of the period and redemption at the net asset value on the last day of the period and assuming all distributions are reinvested at reinvestment prices. Total return calculated for a period of less than one year is not annualized. |
| (d) | Portfolio turnover for periods less than one year are not annualized and does not include securities received or delivered from processing creations or redemptions in-kind. |
See Notes to Financial Statements.
| ALPS Medical Breakthroughs ETF | |
| Financial Highlights | For a Share Outstanding Throughout the Periods Presented |
| | | For the Year Ended November 30, 2021 | | | For the Year Ended November 30, 2020 | | | For the Year Ended November 30, 2019 | | | For the Year Ended November 30, 2018 | | | For the Year Ended November 30, 2017 | |
| NET ASSET VALUE, BEGINNING OF PERIOD | | $ | 49.00 | | | $ | 39.51 | | | $ | 33.59 | | | $ | 31.70 | | | $ | 24.16 | |
| | | | | | | | | | | | | | | | | | | | | |
| INCOME/(LOSS) FROM INVESTMENT OPERATIONS: | | | | | | | | | | | | | | | | | | | | |
| Net investment income/(loss) (a) | | | (0.18 | ) | | | (0.13 | ) | | | 0.03 | | | | (0.10 | ) | | | 0.18 | |
| Net realized and unrealized gain/(loss) | | | (5.88 | ) | | | 9.64 | | | | 6.67 | | | | 2.57 | (b) | | | 7.36 | |
| Total from investment operations | | | (6.06 | ) | | | 9.51 | | | | 6.70 | | | | 2.47 | | | | 7.54 | |
| | | | | | | | | | | | | | | | | | | | | |
| DISTRIBUTIONS: | | | | | | | | | | | | | | | | | | | | |
| From net investment income | | | – | | | | (0.02 | ) | | | (0.78 | ) | | | (0.58 | ) | | | – | |
| Total distributions | | | – | | | | (0.02 | ) | | | (0.78 | ) | | | (0.58 | ) | | | – | |
| | | | | | | | | | | | | | | | | | | | | |
| Net increase/(decrease) in net asset value | | | (6.06 | ) | | | 9.49 | | | | 5.92 | | | | 1.89 | | | | 7.54 | |
| NET ASSET VALUE, END OF PERIOD | | $ | 42.94 | | | $ | 49.00 | | | $ | 39.51 | | | $ | 33.59 | | | $ | 31.70 | |
| TOTAL RETURN(c) | | | (12.37 | )% | | | 24.07 | % | | | 20.99 | % | | | 7.81 | % | | | 31.21 | % |
| | | | | | | | | | | | | | | | | | | | | |
| RATIOS/SUPPLEMENTAL DATA: | | | | | | | | | | | | | | | | | | | | |
| Net assets, end of period (000s) | | $ | 188,929 | | | $ | 242,542 | | | $ | 197,570 | | | $ | 221,694 | | | $ | 128,402 | |
| | | | | | | | | | | | | | | | | | | | | |
| Ratio of expenses to average net assets | | | 0.50 | % | | | 0.50 | % | | | 0.50 | % | | | 0.50 | % | | | 0.50 | % |
| Ratio of net investment income/(loss) to average net assets | | | (0.36 | )% | | | (0.33 | )% | | | 0.09 | % | | | (0.27 | )% | | | 0.66 | % |
| Portfolio turnover rate(d) | | | 81 | % | | | 68 | % | | | 88 | % | | | 48 | % | | | 43 | % |
| (a) | Based on average shares outstanding during the period. |
| (b) | Net realized and unrealized loss on investments per share does not correlate to aggregate of the net realized and unrealized gain in the Statements of Operations for the year ended November 30, 2018, primarily due to the timing of the sales and repurchases of the Fund's shares in relation to the fluctuating market values for the Fund's portfolio. |
| (c) | Total return is calculated assuming an initial investment made at the net asset value at the beginning of the period and redemption at the net asset value on the last day of the period and assuming all distributions are reinvested at reinvestment prices. Total return calculated for a period of less than one year is not annualized. |
| (d) | Portfolio turnover for periods less than one year are not annualized and does not include securities received or delivered from processing creations or redemptions in-kind. |
See Notes to Financial Statements.
| ALPS ETF Trust | |
| Notes to Financial Statements | November 30, 2021 |
1. ORGANIZATION
ALPS ETF Trust (the “Trust”), a Delaware statutory trust, is an open-end management investment company registered under the Investment Company Act of 1940, as amended (the “1940 Act”). As of November 30, 2021, the Trust consisted of eighteen separate portfolios. Each portfolio represents a separate series of the Trust. This report pertains to the ALPS Clean Energy ETF, ALPS Disruptive Technologies ETF, ALPS Global Travel Beneficiaries ETF and the ALPS Medical Breakthroughs (each a “Fund” and collectively, the ���Funds”). ALPS Clean Energy ETF is considered non-diversified and may invest a greater portion of assets in securities of individual issuers than a diversified fund. As a result, changes in the market value of a single investment could cause greater fluctuations in share price than would occur in a diversified fund. ALPS Disruptive Technologies ETF, ALPS Global Travel Beneficiaries ETF and ALPS Medical Breakthroughs ETF have elected to qualify as a diversified series of the Trust under the 1940 Act.
The investment objective of the ALPS Clean Energy ETF is to seek investment results that correspond generally, before fees and expenses, to the performance of the CIBC Atlas Clean Energy Total Return Index. The investment objective of the ALPS Disruptive Technologies ETF is to seek investment results that correspond generally, before fees and expenses, to the performance of the Indxx Disruptive Technologies Total Return Index. The investment objective of the ALPS Global Travel Beneficiaries ETF is to seek investment results that correspond generally, before fees and expenses, to the performance of the S-Network Global Travel Index. The investment objective of the ALPS Medical Breakthroughs ETF is to seek investment results that correspond generally, before fees and expenses, to the performance of the S-Network Medical Breakthroughs Total Return Index.
The shares of the ALPS Clean Energy ETF, ALPS Disruptive Technologies ETF, the ALPS Global Travel Beneficiaries ETF and the ALPS Medical Breakthroughs ETF (“Shares”) are listed on the NYSE Arca, Inc. (the “NYSE Arca”). Each Fund issues and redeems Shares at net asset value (“NAV”) in blocks of 25,000 Shares, each of which is called a “Creation Unit”. Creation Units are issued and redeemed principally in-kind for securities included in the Underlying Index. Except when aggregated in Creation Units, Shares are not redeemable securities of the Fund. On October 1, 2021, ALPS Clean Energy ETF, ALPS Disruptive Technologies ETF and ALPS Medical Breakthroughs ETF each reduced its Creation Unit size from 50,000 to 25,000 shares.
Pursuant to the Trust’s organizational documents, its Officers and Trustees are indemnified against certain liability arising out of the performance of their duties to the Trust. Additionally, in the normal course of business, the Trust enters into contracts with service providers that contain general indemnification clauses. The Trust’s maximum exposure under these arrangements is unknown, as this would involve future claims that may be made against the Trust that have not yet occurred.
2. SIGNIFICANT ACCOUNTING POLICIES
The following is a summary of significant accounting policies consistently followed by the Funds in the preparation of the financial statements. The accompanying financial statements were prepared in accordance with accounting principles generally accepted in the United States of America (“U.S. GAAP”). The preparation of financial statements in conformity with U.S. GAAP requires management to make certain estimates and assumptions that affect the reported amounts of assets and liabilities and disclosures of contingent assets and liabilities at the date of the financial statements and the reported amounts of revenue and expenses during the period. Actual results could differ from those estimates. Each Fund is considered an investment company under U.S. GAAP and follows the accounting and reporting guidance applicable to investment companies in the Financial Accounting Standards Board (“FASB”) Accounting Standards Codification Topic 946.
A. Portfolio Valuation
Each Fund’s NAV is determined daily, as of the close of regular trading on the New York Stock Exchange (the “NYSE”), normally 4:00 p.m. Eastern time, on each day the NYSE is open for trading. The NAV is computed by dividing the value of all assets of the Fund (including accrued interest and dividends), less all liabilities (including accrued expenses and dividends declared but unpaid), by the total number of shares outstanding.
Portfolio securities listed on any exchange other than the NASDAQ Stock Market LLC (“NASDAQ”) are valued at the last sale price on the business day as of which such value is being determined. If there has been no sale on such day, the securities are valued at the mean of the most recent bid and ask prices on such day. Securities traded on the NASDAQ are valued at the NASDAQ Official Closing Price as determined by NASDAQ. Portfolio securities traded on more than one securities exchange are valued at the last sale price on the business day as of which such value is being determined at the close of the exchange representing the principal market for such securities. Portfolio securities traded in the over-the-counter market, but excluding securities traded on the NASDAQ, are valued at the last quoted sale price in such market.
The Funds’ investments are valued at market value or, in the absence of market value with respect to any portfolio securities, at fair value according to procedures adopted by the Trust’s Board of Trustees (the “Board”). When market quotations are not readily available or when events occur that make established valuation methods unreliable, securities of the Funds may be valued in good faith by or under the direction of the Board. These securities generally include, but are not limited to, restricted securities (securities which may not be publicly sold without registration under the Securities Act of 1933) for which a pricing service is unable to provide a market price; securities whose trading has been formally suspended; a security whose market price is not available from a pre-established primary pricing source or the pricing source is not willing to provide a price; a security with respect to which an event has occurred that is most likely to materially affect the value of the security after the market has closed but before the calculation of the Fund’s NAV or make it difficult or impossible to obtain a reliable market quotation; or a security whose price, as provided by the pricing service, does not reflect the security’s “fair value” due to the security being de-listed from a national exchange or the security’s primary trading market is temporarily closed at a time when, under normal conditions, it would be open. As a general principle, the current “fair value” of a security would be the amount which the owner might reasonably expect to receive from the sale on the applicable exchange or principal market. A variety of factors may be considered in determining the fair value of such securities.
| ALPS ETF Trust | |
| Notes to Financial Statements | November 30, 2021 |
B. Fair Value Measurements
Each Fund discloses the classification of its fair value measurements following a three-tier hierarchy based on the inputs used to measure fair value. Inputs refer broadly to the assumptions that market participants would use in pricing the asset or liability; including assumptions about risk. Inputs may be observable or unobservable. Observable inputs reflect the assumptions market participants would use in pricing the asset or liability that are developed based on market data obtained from sources independent of the reporting entity. Unobservable inputs reflect the reporting entity’s own assumptions about the assumptions market participants would use in pricing the asset or liability that are developed based on the best information available.
Valuation techniques used to value the Funds’ investments by major category are as follows:
Equity securities, including restricted securities, for which market quotations are readily available, are valued at the last reported sale price or official closing price as reported by a third party pricing vendor on the primary market or exchange on which they are traded and are categorized as Level 1 in the hierarchy. In the event there were no sales during the day or closing prices are not available, securities are valued at the mean of the most recent quoted bid and ask prices on such day and are generally categorized as Level 2 in the hierarchy. Investments in open-end mutual funds are valued at their closing NAV each business day and are categorized as Level 1 in the hierarchy.
Changes in valuation techniques may result in transfers in or out of an assigned level within the disclosure hierarchy.
Various inputs are used in determining the value of each Fund’s investments as of the end of the reporting period. When inputs used fall into different levels of the fair value hierarchy, the level in the hierarchy within which the fair value measurement falls is determined based on the lowest level input that is significant to the fair value measurement in its entirety. The designated input levels are not necessarily an indication of the risk or liquidity associated with these investments.
These inputs are categorized in the following hierarchy under applicable financial accounting standards:
Level 1 – Unadjusted quoted prices in active markets for identical investments, unrestricted assets or liabilities that a Fund has the ability to access at the measurement date;
Level 2 – Quoted prices which are not active, quoted prices for similar assets or liabilities in active markets or inputs other than quoted prices that are observable (either directly or indirectly) for substantially the full term of the asset or liability; and
Level 3 – Significant unobservable prices or inputs (including the Fund’s own assumptions in determining the fair value of investments) where there is little or no market activity for the asset or liability at the measurement date.
| ALPS ETF Trust | |
| Notes to Financial Statements | November 30, 2021 |
The following is a summary of the inputs used to value the Funds’ investments as of November 30, 2021:
ALPS Clean Energy ETF
| Investments in Securities at Value | | Level 1 - Quoted and Unadjusted Prices | | | Level 2 - Other Significant Observable Inputs | | | Level 3 - Significant Unobservable Inputs | | | Total | |
| Common Stocks* | | $ | 906,862,424 | | | $ | – | | | $ | – | | | $ | 906,862,424 | |
| Master Limited Partnerships* | | | 106,640,977 | | | | – | | | | – | | | | 106,640,977 | |
| Short Term Investments | | | 53,468,778 | | | | – | | | | – | | | | 53,468,778 | |
| Total | | $ | 1,066,972,179 | | | $ | – | | | $ | – | | | $ | 1,066,972,179 | |
ALPS Disruptive Technologies ETF
| Investments in Securities at Value | | Level 1 - Quoted and Unadjusted Prices | | | Level 2 - Other Significant Observable Inputs | | | Level 3 - Significant Unobservable Inputs | | | Total | |
| Common Stocks* | | $ | 235,116,794 | | | $ | – | | | $ | – | | | $ | 235,116,794 | |
| Master Limited Partnerships* | | | 2,274,451 | | | | – | | | | – | | | | 2,274,451 | |
| Short Term Investments | | | 3,432,552 | | | | – | | | | – | | | | 3,432,552 | |
| Total | | $ | 240,823,797 | | | $ | – | | | $ | – | | | $ | 240,823,797 | |
ALPS Global Travel Beneficiaries ETF
| Investments in Securities at Value | | Level 1 - Quoted and Unadjusted Prices | | | Level 2 - Other Significant Observable Inputs | | | Level 3 - Significant Unobservable Inputs | | | Total | |
| Common Stocks* | | $ | 7,655,852 | | | $ | – | | | $ | – | | | $ | 7,655,852 | |
| Short Term Investments | | | 25,550 | | | | – | | | | – | | | | 25,550 | |
| Total | | $ | 7,681,402 | | | $ | – | | | $ | – | | | $ | 7,681,402 | |
ALPS Medical Breakthroughs ETF
| Investments in Securities at Value | | Level 1 - Quoted and Unadjusted Prices | | | Level 2 - Other Significant Observable Inputs | | | Level 3 - Significant Unobservable Inputs | | | Total | |
| Common Stocks* | | $ | 188,833,284 | | | $ | – | | | $ | – | | | $ | 188,833,284 | |
| Short Term Investments | | | 6,839,838 | | | | – | | | | – | | | | 6,839,838 | |
| Total | | $ | 195,673,122 | | | $ | – | | | $ | – | | | $ | 195,673,122 | |
| * | For a detailed sector breakdown, see the accompanying Schedule of Investments. |
The Funds did not have any securities that used significant unobservable inputs (Level 3) in determining fair value and there were no transfers into or out of Level 3 during the year ended November 30, 2021.
C. Foreign Investment Risk
The Funds may directly purchase securities of foreign issuers. Investments in non-U.S. issuers may involve unique risks compared to investing in securities of U.S. issuers, including, among others, less liquidity generally, greater market volatility than U.S. securities and less complete financial information than for U.S. issuers. In addition, adverse political, economic or social developments could undermine the value of the Fund’s investments or prevent the Fund from realizing the full value of its investments. Financial reporting standards for companies based in foreign markets differ from those in the United States. Finally, the value of the currency of the country in which the Fund has invested could decline relative to the value of the U.S. dollar, which may affect the value of the investment to U.S. investors. The Fund will not enter into transactions to hedge against declines in the value of the Fund’s assets that are denominated in foreign currency.
Countries with emerging markets may have relatively unstable governments and may present the risks of nationalization of businesses, restrictions on foreign ownership and prohibitions on the repatriation of assets. The economies of emerging markets countries also may be based on only a few industries, making them more vulnerable to changes in local or global trade conditions and more sensitive to debt burdens, inflation rates or adverse news and events.
| ALPS ETF Trust | |
| Notes to Financial Statements | November 30, 2021 |
Because foreign markets may be open on different days than the days during which investors may purchase the shares of the Fund, the value of the Funds’ securities may change on the days when investors are not able to purchase the shares of the Fund. The value of securities denominated in foreign currencies is converted into U.S. dollars using exchange rates determined daily as of the close of regular trading on the NYSE. Any use of a different rate from the rates used by the Index may adversely affect a Fund's ability to track its Index.
D. Foreign Currency Translation
The books and records of the Funds are maintained in U.S. dollars. Investment valuations and other assets and liabilities initially expressed in foreign currencies are converted each business day into U.S. dollars based upon current exchange rates. The portion of realized and unrealized gains or losses on investments due to fluctuations in foreign currency exchange rates is not separately disclosed and is included in realized and unrealized gains or losses on investments, when applicable.
E. Securities Transactions and Investment Income
Securities transactions are recorded as of the trade date. Realized gains and losses from securities transactions are recorded on the specific identification in accordance with GAAP. Dividend income and capital gains distributions, if any, are recorded on the ex-dividend date, net of any foreign taxes withheld. Interest income, if any, is recorded on the accrual basis.
F. Dividends and Distributions to Shareholders
Dividends from net investment income for the ALPS Disruptive Technology ETF, the ALPS Global Travel Beneficiaries ETF and the ALPS Medical Breakthroughs ETF, if any, are declared and paid annually or as the Board may determine from time to time. Dividends from net investment income for ALPS Clean Energy ETF, if any, are declared and paid quarterly or as the Board may determine from time to time. Distributions of net realized capital gains earned by the Funds, if any, are distributed at least annually.
G. Federal Tax and Tax Basis Information
The timing and character of income and capital gain distributions are determined in accordance with income tax regulations, which may differ from U.S. GAAP. Reclassifications are made to the Funds’ capital accounts for permanent tax differences to reflect income and gains available for distribution (or available capital loss carryforwards) under income tax regulations.
For the year ended November 30, 2021, the following reclassifications, which had no impact on results of operations or net assets, were recorded to reflect permanent tax differences resulting primarily from in-kind transactions:
| Fund | | Paid-in Capital | | | Total Distributable Earnings | |
| ALPS Clean Energy ETF | | $ | 129,568,999 | | | $ | (129,568,999 | ) |
| ALPS Disruptive Technologies ETF | | | 15,095,424 | | | | (15,095,424 | ) |
| ALPS Global Travel Beneficiaries ETF | | | – | | | | – | |
| ALPS Medical Breakthroughs ETF | | | 46,828,239 | | | | (46,828,239 | ) |
For ALPS Medical Breakthroughs ETF, included in the amounts reclassified was a net operating loss offset to Paid-in Capital in the amount of $617,193.
The tax character of the distributions paid during the fiscal years ended November 30, 2021 and November 30, 2020 was as follows:
| | | Ordinary Income | | | Long-Term Capital Gain | | | Return of Capital | |
| November 30, 2021 | | | | | | | | | | | | |
| ALPS Clean Energy ETF | | $ | 2,023,844 | | | $ | – | | | $ | 3,160,255 | |
| ALPS Disruptive Technologies ETF | | | 633,863 | | | | – | | | | – | |
| ALPS Global Travel Beneficiaries ETF | | | – | | | | – | | | | – | |
| ALPS Medical Breakthroughs ETF | | | – | | | | – | | | | – | |
| ALPS ETF Trust | |
| Notes to Financial Statements | November 30, 2021 |
| | | Ordinary Income | | | Long-Term Capital Gain | | | Return of Capital | |
| November 30, 2020 | | | | | | | | | | | | |
| ALPS Clean Energy ETF | | $ | 671,822 | | | $ | – | | | $ | 1,796,052 | |
| ALPS Disruptive Technologies ETF | | | 330,120 | | | | – | | | | – | |
| ALPS Global Travel Beneficiaries ETF | | | – | | | | – | | | | – | |
| ALPS Medical Breakthroughs ETF | | | 84,005 | | | | – | | | | – | |
The character of distributions made during the year may differ from its ultimate characterization for federal income tax purposes.
Under current law, capital losses maintain their character as short-term or long-term and are carried forward to the next tax year without expiration. As of November 30, 2021, the following amounts are available as carry forwards to the next tax year:
| Fund | | Short-Term | | | Long-Term | |
| ALPS Clean Energy ETF | | $ | 47,831,913 | | | $ | – | |
| ALPS Disruptive Technologies ETF | | | 2,798,682 | | | | 1,737,476 | |
| ALPS Global Travel Beneficiaries ETF | | | 15,333 | | | | – | |
| ALPS Medical Breakthroughs ETF | | | 44,254,973 | | | | 32,473,807 | |
The ALPS Medical Breakthrough ETF elects to defer to the year ending November 30, 2022, late year ordinary losses in the amount of $774,798.
As of November 30, 2021, the components of distributable earnings on a tax basis for each Fund were as follows:
| | | Accumulated net investment income | | | Accumulated net realized loss on investments | | | Other accumulated losses | | | Net unrealized appreciation/ (depreciation) on investments | | | Total | |
| ALPS Clean Energy ETF | | | – | | | $ | (47,831,913 | ) | | $ | (485,549 | ) | | $ | 131,671,499 | | | $ | 83,354,037 | |
| ALPS Disruptive Technologies ETF | | | 524,750 | | | | (4,536,158 | ) | | | – | | | | 44,946,737 | | | | 40,935,329 | |
| ALPS Global Travel Beneficiaries ETF | | | 12,195 | | | | (15,333 | ) | | | – | | | | (379,278 | ) | | | (382,416 | ) |
| ALPS Medical Breakthroughs ETF | | | – | | | | (77,503,578 | ) | | | – | | | | (27,794,229 | ) | | | (105,297,807 | ) |
As of November 30, 2021 the cost of investments for federal income tax purposes and accumulated net unrealized appreciation/(depreciation) on investments were as follows:
| | | ALPS Clean Energy ETF | | | ALPS Disruptive Technologies ETF | | | ALPS Global Travel Beneficiaries ETF | | | ALPS Medical Breakthroughs ETF | |
| Gross appreciation (excess of value over tax cost) | | $ | 239,027,862 | | | $ | 60,155,254 | | | $ | 233,763 | | | $ | 29,975,314 | |
| Gross depreciation (excess of tax cost over value) | | | (107,353,141 | ) | | | (15,208,350 | ) | | | (613,045 | ) | | | (57,769,543 | ) |
| Net depreciation of foreign currency | | | (3,222 | ) | | | (167 | ) | | | 4 | | | | – | |
| Net unrealized appreciation (depreciation) | | $ | 131,671,499 | | | $ | 44,946,737 | | | $ | (379,278 | ) | | $ | (27,794,229 | ) |
| Cost of investments for income tax purposes | | $ | 935,297,458 | | | $ | 195,876,893 | | | $ | 8,060,684 | | | $ | 223,467,351 | |
The differences between book-basis and tax-basis are primarily due to the deferral of losses from wash sales and investments in partnerships.
| ALPS ETF Trust | |
| Notes to Financial Statements | November 30, 2021 |
H. Income Taxes
No provision for income taxes is included in the accompanying financial statements, as each Fund intends to distribute to shareholders all taxable investment income and realized gains and otherwise comply with Subchapter M of the Internal Revenue Code of 1986, as amended, applicable to regulated investment companies. Each Fund evaluates tax positions taken (or expected to be taken) in the course of preparing the Fund’s tax returns to determine whether these positions meet a “more-likely-than-not” standard that, based on the technical merits, have a more than fifty percent likelihood of being sustained by a taxing authority upon examination. A tax position that meets the “more-likely-than-not” recognition threshold is measured to determine the amount of benefit to recognize in the financial statements.
As of and during the year ended November 30, 2021, each Fund did not have a liability for any unrecognized tax benefits. Each Fund files U.S. federal, state, and local tax returns as required. Each Fund’s tax returns are subject to examination by the relevant tax authorities until expiration of the applicable statute of limitations, which is generally three years after the filing of the tax return, but may extend to four years in certain jurisdictions. Tax returns for open years have incorporated no uncertain tax positions that require a provision for income taxes.
I. Lending of Portfolio Securities
The Funds have entered into a securities lending agreement with State Street Bank & Trust Co. (“SSB”), the Funds’ lending agent. Each Fund may lend their portfolio securities only to borrowers that are approved by SSB. Each Fund will limit such lending to not more than 33 1/3% of the value of its total assets. Each Funds’ securities held at SSB as custodian shall be available to be lent except those securities the Fund or ALPS Advisors, Inc. specifically identifies in writing as not being available for lending. The borrower pledges and maintains with each Fund collateral consisting of cash (U.S. Dollars only), securities issued or guaranteed by the U.S. government or its agencies or instrumentalities, and cash equivalents (including irrevocable bank letters of credit) issued by a person other than the borrower or an affiliate of the borrower. The initial collateral received by each Fund is required to have a value of no less than 102% of the market value of the loaned securities for U.S equity securities and a value of no less than 105% of the market value for non-U.S. equity securities. The collateral is maintained thereafter, at a market value equal to not less than 102% of the current value of the U.S. equity securities on loan and not less than 105% of the current value of the non-U.S. equity securities on loan. The market value of the loaned securities is determined at the close of each business day and any additional required collateral is delivered to each Fund on the next business day. During the term of the loan, each Fund is entitled to all distributions made on or in respect of the loaned securities. Loans of securities are terminable at any time and the borrower, after notice, is required to return borrowed securities within the customary time period for settlement of securities transactions.
Any cash collateral received is reinvested in a money market fund managed by SSB as disclosed in the Fund’s Schedule of Investments and is reflected in the Statements of Assets and Liabilities as a payable for collateral upon return of securities loaned. Non-cash collateral, in the form of securities issued or guaranteed by the U.S. government or its agencies or instrumentalities, is not disclosed in a Fund’s Statements of Assets and Liabilities as it is held by the lending agent on behalf of each Fund, and each Fund does not have the ability to re-hypothecate these securities. Income earned by the Fund from securities lending activity is disclosed in the Statement of Operations.
The following is a summary of each Fund's securities lending agreement and related cash and non-cash collateral received as of November 30, 2021:
| Fund | | Market Value of Securities on Loan | | | Cash Collateral Received | | | Non-Cash Collateral Received | | | Total Collateral Received | |
| ALPS Clean Energy ETF | | $ | 132,255,922 | | | $ | 52,491,002 | | | $ | 86,635,349 | | | $ | 139,126,351 | |
| ALPS Disruptive Technologies ETF | | | 9,525,848 | | | | 3,307,091 | | | | 6,700,526 | | | | 10,007,617 | |
| ALPS Global Travel Beneficiaries ETF | | | 65,144 | | | | 15,322 | | | | 54,442 | | | | 69,764 | |
| ALPS Medical Breakthroughs ETF | | | 16,199,748 | | | | 6,666,410 | | | | 9,752,538 | | | | 16,418,948 | |
The risks of securities lending include the risk that the borrower may not provide additional collateral when required or may not return the securities when due. To mitigate these risks, each Fund benefits from a borrower default indemnity provided by SSB. SSB’s indemnity allows for full replacement of securities lent wherein SSB will purchase the unreturned loaned securities on the open market by applying the proceeds of the collateral or to the extent such proceeds are insufficient or the collateral is unavailable, SSB will purchase the unreturned loan securities at SSB’s expense. However, the Funds could suffer a loss if the value of the investments purchased with cash collateral falls below the value of the cash collateral received.
| ALPS ETF Trust | |
| Notes to Financial Statements | November 30, 2021 |
The following tables reflect a breakdown of transactions accounted for as secured borrowings, the gross obligation by the type of collateral pledged or securities loaned, and the remaining contractual maturity of those transactions as of November 30, 2021:
| ALPS Clean Energy ETF | | Remaining contractual maturity of the agreements | |
| Securities Lending Transactions | | Overnight & Continuous | | | Up to 30 days | | | 30-90 days | | | Greater than 90 days | | | Total | |
| Common Stocks | | $ | 52,491,002 | | | $ | – | | | $ | – | | | $ | – | | | $ | 52,491,002 | |
| Total Borrowings | | | | | | | | | | | | | | | | | | | 52,491,002 | |
| Gross amount of recognized liabilities for securities lending (collateral received) | | | | | | | | | | | | | | $ | 52,491,002 | |
| ALPS Disruptive Technologies ETF | | Remaining contractual maturity of the agreements | |
| Securities Lending Transactions | | Overnight & Continuous | | | Up to 30 days | | | 30-90 days | | | Greater than 90 days | | | Total | |
| Common Stocks | | $ | 3,307,091 | | | $ | – | | | $ | – | | | $ | – | | | $ | 3,307,091 | |
| Total Borrowings | | | | | | | | | | | | | | | | | | | 3,307,091 | |
| Gross amount of recognized liabilities for securities lending (collateral received) | | | | | | | | | | | | | | $ | 3,307,091 | |
| ALPS Global Travel Beneficiaries ETF | | Remaining contractual maturity of the agreements | |
| Securities Lending Transactions | | Overnight & Continuous | | | Up to 30 days | | | 30-90 days | | | Greater than 90 days | | | Total | |
| Common Stocks | | $ | 15,322 | | | $ | – | | | $ | – | | | $ | – | | | $ | 15,322 | |
| Total Borrowings | | | | | | | | | | | | | | | | | | | 15,322 | |
| Gross amount of recognized liabilities for securities lending (collateral received) | | | | | | | | | | | | | | $ | 15,322 | |
| ALPS Medical Breakthroughs ETF | | Remaining contractual maturity of the agreements | |
| Securities Lending Transactions | | Overnight & Continuous | | | Up to 30 days | | | 30-90 days | | | Greater than 90 days | | | Total | |
| Common Stocks | | $ | 6,666,410 | | | $ | – | | | $ | – | | | $ | – | | | $ | 6,666,410 | |
| Total Borrowings | | | | | | | | | | | | | | | | | | | 6,666,410 | |
| Gross amount of recognized liabilities for securities lending (collateral received) | | | | | | | | | | | | | | $ | 6,666,410 | |
3. INVESTMENT ADVISORY FEE AND OTHER AFFILIATED TRANSACTIONS
ALPS Advisors, Inc. (the “Adviser”) serves as the Funds’ investment adviser pursuant to an Investment Advisory Agreement with the Trust on behalf of each Fund (the “Advisory Agreement”). Pursuant to the Advisory Agreement, each Fund pays the Adviser an annual management fee for the services and facilities it provides, payable on a monthly basis as a percentage of the relevant Fund’s average daily net assets as set out below. From time to time, the Adviser may waive all or a portion of its fee.
| Fund | Advisory Fee |
| ALPS Clean Energy ETF | 0.55%* |
| ALPS Disruptive Technologies ETF | 0.50% |
| ALPS Global Travel Beneficiaries ETF | 0.65% |
| ALPS Medical Breakthroughs ETF | 0.50% |
| * | Effective January 1, 2021, the ALPS Clean Energy ETF changed its management fee from 0.65% to 0.55%. |
Out of the unitary management fee, the Adviser pays substantially all expenses of each Fund, including licensing fees to the Underlying Index provider, the cost of transfer agency, custody, fund administration, legal, audit, trustees and other services, except for interest expenses, distribution fees or expenses, brokerage expenses, taxes and extraordinary expenses not incurred in the ordinary course of each Fund's business. The Adviser’s unitary management fee is designed to pay substantially all of each Fund's expenses and to compensate the Adviser for providing services for each Fund.
ALPS Fund Services, Inc., an affiliate of the Adviser, is the administrator for the Funds.
| ALPS ETF Trust | |
| Notes to Financial Statements | November 30, 2021 |
Each Trustee receives (1) a quarterly retainer of $10,000, (2) a per meeting fee of $5,000, (3) $1,500 for any special meeting held outside of a regularly scheduled board meeting, and (4) reimbursement for all reasonable out-of-pocket expenses relating to attendance at meetings. In addition, the Chairman of the Board and Chairman of the Audit Committee each receives a quarterly retainer of $2,000, in connection with their respective roles.
4. PURCHASES AND SALES OF SECURITIES
For the year ended November 30, 2021, the cost of purchases and proceeds from sales of investment securities, excluding short-term investments and in-kind transactions, were as follows:
| Fund | | Purchases | | | Sales | |
| ALPS Clean Energy ETF | | $ | 350,791,662 | | | $ | 359,206,543 | |
| ALPS Disruptive Technologies ETF | | | 56,520,255 | | | | 57,474,084 | |
| ALPS Global Travel Beneficiaries ETF | | | 1,288,184 | | | | 1,115,516 | |
| ALPS Medical Breakthroughs ETF | | | 191,520,834 | | | | 190,963,851 | |
For the year ended November 30, 2021, the cost of in-kind purchases and proceeds from in-kind sales were as follows:
| Fund | | Purchases | | | Sales | |
| ALPS Clean Energy ETF | | $ | 667,197,294 | | | $ | 232,264,873 | |
| ALPS Disruptive Technologies ETF | | | 99,710,592 | | | | 31,781,571 | |
| ALPS Global Travel Beneficiaries ETF | | | 7,877,784 | | | | – | |
| ALPS Medical Breakthroughs ETF | | | 97,973,652 | | | | 121,373,055 | |
For the year ended November 30, 2021, the in-kind net realized gains/(losses) were as follows:
| Fund | | Net Realized Gain/(Loss) | |
| ALPS Clean Energy ETF | | $ | 131,910,055 | |
| ALPS Disruptive Technologies ETF | | | 15,146,791 | |
| ALPS Medical Breakthroughs ETF | | | 48,194,108 | |
Gains on in-kind transactions are not considered taxable for federal income tax purposes and losses on in-kind transactions are also not deductible for tax purposes.
5. CAPITAL SHARE TRANSACTIONS
Shares are created and redeemed by each Fund only in Creation Unit size aggregations of 25,000 Shares. Only broker-dealers or large institutional investors with creation and redemption agreements called Authorized Participants (“AP”) are permitted to purchase or redeem Creation Units from the Funds. Such transactions are generally permitted on an in-kind basis, with a balancing cash component to equate the transaction to the NAV per unit of each Fund on the transaction date. Cash may be substituted equivalent to the value of certain securities generally when they are not available in sufficient quantity for delivery, not eligible for trading by the AP or as a result of other market circumstances.
6. RELATED PARTY TRANSACTIONS
The ALPS Clean Energy ETF and ALPS Disruptive Technologies ETF engaged in cross trades between other funds in the Trust during the year ended November 30, 2021 pursuant to Rule 17a-7 under the 1940 Act. Cross trading is the buying or selling of portfolio securities between funds to which the Adviser serves as the investment adviser. The Board previously adopted procedures that apply to transactions between the Funds of the Trust pursuant to Rule 17a-7. These transactions related to cross trades during the period complied with the requirements set forth by Rule 17a-7 and the Trust’s procedures.
| ALPS ETF Trust | |
| Notes to Financial Statements | November 30, 2021 |
Transactions related to cross trades during the year ended November 30, 2021, were as follows:
| | | Purchase cost paid | | | Sale proceeds received | | | Realized gain/(loss) on sales | |
| ALPS Clean Energy ETF | | $ | 287,713 | | | $ | – | | | $ | – | |
| ALPS Disruptive Technologies ETF | | | – | | | | 287,713 | | | | (859 | ) |
7. MARKET DISRUPTIONS RISK
The Funds are subject to investment and operational risks associated with financial, economic and other global market developments and disruptions, including the recent spread of an infectious respiratory illness caused by a novel strain of coronavirus (known as COVID-19), which can negatively impact the securities markets and cause each Fund to lose value.
The spread of COVID-19 has caused volatility, severe market dislocations and liquidity constraints in many markets, including markets for the securities each Fund holds, and may adversely affect each Fund’s investments and operations. The transmission of COVID-19 and efforts to contain its spread have resulted in travel restrictions and disruptions, closed international borders, enhanced health screenings at ports of entry and elsewhere, disruption of and delays in healthcare service preparation and delivery, quarantines, event and service cancellations or interruptions, disruptions to business operations and supply chains, and a reduction in consumer and business spending, as well as general concern and uncertainty that has negatively affected the economy. These disruptions have led to instability in the market place and the jobs market. The impact of COVID-19 could adversely affect the economies of many nations or the entire global economy, the financial well-being and performance of individual issuers, borrowers and sectors and the health of the markets generally in potentially significant and unforeseen ways.
The foregoing could lead to a significant economic downturn or recession, increased market volatility, a greater number of market closures, higher default rates and adverse effects on the values and liquidity of each Fund’s securities or other assets. Such impacts may adversely affect the performance of the Funds.
8. SUBSEQUENT EVENTS
Subsequent events, if any, after the date of the Statements of Assets and Liabilities have been evaluated through the date the financial statements were issued. Management has determined that there were no subsequent events to report through the issuance of these financial statements.
| ALPS ETF Trust | |
| Additional Information | November 30, 2021 (Unaudited) |
PROXY VOTING RECORDS, POLICIES AND PROCEDURES
Information regarding how each Fund voted proxies relating to portfolio securities during the most recent 12-month period ended June 30 and a description of the Fund’s proxy voting policies and procedures used in determining how to vote for proxies are available without charge on the SEC’s website at www.sec.gov and upon request, by calling (toll-free) 1-866-759-5679.
PORTFOLIO HOLDINGS
The Fund files a complete schedule of portfolio holdings with the U.S. Securities and Exchange Commission (“SEC”) for the first and third quarters of each fiscal year on Form N-PORT within 60 days after the end of the period. Copies of the Fund’s Form N-PORT are available without a charge, upon request, by contacting the Fund at 1-866-759-5679 and on the SEC’s website at https://www.sec.gov.
TAX INFORMATION
The Funds designate the following as a percentage of taxable ordinary income distributions, or up to the maximum amount allowable, for the calendar year ended December 31, 2020:
| | Qualified Dividend Income | Dividend Received Deduction |
| ALPS Clean Energy ETF | 100.00% | 16.87% |
| ALPS Disruptive Technologies ETF | 69.64% | 27.07% |
| ALPS Medical Breakthroughs ETF | 0.00% | 0.00% |
In early 2021, if applicable, shareholders of record received this information for the distributions paid to them by the Funds during the calendar year 2020 via Form 1099. The Funds will notify shareholders in early 2022 of amounts paid to them by the Funds, if any, during the calendar year 2021.
LICENSING AGREEMENT
ALPS Clean Energy ETF
CIBC NTC is the designer of the construction and methodology for the Underlying Index. “CIBC NTC” and “CIBC Atlas Clean Energy Index” are service marks or trademarks of the Index Provider. CIBC NTC acts as brand licensor for the Underlying Index and is not responsible for the descriptions of the Fund that appear herein.
The Fund is not sponsored by CIBC NTC or any of its affiliates. CIBC NTC makes no representation or warranty, express or implied, to the owners of the Fund or any member of the public regarding the advisability of investing in securities or commodities generally or in the Fund particularly. CIBC NTC does not guarantee the quality, accuracy or completeness of the Underlying Index or any Underlying Index data included herein or derived therefrom and assumes no liability in connection with their use. The Underlying Index is determined and composed without regard to the Adviser or the Fund. CIBC NTC has no obligation to take the needs of the Adviser, the Fund or the shareholders of the Fund into consideration in determining, composing or calculating the Underlying Index. CIBC NTC is not responsible for and has not participated in the determination of the timing of, prices at, or quantities of the Fund to be issued or in the determination or calculation of the equation by which the Fund is to be converted into cash. CIBC NTC has no obligation or liability in connection with the administration, marketing or trading of the Fund and is not responsible for and has not participated in the determination of pricing or the timing of the issuance or sale of the Shares of the Fund or in the determination or calculation of the NAV of the Fund.
CIBC NTC has no obligation or liability in connection with the administration, marketing or trading of the Fund. CIBC NTC makes no warranty, express or implied, as to results to be obtained by the Adviser, the Fund, Fund shareholders or any other person or entity from the use of the Underlying Index or any data included therein. CIBC NTC makes no express or implied warranties, and expressly disclaims all warranties of merchantability or fitness for a particular purpose or use with respect to the Underlying Index or any data included therein. Without limiting any of the foregoing, in no event shall CIBC NTC have any liability for any special, punitive, indirect, or consequential damages (including lost profits) arising out of matters relating to the use of the Underlying Index, even if notified of the possibility of such damages.
All intellectual property rights in the Underlying Index vests in CIBC NTC.
| ALPS ETF Trust | |
| Additional Information | November 30, 2021 (Unaudited) |
The Underlying Index is the property of CIBC NTC, which has contracted with S&P Opco, LLC (a subsidiary of S&P Dow Jones Indices LLC) to calculate and maintain the Underlying Index. The Underlying Index is not sponsored by S&P Dow Jones Indices or its affiliates or its third party licensors (collectively, “S&P Dow Jones Indices”). S&P Dow Jones Indices will not be liable for any errors or omissions in calculating the Underlying Index. “Calculated by S&P Dow Jones Indices” and the related stylized mark(s) are service marks of S&P Dow Jones Indices and have been licensed for use by CIBC NTC. S&P® is a registered trademark of Standard & Poor’s Financial Services LLC (“SPFS”), and Dow Jones® is a registered trademark of Dow Jones Trademark Holdings LLC (“Dow Jones”).
The Fund is not sponsored, endorsed, sold or promoted by S&P Dow Jones Indices. S&P Dow Jones Indices does not make any representation or warranty, express or implied, to the owners of the Fund or any member of the public regarding the advisability of investing in securities generally or in the Fund particularly or the ability of the Underlying Index to track general market performance. S&P Dow Jones Indices’ only relationship to CIBC NTC with respect to the Underlying Index is the licensing of certain trademarks, service marks and trade names of S&P Dow Jones Indices, and the provision of the calculation services related to the Underlying Index. S&P Dow Jones Indices is not responsible for and has not participated in the determination of the prices and amount of the Fund or the timing of the issuance or sale of the Fund or in the determination or calculation of the equation by which the Fund may be converted into cash or other redemption mechanics. S&P Dow Jones Indices has no obligation or liability in connection with the administration, marketing or trading of the Fund. S&P Dow Jones Indices LLC is not an investment advisor. Inclusion of a security within the Underlying Index is not a recommendation by S&P Dow Jones Indices to buy, sell, or hold such security, nor is it investment advice.
S&P DOW JONES INDICES DOES NOT GUARANTEE THE ADEQUACY, ACCURACY, TIMELINESS AND/OR THE COMPLETENESS OF THE UNDERLYING INDEX OR ANY DATA RELATED THERETO OR ANY COMMUNICATION WITH RESPECT THERETO, INCLUDING, ORAL, WRITTEN, OR ELECTRONIC COMMUNICATIONS. S&P DOW JONES INDICES SHALL NOT BE SUBJECT TO ANY DAMAGES OR LIABILITY FOR ANY ERRORS, OMISSIONS, OR DELAYS THEREIN. S&P DOW JONES INDICES MAKES NO EXPRESS OR IMPLIED WARRANTIES, AND EXPRESSLY DISCLAIMS ALL WARRANTIES, OF MERCHANTABILITY OR FITNESS FOR A PARTICULAR PURPOSE OR USE OR AS TO RESULTS TO BE OBTAINED BY CIBC NTC, OWNERS OF THE FUND, OR ANY OTHER PERSON OR ENTITY FROM THE USE OF THE UNDERLYING INDEX OR WITH RESPECT TO ANY DATA RELATED THERETO. WITHOUT LIMITING ANY OF THE FOREGOING, IN NO EVENT WHATSOEVER SHALL S&P DOW JONES INDICES BE LIABLE FOR ANY INDIRECT, SPECIAL, INCIDENTAL, PUNITIVE, OR CONSEQUENTIAL DAMAGES, INCLUDING BUT NOT LIMITED TO, LOSS OF PROFITS, TRADING LOSSES, LOST TIME, OR GOODWILL, EVEN IF THEY HAVE BEEN ADVISED OF THE POSSIBILITY OF SUCH DAMAGES, WHETHER IN CONTRACT, TORT, STRICT LIABILITY, OR OTHERWISE.
The Index Provider is not affiliated with the Trust, the Adviser or ALPS Portfolio Solutions Distributor, Inc. (the “Distributor”). The Index Provider has entered into a license agreement with the Adviser (the “License Agreement”). The use of the Underlying Index by the Adviser and the Fund is subject to the terms of the License Agreement, which impose certain limitations and conditions on the Fund’s ability to use the Underlying Index.
The Adviser does not guarantee the accuracy and/or the completeness of the Underlying Index or any data included therein, and the Adviser shall have no liability for any errors, omissions or interruptions therein. The Adviser makes no warranty, express or implied, as to results to be obtained by the Fund, owners of the Shares of the Fund or any other person or entity from the use of the Underlying Index or any data included therein. The Adviser makes no express or implied warranties, and expressly disclaims all warranties of merchantability or fitness for a particular purpose or use with respect to the Underlying Index or any data included therein. Without limiting any of the foregoing, in no event shall the Adviser have any liability for any special, punitive, direct, indirect, or consequential damages (including lost profits) arising out of matters relating to the use of the Underlying Index, even if notified of the possibility of such damages.
ALPS Disruptive Technology ETF
“Indxx” is a service mark of Indxx, LLC (“Indxx” or the “Index Provider”) and has been licensed for use for certain purposes by ALPS Advisors, Inc. (the “Adviser”).
The ALPS Disruptive Technologies ETF is not sponsored, endorsed, sold or promoted by Indxx. Indxx makes no representation or warranty, express or implied, to the owners of the ALPS Disruptive Technologies ETF or any member of the public regarding the advisability of investing in securities generally or in the ALPS Disruptive Technologies ETF particularly. Indxx has no obligation to take the needs of ALPS Advisors, Inc. or the shareholders of ALPS Disruptive Technologies ETF into consideration in determining, composing, or calculating the Underlying Index. Indxx is not responsible for and has not participated in the determination of the timing, amount or pricing of the ALPS Disruptive Technologies ETF shares to be issued or in the determination or calculation of the equation by which the ALPS Disruptive Technologies ETF is to be converted into cash. Indxx has no obligation or liability in connection with the administration, marketing or trading of the ALPS Disruptive Technologies ETF.
INDXX MAKES NO WARRANTY, EXPRESS OR IMPLIED, AS TO THE RESULTS TO BE OBTAINED BY ANY PERSON OR ENTITY FROM THE USE OF THE INDEX(ES), TRADING BASED ON THE INDEX(ES), OR ANY DATA INCLUDED THEREIN IN CONNECTION WITH THE PRODUCTS, OR FOR ANY OTHER USE. INDXX EXPRESSLY DISCLAIMS ALL WARRANTIES AND CONDITIONS, EXPRESS, STATUTORY, OR IMPLIED, EXCEPT AS SET FORTH IN THIS AGREEMENT. EXCEPT AS OTHERWISE SPECIFICALLY SET FORTH IN THIS AGREEMENT, INDXX HEREBY EXPRESSLY DISCLAIMS ALL IMPLIED WARRANTIES AND CONDITIONS OF MERCHANTABILITY, TITLE, OR FITNESS FOR A PARTICULAR PURPOSE OR USE WITH RESPECT TO THE INDEX(ES) OR ANY DATA INCLUDED THEREIN. INDXX DOES NOT GUARANTEE THE ACCURACY AND/OR THE COMPLETENESS OF ANY DATA SUPPLIED BY IT OR ANY DATA INCLUDED THEREIN. INDXX MAKES NO WARRANTY, EXPRESS OR IMPLIED, AS TO RESULTS TO BE OBTAINED BY THE FUNDS, ITS SHAREHOLDERS OR AFFILIATES, OR ANY OTHER PERSON OR ENTITY FROM THE USE OF THE DATA SUPPLIED BY INDXX OR ANY DATA INCLUDED THEREIN. INDXX MAKES NO EXPRESS OR IMPLIED WARRANTIES, AND EXPRESSLY DISCLAIMS ALL WARRANTIES OF MERCHANTABILITY OR FITNESS FOR A PARTICULAR PURPOSE OR USE WITH RESPECT TO THE DATA SUPPLIED BY INDXX OR ANY DATA INCLUDED THEREIN. WITHOUT LIMITING ANY OF THE FOREGOING, IN NO EVENT SHALL INDXX HAVE ANY LIABILITY FOR ANY SPECIAL, PUNITIVE, INDIRECT, OR CONSEQUENTIAL DAMAGES (INCLUDING LOST PROFITS), EVEN IF NOTIFIED OF THE POSSIBILITY OF SUCH DAMAGES.
| ALPS ETF Trust | |
| Additional Information | November 30, 2021 (Unaudited) |
The Adviser does not guarantee the accuracy and/or the completeness of the Underlying Index or any data included therein, and the Adviser shall have no liability for any errors, omissions or interruptions therein. The Adviser makes no warranty, express or implied, as to results to be obtained by the Fund, owners of the Shares of the Fund or any other person or entity from the use of the Underlying Index or any data included therein. Adviser makes no express or implied warranties, and expressly disclaims all warranties of merchantability or fitness for a particular purpose or use with respect to the Underlying Index or any data included therein. Without limiting any of the foregoing, in no event shall the Adviser have any liability for any special, punitive, direct, indirect or consequential damages (including lost profits) arising out of matters relating to the use of the Underlying Index, even if notified of the possibility of such damages.
ALPS Global Travel Beneficiaries ETF
S-Network and S-Network Global Travel Index are service marks of S-Network Global Indexes, Inc. ("S-Network") and have been licensed for use by the ALPS Advisors, Inc. (“ALPS”). The Fund is not issued, sponsored, endorsed, sold or promoted by S-Network or its affiliates. S-Network makes no representation or warranty, express or implied, to the purchasers or owners of the Fund or any member of the public regarding the advisability of investing in securities generally or in the Fund particularly or the ability of the Index to track general market performance. S-Network's only relationship to the Fund is the licensing of the service marks and the Index, which is determined, composed and calculated by S-Network without regard to ALPS or the Fund. S-Network is not responsible for and has not participated in the determination of the timing of, prices at, or quantities of the Fund issued by ALPS. S-Network has no obligation or liability in connection with the issuance, administration, marketing or trading of the Fund.
S-NETWORK DOES NOT GUARANTEE THE ACCURACY AND/OR THE COMPLETENESS OF THE S-NETWORK GLOBAL TRAVEL INDEX OR ANY DATA INCLUDED THEREIN AND S-NETWORK SHALL HAVE NO LIABILITY FOR ANY ERRORS, OMISSIONS, OR INTERRUPTIONS THEREIN. S-NETWORK MAKES NO WARRANTY, EXPRESS OR IMPLIED, AS TO RESULTS TO BE OBTAINED BY LICENSEE, OWNERS OF THE FUND, OR ANY OTHER PERSON OR ENTITY FROM THE USE OF THE S-NETWORK GLOBAL TRAVEL INDEX OR ANY DATA INCLUDED THEREIN. S-NETWORK MAKES NO EXPRESS OR IMPLIED WARRANTIES, AND EXPRESSLY DISCLAIMS ALL WARRANTIES OF MERCHANTABILITY OR FITNESS FOR A PARTICULAR PURPOSE OR USE WITH RESPECT TO THE S-NETWORK GLOBAL TRAVEL INDEX OR ANY DATA INCLUDED THEREIN. WITHOUT LIMITING ANY OF THE FOREGOING, UNLESS ARISING AS A RESULT OF S-NETWORK'S (i) GROSS NEGLIGENCE OR WILLFUL MISCONDUCT, (ii) BREACH OF ITS CONFIDENTIALITY OBLIGATIONS: OR (iii) INDEMNIFICATION OBLIGATIONS, S-NETWORK SHALL NOT HAVE ANY LIABILITY FOR ANY SPECIAL, PUNITIVE, INDIRECT, OR CONSEQUENTIAL DAMAGES (INCLUDING LOST PROFITS), EVEN IF NOTIFIED OF THE POSSIBILITY OF SUCH DAMAGES.
The Adviser does not guarantee the accuracy and/or the completeness of the Underlying Index or any data included therein, and the Adviser shall have no liability for any errors, omissions or interruptions therein. The Adviser makes no warranty, express or implied, as to results to be obtained by the Fund, owners of the Shares of the Fund or any other person or entity from the use of the Underlying Index or any data included therein. The Adviser makes no express or implied warranties, and expressly disclaims all warranties of merchantability or fitness for a particular purpose or use with respect to the Underlying Index or any data included therein. Without limiting any of the foregoing, in no event shall the Adviser have any liability for any special, punitive, direct, indirect or consequential damages (including lost profits) arising out of matters relating to the use of the Underlying Index even if notified of the possibility of such damages.
ALPS Medical Breakthroughs ETF
The Fund is not sponsored, endorsed, sold or promoted by S-Network Global Indexes, Inc. (“Licensor”). Licensor makes no representation or warranty, express or implied, to the owners of the Fund or any member of the public regarding the advisability of investing in securities generally or in the Fund particularly or the ability of the Underlying Index to track the performance of the physical commodities market. Licensor’s only relationship to the Licensee is the licensing of certain service marks and trade names of Licensor and of the Underlying Index that is determined, composed and calculated by Licensor without regard to the Licensee or the Fund. Licensor has no obligation to take the needs of the Licensee or the owners of the Fund into consideration in determining, composing or calculating the Underlying Index. Licensor is not responsible for and has not participated in the determination of the timing of, prices at, or quantities of the Fund to be issued or in the determination or calculation of the equation by which the Fund is to be converted into cash. Licensor has no obligation or liability in connection with the administration, marketing or trading of the Fund.
LICENSOR DOES NOT GUARANTEE THE ACCURACY AND/OR THE COMPLETENESS OF THE UNDERLYING INDEX OR ANY DATA INCLUDED THEREIN AND LICENSOR SHALL HAVE NO LIABILITY FOR ANY ERRORS, OMISSIONS, OR INTERRUPTIONS THEREIN. LICENSOR MAKES NO WARRANTY, EXPRESS OR IMPLIED, AS TO RESULTS TO BE OBTAINED BY LICENSEE, OWNERS OF THE FUND, OR ANY OTHER PERSON OR ENTITY FROM THE USE OF THE UNDERLYING INDEX OR ANY DATA INCLUDED THEREIN. LICENSOR MAKES NO EXPRESS OR IMPLIED WARRANTIES, AND EXPRESSLY DISCLAIMS ALL WARRANTIES OF MERCHANTABILITY OR FITNESS FOR A PARTICULAR PURPOSE OR USE WITH RESPECT TO THE UNDERLYING INDEX OR ANY DATA INCLUDED THEREIN. WITHOUT LIMITING ANY OF THE FOREGOING, IN NO EVENT SHALL LICENSOR HAVE ANY LIABILITY FOR ANY SPECIAL, PUNITIVE, INDIRECT, OR CONSEQUENTIAL DAMAGES (INCLUDING LOST PROFITS), EVEN IF NOTIFIED OF THE POSSIBILITY OF SUCH DAMAGES.
| ALPS ETF Trust | |
| Additional Information | November 30, 2021 (Unaudited) |
Standard & Poor’s Custom Indexes serves as calculation agent for the Index. The Fund is not sponsored, endorsed, sold or promoted by Standard & Poor’s, a division of The McGraw-Hill Companies, Inc. (“S&P”) or its third party licensors. Neither S&P nor its third party licensors make any representation or warranty, express or implied, to the owners of the Fund or any member of the public regarding the advisability of investing in securities generally or in the Fund particularly or the ability of the Underlying Index to track general stock market performance. S&P’s and its third party licensor’s only relationship to S-Network Global Indexes, Inc. is the licensing of certain trademarks, service marks and trade names of S&P and/or its third party licensors and for the providing of calculation and maintenance services related to the Underlying Index. Neither S&P nor its third party licensors is responsible for and has not participated in the determination of the prices and amount of the Fund or the timing of the issuance or sale of the Fund or in the determination or calculation of the equation by which the Fund is to be converted into cash. S&P has no obligation or liability in connection with the administration, marketing or trading of the Fund.
NEITHER S&P, ITS AFFILIATES NOR THEIR THIRD PARTY LICENSORS GUARANTEE THE ADEQUACY, ACCURACY, TIMELINESS OR COMPLETENESS OF THE UNDERLYING INDEX OR ANY DATA INCLUDED THEREIN OR ANY COMMUNICATIONS, INCLUDING BUT NOT LIMITED TO, ORAL OR WRITTEN COMMUNICATIONS (INCLUDING ELECTRONIC COMMUNICATIONS) WITH RESPECT THERETO. S&P, ITS AFFILIATES AND THEIR THIRD PARTY LICENSORS SHALL NOT BE SUBJECT TO ANY DAMAGES OR LIABILITY FOR ANY ERRORS, OMISSIONS OR DELAYS THEREIN. S&P MAKES NO EXPRESS OR IMPLIED WARRANTIES, AND EXPRESSLY DISCLAIMS ALL WARRANTIES OF MERCHANTABILITY OR FITNESS FOR A PARTICULAR PURPOSE OR USE WITH RESPECT TO ITS TRADEMARKS, THE UNDERLYING INDEX OR ANY DATA INCLUDED THEREIN. WITHOUT LIMITING ANY OF THE FOREGOING, IN NO EVENT WHATSOEVER SHALL S&P, ITS AFFILIATES OR THEIR THIRD PARTY LICENSORS BE LIABLE FOR ANY INDIRECT, SPECIAL, INCIDENTAL, PUNITIVE OR CONSEQUENTIAL DAMAGES, INCLUDING BUT NOT LIMITED TO, LOSS OF PROFITS, TRADING LOSSES, LOST TIME OR GOODWILL, EVEN IF THEY HAVE BEEN ADVISED OF THE POSSIBILITY OF SUCH DAMAGES, WHETHER IN CONTRACT, TORT, STRICT LIABILITY OR OTHERWISE.
Standard & Poor’s®, and S&P® are registered trademarks of The McGraw-Hill Companies, Inc.; “Calculated by S&P Custom Indices” and its related stylized mark are service marks of The McGraw-Hill Companies, Inc. These marks have been licensed for use by S-Network Global Indexes, Inc.
The Adviser does not guarantee the accuracy and/or the completeness of the Underlying Index or any data included therein, and the Adviser shall have no liability for any errors, omissions or interruptions therein. The Adviser makes no warranty, express or implied, as to results to be obtained by the Fund, owners of the Shares of the Fund or any other person or entity from the use of the Underlying Index or any data included therein. The Adviser makes no express or implied warranties, and expressly disclaims all warranties of merchantability or fitness for a particular purpose or use with respect to the Underlying Index or any data included therein. Without limiting any of the foregoing, in no event shall the Adviser have any liability for any special, punitive, direct, indirect, or consequential damages (including lost profits) arising out of matters relating to the use of the Underlying Index, even if notified of the possibility of such damages.
| ALPS ETF Trust | |
| Board Considerations Regarding Approval of Investment Advisory Agreements | November 30, 2021 (Unaudited) |
ALPS Clean Energy ETF, ALPS Disruptive Technology ETF, ALPS Medical Breakthroughs ETF
At a meeting held on June 7, 2021 via electronic means (video-conference), the Board of Trustees of the Trust (the “Board” or the “Trustees”), including the Trustees who are not “interested persons” of the Trust within the meaning of the Investment Company Act of 1940, as amended (the “Independent Trustees”), evaluated a proposal to approve the continuance of the Investment Advisory Agreements between the Trust and ALPS Advisors, Inc. (the “Adviser” or “AAI”) with respect to the ALPS Clean Energy ETF (“ACES”), the ALPS Disruptive Technologies ETF (“DTEC”) and the ALPS Medical Breakthroughs ETF (“SBIO”) (each “a Fund” and collectively the “Funds”). The Independent Trustees also met separately to consider each Investment Advisory Agreement.
With respect to the nature, extent and quality of the services provided by AAI under the Investment Advisory Agreements, the Board considered and reviewed information concerning the services provided under the Investment Advisory Agreements, the investment parameters of the index of each Fund, financial information regarding AAI and its parent company, information describing AAI’s current organization and the background and experience of the persons responsible for the day-to-day management of the Funds.
The Board reviewed information on the performance of each Fund and its applicable benchmark. The Board also evaluated the correlation and tracking error between each underlying index and its corresponding Fund’s performance. Based on this review, the Board, including the Independent Trustees. found that the nature and extent of services provided to each Fund under the Investment Advisory Agreements was appropriate and that the quality was satisfactory.
The Board noted that the advisory fees for each Fund were unitary fees pursuant to which AAI assumes all expenses of the Funds (including the cost of transfer agency, custody, fund administration, legal, audit and other services) other than the payments under the Advisory Agreement, brokerage expenses, taxes, interest, litigation expenses and other extraordinary expenses.
With respect to advisory fee rates, the Board, including the Independent Trustees, noted the following:
The gross management fee rate for ACES is higher than the median of its FUSE expense group. DTEC is equal to the median of its FUSE expense group. ACES’ net expense ratio, however, is lower than the median of its FUSE expense group. DTEC’s net expense ratio is at the median of its FUSE expense group. The gross management fee rate for SBIO is lower than the median of its FUSE expense group. SBIO’s net expense ratio is also below the median of its FUSE expense group.
Based on the foregoing, and the other information available to them, the Board, including the Independent Trustees concluded that the advisory fee rate for each of the Funds was reasonable under the circumstances and in light of the quality of the services provided.
The Board, including the Independent Trustees considered other benefits available to AAI because of its relationship with the Funds and concluded that the advisory fees were reasonable taking into account any such benefits.
The Board, including the Independent Trustees also considered with respect to each Fund the information provided by AAI about the costs and profitability of AAI with respect to each of the Funds, including the asset levels and other factors that influence the profitability and financial viability of the Funds. The Board, including the Independent Trustees reviewed and noted the relatively small sizes of DTEC and SBIO and concluded that AAI was not realizing any economies of scale. With respect to ACES, the Independent Trustees noted that the Fund’s asset levels have increased sharply over the prior year and that current profitability levels were not unreasonable. The Independent Trustees determined that AAI should continue to keep the Board informed on an ongoing basis of any significant developments (e.g., material increases in asset levels) so as to facilitate the Independent Trustees’ evaluation of whether further economies of scale have been achieved.
In voting to renew each Investment Advisory Agreement, the Board, including the Independent Trustees concluded that the terms of each Investment Advisory Agreement are reasonable and fair in light of the services to be performed, the fees paid by certain other funds, expenses to be incurred and such other matters as the members of the Board, including the Independent Trustees, considered relevant in the exercise of their reasonable business judgment. The Board, including the Independent Trustees did not identify any single factor or group of factors as all important or controlling and considered all factors together.
ALPS Global Travel Beneficiaries ETF
At a meeting held on June 7, 2021 via electronic means (video-conference), the Board of Trustees of the Trust (the “Board” or the “Trustees”), including the Trustees who are not “interested persons” of the Trust within the meaning of the Investment Company Act of 1940, as amended (the “Independent Trustees”), evaluated a proposal to approve the Investment Advisory Agreement (the “New Fund Advisory Agreement”) between the Trust and ALPS Advisors, Inc. (the “Adviser” or “AAI”) with respect to the ALPS Global Travel Beneficiaries ETF (“JRNY” or the “New Fund”). The Independent Trustees also met separately to consider the New Fund Advisory Agreement.
| ALPS ETF Trust | |
| Board Considerations Regarding Approval of Investment Advisory Agreements | November 30, 2021 (Unaudited) |
In evaluating the New Fund Advisory Agreement, the Board, including the Independent Trustees, considered various factors, including (i) the nature, extent and quality of the services expected to be provided by the Adviser to the New Fund under the New Fund Advisory Agreement; (ii) the advisory fees and other expenses proposed to be paid by the New Fund compared to those of similar funds managed by other investment advisers; (iii) the expected costs of the services to be provided to the New Fund and the projected profitability to be realized by the Adviser and its affiliates from the Adviser’s relationship with the New Fund; (iv) the extent to which economies of scale would be realized if and as the New Fund’s assets increase and whether the fee level in the New Fund Advisory Agreement reflects these economies of scale for the benefit of shareholders; and (v) any additional benefits and other considerations.
With respect to the nature, extent and quality of the services to be provided by the Adviser under the New Fund Advisory Agreement, the Board, including the Independent Trustees, considered and reviewed information concerning the services proposed to be provided under the New Fund Advisory Agreement, the proposed investment strategy, financial information regarding the Adviser and its parent company, information describing the Adviser’s current organization and the background and experience of the persons who would be responsible for the day-to-day management of the New Fund, the anticipated financial support of the New Fund, and the nature and quality of services provided to other ETFs, open-end and closed-end funds sponsored by the Adviser. Based upon their review, the Board, including the Independent Trustees, concluded that the Adviser was qualified to oversee the services to be provided by other service providers and that the services to be provided by the Adviser to the New Fund are expected to be satisfactory.
With respect to the costs of services to be provided and profits to be realized by the Adviser, the Board, including the Independent Trustees, considered the resources involved in managing the New Fund as well as the fact that the Adviser agreed to pay all of the New Fund’s expenses (except for interest expenses, distribution fees or expenses, brokerage expenses, taxes and extraordinary expenses such as litigation and other expenses not incurred in the ordinary course of the New Fund’s business) out of the unitary advisory fee. Based on their review, the Board, including the Independent Trustees, concluded that the expected profitability of the New Fund to the Adviser was not unreasonable.
The Board, including the Independent Trustees, also reviewed comparative fee and expense data provided by FUSE regarding the New Fund. The Trustees noted the proposed advisory fee for services to be provided to the New Fund by the Adviser was 0.65% of the New Fund’s average daily net assets. The Trustees also considered that the advisory fee with respect to the New Fund was a unitary one and that, as set forth above, the Adviser had agreed to pay all of the New Fund’s expenses (except for interest expenses, marketing fees, distribution fees or expenses, brokerage expenses, taxes and extraordinary expenses such as litigation and other expenses not incurred in the ordinary course of the New Fund’s business) out of the unitary fee. The Board, including the Independent Trustees, considered that, taking into account the impact of the New Fund’s unitary advisory fee, the New Fund’s expense ratio was above the median of its FUSE gross advisory fees peer group and at median of its FUSE total net expenses peer group. Based on the foregoing and the other information available to them, the Board, including the Independent Trustees, concluded that the advisory fees for the New Fund were reasonable under the circumstances and in light of the quality of services to be provided.
The Board, including the Independent Trustees, also considered other benefits that may be realized by the Adviser from its relationship with the New Fund and concluded that the advisory fees were reasonable taking into account such benefits.
The Board, including the Independent Trustees, considered the extent to which economies of scale would be realized as the New Fund grows and whether fee levels reflect a reasonable sharing of such economies of scale for the benefit of the New Fund investors. Because the New Fund is newly organized, the Trustees reviewed the New Fund’s proposed unitary advisory fee and anticipated expenses and determined to review economies of scale in the future when the New Fund had attracted assets.
In voting to approve the New Fund Advisory Agreement, the Board, including the Independent Trustees, concluded that the terms of the New Fund Advisory Agreement are reasonable and fair in light of the services to be performed, the fees paid by certain other funds, expenses to be incurred and such other matters as the Board, including the Independent Trustees, considered relevant in the exercise of their reasonable business judgment. The Board, including the Independent Trustees, did not identify any single factor or group of factors as all important or controlling and considered all factors together.
| ALPS ETF Trust | |
| Trustees & Officers | November 30, 2021 (Unaudited) |
The general supervision of the duties performed by the Adviser for the Fund under the Investment Advisory Agreement is the responsibility of the Board of Trustees. The Trust currently has four Trustees. Three Trustees have no affiliation or business connection with the Adviser or any of its affiliated persons and do not own any stock or other securities issued by the Adviser. These are the “non-interested” or “independent” Trustees (“Independent Trustees”). The other Trustee (the “Interested Trustee”) is affiliated with the Adviser.
The Independent Trustees of the Trust, their term of office and length of time served, their principal business occupations during the past five years, the number of portfolios in the Fund Complex overseen by each Independent Trustee, and other directorships, if any, held by the Trustee are shown below.
INDEPENDENT TRUSTEES
| Name, Address & Year of Birth* | Position(s) Held with Trust | Term of Office and Length of Time Served** | Principal Occupation(s) During Past 5 Years | Number of Portfolios in Fund Complex Overseen by Trustees*** | Other Directorships Held by Trustees |
| Mary K. Anstine, 1940 | Trustee | Since March 2008 | Ms. Anstine is Trustee/Director of AV Hunter Trust and Colorado Uplift Board. | 36 | Ms. Anstine is a Trustee of ALPS Variable Investment Trust (7 funds); Financial Investors Trust (32 funds); Reaves Utility Income Fund; and Segall Bryant & Hamill Trust (14 funds). |
Jeremy W. Deems, 1976 | Trustee | Since March 2008 | Mr. Deems is the Co-Founder and Chief Financial Officer of Green Alpha Advisors, LLC, a registered investment advisor, and Co-Portfolio Manager of the Shelton Green Alpha Fund. | 36 | Mr. Deems is a Trustee of ALPS Variable Investment Trust (7 funds); Financial Investors Trust (32 funds); and Reaves Utility Income Fund; and Clough Funds Trust (1 fund). |
Rick A. Pederson, 1952 | Trustee | Since March 2008 | Mr. Pederson is Partner, Bow River Capital Partners (private equity management), 2003 - present; Board Member, Prosci Inc. (private business services) 2013-2016; Advisory Board Member, Citywide Banks (Colorado community bank) 2014-2017; Board Member, Strong-Bridge Consulting, 2015-2019; Board Member, IRI/ODMS Holdings LLC, 2017-2019; Director, National Western Stock Show (not for profit) 2010 - present; Director, History Colorado (not for profit) 2015-present; Director, Citywide Bank Advisory Board 2017-present; Trustee, Boettcher Foundation, 2018 -present. | 19 | Mr. Pederson is Trustee of Segall Bryant & Hamill Trust (14 funds) and Principal Real Estate Income Fund (1 fund). |
| * | The business address of the Trustee is c/o ALPS Advisors, Inc., 1290 Broadway, Suite 1000, Denver, Colorado 80203. |
| ** | This is the period for which the Trustee began serving the Trust. Each Trustee serves an indefinite term, until his successor is elected. |
| *** | The Fund Complex includes all series of the Trust and any other investment companies for which ALPS Advisors, Inc. provides investment advisory services. |
| ALPS ETF Trust | |
| Trustees & Officers | November 30, 2021 (Unaudited) |
The Trustee who is an “interested person” of the Trust, his term of office and length of time served, his principal business occupations during the past five years, the number of portfolios in the Fund Complex overseen by the Interested Trustee and the other directorships, if any, held by the Trustee, are shown below.
INTERESTED TRUSTEE
| Name, Address and Year of Birth of Interested Trustee* | Position(s) Held with Trust | Term of Office and Length of Time Served** | Principal Occupation(s) During Past 5 Years | Number of Portfolios in Fund Complex Overseen by Trustees*** | Other Directorships Held by Trustees |
Edmund J. Burke, 1961 | Trustee | Since December 2017. | Mr. Burke joined ALPS in 1991 and served as the President and Director of ALPS Holdings, Inc., and ALPS Advisors, Inc. (“AAI”), and Director of ALPS Distributors, Inc. (“ADI”), ALPS Fund Services, Inc. (“AFS”), and ALPS Portfolio Solutions Distributor, Inc. (“APSD”). Mr. Burke retired from ALPS in June 2019. | 31 | Mr. Burke is a Trustee of Clough Global Dividend and Income Fund (1 fund); Clough Global Equity Fund (1 fund); Clough Global Opportunities Fund (1 fund); Clough Funds Trust (1 fund); Liberty All-Star Equity Fund (1 fund); Director of the Liberty All-Star Growth Fund, Inc. (1 fund) and Financial Investors Trust (32 funds). |
| * | The business address of the Trustee is c/o ALPS Advisors, Inc., 1290 Broadway, Suite 1000, Denver, Colorado 80203. Effective December 1, 2021, Mr. Burke is an Independent Trustee of the Trust. |
| ** | This is the period for which the Trustee began serving the Trust. Each Trustee serves an indefinite term, until his successor is elected. |
| *** | The Fund Complex includes all series of the Trust and any other investment companies for which ALPS Advisors, Inc. provides investment advisory services. |
| ALPS ETF Trust | |
| Trustees & Officers | November 30, 2021 (Unaudited) |
| OFFICERS | | | |
| Name, Address and Year of Birth of Officer* | Position(s) Held with Trust | Length of Time Served** | Principal Occupation(s) During Past 5 Years |
Laton Spahr,
1975 | President | Since June 2021 | Mr. Spahr joined ALPS in 2019 and currently serves as President and Portfolio Manager of AAI. Prior to his current role, Mr. Spahr was a Senior Vice President and Strategy Leader of the Value & Income Team for Oppenheimer Funds from 2013 to 2019. |
Matthew Sutula,
1985 | Chief Compliance Officer (“CCO”) | Since December 2019 | Mr. Sutula joined ALPS in 2012 and currently serves as Chief Compliance Officer of AAI. Prior to his current role, Mr. Sutula served as interim Compliance Officer of the Trust (September 2019 to December 2019). Compliance Manager and Senior Compliance Analyst for AAI, as well as Compliance Analyst for AFS. Prior to joining ALPS, he spent seven years at Morningstar, Inc. in various analyst roles supporting the registered investment company databases. Mr. Sutula is also Chief Compliance Officer of Principal Real Estate Income Fund, ALPS Variable Investment Trust, RiverNorth Opportunities Fund, Inc., Liberty All-Star Equity Fund and Liberty All-Star Growth Fund, Inc. |
Kathryn Burns,
1976 | Treasurer | Since September 2018 | Ms. Burns serves as Vice President, Director of Fund Operations of AAI since 2018. From 2013 to 2018, she served as Vice President and Fund Controller at AFS. Prior to joining ALPS, she worked at Old Mutual Capital where she served as Vice President and Chief Compliance Officer (2010 – 2012) and Regulatory Reporting Manager and Assistant Treasurer to the Old Mutual Funds Trusts (2006 – 2012). She also served as a CPA for PricewaterhouseCoopers LLP. Ms. Burns also serves as President of ALPS Variable Investment Trust, Principal Real Estate Income Fund and RiverNorth Opportunities Fund, Inc. From June 2018 to November 2021 she also served as Treasurer of Boulder Growth & Income Fund, Inc. |
Brendan Hamill,
1986 | Secretary | Since September 2021 | Mr. Hamill joined ALPS in August 2021, and is currently Vice President and Principal Legal Counsel. Prior to joining ALPS, Mr. Hamill was an attorney at Lewis Brisbois Bisgaard & Smith, LLP (law firm) (December 2018-August 2021) and Vedder Price, P.C. (law firm) (August 2015-December 2018). Mr. Hamill also serves as Secretary of Financial Investors Trust, Secretary of ALPS Variable Investment Trust, Secretary of Principal Real Estate Income Fund, and Assistant Secretary of James Advantage Funds. |
| * | The business address of each Officer is c/o ALPS Advisors, Inc., 1290 Broadway, Suite 1000, Denver, Colorado 80203. Each Officer is deemed an affiliate of the Trust as defined under the 1940 Act. |
| ** | This is the period for which the Officer began serving the Trust. Each Officer serves an indefinite term, until his/her successor is elected. |
The Statement of Additional Information includes additional information about the Fund’s Trustees and is available, without charge, upon request by calling (toll-free) 1-866-759-5679.
Intentionally Left Blank


Table of Contents
| Performance Overview | 1 |
| Disclosure of Fund Expenses | 13 |
| Report of Independent Registered Public Accounting Firm | 14 |
| Financial Statements | |
| Schedule of Investments | 15 |
| Statements of Assets and Liabilities | 20 |
| Statements of Operations | 21 |
| Statements of Changes in Net Assets | 22 |
| Financial Highlights | 26 |
| Notes to Financial Statements | 30 |
| Additional Information | 38 |
| Board Considerations Regarding Approval of Investment Advisory Agreements | 40 |
| Trustees and Officers | 41 |
alpsfunds.com
ALPS Sector Dividend Dogs ETF
| Performance Overview | November 30, 2021 (Unaudited) |
Investment Objective
The ALPS Sector Dividend Dogs ETF (the “Fund” or “SDOG”) seeks investment results that replicate as closely as possible, before fees and expenses, the performance of the S-Network® Sector Dividend Dogs Index (the “Underlying Index”).
The Underlying Index is a rules based index intended to give investors a means of tracking the overall performance of the highest dividend paying stocks (i.e. “Dividend Dogs”) in the S&P 500® Total Return Index (“SPX”) on a sector-by-sector basis. “Dividend Dogs” refers to the five stocks in each of the Global Industry Classification Standard (“GICS”) sectors, excluding the real estate sector, that make up the S&P 500® Total Return Index which offer the highest dividend yields.
Performance Overview
The ALPS Sector Dividend Dogs ETF, for the twelve-month period ended November 30, 2021, generated a total return of 19.77%, in-line with the Fund’s Underlying Index, net of fees, which returned 20.33%. The Fund underperformed the S&P 500® Total Return Index (“S&P 500®”), which returned 27.92% for the same period.
The trailing twelve-month yield for the Fund’s underlying constituents as of November 30, 2021 was 3.46% vs. 1.28% for the S&P 500®.
The S&P 500® returned 27.92% for the trailing twelve-month (TTM) period ended November 30, 2021, finishing near its all-time high. Unmoved by persistent talks of inflation and policy changes, markets surged without significant drawdowns until September. October proved resilient, as the drawdown was met by a swift bounce back to all-time-highs for most of the averages. Main macroeconomic talking points throughout 2021 centered on inflation and the question surrounding how transitory price increases would turn out to be. Inflation fears continued to be justified with the Consumer Price Index (CPI) surging 6.2% in October, along with core inflation readings increasing 4.6% for the same month; both indicators notching their largest increases since December 1990, and August 1991, respectively. Federal Reserve Chairman Powell was quick to reassure markets of the non-persistent inflation narrative throughout 2021 and announced a taper and reduction of balance sheet purchases starting in November of ‘21. Although the Fed plans to complete tapering before any rate hikes in 2022, projections of the magnitude for rate increases vary, as global supply chain woes and the newly discovered Omicron variant do not ensure a future without added policy support. Despite a murky outlook for 2021 and heading into the New Year, global GDP surpassed pre-pandemic levels in 2021, aided by policy support and strong consumer spending. Record profit margins for U.S. corporations led the way for record valuations through most of the year, but was matched by an earnings season in Q3 where many companies cut forward looking expectations amid a slowing global growth outlook.
Compared to the S&P 500®, the Fund saw a negative impact (-2.35%) from sector allocation effect for the period. The underperformance was largely driven by relative under-weighting in Information Technology (average weight for the period of 9.95% vs. 27.47% in SPX), however the positive allocation effect was mainly attributed to the relative over-weight in Energy (average weight for the period of 10.19% vs. 2.68% in SPX); a result of the equal sector weight strategy. The Fund also saw a negative impact (-7.48%) from selection effect, with Information Technology lagging all other sectors and detracting 3.32%. The Fund’s Consumer Staples names exhibited the strongest positive contribution to overall selection effect for the period.
The best performing stocks in the Fund for the period were Oneok Inc. (OKE), which increased 79.63%, and Seagate Technology Holdings (STX), which saw a gain of 76.01%. Other top performers included Exxon Mobil Corp. (XOM), which rose 66.66%, and CF Industries Holdings Inc. (CF), which climbed 64.73%. The largest detractors were Western Union Co. (WU), which decreased 28.41%, Sylvamo Corp. (SLVM), which fell 21.21%, and Kyndryl Holdings Inc. (KD), which lost 21.04%.
Looking forward, the Fund’s strategy of annually selecting the five highest yielding securities in each of the ten sectors (excluding Real Estate) in the S&P 500® is intended to provide meaningfully higher yield relative to the S&P 500®, potential for market participation in all economic cycles through equal sector weighting, and a deep value portfolio of securities as identified through high yield relative to sector peers.
Performance (as of November 30, 2021)
| | 1 Year | 5 Year | Since Inception^ |
| ALPS Sector Dividend Dogs ETF – NAV | 19.77% | 7.52% | 11.73% |
| ALPS Sector Dividend Dogs ETF – Market Price* | 19.67% | 7.50% | 11.72% |
| S-Network® Sector Dividend Dogs Total Return Index | 20.33% | 7.98% | 12.24% |
| S&P 500® Total Return Index | 27.92% | 17.90% | 15.98% |
Total Expense Ratio (per the current prospectus) 0.40%.
ALPS Sector Dividend Dogs ETF
| Performance Overview | November 30, 2021 (Unaudited) |
Performance data quoted represents past performance. Past performance does not guarantee future results. Total return figures assume reinvestment of dividends and capital gains distributions, if any. The table does not reflect the deduction of taxes that a shareholder would pay on Fund distributions or the redemption of Fund shares. Investment return and principal value of an investment will fluctuate so that an investor’s shares, when sold or redeemed, may be worth more or less than the original cost. Current performance data may be higher or lower than actual data quoted. For the most current month-end performance data please visit www.alpsfunds.com or call 1.866.675.2639.
NAV is an exchange-traded fund’s per-share value. The per-share dollar amount of the Fund is derived by dividing the total value of all the securities in its portfolio, less any liabilities, by the number of Fund shares outstanding. Market Price is the price at which a share can currently be traded in the market. Information detailing the number of days the Market Price of the Fund was greater than the Fund’s NAV and the number of days it was less than the Fund’s NAV can be obtained at www.alpsfunds.com.
| ^ | The Fund Commencement Date was June 29, 2012. |
| * | Market Price means the official closing price of a share or, if it more accurately reflects the market value of a share at the time as of which the Fund calculates current net asset value per share, the price that is the midpoint of the bid-ask spread as of that time. It does not represent the returns an investor would receive if shares were traded at other times. |
The S-Network® Sector Dividend Dogs Total Return Index is designed to serve as a fair, impartial and transparent measure of the performance of US large cap equities with above average dividend yields. The Underlying Index is a portfolio of fifty stocks derived from the S&P 500® Index. The index is reported on a total return basis, which assumes reinvestment of any dividends and distributions realized during a given time period.
The S&P 500® Total Return Index is an index of 500 stocks chosen for market size, liquidity and industry grouping among other factors. Total return assumes reinvestment of any dividends and distributions realized during a given time period.
The indexes are not actively managed and do not reflect any deductions for fees, expenses or taxes. One cannot invest directly in an index. Index performance does not reflect fund performance.
The Fund’s shares are not individually redeemable. Investors buy and sell shares of the Fund on a secondary market. Only market makers or “authorized participants” may trade directly with the Fund, typically in blocks of 25,000 shares.
The ALPS Sector Dividend Dogs ETF is not suitable for all investors. Investments in the Fund are subject to investment risks, including possible loss of the principal amount invested.
ALPS Portfolio Solutions Distributor, Inc., a FINRA member, is the distributor for the ETF.
ALPS Sector Dividend Dogs ETF
| Performance Overview | November 30, 2021 (Unaudited) |
Top 10 Holdings* (as of November 30, 2021)
| CF Industries Holdings, Inc. | 2.73% |
| Seagate Technology Holdings PLC | 2.51% |
| Pfizer, Inc. | 2.41% |
| ONEOK, Inc. | 2.33% |
| Comerica, Inc. | 2.33% |
| Edison International | 2.30% |
| Juniper Networks, Inc. | 2.30% |
| Exxon Mobil Corp. | 2.27% |
| Williams Cos., Inc. | 2.26% |
| AbbVie, Inc. | 2.22% |
| Total % of Top 10 Holdings | 23.66% |
Future holdings are subject to change.
Sector Allocation* (as of November 30, 2021)
| Energy | 11.00% |
| Health Care | 10.49% |
| Financials | 10.35% |
| Information Technology | 10.23% |
| Materials | 10.09% |
| Utilities | 10.05% |
| Communication Services | 9.54% |
| Consumer Discretionary | 9.54% |
| Industrials | 9.43% |
| Consumer Staples | 9.17% |
| Money Market Fund | 0.11% |
| Total | 100.00% |
Growth of $10,000 (as of November 30, 2021)
Comparison of Change in Value of $10,000 Investment in the Fund and the Indexes

The chart above compares historical performance of a hypothetical investment of $10,000 in the Fund since inception with the performance of the Fund’s benchmark index. Results include the reinvestment of all dividends and capital gains distributions. Past performance does not guarantee future results. The chart does not reflect the deduction of taxes that a shareholder would pay on Fund distributions or the redemption of Fund shares.
ALPS International Sector Dividend Dogs ETF
| Performance Overview | November 30, 2021 (Unaudited) |
Investment Objective
The ALPS International Sector Dividend Dogs ETF (the “Fund” or “IDOG”) seeks investment results that replicate as closely as possible, before fees and expenses, the performance of the S-Network® International Sector Dividend Dogs Net Total Return Index (the “Underlying Index”).
The Underlying Index is a rules-based index intended to give investors a means of tracking the overall performance of the highest dividend paying stocks (i.e. “Dividend Dogs”) in the S-Network® Developed Markets (ex NA) Index, a universe of mainly large capitalization stocks in international developed markets not located in the Americas (the “S-Net Developed Markets”) on a sector-by-sector basis. “Dividend Dogs” refers to the five stocks in each of the Global Industry Classification Standard (“GICS”) sectors, excluding the real estate sector, that make up the S-Net Developed Markets which offer the highest dividend yields.
Performance Overview
The ALPS International Sector Dividend Dogs ETF, for the trailing twelve-month period ended November 30, 2021, generated a total return of 10.93%, relatively in-line with the Fund’s Underlying Index, net of fees, which returned 11.42%. The Fund slightly underperformed the Morningstar Developed Markets ex-North America Index (MSDINUS), which returned 10.87% for the same period.
The trailing twelve-month yield for the Fund’s constituents as of 11/30/2021 was 3.99%.
Developed Markets (ex-U.S.), as represented by the Morningstar Developed Markets ex-North America Index, returned 10.87% for the trailing twelve-month period ended November 30, 2021. In what is normally a headwind for international equities, the U.S. Dollar strengthened relative to the Euro, however ex-U.S. markets did not see the historical drop in performance from the move.
Similar to the U.S., Eurozone markets saw a strong earnings season and ongoing economic recovery from the pandemic. Value outperformed growth equities internationally for the majority of the year, with the gap in performance closing in recent months. Future growth prospects remain optimistic, predicated on lessening travel restrictions and temporary higher inflation. Annual inflation in the Eurozone was estimated at 3.4% in September, up from 2.2% in July. The ECB echoed the Fed’s dovish tone in European markets, stating it would tolerate any moderate overshoot of its 2.0% inflation target. Monetary policy decisions will be at the forefront of macro discussions, as many central banks have begun to raise rates or entertain the idea of tightening monetary policy. However, significant growth prospects remain, as continued post-pandemic fiscal policy will support global economic expansion heading into 2022.
Compared to the Morningstar Developed Markets ex-North America Index, the Fund saw a slightly negative impact of -0.61% from sector allocation where a relative overweight in Energy (average weight for the period of 10.02% vs. 2.93% in MSDINUS) contributed to positive performance, a result of the equal sector weighting strategy. The Fund’s relative overweight to the Utilities sector (average weight for the period of 10.04% vs. 3.40% in MSDINUS) detracted from positive performance. The Fund also saw relative underperformance of -1.73% attributed to selection effect.
From a geographical perspective, the highest contribution to return was attributed to holdings based in Japan. The Fund’s performance was adversely impacted by holdings based in France. Overall, the currency effect detracted roughly -0.15% to the overall performance of the Fund.
The best-performing stocks for the trailing twelve-month period were Hitachi Ltd. (6501 JP), which increased 57.90%, BP Plc. (BP/ LN), which returned 37.07%, and Telestra Corp Ltd. (TLS AU), which gained 31.08%. The worst performing stocks were Takeda Pharmaceutical Co Ltd. (4502 JP), which lost 22.14%, Edenred (EDEN FP), which fell 22.02%; and Continental AG (CON GR), which decreased 18.25%.
Looking forward, the Fund’s strategy of annually selecting the five highest yielding securities in each of the ten sectors in the S-Network Developed Markets (Ex N.A.) Index is intended to provide high yield relative to the Morningstar Developed Markets ex-North America Index, potential for market participation in all economic cycles through equal sector weighting, and a deep value portfolio of securities as identified through high yield relative to their sector peers.
Performance (as of November 30, 2021)
| | 1 Year | 5 Year | Since Inception^ |
| ALPS International Sector Dividend Dogs ETF – NAV | 10.93% | 7.33% | 4.76% |
| ALPS International Sector Dividend Dogs ETF – Market Price* | 11.18% | 7.27% | 4.72% |
| S-Network® International Sector Dividend Dogs Net Total Return Index | 11.42% | 7.78% | 5.18% |
| Morningstar® Developed Markets ex-North America Net Total Return Index | 10.87% | 9.33% | 6.65% |
Total Expense Ratio (per the current prospectus) 0.50%.
ALPS International Sector Dividend Dogs ETF
| Performance Overview | November 30, 2021 (Unaudited) |
Performance data quoted represents past performance. Past performance does not guarantee future results. Total return figures assume reinvestment of dividends and capital gains distributions, if any. The table does not reflect the deduction of taxes that a shareholder would pay on Fund distributions or the redemption of Fund shares. Investment return and principal value of an investment will fluctuate so that an investor’s shares, when sold or redeemed, may be worth more or less than the original cost. Current performance data may be higher or lower than actual data quoted. For the most current month-end performance data please visit www.alpsfunds.com or call 1.866.675.2639.
NAV is an exchange-traded fund’s per-share value. The per-share dollar amount of the Fund is derived by dividing the total value of all the securities in its portfolio, less any liabilities, by the number of Fund shares outstanding. Market Price is the price at which a share can currently be traded in the market. Information detailing the number of days the Market Price of the Fund was greater than the Fund’s NAV and the number of days it was less than the Fund’s NAV can be obtained at www.alpsfunds.com.
| ^ | The Fund Commencement Date was June 28, 2013. |
| * | Market Price means the official closing price of a share or, if it more accurately reflects the market value of a share at the time as of which the Fund calculates current net asset value per share, the price that is the midpoint of the bid-ask spread as of that time. It does not represent the returns an investor would receive if shares were traded at other times. |
The S-Network® International Sector Dividend Dogs Net Total Return Index is designed to serve as a fair, impartial and transparent measure of the performance of international large cap equities with above average dividend yields. The Underlying Index is a portfolio of fifty stocks derived from the S-Network International Developed Markets (ex-Americas) Index. Total Return assumes reinvestment of any dividends and distributions realized during a given time period. Net Total Return (NTR) is obtained by reinvesting the net dividend, which is equal to the ordinary gross dividend minus the amount of withholding tax.
Morningstar® Developed Markets ex-North America Net Total Return Index measures the performance of companies in developed markets ex-North America. It covers approximately 97% of the full market capitalization in the Developed Markets ex-North America.
The indexes are not actively managed and do not reflect any deductions for fees, expenses or taxes. One cannot invest directly in an index. Index performance does not reflect fund performance.
The Fund’s shares are not individually redeemable. Investors buy and sell shares of the Fund on a secondary market. Only market makers or “authorized participants” may trade directly with the Fund, typically in blocks of 25,000 shares.
The ALPS International Sector Dividend Dogs ETF is not suitable for all investors. Investments in the Fund are subject to investment risks, including possible loss of the principal amount invested.
ALPS Portfolio Solutions Distributor, Inc., a FINRA member, is the distributor for the ETF.
ALPS International Sector Dividend Dogs ETF
| Performance Overview | November 30, 2021 (Unaudited) |
Top 10 Holdings* (as of November 30, 2021)
| Woodside Petroleum, Ltd. | 2.28% |
| Naturgy Energy Group SA | 2.27% |
| Royal Dutch Shell PLC | 2.26% |
| TotalEnergies SE | 2.25% |
| Swiss Re AG | 2.25% |
| BP PLC | 2.24% |
| GlaxoSmithKline PLC | 2.19% |
| Bayerische Motoren Werke AG | 2.18% |
| Koninklijke Ahold Delhaize NV | 2.16% |
| Telstra Corp., Ltd. | 2.16% |
| Total % of Top 10 Holdings | 22.24% |
Future holdings are subject to change.
Sector Allocation* (as of November 30, 2021)
| Industrials | 11.26% |
| Energy | 11.15% |
| Utilities | 10.29% |
| Consumer Discretionary | 10.27% |
| Financials | 10.24% |
| Consumer Staples | 10.14% |
| Health Care | 9.87% |
| Communication Services | 9.86% |
| Materials | 9.41% |
| Information Technology | 7.36% |
| Money Market Fund | 0.15% |
| Total | 100.00% |
Growth of $10,000 (as of November 30, 2021)
Comparison of Change in Value of $10,000 Investment in the Fund and the Indexes

The chart above compares historical performance of a hypothetical investment of $10,000 in the Fund since inception with the performance of the Fund’s benchmark index. Results include the reinvestment of all dividends and capital gains distributions. Past performance does not guarantee future results. The chart does not reflect the deduction of taxes that a shareholder would pay on Fund distributions or the redemption of Fund shares.
ALPS Emerging Sector Dividend Dogs ETF
| Performance Overview | November 30, 2021 (Unaudited) |
Investment Objective
The ALPS Emerging Sector Dividend Dogs ETF (the “Fund” or “EDOG”) seeks investment results that replicate as closely as possible, before fees and expenses, the performance of the S-Network® Emerging Sector Dividend Dogs Net Total Return Index (the “Underlying Index”).
The Underlying Index is a rules-based index intended to give investors a means of tracking the overall performance of the highest dividend paying stocks (i.e. “Dividend Dogs”) in the S-Network® Emerging Markets Index, a universe of mainly large capitalization stocks domiciled in emerging markets (the “S-Network Emerging Markets”) on a sector-by-sector basis. “Dividend Dogs” refers to the five stocks in each of the Global Industry Classification Standard (“GICS”) sectors, excluding the real estate sector, that make up the S-Network® Emerging Markets which offer the highest dividend yields. Emerging market countries are countries that major international financial institutions, such as the World Bank, generally consider to be less economically mature than developed nations.
Performance Overview
The ALPS Emerging Sector Dividend Dogs ETF, for the trailing twelve-month period ended November 30, 2021, generated a total return of 16.81%, relatively in-line with the Fund’s Underlying Index, net of fees, which returned 17.87%. The Fund vastly outperformed the Morningstar Emerging Markets Index (MEMMN), which returned 4.72% for the same period.
The trailing twelve-month yield for the Fund’s constituents as of November 30, 2021 was 3.89% vs. 2.54% for the Morningstar Emerging Markets Index.
Through the first half of the year, emerging markets benefitted from the continued recovery of the COVID-19 pandemic, as countries saw growth in export volumes and consumption. Trailing twelve-months (TTM) performance, tracked by the MEMMN Index, outpaced U.S. Indices through February, at which time worries around inflation and rising prices began to take hold. Surging producer price inflation recorded its largest year-over-year jump in May at 9%, adding to concern. Despite these bumps in the road and slower rates of mass vaccination, emerging markets exhibited strong support from increased activity. The second half of the year saw EM equities underperform broad U.S. indexes, with supply chain bottlenecks and drastically higher commodity prices beginning to appear as longer-term disruptions. EM equities declined from June on, accelerated by the Chinese market’s sharp sell-off and government crackdown of technology and education names. Additional pressure came from the real estate sector, where concerns of a systematic impact from the company Evergrande arose. China continues to pose significant headwinds for emerging market performance as U.S. regulators threaten to potentially delist a number of Chinese equities on U.S. exchanges. Although it has not been a picture perfect year for emerging market equities, they are poised to perform well if significant stimulus continues and the U.S. dollar weakens.
Compared to the Morningstar Emerging Markets Index, the Fund outperformed by over 1300bps, largely driven by the relative underweight to Consumer Discretionary (average weight for the period of 10.00% vs. 16.21% in MEMMN) and a relative overweight to Energy over the one year period (average weight for the period of 10.23% vs. 4.89% in MEMMN), a result of the equal sector weighting strategy. The Fund also saw a positive impact (16.36%) due to selection effect. From a geographical perspective, the highest contribution to return was attributed to holdings based in India. The Fund’s performance was adversely impacted by holdings based in Chile. Overall, the currency effect lowered the overall performance of the Fund by roughly 2.25%.
The best-performing stocks for the period were Vedanta Ltd. (VEDL US), which increased 115.24%, Yanzhou Coal Mining Co. (1171 HK), which returned 104.84%, and Globe Telecom, Inc. (GLO PM), which gained 68.74%. The worst performing stocks were Top Glove Corp. (TOPG MK), which lost 54.44%, BB Seguridade Participacoes (BBSE3 BZ), which fell 33.62%; and Enel Chile SA-ADR (ENIC US), which decreased 32.49%.
Looking forward, the Fund’s strategy of annually selecting the five highest-yielding securities in each of the ten sectors in the S-Net Emerging Markets Index is intended to provide high yield relative to the Morningstar Emerging Markets Index, potential for market participation in all economic cycles through equal sector weighting, and a deep value portfolio of securities as identified through high yield relative to their sector peers.
Performance (as of November 30, 2021)
| | 1 Year | 5 Year | Since Inception^ |
| ALPS Emerging Sector Dividend Dogs ETF – NAV | 16.81% | 6.38% | 3.15% |
| ALPS Emerging Sector Dividend Dogs ETF – Market Price* | 16.67% | 6.25% | 3.13% |
| S-Network® Emerging Sector Dividend Dogs Net Total Return Index | 17.87% | 7.17% | 3.99% |
| Morningstar® Emerging Markets Net Total Return Index | 4.72% | 9.91% | 5.91% |
Total Expense Ratio (per the current prospectus) 0.60%.
Performance data quoted represents past performance. Past performance does not guarantee future results. Total return figures assume reinvestment of dividends and capital gains distributions, if any. The table does not reflect the deduction of taxes that a shareholder would pay on Fund distributions or the redemption of Fund shares. Investment return and principal value of an investment will fluctuate so that an investor’s shares, when sold or redeemed, may be worth more or less than the original cost. Current performance data may be higher or lower than actual data quoted. For the most current month-end performance data please visit www.alpsfunds.com or call 1.866.675.2639.
ALPS Emerging Sector Dividend Dogs ETF
| Performance Overview | November 30, 2021 (Unaudited) |
NAV is an exchange-traded fund’s per-share value. The per-share dollar amount of the Fund is derived by dividing the total value of all the securities in its portfolio, less any liabilities, by the number of Fund shares outstanding. Market Price is the price at which a share can currently be traded in the market. Information detailing the number of days the Market Price of the Fund was greater than the Fund’s NAV and the number of days it was less than the Fund’s NAV can be obtained at www.alpsfunds.com.
| ^ | The Fund Commencement Date was March 28, 2014. |
| * | Market Price means the official closing price of a share or, if it more accurately reflects the market value of a share at the time as of which the Fund calculates current net asset value per share, the price that is the midpoint of the bid-ask spread as of that time. It does not represent the returns an investor would receive if shares were traded at other times. |
The S-Network® Emerging Sector Dividend Dogs Net Total Return Index is a portfolio of stocks derived from a universe of mainly large capitalization stocks domiciled in emerging markets (the “S-Network Emerging Markets Index” “SNEMX”). The index methodology selects the five stocks in each of the GICS sectors, excluding the real estate sector, that make up the universe which offer the highest dividend yields as of the last trading day of November. The fifty stocks that are selected for inclusion in the portfolio are equally weighted. The universe includes stocks whose domicile and primary exchange listings are in countries identified by the World Bank as Upper Middle Income (certain lower middle income countries are also included, as well as stocks traded on the Taiwan Stock Exchange despite non-recognition by the World Bank). The selection criteria for the universe, in addition to the aforementioned country qualifications, also include requirements for sector inclusion, primary exchange listing, minimum market capitalization, share price, average daily trading volume and other factors. Total Return assumes reinvestment of any dividends and distributions realized during a given time period. Net Total Return (NTR) is obtained by reinvesting the net dividend, which is equal to the ordinary gross dividend minus the amount of withholding tax.
Morningstar® Emerging Markets Net Total Return Index measures the performance of emerging markets targeting the top 97% of stocks by market capitalization.
The indexes are not actively managed and do not reflect any deductions for fees, expenses or taxes. One cannot invest directly in an index. Index performance does not reflect fund performance.
The Fund’s shares are not individually redeemable. Investors buy and sell shares of the Fund on a secondary market. Only market makers or “authorized participants” may trade directly with the Fund, typically in blocks of 25,000 shares.
The ALPS Emerging Sector Dividend Dogs ETF is not suitable for all investors. Investments in the Fund are subject to investment risks, including possible loss of the principal amount invested.
ALPS Portfolio Solutions Distributor, Inc., a FINRA member, is the distributor for the ETF.
ALPS Emerging Sector Dividend Dogs ETF
| Performance Overview | November 30, 2021 (Unaudited) |
Top 10 Holdings* (as of November 30, 2021)
| Adaro Energy Tbk PT | 2.73% |
| PLDT, Inc. | 2.51% |
| Globe Telecom, Inc. | 2.48% |
| Credicorp, Ltd. | 2.46% |
| Telefonica Brasil SA | 2.43% |
| Kalbe Farma Tbk PT | 2.36% |
| MultiChoice Group | 2.35% |
| Bumrungrad Hospital Pcl | 2.35% |
| Magnit PJSC | 2.32% |
| Aboitiz Equity Ventures, Inc. | 2.31% |
| Total % of Top 10 Holdings | 24.30% |
| * | % of Total Investments (excluding investments purchased with collateral from securities loaned). Future holdings are subject to change. |
Sector Allocation* (as of November 30, 2021)
| Communication Services | 11.67% |
| Health Care | 10.62% |
| Financials | 10.60% |
| Industrials | 10.59% |
| Consumer Staples | 10.34% |
| Energy | 10.06% |
| Utilities | 10.01% |
| Consumer Discretionary | 9.30% |
| Information Technology | 8.90% |
| Materials | 7.79% |
| Money Market Fund | 0.12% |
| Total | 100.00% |
Growth of $10,000 (as of November 30, 2021)
Comparison of Change in Value of $10,000 Investment in the Fund and the Indexes
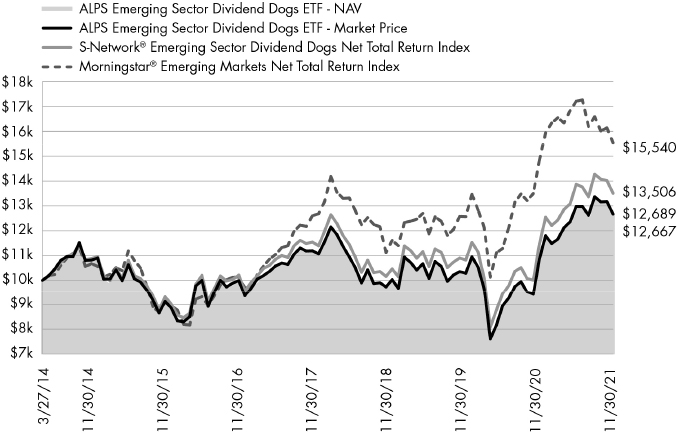
The chart above compares historical performance of a hypothetical investment of $10,000 in the Fund since inception with the performance of the Fund’s benchmark index. Results include the reinvestment of all dividends and capital gains distributions. Past performance does not guarantee future results. The chart does not reflect the deduction of taxes that a shareholder would pay on Fund distributions or the redemption of Fund shares.
ALPS REIT Dividend Dogs ETF
| Performance Overview | November 30, 2021 (Unaudited) |
Investment Objective
The ALPS REIT Dividend Dogs ETF (the “Fund” or "RDOG") seeks investment results that replicate as closely as possible, before fees and expenses, the performance of the S-Network® REIT Dividend Dogs Total Return Index (the “Underlying Index”).
The Underlying Index is a rules-based index intended to give investors a means of tracking the overall performance of the highest dividend paying real estate investment trusts (“REITs”) (i.e. “Dividend Dogs”) in the S-Network® Composite US REIT Index, a universe of mainly REITs listed in the United States (the “S-Net U.S. REIT” or "SNREIT"), on a segment-by-segment basis. “Dividend Dogs” refers to the five REITs in each of the nine segments that make up the S-Net U.S. REIT which offer the highest dividend yields.
Performance Overview
The ALPS REIT Dividend Dogs ETF, for the twelve-month period ended November 30, 2021, generated a total return of 29.00%, in-line with the Fund’s Underlying Index, net of fees, which returned 29.20%. The Fund underperformed the broader U.S. REIT market, as represented by the S-Network Composite US REIT Index (SNREIT), which returned 31.78% for the same period.
The trailing twelve-month (TTM) yield for the fund as of 11/30/2021 was 3.93% while the SNREIT TTM yield was 3.06% as of November 30, 2021.
The S-Network Composite US REIT Index returned 31.78% on a trailing twelve-month period ended November 30, 2021, and the S&P 500 Total Return Index returned 27.92% for the trailing twelve-month period, finishing near its all-time high. Unmoved by persistent talks of inflation and policy changes, markets surged without significant drawdowns until September. October proved resilient, as the drawdown was met by a swift bounce back to all-time-highs for most of the averages. Main macroeconomic talking points throughout 2021 centered on inflation and the question of how transitory price increases would turn out to be. Inflation fears continued to be justified with the Consumer Price Index (CPI) surging 6.2% in October, along with core inflation readings increasing 4.6% for the same month; both indicators notching their largest increases since December 1990, and August 1991, respectively. Federal Reserve Chairman Powell was quick to reassure markets of the non-persistent inflation narrative throughout 2021 and announced a taper and reduction of balance sheet purchases starting in November of ‘21. Although the Fed plans to complete tapering before any rate hikes in 2022, projections of the magnitude for said rate increases vary, as global supply chain woes and the newly discovered COVID-19 Omicron variant do not ensure a future without added policy support. Despite a murky economic landscape for 2021 and heading into the New Year, global GDP surpassed pre-pandemic levels in 2021, aided by policy support and strong consumer spending. Record profit margins for U.S. corporations led the way for record valuations through most of the year, but were matched by an earnings season in Q3 where many companies cut forward looking expectations amid a slowing global growth outlook.
Travel-sensitive REITs, such as Hotel & Resorts REITs, lagged the broader REIT market the most due to surges of new COVID variants and pauses in global travel. In contrast, Industrial REITs performed the best during the period, as strong market fundamentals and tenant demand drove commercial property gains.
The best-performing stocks in the Fund for the period were Plymouth Industrial REIT, Inc. (PLYM), which increased 104.71%, and City Office REIT, Inc. (CIO), which saw a gain of 99.97%. The largest detractors were Washington Prime Group, Inc. (WPGGQ), which decreased 29.08%, Service Properties Trust (SVC), which fell 27.99%, and Sabra Health Care REIT, Inc. (SBRA), which lost 15.64%.
Looking forward, the Fund’s strategy of annually selecting the five highest-yielding securities in each of the nine segments in the S-Network Composite US REIT Index is intended to provide meaningfully higher yield relative to the S-Network Composite US REIT Index, potential for market participation in all economic cycles through equal segment weighting, and a value portfolio of securities as identified through high yield relative to their segment peers.
Performance (as of November 30, 2021)
| | 1 Year | 5 Year | 10 Year | Since Inception^ |
| ALPS REIT Dividend Dogs ETF – NAV | 29.00%* | 8.04% | 8.34% | 4.03% |
| ALPS REIT Dividend Dogs ETF – Market Price** | 29.13% | 8.08% | 8.18% | 4.04% |
| S-Network® REIT Dividend Dogs Total Return Index | 29.20% | – | – | – |
| S-Network® Composite US REIT Index | 31.78% | – | – | – |
| S-Network REIT Dividend Dogs Index/S&P United States REIT Index*** | 29.20% | 8.26% | 10.07% | 7.16% |
Total Expense Ratio (per the current prospectus) is 0.35%.
Performance data quoted represents past performance. Past performance does not guarantee future results. On January 2, 2020, the Fund changed its Underlying Index and principal investment strategies. Consequently, the Fund's total returns shown above for the periods prior to January 2, 2020 are not necessarily indicative of the performance of the Fund, as it is currently managed. Total return figures assume reinvestment of dividends and capital gains distributions, if any. The table does not reflect the deduction of taxes that a shareholder would pay on Fund distributions or the redemption of Fund shares. Investment return and principal value of an investment will fluctuate so that an investor’s shares, when sold or redeemed, may be worth more or less than the original cost. Current performance data may be higher or lower than actual data quoted. For the most current month-end performance data please visit www.alpsfunds.com or call 1.866.759.5679.
ALPS REIT Dividend Dogs ETF
| Performance Overview | November 30, 2021 (Unaudited) |
NAV is an exchange-traded fund’s per-share value. The per-share dollar amount of the Fund is derived by dividing the total value of all the securities in its portfolio, less any liabilities, by the number of Fund shares outstanding. Market Price is the price at which a share can currently be traded in the market. Information detailing the number of days the Market Price of the Fund was greater than the Fund’s NAV and the number of days it was less than the Fund’s NAV can be obtained at www.alpsfunds.com.
| ^ | The Fund Inception Date was May 7, 2008. |
| * | Excludes adjustments in accordance with accounting principles generally accepted in the United States of America and as such, the net asset value and total return for shareholder transactions reported to the market may differ from the net asset value for financial reporting purposes. |
| ** | Market Price means the official closing price of a share or, if it more accurately reflects the market value of a share at the time as of which the Fund calculates current net asset value per share, the price that is the midpoint of the bid-ask spread as of that time. It does not represent the returns an investor would receive if shares were traded at other times. |
| *** | The performance shown reflects a combination of the Fund's Underlying Index, and for periods prior to January 2, 2020, the S&P United States REIT Index. |
The S-Network® REIT Dividend Dogs Total Return Index, like the S-Net U.S. REIT from which components of the Underlying Index are selected, divides into nine segments, eight of which are based on Global Industry Classification Standard (“GICS”) Sub-Industries (excluding Technology REITs involved in cell towers and/or data centers) and a separate Technology REIT segment based on the research of the Underlying Index provider, S-Network® Global Indexes, Inc. (the “Index Provider”). The Underlying Index generally consists of 45 REITs on each annual reconstitution date. The Underlying Index’s REITs must be constituents of the S-Net U.S. REIT universe, which includes a universe of mainly REITs listed in the United States. The selection criteria for the universe also includes requirements for segment inclusion, primary exchange listing, minimum market capitalization, share price, average daily trading volume and other factors. The Underlying Index is rebalanced quarterly. The index is reported on a total return basis, which assumes reinvestment of any dividends and distributions realized during a given time period. The index commenced operations on October 29, 2019.
The S-Network® Composite US REIT Index (the “S-Net U.S. REIT” or “SNREIT”) is a benchmark index for the Real Estate Investment Trust component of the US stock market. The SNREIT provides the universe of stocks for RDOGX. The selection criteria for SNREIT include requirements for sector inclusion, primary exchange listing, minimum market capitalization, minimum average daily trading volume, and other factors. All constituents of RDOGX must be constituents of SNREIT. The index commenced operations on February 12, 2016.
The S&P United States REIT Index defines and measures the investable universe of publicly traded real estate investment trusts domiciled in the United States.
The indexes are not actively managed and do not reflect any deductions for fees, expenses or taxes. Total return assumes reinvestment of any dividends and distributions realized during a given time period. One cannot invest directly in an index. Index performance does not reflect fund performance.
The Fund’s shares are not individually redeemable. Investors buy and sell shares of the Fund on a secondary market. Only market makers or “authorized participants” may trade directly with the Fund, typically in blocks of 25,000 shares.
The ALPS REIT Dividend Dogs ETF is not suitable for all investors. Investments in the Fund are subject to investment risks, including possible loss of the principal amount invested.
ALPS Portfolio Solutions Distributor, Inc., a FINRA member, is the distributor for the ETF.
ALPS REIT Dividend Dogs ETF
| Performance Overview | November 30, 2021 (Unaudited) |
Top 10 Holdings* (as of November 30, 2021)
| Plymouth Industrial REIT, Inc. | 3.13% |
| Franklin Street Properties Corp. | 3.12% |
| CyrusOne, Inc. | 2.79% |
| CoreSite Realty Corp. | 2.79% |
| Monmouth Real Estate Investment Corp. | 2.72% |
| Saul Centers, Inc. | 2.72% |
| The Macerich Co. | 2.70% |
| Lexington Realty Trust | 2.67% |
| Digital Realty Trust, Inc. | 2.61% |
| One Liberty Properties, Inc. | 2.57% |
| Total % of Top 10 Holdings | 27.82% |
Future holdings are subject to change.
REIT Sector Allocation* (as of November 30, 2021)
| Specialized REITs | 16.86% |
| Industrial REITs | 13.09% |
| Office REITs | 12.59% |
| Residential REITs | 12.34% |
| Retail REITs | 12.26% |
| Diversified REITs | 11.89% |
| Health Care REITs | 11.14% |
| Technology REITs | 7.73% |
| Hotel & Resort REITs | 1.94% |
| Money Market Fund | 0.16% |
| Total | 100.00% |
Growth of $10,000 (as of November 30, 2021)
Comparison of Change in Value of $10,000 Investment in the Fund and the Indexes

The chart above compares historical performance of a hypothetical investment of $10,000 in the Fund over the past ten years with the performance of the Fund’s benchmark index. Results include the reinvestment of all dividends and capital gains distributions. Past performance does not guarantee future results. The chart does not reflect the deduction of taxes that a shareholder would pay on Fund distributions or the redemption of Fund shares.
ALPS ETF Trust
| Disclosure of Fund Expenses | November 30, 2021 (Unaudited) |
Shareholder Expense Example: As a shareholder of a Fund, you incur certain ongoing costs, including management fees and other Fund expenses. These examples are intended to help you understand your ongoing costs (in dollars) of investing in the Fund and to compare these costs with the ongoing costs of investing in other funds. It is based on an investment of $1,000 invested at the beginning of the (six month) period and held through November 30, 2021.
Actual Return: The first line of the table provides information about actual account values and actual expenses. You may use the information in this line, together with the amount you invested, to estimate the expenses that you incurred over the period. Simply divide your account value by $1,000 (for example, an $8,600 account value divided by $1,000 = 8.6), then multiply the result by the number in the first line under the heading entitled “Expenses Paid During Period” to estimate the expenses attributable to your investment during this period.
Hypothetical 5% Return: The second line of the table provides information about hypothetical account values and hypothetical expenses based on the Fund’s actual expense ratio and an assumed rate of return of 5% per year before expenses, which is not the Fund’s actual return. The hypothetical account values and expenses may not be used to estimate the actual ending account balance or expenses you paid for the period. You may use this information to compare ongoing costs of investing in the Fund and other funds. To do so, compare this 5% hypothetical example with the 5% hypothetical examples that appear in the shareholder reports of other funds.
The expenses shown in the table are meant to highlight ongoing Fund costs only and do not reflect any transaction costs, such as brokerage commissions and other fees to financial intermediaries. Therefore, the second line is useful in comparing ongoing costs only, and will not help you determine the relative total costs of owning different funds. In addition, if these costs were included, your costs would have been higher.
| | | Beginning Account Value 6/1/21 | | | Ending Account Value 11/30/21 | | | Expense Ratio(a) | | | Expenses Paid During Period 6/1/21 - 11/30/21(b) | |
| ALPS Sector Dividend Dogs ETF | | | | | | | | | | | | | | | | |
| Actual | | $ | 1,000.00 | | | $ | 941.80 | | | | 0.40 | % | | $ | 1.95 | |
| Hypothetical (5% return before expenses) | | $ | 1,000.00 | | | $ | 1,023.06 | | | | 0.40 | % | | $ | 2.03 | |
| | | | | | | | | | | | | | | | | |
| ALPS International Sector Dividend Dogs ETF | | | | | | | | | | | | | | | | |
| Actual | | $ | 1,000.00 | | | $ | 937.60 | | | | 0.50 | % | | $ | 2.43 | |
| Hypothetical (5% return before expenses) | | $ | 1,000.00 | | | $ | 1,022.56 | | | | 0.50 | % | | $ | 2.54 | |
| | | | | | | | | | | | | | | | | |
| ALPS Emerging Sector Dividend Dogs ETF | | | | | | | | | | | | | | | | |
| Actual | | $ | 1,000.00 | | | $ | 979.00 | | | | 0.60 | % | | $ | 2.98 | |
| Hypothetical (5% return before expenses) | | $ | 1,000.00 | | | $ | 1,022.06 | | | | 0.60 | % | | $ | 3.04 | |
| | | | | | | | | | | | | | | | | |
| ALPS REIT Dividend Dogs ETF | | | | | | | | | | | | | | | | |
| Actual | | $ | 1,000.00 | | | $ | 1,079.90 | | | | 0.35 | % | | $ | 1.82 | |
| Hypothetical (5% return before expenses) | | $ | 1,000.00 | | | $ | 1,023.31 | | | | 0.35 | % | | $ | 1.78 | |
| (a) | Annualized based on the Fund's most recent half-year expenses. |
| (b) | Expenses are equal to the Fund's annualized expense ratio multiplied by the average account value over the period, multiplied by the number of days in the most recent fiscal half year (183), divided by 365. |
ALPS ETF Trust
Report of Independent Registered Public Accounting Firm
To the Board of Trustees of ALPS ETF Trust and the shareholders of ALPS Sector Dividend Dogs ETF, ALPS International Sector Dividend Dogs ETF, ALPS Emerging Sector Dividend Dogs ETF, and ALPS REIT Dividend Dogs ETF:
Opinion on the Financial Statements and Financial Highlights
We have audited the accompanying statements of assets and liabilities, including the schedules of investments of ALPS Sector Dividend Dogs ETF, ALPS International Sector Dividend Dogs ETF, ALPS Emerging Sector Dividend Dogs ETF, and ALPS REIT Dividend Dogs ETF (the "Funds"), four of the funds constituting the ALPS ETF Trust, as of November 30, 2021, the related statements of operations for the year then ended, the statements of changes in net assets for each of the two years in the period then ended, and the financial highlights for each of the five years in the period then ended, and the related notes.
In our opinion, the financial statements and financial highlights present fairly, in all material respects, the financial position of the Funds as of November 30, 2021, and the results of their operations for the year then ended, the changes in their net assets for each of the two years in the period then ended, and the financial highlights for each of the five years in the period then ended in conformity with accounting principles generally accepted in the United States of America.
Basis for Opinion
These financial statements and financial highlights are the responsibility of the Funds’ management. Our responsibility is to express an opinion on the Funds’ financial statements and financial highlights based on our audits. We are a public accounting firm registered with the Public Company Accounting Oversight Board (United States) (PCAOB) and are required to be independent with respect to the Funds in accordance with the U.S. federal securities laws and the applicable rules and regulations of the Securities and Exchange Commission and the PCAOB.
We conducted our audits in accordance with the standards of the PCAOB. Those standards require that we plan and perform the audits to obtain reasonable assurance about whether the financial statements and financial highlights are free of material misstatement, whether due to error or fraud. The Funds are not required to have, nor were we engaged to perform, an audit of their internal control over financial reporting. As part of our audits we are required to obtain an understanding of internal control over financial reporting but not for the purpose of expressing an opinion on the effectiveness of the Funds’ internal control over financial reporting. Accordingly, we express no such opinion.
Our audits included performing procedures to assess the risks of material misstatement of the financial statements and financial highlights, whether due to error or fraud, and performing procedures that respond to those risks. Such procedures included examining, on a test basis, evidence regarding the amounts and disclosures in the financial statements and financial highlights. Our audits also included evaluating the accounting principles used and significant estimates made by management, as well as evaluating the overall presentation of the financial statements and financial highlights. Our procedures included confirmation of securities owned as of November 30, 2021, by correspondence with the custodian and brokers; when replies were not received from brokers, we performed other auditing procedures. We believe that our audits provide a reasonable basis for our opinion.
DELOITTE & TOUCHE LLP
Denver, Colorado
January 26, 2022
We have served as the auditor of one or more investment companies advised by ALPS Advisors, Inc. since 2007.
ALPS Sector Dividend Dogs ETF
| Schedule of Investments | November 30, 2021 |
| Security Description | | Shares | | | Value | |
| COMMON STOCKS (99.46%) |
| Communication Services (9.50%) |
| AT&T, Inc. | | | 853,354 | | | $ | 19,482,072 | |
| Interpublic Group of Cos., Inc. | | | 640,997 | | | | 21,274,690 | |
| Lumen Technologies, Inc. | | | 1,937,101 | | | | 23,903,826 | |
| Omnicom Group, Inc. | | | 322,564 | | | | 21,711,783 | |
| Verizon Communications, Inc. | | | 426,384 | | | | 21,434,324 | |
| Total Communication Services | | | | | | | 107,806,695 | |
| | | | | | | | | |
| Consumer Discretionary (9.50%) |
| Genuine Parts Co. | | | 195,311 | | | | 24,949,027 | |
| Hanesbrands, Inc. | | | 1,238,316 | | | | 19,998,803 | |
| Hasbro, Inc. | | | 235,862 | | | | 22,857,386 | |
| Leggett & Platt, Inc. | | | 495,337 | | | | 20,006,662 | |
| Newell Brands, Inc. | | | 928,967 | | | | 19,944,922 | |
| Total Consumer Discretionary | | | | | | | 107,756,800 | |
| | | | | | | | | |
| Consumer Staples (9.13%) |
| Altria Group, Inc. | | | 456,966 | | | | 19,485,030 | |
| Kellogg Co. | | | 369,961 | | | | 22,634,214 | |
| Kraft Heinz Co. | | | 636,430 | | | | 21,390,412 | |
| Philip Morris International, Inc. | | | 223,174 | | | | 19,179,574 | |
| Walgreens Boots Alliance, Inc. | | | 467,537 | | | | 20,945,658 | |
| Total Consumer Staples | | | | | | | 103,634,888 | |
| | | | | | | | | |
| Energy (10.96%) | | | | | | | | |
| Exxon Mobil Corp. | | | 428,340 | | | | 25,631,866 | |
| Kinder Morgan, Inc. | | | 1,447,826 | | | | 22,383,390 | |
| ONEOK, Inc. | | | 440,465 | | | | 26,357,426 | |
| Valero Energy Corp. | | | 365,927 | | | | 24,495,153 | |
| Williams Cos., Inc. | | | 952,321 | | | | 25,512,679 | |
| Total Energy | | | | | | | 124,380,514 | |
| | | | | | | | | |
| Financials (10.31%) | | | | | | | | |
| Comerica, Inc. | | | 318,625 | | | | 26,296,121 | |
| Huntington Bancshares, Inc. | | | 1,506,616 | | | | 22,358,182 | |
| People's United Financial, Inc. | | | 1,451,068 | | | | 24,726,199 | |
| Prudential Financial, Inc. | | | 223,716 | | | | 22,877,198 | |
| Unum Group | | | 896,503 | | | | 20,709,219 | |
| Total Financials | | | | | | | 116,966,919 | |
| | | | | | | | | |
| Health Care (10.45%) | | | | | | | | |
| AbbVie, Inc. | | | 217,111 | | | | 25,028,556 | |
| Cardinal Health, Inc. | | | 437,686 | | | | 20,234,224 | |
| Gilead Sciences, Inc. | | | 325,677 | | | | 22,448,915 | |
| Merck & Co., Inc. | | | 314,745 | | | | 23,577,548 | |
| Pfizer, Inc. | | | 507,152 | | | | 27,249,277 | |
| Total Health Care | | | | | | | 118,538,520 | |
| | | | | | | | | |
| Industrials (9.38%) | | | | | | | | |
| 3M Co. | | | 125,837 | | | | 21,397,324 | |
| Emerson Electric Co. | | | 230,974 | | | | 20,288,756 | |
| General Dynamics Corp. | | | 114,651 | | | | 21,665,599 | |
| Huntington Ingalls Industries, Inc. | | | 117,162 | | | | 20,797,427 | |
| Security Description | | Shares | | | Value | |
| Industrials (continued) |
| Lockheed Martin Corp. | | | 67,062 | | | $ | 22,353,106 | |
| Total Industrials | | | | | | | 106,502,212 | |
| | | | | | | | | |
| Information Technology (10.18%) |
| Hewlett Packard Enterprise Co. | | | 1,615,775 | | | | 23,186,371 | |
| International Business Machines Corp. | | | 176,512 | | | | 20,669,555 | |
| Juniper Networks, Inc. | | | 833,799 | | | | 25,956,163 | |
| Seagate Technology Holdings PLC | | | 276,459 | | | | 28,384,046 | |
| Western Union Co. | | | 1,096,318 | | | | 17,343,751 | |
| Total Information Technology | | | | | | | 115,539,886 | |
| | | | | | | | | |
| Materials (10.05%) | | | | | | | | |
| Amcor PLC | | | 1,887,411 | | | | 21,365,492 | |
| CF Industries Holdings, Inc. | | | 508,223 | | | | 30,793,232 | |
| International Paper Co. | | | 418,558 | | | | 19,052,760 | |
| LyondellBasell Industries NV, Class A | | | 248,978 | | | | 21,693,453 | |
| The Dow Chemical Co. | | | 384,235 | | | | 21,106,029 | |
| Total Materials | | | | | | | 114,010,966 | |
| | | | | | | | | |
| Utilities (10.00%) | | | | | | | | |
| Dominion Resources, Inc. | | | 300,396 | | | | 21,388,195 | |
| Edison International | | | 397,778 | | | | 25,966,948 | |
| FirstEnergy Corp. | | | 613,472 | | | | 23,103,355 | |
| PPL Corp. | | | 780,878 | | | | 21,731,835 | |
| Southern Co. | | | 349,232 | | | | 21,338,075 | |
| Total Utilities | | | | | | | 113,528,408 | |
| | | | | | | | | |
| TOTAL COMMON STOCKS |
| (Cost $1,050,480,090) | | | | | | | 1,128,665,808 | |
| | | 7 Day Yield | | | Shares | | | Value | |
| SHORT TERM INVESTMENTS (0.10%) | | | | |
| Money Market Fund | | | | | | | | | | | | |
| State Street Institutional Treasury Plus Money Market Fund | | | 0.01 | % | | | 1,189,260 | | | | 1,189,260 | |
| TOTAL SHORT TERM INVESTMENTS | | | | |
| (Cost $1,189,260) | | | | | | | | | | | 1,189,260 | |
| | | | | | | | | | | | | |
| TOTAL INVESTMENTS (99.57%) | | | | |
| (Cost $1,051,669,350) | | | | | | | | | | $ | 1,129,855,068 | |
| OTHER ASSETS IN EXCESS OF LIABILITIES (0.43%) | | | 4,888,328 | |
| NET ASSETS - 100.00% | | $ | 1,134,743,396 | |
See Notes to Financial Statements.
ALPS International Sector Dividend Dogs ETF
| Schedule of Investments | November 30, 2021 |
| Security Description | | Shares | | | Value | |
| COMMON STOCKS (99.21%) |
| Australia (12.42%) | | | | | | | | |
| BHP Group, Ltd.(a) | | | 109,199 | | | $ | 3,064,659 | |
| Coles Group, Ltd. | | | 260,597 | | | | 3,347,513 | |
| Fortescue Metals Group, Ltd. | | | 247,347 | | | | 2,999,225 | |
| Telstra Corp., Ltd. | | | 1,164,410 | | | | 3,378,301 | |
| Wesfarmers, Ltd. | | | 78,922 | | | | 3,198,917 | |
| Woodside Petroleum, Ltd. | | | 233,840 | | | | 3,572,227 | |
| Total Australia | | | | | | | 19,560,842 | |
| | | | | | | | | |
| Finland (1.96%) | | | | | | | | |
| Fortum Oyj | | | 107,287 | | | | 3,091,729 | |
| | | | | | | | | |
| France (9.45%) | | | | | | | | |
| Bouygues SA | | | 78,027 | | | | 2,650,277 | |
| Danone SA | | | 47,055 | | | | 2,774,439 | |
| Edenred | | | 59,842 | | | | 2,682,086 | |
| Sanofi | | | 34,170 | | | | 3,249,746 | |
| TotalEnergies SE | | | 76,445 | | | | 3,520,722 | |
| Total France | | | | | | | 14,877,270 | |
| | | | | | | | | |
| Germany (13.71%) | | | | | | | | |
| Allianz SE | | | 14,490 | | | | 3,162,375 | |
| BASF SE | | | 43,333 | | | | 2,844,441 | |
| Bayer AG | | | 61,157 | | | | 3,087,812 | |
| Bayerische Motoren Werke AG | | | 35,370 | | | | 3,408,799 | |
| Continental AG(b) | | | 29,204 | | | | 3,136,476 | |
| Evonik Industries AG | | | 100,566 | | | | 3,034,909 | |
| SAP SE | | | 22,751 | | | | 2,920,248 | |
| Total Germany | | | | | | | 21,595,060 | |
| | | | | | | | | |
| Hong Kong (1.49%) | | | | | | | | |
| CITIC, Ltd. | | | 2,589,000 | | | | 2,337,338 | |
| | | | | | | | | |
| Italy (2.06%) | | | | | | | | |
| Snam SpA | | | 575,410 | | | | 3,245,882 | |
| | | | | | | | | |
| Japan (19.32%) | | | | | | | | |
| Canon, Inc. | | | 133,563 | | | | 2,954,019 | |
| Hitachi, Ltd. | | | 56,200 | | | | 3,325,214 | |
| Japan Tobacco, Inc. | | | 165,900 | | | | 3,336,786 | |
| Kyocera Corp. | | | 49,900 | | | | 2,971,442 | |
| Mitsubishi Corp. | | | 102,200 | | | | 3,065,955 | |
| Sekisui House, Ltd. | | | 152,800 | | | | 2,987,464 | |
| SoftBank Corp. | | | 226,200 | | | | 3,126,797 | |
| Sumitomo Corp. | | | 224,400 | | | | 3,069,159 | |
| Sumitomo Mitsui Financial Group, Inc. | | | 91,000 | | | | 2,981,139 | |
| Takeda Pharmaceutical Co., Ltd. | | | 97,200 | | | | 2,606,389 | |
| Total Japan | | | | | | | 30,424,364 | |
| | | | | | | | | |
| Netherlands (6.42%) | | | | | | | | |
| Koninklijke Ahold Delhaize NV | | | 100,530 | | | | 3,380,415 | |
| NN Group NV | | | 64,174 | | | | 3,197,928 | |
| Security Description | | Shares | | | Value | |
| Netherlands (continued) | | | | | | | | |
| Royal Dutch Shell PLC, Class A | | | 167,555 | | | $ | 3,530,634 | |
| Total Netherlands | | | | | | | 10,108,977 | |
| | | | | | | | | |
| Norway (1.81%) | | | | | | | | |
| Telenor ASA | | | 192,534 | | | | 2,849,304 | |
| | | | | | | | | |
| Spain (8.29%) | | | | | | | | |
| Endesa SA | | | 139,122 | | | | 3,129,519 | |
| Naturgy Energy Group SA | | | 128,998 | | | | 3,554,994 | |
| Repsol SA | | | 296,622 | | | | 3,293,670 | |
| Telefonica SA | | | 680,375 | | | | 3,083,740 | |
| Total Spain | | | | | | | 13,061,923 | |
| | | | | | | | | |
| Sweden (1.91%) | | | | | | | | |
| Telia Co. AB | | | 775,684 | | | | 3,003,619 | |
| | | | | | | | | |
| Switzerland (8.33%) | | | | | | | | |
| Novartis AG | | | 38,610 | | | | 3,088,632 | |
| Swatch Group AG | | | 11,328 | | | | 3,348,858 | |
| Swiss Re AG | | | 37,388 | | | | 3,520,308 | |
| Zurich Insurance Group AG | | | 7,668 | | | | 3,166,427 | |
| Total Switzerland | | | | | | | 13,124,225 | |
| | | | | | | | | |
| United Kingdom (12.04%) |
| BAE Systems PLC | | | 431,882 | | | | 3,148,751 | |
| BP PLC | | | 809,939 | | | | 3,505,667 | |
| British American Tobacco PLC | | | 90,126 | | | | 3,032,528 | |
| GlaxoSmithKline PLC | | | 168,674 | | | | 3,420,992 | |
| Rio Tinto PLC | | | 45,425 | | | | 2,786,239 | |
| SSE PLC | | | 148,487 | | | | 3,064,886 | |
| Total United Kingdom | | | | | | | 18,959,063 | |
| | | | | | | | | |
| TOTAL COMMON STOCKS |
| (Cost $161,665,816) | | | | | | | 156,239,596 | |
| | | 7 Day Yield | | | Shares | | | Value | |
| SHORT TERM INVESTMENTS (0.15%) | | | | | | | | | | | | |
| Money Market Fund | | | | | | | | | | | | |
| State Street Institutional Treasury Plus Money Market Fund | | | 0.01 | % | | | 229,548 | | | | 229,548 | |
| TOTAL SHORT TERM INVESTMENTS | | | | | | | | | | | | |
| (Cost $229,548) | | | | | | | | | | | 229,548 | |
| | | | | | | | | | | | | |
| TOTAL INVESTMENTS (99.35%) | | | | | | | | | | | | |
| (Cost $161,895,364) | | | | | | | | | | $ | 156,469,144 | |
| OTHER ASSETS IN EXCESS OF LIABILITIES (0.65%) | | | | | | | | | | | 1,019,477 | |
| NET ASSETS - 100.00% | | | | | | | | | | $ | 157,488,621 | |
| (a) | Security, or a portion of the security position is currently on loan. The total market value of securities on loan is $2,295,585. |
| (b) | Non-income producing security. |
See Notes to Financial Statements.
ALPS Emerging Sector Dividend Dogs ETF
| Schedule of Investments | November 30, 2021 |
| Security Description | | Shares | | | Value | |
| COMMON STOCKS (99.72%) |
| Brazil (10.13%) | | | | | | | | |
| Banco Santander Brasil SA, ADR | | | 80,268 | | | $ | 467,160 | |
| BB Seguridade Participacoes SA | | | 149,000 | | | | 553,398 | |
| Centrais Eletricas Brasileiras SA | | | 78,023 | | | | 452,856 | |
| Telefonica Brasil SA | | | 67,213 | | | | 601,251 | |
| Vibra Energia SA | | | 111,600 | | | | 431,960 | |
| Total Brazil | | | | | | | 2,506,625 | |
| | | | | | | | | |
| Chile (5.99%) | | | | | | | | |
| Enel Americas SA, ADR(a) | | | 85,830 | | | | 532,146 | |
| Enel Chile SA, ADR(a) | | | 225,628 | | | | 496,381 | |
| Falabella SA | | | 146,976 | | | | 454,762 | |
| Total Chile | | | | | | | 1,483,289 | |
| | | | | | | | | |
| China (8.96%) | | | | | | | | |
| China Minsheng Banking Corp., Ltd. | | | 1,248,000 | | | | 480,123 | |
| China Railway Signal & Communication Corp., Ltd.(a)(b)(c) | | | 1,389,000 | | | | 488,056 | |
| Huadian Power International Corp., Ltd., Class H(a) | | | 1,408,000 | | | | 438,759 | |
| Legend Holdings Corp.(b)(c) | | | 246,400 | | | | 388,653 | |
| Yanzhou Coal Mining Co., Ltd., Class H | | | 269,000 | | | | 422,231 | |
| Total China | | | | | | | 2,217,822 | |
| | | | | | | | | |
| Czech Republic (2.24%) | | | | | | | | |
| CEZ AS | | | 16,934 | | | | 553,357 | |
| | | | | | | | | |
| Hungary (2.00%) | | | | | | | | |
| Richter Gedeon Nyrt | | | 18,609 | | | | 495,254 | |
| | | | | | | | | |
| India (6.17%) | | | | | | | | |
| Dr Reddy's Laboratories, Ltd., ADR | | | 8,167 | | | | 509,948 | |
| Infosys, Ltd., Sponsored ADR | | | 23,456 | | | | 529,636 | |
| Wipro, Ltd., ADR | | | 56,956 | | | | 486,404 | |
| Total India | | | | | | | 1,525,988 | |
| | | | | | | | | |
| Indonesia (7.26%) | | | | | | | | |
| Adaro Energy Tbk PT | | | 5,674,200 | | | | 673,495 | |
| Indofood Sukses Makmur Tbk PT | | | 1,230,500 | | | | 541,257 | |
| Kalbe Farma Tbk PT | | | 5,211,000 | | | | 582,133 | |
| Total Indonesia | | | | | | | 1,796,885 | |
| | | | | | | | | |
| Malaysia (9.74%) | | | | | | | | |
| Genting Bhd | | | 437,450 | | | | 457,029 | |
| Genting Malaysia Bhd | | | 722,000 | | | | 474,876 | |
| MISC Bhd | | | 322,400 | | | | 509,073 | |
| Sime Darby Bhd | | | 991,600 | | | | 515,637 | |
| Security Description | | Shares | | | Value | |
| Malaysia (continued) | | | | | | | | |
| Top Glove Corp. Bhd | | | 650,500 | | | $ | 452,562 | |
| Total Malaysia | | | | | | | 2,409,177 | |
| | | | | | | | | |
| Mexico (9.78%) | | | | | | | | |
| Coca-Cola Femsa SAB de CV, ADR | | | 9,513 | | | | 467,278 | |
| Grupo Mexico SAB de CV, Series B | | | 122,305 | | | | 511,750 | |
| Kimberly-Clark de Mexico SAB de CV, Class A | | | 315,600 | | | | 495,570 | |
| Orbia Advance Corp. SAB de CV | | | 191,255 | | | | 445,437 | |
| Promotora y Operadora de Infraestructura SAB de CV | | | 72,513 | | | | 498,638 | |
| Total Mexico | | | | | | | 2,418,673 | |
| | | | | | | | | |
| Peru (2.45%) | | | | | | | | |
| Credicorp, Ltd. | | | 5,145 | | | | 607,110 | |
| | | | | | | | | |
| Philippines (7.29%) | | | | | | | | |
| Aboitiz Equity Ventures, Inc. | | | 585,400 | | | | 570,470 | |
| Globe Telecom, Inc. | | | 9,405 | | | | 612,627 | |
| PLDT, Inc. | | | 18,620 | | | | 620,851 | |
| Total Philippines | | | | | | | 1,803,948 | |
| | | | | | | | | |
| Poland (1.81%) | | | | | | | | |
| Polskie Gornictwo Naftowe i Gazownictwo SA | | | 332,016 | | | | 447,517 | |
| | | | | | | | | |
| Russia (10.48%) | | | | | | | | |
| Gazprom PJSC, ADR | | | 60,620 | | | | 540,731 | |
| Magnit PJSC, GDR(c) | | | 37,074 | | | | 572,793 | |
| MMC Norilsk Nickel PJSC, ADR | | | 16,099 | | | | 462,524 | |
| Sberbank of Russia PJSC, ADR | | | 30,292 | | | | 512,238 | |
| Severstal PAO, GDR(c) | | | 24,083 | | | | 505,743 | |
| Total Russia | | | | | | | 2,594,029 | |
| | | | | | | | | |
| South Africa (3.97%) | | | | | | | | |
| Exxaro Resources, Ltd. | | | 41,957 | | | | 400,471 | |
| MultiChoice Group | | | 75,176 | | | | 581,415 | |
| Total South Africa | | | | | | | 981,886 | |
| | | | | | | | | |
| Thailand (9.51%) | | | | | | | | |
| BTS Group Holdings PCL | | | 1,919,000 | | | | 523,920 | |
| Bumrungrad Hospital Pcl | | | 135,800 | | | | 580,316 | |
| Delta Electronics Thailand PCL | | | 23,200 | | | | 307,061 | |
| Intouch Holdings PCL | | | 214,000 | | | | 462,008 | |
| Osotspa PCL(c) | | | 504,400 | | | | 478,991 | |
| Total Thailand | | | | | | | 2,352,296 | |
| | | | | | | | | |
| Turkey (1.94%) | | | | | | | | |
| Ford Otomotiv Sanayi AS | | | 26,654 | | | | 479,015 | |
| | | | | | | | | |
| TOTAL COMMON STOCKS |
| (Cost $24,184,219) | | | | | | | 24,672,871 | |
ALPS Emerging Sector Dividend Dogs ETF
| Schedule of Investments | November 30, 2021 |
| Security Description | | Shares | | | Value | |
| RIGHTS(0.00%) | | | | | | | | |
| Thailand (0.00%) | | | | | | | | |
| BTS Group Holdings PCL (Expiring | | | | | | $ | – | |
| 11/20/2026), Strike Price THB 14.90 | | | 333,640 | | | | | |
| | | | | | | | | |
| TOTAL RIGHTS | | | | | | | | |
| (Cost $–) | | | | | | | – | |
| | | 7 Day Yield | | | Shares | | | Value | |
| SHORT TERM INVESTMENTS (3.47%) | | | | | | | | | | | | |
| Money Market Fund (0.12%) | | | | | | | | | | | | |
| State Street Institutional Treasury Plus Money Market Fund | | | | | | | | | | | | |
| (Cost $28,835) | | | 0.01 | % | | | 28,835 | | | | 28,835 | |
| | | | | | | | | | | | | |
| Investments Purchased with Collateral from Securities Loaned (3.35%) | | | | | | | | | | | | |
| State Street Navigator Securities Lending Government Money Market Portfolio, 0.03% | | | | | | | | | | | | |
| (Cost $829,814) | | | | | | | 829,814 | | | | 829,814 | |
| TOTAL SHORT TERM INVESTMENTS | | | | | | | | | | | | |
| (Cost $858,649) | | | | | | | | | | | 858,649 | |
| | | | | | | | | | | | | |
| TOTAL INVESTMENTS (103.19%) | | | | | | | | | | | | |
| (Cost $25,042,868) | | | | | | | | | | $ | 25,531,520 | |
| LIABILITIES IN EXCESS OF OTHER ASSETS (-3.19%) | | | | | | | | | | | (790,014 | ) |
| NET ASSETS - 100.00% | | | | | | | | | | $ | 24,741,506 | |
| (a) | Security, or a portion of the security position is currently on loan. The total market value of securities on loan is $1,425,220. |
| (b) | Securities exempt from registration under Rule 144A of the Securities Act of 1933. These securities may be sold in the ordinary course of business in transactions exempt from registration, normally to qualified institutional buyers. At period end, the aggregate market value of those securities was $876,709, representing 3.54% of net assets. |
| (c) | Securities were purchased pursuant to Regulation S under the Securities Act of 1933, which exempts securities offered and sold outside of the United States from registration. Such securities cannot be sold in the United States without either an effective registration statement filed pursuant to the Securities Act of 1933, or pursuant to an exemption from registration. As of November 30, 2021, the market value of those securities was $2,434,236 representing 9.84% of net assets. |
Currency Abbreviations:
THB - Thai Bhat
See Notes to Financial Statements.
ALPS REIT Dividend Dogs ETF
| Schedule of Investments | November 30, 2021 |
| Security Description | | Shares | | | Value | |
| COMMON STOCKS (99.79%) |
| Diversified REITs (11.88%) |
| Essential Properties Realty Trust, Inc. | | | 22,260 | | | $ | 601,688 | |
| One Liberty Properties, Inc. | | | 22,672 | | | | 737,520 | |
| STORE Capital Corp. | | | 20,319 | | | | 669,308 | |
| Washington Real Estate Investment Trust | | | 27,729 | | | | 698,771 | |
| WP Carey, Inc. | | | 9,186 | | | | 701,351 | |
| Total Diversified REITs | | | | | | | 3,408,638 | |
| | | | | | | | | |
| Health Care REITs (11.13%) |
| LTC Properties, Inc. | | | 20,461 | | | | 649,842 | |
| Medical Properties Trust, Inc. | | | 32,892 | | | | 700,271 | |
| National Health Investors, Inc. | | | 11,855 | | | | 619,305 | |
| Physicians Realty Trust | | | 37,934 | | | | 676,363 | |
| Sabra Health Care REIT, Inc. | | | 42,342 | | | | 547,482 | |
| Total Health Care REITs | | | | | | | 3,193,263 | |
| | | | | | | | | |
| Hotel & Resort REITs (1.94%) |
| Service Properties Trust | | | 65,354 | | | | 556,163 | |
| | | | | | | | | |
| Industrial REITs (13.09%) |
| Industrial Logistics Properties Trust | | | 26,453 | | | | 586,198 | |
| Lexington Realty Trust | | | 50,823 | | | | 764,886 | |
| Monmouth Real Estate Investment Corp. | | | 37,601 | | | | 780,973 | |
| Plymouth Industrial REIT, Inc. | | | 30,190 | | | | 898,153 | |
| STAG Industrial, Inc. | | | 16,637 | | | | 725,040 | |
| Total Industrial REITs | | | | | | | 3,755,250 | |
| | | | | | | | | |
| Office REITs (12.58%) | | | | | | | | |
| Brandywine Realty Trust | | | 52,282 | | | | 671,823 | |
| City Office REIT, Inc. | | | 40,817 | | | | 680,827 | |
| Franklin Street Properties Corp. | | | 155,326 | | | | 894,678 | |
| Office Properties Income Trust | | | 27,264 | | | | 646,975 | |
| SL Green Realty Corp. | | | 10,304 | | | | 715,407 | |
| Total Office REITs | | | | | | | 3,609,710 | |
| | | | | | | | | |
| Residential REITs (12.34%) |
| American Campus Communities, Inc. | | | 13,881 | | | | 718,203 | |
| BRT Apartments Corp. | | | 35,309 | | | | 664,515 | |
| Centerspace | | | 6,840 | | | | 698,979 | |
| Clipper Realty, Inc. | | | 83,759 | | | | 732,054 | |
| Equity Residential | | | 8,502 | | | | 725,306 | |
| Total Residential REITs | | | | | | | 3,539,057 | |
| | | | | | | | | |
| Retail REITs (12.25%) | | | | | | | | |
| American Finance Trust, Inc. | | | 83,461 | | | | 662,680 | |
| National Retail Properties, Inc. | | | 15,303 | | | | 674,862 | |
| Saul Centers, Inc. | | | 15,856 | | | | 780,591 | |
| Spirit Realty Capital, Inc. | | | 14,005 | | | | 624,063 | |
| Security Description | | Shares | | | Value | |
| Retail REITs (continued) | | | | | | | | |
| The Macerich Co. | | | 41,009 | | | $ | 773,430 | |
| Total Retail REITs | | | | | | | 3,515,626 | |
| | | | | | | | | |
| Specialized REITs (16.86%) |
| American Tower Corp. | | | 2,347 | | | | 616,041 | |
| CoreSite Realty Corp. | | | 4,678 | | | | 800,172 | |
| CubeSmart | | | 12,972 | | | | 699,450 | |
| Four Corners Property Trust, Inc. | | | 25,974 | | | | 701,817 | |
| Gaming and Leisure Properties, Inc. | | | 14,421 | | | | 650,676 | |
| National Storage Affiliates Trust | | | 11,979 | | | | 735,271 | |
| VICI Properties, Inc. | | | 23,297 | | | | 633,678 | |
| Total Specialized REITs | | | | | | | 4,837,105 | |
| | | | | | | | | |
| Technology REITs (7.72%) |
| Crown Castle International Corp. | | | 3,672 | | | | 667,019 | |
| CyrusOne, Inc. | | | 8,993 | | | | 800,557 | |
| Digital Realty Trust, Inc. | | | 4,458 | | | | 747,785 | |
| Total Technology REITs | | | | | | | 2,215,361 | |
| | | | | | | | | |
| TOTAL COMMON STOCKS |
| (Cost $25,057,691) | | | | | | | 28,630,173 | |
| | | 7 Day Yield | | | Shares | | | Value | |
| SHORT TERM INVESTMENTS (0.16%) | | | | | | | | | | | | |
| Money Market Fund | | | | | | | | | | | | |
| State Street Institutional Treasury Plus Money Market Fund | | | 0.01 | % | | | 46,175 | | | | 46,175 | |
| TOTAL SHORT TERM INVESTMENTS | | | | | | | | | | | | |
| (Cost $46,175) | | | | | | | | | | | 46,175 | |
| | | | | | | | | | | | | |
| TOTAL INVESTMENTS (99.95%) | | | | | | | | | | | | |
| (Cost $25,103,866) | | | | | | | | | | $ | 28,676,348 | |
| OTHER ASSETS IN EXCESS OF LIABILITIES (0.05%) | | | | | | | | | | | 13,074 | |
| NET ASSETS - 100.00% | | | | | | | | | | $ | 28,689,422 | |
See Notes to Financial Statements.
ALPS ETF Trust
| Statements of Assets and Liabilities | November 30, 2021 |
| | | ALPS Sector Dividend Dogs ETF | | | ALPS International Sector Dividend Dogs ETF | | | ALPS Emerging Sector Dividend Dogs ETF | | | ALPS REIT Dividend Dogs ETF | |
| ASSETS: | | | | | | | | | | | | | | | | |
| Investments, at value | | $ | 1,129,855,068 | | | $ | 156,469,144 | | | $ | 25,531,520 | | | $ | 28,676,348 | |
| Foreign currency, at value (Cost $–, $67,769, $6,639 and $–) | | | – | | | | 67,769 | | | | 6,519 | | | | – | |
| Foreign tax reclaims | | | – | | | | 420,608 | | | | 3,527 | | | | 3,368 | |
| Dividends receivable | | | 5,279,761 | | | | 604,030 | | | | 42,451 | | | | 18,579 | |
| Receivable for investments sold | | | – | | | | 62,422 | | | | – | | | | – | |
| Total Assets | | | 1,135,134,829 | | | | 157,623,973 | | | | 25,584,017 | | | | 28,698,295 | |
| | | | | | | | | | | | | | | | | |
| LIABILITIES: | | | | | | | | | | | | | | | | |
| Payable for investments purchased | | | – | | | | 62,636 | | | | – | | | | – | |
| Payable to adviser | | | 391,433 | | | | 72,716 | | | | 12,697 | | | | 8,873 | |
| Payable for collateral upon return of securities loaned | | | – | | | | – | | | | 829,814 | | | | – | |
| Total Liabilities | | | 391,433 | | | | 135,352 | | | | 842,511 | | | | 8,873 | |
| NET ASSETS | | $ | 1,134,743,396 | | | $ | 157,488,621 | | | $ | 24,741,506 | | | $ | 28,689,422 | |
| | | | | | | | | | | | | | | | | |
| NET ASSETS CONSIST OF: | | | | | | | | | | | | | | | | |
| Paid-in capital | | $ | 1,334,982,881 | | | $ | 216,300,017 | | | $ | 32,905,986 | | | $ | 34,566,895 | |
| Total Distributable earnings | | | (200,239,485 | ) | | | (58,811,396 | ) | | | (8,164,480 | ) | | | (5,877,473 | ) |
| NET ASSETS | | $ | 1,134,743,396 | | | $ | 157,488,621 | | | $ | 24,741,506 | | | $ | 28,689,422 | |
| | | | | | | | | | | | | | | | | |
| INVESTMENTS, AT COST | | $ | 1,051,669,350 | | | $ | 161,895,364 | | | $ | 25,042,868 | | | $ | 25,103,866 | |
| | | | | | | | | | | | | | | | | |
| PRICING OF SHARES: | | | | | | | | | | | | | | | | |
| Net Assets | | $ | 1,134,743,396 | | | $ | 157,488,621 | | | $ | 24,741,506 | | | $ | 28,689,422 | |
| Shares of beneficial interest outstanding (Unlimited number of shares authorized, par value $0.01 per share) | | | 22,484,141 | | | | 5,950,000 | | | | 1,050,000 | | | | 575,000 | |
| Net Asset Value, offering and redemption price per share | | $ | 50.47 | | | $ | 26.47 | | | $ | 23.56 | | | $ | 49.89 | |
See Notes to Financial Statements.
ALPS ETF Trust
| Statements of Operations | For the Year Ended November 30, 2021 |
| | | ALPS Sector Dividend Dogs ETF | | | ALPS International Sector Dividend Dogs ETF | | | ALPS Emerging Sector Dividend Dogs ETF | | | ALPS REIT Dividend Dogs ETF | |
| INVESTMENT INCOME: | | | | | | | | | | | | | | | | |
| Dividends* | | $ | 44,296,752 | | | $ | 7,826,498 | | | $ | 1,187,243 | | | $ | 521,652 | |
| Non-cash dividends(a) | | | – | | | | – | | | | – | | | | 351,488 | |
| Securities Lending Income | | | – | | | | 2,566 | | | | 21,646 | | | | 1,113 | |
| Total Investment Income | | | 44,296,752 | | | | 7,829,064 | | | | 1,208,889 | | | | 874,253 | |
| | | | | | | | | | | | | | | | | |
| EXPENSES: | | | | | | | | | | | | | | | | |
| Investment adviser fees | | | 4,627,840 | | | | 885,043 | | | | 147,282 | | | | 103,593 | |
| Total Expenses | | | 4,627,840 | | | | 885,043 | | | | 147,282 | | | | 103,593 | |
| NET INVESTMENT INCOME | | | 39,668,912 | | | | 6,944,021 | | | | 1,061,607 | | | | 770,660 | |
| | | | | | | | | | | | | | | | | |
| REALIZED AND UNREALIZED GAIN/(LOSS) | | | | | | | | | | | | | | | | |
| Net realized gain/(loss) on investments(b) | | | 20,856,818 | | | | (2,959,622 | ) | | | 1,008,273 | | | | (1,540,165 | ) |
| Net realized gain/(loss) on foreign currency transactions | | | – | | | | (41,486 | ) | | | (9,736 | ) | | | 168 | |
| Total net realized gain/(loss) | | | 20,856,818 | | | | (3,001,108 | ) | | | 998,537 | | | | (1,539,997 | ) |
| Net change in unrealized appreciation on investments | | | 133,811,971 | | | | 12,490,979 | | | | 1,420,837 | | | | 8,191,442 | |
| Net change in unrealized depreciation on translation of assets and liabilities denominated in foreign currencies | | | – | | | | (31,038 | ) | | | (931 | ) | | | (339 | ) |
| Total net change in unrealized appreciation | | | 133,811,971 | | | | 12,459,941 | | | | 1,419,906 | | | | 8,191,103 | |
| NET REALIZED AND UNREALIZED GAIN ON INVESTMENTS | | | 154,668,789 | | | | 9,458,833 | | | | 2,418,443 | | | | 6,651,106 | |
| NET INCREASE IN NET ASSETS RESULTING FROM OPERATIONS | | $ | 194,337,701 | | | $ | 16,402,854 | | | $ | 3,480,050 | | | $ | 7,421,766 | |
| *Net of foreign tax withholding: | | $ | – | | | $ | 919,046 | | | $ | 138,805 | | | $ | 2,043 | |
| (a) | Represents non-cash distributions in connection with capital changes for certain investments held by the Fund recorded on ex-date and based on fair value. |
| (b) | Includes realized gain or loss as a result of in-kind transactions (See Note 4 in Notes to Financial Statements). |
See Notes to Financial Statements.
ALPS Sector Dividend Dogs ETF
Statements of Changes in Net Assets
| | | For the Year Ended November 30, 2021 | | | For the Year Ended November 30, 2020 | |
| OPERATIONS: | | | | | | | | |
| Net investment income | | $ | 39,668,912 | | | $ | 50,587,999 | |
| Net realized gain/(loss) | | | 20,856,818 | | | | (88,409,933 | ) |
| Net change in unrealized appreciation/(depreciation) | | | 133,811,971 | | | | (103,423,993 | ) |
| Net increase/(decrease) in net assets resulting from operations | | | 194,337,701 | | | | (141,245,927 | ) |
| | | | | | | | | |
| Net Equalization Credits/(Debits) | | | (376,556 | ) | | | 3,589,268 | |
| | | | | | | | | |
| DISTRIBUTIONS TO SHAREHOLDERS: | | | | | | | | |
| From distributable earnings | | | (41,129,463 | ) | | | (51,189,402 | ) |
| Total distributions | | | (41,129,463 | ) | | | (51,189,402 | ) |
| | | | | | | | | |
| CAPITAL SHARE TRANSACTIONS: | | | | | | | | |
| Proceeds from sale of shares | | | 42,671,156 | | | | 152,957,639 | |
| Cost of shares redeemed | | | (68,650,049 | ) | | | (699,792,739 | ) |
| Net income equalization (Note 2) | | | 376,556 | | | | (3,589,268 | ) |
| Net decrease from share transactions | | | (25,602,337 | ) | | | (550,424,368 | ) |
| Net increase/(decrease) in net assets | | | 127,229,345 | | | �� | (739,270,429 | ) |
| | | | | | | | | |
| NET ASSETS: | | | | | | | | |
| Beginning of period | | | 1,007,514,051 | | | | 1,746,784,480 | |
| End of period | | $ | 1,134,743,396 | | | $ | 1,007,514,051 | |
| | | | | | | | | |
| OTHER INFORMATION: | | | | | | | | |
| CAPITAL SHARE TRANSACTIONS: | | | | | | | | |
| Beginning shares | | | 23,059,141 | | | | 38,159,141 | |
| Shares sold | | | 800,000 | | | | 3,350,000 | |
| Shares redeemed | | | (1,375,000 | ) | | | (18,450,000 | ) |
| Shares outstanding, end of period | | | 22,484,141 | | | | 23,059,141 | |
See Notes to Financial Statements.
ALPS International Sector Dividend Dogs ETF
Statements of Changes in Net Assets
| | | For the Year Ended November 30, 2021 | | | For the Year Ended November 30, 2020 | |
| OPERATIONS: | | | | | | | | |
| Net investment income | | $ | 6,944,021 | | | $ | 5,343,294 | |
| Net realized loss | | | (3,001,108 | ) | | | (5,677,330 | ) |
| Net change in unrealized appreciation/(depreciation) | | | 12,459,941 | | | | (16,870,424 | ) |
| Net increase/(decrease) in net assets resulting from operations | | | 16,402,854 | | | | (17,204,460 | ) |
| | | | | | | | | |
| Net Equalization Credits/(Debits) | | | (1,568,545 | ) | | | 21,476 | |
| | | | | | | | | |
| DISTRIBUTIONS TO SHAREHOLDERS: | | | | | | | | |
| From distributable earnings | | | (7,018,603 | ) | | | (8,323,715 | ) |
| From tax return of capital | | | (36,242 | ) | | | (309,701 | ) |
| Total distributions | | | (7,054,845 | ) | | | (8,633,416 | ) |
| | | | | | | | | |
| CAPITAL SHARE TRANSACTIONS: | | | | | | | | |
| Proceeds from sale of shares | | | 22,093,394 | | | | 15,489,973 | |
| Cost of shares redeemed | | | (20,383,668 | ) | | | (64,962,269 | ) |
| Net income equalization (Note 2) | | | 1,568,545 | | | | (21,476 | ) |
| Net increase/(decrease) from share transactions | | | 3,278,271 | | | | (49,493,772 | ) |
| Net increase/(decrease) in net assets | | | 11,057,735 | | | | (75,310,172 | ) |
| | | | | | | | | |
| NET ASSETS: | | | | | | | | |
| Beginning of period | | | 146,430,886 | | | | 221,741,058 | |
| End of period | | $ | 157,488,621 | | | $ | 146,430,886 | |
| | | | | | | | | |
| OTHER INFORMATION: | | | | | | | | |
| CAPITAL SHARE TRANSACTIONS: | | | | | | | | |
| Beginning shares | | | 5,900,000 | | | | 8,250,000 | |
| Shares sold | | | 800,000 | | | | 650,000 | |
| Shares redeemed | | | (750,000 | ) | | | (3,000,000 | ) |
| Shares outstanding, end of period | | | 5,950,000 | | | | 5,900,000 | |
See Notes to Financial Statements.
ALPS Emerging Sector Dividend Dogs ETF
Statements of Changes in Net Assets
| | | For the Year Ended November 30, 2021 | | | For the Year Ended November 30, 2020 | |
| OPERATIONS: | | | | | | | | |
| Net investment income | | $ | 1,061,607 | | | $ | 673,942 | |
| Net realized gain/(loss) | | | 998,537 | | | | (2,081,382 | ) |
| Net change in unrealized appreciation | | | 1,419,906 | | | | 552,602 | |
| Net increase/(decrease) in net assets resulting from operations | | | 3,480,050 | | | | (854,838 | ) |
| | | | | | | | | |
| Net Equalization Credits | | | 19,079 | | | | 26,895 | |
| | | | | | | | | |
| DISTRIBUTIONS TO SHAREHOLDERS: | | | | | | | | |
| From distributable earnings | | | (971,386 | ) | | | (831,362 | ) |
| Total distributions | | | (971,386 | ) | | | (831,362 | ) |
| | | | | | | | | |
| CAPITAL SHARE TRANSACTIONS: | | | | | | | | |
| Proceeds from sale of shares | | | 1,275,304 | | | | 3,165,851 | |
| Cost of shares redeemed | | | – | | | | (9,462,865 | ) |
| Net income equalization (Note 2) | | | (19,079 | ) | | | (26,895 | ) |
| Net increase/(decrease) from share transactions | | | 1,256,225 | | | | (6,323,909 | ) |
| Net increase/(decrease) in net assets | | | 3,783,968 | | | | (7,983,214 | ) |
| | | | | | | | | |
| NET ASSETS: | | | | | | | | |
| Beginning of period | | | 20,957,538 | | | | 28,940,752 | |
| End of period | | $ | 24,741,506 | | | $ | 20,957,538 | |
| | | | | | | | | |
| OTHER INFORMATION: | | | | | | | | |
| CAPITAL SHARE TRANSACTIONS: | | | | | | | | |
| Beginning shares | | | 1,000,000 | | | | 1,400,000 | |
| Shares sold | | | 50,000 | | | | 150,000 | |
| Shares redeemed | | | – | | | | (550,000 | ) |
| Shares outstanding, end of period | | | 1,050,000 | | | | 1,000,000 | |
See Notes to Financial Statements.
ALPS REIT Dividend Dogs ETF
Statements of Changes in Net Assets
| | | For the Year Ended November 30, 2021 | | | For the Year Ended November 30, 2020(a) | |
| OPERATIONS: | | | | | | | | |
| Net investment income | | $ | 770,660 | | | $ | 1,103,770 | |
| Net realized gain/(loss) | | | (1,539,997 | ) | | | 5,165,077 | |
| Net change in unrealized appreciation/(depreciation) | | | 8,191,103 | | | | (14,485,522 | ) |
| Net increase/(decrease) in net assets resulting from operations | | | 7,421,766 | | | | (8,216,675 | ) |
| | | | | | | | | |
| DISTRIBUTIONS TO SHAREHOLDERS: | | | | | | | | |
| From distributable earnings | | | (874,838 | ) | | | (1,494,087 | ) |
| From tax return of capital | | | (444,426 | ) | | | (336,997 | ) |
| Total distributions | | | (1,319,264 | ) | | | (1,831,084 | ) |
| | | | | | | | | |
| CAPITAL SHARE TRANSACTIONS: | | | | | | | | |
| Proceeds from sale of shares | | | – | | | | 19,287,844 | |
| Cost of shares redeemed | | | (3,733,564 | ) | | | (36,184,766 | ) |
| Net decrease from share transactions | | | (3,733,564 | ) | | | (16,896,922 | ) |
| Net increase/(decrease) in net assets | | | 2,368,938 | | | | (26,944,681 | ) |
| | | | | | | | | |
| NET ASSETS: | | | | | | | | |
| Beginning of period | | | 26,320,484 | | | | 53,265,165 | |
| End of period | | $ | 28,689,422 | | | $ | 26,320,484 | |
| | | | | | | | | |
| OTHER INFORMATION: | | | | | | | | |
| CAPITAL SHARE TRANSACTIONS: | | | | | | | | |
| Beginning shares | | | 650,000 | | | | 1,100,000 | |
| Shares sold | | | – | | | | 400,000 | |
| Shares redeemed | | | (75,000 | ) | | | (850,000 | ) |
| Shares outstanding, end of period | | | 575,000 | | | | 650,000 | |
| (a) | Prior to January 2, 2020, the ALPS REIT Dividend Dogs ETF was known as the Cohen & Steers Global Realty Majors ETF. |
See Notes to Financial Statements.
ALPS Sector Dividend Dogs ETF
| Financial Highlights | For a Share Outstanding Throughout the Periods Presented |
| | | For the Year Ended November 30, 2021 | | | For the Year Ended November 30, 2020 | | | For the Year Ended November 30, 2019 | | | For the Year Ended November 30, 2018 | | | For the Year Ended November 30, 2017 | |
| NET ASSET VALUE, BEGINNING OF PERIOD | | $ | 43.69 | | | $ | 45.78 | | | $ | 44.26 | | | $ | 45.61 | | | $ | 42.29 | |
| | | | | | | | | | | | | | | | | | | | | |
| INCOME/(LOSS) FROM INVESTMENT OPERATIONS: | | | | | | | | | | | | | | | | | | | | |
| Net investment income (a) | | | 1.75 | | | | 1.70 | | | | 1.71 | | | | 1.54 | | | | 1.40 | |
| Net realized and unrealized gain/(loss) | | | 6.84 | | | | (2.14 | ) | | | 1.34 | | | | (1.31 | ) | | | 3.39 | |
| Total from investment operations | | | 8.59 | | | | (0.44 | ) | | | 3.05 | | | | 0.23 | | | | 4.79 | |
| | | | | | | | | | | | | | | | | | | | | |
| DISTRIBUTIONS: | | | | | | | | | | | | | | | | | | | | |
| From net investment income | | | (1.81 | ) | | | (1.65 | ) | | | (1.53 | ) | | | (1.58 | ) | | | (1.42 | ) |
| Tax return of capital | | | – | | | | – | | | | – | | | | – | | | | (0.05 | ) |
| Total distributions | | | (1.81 | ) | | | (1.65 | ) | | | (1.53 | ) | | | (1.58 | ) | | | (1.47 | ) |
| | | | | | | | | | | | | | | | | | | | | |
| Net increase/(decrease) in net asset value | | | 6.78 | | | | (2.09 | ) | | | 1.52 | | | | (1.35 | ) | | | 3.32 | |
| NET ASSET VALUE, END OF PERIOD | | $ | 50.47 | | | $ | 43.69 | | | $ | 45.78 | | | $ | 44.26 | | | $ | 45.61 | |
| TOTAL RETURN(b) | | | 19.77 | % | | | (0.27 | )% | | | 7.26 | % | | | 0.51 | % | | | 11.59 | % |
| | | | | | | | | | | | | | | | | | | | | |
| RATIOS/SUPPLEMENTAL DATA: | | | | | | | | | | | | | | | | | | | | |
| Net assets, end of period (000s) | | $ | 1,134,743 | | | $ | 1,007,514 | | | $ | 1,746,784 | | | $ | 2,166,709 | | | $ | 2,322,205 | |
| | | | | | | | | | | | | | | | | | | | | |
| Ratio of expenses to average net assets | | | 0.40 | % | | | 0.40 | % | | | 0.40 | % | | | 0.40 | % | | | 0.40 | % |
| Ratio of net investment income to average net assets | | | 3.43 | % | | | 4.27 | % | | | 3.97 | % | | | 3.40 | % | | | 3.24 | % |
| Portfolio turnover rate(c) | | | 54 | % | | | 77 | % | | | 55 | % | | | 61 | % | | | 48 | % |
| Undistributed net investment income included in price of units issued and redeemed(a)(d) | | $ | (0.02 | ) | | $ | 0.12 | | | $ | 0.06 | | | $ | 0.04 | | | $ | 0.03 | |
| (a) | Based on average shares outstanding during the period. |
| (b) | Total return is calculated assuming an initial investment made at the net asset value at the beginning of the period and redemption at the net asset value on the last day of the period and assuming all distributions are reinvested at reinvestment prices. Total return calculated for a period of less than one year is not annualized. |
| (c) | Portfolio turnover for periods less than one year is not annualized and does not include securities received or delivered from processing creations or redemptions in-kind. |
| (d) | The per share amount of equalization is presented to show the impact of equalization on distributable earnings per share. |
See Notes to Financial Statements.
ALPS International Sector Dividend Dogs ETF
| Financial Highlights | For a Share Outstanding Throughout the Periods Presented |
| | | For the Year Ended November 30, 2021 | | | For the Year Ended November 30, 2020 | | | For the Year Ended November 30, 2019 | | | For the Year Ended November 30, 2018 | | | For the Year Ended November 30, 2017 | |
| NET ASSET VALUE, BEGINNING OF PERIOD | | $ | 24.82 | | | $ | 26.88 | | | $ | 25.14 | | | $ | 28.27 | | | $ | 22.84 | |
| | | | | | | | | | | | | | | | | | | | | |
| INCOME/(LOSS) FROM INVESTMENT OPERATIONS: | | | | | | | | | | | | | | | | | | | | |
| Net investment income(a) | | | 1.09 | | | | 0.75 | | | | 1.20 | | | | 1.15 | | | | 0.94 | |
| Net realized and unrealized gain/(loss) | | | 1.65 | | | | (1.66 | ) | | | 1.69 | | | | (3.19 | ) | | | 5.41 | |
| Total from investment operations | | | 2.74 | | | | (0.91 | ) | | | 2.89 | | | | (2.04 | ) | | | 6.35 | |
| | | | | | | | | | | | | | | | | | | | | |
| DISTRIBUTIONS: | | | | | | | | | | | | | | | | | | | | |
| From net investment income | | | (1.08 | ) | | | (1.11 | ) | | | (1.15 | ) | | | (1.09 | ) | | | (0.92 | ) |
| Tax return of capital | | | (0.01 | ) | | | (0.04 | ) | | | – | | | | – | | | | – | |
| Total distributions | | | (1.09 | ) | | | (1.15 | ) | | | (1.15 | ) | | | (1.09 | ) | | | (0.92 | ) |
| | | | | | | | | | | | | | | | | | | | | |
| Net increase/(decrease) in net asset value | | | 1.65 | | | | (2.06 | ) | | | 1.74 | | | | (3.13 | ) | | | 5.43 | |
| NET ASSET VALUE, END OF PERIOD | | $ | 26.47 | | | $ | 24.82 | | | $ | 26.88 | | | $ | 25.14 | | | $ | 28.27 | |
| TOTAL RETURN(b) | | | 10.93 | % | | | (3.08 | )% | | | 11.79 | % | | | (7.47 | )% | | | 28.21 | % |
| | | | | | | | | | | | | | | | | | | | | |
| RATIOS/SUPPLEMENTAL DATA: | | | | | | | | | | | | | | | | | | | | |
| Net assets, end of period (000s) | | $ | 157,489 | | | $ | 146,431 | | | $ | 221,741 | | | $ | 285,327 | | | $ | 349,184 | |
| | | | | | | | | | | | | | | | | | | | | |
| Ratio of expenses to average net assets | | | 0.50 | % | | | 0.50 | % | | | 0.50 | % | | | 0.50 | % | | | 0.50 | % |
| Ratio of net investment income to average net assets | | | 3.92 | % | | | 3.22 | % | | | 4.65 | % | | | 4.16 | % | | | 3.55 | % |
| Portfolio turnover rate(c) | | | 61 | % | | | 79 | % | | | 58 | % | | | 72 | % | | | 37 | % |
| Undistributed net investment income included in price of units issued and redeemed(a)(d) | | $ | (0.25 | ) | | $ | 0.00 | (e) | | $ | 0.04 | | | $ | 0.05 | | | $ | 0.12 | |
| (a) | Based on average shares outstanding during the period. |
| (b) | Total return is calculated assuming an initial investment made at the net asset value at the beginning of the period and redemption at the net asset value on the last day of the period and assuming all distributions are reinvested at reinvestment prices. Total return calculated for a period of less than one year is not annualized. |
| (c) | Portfolio turnover for periods less than one year is not annualized and does not include securities received or delivered from processing creations or redemptions in-kind. |
| (d) | The per share amount of equalization is presented to show the impact of equalization on distributable earnings per share. |
See Notes to Financial Statements.
ALPS Emerging Sector Dividend Dogs ETF
| Financial Highlights | For a Share Outstanding Throughout the Periods Presented |
| | | For the Year Ended November 30, 2021 | | | For the Year Ended November 30, 2020 | | | For the Year Ended November 30, 2019 | | | For the Year Ended November 30, 2018 | | | For the Year Ended November 30, 2017 | |
| NET ASSET VALUE, BEGINNING OF PERIOD | | $ | 20.96 | | | $ | 20.67 | | | $ | 21.33 | | | $ | 24.29 | | | $ | 21.17 | |
| | | | | | | | | | | | | | | | | | | | | |
| INCOME/(LOSS) FROM INVESTMENT OPERATIONS: | | | | | | | | | | | | | | | | | | | | |
| Net investment income(a) | | | 1.04 | | | | 0.56 | | | | 0.89 | | | | 0.91 | | | | 0.80 | |
| Net realized and unrealized gain/(loss) | | | 2.50 | | | | 0.42 | | | | (0.33 | ) | | | (3.02 | ) | | | 3.06 | |
| Total from investment operations | | | 3.54 | | | | 0.98 | | | | 0.56 | | | | (2.11 | ) | | | 3.86 | |
| | | | | | | | | | | | | | | | | | | | | |
| DISTRIBUTIONS: | | | | | | | | | | | | | | | | | | | | |
| From net investment income | | | (0.94 | ) | | | (0.69 | ) | | | (1.22 | ) | | | (0.85 | ) | | | (0.74 | ) |
| Total distributions | | | (0.94 | ) | | | (0.69 | ) | | | (1.22 | ) | | | (0.85 | ) | | | (0.74 | ) |
| | | | | | | | | | | | | | | | | | | | | |
| Net increase/(decrease) in net asset value | | | 2.60 | | | | 0.29 | | | | (0.66 | ) | | | (2.96 | ) | | | 3.12 | |
| NET ASSET VALUE, END OF PERIOD | | $ | 23.56 | | | $ | 20.96 | | | $ | 20.67 | | | $ | 21.33 | | | $ | 24.29 | |
| TOTAL RETURN(b) | | | 16.81 | % | | | 5.20 | % | | | 2.67 | % | | | (8.76 | )% | | | 18.37 | % |
| | | | | | | | | | | | | | | | | | | | | |
| RATIOS/SUPPLEMENTAL DATA: | | | | | | | | | | | | | | | | | | | | |
| Net assets, end of period (000s) | | $ | 24,742 | | | $ | 20,958 | | | $ | 28,941 | | | $ | 35,201 | | | $ | 47,356 | |
| | | | | | | | | | | | | | | | | | | | | |
| Ratio of expenses to average net assets | | | 0.60 | % | | | 0.60 | % | | | 0.60 | % | | | 0.60 | % | | | 0.60 | % |
| Ratio of net investment income to average net assets | | | 4.32 | % | | | 2.92 | % | | | 4.16 | % | | | 3.88 | % | | | 3.33 | % |
| Portfolio turnover rate(c) | | | 84 | % | | | 93 | % | | | 83 | % | | | 85 | % | | | 42 | % |
| Undistributed net investment income included in price of units issued and redeemed(a)(d) | | $ | 0.02 | | | $ | 0.02 | | | $ | 0.01 | | | $ | 0.10 | | | $ | 0.05 | |
| (a) | Based on average shares outstanding during the period. |
| (b) | Total return is calculated assuming an initial investment made at the net asset value at the beginning of the period and redemption at the net asset value on the last day of the period and assuming all distributions are reinvested at reinvestment prices. Total return calculated for a period of less than one year is not annualized. |
| (c) | Portfolio turnover for periods less than one year is not annualized and does not include securities received or delivered from processing creations or redemptions in-kind. |
| (d) | The per share amount of equalization is presented to show the impact of equalization on distributable earnings per share. |
See Notes to Financial Statements.
ALPS REIT Dividend Dogs ETF
| Financial Highlights | For a Share Outstanding Throughout the Periods Presented |
| | | For the Year Ended November 30, 2021 | | | For the Year Ended November 30, 2020 (a) | | | For the Year Ended November 30, 2019 | | | For the Year Ended November 30, 2018 | | | For the Year Ended November 30, 2017 | |
| NET ASSET VALUE, BEGINNING OF PERIOD | | $ | 40.49 | | | $ | 48.42 | | | $ | 44.18 | | | $ | 45.37 | | | $ | 41.31 | |
| | | | | | | | | | | | | | | | | | | | | |
| INCOME/(LOSS) FROM INVESTMENT OPERATIONS: | | | | | | | | | | | | | | | | | | | | |
| Net investment income (b) | | | 1.21 | | | | 1.29 | | | | 1.19 | | | | 1.17 | | | | 0.75 | |
| Net realized and unrealized gain/(loss) | | | 10.25 | | | | (7.26 | ) | | | 4.45 | | | | (0.53 | ) | | | 4.45 | |
| Total from investment operations | | | 11.46 | | | | (5.97 | ) | | | 5.64 | | | | 0.64 | | | | 5.20 | |
| | | | | | | | | | | | | | | | | | | | | |
| DISTRIBUTIONS: | | | | | | | | | | | | | | | | | | | | |
| From net investment income | | | (1.36 | ) | | | (1.57 | ) | | | (1.40 | ) | | | (1.83 | ) | | | (1.14 | ) |
| Tax return of capital | | | (0.70 | ) | | | (0.39 | ) | | | – | | | | – | | | | – | |
| Total distributions | | | (2.06 | ) | | | (1.96 | ) | | | (1.40 | ) | | | (1.83 | ) | | | (1.14 | ) |
| | | | | | | | | | | | | | | | | | | | | |
| Net increase/(decrease) in net asset value | | | 9.40 | | | | (7.93 | ) | | | 4.24 | | | | (1.19 | ) | | | 4.06 | |
| NET ASSET VALUE, END OF PERIOD | | $ | 49.89 | | | $ | 40.49 | | | $ | 48.42 | | | $ | 44.18 | | | $ | 45.37 | |
| TOTAL RETURN(c) | | | 29.03 | % | | | (11.77 | )% | | | 13.00 | % | | | 1.47 | % | | | 12.77 | % |
| | | | | | | | | | | | | | | | | | | | | |
| RATIOS/SUPPLEMENTAL DATA: | | | | | | | | | | | | | | | | | | | | |
| Net assets, end of period (000s) | | $ | 28,689 | | | $ | 26,320 | | | $ | 53,265 | | | $ | 55,222 | | | $ | 68,050 | |
| | | | | | | | | | | | | | | | | | | | | |
| Ratio of expenses to average net assets | | | 0.35 | % | | | 0.38 | %(d) | | | 0.55 | % | | | 0.55 | % | | | 0.55 | % |
| Ratio of net investment income to average net assets | | | 2.60 | % | | | 3.26 | % | | | 2.56 | % | | | 2.67 | % | | | 1.71 | % |
| Portfolio turnover rate(e) | | | 78 | % | | | 148 | % | | | 10 | % | | | 14 | % | | | 10 | % |
| (a) | Prior to January 2, 2020, the ALPS REIT Dividend Dogs ETF was known as the Cohen & Steers Global Realty Majors ETF. (b) Based on average shares outstanding during the period. |
| (c) | Total return is calculated assuming an initial investment made at the net asset value at the beginning of the period and redemption at the net asset value on the last day of the period and assuming all distributions are reinvested at reinvestment prices. Total return calculated for a period of less than one year is not annualized. |
| (d) | Effective January 2, 2020 the Fund's Advisory Fee changed from 0.55% to 0.35%. |
| (e) | Portfolio turnover for periods less than one year is not annualized and does not include securities received or delivered from processing creations or redemptions in-kind. |
See Notes to Financial Statements.
ALPS ETF Trust
| Notes to Financial Statements | November 30, 2021 |
1. ORGANIZATION
ALPS ETF Trust (the “Trust”), a Delaware statutory trust, is an open-end management investment company registered under the Investment Company Act of 1940, as amended (the “1940 Act”). As of November 30, 2021, the Trust consisted of eighteen separate portfolios. Each portfolio represents a separate series of the Trust. This report pertains to the ALPS Sector Dividend Dogs ETF, the ALPS International Sector Dividend Dogs ETF, the ALPS Emerging Sector Dividend Dogs ETF, and the ALPS REIT Dividend Dogs ETF (each a “Fund” and collectively, the “Funds”). Each Fund has elected to qualify as a diversified series of the Trust under the 1940 Act.
The investment objective of the ALPS Sector Dividend Dogs ETF is to seek investment results that replicate as closely as possible, before fees and expenses, the performance of the S-Network® Sector Dividend Dogs Index. The investment objective of the ALPS International Sector Dividend Dogs ETF is to seek investment results that replicate as closely as possible, before fees and expenses, the performance of the S-Network® International Sector Dividend Dogs Index. The investment objective of the ALPS Emerging Sector Dividend Dogs ETF is to seek investment results that replicate as closely as possible, before fees and expenses, the performance of the S-Network® Emerging Sector Dividend Dogs Index. The investment objective of the ALPS REIT Dividend Dogs ETF is to seek investment results that replicate as closely as possible, before fees and expenses, the performance of the S-Network® REIT Dividend Dogs Index.
The shares of the ALPS Sector Dividend Dogs ETF, the ALPS International Sector Dividend Dogs ETF, the ALPS Emerging Sector Dividend Dogs ETF, and the ALPS REIT Dividend Dogs ETF (“Shares”) are listed on the NYSE Arca, Inc. (the “NYSE Arca”). Each Fund issues and redeems Shares, at net asset value (“NAV”) in blocks of 25,000 Shares (prior to October 1, 2021 in blocks of 50,000 Shares), each of which is called a “Creation Unit”. Creation Units are issued and redeemed principally in-kind for securities included in the Underlying Index. Except when aggregated in Creation Units, Shares are not redeemable securities of the Fund.
Pursuant to the Trust’s organizational documents, its Officers and Trustees are indemnified against certain liability arising out of the performance of their duties to the Trust. Additionally, in the normal course of business, the Trust enters into contracts with service providers that contain general indemnification clauses. The Trust’s maximum exposure under these arrangements is unknown, as this would involve future claims that may be made against the Trust that have not yet occurred.
2. SIGNIFICANT ACCOUNTING POLICIES
The following is a summary of significant accounting policies consistently followed by the Funds in the preparation of the financial statements. The accompanying financial statements were prepared in accordance with accounting principles generally accepted in the United States of America (“U.S. GAAP”). The preparation of financial statements in conformity with U.S. GAAP requires management to make certain estimates and assumptions that affect the reported amounts of assets and liabilities and disclosures of contingent assets and liabilities at the date of the financial statements and the reported amounts of revenue and expenses during the period. Actual results could differ from those estimates. Each Fund is considered an investment company under U.S. GAAP and follows the accounting and reporting guidance applicable to investment companies in the Financial Accounting Standards Board (“FASB”) Accounting Standards Codification Topic 946.
A. Portfolio Valuation
Each Fund’s NAV is determined daily, as of the close of regular trading on the New York Stock Exchange (“NYSE”), normally 4:00 p.m. Eastern time, on each day the NYSE is open for trading. The NAV is computed by dividing the value of all assets of the Fund (including accrued interest and dividends), less all liabilities (including accrued expenses and dividends declared but unpaid), by the total number of shares outstanding.
Portfolio securities listed on any exchange other than the NASDAQ Stock Market LLC (“NASDAQ”) are valued at the last sale price on the business day as of which such value is being determined. If there has been no sale on such day, the securities are valued at the mean of the most recent bid and ask prices on such day. Securities traded on the NASDAQ are valued at the NASDAQ Official Closing Price as determined by NASDAQ. Portfolio securities traded on more than one securities exchange are valued at the last sale price on the business day as of which such value is being determined at the close of the exchange representing the principal market for such securities. Portfolio securities traded in the over-the-counter market, but excluding securities traded on the NASDAQ, are valued at the latest quoted sale price in such market.
The Funds’ investments are valued at market value or, in the absence of market value with respect to any portfolio securities, at fair value according to procedures adopted by the Trust’s Board of Trustees (the “Board”). When market quotations are not readily available or when events occur that make established valuation methods unreliable, securities of the Funds may be valued in good faith by or under the direction of the Board. These securities generally include, but are not limited to, restricted securities (securities which may not be publicly sold without registration under the Securities Act of 1933) for which a pricing service is unable to provide a market price; securities whose trading has been formally suspended; a security whose market price is not available from a pre-established primary pricing source or the pricing source is not willing to provide a price; a security with respect to which an event has occurred that is most likely to materially affect the value of the security after the market has closed but before the calculation of the Fund’s NAV or make it difficult or impossible to obtain a reliable market quotation; or a security whose price, as provided by the pricing service, does not reflect the security’s “fair value” due to the security being de-listed from a national exchange or the security’s primary trading market is temporarily closed at a time when, under normal conditions, it would be open. As a general principle, the current “fair value” of a security would be the amount which the owner might reasonably expect to receive from the sale on the applicable exchange or principal market. A variety of factors may be considered in determining the fair value of such securities.
ALPS ETF Trust
| Notes to Financial Statements | November 30, 2021 |
B. Fair Value Measurements
Each Fund discloses the classification of its fair value measurements following a three-tier hierarchy based on the inputs used to measure fair value. Inputs refer broadly to the assumptions that market participants would use in pricing the asset or liability, including assumptions about risk. Inputs may be observable or unobservable. Observable inputs reflect the assumptions market participants would use in pricing the asset or liability that are developed based on market data obtained from sources independent of the reporting entity. Unobservable inputs reflect the reporting entity’s own assumptions about the assumptions market participants would use in pricing the asset or liability that are developed based on the best information available.
Valuation techniques used to value the Funds’ investments by major category are as follows:
Equity securities, including restricted securities, for which market quotations are readily available, are valued at the last reported sale price or official closing price as reported by a third party pricing vendor on the primary market or exchange on which they are traded and are categorized as Level 1 in the hierarchy. In the event there were no sales during the day or closing prices are not available, securities are valued at the mean of the most recent quoted bid and ask prices on such day and are generally categorized as Level 2 in the hierarchy. Investments in open-end mutual funds are valued at their closing NAV each business day and are categorized as Level 1 in the hierarchy.
Changes in valuation techniques may result in transfers in or out of an assigned level within the disclosure hierarchy.
Various inputs are used in determining the value of each Fund’s investments as of the end of the reporting period. When inputs used fall into different levels of the fair value hierarchy, the level in the hierarchy within which the fair value measurement falls is determined based on the lowest level input that is significant to the fair value measurement in its entirety. The designated input levels are not necessarily an indication of the risk or liquidity associated with these investments.
These inputs are categorized in the following hierarchy under applicable financial accounting standards:
| Level 1 – | Unadjusted quoted prices in active markets for identical investments, unrestricted assets or liabilities that a Fund has the ability to access at the measurement date; |
| Level 2 – | Quoted prices which are not active, quoted prices for similar assets or liabilities in active markets or inputs other than quoted prices that are observable (either directly or indirectly) for substantially the full term of the asset or liability; and |
| Level 3 – | Significant unobservable prices or inputs (including the Fund’s own assumptions in determining the fair value of investments) where there is little or no market activity for the asset or liability at the measurement date. |
The following is a summary of the inputs used to value the Funds’ investments as of November 30, 2021:
ALPS Sector Dividend Dogs ETF
| Investments in Securities at Value | | Level 1 - Quoted and Unadjusted Prices | | | Level 2 - Other Significant Observable Inputs | | | Level 3 - Significant Unobservable Inputs | | | Total | |
| Common Stocks* | | $ | 1,128,665,808 | | | $ | – | | | $ | – | | | $ | 1,128,665,808 | |
| Short Term Investments | | | 1,189,260 | | | | – | | | | – | | | | 1,189,260 | |
| Total | | $ | 1,129,855,068 | | | $ | – | | | $ | – | | | $ | 1,129,855,068 | |
ALPS International Sector Dividend Dogs ETF
| Investments in Securities at Value | | Level 1 - Quoted and Unadjusted Prices | | | Level 2 - Other Significant Observable Inputs | | | Level 3 - Significant Unobservable Inputs | | | Total | |
| Common Stocks* | | $ | 156,239,596 | | | $ | – | | | $ | – | | | $ | 156,239,596 | |
| Short Term Investments | | | 229,548 | | | | – | | | | – | | | | 229,548 | |
| Total | | $ | 156,469,144 | | | $ | – | | | $ | – | | | $ | 156,469,144 | |
ALPS ETF Trust
| Notes to Financial Statements | November 30, 2021 |
ALPS Emerging Sector Dividend Dogs ETF
| Investments in Securities at Value | | Level 1 - Quoted and Unadjusted Prices | | | Level 2 - Other Significant Observable Inputs | | | Level 3 - Significant Unobservable Inputs | | | Total | |
| Common Stocks* | | $ | 24,672,871 | | | $ | – | | | $ | – | | | $ | 24,672,871 | |
| Rights and Warrants* | | | – | | | | – | | | | – | | | | – | |
| Short Term Investments | | | 858,649 | | | | – | | | | – | | | | 858,649 | |
| Total | | $ | 25,531,520 | | | $ | – | | | $ | – | | | $ | 25,531,520 | |
ALPS REIT Dividend Dogs ETF
| Investments in Securities at Value | | Level 1 - Quoted and Unadjusted Prices | | | Level 2 - Other Significant Observable Inputs | | | Level 3 - Significant Unobservable Inputs | | | Total | |
| Common Stocks* | | $ | 28,630,173 | | | $ | – | | | $ | – | | | $ | 28,630,173 | |
| Short Term Investments | | | 46,175 | | | | – | | | | – | | | | 46,175 | |
| Total | | $ | 28,676,348 | | | $ | – | | | $ | – | | | $ | 28,676,348 | |
| * | For a detailed sector/country breakdown, see the accompanying Schedule of Investments. |
The Funds did not have any securities that used significant unobservable inputs (Level 3) in determining fair value and there were no transfers into or out of Level 3 during the year ended November 30, 2021.
C. Foreign Securities
The ALPS International Sector Dividend Dogs ETF, the ALPS Emerging Sector Dividend Dogs ETF, and the ALPS REIT Dividend Dogs ETF may directly purchase securities of foreign issuers. Investments in non-U.S. issuers may involve unique risks compared to investing in securities of U.S. issuers, including, among others, less liquidity generally, greater market volatility than U.S. securities and less complete financial information than for U.S. issuers. In addition, adverse political, economic or social developments could undermine the value of the Fund’s investments or prevent the Fund from realizing the full value of its investments. Financial reporting standards for companies based in foreign markets differ from those in the United States. Finally, the value of the currency of the country in which the Fund has invested could decline relative to the value of the U.S. dollar, which may affect the value of the investment to U.S. investors.
Because foreign markets may be open on different days than the days during which investors may purchase the shares of each Fund, the value of each Fund's securities may change on the days when investors are not able to purchase the shares of the Funds. The value of securities denominated in foreign currencies is converted into U.S. dollars using exchange rates determined daily as of the close of regular trading on the NYSE or NASDAQ. Any use of a different rate from the rates used by the Index may adversely affect a Fund's ability to track its Index.
D. Foreign Currency Translation
The books and records of the Funds are maintained in U.S. dollars. Investment valuations and other assets and liabilities initially expressed in foreign currencies are converted each business day into U.S. dollars based upon current exchange rates. The portion of realized and unrealized gains or losses on investments due to fluctuations in foreign currency exchange rates is not separately disclosed and is included in realized and unrealized gains or losses on investments, when applicable.
E. Securities Transactions and Investment Income
Securities transactions are recorded as of the trade date. Realized gains and losses from securities transactions are recorded on the specific identification in accordance with GAAP. Dividend income and capital gains distributions, if any, are recorded on the ex-dividend date, net of any foreign taxes withheld. Interest income, if any, is recorded on the accrual basis, including any amortization of premiums and accretion of discounts.
F. Dividends and Distributions to Shareholders
Dividends from net investment income for each Fund, if any, are declared and paid quarterly or as the Board may determine from time to time. Distributions of net realized capital gains earned by the Funds, if any, are distributed at least annually.
G. Equalization
The ALPS Sector Dividend Dogs ETF, the ALPS International Sector Dividend Dogs ETF, and the ALPS Emerging Sector Dividend Dogs ETF utilize the accounting practice known as “Equalization” by which a portion of the proceeds from sales and costs of reacquiring the Funds’ shares, equivalent on a per share basis to the amount of distributable net investment income on the date of the transaction, is credited or charged to undistributed net investment income. As a result, undistributed net investment income per share is unaffected by sales or reacquisitions of the Funds’ shares. Amounts related to Equalization can be found on the Statement of Changes in Net Assets.
ALPS ETF Trust
| Notes to Financial Statements | November 30, 2021 |
H. Real Estate Investment Trusts (“REITs”)
As part of its investments in real estate related securities, the ALPS REIT Dividend Dogs ETF (“RDOG”) will invest in REITs and is subject to certain risks associated with direct investment in REITs. REITs possess certain risks which differ from an investment in common stocks. REITs are financial vehicles that pool investors’ capital to acquire, develop and/or finance real estate and provide services to their tenants. REITs may concentrate their investments in specific geographic areas or in specific property types, e.g., regional malls, shopping centers, office buildings, apartment buildings and industrial warehouses. REITs may be affected by changes in the value of their underlying properties and by defaults by borrowers or tenants. REITs depend generally on their ability to generate cash flow to make distributions to shareowners, and certain REITs have self-liquidation provisions by which mortgages held may be paid in full and distributions of capital returns may be made at any time.
As REITs generally pay a higher rate of dividends than most other operating companies, to the extent application of RDOG’s investment strategy results in RDOG investing in REIT shares, the percentage of RDOG’s dividend income received from REIT shares will likely exceed the percentage of RDOG’s portfolio that is comprised of REIT shares. Distributions received by RDOG from REITs may consist of dividends, capital gains and/or return of capital.
Dividend income from REITs is recognized on the ex-dividend date. The calendar year-end amounts of ordinary income, capital gains, and return of capital included in distributions received from RDOG’s investments in REITs are reported to RDOG after the end of the calendar year; accordingly, RDOG estimates these amounts for accounting purposes until the characterization of REIT distributions is reported to RDOG after the end of the calendar year. Estimates are based on the most recent REIT distribution information available.
The performance of a REIT may be affected by its failure to qualify for tax-free pass-through of income under the Internal Revenue Code of 1986, as amended (the “Code”), or its failure to maintain exemption from registration under the 1940 Act. Due to RDOG’s investments in REITs, RDOG may also make distributions in excess of RDOG’s earnings and capital gains. Distributions, if any, in excess of RDOG’s earnings and profits will first reduce the adjusted tax basis of a holder’s shares and, after that basis has been reduced to zero, will constitute capital gains to the shareholder.
I. Federal Tax and Tax Basis Information
The timing and character of income and capital gain distributions are determined in accordance with income tax regulations, which may differ from U.S. GAAP. Reclassifications are made to the Funds’ capital accounts for permanent tax differences to reflect income and gains available for distribution (or available capital loss carryforwards) under income tax regulations.
For the year ended November 30, 2021, the following reclassifications, which had no impact on results of operations or net assets, were recorded to reflect permanent tax differences resulting primarily from in-kind transactions:
| Fund | | Paid-in Capital | | | Total Distributable Earnings | |
| ALPS Sector Dividend Dogs ETF | | $ | 11,026,744 | | | $ | (11,026,744 | ) |
| ALPS International Sector Dividend Dogs ETF | | | 1,939,974 | | | | (1,939,974 | ) |
| ALPS Emerging Sector Dividend Dogs ETF | | | – | | | | – | |
| ALPS REIT Dividend Dogs ETF | | | 756,180 | | | | (756,180 | ) |
The tax character of the distributions paid during the fiscal years ended November 30, 2021 and November 30, 2020 was as follows:
| Fund | | Ordinary Income | | | Return of Capital | |
| November 30, 2021 | | | | | | | | |
| ALPS Sector Dividend Dogs ETF | | $ | 41,129,463 | | | $ | – | |
| ALPS International Sector Dividend Dogs ETF | | | 7,018,603 | | | | 36,242 | |
| ALPS Emerging Sector Dividend Dogs ETF | | | 971,386 | | | | – | |
| ALPS REIT Dividend Dogs ETF | | | 874,838 | | | | 444,426 | |
ALPS ETF Trust
| Notes to Financial Statements | November 30, 2021 |
| Fund | | Ordinary Income | | | Return of Capital | |
| November 30, 2020 | | | | | | | | |
| ALPS Sector Dividend Dogs ETF | | $ | 51,189,402 | | | $ | – | |
| ALPS International Sector Dividend Dogs ETF | | | 8,323,715 | | | | 309,701 | |
| ALPS Emerging Sector Dividend Dogs ETF | | | 831,362 | | | | – | |
| ALPS REIT Dividend Dogs ETF | | | 1,494,087 | | | | 336,997 | |
The character of distributions made during the year may differ from its ultimate characterization for federal income tax purposes.
Under current law, capital losses maintain their character as short-term or long-term and are carried forward to the next tax year without expiration. As of November 30, 2021, the following amounts are available as carry forwards to the next tax year:
| Fund | | Short-Term | | | Long-Term | |
| ALPS Sector Dividend Dogs ETF | | $ | – | | | $ | 278,703,992 | |
| ALPS International Sector Dividend Dogs ETF | | | 4,432,773 | | | | 48,112,299 | |
| ALPS Emerging Sector Dividend Dogs ETF | | | 439,844 | | | | 8,114,494 | |
| ALPS REIT Dividend Dogs ETF | | | 6,887,991 | | | | 2,417,872 | |
The ALPS Sector Dividend Dogs ETF and ALPS Emerging Sector Dividend Dogs ETF used capital loss carryovers during the year ended November 30, 2021 in the amount of $10,221,052 and $575,819, respectively.
As of November 30, 2021, the components of distributable earnings on a tax basis for each Fund were as follows:
| | | Undistributed net investment income | | | Accumulated net realized loss on investments | | | Net unrealized appreciation/ (depreciation) on investments | | | Total | |
| ALPS Sector Dividend Dogs ETF | | $ | 4,375,810 | | | $ | (278,703,992 | ) | | $ | 74,088,697 | | | $ | (200,239,485 | ) |
| ALPS International Sector Dividend Dogs ETF | | | – | | | | (52,545,072 | ) | | | (6,266,324 | ) | | | (58,811,396 | ) |
| ALPS Emerging Sector Dividend Dogs ETF | | | 110,349 | | | | (8,554,338 | ) | | | 279,509 | | | | (8,164,480 | ) |
| ALPS REIT Dividend Dogs ETF | | | – | | | | (9,305,863 | ) | | | 3,428,390 | | | | (5,877,473 | ) |
As of November 30, 2021, the cost of investments for federal income tax purposes and accumulated net unrealized appreciation/(depreciation) on investments were as follows:
| | | Gross Appreciation (excess of value over tax cost) | | | Gross Depreciation (excess of tax cost over value) | | | Net Appreciation/ (Depreciation) of Foreign Currency | | | Net Unrealized Appreciation/ (Depreciation) | | | Cost of Investments for Income Tax Purposes | |
| ALPS Sector Dividend Dogs ETF | | $ | 138,952,825 | | | $ | (64,864,128 | ) | | $ | – | | | $ | 74,088,697 | | | $ | 1,055,766,371 | |
| ALPS International Sector Dividend Dogs ETF | | | 10,083,942 | | | | (16,341,765 | ) | | | (8,501 | ) | | | (6,266,324 | ) | | | 162,726,967 | |
| ALPS Emerging Sector Dividend Dogs ETF | | | 2,790,485 | | | | (2,510,295 | ) | | | (681 | ) | | | 279,509 | | | | 25,251,330 | |
| ALPS REIT Dividend Dogs ETF | | | 5,256,035 | | | | (1,827,806 | ) | | | 161 | | | | 3,428,390 | | | | 25,248,119 | |
The differences between book-basis and tax-basis are primarily due to the deferral of losses from wash sales and investments in passive foreign investment companies.
J. Income Taxes
No provision for income taxes is included in the accompanying financial statements, as each Fund intends to distribute to shareholders all taxable investment income and realized gains and otherwise comply with Subchapter M of the Code, applicable to regulated investment companies. Each Fund evaluates tax positions taken (or expected to be taken) in the course of preparing the Fund’s tax returns to determine whether these positions meet a “more-likely-than-not” standard that, based on the technical merits, have a more than fifty percent likelihood of being sustained by a taxing authority upon examination. A tax position that meets the “more-likely-than-not” recognition threshold is measured to determine the amount of benefit to recognize in the financial statements.
ALPS ETF Trust
| Notes to Financial Statements | November 30, 2021 |
As of and during the year ended November 30, 2021, each Fund did not have a liability for any unrecognized tax benefits. Each Fund files U.S. federal, state, and local tax returns as required. Each Fund’s tax returns are subject to examination by the relevant tax authorities until expiration of the applicable statute of limitations, which is generally three years after the filing of the tax return, but may extend to four years in certain jurisdictions. Each Fund’s tax returns for open years have incorporated no uncertain tax positions that require a provision for income taxes.
K. Lending of Portfolio Securities
The Funds have entered into a securities lending agreement with State Street Bank & Trust Co. (“SSB”), the Funds’ lending agent. Each Fund may lend its portfolio securities only to borrowers that are approved by SSB. Each Fund will limit such lending to not more than 33 1/3% of the value of its total assets. The Fund’s securities held at SSB as custodian shall be available to be lent except those securities the Fund or ALPS Advisors, Inc. specifically identifies in writing as not being available for lending. The borrower pledges and maintains with the Fund collateral consisting of cash (U.S. Dollars only), securities issued or guaranteed by the U.S. government or its agencies or instrumentalities, and cash equivalents (including irrevocable bank letters of credit) issued by a person other than the borrower or an affiliate of the borrower. The initial collateral received by the Fund is required to have a value of no less than 102% of the market value of the loaned securities for U.S equity securities and a value of no less than 105% of the market value for non-U.S. equity securities. The collateral is maintained thereafter, at a market value equal to not less than 102% of the current value of the U.S. equity securities on loan and not less than 105% of the current value of the non-U.S. equity securities on loan. The market value of the loaned securities is determined at the close of each business day and any additional required collateral is delivered to the Fund on the next business day. During the term of the loan, each Fund is entitled to all distributions made on or in respect of the loaned securities. Loans of securities are terminable at any time and the borrower, after notice, is required to return borrowed securities within the customary time period for settlement of securities transactions.
Any cash collateral received is reinvested in a money market fund managed by SSB as disclosed in the Fund’s Schedule of Investments and is reflected in the Statements of Assets and Liabilities as a payable for collateral upon return of securities loaned. Non-cash collateral, in the form of securities issued or guaranteed by the U.S. government or its agencies or instrumentalities, is not disclosed in the Fund’s Statement of Assets and Liabilities as it is held by the lending agent on behalf of the Fund, and the Fund does not have the ability to re-hypothecate these securities. Income earned by the Fund from securities lending activity is disclosed in the Statement of Operations.
The following is a summary of the Fund's securities lending agreement and related cash and non-cash collateral received as of November 30, 2021:
| Fund | | Market Value of Securities on Loan | | | Cash Collateral Received | | | Non-Cash Collateral Received | | | Total Collateral Received | |
| ALPS International Sector Dividend Dogs ETF | | $ | 2,295,585 | | | $ | – | | | $ | 2,427,433 | | | $ | 2,427,433 | |
| ALPS Emerging Sector Dividend Dogs ETF | | | 1,425,220 | | | | 829,814 | | | | 724,369 | | | | 1,554,183 | |
The risks of securities lending include the risk that the borrower may not provide additional collateral when required or may not return the securities when due. To mitigate these risks, the Funds benefit from a borrower default indemnity provided by SSB. SSB’s indemnity allows for full replacement of securities lent wherein SSB will purchase the unreturned loaned securities on the open market by applying the proceeds of the collateral, or to the extent such proceeds are insufficient or the collateral is unavailable, SSB will purchase the unreturned loan securities at SSB’s expense. However, the Funds could suffer a loss if the value of the investments purchased with cash collateral falls below the value of the cash collateral received.
The following table reflects a breakdown of transactions accounted for as secured borrowings, the gross obligation by the type of collateral pledged or securities loaned, and the remaining contractual maturity of those transactions as of November 30, 2021:
| ALPS Emerging Sector Dividend Dogs ETF | Remaining contractual maturity of the agreements |
| Securities Lending Transactions | | Overnight & Continuous | | | Up to 30 days | | | 30-90 days | | | Greater than 90 days | | | Total | |
| Common Stocks | | $ | 829,814 | | | $ | – | | | $ | – | | | $ | – | | | $ | 829,814 | |
| Total Borrowings | | | | | | | | | | | | | | | | | | | 829,814 | |
| Gross amount of recognized liabilities for securities lending (collateral received) | | | $ | 829,814 | |
ALPS ETF Trust
| Notes to Financial Statements | November 30, 2021 |
3. INVESTMENT ADVISORY FEE AND OTHER AFFILIATED TRANSACTIONS
ALPS Advisors, Inc. (the “Adviser”) serves as the Funds’ investment adviser pursuant to an Investment Advisory Agreement with the Trust on behalf of each Fund (the “Advisory Agreement”). Pursuant to the Advisory Agreement, each Fund pays the Adviser an annual management fee for the services and facilities it provides, payable on a monthly basis as a percentage of the relevant Fund’s average daily net assets as set out below. From time to time, the Adviser may waive all or a portion of its fee.
| Fund | Advisory Fee |
| ALPS Sector Dividend Dogs ETF | 0.40% |
| ALPS International Sector Dividend Dogs ETF | 0.50% |
| ALPS Emerging Sector Dividend Dogs ETF | 0.60% |
| ALPS REIT Dividend Dogs ETF | 0.35% |
Out of the unitary management fee, the Adviser pays substantially all expenses of each Fund, including licensing fees to the Underlying Index provider, the cost of transfer agency, custody, fund administration, legal, audit, trustees and other services, except for interest expenses, distribution fees or expenses, brokerage expenses, taxes and extraordinary expenses not incurred in the ordinary course of each Fund's business. The Adviser’s unitary management fee is designed to pay substantially all of each Fund's expenses and to compensate the Adviser for providing services for each Fund.
ALPS Fund Services, Inc., an affiliate of the Adviser, is the administrator of the Funds.
Each Trustee receives (1) a quarterly retainer of $10,000, (2) a per meeting fee of $5,000, (3) $1,500 for any special meeting held outside of a regularly scheduled board meeting, and (4) reimbursement for all reasonable out-of-pocket expenses relating to attendance at meetings. In addition, the Chairman of the Board and Chairman of the Audit Committee each receives a quarterly retainer of $2,000, in connection with their respective roles.
4. PURCHASES AND SALES OF SECURITIES
For the year ended November 30, 2021, the cost of purchases and proceeds from sales of investment securities, excluding short-term investments and in-kind transactions, were as follows:
| Fund | | Purchases | | | Sales | |
| ALPS Sector Dividend Dogs ETF | | $ | 619,122,019 | | | $ | 615,360,325 | |
| ALPS International Sector Dividend Dogs ETF | | | 105,069,241 | | | | 105,340,522 | |
| ALPS Emerging Sector Dividend Dogs ETF | | | 20,585,933 | | | | 20,246,070 | |
| ALPS REIT Dividend Dogs ETF | | | 23,308,934 | | | | 22,732,820 | |
For the year ended November 30, 2021, the cost of in-kind purchases and proceeds from in-kind sales were as follows:
| Fund | | Purchases | | | Sales | |
| ALPS Sector Dividend Dogs ETF | | $ | 42,658,789 | | | $ | 68,640,518 | |
| ALPS International Sector Dividend Dogs ETF | | | 22,106,996 | | | | 20,131,895 | |
| ALPS Emerging Sector Dividend Dogs ETF | | | 1,016,011 | | | | – | |
| ALPS REIT Dividend Dogs ETF | | | – | | | | 3,732,520 | |
For the year ended November 30, 2021, the in-kind net realized gains/(losses) were as follows:
| Fund | | Net Realized Gain/(Loss) | |
| ALPS Sector Dividend Dogs ETF | | $ | 11,671,302 | |
| ALPS International Sector Dividend Dogs ETF | | | 2,137,869 | |
| ALPS REIT Dividend Dogs ETF | | | 863,443 | |
Gains on in-kind transactions are not considered taxable for federal income tax purposes and losses on in-kind transactions are also not deductible for tax purposes.
ALPS ETF Trust
| Notes to Financial Statements | November 30, 2021 |
5. CAPITAL SHARE TRANSACTIONS
Shares are created and redeemed by each Fund only in Creation Unit size aggregations of 25,000 shares (prior to October 1, 2021, the Creation Unit size was 50,000 Shares). Only broker-dealers or large institutional investors with creation and redemption agreements called Authorized Participants (“AP”) are permitted to purchase or redeem Creation Units from the Funds. Such transactions are generally permitted on an in-kind basis, with a balancing cash component to equate the transaction to the NAV per unit of each Fund on the transaction date. Cash may be substituted equivalent to the value of certain securities generally when they are not available in sufficient quantity for delivery, not eligible for trading by the AP or as a result of other market circumstances.
6. RELATED PARTY TRANSACTIONS
The ALPS Sector Dvidend Dogs ETF engaged in cross trades between other funds in the Trust during the year ended November 30, 2021 pursuant to Rule 17a-7 under the 1940 Act. Cross trading is the buying or selling of portfolio securities between funds to which the Adviser serves as the investment adviser. The Board previously adopted procedures that apply to transactions between the Funds of the Trust pursuant to Rule 17a-7. These transactions related to cross trades during the period complied with the requirements set forth by Rule 17a-7 and the Trust’s procedures.
Transactions related to cross trades during the year ended November 30, 2021, were as follows:
| | | Purchase cost paid | | | Sale proceeds received | | | Realized gain/(loss) on sales | |
| ALPS Sector Dividend Dogs ETF | | $ | 2,625,190 | | | $ | 1,007,571 | | | $ | 154,451 | |
7. MARKET DISRUPTIONS RISK
The Funds are subject to investment and operational risks associated with financial, economic and other global market developments and disruptions, including the recent spread of an infectious respiratory illness caused by a novel strain of coronavirus (known as COVID-19), which can negatively impact the securities markets and cause each Fund to lose value.
The spread of COVID-19 has caused volatility, severe market dislocations and liquidity constraints in many markets, including markets for the securities each Fund holds, and may adversely affect each Fund’s investments and operations. The transmission of COVID-19 and efforts to contain its spread have resulted in travel restrictions and disruptions, closed international borders, enhanced health screenings at ports of entry and elsewhere, disruption of and delays in healthcare service preparation and delivery, quarantines, event and service cancellations or interruptions, disruptions to business operations and supply chains, and a reduction in consumer and business spending, as well as general concern and uncertainty that has negatively affected the economy. These disruptions have led to instability in the market place and the jobs market. The impact of COVID-19 could adversely affect the economies of many nations or the entire global economy, the financial well-being and performance of individual issuers, borrowers and sectors and the health of the markets generally in potentially significant and unforeseen ways.
The foregoing could lead to a significant economic downturn or recession, increased market volatility, a greater number of market closures, higher default rates and adverse effects on the values and liquidity of each Fund’s securities or other assets. Such impacts may adversely affect the performance of the Funds.
8. SUBSEQUENT EVENTS
Subsequent events, if any, after the date of the Statements of Assets and Liabilities have been evaluated through the date the financial statements were issued. Management has determined that there were no subsequent events to report through the issuance of these financial statements.
ALPS ETF Trust
| Additional Information | November 30, 2021 (Unaudited) |
PROXY VOTING POLICIES AND PROCEDURES
Information regarding how the Fund voted proxies relating to portfolio securities during the most recent 12-month period ended June 30 and a description of the Fund’s proxy voting policies and procedures used in determining how to vote for proxies are available without charge on the SEC’s website at www.sec.gov and upon request, by calling (toll-free) 1-866-759-5679.
PORTFOLIO HOLDINGS
The Fund files a complete schedule of portfolio holdings with the U.S. Securities and Exchange Commission (“SEC”) for the first and third quarters of each fiscal year on Form N-PORT within 60 days after the end of the period. Copies of the Fund’s Form N-PORT are available without a charge, upon request, by contacting the Fund at 1-866-759-5679 and on the SEC’s website at https://www.sec.gov.
TAX INFORMATION
The Funds designate the following as a percentage of taxable ordinary income distributions, or up to the maximum amount allowable, for the calendar year ended December 31, 2020:
| | Qualified Dividend Income | Dividend Received Deduction | 199A |
| ALPS Sector Dividend Dogs ETF | 100.00% | 99.08% | 0.00% |
| ALPS International Sector Dividend Dogs ETF | 98.94% | 0.00% | 0.00% |
| ALPS Emerging Sector Dividend Dogs ETF | 75.62% | 0.00% | 0.00% |
| ALPS REIT Dividend Dogs ETF | 0.81% | 0.00% | 40.55% |
In early 2021, if applicable, shareholders of record received this information for the distributions paid to them by the Funds during the calendar year 2020 via Form 1099. The Funds will notify shareholders in early 2022 of amounts paid to them by the Funds, if any, during the calendar year 2021.
Pursuant to Section 853(c) of the Internal Revenue Code, the following Funds designated the following for the calendar year ended December 31, 2021:
| | | Foreign Taxes Paid | | | Foreign Source Income | |
| Alps Emerging Sector Dividend Dog ETF | | $ | 118,762 | | | $ | 1,289,676 | |
| ALPS International Sector Dividend Dogs ETF | | $ | 825,084 | | | $ | 8,600,862 | |
LICENSING AGREEMENTS
ALPS Sector Dividend Dogs ETF, ALPS International Sector Dividend Dogs ETF, ALPS Emerging Sector Dividend Dogs ETF, and ALPS REIT Dividend Dogs ETF
The Funds are not sponsored, endorsed, sold or promoted by S-Network Global Indexes, Inc.SM (“Licensor”). Licensor makes no representation or warranty, express or implied, to the owners of the Funds or any member of the public regarding the advisability of investing in securities generally or in the Funds particularly or the ability of the (i) in the case of SDOG, S-Network Sector Dividend DogsSM, (ii) in the case of IDOG, S-Network International Sector Dividend DogsSM, (iii) in the case of EDOG, S-Network Emerging Sector Dividend Dogs IndexSM, and (iv) in the case of RDOG, S-Network REIT Dividend Dogs IndexSM (each an “Underlying Index”) to track the performance of a market or sector. Licensor’s only relationship to the Licensee is the licensing of certain service marks and trade names of Licensor and of the Underlying Index that is determined, composed and calculated by Licensor without regard to the Licensee or the Fund. Licensor has no obligation to take the needs of the Licensee or the owners of the Fund into consideration in determining, composing or calculating the Underlying Index. Licensor is not responsible for and has not participated in the determination of the timing of, prices at, or quantities of the Fund to be issued or in the determination or calculation of the equation by which the Fund is to be converted into cash. Licensor has no obligation or liability in connection with the administration, marketing or trading of the Fund.
LICENSOR DOES NOT GUARANTEE THE ACCURACY AND/OR THE COMPLETENESS OF THE UNDERLYING INDEX OR ANY DATA INCLUDED THEREIN AND LICENSOR SHALL HAVE NO LIABILITY FOR ANY ERRORS, OMISSIONS, OR INTERRUPTIONS THEREIN. LICENSOR MAKES NO WARRANTY, EXPRESS OR IMPLIED, AS TO RESULTS TO BE OBTAINED BY LICENSEE, OWNERS OF THE FUND, OR ANY OTHER PERSON OR ENTITY FROM THE USE OF THE UNDERLYING INDEX OR ANY DATA INCLUDED THEREIN. LICENSOR MAKES NO EXPRESS OR IMPLIED WARRANTIES, AND EXPRESSLY DISCLAIMS ALL WARRANTIES OF MERCHANTABILITY OR FITNESS FOR A PARTICULAR PURPOSE OR USE WITH RESPECT TO THE UNDERLYING INDEX OR ANY DATA INCLUDED THEREIN. WITHOUT LIMITING ANY OF THE FOREGOING, IN NO EVENT SHALL LICENSOR HAVE ANY LIABILITY FOR ANY SPECIAL, PUNITIVE, INDIRECT, OR CONSEQUENTIAL DAMAGES (INCLUDING LOST PROFITS), EVEN IF NOTIFIED OF THE POSSIBILITY OF SUCH DAMAGES.
ALPS ETF Trust
| Additional Information | November 30, 2021 (Unaudited) |
The Funds are not sponsored, endorsed, sold or promoted by Standard & Poor’s, a division of The McGraw-Hill Companies, Inc. (“S&P”) or its third party licensors. Neither S&P nor its third party licensors make any representation or warranty, express or implied, to the owners of each Fund or any member of the public regarding the advisability of investing in securities generally or in each Fund particularly or the ability of each Underlying Index to track general stock market performance. S&P’s and its third party licensor’s only relationship to the Index Provider is the licensing of certain trademarks, service marks and trade names of S&P and/or its third party licensors and for the providing of calculation and maintenance services related to the Underlying Index. Neither S&P nor its third party licensors is responsible for and has not participated in the determination of the prices and amount of each Fund or the timing of the issuance or sale of each Fund or in the determination or calculation of the equation by which each Fund is to be converted into cash. S&P has no obligation or liability in connection with the administration, marketing or trading of each Fund.
NEITHER S&P, ITS AFFILIATES NOR THEIR THIRD PARTY LICENSORS GUARANTEE THE ADEQUACY, ACCURACY, TIMELINESS OR COMPLETENESS OF EACH UNDERLYING INDEX OR ANY DATA INCLUDED THEREIN OR ANY COMMUNICATIONS, INCLUDING BUT NOT LIMITED TO, ORAL OR WRITTEN COMMUNICATIONS (INCLUDING ELECTRONIC COMMUNICATIONS) WITH RESPECT THERETO. S&P, ITS AFFILIATES AND THEIR THIRD PARTY LICENSORS SHALL NOT BE SUBJECT TO ANY DAMAGES OR LIABILITY FOR ANY ERRORS, OMISSIONS OR DELAYS THEREIN. S&P MAKES NO EXPRESS OR IMPLIED WARRANTIES, AND EXPRESSLY DISCLAIMS ALL WARRANTIES OF MERCHANTABILITY OR FITNESS FOR A PARTICULAR PURPOSE OR USE WITH RESPECT TO ITS TRADEMARKS, EACH UNDERLYING INDEX OR ANY DATA INCLUDED THEREIN. WITHOUT LIMITING ANY OF THE FOREGOING, IN NO EVENT WHATSOEVER SHALL S&P, ITS AFFILIATES OR THEIR THIRD PARTY LICENSORS BE LIABLE FOR ANY INDIRECT, SPECIAL, INCIDENTAL, PUNITIVE OR CONSEQUENTIAL DAMAGES, INCLUDING BUT NOT LIMITED TO, LOSS OF PROFITS, TRADING LOSSES, LOST TIME OR GOODWILL, EVEN IF THEY HAVE BEEN ADVISED OF THE POSSIBILITY OF SUCH DAMAGES, WHETHER IN CONTRACT, TORT, STRICT LIABILITY OR OTHERWISE.
Standard & Poor’s® and S&P® are registered trademarks of The McGraw-Hill Companies, Inc.; “Calculated by S&P Custom Indices” and its related stylized mark are service marks of The McGraw-Hill Companies, Inc. These marks have been licensed for use by the Index Provider.
The S&P 500® is the property of Standard and Poor’s Financial Services LLC (“S&P”) and has been licensed by S&P for use by S-Network® Global Indexes, Inc. in connection with the S-Network® Sector Dividend Dogs Index (Ticker: SDOGX), the S-Network® International Sector Dividend Dogs Index (Ticker: IDOGX), the S-Network® Emerging Sector Dividend Dogs Index (Ticker: EDOGX), and the S-Network® REIT Dividend Dogs Index (Ticker: RDOGX).
The Adviser does not guarantee the accuracy and/or the completeness of each Underlying Index or any data included therein, and the Adviser shall have no liability for any errors, omissions or interruptions therein. The Adviser makes no warranty, express or implied, as to results to be obtained by each Fund, owners of the Shares of each Fund or any other person or entity from the use of each Underlying Index or any data included therein. The Adviser makes no express or implied warranties, and expressly disclaims all warranties of merchantability or fitness for a particular purpose or use with respect to each Underlying Index or any data included therein. Without limiting any of the foregoing, in no event shall the Adviser have any liability for any special, punitive, direct, indirect or consequential damages (including lost profits) arising out of matters relating to the use of each Underlying Index, even if notified of the possibility of such damages.
ALPS ETF Trust
| Board Considerations Regarding Approval of Investment Advisory Agreements | November 30, 2021 (Unaudited) |
At a meeting held on June 7, 2021 via electronic means (video-conference), the Board of Trustees of the Trust (the “Board” or the “Trustees”), including the Trustees who are not “interested persons” of the Trust within the meaning of the Investment Company Act of 1940, as amended (the “Independent Trustees”), evaluated a proposal to approve the continuance of the Investment Advisory Agreements between the Trust and ALPS Advisors, Inc. (the “Adviser” or “AAI”) with respect to the ALPS Sector Dividend Dogs ETF (“SDOG”), the ALPS International Sector Dividend Dogs ETF (“IDOG”), the ALPS Emerging Sector Dividend Dogs ETF (“EDOG”), and the ALPS REIT Dividend Dogs ETF (“RDOG”) (each “a Fund” and collectively the “Funds”). The Independent Trustees also met separately to consider each Investment Advisory Agreement.
In evaluating the Investment Advisory Agreements with respect to each Fund, the Board, including the Independent Trustees considered various factors, including (i) the nature, extent and quality of the services provided by AAI with respect to the applicable Fund under the Investment Advisory Agreements; (ii) the advisory fees and other expenses paid by the Fund compared to those of similar funds managed by other investment advisers; (iii) the costs of the services provided to the Fund by AAI and the profits realized by AAI and its affiliates from its relationship to the Fund; (iv) the extent to which economies of scale have been or would be realized if and as the assets of the Fund grow and whether fees reflect the economies of scale for the benefit of shareholders; and (v) any additional benefits and other considerations.
With respect to the nature, extent and quality of the services provided by AAI under the Investment Advisory Agreements, the Board considered and reviewed information concerning the services provided under the Investment Advisory Agreements, the investment parameters of the index of each Fund, financial information regarding AAI and its parent company, information describing AAI’s current organization and the background and experience of the persons responsible for the day-to-day management of the Funds.
The Board reviewed information on the performance of each Fund and its applicable benchmark. The Board also evaluated the correlation and tracking error between each underlying index and its corresponding Fund’s performance. Based on this review, the Board, including the Independent Trustees. found that the nature and extent of services provided to each Fund under the Investment Advisory Agreements was appropriate and that the quality was satisfactory.
The Board noted that the advisory fees for each Fund were unitary fees pursuant to which AAI assumes all expenses of the Funds (including the cost of transfer agency, custody, fund administration, legal, audit and other services) other than the payments under the Advisory Agreement, brokerage expenses, taxes, interest, litigation expenses and other extraordinary expenses.
With respect to advisory fee rates, the Board, including the Independent Trustees, noted the following:
The gross management fee rate for SDOG, IDOG and EDOG is higher than the median of its FUSE expense group. These Funds’ respective net expense ratios, however, are slightly above the median of their respective FUSE expense group.
The gross management fee rate for RDOG is lower than the median of its FUSE expense group. RDOG’s net expense ratio is also below the median of its FUSE expense group.
Based on the foregoing, and the other information available to them, the Board, including the Independent Trustees concluded that the advisory fee rate for each of the Funds were reasonable under the circumstances and in light of the quality of the services provided.
The Board, including the Independent Trustees considered other benefits available to AAI because of its relationship with the Funds and concluded that the advisory fees were reasonable taking into account any such benefits.
The Board, including the Independent Trustees also considered with respect to each Fund the information provided by AAI about the costs and profitability of AAI with respect to each of the Funds, including the asset levels and other factors that influence the profitability and financial viability of the Funds. The Board, including the Independent Trustees reviewed and noted the relatively small sizes of the Funds (other than SDOG) and concluded that AAI was not realizing any economies of scale. With respect to SDOG, the Independent Trustees noted that the Fund’s asset levels have recovered to its respective historic highs. The Independent Trustees determined that AAI should continue to keep the Board informed on an ongoing basis of any significant developments (e.g., material increases in asset levels) so as to facilitate the Independent Trustees’ evaluation of whether further economies of scale have been achieved.
In voting to renew each Investment Advisory Agreement, the Board, including the Independent Trustees concluded that the terms of each Investment Advisory Agreement are reasonable and fair in light of the services to be performed, the fees paid by certain other funds, expenses to be incurred and such other matters as the members of the Board, including the Independent Trustees, considered relevant in the exercise of their reasonable business judgment. The Board, including the Independent Trustees did not identify any single factor or group of factors as all important or controlling and considered all factors together.
ALPS ETF Trust
| Trustees and Officers | November 30, 2021 (Unaudited) |
The general supervision of the duties performed by the Adviser for the Fund under the Investment Advisory Agreement is the responsibility of the Board of Trustees. The Trust currently has four Trustees. Three Trustees have no affiliation or business connection with the Adviser or any of its affiliated persons and do not own any stock or other securities issued by the Adviser. These are the “non-interested” or “independent” Trustees (“Independent Trustees”). The other Trustee (the “Interested Trustee”) is affiliated with the Adviser.
The Independent Trustees of the Trust, their term of office and length of time served, their principal business occupations during the past five years, the number of portfolios in the Fund Complex overseen by each Independent Trustee, and other directorships, if any, held by the Trustee are shown below.
| INDEPENDENT TRUSTEES |
| Name, Address & Year of Birth* | Position(s) Held with Trust | Term of Office and Length of Time Served** | Principal Occupation(s) During Past 5 Years | Number of Portfolios in Fund Complex Overseen by Trustees*** | Other Directorships Held by Trustees |
Mary K. Anstine, 1940 | Trustee | Since March 2008 | Ms. Anstine is Trustee/Director of AV Hunter Trust and Colorado Uplift Board. | 36 | Ms. Anstine is a Trustee of ALPS Variable Investment Trust (7 funds); Financial Investors Trust (32 funds); Reaves Utility Income Fund; and Segall Bryant & Hamill Trust (14 funds). |
Jeremy W. Deems, 1976 | Trustee | Since March 2008 | Mr. Deems is the Co-Founder and Chief Financial Officer of Green Alpha Advisors, LLC, a registered investment advisor, and Co-Portfolio Manager of the Shelton Green Alpha Fund. | 36 | Mr. Deems is a Trustee of ALPS Variable Investment Trust (7 funds); Financial Investors Trust (32 funds); and Reaves Utility Income Fund; and Clough Funds Trust (1 fund). |
Rick A. Pederson, 1952 | Trustee | Since March 2008 | Mr. Pederson is Partner, Bow River Capital Partners (private equity management), 2003 - present; Board Member, Prosci Inc. (private business services) 2013-2016; Advisory Board Member, Citywide Banks (Colorado community bank) 2014-2017; Board Member, Strong-Bridge Consulting, 2015-2019; Board Member, IRI/ODMS Holdings LLC, 2017-2019; Director, National Western Stock Show (not for profit) 2010 - present; Director, History Colorado (not for profit) 2015-present; Director, Citywide Bank Advisory Board 2017-present; Trustee, Boettcher Foundation, 2018 -present. | 19 | Mr. Pederson is Trustee of Segall Bryant & Hamill Trust (14 funds) and Principal Real Estate Income Fund (1 fund). |
| * | The business address of the Trustee is c/o ALPS Advisors, Inc., 1290 Broadway, Suite 1000, Denver, Colorado 80203. |
| ** | This is the period for which the Trustee began serving the Trust. Each Trustee serves an indefinite term, until his successor is elected. |
| *** | The Fund Complex includes all series of the Trust and any other investment companies for which ALPS Advisors, Inc. provides investment advisory services. |
ALPS ETF Trust
| Trustees and Officers | November 30, 2021 (Unaudited) |
The Trustee who is an “interested person” of the Trust, his term of office and length of time served, his principal business occupations during the past five years, the number of portfolios in the Fund Complex overseen by the Interested Trustee and the other directorships, if any, held by the Trustee, are shown below.
| INTERESTED TRUSTEE |
| Name, Address and Year of Birth of Interested Trustee* | Position(s) Held with Trust | Term of Office and Length of Time Served** | Number of Principal Occupation(s) During Past 5 Years | Portfolios in Fund Complex Overseen by Trustees*** | Other Directorships Held by Trustees |
Edmund J. Burke, 1961 | Trustee | Since December 2017. | Mr. Burke joined ALPS in 1991 and served as the President and Director of ALPS Holdings, Inc., and ALPS Advisors, Inc. (“AAI”), and Director of ALPS Distributors, Inc. (“ADI”), ALPS Fund Services, Inc. (“AFS”), and ALPS Portfolio Solutions Distributor, Inc. (“APSD”). Mr. Burke retired from ALPS in June 2019. | 31 | Mr. Burke is a Trustee of Clough Global Dividend and Income Fund (1 fund); Clough Global Equity Fund (1 fund); Clough Global Opportunities Fund (1 fund); Clough Funds Trust (1 fund); Liberty All-Star Equity Fund (1 fund); Director of the Liberty All- Star Growth Fund, Inc. (1 fund) and Financial Investors Trust (32 funds). |
| * | The business address of the Trustee is c/o ALPS Advisors, Inc., 1290 Broadway, Suite 1000, Denver, Colorado 80203. Effective December 1, 2021, Mr. Burke is an Independent Trustee of the Trust. |
| ** | This is the period for which the Trustee began serving the Trust. Each Trustee serves an indefinite term, until his successor is elected. |
| *** | The Fund Complex includes all series of the Trust and any other investment companies for which ALPS Advisors, Inc. provides investment advisory services. |
ALPS ETF Trust
| Trustees and Officers | November 30, 2021 (Unaudited) |
| OFFICERS |
| Name, Address and Year of Birth of Officer* | Position(s) Held with Trust | Length of Time Served** | Principal Occupation(s) During Past 5 Years |
| Laton Spahr, 1975 | President | Since June 2021 | Mr. Spahr joined ALPS in 2019 and currently serves as President and Portfolio Manager of AAI. Prior to his current role, Mr. Spahr was a Senior Vice President and Strategy Leader of the Value & Income Team for Oppenheimer Funds from 2013 to 2019. |
| Matthew Sutula, 1985 | Chief Compliance Officer (“CCO”) | Since December 2019 | Mr. Sutula joined ALPS in 2012 and currently serves as Chief Compliance Officer of AAI. Prior to his current role, Mr. Sutula served as interim Compliance Officer of the Trust (September 2019 to December 2019). Compliance Manager and Senior Compliance Analyst for AAI, as well as Compliance Analyst for AFS. Prior to joining ALPS, he spent seven years at Morningstar, Inc. in various analyst roles supporting the registered investment company databases. Mr. Sutula is also Chief Compliance Officer of Principal Real Estate Income Fund, ALPS Variable Investment Trust, RiverNorth Opportunities Fund, Inc., Liberty All-Star Equity Fund and Liberty All-Star Growth Fund, Inc. |
| Kathryn Burns, 1976 | Treasurer | Since September 2018 | Ms. Burns serves as Vice President, Director of Fund Operations of AAI since 2018. From 2013 to 2018, she served as Vice President and Fund Controller at AFS. Prior to joining ALPS, she worked at Old Mutual Capital where she served as Vice President and Chief Compliance Officer (2010 – 2012) and Regulatory Reporting Manager and Assistant Treasurer to the Old Mutual Funds Trusts (2006 – 2012). She also served as a CPA for PricewaterhouseCoopers LLP. Ms. Burns also serves as President of ALPS Variable Investment Trust, Principal Real Estate Income Fund and RiverNorth Opportunities Fund, Inc. From June 2018 to November 2021 she also served as Treasurer of Boulder Growth & Income Fund, Inc. |
| Brendan Hamill, 1986 | Secretary | Since September 2021 | Mr. Hamill joined ALPS in August 2021, and is currently Vice President and Principal Legal Counsel. Prior to joining ALPS, Mr. Hamill was an attorney at Lewis Brisbois Bisgaard & Smith, LLP (law firm) (December 2018-August 2021) and Vedder Price, P.C. (law firm) (August 2015-December 2018). Mr. Hamill also serves as Secretary of Financial Investors Trust, Secretary of ALPS Variable Investment Trust, Secretary of Principal Real Estate Income Fund, and Assistant Secretary of James Advantage Funds. |
| * | The business address of each Officer is c/o ALPS Advisors, Inc., 1290 Broadway, Suite 1000, Denver, Colorado 80203. Each Officer is deemed an affiliate of the Trust as defined under the 1940 Act. |
| ** | This is the period for which the Officer began serving the Trust. Each Officer serves an indefinite term, until his/her successor is elected. |
The Statement of Additional Information includes additional information about the Fund’s Trustees and is available, without charge, upon request by calling (toll-free) 1-866-759-5679.

TABLE OF CONTENTS
| Performance Overview | 1 |
| Disclosure of Fund Expenses | 6 |
| Report of Independent Registered Public Accounting Firm | 7 |
| Schedule of Investments | 8 |
| Statement of Assets and Liabilities | 13 |
| Statement of Operations | 14 |
| Statements of Changes in Net Assets | 15 |
| Financial Highlights | 16 |
| Notes to Financial Statements | 17 |
| Additional Information | 23 |
| Board Considerations Regarding Approval of Investment Advisory Agreement | 25 |
| Trustees & Officers | 26 |
| Barron’s 400SM ETF | |
| Performance Overview | November 30, 2021 (Unaudited) |
Investment Objective
The Barron’s 400SM ETF (the “Fund” or “BFOR”) seeks investment results that correspond generally, before fees and expenses, to the performance of the Barron’s 400 IndexSM (the “Underlying Index”). The Underlying Index is a rules-based index intended to give investors a means of tracking the overall performance of high performing equity securities of U.S. companies. The Fund will invest at least 80% of its total assets in the equity securities which comprise the Underlying Index.
The Underlying Index generally consists of 400 stocks. The Underlying Index’s stocks are constituents of the MarketGrader U.S. Coverage Universe. In compiling the Underlying Index, MarketGrader Capital, LLC (the “Index Provider”) selects the 400 stocks from the MarketGrader U.S. Coverage Universe by using a methodology that selects components based on the strength of their fundamentals in growth, value, profitability and cash flow and then screens such potential Underlying Index components for certain criteria regarding concentration, market capitalization, and liquidity. The eligible stocks that are selected for inclusion in the Underlying Index’s portfolio are equally weighted. The Underlying Index is rebalanced by the Index Provider semiannually, on the third Friday of March and September each year.
Performance Overview
The Barron’s 400 ETF (BFOR) closed its 2021 fiscal year on November 30th, with its best-ever annual performance since the Fund's inception returning 33.2% for the year. Over the year, the BFOR closely tracked the performance its benchmark, the Barron’s 400 Index (B400T), which gained 34.1% on a total return basis. Figure 1 presents the fiscal year returns for both BFOR and the B400 since the Fund’s inception on June 3, 2013.
Figure 1. Fiscal Year Returns for the Barron’s 400 ETF (BFOR) and Its Benchmark, the Barron’s 400 Index (B400T) Since Inception on June 3, 2013.
| Fiscal Year | Barron’s 400 ETF (BFOR) | Barron’s 400 Index (B400T) |
| 2013* | 17.2% | 18.4% |
| 2014 | 8.1% | 9.0% |
| 2015 | 1.0% | 1.8% |
| 2016 | 9.1% | 9.9% |
| 2017 | 21.9% | 22.6% |
| 2018 | -2.1% | -1.5% |
| 2019 | 5.0% | 5.6% |
| 2020 | 13.3% | 14.1% |
| 2021 | 33.2% | 34.1% |
| * | The fiscal year 2013 is measured from the Fund’s inception on June 3, 2013, through November 30, 2013. BFOR returns are based on the Fund’s last market price at each fiscal year’s end date. B400T figures reflect total returns. Source: Bloomberg. |
Barron’s 400 Index Outperforms the Broad U.S. Stock Market
A year ago, the Advisor wrote about the remarkable bounce the Barron’s 400 Index (B400T) had from its March 23, 2020 low following the brief swoon in U.S. equities at the outset of the global pandemic, with the index gaining 78.3% on a total return basis from the market bottom through the end of fiscal year 2020 (see annual letter to shareholders in the 2020 annual report)1. This helped it record a strong 13.6% return for the year, although it failed to beat the broad U.S. market as measured by the Dow Jones US Total Stock Market Index (DJUSTSM), which rose 20% during the same period. In fiscal year 2021, however, the B400 handily beat the broad market benchmark gaining 34.1% to the DJUSTSM’s 26.5%. Furthermore, the B400 also outperformed the market’s large cap benchmarks, represented by the S&P 500 Index (SPX) and the Russell 1000 Index (R1K), which gained 27.9%, and 26.7%, respectively. Interestingly, the B400 outperformed the market’s small cap and midcap benchmarks too, as measured by the Russell 2000 Index (R2K), and the S&P MidCap 400 Index, which gained 22% and 26.5%, respectively. A summary of BFOR’s and B400’s performance in fiscal year 2021 may be seen in Figure 2.
| Barron’s 400SM ETF | |
| Performance Overview | November 30, 2021 (Unaudited) |
Figure 2. Fiscal Year 2021 Performance for the Barron’s 400 ETF (BFOR) and the Barron’s 400 Index (B400T) Versus Select Broad and Size U.S. Equity Benchmarks
| | Fiscal Year Return 11/30/2020 – 11/30/2021 |
| Barron’s 400 ETF (BFOR) | 33.2% |
| Barron’s 400 Index | 34.1% |
| Dow Jones US Total Stock Market Index | 26.5% |
| S&P 500 Index | 27.9% |
| Russell 1000 Index | 26.7% |
| Russell 2000 Index | 22.0% |
| S&P MidCap 400 Index | 26.5% |
| S&P Small Cap 600 Index | 31.4% |
Source: Bloomberg
Barron’s 400 vs. Factor Benchmark Returns
A common theme throughout 2021 was the widely held belief that the value factor seemed poised to finally make a comeback after years of underperforming the growth factor. In fiscal year 2020 alone, the Russell 3000 Value Index (R3KV) underperformed the Russell 3000 Growth Index (R3KG) by almost 40 percentage points (2.2% vs. 37.3%, respectively). The trend was not entirely reversed in fiscal year 2021, although value did have much better relative performance than in 2020, with R3KV returning 22.9%, yet still lower than R3KG’s return of 29.4%. However, when combined with the size factor, value’s performance was indeed quite strong, based on the Russell 2000 Value Index’s (small cap value) return of 33% compared to the Russell 1000 Growth Index’s (large cap growth) return of 30.7%. The Barron’s 400 Index, BFOR’s benchmark, was designed to straddle the factor divide by selecting companies according to MarketGrader’s GARP (growth at a reasonable price) methodology. This allowed the index to outperform, in 2021, the four combinations of size and style (large, small, value, and growth) tracked by the Russell size and style benchmarks. Furthermore, the B400 also did better in fiscal year 2021 than the midcap growth benchmark, based on the S&P MidCap 400 Index’s return of 21.5%. Though the B400 is an all-cap index, it is often compared to midcap growth exposures since it is equally weighted, and thus its median market cap falls squarely within the midcap range2. Figure 3 shows how BFOR and the B400 performed relative to the size and style benchmarks.
Figure 3. Fiscal Year 2021 Performance for the Barron’s 400 ETF (BFOR), the Barron’s 400 Index (B400T) Versus Size & Style Equity Benchmarks
| | Fiscal Year Return 11/30/2020 – 11/30/2021 |
| Barron’s 400 ETF (BFOR) | 33.2% |
| Barron’s 400 Index | 34.1% |
| S&P MidCap 400 Growth Index | 21.5% |
| Russell 3000 Value Index | 22.9% |
| Russell 3000 Growth Index | 29.4% |
| Russell 1000 Value Index (Large Cap Value) | 22.2% |
| Russell 1000 Growth Index (Large Cap Growth) | 30.7% |
| Russell 2000 Value Index (Small Cap Value) | 33.0% |
| Russell 2000 Growth Index (Small Cap Growth) | 12.0% |
| MSCI USA Quality Factor Index | 26.8% |
Source: Bloomberg
Breaking Down the Companies
The B400 Index reconstitutes and rebalances in March and September of each calendar year3. But the BFOR’s fiscal year runs from November 30th close of one year to the November 30th close of the following year. Therefore, over its fiscal year, BFOR holds three different portfolios. The first portfolio of 400 companies is the one that it starts the fiscal year with (which was reconstituted in September of the previous fiscal year), and this is held through the March rebalance. When the B400 Index reconstitutes in March, this essentially determines the second portfolio of 400 companies that BFOR holds. Finally, when the B400 reconstitutes in September, the third portfolio of B400 companies that BFOR holds is determined.
| 2 | As of this writing on December 10, 2021, the average market cap of all B400 constituents was $54.9 billion, while the median market cap was $10.7 billion. Source: MarketGrader Research. |
| 3 | B400 is reconstituted and rebalanced semi-annually on the third Friday of March and September. |
| Barron’s 400SM ETF | |
| Performance Overview | November 30, 2021 (Unaudited) |
For the 2021 fiscal year, the three portfolios that were held by BFOR comprised a total of 711 different companies, including the 400 companies selected by the B400 in September 2020, March 2021, and September 2021 for the index. Of these, 73% (or 518 companies) had a positive return during their time as members of B400 in the last fiscal year, with only 27% having posted a negative return. It’s worth noting that 137 companies that were members of the B400 at the start of the 2021 fiscal year (selected at the September 2020 rebalance) are still part of the index (34% of current constituents). Figure 4 summarizes the number of companies that were members of the B400 across different time periods during the 2021 fiscal year. Figure 5 presents the top 30 performers (regardless of the period each stock was held).
Figure 4. Barron’s 400 Unique Constituents by Selection Period In the 2021 Fiscal Year
| Period | # of Companies |
| Sept. 2020 to March 2021 | 131 |
| Sept. 2020 to Sept. 2021 | 96 |
| Sept. 2020 to March 2022 | 137 |
| Sept. 2020 to March 2021 & Sept. 2021 to March 2022* | 36 |
| March 2021 to Sept. 2021 | 84 |
| March 2021 to March 2022 | 84 |
| Sept. 2021 to March 2022 | 143 |
| * | These are companies that started the 2021 fiscal year as members of B400, were removed at the March 2022 reconstitution, and were then re-selected in September 2021 reconstitution. Source: MarketGrader Research. |
Figure 5. Top 30 Performing Stocks in the Barron’s 400 Index During the 2021 Fiscal Year*
| Symbol | Company Name | Market Cap** (in USD Millions) | Sector | Start Date | End Date | Return (%) |
| DISCA | Discovery, Inc. Class A | 11,144 | Consumer Discretionary | 9/21/20 | 3/19/21 | 187.14 |
| CROX | Crocs, Inc. | 2,522 | Consumer Discretionary | 9/21/20 | 3/18/22 | 178.52 |
| VIAC | ViacomCBS Inc. Class B | 16,972 | Consumer Discretionary | 9/21/20 | 3/19/21 | 175.94 |
| ATKR | Atkore International Group | 1,243 | Industrials | 9/21/20 | 3/18/22 | 173.22 |
| FTNT | Fortinet, Inc. | 15,874 | Technology | 9/21/20 | 3/18/22 | 169.5 |
| NVDA | NVIDIA Corporation | 298,217 | Technology | 9/21/20 | 3/18/22 | 143.81 |
| TBBK | Bancorp Inc | 497 | Financials | 9/21/20 | 3/18/22 | 139.58 |
| WAL | Western Alliance Bancorp | 3,485 | Financials | 9/21/20 | 3/18/22 | 114.12 |
| SFBS | ServisFirst Bancshares Inc | 1,821 | Financials | 9/21/20 | 3/18/22 | 112.78 |
| SBNY | Signature Bank | 5,576 | Financials | 9/21/20 | 3/19/21 | 112.44 |
| IT | Gartner, Inc. | 11,333 | Industrials | 9/21/20 | 3/18/22 | 105.43 |
| CLFD | Clearfield, Inc. | 338 | Technology | 3/22/21 | 3/18/22 | 104.49 |
| WIRE | Encore Wire Corporation | 1,359 | Industrials | 3/22/21 | 3/18/22 | 102.74 |
| SIVB | SVB Financial Group | 13,374 | Financials | 9/21/20 | 3/18/22 | 100.76 |
| GNRC | Generac Holdings Inc. | 11,015 | Industrials | 9/21/20 | 3/18/22 | 95.38 |
| CPRX | Catalyst Pharmaceuticals | 297 | Health Care | 9/21/20 | 3/18/22 | 91.26 |
| XPEL | XPEL, Inc. | 352 | Consumer Discretionary | 9/21/20 | 3/18/22 | 89.78 |
| MCB | Metropolitan Bank Holding | 373 | Financials | 3/22/21 | 3/18/22 | 88.92 |
| EPAM | EPAM Systems, Inc. | 17,023 | Technology | 9/21/20 | 3/18/22 | 88.80 |
| CPF | Central Pacific Financial | 429 | Financials | 9/21/20 | 3/18/22 | 88.46 |
| HIBB | Hibbett Sports, Inc. | 534 | Consumer Discretionary | 9/21/20 | 9/17/21 | 88.36 |
| PFBC | Preferred Bank | 506 | Financials | 9/21/20 | 3/18/22 | 85.34 |
| INTU | Intuit Inc. | 84,085 | Technology | 9/21/20 | 3/18/22 | 85.30 |
| ANET | Arista Networks, Inc. | 11,469 | Technology | 9/21/20 | 3/18/22 | 83.30 |
| ENPH | Enphase Energy, Inc. | 7,692 | Technology | 9/21/20 | 3/18/22 | 83.06 |
| EWBC | East West Bancorp, Inc. | 5,296 | Financials | 9/21/20 | 3/19/21 | 82.87 |
| XLNX | Xilinx, Inc. | 27,441 | Technology | 3/22/21 | 3/18/22 | 82.25 |
| CASH | Meta Financial Group, Inc. | 611 | Financials | 9/21/20 | 3/18/22 | 80.57 |
| AMAT | Applied Materials, Inc. | 55,440 | Industrials | 9/21/20 | 3/18/22 | 78.46 |
| WSM | Williams-Sonoma, Inc. | 6,497 | Consumer Discretionary | 9/21/20 | 3/18/22 | 77.98 |
| * | Regardless of holding period. |
| ** | Market cap is from the date each company was first selected to B400 during fiscal year 2021. Sources: MarketGrader Research and FactSet. |
| Barron’s 400SM ETF | |
| Performance Overview | November 30, 2021 (Unaudited) |
Performance (as of November 30, 2021)
| | 1 Year | 5 Year | Since Inception^ |
| Barron’s 400SM ETF – NAV | 33.18% | 13.58% | 12.13% |
| Barron’s 400SM ETF – Market Price* | 33.17% | 13.58% | 12.13% |
| Barron’s 400 IndexSM | 34.06% | 14.31% | 12.87% |
Total Expense Ratio (per the current prospectus) is 0.70%
Performance data quoted represents past performance. Past performance does not guarantee future results. Total return figures assume reinvestment of dividends and capital gains distributions, if any. The table does not reflect the deduction of taxes that a shareholder would pay on Fund distributions or the redemption of Fund shares. Investment return and principal value of an investment will fluctuate so that an investor’s shares, when sold or redeemed, may be worth more or less than the original cost. Current performance data may be higher or lower than actual data quoted. For the most current month-end performance data please visit www.alpsfunds.com or call 1.855.724.0450.
NAV is an exchange-traded fund’s per-share value. The per-share dollar amount of the Fund is derived by dividing the total value of all the securities in its portfolio, less any liabilities, by the number of Fund shares outstanding. Market Price is the price at which a share can currently be traded in the market. Information detailing the number of days the Market Price of the Fund was greater than the Fund’s NAV and the number of days it was less than the Fund’s NAV can be obtained at www.alpsfunds.com.
| ^ | The Fund commenced Investment Operations on June 4, 2013. |
| * | Market Price means the official closing price of a share or, if it more accurately reflects the market value of a share at the time as of which the Fund calculates current net asset value per share, the price that is the midpoint of the bid-ask spread as of that time. It does not represent the returns an investor would receive if shares were traded at other times. |
The Barron’s 400 IndexSM, calculated by NYSE Arca or its affiliates, measures the performance of a diversified group of U.S. companies selected in part based on fundamentals-related rules-based criteria. The index includes companies that have scored highest according to fundamentals-related rankings calculated by MarketGrader Capital, LLC. Additional rules-based screening provides for sector and market cap diversification. The Underlying Index has been licensed by MarketGrader for use with the Barron’s 400SM ETF.
The index is not actively managed and does not reflect any deductions for fees, expenses or taxes. One cannot invest directly in an index. Index performance does not reflect Fund performance.
Funds that emphasize investments in small/mid cap companies will generally experience greater price volatility.
Barron’s 400SM ETF shares are not individually redeemable. Investors buy and sell shares of the Barron’s 400SM ETF on a secondary market. Only market makers or “authorized participants” may trade directly with the Fund, typically in blocks of 25,000 shares.
The Barron’s 400SM ETF is not suitable for all investors. Investments in the Fund are subject to investment risks, including possible loss of the principal amount invested.
ALPS Portfolio Solutions Distributor, Inc., a FINRA member, is the distributor for the Fund.
| Barron’s 400SM ETF | |
| Performance Overview | November 30, 2021 (Unaudited) |
Top 10 Holdings* (as of November 30, 2021)
| Encore Wire Corp. | 0.40% |
| Live Oak Bancshares, Inc. | 0.38% |
| Enphase Energy, Inc. | 0.38% |
| Triumph Bancorp, Inc. | 0.37% |
| Advanced Micro Devices, Inc. | 0.36% |
| NVIDIA Corp. | 0.35% |
| Xilinx, Inc. | 0.35% |
| Clearfield, Inc. | 0.35% |
| Trade Desk, Inc. | 0.35% |
| Calix, Inc. | 0.35% |
| Total % of Top 10 Holdings | 3.64% |
| * | % of Total Investments (excluding investments purchased with collateral from securities loaned). |
Future holdings are subject to change.
Growth of $10,000 (as of November 30, 2021)
Comparison of change in value of a $10,000 investment in the Fund and the Underlying Index
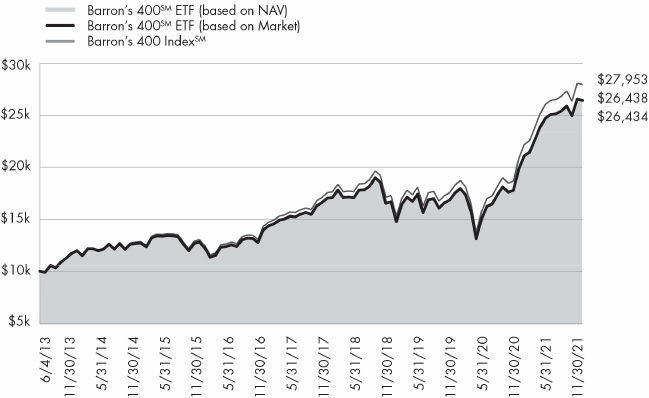
The chart above compares historical performance of a hypothetical investment of $10,000 in the Fund since inception with the performance of the Fund’s benchmark index. Results include the reinvestment of all dividends and capital gains distributions. Past performance does not guarantee future results. The chart does not reflect the deduction of taxes that a shareholder would pay on Fund distributions or the redemption of Fund shares.
| Barron’s 400SM ETF | |
| Disclosure of Fund Expenses | November 30, 2021 (Unaudited) |
Shareholder Expense Example: As a shareholder of the Fund, you incur certain ongoing costs, including management fees and other Fund expenses. These examples are intended to help you understand your ongoing costs (in dollars) of investing in the Fund and to compare these costs with the ongoing costs of investing in other funds. It is based on an investment of $1,000 invested at the beginning of the (six month) period and held through November 30, 2021.
Actual Return: The first line of the table provides information about actual account values and actual expenses. You may use the information in this line, together with the amount you invested, to estimate the expenses that you incurred over the period. Simply divide your account value by $1,000 (for example, an $8,600 account value divided by $1,000 = 8.6), then multiply the result by the number in the first line under the heading entitled “Expenses Paid During Period” to estimate the expenses attributable to your investment during this period.
Hypothetical 5% Return: The second line of the table provides information about hypothetical account values and hypothetical expenses based on the Fund’s actual expense ratio and an assumed rate of return of 5% per year before expenses, which is not the Fund’s actual return. The hypothetical account values and expenses may not be used to estimate the actual ending account balance or expenses you paid for the period. You may use this information to compare ongoing costs of investing in the Fund and other funds. To do so, compare this 5% hypothetical example with the 5% hypothetical examples that appear in the shareholder reports of other funds.
The expenses shown in the table are meant to highlight ongoing Fund costs only and do not reflect any transaction costs, such as brokerage commissions and other fees to financial intermediaries. Therefore, the second line is useful in comparing ongoing costs only, and will not help you determine the relative total costs of owning different funds. In addition, if these costs were included, your costs would have been higher.
| | Beginning Account Value 6/1/21 | Ending Account Value 11/30/21 | Expense Ratio(a) | Expenses Paid During Period 6/1/21 - 11/30/21(b) |
| Barron's 400 ETF | | | | |
| Actual | $1,000.00 | $1,054.30 | 0.65% | $3.35 |
| Hypothetical (5% return before expenses) | $1,000.00 | $1,021.81 | 0.65% | $3.29 |
| (a) | Annualized, based on the Fund's most recent fiscal half year expenses. |
| (b) | Expenses are equal to the Fund's annualized expense ratio multiplied by the average account value over the period, multiplied by the number of days in the most recent fiscal half year (183), divided by 365. |
| Barron’s 400SM ETF |
| Report of Independent Registered Public Accounting Firm |
To the Board of Trustees of ALPS ETF Trust and the shareholders of Barron’s 400SM ETF:
Opinion on the Financial Statements and Financial Highlights
We have audited the accompanying statement of assets and liabilities, including the schedule of investments of Barron’s 400SM ETF (the "Fund"), one of the funds constituting the ALPS ETF Trust, as of November 30, 2021, the related statement of operations for the year then ended, the statements of changes in net assets for each of the two years in the period then ended, and the financial highlights for each of the five years in the period then ended, and the related notes.
In our opinion, the financial statements and financial highlights present fairly, in all material respects, the financial position of the Fund as of November 30, 2021, and the result of its operations for the year then ended, the changes in its net assets for each of the two years in the period then ended, and the financial highlights for each of the five years in the period then ended, in conformity with accounting principles generally accepted in the United States of America.
Basis for Opinion
These financial statements and financial highlights are the responsibility of the Fund's management. Our responsibility is to express an opinion on the Fund's financial statements and financial highlights based on our audits. We are a public accounting firm registered with the Public Company Accounting Oversight Board (United States) (PCAOB) and are required to be independent with respect to the Fund in accordance with the U.S. federal securities laws and the applicable rules and regulations of the Securities and Exchange Commission and the PCAOB.
We conducted our audits in accordance with the standards of the PCAOB. Those standards require that we plan and perform the audit to obtain reasonable assurance about whether the financial statements and financial highlights are free of material misstatement, whether due to error or fraud. The Fund is not required to have, nor were we engaged to perform, an audit of its internal control over financial reporting. As part of our audit we are required to obtain an understanding of internal control over financial reporting but not for the purpose of expressing an opinion on the effectiveness of the Fund’s internal control over financial reporting. Accordingly, we express no such opinion.
Our audit included performing procedures to assess the risks of material misstatement of the financial statements and financial highlights, whether due to error or fraud, and performing procedures that respond to those risks. Such procedures included examining, on a test basis, evidence regarding the amounts and disclosures in the financial statements and financial highlights. Our audit also included evaluating the accounting principles used and significant estimates made by management, as well as evaluating the overall presentation of the financial statements and financial highlights. Our procedures included confirmation of securities owned as of November 30, 2021, by correspondence with the custodian and brokers; when replies were not received from brokers, we performed other auditing procedures. We believe that our audit provides a reasonable basis for our opinion.
DELOITTE & TOUCHE LLP
Denver, Colorado
January 26, 2022
We have served as the auditor of one or more investment companies advised by ALPS Advisors, Inc. since 2007.
| Barron’s 400SM ETF | |
| Schedule of Investments | November 30, 2021 |
| Security Description | | Shares | | | Value | |
| COMMON STOCKS (98.94%) | | | | | | | | |
| Communication Services (3.31%) | | | | | | | | |
| Alphabet, Inc., Class A(a) | | | 129 | | | $ | 366,096 | |
| Cable One, Inc. | | | 194 | | | | 343,780 | |
| Cargurus, Inc.(a) | | | 11,906 | | | | 446,475 | |
| DISH Network Corp., Class A(a) | | | 8,830 | | | | 275,937 | |
| Fox Corp., Class A | | | 10,507 | | | | 375,205 | |
| IDT Corp., Class B(a) | | | 8,230 | | | | 446,724 | |
| Interpublic Group of Cos., Inc. | | | 10,018 | | | | 332,497 | |
| Meta Platforms, Inc., Class A(a) | | | 985 | | | | 319,593 | |
| Netflix, Inc.(a) | | | 641 | | | | 411,458 | |
| Nexstar Media Group, Inc., Class A | | | 2,586 | | | | 386,607 | |
| Omnicom Group, Inc. | | | 5,118 | | | | 344,493 | |
| TEGNA, Inc. | | | 21,489 | | | | 424,408 | |
| Verizon Communications, Inc. | | | 6,816 | | | | 342,640 | |
| ZoomInfo Technologies, Inc.(a) | | | 5,534 | | | | 341,448 | |
| Total Communication Services | | | | | | | 5,157,361 | |
| | | | | | | | | |
| Consumer Discretionary (19.45%) | | | | | | | | |
| Academy Sports & Outdoors, Inc.(a) | | | 8,186 | | | | 365,259 | |
| Acushnet Holdings Corp.(b) | | | 7,407 | | | | 402,793 | |
| America's Car-Mart, Inc.(a) | | | 3,095 | | | | 303,743 | |
| Asbury Automotive Group, Inc.(a) | | | 2,161 | | | | 353,626 | |
| AutoNation, Inc.(a) | | | 3,479 | | | | 430,874 | |
| Best Buy Co., Inc. | | | 3,367 | | | | 359,798 | |
| Big 5 Sporting Goods Corp.(b) | | | 14,860 | | | | 352,628 | |
| Boot Barn Holdings, Inc.(a) | | | 4,354 | | | | 532,668 | |
| BorgWarner, Inc. | | | 8,585 | | | | 371,559 | |
| Boyd Gaming Corp.(a) | | | 6,330 | | | | 371,001 | |
| Brunswick Corp. | | | 3,822 | | | | 358,924 | |
| Buckle, Inc. | | | 9,441 | | | | 444,105 | |
| Camping World Holdings, Inc., Class A(b) | | | 9,618 | | | | 421,846 | |
| Carter's, Inc. | | | 3,730 | | | | 376,842 | |
| Century Communities, Inc. | | | 5,673 | | | | 403,180 | |
| Columbia Sportswear Co. | | | 3,581 | | | | 349,255 | |
| Container Store Group, Inc.(a) | | | 34,696 | | | | 403,515 | |
| Crocs, Inc.(a) | | | 2,483 | | | | 407,262 | |
| Deckers Outdoor Corp.(a) | | | 848 | | | | 343,779 | |
| Dick's Sporting Goods, Inc.(b) | | | 2,840 | | | | 333,870 | |
| Dillard's, Inc., Class A | | | 1,846 | | | | 505,619 | |
| DR Horton, Inc. | | | 4,220 | | | | 412,294 | |
| Five Below, Inc.(a) | | | 2,006 | | | | 408,101 | |
| Floor & Decor Holdings, Inc., Class A(a) | | | 2,906 | | | | 374,613 | |
| General Motors Co.(a) | | | 7,324 | | | | 423,840 | |
| Gentherm, Inc.(a) | | | 4,624 | | | | 390,497 | |
| Genuine Parts Co. | | | 3,091 | | | | 394,844 | |
| Group 1 Automotive, Inc. | | | 2,259 | | | | 439,940 | |
| Hasbro, Inc. | | | 3,804 | | | | 368,646 | |
| Haverty Furniture Cos., Inc. | | | 10,986 | | | | 328,591 | |
| La-Z-Boy, Inc. | | | 11,182 | | | | 373,367 | |
| LCI Industries | | | 2,835 | | | | 431,686 | |
| Leggett & Platt, Inc. | | | 7,975 | | | | 322,110 | |
| Lennar Corp., Class B | | | 4,576 | | | | 392,529 | |
| LGI Homes, Inc.(a) | | | 2,455 | | | | 352,685 | |
| Security Description | | Shares | | | Value | |
| Consumer Discretionary (continued) | | | | | | | | |
| Lithia Motors, Inc., Class A | | | 1,162 | | | $ | 338,526 | |
| LKQ Corp. | | | 7,257 | | | | 405,666 | |
| Lumber Liquidators Holdings, Inc.(a) | | | 19,856 | | | | 304,591 | |
| M/I Homes, Inc.(a) | | | 6,112 | | | | 341,600 | |
| Malibu Boats, Inc., Class A(a) | | | 5,470 | | | | 380,001 | |
| MarineMax, Inc.(a) | | | 7,837 | | | | 417,477 | |
| MasterCraft Boat Holdings, Inc.(a) | | | 14,992 | | | | 410,181 | |
| Meritage Homes Corp.(a) | | | 3,615 | | | | 407,989 | |
| Mohawk Industries, Inc.(a) | | | 1,989 | | | | 333,893 | |
| Monarch Casino & Resort, Inc.(a) | | | 5,883 | | | | 396,338 | |
| Movado Group, Inc. | | | 11,612 | | | | 521,030 | |
| NIKE, Inc., Class B | | | 2,335 | | | | 395,175 | |
| NVR, Inc.(a) | | | 75 | | | | 391,901 | |
| O'Reilly Automotive, Inc.(a) | | | 627 | | | | 400,126 | |
| Patrick Industries, Inc. | | | 4,688 | | | | 373,962 | |
| Pool Corp. | | | 781 | | | | 432,768 | |
| PulteGroup, Inc. | | | 7,862 | | | | 393,336 | |
| Rent-A-Center, Inc., Class A | | | 6,223 | | | | 274,870 | |
| Revolve Group, Inc.(a) | | | 5,800 | | | | 441,786 | |
| RH(a) | | | 536 | | | | 312,585 | |
| Service Corp. International | | | 6,015 | | | | 397,952 | |
| Shoe Carnival, Inc. | | | 10,871 | | | | 425,056 | |
| Shutterstock, Inc. | | | 3,313 | | | | 377,715 | |
| Signet Jewelers, Ltd. | | | 4,805 | | | | 466,758 | |
| Skechers U.S.A., Inc., Class A(a) | | | 8,032 | | | | 360,797 | |
| Skyline Champion Corp.(a) | | | 5,877 | | | | 459,875 | |
| Smith & Wesson Brands, Inc. | | | 17,953 | | | | 408,431 | |
| Sonos, Inc.(a)(b) | | | 10,245 | | | | 324,254 | |
| Standard Motor Products, Inc. | | | 9,021 | | | | 451,411 | |
| Stride, Inc.(a) | | | 10,977 | | | | 374,645 | |
| Sturm Ruger & Co., Inc. | | | 5,105 | | | | 365,978 | |
| Target Corp. | | | 1,530 | | | | 373,075 | |
| Tempur Sealy International, Inc. | | | 7,824 | | | | 335,180 | |
| TopBuild Corp.(a) | | | 1,695 | | | | 457,294 | |
| TRI Pointe Group, Inc.(a) | | | 16,928 | | | | 422,692 | |
| Ulta Beauty, Inc.(a) | | | 992 | | | | 380,878 | |
| Vista Outdoor, Inc.(a) | | | 8,991 | | | | 392,637 | |
| Whirlpool Corp. | | | 1,714 | | | | 373,206 | |
| Williams-Sonoma, Inc. | | | 2,079 | | | | 405,072 | |
| Winnebago Industries, Inc. | | | 5,362 | | | | 387,244 | |
| XPEL, Inc.(a)(c) | | | 4,571 | | | | 328,609 | |
| YETI Holdings, Inc.(a) | | | 3,724 | | | | 343,204 | |
| Zumiez, Inc.(a) | | | 9,875 | | | | 451,880 | |
| Total Consumer Discretionary | | | | | | | 30,343,533 | |
| | | | | | | | | |
| Consumer Staples (4.64%) | | | | | | | | |
| Altria Group, Inc. | | | 7,668 | | | | 326,963 | |
| Archer-Daniels-Midland Co. | | | 6,142 | | | | 382,094 | |
| Bunge, Ltd. | | | 4,817 | | | | 417,008 | |
| Central Garden & Pet Co.(a) | | | 8,367 | | | | 403,122 | |
| Coca-Cola Co. | | | 6,660 | | | | 349,317 | |
| Darling Ingredients, Inc.(a) | | | 5,010 | | | | 338,275 | |
| Estee Lauder Cos., Inc., Class A | | | 1,120 | | | | 371,918 | |
| Hershey Co. | | | 2,124 | | | | 376,989 | |
| Barron’s 400SM ETF | |
| Schedule of Investments | November 30, 2021 |
| Security Description | | Shares | | | Value | |
| Consumer Staples (continued) | | | | | | | | |
| Ingles Markets, Inc., Class A | | | 5,714 | | | $ | 438,721 | |
| Inter Parfums, Inc. | | | 5,343 | | | | 469,276 | |
| Medifast, Inc. | | | 1,692 | | | | 348,112 | |
| MGP Ingredients, Inc.(b) | | | 5,888 | | | | 459,146 | |
| Monster Beverage Corp.(a) | | | 3,905 | | | | 327,161 | |
| PepsiCo, Inc. | | | 2,390 | | | | 381,874 | |
| Procter & Gamble Co. | | | 2,551 | | | | 368,824 | |
| Sanderson Farms, Inc. | | | 1,978 | | | | 371,429 | |
| Turning Point Brands, Inc.(b) | | | 7,795 | | | | 296,210 | |
| Tyson Foods, Inc., Class A | | | 4,916 | | | | 388,167 | |
| USANA Health Sciences, Inc.(a) | | | 4,205 | | | | 419,323 | |
| Total Consumer Staples | | | | | | | 7,233,929 | |
| | | | | | | | | |
| Energy (1.91%) | | | | | | | | |
| California Resources Corp. | | | 8,962 | | | | 350,145 | |
| EOG Resources, Inc. | | | 5,334 | | | | 464,058 | |
| Magnolia Oil & Gas Corp. | | | 23,341 | | | | 442,779 | |
| Oasis Petroleum, Inc. | | | 3,969 | | | | 475,883 | |
| ONEOK, Inc. | | | 6,991 | | | | 418,341 | |
| Texas Pacific Land Corp. | | | 305 | | | | 368,675 | |
| Whiting Petroleum Corp.(a) | | | 7,029 | | | | 454,706 | |
| Total Energy | | | | | | | 2,974,587 | |
| | | | | | | | | |
| Financials (19.88%) | | | | | | | | |
| 1st Source Corp. | | | 8,216 | | | | 379,990 | |
| Allegiance Bancshares, Inc. | | | 10,728 | | | | 433,733 | |
| Ameris Bancorp | | | 7,944 | | | | 386,635 | |
| Apollo Global Management, Inc. | | | 6,078 | | | | 430,201 | |
| Artisan Partners Asset Management, Inc., Class A | | | 7,332 | | | | 327,960 | |
| Athene Holding, Ltd., Class A(a) | | | 5,418 | | | | 443,843 | |
| Atlantic Capital Bancshares, Inc.(a) | | | 16,105 | | | | 449,974 | |
| Atlanticus Holdings Corp.(a) | | | 7,236 | | | | 430,035 | |
| Bancorp, Inc.(a) | | | 16,338 | | | | 461,875 | |
| Bank OZK | | | 9,064 | | | | 405,251 | |
| Banner Corp. | | | 7,192 | | | | 411,958 | |
| BOK Financial Corp. | | | 4,443 | | | | 458,562 | |
| Byline Bancorp, Inc. | | | 16,176 | | | | 420,091 | |
| Cadence Bank | | | 13,069 | | | | 381,876 | |
| Capital One Financial Corp. | | | 2,402 | | | | 337,553 | |
| Cathay General Bancorp | | | 9,330 | | | | 391,020 | |
| Central Pacific Financial Corp. | | | 15,776 | | | | 422,324 | |
| Cohen & Steers, Inc. | | | 4,354 | | | | 390,859 | |
| Credit Acceptance Corp.(a) | | | 610 | | | | 381,189 | |
| Enterprise Financial Services Corp. | | | 8,605 | | | | 399,014 | |
| Evercore, Inc., Class A | | | 2,680 | | | | 371,716 | |
| FactSet Research Systems, Inc. | | | 967 | | | | 453,107 | |
| FB Financial Corp. | | | 9,106 | | | | 390,647 | |
| Fidelity National Financial, Inc., Class A | | | 7,998 | | | | 391,182 | |
| First BanCorp/Puerto Rico | | | 30,453 | | | | 404,720 | |
| First Bancorp/Southern Pines NC | | | 9,534 | | | | 423,691 | |
| First Busey Corp. | | | 16,354 | | | | 420,298 | |
| First Foundation, Inc. | | | 15,095 | | | | 383,715 | |
| Security Description | | Shares | | | Value | |
| Financials (continued) | | | | | | | | |
| First Horizon Corp. | | | 24,450 | | | $ | 394,379 | |
| First Merchants Corp. | | | 9,574 | | | | 381,907 | |
| Flagstar Bancorp, Inc. | | | 7,469 | | | | 347,607 | |
| Glacier Bancorp, Inc. | | | 7,427 | | | | 403,286 | |
| Heartland Financial USA, Inc. | | | 8,009 | | | | 380,428 | |
| Houlihan Lokey, Inc. | | | 4,163 | | | | 451,852 | |
| Independent Bank Corp. | | | 18,628 | | | | 420,061 | |
| Independent Bank Group, Inc. | | | 5,677 | | | | 394,154 | |
| Investors Bancorp, Inc. | | | 26,742 | | | | 398,188 | |
| Jefferies Financial Group, Inc. | | | 10,119 | | | | 380,272 | |
| KeyCorp | | | 18,005 | | | | 404,032 | |
| Lakeland Bancorp, Inc. | | | 22,685 | | | | 405,835 | |
| Lazard, Ltd., Class A | | | 7,944 | | | | 338,573 | |
| Live Oak Bancshares, Inc. | | | 6,730 | | | | 599,643 | |
| Merchants Bancorp | | | 10,277 | | | | 468,734 | |
| Meta Financial Group, Inc. | | | 7,368 | | | | 440,385 | |
| Metropolitan Bank Holding Corp.(a) | | | 4,883 | | | | 463,543 | |
| Moelis & Co., Class A | | | 6,014 | | | | 368,718 | |
| National Bank Holdings Corp., Class A | | | 10,609 | | | | 452,156 | |
| NBT Bancorp, Inc. | | | 10,999 | | | | 397,174 | |
| Nicolet Bankshares, Inc.(a) | | | 5,208 | | | | 371,382 | |
| OFG Bancorp | | | 16,456 | | | | 396,590 | |
| Old National Bancorp | | | 23,550 | | | | 415,893 | |
| Pacific Premier Bancorp, Inc. | | | 9,929 | | | | 384,749 | |
| Peoples Bancorp, Inc. | | | 12,294 | | | | 379,147 | |
| Piper Sandler Cos. | | | 2,761 | | | | 457,636 | |
| Popular, Inc. | | | 5,137 | | | | 399,761 | |
| Preferred Bank | | | 6,118 | | | | 416,942 | |
| Premier Financial Corp. | | | 12,789 | | | | 375,997 | |
| Prosperity Bancshares, Inc. | | | 5,658 | | | | 403,302 | |
| Provident Financial Services, Inc. | | | 16,790 | | | | 395,237 | |
| QCR Holdings, Inc. | | | 7,413 | | | | 399,857 | |
| Regional Management Corp. | | | 6,110 | | | | 345,582 | |
| ServisFirst Bancshares, Inc. | | | 5,223 | | | | 419,877 | |
| SVB Financial Group(a) | | | 633 | | | | 438,245 | |
| Synovus Financial Corp. | | | 9,413 | | | | 426,315 | |
| T Rowe Price Group, Inc. | | | 1,741 | | | | 348,113 | |
| Tompkins Financial Corp. | | | 4,907 | | | | 383,531 | |
| Triumph Bancorp, Inc.(a) | | | 4,547 | | | | 579,060 | |
| UMB Financial Corp. | | | 4,206 | | | | 423,039 | |
| United Community Banks, Inc. | | | 13,106 | | | | 449,143 | |
| Univest Financial Corp. | | | 14,260 | | | | 393,148 | |
| Upstart Holdings, Inc.(a) | | | 1,379 | | | | 282,543 | |
| Victory Capital Holdings, Inc., Class A | | | 10,921 | | | | 382,890 | |
| WesBanco, Inc. | | | 11,972 | | | | 389,689 | |
| Western Alliance Bancorp | | | 3,790 | | | | 416,066 | |
| Wintrust Financial Corp. | | | 5,070 | | | | 443,777 | |
| Zions Bancorp NA | | | 6,522 | | | | 411,408 | |
| Total Financials | | | | | | | 31,002,865 | |
| | | | | | | | | |
| Health Care (12.45%) | | | | | | | | |
| Abbott Laboratories | | | 2,918 | | | | 366,997 | |
| AbbVie, Inc. | | | 3,483 | | | | 401,520 | |
| Agilent Technologies, Inc. | | | 2,152 | | | | 324,737 | |
| Barron’s 400SM ETF | |
| Schedule of Investments | November 30, 2021 |
| Security Description | | Shares | | | Value | |
| Health Care (continued) | | | | | | | | |
| Align Technology, Inc.(a) | | | 524 | | | $ | 320,442 | |
| Antares Pharma, Inc.(a) | | | 102,178 | | | | 330,035 | |
| Avantor, Inc.(a) | | | 8,828 | | | | 348,529 | |
| Becton Dickinson and Co. | | | 1,423 | | | | 337,450 | |
| BioDelivery Sciences International, Inc.(a) | | | 85,462 | | | | 237,584 | |
| BioMarin Pharmaceutical, Inc.(a) | | | 4,870 | | | | 420,232 | |
| Bio-Rad Laboratories, Inc., | | | | | | | | |
| Class A(a) | | | 462 | | | | 347,978 | |
| Blueprint Medicines Corp.(a) | | | 3,707 | | | | 356,613 | |
| Bruker Corp. | | | 4,318 | | | | 349,715 | |
| Catalyst Pharmaceuticals, Inc.(a) | | | 75,695 | | | | 529,865 | |
| Charles River Laboratories International, Inc.(a) | | | 851 | | | | 311,355 | |
| Co.-Diagnostics, Inc.(a) | | | 38,277 | | | | 368,990 | |
| Cooper Cos, Inc. | | | 839 | | | | 315,858 | |
| Danaher Corp. | | | 1,143 | | | | 367,635 | |
| DaVita, Inc.(a) | | | 3,031 | | | | 286,430 | |
| Dexcom, Inc.(a) | | | 684 | | | | 384,812 | |
| Edwards Lifesciences Corp.(a) | | | 3,067 | | | | 329,120 | |
| Eli Lilly & Co. | | | 1,591 | | | | 394,632 | |
| Fulgent Genetics, Inc.(a)(b) | | | 4,288 | | | | 401,014 | |
| Gilead Sciences, Inc. | | | 5,265 | | | | 362,916 | |
| Globus Medical, Inc., Class A(a) | | | 4,621 | | | | 289,367 | |
| Halozyme Therapeutics, Inc.(a) | | | 8,959 | | | | 294,572 | |
| HCA Healthcare, Inc. | | | 1,457 | | | | 328,685 | |
| Henry Schein, Inc.(a) | | | 4,727 | | | | 335,901 | |
| Hologic, Inc.(a) | | | 4,753 | | | | 355,192 | |
| IDEXX Laboratories, Inc.(a) | | | 561 | | | | 341,127 | |
| Innoviva, Inc.(a) | | | 24,595 | | | | 411,228 | |
| Intuitive Surgical, Inc.(a) | | | 1,069 | | | | 346,719 | |
| Ironwood Pharmaceuticals, Inc.(a) | | | 31,115 | | | | 345,065 | |
| Johnson & Johnson | | | 2,251 | | | | 350,998 | |
| Laboratory Corp. of America Holdings(a) | | | 1,250 | | | | 356,663 | |
| LeMaitre Vascular, Inc. | | | 6,469 | | | | 302,685 | |
| Maravai LifeSciences Holdings, Inc.(a) | | | 7,939 | | | | 364,718 | |
| Medpace Holdings, Inc.(a) | | | 2,047 | | | | 424,568 | |
| Mettler-Toledo International, Inc.(a) | | | 237 | | | | 358,849 | |
| Moderna, Inc.(a) | | | 867 | | | | 305,557 | |
| Organogenesis Holdings, Inc.(a) | | | 25,457 | | | | 256,097 | |
| PerkinElmer, Inc. | | | 2,022 | | | | 368,328 | |
| Pfizer, Inc. | | | 8,295 | | | | 445,690 | |
| Premier, Inc., Class A | | | 9,344 | | | | 346,382 | |
| Quest Diagnostics, Inc. | | | 2,395 | | | | 356,089 | |
| Regeneron Pharmaceuticals, Inc.(a) | | | 575 | | | | 366,005 | |
| Repligen Corp.(a) | | | 1,260 | | | | 360,990 | |
| Seagen, Inc.(a) | | | 2,465 | | | | 394,400 | |
| Stryker Corp. | | | 1,346 | | | | 318,504 | |
| Thermo Fisher Scientific, Inc. | | | 660 | | | | 417,668 | |
| Universal Health Services, Inc., Class B | | | 2,525 | | | | 299,793 | |
| Security Description | | Shares | | | Value | |
| Health Care (continued) | | | | | | | | |
| Veeva Systems, Inc., Class A(a) | | | 1,239 | | | $ | 350,117 | |
| Vertex Pharmaceuticals, Inc.(a) | | | 1,969 | | | | 368,085 | |
| Waters Corp.(a) | | | 905 | | | | 296,903 | |
| West Pharmaceutical Services, Inc. | | | 820 | | | | 362,981 | |
| Zoetis, Inc. | | | 1,821 | | | | 404,335 | |
| Total Health Care | | | | | | | 19,418,720 | |
| | | | | | | | | |
| Industrials (15.28%) | | | | | | | | |
| 3M Co. | | | 2,032 | | | | 345,521 | |
| AGCO Corp. | | | 2,901 | | | | 319,719 | |
| AMERCO | | | 563 | | | | 396,667 | |
| AO Smith Corp. | | | 5,427 | | | | 429,004 | |
| Atkore, Inc.(a) | | | 4,263 | | | | 454,009 | |
| Atlas Air Worldwide Holdings, Inc.(a) | | | 4,922 | | | | 431,216 | |
| BlueLinx Holdings, Inc.(a) | | | 7,250 | | | | 511,415 | |
| Boise Cascade Co. | | | 6,879 | | | | 445,966 | |
| Builders FirstSource, Inc.(a) | | | 7,090 | | | | 492,330 | |
| Carrier Global Corp. | | | 6,745 | | | | 365,039 | |
| Caterpillar, Inc. | | | 1,832 | | | | 354,217 | |
| Copart, Inc.(a) | | | 2,565 | | | | 372,335 | |
| CSW Industrials, Inc. | | | 2,957 | | | | 355,431 | |
| CSX Corp. | | | 12,161 | | | | 421,500 | |
| Cummins, Inc. | | | 1,599 | | | | 335,390 | |
| Deere & Co. | | | 1,041 | | | | 359,707 | |
| Dover Corp. | | | 2,220 | | | | 363,747 | |
| Emerson Electric Co. | | | 3,798 | | | | 333,616 | |
| Encore Wire Corp. | | | 4,439 | | | | 623,502 | |
| Equifax, Inc. | | | 1,355 | | | | 377,571 | |
| Expeditors International of Washington, Inc. | | | 2,891 | | | | 351,603 | |
| Exponent, Inc. | | | 3,252 | | | | 378,858 | |
| Fastenal Co. | | | 6,993 | | | | 413,776 | |
| FedEx Corp. | | | 1,454 | | | | 334,958 | |
| Fortune Brands Home & Security, Inc. | | | 3,856 | | | | 387,644 | |
| Generac Holdings, Inc.(a) | | | 856 | | | | 360,581 | |
| Graco, Inc. | | | 4,875 | | | | 355,339 | |
| Helios Technologies, Inc. | | | 4,371 | | | | 438,542 | |
| Illinois Tool Works, Inc. | | | 1,708 | | | | 396,512 | |
| Insteel Industries, Inc. | | | 10,615 | | | | 447,528 | |
| JB Hunt Transport Services, Inc. | | | 2,205 | | | | 421,508 | |
| Kadant, Inc. | | | 1,763 | | | | 413,353 | |
| L3Harris Technologies, Inc. | | | 1,633 | | | | 341,428 | |
| Landstar System, Inc. | | | 2,326 | | | | 392,047 | |
| Lennox International, Inc. | | | 1,184 | | | | 365,880 | |
| Lincoln Electric Holdings, Inc. | | | 2,822 | | | | 380,857 | |
| Matson, Inc. | | | 4,432 | | | | 361,341 | |
| MillerKnoll, Inc. | | | 9,158 | | | | 347,455 | |
| Mueller Industries, Inc. | | | 8,811 | | | | 487,513 | |
| Norfolk Southern Corp. | | | 1,514 | | | | 401,619 | |
| Northrop Grumman Corp. | | | 1,055 | | | | 367,984 | |
| Old Dominion Freight Line, Inc. | | | 1,285 | | | | 456,393 | |
| Owens Corning | | | 3,965 | | | | 336,391 | |
| Parker-Hannifin Corp. | | | 1,298 | | | | 392,074 | |
| Robert Half International, Inc. | | | 3,642 | | | | 404,881 | |
| Barron’s 400SM ETF | |
| Schedule of Investments | November 30, 2021 |
| Security Description | | Shares | | | Value | |
| Industrials (continued) | | | | | | | | |
| Rockwell Automation, Inc. | | | 1,184 | | | $ | 398,061 | |
| Saia, Inc.(a) | | | 1,540 | | | | 510,017 | |
| Simpson Manufacturing Co., Inc. | | | 3,450 | | | | 397,992 | |
| Snap-on, Inc. | | | 1,716 | | | | 353,342 | |
| Stanley Black & Decker, Inc. | | | 2,032 | | | | 355,112 | |
| Textainer Group Holdings, Ltd. | | | 11,612 | | | | 379,364 | |
| Textron, Inc. | | | 5,310 | | | | 375,948 | |
| Toro Co. | | | 3,542 | | | | 356,184 | |
| TransUnion | | | 3,116 | | | | 346,468 | |
| Trex Co., Inc.(a) | | | 3,450 | | | | 458,057 | |
| UFP Industries, Inc. | | | 5,357 | | | | 446,131 | |
| Union Pacific Corp. | | | 1,823 | | | | 429,572 | |
| United Parcel Service, Inc., Class B | | | 1,940 | | | | 384,838 | |
| Watsco, Inc. | | | 1,336 | | | | 391,061 | |
| WW Grainger, Inc. | | | 904 | | | | 435,195 | |
| Total Industrials | | | | | | | 23,841,309 | |
| | | | | | | | | |
| Information Technology (16.37%) | | | | | | | | |
| Adobe, Inc.(a) | | | 575 | | | | 385,164 | |
| Advanced Micro Devices, Inc.(a) | | | 3,507 | | | | 555,404 | |
| Akamai Technologies, Inc.(a) | | | 3,313 | | | | 373,375 | |
| Amkor Technology, Inc. | | | 12,879 | | | | 277,671 | |
| Amphenol Corp., Class A | | | 4,897 | | | | 394,600 | |
| Analog Devices, Inc. | | | 2,136 | | | | 385,014 | |
| Apple, Inc. | | | 2,503 | | | | 413,746 | |
| Applied Materials, Inc. | | | 2,645 | | | | 389,317 | |
| Arista Networks, Inc.(a) | | | 4,140 | | | | 513,608 | |
| Automatic Data Processing, Inc. | | | 1,857 | | | | 428,763 | |
| Broadcom, Inc. | | | 738 | | | | 408,616 | |
| Broadridge Financial Solutions, Inc. | | | 2,186 | | | | 368,494 | |
| Cadence Design Systems, Inc.(a) | | | 2,247 | | | | 398,753 | |
| Calix, Inc.(a) | | | 8,044 | | | | 538,626 | |
| CDW Corp. | | | 1,916 | | | | 362,814 | |
| Cisco Systems, Inc. | | | 6,409 | | | | 351,470 | |
| Clearfield, Inc.(a) | | | 8,393 | | | | 543,363 | |
| Cognex Corp. | | | 4,212 | | | | 325,377 | |
| Cognizant Technology Solutions Corp., Class A | | | 4,900 | | | | 382,102 | |
| Corning, Inc. | | | 9,694 | | | | 359,550 | |
| Diodes, Inc.(a) | | | 3,844 | | | | 408,809 | |
| EMCORE Corp.(a) | | | 52,093 | | | | 383,925 | |
| Enphase Energy, Inc.(a) | | | 2,347 | | | | 586,750 | |
| Entegris, Inc. | | | 2,896 | | | | 423,048 | |
| EPAM Systems, Inc.(a) | | | 595 | | | | 362,087 | |
| EVERTEC, Inc. | | | 8,112 | | | | 340,623 | |
| ExlService Holdings, Inc.(a) | | | 2,992 | | | | 388,571 | |
| Fair Isaac Corp.(a) | | | 843 | | | | 297,689 | |
| FleetCor Technologies, Inc.(a) | | | 1,451 | | | | 300,546 | |
| Fortinet, Inc.(a) | | | 1,233 | | | | 409,492 | |
| Gartner, Inc.(a) | | | 1,194 | | | | 372,826 | |
| Intuit, Inc. | | | 653 | | | | 425,952 | |
| Keysight Technologies, Inc.(a) | | | 2,082 | | | | 404,907 | |
| KLA Corp. | | | 1,039 | | | | 424,047 | |
| Lam Research Corp. | | | 614 | | | | 417,428 | |
| Security Description | | Shares | | | Value | |
| Information Technology (continued) | | | | | | | | |
| Littelfuse, Inc. | | | 1,408 | | | $ | 420,260 | |
| Manhattan Associates, Inc.(a) | | | 2,283 | | | | 356,513 | |
| Microsoft Corp. | | | 1,236 | | | | 408,609 | |
| Monolithic Power Systems, | | | | | | | | |
| Inc. | | | 747 | | | | 413,435 | |
| Motorola Solutions, Inc. | | | 1,539 | | | | 389,644 | |
| NetApp, Inc. | | | 4,022 | | | | 357,475 | |
| NVIDIA Corp. | | | 1,668 | | | | 545,036 | |
| ON Semiconductor Corp.(a) | | | 7,752 | | | | 476,205 | |
| Onto Innovation, Inc.(a) | | | 4,663 | | | | 439,068 | |
| Oracle Corp. | | | 4,293 | | | | 389,547 | |
| Paychex, Inc. | | | 3,382 | | | | 403,134 | |
| Paycom Software, Inc.(a) | | | 792 | | | | 346,484 | |
| Power Integrations, Inc. | | | 3,422 | | | | 342,303 | |
| Qorvo, Inc.(a) | | | 2,035 | | | | 297,578 | |
| QUALCOMM, Inc. | | | 2,627 | | | | 474,331 | |
| Skyworks Solutions, Inc. | | | 2,082 | | | | 315,756 | |
| SS&C Technologies Holdings, | | | | | | | | |
| Inc. | | | 5,199 | | | | 396,840 | |
| Teradyne, Inc. | | | 3,031 | | | | 463,349 | |
| Texas Instruments, Inc. | | | 1,900 | | | | 365,503 | |
| Trade Desk, Inc., Class A(a) | | | 5,235 | | | | 541,404 | |
| Trimble, Inc.(a) | | | 4,062 | | | | 348,804 | |
| TTEC Holdings, Inc. | | | 3,799 | | | | 320,598 | |
| Turtle Beach Corp.(a) | | | 12,236 | | | | 327,925 | |
| Ubiquiti, Inc. | | | 1,198 | | | | 358,549 | |
| Vishay Intertechnology, Inc. | | | 17,822 | | | | 363,034 | |
| VMware, Inc., Class A | | | 2,651 | | | | 309,478 | |
| Xilinx, Inc. | | | 2,384 | | | | 544,625 | |
| Xperi Corp. | | | 18,722 | | | | 335,498 | |
| Zebra Technologies Corp., | | | | | | | | |
| Class A(a) | | | 642 | | | | 377,997 | |
| Total Information Technology | | | | | | | 25,531,509 | |
| | | | | | | | | |
| Materials (5.46%) | | | | | | | | |
| Air Products and Chemicals, Inc. | | | 1,379 | | | | 396,380 | |
| Avery Dennison Corp. | | | 1,672 | | | | 342,877 | |
| Ball Corp. | | | 4,003 | | | | 374,080 | |
| Celanese Corp. | | | 2,477 | | | | 374,919 | |
| Cliffs Natural Resources, Inc.(a) | | | 16,805 | | | | 341,982 | |
| Crown Holdings, Inc. | | | 3,512 | | | | 371,570 | |
| Dow Chemical Co. | | | 6,217 | | | | 341,500 | |
| Eagle Materials, Inc. | | | 2,583 | | | | 398,350 | |
| Freeport-McMoRan, Inc. | | | 10,662 | | | | 395,347 | |
| Ingevity Corp.(a) | | | 5,020 | | | | 360,988 | |
| Louisiana-Pacific Corp. | | | 6,144 | | | | 401,510 | |
| Mosaic Co. | | | 11,576 | | | | 396,131 | |
| NewMarket Corp. | | | 1,144 | | | | 379,007 | |
| Newmont Corp. | | | 6,484 | | | | 356,101 | |
| Nucor Corp. | | | 3,492 | | | | 371,060 | |
| Packaging Corp. of America | | | 2,501 | | | | 326,606 | |
| PPG Industries, Inc. | | | 2,467 | | | | 380,337 | |
| Royal Gold, Inc. | | | 3,394 | | | | 339,502 | |
| Sherwin-Williams Co. | | | 1,240 | | | | 410,738 | |
| Southern Copper Corp. | | | 6,103 | | | | 357,025 | |
| Steel Dynamics, Inc. | | | 5,985 | | | | 357,903 | |
| Tronox Holdings PLC | | | 15,505 | | | | 340,955 | |
| Barron’s 400SM ETF | |
| Schedule of Investments | November 30, 2021 |
| Security Description | | Shares | | | Value | |
| Materials (continued) | | | | | | | | |
| Valvoline, Inc. | | | 11,590 | | | $ | 394,871 | |
| Total Materials | | | | | | | 8,509,739 | |
| | | | | | | | | |
| Utilities (0.19%) | | | | | | | | |
| NRG Energy, Inc. | | | 8,451 | | | | 304,405 | |
| | | | | | | | | |
| TOTAL COMMON STOCKS | | | | | | | | |
| (Cost $123,887,806) | | | | | | | 154,317,957 | |
| Security Description | | Shares | | | Value | |
| LIMITED PARTNERSHIPS (0.78%) | | | | | | | | |
| Energy (0.51%) | | | | | | | | |
| KKR & Co., LP | | | 5,852 | | | | 435,681 | |
| Magellan Midstream Partners LP | | | 7,784 | | | | 361,022 | |
| Total Energy | | | | | | | 796,703 | |
| | | | | | | | | |
| Financials (0.27%) | | | | | | | | |
| Carlyle Group, Inc. | | | 7,552 | | | | 413,019 | |
| | | | | | | | | |
| TOTAL LIMITED PARTNERSHIPS | | | | | | | | |
| (Cost $1,146,784) | | | | | | | 1,209,722 | |
| | | 7 Day Yield | | | Shares | | | Value | |
| SHORT TERM INVESTMENTS (0.69%) | | | | | | | | | | | | |
| Money Market Fund (0.19%) | | | | | | | | | | | | |
| State Street Institutional Treasury Plus Money Market Fund | | | | | | | | | | | | |
| (Cost $295,893) | | | 0.01 | % | | | 295,893 | | | | 295,893 | |
| | | | | | | | | | | | | |
| Investments Purchased with Collateral from Securities Loaned (0.50%) | | | | | | | | | | | | |
| State Street Navigator Securities Lending Government Money Market Portfolio, 0.03% | | | | | | | | | | | | |
| (Cost $784,121) | | | | | | | 784,121 | | | | 784,121 | |
| TOTAL SHORT TERM INVESTMENTS | | | | | | | | |
| (Cost $1,080,014) | | | | | | | | | | | 1,080,014 | |
| | | | | | | | | | | | | |
| TOTAL INVESTMENTS (100.41%) | | | | | | | | | |
| (Cost $126,114,604) | | | | | | | $ | 156,607,693 | |
| LIABILITIES IN EXCESS OF OTHER ASSETS (-0.41%) | | | | | | | | (639,424 | ) |
| NET ASSETS - 100.00% | | | | $ | 155,968,269 | |
| (a) | Non-income producing security. |
| (b) | Security, or a portion of the security position is currently on loan. The total market value of securities on loan is $1,514,525. |
| (c) | Securities were purchased pursuant to Regulation S under the Securities Act of 1933, which exempts securities offered and sold outside of the United States from registration. Such securities cannot be sold in the United States without either an effective registration statement filed pursuant to the Securities Act of 1933, or pursuant to an exemption from registration. As of November 30, 2021, the market value of those securities was $328,609 representing 0.21% of net assets. |
See Notes to Financial Statements.
| Barron’s 400SM ETF | |
| Statement of Assets and Liabilities | November 30, 2021 |
| ASSETS: | | | |
| Investments, at value | | $ | 156,607,693 | |
| Dividends receivable | | | 231,549 | |
| Total Assets | | | 156,839,242 | |
| | | | | |
| LIABILITIES: | | | | |
| Payable to adviser | | | 86,852 | |
| Payable for collateral upon return of securities loaned | | | 784,121 | |
| Total Liabilities | | | 870,973 | |
| NET ASSETS | | $ | 155,968,269 | |
| | | | | |
| NET ASSETS CONSIST OF: | | | | |
| Paid-in capital | | $ | 179,908,086 | |
| Total distributable earnings | | | (23,939,817 | ) |
| NET ASSETS | | $ | 155,968,269 | |
| | | | | |
| INVESTMENTS, AT COST | | $ | 126,114,604 | |
| | | | | |
| PRICING OF SHARES | | | | |
| Net Assets | | $ | 155,968,269 | |
| Shares of beneficial interest outstanding (Unlimited number of shares authorized, par value $0.01 per share) | | | 2,500,000 | |
| Net Asset Value, offering and redemption price per share | | $ | 62.39 | |
See Notes to Financial Statements.
| Barron’s 400SM ETF | |
| Statement of Operations | For the Year Ended November 30, 2021 |
| INVESTMENT INCOME: | | | |
| Dividends(a) | | $ | 2,164,072 | |
| Securities Lending Income | | | 14,858 | |
| Total Investment Income | | | 2,178,930 | |
| | | | | |
| EXPENSES: | | | | |
| Investment adviser fees | | | 914,299 | |
| Net Expenses | | | 914,299 | |
| NET INVESTMENT INCOME | | | 1,264,631 | |
| | | | | |
| REALIZED AND UNREALIZED GAIN: | | | | |
| Net realized gain on investments(b) | | | 35,081,287 | |
| Net change in unrealized appreciation/depreciation on investments | | | 2,133,972 | |
| NET REALIZED AND UNREALIZED GAIN ON INVESTMENTS | | | 37,215,259 | |
| NET INCREASE IN NET ASSETS RESULTING FROM OPERATIONS | | $ | 38,479,890 | |
| (a) | Net of foreign tax withholding of $925. |
| (b) | Includes realized gain or loss as a result of in-kind transactions (See Note 4 in Notes to Financial Statements). |
See Notes to Financial Statements.
| Barron’s 400SM ETF |
| Statements of Changes in Net Assets |
| | | For the Year Ended November 30, 2021 | | | For the Year Ended November 30, 2020 | |
| OPERATIONS: | | | | | | | | |
| Net investment income | | $ | 1,264,631 | | | $ | 1,259,107 | |
| Net realized gain/(loss) | | | 35,081,287 | | | | (6,883,800 | ) |
| Net change in unrealized appreciation/depreciation | | | 2,133,972 | | | | 14,975,635 | |
| Net increase in net assets resulting from operations | | | 38,479,890 | | | | 9,350,942 | |
| | | | | | | | | |
| DISTRIBUTIONS TO SHAREHOLDERS: | | | | | | | | |
| From distributable earnings | | | (1,258,708 | ) | | | (1,017,716 | ) |
| Total distributions | | | (1,258,708 | ) | | | (1,017,716 | ) |
| | | | | | | | | |
| CAPITAL SHARE TRANSACTIONS: | | | | | | | | |
| Proceeds from sale of shares | | | 94,843,165 | | | | – | |
| Cost of shares redeemed | | | (94,389,197 | ) | | | (37,189,939 | ) |
| Net increase/(decrease) from capital share transactions | | | 453,968 | | | | (37,189,939 | ) |
| Net increase/(decrease) in net assets | | | 37,675,150 | | | | (28,856,713 | ) |
| | | | | | | | | |
| NET ASSETS: | | | | | | | | |
| Beginning of year | | | 118,293,119 | | | | 147,149,832 | |
| End of year | | $ | 155,968,269 | | | $ | 118,293,119 | |
| | | | | | | | | |
| OTHER INFORMATION: | | | | | | | | |
| CAPITAL SHARE TRANSACTIONS: | | | | | | | | |
| Beginning shares | | | 2,500,000 | | | | 3,500,000 | |
| Shares sold | | | 1,650,000 | | | | – | |
| Shares redeemed | | | (1,650,000 | ) | | | (1,000,000 | ) |
| Shares outstanding, end of period | | | 2,500,000 | | | | 2,500,000 | |
See Notes to Financial Statements.
| Barron’s 400SM ETF | |
| Financial Highlights | For a Share Outstanding Throughout the Periods Presented |
| | | For the Year Ended November 30, 2021 | | | For the Year Ended November 30, 2020 | | | For the Year Ended November 30, 2019 | | | For the Year Ended November 30, 2018 | | | For the Year Ended November 30, 2017 | |
| NET ASSET VALUE, BEGINNING OF PERIOD | | $ | 47.32 | | | $ | 42.04 | | | $ | 40.42 | | | $ | 41.54 | | | $ | 34.35 | |
| | | | | | | | | | | | | | | | | | | | | |
| INCOME FROM OPERATIONS: | | | | | | | | | | | | | | | | | | | | |
| Net investment income(a) | | | 0.52 | | | | 0.43 | | | | 0.44 | | | | 0.40 | | | | 0.29 | |
| Net realized and unrealized gain/(loss) | | | 15.05 | | | | 5.14 | | | | 1.51 | | | | (1.27 | ) | | | 7.17 | |
| Total from investment operations | | | 15.57 | | | | 5.57 | | | | 1.95 | | | | (0.87 | ) | | | 7.46 | |
| | | | | | | | | | | | | | | | | | | | | |
| DISTRIBUTIONS: | | | | | | | | | | | | | | | | | | | | |
| From net investment income | | | (0.50 | ) | | | (0.29 | ) | | | (0.33 | ) | | | (0.25 | ) | | | (0.27 | ) |
| Total distributions | | | (0.50 | ) | | | (0.29 | ) | | | (0.33 | ) | | | (0.25 | ) | | | (0.27 | ) |
| | | | | | | | | | | | | | | | | | | | | |
| NET INCREASE/(DECREASE) IN NET ASSET VALUE | | | 15.07 | | | | 5.28 | | | | 1.62 | | | | (1.12 | ) | | | 7.19 | |
| NET ASSET VALUE, END OF PERIOD | | $ | 62.39 | | | $ | 47.32 | | | $ | 42.04 | | | $ | 40.42 | | | $ | 41.54 | |
| TOTAL RETURN(b) | | | 33.18 | % | | | 13.33 | % | | | 5.00 | % | | | (2.12 | )% | | | 21.87 | % |
| | | | | | | | | | | | | | | | | | | | | |
| RATIOS/SUPPLEMENTAL DATA: | | | | | | | | | | | | | | | | | | | | |
| Net assets, end of period (in 000s) | | $ | 155,968 | | | $ | 118,293 | | | $ | 147,150 | | | $ | 163,708 | | | $ | 205,601 | |
| | | | | | | | | | | | | | | | | | | | | |
| RATIOS TO AVERAGE NET ASSETS | | | | | | | | | | | | | | | | | | | | |
| Ratio of expenses to average net assets | | | 0.65 | % | | | 0.65 | % | | | 0.65 | % | | | 0.65 | % | | | 0.65 | % |
| Ratio of net investment income to average net assets | | | 0.90 | % | | | 1.08 | % | | | 1.10 | % | | | 0.93 | % | | | 0.78 | % |
| Portfolio turnover rate(c) | | | 91 | % | | | 83 | % | | | 109 | % | | | 88 | % | | | 84 | % |
| (a) | Based on average shares outstanding during the period. |
| (b) | Total return is calculated assuming an initial investment made at the net asset value at the beginning of the period and redemption at the net asset value on the last day of the period and assuming all distributions are reinvested at the reinvestment prices. Total return calculated for a period of less than one year is not annualized. |
| (c) | Portfolio turnover for periods less than one year are not annualized and does not include securities received or delivered from processing creations or redemptions in-kind. |
See Notes to Financial Statements.
| Barron’s 400SM ETF | |
| Notes to Financial Statements | November 30, 2021 |
1. ORGANIZATION
ALPS ETF Trust (the “Trust”), a Delaware statutory trust, is an open-end management investment company registered under the Investment Company Act of 1940, as amended (the “1940 Act”). As of November 30, 2021, the Trust consisted of eighteen separate portfolios. Each portfolio represents a separate series of the Trust. This report pertains solely to the Barron’s 400SM ETF (the “Fund”). The investment objective of the Fund is to seek investment results that correspond generally, before fees and expenses, to the performance of the Barron’s 400 IndexSM (the “Underlying Index”). The Fund has elected to qualify as a diversified series of the Trust under the 1940 Act.
The Fund’s Shares (“Shares”) are listed on the NYSE Arca, Inc. (the “NYSE Arca”). The Fund issues and redeems Shares at net asset value (“NAV”) in blocks of 25,000 Shares, each of which is called a “Creation Unit”. Creation Units are issued and redeemed principally in-kind for securities included in the Underlying Index. Except when aggregated in Creation Units, Shares are not redeemable securities of the Fund. On October 1, 2021, the Fund reduced its Creation Unit size from 50,000 to 25,000 shares.
Pursuant to the Trust’s organizational documents, its Officers and Trustees are indemnified against certain liability arising out of the performance of their duties to the Trust. Additionally, in the normal course of business, the Trust enters into contracts with service providers that contain general indemnification clauses. The Trust’s maximum exposure under these arrangements is unknown, as this would involve future claims that may be made against the Trust that have not yet occurred.
2. SIGNIFICANT ACCOUNTING POLICIES
The following is a summary of significant accounting policies consistently followed by the Fund in the preparation of the financial statements. The accompanying financial statements were prepared in accordance with accounting principles generally accepted in the United States of America (“U.S. GAAP”). The preparation of financial statements in conformity with U.S. GAAP requires management to make certain estimates and assumptions that affect the reported amounts of assets and liabilities and disclosures of contingent assets and liabilities at the date of the financial statements and the reported amounts of revenue and expenses during the period. Actual results could differ from those estimates. The Fund is considered an investment company under U.S. GAAP and follows the accounting and reporting guidance applicable to investment companies in the Financial Accounting Standards Board (“FASB”) Accounting Standards Codification Topic 946.
A. Portfolio Valuation
The Fund’s NAV is determined daily, as of the close of regular trading on the New York Stock Exchange (the “NYSE”), normally 4:00 p.m. Eastern time, on each day the NYSE is open for trading. The NAV is computed by dividing the value of all assets of the Fund (including accrued interest and dividends), less all liabilities (including accrued expenses and dividends declared but unpaid), by the total number of shares outstanding.
Portfolio securities listed on any exchange other than the NASDAQ Stock Market LLC (“NASDAQ”) are valued at the last sale price on the business day as of which such value is being determined. If there has been no sale on such day, the securities are valued at the mean of the most recent bid and ask prices on such day. Securities traded on the NASDAQ are valued at the NASDAQ Official Closing Price as determined by NASDAQ. Portfolio securities traded on more than one securities exchange are valued at the last sale price on the business day as of which such value is being determined at the close of the exchange representing the principal market for such securities. Portfolio securities traded in the over-the-counter market, but excluding securities traded on the NASDAQ, are valued at the latest quoted sale price in such market.
The Fund’s investments are valued at market value or, in the absence of market value with respect to any portfolio securities, at fair value according to procedures adopted by the Trust’s Board of Trustees (the “Board”). When market quotations are not readily available or when events occur that make established valuation methods unreliable, securities of the Fund may be valued in good faith by or under the direction of the Board. These securities generally include, but are not limited to, restricted securities (securities which may not be publicly sold without registration under the Securities Act of 1933) for which a pricing service is unable to provide a market price; securities whose trading has been formally suspended; a security whose market price is not available from a pre-established primary pricing source or the pricing source is not willing to provide a price; a security with respect to which an event has occurred that is most likely to materially affect the value of the security after the market has closed but before the calculation of the Fund’s NAV or make it difficult or impossible to obtain a reliable market quotation; or a security whose price, as provided by the pricing service, does not reflect the security’s “fair value” due to the security being de-listed from a national exchange or the security’s primary trading market is temporarily closed at a time when, under normal conditions, it would be open. As a general principle, the current “fair value” of a security would be the amount which the owner might reasonably expect to receive from the sale on the applicable exchange or principal market. A variety of factors may be considered in determining the fair value of such securities.
Barron’s 400SM ETF | |
| Notes to Financial Statements | November 30, 2021 |
B. Fair Value Measurements
The Fund discloses the classification of its fair value measurements following a three-tier hierarchy based on the inputs used to measure fair value. Inputs refer broadly to the assumptions that market participants would use in pricing the asset or liability; including assumptions about risk. Inputs may be observable or unobservable. Observable inputs reflect the assumptions market participants would use in pricing the asset or liability that are developed based on market data obtained from sources independent of the reporting entity. Unobservable inputs reflect the reporting entity’s own assumptions about the assumptions market participants would use in pricing the asset or liability that are developed based on the best information available.
Valuation techniques used to value the Fund's investments by major category are as follows:
Equity securities and Limited Partnerships, including restricted securities, for which market quotations are readily available, are valued at the last reported sale price or official closing price as reported by a third party pricing vendor on the primary market or exchange on which they are traded and are categorized as Level 1 in the hierarchy. In the event there were no sales during the day or closing prices are not available, securities are valued at the mean of the most recent quoted bid and ask prices on such day and are generally categorized as Level 2 in the hierarchy. Investments in open-end mutual funds are valued at their closing NAV each business day and are categorized as Level 1 in the hierarchy.
Changes in valuation techniques may result in transfers in or out of an assigned level within the disclosure hierarchy.
Various inputs are used in determining the value of the Fund’s investments as of the end of the reporting period. When inputs used fall into different levels of the fair value hierarchy, the level in the hierarchy within which the fair value measurement falls is determined based on the lowest level input that is significant to the fair value measurement in its entirety. The designated input levels are not necessarily an indication of the risk or liquidity associated with these investments.
These inputs are categorized in the following hierarchy under applicable financial accounting standards:
| Level 1 – | Unadjusted quoted prices in active markets for identical investments, unrestricted assets or liabilities that a Fund has the ability to access at the measurement date; |
| Level 2 – | Quoted prices which are not active, quoted prices for similar assets or liabilities in active markets or inputs other than quoted prices that are observable (either directly or indirectly) for substantially the full term of the asset or liability; and |
| Level 3 – | Significant unobservable prices or inputs (including the Fund’s own assumptions in determining the fair value of investments) where there is little or no market activity for the asset or liability at the measurement date. |
The following is a summary of the inputs used to value the Fund’s investments as of November 30, 2021:
Barron's 400 ETF
| Investments in Securities at Value | | Level 1 - Quoted and Unadjusted Prices | | | Level 2 - Other Significant Observable Inputs | | | Level 3 - Significant Unobservable Inputs | | | Total | |
| Common Stocks* | | $ | 154,317,957 | | | $ | – | | | $ | – | | | $ | 154,317,957 | |
| Limited Partnerships* | | | 1,209,722 | | | | – | | | | – | | | | 1,209,722 | |
| Short Term Investments | | | 1,080,014 | | | | – | | | | – | | | | 1,080,014 | |
| Total | | $ | 156,607,693 | | | $ | – | | | $ | – | | | $ | 156,607,693 | |
| * | For a detailed sector breakdown, see the accompanying Schedule of Investments. |
The Fund did not have any securities that used significant unobservable inputs (Level 3) in determining fair value and there were no transfers into or out of Level 3 during the year ended November 30, 2021.
C. Securities Transactions and Investment Income
Securities transactions are recorded as of the trade date. Realized gains and losses from securities transactions are recorded on the specific identification in accordance with GAAP. Dividend income and capital gains distributions, if any, are recorded on the ex-dividend date. Interest income, if any, is recorded on the accrual basis.
| Barron’s 400SM ETF | |
| Notes to Financial Statements | November 30, 2021 |
D. Dividends and Distributions to Shareholders
Dividends from net investment income of the Fund, if any, are declared and paid annually or as the Board may determine from time to time. Distributions of net realized capital gains earned by the Fund, if any, are distributed at least annually.
E. Federal Tax and Tax Basis Information
The timing and character of income and capital gain distributions are determined in accordance with income tax regulations, which may differ from U.S. GAAP. Reclassifications are made to the Fund’s capital accounts for permanent tax differences to reflect income and gains available for distribution (or available capital loss carryforwards) under income tax regulations.
For the year ended November 30, 2021, the following reclassifications, which had no impact on results of operations or net assets, were recorded to reflect permanent tax differences resulting primarily from in-kind transactions:
| Fund | | Paid-in Capital | | | Total Distributable Earnings | |
| Barron’s 400SM ETF | | $ | 34,844,026 | | | $ | (34,844,026 | ) |
The tax character of the distributions paid during the fiscal year ended November 30, 2021 and November 30, 2020 was as follows:
| | | Ordinary Income | | | Long-Term Capital Gain | | | Return of Capital | |
| November 30, 2021 | | | | | | | | | | | | |
| Barron’s 400SM ETF | | $ | 1,258,708 | | | $ | – | | | $ | – | |
| | | Ordinary Income | | | Long-Term Capital Gain | | | Return of Capital | |
| November 30, 2020 | | | | | | | | | | | | |
| Barron’s 400SM ETF | | $ | 1,017,716 | | | $ | – | | | $ | – | |
The character of distributions made during the year may differ from its ultimate characterization for federal income tax purposes.
Under current law, capital losses maintain their character as short-term or long-term and are carried forward to the next tax year without expiration. As of November 30, 2021, the following amounts are available as carry forwards to the next tax year:
| Fund | | Short-Term | | | Long-Term | |
| Barron’s 400SM ETF | | $ | 37,589,993 | | | $ | 17,906,661 | |
The Barron’s 400SM ETF used capital loss carryovers during the year ended November 30, 2021 in the amount of $538,562
As of November 30, 2021, the components of distributable earnings on a tax basis for each Fund were as follows:
| | | Barron’s 400SM ETF | |
| Undistributed net investment income | | $ | 1,041,653 | |
| Accumulated net realized loss on investments | | | (55,496,654 | ) |
| Net unrealized appreciation on investments | | | 30,515,184 | |
| Total | | $ | (23,939,817 | ) |
As of November 30, 2021, the cost of investments for federal income tax purposes and accumulated net unrealized appreciation/(depreciation) on investments were as follows:
| | | Barron’s 400SM ETF | |
| Gross appreciation (excess of value over tax cost) | | $ | 34,425,103 | |
| Gross depreciation (excess of tax cost over value) | | | (3,909,919 | ) |
| Net unrealized appreciation (depreciation) | | $ | 30,515,184 | |
| Cost of investments for income tax purposes | | $ | 126,092,509 | |
The differences between book-basis and tax-basis are primarily due to the deferral of losses from wash sales and investments in partnerships.
| Barron’s 400SM ETF | |
| Notes to Financial Statements | November 30, 2021 |
F. Income Taxes
No provision for income taxes is included in the accompanying financial statements, as the Fund intends to distribute to shareholders all taxable investment income and realized gains and otherwise comply with Subchapter M of the Internal Revenue Code of 1986, as amended, applicable to regulated investment companies. The Fund evaluates tax positions taken (or expected to be taken) in the course of preparing the Fund’s tax returns to determine whether these positions meet a “more-likely-than-not” standard that, based on the technical merits, have a more than fifty percent likelihood of being sustained by a taxing authority upon examination. A tax position that meets the “more-likely-than-not” recognition threshold is measured to determine the amount of benefit to recognize in the financial statements.
As of and during the year ended November 30, 2021, the Fund did not have a liability for any unrecognized tax benefits. The Fund files U.S. federal, state, and local tax returns as required. The Fund’s tax returns are subject to examination by the relevant tax authorities until expiration of the applicable statute of limitations, which is generally three years after the filing of the tax return, but may extend to four years in certain jurisdictions. Tax returns for open years have incorporated no uncertain tax positions that require a provision for income taxes.
G. Lending of Portfolio Securities
The Fund has entered into a securities lending agreement with State Street Bank & Trust Co. (“SSB”), the Fund’s lending agent. The Fund may lend its portfolio securities only to borrowers that are approved by SSB. The Fund will limit such lending to not more than 33 1/3% of the value of its total assets. The Fund’s securities held at SSB as custodian shall be available to be lent except those securities the Fund or ALPS Advisors, Inc. specifically identifies in writing as not being available for lending. The borrower pledges and maintains with the Fund collateral consisting of cash (U.S. Dollars only), securities issued or guaranteed by the U.S. government or its agencies or instrumentalities, and cash equivalents (including irrevocable bank letters of credit) issued by a person other than the borrower or an affiliate of the borrower. The initial collateral received by the Fund is required to have a value of no less than 102% of the market value of the loaned securities for U.S equity securities and a value of no less than 105% of the market value for non-U.S. equity securities. The collateral is maintained thereafter, at a market value equal to not less than 102% of the current value of the U.S. equity securities on loan and not less than 105% of the current value of the non-U.S. equity securities on loan. The market value of the loaned securities is determined at the close of each business day and any additional required collateral is delivered to the Fund on the next business day. During the term of the loan, the Fund is entitled to all distributions made on or in respect of the loaned securities. Loans of securities are terminable at any time and the borrower, after notice, is required to return borrowed securities within the customary time period for settlement of securities transactions.
Any cash collateral received is reinvested in a money market fund managed by SSB as disclosed in the Fund’s Schedule of Investments and is reflected in the Statements of Assets and Liabilities as a payable for collateral upon return of securities loaned. Non-cash collateral, in the form of securities issued or guaranteed by the U.S. government or its agencies or instrumentalities, is not disclosed in the Fund’s Statements of Assets and Liabilities as it is held by the lending agent on behalf of the Fund, and the Fund does not have the ability to re-hypothecate these securities. Income earned by the Fund from securities lending activity is disclosed in the Statement of Operations.
The following is a summary of the Fund's securities lending agreement and related cash and non-cash collateral received as of November 30, 2021:
| | | Market Value of Securities on Loan | | | Cash Collateral Received | | | Non-Cash Collateral Received | | | Total Collateral Received | |
| Barron's 400 ETF | | $ | 1,514,525 | | | $ | 784,121 | | | $ | 805,066 | | | $ | 1,589,187 | |
The risks of securities lending include the risk that the borrower may not provide additional collateral when required or may not return the securities when due. To mitigate these risks, the Fund benefits from a borrower default indemnity provided by SSB. SSB’s indemnity allows for full replacement of securities lent wherein SSB will purchase the unreturned loaned securities on the open market by applying the proceeds of the collateral, or to the extent such proceeds are insufficient or the collateral is unavailable, SSB will purchase the unreturned loan securities at SSB’s expense. However, the Fund could suffer a loss if the value of the investments purchased with cash collateral falls below the value of the cash collateral received.
Barron’s 400SM ETF | |
| Notes to Financial Statements | November 30, 2021 |
The following table reflects a breakdown of transactions accounted for as secured borrowings, the gross obligation by the type of collateral pledged or securities loaned, and the remaining contractual maturity of those transactions as of November 30, 2021:
| Barron's 400 ETF | | Remaining contractual maturity of the agreements | |
| | | | | | | | | | | | | | | | |
| Securities Lending Transactions | | Overnight & Continuous | | | Up to 30 days | | | 30-90 days | | | Greater than 90 days | | | Total | |
| Common Stocks | | $ | 784,121 | | | $ | – | | | $ | – | | | $ | – | | | $ | 784,121 | |
| Total Borrowings | | | | | | | | | | | | | | | | | | | 784,121 | |
| Gross amount of recognized liabilities for securities lending (collateral received) | | | $ | 784,121 | |
3. INVESTMENT ADVISORY FEE AND OTHER AFFILIATED TRANSACTIONS
ALPS Advisors, Inc. (the “Adviser”) serves as the Fund’s investment adviser pursuant to an Investment Advisory Agreement with the Trust on behalf of the Fund (the “Advisory Agreement”). Pursuant to the Advisory Agreement, the Fund pays the Adviser an annual management fee for the services and facilities it provides, payable on a monthly basis at the annual rate of 0.65% of the Fund’s average daily net assets. From time to time, the Adviser may waive all or a portion of its fee.
Out of the unitary management fees, the Adviser pays substantially all expenses of the Fund, including the cost of transfer agency, custody, fund administration, legal, audit, trustees and other services, except for interest expenses, distribution fees or expenses, brokerage expenses, taxes and extraordinary expenses not incurred in the ordinary course of the Fund's business. The Adviser’s unitary management fee is designed to pay substantially all of the Fund’s expenses and to compensate the Adviser for providing services to the Fund.
ALPS Fund Services, Inc., an affiliate of the Adviser, is the administrator of the Fund.
Each Trustee receives (1) a quarterly retainer of $10,000, (2) a per meeting fee of $5,000, (3) $1,500 for any special meeting held outside of a regularly scheduled board meeting, and (4) reimbursement for all reasonable out-of-pocket expenses relating to attendance at meetings. In addition, the Chairman of the Board and Chairman of the Audit Committee each receives a quarterly retainer of $2,000, in connection with their respective roles.
4. PURCHASES AND SALES OF SECURITIES
For the year ended November 30, 2021, the cost of purchases and proceeds from sales of investment securities, excluding in-kind transactions and short-term investments, were as follows:
| Fund | | Purchases | | | Sales | |
| Barron's 400 ETF | | $ | 125,928,090 | | | $ | 126,114,656 | |
For the year ended November 30, 2021, the cost of in-kind purchases and proceeds from in-kind sales were as follows:
| Fund | | Purchases | | | Sales | |
| Barron's 400 ETF | | $ | 94,375,667 | | | $ | 93,840,126 | |
For the year ended November 30, 2021, the Barron's 400 ETF had in-kind net realized gains of $34,889,482.
Gains on in-kind transactions are not considered taxable for federal income tax purposes and losses on in-kind transactions are also not deductible for tax purposes.
5. CAPITAL SHARE TRANSACTIONS
Shares are created and redeemed by the Fund only in Creation Unit size aggregations of 25,000 Shares. Only broker-dealers or large institutional investors with creation and redemption agreements called Authorized Participants (“AP”) are permitted to purchase or redeem Creation Units from the Fund. Such transactions are generally permitted on an in-kind basis, with a balancing cash component to equate the transaction to the NAV per unit of the Fund on the transaction date. Cash may be substituted equivalent to the value of certain securities generally when they are not available in sufficient quantity for delivery, not eligible for trading by the AP or as a result of other market circumstances.
| Barron’s 400SM ETF | | |
| Notes to Financial Statements | November 30, 2021 | |
6. RELATED PARTY TRANSACTIONS
The Fund engaged in cross trades between other funds in the Trust during the year ended November 30, 2021 pursuant to Rule 17a-7 under the 1940 Act. Cross trading is the buying or selling of portfolio securities between funds to which the Adviser serves as the investment adviser. The Board previously adopted procedures that apply to transactions between the Funds of the Trust pursuant to Rule 17a-7. These transactions related to cross trades during the period complied with the requirements set forth by Rule 17a-7 and the Trust’s procedures.
Transactions related to cross trades during the year ended November 30, 2021, were as follows:
| Fund | | Purchase cost paid | | | Sale proceeds received | | | Realized gain/(loss) on sales | |
| Barron's 400 ETF | | $ | 1,473,056 | | | $ | 1,093,715 | | | $ | (54,485 | ) |
7. MARKET DISRUPTIONS RISK
The Fund is subject to investment and operational risks associated with financial, economic and other global market developments and disruptions, including the recent spread of an infectious respiratory illness caused by a novel strain of coronavirus (known as COVID-19), which can negatively impact the securities markets and cause the Fund to lose value.
The spread of COVID-19 has caused volatility, severe market dislocations and liquidity constraints in many markets, including markets for the securities the Fund holds, and may adversely affect the Fund’s investments and operations. The transmission of COVID-19 and efforts to contain its spread have resulted in travel restrictions and disruptions, closed international borders, enhanced health screenings at ports of entry and elsewhere, disruption of and delays in healthcare service preparation and delivery, quarantines, event and service cancellations or interruptions, disruptions to business operations and supply chains, and a reduction in consumer and business spending, as well as general concern and uncertainty that has negatively affected the economy. These disruptions have led to instability in the market place and the jobs market. The impact of COVID-19 could adversely affect the economies of many nations or the entire global economy, the financial well-being and performance of individual issuers, borrowers and sectors and the health of the markets generally in potentially significant and unforeseen ways.
The foregoing could lead to a significant economic downturn or recession, increased market volatility, a greater number of market closures, higher default rates and adverse effects on the values and liquidity of the Fund’s securities or other assets. Such impacts may adversely affect the performance of the Fund.
8. SUBSEQUENT EVENTS
Subsequent events, if any, after the date of the Statements of Assets and Liabilities have been evaluated through the date the financial statements were issued. Management has determined that there were no subsequent events to report through the issuance of these financial statements.
| Barron’s 400SM ETF | |
| Additional Information | November 30, 2021 (Unaudited) |
PROXY VOTING RECORDS, POLICIES AND PROCEDURES
Information regarding how the Fund voted proxies relating to portfolio securities during the most recent 12-month period ended June 30 and a description of the Fund’s proxy voting policies and procedures used in determining how to vote for proxies are available without charge on the SEC’s website at www.sec.gov and upon request, by calling (toll-free) 1-866-759-5679.
PORTFOLIO HOLDINGS
The Fund files a complete schedule of portfolio holdings with the U.S. Securities and Exchange Commission (“SEC”) for the first and third quarters of each fiscal year on Form N-PORT within 60 days after the end of the period. Copies of the Fund’s Form N-PORT are available without a charge, upon request, by contacting the Fund at 1-866-759-5679 and on the SEC’s website at https://www.sec.gov.
TAX INFORMATION
The Barron’s 400 ETF designates the following as a percentage of taxable ordinary income distributions, or up to the maximum amount allowable, for the calendar year ended December 31, 2020:
| | Qualified Dividend Income | Dividend Received Deduction |
| Barron's 400 ETF | 100.00% | 100.00% |
In early 2021, if applicable, shareholders of record received this information for the distributions paid to them by the Fund during the calendar year 2020 via Form 1099. The Fund will notify shareholders in early 2022 of amounts paid to them by the Fund, if any, during the calendar year 2021.
LICENSING AGREEMENT
MarketGrader Capital, LLC (the “Index Provider”) has entered into a license agreement with Dow Jones & Company to use the “Barron’s” name and certain related intellectual property in connection with the Underlying Index. The Index Provider also has entered into a license and services agreement with its parent company, MarketGrader.com, to use the methodology for constructing the Underlying Index. The Index Provider in turn has entered into the Sublicense Agreement with ALPS Advisers, Inc. to use the Underlying Index. The following disclosure relates to such licensing agreements:
The Barron’s 400 ETF (the “Fund”) is not sponsored, endorsed, sold or promoted by the Index Provider. The Index Provider makes no representation or warranty, express or implied, to the owners of the Fund or any member of the public regarding the advisability of investing in securities generally or in the Fund particularly or the ability of the Fund to track the performance of the physical commodities market. The Index Provider’s only relationship to the ALPS Advisors, Inc. (the “Adviser”) or the Fund is the licensing of certain service marks and trade names of the Index Provider and of the Underlying Index that is determined, composed and calculated by the Index Provider without regard to the Adviser or the Fund. The Index Provider has no obligation to take the needs of the Adviser or the Fund or the owners of the Fund into consideration in determining, composing or calculating the Underlying Index. The Index Provider is not responsible for and has not participated in the determination of the timing of, prices at, or quantities of the Fund to be issued or in the determination or calculation of the equation by which the Fund is to be converted into cash. The Index Provider has no obligation or liability in connection with the administration, marketing or trading of the Fund
THE INDEX PROVIDER DOES NOT GUARANTEE THE ACCURACY AND/OR THE COMPLETENESS OF THE UNDERLYING INDEX OR ANY DATA INCLUDED THEREIN AND THE INDEX PROVIDER SHALL HAVE NO LIABILITY FOR ANY ERRORS, OMISSIONS, OR INTERRUPTIONS THEREIN. THE INDEX PROVIDER MAKES NO WARRANTY, EXPRESS OR IMPLIED, AS TO RESULTS TO BE OBTAINED BY THE ADVISER, THE FUND, OWNERS OF THE FUND, OR ANY OTHER PERSON OR ENTITY FROM THE USE OF THE UNDERLYING INDEX OR ANY DATA INCLUDED THEREIN. THE INDEX PROVIDER MAKES NO EXPRESS OR IMPLIED WARRANTIES, AND EXPRESSLY DISCLAIMS ALL WARRANTIES OF MERCHANTABILITY OR FITNESS FOR A PARTICULAR PURPOSE OR USE WITH RESPECT TO THE UNDERLYING INDEX OR ANY DATA INCLUDED THEREIN. WITHOUT LIMITING ANY OF THE FOREGOING, IN NO EVENT SHALL THE INDEX PROVIDER HAVE ANY LIABILITY FOR ANY SPECIAL, PUNITIVE, INDIRECT, OR CONSEQUENTIAL DAMAGES (INCLUDING LOST PROFITS), EVEN IF NOTIFIED OF THE POSSIBILITY OF SUCH DAMAGES.
“The Barron’s 400 IndexSM” is calculated and published by MarketGrader Capital, LLC (“MarketGrader”). “Barron’s,” “Barron’s 400” and “Barron’s 400 Index” are trademarks or service marks of DJC & Company, Inc. or its affiliates and have been licensed to MarketGrader and sublicensed for certain purposes by Barron’s 400 Exchange Traded Fund, a sub-fund of that certain ALPS ETF Trust, a Delaware Statutory Trust (“Sub-Licensee”). The Barron’s 400 ETF (the “Product”) is not sponsored, endorsed, sold or promoted by DJC or its affiliates. DJC and its affiliates make no representation or warranty, express or implied, to the owners of the Fund or any member of the public regarding the advisability of trading in the Fund particularly. DJC and its affiliates’ only relationship to the Licensee is the licensing of certain trademarks and trade names of DJC. DJC has no obligation to take the needs of the Licensee or the owners of the Fund into consideration in connection with its licensing of the Barron’s 400 Index to MarketGrader or the sublicense to Licensee. DJC and its affiliates are not responsible for and have not participated in the determination of the timing of, prices at, or quantities of the Fund to be sold or in the determination or calculation of the equation by which the Product are to be converted into cash. DJC and its affiliates have no obligation or liability in connection with the administration, marketing or trading of the Barron’s 400 Index or the Product.
| Barron’s 400SM ETF | |
| Additional Information | November 30, 2021 (Unaudited) |
DOW JONES DOES NOT GUARANTEE THE ACCURACY AND/OR THE COMPLETENESS OF THE BARRON’S 400 INDEX OR ANY DATA INCLUDED THEREIN AND DOW JONES AND ITS AFFILIATES SHALL HAVE NO LIABILITY FOR ANY ERRORS, OMISSIONS, OR INTERRUPTIONS THEREIN. DOW JONESAND ITS AFFILIATES MAKE NO WARRANTY, EXPRESS OR IMPLIED, AS TO RESULTS TO BE OBTAINED BY THE LICENSEE, OWNERS OF THE FUND, OR ANY OTHER PERSON OR ENTITY FROM THE USE OF THE BARRON’S 400 INDEX OR ANY DATA INCLUDED THEREIN. DOW JONES AND ITS AFFILIATES MAKE NO EXPRESS OR IMPLIED WARRANTIES. AND EXPRESSLY DISCLAIM ALL WARRANTIES, OF MERCHANTABILITY OR FITNESS FOR A PARTICULAR PURPOSE OR USE WITH RESPECT TO THE BARRON’S 400 INDEX OR ANY DATA INCLUDED THEREIN. WITHOUT LIMITING ANY OF THE FOREGOING, IN NO EVENT SHALL DOW JONES AND ITS AFFILIATES HAVE ANY LIABILITY FOR ANY LOST PROFITS OR INDIRECT, PUNITIVE, SPECIAL OR CONSEQUENTIAL DAMAGES OR LOSSES, EVEN IF NOTIFIED OF THE POSSIBILITY OF SUCH DAMAGES. THERE ARE NO THIRD PARTY BENEFICIARIES OF ANY AGREEMENTS OR ARRANGEMENTS BETWEEN DJC AND THE LICENSEE, OTHER THAN THE LICENSORS OF MARKETGRADER.
The Adviser does not guarantee the accuracy and/or the completeness of the Underlying Index or any data included therein, and the Adviser shall have no liability for any errors, omissions or interruptions therein. The Adviser makes no warranty, express or implied, as to results to be obtained by the Fund, owners of the Shares of the Fund or any other person or entity from the use of the Underlying Index or any data included therein. The Adviser makes no express or implied warranties, and expressly disclaims all warranties of merchantability or fitness for a particular purpose or use with respect to the Underlying Index or any data included therein. Without limiting any of the foregoing, in no event shall the Adviser have any liability for any special, punitive, direct, indirect or consequential damages (including lost profits) arising out of matters relating to the use of the Underlying Index, even if notified of the possibility of such damages.
| Barron’s 400SM ETF | |
| Board Considerations Regarding Approval of Investment Advisory Agreement | November 30, 2021 (Unaudited) |
At a meeting held on June 7, 2021 via electronic means (video-conference), the Board of Trustees of the Trust (the “Board” or the “Trustees”), including the Trustees who are not “interested persons” of the Trust within the meaning of the Investment Company Act of 1940, as amended (the “Independent Trustees”), evaluated a proposal to approve the continuance of the Investment Advisory Agreement between the Trust and ALPS Advisors, Inc. (the “Adviser” or “AAI”) with respect to the Barron’s 400 ETF (“BFOR” or the “Fund”). The Independent Trustees also met separately to consider the Investment Advisory Agreement.
In evaluating the Investment Advisory Agreement with respect to the Fund, the Board considered various factors, including (i) the nature, extent and quality of the services provided by AAI with respect to the Fund under the Investment Advisory Agreement; (ii) the advisory fees and other expenses paid by the Fund compared to those of similar funds managed by other investment advisers; (iii) the costs of the services provided to the Fund by AAI and the profits realized by AAI and its affiliates from its relationship to the Fund; (iv) the extent to which economies of scale have been or would be realized if and as the assets of the Fund grow and whether fees reflect the economies of scale for the benefit of shareholders; and (v) any additional benefits and other considerations.
With respect to the nature, extent and quality of the services provided by AAI under the Investment Advisory Agreement, the Board considered and reviewed information concerning the services provided under the Investment Advisory Agreement, the investment parameters of the index of the Fund, financial information regarding AAI and its parent company, information describing AAI’s current organization and the background and experience of the persons responsible for the day-to-day management of the Fund. The Board reviewed information on the performance of the Fund and its benchmark. The Board also evaluated the correlation and tracking error between the underlying index and the Fund’s performance. Based on this review, the Board, including the Independent Trustees, found that the nature and extent of services provided to the Fund under the Investment Advisory Agreement was appropriate and that the quality was satisfactory.
The Board noted that the advisory fee for the Fund was a unitary fee pursuant to which AAI assumes all expenses of the Fund (including the cost of transfer agency, custody, fund administration, legal, audit and other services) other than the payments under the Advisory Agreement, brokerage expenses, taxes, interest, litigation expenses and other extraordinary expenses.
With respect to advisory fee rates, the Board, including the Independent Trustees, noted the following:
The gross management fee rate for the Fund is higher than the median of its FUSE expense group. The Fund’s net expense ratio, however, is slightly above the median of its respective FUSE expense group. With respect to the Fund, the Board took into account, among other things, the unique features and performance of the Fund’s underlying index and the costs and benefits of linkage to the Barron’s name.
Based on the foregoing, and the other information available to them, the Board, including the Independent Trustees concluded that the advisory fee rate for the Fund was reasonable under the circumstances and in light of the quality of the services provided.
The Board, including the Independent Trustees considered other benefits available to AAI because of its relationship with the Fund and concluded that the advisory fees were reasonable taking into account any such benefits.
The Board, including the Independent Trustees also considered with respect to the Fund the information provided by AAI about the costs and profitability of AAI with respect to the Fund, including the asset levels and other factors that influence the profitability and financial viability of the Fund. The Board, including the Independent Trustees reviewed and noted the relatively small size of the Fund and concluded that AAI was not realizing any economies of scale. The Independent Trustees determined that AAI should continue to keep the Board informed on an ongoing basis of any significant developments (e.g., material increases in asset levels) so as to facilitate the Independent Trustees’ evaluation of whether further economies of scale have been achieved.
In voting to renew the Investment Advisory Agreement, the Board, including the Independent Trustees concluded that the terms of the Investment Advisory Agreement are reasonable and fair in light of the services to be performed, the fees paid by certain other funds, expenses to be incurred and such other matters as the members of the Board, including the Independent Trustees, considered relevant in the exercise of their reasonable business judgment. The Board, including the Independent Trustees did not identify any single factor or group of factors as all important or controlling and considered all factors together.
Barron’s 400SM ETF | |
| Trustees & Officers | November 30, 2021 (Unaudited) |
The general supervision of the duties performed by the Adviser for the Fund under the Investment Advisory Agreement is the responsibility of the Board of Trustees. The Trust currently has four Trustees. Three Trustees have no affiliation or business connection with the Adviser or any of its affiliated persons and do not own any stock or other securities issued by the Adviser. These are the “non-interested” or “independent” Trustees (“Independent Trustees”). The other Trustee (the “Interested Trustee”) is affiliated with the Adviser.
The Independent Trustees of the Trust, their term of office and length of time served, their principal business occupations during the past five years, the number of portfolios in the Fund Complex overseen by each Independent Trustee, and other directorships, if any, held by the Trustee are shown below.
| INDEPENDENT TRUSTEES |
| Name, Address & Year of Birth* | Position(s) Held with Trust | Term of Office and Length of Time Served** | Principal Occupation(s) During Past 5 Years | Number of Portfolios in Fund Complex Overseen by Trustees*** | Other Directorships Held by Trustees |
Mary K. Anstine,
1940 | Trustee | Since March 2008 | Ms. Anstine is Trustee/Director of AV Hunter Trust and Colorado Uplift Board. | 36 | Ms. Anstine is a Trustee of ALPS Variable Investment Trust (7 funds); Financial Investors Trust (32 funds); Reaves Utility Income Fund; and Segall Bryant & Hamill Trust (14 funds). |
Jeremy W. Deems,
1976 | Trustee | Since March 2008 | Mr. Deems is the Co-Founder and Chief Financial Officer of Green Alpha Advisors, LLC, a registered investment advisor, and Co-Portfolio Manager of the Shelton Green Alpha Fund. | 36 | Mr. Deems is a Trustee of ALPS Variable Investment Trust (7 funds); Financial Investors Trust (32 funds); and Reaves Utility Income Fund; and Clough Funds Trust (1 fund). |
Rick A. Pederson,
1952 | Trustee | Since March 2008 | Mr. Pederson is Partner, Bow River Capital Partners (private equity management), 2003 - present; Board Member, Prosci Inc. (private business services) 2013-2016; Advisory Board Member, Citywide Banks (Colorado community bank) 2014-2017; Board Member, Strong-Bridge Consulting, 2015-2019; Board Member, IRI/ODMS Holdings LLC, 2017-2019; Director, National Western Stock Show (not for profit) 2010 - present; Director, History Colorado (not for profit) 2015-present; Director, Citywide Bank Advisory Board 2017-present; Trustee, Boettcher Foundation, 2018 -present. | 19 | Mr. Pederson is Trustee of Segall Bryant & Hamill Trust (14 funds) and Principal Real Estate Income Fund (1 fund). |
| * | The business address of the Trustee is c/o ALPS Advisors, Inc., 1290 Broadway, Suite 1000, Denver, Colorado 80203. |
| ** | This is the period for which the Trustee began serving the Trust. Each Trustee serves an indefinite term, until his successor is elected. |
| *** | The Fund Complex includes all series of the Trust and any other investment companies for which ALPS Advisors, Inc. provides investment advisory services. |
| Barron’s 400SM ETF | |
| Trustees & Officers | November 30, 2021 (Unaudited) |
The Trustee who is an “interested person” of the Trust, his term of office and length of time served, his principal business occupations during the past five years, the number of portfolios in the Fund Complex overseen by the Interested Trustee and the other directorships, if any, held by the Trustee, are shown below.
| INTERESTED TRUSTEE |
| Name, Address and Year of Birth of Interested Trustee* | Position(s) Held with Trust | Term of Office and Length of Time Served** | Principal Occupation(s) During Past 5 Years | Number of Portfolios in Fund Complex Overseen by Trustees*** | Other Directorships Held by Trustees |
Edmund J. Burke, 1961 | Trustee | Since December 2017. | Mr. Burke joined ALPS in 1991 and served as the President and Director of ALPS Holdings, Inc., and ALPS Advisors, Inc. (“AAI”), and Director of ALPS Distributors, Inc. (“ADI”), ALPS Fund Services, Inc. (“AFS”), and ALPS Portfolio Solutions Distributor, Inc. (“APSD”). Mr. Burke retired from ALPS in June 2019. | 31 | Mr. Burke is a Trustee of Clough Global Dividend and Income Fund (1 fund); Clough Global Equity Fund (1 fund); Clough Global Opportunities Fund (1 fund); Clough Funds Trust (1 fund); Liberty All-Star Equity Fund (1 fund); Director of the Liberty All-Star Growth Fund, Inc. (1 fund) and Financial Investors Trust (32 funds). |
| * | The business address of the Trustee is c/o ALPS Advisors, Inc., 1290 Broadway, Suite 1000, Denver, Colorado 80203. Effective December 1, 2021, Mr. Burke is an Independent Trustee of the Trust. |
| ** | This is the period for which the Trustee began serving the Trust. Each Trustee serves an indefinite term, until his successor is elected. |
| *** | The Fund Complex includes all series of the Trust and any other investment companies for which ALPS Advisors, Inc. provides investment advisory services. |
| Barron’s 400SM ETF | |
| Trustees & Officers | November 30, 2021 (Unaudited) |
| OFFICERS |
| Name, Address and Year of Birth of Officer* | Position(s) Held with Trust | Length of Time Served** | Principal Occupation(s) During Past 5 Years |
Laton Spahr, 1975 | President | Since June 2021 | Mr. Spahr joined ALPS in 2019 and currently serves as President and Portfolio Manager of AAI. Prior to his current role, Mr. Spahr was a Senior Vice President and Strategy Leader of the Value & Income Team for Oppenheimer Funds from 2013 to 2019. |
Matthew Sutula, 1985 | Chief Compliance Officer (“CCO”) | Since December 2019 | Mr. Sutula joined ALPS in 2012 and currently serves as Chief Compliance Officer of AAI. Prior to his current role, Mr. Sutula served as interim Compliance Officer of the Trust (September 2019 to December 2019). Compliance Manager and Senior Compliance Analyst for AAI, as well as Compliance Analyst for AFS. Prior to joining ALPS, he spent seven years at Morningstar, Inc. in various analyst roles supporting the registered investment company databases. Mr. Sutula is also Chief Compliance Officer of Principal Real Estate Income Fund, ALPS Variable Investment Trust, RiverNorth Opportunities Fund, Inc., Liberty All-Star Equity Fund and Liberty All-Star Growth Fund, Inc. |
Kathryn Burns, 1976 | Treasurer | Since September 2018 | Ms. Burns serves as Vice President, Director of Fund Operations of AAI since 2018. From 2013 to 2018, she served as Vice President and Fund Controller at AFS. Prior to joining ALPS, she worked at Old Mutual Capital where she served as Vice President and Chief Compliance Officer (2010 – 2012) and Regulatory Reporting Manager and Assistant Treasurer to the Old Mutual Funds Trusts (2006 – 2012). She also served as a CPA for PricewaterhouseCoopers LLP. Ms. Burns also serves as President of ALPS Variable Investment Trust, Principal Real Estate Income Fund and RiverNorth Opportunities Fund, Inc. From June 2018 to November 2021 she also served as Treasurer of Boulder Growth & Income Fund, Inc. |
Brendan Hamill, 1986 | Secretary | Since September 2021 | Mr. Hamill joined ALPS in August 2021, and is currently Vice President and Principal Legal Counsel. Prior to joining ALPS, Mr. Hamill was an attorney at Lewis Brisbois Bisgaard & Smith, LLP (law firm) (December 2018-August 2021) and Vedder Price, P.C. (law firm) (August 2015-December 2018). Mr. Hamill also serves as Secretary of Financial Investors Trust, Secretary of ALPS Variable Investment Trust, Secretary of Principal Real Estate Income Fund, and Assistant Secretary of James Advantage Funds. |
| * | The business address of each Officer is c/o ALPS Advisors, Inc., 1290 Broadway, Suite 1000, Denver, Colorado 80203. Each Officer is deemed an affiliate of the Trust as defined under the 1940 Act. |
| ** | This is the period for which the Officer began serving the Trust. Each Officer serves an indefinite term, until his/her successor is elected. |
The Statement of Additional Information includes additional information about the Fund’s Trustees and is available, without charge, upon request by calling (toll-free) 1-866-759-5679.
Table of Contents
| Performance Overview | |
| RiverFront Dynamic Core Income ETF | 1 |
| RiverFront Dynamic US Dividend Advantage ETF | 4 |
| RiverFront Dynamic US Flex-Cap ETF | 7 |
| RiverFront Strategic Income Fund | 10 |
| Disclosure of Fund Expenses | 13 |
| Report of Independent Registered Public Accounting Firm | 14 |
| Financial Statements | |
| Schedule of Investments | |
| RiverFront Dynamic Core Income ETF | 15 |
| RiverFront Dynamic US Dividend Advantage ETF | 19 |
| RiverFront Dynamic US Flex-Cap ETF | 21 |
| RiverFront Strategic Income Fund | 23 |
| Statement of Assets and Liabilities | 26 |
| Statement of Operations | 27 |
| Statements of Changes in Net Assets | |
| RiverFront Dynamic Core Income ETF | 28 |
| RiverFront Dynamic US Dividend Advantage ETF | 29 |
| RiverFront Dynamic US Flex-Cap ETF | 30 |
| RiverFront Strategic Income Fund | 31 |
| Financial Highlights | 32 |
| Notes to Financial Statements | 36 |
| Additional Information | 44 |
| Board Considerations Regarding Approval of Investment Advisory Agreement and Investment Sub-Advisory Agreements | 45 |
| Trustees & Officers | 47 |
alpsfunds.com
| RiverFront Dynamic Core Income ETF | |
| Performance Overview | November 30, 2021 (Unaudited) |
Investment Objective
RiverFront Dynamic Core Income ETF (the “Fund” or "RFCI") seeks total return, with an emphasis on income as the source of that total return. The Fund seeks to achieve its investment objective by investing in a global portfolio of fixed income securities of various maturities, ratings and currency denominations.
Market Recap
The fiscal year ended November 30, 2021 was a year of recovery for the global equity markets. Early into the fiscal year, the release of COVID-19 vaccines caused a global equity rally, led by value stocks. Both developed international equities and emerging international equities outperformed US equities during this rally but began to lose their momentum halfway through February 2021. Emerging markets, specifically, saw a large draw down from mid-February through March; this drawdown was caused in large part due to concerns surrounding China’s growth prospects. These concerns, amplified by political questions surrounding China, would continue to affect performance in the fiscal year, with emerging markets posting negative performance from June through the end of October.
In the developed world, the United States was able to outperform developed international markets. Despite lagging value stocks in the first quarter of the fiscal year, US growth stocks out-performed value for the fiscal year, leading the way within the broad US large cap asset class. For developed international stocks, the value rotation slowed, but never stopped, with growth stock pacing the broad market throughout the fiscal year.
Looking in the rear-view mirror, fixed income markets were volatile in 2021. After beginning the calendar year with the 10-year Treasury bonds yielding just .93%, yields quickly rose as the economy accelerated after Fed stimulus through quantitative easing and government transfer payments. Yields peaked at 1.74% at the end of March, and then traded within a 60-basis point range. With Treasury bond yields low, the funds used a combination of investment grade and high yield credit to generate income, while maintaining a short duration strategy versus the Bloomberg Aggregate Bond Index. The Fund’s duration was kept shorter due to the anticipation reducing bond purchases through its quantitative easing program in addition to inflation expectations increasing.
2021 Performance Attribution
Broadly, RFCI underperformed its benchmark for the 12-month period ending November 30, 2021. The underperformance was primarily due to the Fund’s selection within investment grade bonds.
Negative Contributors:
| • | Selection within Treasuries: The Fund’s Treasury bond holdings had longer maturities than those in the benchmark and underperformed as interest rates rose throughout the period. |
| • | Allocation to Mortgage-backed Securities (MBS): The Fund had no exposure to MBS during this period and MBS outperformed Treasuries. |
Positive Contributors:
| • | Allocation to credit: The Fund’s overweight to corporate bonds relative to Treasuries, agencies, and mortgages was additive during the period, as credit spreads tightened. |
| • | Allocation to Treasuries: The Fund’s underweight to Treasuries had a positive effect on performance, as interest rates moved higher over the period. |
2022 Outlook
While Riverfront understands and partially shares the worries surrounding rising debt and inflation that contributed to a flat to negative global stock market in the third quarter, RiverFront believes that stocks and commodities will remain the highest performing asset classes. These assets provide more potential for capital appreciation to offset inflation and higher taxes than ‘stable assets’ like cash, CDs, and bonds. In the US, RiverFront prefers to play the equity markets using a barbell approach to growth and value. RiverFront favors growth, mega-cap stocks, specifically those that lean towards software and services, while also selectively investing in more cyclical, value stocks. This approach allows RiverFront’s portfolios to have proper exposures to both sides of the growth versus value trade, while not overexposing the Fund to low-quality, value names or telecommunication stocks, which RiverFront believes at the aggregate are over-valued.
Internationally, RiverFront believes that the potential for a reacceleration in global growth lends itself to value investing. However, RiverFront believes that this excludes developed international energy stocks; it is RiverFront’s view that these stocks are worse positioned to take advantage of high oil prices than their US or emerging counterparts. From a country standpoint, RiverFront prefers the United Kingdom, France, Germany, and Japan, with a partially hedged position in yen and euro denominated assets. In emerging markets, RiverFront’s highest conviction is an underweight to China. RiverFront believes that the Chinese Communist Party's recent actions have signaled an aversion to free market economics that RiverFront believes are required to be a viable investment. As such, Riverfront has allocated capital away from Chinese equites toward South Korea and Saudi Arabian energy equities.
Heading into 2022, RiverFront believes the Fed will accelerate its tapering of bond purchases to help slow inflation. RiverFront expects inflation to peak in the first half of the year, thus limiting the upside pressure on yields. RiverFront’s base case for the 10-year Treasury bond is for it to reach 2% by the end of the calendar year. Given the low level of yields going into the new year RiverFront believes that there will be little price appreciation in bonds, with most of the total return coming from income. Therefore, the Fund will look to out yield the benchmark by owning short and intermediate corporate bonds, high yield, and bank loans in combination with long duration Treasuries to act as a shock absorber in case of risk off events.
| RiverFront Dynamic Core Income ETF | |
| Performance Overview | November 30, 2021 (Unaudited) |
Performance (as of November 30, 2021)
| | 1 Year | 5 Year | Since Inception^ |
| RiverFront Dynamic Core Income ETF – NAV | -1.51% | 3.12% | 2.51% |
| RiverFront Dynamic Core Income ETF – Market Price* | -1.43% | 3.08% | 2.50% |
| Bloomberg U.S. Aggregate Bond Total Return Index | -1.15% | 3.65% | 2.96% |
Total Expense Ratio (per the current prospectus) is 0.54%.
Performance data quoted represents past performance. Past performance does not guarantee future results. Total return figures assume reinvestment of dividends and capital gains distributions, if any. The table does not reflect the deduction of taxes that a shareholder would pay on Fund distributions or the redemption of Fund shares. Investment return and principal value of an investment will fluctuate so that an investor’s shares, when sold or redeemed, may be worth more or less than the original cost. Current performance data may be higher or lower than actual data quoted. For the most current month-end performance data please visit www.alpsfunds.com or call 1.866.759.5679.
NAV is an exchange-traded fund’s per-share value. The per-share dollar amount of the fund is derived by dividing the total value of all the securities in its portfolio, less any liabilities, by the number of fund shares outstanding. Market Price is the price at which a share can currently be traded in the market. Information detailing the number of days the Market Price of the Fund was greater than the Fund’s NAV and the number of days it was less than the Fund’s NAV can be obtained at www.alpsfunds.com.
| ^ | The Fund commenced operations on June 14, 2016. |
| * | Market Price means the official closing price of a share or, if it more accurately reflects the market value of a share at the time as of which the Fund calculates current net asset value per share, the price that is the midpoint of the bid-ask spread as of that time. It does not represent the returns an investor would receive if shares were traded at other times. |
Bloomberg U.S. Aggregate Bond Total Return Index is a broad-based benchmark that measures the investment grade, U.S. dollar-denominated, fixed-rate taxable bond market, including Treasuries, government-related and corporate securities, MBS (agency fixed-rate and hybrid ARM pass-throughs), ABS, and CMBS (agency and non-agency). The index is reported on a total return basis, which assumes reinvestment of any dividends and distributions realized during a given time period. The index is not actively managed and does not reflect any deductions for fees, expenses or taxes. One cannot invest directly in an index. Index performance does not reflect fund performance.
The RiverFront Dynamic Core Income ETF is not suitable for all investors. Investments in the Fund are subject to investment risks, including possible loss of the principal amount invested.
The Fund’s shares are not individually redeemable. Investors buy and sell shares of the Fund on a secondary market. Only market makers or “authorized participants” may trade directly with the Fund, typically in blocks of 25,000 shares.
ALPS Portfolio Solutions Distributor, Inc., a FINRA member, is the Distributor for the RiverFront Dynamic Core Income ETF.
| RiverFront Dynamic Core Income ETF | |
| Performance Overview | November 30, 2021 (Unaudited) |
Top 10 Holdings*^ (as of November 30, 2021)
| United States Treasury Bond 02/15/2028 2.75% | 6.49% |
| United States Treasury Bond 02/15/2041 1.88% | 5.40% |
| United States Treasury Bond 02/15/2051 1.88% | 3.98% |
| United States Treasury Note 10/31/2025 3.00% | 3.22% |
| Broadcom, Inc. 11/15/2035 3.14% | 2.02% |
| Marathon Oil Corp. 07/15/2027 4.40% | 2.01% |
| Ford Motor Co. 04/22/2030 9.63% | 1.98% |
| Iron Mountain, Inc. 09/15/2027 4.88% | 1.97% |
| United States Treasury Note 10/31/2031 2.88% | 1.86% |
| United States Treasury Bond 08/15/2051 2.00% | 1.79% |
| Total % of Top 10 Holdings | 30.72% |
| ^ | Excludes Money Market Fund |
Future holdings are subject to change.
Growth of $10,000 (as of November 30, 2021)
Comparison of Change in Value of $10,000 Investment in the Fund and the Fund’s benchmark
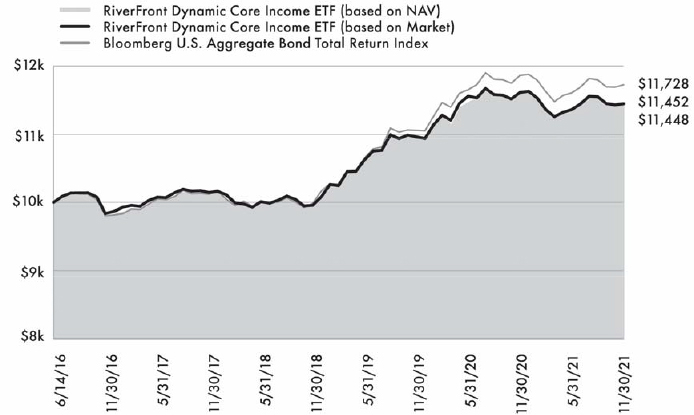
The chart above compares historical performance of a hypothetical investment of $10,000 in the Fund since inception with the performance of the Fund’s benchmark index. Results include the reinvestment of all dividends and capital gains distributions. Past performance does not guarantee future results. The graph does not reflect the deduction of taxes that a shareholder would pay on Fund distributions or the redemption of Fund shares.
| RiverFront Dynamic US Dividend Advantage ETF |
| Performance Overview | November 30, 2021 (Unaudited) |
Investment Objective
RiverFront Dynamic US Dividend Advantage ETF (the “Fund” or "RFDA") seeks to provide capital appreciation and dividend income. Under normal market conditions, the Fund seeks to achieve its investment objective by investing at least 65% of its net assets in a portfolio of equity securities of publicly traded U.S. companies with the potential for dividend income. Equity securities include common stocks and common or preferred shares of real estate investment trusts (“REITs”).
Market Recap
The fiscal year ended November 30, 2021 was a year of recovery for the global equity markets. Early into the fiscal year, the release of COVID-19 vaccines caused a global equity rally, led by value stocks. Both developed international equities and emerging international equities outperformed US equities during this rally but began to lose their momentum halfway through February 2021. Emerging markets, specifically, saw a large draw down from mid-February through March; this drawdown was caused in large part due to concerns surrounding China’s growth prospects. These concerns, amplified by political questions surrounding China, would continue to affect performance in the fiscal year, with emerging markets posting negative performance from June through the end of October.
In the developed world, the United States was able to outperform developed international. Despite lagging value stocks in the first quarter of the fiscal year, US growth stocks out-performed value for the fiscal year, leading the way within the broad US large cap asset class. For developed international stocks, the value rotation slowed, but never stopped, with growth stock pacing the broad market throughout the fiscal year.
Looking in the rear-view mirror, fixed income markets were volatile in 2021. After beginning the calendar year with the 10-year Treasury bonds yielding just .93%, yields quickly rose as the economy accelerated after Fed stimulus through quantitative easing and government transfer payments. Yields peaked at 1.74% at the end of March, and then traded within a 60-basis point range. With Treasury bond yields low, the Fund used a combination of investment grade and high yield credit to generate income, while maintaining a short duration strategy versus the Bloomberg Aggregate Bond Index. The Fund’s duration was kept shorter due to the anticipation reducing bond purchases through its quantitative easing program in addition to inflation expectations increasing.
2021 Performance Attribution
Broadly, RFDA underperformed its benchmark for the 12-month period ending November 30, 2021. The underperformance was primarily due to the Fund’s selection decisions.
| 1. | Sector Allocation: The sector allocations in RFDA are determined through a bottoms-up process that ranks stocks on three fundamental cornerstones: value, quality and momentum/sentiment. If a sector produces more highly ranked stocks relative to another sector, that sector’s allocation is allowed to exceed its benchmark by a tolerable level, and vice versa. Sector allocation was a slightly negative contributor for RFDA in FY 2021. |
| a. | Positive contributors: The underweights to utilities and healthcare were positive contributors. |
| b. | Negative contributors: The portfolio’s underweights to consumer cyclicals and its over-weights to consumer non-cyclicals dampened relative performance. |
| 2. | Security Selection: The investment selection process behind RFDA is built on making a number of security selection choices. This means that there are rarely just one or two things contributing to the returns in the fund. In FY 2021, Riverfront's equity selection posted negative results in aggregate. A few of the top themes that contributed most to performance in the year were: |
| a. | Positive contributors: Security selection in healthcare and consumer services were additive. |
| b. | Negative contributors: Security selection in business services, non-energy materials and consumer cyclicals detracted from performance. |
2022 Outlook
While Riverfront understands and partially shares the worries surrounding rising debt and inflation that contributed to a flat to negative global stock market in the third quarter, Riverfront believes that stocks and commodities will remain the highest performing asset classes. These assets provide more potential for capital appreciation to offset inflation and higher taxes than ‘stable assets’ like cash, CDs, and bonds. In the US, RiverFront prefers to play the equity markets using a barbell approach to growth and value. Riverfront favors growth, mega-cap stocks, specifically those that lean towards software and services, while also selectively investing in more cyclical, value stocks. This approach allows Riverfront’s portfolios to have proper exposures to both sides of the growth versus value trade, while not overexposing us to low-quality, value names or telecommunication stocks, which RiverFront believes at the aggregate are over-valued.
Internationally, RiverFront believes that the potential for a reacceleration in global growth lends itself to value investing. However, Riverfront believes that this excludes developed international energy stocks; it is Riverfront’s view that these stocks are less positioned to take advantage of high oil prices than their US or emerging counterparts. From a country standpoint, RiverFront prefers the United Kingdom, France, Germany, and Japan, with a partially hedged position in yen and euro denominated assets. In emerging markets, RiverFront’s highest conviction is an underweight to China. Riverfront believes that the Chinese Communist Party's recent actions have signaled an aversion to free market economics that we believe are required to be a viable investment. As such, Riverfront has allocated capital away from Chinese equites toward South Korea and Saudi Arabian energy equities.
| RiverFront Dynamic US Dividend Advantage ETF | |
| Performance Overview | November 30, 2021 (Unaudited) |
Heading into 2022, RiverFront believes the Fed will accelerate its tapering of bond purchases to help slow inflation. RiverFront expects inflation to peak in the first half of the year, thus limiting the upside pressure on yields. RiverFront’s base case for the 10-year Treasury bond is for it to reach 2% by the end of the calendar year. Given the low level of yields going into the new year RiverFront believes that there will be little price appreciation in bonds, with most of the total return coming from income.
Performance (as of November 30, 2021)
| | 1 Year | 5 Year | Since Inception^ |
| RiverFront Dynamic US Dividend Advantage ETF – NAV | 23.13% | 13.19% | 13.28% |
| RiverFront Dynamic US Dividend Advantage ETF – Market Price* | 23.19% | 13.18% | 13.29% |
| S&P 500® Total Return Index | 27.92% | 17.90% | 17.31% |
Total Expense Ratio (per the current prospectus) is 0.52%.
Performance data quoted represents past performance. Past performance does not guarantee future results. Total return figures assume reinvestment of dividends and capital gains distributions, if any. The table does not reflect the deduction of taxes that a shareholder would pay on Fund distributions or the redemption of Fund shares. Investment return and principal value of an investment will fluctuate so that an investor’s shares, when sold or redeemed, may be worth more or less than the original cost. Current performance data may be higher or lower than actual data quoted. For the most current month-end performance data please visit www.alpsfunds.com or call 1.866.759.5679.
NAV is an exchange-traded fund’s per-share value. The per-share dollar amount of the fund is derived by dividing the total value of all the securities in its portfolio, less any liabilities, by the number of fund shares outstanding. Market Price is the price at which a share can currently be traded in the market. Information detailing the number of days the Market Price of the Fund was greater than the Fund’s NAV and the number of days it was less than the Fund’s NAV can be obtained at www.alpsfunds.com.
| ^ | The Fund commenced operations on June 7, 2016. |
| * | Market Price means the official closing price of a share or, if it more accurately reflects the market value of a share at the time as of which the Fund calculates current net asset value per share, the price that is the midpoint of the bid-ask spread as of that time. It does not represent the returns an investor would receive if shares were traded at other times. |
S&P 500® Total Return Index is the Standard & Poor’s composite index of 500 stocks, a widely recognized, unmanaged index of common stock prices. The index is reported on a total return basis, which assumes reinvestment of any dividends and distributions realized during a given time period. The index is not actively managed and does not reflect any deductions for fees, expenses or taxes. One cannot invest directly in an index. Index performance does not reflect fund performance.
The RiverFront Dynamic US Dividend Advantage ETF is not suitable for all investors. Investments in the Fund are subject to investment risks, including possible loss of the principal amount invested.
The Fund’s shares are not individually redeemable. Investors buy and sell shares of the Fund on a secondary market. Only market makers or “authorized participants” may trade directly with the Fund, typically in blocks of 25,000 shares.
ALPS Portfolio Solutions Distributor, Inc., a FINRA member, is the Distributor for the RiverFront Dynamic US Dividend Advantage ETF.
| RiverFront Dynamic US Dividend Advantage ETF | |
| Performance Overview | November 30, 2021 (Unaudited) |
Top 10 Holdings* (as of November 30, 2021)
| Microsoft Corp. | 8.54% |
| Apple, Inc. | 5.54% |
| Amazon.com, Inc. | 4.12% |
| Broadcom, Inc. | 2.60% |
| Bank of America Corp. | 2.58% |
| Oracle Corp. | 2.34% |
| Eli Lilly & Co. | 2.31% |
| Pfizer, Inc. | 2.14% |
| Cadence Design Systems, Inc. | 1.99% |
| Visa, Inc. | 1.96% |
| Total % of Top 10 Holdings | 34.12% |
| * | % of Total Investments (excluding investments purchased with collateral from securities loaned) |
Future holdings are subject to change.
Growth of $10,000 (as of November 30, 2021)
Comparison of Change in Value of $10,000 Investment in the Fund and the Fund’s benchmark
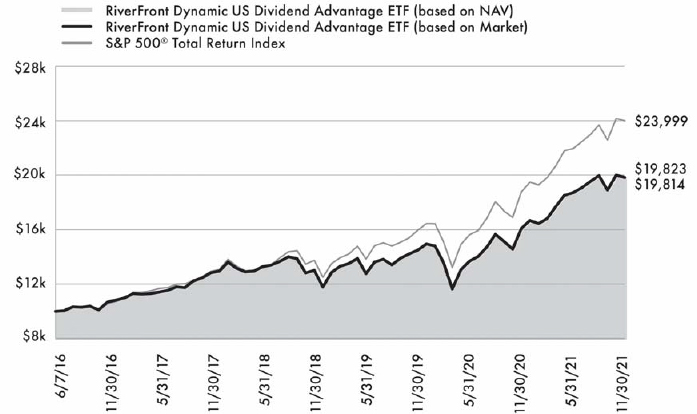
The chart above compares historical performance of a hypothetical investment of $10,000 in the Fund since inception with the performance of the Fund’s benchmark index. Results include the reinvestment of all dividends and capital gains distributions. Past performance does not guarantee future results. The graph does not reflect the deduction of taxes that a shareholder would pay on Fund distributions or the redemption of Fund shares.
| RiverFront Dynamic US Flex-Cap ETF | |
| Performance Overview | November 30, 2021 (Unaudited) |
Investment Objective
RiverFront Dynamic US Flex-Cap ETF (the “Fund” or "RFFC") seeks to provide capital appreciation. Under normal market conditions, the Fund seeks to achieve its investment objective by investing at least 65% of its net assets in a portfolio of equity securities of publicly traded U.S. companies. Equity securities include common stocks and common or preferred shares of real estate investment trusts (“REITs”).
Market Recap
The fiscal year ended November 30, 2021 was a year of recovery for the global equity markets. Early into the fiscal year, the release of COVID-19 vaccines caused a global equity rally, led by value stocks. Both developed international equities and emerging international equities outperformed US equities during this rally but began to lose their momentum halfway through February 2021. Emerging markets, specifically, saw a large draw down from mid-February through March; this drawdown was caused in large part due to concerns surrounding China’s growth prospects. These concerns, amplified by political questions surrounding China, would continue to affect performance in the fiscal year, with emerging markets posting negative performance from June through the end of October.
In the developed world, the United States was able to outperform developed international. Despite lagging value stocks in the first quarter of the fiscal year, US growth stocks out-performed value for the fiscal year, leading the way within the broad US large cap asset class. For developed international stocks, the value rotation slowed, but never stopped, with growth stock pacing the broad market throughout the fiscal year.
Looking in the rear-view mirror, fixed income markets were volatile in 2021. After beginning the calendar year with the 10-year Treasury bonds yielding just .93%, yields quickly rose as the economy accelerated after Fed stimulus through quantitative easing and government transfer payments. Yields peaked at 1.74% at the end of March, and then traded within a 60-basis point range. With Treasury bond yields low, the Fund used a combination of investment grade and high yield credit to generate income, while maintaining a short duration strategy versus the Bloomberg Aggregate Bond Index. The Fund’s duration was kept shorter due to the anticipation reducing bond purchases through its quantitative easing program in addition to inflation expectations increasing.
2021 Performance Attribution
Broadly, RFFC underperformed its benchmark for the 12-month period ending November 30, 2021. The underperformance was primarily due to the Fund’s allocation and selection decisions.
| 1. | Sector Allocation: The sector allocations in RFFC are determined through a bottoms-up process that ranks stocks on three fundamental cornerstones: value, quality and momentum/sentiment. If a sector produces more highly ranked stocks relative to another sector, that sector’s allocation is allowed to exceed its benchmark by a tolerable level, and vice versa. Sector allocation was a slightly negative contributor for RFFC in FY 2021. |
| a. | Positive contributors: The underweights to utilities and consumer services were positive contributors. |
| b. | Negative contributors: The portfolio’s underweight to energy and over-weight to consumer non-cyclicals negatively impacted portfolio returns. |
| 2. | Security Selection: The investment selection process behind RFFC is built on making a number of security selection choices. This means that there are rarely just one or two things contributing to the returns in the fund. In FY 2021, RiverFront’s equity selection posted negative results in aggregate. A few of the top themes that contributed most to performance in the year were: |
| a. | Positive contributors: Security selection in healthcare, technology, and industrials were net positives. |
| b. | Negative contributors: Security selection in non-energy materials, consumer non-cyclicals and financials were detractors. |
2022 Outlook
While Riverfront understands and partially shares the worries surrounding rising debt and inflation that contributed to a flat to negative global stock market in the third quarter, RiverFront believes that stocks and commodities will remain the highest performing asset classes. These assets provide more potential for capital appreciation to offset inflation and higher taxes than ‘stable assets’ like cash, CDs, and bonds. In the US, RiverFront prefers to play the equity markets using a barbell approach to growth and value. RiverFront favors growth, mega-cap stocks, specifically those that lean towards software and services, while also selectively investing in more cyclical, value stocks. This approach allows our portfolios to have proper exposures to both sides of the growth versus value trade, while not overexposing us to low-quality, value names or telecommunication stocks, which RiverFront believes at the aggregate are over-valued.
Internationally, RiverFront believes that the potential for a reacceleration in global growth lends itself to value investing. However, RiverFront believes that this excludes developed international energy stocks; it is RiverFront’s view that these stocks are less positioned to take advantage of high oil prices than their US or emerging counterparts. From a country standpoint, RiverFront prefers the United Kingdom, France, Germany, and Japan, with a partially hedged position in yen and euro denominated assets. In emerging markets, RiverFront’s highest conviction is an underweight to China. RiverFront believes that the Chinese Communist Party's recent actions have signaled an aversion to free market economics that RiverFront believes are required to be a viable investment. As such, Riverfront has allocated capital away from Chinese equites toward South Korea and Saudi Arabian energy equities.
| RiverFront Dynamic US Flex-Cap ETF | |
| Performance Overview | November 30, 2021 (Unaudited) |
Heading into 2022, RiverFront believes the Fed will accelerate its tapering of bond purchases to help slow inflation. RiverFront expects inflation to peak in the first half of the year, thus limiting the upside pressure on yields. RiverFront’s base case for the 10-year Treasury bond is for it to reach 2% by the end of the calendar year. Given the low level of yields going into the new year RiverFront believes that there will be little price appreciation in bonds, with most of the total return coming from income.
Performance (as of November 30, 2021)
| | 1 Year | 5 Year | Since Inception^ |
| RiverFront Dynamic US Flex-Cap ETF – NAV | 23.65% | 12.71% | 13.00% |
| RiverFront Dynamic US Flex-Cap ETF – Market Price* | 23.56% | 12.69% | 12.99% |
| S&P Composite 1500® Total Return Index | 27.95% | 17.38% | 16.93% |
Total Expense Ratio (per the current prospectus) is 0.52%.
Performance data quoted represents past performance. Past performance does not guarantee future results. Total return figures assume reinvestment of dividends and capital gains distributions, if any. The table does not reflect the deduction of taxes that a shareholder would pay on Fund distributions or the redemption of Fund shares. Investment return and principal value of an investment will fluctuate so that an investor’s shares, when sold or redeemed, may be worth more or less than the original cost. Current performance data may be higher or lower than actual data quoted. For the most current month-end performance data please visit www.alpsfunds.com or call 1.866.759.5679.
NAV is an exchange-traded fund’s per-share value. The per-share dollar amount of the fund is derived by dividing the total value of all the securities in its portfolio, less any liabilities, by the number of fund shares outstanding. Market Price is the price at which a share can currently be traded in the market. Information detailing the number of days the Market Price of the Fund was greater than the Fund’s NAV and the number of days it was less than the Fund’s NAV can be obtained at www.alpsfunds.com.
| ^ | The Fund commenced operations on June 7, 2016. |
| * | Market Price means the official closing price of a share or, if it more accurately reflects the market value of a share at the time as of which the Fund calculates current net asset value per share, the price that is the midpoint of the bid-ask spread as of that time. It does not represent the returns an investor would receive if shares were traded at other times. |
S&P Composite 1500® Total Return Index is the Standard & Poor’s broad-based unmanaged capitalization-weighted index comprising 1,500 stocks of Large-cap, Mid-cap, and Small-cap U.S. companies. The index is reported on a total return basis, which assumes reinvestment of any dividends and distributions realized during a given time period. The index is not actively managed and does not reflect any deductions for fees, expenses or taxes. One cannot invest directly in an index. Index performance does not reflect fund performance.
The RiverFront Dynamic US Flex-Cap ETF is not suitable for all investors. Investments in the Fund are subject to investment risks, including possible loss of the principal amount invested.
The Fund’s shares are not individually redeemable. Investors buy and sell shares of the Fund on a secondary market. Only market makers or “authorized participants” may trade directly with the Fund, typically in blocks of 25,000 shares.
ALPS Portfolio Solutions Distributor, Inc., a FINRA member, is the Distributor for the RiverFront Dynamic US Flex-Cap ETF.
| RiverFront Dynamic US Flex-Cap ETF | |
| Performance Overview | November 30, 2021 (Unaudited) |
Top 10 Holdings* (as of November 30, 2021)
| Microsoft Corp. | 6.47% |
| Apple, Inc. | 6.05% |
| Amazon.com, Inc. | 3.29% |
| UnitedHealth Group, Inc. | 1.73% |
| Enphase Energy, Inc. | 1.64% |
| Advanced Micro Devices, Inc. | 1.47% |
| Eli Lilly & Co. | 1.45% |
| Adobe, Inc. | 1.44% |
| Prologis, Inc. | 1.39% |
| Oracle Corp. | 1.35% |
| Total % of Top 10 Holdings | 26.28% |
| * | % of Total Investments (excluding investments purchased with collateral from securities loaned) |
Future holdings are subject to change.
Growth of $10,000 (as of November 30, 2021)
Comparison of Change in Value of $10,000 Investment in the Fund and the Fund’s benchmark

The chart above compares historical performance of a hypothetical investment of $10,000 in the Fund since inception with the performance of the Fund’s benchmark index. Results include the reinvestment of all dividends and capital gains distributions. Past performance does not guarantee future results. The graph does not reflect the deduction of taxes that a shareholder would pay on Fund distributions or the redemption of Fund shares.
| RiverFront Strategic Income Fund | |
| Performance Overview | November 30, 2021 (Unaudited) |
Investment Objective
The RiverFront Strategic Income Fund (the “Fund” or "RIGS") seeks total return, with an emphasis on income as the source of that total return. The Fund seeks to achieve its investment objective by investing in a global portfolio of fixed income securities of various maturities, ratings and currency denominations. The Fund utilizes various investment strategies in a broad array of fixed income sectors.
Market Recap
The fiscal year ended November 30, 2021 was a year of recovery for the global equity markets. Early into the fiscal year, the release of COVID-19 vaccines caused a global equity rally, led by value stocks. Both developed international equities and emerging international equities outperformed US equities, during this rally but began to lose their momentum halfway through February 2021. Emerging markets, specifically, saw a large draw down from mid-February through March; this drawdown was caused in large part due to concerns surrounding China’s growth prospects. These concerns, amplified by political questions surrounding China, would continue to affect performance in the fiscal year, with emerging markets posting negative performance from June through the end of October.
In the developed world, the United States was able to outperform developed international. Despite lagging value stocks in the first quarter of the fiscal year, US growth stocks out-performed value for the fiscal year, leading the way within the broad US large cap asset class. For developed international stocks, the value rotation slowed, but never stopped, with growth stock pacing the broad market throughout the fiscal year.
Looking in the rear-view mirror, fixed income markets were volatile in 2021. After beginning the calendar year with the 10-year Treasury bonds yielding just .93%, yields quickly rose as the economy accelerated after Fed stimulus through quantitative easing and government transfer payments. Yields peaked at 1.74% at the end of March, and then traded within a 60-basis point range. With Treasury bond yields low, the Fund used a combination of investment grade and high yield credit to generate income, while maintaining a short duration strategy versus the Bloomberg Aggregate Bond Index. The Fund’s duration was kept shorter due to the anticipation reducing bond purchases through its quantitative easing program in addition to inflation expectations increasing.
2021 Performance Attribution
Broadly, RIGS outperformed its benchmark for the 12-month period ending November 30, 2021. The outperformance was primarily due to its shorter duration and exposure to high yield corporate bonds.
Negative Contributors:
| • | Cash allocation: The Fund’s allocation to cash throughout the period negatively impacted performance. |
| • | Allocation to Mortgage-Backed Securities (MBS): The Fund had no exposure to MBS during this period and MBS outperformed Treasuries. |
Positive Contributors:
| • | Selection within US Credit: The Fund held mainly short-maturity, high yield bonds during the period. High yield bonds were one of the highest performing sectors of the fixed income market, as credit spreads tightened sharply. |
| • | Allocation to Treasuries: The Fund was underweight Treasuries, which underperformed both Corporate bonds and MBS, as interest rates rose. |
2022 Outlook
While Riverfront understands and partially shares the worries surrounding rising debt and inflation that contributed to a flat to negative global stock market in the third quarter, RiverFront believes that stocks and commodities will remain the highest performing asset classes. These assets provide more potential for capital appreciation to offset inflation and higher taxes than ‘stable assets’ like cash, CDs, and bonds. In the US, RiverFront prefers to play the equity markets using a barbell approach to growth and value. RiverFront favors growth, mega-cap stocks, specifically those that lean towards software and services, while also selectively investing in more cyclical, value stocks. This approach allows RiverFront’s portfolios to have proper exposures to both sides of the growth versus value trade, while not overexposing the Fund to low-quality, value names or telecommunication stocks, which RiverFront believes at the aggregate are over-valued.
Internationally, RiverFront believes that the potential for a reacceleration in global growth lends itself to value investing. However, RiverFront believes that this excludes developed international energy stocks; it is RiverFront’s view that these stocks are less positioned to take advantage of high oil prices than their US or emerging counterparts. From a country standpoint, RiverFront prefers the United Kingdom, France, Germany, and Japan, with a partially hedged position in yen and euro denominated assets. In markets, RiverFront’s highest conviction is an underweight to China. RiverFront believes that Chinese Communist Party's recent actions have signaled an aversion to free market economics that RiverFront believes are required to be a viable investment. As such, Riverfront has allocated capital away from Chinese equites toward South Korea and Saudi Arabian energy equities.
Heading into 2022, RiverFront believes the Fed will accelerate its tapering of bond purchases to help slow inflation. RiverFront expects inflation to peak in the first half of the year, thus limiting the upside pressure on yields. RiverFront’s base case for the 10-year Treasury bond is for it to reach 2% by the end of the calendar year. Given the low level of yields going into the new year RiverFront believes that there will be little price appreciation in bonds, with most of the total return coming from income. Therefore, the Fund will look to out yield the benchmark by owning short and intermediate corporate bonds, high yield, and bank loans in combination with long duration Treasuries to act as a shock absorber in case of risk off events.
| RiverFront Strategic Income Fund | |
| Performance Overview | November 30, 2021 (Unaudited) |
Performance (as of November 30, 2021)
| | 1 Year | 5 Year | Since Inception^ |
| RiverFront Strategic Income Fund – NAV | 1.52% | 3.44% | 3.84% |
| RiverFront Strategic Income Fund – Market Price* | 1.60% | 3.43% | 3.83% |
| Bloomberg U.S. Aggregate Bond Total Return Index | -1.15% | 3.65% | 3.32% |
Total Expense Ratio (per the current prospectus) is 0.48%. The Fund’s management fees consist of a fee of 0.11% paid to the Fund’s investment adviser and a fee of 0.35% paid to the Fund’s sub-adviser.
Performance data quoted represents past performance. Past performance does not guarantee future results. Total return figures assume reinvestment of dividends and capital gains distributions, if any. The table does not reflect the deduction of taxes that a shareholder would pay on Fund distributions or the redemption of Fund shares. Investment return and principal value of an investment will fluctuate so that an investor’s shares, when sold or redeemed, may be worth more or less than the original cost. Current performance data may be higher or lower than actual data quoted. For most current month-end performance data please visit www.alpsfunds.com or call 1.866.759.5679.
NAV is an exchange-traded fund’s per-share value. The per-share dollar amount of the Fund is derived by dividing the total value of all the securities in its portfolio, less any liabilities, by the number of Fund shares outstanding. Market Price is the price at which a share can currently be traded in the market. Information detailing the number of days the Market Price of the Fund was greater than the Fund’s NAV and the number of days it was less than the Fund’s NAV can be obtained at www.alpsfunds.com.
| ^ | The Fund commenced Investment Operations on October 8, 2013. |
| * | Market Price means the official closing price of a share or, if it more accurately reflects the market value of a share at the time as of which the Fund calculates current net asset value per share, the price that is the midpoint of the bid-ask spread as of that time. It does not represent the returns an investor would receive if shares were traded at other times. |
Duration is a measure of the sensitivity of the price (the value of principal) of a fixed-income investment to a change in interest rates. Duration is expressed as a number of years. The duration number is a calculation involving present value, yield, coupon, final maturity and call features. The bigger the duration number, the greater the interest-rate risk or reward for bond prices. Rising interest rates mean falling bond prices, while declining interest rates mean rising bond prices.
Bloomberg U.S. Aggregate Bond Total Return Index is a broad-based benchmark that measures the investment grade, U.S. dollar-denominated, fixed-rate taxable bond market, including Treasuries, government-related and corporate securities, MBS (agency fixed-rate and hybrid ARM pass-throughs), ABS, and CMBS (agency and non-agency). The index is reported on a total return basis, which assumes reinvestment of any dividends and distributions realized during a given time period. The index is not actively managed and does not reflect any deductions for fees, expenses or taxes. One cannot invest directly in an index. Index performance does not reflect fund performance.
The RiverFront Strategic Income Fund is not suitable for all investors. Investments in the Fund are subject to investment risks, including possible loss of the principal amount invested.
The Fund's shares are not individually redeemable. Investors buy and sell shares of the fund on a secondary market. Only market makers or "authorized participants" may trade directly with the Fund, typically in blocks of 25,000 shares.
ALPS Portfolio Solutions Distributor, Inc., a FINRA member, is the distributor for the RiverFront Strategic Income Fund.
| RiverFront Strategic Income Fund | |
| Performance Overview | November 30, 2021 (Unaudited) |
Top 10 Holdings*^ (as of November 30, 2021)
| United States Treasury Bond 02/15/2031 1.13% | 3.74% |
| United States Treasury Bond 02/15/2050 2.00% | 1.78% |
| CIT Group, Inc. 08/15/2022 5.00% | 1.54% |
| T-Mobile USA, Inc. 04/15/2026 2.63% | 1.38% |
| JPMorgan Chase & Co. 10/01/2027 4.25% | 1.30% |
| PulteGroup, Inc. 03/01/2026 5.50% | 1.30% |
| Citigroup, Inc. 09/29/2027 4.45% | 1.30% |
| Bank of America Corp. 10/22/2026 4.25% | 1.29% |
| Goldman Sachs Group, Inc. 10/21/2025 4.25% | 1.27% |
| Vistra Operations Co. LLC 07/15/2024 3.55% | 1.26% |
| Total % of Top 10 Holdings | 16.16% |
| ^ | Excludes Money Market Fund |
Future holdings are subject to change.
Growth of $10,000 (as of November 30, 2021)
Comparison of Change in Value of $10,000 Investment in the Fund and the Fund’s benchmark
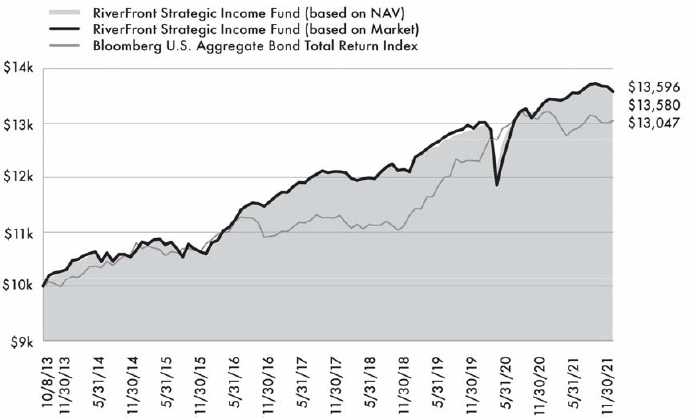
The chart above compares historical performance of a hypothetical investment of $10,000 in the Fund since inception with the performance of the Fund’s benchmark index. Results include the reinvestment of all dividends and capital gains distributions. Past performance does not guarantee future results. The graph does not reflect the deduction of taxes that a shareholder would pay on Fund distributions or the redemption of Fund shares.
| RiverFront ETFs | |
| Disclosure of Fund Expenses | November 30, 2021 (Unaudited) |
Shareholder Expense Example: As a shareholder of a Fund, you incur certain ongoing costs, including management fees and other Fund expenses. These examples are intended to help you understand your ongoing costs (in dollars) of investing in a Fund and to compare these costs with the ongoing costs of investing in other funds. It is based on an investment of $1,000 invested at the beginning of the (six month) period and held through November 30, 2021.
Actual Return: The first line of the table provides information about actual account values and actual expenses. You may use the information in this line, together with the amount you invested, to estimate the expenses that you incurred over the period. Simply divide your account value by $1,000 (for example, an $8,600 account value divided by $1,000 = 8.6), then multiply the result by the number in the first line under the heading entitled “Expenses Paid During Period” to estimate the expenses attributable to your investment during this period.
Hypothetical 5% Return: The second line of the table provides information about hypothetical account values and hypothetical expenses based on the Fund’s actual expense ratio and an assumed rate of return of 5% per year before expenses, which is not the Fund’s actual return. The hypothetical account values and expenses may not be used to estimate the actual ending account balance or expenses you paid for the period. You may use this information to compare ongoing costs of investing in the Fund and other funds. To do so, compare this 5% hypothetical example with the 5% hypothetical examples that appear in the shareholder reports of other funds.
The expenses shown in the table are meant to highlight ongoing Fund costs only and do not reflect any transaction costs, such as brokerage commissions and other fees to financial intermediaries. Therefore, the second line is useful in comparing ongoing costs only, and will not help you determine the relative total costs of owning different funds. In addition, if these costs were included, your costs would have been higher.
| | Beginning Account Value 6/1/21 | Ending Account Value 11/30/21 | Expense Ratio(a) | Expenses Paid During Period 6/1/21 - 11/30/21(b) |
| RiverFront Dynamic Core Income ETF | | | | |
| Actual | $1,000.00 | $1,007.10 | 0.51% | $2.57 |
| Hypothetical (5% return before expenses) | $1,000.00 | $1,022.51 | 0.51% | $2.59 |
| RiverFront Dynamic US Dividend Advantage ETF | | | | |
| Actual | $1,000.00 | $1,059.40 | 0.52% | $2.68 |
| Hypothetical (5% return before expenses) | $1,000.00 | $1,022.46 | 0.52% | $2.64 |
| RiverFront Dynamic US Flex-Cap ETF | | | | |
| Actual | $1,000.00 | $1,063.30 | 0.52% | $2.69 |
| Hypothetical (5% return before expenses) | $1,000.00 | $1,022.46 | 0.52% | $2.64 |
| RiverFront Strategic Income Fund | | | | |
| Actual | $1,000.00 | $1,002.70 | 0.46% | $2.31 |
| Hypothetical (5% return before expenses) | $1,000.00 | $1,022.76 | 0.46% | $2.33 |
| (a) | Annualized, based on the Fund's most recent fiscal half year expenses. |
| (b) | Expenses are equal to the Fund's annualized expense ratio multiplied by the average account value over the period, multiplied by the number of days in the most recent fiscal half year (183), divided by 365. |
RiverFront ETFs |
| Report of Independent Registered Public Accounting Firm |
To the Board of Trustees of ALPS ETF Trust and the shareholders of RiverFront Dynamic Core Income ETF, RiverFront Dynamic US Dividend Advantage ETF, RiverFront Dynamic US Flex-Cap ETF, and RiverFront Strategic Income Fund:
Opinion on the Financial Statements and Financial Highlights
We have audited the accompanying statements of assets and liabilities, including the schedules of investments, of RiverFront Dynamic Core Income ETF, RiverFront Dynamic US Dividend Advantage ETF, RiverFront Dynamic US Flex-Cap ETF, and RiverFront Strategic Income Fund (the "Funds"), four of the funds constituting the ALPS ETF Trust as of November 30, 2021, the related statements of operations for the year then ended, the statements of changes in net assets for each of the two years in the period then ended, and the financial highlights for each of the five years in the period then ended, and the related notes.
In our opinion, the financial statements and financial highlights present fairly, in all material respects, the financial position of the Funds as of November 30, 2021, and the results of their operations for the year then ended, the changes in their net assets for each of the two years in the period then ended, and the financial highlights for each of the five years in the period then ended, in conformity with accounting principles generally accepted in the United States of America.
Basis for Opinion
These financial statements and financial highlights are the responsibility of the Funds’ management. Our responsibility is to express an opinion on the Funds’ financial statements and financial highlights based on our audits. We are a public accounting firm registered with the Public Company Accounting Oversight Board (United States) (PCAOB) and are required to be independent with respect to the Funds in accordance with the U.S. federal securities laws and the applicable rules and regulations of the Securities and Exchange Commission and the PCAOB.
We conducted our audits in accordance with the standards of the PCAOB. Those standards require that we plan and perform the audit to obtain reasonable assurance about whether the financial statements and financial highlights are free of material misstatement, whether due to error or fraud. The Funds are not required to have, nor were we engaged to perform, an audit of their internal control over financial reporting. As part of our audits we are required to obtain an understanding of internal control over financial reporting but not for the purpose of expressing an opinion on the effectiveness of the Funds’ internal control over financial reporting. Accordingly, we express no such opinion.
Our audits included performing procedures to assess the risks of material misstatement of the financial statements and financial highlights, whether due to error or fraud, and performing procedures that respond to those risks. Such procedures included examining, on a test basis, evidence regarding the amounts and disclosures in the financial statements and financial highlights. Our audits also included evaluating the accounting principles used and significant estimates made by management, as well as evaluating the overall presentation of the financial statements and financial highlights. Our procedures included confirmation of securities owned as of November 30, 2021, by correspondence with the custodian and brokers; when replies were not received from brokers, we performed other auditing procedures. We believe that our audits provide a reasonable basis for our opinion.
DELOITTE & TOUCHE LLP
Denver, Colorado
January 26, 2022
We have served as the auditor of one or more investment companies advised by ALPS Advisors, Inc. since 2007.
| RiverFront Dynamic Core Income ETF | |
| Schedule of Investments | November 30, 2021 |
| Security Description | | Principal Amount | | | Value | |
| CORPORATE BONDS (60.90%) | | | | | | | | |
| Communications (7.96%) | | | | | | | | |
| AT&T, Inc. | | | | | | | | |
| 2.55%, 12/01/2033 | | $ | 2,066,000 | | | $ | 1,999,530 | |
| Charter Communications Operating LLC / Charter Communications Operating Capital | | | | | | | | |
| 4.91%, 07/23/2025 | | | 1,143,000 | | | | 1,262,176 | |
| Comcast Corp. | | | | | | | | |
| 3.60%, 03/01/2024 | | | 74,000 | | | | 78,495 | |
| 3.55%, 05/01/2028 | | | 197,000 | | | | 216,827 | |
| 4.15%, 10/15/2028 | | | 1,104,000 | | | | 1,251,695 | |
| Discovery Communications LLC | | | | | | | | |
| 3.95%, 03/20/2028 | | | 136,000 | | | | 148,502 | |
| Sirius XM Radio, Inc. | | | | | | | | |
| 3.13%, 09/01/2026(a) | | | 1,265,000 | | | | 1,248,214 | |
| T-Mobile USA, Inc. | | | | | | | | |
| 4.00%, 04/15/2022 | | | 197,000 | | | | 198,698 | |
| Verizon Communications, Inc. | | | | | | | | |
| 4.33%, 09/21/2028 | | | 197,000 | | | | 224,660 | |
| 4.02%, 12/03/2029 | | | 111,000 | | | | 124,613 | |
| 2.36%, 03/15/2032(a) | | | 932,000 | | | | 924,951 | |
| ViacomCBS, Inc. | | | | | | | | |
| 3.50%, 01/15/2025 | | | 368,000 | | | | 390,321 | |
| 3.70%, 06/01/2028 | | | 50,000 | | | | 54,679 | |
| Walt Disney Co. | | | | | | | | |
| 2.00%, 09/01/2029 | | | 1,265,000 | | | | 1,264,073 | |
| Total Communications | | | | | | | 9,387,434 | |
| | | | | | | | | |
| Consumer Discretionary (6.73%) | | | | | | | | |
| ADT Security Corp. | | | | | | | | |
| 4.13%, 06/15/2023 | | | 93,000 | | | | 96,160 | |
| Alibaba Group Holding, Ltd. | | | | | | | | |
| 3.60%, 11/28/2024 | | | 273,000 | | | | 289,559 | |
| 3.40%, 12/06/2027 | | | 197,000 | | | | 210,129 | |
| Amazon.com, Inc. | | | | | | | | |
| 3.15%, 08/22/2027 | | | 412,000 | | | | 444,056 | |
| CoreCivic, Inc. | | | | | | | | |
| 4.63%, 05/01/2023 | | | 197,000 | | | | 197,427 | |
| eBay, Inc. | | | | | | | | |
| 3.45%, 08/01/2024 | | | 136,000 | | | | 143,397 | |
| Ford Motor Co. | | | | | | | | |
| 9.63%, 04/22/2030 | | | 1,600,000 | | | | 2,326,160 | |
| General Motors Financial Co., Inc. | | | | | | | | |
| 3.70%, 05/09/2023 | | | 350,000 | | | | 362,303 | |
| 3.60%, 06/21/2030 | | | 1,091,000 | | | | 1,157,730 | |
| Goodyear Tire & Rubber Co. | | | | | | | | |
| 4.88%, 03/15/2027 | | | 1,143,000 | | | | 1,187,886 | |
| Lowe's Cos., Inc. | | | | | | | | |
| 3.10%, 05/03/2027 | | | 136,000 | | | | 145,059 | |
| Marriott International, Inc. | | | | | | | | |
| 4.00%, 04/15/2028(b) | | | 185,000 | | | | 201,650 | |
| McDonald's Corp. | | | | | | | | |
| 3.50%, 03/01/2027 | | | 68,000 | | | | 73,854 | |
| Security Description | | Principal Amount | | | Value | |
| Consumer Discretionary (continued) | | | | | | |
| Nordstrom, Inc. | | | | | | | | |
| 4.25%, 08/01/2031 | | $ | 1,143,000 | | | $ | 1,095,400 | |
| Total Consumer Discretionary | | | | | | | 7,930,770 | |
| | | | | | | | | |
| Consumer Staples (1.28%) | | | | | | | | |
| Anheuser-Busch InBev | | | | | | | | |
| Worldwide, Inc. | | | | | | | | |
| 4.00%, 04/13/2028 | | | 1,279,000 | | | | 1,433,044 | |
| Constellation Brands, Inc. | | | | | | | | |
| 4.75%, 12/01/2025 | | | 68,000 | | | | 76,342 | |
| Total Consumer Staples | | | | | | | 1,509,386 | |
| | | | | | | | | |
| Energy (7.46%) | | | | | | | | |
| Chevron Corp. | | | | | | | | |
| 2.90%, 03/03/2024 | | | 350,000 | | | | 364,884 | |
| ConocoPhillips Co. | | | | | | | | |
| 4.95%, 03/15/2026 | | | 136,000 | | | | 153,851 | |
| Continental Resources, Inc. | | | | | | | | |
| 4.50%, 04/15/2023 | | | 197,000 | | | | 203,970 | |
| 3.80%, 06/01/2024 | | | 197,000 | | | | 205,852 | |
| Enterprise Products Operating LLC | | | | | | | | |
| 3.35%, 03/15/2023 | | | 350,000 | | | | 359,621 | |
| Exxon Mobil Corp. | | | | | | | | |
| 3.04%, 03/01/2026 | | | 495,000 | | | | 525,653 | |
| Hess Midstream Operations LP | | | | | | | | |
| 4.25%, 02/15/2030(a) | | | 1,143,000 | | | | 1,107,716 | |
| Kinder Morgan Energy Partners LP | | | | | | | | |
| 4.25%, 09/01/2024 | | | 197,000 | | | | 210,837 | |
| Marathon Oil Corp. | | | | | | | | |
| 4.40%, 07/15/2027 | | | 2,150,000 | | | | 2,355,261 | |
| Marathon Petroleum Corp. | | | | | | | | |
| 3.80%, 04/01/2028 | | | 136,000 | | | | 146,316 | |
| ONEOK Partners LP | | | | | | | | |
| 3.38%, 10/01/2022 | | | 350,000 | | | | 355,245 | |
| Ovintiv Exploration, Inc. | | | | | | | | |
| 5.63%, 07/01/2024 | | | 197,000 | | | | 215,142 | |
| Sabine Pass Liquefaction LLC | | | | | | | | |
| 5.63%, 04/15/2023 | | | 273,000 | | | | 287,131 | |
| 5.75%, 05/15/2024 | | | 136,000 | | | | 148,665 | |
| Schlumberger Investment SA | | | | | | | | |
| 3.65%, 12/01/2023 | | | 568,000 | | | | 594,939 | |
| Shell International Finance BV | | | | | | | | |
| 2.75%, 04/06/2030 | | | 1,143,000 | | | | 1,196,331 | |
| Williams Cos., Inc. | | | | | | | | |
| 4.55%, 06/24/2024 | | | 136,000 | | | | 146,255 | |
| 3.90%, 01/15/2025 | | | 206,000 | | | | 220,439 | |
| Total Energy | | | | | | | 8,798,108 | |
| | | | | | | | | |
| Financials (18.81%) | | | | | | | | |
| Aflac, Inc. | | | | | | | | |
| 3.63%, 11/15/2024 | | | 273,000 | | | | 292,977 | |
| Ally Financial, Inc. | | | | | | | | |
| 4.13%, 02/13/2022 | | | 513,000 | | | | 516,585 | |
| Bank of America Corp. | | | | | | | | |
| 4.25%, 10/22/2026 | | | 1,714,000 | | | | 1,891,629 | |
See Notes to Financial Statements.
RiverFront Dynamic Core Income ETF | |
| Schedule of Investments | November 30, 2021 |
| Security Description | | Principal Amount | | | Value | |
| Financials (continued) | | | | | | | | |
| Berkshire Hathaway, Inc. | | | | | | | | |
| 3.13%, 03/15/2026 | | $ | 350,000 | | | $ | 374,798 | |
| Chubb INA Holdings, Inc. | | | | | | | | |
| 3.35%, 05/03/2026 | | | 339,000 | | | | 365,521 | |
| Citigroup, Inc. | | | | | | | | |
| 3M US L + 1.43%, | | | | | | | | |
| 09/01/2023(c) | | | 350,000 | | | | 353,124 | |
| 4.45%, 09/29/2027 | | | 197,000 | | | | 219,305 | |
| 6.63%, 06/15/2032 | | | 706,000 | | | | 947,499 | |
| Cooperatieve Rabobank UA | | | | | | | | |
| 4.63%, 12/01/2023 | | | 350,000 | | | | 374,844 | |
| Credit Suisse Group AG | | | | | | | | |
| 4.55%, 04/17/2026 | | | 322,000 | | | | 356,312 | |
| Discover Bank | | | | | | | | |
| 4.65%, 09/13/2028 | | | 185,000 | | | | 211,698 | |
| Goldman Sachs Group, Inc. | | | | | | | | |
| 3M US L + 0.75%, | | | | | | | | |
| 02/23/2023(c) | | | 568,000 | | | | 570,631 | |
| 3M US L + 1.60%, | | | | | | | | |
| 11/29/2023(c) | | | 350,000 | | | | 358,852 | |
| 3.50%, 11/16/2026 | | | 35,000 | | | | 37,359 | |
| 5.95%, 01/15/2027 | | | 978,000 | | | | 1,156,182 | |
| Host Hotels & Resorts LP | | | | | | | | |
| 4.00%, 06/15/2025 | | | 136,000 | | | | 144,409 | |
| HSBC Holdings PLC | | | | | | | | |
| 4.30%, 03/08/2026 | | | 185,000 | | | | 203,133 | |
| 3.90%, 05/25/2026 | | | 273,000 | | | | 295,501 | |
| 4.38%, 11/23/2026 | | | 136,000 | | | | 148,811 | |
| Intercontinental Exchange, Inc. | | | | | | | | |
| 3.75%, 09/21/2028 | | | 197,000 | | | | 218,272 | |
| Iron Mountain, Inc. | | | | | | | | |
| 4.88%, 09/15/2027(a) | | | 2,268,000 | | | | 2,309,686 | |
| JPMorgan Chase & Co. | | | | | | | | |
| 3.38%, 05/01/2023 | | | 273,000 | | | | 282,951 | |
| 3M US L + 1.23%, | | | | | | | | |
| 10/24/2023(c) | | | 809,000 | | | | 816,463 | |
| 4.25%, 10/01/2027 | | | 1,342,000 | | | | 1,500,899 | |
| Lincoln National Corp. | | | | | | | | |
| 3.35%, 03/09/2025 | | | 273,000 | | | | 290,449 | |
| M&T Bank Corp. | | | | | | | | |
| 3M US L + 0.68%, | | | | | | | | |
| 07/26/2023(c) | | | 350,000 | | | | 353,051 | |
| MetLife, Inc. | | | | | | | | |
| 3.60%, 04/10/2024 | | | 341,000 | | | | 361,576 | |
| 6.50%, 12/15/2032 | | | 50,000 | | | | 70,273 | |
| Mitsubishi UFJ Financial Group, Inc. | | | | | | | | |
| 3.85%, 03/01/2026 | | | 273,000 | | | | 297,444 | |
| Mizuho Financial Group, Inc. | | | | | | | | |
| 3M US L + 1.00%, | | | | | | | | |
| 09/11/2024(c) | | | 700,000 | | | | 708,598 | |
| 3.17%, 09/11/2027 | | | 68,000 | | | | 72,173 | |
| Security Description | | Principal Amount | | | Value | |
| Financials (continued) | | | | | | |
| Morgan Stanley | | | | | | | | |
| 3M US L + 1.40%, | | | | | | | | |
| 10/24/2023(c) | | $ | 700,000 | | | $ | 707,873 | |
| 5.00%, 11/24/2025 | | | 427,000 | | | | 477,868 | |
| 3.63%, 01/20/2027 | | | 538,000 | | | | 583,041 | |
| NatWest Group PLC | | | | | | | | |
| 3M US L + 1.48%, | | | | | | | | |
| 05/15/2023(c) | | | 273,000 | | | | 276,304 | |
| 3M US L + 1.47%, | | | | | | | | |
| 05/15/2023(c) | | | 350,000 | | | | 351,674 | |
| PNC Financial Services Group, Inc. | | | | | | | | |
| 3.15%, 05/19/2027 | | | 273,000 | | | | 294,685 | |
| 3.45%, 04/23/2029 | | | 1,091,000 | | | | 1,191,957 | |
| Starwood Property Trust, Inc. | | | | | | | | |
| 5.00%, 12/15/2021 | | | 92,000 | | | | 92,096 | |
| Truist Bank | | | | | | | | |
| 3.30%, 05/15/2026 | | | 273,000 | | | | 292,623 | |
| UBS Group AG | | | | | | | | |
| 4.13%, 09/24/2025 | | | 113,000 | | | | 123,181 | |
| 4.13%, 04/15/2026 | | | 68,000 | | | | 74,647 | |
| Wells Fargo & Co. | | | | | | | | |
| 3.00%, 04/22/2026 | | | 1,528,000 | | | | 1,604,868 | |
| Total Financials | | | | | | | 22,171,822 | |
| | | | | | | | | |
| Health Care (6.05%) | | | | | | | | |
| AbbVie, Inc. | | | | | | | | |
| 3.20%, 11/21/2029 | | | 1,143,000 | | | | 1,218,154 | |
| Aetna, Inc. | | | | | | | | |
| 3.50%, 11/15/2024 | | | 197,000 | | | | 208,930 | |
| Bristol-Myers Squibb Co. | | | | | | | | |
| 3.25%, 02/27/2027 | | | 768,000 | | | | 833,454 | |
| Cigna Corp. | | | | | | | | |
| 3.00%, 07/15/2023 | | | 340,000 | | | | 350,862 | |
| CVS Health Corp. | | | | | | | | |
| 4.30%, 03/25/2028 | | | 392,000 | | | | 441,825 | |
| DaVita, Inc. | | | | | | | | |
| 4.63%, 06/01/2030(a) | | | 1,143,000 | | | | 1,127,998 | |
| HCA, Inc. | | | | | | | | |
| 5.38%, 09/01/2026 | | | 1,143,000 | | | | 1,280,149 | |
| Johnson & Johnson | | | | | | | | |
| 2.45%, 03/01/2026 | | | 350,000 | | | | 364,965 | |
| Merck & Co., Inc. | | | | | | | | |
| 2.80%, 05/18/2023 | | | 685,000 | | | | 707,389 | |
| Pfizer, Inc. | | | | | | | | |
| 3.20%, 09/15/2023 | | | 284,000 | | | | 296,667 | |
| UnitedHealth Group, Inc. | | | | | | | | |
| 3.75%, 07/15/2025 | | | 273,000 | | | | 296,432 | |
| Total Health Care | | | | | | | 7,126,825 | |
| | | | | | | | | |
| Industrials (4.13%) | | | | | | | | |
| 3M Co. | | | | | | | | |
| 3.25%, 02/14/2024 | | | 568,000 | | | | 596,738 | |
| Boeing Co. | | | | | | | | |
| 3.45%, 11/01/2028 | | | 197,000 | | | | 206,510 | |
| 5.15%, 05/01/2030 | | | 1,143,000 | | | | 1,327,597 | |
See Notes to Financial Statements.
| RiverFront Dynamic Core Income ETF | |
| Schedule of Investments | November 30, 2021 |
| Security Description | | Principal Amount | | | Value | |
| Industrials (continued) | | | | | | |
| CNH Industrial NV | | | | | | | | |
| 4.50%, 08/15/2023 | | $ | 273,000 | | | $ | 288,301 | |
| FedEx Corp. | | | | | | | | |
| 3.40%, 02/15/2028 | | | 197,000 | | | | 215,947 | |
| General Dynamics Corp. | | | | | | | | |
| 3.50%, 05/15/2025 | | | 266,000 | | | | 285,112 | |
| General Electric Co. | | | | | | | | |
| 3.45%, 05/01/2027 | | | 1,143,000 | | | | 1,246,205 | |
| John Deere Capital Corp. | | | | | | | | |
| 2.65%, 06/24/2024 | | | 273,000 | | | | 285,238 | |
| Lockheed Martin Corp. | | | | | | | | |
| 3.55%, 01/15/2026 | | | 197,000 | | | | 213,430 | |
| Textron, Inc. | | | | | | | | |
| 3.65%, 03/15/2027 | | | 185,000 | | | | 200,113 | |
| Total Industrials | | | | | | | 4,865,191 | |
| | | | | | | | | |
| Materials (1.92%) | | | | | | | | |
| Ball Corp. | | | | | | | | |
| 4.00%, 11/15/2023 | | | 197,000 | | | | 206,333 | |
| DuPont de Nemours, Inc. | | | | | | | | |
| 4.73%, 11/15/2028 | | | 1,143,000 | | | | 1,333,070 | |
| Glencore Funding LLC | | | | | | | | |
| 3.00%, 10/27/2022(a) | | | 350,000 | | | | 356,571 | |
| LyondellBasell Industries NV | | | | | | | | |
| 5.75%, 04/15/2024 | | | 197,000 | | | | 215,444 | |
| Sherwin-Williams Co. | | | | | | | | |
| 3.45%, 06/01/2027 | | | 136,000 | | | | 146,631 | |
| Total Materials | | | | | | | 2,258,049 | |
| | | | | | | | | |
| Technology (5.63%) | | | | | | | | |
| Apple, Inc. | | | | | | | | |
| 3.20%, 05/11/2027 | | | 1,143,000 | | | | 1,231,089 | |
| Broadcom, Inc. | | | | | | | | |
| 4.11%, 09/15/2028 | | | 159,000 | | | | 174,854 | |
| 3.14%, 11/15/2035(a) | | | 2,396,000 | | | | 2,365,606 | |
| Flex, Ltd. | | | | | | | | |
| 5.00%, 02/15/2023 | | | 273,000 | | | | 286,179 | |
| Microsoft Corp. | | | | | | | | |
| 3.30%, 02/06/2027 | | | 952,000 | | | | 1,033,606 | |
| 3.45%, 08/08/2036 | | | 86,000 | | | | 98,987 | |
| 2.92%, 03/17/2052 | | | 93,000 | | | | 99,115 | |
| Oracle Corp. | | | | | | | | |
| 3.25%, 11/15/2027 | | | 1,067,000 | | | | 1,129,783 | |
| S&P Global, Inc. | | | | | | | | |
| 4.00%, 06/15/2025 | | | 197,000 | | | | 214,546 | |
| Total Technology | | | | | | | 6,633,765 | |
| | | | | | | | | |
| Utilities (0.93%) | | | | | | | | |
| CMS Energy Corp. | | | | | | | | |
| 3.60%, 11/15/2025 | | | 113,000 | | | | 120,819 | |
| Consumers Energy Co. | | | | | | | | |
| 3.13%, 08/31/2024 | | | 136,000 | | | | 142,528 | |
| Dominion Energy, Inc. | | | | | | | | |
| 4.25%, 06/01/2028 | | | 185,000 | | | | 207,132 | |
| Security Description | | Principal Amount | | | Value | |
| Utilities (continued) | | | | | | | | |
| Exelon Corp. | | | | | | | | |
| 3.40%, 04/15/2026 | | $ | 112,000 | | | $ | 119,503 | |
| Southern Co. | | | | | | | | |
| 2.95%, 07/01/2023 | | | 350,000 | | | | 359,520 | |
| Southwestern Electric Power Co. | | | | | | | | |
| 4.10%, 09/15/2028 | | | 136,000 | | | | 151,214 | |
| Total Utilities | | | | | | | 1,100,716 | |
| | | | | | | | | |
| TOTAL CORPORATE BONDS | | | | | | | | |
| (Cost $71,663,214) | | | | | | | 71,782,066 | |
| | | | | | | | | |
| GOVERNMENT BONDS (27.24%) | | | | | | | | |
| United States Treasury Bond | | | | | | | | |
| 2.75%, 02/15/2028 | | | 6,992,000 | | | | 7,605,712 | |
| 1.25%, 08/15/2031 | | | 2,000,000 | | | | 1,968,281 | |
| 3.88%, 08/15/2040 | | | 974,300 | | | | 1,302,860 | |
| 1.88%, 02/15/2041 | | | 6,303,000 | | | | 6,327,377 | |
| 2.75%, 11/15/2047 | | | 1,324,000 | | | | 1,580,939 | |
| 1.88%, 02/15/2051 | | | 4,583,000 | | | | 4,665,528 | |
| 2.00%, 08/15/2051 | | | 2,000,000 | | | | 2,097,187 | |
| United States Treasury Inflation Indexed Bonds | | | | | | | | |
| 2.13%, 02/15/2040(d) | | | 393,142 | | | | 608,983 | |
| United States Treasury Note | | | | | | | | |
| 2.88%, 10/31/2023 | | | 2,087,000 | | | | 2,181,323 | |
| 3.00%, 10/31/2025 | | | 3,502,000 | | | | 3,768,481 | |
| TOTAL GOVERNMENT BONDS | | | | | | | | |
| (Cost $30,331,775) | | | | | | | 32,106,671 | |
| | | 7 Day Yield | | | Shares | | | Value | |
| SHORT TERM INVESTMENTS (11.29%) | | | | | | | | | |
| Money Market Fund | | | | | | | | | | | | |
State Street Institutional Treasury Plus Money
Market Fund | | | 0.01 | % | | | 13,308,403 | | | | 13,308,403 | |
| TOTAL SHORT TERM INVESTMENTS | | | | | | | | | | | | |
| (Cost $13,308,403) | | | | | | | | | | | 13,308,403 | |
| | | | | | | | | | | | | |
| TOTAL INVESTMENTS (99.43%) | | | | | | | | | | | | |
| (Cost $115,303,392) | | | | | | | | | | $ | 117,197,140 | |
| OTHER ASSETS IN EXCESS OF LIABILITIES (0.57%) | | | | | | | | | | | 675,731 | |
| NET ASSETS - 100.00% | | | | | | | | | | $ | 117,872,871 | |
Investment Abbreviations:
LIBOR - London Interbank Offered Rate
Reference Rates:
3M US L - 3 Month LIBOR as of November 30, 2021 was 0.17%
See Notes to Financial Statements.
| RiverFront Dynamic Core Income ETF | |
| Schedule of Investments | November 30, 2021 |
| (a) | Securities exempt from registration under Rule 144A of the Securities Act of 1933. These securities may be sold in the ordinary course of business in transactions exempt from registration, normally to qualified institutional buyers. At period end, the aggregate market value of those securities was $9,440,742, representing 8.01% of net assets. |
| (b) | Securities were purchased pursuant to Regulation S under the Securities Act of 1933, which exempts securities offered and sold outside of the United States from registration. Such securities cannot be sold in the United States without either an effective registration statement filed pursuant to the Securities Act of 1933, or pursuant to an exemption from registration. As of November 30, 2021, the market value of those securities was $201,650 representing 0.17% of net assets. |
| (c) | Floating or variable rate security. The reference rate is described above. The rate in effect as of November 30, 2021 is based on the reference rate plus the displayed spread as of the security's last reset date. |
| (d) | Principal amount of security is adjusted for inflation. |
See Notes to Financial Statements.
| RiverFront Dynamic US Dividend Advantage ETF | |
| Schedule of Investments | November 30, 2021 |
| Security Description | | Shares | | | Value | |
| COMMON STOCKS (99.55%) | | | | | | |
| Communication Services (4.90%) | | | | | | | | |
| AT&T, Inc. | | | 55,279 | | | $ | 1,262,020 | |
| Meta Platforms, Inc., Class A(a) | | | 3,798 | | | | 1,232,299 | |
| News Corp., Class B | | | 75,471 | | | | 1,626,400 | |
| Sirius XM Holdings, Inc.(b) | | | 156,053 | | | | 951,923 | |
| Verizon Communications, Inc. | | | 28,308 | | | | 1,423,043 | |
| Total Communication Services | | | | | | | 6,495,685 | |
| | | | | | | | | |
| Consumer Discretionary (11.18%) | | | | | | | | |
| Amazon.com, Inc.(a) | | | 1,557 | | | | 5,460,508 | |
| Best Buy Co., Inc. | | | 9,565 | | | | 1,022,116 | |
| Dollar General Corp. | | | 3,263 | | | | 722,102 | |
| Domino's Pizza, Inc. | | | 2,599 | | | | 1,362,240 | |
| Lowe's Cos., Inc. | | | 7,044 | | | | 1,722,892 | |
| NIKE, Inc., Class B | | | 4,531 | | | | 766,826 | |
| PulteGroup, Inc. | | | 12,809 | | | | 640,834 | |
| Starbucks Corp. | | | 11,691 | | | | 1,281,801 | |
| Target Corp. | | | 7,526 | | | | 1,835,140 | |
| Total Consumer Discretionary | | | | | | | 14,814,459 | |
| | | | | | | | | |
| Consumer Staples (6.77%) | | | | | | | | |
| Coca-Cola Co. | | | 44,096 | | | | 2,312,835 | |
| Colgate-Palmolive Co. | | | 22,475 | | | | 1,686,075 | |
| Mondelez International, Inc., Class A | | | 32,430 | | | | 1,911,424 | |
| Philip Morris International, Inc. | | | 5,677 | | | | 487,881 | |
| Vector Group, Ltd. | | | 76,269 | | | | 1,185,220 | |
| Walmart, Inc. | | | 9,909 | | | | 1,393,503 | |
| Total Consumer Staples | | | | | | | 8,976,938 | |
| | | | | | | | | |
| Energy (1.13%) | | | | | | | | |
| Kinder Morgan, Inc. | | | 96,692 | | | | 1,494,858 | |
| | | | | | | | | |
| Financials (9.28%) | | | | | | | | |
| Ameriprise Financial, Inc. | | | 6,314 | | | | 1,828,534 | |
| Artisan Partners Asset Management, Inc., Class A | | | 17,909 | | | | 801,070 | |
| Bank of America Corp. | | | 76,855 | | | | 3,417,742 | |
| First Republic Bank | | | 624 | | | | 130,828 | |
| FNB Corp. | | | 66,868 | | | | 779,681 | |
| Fulton Financial Corp. | | | 63,761 | | | | 1,006,786 | |
| Mercury General Corp. | | | 12,604 | | | | 643,056 | |
| Navient Corp. | | | 43,805 | | | | 864,273 | |
| Progressive Corp. | | | 12,332 | | | | 1,146,136 | |
| Starwood Property Trust, Inc. | | | 34,580 | | | | 863,117 | |
| Trustmark Corp. | | | 26,499 | | | | 811,134 | |
| Total Financials | | | | | | | 12,292,357 | |
| | | | | | | | | |
| Health Care (10.40%) | | | | | | | | |
| AbbVie, Inc. | | | 10,198 | | | | 1,175,626 | |
| Boston Scientific Corp.(a) | | | 46,132 | | | | 1,756,245 | |
| Eli Lilly & Co. | | | 12,325 | | | | 3,057,093 | |
| Humana, Inc. | | | 3,285 | | | | 1,378,747 | |
| Merck & Co., Inc. | | | 22,423 | | | | 1,679,707 | |
| Pfizer, Inc. | | | 52,797 | | | | 2,836,783 | |
| Security Description | | Shares | | | Value | |
| Health Care (continued) | | | | | | | | |
| Zoetis, Inc. | | | 8,534 | | | $ | 1,894,889 | |
| Total Health Care | | | | | | | 13,779,090 | |
| | | | | | | | | |
| Industrials (8.24%) | | | | | | | | |
| 3M Co. | | | 10,992 | | | | 1,869,080 | |
| A O Smith Corp. | | | 8,148 | | | | 644,099 | |
| Fastenal Co. | | | 36,156 | | | | 2,139,351 | |
| Lockheed Martin Corp. | | | 4,402 | | | | 1,467,275 | |
| Northrop Grumman Corp. | | | 3,498 | | | | 1,220,102 | |
| Rollins, Inc. | | | 50,043 | | | | 1,665,431 | |
| United Parcel Service, Inc., Class B | | | 9,668 | | | | 1,917,841 | |
| Total Industrials | | | | | | | 10,923,179 | |
| | | | | | | | | |
| Information Technology (34.74%) | | | | | | | | |
| Advanced Micro Devices, Inc.(a) | | | 12,677 | | | | 2,007,656 | |
| Apple, Inc. | | | 44,408 | | | | 7,340,642 | |
| Broadcom, Inc. | | | 6,217 | | | | 3,442,229 | |
| Cadence Design Systems, Inc.(a) | | | 14,828 | | | | 2,631,377 | |
| Cisco Systems, Inc./Delaware | | | 15,553 | | | | 852,927 | |
| CommVault Systems, Inc.(a) | | | 18,622 | | | | 1,170,951 | |
| Intel Corp. | | | 44,065 | | | | 2,167,998 | |
| Microsoft Corp. | | | 34,189 | | | | 11,302,542 | |
| Motorola Solutions, Inc. | | | 6,002 | | | | 1,519,586 | |
| National Instruments Corp. | | | 15,803 | | | | 656,141 | |
| Oracle Corp. | | | 34,157 | | | | 3,099,406 | |
| Paychex, Inc. | | | 14,196 | | | | 1,692,163 | |
| Power Integrations, Inc. | | | 14,970 | | | | 1,497,449 | |
| Salesforce.com, Inc.(a) | | | 2,801 | | | | 798,173 | |
| Square, Inc., Class A(a)(b) | | | 9,077 | | | | 1,891,011 | |
| Texas Instruments, Inc. | | | 7,142 | | | | 1,373,907 | |
| Visa, Inc. | | | 13,390 | | | | 2,594,580 | |
| Total Information Technology | | | | | | | 46,038,738 | |
| | | | | | | | | |
| Materials (1.45%) | | | | | | | | |
| Newmont Mining Corp. | | | 26,522 | | | | 1,456,588 | |
| Westrock Co. | | | 10,745 | | | | 466,226 | |
| Total Materials | | | | | | | 1,922,814 | |
| | | | | | | | | |
| Real Estate (9.83%) | | | | | | | | |
| American Assets Trust, Inc. | | | 25,052 | | | | 861,789 | |
| American Tower Corp. | | | 7,121 | | | | 1,869,120 | |
| Brandywine Realty Trust | | | 53,127 | | | | 682,682 | |
| Douglas Emmett, Inc. | | | 15,320 | | | | 502,036 | |
| Equity Residential | | | 19,293 | | | | 1,645,886 | |
| Iron Mountain, Inc. | | | 33,996 | | | | 1,544,778 | |
| Kimco Realty Corp. | | | 1,583 | | | | 35,491 | |
| Lexington Realty Trust | | | 43,019 | | | | 647,436 | |
| National Health Investors, Inc. | | | 9,211 | | | | 481,183 | |
| Omega Healthcare Investors, Inc. | | | 16,969 | | | | 474,114 | |
| Paramount Group, Inc. | | | 80,881 | | | | 643,813 | |
| Piedmont Office Realty Trust, Inc., Class A | | | 71,344 | | | | 1,239,959 | |
| Prologis, Inc. | | | 8,324 | | | | 1,254,843 | |
| Sabra Health Care REIT, Inc. | | | 37,088 | | | | 479,548 | |
See Notes to Financial Statements.
| RiverFront Dynamic US Dividend Advantage ETF | |
| Schedule of Investments | November 30, 2021 |
| Security Description | | Shares | | | Value | |
| Real Estate (continued) | | | | | | | | |
| SITE Centers Corp. | | | 43,742 | | | $ | 658,754 | |
| Total Real Estate | | | | | | | 13,021,432 | |
| | | | | | | | | |
| Utilities (1.63%) | | | | | | | | |
| Alliant Energy Corp. | | | 8,291 | | | | 454,264 | |
| Entergy Corp. | | | 7,937 | | | | 796,399 | |
| PPL Corp. | | | 32,879 | | | | 915,022 | |
| Total Utilities | | | | | | | 2,165,685 | |
| | | | | | | | | |
| TOTAL COMMON STOCKS | | | | | | | | |
| (Cost $93,087,500) | | | | | | | 131,925,235 | |
| | | 7 Day Yield | | | Shares | | | Value | |
| SHORT TERM INVESTMENTS (0.44%) | | | | | | | | | |
| Money Market Fund (0.35%) | | | | | | | | | | | | |
| State Street Institutional Treasury Plus Money Market Fund | | | | | | | | | | | | |
| (Cost $467,176) | | | 0.01 | % | | | 467,176 | | | | 467,176 | |
| | | | | | | | | | | | | |
| Investments Purchased with Collateral from Securities Loaned (0.09%) | | | | | | | | | | | | |
| State Street Navigator Securities Lending Government Money Market Portfolio, 0.03% | | | | | | | | | | | | |
| (Cost $117,429) | | | | | | | 117,429 | | | | 117,429 | |
| TOTAL SHORT TERM INVESTMENTS | | | | | | | | | | | | |
| (Cost $584,605) | | | | | | | | | | | 584,605 | |
| | | | | | | | | | | | | |
| TOTAL INVESTMENTS (99.99%) | | | | | | | | | | | | |
| (Cost $93,672,105) | | | | | | | | | | $ | 132,509,840 | |
| OTHER ASSETS IN EXCESS OF LIABILITIES (0.01%) | | | | | | | | | | | 14,353 | |
| NET ASSETS - 100.00% | | | | | | | | | | $ | 132,524,193 | |
| (a) | Non-income producing security. |
| (b) | Security, or a portion of the security position is currently on loan. The total market value of securities on loan is $1,504,347. |
See Notes to Financial Statements.
| RiverFront Dynamic US Flex-Cap ETF | |
| Schedule of Investments | November 30, 2021 |
| Security Description | | Shares | | | Value | |
| COMMON STOCKS (99.56%) | | | | | | |
| Communication Services (5.78%) | | | | | | | | |
| Alphabet, Inc., Class A(a) | | | 157 | | | $ | 445,558 | |
| Alphabet, Inc., Class C(a) | | | 145 | | | | 413,111 | |
| Comcast Corp., Class A | | | 8,748 | | | | 437,225 | |
| Meta Platforms, Inc., Class A(a) | | | 1,936 | | | | 628,154 | |
| New York Times Co., Class A | | | 6,193 | | | | 294,167 | |
| Sirius XM Holdings, Inc.(b) | | | 47,616 | | | | 290,458 | |
| Verizon Communications, Inc. | | | 9,610 | | | | 483,095 | |
| Total Communication Services | | | | | | | 2,991,768 | |
| | | | | | | | | |
| Consumer Discretionary (10.28%) | | | | | | | | |
| Adtalem Global Education, Inc.(a) | | | 5,972 | | | | 177,189 | |
| Amazon.com, Inc.(a) | | | 485 | | | | 1,700,929 | |
| Chegg, Inc.(a) | | | 3,534 | | | | 98,422 | |
| Domino's Pizza, Inc. | | | 853 | | | | 447,091 | |
| Hanesbrands, Inc. | | | 13,191 | | | | 213,035 | |
| Lowe's Cos., Inc. | | | 2,693 | | | | 658,681 | |
| PulteGroup, Inc. | | | 6,390 | | | | 319,692 | |
| Sonic Automotive, Inc., Class A | | | 6,279 | | | | 281,990 | |
| Target Corp. | | | 2,726 | | | | 664,708 | |
| Wendy's Co. | | | 10,005 | | | | 205,903 | |
| Williams-Sonoma, Inc. | | | 2,830 | | | | 551,397 | |
| Total Consumer Discretionary | | | | | | | 5,319,037 | |
| | | | | | | | | |
| Consumer Staples (6.66%) | | | | | | | | |
| Brown-Forman Corp. | | | 4,590 | | | | 301,425 | |
| Coca-Cola Co. | | | 10,517 | | | | 551,617 | |
| Colgate-Palmolive Co. | | | 5,018 | | | | 376,450 | |
| Mondelez International, Inc., Class A | | | 7,091 | | | | 417,943 | |
| Procter & Gamble Co. | | | 4,772 | | | | 689,936 | |
| Sprouts Farmers Market, Inc.(a) | | | 8,037 | | | | 212,659 | |
| Vector Group, Ltd. | | | 23,864 | | | | 370,847 | |
| Walmart, Inc. | | | 3,733 | | | | 524,972 | |
| Total Consumer Staples | | | | | | | 3,445,849 | |
| | | | | | | | | |
| Energy (1.23%) | | | | | | | | |
| Coterra Energy, Inc. | | | 11,893 | | | | 238,811 | |
| EOG Resources, Inc. | | | 4,570 | | | | 397,590 | |
| Total Energy | | | | | | | 636,401 | |
| | | | | | | | | |
| Financials (9.54%) | | | | | | | | |
| Ameriprise Financial, Inc. | | | 2,055 | | | | 595,128 | |
| Berkshire Hathaway, Inc., Class B(a) | | | 687 | | | | 190,086 | |
| BlackRock, Inc. | | | 683 | | | | 617,849 | |
| First Commonwealth Financial Corp. | | | 23,599 | | | | 354,693 | |
| Hope Bancorp, Inc. | | | 20,018 | | | | 287,258 | |
| Kearny Financial Corp. | | | 24,054 | | | | 305,726 | |
| Mercury General Corp. | | | 5,839 | | | | 297,906 | |
| OceanFirst Financial Corp. | | | 9,812 | | | | 202,225 | |
| Progressive Corp. | | | 6,604 | | | | 613,776 | |
| Provident Financial Services, Inc. | | | 14,448 | | | | 340,106 | |
| Security Description | | Shares | | | Value | |
| Financials (continued) | | | | | | |
| S&P Global, Inc. | | | 1,099 | | | $ | 500,847 | |
| Trupanion, Inc.(a)(b) | | | 3,047 | | | | 375,756 | |
| Trustmark Corp. | | | 8,250 | | | | 252,533 | |
| Total Financials | | | | | | | 4,933,889 | |
| | | | | | | | | |
| Health Care (12.44%) | | | | | | | | |
| AbbVie, Inc. | | | 4,842 | | | | 558,186 | |
| Anthem, Inc. | | | 1,319 | | | | 535,817 | |
| Boston Scientific Corp.(a) | | | 9,635 | | | | 366,805 | |
| Eli Lilly & Co. | | | 3,019 | | | | 748,833 | |
| Exelixis, Inc.(a) | | | 13,186 | | | | 221,393 | |
| Johnson & Johnson | | | 1,066 | | | | 166,221 | |
| Merck & Co., Inc. | | | 6,373 | | | | 477,401 | |
| NeoGenomics, Inc.(a) | | | 5,824 | | | | 199,530 | |
| Pacific Biosciences of | | | | | | | | |
| California, Inc.(a) | | | 16,196 | | | | 375,909 | |
| Perrigo Co. PLC | | | 5,062 | | | | 185,826 | |
| Quidel Corp.(a) | | | 1,416 | | | | 208,945 | |
| RadNet, Inc.(a) | | | 12,240 | | | | 329,990 | |
| STAAR Surgical Co.(a) | | | 2,996 | | | | 285,189 | |
| UnitedHealth Group, Inc. | | | 2,017 | | | | 895,992 | |
| Vertex Pharmaceuticals, Inc.(a) | | | 1,424 | | | | 266,203 | |
| Zoetis, Inc. | | | 2,750 | | | | 610,610 | |
| Total Health Care | | | | | | | 6,432,850 | |
| | | | | | | | | |
| Industrials (9.90%) | | | | | | | | |
| 3M Co. | | | 2,488 | | | | 423,060 | |
| Allison Transmission Holdings, Inc. | | | 5,535 | | | | 191,456 | |
| CACI International, Inc., Class A(a) | | | 815 | | | | 211,435 | |
| Cintas Corp. | | | 1,010 | | | | 426,412 | |
| CoreCivic, Inc.(a) | | | 34,422 | | | | 370,725 | |
| Expeditors International of Washington, Inc. | | | 2,521 | | | | 306,604 | |
| Fastenal Co. | | | 5,179 | | | | 306,441 | |
| General Electric Co. | | | 2,199 | | | | 208,883 | |
| Graco, Inc. | | | 5,332 | | | | 388,650 | |
| Hubbell, Inc. | | | 1,349 | | | | 263,999 | |
| Lockheed Martin Corp. | | | 1,020 | | | | 339,986 | |
| Northrop Grumman Corp. | | | 1,068 | | | | 372,518 | |
| Rollins, Inc. | | | 8,248 | | | | 274,493 | |
| Steelcase, Inc., Class A | | | 13,677 | | | | 153,046 | |
| United Parcel Service, Inc., | | | | | | | | |
| Class B | | | 2,794 | | | | 554,246 | |
| Vicor Corp.(a) | | | 2,300 | | | | 329,958 | |
| Total Industrials | | | | | | | 5,121,912 | |
| | | | | | | | | |
| Information Technology (34.58%) | | | | | | | | |
| Adobe, Inc.(a) | | | 1,113 | | | | 745,543 | |
| Advanced Micro Devices, Inc.(a) | | | 4,793 | | | | 759,067 | |
| Apple, Inc. | | | 18,918 | | | | 3,127,145 | |
| Broadcom, Inc. | | | 1,039 | | | | 575,274 | |
| Cognizant Technology Solutions Corp., Class A | | | 3,303 | | | | 257,568 | |
| Enphase Energy, Inc.(a) | | | 3,400 | | | | 850,000 | |
| Entegris, Inc. | | | 3,721 | | | | 543,564 | |
See Notes to Financial Statements.
| RiverFront Dynamic US Flex-Cap ETF | |
| Schedule of Investments | November 30, 2021 |
| Security Description | | Shares | | | Value | |
| Information Technology (continued) | | | | | | |
| EPAM Systems, Inc.(a) | | | 956 | | | $ | 581,774 | |
| Gogo, Inc.(a)(b) | | | 23,949 | | | | 307,026 | |
| Intel Corp. | | | 10,979 | | | | 540,167 | |
| Knowles Corp.(a) | | | 17,268 | | | | 375,061 | |
| Mastercard, Inc., Class A | | | 1,940 | | | | 610,945 | |
| Microsoft Corp. | | | 10,113 | | | | 3,343,257 | |
| Monolithic Power Systems, Inc. | | | 1,222 | | | | 676,328 | |
| NCR Corp.(a) | | | 7,041 | | | | 273,895 | |
| Oracle Corp. | | | 7,669 | | | | 695,885 | |
| PayPal Holdings, Inc.(a) | | | 2,854 | | | | 527,676 | |
| Power Integrations, Inc. | | | 4,594 | | | | 459,538 | |
| Salesforce.com, Inc.(a) | | | 2,268 | | | | 646,289 | |
| Square, Inc., Class A(a)(b) | | | 1,951 | | | | 406,452 | |
| Visa, Inc. | | | 3,516 | | | | 681,295 | |
| VMware, Inc., Class A | | | 2,120 | | | | 247,489 | |
| Zebra Technologies Corp., Class A(a) | | | 1,117 | | | | 657,667 | |
| Total Information Technology | | | | | | | 17,888,905 | |
| | | | | | | | | |
| Materials (3.66%) | | | | | | | | |
| Axalta Coating Systems, Ltd.(a) | | | 8,251 | | | | 250,170 | |
| Eastman Chemical Co. | | | 2,346 | | | | 244,664 | |
| FMC Corp. | | | 2,883 | | | | 288,848 | |
| NewMarket Corp. | | | 440 | | | | 145,772 | |
| O-I, Inc.(a) | | | 22,824 | | | | 252,662 | |
| Packaging Corp. of America | | | 1,540 | | | | 201,109 | |
| Vulcan Materials Co. | | | 1,652 | | | | 316,589 | |
| Westrock Co. | | | 4,495 | | | | 195,038 | |
| Total Materials | | | | | | | 1,894,852 | |
| | | | | | | | | |
| Real Estate (4.86%) | | | | | | | | |
| Apartment Income REIT Corp. | | | 5,301 | | | | 269,079 | |
| Apartment Investment and Management Co., Class A(a) | | | 5,301 | | | | 39,280 | |
| CubeSmart | | | 6,601 | | | | 355,926 | |
| Douglas Emmett, Inc. | | | 6,986 | | | | 228,931 | |
| Kennedy-Wilson Holdings, Inc. | | | 13,436 | | | | 291,427 | |
| Kimco Realty Corp. | | | 14,501 | | | | 325,113 | |
| Piedmont Office Realty Trust, Inc., Class A | | | 16,542 | | | | 287,500 | |
| Prologis, Inc. | | | 4,771 | | | | 719,228 | |
| Total Real Estate | | | | | | | 2,516,484 | |
| | | | | | | | | |
| Utilities (0.63%) | | | | | | | | |
| Entergy Corp. | | | 3,267 | | | | 327,811 | |
| | | | | | | | | |
| TOTAL COMMON STOCKS | | | | | | | | |
| (Cost $35,992,455) | | | | | | | 51,509,758 | |
| Security Description | | Shares | | | Value | |
| EXCHANGE TRADED FUNDS (0.17%) | | | | | | |
| iShares Core S&P 500 ETF | | | 191 | | | $ | 87,408 | |
| | | | | | | | | |
| TOTAL EXCHANGE TRADED FUNDS | | | | | | | | |
| (Cost $84,839) | | | | | | | 87,408 | |
| | | 7 Day Yield | | | Shares | | | Value | |
| SHORT TERM INVESTMENTS (0.77%) | | | | | |
| Money Market Fund (0.21%) | | | | | | | | | |
State Street Institutional Treasury Plus
Money Market Fund | | | | | | | | | | | | |
| (Cost $109,022) | | | 0.01 | % | | | 109,022 | | | | 109,022 | |
| | | | | | | | | | | | | |
| Investments Purchased with Collateral from Securities Loaned (0.56%) | | | | | | | | | | | | |
| State Street Navigator Securities Lending Government Money Market Portfolio, 0.03% | | | | | | | | | | | | |
| (Cost $287,699) | | | | | | | 287,699 | | | | 287,699 | |
| TOTAL SHORT TERM INVESTMENTS | | | | | | | |
| (Cost $396,721) | | | | | | | | | | | 396,721 | |
| | | | | | | | | | | | | |
| TOTAL INVESTMENTS (100.50%) | | | | | | | | | | | | |
| (Cost $36,474,015) | | | | | | | | | | $ | 51,993,887 | |
| LIABILITIES IN EXCESS OF OTHER ASSETS (-0.50%) | | | | | | (259,219 | ) |
| NET ASSETS - 100.00% | | | | | | | | | | $ | 51,734,668 | |
| (a) | Non-income producing security. |
| (b) | Security, or a portion of the security position is currently on loan. The total market value of securities on loan is $855,062. |
See Notes to Financial Statements.
| RiverFront Strategic Income Fund | |
| Schedule of Investments | November 30, 2021 |
| Security Description | | Principal Amount | | | Value | |
| CORPORATE BONDS (81.86%) | | | | | | |
| Communications (5.53%) | | | | | | | | |
| AMC Networks, Inc. | | | | | | | | |
| 5.00%, 04/01/2024 | | $ | 420,000 | | | $ | 422,978 | |
| 4.75%, 08/01/2025 | | | 500,000 | | | | 508,867 | |
| CCO Holdings LLC / CCO Holdings | | | | | | | | |
| Capital Corp. | | | | | | | | |
| 5.50%, 05/01/2026(a) | | | 580,000 | | | | 599,505 | |
| CSC Holdings LLC | | | | | | | | |
| 5.50%, 04/15/2027(a) | | | 1,075,000 | | | | 1,105,530 | |
| Level 3 Financing, Inc. | | | | | | | | |
| 3.75%, 07/15/2029(a) | | | 1,268,000 | | | | 1,179,684 | |
| Netflix, Inc. | | | | | | | | |
| 4.38%, 11/15/2026 | | | 1,000,000 | | | | 1,103,665 | |
| Sirius XM Radio, Inc. | | | | | | | | |
| 3.13%, 09/01/2026(a) | | | 1,045,000 | | | | 1,031,133 | |
| T-Mobile USA, Inc. | | | | | | | | |
| 2.63%, 04/15/2026 | | | 1,953,000 | | | | 1,956,662 | |
| Total Communications | | | | | | | 7,908,024 | |
| | | | | | | | | |
| Consumer Discretionary (14.69%) | | | | | | | | |
| Air Canada | | | | | | | | |
| 3.88%, 08/15/2026(a) | | | 1,098,000 | | | | 1,096,227 | |
| Aramark Services, Inc. | | | | | | | | |
| 6.38%, 05/01/2025(a) | | | 1,098,000 | | | | 1,146,422 | |
| Caesars Entertainment, Inc. | | | | | | | | |
| 6.25%, 07/01/2025(a) | | | 1,300,000 | | | | 1,353,157 | |
| DR Horton, Inc. | | | | | | | | |
| 4.38%, 09/15/2022 | | | 1,738,000 | | | | 1,770,951 | |
| Goodyear Tire & Rubber Co. | | | | | | | | |
| 5.00%, 05/31/2026 | | | 1,334,000 | | | | 1,365,922 | |
| Hilton Domestic Operating Co., Inc. | | | | | | | | |
| 3.75%, 05/01/2029(a) | | | 1,209,000 | | | | 1,199,588 | |
| International Game Technology PLC | | | | | | | | |
| 6.50%, 02/15/2025(a) | | | 1,148,000 | | | | 1,247,044 | |
| Las Vegas Sands Corp. | | | | | | | | |
| 3.20%, 08/08/2024 | | | 972,000 | | | | 991,986 | |
| Lennar Corp. | | | | | | | | |
| 4.75%, 11/29/2027 | | | 1,209,000 | | | | 1,375,558 | |
| MGM Resorts International | | | | | | | | |
| 6.00%, 03/15/2023 | | | 1,300,000 | | | | 1,355,172 | |
| Newell Brands, Inc. | | | | | | | | |
| 4.35%, 04/01/2023 | | | 400,000 | | | | 414,824 | |
| 4.70%, 04/01/2026 | | | 1,000,000 | | | | 1,072,188 | |
| Nissan Motor Co., Ltd. | | | | | | | | |
| 3.52%, 09/17/2025(a) | | | 1,209,000 | | | | 1,268,813 | |
| PulteGroup, Inc. | | | | | | | | |
| 5.50%, 03/01/2026 | | | 1,610,000 | | | | 1,837,775 | |
| Royal Caribbean Cruises, Ltd. | | | | | | | | |
| 10.88%, 06/01/2023(a) | | | 1,357,000 | | | | 1,477,678 | |
| Six Flags Entertainment Corp. | | | | | | | | |
| 4.88%, 07/31/2024(a) | | | 729,000 | | | | 735,379 | |
| Security Description | | Principal Amount | | | Value | |
| Consumer Discretionary (continued) | | | | | | |
| Yum! Brands, Inc. | | | | | | | | |
| 7.75%, 04/01/2025(a) | | $ | 1,209,000 | | | $ | 1,276,819 | |
| Total Consumer Discretionary | | | | | | | 20,985,503 | |
| | | | | | | | | |
| Consumer Staples (2.63%) | | | | | | | | |
| Anheuser-Busch InBev | | | | | | | | |
| Worldwide, Inc. | | | | | | | | |
| 4.75%, 01/23/2029 | | | 1,098,000 | | | | 1,281,517 | |
| JBS USA Food Co. | | | | | | | | |
| 7.00%, 01/15/2026 | | | 1,278,000 | | | | 1,331,720 | |
| Spectrum Brands, Inc. | | | | | | | | |
| 5.75%, 07/15/2025 | | | 30,000 | | | | 30,590 | |
| US Foods, Inc. | | | | | | | | |
| 6.25%, 04/15/2025(a) | | | 1,075,000 | | | | 1,120,935 | |
| Total Consumer Staples | | | | | | | 3,764,762 | |
| | | | | | | | | |
| Energy (5.36%) | | | | | | | | |
| Cheniere Corpus Christi Holdings LLC | | | | | | | | |
| 7.00%, 06/30/2024 | | | 1,271,000 | | | | 1,414,294 | |
| DCP Midstream Operating LP | | | | | | | | |
| 5.38%, 07/15/2025 | | | 1,045,000 | | | | 1,119,435 | |
| EQM Midstream Partners LP | | | | | | | | |
| 4.75%, 07/15/2023 | | | 408,000 | | | | 421,025 | |
| Occidental Petroleum Corp. | | | | | | | | |
| 2.90%, 08/15/2024 | | | 1,120,000 | | | | 1,124,010 | |
| Petroleos Mexicanos | | | | | | | | |
| 4.88%, 01/18/2024 | | | 1,075,000 | | | | 1,095,576 | |
| Schlumberger Holdings Corp. | | | | | | | | |
| 3.90%, 05/17/2028(a) | | | 1,098,000 | | | | 1,200,256 | |
| Valero Energy Corp. | | | | | | | | |
| 3.40%, 09/15/2026 | | | 1,209,000 | | | | 1,283,507 | |
| Total Energy | | | | | | | 7,658,103 | |
| | | | | | | | | |
| Financials (25.25%) | | | | | | | | |
| Air Lease Corp. | | | | | | | | |
| 4.25%, 02/01/2024 | | | 1,008,000 | | | | 1,067,908 | |
| Ares Capital Corp. | | | | | | | | |
| 3.50%, 02/10/2023 | | | 1,212,000 | | | | 1,243,367 | |
| Avolon Holdings Funding, Ltd. | | | | | | | | |
| 2.53%, 11/18/2027(a) | | | 1,142,000 | | | | 1,115,128 | |
| Bancolombia SA | | | | | | | | |
| 5.13%, 09/11/2022 | | | 996,000 | | | | 1,018,231 | |
| Bank of America Corp. | | | | | | | | |
| 4.25%, 10/22/2026 | | | 1,649,000 | | | | 1,819,893 | |
| Blackstone Secured Lending Fund | | | | | | | | |
| 3.63%, 01/15/2026 | | | 1,196,000 | | | | 1,249,378 | |
| Capital One Financial Corp. | | | | | | | | |
| 4.20%, 10/29/2025 | | | 1,098,000 | | | | 1,196,526 | |
| CIT Group, Inc. | | | | | | | | |
| 5.00%, 08/15/2022 | | | 2,121,000 | | | | 2,179,656 | |
| Citigroup, Inc. | | | | | | | | |
| 4.45%, 09/29/2027 | | | 1,649,000 | | | | 1,835,704 | |
| EPR Properties | | | | | | | | |
| 4.75%, 12/15/2026 | | | 1,045,000 | | | | 1,130,596 | |
See Notes to Financial Statements.
| RiverFront Strategic Income Fund | | |
| Schedule of Investments | November 30, 2021 | |
| Security Description | | Principal Amount | | | Value | |
| Financials (continued) | | | | | | |
| FS KKR Capital Corp. | | | | | | | | |
| 3.40%, 01/15/2026 | | $ | 1,209,000 | | | $ | 1,234,300 | |
| GLP Capital LP / GLP Financing II, Inc. | | | | | | | | |
| 3.35%, 09/01/2024 | | | 972,000 | | | | 1,011,716 | |
| Goldman Sachs Group, Inc. | | | | | | | | |
| 4.25%, 10/21/2025 | | | 1,649,000 | | | | 1,795,412 | �� |
| HAT Holdings I LLC / HAT Holdings II LLC | | | | | | | | |
| 3.38%, 06/15/2026(a) | | | 1,131,000 | | | | 1,114,917 | |
| Icahn Enterprises LP / Icahn Enterprises Finance Corp. | | | | | | | | |
| 4.75%, 09/15/2024 | | | 1,301,000 | | | | 1,325,654 | |
| Iron Mountain, Inc. | | | | | | | | |
| 4.88%, 09/15/2027(a) | | | 1,161,000 | | | | 1,182,339 | |
| iStar, Inc. | | | | | | | | |
| 4.75%, 10/01/2024 | | | 1,365,000 | | | | 1,413,219 | |
| JPMorgan Chase & Co. | | | | | | | | |
| 4.25%, 10/01/2027 | | | 1,649,000 | | | | 1,844,249 | |
| MPT Operating Partnership LP / | | | | | | | | |
| MPT Finance Corp. | | | | | | | | |
| 5.25%, 08/01/2026 | | | 972,000 | | | | 999,823 | |
| Newmark Group, Inc. | | | | | | | | |
| 6.13%, 11/15/2023 | | | 1,281,000 | | | | 1,379,355 | |
| Omega Healthcare Investors, Inc. | | | | | | | | |
| 4.38%, 08/01/2023 | | | 330,000 | | | | 345,940 | |
| 5.25%, 01/15/2026 | | | 669,000 | | | | 748,166 | |
| OneMain Finance Corp. | | | | | | | | |
| 6.13%, 03/15/2024 | | | 1,300,000 | | | | 1,366,619 | |
| Park Aerospace Holdings, Ltd. | | | | | | | | |
| 5.25%, 08/15/2022(a) | | | 26,000 | | | | 26,677 | |
| Santander Holdings USA, Inc. | | | | | | | | |
| 3.50%, 06/07/2024 | | | 496,000 | | | | 519,554 | |
| SBA Communications Corp. | | | | | | | | |
| 3.88%, 02/15/2027 | | | 1,550,000 | | | | 1,588,265 | |
| Starwood Property Trust, Inc. | | | | | | | | |
| 5.00%, 12/15/2021 | | | 765,000 | | | | 765,796 | |
| 4.75%, 03/15/2025 | | | 1,000,000 | | | | 1,039,063 | |
| Synchrony Financial | | | | | | | | |
| 2.85%, 07/25/2022 | | | 1,030,000 | | | | 1,043,886 | |
| VICI Properties LP / VICI Note Co., Inc. | | | | | | | | |
| 4.25%, 12/01/2026(a) | | | 1,430,000 | | | | 1,476,496 | |
| Total Financials | | | | | | | 36,077,833 | |
| | | | | | | | | |
| Health Care (2.03%) | | | | | | | | |
| DaVita, Inc. | | | | | | | | |
| 4.63%, 06/01/2030(a) | | | 1,161,000 | | | | 1,145,762 | |
| HCA, Inc. | | | | | | | | |
| 5.88%, 05/01/2023 | | | 1,133,000 | | | | 1,201,376 | |
| 5.38%, 02/01/2025 | | | 500,000 | | | | 546,000 | |
| Total Health Care | | | | | | | 2,893,138 | |
| | | | | | | | | |
| Industrials (5.13%) | | | | | | | | |
| Boeing Co. | | | | | | | | |
| 4.88%, 05/01/2025 | | | 1,209,000 | | | | 1,326,344 | |
| Security Description | | Principal Amount | | | Value | |
| Industrials (continued) | | | | | | |
| MasTec, Inc. | | | | | | | | |
| 4.50%, 08/15/2028(a) | | $ | 1,118,000 | $ | | | 1,150,500 | |
| Sensata Technologies BV | | | | | | | | |
| 5.00%, 10/01/2025(a) | | | 1,000,000 | | | | 1,084,285 | |
| Stericycle, Inc. | | | | | | | | |
| 5.38%, 07/15/2024(a) | | | 1,046,000 | | | | 1,072,098 | |
| TransDigm, Inc. | | | | | | | | |
| 6.25%, 03/15/2026(a) | | | 1,075,000 | | | | 1,116,860 | |
| WESCO Distribution, Inc. | | | | | | | | |
| 7.13%, 06/15/2025(a) | | | 1,500,000 | | | | 1,586,303 | |
| Total Industrials | | | | | | | 7,336,390 | |
| | | | | | | | | |
| Materials (13.71%) | | | | | | | | |
| Alcoa Nederland Holding BV | | | | | | | | |
| 4.13%, 03/31/2029(a) | | | 1,357,000 | | | | 1,386,081 | |
| ArcelorMittal SA | | | | | | | | |
| 3.60%, 07/16/2024 | | | 1,133,000 | | | | 1,188,767 | |
| Arconic Corp. | | | | | | | | |
| 6.00%, 05/15/2025(a) | | | 1,098,000 | | | | 1,146,603 | |
| Ardagh Packaging Finance PLC / | | | | | | | | |
| Ardagh Holdings USA, Inc. | | | | | | | | |
| 5.25%, 04/30/2025(a) | | | 1,322,000 | | | | 1,362,870 | |
| Ball Corp. | | | | | | | | |
| 5.25%, 07/01/2025 | | | 834,000 | | | | 916,228 | |
| 4.88%, 03/15/2026 | | | 500,000 | | | | 544,688 | |
| Berry Global, Inc. | | | | | | | | |
| 4.88%, 07/15/2026(a) | | | 1,160,000 | | | | 1,205,037 | |
| Braskem Finance, Ltd. | | | | | | | | |
| 6.45%, 02/03/2024 | | | 1,335,000 | | | | 1,447,754 | |
| CF Industries, Inc. | | | | | | | | |
| 3.45%, 06/01/2023 | | | 879,000 | | | | 911,505 | |
| Freeport-McMoRan, Inc. | | | | | | | | |
| 3.88%, 03/15/2023 | | | 1,133,000 | | | | 1,167,194 | |
| 5.00%, 09/01/2027 | | | 550,000 | | | | 572,643 | |
| Graphic Packaging International LLC | | | | | | | | |
| 4.88%, 11/15/2022 | | | 1,481,000 | | | | 1,515,374 | |
| Mauser Packaging Solutions Holding Co. | | | | | | | | |
| 5.50%, 04/15/2024(a) | | | 434,000 | | | | 435,050 | |
| Methanex Corp. | | | | | | | | |
| 5.13%, 10/15/2027 | | | 1,075,000 | | | | 1,125,611 | |
| NOVA Chemicals Corp. | | | | | | | | |
| 4.88%, 06/01/2024(a) | | | 1,300,000 | | | | 1,349,848 | |
| Novelis Corp. | | | | | | | | |
| 3.25%, 11/15/2026(a) | | | 1,045,000 | | | | 1,045,679 | |
| Sasol Financing International, Ltd. | | | | | | | | |
| 4.50%, 11/14/2022 | | | 582,000 | | | | 590,348 | |
| Sasol Financing USA LLC | | | | | | | | |
| 4.38%, 09/18/2026 | | | 669,000 | | | | 660,310 | |
| Standard Industries, Inc. | | | | | | | | |
| 3.38%, 01/15/2031(a) | | | 1,098,000 | | | | 1,013,278 | |
| Total Materials | | | | | | | 19,584,868 | |
See Notes to Financial Statements.
| RiverFront Strategic Income Fund | |
| Schedule of Investments | November 30, 2021 |
| Security Description | | Principal Amount | | | Value | |
| Technology (3.30%) | | | | | | |
| Flex, Ltd. | | | | | | | | |
| 5.00%, 02/15/2023 | | $ | 1,333,000 | $ | | | 1,397,353 | |
| Microchip Technology, Inc. | | | | | | | | |
| 4.25%, 09/01/2025 | | | 1,118,000 | | | | 1,158,553 | |
| NortonLifeLock, Inc. | | | | | | | | |
| 3.95%, 06/15/2022 | | | 146,000 | | | | 146,311 | |
| 5.00%, 04/15/2025(a) | | | 859,000 | | | | 869,660 | |
| Seagate HDD Cayman | | | | | | | | |
| 4.75%, 06/01/2023 | | | 1,098,000 | | | | 1,149,601 | |
| Total Technology | | | | | | | 4,721,478 | |
| | | | | | | | | |
| Utilities (4.23%) | | | | | | | | |
| AmeriGas Partners LP / AmeriGas | | | | | | | | |
| Finance Corp. | | | | | | | | |
| 5.88%, 08/20/2026 | | | 1,131,000 | | | | 1,236,500 | |
| Calpine Corp. | | | | | | | | |
| 5.25%, 06/01/2026(a) | | | 1,081,000 | | | | 1,107,686 | |
| NextEra Energy Operating Partners LP | | | | | | | | |
| 4.25%, 07/15/2024(a) | | | 1,496,000 | | | | 1,532,196 | |
| NRG Energy, Inc. | | | | | | | | |
| 6.63%, 01/15/2027 | | | 374,000 | | | | 387,120 | |
| Vistra Operations Co. LLC | | | | | | | | |
| 3.55%, 07/15/2024(a) | | | 1,721,000 | | | | 1,785,931 | |
| Total Utilities | | | | | | | 6,049,433 | |
| | | | | | | | | |
| TOTAL CORPORATE BONDS | | | | | | | | |
| (Cost $117,462,395) | | | | | | | 116,979,532 | |
| | | | | | | | | |
| GOVERNMENT BONDS (6.30%) | | | | | | | | |
| United States Treasury Bond | | | | | | | | |
| 1.13%, 02/15/2031 | | | 5,420,000 | | | | 5,292,546 | |
| 1.13%, 08/15/2040 | | | 1,357,000 | | | | 1,200,627 | |
| 2.00%, 02/15/2050 | | | 2,403,000 | | | | 2,513,856 | |
| TOTAL GOVERNMENT BONDS | | | | | | | | |
| (Cost $8,545,528) | | | | | | | 9,007,029 | |
| | | 7 Day Yield | | | Shares | | | Value | |
| SHORT TERM INVESTMENTS (10.90%) | | | | | |
| Money Market Fund | | | | | | | | | | | | |
| State Street Institutional Treasury Plus Money Market Fund | | | 0.01 | % | | | 15,569,861 | | | | 15,569,861 | |
| TOTAL SHORT TERM INVESTMENTS | | | | | | | |
| (Cost $15,569,861) | | | | | | | | | | | 15,569,861 | |
| | | | | | | | | | | | | |
| TOTAL INVESTMENTS (99.06%) | | | | | | | | | | | | |
| (Cost $141,577,784) | | | | | | | | | | $ | 141,556,422 | |
| OTHER ASSETS IN EXCESS OF LIABILITIES (0.94%) | | | | | | 1,336,764 | |
| NET ASSETS - 100.00% | | | | | | | | | | $ | 142,893,186 | |
| (a) | Securities exempt from registration under Rule 144A of the Securities Act of 1933. These securities may be sold in the ordinary course of business in transactions exempt from registration, normally to qualified institutional buyers. At period end, the aggregate market value of those securities was $43,349,454, representing 30.34% of net assets. |
See Notes to Financial Statements.
| RiverFront ETFs | |
| Statement of Assets and Liabilities | November 30, 2021 |
| | | RiverFront Dynamic Core Income ETF | | | RiverFront Dynamic US Dividend Advantage ETF | | | RiverFront Dynamic US Flex- Cap ETF | | | RiverFront Strategic Income Fund | |
| ASSETS: | | | | | | | | | | | | | | | | |
| Investments, at value | | $ | 117,197,140 | | | $ | 132,509,840 | | | $ | 51,993,887 | | | $ | 141,556,422 | |
| Dividend receivable | | | – | | | | 190,258 | | | | 51,333 | | | | – | |
| Interest receivable | | | 725,018 | | | | – | | | | – | | | | 1,424,310 | |
| Total Assets | | | 117,922,158 | | | | 132,700,098 | | | | 52,045,220 | | | | 142,980,732 | |
| | | | | | | | | | | | | | | | | |
| LIABILITIES: | | | | | | | | | | | | | | | | |
| Payable to adviser | | | 49,287 | | | | 58,476 | | | | 22,853 | | | | 54,196 | |
| Payable for investments purchased | | | – | | | | – | | | | – | | | | 33,350 | |
| Payable for collateral upon return of securities loaned | | | – | | | | 117,429 | | | | 287,699 | | | | – | |
| Total Liabilities | | | 49,287 | | | | 175,905 | | | | 310,552 | | | | 87,546 | |
| NET ASSETS | | $ | 117,872,871 | | | $ | 132,524,193 | | | $ | 51,734,668 | | | $ | 142,893,186 | |
| | | | | | | | | | | | | | | | | |
| NET ASSETS CONSIST OF: | | | | | | | | | | | | | | | | |
| Paid-in capital | | $ | 114,258,887 | | | $ | 110,873,706 | | | $ | 60,381,219 | | | $ | 152,981,346 | |
| Total distributable earnings | | | 3,613,984 | | | | 21,650,487 | | | | (8,646,551 | ) | | | (10,088,160 | ) |
| NET ASSETS | | $ | 117,872,871 | | | $ | 132,524,193 | | | $ | 51,734,668 | | | $ | 142,893,186 | |
| | | | | | | | | | | | | | | | | |
| INVESTMENTS, AT COST | | $ | 115,303,392 | | | $ | 93,672,105 | | | $ | 36,474,015 | | | $ | 141,577,784 | |
| | | | | | | | | | | | | | | | | |
| PRICING OF SHARES | | | | | | | | | | | | | | | | |
| Net Assets | | $ | 117,872,871 | | | $ | 132,524,193 | | | $ | 51,734,668 | | | $ | 142,893,186 | |
| Shares of beneficial interest outstanding (Unlimited number of shares authorized, par value $0.01 per share) | | | 4,650,000 | | | | 2,950,002 | | | | 1,125,002 | | | | 5,825,000 | |
| Net Asset Value, offering and redemption price per share | | $ | 25.35 | | | $ | 44.92 | | | $ | 45.99 | | | $ | 24.53 | |
See Notes to Financial Statements.
| RiverFront ETFs | |
| Statement of Operations | For the Year Ended November 30, 2021 |
| | | RiverFront Dynamic Core Income ETF | | | RiverFront Dynamic US Dividend Advantage ETF | | | RiverFront Dynamic US Flex- Cap ETF | | | RiverFront Strategic Income Fund | |
| INVESTMENT INCOME: | | | | | | | | | | | | |
| Interest | | $ | 2,543,754 | | | $ | – | | | $ | – | | | $ | 3,367,279 | |
| Dividends(a) | | | 1,480 | | | | 2,574,570 | | | | 712,667 | | | | 2,163 | |
| Non-Cash Dividends(b) | | | – | | | | – | | | | 208,615 | | | | – | |
| Securities Lending Income | | | – | | | | 2,421 | | | | 5,591 | | | | – | |
| Total Investment Income | | | 2,545,234 | | | | 2,576,991 | | | | 926,873 | | | | 3,369,442 | |
| | | | | | | | | | | | | | | | | |
| EXPENSES: | | | | | | | | | | | | | | | | |
| Investment adviser and sub-adviser fees (Note 3) | | | 555,036 | | | | 674,222 | | | | 322,665 | | | | 575,624 | |
| Total Expenses | | | 555,036 | | | | 674,222 | | | | 322,665 | | | | 575,624 | |
| NET INVESTMENT INCOME | | | 1,990,198 | | | | 1,902,769 | | | | 604,208 | | | | 2,793,818 | |
| | | | | | | | | | | | | | | | | |
| REALIZED AND UNREALIZED GAIN/(LOSS) | | | | | | | | | | | | | | | | |
| Net realized gain on investments(c) | | | 2,564,824 | | | | 8,733,483 | | | | 10,365,533 | | | | 491,816 | |
| NET REALIZED GAIN | | | 2,564,824 | | | | 8,733,483 | | | | 10,365,533 | | | | 491,816 | |
| Net change in unrealized appreciation/(depreciation) on investments | | | (6,289,006 | ) | | | 15,974,138 | | | | 2,789,216 | | | | (1,547,122 | ) |
| NET CHANGE IN UNREALIZED APPRECIATION/(DEPRECIATION) | | | (6,289,006 | ) | | | 15,974,138 | | | | 2,789,216 | | | | (1,547,122 | ) |
| NET REALIZED AND UNREALIZED GAIN/(LOSS) ON INVESTMENTS | | | (3,724,182 | ) | | | 24,707,621 | | | | 13,154,749 | | | | (1,055,306 | ) |
| NET INCREASE/(DECREASE) IN NET ASSETS RESULTING FROM OPERATIONS | | $ | (1,733,984 | ) | | $ | 26,610,390 | | | $ | 13,758,957 | | | $ | 1,738,512 | |
| (a) | Net of foreign tax withholding in the amounts of $–, $–, $– and $158, respectively. |
| (b) | Represents non-cash distributions in connection with capital changes for certain investments held by the Fund recorded on ex-date and based on fair value. |
| (c) | Includes realized gain or loss as a result of in-kind transactions (See Note 4 in Notes to Financial Statements). |
See Notes to Financial Statements.
| RiverFront Dynamic Core Income ETF |
| Statements of Changes in Net Assets |
| | | For the Year Ended November 30, 2021 | | | For the Year Ended November 30, 2020 | |
| OPERATIONS: | | | | | | |
| Net investment income | | $ | 1,990,198 | | | $ | 2,438,367 | |
| Net realized gain | | | 2,564,824 | | | | 3,629,089 | |
| Net change in unrealized appreciation/(depreciation) | | | (6,289,006 | ) | | | 1,439,069 | |
| Net increase/(decrease) in net assets resulting from operations | | | (1,733,984 | ) | | | 7,506,525 | |
| | | | | | | | | |
| DISTRIBUTIONS TO SHAREHOLDERS: | | | | | | | | |
| From distributable earnings | | | (1,962,506 | ) | | | (2,449,436 | ) |
| Total distributions | | | (1,962,506 | ) | | | (2,449,436 | ) |
| | | | | | | | | |
| CAPITAL SHARE TRANSACTIONS: | | | | | | | | |
| Proceeds from sale of shares | | | 17,914,173 | | | | 11,640,417 | |
| Shares redeemed | | | (9,068,318 | ) | | | (38,925,424 | ) |
| Net increase/(decrease) from share transactions | | | 8,845,855 | | | | (27,285,007 | ) |
| | | | | | | | | |
| Net increase/(decrease) in net assets | | | 5,149,365 | | | | (22,227,918 | ) |
| | | | | | | | | |
| NET ASSETS: | | | | | | | | |
| Beginning of period | | | 112,723,506 | | | | 134,951,424 | |
| End of period | | $ | 117,872,871 | | | $ | 112,723,506 | |
| | | | | | | | | |
| OTHER INFORMATION: | | | | | | | | |
| CAPITAL SHARE TRANSACTIONS: | | | | | | | | |
| Beginning shares | | | 4,300,000 | | | | 5,350,000 | |
| Shares sold | | | 700,000 | | | | 450,000 | |
| Shares redeemed | | | (350,000 | ) | | | (1,500,000 | ) |
| Shares outstanding, end of period | | | 4,650,000 | | | | 4,300,000 | |
See Notes to Financial Statements.
| RiverFront Dynamic US Dividend Advantage ETF |
| Statements of Changes in Net Assets |
| | | For the Year Ended November 30, 2021 | | | For the Year Ended November 30, 2020 | |
| OPERATIONS: | | | | | | |
| Net investment income | | $ | 1,902,769 | | | $ | 2,090,176 | |
| Net realized gain/(loss) | | | 8,733,483 | | | | (3,382,886 | ) |
| Net change in unrealized appreciation | | | 15,974,138 | | | | 17,047,755 | |
| Net increase in net assets resulting from operations | | | 26,610,390 | | | | 15,755,045 | |
| | | | | | | | | |
| DISTRIBUTIONS TO SHAREHOLDERS: | | | | | | | | |
| From distributable earnings | | | (1,936,954 | ) | | | (2,186,237 | ) |
| Total distributions | | | (1,936,954 | ) | | | (2,186,237 | ) |
| | | | | | | | | |
| CAPITAL SHARE TRANSACTIONS: | | | | | | | | |
| Proceeds from sale of shares | | | 4,577,634 | | | | 26,065,088 | |
| Shares redeemed | | | (30,021,042 | ) | | | (37,167,998 | ) |
| Net decrease from share transactions | | | (25,443,408 | ) | | | (11,102,910 | ) |
| | | | | | | | | |
| Net increase/(decrease) in net assets | | | (769,972 | ) | | | 2,465,898 | |
| | | | | | | | | |
| NET ASSETS: | | | | | | | | |
| Beginning of period | | | 133,294,165 | | | | 130,828,267 | |
| End of period | | $ | 132,524,193 | | | $ | 133,294,165 | |
| | | | | | | | | |
| OTHER INFORMATION: | | | | | | | | |
| CAPITAL SHARE TRANSACTIONS: | | | | | | | | |
| Beginning shares | | | 3,600,002 | | | | 3,850,002 | |
| Shares sold | | | 100,000 | | | | 850,000 | |
| Shares redeemed | | | (750,000 | ) | | | (1,100,000 | ) |
| Shares outstanding, end of period | | | 2,950,002 | | | | 3,600,002 | |
See Notes to Financial Statements.
| RiverFront Dynamic US Flex-Cap ETF |
| Statements of Changes in Net Assets |
| | | For the Year Ended November 30, 2021 | | | For the Year Ended November 30, 2020 | |
| OPERATIONS: | | | | | | |
| Net investment income | | $ | 604,208 | | | $ | 1,184,324 | |
| Net realized gain/(loss) | | | 10,365,533 | | | | (7,294,795 | ) |
| Net change in unrealized appreciation | | | 2,789,216 | | | | 6,053,248 | |
| Net increase/(decrease) in net assets resulting from operations | | | 13,758,957 | | | | (57,223 | ) |
| | | | | | | | | |
| DISTRIBUTIONS TO SHAREHOLDERS: | | | | | | | | |
| From distributable earnings | | | (679,274 | ) | | | (1,188,592 | ) |
| Total distributions | | | (679,274 | ) | | | (1,188,592 | ) |
| | | | | | | | | |
| CAPITAL SHARE TRANSACTIONS: | | | | | | | | |
| Proceeds from sale of shares | | | – | | | | 1,823,640 | |
| Shares redeemed | | | (32,744,774 | ) | | | (55,840,068 | ) |
| Net decrease from share transactions | | | (32,744,774 | ) | | | (54,016,428 | ) |
| | | | | | | | | |
| Net decrease in net assets | | | (19,665,091 | ) | | | (55,262,243 | ) |
| | | | | | | | | |
| NET ASSETS: | | | | | | | | |
| Beginning of period | | | 71,399,759 | | | | 126,662,002 | |
| End of period | | $ | 51,734,668 | | | $ | 71,399,759 | |
| | | | | | | | | |
| OTHER INFORMATION: | | | | | | | | |
| CAPITAL SHARE TRANSACTIONS: | | | | | | | | |
| Beginning shares | | | 1,900,002 | | | | 3,650,002 | |
| Shares sold | | | – | | | | 50,000 | |
| Shares redeemed | | | (775,000 | ) | | | (1,800,000 | ) |
| Shares outstanding, end of period | | | 1,125,002 | | | | 1,900,002 | |
See Notes to Financial Statements.
| RiverFront Strategic Income Fund |
| Statements of Changes in Net Assets |
| | | For the Year Ended November 30, 2021 | | | For the Year Ended November 30, 2020 | |
| OPERATIONS: | | | | | | |
| Net investment income | | $ | 2,793,818 | | | $ | 4,733,460 | |
| Net realized gain/(loss) | | | 491,816 | | | | (800,489 | ) |
| Net change in unrealized depreciation | | | (1,547,122 | ) | | | (812,935 | ) |
| Net increase in net assets resulting from operations | | | 1,738,512 | | | | 3,120,036 | |
| | | | | | | | | |
| DISTRIBUTIONS TO SHAREHOLDERS: | | | | | | | | |
| From distributable earnings | | | (3,171,669 | ) | | | (4,943,458 | ) |
| Total distributions | | | (3,171,669 | ) | | | (4,943,458 | ) |
| | | | | | | | | |
| CAPITAL SHARE TRANSACTIONS: | | | | | | | | |
| Proceeds from sale of shares | | | 43,888,656 | | | | 17,274,109 | |
| Shares redeemed | | | (18,545,978 | ) | | | (64,356,361 | ) |
| Net increase/(decrease) from share transactions | | | 25,342,678 | | | | (47,082,252 | ) |
| | | | | | | | | |
| Net increase/(decrease) in net assets | | | 23,909,521 | | | | (48,905,674 | ) |
| | | | | | | | | |
| NET ASSETS: | | | | | | | | |
| Beginning of period | | | 118,983,665 | | | | 167,889,339 | |
| End of period | | $ | 142,893,186 | | | $ | 118,983,665 | |
| | | | | | | | | |
| OTHER INFORMATION: | | | | | | | | |
| CAPITAL SHARE TRANSACTIONS: | | | | | | | | |
| Beginning shares | | | 4,800,000 | | | | 6,800,000 | |
| Shares sold | | | 1,775,000 | | | | 700,000 | |
| Shares redeemed | | | (750,000 | ) | | | (2,700,000 | ) |
| Shares outstanding, end of period | | | 5,825,000 | | | | 4,800,000 | |
See Notes to Financial Statements.
| RiverFront Dynamic Core Income ETF | |
| Financial Highlights | For a share outstanding throughout the periods presented |
| | | For the Year Ended November 30, 2021 | | | For the Year Ended November 30, 2020 | | | For the Year Ended November 30, 2019 | | | For the Year Ended November 30, 2018 | | | For the Year Ended November 30, 2017 | |
| NET ASSET VALUE, BEGINNING OF PERIOD | | $ | 26.21 | | | $ | 25.22 | | | $ | 23.52 | | | $ | 24.60 | | | $ | 24.32 | |
| | | | | | | | | | | | | | | | | | | | | |
| INCOME/(LOSS) FROM INVESTMENT OPERATIONS: | | | | | | | | | | | | | | | | | | | | |
| Net investment income(a) | | | 0.47 | | | | 0.50 | | | | 0.68 | | | | 0.68 | | | | 0.53 | |
| Net realized and unrealized gain/(loss) | | | (0.87 | ) | | | 0.99 | | | | 1.70 | | | | (1.10 | ) | | | 0.23 | |
| Total from investment operations | | | (0.40 | ) | | | 1.49 | | | | 2.38 | | | | (0.42 | ) | | | 0.76 | |
| | | | | | | | | | | | | | | | | | | | | |
| DISTRIBUTIONS: | | | | | | | | | | | | | | | | | | | | |
| From net investment income | | | (0.46 | ) | | | (0.50 | ) | | | (0.68 | ) | | | (0.66 | ) | | | (0.48 | ) |
| Total distributions | | | (0.46 | ) | | | (0.50 | ) | | | (0.68 | ) | | | (0.66 | ) | | | (0.48 | ) |
| | | | | | | | | | | | | | | | | | | | | |
| NET INCREASE/(DECREASE) IN NET ASSET VALUE | | | (0.86 | ) | | | 0.99 | | | | 1.70 | | | | (1.08 | ) | | | 0.28 | |
| NET ASSET VALUE, END OF PERIOD | | $ | 25.35 | | | $ | 26.21 | | | $ | 25.22 | | | $ | 23.52 | | | $ | 24.60 | |
| TOTAL RETURN(b) | | | (1.51 | )% | | | 5.97 | % | | | 10.22 | % | | | (1.74 | )% | | | 3.15 | % |
| | | | | | | | | | | | | | | | | | | | | |
| RATIOS/SUPPLEMENTAL DATA: | | | | | | | | | | | | | | | | | | | | |
| Net assets, end of period (000s) | | $ | 117,873 | | | $ | 112,724 | | | $ | 134,951 | | | $ | 150,527 | | | $ | 47,962 | |
| | | | | | | | | | | | | | | | | | | | | |
| Ratio of expenses to average net assets | | | 0.51 | % | | | 0.51 | % | | | 0.51 | % | | | 0.51 | % | | | 0.51 | % |
| Ratio of net investment income to average net assets | | | 1.83 | % | | | 1.94 | % | | | 2.74 | % | | | 2.83 | % | | | 2.15 | % |
| Portfolio turnover rate(c) | | | 45 | % | | | 11 | % | | | 6 | % | | | 15 | % | | | 18 | % |
| (a) | Based on average shares outstanding during the period. |
| (b) | Total return is calculated assuming an initial investment made at the net asset value at the beginning of the period and the redemption at the net asset value on the last day of the period and assuming all distributions are reinvested at the actual reinvestment prices. Total return calculated for a period of less than one year is not annualized. |
| (c) | Portfolio turnover for periods less than one year are not annualized and does not include securities received or delivered from processing creations or redemptions in-kind. |
See Notes to Financial Statements.
| RiverFront Dynamic US Dividend Advantage ETF | |
| Financial Highlights | For a share outstanding throughout the periods presented |
| | | For the Year Ended November 30, 2021 | | | For the Year Ended November 30, 2020 | | | For the Year Ended November 30, 2019 | | | For the Year Ended November 30, 2018 | | | For the Year Ended November 30, 2017 | |
| NET ASSET VALUE, BEGINNING OF PERIOD | | $ | 37.03 | | | $ | 33.98 | | | $ | 31.19 | | | $ | 31.39 | | | $ | 26.59 | |
| | | | | | | | | | | | | | | | | | | | | |
| INCOME/(LOSS) FROM INVESTMENT OPERATIONS: | | | | | | | | | | | | | | | | | | | | |
| Net investment income(a) | | | 0.62 | | | | 0.56 | | | | 0.65 | | | | 0.73 | | | | 0.63 | |
| Net realized and unrealized gain/(loss) | | | 7.90 | | | | 3.08 | | | | 2.81 | | | | (0.26 | ) | | | 4.76 | |
| Total from investment operations | | | 8.52 | | | | 3.64 | | | | 3.46 | | | | 0.47 | | | | 5.39 | |
| | | | | | | | | | | | | | | | | | | | | |
| DISTRIBUTIONS: | | | | | | | | | | | | | | | | | | | | |
| From net investment income | | | (0.63 | ) | | | (0.59 | ) | | | (0.67 | ) | | | (0.67 | ) | | | (0.59 | ) |
| Total distributions | | | (0.63 | ) | | | (0.59 | ) | | | (0.67 | ) | | | (0.67 | ) | | | (0.59 | ) |
| | | | | | | | | | | | | | | | | | | | | |
| NET INCREASE/(DECREASE) IN NET ASSET VALUE | | | 7.89 | | | | 3.05 | | | | 2.79 | | | | (0.20 | ) | | | 4.80 | |
| NET ASSET VALUE, END OF PERIOD | | $ | 44.92 | | | $ | 37.03 | | | $ | 33.98 | | | $ | 31.19 | | | $ | 31.39 | |
| TOTAL RETURN(b) | | | 23.13 | % | | | 10.92 | % | | | 11.29 | % | | | 1.45 | % | | | 20.49 | % |
| | | | | | | | | | | | | | | | | | | | | |
| RATIOS/SUPPLEMENTAL DATA: | | | | | | | | | | | | | | | | | | | | |
| Net assets, end of period (000s) | | $ | 132,524 | | | $ | 133,294 | | | $ | 130,828 | | | $ | 151,293 | | | $ | 59,644 | |
| | | | | | | | | | | | | | | | | | | | | |
| Ratio of expenses to average net assets | | | 0.52 | % | | | 0.52 | % | | | 0.52 | % | | | 0.52 | % | | | 0.52 | % |
| Ratio of net investment income to average net assets | | | 1.47 | % | | | 1.68 | % | | | 2.05 | % | | | 2.27 | % | | | 2.19 | % |
| Portfolio turnover rate(c) | | | 0 | % | | | 75 | % | | | 64 | % | | | 96 | % | | | 54 | % |
| (a) | Based on average shares outstanding during the period. |
| (b) | Total return is calculated assuming an initial investment made at the net asset value at the beginning of the period and the redemption at the net asset value on the last day of the period and assuming all distributions are reinvested at the actual reinvestment prices. Total return calculated for a period of less than one year is not annualized. |
| (c) | Portfolio turnover for periods less than one year are not annualized and does not include securities received or delivered from processing creations or redemptions in-kind. |
See Notes to Financial Statements.
| RiverFront Dynamic US Flex-Cap ETF | |
| Financial Highlights | For a share outstanding throughout the periods presented |
| | | For the Year Ended November 30, 2021 | | | For the Year Ended November 30, 2020 | | | For the Year Ended November 30, 2019 | | | For the Year Ended November 30, 2018 | | | For the Year Ended November 30, 2017 | |
| NET ASSET VALUE, BEGINNING OF PERIOD | | $ | 37.58 | | | $ | 34.70 | | | $ | 32.79 | | | $ | 32.46 | | | $ | 26.84 | |
| | | | | | | | | | | | | | | | | | | | | |
| INCOME/(LOSS) FROM INVESTMENT OPERATIONS: | | | | | | | | | | | | | | | | | | | | |
| Net investment income(a) | | | 0.42 | | | | 0.45 | | | | 0.48 | | | | 0.44 | | | | 0.31 | |
| Net realized and unrealized gain | | | 8.43 | | | | 2.87 | (b) | | | 1.93 | | | | 0.27 | (b) | | | 5.59 | |
| Total from investment operations | | | 8.85 | | | | 3.32 | | | | 2.41 | | | | 0.71 | | | | 5.90 | |
| | | | | | | | | | | | | | | | | | | | | |
| DISTRIBUTIONS: | | | | | | | | | | | | | | | | | | | | |
| From net investment income | | | (0.44 | ) | | | (0.44 | ) | | | (0.50 | ) | | | (0.38 | ) | | | (0.28 | ) |
| Total distributions | | | (0.44 | ) | | | (0.44 | ) | | | (0.50 | ) | | | (0.38 | ) | | | (0.28 | ) |
| | | | | | | | | | | | | | | | | | | | | |
| NET INCREASE IN NET ASSET VALUE | | | 8.41 | | | | 2.88 | | | | 1.91 | | | | 0.33 | | | | 5.62 | |
| NET ASSET VALUE, END OF PERIOD | | $ | 45.99 | | | $ | 37.58 | | | $ | 34.70 | | | $ | 32.79 | | | $ | 32.46 | |
| TOTAL RETURN(c) | | | 23.65 | % | | | 9.75 | % | | | 7.49 | % | | | 2.16 | % | | | 22.08 | % |
| | | | | | | | | | | | | | | | | | | | | |
| RATIOS/SUPPLEMENTAL DATA: | | | | | | | | | | | | | | | | | | | | |
| Net assets, end of period (000s) | | $ | 51,735 | | | $ | 71,400 | | | $ | 126,662 | | | $ | 152,464 | | | $ | 40,576 | |
| | | | | | | | | | | | | | | | | | | | | |
| Ratio of expenses to average net assets | | | 0.52 | % | | | 0.52 | % | | | 0.52 | % | | | 0.52 | % | | | 0.52 | % |
| Ratio of net investment income to average net assets | | | 0.97 | % | | | 1.34 | % | | | 1.46 | % | | | 1.30 | % | | | 1.05 | % |
| Portfolio turnover rate(d) | | | 5 | % | | | 99 | % | | | 98 | % | | | 152 | % | | | 86 | % |
| (a) | Based on average shares outstanding during the period. |
| (b) | Net realized and unrealized gain on investments per share does not correlate to the aggregate of the net realized and unrealized gain/(loss) in the Statements of Operations for the period(s) presented, primarily due to the timing of the sales and repurchases of the Fund's shares in relation to the fluctuating market values for the Fund's portfolio. |
| (c) | Total return is calculated assuming an initial investment made at the net asset value at the beginning of the period and the redemption at the net asset value on the last day of the period and assuming all distributions are reinvested at the actual reinvestment prices. Total return calculated for a period of less than one year is not annualized. |
| (d) | Portfolio turnover for periods less than one year are not annualized and does not include securities received or delivered from processing creations or redemptions in-kind. |
See Notes to Financial Statements.
| RiverFront Strategic Income Fund | |
| Financial Highlights | For a share outstanding throughout the periods presented |
| | | For the Year Ended November 30, 2021 | | | For the Year Ended November 30, 2020 | | | For the Year Ended November 30, 2019 | | | For the Year Ended November 30, 2018 | | | For the Year Ended November 30, 2017 | |
| NET ASSET VALUE, BEGINNING OF PERIOD | | $ | 24.79 | | | $ | 24.69 | | | $ | 24.27 | | | $ | 25.21 | | | $ | 25.02 | |
| | | | | | | | | | | | | | | | | | | | | |
| INCOME/(LOSS) FROM INVESTMENT OPERATIONS: | | | | | | | | | | | | | | | | | | | | |
| Net investment income(a) | | | 0.55 | | | | 0.81 | | | | 0.94 | | | | 1.06 | | | | 1.11 | |
| Net realized and unrealized gain/(loss) | | | (0.18 | ) | | | 0.13 | (b) | | | 0.48 | | | | (0.92 | ) | | | 0.19 | |
| Total from investment operations | | | 0.37 | | | | 0.94 | | | | 1.42 | | | | 0.14 | | | | 1.30 | |
| | | | | | | | | | | | | | | | | | | | | |
| DISTRIBUTIONS: | | | | | | | | | | | | | | | | | | | | |
| From net investment income | | | (0.63 | ) | | | (0.84 | ) | | | (1.00 | ) | | | (1.08 | ) | | | (1.11 | ) |
| Total distributions | | | (0.63 | ) | | | (0.84 | ) | | | (1.00 | ) | | | (1.08 | ) | | | (1.11 | ) |
| | | | | | | | | | | | | | | | | | | | | |
| NET INCREASE/(DECREASE) IN NET ASSET VALUE | | | (0.26 | ) | | | 0.10 | | | | 0.42 | | | | (0.94 | ) | | | 0.19 | |
| NET ASSET VALUE, END OF PERIOD | | $ | 24.53 | | | $ | 24.79 | | | $ | 24.69 | | | $ | 24.27 | | | $ | 25.21 | |
| TOTAL RETURN(c) | | | 1.52 | % | | | 3.95 | % | | | 5.96 | % | | | 0.57 | % | | | 5.29 | % |
| | | | | | | | | | | | | | | | | | | | | |
| RATIOS/SUPPLEMENTAL DATA: | | | | | | | | | | | | | | | | | | | | |
| Net assets, end of period (000s) | | $ | 142,893 | | | $ | 118,984 | | | $ | 167,889 | | | $ | 152,880 | | | $ | 337,769 | |
| | | | | | | | | | | | | | | | | | | | | |
| Ratio of expenses excluding waiver/reimbursement to average net assets | | | 0.46 | % | | | 0.46 | % | | | 0.46 | % | | | 0.46 | % | | | 0.46 | % |
| Ratio of expenses including waiver/reimbursement to average net assets | | | 0.46 | % | | | 0.46 | % | | | 0.46 | % | | | 0.17 | %(d) | | | 0.16 | %(e) |
| Ratio of net investment income including expenses waiver/reimbursement to average net assets | | | 2.23 | % | | | 3.32 | % | | | 3.83 | % | | | 4.31 | % | | | 4.41 | % |
| Portfolio turnover rate(f) | | | 50 | % | | | 54 | % | | | 44 | % | | | 35 | % | | | 32 | % |
| (a) | Based on average shares outstanding during the period. |
| (b) | Net realized and unrealized gain on investments per share does not correlate to the aggregate of the net realized and unrealized gain/(loss) in the Statements of Operations for the period(s) presented, primarily due to the timing of the sales and repurchases of the Fund's shares in relation to the fluctuating market values for the Fund's portfolio. |
| (c) | Total return is calculated assuming an initial investment made at the net asset value at the beginning of the period and the redemption at the net asset value on the last day of the period and assuming all distributions are reinvested at the actual reinvestment prices. Total return calculated for a period of less than one year is not annualized. |
| (d) | Effective November 1, 2018, the Fund’s management fee consists of a fee of 0.11% paid to the Fund’s investment adviser and a fee of 0.35% paid to the Fund’s sub-adviser. The Fund’s sub-adviser ceased its voluntary waiver effective November 1, 2018. |
| (e) | Effective July 1, 2016, the Fund’s management fee consists of a fee of 0.16% paid to the Fund’s investment adviser and a fee of 0.30% paid to the Fund’s sub-adviser. The Fund’s sub-adviser voluntarily waived all of its 0.30% annual sub-advisory fee payable by the Fund until November 1, 2018. |
| (f) | Portfolio turnover for periods less than one year are not annualized and does not include securities received or delivered from processing creations or redemptions in-kind. |
See Notes to Financial Statements.
| RiverFront ETFs | |
| Notes to Financial Statements | November 30, 2021 |
1. ORGANIZATION
ALPS ETF Trust (the “Trust”), a Delaware statutory trust, is an open-end management investment company registered under the Investment Company Act of 1940, as amended (the “1940 Act”). As of November 30, 2021, the Trust consists of eighteen separate portfolios. Each portfolio represents a separate series of the Trust. This report pertains solely to the RiverFront Dynamic Core Income ETF, the RiverFront Dynamic US Dividend Advantage ETF, the RiverFront Dynamic US Flex-Cap ETF, and the RiverFront Strategic Income Fund (each a “Fund” and collectively, the “Funds”).
The investment objective of the RiverFront Dynamic Core Income ETF Fund is to seek total return, with an emphasis on income as the source of that total return. The Fund has elected to qualify as a diversified series of the Trust under the 1940 Act.
The investment objective of the RiverFront Dynamic US Dividend Advantage ETF Fund is to seek to provide capital appreciation and dividend income. The Fund has elected to qualify as a diversified series of the Trust under the 1940 Act.
The investment objective of the RiverFront Dynamic US Flex-Cap ETF Fund is to seek to provide capital appreciation. The Fund has elected to qualify as a diversified series of the Trust under the 1940 Act.
The investment objective of the RiverFront Strategic Income Fund is to seek total return, with an emphasis on income as the source of that total return. The Fund has elected to qualify as a diversified series of the Trust under the 1940 Act.
Each Fund’s Shares (“Shares”) are listed on the NYSE Arca, Inc. Each Fund issues and redeems Shares at net asset value (“NAV”) in blocks of 25,000 Shares (prior to October 1, 2021 in blocks of 50,000 Shares), each of which is called a “Creation Unit”. Creation Units are issued and redeemed principally in-kind for securities and/or cash. Except when aggregated in Creation Units, Shares are not redeemable securities of a Fund.
Pursuant to the Trust’s organizational documents, its Officers and Trustees are indemnified against certain liability arising out of the performance of their duties to the Trust. Additionally, in the normal course of business, the Trust enters into contracts with service providers that contain general indemnification clauses. The Trust’s maximum exposure under these arrangements is unknown, as this would involve future claims that may be made against the Trust that have not yet occurred.
2. SIGNIFICANT ACCOUNTING POLICIES
The following is a summary of significant accounting policies consistently followed by the Funds in the preparation of the financial statements. The accompanying financial statements were prepared in accordance with accounting principles generally accepted in the United States of America (“U.S. GAAP”). The preparation of financial statements in conformity with U.S. GAAP requires management to make certain estimates and assumptions that affect the reported amounts of assets and liabilities and disclosures of contingent assets and liabilities at the date of the financial statements and the reported amounts of revenue and expenses during the period. Actual results could differ from those estimates. Each Fund is considered an investment company under U.S. GAAP and follows the accounting and reporting guidance applicable to investment companies in the Financial Accounting Standards Board (“FASB”) Accounting Standards Codification Topic 946.
A. Portfolio Valuation
Each Fund’s NAV is determined daily, as of the close of regular trading on the New York Stock Exchange (the “NYSE”), normally 4:00 p.m. Eastern Time, on each day the NYSE is open for trading. The NAV is computed by dividing the value of all assets of each Fund (including accrued interest and dividends), less all liabilities (including accrued expenses and dividends declared but unpaid), by the total number of shares outstanding.
Portfolio securities listed on any exchange other than the NASDAQ Stock Market LLC (“NASDAQ”) are valued at the last sale price on the business day as of which such value is being determined. If there has been no sale on such day, the securities are valued at the mean of the most recent bid and ask prices on such day. Securities traded on the NASDAQ are valued at the NASDAQ Official Closing Price as determined by NASDAQ. Portfolio securities traded on more than one securities exchange are valued at the last sale price on the business day as of which such value is being determined at the close of the exchange representing the principal market for such securities. Portfolio securities traded in the over-the-counter market, but excluding securities traded on the NASDAQ, are valued at the last quoted sale price in such market.
Corporate bonds and United States government bonds are typically valued at the mean between the evaluated bid and ask prices formulated by an independent pricing service.
Each Fund’s investments are valued at market value or, in the absence of market value with respect to any portfolio securities, at fair value according to procedures adopted by the Trust’s Board of Trustees (the “Board”). When market quotations are not readily available or when events occur that make established valuation methods unreliable, securities of the Funds may be valued in good faith by or under the direction of the Board. These securities generally include, but are not limited to, restricted securities (securities which may not be publicly sold without registration under the Securities Act of 1933) for which a pricing service is unable to provide a market price; securities whose trading has been formally suspended; a security whose market price is not available from a pre-established primary pricing source or the pricing source is not willing to provide a price; a security with respect to which an event has occurred that is most likely to materially affect the value of the security after the market has closed but before the calculation of a Fund’s NAV or make it difficult or impossible to obtain a reliable market quotation; or a security whose price, as provided by the pricing service, does not reflect the security’s “fair value” due to the security being de-listed from a national exchange or the security’s primary trading market is temporarily closed at a time when, under normal conditions, it would be open. As a general principle, the current “fair value” of a security would be the amount which the owner might reasonably expect to receive from the sale on the applicable exchange or principal market. A variety of factors may be considered in determining the fair value of such securities.
| RiverFront ETFs | |
| Notes to Financial Statements | November 30, 2021 |
B. Fair Value Measurements
Each Fund discloses the classification of its fair value measurements following a three-tier hierarchy based on the inputs used to measure fair value. Inputs refer broadly to the assumptions that market participants would use in pricing the asset or liability, including assumptions about risk. Inputs may be observable or unobservable. Observable inputs reflect the assumptions market participants would use in pricing the asset or liability that are developed based on market data obtained from sources independent of the reporting entity. Unobservable inputs reflect the reporting entity’s own assumptions about the assumptions market participants would use in pricing the asset or liability that are developed based on the best information available.
Valuation techniques used to value the Funds’ investments by major category are as follows:
Equity securities, including restricted securities, for which market quotations are readily available, are valued at the last reported sale price or official closing price as reported by a third party pricing vendor on the primary market or exchange on which they are traded and are categorized as Level 1 in the hierarchy. In the event there were no sales during the day or closing prices are not available, securities are valued at the mean of the most recent quoted bid and ask prices on such day and are generally categorized as Level 2 in the hierarchy. Investments in open-end mutual funds are valued at their closing NAV each business day and are categorized as Level 1 in the hierarchy.
Debt securities, including restricted securities, are valued based on evaluated prices received from third party pricing vendors or from brokers who make markets in such securities. For corporate bonds, pricing vendors utilize matrix pricing which considers yield or price of bonds of comparable quality, coupon, maturity and type as well as broker-supplied prices. When independent prices are unavailable or unreliable, debt securities may be valued utilizing pricing methodologies which consider similar factors that would be used by third party pricing vendors. Debt securities are generally categorized as Level 2 in the hierarchy but may be Level 3 depending on the circumstances. The RiverFront Dynamic Core Income ETF, the RiverFront Dynamic Unconstrained Income ETF, and the RiverFront Strategic Income Fund may invest a significant portion of their assets in below investment grade securities. The value of these securities can be more volatile due to changes in the credit quality of the issuer and is sensitive to changes in economic, market and regulatory conditions.
Changes in valuation techniques may result in transfers in or out of an assigned level within the disclosure hierarchy.
Various inputs are used in determining the value of each Fund’s investments as of the end of the reporting period. When inputs used fall into different levels of the fair value hierarchy, the level in the hierarchy within which the fair value measurement falls is determined based on the lowest level input that is significant to the fair value measurement in its entirety. The designated input levels are not necessarily an indication of the risk or liquidity associated with these investments.
These inputs are categorized in the following hierarchy under applicable financial accounting standards:
| Level 1 – | Unadjusted quoted prices in active markets for identical investments, unrestricted assets or liabilities that a Fund has the ability to access at the measurement date; |
| Level 2 – | Quoted prices which are not active, quoted prices for similar assets or liabilities in active markets or inputs other than quoted prices that are observable (either directly or indirectly) for substantially the full term of the asset or liability; and |
| Level 3 – | Significant unobservable prices or inputs (including the Fund’s own assumptions in determining the fair value of investments) where there is little or no market activity for the asset or liability at the measurement date. |
| RiverFront ETFs | |
| Notes to Financial Statements | November 30, 2021 |
The following is a summary of the inputs used to value the Funds’ investments as of November 30, 2021:
RiverFront Dynamic Core Income ETF
| Investments in Securities at Value | | Level 1 - Quoted and Unadjusted Prices | | | Level 2 - Other Significant Observable Inputs | | | Level 3 - Significant Unobservable Inputs | | | Total | |
| Corporate Bonds* | | $ | – | | | $ | 71,782,066 | | | $ | – | | | $ | 71,782,066 | |
| Government Bonds* | | | – | | | | 32,106,671 | | | | – | | | | 32,106,671 | |
| Short Term Investments | | | 13,308,403 | | | | – | | | | – | | | | 13,308,403 | |
| Total | | $ | 13,308,403 | | | $ | 103,888,737 | | | $ | – | | | $ | 117,197,140 | |
RiverFront Dynamic US Dividend Advantage ETF
| Investments in Securities at Value | | Level 1 - Quoted and Unadjusted Prices | | | Level 2 - Other Significant Observable Inputs | | | Level 3 - Significant Unobservable Inputs | | | Total | |
| Common Stocks* | | $ | 131,925,235 | | | $ | – | | | $ | – | | | $ | 131,925,235 | |
| Short Term Investments | | | 584,605 | | | | – | | | | – | | | | 584,605 | |
| Total | | $ | 132,509,840 | | | $ | – | | | $ | – | | | $ | 132,509,840 | |
RiverFront Dynamic US Flex-Cap ETF
| Investments in Securities at Value | | Level 1 - Quoted and Unadjusted Prices | | | Level 2 - Other Significant Observable Inputs | | | Level 3 - Significant Unobservable Inputs | | | Total | |
| Common Stocks* | | $ | 51,509,758 | | | $ | – | | | $ | – | | | $ | 51,509,758 | |
| Exchange Traded Funds | | | 87,408 | | | | – | | | | – | | | | 87,408 | |
| Short Term Investments | | | 396,721 | | | | – | | | | – | | | | 396,721 | |
| Total | | $ | 51,993,887 | | | $ | – | | | $ | – | | | $ | 51,993,887 | |
RiverFront Strategic Income Fund
| Investments in Securities at Value | | Level 1 - Quoted and Unadjusted Prices | | | Level 2 - Other Significant Observable Inputs | | | Level 3 - Significant Unobservable Inputs | | | Total | |
| Corporate Bonds* | | $ | – | | | $ | 116,979,532 | | | $ | – | | | $ | 116,979,532 | |
| Government Bonds* | | | – | | | | 9,007,029 | | | | – | | | | 9,007,029 | |
| Short Term Investments | | | 15,569,861 | | | | – | | | | – | | | | 15,569,861 | |
| Total | | $ | 15,569,861 | | | $ | 125,986,561 | | | $ | – | | | $ | 141,556,422 | |
| * | For a detailed sector breakdown, see the accompanying Schedule of Investments. |
The Funds did not have any securities that used significant unobservable inputs (Level 3) in determining fair value and there were no transfers into or out of Level 3 during the year ended November 30, 2021.
C. Securities Transactions and Investment Income
Securities transactions are recorded as of the trade date. Realized gains and losses from securities transactions are recorded on the specific identification in accordance with GAAP. Dividend income and capital gains distributions, if any, are recorded on the ex-dividend date. Interest income, if any, is recorded on the accrual basis, including amortization of premiums and accretion of discounts.
D. Dividends and Distributions to Shareholders
Dividends from net investment income for each Fund, if any, are declared and paid monthly or as the Board may determine from time to time. Distributions of net realized capital gains earned by the Funds, if any, are distributed at least annually.
E. Federal Tax and Tax Basis Information
The timing and character of income and capital gain distributions are determined in accordance with income tax regulations, which may differ from U.S. GAAP. Reclassifications are made to the Funds’ capital accounts for permanent tax differences to reflect income and gains available for distribution (or available capital loss carryforwards) under income tax regulations.
| RiverFront ETFs | |
| Notes to Financial Statements | November 30, 2021 |
For the year ended November 30, 2021, the following reclassifications, which had no impact on results of operations or net assets, were recorded to reflect permanent tax differences resulting primarily from in-kind transactions:
| Fund | | Paid-in Capital | | | Total Distributable Earnings | |
| RiverFront Dynamic Core Income ETF | | $ | 697,983 | | | $ | (697,983 | ) |
| RiverFront Dynamic US Dividend Advantage ETF | | | 8,589,950 | | | | (8,589,950 | ) |
| RiverFront Dynamic US Flex-Cap ETF | | | 9,437,462 | | | | (9,437,462 | ) |
| RiverFront Strategic Income Fund | | | 275,390 | | | | (275,390 | ) |
The tax character of the distributions paid during the fiscal year ended November 30, 2021 and November 30, 2020 was as follows:
| | | Ordinary Income | | | Long-Term Capital Gain | | | Return of Capital | |
| November 30, 2021 | | | | | | | | | |
| RiverFront Dynamic Core Income ETF | | $ | 1,962,506 | | | $ | – | | | $ | – | |
| RiverFront Dynamic US Dividend Advantage ETF | | | 1,936,954 | | | | – | | | | – | |
| RiverFront Dynamic US Flex-Cap ETF | | | 679,274 | | | | – | | | | – | |
| RiverFront Strategic Income Fund | | | 3,171,669 | | | | – | | | | – | |
| | | Ordinary Income | | | Long-Term Capital Gain | | | Return of Capital | |
| November 30, 2020 | | | | | | | | | |
| RiverFront Dynamic Core Income ETF | | $ | 2,449,436 | | | $ | – | | | $ | – | |
| RiverFront Dynamic US Dividend Advantage ETF | | | 2,186,237 | | | | – | | | | – | |
| RiverFront Dynamic US Flex-Cap ETF | | | 1,188,592 | | | | – | | | | – | |
| RiverFront Strategic Income Fund | | | 4,943,458 | | | | – | | | | – | |
The character of distributions made during the year may differ from its ultimate characterization for federal income tax purposes.
The RiverFront Dynamic Core Income ETF, RiverFront Dynamic US Dividend Advantage ETF and RiverFront Dynamic US Flex-Cap ETF used capital loss carryovers during the year ended November 30, 2021 in the amounts of $163,328, $78,238 and $818,235, respectively.
Under current law, capital losses maintain their character as short-term or long-term and are carried forward to the next tax year without expiration. As of November 30, 2021, the following amounts are available as carry forwards to the next tax year:
| Fund | | Short-Term | | | Long-Term | |
| RiverFront Dynamic US Dividend Advantage ETF | | $ | 5,611,019 | | | $ | 11,582,063 | |
| RiverFront Dynamic US Flex-Cap ETF | | | 12,308,600 | | | | 11,857,380 | |
| RiverFront Strategic Income Fund | | | 7,097,858 | | | | 2,743,833 | |
As of November 30, 2021, the components of distributable earnings on a tax basis for each Fund were as follows:
| | | RiverFront Dynamic Core Income ETF | | | RiverFront Dynamic US Dividend Advantage ETF | | | RiverFront Dynamic US Flex-Cap ETF | | | RiverFront Strategic Income Fund | |
| Accumulated net investment income | | $ | 59,074 | | | $ | 13,342 | | | $ | 1,082 | | | $ | 62,614 | |
| Accumulated net realized gain/(loss) on investments | | | 1,710,559 | | | | (17,193,082 | ) | | | (24,165,980 | ) | | | (9,841,691 | ) |
| Net unrealized appreciation/(depreciation) on investments | | | 1,844,351 | | | | 38,830,227 | | | | 15,518,347 | | | | (309,083 | ) |
| Total | | $ | 3,613,984 | | | $ | 21,650,487 | | | $ | (8,646,551 | ) | | $ | (10,088,160 | ) |
| RiverFront ETFs | |
| Notes to Financial Statements | November 30, 2021 |
As of November 30, 2021, the cost of investments for federal income tax purposes and accumulated net unrealized appreciation/(depreciation) on investments were as follows:
| | | RiverFront Dynamic Core Income ETF | | | RiverFront Dynamic US Dividend Advantage ETF | | | RiverFront Dynamic US Flex-Cap ETF | | | RiverFront Strategic Income Fund | |
| Gross appreciation (excess of value over tax cost) | | $ | 3,035,527 | | | $ | 41,175,813 | | | $ | 17,061,968 | | | $ | 756,357 | |
| Gross depreciation (excess of tax cost over value) | | | (1,191,176 | ) | | | (2,345,586 | ) | | | (1,543,621 | ) | | | (1,065,440 | ) |
| Net unrealized appreciation/(depreciation) | | | 1,844,351 | | | | 38,830,227 | | | | 15,518,347 | | | | (309,083 | ) |
| Cost of investments for income tax purposes | | $ | 115,352,789 | | | $ | 93,679,613 | | | $ | 36,475,540 | | | $ | 141,865,505 | |
The differences between book-basis and tax-basis are primarily due to the deferral of losses from wash sales and difference between premium amortization due to Accounting Standards Update 2017-08.
F. Income Taxes
No provision for income taxes is included in the accompanying financial statements, as each Fund intends to distribute to shareholders all taxable investment income and realized gains and otherwise comply with Subchapter M of the Internal Revenue Code of 1986, as amended, applicable to regulated investment companies. Each Fund evaluates tax positions taken (or expected to be taken) in the course of preparing the Funds’ tax returns to determine whether these positions meet a “more-likely-than-not” standard that, based on the technical merits, have a more than fifty percent likelihood of being sustained by a taxing authority upon examination. A tax position that meets the “more-likely-than-not” recognition threshold is measured to determine the amount of benefit to recognize in the financial statements.
As of and during the year ended November 30, 2021, the Funds did not have a liability for any unrecognized tax benefits. Each Fund files U.S. federal, state, and local tax returns as required. Each Fund’s tax returns are subject to examination by the relevant tax authorities until expiration of the applicable statute of limitations, which is generally three years after the filing of the tax return, but may extend to four years in certain jurisdictions. Tax returns for open years have incorporated no uncertain tax positions that require a provision for income taxes.
G. Lending of Portfolio Securities
The RiverFront Dynamic US Dividend Advantage ETF and the RiverFront Dynamic US Flex-Cap ETF have entered into a securities lending agreement with State Street Bank & Trust Co. (“SSB”), the Funds’ lending agent. Each Fund may lend its portfolio securities only to borrowers that are approved by SSB. Each Fund will limit such lending to not more than 33 1/3% of the value of its total assets. Each Fund’s securities held at SSB as custodian shall be available to be lent except those securities the Fund or ALPS Advisors, Inc. specifically identifies in writing as not being available for lending. The borrower pledges and maintains with the Fund collateral consisting of cash (U.S. Dollars only), securities issued or guaranteed by the U.S. government or its agencies or instrumentalities, and cash equivalents (including irrevocable bank letters of credit) issued by a person other than the borrower or an affiliate of the borrower. The initial collateral received by each Fund is required to have a value of no less than 102% of the market value of the loaned securities for U.S equity securities and a value of no less than 105% of the market value for non-U.S. equity securities. The collateral is maintained thereafter, at a market value equal to not less than 102% of the current value of the U.S. equity securities on loan and not less than 105% of the current value of the non-U.S. equity securities on loan. The market value of the loaned securities is determined at the close of each business day and any additional required collateral is delivered to each Fund on the next business day. During the term of the loan, each Fund is entitled to all distributions made on or in respect of the loaned securities. Loans of securities are terminable at any time and the borrower, after notice, is required to return borrowed securities within the customary time period for settlement of securities transactions.
Any cash collateral received is reinvested in a money market fund managed by SSB as disclosed in the Fund’s Schedule of Investments and is reflected in the Statements of Assets and Liabilities as a payable for collateral upon return of securities loaned. Non-cash collateral, in the form of securities issued or guaranteed by the U.S. government or its agencies or instrumentalities, is not disclosed in the Fund’s Statements of Assets and Liabilities as it is held by the lending agent on behalf of the Fund, and the Fund does not have the ability to re-hypothecate these securities. Income earned by the Fund from securities lending activity is disclosed in the Statement of Operations.
| RiverFront ETFs | |
| Notes to Financial Statements | November 30, 2021 |
The following is a summary of the Fund's securities lending agreement and related cash and non-cash collateral received as of November 30, 2021:
| Fund | | Market Value of Securities on Loan | | | Cash Collateral Received | | | Non-Cash Collateral Received | | | Total Collateral Received | |
| RiverFront Dynamic US Dividend Advantage ETF | | $ | 1,504,347 | | | $ | 117,429 | | | $ | 1,454,190 | | | $ | 1,571,619 | |
| RiverFront Dynamic US Flex-Cap ETF | | | 855,062 | | | | 287,699 | | | | 609,254 | | | | 896,953 | |
The risks of securities lending include the risk that the borrower may not provide additional collateral when required or may not return the securities when due. To mitigate these risks, the Funds benefit from a borrower default indemnity provided by SSB. SSB’s indemnity allows for full replacement of securities lent wherein SSB will purchase the unreturned loaned securities on the open market by applying the proceeds of the collateral, or to the extent such proceeds are insufficient or the collateral is unavailable, SSB will purchase the unreturned loan securities at SSB’s expense. However, the Funds could suffer a loss if the value of the investments purchased with cash collateral falls below the value of the cash collateral received.
The following table reflects a breakdown of transactions accounted for as secured borrowings, the gross obligation by the type of collateral pledged or securities loaned, and the remaining contractual maturity of those transactions as of November 30, 2021:
| RiverFront Dynamic US Dividend Advantage ETF | | | | | Remaining contractual maturity of the agreements | |
| Securities Lending Transactions | | Overnight & Continuous | | | Up to 30 days | | | 30-90 days | | | Greater than 90 days | | | Total | |
| Common Stocks | | $ | 117,429 | | | $ | – | | | $ | – | | | $ | – | | | $ | 117,429 | |
| Total Borrowings | | | | | | | | | | | | | | | | | | | 117,429 | |
| Gross amount of recognized liabilities for securities lending (collateral received) | | | $ | 117,429 | |
| RiverFront Dynamic US Flex-Cap ETF | | | | | Remaining contractual maturity of the agreements | |
| Securities Lending Transactions | | Overnight & Continuous | | | Up to 30 days | | | 30-90 days | | | Greater than 90 days | | | Total | |
| Common Stocks | | $ | 287,699 | | | $ | – | | | $ | – | | | $ | – | | | $ | 287,699 | |
| Total Borrowings | | | | | | | | | | | | | | | | | | | 287,699 | |
| Gross amount of recognized liabilities for securities lending (collateral received) | | | $ | 287,699 | |
3. INVESTMENT ADVISORY FEE AND OTHER AFFILIATED TRANSACTIONS
ALPS Advisors, Inc. (the “Adviser”) serves as the Funds’ investment adviser pursuant to an Investment Advisory Agreement with the Trust on behalf of each Fund (the “Advisory Agreement”). Pursuant to the Advisory Agreement, each Fund pays the Adviser an annual management fee for the services and facilities it provides, payable on a monthly basis as a percentage of the relevant Fund’s average daily net assets as set out below:
| Fund | Advisory Fee |
| RiverFront Dynamic Core Income ETF | 0.51%(a) |
| RiverFront Dynamic US Dividend Advantage ETF | 0.52%(b) |
| RiverFront Dynamic US Flex-Cap ETF | 0.52%(b) |
| RiverFront Strategic Income Fund | 0.11% |
| (a) | The unitary advisory fee as a percentage of net assets is subject to the following breakpoints: (i) 0.51% for average net assets up to $600 million, (ii) 0.48% for average net assets equal to or greater than $600 million. |
| (b) | The unitary advisory fee as a percentage of net assets is subject to the following breakpoints: (i) 0.52% for average net assets up to $600 million, (ii) 0.49% for average net assets equal to or greater than $600 million. |
Out of the unitary management fee, the Adviser pays substantially all expenses of each Fund, including the cost of transfer agency, custody, fund administration, legal, audit, trustees and other services, except for interest expenses, distribution fees or expenses, brokerage expenses, taxes and extraordinary expenses not incurred in the ordinary course of each Fund's business. The Adviser’s unitary management fee is designed to pay substantially all of each Fund's expenses and to compensate the Adviser for providing services for each Fund.
| RiverFront ETFs | |
| Notes to Financial Statements | November 30, 2021 |
RiverFront Investment Group, LLC (the “Sub-Adviser”) serves as each Fund’s sub-adviser pursuant to a sub-advisory agreement with the Trust (the ‘‘Sub-Advisory Agreement’’). Pursuant to the Sub-Advisory Agreement, the Adviser pays the Sub-Adviser a sub-advisory fee out of the Adviser’s advisory fee for the services it provides besides RiverFront Strategic Income Fund, in which the Fund directly pays the Sub-Adviser. The fee is payable on a monthly basis at the annual rate of the relevant Fund’s average daily net assets as set out below:
| Fund | Sub-Advisory Fee |
| RiverFront Dynamic Core Income ETF | 0.35% |
| RiverFront Dynamic US Dividend Advantage ETF | 0.35% |
| RiverFront Dynamic US Flex-Cap ETF | 0.35% |
| RiverFront Strategic Income Fund | 0.35% |
ALPS Fund Services, Inc., an affiliate of the Adviser, is the administrator of the Funds.
Each Trustee receives (1) a quarterly retainer of $10,000, (2) a per meeting fee of $5,000, (3) $1,500 for any special meeting held outside of a regularly scheduled board meeting, and (4) reimbursement for all reasonable out-of-pocket expenses relating to attendance at meetings. In addition, the Chairman of the Board and Chairman of the Audit Committee each receives a quarterly retainer of $2,000, in connection with their respective roles.
4. PURCHASES AND SALES OF SECURITIES
For the year ended November 30, 2021, the cost of purchases and proceeds from sales of investment securities, excluding in-kind transactions and short-term investments, were as follows:
| Fund | | Purchases | | | Sales | |
| RiverFront Dynamic Core Income ETF | | $ | 31,201,592 | | | $ | 33,775,060 | |
| RiverFront Dynamic US Dividend Advantage ETF | | | 164,268 | | | | 168,632 | |
| RiverFront Dynamic US Flex-Cap ETF | | | 2,965,157 | | | | 2,781,085 | |
| RiverFront Strategic Income Fund | | | 52,732,008 | | | | 53,972,485 | |
For the year ended November 30, 2021, the cost of U.S. Government security purchases and proceeds from U.S. Government security sales were as follows:
| Fund | | Purchases | | | Sales | |
| RiverFront Dynamic Core Income ETF | | $ | 13,019,823 | | | $ | 10,632,821 | |
| RiverFront Strategic Income Fund | | | 7,440,234 | | | | 816,036 | |
For the year ended November 30, 2021, the cost of in-kind purchases and proceeds from in-kind sales were as follows:
| Fund | | Purchases | | | Sales | |
| RiverFront Dynamic Core Income ETF | | $ | 17,448,026 | | | $ | 8,713,481 | |
| RiverFront Dynamic US Dividend Advantage ETF | | | 4,574,357 | | | | 30,030,919 | |
| RiverFront Dynamic US Flex-Cap ETF | | | – | | | | 32,772,007 | |
| RiverFront Strategic Income Fund | | | 38,117,717 | | | | 15,627,708 | |
For the year ended November 30, 2021, the in-kind net realized gains/(losses) were as follows:
| Fund | | Net Realized Gain/(Loss) | |
| RiverFront Dynamic Core Income ETF | | $ | 699,194 | |
| RiverFront Dynamic US Dividend Advantage ETF | | | 8,545,751 | |
| RiverFront Dynamic US Flex-Cap ETF | | | 9,415,865 | |
| RiverFront Strategic Income Fund | | | 296,853 | |
Gains on in-kind transactions are not considered taxable for federal income tax purposes and losses on in-kind transactions are also not deductible for tax purposes.
| RiverFront ETFs | |
| Notes to Financial Statements | November 30, 2021 |
5. CAPITAL SHARE TRANSACTIONS
Shares are created and redeemed by each Fund only in Creation Unit size aggregations of 25,000 Shares. Only broker-dealers or large institutional investors with creation and redemption agreements called Authorized Participants (“AP”) are permitted to purchase or redeem Creation Units from each Fund. Such transactions are generally permitted on an in-kind basis, with a balancing cash component to equate the transaction to the NAV per unit of each Fund on the transaction date. Cash may be substituted equivalent to the value of certain securities generally when they are not available in sufficient quantity for delivery, not eligible for trading by the AP or as a result of other market circumstances.
6. MARKET DISRUPTIONS RISK
The Funds are subject to investment and operational risks associated with financial, economic and other global market developments and disruptions, including the recent spread of an infectious respiratory illness caused by a novel strain of coronavirus (known as COVID-19), which can negatively impact the securities markets and cause each Fund to lose value.
The spread of COVID-19 has caused volatility, severe market dislocations and liquidity constraints in many markets, including markets for the securities each Fund holds, and may adversely affect each Fund’s investments and operations. The transmission of COVID-19 and efforts to contain its spread have resulted in travel restrictions and disruptions, closed international borders, enhanced health screenings at ports of entry and elsewhere, disruption of and delays in healthcare service preparation and delivery, quarantines, event and service cancellations or interruptions, disruptions to business operations and supply chains, and a reduction in consumer and business spending, as well as general concern and uncertainty that has negatively affected the economy. These disruptions have led to instability in the market place and the jobs market. The impact of COVID-19 could adversely affect the economies of many nations or the entire global economy, the financial well-being and performance of individual issuers, borrowers and sectors and the health of the markets generally in potentially significant and unforeseen ways.
The foregoing could lead to a significant economic downturn or recession, increased market volatility, a greater number of market closures, higher default rates and adverse effects on the values and liquidity of each Fund’s securities or other assets. Such impacts may adversely affect the performance of the Funds.
7. SUBSEQUENT EVENTS
Subsequent events, if any, after the date of the Statements of Assets and Liabilities have been evaluated through the date the financial statements were issued. Management has determined that there were no subsequent events to report through the issuance of these financial statements.
| RiverFront ETFs | |
| Additional Information | November 30, 2021 (Unaudited) |
PROXY VOTING RECORDS, POLICIES AND PROCEDURES
Information regarding how each Fund voted proxies relating to portfolio securities during the most recent 12-month period ended June 30 and a description of the Funds’ proxy voting policies and procedures used in determining how to vote for proxies are available without charge on the SEC’s website at www.sec.gov and upon request, by calling (toll-free) 1-866-759-5679.
PORTFOLIO HOLDINGS
The Fund files a complete schedule of portfolio holdings with the U.S. Securities and Exchange Commission (“SEC”) for the first and third quarters of each fiscal year on Form N-PORT within 60 days after the end of the period. Copies of the Fund’s Form N-PORT are available without a charge, upon request, by contacting the Fund at 1-866-759-5679 and on the SEC’s website at https://www.sec.gov.
TAX INFORMATION
The Funds designate the following as a percentage of taxable ordinary income distributions, or up to the maximum amount allowable, for the calendar year ended December 31, 2020:
| | Qualified Dividend Income | Dividend Received Deduction |
| RiverFront Dynamic Core Income ETF | 0.00% | 0.00% |
| RiverFront Dynamic US Dividend Advantage ETF | 100.00% | 100.00% |
| RiverFront Dynamic US Flex-Cap ETF | 98.21% | 97.00% |
| RiverFront Strategic Income Fund | 0.00% | 0.00% |
In early 2021, if applicable, shareholders of record received this information for the distributions paid to them by the Funds during the calendar year 2020 via Form 1099. The Funds will notify shareholders in early 2022 of amounts paid to them by the Funds, if any, during the calendar year 2021.
| RiverFront ETFs | |
| Board Considerations Regarding Approval of Investment Advisory Agreement and Investment Sub-Advisory Agreements | November 30, 2021 (Unaudited) |
At a meeting held on June 7, 2021 via electronic means (video-conference), the Board of Trustees of the Trust (the “Board” or the “Trustees”), including the Trustees who are not “interested persons” of the Trust within the meaning of the Investment Company Act of 1940, as amended (the “Independent Trustees”), evaluated a proposal to approve the continuance of (i) the Investment Advisory Agreements between the Trust and ALPS Advisors, Inc. (the “Adviser” or “AAI”) with respect to the RiverFront Strategic Income Fund (“RIGS”), RiverFront Dynamic Core Income ETF (“RFCI”), RiverFront Dynamic US Dividend Advantage ETF (“RFDA”) and RiverFront Dynamic US Flex-Cap ETF (“RFFC”) (each “a Fund” and collectively the “Funds”) and (ii) the Investment Sub-Advisory Agreements between the Trust or AAI and RiverFront Investment Group, LLC (the “Sub-Adviser” or “RiverFront”) with respect to the Funds (the “RiverFront Sub-Advisory Agreement”). The Independent Trustees also met separately to consider each Investment Advisory Agreement and Investment Sub-Advisory Agreement.
In evaluating the Investment Advisory Agreements with respect to each Fund, the Board, including the Independent Trustees, considered various factors, including (i) the nature, extent and quality of the services provided by AAI with respect to the applicable Fund under the Investment Advisory Agreements; (ii) the advisory fees and other expenses paid by the Fund compared to those of similar funds managed by other investment advisers; (iii) the costs of the services provided to the Fund by AAI and the profits realized by AAI and its affiliates from its relationship to the Fund; (iv) the extent to which economies of scale have been or would be realized if and as the assets of the Fund grow and whether fees reflect the economies of scale for the benefit of shareholders; and (v) any additional benefits and other considerations.
With respect to the nature, extent and quality of the services provided by AAI under the Investment Advisory Agreements, the Board considered and reviewed information concerning the services provided under the Investment Advisory Agreements, financial information regarding AAI and its parent company, information describing AAI’s current organization and the background and experience of the persons responsible for the day-to-day management of the Funds.
The Board reviewed information on the performance of each Fund and its applicable benchmark, and with respect to each Fund, the FUSE performance group. Based on this review, the Board, including the Independent Trustees, found that the nature and extent of services provided to each Fund under the Investment Advisory Agreements was appropriate and that the quality was satisfactory.
The Board noted that the advisory fees for each Fund were unitary fees pursuant to which AAI assumes all expenses of the Funds (including the cost of transfer agency, custody, fund administration, legal, audit and other services) other than the payments under the Advisory Agreement, brokerage expenses, taxes, interest, litigation expenses and other extraordinary expenses.
With respect to advisory fee rates, the Board, including the Independent Trustees, noted the following:
The gross management fee rate for RFCI is higher than the median of its FUSE expense group. RFCI’s net expense ratio, however, is slightly above the median of their respective FUSE expense group.
The gross management fee rate RIGS, RFFC and RFDA is lower than the median of its FUSE expense group. These Funds’ respective net expense ratios are also below the median of its FUSE expense group.
Based on the foregoing, and the other information available to them, the Board, including the Independent Trustees concluded that the advisory fee rate for each of the Funds were reasonable under the circumstances and in light of the quality of the services provided.
The Board, including the Independent Trustees considered other benefits available to AAI because of its relationship with the Funds and concluded that the advisory fees were reasonable taking into account any such benefits.
The Board, including the Independent Trustees also considered with respect to each Fund the information provided by AAI about the costs and profitability of AAI with respect to each of the Funds, including the asset levels and other factors that influence the profitability and financial viability of the Funds. The Board, including the Independent Trustees, reviewed and noted the relatively small sizes of the Funds and concluded that AAI was not realizing any economies of scale. The Independent Trustees determined that AAI should continue to keep the Board informed on an ongoing basis of any significant developments (e.g., material increases in asset levels) so as to facilitate the Independent Trustees’ evaluation of whether further economies of scale have been achieved.
In voting to renew each Investment Advisory Agreement, the Board, including the Independent Trustees concluded that the terms of each Investment Advisory Agreement are reasonable and fair in light of the services to be performed, the fees paid by certain other funds, expenses to be incurred and such other matters as the members of the Board, including the Independent Trustees, considered relevant in the exercise of their reasonable business judgment. The Independent Trustees did not identify any single factor or group of factors as all important or controlling and considered all factors together.
| RiverFront ETFs | |
| Board Considerations Regarding Approval of Investment Advisory Agreement and Investment Sub-Advisory Agreements | November 30, 2021 (Unaudited) |
RiverFront Sub-Advisory Agreements
The Board, including the Independent Trustees discussed the RiverFront Sub-Advisory Agreements.
In evaluating the RiverFront Sub-Advisory Agreements, the Board, including the Independent Trustees considered various factors, including (i) the nature, extent and quality of the services provided by RiverFront with respect to the Funds under the RiverFront Sub-Advisory Agreements; (ii) the advisory fees and other expenses paid by the Funds compared to those of similar funds managed by other investment advisers; (iii) the profitability to RiverFront of its sub-advisory relationship with the Funds and the reasonableness of compensation to RiverFront; (iv) the extent to which economies of scale would be realized if, and as, the Funds assets increase, and whether the fee level in the RiverFront Sub-Advisory Agreements reflects these economies of scale; and (v) any additional benefits and other considerations.
With respect to the nature, extent and quality of the services provided by RiverFront under the RiverFront Sub-Advisory Agreements, the Board, including the Independent Trustees considered and reviewed information concerning the services provided under the RiverFront Sub-Advisory Agreements, the Funds’ respective performance, financial information regarding RiverFront, information describing RiverFront’s current organization and the background and experience of the persons responsible for the day-to-day management of the Funds. Based upon their review, the Board, including the Independent Trustees concluded that RiverFront was qualified to oversee the portfolio management of the Funds and that the services provided by RiverFront to the Funds are satisfactory. The Board, including the Independent Trustees considered that the contractual sub-advisory fee to be paid to RiverFront from RIGS was 0.35% of RIGS’ average daily net assets out of a total management fee of 0.46% of RIGS’ average daily net assets. The Board, including the Independent Trustees considered that the contractual sub-advisory fee to be paid to RiverFront with respect to each of RFCI, RFDA and RFFC was 0.35% of each Fund’s average daily net assets out of a total management fee of 0.51% with respect to RFCI’s average daily net assets, respectively, and 0.52% with respect to each of RFDA’s and RFFC’s average daily net assets, respectively. Based on the consideration of all factors deemed relevant by them, the Board, including the Independent Trustees concluded that the sub-advisory fees received by RiverFront under the RiverFront Sub-Advisory Agreements were reasonable under the circumstances and in light of the quality of services provided.
With respect to the costs of services provided and profits realized by RiverFront, the Board, including the Independent Trustees considered the resources involved in managing the Funds. Based on their review of the profitability of each of the Funds to RiverFront, the Board, including the Independent Trustees concluded that the profitability of each Fund to RiverFront was not unreasonable.
The Board, including the Independent Trustees also considered other benefits that have been and may be realized by RiverFront from its relationships with each Fund and concluded that the sub-advisory fees with respect to each Fund were reasonable taking into account such benefits.
The Board, including the Independent Trustees noted that RIGS had declined in assets over the prior year. The Board, including the Independent Trustees considered the extent to which economies of scale may be realized if RIGS’ assets increase to its previous levels and continue to grow in size and whether fee levels reflect a reasonable sharing of such economies of scale for the benefit of the Fund’s investors. They also noted that RIGS has experienced fluctuations in assets, which makes it difficult to quantify the potential variability in net assets and thus determine the sustainability of any potential economies of scale which may exist. The Board, including the Independent Trustees also noted that RFCI, RFDA and RFFC were all launched during June 2016 and are only beginning to reach scale in terms of assets. The Independent Trustees determined that AAI should continue to keep the Board informed on an ongoing basis of any significant developments (e.g., material increases in asset levels) so as to facilitate the Independent Trustees’ evaluation of whether further economies of scale have been achieved with respect to each Fund.
In voting to approve each of the RiverFront Sub-Advisory Agreements, the Board, including the Independent Trustees concluded that the terms of each RiverFront Sub-Advisory Agreement are reasonable and fair in light of the services performed, expenses incurred and such other matters as the Board, including the Independent Trustees considered relevant in the exercise of their reasonable business judgment. The Board, including the Independent Trustees did not identify any single factor or group of factors as all important or controlling and considered all factors together. The general supervision of the duties performed by the Adviser for the Fund under the Investment Advisory Agreement is the responsibility of the Board of Trustees. The Trust currently has four Trustees. Three Trustees have no affiliation or business connection with the Adviser or any of its affiliated persons and do not own any stock or other securities issued by the Adviser. These are the “non-interested” or “independent” Trustees (“Independent Trustees”). The other Trustee (the “Interested Trustee”) is affiliated with the Adviser.
The Independent Trustees of the Trust, their term of office and length of time served, their principal business occupations during the past five years, the number of portfolios in the Fund Complex overseen by each Independent Trustee, and other directorships, if any, held by the Trustee are shown below.
| RiverFront ETFs | |
| Trustees & Officers | November 30, 2021 (Unaudited) |
The general supervision of the duties performed by the Adviser for the Fund under the Investment Advisory Agreement is the responsibility of the Board of Trustees. The Trust currently has four Trustees. Three Trustees have no affiliation or business connection with the Adviser or any of its affiliated persons and do not own any stock or other securities issued by the Adviser. These are the “non-interested” or “independent” Trustees (“Independent Trustees”). The other Trustee (the “Interested Trustee”) is affiliated with the Adviser.
The Independent Trustees of the Trust, their term of office and length of time served, their principal business occupations during the past five years, the number of portfolios in the Fund Complex overseen by each Independent Trustee, and other directorships, if any, held by the Trustee are shown below.
| INDEPENDENT TRUSTEES | | |
| Name, Address & Year of Birth* | | Position(s) Held with Trust | | Term of Office and Length of Time Served** | | Principal Occupation(s) During Past 5 Years | | Number of Portfolios in Fund Complex Overseen by Trustees*** | | Other Directorships Held by Trustees |
Mary K. Anstine,
1940 | | Trustee | | Since March 2008 | | Ms. Anstine is Trustee/Director of AV Hunter Trust and Colorado Uplift Board. | | 36 | | Ms. Anstine is a Trustee of ALPS Variable Investment Trust (7 funds); Financial Investors Trust (32 funds); Reaves Utility Income Fund; and Segall Bryant & Hamill Trust (14 funds). |
Jeremy W. Deems,
1976 | | Trustee | | Since March 2008 | | Mr. Deems is the Co-Founder and Chief Financial Officer of Green Alpha Advisors, LLC, a registered investment advisor, and Co-Portfolio Manager of the Shelton Green Alpha Fund. | | 36 | | Mr. Deems is a Trustee of ALPS Variable Investment Trust (7 funds); Financial Investors Trust (32 funds); and Reaves Utility Income Fund; and Clough Funds Trust (1 fund). |
Rick A. Pederson,
1952 | | Trustee | | Since March 2008 | | Mr. Pederson is Partner, Bow River Capital Partners (private equity management), 2003 - present; Board Member, Prosci Inc. (private business services) 2013-2016; Advisory Board Member, Citywide Banks (Colorado community bank) 2014-2017; Board Member, Strong-Bridge Consulting, 2015-2019; Board Member, IRI/ODMS Holdings LLC, 2017-2019; Director, National Western Stock Show (not for profit) 2010 - present; Director, History Colorado (not for profit) 2015-present; Director, Citywide Bank Advisory Board 2017-present; Trustee, Boettcher Foundation, 2018 -present. | | 19 | | Mr. Pederson is Trustee of Segall Bryant & Hamill Trust (14 funds) and Principal Real Estate Income Fund (1 fund). |
| * | The business address of the Trustee is c/o ALPS Advisors, Inc., 1290 Broadway, Suite 1000, Denver, Colorado 80203. |
| ** | This is the period for which the Trustee began serving the Trust. Each Trustee serves an indefinite term, until his successor is elected. |
| *** | The Fund Complex includes all series of the Trust and any other investment companies for which ALPS Advisors, Inc. provides investment advisory services. |
| RiverFront ETFs | |
| Trustees & Officers | November 30, 2021 (Unaudited) |
The Trustee who is an “interested person” of the Trust, his term of office and length of time served, his principal business occupations during the past five years, the number of portfolios in the Fund Complex overseen by the Interested Trustee and the other directorships, if any, held by the Trustee, are shown below.
| INTERESTED TRUSTEE | | |
| Name, Address and Year of Birth of Interested Trustee* | | Position(s) Held with Trust | | Term of Office and Length of Time Served** | | Principal Occupation(s) During Past 5 Years | | Number of Portfolios in Fund Complex Overseen by Trustees*** | | Other Directorships Held by Trustees |
| Edmund J. Burke, 1961 | | Trustee | | Since December 2017. | | Mr. Burke joined ALPS in 1991 and served as the President and Director of ALPS Holdings, Inc., and ALPS Advisors, Inc. (“AAI”), and Director of ALPS Distributors, Inc. (“ADI”), ALPS Fund Services, Inc. (“AFS”), and ALPS Portfolio Solutions Distributor, Inc. (“APSD”). Mr. Burke retired from ALPS in June 2019. | | 31 | | Mr. Burke is a Trustee of Clough Global Dividend and Income Fund (1 fund); Clough Global Equity Fund (1 fund); Clough Global Opportunities Fund (1 fund); Clough Funds Trust (1 fund); Liberty All-Star Equity Fund (1 fund); Director of the Liberty All- Star Growth Fund, Inc. (1 fund) and Financial Investors Trust (32 funds). |
| * | The business address of the Trustee is c/o ALPS Advisors, Inc., 1290 Broadway, Suite 1000, Denver, Colorado 80203. Effective December 1, 2021, Mr. Burke is an Independent Trustee of the Trust. |
| ** | This is the period for which the Trustee began serving the Trust. Each Trustee serves an indefinite term, until his successor is elected. |
| *** | The Fund Complex includes all series of the Trust and any other investment companies for which ALPS Advisors, Inc. provides investment advisory services. |
| RiverFront ETFs | |
| Trustees & Officers | November 30, 2021 (Unaudited) |
| OFFICERS | | | | | | |
| Name, Address and Year of Birth of Officer* | | Position(s) Held with Trust | | Length of Time Served** | | Principal Occupation(s) During Past 5 Years |
| Laton Spahr, 1975 | | President | | Since June 2021 | | Mr. Spahr joined ALPS in 2019 and currently serves as President and Portfolio Manager of AAI. Prior to his current role, Mr. Spahr was a Senior Vice President and Strategy Leader of the Value & Income Team for Oppenheimer Funds from 2013 to 2019. |
| Matthew Sutula, 1985 | | Chief Compliance Officer (“CCO”) | | Since December 2019 | | Mr. Sutula joined ALPS in 2012 and currently serves as Chief Compliance Officer of AAI. Prior to his current role, Mr. Sutula served as interim Compliance Officer of the Trust (September 2019 to December 2019). Compliance Manager and Senior Compliance Analyst for AAI, as well as Compliance Analyst for AFS. Prior to joining ALPS, he spent seven years at Morningstar, Inc. in various analyst roles supporting the registered investment company databases. Mr. Sutula is also Chief Compliance Officer of Principal Real Estate Income Fund, ALPS Variable Investment Trust, RiverNorth Opportunities Fund, Inc., Liberty All-Star Equity Fund and Liberty All-Star Growth Fund, Inc. |
| Kathryn Burns, 1976 | | Treasurer | | Since September 2018 | | Ms. Burns serves as Vice President, Director of Fund Operations of AAI since 2018. From 2013 to 2018, she served as Vice President and Fund Controller at AFS. Prior to joining ALPS, she worked at Old Mutual Capital where she served as Vice President and Chief Compliance Officer (2010 – 2012) and Regulatory Reporting Manager and Assistant Treasurer to the Old Mutual Funds Trusts (2006 – 2012). She also served as a CPA for PricewaterhouseCoopers LLP. Ms. Burns also serves as President of ALPS Variable Investment Trust, Principal Real Estate Income Fund and RiverNorth Opportunities Fund, Inc. From June 2018 to November 2021 she also served as Treasurer of Boulder Growth & Income Fund, Inc. |
| Brendan Hamill, 1986 | | Secretary | | Since September 2021 | | Mr. Hamill joined ALPS in August 2021, and is currently Vice President and Principal Legal Counsel. Prior to joining ALPS, Mr. Hamill was an attorney at Lewis Brisbois Bisgaard & Smith, LLP (law firm) (December 2018-August 2021) and Vedder Price, P.C. (law firm) (August 2015-December 2018). Mr. Hamill also serves as Secretary of Financial Investors Trust, Secretary of ALPS Variable Investment Trust, Secretary of Principal Real Estate Income Fund, and Assistant Secretary of James Advantage Funds. |
| * | The business address of each Officer is c/o ALPS Advisors, Inc., 1290 Broadway, Suite 1000, Denver, Colorado 80203. Each Officer is deemed an affiliate of the Trust as defined under the 1940 Act. |
| ** | This is the period for which the Officer began serving the Trust. Each Officer serves an indefinite term, until his/her successor is elected. |
The Statement of Additional Information includes additional information about the Fund’s Trustees and is available, without charge, upon request by calling (toll-free) 1-866-759-5679.

| (a) | The Registrant, as of the end of the period covered by this report, has adopted a code of ethics that applies to the Registrant's principal executive officer, principal financial officer, principal accounting officer or controller or any persons performing similar functions on behalf of the Registrant. |
| (c) | During the period covered by this report, no amendments to the provisions of the code of ethics adopted in 2(a) above were made. |
| (d) | During the period covered by this report, no implicit or explicit waivers to the provisions of the code of ethics adopted in 2(a) above were granted. |
| (f) | The Registrant's Code of Ethics is attached as an Exhibit hereto. |
| Item 3. | Audit Committee Financial Expert. |
The Board of Trustees of the Registrant has determined that the Registrant has at least one Audit Committee Financial Expert serving on its audit committee. The Board of Trustees of the Registrant has designated Jeremy W. Deems as the Registrant’s “Audit Committee Financial Expert”. Mr. Deems is “independent” as defined in paragraph (a)(2) of Item 3 to Form N-CSR.
| Item 4. | Principal Accountant Fees and Services. |
| (a) | Audit Fees: For the Registrant’s fiscal years ended November 30, 2021 and November 30, 2020, the aggregate fees billed for professional services rendered by the principal accountant for the audit of the Registrant’s annual financial statements were $353,415 and $321,865, respectively. |
| (b) | Audit-Related Fees: For the Registrant’s fiscal years ended November 30, 2021 and November 30, 2020, the aggregate fees billed for professional services rendered by the principal accountant that are reasonably related to the performance of the audit of the Registrant's financial statements and are not reported under paragraph (a) of this Item were $0 and $0, respectively. |
| (c) | Tax Fees: For the Registrant’s fiscal years ended November 30, 2021 and November 30, 2020, the aggregate fees billed for professional services rendered by the principal accountant for tax compliance, tax advice and tax planning were $121,080 and $91,730, respectively. The fiscal year 2021 and 2020 tax fees were for services pertaining to federal and state income tax return review, review of year end dividend distributions and excise tax preparation. |
| (d) | All Other Fees: For the Registrant’s fiscal years ended November 30, 2021 and November 30, 2020, aggregate fees billed to the Registrant by the principal accountant for services provided by the principal accountant other than the services reported in paragraphs (a) through (c) of this Item 4 were $0 and $0, respectively. |
| (1) | Audit Committee Pre-Approval Policies and Procedures: All services to be performed by the Registrant's principal accountant must be pre-approved by the Registrant's audit committee. |
| (2) | No services described in paragraphs (b) through (d) of this Item were approved by the Registrant’s audit committee pursuant to paragraph (c)(7)(i)(C) of Rule 2-01 of Regulation S-X. |
| (g) | The aggregate non-audit fees billed by the Registrant’s accountant for the fiscal years ended November 30, 2021 and November 30, 2020 of the Registrant were $121,080 and $91,730, respectively. These fees consisted of non-audit fees billed to the Registrant of $121,080 and $91,370, respectively as described in response to paragraph (c) above. |
| (h) | The Registrant’s audit committee has considered whether the provision of non- audit services that were rendered to the Registrant’s investment adviser (not including any sub-adviser whose role is primarily portfolio management and is subcontracted with or overseen by another investment adviser), and any entity controlling, controlled by, or under common control with the investment adviser that provides ongoing services to the Registrant that were not pre-approved pursuant to paragraph (c)(7)(ii) of Rule 2-01 of Regulation S-X, is compatible with maintaining the principal accountant’s independence. The Registrant’s audit committee determined that the provision of such non-audit services is compatible with maintaining the principal accountant’s independence. |
| Item 5. | Audit Committee of Listed Registrants. |
Not applicable to the Registrant.
| (a) | Schedule of Investments is included as part of the Report to Stockholders filed under Item 1 of this Form N-CSR. |
| Item 7. | Disclosure of Proxy Voting Policies and Procedures for Closed-End Management Investment Companies. |
Not applicable to Registrant.
| Item 8. | Portfolio Managers of Closed-End Management Investment Companies. |
Not applicable to Registrant.
| Item 9. | Purchases of Equity Securities by Closed-End Management Investment Company and Affiliated Purchasers. |
Not applicable to Registrant.
| Item 10. | Submission of Matters to a Vote of Security Holders. |
No material changes to the procedures by which the shareholders may recommend nominees to the Registrant’s Board of Trustees have been implemented after the Registrant’s last provided disclosure in response to the requirements of Item 407(c)(2)(iv) of Regulation S-K (17 CFR 229.407) (as required by Item 22(b)(15) of Schedule 14A (17 CFR 240.14a-101)), or this Item.
| Item 11. | Controls and Procedures. |
| (a) | The Registrant’s principal executive officer and principal financial officer have concluded that the Registrant’s disclosure controls and procedures (as defined in Rule 30a-3(c) under the Investment Company Act of 1940, as amended) are effective based on their evaluation of these controls and procedures as of a date within 90 days of the filing date of this report. |
| (b) | There was no change in the Registrant's internal control over financial reporting (as defined in Rule 30a-3(d) under the Investment Company Act of 1940, as amended) during the period covered by this report that has materially affected, or is reasonably likely to materially affect, the Registrant's internal control over financial reporting. |
| Item 12. | Disclosure of Securities Lending Activities for Closed-End Management Investment Companies. |
Not applicable.
SIGNATURES
Pursuant to the requirements of the Securities Exchange Act of 1934 and the Investment Company Act of 1940, the Registrant has duly caused this report to be signed on its behalf by the undersigned, thereunto duly authorized.
| ALPS ETF TRUST | |
| | | |
| By: | /s/ Laton Spahr | |
| | Laton Spahr (Principal Executive Officer) | |
| | President | |
| | | |
| Date: | February 8, 2022 | |
Pursuant to the requirements of the Securities Exchange Act of 1934 and the Investment Company Act of 1940, this report has been signed below by the following persons on behalf of the Registrant and in the capacities and on the dates indicated.
| By: | /s/ Laton Spahr | |
| | Laton Spahr (Principal Executive Officer) | |
| | President | |
| | | |
| Date: | February 8, 2022 | |
| | | |
| By: | /s/ Kathryn Burns | |
| | Kathryn Burns (Principal Financial Officer) | |
| | Treasurer | |
| | | |
| Date: | February 8, 2022 | |