UNITED STATES
SECURITIES AND EXCHANGE COMMISSION
Washington, D.C. 20549
FORM N-CSR
CERTIFIED SHAREHOLDER REPORT OF REGISTERED
MANAGEMENT INVESTMENT COMPANIES
Investment Company Act file number:
811-22175
ALPS ETF TRUST
(Exact name of registrant as specified in charter)
1290 Broadway, Suite 1100, Denver, Colorado 80203
(Address of principal executive offices) (Zip code)
Abigail J. Murray, Esq., Secretary
ALPS ETF Trust
1290 Broadway, Suite 1100
Denver, Colorado 80203
(Name and address of agent for service)
Registrant’s Telephone Number, including Area Code: (303) 623-2577
Date of fiscal year end: November 30
Date of reporting period: December 1, 2015 – November 30, 2016
Item 1. Reports to Stockholders.
| Performance Overview | |
| Alerian MLP ETF | 1 |
| Alerian Energy Infrastructure ETF | 4 |
| Disclosure of Fund Expenses | 7 |
| Report of Independent Registered Public Acounting Firm | 8 |
| Financial Statements | |
| Alerian MLP ETF | |
| Schedule of Investments | 9 |
| Statement of Assets and Liabilities | 10 |
| Statement of Operations | 11 |
| Statements of Changes in Net Assets | 12 |
| Financial Highlights | 13 |
| Alerian Energy Infrastructure ETF | |
| Schedule of Investments | 14 |
| Statement of Assets and Liabilities | 16 |
| Statement of Operations | 17 |
| Statements of Changes in Net Assets | 18 |
| Financial Highlights | 19 |
| Notes to Financial Statements | 20 |
| Additional Information | 30 |
| Board Considerations Regarding Approval of Investment Advisory Agreements | 32 |
| Trustees & Officers | 34 |
alpsfunds.com
Alerian MLP ETF
| Performance Overview | November 30, 2016 (Unaudited) |
INVESTMENT OBJECTIVE
The Alerian MLP ETF (the “Fund” or “AMLP”) seeks investment results that correspond (before fees and expenses) generally to the price and yield performance of its underlying index, the Alerian MLP Infrastructure Index (the “Underlying Index” or “AMZI”). The Shares of the Fund are listed and trade on the New York Stock Exchange (“NYSE”) Arca under the ticker symbol AMLP. The Fund generally will invest in all of the securities that comprise the Index in proportion to their weightings in the Underlying Index.
The Underlying Index is a rules based, modified capitalization weighted, float‐adjusted index intended to give investors a means of tracking the overall performance of the United States energy infrastructure Master Limited Partnership (“MLP”) asset class. The Underlying Index is comprised of energy infrastructure MLPs that earn a majority of their cash flow from the transportation, storage, and processing of energy commodities.
PERFORMANCE OVERVIEW
During the twelve‐month period of December 1, 2015 to November 30, 2016 the Fund delivered a total return of 9.76% (9.76% NAV). This compares to the Fund’s Underlying Index, which was up 2.6% on a price‐return and 11.38% on a total‐return basis. The difference in performance between the AMZI and AMLP is primarily attributable to the Fund’s operating expenses and the tax impact of the Fund’s C Corporation structure.
During the period, the fund paid four distributions:
| | • | $0.299 on February 18, 2016 |
| | • | $0.240 on August 17, 2016 |
| | • | $0.240 on November 17, 2016 |
Improving NGL1 fundamentals led to ONEOK Partners (OKS), DCP Midstream (DPM), and Williams Partners (WPZ) to outperform over 33% during the period. Concerns of equity overhang impacted the performance of MPLX LP (MPLX) and Shell Midstream Partners (SHLX) by over 20%.
During the period, Antero Midstream Partners (AM), Boardwalk Pipeline Partners (BWP), Phillips 66 Partners (PSXP), and Tallgrass Energy Partners (TEP) were added to the index during the period. Targa Resource Partners (NGLS) was removed during a special rebalancing due to its merger with Targa Resources Corp (TRGP).
For distributions reflecting the third calendar quarter of 2016, 14 of the 25 constituents in the AMZI increased their distribution, 10 MLPs maintained their distribution, and one MLP lowered its distribution.
After falling 34% from December 1, 2015, the Underlying Index hit a near‐term low on February 11, 2016. Since then, until period end on November 30, 2016, the Underlying Index recovered over 56%. There has been a marked difference for MLPs over the past year. Capital markets have eased, MLPs have begun announcing organic growth projects again, and the sector even saw its first MLP IPO after a fourteen‐month pause. In addition, a handful of major M&A activity has been either announced or completed. Certain areas such as the Permian in West Texas, Marcellus in the Northeast, and SCOOP/STACK plays in Oklahoma continue to see strong producer activity.
Despite the sector turning around since over a year ago, energy infrastructure MLPs and companies are facing new difficulties. While federal agencies have been supportive of the build‐out of energy infrastructure, certain state regulatory agencies in the Northeast and East have made the process of securing pipeline customer commitments and/or right of way more difficult for MLPs. Environmental protests have weighed on the ability for certain MLPs to proceed with newbuild pipeline construction. As a function of a more challenging build‐out environment, not only are existing infrastructure assets now more valuable, the rights of way that come with pipelines also have greater value. Many industry analysts expect, and we believe, that some of these regulatory challenges will lessen under the Trump administration.
Relative to a year ago, we believe the oil market is headed more in the direction towards balancing, but short term volatility is still to be expected. Uncertainty continues to be the enemy of premium valuations. As uncertainty lessens around the direction of commodity prices, MLP access to capital markets, infrastructure growth opportunities, and even the political climate, we believe that energy infrastructure MLPs may begin trading more on their fundamentals, and less on sentiment. With the long‐term fundamentals for energy infrastructure MLPs to support the domestic supply of energy resources still intact, we continue to believe that MLPs represent a potentially compelling investment opportunity for investors seeking after‐tax yield and access to real assets.
1) | NGL: Natural gas liquids. |
Alerian MLP ETF
| Performance Overview | November 30, 2016 (Unaudited) |
Performance (as of November 30, 2016)
| | 1 Year | 3 Year | 5 Year | Since Inception^ |
| Alerian MLP ETF – NAV | 9.76% | ‐4.40% | 1.80% | 3.73% |
| Alerian MLP ETF – Market Price* | 9.76% | ‐4.34% | 1.84% | 3.76% |
| Alerian MLP Infrastructure Index | 11.38% | ‐5.55% | 3.67% | 6.67% |
S&P 500® Total Return Index | 8.06% | 9.07% | 14.45% | 14.91% |
Total Expense Ratio (per the current prospectus) 0.85%.
Performance data quoted represents past performance. Past performance does not guarantee future results. The table does not reflect the deduction of taxes that a shareholder would pay on Fund distributions or the redemption of Fund shares. Investment return and principal value of an investment will fluctuate so that an investor’s shares, when sold or redeemed, may be worth more or less than the original cost. Current performance data may be higher or lower than actual data quoted. For the most current month-end performance data please visit www.alpsfunds.com or call 1.877.398.8461. The Fund accrues deferred income taxes for future tax liabilities associated with the portion of MLP distributions considered to be a tax-deferred return of capital and for any net operating gains as well as capital appreciation of its investment. This deferred tax liability is reflected in the daily NAV and as a result the fund's after-tax performance could differ significantly from the underlying assets even if the pre-tax performance is closely tracked.
NAV is an exchange-traded fund’s per-share value. The per-share dollar amount of the Fund is derived by dividing the total value of all the securities in its portfolio, less any liabilities, by the number of Fund shares outstanding. Market Price is the price at which a share can currently be traded in the market. Information detailing the number of days the Market Price of the Fund was greater than the Fund’s NAV and the number of days it was less than the Fund’s NAV can be obtained at www.alpsfunds.com.
| ^ | The Fund commenced Investment Operations on August 24, 2010 with an Inception Date, the first day of trading on the NYSE ARCA, of August 25, 2010. |
| * | Market Price is based on the midpoint of the bid-ask spread at 4 p.m. ET and does not represent the returns an investor would receive if shares were traded at other times. |
The Alerian MLP Infrastructure Index is comprised of 25 midstream energy Master Limited Partnerships and provides investors with an unbiased benchmark for the infrastructure component of this emerging asset class.
S&P 500® Total Return Index is the Standard & Poor’s composite index of 500 stocks, a widely recognized, unmanaged index of common stock prices. Total return assumes reinvestment of any dividends and distributions realized during a given time period.
The index is not actively managed and does not reflect any deductions for fees, expenses or taxes. One cannot invest directly in an index. Index performance does not reflect fund performance.
The Alerian MLP ETF is not suitable for all investors. Investments in the Fund are subject to investment risks, including possible loss of the principal amount invested.
ALPS Portfolio Solutions Distributor, Inc., a FINRA member, is the distributor for the Fund.
Alerian MLP ETF
| Performance Overview | November 30, 2016 (Unaudited) |
Top 10 Holdings* (as of November 30, 2016)
| Magellan Midstream Partners LP | 10.00% |
| Enterprise Products Partners LP | 9.97% |
| Plains All American Pipeline LP | 9.07% |
| Energy Transfer Partners LP | 8.93% |
| Williams Partners LP | 6.59% |
| Buckeye Partners LP | 6.08% |
| MPLX LP | 6.05% |
| ONEOK Partners LP | 4.78% |
| Sunoco Logistics Partners LP | 3.94% |
| Enbridge Energy Partners LP | 3.85% |
| Total % of Top 10 Holdings | 69.26% |
Future holdings are subject to change.
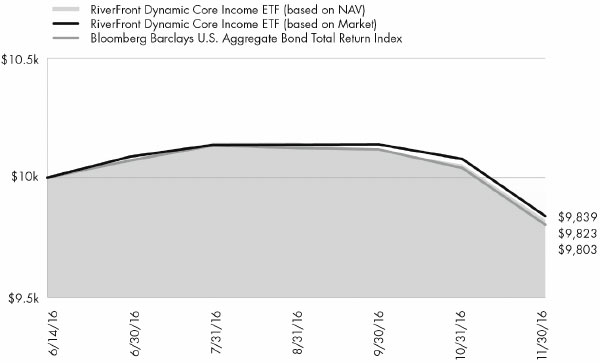
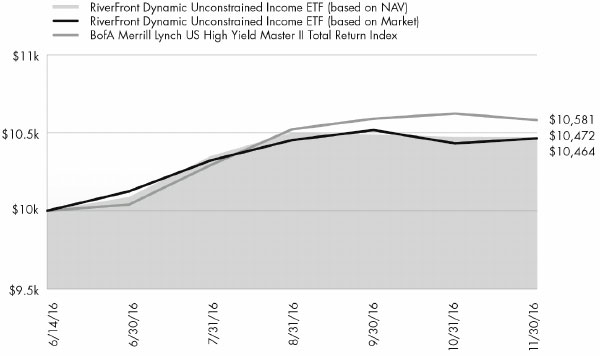
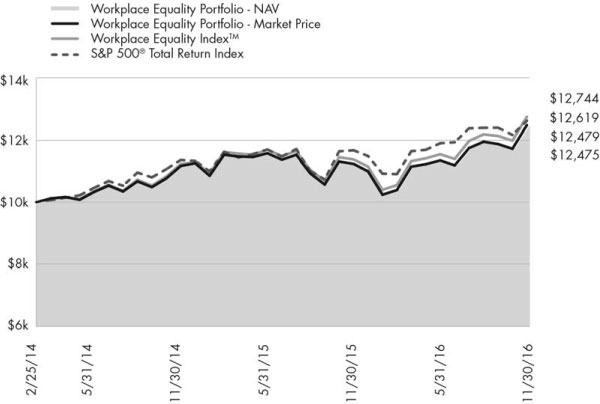
Growth of $10,000 (as of November 30, 2016)
Comparison of change in value of a $10,000 investment in the Fund and the Indexes
The chart above represents historical performance of a hypothetical investment of $10,000 in the Fund over the life of the Fund. Past performance does not guarantee future results. This chart does not reflect the deduction of taxes that a shareholder would pay on Fund distributions or the redemption of Fund shares.
Alerian Energy Infrastructure ETF
| Performance Overview | November 30, 2016 (Unaudited) |
INVESTMENT OBJECTIVE
The Alerian Energy Infrastructure ETF (the “Fund” or “ENFR”) seeks investment results that correspond (before fees and expenses) generally to the price and yield performance of its underlying index, the Alerian Energy Infrastructure Index (the “Underlying Index” or “AMEI”). As a secondary objective, the Fund seeks to provide total return through income and capital appreciation.
The Underlying Index is a composite of North American energy infrastructure companies engaged in the pipeline transportation, storage, and processing of energy commodities (also known as “midstream energy businesses”). Currently, each constituent is assigned to one of four categories: (i) U.S. Energy Infrastructure Master Limited Partnerships (“MLPs”) (ii) U.S. General Partners, (iii) U.S. Energy Infrastructure Companies, and (iv) Canadian Energy Infrastructure Companies. Each category is assigned an index weight of 25%.
PERFORMANCE OVERVIEW
During the twelve‐month period of December 1, 2015 to November 30, 2016, the Fund delivered a total return of 25.84% (25.63% NAV). This compares to the Fund’s Underlying Index, which returned 19.6% on a price return and 26.65% on a total return basis.
Top contributors during the period include Plains GP Holdings (PAGP), ONEOK Inc. (OKE), and Spectra Energy (SE). Underperformers included MPLX LP (MPLX), Phillips 66 Partners (PSXP), and Shell Midstream Partners (SHLX).
During the period, Exterran Corporation (EXTN) was removed during a quarterly rebalancing. In addition, Targa Resources Partners (NGLS) and Columbia Pipeline Group (CPGX) were removed during special rebalancings, due to their merger with Targa Resources Corp (TRGP) and TransCanada (TRP), respectively.
After falling 26% from December 1, 2015, the Underlying Index hit a near‐term low on January 20, 2016, roughly 16 trading days prior to when energy infrastructure MLPs hit their low on February 11, 2016, as measured by the Alerian MLP Infrastructure Index (AMZI). Since January through period end, the Underlying Index recovered nearly 62%. There has been more stabilization in crude prices relative to a year ago, global oversupply issues have lessened, investor sentiment has improved, OPEC has agreed to production cuts, and the new political climate in the US and Canada looks to be more supportive for energy infrastructure companies.
Organic projects backed by long‐term binding commitments continue to be announced. These projects vary by product handled, including crude oil, natural gas, NGLs, refined products, and propane. They also vary by asset type, including pipelines, processing plants, and fractionation plants. More notable projects include a $2.1 billion natural gas pipeline in Mexico, owned by TransCanada and IEnova, as well as Spectra Energy’s $1.5 billion natural gas pipeline running to the Mexican border where it will connect with TransCanada and IEnova’s pipeline.
The Interstate Natural Gas Association of America (INGAA) released an updated study during the period discussing midstream oil and gas infrastructure needs in the US and Canada, suggesting in their view, a median case of $522 billion of energy infrastructure build‐out necessary between 2015 and 2035. As the energy markets continue to rebalance, and if the $522 billion of energy infrastructure build‐out materializes over the next several decades, we continue to believe that investors seeking access to real assets via energy infrastructure have the potential to experience capital appreciation.
Alerian Energy Infrastructure ETF
| Performance Overview | November 30, 2016 (Unaudited) |
Performance (as of November 30, 2016)
| | 1 Year | 3 Year | Since Inception^ |
| Alerian Energy Infrastructure ETF ‐ NAV | 25.63% | 0.10% | ‐0.08% |
| Alerian Energy Infrastructure ETF ‐ Market Price* | 25.84% | 0.12% | ‐0.01% |
| Alerian Energy Infrastructure Index | 26.65% | 0.88% | 0.73% |
S&P 500® Total Return Index | 8.06% | 9.07% | 9.88% |
Total Expense Ratio (per the current prospectus) 0.65%.
Performance data quoted represents past performance. Past performance does not guarantee future results. The table does not reflect the deduction of taxes that a shareholder would pay on Fund distributions or the redemption of Fund shares. Investment return and principal value of an investment will fluctuate so that an investor’s shares, when sold or redeemed, may be worth more or less than the original cost. Current performance data may be higher or lower than actual data quoted. For most current month-end performance data please visit www.alpsfunds.com or call 1.866.675.2639.
NAV is an exchange-traded fund’s per-share value. The per-share dollar amount of the Fund is derived by dividing the total value of all the securities in its portfolio, less any liabilities, by the number of Fund shares outstanding. Market Price is the price at which a share can currently be traded in the market. Information detailing the number of days the Market Price of the Fund was greater than the Fund’s NAV and the number of days it was less than the Fund’s NAV can be obtained at www.alpsfunds.com.
| ^ | The Fund commenced Investment Operations on November 1, 2013. |
| * | Market Price is based on the midpoint of the bid-ask spread at 4 p.m. ET and does not represent the returns an investor would receive if shares were traded at other times. |
The Alerian Energy Infrastructure Index is comprised of 30 equity securities of issuers headquartered or incorporated in the United States and Canada that engage in the transportation, storage, and processing of energy commodities.
S&P 500® Total Return Index: the Standard & Poor’s composite index of 500 stocks, a widely recognized, unmanaged index of common stock prices. Total return assumes reinvestment of any dividends and distributions realized during a given time period.
The index is not actively managed and does not reflect any deductions for fees, expenses or taxes. One cannot invest directly in an index. Index performance does not reflect fund performance.
The Alerian Energy Infrastructure ETF is not suitable for all investors. Investments in the Fund are subject to investment risks, including possible loss of the principal amount invested.
ALPS Portfolio Solutions Distributor, Inc., a FINRA member, is the distributor for the Fund.
Alerian Energy Infrastructure ETF
| Performance Overview | November 30, 2016 (Unaudited) |
Top 10 Holdings* (as of November 30, 2016)
| ONEOK, Inc. | 5.64% |
| Spectra Energy Corp. | 5.54% |
| The Williams Cos., Inc. | 5.29% |
| Enbridge, Inc. | 5.14% |
| CenterPoint Energy, Inc. | 5.12% |
| Kinder Morgan, Inc. | 4.90% |
| Plains GP Holdings LP, Class A | 4.86% |
| TransCanada Corp. | 4.77% |
| Dominion Resources, Inc. | 4.76% |
| Magellan Midstream Partners LP | 4.74% |
| Total % of Top 10 Holdings | 50.76% |
Future holdings are subject to change.
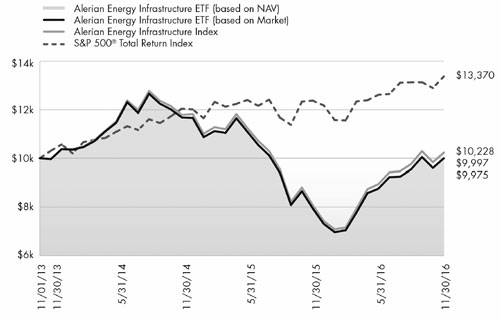
Growth of $10,000 (as of November 30, 2016)
Comparison of change in value of a $10,000 investment in the Fund and the Indexes
The chart above represents historical performance of a hypothetical investment of $10,000 in the Fund over the life of the Fund. Past performance does not guarantee future results. This chart does not reflect the deduction of taxes that a shareholder would pay on Fund distributions or the redemption of Fund shares.
Alerian Exchange Traded Funds
| Disclosure of Fund Expenses | November 30, 2016 (Unaudited) |
Shareholder Expense Example: As a shareholder of a Fund, you incur two types of costs: (1) transaction costs which may include creation and redemption fees or brokerage charges, and (2) ongoing costs, including management fees and other Fund expenses. These examples are intended to help you understand your ongoing costs (in dollars) of investing in the Fund and to compare these costs with the ongoing costs of investing in other funds. It is based on an investment of $1,000 invested at the beginning of the (six month) period and held through November 30, 2016.
Actual Return: The first line of the table provides information about actual account values and actual expenses. You may use the information in this line, together with the amount you invested, to estimate the expenses that you incurred over the period. Simply divide your account value by $1,000 (for example, an $8,600 account value divided by $1,000 = 8.6), then multiply the result by the number in the first line under the heading entitled “Expenses Paid During Period” to estimate the expenses attributable to your investment during this period.
Hypothetical 5% Return: The second line of the table provides information about hypothetical account values and hypothetical expenses based on the Fund’s actual expense ratio and an assumed rate of return of 5% per year before expenses, which is not the Fund’s actual return. The hypothetical account values and expenses may not be used to estimate the actual ending account balance or expenses you paid for the period. You may use this information to compare ongoing costs of investing in the Fund and other funds. To do so, compare this 5% hypothetical example with the 5% hypothetical examples that appear in the shareholder reports of other funds.
The expenses shown in the table are meant to highlight ongoing Fund costs only and do not reflect any transaction costs, such as creation and redemption fees or brokerage charges. Therefore, the second line is useful in comparing ongoing costs only, and will not help you deter‐ mine the relative total costs of owning different funds. In addition, if these costs were included, your costs would have been higher.
| | Beginning Account Value 6/1/16 | Ending Account Value 11/30/16 | Expense Ratio(a) | Expenses Paid During Period 6/1/16 - 11/30/16(b) |
| Alerian MLP ETF | | | | |
| Actual | $1,000.00 | $1,044.00 | 0.85% | $4.34 |
Hypothetical (5% return before expenses) | $1,000.00 | $1,020.75 | 0.85% | $4.29 |
| | | | | |
| Alerian Energy Infrastructure ETF | | | | |
| Actual | $1,000.00 | $1,138.60 | 0.65% | $3.48 |
Hypothetical (5% return before expenses) | $1,000.00 | $1,021.75 | 0.65% | $3.29 |
(a) | Annualized, based on the Fund's most recent fiscal half-year expenses. |
(b) | Expenses are equal to the Fund's annualized expense ratio multiplied by the average account value over the period, multiplied by the number of days in the most recent fiscal half year (183), divided by 366. |
Alerian Exchange Traded Funds
Report of Independent Registered Public Accounting Firm
To the Board of Trustees and Shareholders of ALPS ETF Trust:
We have audited the accompanying statements of assets and liabilities, including the schedules of investments, of Alerian MLP ETF and Alerian Energy Infrastructure ETF, two of the portfolios constituting the ALPS ETF Trust (the “Trust”), as of November 30, 2016, and the related statements of operations for the year then ended, the statements of changes in net assets for each of the two years in the period then ended, and the financial highlights for each of the periods presented. These financial statements and financial highlights are the responsibility of the Trust’s management. Our responsibility is to express an opinion on these financial statements and financial highlights based on our audits.
We conducted our audits in accordance with the standards of the Public Company Accounting Oversight Board (United States). Those standards require that we plan and perform the audit to obtain reasonable assurance about whether the financial statements and financial highlights are free of material misstatement. The Trust is not required to have, nor were we engaged to perform, an audit of its internal control over financial reporting. Our audits included consideration of internal control over financial reporting as a basis for designing audit procedures that are appropriate in the circumstances, but not for the purpose of expressing an opinion on the effectiveness of the Trust’s internal control over financial reporting. Accordingly, we express no such opinion. An audit also includes examining, on a test basis, evidence supporting the amounts and disclosures in the financial statements, assessing the accounting principles used and significant estimates made by management, as well as evaluating the overall financial statement presentation. Our procedures included confirmation of securities owned as of November 30, 2016, by correspondence with the custodian and brokers. We believe that our audits provide a reasonable basis for our opinion.
In our opinion, the financial statements and financial highlights referred to above present fairly, in all material respects, the financial position of Alerian MLP ETF and Alerian Energy Infrastructure ETF of the ALPS ETF Trust as of November 30, 2016, the results of their operations for the year then ended, the changes in their net assets for each of the two years in the period then ended, and the financial highlights for each of the periods presented, in conformity with accounting principles generally accepted in the United States of America.
DELOITTE & TOUCHE LLP
Denver, Colorado
January 27, 2017
Alerian MLP ETF
| Schedule of Investments | November 30, 2016 |
| Security Description | | Shares | | | Value | |
| Master Limited Partnerships (100.43%) | | | | | | |
| Gathering & Processing (26.35%) | | | | | | |
| Antero Midstream Partners LP | | | 4,574,081 | | | $ | 128,851,862 | |
DCP Midstream Partners LP(a) | | | 6,171,411 | | | | 213,715,963 | |
| EnLink Midstream Partners LP | | | 10,403,852 | | | | 182,275,487 | |
| MPLX LP | | | 17,376,799 | | | | 570,827,847 | |
ONEOK Partners LP(a) | | | 10,785,060 | | | | 450,815,508 | |
| Western Gas Partners LP | | | 5,309,295 | | | | 303,001,466 | |
| Williams Partners LP | | | 17,032,243 | | | | 621,676,869 | |
| Total Gathering & Processing | | | | | | | 2,471,165,002 | |
| | | | | | | | | |
Pipeline Transportation | Natural Gas (27.82%) | | | | | | | | |
| Boardwalk Pipeline Partners LP | | | 8,489,487 | | | | 145,764,492 | |
| Energy Transfer Partners LP | | | 24,001,285 | | | | 842,925,129 | |
| Enterprise Products Partners LP | | | 36,310,933 | | | | 941,542,493 | |
| EQT Midstream Partners LP | | | 4,001,906 | | | | 293,059,576 | |
| Spectra Energy Partners LP | | | 4,908,311 | | | | 208,554,134 | |
| TC PipeLines LP | | | 3,329,485 | | | | 176,962,128 | |
| Total Pipeline Transportation | Natural Gas | | | | | | | 2,608,807,952 | |
| | | | | | | | | |
| Pipeline Transportation | Petroleum (46.26%) | | | | | | | | |
Buckeye Partners LP(a) | | | 8,925,623 | | | | 574,274,584 | |
Enbridge Energy Partners LP(a) | | | 14,705,996 | | | | 363,238,101 | |
Genesis Energy LP(a) | | | 7,014,426 | | | | 245,084,044 | |
Magellan Midstream Partners LP(a) | | | 13,629,760 | | | | 943,860,880 | |
NGL Energy Partners LP(a) | | | 6,573,790 | | | | 121,943,804 | |
NuStar Energy LP(a) | | | 4,392,697 | | | | 209,707,355 | |
| Phillips 66 Partners LP | | | 2,927,135 | | | | 132,101,603 | |
Plains All American Pipeline LP(a) | | | 25,976,325 | | | | 855,919,909 | |
Shell Midstream Partners LP(a) | | | 6,019,969 | | | | 166,030,745 | |
| Sunoco Logistics Partners LP | | | 15,693,372 | | | | 371,775,983 | |
| Tallgrass Energy Partners LP | | | 2,880,750 | | | | 134,934,330 | |
| Tesoro Logistics LP | | | 4,643,793 | | | | 218,861,964 | |
| Total Pipeline Transportation | Petroleum | | | | | | | 4,337,733,302 | |
| | | | | | | | | |
| Total Master Limited Partnerships | | | | | | | | |
| (Cost $8,628,506,881) | | | | | | | 9,417,706,256 | |
| | | 7 Day Yield | | | Shares | | | Value | |
| Short Term Investments (0.23%) | | | | | | | | | |
| State Street Institutional Treasury Plus Money Market Fund | | | 0.259 | % | | | 21,858,851 | | | | 21,858,851 | |
| | | | | | | | | | | | | |
| Total Short Term Investments | | | | | | | | | | | | |
| (Cost $21,858,851) | | | | | | | | | | | 21,858,851 | |
| | | | | | | | | | | | | |
| Total Investments (100.66%) | | | | | | | | | | | | |
| (Cost $8,650,365,732) | | | | | | | | | | $ | 9,439,565,107 | |
| | | | | | | | | | | | | |
| Liabilities in Excess of Other Assets (‐0.66%) | | | | | | | | | | | (61,545,919 | ) |
| | | | | | | | | | | | | |
| Net Assets (100.00%) | | | | | | | | | | $ | 9,378,019,188 | |
| (a) | Affiliated Company. See Note 8 in Notes to Financial Statements. |
See Notes to Financial Statements.
Alerian MLP ETF
| Statement of Assets and Liabilities | November 30, 2016 |
| ASSETS: | | | |
| Investments, at value | | $ | 5,294,974,214 | |
| Investments in affiliates, at value | | | 4,144,590,893 | |
| Receivable due from advisor | | | 3,042,500 | |
| Interest receivable | | | 5,389 | |
| Income tax receivable | | | 9,482 | |
| Total Assets | | | 9,442,622,478 | |
| | | | | |
| LIABILITIES: | | | | |
| Payable for investments purchased | | | 12,871,764 | |
| Franchise tax payable | | | 459,232 | |
| Deferred tax liability | | | 44,989,405 | |
| Payable to adviser | | | 6,282,889 | |
| Total Liabilities | | | 64,603,290 | |
| NET ASSETS | | $ | 9,378,019,188 | |
| | | | | |
| NET ASSETS CONSIST OF: | | | | |
| Paid‐in capital | | $ | 9,634,808,848 | |
| Accumulated net investment loss, net of deferred income taxes | | | (207,994,724 | ) |
| Accumulated net realized loss on investments, net of deferred income taxes | | | (620,935,068 | ) |
| Net unrealized appreciation on investments, net of deferred income taxes | | | 572,140,132 | |
| NET ASSETS | | $ | 9,378,019,188 | |
| | | | | |
| INVESTMENTS, AT COST | | $ | 5,115,603,669 | |
| INVESTMENTS IN AFFILIATES, AT COST | | | 3,534,762,063 | |
| | | | | |
| PRICING OF SHARES | | | | |
| Net Assets | | $ | 9,378,019,188 | |
| Shares of beneficial interest outstanding (Unlimited number of shares authorized, par value $0.01 per share) | | | 761,612,100 | |
| Net Asset Value, offering and redemption price per share | | $ | 12.31 | |
See Notes to Financial Statements.
Alerian MLP ETF
| Statement of Operations | For the Year Ended November 30, 2016 |
| INVESTMENT INCOME: | | | |
| Distributions from master limited partnerships | | $ | 639,723,539 | |
| Less return of capital distributions | | | (639,723,539 | ) |
| Total Investment Income | | | – | |
| | | | | |
| EXPENSES: | | | | |
| Franchise tax expense | | | 770,278 | |
| Investment adviser fee | | | 67,195,413 | |
| Total Expenses | | | 67,965,691 | |
| NET INVESTMENT LOSS, BEFORE INCOME TAXES | | | (67,965,691 | ) |
| Deferred income tax benefit | | | 96,348,240 | |
| NET INVESTMENT INCOME | | | 28,382,549 | |
| | | | | |
| REALIZED AND UNREALIZED GAIN/(LOSS): | | | | |
| Net realized loss on investments, before income taxes | | | (399,960,327 | ) |
| Net realized loss on affiliated investments, before income taxes | | | (181,285,437 | ) |
| Deferred income tax benefit | | | 123,140,278 | |
| Net realized loss | | | (458,105,486 | ) |
| Net change in unrealized appreciation on investments, before income taxes | | | 1,528,473,032 | |
| Deferred income tax expense | | | (263,842,388 | ) |
| Net change in unrealized appreciation | | | 1,264,630,644 | |
| NET REALIZED AND UNREALIZED GAIN | | | 806,525,158 | |
| NET INCREASE IN NET ASSETS RESULTING FROM OPERATIONS | | $ | 834,907,707 | |
See Notes to Financial Statements.
Alerian MLP ETF
Statements of Changes in Net Assets
| | | For the Year Ended November 30, 2016 | | | For the Year Ended November 30, 2015(a) | |
| OPERATIONS: | | | | | | |
| Net investment income/(loss) | | $ | 28,382,549 | | | $ | (132,888,834 | ) |
Net realized loss(a) | | | (458,105,486 | ) | | | (94,672,786 | ) |
Net change in unrealized appreciation/(depreciation)(a) | | | 1,264,630,644 | | | | (2,306,039,973 | ) |
| Net increase/(decrease) in net assets resulting from operations | | | 834,907,707 | | | | (2,533,601,593 | ) |
| | | | | | | | | |
| DISTRIBUTIONS TO SHAREHOLDERS: | | | | | | | | |
| From tax return of capital | | | (689,407,280 | ) | | | (647,133,076 | ) |
| Total distributions | | | (689,407,280 | ) | | | (647,133,076 | ) |
| | | | | | | | | |
| CAPITAL SHARE TRANSACTIONS: | | | | | | | | |
| Proceeds from sale of shares | | | 3,159,977,900 | | | | 2,547,020,530 | |
| Cost of shares redeemed | | | (1,131,213,513 | ) | | | (1,511,532,837 | ) |
| Net increase from share transactions | | | 2,028,764,387 | | | | 1,035,487,693 | |
| | | | | | | | | |
| Net increase/(decrease) in net assets | | | 2,174,264,814 | | | | (2,145,246,976 | ) |
| | | | | | | | | |
| NET ASSETS: | | | | | | | | |
| Beginning of year | | | 7,203,754,374 | | | | 9,349,001,350 | |
| End of year * | | $ | 9,378,019,188 | | | $ | 7,203,754,374 | |
| *Including accumulated net investment loss, net of deferred income taxes of: | | $ | (207,994,724 | ) | | $ | (236,377,273 | ) |
| | | | | | | | | |
| OTHER INFORMATION: | | | | | | | | |
| SHARE TRANSACTIONS: | | | | | | | | |
| Beginning shares | | | 588,062,100 | | | | 516,512,100 | |
| Shares sold | | | 271,600,000 | | | | 172,050,000 | |
| Shares redeemed | | | (98,050,000 | ) | | | (100,500,000 | ) |
| Shares outstanding, end of year | | | 761,612,100 | | | | 588,062,100 | |
| (a) | Prior to November 30, 2016, the Fund presented realized gain/loss and unrealized appreciation/depreciation by investment type. This change in presentation was made to conform to industry standards and had no effect on the Fund's change in net assets. |
See Notes to Financial Statements.
Alerian MLP ETF
| Financial Highlights | For a Share Outstanding Throughout the Periods Presented |
| | | For the Year Ended November 30, 2016 | | | For the Year Ended November 30, 2015 | | | For the Year Ended November 30, 2014 | | | For the Year Ended November 30, 2013 | | | For the Year Ended November 30, 2012 | |
| NET ASSET VALUE, BEGINNING OF PERIOD | | $ | 12.25 | | | $ | 18.10 | | | $ | 17.69 | | | $ | 16.32 | | | $ | 15.97 | |
| | | | | | | | | | | | | | | | | | | | | |
| INCOME/(LOSS) FROM OPERATIONS: | | | | | | | | | | | | | | | | | | | | |
Net investment income/(loss)(a) | | | 0.04 | | | | (0.13 | ) | | | (0.16 | ) | | | (0.09 | ) | | | (0.09 | ) |
| Net realized and unrealized gain/(loss) on investments | | | 1.04 | | | | (4.53 | ) | | | 1.70 | | | | 2.53 | | | | 1.44 | |
| Total from investment operations | | | 1.08 | | | | (4.66 | ) | | | 1.54 | | | | 2.44 | | | | 1.35 | |
| | | | | | | | | | | | | | | | | | | | | |
| DISTRIBUTIONS: | | | | | | | | | | | | | | | | | | | | |
| From net realized gains | | | – | | | | – | | | | (0.73 | ) | | | – | | | | (0.00 | )(a)(b) |
| From tax return of capital | | | (1.02 | ) | | | (1.19 | ) | | | (0.40 | ) | | | (1.07 | ) | | | (1.00 | ) |
| Total distributions | | | (1.02 | ) | | | (1.19 | ) | | | (1.13 | ) | | | (1.07 | ) | | | (1.00 | ) |
| | | | | | | | | | | | | | | | | | | | | |
| NET INCREASE/(DECREASE) IN NET ASSET VALUE | | | 0.06 | | | | (5.85 | ) | | | 0.41 | | | | 1.37 | | | | 0.35 | |
| NET ASSET VALUE, END OF PERIOD | | $ | 12.31 | | | $ | 12.25 | | | $ | 18.10 | | | $ | 17.69 | | | $ | 16.32 | |
TOTAL RETURN(c) | | | 9.76 | % | | | (26.84 | )% | | | 8.82 | % | | | 15.16 | % | | | 8.62 | % |
| | | | | | | | | | | | | | | | | | | | | |
| RATIOS/SUPPLEMENTAL DATA: | | | | | | | | | | | | | | | | | | | | |
| Net assets, end of period (000s) | | $ | 9,378,019 | | | $ | 7,203,754 | | | $ | 9,349,001 | | | $ | 7,384,685 | | | $ | 4,466,815 | |
| | | | | | | | | | | | | | | | | | | | | |
| RATIO TO AVERAGE NET ASSETS: | | | | | | | | | | | | | | | | | | | | |
| Expenses (excluding net current and deferred tax expenses/benefits and franchise tax expense) | | | 0.85 | % | | | 0.85 | % | | | 0.85 | % | | | 0.85 | % | | | 0.85 | % |
Expenses (including net current and deferred tax expenses/benefits)(d) | | | 1.42 | % | | | (11.40 | )% | | | 5.43 | % | | | 8.56 | % | | | 4.85 | % |
Expenses (including current and deferred tax expenses/benefits)(e) | | | (0.36 | )% | | | 1.57 | % | | | 0.55 | % | | | 0.55 | % | | | 0.54 | % |
| Net investment loss (excluding deferred tax expenses/benefits and franchise tax expense) | | | (0.85 | )% | | | (0.85 | )% | | | (0.85 | )% | | | (0.85 | )% | | | (0.85 | )% |
Net investment income/(loss)(including deferred tax expenses/benefits)(e) | | | 0.36 | % | | | (1.57 | )% | | | (0.55 | )% | | | (0.55 | )% | | | (0.54 | )% |
PORTFOLIO TURNOVER RATE(f) | | | 31 | % | | | 21 | % | | | 29 | % | | | 12 | % | | | 12 | % |
| (a) | Based on average shares outstanding during the period. |
| (b) | Less than ($0.005) per share. |
| (c) | Total return is calculated assuming an initial investment made at the net assets value at the beginning of the period and redemption at the net asset value on the last day of the period and assuming all distributions are reinvested at actual reinvestment prices. Total return calculated for a period of less than one year is not annualized. |
| (d) | Includes amount of current and deferred taxes/benefits for all components of the Statement of Operations. |
| (e) | Includes amount of current and deferred tax benefit associated with net investment income/(loss). |
| (f) | Portfolio turnover does not include securities received or delivered from processing creations or redemptions in-kind. |
See Notes to Financial Statements.
Alerian Energy Infrastructure ETF
| Schedule of Investments | November 30, 2016 |
| Security Description | | Shares | | | Value | |
| Canadian Energy Infrastructure Companies (23.67%) | | | | | | |
| Energy (23.67%) | | | | | | |
| AltaGas, Ltd. | | | 12,848 | | | $ | 312,185 | |
| Enbridge, Inc. | | | 22,451 | | | | 944,302 | |
| Gibson Energy, Inc. | | | 11,299 | | | | 153,508 | |
| Inter Pipeline, Ltd. | | | 26,856 | | | | 545,997 | |
| Keyera Corp. | | | 14,542 | | | | 417,976 | |
| Pembina Pipeline Corp. | | | 29,426 | | | | 864,620 | |
| TransCanada Corp. | | | 19,525 | | | | 876,902 | |
| Veresen, Inc. | | | 24,944 | | | | 229,144 | |
| Total Energy | | | | | | | 4,344,634 | |
| | | | | | | | | |
| Total Canadian Energy Infrastructure Companies | | | | | | | | |
| (Cost $5,216,510) | | | | | | | 4,344,634 | |
| | | | | | | | | |
| U.S. Energy Infrastructure Companies (25.33%) | | | | | | | | |
| Energy (12.30%) | | | | | | | | |
| Kinder Morgan, Inc. | | | 40,503 | | | | 899,168 | |
| Macquarie Infrastructure Corp. | | | 6,880 | | | | 563,747 | |
| Targa Resources Corp. | | | 14,911 | | | | 794,607 | |
| Total Energy | | | | | | | 2,257,522 | |
| | | | | | | | | |
| Utilities (13.03%) | | | | | | | | |
| CenterPoint Energy, Inc. | | | 39,386 | | | | 939,749 | |
| Dominion Resources, Inc. | | | 11,933 | | | | 874,570 | |
| OGE Energy Corp. | | | 18,248 | | | | 577,549 | |
| Total Utilities | | | | | | | 2,391,868 | |
| | | | | | | | | |
| Total U.S. Energy Infrastructure Companies | | | | | | | | |
| (Cost $5,061,438) | | | | | | | 4,649,390 | |
| | | | | | | | | |
| U.S. Energy Infrastructure MLPs (23.35%) | | | | | | | | |
| Energy (22.73%) | | | | | | | | |
| Buckeye Partners LP | | | 8,670 | | | | 557,828 | |
| Cheniere Energy Partners LP | | | 2,999 | | | | 88,081 | |
| Energy Transfer Equity LP | | | 49,441 | | | | 841,980 | |
| Enterprise Products Partners LP | | | 33,522 | | | | 869,225 | |
| EQT GP Holdings LP | | | 1,741 | | | | 43,003 | |
| Magellan Midstream Partners LP | | | 12,583 | | | | 871,373 | |
| MPLX LP | | | 16,878 | | | | 554,442 | |
| NuStar GP Holdings LLC | | | 2,251 | | | | 57,175 | |
| Phillips 66 Partners LP | | | 2,850 | | | | 128,621 | |
| Shell Midstream Partners LP | | | 5,862 | | | | 161,674 | |
| Total Energy | | | | | | | 4,173,402 | |
| | | | | | | | | |
| Utilities (0.62%) | | | | | | | | |
| Western Gas Equity Partners LP | | | 2,640 | | | | 113,361 | |
| | | | | | | | | |
| Total U.S. Energy Infrastructure MLPs | | | | | | | | |
| (Cost $5,368,377) | | | | | | | 4,286,763 | |
| | | | | | | | | |
| U.S. General Partners (27.48%) | | | | | | | | |
| Energy (27.48%) | | | | | | | | |
| Archrock, Inc. | | | 15,883 | | | | 213,626 | |
| EnLink Midstream LLC | | | 10,964 | | | | 200,641 | |
See Notes to Financial Statements.
Alerian Energy Infrastructure ETF
| Schedule of Investments | November 30, 2016 |
| Security Description | | Shares | | | Value | |
| Energy (continued) | | | | | | |
| ONEOK, Inc. | | | 18,873 | | | $ | 1,036,694 | |
| Plains GP Holdings LP, Class A | | | 25,368 | | | | 891,939 | |
| SemGroup Corp., Class A | | | 12,244 | | | | 441,396 | |
| Spectra Energy Corp. | | | 24,845 | | | | 1,017,403 | |
| Tallgrass Energy GP LP | | | 11,159 | | | | 270,048 | |
| The Williams Cos., Inc. | | | 31,675 | | | | 972,423 | |
| Total Energy | | | | | | | 5,044,170 | |
| | | | | | | | | |
| Total U.S. General Partners | | | | | | | | |
| (Cost $5,692,875) | | | | | | | 5,044,170 | |
| | | 7 Day Yield | | | Shares | | | Value | |
| Short Term Investments (0.22%) | | | | | | | | | |
| State Street Institutional Treasury Plus Money Market Fund | | | 0.259 | % | | | 41,178 | | | | 41,178 | |
| | | | | | | | | | | | | |
| Total Short Term Investments | | | | | | | | | | | | |
| (Cost $41,178) | | | | | | | | | | | 41,178 | |
| | | | | | | | | | | | | |
| Total Investments (100.05%) | | | | | | | | | | | | |
| (Cost $21,380,378) | | | | | | | | | | $ | 18,366,135 | |
| | | | | | | | | | | | | |
| Liabilities in Excess of Other Assets (‐0.05%) | | | | | | | | | | | (9,451 | ) |
| | | | | | | | | | | | | |
| Net Assets (100.00%) | | | | | | | | | | $ | 18,356,684 | |
See Notes to Financial Statements.
Alerian Energy Infrastructure ETF
| Statement of Assets and Liabilities | November 30, 2016 |
| ASSETS: | | | |
| Investments, at value | | $ | 18,366,135 | |
| Dividends receivable | | | 39,899 | |
| Total Assets | | | 18,406,034 | |
| | | | | |
| LIABILITIES: | | | | |
| Payable for investments purchased | | | 41,041 | |
| Payable to adviser | | | 8,309 | |
| Total Liabilities | | | 49,350 | |
| NET ASSETS | | $ | 18,356,684 | |
| | | | | |
| NET ASSETS CONSIST OF: | | | | |
| Paid-in capital | | $ | 21,535,250 | |
| Accumulated net investment loss | | | (360,739 | ) |
| Accumulated net realized gain on investments and foreign currency transactions | | | 196,428 | |
| Net unrealized depreciation on investments and translation of assets and liabilities denominated in foreign currencies | | | (3,014,255 | ) |
| NET ASSETS | | $ | 18,356,684 | |
| | | | | |
| INVESTMENTS, AT COST | | $ | 21,380,378 | |
| | | | | |
| PRICING OF SHARES | | | | |
| Net Assets | | $ | 18,356,684 | |
| Shares of beneficial interest outstanding (Unlimited number of shares authorized, par value $0.01 per share) | | | 800,000 | |
| Net Asset Value, offering and redemption price per share | | $ | 22.95 | |
See Notes to Financial Statements.
Alerian Energy Infrastructure ETF
| Statement of Operations | For the Year Ended November 30, 2016 |
| INVESTMENT INCOME: | | | |
| Dividends | | $ | 648,352 | |
| Foreign taxes withheld | | | (25,481 | ) |
| Total Investment Income | | | 622,871 | |
| | | | | |
| EXPENSES: | | | | |
| Investment adviser fees | | | 86,263 | |
| Total Expenses | | | 86,263 | |
| NET INVESTMENT INCOME | | | 536,608 | |
| | | | | |
| REALIZED AND UNREALIZED GAIN/(LOSS): | | | | |
| Net realized loss on investments | | | (806,962 | ) |
| Net realized loss on foreign currency transactions | | | (6,435 | ) |
| Net realized loss | | | (813,397 | ) |
| Net change in unrealized appreciation on investments | | | 2,854,921 | |
| Net change in unrealized appreciation on translation of assets and liabilities denominated in foreign currencies | | | 93 | |
| Net change in unrealized appreciation | | | 2,855,014 | |
| NET REALIZED AND UNREALIZED GAIN ON INVESTMENTS AND FOREIGN CURRENCIES | | | 2,041,617 | |
| NET INCREASE IN NET ASSETS RESULTING FROM OPERATIONS | | $ | 2,578,225 | |
See Notes to Financial Statements.
Alerian Energy Infrastructure ETF
Statements of Changes in Net Assets
| | | For the Year Ended November 30, 2016 | | | For the Year Ended November 30, 2015(a) | |
| OPERATIONS: | | | | | | |
| Net investment income | | $ | 536,608 | | | $ | 559,276 | |
Net realized loss(a) | | | (813,397 | ) | | | (428,159 | ) |
Net change in unrealized appreciation/(depreciation)(a) | | | 2,855,014 | | | | (5,827,886 | ) |
| Net increase/(decrease) in net assets resulting from operations | | | 2,578,225 | | | | (5,696,769 | ) |
| | | | | | | | | |
| DISTRIBUTIONS: | | | | | | | | |
| From net investment income | | | (405,322 | ) | | | (327,210 | ) |
| Dividends to shareholders from tax return of capital | | | (88,512 | ) | | | (103,622 | ) |
| Total distributions | | | (493,834 | ) | | | (430,832 | ) |
| | | | | | | | | |
| CAPITAL SHARE TRANSACTIONS: | | | | | | | | |
| Proceeds from sale of shares | | | 9,559,448 | | | | 4,130,424 | |
| Cost of shares redeemed | | | (5,618,048 | ) | | | (2,802,773 | ) |
| Net increase from share transactions | | | 3,941,400 | | | | 1,327,651 | |
| Net increase/(decrease) in net assets | | | 6,025,791 | | | | (4,799,950 | ) |
| | | | | | | | | |
| NET ASSETS: | | | | | | | | |
| Beginning of period | | | 12,330,893 | | | | 17,130,843 | |
| End of period * | | $ | 18,356,684 | | | $ | 12,330,893 | |
| | | | | | | | | |
| *Including accumulated net investment loss of: | | $ | (360,739 | ) | | $ | (96,943 | ) |
| | | | | | | | | |
| OTHER INFORMATION: | | | | | | | | |
| CAPITAL SHARE TRANSACTIONS: | | | | | | | | |
| Beginning shares | | | 650,000 | | | | 600,002 | |
| Shares sold | | | 500,000 | | | | 150,000 | |
| Shares redeemed | | | (350,000 | ) | | | (100,002 | ) |
| Shares outstanding, end of period | | | 800,000 | | | | 650,000 | |
(a) | Prior to November 30, 2016, the Fund presented realized gain/loss and unrealized appreciation/depreciation by investment type. This change in presentation was made to conform to industry standards and had no effect on the Fund's change in net assets. |
See Notes to Financial Statements.
Alerian Energy Infrastructure ETF
| Financial Highlights | For a Share Outstanding Throughout the Periods Presented |
| | | For the Year Ended November 30, 2016 | | | For the Year Ended November 30, 2015 | | | For the Year Ended November 30, 2014 | | | For the Period November 1, 2013 (Commencement of Operations) to November 30, 2013 | |
| NET ASSET VALUE, BEGINNING OF PERIOD | | $ | 18.97 | | | $ | 28.55 | | | $ | 24.86 | | | $ | 25.00 | |
| | | | | | | | | | | | | | | | | |
| INCOME/(LOSS) FROM INVESTMENT OPERATIONS: | | | | | | | | | | | | | | | | |
Net investment income(a) | | | 0.80 | | | | 0.83 | | | | 0.85 | | | | 0.06 | |
| Net realized and unrealized gain/(loss) on investments | | | 3.95 | | | | (9.78 | ) | | | 3.40 | | | | (0.20 | ) |
| Total from investment operations | | | 4.75 | | | | (8.95 | ) | | | 4.25 | | | | (0.14 | ) |
| | | | | | | | | | | | | | | | | |
| DISTRIBUTIONS: | | | | | | | | | | | | | | | | |
| From net investment income | | | (0.63 | ) | | | (0.48 | ) | | | (0.56 | ) | | | – | |
| Tax return of capital | | | (0.14 | ) | | | (0.15 | ) | | | – | | | | – | |
| Total distributions | | | (0.77 | ) | | | (0.63 | ) | | | (0.56 | ) | | | – | |
| | | | | | | | | | | | | | | | | |
| NET INCREASE/(DECREASE) IN NET ASSET VALUE | | | 3.98 | | | | (9.58 | ) | | | 3.69 | | | | (0.14 | ) |
| NET ASSET VALUE, END OF PERIOD | | $ | 22.95 | | | $ | 18.97 | | | $ | 28.55 | | | $ | 24.86 | |
TOTAL RETURN(b) | | | 25.63 | % | | | (31.83 | )% | | | 17.12 | % | | | (0.56 | )% |
| | | | | | | | | | | | | | | | | |
| RATIOS/SUPPLEMENTAL DATA: | | | | | | | | | | | | | | | | |
| Net assets, end of period (000s) | | $ | 18,357 | | | $ | 12,331 | | | $ | 17,131 | | | $ | 3,729 | |
| | | | | | | | | | | | | | | | | |
| Ratio of expenses to average net assets | | | 0.65 | % | | | 0.65 | % | | | 0.65 | % | | | 0.65 | %(c) |
| Ratio of net investment income to average net assets | | | 4.04 | % | | | 3.31 | % | | | 2.98 | % | | | 3.21 | %(c) |
PORTFOLIO TURNOVER RATE(d) | | | 38 | % | | | 47 | % | | | 27 | % | | | 0 | % |
(a) | Based on average shares outstanding during the period. |
(b) | Total return is calculated assuming an initial investment made at the net asset value at the beginning of the period and redemption at the net asset value on the last day of the period and assuming all distributions are reinvested at actual reinvestment prices. Total return calculated for a period of less than one year is not annualized. |
(d) | Portfolio turnover for periods less than one year is not annualized and does not include securities received or delivered from processing creations or redemptions in-kind. |
See Notes to Financial Statements.
Alerian Exchange Traded Funds
| Notes to Financial Statements | November 30, 2016 |
1. ORGANIZATION
ALPS ETF Trust (the “Trust”), a Delaware statutory trust, is an open-end management investment company registered under the Investment Company Act of 1940, as amended (the “1940 Act”). As of November 30, 2016, the Trust consisted of nineteen separate portfolios. Each portfolio represents a separate series of the Trust. This report pertains to the Alerian MLP ETF and the Alerian Energy Infrastructure ETF (each a “Fund” and collectively, the “Funds”).
The investment objective of the Alerian MLP ETF is to seek investment results that correspond (before fees and expenses) generally to the price and yield performance of its underlying index, the Alerian MLP Infrastructure Index. The investment objective of the Alerian Energy Infrastructure ETF is to seek investment results that correspond (before fees and expenses) generally to the price and yield performance of its underlying index, the Alerian Energy Infrastructure Index. The investment advisor uses a “passive” or indexing approach to try to achieve each Fund’s investment objective. Each Fund is considered non-diversified and may invest a greater portion of assets in securities of individual issuers than a diversified fund. As a result, changes in the market value of a single investment could cause greater fluctuations in share price than would occur in a diversified fund.
Each Fund’s Shares (“Shares”) are listed on the New York Stock Exchange (“NYSE”) Arca. Each Fund issues and redeems Shares at net asset value (“NAV”), in blocks of 50,000 Shares, each of which is called a “Creation Unit”. Creation Units are issued and redeemed principally in-kind for securities included in the Underlying Index. Except when aggregated in Creation Units, Shares are not redeemable securities of the Fund.
Pursuant to the Trust’s organizational documents, its Officers and Trustees are indemnified against certain liability arising out of the performance of their duties to the Trust. Additionally, in the normal course of business, the Trust enters into contracts with service providers that contain general indemnification clauses. The Trust’s maximum exposure under these arrangements is unknown, as this would involve future claims that may be made against the Trust that have not yet occurred.
2. SIGNIFICANT ACCOUNTING POLICIES
The following is a summary of significant accounting policies consistently followed by the Funds in the preparation of the financial statements. The accompanying financial statements were prepared in accordance with accounting principles generally accepted in the United States of America (“U.S. GAAP”). The preparation of financial statements in conformity with U.S. GAAP requires management to make certain estimates and assumptions that affect the reported amounts of assets and liabilities and disclosures of contingent assets and liabilities at the date of the financial statements and the reported amounts of revenue and expenses during the period. Actual results could differ from those estimates. Each Fund is considered an investment company under U.S. GAAP and follows the accounting and reporting guidance applicable to investment companies in the Financial Accounting Standards Board Accounting Standards Codification Topic 946.
A. Portfolio Valuation
Each Fund’s NAV is determined daily, as of the close of regular trading on the NYSE, normally 4:00 p.m. Eastern Time, on each day the NYSE is open for trading. The NAV is computed by dividing the value of all assets of the Fund (including accrued interest and dividends), less all liabilities (including accrued expenses and dividends declared but unpaid), by the total number of shares outstanding.
Portfolio securities listed on any exchange other than the NASDAQ Stock Market LLC (“NASDAQ”) are valued at the last sale price on the business day as of which such value is being determined. If there has been no sale on such day, the securities are valued at the mean of the most recent bid and ask prices on such day. Securities traded on the NASDAQ are valued at the NASDAQ Official Closing Price as determined by NASDAQ. Portfolio securities traded on more than one securities exchange are valued at the last sale price on the business day as of which such value is being determined at the close of the exchange representing the principal market for such securities. Portfolio securities traded in the over-the-counter market, but excluding securities traded on the NASDAQ, are valued at the latest quoted sale price in such market.
The Funds’ investments are valued at market value or, in the absence of market value with respect to any portfolio securities, at fair value according to procedures adopted by the Trust’s Board of Trustees (the “Board”). When market quotations are not readily available or when events occur that make established valuation methods unreliable, securities of the Funds may be valued in good faith by or under the direction of the Board. These securities generally include, but are not limited to, restricted securities (securities which may not be publicly sold without registration under the Securities Act of 1933) for which a pricing service is unable to provide a market price; securities whose trading has been formally suspended; a security whose market price is not available from a pre-established primary pricing source or the pricing source is not willing to provide a price; a security with respect to which an event has occurred that is most likely to materially affect the value of the security after the market has closed but before the calculation of the Funds’ NAV or make it difficult or impossible to obtain a reliable market quotation; or a security whose price, as provided by the pricing service, does not reflect the security’s “fair value” due to the security being de-listed from a national exchange or the security’s primary trading market is temporarily closed at a time when, under normal conditions, it would be open. As a general principle, the current “fair value” of a security would be the amount which the owner might reasonably expect to receive from the sale on the applicable exchange or principal market. A variety of factors may be considered in determining the fair value of such securities.
Alerian Exchange Traded Funds
| Notes to Financial Statements | November 30, 2016 |
B. Fair Value Measurements
Each Fund discloses the classification of its fair value measurements following a three-tier hierarchy based on the inputs used to measure fair value. Inputs refer broadly to the assumptions that market participants would use in pricing the asset or liability, including assumptions about risk. Inputs may be observable or unobservable. Observable inputs reflect the assumptions market participants would use in pricing the asset or liability that are developed based on market data obtained from sources independent of the reporting entity. Unobservable inputs reflect the reporting entity’s own assumptions about the assumptions market participants would use in pricing the asset or liability that are developed based on the best information available.
Valuation techniques used to value the Funds’ investments by major category are as follows:
Equity securities, including restricted securities, and Limited Partnerships for which market quotations are readily available, are valued at the last reported sale price or official closing price as reported by a third party pricing vendor on the primary market or exchange on which they are traded and are categorized as Level 1 in the hierarchy. In the event there were no sales during the day or closing prices are not available, securities are valued at the mean of the most recent quoted bid and ask prices on such day and are generally categorized as Level 2 in the hierarchy. Investments in open-end mutual funds are valued at their closing NAV each business day and are categorized as Level 1 in the hierarchy.
Changes in valuation techniques may result in transfers in or out of an assigned level within the disclosure hierarchy.
Various inputs are used in determining the value of the Funds’ investments as of the end of the reporting period. When inputs used fall into different levels of the fair value hierarchy, the level in the hierarchy within which the fair value measurement falls is determined based on the lowest level input that is significant to the fair value measurement in its entirety. The designated input levels are not necessarily an indication of the risk or liquidity associated with these investments.
These inputs are categorized in the following hierarchy under applicable financial accounting standards:
| Level 1 – | Unadjusted quoted prices in active markets for identical investments, unrestricted assets or liabilities that a Fund has the ability to access at the measurement date; |
| Level 2 – | Quoted prices which are not active, quoted prices for similar assets or liabilities in active markets or inputs other than quoted prices that are observable (either directly or indirectly) for substantially the full term of the asset or liability; and |
| Level 3 – | Significant unobservable prices or inputs (including the Fund’s own assumptions in determining the fair value of investments) where there is little or no market activity for the asset or liability at the measurement date. |
The following is a summary of the inputs used to value each Fund’s investments at November 30, 2016:
Alerian MLP ETF
| Investments in Securities at Value* | | Level 1- Unadjusted Quoted Prices | | | Level 2- Other Significant Observable Inputs | | | Level 3- Significant Unobservable Inputs | | | Total | |
| Master Limited Partnerships | | $ | 9,417,706,256 | | | $ | – | | | $ | – | | | $ | 9,417,706,256 | |
| Short-Term Investments | | | 21,858,851 | | | | – | | | | – | | | | 21,858,851 | |
| TOTAL | | $ | 9,439,565,107 | | | $ | – | | | $ | – | | | $ | 9,439,565,107 | |
Alerian Exchange Traded Funds
| Notes to Financial Statements | November 30, 2016 |
Alerian Energy Infrastructure ETF
| Investments in Securities at Value* | | Level 1- Unadjusted Quoted Prices | | | Level 2- Other Significant Observable Inputs | | | Level 3- Significant Unobservable Inputs | | | Total | |
| Canadian Energy Infrastructure Companies | | $ | 4,344,634 | | | $ | – | | | $ | – | | | $ | 4,344,634 | |
| U.S. Energy Infrastructure Companies | | | 4,649,390 | | | | – | | | | – | | | | 4,649,390 | |
| U.S. Energy Infrastructure MLPs | | | 4,286,763 | | | | – | | | | – | | | | 4,286,763 | |
| U.S. General Partners | | | 5,044,170 | | | | – | | | | – | | | | 5,044,170 | |
| Short-Term Investments | | | 41,178 | | | | – | | | | – | | | | 41,178 | |
| TOTAL | | $ | 18,366,135 | | | $ | – | | | $ | – | | | $ | 18,366,135 | |
| * | For a detailed breakdown of sectors, see the accompanying Schedule of Investments. |
Each Fund recognizes transfers between levels as of the end of the period. For the year ended November 30, 2016, the Funds did not have any transfers between Level 1 and Level 2 securities. The Funds did not have any securities that used significant unobservable inputs (Level 3) in determining fair value.
C. Foreign Currency Translation
The books and records of the Funds are maintained in U.S. dollars. Investment valuations and other assets and liabilities initially expressed in foreign currencies are converted each business day into U.S. dollars based upon current exchange rates. The portion of realized and unrealized gains or losses on investments due to fluctuations in foreign currency exchange rates is not separately disclosed and is included in realized and unrealized gains or losses on investments, when applicable.
D. Securities Transactions and Investment Income
Securities transactions are recorded as of the trade date. Realized gains and losses from securities transactions are recorded on the last in, first out (“LIFO”) cost basis. Dividend income and capital gains distributions, if any, are recorded on the ex-dividend date, net of any foreign taxes withheld. Interest income, if any, is recorded on the accrual basis, including amortization of premiums and accretion of discounts.
E. Dividends and Distributions to Shareholders
Each Fund intends to declare and make quarterly distributions, or as the Board may determine from time to time. Distributions of net realized capital gains earned by the Alerian Energy Infrastructure ETF, if any, are distributed at least annually. Distributions from net investment income and capital gains are determined in accordance with income tax regulations, which may differ from U.S. GAAP. These differences are primarily due to differing treatments of income and gains on various investment securities held by the Funds, timing differences and differing characterization of distributions made by the Funds.
Distributions received from each Fund’s investments in Master Limited Partnerships (“MLPs”) may be comprised of both income and return of capital. Each Fund records investment income and return of capital based on estimates made at the time such distributions are received. Such estimates are based on historical information available from each MLP and other industry sources. These estimates may subsequently be revised based on information received from MLPs after their tax reporting periods are concluded. For the year ended November 30, 2016, the Alerian MLP ETF distributed $689,407,280 of which 100% is anticipated to be characterized as return of capital from MLP distributions received.
The Alerian MLP ETF also expects a portion of the distributions it receives from MLPs to be treated as a tax deferred return of capital, thus reducing the Alerian MLP ETF’s current tax liability. Return of capital distributions are not taxable income to the shareholder, but reduce the investor’s tax basis in the investor’s Fund Shares. Such a reduction in tax basis will result in larger taxable gains and/or lower tax losses on a subsequent sale of Fund Shares. Shareholders who periodically receive the payment of dividends or other distributions consisting of a return of capital may be under the impression that they are receiving net profits from the Funds when, in fact, they are not. Shareholders should not assume that the source of the distributions is from the net profits of the Funds.
Alerian Exchange Traded Funds
| Notes to Financial Statements | November 30, 2016 |
F. Federal Income Taxation and Tax Basis Information
Alerian MLP ETF
The Alerian MLP ETF is taxed as a regular C-corporation for federal income tax purposes. Currently, the maximum marginal regular federal income tax rate for a corporation is 35 percent. The Fund may be subject to a 20 percent federal alternative minimum tax on its federal alternative taxable income to the extent that its alternative minimum tax exceeds its regular federal income tax. This differs from most investment companies, which elect to be treated as “regulated investment companies” under the Code in order to avoid paying entity level income taxes. Under current law, the Fund is not eligible to elect treatment as a regulated investment company due to its investments primarily in MLPs invested in energy assets. As a result, the Fund will be obligated to pay applicable federal and state corporate income taxes on its taxable income as opposed to most other investment companies, which are not so obligated. The Fund expects that a portion of the distributions it receives from MLPs may be treated as a tax-deferred return of capital, thus reducing the Fund’s current tax liability. However, the amount of taxes currently paid by the Fund will vary depending on the amount of income and gains derived from investments and/or sales of MLP interests and such taxes will reduce an investor’s return from an investment in the Fund.
Cash distributions from MLPs to the Fund that exceed such Fund’s allocable share of such MLP’s net taxable income are considered a tax-deferred return of capital that will reduce the Fund’s adjusted tax basis in the equity securities of the MLP. These reductions in such Fund’s adjusted tax basis in the MLP equity securities will increase the amount of gain (or decrease the amount of loss) recognized by the Fund on a subsequent sale of the securities. The Fund will accrue deferred income taxes for any future tax liability associated with (i) that portion of MLP distributions considered to be a tax-deferred return of capital as well as (ii) capital appreciation of its investments. Upon the sale of an MLP security, the Fund may be liable for previously deferred taxes. The Fund’s accrued deferred tax liability will be reflected each day in the Fund’s NAV. Increases in deferred tax liability will decrease NAV. Conversely, decreases in deferred liability will increase NAV, but only to the extent of previously accrued deferred tax liability, i.e., no deferred tax asset will be accrued. The Fund will rely to a large extent on information provided by the MLPs, which is not necessarily timely, to estimate deferred tax liability for purposes of financial statement reporting and determining the NAV. From time to time, ALPS Advisors, Inc. will modify the estimates or assumptions related to the Fund’s deferred tax liability as new information becomes available. The Fund’s estimates regarding its deferred tax liability are made in good faith, however, the daily estimate of the Fund’s deferred tax liability used to calculate the Fund’s NAV could vary significantly from the Fund’s actual tax liability. The Fund will generally compute deferred income taxes based on the federal income tax rate applicable to corporations, currently 35%, and an assumed rate attributable to state taxes.
The Fund recognizes interest and penalties related to unrecognized tax benefits within the income tax expense line in the accompanying statement of operations. Accrued interest and penalties are included within the related tax liability line in the balance sheet.
Since the Fund will be subject to taxation on its taxable income, the NAV of Fund shares will also be reduced by the accrual of any deferred tax liabilities. The Underlying Index however is calculated without any deductions for taxes. As a result, the Fund’s after tax performance could differ significantly from the Underlying Index even if the pretax performance of the Fund and the performance of the Underlying Index are closely correlated.
The Fund’s income tax expense/(benefit) consists of the following:
| Alerian MLP ETF | | Year ended November 30, 2016 | |
| | | Current | | | Deferred | | | Total | |
| Federal | | $ | – | | | $ | 306,415,602 | | | $ | 306,415,602 | |
| State | | | – | | | | 21,981,108 | | | | 21,981,108 | |
| Valuation Allowance | | | – | | | | (284,042,840 | ) | | | (284,042,840 | ) |
| Total tax expense/(benefit) | | $ | – | | | $ | 44,353,870 | | | $ | 44,353,870 | |
Deferred income taxes reflect the net tax effect of temporary differences between the carrying amount of assets and liabilities for financial reporting and tax purposes.
Alerian Exchange Traded Funds
| Notes to Financial Statements | November 30, 2016 |
Components of the Fund’s deferred tax assets and liabilities are as follows:
| Alerian MLP ETF | | As of November 30, 2016 | |
| Deferred tax assets: | | | |
| Accrued franchise taxes | | $ | 179,444 | |
| Charitable contribution carryforward | | | 482,774 | |
| Income recognized from MLP investments | | | 295,747,361 | |
| Credit for prior year minimum tax | | | 331,761 | |
| Net operating loss carryforward | | | 378,402,076 | |
| Capital loss carryforward | | | 490,108,571 | |
| Less Deferred tax liabilities: | | | | |
| Net unrealized gain on investment securities | | | (1,210,008,033 | ) |
| Other | | | (233,357 | ) |
| Net Deferred tax liability | | $ | (44,989,405 | ) |
Due to the activities of the MLPs that the fund is invested in, the Fund is required to pay franchise tax in certain states. Generally speaking, franchise tax expense is a tax on equity of a corporation, or base minimum fees, imposed by various jurisdictions. The amounts of the tax are estimated throughout the year based upon the Fund’s estimate of underlying activities conducted in the states and reconciled to actual amounts paid upon the filing of the tax returns for the states. These taxes are paid as either estimated tax payments, extension payments, or with the tax return filings of the various states.
The net operating loss carryforward is available to offset future taxable income. The net operating loss can be carried forward for 20 years and, accordingly, would begin to expire as of November 30, 2032. The Fund has net operating loss carryforwards for federal income tax purposes as follows:
| Alerian MLP ETF | Period-Ended | | Amount | | Expiration |
| Federal | 11/30/2012 | | $ | 92,112,756 | | 11/30/2032 |
| Federal | 11/30/2013 | | | 349,770,934 | | 11/30/2033 |
| Federal | 11/30/2014 | | | 64,228,395 | | 11/30/2034 |
| Federal | 11/30/2015 | | | 270,791,678 | | 11/30/2035 |
| Federal | 11/30/2016 | | | 220,479,783 | | 11/30/2036 |
| Total | | | $ | 997,383,546 | | |
The Fund also has state tax net operating loss carryforwards of various amounts per state. The Deferred Tax Assets associated with these state tax net operating losses are as follows:
| Alerian MLP ETF | Period-Ended | | Amount | | Expiration |
| State | 11/30/2012 | | $ | 2,950,477 | | Varies by State (5-20 years) |
| State | 11/30/2013 | | | 10,853,441 | | Varies by State (5-20 years) |
| State | 11/30/2014 | | | 1,931,661 | | Varies by State (5-20 years) |
| State | 11/30/2015 | | | 9,260,851 | | Varies by State (5-20 years) |
| State | 11/30/2016 | | | 4,321,405 | | Varies by State (5-20 years) |
| Total | | | $ | 29,317,835 | | |
Alerian Exchange Traded Funds
| Notes to Financial Statements | November 30, 2016 |
The capital loss carryforward is available to offset future taxable income. The capital loss can be carried forward for 5 years and, accordingly, would begin to expire as of November 30, 2020. The Fund has net capital loss carryforwards for federal income tax purposes as follows:
| Alerian MLP ETF | Year-Ended | | Amount | | Expiration |
| Federal | 11/30/2015 | | $ | 504,879,549 | | 11/30/2020 |
| Federal | 11/30/2016 | | | 847,945,696 | | 11/30/2021 |
| Total | | | $ | 1,352,825,245 | | |
The Fund reviews the recoverability of its deferred tax assets based upon the weight of available evidence. Although the Fund currently has a net deferred tax liability, it reviews the recoverability of its deferred tax assets based upon the weight of available evidence. When assessing the recoverability of its deferred tax assets, significant weight was given to the effects of potential future realized and unrealized gains on investments and the period over which these deferred tax assets can be realized. Currently, any capital losses that may be generated by the Fund in the future are eligible to be carried back up to three years and can be carried forward for five years to offset capital gains recognized by the fund in those years. For Federal Tax purposes, net operating losses that may be generated by the Fund in the future are eligible to be carried back up to two years and can be carried forward for 20 years to offset income generated by the Fund in those years.
Based upon the Fund’s assessment, it has determined that it is more likely than not that its deferred tax assets will be realized through future taxable income of the appropriate character. Accordingly, no valuation allowance has been established for the Fund’s deferred tax assets. The Fund will continue to assess the need for a valuation allowance in the future. Significant declines in the fair value of its portfolio of investments may change the Fund’s assessment of the recoverability of these assets and may result in the recording of a valuation allowance against all or a portion of the Fund’s gross deferred tax assets.
Total income tax expense/(benefit) (current and deferred) differs from the amount computed by applying the federal statutory income tax rate of 35% to net investment and realized and unrealized gain/(losses) on investment before taxes as follows:
| Alerian MLP ETF | | As of November 30, 2016 | |
| Income tax expense at statutory rate | | $ | 307,741,552 | |
| State income tax benefit (net of federal benefit) | | | 17,233,527 | |
| Permanent differences, net | | | (1,668,403 | ) |
| Change in estimated state deferral rate | | | (77,843 | ) |
| Other | | | 5,167,877 | |
| Valuation allowance | | | (284,042,840 | ) |
| Net income tax expense | | $ | 44,353,870 | |
The following is a tabular reconciliation of the total amounts of unrecognized tax benefits:
| Alerian MLP ETF | | Inception to November 30, 2016 | |
| Unrecognized tax benefit - Beginning | | $ | – | |
| Gross increases - tax positions in prior period | | | – | |
| Gross decreases - tax positions in prior period | | | – | |
| Gross increases - tax positions in current period | | | – | |
| Settlement | | | – | |
| Lapse of statute of limitations | | | – | |
| Unrecognized tax benefit - Ending | | $ | – | |
The Fund recognizes interest accrued related to unrecognized tax benefits and penalties as income tax expense. For the period from inception to November 30, 2016, the Fund had no accrued penalties or interest.
The Fund recognizes the tax benefits of uncertain tax positions only where the position is “more likely than not" to be sustained assuming examination by tax authorities. Management has analyzed the Fund's tax positions and has concluded that no liability for unrecognized tax benefits should be recorded related to uncertain tax positions taken on U.S. tax returns and state tax returns filed since inception of the fund. Tax periods ended November 30, 2013 through November 30, 2016 remain subject to examination by tax authorities in the United States. Due to the nature of the Fund's investments, the Fund may be required to file income tax returns in several states. The Fund is not aware of any tax positions for which it is reasonably possible that the total amounts of unrecognized tax benefits will change materially in the next 12 months.
Alerian Exchange Traded Funds
| Notes to Financial Statements | November 30, 2016 |
Alerian Energy Infrastructure ETF
The timing and character of income and capital gain distributions are determined in accordance with income tax regulations, which may differ from U.S. GAAP. Reclassifications are made to the Fund’s capital accounts for permanent tax differences to reflect income and gains available for distribution (or available capital loss carryforwards) under income tax regulations.
No provision for income taxes is included in the accompanying financial statements, as the Alerian Energy Infrastructure ETF intends to distribute to shareholders all taxable investment income and realized gains and otherwise comply with Subchapter M of the Internal Revenue Code of 1986, as amended, applicable to regulated investment companies. The Alerian Energy Infrastructure ETF evaluates tax positions taken (or expected to be taken) in the course of preparing the Fund’s tax returns to determine whether these positions meet a “more‐likely‐than‐not” standard that, based on the technical merits, have a more than fifty percent likelihood of being sustained by a taxing authority upon examination. A tax position that meets the “more‐likely‐than‐not” recognition threshold is measured to determine the amount of benefit to recognize in the financial statements.
As of and during the year ended November 30, 2016, the Alerian Energy Infrastructure ETF did not have a liability for any unrecognized tax benefits. The Alerian Energy Infrastructure ETF files U.S. federal, state, and local tax returns as required. The Fund’s tax returns are subject to examination by the relevant tax authorities until expiration of the applicable statute of limitations, which is generally three years after the filing of the tax return, but may extend to four years in certain jurisdictions. Tax returns for open years have incorporated no uncertain tax positions that require a provision for income taxes.
For the year ended November 30, 2016, permanent book and tax differences resulting primarily from differing treatment of investments in partnerships were identified and reclassified among components of the Fund’s net assets as follows:
| Fund | | Accumulated Net Investment Income/(Loss) | | | Accumulated Net Realized Gain/ (Loss) on Investments | | | Paid-in Capital | |
| Alerian Energy Infrastructure ETF | | $ | (395,082 | ) | | $ | 1,253,432 | | | $ | (858,350 | ) |
At November 30, 2016, the Fund had available for tax purposes unused capital loss carryforwards as follows:
| | | Short-Term | | | Long-Term | |
| Alerian Energy Infrastructure ETF | | $ | 527,381 | | | $ | 131,927 | |
Capital loss carryovers used during the year ended November 30, 2016 were $123,732.
The tax character of the distributions paid during the fiscal years ended November 30, 2016 and November 30, 2015 were as follows:
| | | Ordinary Income | | | Long-Term Capital Gain | | | Return of Capital | |
| November 30, 2016 | | | | | | |
| Alerian Energy Infrastructure ETF | | $ | 405,322 | | | $ | – | | | $ | 88,512 | |
| November 30, 2015 | | | | | | | | | | | | |
| Alerian Energy Infrastructure ETF | | $ | 327,210 | | | $ | – | | | $ | 103,622 | |
As of November 30, 2016, the components of distributable earnings on a tax basis were as follows:
| | | Alerian Energy Infrastructure ETF | |
| Accumulated net realized loss on investments | | $ | (659,308 | ) |
| Net unrealized depreciation on investments | | | (2,024,180 | ) |
| Other accumulated losses | | | (495,078 | ) |
| Total | | $ | (3,178,566 | ) |
Other accumulated losses are mostly due to partnership losses being suspended for tax purposes.
Alerian Exchange Traded Funds
| Notes to Financial Statements | November 30, 2016 |
As of November 30, 2016, the costs of investments for federal income tax purposes and accumulated net unrealized appreciation/(depreciation) on investments were as follows:
| | | Alerian MLP ETF | | | Alerian Energy Infrastructure ETF | |
| Cost of investments for income tax purposes | | $ | 6,877,633,261 | | | $ | 20,390,303 | |
| Gross appreciation (excess of value over tax cost) | | $ | 3,111,581,289 | | | $ | 909,277 | |
| Gross depreciation (excess of tax cost over value) | | | (549,649,443 | ) | | | (2,933,445 | ) |
Net depreciation of foreign currency | | | – | | | | (12 | ) |
| Net unrealized appreciation/(depreciation) | | $ | 2,561,931,846 | | | $ | (2,024,180 | ) |
The difference between cost amounts for financial statement purposes is due primarily to the recognition of pass‐through income from a Fund’s investments in master limited partnerships and wash sales.
3. INVESTMENT ADVISORY FEE AND OTHER AFFILIATED TRANSACTIONS
ALPS Advisors, Inc. (the “Adviser”) acts as each Fund's investment adviser pursuant to advisory agreements with the Trust on behalf of each Fund (the “Advisory Agreements”). Pursuant to the Advisory Agreements, each Fund pays the Adviser a unitary fee for the services and facilities it provides payable on a monthly basis as a percentage of the relevant Fund's average daily net assets as set out below.
| Fund | | Advisory Fee |
| Alerian MLP ETF | 0.85% | up to and including $10 billion |
| | 0.80% | greater than $10 billion up to and including $15 billion |
| | 0.755% | greater than $15 billion up to and including $20 billion |
| | 0.715% | greater than $20 billion |
| Alerian Energy Infrastructure ETF | 0.65% | |
Out of the unitary management fees, the Adviser pays substantially all expenses of the Funds, including the cost of transfer agency, custody, fund administration, legal, audit, independent trustees and other services, except for taxes, interest expenses, distribution fees or expenses, brokerage expenses, and extraordinary expenses such as litigation, and other expenses not incurred in the ordinary course of the each Fund's business. The Adviser’s unitary management fee is designed to pay substantially all the Funds’ expenses and to compensate the Adviser for providing services for each Fund.
ALPS Fund Services, Inc., an affiliate of the Adviser, is the administrator of the Funds.
Each Trustee who is not an officer or employee of the Adviser, any sub‐adviser or any of their affiliates (“Independent Trustees”) receives (1) a quarterly retainer of $5,000, (2) a per meeting fee for regularly scheduled meetings of $3,750, (3) $1,500 for any special meeting held outside of a regularly scheduled board meeting, and (4) reimbursement for all reasonable out‐of‐pocket expenses relating to attendance at meetings.
4. PURCHASES AND SALES OF SECURITIES
For the year ended November 30, 2016, the cost of purchases and proceeds from sales of investment securities, excluding short‐term investments and in‐kind transactions, were as follows:
| Fund | | Purchases | | | Sales | |
| Alerian MLP ETF | | $ | 2,527,552,140 | | | $ | 2,655,041,659 | |
| Alerian Energy Infrastructure ETF | | | 5,346,138 | | | | 5,195,670 | |
For the year ended November 30, 2016, the cost of in‐kind purchases and proceeds from in‐kind sales were as follows:
| Fund | | Purchases | | | Sales | |
| Alerian MLP ETF | | $ | 3,157,845,062 | | | $ | 1,124,591,728 | |
| Alerian Energy Infrastructure ETF | | | 9,558,649 | | | | 5,611,862 | |
Alerian Exchange Traded Funds
| Notes to Financial Statements | November 30, 2016 |
For the year ended November 30, 2016, the Alerian MLP ETF and the Alerian Energy Infrastructure ETF had in‐kind net realized gain/(loss) of $(23,006,263) and $(455,824) respectively.
Gains on in‐kind transactions are not considered taxable for federal income tax purposes and losses on in kind transactions are also not deductible for tax purposes.
5. MASTER LIMITED PARTNERSHIPS
MLPs are publicly traded partnerships engaged in, among other things, the transportation, storage and processing of minerals and natural resources, and are treated as partnerships for U.S. federal income tax purposes. By confining their operations to these specific activities, their interests, or units, are able to trade on public securities exchanges exactly like the shares of a corporation, without entity level taxation. To qualify as a MLP and to not be taxed as a corporation, a partnership must receive at least 90% of its income from qualifying sources as set forth in Section 7704(d) of the Internal Revenue Code of 1986, as amended (the “Code”). These qualifying sources include, among other things, natural resource‐based activities such as the processing, transportation and storage of mineral or natural resources. MLPs generally have two classes of owners, the general partner and limited partners. The general partner of an MLP is typically owned by a major energy company, an investment fund, the direct management of the MLP, or is an entity owned by one or more of such parties. The general partner may be structured as a private or publicly traded corporation or other entity. The general partner typically controls the operations and management of the MLP through an up to 2% equity interest in the MLP plus, in many cases, ownership of common units and subordinated units. Limited partners typically own the remainder of the partnership, through ownership of common units, and have a limited role in the partnership’s operations and management.
MLPs are typically structured such that common units and general partner interests have first priority to receive quarterly cash distributions up to an established minimum amount (“minimum quarterly distributions” or “MQD”). Common and general partner interests also accrue arrearages in distributions to the extent the MQD is not paid. Once common and general partner interests have been paid, subordinated units receive distributions of up to the MQD; however, subordinated units do not accrue arrearages. Distributable cash in excess of the MQD is distributed to both common and subordinated units and generally on a pro rata basis. The general partner is also eligible to receive incentive distributions if the general partner operates the business in a manner which results in distributions paid per common unit surpassing specified target levels. As the general partner increases cash distributions to the limited partners, the general partner receives an increasingly higher percentage of the incremental cash distributions.
6. CAPITAL SHARE TRANSACTIONS
Shares are created and redeemed by each Fund only in Creation Unit size aggregations of 50,000 Shares. Only broker‐dealers or large institutional investors with creation and redemption agreements called Authorized Participants (“AP”) are permitted to purchase or redeem Creation Units from the Funds. Such transactions are generally permitted on an in‐kind basis, with a balancing cash component to equate the transaction to the NAV per unit of each Fund on the transaction date. Cash may be substituted equivalent to the value of certain securities generally when they are not available in sufficient quantity for delivery, not eligible for trading by the AP or as a result of other market circumstances.
7. RELATED PARTY TRANSACTIONS
The Funds engaged in cross trades between each other during the year ended November 30, 2016 pursuant to Rule 17a‐7 under the 1940 Act. Cross trading is the buying or selling of portfolio securities between funds to which the Adviser serves as the investment adviser. The Board previously adopted procedures that apply to transactions between the Funds of the Trust pursuant to Rule 17a‐7. These transactions related to cross trades during the period complied with the requirements set forth by Rule 17a‐7 and the Trust’s procedures.
Transactions related to cross trades during the year ended November 30, 2016, were as follows:
| Fund | | Purchase cost paid | | | Sale proceeds received | | | Realized gain/ (loss) on sales | |
| Alerian MLP ETF | | $ | 74,076 | | | $ | 642,764 | | | $ | (20,272 | ) |
| Alerian Energy Infrastructure ETF | | | 133,310 | | | | 74,076 | | | | 1,786 | |
Alerian Exchange Traded Funds
| Notes to Financial Statements | November 30, 2016 |
8. AFFILIATED COMPANIES
As defined by the Investment Company Act of 1940, an affiliated person, including an affiliated company, is one in which a Fund owns 5% or more of the outstanding voting securities, or a company which is under common ownership or control with the Fund.
For the Fiscal Year Ended November 30, 2016, the Alerian MLP ETF held shares in the following affiliates, as defined by the Investment Company Act of 1940.
| Security Name | | Share Balance December 1, 2015 | | | Purchases | | | Sales | | | Share Balance November 30, 2016 | | | Dividend Income* | | | Realized Gain/(Loss) | | | Market Value November 30, 2016 | |
| Master Limited Partnerships | | | | | | | | | | | | | | | | | | | | | |
| Buckeye Partners LP | | | 5,736,893 | | | | 6,198,400 | | | | (3,009,670 | ) | | | 8,925,623 | | | – | | | 9,563,215 | | | | 574,274,584 | |
| DCP Midstream Partners LP | | | 6,804,719 | | | | 2,581,518 | | | | (3,214,826 | ) | | | 6,171,411 | | | | – | | | | (7,607,113 | ) | | | 213,715,963 | |
| Enbridge Energy Partners LP | | | 15,050,652 | | | | 5,992,915 | | | | (6,337,571 | ) | | | 14,705,996 | | | | – | | | | (4,768,675 | ) | | | 363,238,101 | |
| Genesis Energy LP | | | 6,991,534 | | | | 3,116,114 | | | | (3,093,222 | ) | | | 7,014,426 | | | | – | | | | (15,095,507 | ) | | | 245,084,044 | |
| Magellan Midstream Partners LP | | | 9,171,989 | | | | 7,344,474 | | | | (2,886,703 | ) | | | 13,629,760 | | | | – | | | | (6,409,025 | ) | | | 943,860,880 | |
| NGL Energy Partners LP | | | 6,872,613 | | | | 8,200,712 | | | | (8,499,535 | ) | | | 6,573,790 | | | | – | | | | (158,702,286 | ) | | | 121,943,804 | |
| NuStar Energy LP | | | 4,774,949 | | | | 1,821,163 | | | | (2,203,415 | ) | | | 4,392,697 | | | | – | | | | (10,013,789 | ) | | | 209,707,355 | |
| ONEOK Partners LP | | | 12,535,879 | | | | 4,498,884 | | | | (6,249,703 | ) | | | 10,785,060 | | | | – | | | | (9,374,298 | ) | | | 450,815,508 | |
| Plains All American Pipeline LP | | | 18,137,202 | | | | 16,540,564 | | | | (8,701,441 | ) | | | 25,976,325 | | | | – | | | | 23,118,771 | | | | 855,919,909 | |
Shell Midstream Partners LP | | | 3,952,847 | | | | 3,776,270 | | | | (1,709,148 | ) | | | 6,019,969 | | | | – | | | | (1,996,730 | ) | | | 166,030,745 | |
| Total | | | | | | | | | | | | | | | | | | $ | – | | | $ | (181,285,437 | ) | | $ | 4,144,590,893 | |
| * | 100% of the Income received was estimated as Return of Capital. |
Alerian Exchange Traded Funds
| Additional Information | November 30, 2016 (Unaudited) |
PROXY VOTING RECORDS, POLICIES AND PROCEDURES
Information regarding how each Fund voted proxies relating to portfolio securities during the most recent 12‐month period ended June 30 and a description of the Funds’ proxy voting policies and procedures used in determining how to vote for proxies are available without charge on the Securities and Exchange Commission’s (“SEC”) website at www.sec.gov and upon request, by calling (toll‐free) 1‐866‐675‐2639.
PORTFOLIO HOLDINGS
The Trust is required to disclose, after its first and third fiscal quarters, the complete schedule of each Fund’s portfolio holdings with the SEC on Form N‐Q. Form N‐Q for each Fund will be available on the SEC’s website at www.sec.gov. Each Fund’s Form N‐Q may also be reviewed and copied at the SEC’s Public Reference Room in Washington, D.C. and information on the operation of the Public Reference Room may be obtained by calling 1‐800‐SEC‐0330. Each Fund’s Form N‐Q will be available without charge, upon request, by calling (toll‐free) 1‐866‐675‐2639 or by writing to ALPS ETF Trust at 1290 Broadway, Suite 1100, Denver, Colorado 80203.
TAX INFORMATION
The Fund designates the following for federal income tax purposes for distributions made during the calendar year ended December 31, 2015:
| | Qualified Dividend Income | Dividend Received Deduction |
| Alerian Energy Infrastructure ETF | 100.00% | 98.70% |
In early 2016, if applicable, shareholders of record received this information for the distributions paid to them by the Fund during the calendar year 2015 via Form 1099. The Fund will notify shareholders in early 2017 of amounts paid to them by the Fund, if any, during the calendar year 2016.
LICENSING AGREEMENTS
Alerian (the “Licensor”) has entered into an index licensing agreement with ALPS Advisors Inc. (the “Advisor”) with respect to each of the Alerian MLP ETF and the Alerian Energy Infrastructure ETF, to allow the Adviser’s use of AMZI and AMEI. The following disclosure relates to the Licensor:
Alerian is the designer of the construction and methodology for the underlying index (each an “Underlying Index”) for each of the Alerian MLP ETF and the Alerian Energy Infrastructure ETF (each a “Fund” and collectively, the “Funds”). “Alerian,” “Alerian MLP Infrastructure Index,” “Alerian Energy Infrastructure Index,” “Alerian Index Series” and “AMZI” are service marks or trademarks of Alerian. Alerian acts as brand licensor for each Underlying Index. Alerian is not responsible for the descriptions of either Underlying Index or the Funds that appear herein. Alerian is not affiliated with the Trust, the Adviser or the Distributor.
Neither Fund is issued, sponsored, endorsed, sold or promoted by Alerian (“Licensor”) or its affiliates. Licensor makes no representation or warranty, express or implied, to the owners of the Fund or any member of the public regarding the advisability of investing in securities generally or in the Fund particularly or the ability of the Alerian MLP Infrastructure Index (“Index”) to track general market performance. Licensor’s only relationship to the Licensee is the licensing of the Index which is determined, composed and calculated by Licensor without regard to the Licensee or the Fund. Licensor has no obligation to take the needs of the Licensee or the owners of the Fund into consideration in determining, composing or calculating the Index. Licensor is not responsible for and has not participated in the determination of the timing of, prices at, or quantities of the Fund to be issued or in the determination or calculation of the equation by which the Fund is to be converted into cash. Licensor has no obligation or liability in connection with the issuance, administration, marketing or trading of either Fund and is not responsible for and has not participated in the determination of pricing or the timing of the issuance or sale of the Shares of either Fund or in the determination or calculation of the NAV of the relevant Fund. Alerian MLP Infrastructure Index, Alerian MLP Infrastructure Total Return Index, AMZI and AMZIX are trademarks of GKD Index Partners, LLC and their general use is granted under a license from GKD Index Partners, LLC.
LICENSOR DOES NOT GUARANTEE THE QUALITY, ACCURACY AND/OR THE COMPLETENESS OF THE INDEX OR ANY DATA INCLUDED THEREIN AND SHALL HAVE NO LIABILITY FOR ERRORS OR OMISSIONS OF ANY KIND RELATED TO THE INDEX OR DATA. LICENSOR MAKES NO WARRANTY, EXPRESS OR IMPLIED, AS TO RESULTS TO BE OBTAINED BY LICENSEE, OWNERS OF THE FUND, OR ANY OTHER PERSON OR ENTITY FROM THE USE OF THE INDEX OR ANY DATA INCLUDED THEREIN IN CONNECTION WITH THE RIGHTS LICENSED TO LICENSEE OR FOR ANY OTHER USE. LICENSOR MAKES NO EXPRESS OR IMPLIED WARRANTIES, AND HEREBY EXPRESSLY DISCLAIMS ALL WARRANTIES OF MERCHANTABILITY OR FITNESS FOR A PARTICULAR PURPOSE OR USE WITH RESPECT TO THE INDEX OR ANY DATA INCLUDED THEREIN. WITHOUT LIMITING ANY OF THE FOREGOING, IN NO EVENT SHALL LICENSOR HAVE ANY LIABILITY FOR ANY SPECIAL, PUNITIVE, INDIRECT, OR CONSEQUENTIAL DAMAGES (INCLUDING LOST PROFITS), EVEN IF NOTIFIED OF THE POSSIBILITY OF SUCH DAMAGES.
Alerian Exchange Traded Funds
| Additional Information | November 30, 2016 (Unaudited) |
The Adviser does not guarantee the accuracy and/or the completeness of either Underlying Index or any data included therein, and the Adviser shall have no liability for any errors, omissions or interruptions therein. The Adviser makes no warranty, express or implied, as to results to be obtained by either Fund, owners of the Shares of the relevant Fund or any other person or entity from the use of either Underlying Index or any data included therein. The Adviser makes no express or implied warranties, and expressly disclaims all warranties of merchantability or fitness for a particular purpose or use with respect to either Underlying Index or any data included therein. Without limiting any of the foregoing, in no event shall the Adviser have any liability for any special, punitive, direct, indirect, or consequential damages (including lost profits) arising out of matters relating to the use of either Underlying Index, even if notified of the possibility of such damages.
(Applicable to the Alerian Energy Infrastructure ETF only)
The Underlying Index is the exclusive property of GKD Index Partners LLC d/b/a Alerian, which has contracted with S&P Opco, LLC (a subsidiary of S&P Dow Jones Indices LLC) (“S&P Dow Jones Indices”) to calculate and maintain the Underlying Index. S&P® is a registered trademark of Standard & Poor’s Financial Services LLC (“SPFS”); Dow Jones® is a registered trademark of Dow Jones Trademark Holdings LLC (“Dow Jones”); and these trademarks have been licensed to S&P Dow Jones Indices. “Calculated by S&P Dow Jones Indices” and its related stylized mark(s) have been licensed for use by Alerian.
The Fund is not sponsored, endorsed, sold or promoted by S&P Dow Jones Indices, SPFS, Dow Jones or any of their affiliates (collectively, “S&P Dow Jones Indices Entities”). S&P Dow Jones Indices Entities do not make any representation or warranty, express or implied, to the owners of the Fund or any member of the public regarding the advisability of investing in securities generally or in the Fund particularly or the ability of the Underlying Index to track general market performance. S&P Dow Jones Indices Entities only relationship to Alerian with respect to the Underlying Index is the licensing of certain trademarks, service marks and trade names of S&P Dow Jones Indices Entities and for the providing of calculation and maintenance services related to the Underlying Index. S&P Dow Jones Indices Entities are not responsible for and have not participated in the determination of the prices and amount of the Fund or the timing of the issuance or sale of the Fund or in the determination or calculation of the equation by which the Fund is to be converted into cash. S&P Dow Jones Indices Entities have no obligation or liability in connection with the administration, marketing or trading of the Fund. S&P Dow Jones Indices LLC is not an investment advisor. Inclusion of a security within the Underlying Index is not a recommendation by S&P Dow Jones Indices Entities to buy, sell, or hold such security, nor is it considered to be investment advice.
S&P DOW JONES INDICES ENTITIES DO NOT GUARANTEE THE ADEQUACY, ACCURACY, TIMELINESS AND/OR THE COMPLETENESS OF THE UNDERLYING INDEX OR ANY DATA RELATED THERETO OR ANY COMMUNICATION, INCLUDING BUT NOT LIMITED TO, ORAL OR WRITTEN COMMUNICATION (INCLUDING ELECTRONIC COMMUNICATIONS) WITH RESPECT THERETO. S&P DOW JONES INDICES ENTITIES SHALL NOT BE SUBJECT TO ANY DAMAGES OR LIABILITY FOR ANY ERRORS, OMISSIONS, OR DELAYS THEREIN. S&P DOW JONES INDICES ENTITIES MAKE NO EXPRESS OR IMPLIED WARRANTIES, AND EXPRESSLY DISCLAIMS ALL WARRANTIES, OF MERCHANTABILITY OR FITNESS FOR A PARTICULAR PURPOSE OR USE OR AS TO RESULTS TO BE OBTAINED BY ALERIAN, OWNERS OF THE FUND, OR ANY OTHER PERSON OR ENTITY FROM THE USE OF THE UNDERLYING INDEX OR WITH RESPECT TO ANY DATA RELATED THERETO. WITHOUT LIMITING ANY OF THE FOREGOING, IN NO EVENT WHATSOEVER SHALL S&P DOW JONES INDICES ENTITIES BE LIABLE FOR ANY INDIRECT, SPECIAL, INCIDENTAL, PUNITIVE, OR CONSEQUENTIAL DAMAGES INCLUDING BUT NOT LIMITED TO, LOSS OF PROFITS, TRADING LOSSES, LOST TIME OR GOODWILL, EVEN IF THEY HAVE BEEN ADVISED OF THE POSSIBILITY OF SUCH DAMAGES, WHETHER IN CONTRACT, TORT, STRICT LIABILITY, OR OTHERWISE.
| Alerian Exchange Traded Funds | |
Board Considerations Regarding Approval of
Investment Advisory Agreements | November 30, 2016 (Unaudited) |
At an in‐person meeting held on June 6, 2016, the Board of Trustees of the Trust (the “Board” or the “Trustees”), including the Trustees who are not “interested persons” of the Trust within the meaning of the 1940 Act, as amended (the “Independent Trustees”), evaluated a proposal to approve the continuance of the Investment Advisory Agreement between the Trust and ALPS Advisors, Inc. (the “Adviser” or “AAI”) with respect to the Alerian MLP ETF (“AMLP”) and Alerian Energy Infrastructure ETF (“ENFR”) (collectively “the Funds”). The Independent Trustees also met separately to consider the Investment Advisory Agreements.
In evaluating the Investment Advisory Agreements with respect to AMLP and ENFR, the Trustees considered various factors, including (i) the nature, extent and quality of the services provided by AAI with respect to the Funds under the Investment Advisory Agreements; (ii) the advisory fees and other expenses paid by the Funds compared to those of similar funds managed by other investment advisers; (iii) the costs of the services provided to the Funds by AAI and the profits realized by AAI and its affiliates from its relationship to the Funds; (iv) the extent to which economies of scale have been or would be realized if and as the assets of the Funds grow and whether fees reflect the economies of scale for the benefit of shareholders; and (v) any additional benefits and other considerations.
With respect to the nature, extent and quality of the services provided by AAI under the Investment Advisory Agreements, the Trustees considered and reviewed information concerning the services provided under the Investment Advisory Agreements, the investment parameters of the index of each Fund, financial information regarding AAI and its parent company, information describing AAI’s current organization and the background and experience of the persons responsible for the day‐to‐day management of the Funds.
The Trustees reviewed information on the performance of each Fund and its applicable benchmark. The Trustees also evaluated the correlation and tracking error between each underlying index and its corresponding Fund’s performance. Based on their review, the Trustees found that the nature and extent of services provided to each Fund under the Investment Advisory Agreements was appropriate and that the quality was satisfactory.
The Trustees noted that the advisory fees for each Fund were unitary fees pursuant to which AAI assumes all expenses of the Funds (including the cost of transfer agency, custody, fund administration, legal, audit and other services) other than the payments under the Advisory Agreement, brokerage expenses, taxes, interest, litigation expenses and other extraordinary expenses.
With respect to advisory fee rates, the Trustees noted the following: The net advisory fee rate for each of these Funds is higher than the median of its Broadridge expense group. ENFR’s expense ratio is slightly above the median of its Broadridge expense group andAMLP’s expense ratio is higher than the median of its Broadridge expense group.
With respect to AMLP, the Trustees took into account, among other things, supplemental information provided by the Adviser showing AMLP’s total expenses were in line with the total expenses of peer groups deemed by the Adviser to be more comparable, including peer groups comprised of (i) the master limited partnership (“MLP”) asset class as a whole and (ii) exchange‐traded products focused solely on MLP investments. The Trustees also considered the brand recognition of AMLP’s index provider and that AMLP’s investment advisory fee schedule included breakpoints.
With respect to ENFR, the Trustees took into account, among other things, the index provider’s general reputation in the MLP space, and the fees charged by the index provider for licensing its index.
Based on the foregoing, and the other information available to them, the Trustees concluded that the advisory fee rate for each of the Funds was reasonable under the circumstances and in light of the quality of the services provided.
The Trustees considered other benefits available to AAI because of its relationship with the Funds and concluded that the advisory fees were reasonable taking into account any such benefits.
The Trustees also considered with respect to each Fund the information provided by AAI about the costs and profitability of AAI with respect to each of the Funds. The Trustees reviewed and noted the relatively small size of ENFR and concluded that AAI was not realizing any economies of scale; they noted, however, that AAI has realized some economies of scale with respect to AMLP. With respect to AMLP, the Trustees noted that the Fund had declined in assets. The Trustees determined that they would continue to evaluate whether further economies of scale have been achieved on an ongoing basis.
With respect to AMLP, the Trustees considered, among other things the brand recognition of AMLP’s index provider as well as the trading volumes of the Fund and the narrow trading spreads. The Trustees considered the breakpoint schedule adopted the previous year and whether the breakpoints would benefit shareholders and appropriately reflect economies of scale achieved by AAI with respect to AMLP should AMLP’s assets increase, noting that AMLP’s assets had declined. Based on the foregoing, the Trustees determined that the advisory fee rate for the Fund reflects an appropriate sharing of any economies of scale which may exist currently and should the Fund’s assets increase.
| Alerian Exchange Traded Funds | |
Board Considerations Regarding Approval of
Investment Advisory Agreements | November 30, 2016 (Unaudited) |
In voting to renew each Investment Advisory Agreement, the Trustees concluded that the terms of each Investment Advisory Agreement are reasonable and fair in light of the services to be performed, the fees paid by certain other funds, expenses to be incurred and such other matters as the Trustees considered relevant in the exercise of their reasonable business judgment. The Trustees did not identify any single factor or group of factors as all important or controlling and considered all factors together.
| Alerian Exchange Traded Funds | |
| Trustees & Officers | November 30, 2016 (Unaudited) |
The general supervision of the duties performed by the Adviser for the Fund under the Investment Advisory Agreement is the responsibility of the Board of Trustees. The Trust currently has four Trustees. Three Trustees have no affiliation or business connection with the Adviser or any of its affiliated persons and do not own any stock or other securities issued by the Adviser. These are the “non‐interested” or “independent” Trustees (“Independent Trustees”). The other Trustee (the “Interested Trustee”) is affiliated with the Adviser.
The Independent Trustees of the Trust, their term of office and length of time served, their principal business occupations during the past five years, the number of portfolios in the Fund Complex overseen by each Independent Trustee, and other directorships, if any, held by the Trustee are shown below.
INDEPENDENT TRUSTEES
Name, Address & Year of Birth* | Position(s) Held with Trust | Term of Office and Length of Time Served** | Principal Occupation(s) During Past 5 Years | Number of Portfolios in Fund Complex Overseen by Trustees*** | Other Directorships Held by Trustees |
Mary K. Anstine, 1940 | Trustee | Since March 2008 | Ms. Anstine was President/Chief Executive Officer of HealthONE Alliance, Denver, Colorado, and former Executive Vice President of First Interstate Bank of Denver. Ms. Anstine is also Trustee/ Director of AV Hunter Trust and Colorado Uplift Board. Ms. Anstine was formerly a Director of the Trust Bank of Colorado (later purchased and now known as Northern Trust Bank), HealthONE and Denver Area Council of the Boy Scouts of America and a member of the American Bankers Association Trust Executive Committee. | 44 | Ms. Anstine is a Trustee of ALPS Variable Investment Trust (10 funds); Financial Investors Trust (31 funds); Reaves Utility Income Fund (1 fund); and Westcore Trust (14 funds). |
Jeremy W. Deems, 1976 | Trustee | Since March 2008 | Mr. Deems is the Co‐Founder, Chief Compliance Officer and Chief Financial Officer of Green Alpha Advisors, LLC. Mr. Deems is Co‐Portfolio Manager of the Shelton Green Alpha Fund. Prior to joining Green Alpha Advisors, Mr. Deems was CFO and Treasurer of Forward Management, LLC, ReFlow Management Co., LLC, ReFlow Fund, LLC, a private investment fund, and Sutton Place Management, LLC, an administrative services company. | 46 | Mr. Deems is a Trustee of ALPS Variable Investment Trust (10 funds); Financial Investors Trust (31 funds); and Reaves Utility Income Fund (1 fund); Clough Funds Trust (1 fund) and Elevation ETF Trust (2 fund). |
Rick A. Pederson, 1952 | Trustee | Since March 2008 | Mr. Pederson is President, Foundation Properties, Inc. (a real estate investment management company), 1994 - present; Advisory Board Member, Bow River Capital Partners (private equity management), 2003 - present; Advisor, The Pauls Corporation (real estate investment management and development), 2008 - present; Chairman, Ross Consulting Group (real estate consulting services) 1983 - 2013; Advisory Board Member, Neenan Company (construction services) 2002 - present; Board Member, Prosci Inc. (private business services) 2013 - 2016; Board Member, Citywide Banks (Colorado community bank) 2014 - present; Board Member, Strong-Bridge Consulting (management consulting) 2015 - present; Director, National Western Stock Show (not-for-profit organization); Director, Biennial of the Americas (not-for-profit-organization), 2012 - 2015; Board Member, History Colorado, 2015 -present. | 22 | Mr. Pederson is Trustee of Westcore Trust (14 funds) and Principal Real Estate Income Fund (1 fund). |
| * | The business address of the Trustee is c/o ALPS Advisors, Inc., 1290 Broadway, Suite 1100, Denver, Colorado 80203. |
| ** | This is the period for which the Trustee began serving the Trust. Each Trustee serves an indefinite term, until his successor is elected. |
| *** | The Fund Complex includes all series of the Trust and any other investment companies for which ALPS Advisors, Inc. provides investment advisory services. |
| Alerian Exchange Traded Funds | |
| Trustees & Officers | November 30, 2016 (Unaudited) |
The Trustee who is affiliated with the Adviser or affiliates of the Adviser and executive officers of the Trust, his term of office and length of time served, his principal business occupations during the past five years, the number of portfolios in the Fund Complex overseen by the Interested Trustee and the other directorships, if any, held by the Trustee, are shown below.
INTERESTED TRUSTEE
Name, Address and Year of Birth of Interested Trustee* | Position(s) Held with Trust | Term of Office and Length of Time Served** | Principal Occupation(s) During Past 5 Years | Number of Portfolios in Fund Complex Overseen by Trustees*** | Other Directorships Held by Trustees |
Thomas A. Carter,
1966 | Trustee and
President | Since
March 2008 | Mr. Carter joined ALPS Fund Services, Inc. (“ALPS”) in 1994 and is currently President and Director of ALPS Advisors, Inc. (“AAI”) and ALPS Portfolio Solutions Distributor, Inc. (“APSD”) and Executive Vice President and Director of ALPS and ALPS Holdings, Inc. (“AHI”) and ALPS Distributors, Inc. (“ADI”). Because of his position with AHI, ALPS, ADI, APSD and AAI, Mr. Carter is deemed an affiliate of the Fund as defined under the 1940 Act. Before joining ALPS, Mr. Carter was with Deloitte & Touche LLP, where he worked with a diverse group of clients, primarily within the financial services industry. Mr. Carter is a Certified Public Accountant and received his Bachelor of Science in Accounting from the University of Colorado at Boulder. | 33 | Mr. Carter is a Trustee of ALPS Variable Investment Trust (10 funds); Principal Real Estate Income Fund (1 fund); and RiverNorth Opportunities Fund, Inc. (1 fund). |
| * | The business address of the Trustee is c/o ALPS Advisors, Inc., 1290 Broadway, Suite 1100, Denver, Colorado 80203. |
| ** | This is the period for which the Trustee began serving the Trust. Each Trustee serves an indefinite term, until his successor is elected. |
| *** | The Fund Complex includes all series of the Trust and any other investment companies for which ALPS Advisors, Inc. provides investment advisory services. |
| Alerian Exchange Traded Funds | |
| Trustees & Officers | November 30, 2016 (Unaudited) |
| OFFICERS | | | |
Name, Address and Year of Birth of Officer* | Position(s) Held with Trust | Length of Time Served** | Principal Occupation(s) During Past 5 Years |
| Erin D. Nelson, 1977 | Chief Compliance Officer (“CCO”) | Since December 2015 | Erin Nelson became Senior Vice‐President and Chief Compliance Officer of ALPS Advisors, Inc. (“AAI”) on July 1, 2015 and prior to that served as Vice President and Deputy Chief Compliance Officer of AAI since January 1, 2015. Prior to January 1, 2015, Ms. Nelson was Vice‐President and Assistant General Counsel of ALPS Fund Services, Inc. Because of her position with AAI, Ms. Nelson is deemed an affiliate of the Trust as defined under the 1940 Act. Ms. Nelson is also the CCO of ALPS Variable Investment Trust, Liberty All‐Star Growth Fund, Inc., Liberty All‐Star Equity Fund, Principal Real Estate Income Fund, and RiverNorth Opportunities Fund, Inc. |
| Patrick D. Buchanan, 1972 | Treasurer | Since June 2012 | Mr. Buchanan is Vice President of AAI. Mr. Buchanan joined ALPS in 2007 and because of his position with AAI, he is deemed an affiliate of the Trust as defined under the 1940 Act. Mr. Buchanan is also Treasurer of the ALPS Variable Insurance Trust, Principal Real Estate Income Fund, Clough Funds Trust and RiverNorth Opportunities Fund, Inc. |
| Andrew P. Meloni, 1969 | Assistant Treasurer | Since December 2016 | Mr. Meloni is a Fund Controller for ALPS Fund Services, Inc. Mr. Meloni joined ALPS in 2007 and because of his position with ALPS, he is deemed an affiliate of the Fund as defined under the 1940 Act. Mr. Meloni is also Assistant Treasurer to the Liberty All‐Star Equity Fund, Liberty All‐Star Growth Fund, Inc., Principal Real Estate Income Fund, RiverNorth Opportunities Fund, Inc. and ALPS Variable Investment Trust. |
| Abigail J. Murray, 1975 | Secretary | Since June 2015 | Ms. Murray joined ALPS in April 2015. She is currently Vice President and Senior Counsel of ALPS. Prior to joining ALPS, Ms. Murray was an Attorney and Managing Member at Murray & Rouvina PLC from 2014 to 2015 and an Associate with Vedder Price P.C. from 2007 to 2014. Ms. Murray is also the Secretary of Clough Global Allocation Fund, Clough Global Equity Fund, Clough Global Opportunities Fund, Clough Funds Trust, The Caldwell & Orkin Funds, Inc. and RiverNorth Opportunities Fund, Inc. and Assistant Secretary of Elevation ETF Trust and Principal Real Estate Income Fund. |
| Andrea E. Kuchli, 1985 | Assistant Secretary | Since December 2015 | Ms. Kuchli joined ALPS in 2015 and is currently Vice President and Senior Counsel of ALPS. Prior to joining ALPS, Ms. Kuchli was an Associate with Davis Graham & Stubbs LLP from April 2014 to February 2015, and an Associate with Dechert LLP from 2011 to April 2014. Because of her position with ALPS, Ms. Kuchli is deemed an affiliate of the Trust as defined under the 1940 Act. Ms. Kuchli is also Secretary of Elevation ETF Trust and Principal Real Estate Income Fund as well as Assistant Secretary of the James Advantage Funds and RiverNorth Opportunities Fund, Inc. |
| Sharon Akselrod, 1974 | Assistant Secretary | Since December 2016 | Ms. Akselrod joined ALPS in August 2014 and is currently Senior Investment Company Act Paralegal of ALPS Fund Services, Inc. Prior to joining ALPS, Ms. Akselrod served as Corporate Governance and Regulatory Associate for Nordstrom fsb (2013‐2014) and Senior Legal Assistant – Legal Manager for AXA Equitable Life Insurance Company (2008‐2013). Because of her position with ALPS, Ms. Akselrod is deemed an affiliate of the Trust as defined under the 1940 Act. Ms. Akselrod is also Assistant Secretary of Financial Investors Trust. |
| * | The business address of each Officer is c/o ALPS Advisors, Inc., 1290 Broadway, Suite 1100, Denver, Colorado 80203. |
| ** | This is the period for which the Officer began serving the Trust. Each Officer serves an indefinite term, until his/her successor is elected. |
The Statement of Additional Information includes additional information about the Fund's Trustees and is available, without charge, upon request by calling (toll-free) 1-877-398-8461.
| Performance Overview | 1 |
| Disclosure of Fund Expenses | 4 |
| Report of Independent Registered Public Accounting Firm | 5 |
| Schedule of Investments | 6 |
| Statement of Assets & Liabilities | 7 |
| Statement of Operations | 8 |
| Statements of Changes In Net Assets | 9 |
| Financial Highlights | 10 |
| Notes to Financial Statements | 11 |
| Additional Information | 16 |
| Board Considerations Regarding Approval of Investment Advisory Agreement | 17 |
| Trustees & Officers | 18 |
alpsfunds.com
ALPS Equal Sector Weight ETF
| Performance Overview | November 30, 2016 (Unaudited) |
Investment Objective
The ALPS Equal Sector Weight ETF (the “Fund”) seeks investment results that replicate as closely as possible, before fees and expenses, the performance of the Bank of America Securities – Merrill Lynch Equal Sector Weight Index (the “Underlying Index”).
The Underlying Index is an index of indexes comprised in equal proportions of ten Select Sector SPDR Indexes (the “Underlying Sector Indexes”). These are the Consumer Discretionary Select Sector Index, Consumer Staples Select Sector Index, Materials Select Sector Index, Energy Select Sector Index, Technology Select Sector Index, Utilities Select Sector Index, Financial Select Sector Index, Industrial Select Sector Index, Health Care Select Sector Index and Real Estate Select Sector Index. In order to track the securities in the Underlying Index, the Fund will use a “fund of funds” approach, and seek to achieve its investment objective by investing at least 90% if its total assets in the shares of Select Sector SPDR exchange-traded funds (each, an “Underlying Sector ETF” and collectively, the “Underlying Sector ETFs”) that track the Underlying Sector Indexes of which the Underlying Index is comprised.
The Underlying Index is designed to track the equally weighted performance of the Underlying Sector Indexes. Accordingly, each Underlying Index is rebalanced quarterly so that each rebalance will result in each Underlying Sector Index having an Index weight of 10% and the Underlying Sector Indexes in aggregate total to 100.0%.
Performance Overview
The ALPS Equal Sector Weight ETF (EQL), for the twelve month period ended November 30, 2016, generated a total return of 8.62%, outperforming the Fund’s Underlying Index which returned 6.43%. The Fund outperformed the S&P 500® (SPX), which returned 8.06% for the same period.
The S&P 500® was virtually flat from 11/30/15 through the end of the first calendar quarter in 2016. Fears of a global growth slowdown drove market action early on to start the year as U.S. equities pulled back more than 10%, their second correction in less than 12 months. A rebound in oil prices and continued improvement in consumer confidence helped to lead a rebound during the latter portion of the quarter. The S&P 500® returned 2.46% in Q2 2016. The majority of U.S. equities’ gains came in May as oil continued to climb and an upgrade was made to first quarter U.S. GDP growth. The UK’s in June decision to exit the European Union caused a spike in volatility and a selloff of U.S. equities, but comments from the Federal Reserve suggesting additional rises in U.S. interest rates helped allay worries and the domestic benchmark was able to hold onto its gains. During the third calendar quarter of 2016, the S&P 500® returned 3.85%. The majority of U.S. equities’ gains came in July as initial jobless claims improved and earnings growth outlook became more positive for domestic firms. Performance leveled off for the last two months of the quarter as uncertainty surrounding the U.S. election tempered optimism, and this uncertainty continued to be an anchor to U.S. equity performance through the end of October. The domestic equity markets rebounded optimistically following the U.S. election in November 2016.
Compared to the S&P 500®, the Fund experienced a moderately positive impact (0.33%) from allocation effect during the period. This impact was largely driven by outperformance related to its relative overweight to Utilities (average weight for the period of 10.93% vs. 3.30% in SPX) and a relative underweight to Health Care (average weight for the period of 10.84% vs. 14.58% in SPX). The Fund’s relative underweight allocation to Financials (average weight for the period of 10.88% vs. 15.90% in SPX) detracted from the Fund’s performance.
The best performing fund holdings for the period were the Industrials Select Sector SPDR (XLI), which increased 16.57% and the Financials Sector SPDR (XLF), which saw a gain of 15.38%. The Utilities Select Sector SPDR (XLU), which rose 13.01%, and the Energy Select Sector SPDR (XLE), which climbed 12.63%, were other top performers. The largest detractors were the Real Estate Select Sector SPDR (XLRE), which decreased 5.95% and the Health Care Select Sector SPDR (XLV), which fell 1.79%.
Looking forward we believe the Fund’s strategy of holding each of the ten sectors in the S&P 500® via the Select SPDRs can result in a diversified core holding and potential for market participation in all economic cycles through equal sector weighting.
ALPS Equal Sector Weight ETF
| Performance Overview | November 30, 2016 (Unaudited) |
Performance (as of November 30, 2016)
| | 1 Year | 3 Year | 5 Year | Since Inception^ |
| ALPS Equal Sector Weight ETF ‐ NAV | 8.62% | 8.09% | 13.15% | 14.58% |
| ALPS Equal Sector Weight ETF ‐ Market Price* | 8.70% | 8.09% | 13.15% | 14.61% |
| Bank of America Securities ‐ Merrill Lynch Equal Sector Weight Index | 6.43% | 6.06% | 11.05% | 12.53% |
S&P 500® Total Return Index | 8.06% | 9.07% | 14.45% | 15.27% |
Total Expense Ratio (per the current Prospectus) 0.52%. Net Expense Ratio (per the current Prospectus) 0.30%. Net expense ratio reflects the Adviser’s decision to contractually limit expenses until at least March 31, 2017. Please see the prospectus for additional information.
Performance data quoted represents past performance. Past performance does not guarantee future results. The table does not reflect the deduction of taxes that a shareholder would pay on Fund distributions or the redemption of Fund shares. Investment return and principal value of an investment will fluctuate so that an investor’s shares, when sold or redeemed, may be worth more or less than the original cost. Current performance data may be higher or lower than actual data quoted. For the most current month-end performance data please visit www.alpsfunds.com or call 1.866.675.2639.
NAV is an exchange-traded fund’s per-share value. The per-share dollar amount of the Fund is derived by dividing the total value of all the securities in its portfolio, less any liabilities, by the number of Fund shares outstanding. Market Price is the price at which a share can currently be traded in the market. Information detailing the number of days the Market Price of the Fund was greater than the Fund’s NAV and the number of days it was less than the Fund’s NAV can be obtained at www.alpsfunds.com.
| ^ | The Fund commenced Investment Operations on July 6, 2009 with an Inception Date, the first day of trading on the Exchange, of July 7, 2009. |
| * | Market Price is based on the midpoint of the bid/ask spread at 4 p.m. ET and does not represent the returns an investor would receive if shares were traded at other times. |
Bank of America Securities - Merrill Lynch Equal Sector Weight Index: a U.S. equity index comprised, in equal weights, of nine sub-indices, and is a total return index.
S&P 500®Total Return Index: the Standard & Poor’s composite index of 500 stocks, a widely recognized, unmanaged index of common stock prices. Total return assumes reinvestment of any dividends and distributions realized during a given time period.
The indexes are not actively managed and do not reflect any deductions for fees, expenses or taxes. The indexes are reported on a total return basis, which assumes reinvestment of any dividends and distributions realized during a given time period. One cannot invest directly in an index. Index performance does not reflect fund performance.
The ALPS Equal Sector Weight ETF is not suitable for all investors. Investments in the Fund are subject to investment risks, including possible loss of the principal amount invested.
ALPS Portfolio Solutions Distributor, Inc., a FINRA member, is the distributor for the Fund.
ALPS Equal Sector Weight ETF
| Performance Overview | November 30, 2016 (Unaudited) |
The following table shows the sector weights of both the Fund and the S&P 500® as of November 30, 2016:
Sector Weighting Comparison (as of November 30, 2016)
| | EQL* | S&P 500® | +/- |
| Financials | 11.39% | 14.65% | ‐3.26% |
| Energy | 10.72% | 7.52% | 3.20% |
| Industrials | 10.71% | 10.46% | 0.25% |
| Materials | 10.37% | 2.91% | 7.46% |
| Consumer Discretionary | 10.12% | 12.32% | -2.20% |
| Technology | 9.77% | 23.31% | ‐13.54% |
| Consumer Staples | 9.30% | 9.26% | 0.04% |
| Healthcare | 9.26% | 13.74% | -4.48% |
| Utilities | 9.22% | 3.06% | 6.16% |
| Real Estate | 9.14% | 2.77% | 6.37% |
| Total | 100.00% | 100.00% | |
Source: S&P 500®
Future holdings are subject to change.
Growth of $10,000 (as of November 30, 2016)
Comparison of Change in Value of $10,000 Investment in the Fund and the Indexes
The chart above represents historical performance of a hypothetical investment of $10,000 in the Fund over the life of the Fund. Past performance does not guarantee future results. This chart does not reflect the deduction of taxes that a shareholder would pay on Fund distributions or the redemption of Fund shares.
ALPS Equal Sector Weight ETF
| Disclosure of Fund Expenses | November 30, 2016 (Unaudited) |
Shareholder Expense Example: As a shareholder of the Fund, you incur two types of costs: (1) transaction costs which may include creation and redemption fees or brokerage charges, and (2) ongoing costs, including management fees and other Fund expenses. These examples are intended to help you understand your ongoing costs (in dollars) of investing in the Fund and to compare these costs with the ongoing costs of investing in other funds. The example is based on an investment of $1,000 invested at the beginning of the (six month) period and held through November 30, 2016.
Actual Return: The first line of the table provides information about actual account values and actual expenses. You may use the information in this line, together with the amount you invested, to estimate the expenses that you incurred over the period. Simply divide your account value by $1,000 (for example, an $8,600 account value divided by $1,000 = 8.6), then multiply the result by the number in the first line under the heading entitled “Expenses Paid During Period” to estimate the expenses attributable to your investment during this period.
Hypothetical 5% Return: The second line of the table provides information about hypothetical account values and hypothetical expenses based on the Fund’s actual expense ratio and an assumed rate of return of 5% per year before expenses, which is not the Fund’s actual return. The hypothetical account values and expenses may not be used to estimate the actual ending account balance or expenses you paid for the period. You may use this information to compare ongoing costs of investing in the Fund and other funds. To do so, compare this 5% hypothetical example with the 5% hypothetical examples that appear in the shareholder reports of other funds.
The expenses shown in the table are meant to highlight ongoing Fund costs only and do not reflect any transaction costs, such as creation and redemption fees or brokerage charges. Therefore, the second line of the table is useful in comparing ongoing costs only, and will not help you determine the relative total costs of owning different funds. In addition, if these costs were included, your costs would have been higher.
| | Beginning Account Value 6/1/16 | Ending Account Value 11/30/16 | Expense Ratio(a) | Expenses Paid During Period 6/1/16 - 11/30/16(b) |
| ALPS Equal Sector Weight ETF | | | | |
| Actual | $1,000.00 | $1,050.30 | 0.15% | $0.77 |
Hypothetical (5% return before expenses) | $1,000.00 | $1,024.25 | 0.15% | $0.76 |
(a) | Annualized based on the Fund's most recent half-year expenses. |
(b) | Expenses are equal to the Fund's annualized expense ratio multiplied by the average account value over the period, multiplied by the number of days in the most recent fiscal half year (183), divided by 366. |
ALPS Equal Sector Weight ETF
| Report of Independent Registered Public Accounting Firm | |
To the Board of Trustees and Shareholders of ALPS ETF Trust:
We have audited the accompanying statement of assets and liabilities, including the schedule of investments, of ALPS Equal Sector Weight ETF, one of the portfolios constituting the ALPS ETF Trust (the “Trust”), as of November 30, 2016, and the related statement of operations for the year then ended, the statements of changes in net assets for each of the two years in the period then ended, and the financial highlights for each of the five years in the period then ended. These financial statements and financial highlights are the responsibility of the Trust’s management. Our responsibility is to express an opinion on these financial statements and financial highlights based on our audits.
We conducted our audits in accordance with the standards of the Public Company Accounting Oversight Board (United States). Those standards require that we plan and perform the audit to obtain reasonable assurance about whether the financial statements and financial highlights are free of material misstatement. The Trust is not required to have, nor were we engaged to perform, an audit of its internal control over financial reporting. Our audits included consideration of internal control over financial reporting as a basis for designing audit procedures that are appropriate in the circumstances, but not for the purpose of expressing an opinion on the effectiveness of the Trust’s internal control over financial reporting. Accordingly, we express no such opinion. An audit also includes examining, on a test basis, evidence supporting the amounts and disclosures in the financial statements, assessing the accounting principles used and significant estimates made by management, as well as evaluating the overall financial statement presentation. Our procedures included confirmation of securities owned as of November 30, 2016, by correspondence with the custodian. We believe that our audits provide a reasonable basis for our opinion.
In our opinion, the financial statements and financial highlights referred to above present fairly, in all material respects, the financial position of ALPS Equal Sector Weight ETF of the ALPS ETF Trust as of November 30, 2016, the results of its operations for the year then ended, the changes in its net assets for each of the two years in the period then ended, and the financial highlights for each of the five years in the period then ended, in conformity with accounting principles generally accepted in the United States of America.
DELOITTE & TOUCHE LLP
Denver, Colorado
January 27, 2017
ALPS Equal Sector Weight ETF
| Schedule of Investments | November 30, 2016 |
| SECURITY DESCRIPTION | | SHARES | | | VALUE | |
| EXCHANGE TRADED FUNDS (99.93%) | | | | | | |
| Consumer Discretionary (10.12%) | | | | | | |
Consumer Discretionary Select Sector SPDR® Fund | | | 173,542 | | | $ | 14,204,413 | |
| | | | | | | | | |
| Consumer Staples (9.30%) | | | | | | | | |
Consumer Staples Select Sector SPDR® Fund | | | 258,093 | | | | 13,054,344 | |
| | | | | | | | | |
| Energy (10.71%) | | | | | | | | |
Energy Select Sector SPDR® Fund | | | 201,998 | | | | 15,034,711 | |
| | | | | | | | | |
| Financials (11.38%) | | | | | | | | |
Financial Select Sector SPDR® Fund | | | 709,837 | | | | 15,978,431 | |
| | | | | | | | | |
| Healthcare (9.25%) | | | | | | | | |
Health Care Select Sector SPDR® Fund | | | 188,944 | | | | 12,989,900 | |
| | | | | | | | | |
| Industrials (10.70%) | | | | | | | | |
Industrial Select Sector SPDR® Fund | | | 240,677 | | | | 15,020,652 | |
| | | | | | | | | |
| Materials (10.37%) | | | | | | | | |
Materials Select Sector SPDR® Fund | | | 291,375 | | | | 14,551,267 | |
| | | | | | | | | |
| Real Estate (9.13%) | | | | | | | | |
Real Estate Select Sector SPDR® Fund | | | 427,291 | | | | 12,823,003 | |
| | | | | | | | | |
| Technology (9.76%) | | | | | | | | |
Technology Select Sector SPDR® Fund | | | 288,598 | | | | 13,708,405 | |
| | | | | | | | | |
| Utilities (9.21%) | | | | | | | | |
Utilities Select Sector SPDR® Fund | | | 276,588 | | | | 12,930,489 | |
| | | | | | | | | |
TOTAL EXCHANGE TRADED FUNDS (Cost $113,331,285) | | | | | | | 140,295,615 | |
| | | 7 DAY YIELD | | | SHARES | | | VALUE | |
| SHORT TERM INVESTMENTS (0.08%) | | | | | | | | | |
| State Street Institutional Treasury Plus Money Market Fund | | | 0.259 | % | | | 111,958 | | | | 111,958 | |
| | | | | | | | | | | | | |
TOTAL SHORT TERM INVESTMENTS (Cost $111,958) | | | | | | | | | | | 111,958 | |
| | | | | | | | | | | | | |
TOTAL INVESTMENTS (100.01%) (Cost $113,443,243) | | | | | | | | | | $ | 140,407,573 | |
| | | | | | | | | | | | | |
| NET LIABILITIES LESS OTHER ASSETS (‐0.01%) | | | | | | | | | | | (16,903 | ) |
| | | | | | | | | | | | | |
| NET ASSETS (100.00%) | | | | | | | | | | $ | 140,390,670 | |
Common Abbreviations:
SPDR® - Standard & Poor's Depositary Receipts
See Notes to Financial Statements.
ALPS Equal Sector Weight ETF
| Statement of Assets and Liabilities | November 30, 2016 |
| ASSETS: | | | |
| Investments, at value | | $ | 140,407,573 | |
Dividends receivable | | | 26 | |
Total Assets | | | 140,407,599 | |
| | | | | |
| LIABILITIES: | | | | |
Payable to adviser | | | 16,929 | |
| Total Liabilities | | | 16,929 | |
| NET ASSETS | | $ | 140,390,670 | |
| | | | | |
| NET ASSETS CONSIST OF: | | | | |
| Paid‐in capital | | $ | 112,851,675 | |
| Accumulated net investment income | | | 1,130,664 | |
| Accumulated net realized loss | | | (555,999 | ) |
Net unrealized appreciation | | | 26,964,330 | |
| NET ASSETS | | $ | 140,390,670 | |
| | | | | |
| INVESTMENTS, AT COST | | $ | 113,443,243 | |
| | | | | |
| PRICING OF SHARES | | | | |
| Net Assets | | $ | 140,390,670 | |
| Shares of beneficial interest outstanding (Unlimited number of shares authorized, par value $0.01 per share) | | | 2,350,000 | |
| Net Asset Value, offering and redemption price per share | | $ | 59.74 | |
See Notes to Financial Statements.
ALPS Equal Sector Weight ETF
| Statement of Operations | For the Year Ended November 30, 2016 |
| INVESTMENT INCOME: | | | |
| Dividends | | $ | 4,205,966 | |
Total investment income | | | 4,205,966 | |
| | | | | |
| EXPENSES: | | | | |
Investment adviser fees | | | 505,052 | |
Total expenses before waiver/reimbursement | | | 505,052 | |
Less fees waiver/reimbursement by investment adviser | | | (300,301 | ) |
Net Expenses | | | 204,751 | |
NET INVESTMENT INCOME | | | 4,001,215 | |
| REALIZED AND UNREALIZED GAIN/(LOSS) | | | | |
| Net realized gain on investments | | | 2,016,943 | |
Net change in unrealized appreciation on investments | | | 4,873,106 | |
NET REALIZED AND UNREALIZED GAIN ON INVESTMENTS | | | 6,890,049 | |
| NET INCREASE IN NET ASSETS RESULTING FROM OPERATIONS | | $ | 10,891,264 | |
See Notes to Financial Statements.
ALPS Equal Sector Weight ETF
Statements of Changes in Net Assets
| | | For the Year Ended November 30, 2016 | | | For the Year Ended November 30, 2015(a) | |
| OPERATIONS: | | | | | | |
| Net investment income | | $ | 4,001,215 | | | $ | 2,761,175 | |
Net realized gain(a) | | | 2,016,943 | | | | 7,217,464 | |
Net change in unrealized appreciation/(depreciation)(a) | | | 4,873,106 | | | | (9,245,175 | ) |
| Net increase in net assets resulting from operations | | | 10,891,264 | | | | 733,464 | |
| | | | | | | | | |
| DISTRIBUTIONS TO SHAREHOLDERS: | | | | | | | | |
From net investment income | | | (2,883,195 | ) | | | (2,761,711 | ) |
Total distributions | | | (2,883,195 | ) | | | (2,761,711 | ) |
| | | | | | | | | |
| CAPITAL SHARE TRANSACTIONS: | | | | | | | | |
| Proceeds from sale of shares | | | – | | | | 22,873,159 | |
Cost of shares redeemed | | | (8,024,819 | ) | | | (20,123,962 | ) |
Net increase/(decrease) from share transactions | | | (8,024,819 | ) | | | 2,749,197 | |
| Net increase/(decrease) in net assets | | | (16,750 | ) | | | 720,950 | |
| | | | | | | | | |
| NET ASSETS: | | | | | | | | |
Beginning of year | | | 140,407,420 | | | | 139,686,470 | |
| End of year * | | $ | 140,390,670 | | | $ | 140,407,420 | |
| | | | | | | | | |
| *Including accumulated net investment income of: | | $ | 1,130,664 | | | $ | 12,644 | |
| | | | | | | | | |
| OTHER INFORMATION: | | | | | | | | |
| CAPITAL SHARE TRANSACTIONS: | | | | | | | | |
| Beginning shares | | | 2,500,000 | | | | 2,450,000 | |
| Shares sold | | | – | | | | 400,000 | |
Shares redeemed | | | (150,000 | ) | | | (350,000 | ) |
| Shares outstanding, end of year | | | 2,350,000 | | | | 2,500,000 | |
| (a) | Prior to November 30, 2016, the Fund presented realized gain/loss and unrealized appreciation/depreciation by investment type. This change in presentation was made to conform to industry standards and had no effect on the Fund's change in net assets. |
See Notes to Financial Statements.
ALPS Equal Sector Weight ETF
| Financial Highlights | For a Share Outstanding Throughout the Years Presented |
| | | For the Year Ended November 30, 2016 | | | For the Year Ended November 30, 2015 | | | For the Year Ended November 30, 2014 | | | For the Year Ended November 30, 2013 | | | For the Year Ended November 30, 2012 | |
| NET ASSET VALUE, BEGINNING OF PERIOD | | $ | 56.16 | | | $ | 57.01 | | | $ | 50.11 | | | $ | 39.79 | | | $ | 35.48 | |
| | | | | | | | | | | | | | | | | | | | | |
| INCOME FROM OPERATIONS: | | | | | | | | | | | | | | | | | | | | |
Net investment income(a) | | | 1.66 | | | | 1.09 | | | | 0.90 | | | | 0.81 | | | | 0.69 | |
Net realized and unrealized gain/(loss) | | | 3.11 | | | | (0.84 | ) | | | 6.90 | | | | 10.35 | | | | 4.35 | |
Total from investment operations | | | 4.77 | | | | 0.25 | | | | 7.80 | | | | 11.16 | | | | 5.04 | |
| | | | | | | | | | | | | | | | | | | | | |
| DISTRIBUTIONS: | | | | | | | | | | | | | | | | | | | | |
| From net investment income | | | (1.19 | ) | | | (1.10 | ) | | | (0.90 | ) | | | (0.84 | ) | | | (0.71 | ) |
From tax return of capital | | | – | | | | – | | | | – | | | | – | | | | (0.02 | ) |
Total distributions | | | (1.19 | ) | | | (1.10 | ) | | | (0.90 | ) | | | (0.84 | ) | | | (0.73 | ) |
| | | | | | | | | | | | | | | | | | | | | |
| NET INCREASE/(DECREASE) IN NET ASSET VALUE | | | 3.58 | | | | (0.85 | ) | | | 6.90 | | | | 10.32 | | | | 4.31 | |
| NET ASSET VALUE, END OF PERIOD | | $ | 59.74 | | | $ | 56.16 | | | $ | 57.01 | | | $ | 50.11 | | | $ | 39.79 | |
TOTAL RETURN(b) | | | 8.62 | % | | | 0.48 | % | | | 15.71 | % | | | 28.41 | % | | | 14.35 | % |
| | | | | | | | | | | | | | | | | | | | | |
| RATIOS/SUPPLEMENTAL DATA: | | | | | | | | | | | | | | | | | | | | |
| Net assets, end of period (in 000s) | | $ | 140,391 | | | $ | 140,407 | | | $ | 139,686 | | | $ | 110,245 | | | $ | 75,592 | |
| | | | | | | | | | | | | | | | | | | | | |
| Ratio of expenses excluding waiver/reimbursement to average net assets | | | 0.37 | % | | | 0.37 | % | | | 0.37 | % | | | 0.37 | % | | | 0.37 | % |
| Ratio of expenses including waiver/reimbursement to average net assets | | | 0.15 | % | | | 0.21 | %(c) | | | 0.34 | % | | | 0.34 | % | | | 0.34 | % |
| Ratio of net investment income excluding waiver/reimbursement to average net assets | | | 2.71 | % | | | 1.78 | % | | | 1.67 | % | | | 1.77 | % | | | 1.76 | % |
| Ratio of net investment income including waiver/reimbursement to average net assets | | | 2.93 | % | | | 1.94 | %(c) | | | 1.70 | % | | | 1.80 | % | | | 1.79 | % |
Portfolio turnover rate(d) | | | 13 | % | | | 6 | % | | | 3 | % | | | 2 | % | | | 4 | % |
| (a) | Based on average shares outstanding during the period. |
| (b) | Total return is calculated assuming an initial investment made at the net asset value at the beginning of the period and redemption at the net asset value on the last day of the period and assuming all distributions are reinvested at reinvestment prices. |
| (c) | The effective expense ratio including waivers changed from 0.34% to 0.15% effective April 1, 2015 through March 31, 2016. |
| (d) | Portfolio turnover does not include securities received or delivered from processing creations or redemptions in-kind. |
See Notes to Financial Statements.
ALPS Equal Sector Weight ETF
| Notes to Financial Statements | November 30, 2016 |
1. ORGANIZATION
ALPS ETF Trust (the “Trust”), a Delaware statutory trust, is an open-end management investment company registered under the Investment Company Act of 1940, as amended (the “1940 Act”). As of November 30, 2016, the Trust consists of nineteen separate portfolios. Each portfolio represents a separate series of the Trust. This report pertains solely to the ALPS Equal Sector Weight ETF (the “Fund”). The investment objective of the Fund is to seek investment results that replicate as closely as possible, before fees and expenses, the performance of the Bank of America Securities - Merrill Lynch Equal Sector Weight Index (the “Underlying Index”). The Fund is considered non-diversified and may invest a greater portion of assets in securities of individual issuers than a diversified fund. As a result, changes in the market value of a single investment could cause greater fluctuations in share price than would occur in a diversified fund.
The Fund’s Shares (“Shares”) are listed on the New York Stock Exchange (“NYSE”) Arca. The Fund issues and redeems Shares at net asset value (“NAV”) in blocks of 50,000 Shares each of which is called a “Creation Unit”. Creation Units are issued and redeemed principally in-kind for securities included in the Underlying Index. Except when aggregated in Creation Units, Shares are not redeemable securities of the Fund.
Pursuant to the Trust’s organizational documents, its Officers and Trustees are indemnified against certain liability arising out of the performance of their duties to the Trust. Additionally, in the normal course of business, the Trust enters into contracts with service providers that contain general indemnification clauses. The Trust’s maximum exposure under these arrangements is unknown, as this would involve future claims that may be made against the Trust that have not yet occurred.
2. SIGNIFICANT ACCOUNTING POLICIES
The following is a summary of significant accounting policies consistently followed by the Fund in the preparation of the financial statements. The accompanying financial statements were prepared in accordance with accounting principles generally accepted in the United States of America (“U.S. GAAP”). The preparation of financial statements in conformity with U.S. GAAP requires management to make certain estimates and assumptions that affect the reported amounts of assets and liabilities and disclosures of contingent assets and liabilities at the date of the financial statements and the reported amounts of revenue and expenses during the period. Actual results could differ from those estimates. The Fund is considered an investment company under U.S. GAAP and follows the accounting and reporting guidance applicable to investment companies in the Financial Accounting Standards Board Accounting Standards Codification Topic 946.
A. Portfolio Valuation
The Fund’s NAV is determined daily, as of the close of regular trading on the NYSE, normally 4:00 p.m. Eastern time, on each day the NYSE is open for trading. The NAV is computed by dividing the value of all assets of the Fund (including accrued interest and dividends), less all liabilities (including accrued expenses and dividends declared but unpaid), by the total number of shares outstanding.
Portfolio securities listed on any exchange other than the NASDAQ Stock Market LLC (“NASDAQ”) are valued at the last sale price on the business day as of which such value is being determined. If there has been no sale on such day, the securities are valued at the mean of the most recent bid and ask prices on such day. Securities traded on the NASDAQ are valued at the NASDAQ Official Closing Price as determined by NASDAQ. Portfolio securities traded on more than one securities exchange are valued at the last sale price on the business day as of which such value is being determined at the close of the exchange representing the principal market for such securities. Portfolio securities traded in the over-the-counter market, but excluding securities traded on the NASDAQ, are valued at the last quoted sale price in such market.
The Fund’s investments are valued at market value or, in the absence of market value with respect to any portfolio securities, at fair value according to procedures adopted by the Trust’s Board of Trustees (the “Board”). When market quotations are not readily available or when events occur that make established valuation methods unreliable, securities of the Fund may be valued in good faith by or under the direction of the Board. These securities generally include, but are not limited to, restricted securities (securities which may not be publicly sold without registration under the Securities Act of 1933) for which a pricing service is unable to provide a market price; securities whose trading has been formally suspended; a security whose market price is not available from a pre-established primary pricing source or the pricing source is not willing to provide a price; a security with respect to which an event has occurred that is most likely to materially affect the value of the security after the market has closed but before the calculation of the Fund’s NAV or make it difficult or impossible to obtain a reliable market quotation; or a security whose price, as provided by the pricing service, does not reflect the security’s “fair value” due to the security being de-listed from a national exchange or the security’s primary trading market is temporarily closed at a time when, under normal conditions, it would be open. As a general principle, the current “fair value” of a security would be the amount which the owner might reasonably expect to receive from the sale on the applicable exchange or principal market. A variety of factors may be considered in determining the fair value of such securities. ALPS Equal Sector Weight ETF
| Notes to Financial Statements | November 30, 2016 |
B. Fair Value Measurements
The Fund discloses the classification of its fair value measurements following a three-tier hierarchy based on the inputs used to measure fair value. Inputs refer broadly to the assumptions that market participants would use in pricing the asset or liability, including assumptions about risk. Inputs may be observable or unobservable. Observable inputs reflect the assumptions market participants would use in pricing the asset or liability that are developed based on market data obtained from sources independent of the reporting entity. Unobservable inputs reflect the reporting entity’s own assumptions about the assumptions market participants would use in pricing the asset or liability that are developed based on the best information available.
Valuation techniques used to value the Fund’s investments by major category are as follows:
Exchange Traded Funds, for which market quotations are readily available, are valued at the last reported sale price or official closing price as reported by a third party pricing vendor on the primary market or exchange on which they are traded and are categorized as Level 1 in the hierarchy. In the event there were no sales during the day or closing prices are not available, securities are valued at the mean of the most recent quoted bid and ask prices on such day and are generally categorized as Level 2 in the hierarchy. Investments in open-end mutual funds are valued at their closing NAV each business day and are categorized as Level 1 in the hierarchy.
Changes in valuation techniques may result in transfers in or out of an assigned level within the disclosure hierarchy.
Various inputs are used in determining the value of the Fund’s investments as of the end of the reporting period. When inputs used fall into different levels of the fair value hierarchy, the level in the hierarchy within which the fair value measurement falls is determined based on the lowest level input that is significant to the fair value measurement in its entirety. The designated input levels are not necessarily an indication of the risk or liquidity associated with these investments.
These inputs are categorized in the following hierarchy under applicable financial accounting standards:
| Level 1 – | Unadjusted quoted prices in active markets for identical investments, unrestricted assets or liabilities that a Fund has the ability to access at the measurement date; |
| Level 2 – | Quoted prices which are not active, quoted prices for similar assets or liabilities in active markets or inputs other than quoted prices that are observable (either directly or indirectly) for substantially the full term of the asset or liability; and |
| Level 3 – | Significant unobservable prices or inputs (including the Fund’s own assumptions in determining the fair value of investments) where there is little or no market activity for the asset or liability at the measurement date. |
The following is a summary of inputs used to value the Fund’s investments at November 30, 2016:
| Investments in Securities at Value* | | Level 1 - Unadjusted Quoted Prices | | | Level 2 - Significant Observable Inputs | | | Level 3 - Significant Unobservable Inputs | | | Total | |
| Exchange Traded Funds | | $ | 140,295,615 | | | $ | – | | | $ | – | | | $ | 140,295,615 | |
| Short Term Investments | | | 111,958 | | | | – | | | | – | | | | 111,958 | |
| TOTAL | | $ | 140,407,573 | | | $ | – | | | $ | – | | | $ | 140,407,573 | |
| * | For a detailed sector breakdown, see the accompanying Schedule of Investments. |
The Fund recognizes transfers between levels as of the end of the period. For the year ended November 30, 2016, the Fund did not have any transfers between Level 1 and Level 2 securities. The Fund did not have any securities that used significant unobservable inputs (Level 3) in determining fair value.
C. Securities Transactions and Investment Income
Securities transactions are recorded as of the trade date. Realized gains and losses from securities transactions are recorded on the highest cost basis. Dividend income and capital gains distributions, if any, are recorded on the ex-dividend date. Interest income, if any, is recorded on the accrual basis.
D. Dividends and Distributions to Shareholders
Dividends from net investment income of the Fund, if any, are declared and paid quarterly or as the Board may determine from time to time. Distributions of net realized capital gains earned by the Fund, if any, are distributed at least annually.
ALPS Equal Sector Weight ETF
| Notes to Financial Statements | November 30, 2016 |
E. Federal Tax and Tax Basis Information
The timing and character of income and capital gain distributions are determined in accordance with income tax regulations, which may differ from U.S. GAAP. Reclassifications are made to the Fund’s capital accounts for permanent tax differences to reflect income and gains available for distribution (or available capital loss carryforwards) under income tax regulations.
For the year ended November 30, 2016, the following reclassifications, which had no impact on results of operations or net assets, were recorded to reflect permanent tax differences resulting primarily from in-kind transactions:
| Fund | | Accumulated Net Investment Income/(Loss) | | | Accumulated Net Realized Gain/ (Loss) on Investments | | | Paid-in Capital | |
| ALPS Equal Sector Weight ETF | | $ | – | | | $ | (2,303,178 | ) | | $ | 2,303,178 | |
The tax character of the distributions paid during the fiscal years ended November 30, 2016 and November 30, 2015 were as follows:
| | | Ordinary Income | |
| November 30, 2016 | | | |
| ALPS Equal Sector Weight ETF | | $ | 2,883,195 | |
| November 30, 2015 | | | | |
| ALPS Equal Sector Weight ETF | | $ | 2,761,711 | |
As of November 30, 2016, the components of distributable earnings on a tax basis for the Fund were as follows:
| Undistributed net investment income | | $ | 1,130,664 | |
| Accumulated net realized loss on investments | | | (477,687 | ) |
| Net unrealized appreciation on investments | | | 26,886,018 | |
| Total | | $ | 27,538,995 | |
At November 30, 2016, the Fund had available for tax purposes unused post-enactment capital loss carryforwards as follows:
| Fund | | Short-Term | | | Long-Term | |
| ALPS Equal Sector Weight ETF | | $ | 70,503 | | | $ | 407,184 | |
As of November 30, 2016, the cost of investments for federal income tax purposes and accumulated net unrealized appreciation/(depreciation) on investments were as follows:
| Gross appreciation (excess of value over tax cost) | | $ | 28,771,934 | |
| Gross depreciation (excess of tax cost over value) | | | (1,885,916 | ) |
| Net unrealized appreciation (depreciation) | | | 26,886,018 | |
| Cost of investments for income tax purposes | | $ | 113,521,555 | |
The differences between book-basis and tax-basis are primarily due to the deferral of losses from wash sales.
F. Income Taxes
No provision for income taxes is included in the accompanying financial statements, as the Fund intends to distribute to shareholders all taxable investment income and realized gains and otherwise comply with Subchapter M of the Internal Revenue Code of 1986, as amended, applicable to regulated investment companies. The Fund evaluates tax positions taken (or expected to be taken) in the course of preparing the Fund’s tax returns to determine whether these positions meet a “more-likely-than-not” standard that, based on the technical merits, have a more than fifty percent likelihood of being sustained by a taxing authority upon examination. A tax position that meets the “more-likely-than-not” recognition threshold is measured to determine the amount of benefit to recognize in the financial statements.
ALPS Equal Sector Weight ETF
| Notes to Financial Statements | November 30, 2016 |
As of and during the year ended November 30, 2016, the Fund did not have a liability for any unrecognized tax benefits. The Fund files U.S. federal, state, and local tax returns as required. The Fund’s tax returns are subject to examination by the relevant tax authorities until expiration of the applicable statute of limitations, which is generally three years after the filing of the tax return, but may extend to four years in certain jurisdictions. Tax returns for open years have incorporated no uncertain tax positions that require a provision for income taxes.
3. INVESTMENT ADVISORY FEE AND OTHER AFFILIATED TRANSACTIONS
ALPS Advisors, Inc. (the “Adviser”) acts as the Fund’s investment adviser pursuant to an Advisory Agreement with the Trust on behalf of the Fund (the “Advisory Agreement”). Pursuant to the Advisory Agreement, the Fund pays the Adviser a unitary fee for the services and facilities it provides payable on a monthly basis at the annual rate of 0.37% of the Fund’s average daily net assets.
Effective April 1, 2016 the Adviser has agreed to waive 0.19% of its annual unitary fee payable by the Fund until at least March 31, 2017. This waiver may only be terminated by the Fund’s Board of Trustees prior to such date. Prior to April 1, 2016 the Adviser agreed to waive 0.19% of its annual unitary fee payable by the Fund through March 31, 2016.
ALPS Portfolio Solutions Distributor, Inc. (“APSD”) is both the distributor for the Fund as well as the Select Sector SPDR exchange traded funds (“Underlying Sector ETFs”) that the Fund invests in. As required by exemptive relief obtained by the Underlying Sector ETFs, the Adviser will reimburse the Fund an amount equal to the distribution fee received by APSD from the Underlying Sector ETFs attributable to the Fund’s investment in the Underlying Sector ETFs, for so long as APSD acts as the distributor to the Fund and the Underlying Sector ETFs. Such reimbursement is generally expected to equal 0.03% annually.
Out of the unitary management fee, the Adviser pays substantially all expenses of the Fund, including the cost of transfer agency, custody, fund administration, legal, audit, independent trustees and other services, except for acquired fund fees and expenses, interest expenses, distribution fees or expenses, brokerage expenses, taxes and extraordinary expenses not incurred in the ordinary course of the Fund’s business. The Adviser’s unitary management fee is designed to pay substantially all of the Fund’s expenses and to compensate the Adviser for providing services for the Fund.
ALPS Fund Services, Inc., an affiliate of the Adviser, is the administrator of the Fund.
Each Trustee who is not an officer or employee of the Adviser, any sub-adviser or any of their affiliates (“Independent Trustees”) receives (1) a quarterly retainer of $5,000, (2) a per meeting fee for regularly scheduled meetings of $3,750, (3) $1,500 for any special meeting held outside of a regularly scheduled board meeting, and (4) reimbursement for all reasonable out-of-pocket expenses relating to attendance at meetings.
4. PURCHASES AND SALES OF SECURITIES
For the year ended November 30, 2016, the cost of purchases and proceeds from sales of investment securities, excluding short-term investments and in-kind transactions, were as follows:
| Fund | | Purchases | | | Sales | |
| ALPS Equal Sector Weight ETF | | $ | 21,287,897 | | | $ | 18,060,391 | |
For the six months ended November 30, 2016 , the cost in-kind purchases and proceeds from in-kind sales were as follows:
| Fund | | Purchases | | | Sales | |
| ALPS Equal Sector Weight ETF | | $ | – | | | $ | 8,024,870 | |
For the year ended November 30, 2016, the ALPS Equal Sector Weight ETF had in-kind net realized gain of $2,259,267.
Gains on in-kind transactions are generally not considered taxable gains for federal income tax purposes.
ALPS Equal Sector Weight ETF
| Notes to Financial Statements | November 30, 2016 |
5. CAPITAL SHARE TRANSACTIONS
Shares are created and redeemed by the Fund only in Creation Unit size aggregations of 50,000 Shares. Only broker-dealers or large institutional investors with creation and redemption agreements called Authorized Participants (“AP”) are permitted to purchase or redeem Creation Units from the Fund. Such transactions are generally permitted on an in-kind basis, with a balancing cash component to equate the transaction to the NAV per unit of the Fund on the transaction date. Cash may be substituted equivalent to the value of certain securities generally when they are not available in sufficient quantity for delivery, not eligible for trading by the AP or as a result of other market circumstances.
ALPS Equal Sector Weight ETF
| Additional Information | November 30, 2016 (Unaudited) |
PROXY VOTING RECORDS, POLICIES AND PROCEDURES
Information regarding how the Fund voted proxies relating to portfolio securities during the most recent 12-month period ended June 30 and a description of the Fund’s proxy voting policies and procedures used in determining how to vote for proxies are available without charge on the Securities and Exchange Commission’s (“SEC”) website at www.sec.gov and upon request, by calling (toll-free) 1-866-675-2639.
PORTFOLIO HOLDINGS
The Trust is required to disclose, after its first and third fiscal quarters, the complete schedule of the Fund’s portfolio holdings with the SEC on Form N-Q. Forms N-Q for the Fund are available on the SEC’s website at www.sec.gov. The Fund’s Forms N-Q may also be reviewed and copied at the SEC’s Public Reference Room in Washington, D.C. and information on the operation of the Public Reference Room may be obtained by calling 1-800-SEC-0330. The Fund’s Forms N-Q are available without charge, upon request, by calling (toll-free) 1-866-675-2639 or by writing to ALPS ETF Trust at 1290 Broadway, Suite 1100, Denver, Colorado 80203.
TAX INFORMATION
The Fund designates the following for federal income tax purposes for distributions made during the calendar year ended December 31, 2015:
| | Qualified Dividend Income | Dividend Received Deduction |
| ALPS Equal Sector Weight ETF | 100.00% | 100.00% |
In early 2016, if applicable, shareholders of record received this information for the distributions paid to them by the Fund during the calendar year 2015 via Form 1099. The Fund will notify shareholders in early 2017 of amounts paid to them by the Fund, if any, during the calendar year 2016.
LICENSING AGREEMENT
Merrill Lynch, Pierce, Fenner & Smith Incorporated (“Merrill Lynch” or the “Licensor”) has entered into an index licensing agreement with ALPS Advisors Inc. (the “Advisor”) to allow the Advisor’s use of the Underlying Index of the ALPS Equal Sector Weight ETF (the “Fund”). The following disclosure relates to the Licensor:
The Fund is not issued, sponsored, endorsed, sold or promoted by Merrill Lynch or its affiliates (“Licensor”). Licensor makes no representation or warranty, express or implied, to the owners of the Fund or any member of the public regarding the advisability of investing in securities generally or in the Fund particularly or the ability of the Bank of America Securities Merrill Lynch Equal Sector Weight Index (“Index”) to track general market performance. Licensor’s only relationship to the Licensee is the licensing of the Index which is determined, composed and calculated by Licensor without regard to the Licensee or the Fund. Licensor has no obligation to take the needs of the Licensee or the owners of the Fund into consideration in determining, composing or calculating the Index. Licensor is not responsible for and has not participated in the determination of the timing of, prices at, or quantities of the Fund to be issued or in the determination or calculation of the equation by which the Fund is to be converted into cash. Licensor has no obligation or liability in connection with the issuance, administration, marketing or trading of the Fund.
LICENSOR DOES NOT GUARANTEE THE QUALITY, ACCURACY AND/OR THE COMPLETENESS OF THE INDEX OR ANY DATA INCLUDED THEREIN AND SHALL HAVE NO LIABILITY FOR ERRORS OR OMISSIONS OF ANY KIND RELATED TO THE INDEX OR DATA. LICENSOR MAKES NO WARRANTY, EXPRESS OR IMPLIED, AS TO RESULTS TO BE OBTAINED BY LICENSEE, OWNERS OF THE FUND, OR ANY OTHER PERSON OR ENTITY FROM THE USE OF THE INDEX OR ANY DATA INCLUDED THEREIN IN CONNECTION WITH THE RIGHTS LICENSED TO LICENSEE OR FOR ANY OTHER USE. LICENSOR MAKES NO EXPRESS OR IMPLIED WARRANTIES, AND HEREBY EXPRESSLY DISCLAIMS ALL WARRANTIES OF MERCHANTABILITY OR FITNESS FOR A PARTICULAR PURPOSE OR USE WITH RESPECT TO THE INDEX OR ANY DATA INCLUDED THEREIN. WITHOUT LIMITING ANY OF THE FOREGOING, IN NO EVENT SHALL LICENSOR HAVE ANY LIABILITY FOR ANY SPECIAL, PUNITIVE, INDIRECT, OR CONSEQUENTIAL DAMAGES (INCLUDING LOST PROFITS), EVEN IF NOTIFIED OF THE POSSIBILITY OF SUCH DAMAGES.
The Advisor does not guarantee the accuracy and/or the completeness of the Underlying Index or any data included therein, and the Advisor shall have no liability for any errors, omissions or interruptions therein. The Advisor makes no warranty, express or implied, as to results to be obtained by the Fund, owners of the Shares of the Fund or any other person or entity from the use of the Underlying Index or any data included therein. The Advisor makes no express or implied warranties, and expressly disclaims all warranties of merchantability or fitness for a particular purpose or use with respect to the Underlying Index or any data included therein. Without limiting any of the foregoing, in no event shall the Advisor have any liability for any special, punitive, direct, indirect or consequential damages (including lost profits) arising out of matters relating to the use of the Underlying Index even if notified of the possibility of such damages.
ALPS Equal Sector Weight ETF
Board Considerations Regarding Approval of
Investment Advisory Agreement | November 30, 2016 (Unaudited) |
At an in-person meeting held on June 6, 2016, the Board of Trustees of the Trust (the “Board” or the “Trustees”), including the Trustees who are not “interested persons” of the Trust within the meaning of the 1940 Act, as amended (the “Independent Trustees”), evaluated a proposal to approve the continuance of the Investment Advisory Agreement between the Trust and ALPS Advisors, Inc. (the “Adviser” or “AAI”) with respect to the ALPS Equal Sector Weight ETF (“EQL or “the Fund”). The Independent Trustees also met separately to consider the Investment Advisory Agreement.
In evaluating the Investment Advisory Agreement with respect to EQL, the Trustees considered various factors, including (i) the nature, extent and quality of the services provided by AAI with respect to the Fund under the Investment Advisory Agreement; (ii) the advisory fees and other expenses paid by the Fund compared to those of similar funds managed by other investment advisers; (iii) the costs of the services provided to the Fund by AAI and the profits realized by AAI and its affiliates from its relationship to the Fund; (iv) the extent to which economies of scale have been or would be realized if and as the assets of the Fund grow and whether fees reflect the economies of scale for the benefit of shareholders; and (v) any additional benefits and other considerations.
With respect to the nature, extent and quality of the services provided by AAI under the Investment Advisory Agreement, the Trustees considered and reviewed information concerning the services provided under the Investment Advisory Agreement, the investment parameters of the index of the Fund, financial information regarding AAI and its parent company, information describing AAI’s current organization and the background and experience of the persons responsible for the day-to-day management of the Fund.
The Trustees reviewed information on the performance of the Fund and its benchmark. The Trustees also evaluated the correlation and tracking error between the underlying index and the Fund’s performance. Based on their review, the Trustees found that the nature and extent of services provided to the Fund under the Investment Advisory Agreement was appropriate and that the quality was satisfactory.
The Trustees noted that the advisory fee for the Fund was a unitary fee pursuant to which AAI assumes all expenses of the Fund (including the cost of transfer agency, custody, fund administration, legal, audit and other services) other than the payments under the Advisory Agreement, brokerage expenses, taxes, interest, litigation expenses and other extraordinary expenses.
With respect to advisory fee rates, the Trustees noted the following:
The Fund’s net advisory fee rate was slightly below the median of its Broadridge expense group and the Fund’s expense ratio is at the median of its Broadridge expense group.
Based on the foregoing, and the other information available to them, the Trustees concluded that the advisory fee rate for the Fund was reasonable under the circumstances and in light of the quality of the services provided.
The Trustees considered other benefits available to AAI because of its relationship with the Fund and concluded that the advisory fees were reasonable taking into account any such benefits.
The Trustees also considered with respect to the Fund the information provided by AAI about the costs and profitability of AAI with respect to the Fund. The Trustees reviewed and noted the relatively small size of the Fund and concluded that AAI was not realizing any economies of scale. The Trustees determined that they would continue to evaluate whether further economies of scale have been achieved on an ongoing basis.
In voting to renew the Investment Advisory Agreement, the Trustees concluded that the terms of the Investment Advisory Agreement are reasonable and fair in light of the services to be performed, the fees paid by certain other funds, expenses to be incurred and such other matters as the Trustees considered relevant in the exercise of their reasonable business judgment. The Trustees did not identify any single factor or group of factors as all important or controlling and considered all factors together.
ALPS Equal Sector Weight ETF
| Trustees & Officers | November 30, 2016 (Unaudited) |
The general supervision of the duties performed by the Adviser for the Fund under the Investment Advisory Agreement is the responsibility of the Board of Trustees. The Trust currently has four Trustees. Three Trustees have no affiliation or business connection with the Adviser or any of its affiliated persons and do not own any stock or other securities issued by the Adviser. These are the “non-interested” or “independent” Trustees (“Independent Trustees”). The other Trustee (the “Interested Trustee”) is affiliated with the Adviser.
The Independent Trustees of the Trust, their term of office and length of time served, their principal business occupations during the past five years, the number of portfolios in the Fund Complex overseen by each Independent Trustee, and other directorships, if any, held by the Trustee are shown below.
INDEPENDENT TRUSTEES
| Name, Address & Year of Birth* | Position(s) Held with Trust | Term of Office and Length of Time Served** | Principal Occupation(s) During Past 5 Years | Number of Portfolios in Fund Complex Overseen by Trustees*** | Other Directorships Held by Trustees |
Mary K. Anstine,
1940 | Trustee | Since March 2008 | Ms. Anstine was President/Chief Executive Officer of HealthONE Alliance, Denver, Colorado, and former Executive Vice President of First Interstate Bank of Denver. Ms. Anstine is also Trustee/ Director of AV Hunter Trust and Colorado Uplift Board. Ms. Anstine was formerly a Director of the Trust Bank of Colorado (later purchased and now known as Northern Trust Bank), HealthONE and Denver Area Council of the Boy Scouts of America and a member of the American Bankers Association Trust Executive Committee. | 44 | Ms. Anstine is a Trustee of ALPS Variable Investment Trust (10 funds); Financial Investors Trust (31 funds); Reaves Utility Income Fund (1 fund); and Westcore Trust (14 funds). |
Jeremy W. Deems,
1976 | Trustee | Since March 2008 | Mr. Deems is the Co-Founder, Chief Compliance Officer and Chief Financial Officer of Green Alpha Advisors, LLC. Mr. Deems is Co-Portfolio Manager of the Shelton Green Alpha Fund. Prior to joining Green Alpha Advisors, Mr. Deems was CFO and Treasurer of Forward Management, LLC, ReFlow Management Co., LLC, ReFlow Fund, LLC, a private investment fund, and Sutton Place Management, LLC, an administrative services company. | 46 | Mr. Deems is a Trustee of ALPS Variable Investment Trust (10 funds); Financial Investors Trust (31 funds); and Reaves Utility Income Fund (1 fund); Clough Funds Trust (1 fund) and Elevation ETF Trust (2 fund). |
Rick A. Pederson,
1952 | Trustee | Since March 2008 | Mr. Pederson is President, Foundation Properties, Inc. (a real estate investment management company), 1994 - present; Advisory Board Member, Bow River Capital Partners (private equity management), 2003 - present; Advisor, The Pauls Corporation (real estate investment management and development), 2008 - present; Chairman, Ross Consulting Group (real estate consulting services) 1983 - 2013; Advisory Board Member, Neenan Company (construction services) 2002 - present; Board Member, Prosci Inc. (private business services) 2013 - 2016; Board Member, Citywide Banks (Colorado community bank) 2014 - present; Board Member, Strong-Bridge Consulting (management consulting) 2015 - present; Director, National Western Stock Show (not-for-profit organization); Director, Biennial of the Americas (not-for-profit-organization), 2012 - 2015; Board Member, History Colorado, 2015 - present. | 22 | Mr. Pederson is Trustee of Westcore Trust (14 funds) and Principal Real Estate Income Fund (1 fund). |
| * | The business address of the Trustee is c/o ALPS Advisors, Inc., 1290 Broadway, Suite 1100, Denver, Colorado 80203. |
| ** | This is the period for which the Trustee began serving the Trust. Each Trustee serves an indefinite term, until his successor is elected. |
| *** | The Fund Complex includes all series of the Trust and any other investment companies for which ALPS Advisors, Inc. provides investment advisory services. |
ALPS Equal Sector Weight ETF
| Trustees & Officers | November 30, 2016 (Unaudited) |
The Trustee who is affiliated with the Adviser or affiliates of the Adviser and executive officers of the Trust, his term of office and length of time served, his principal business occupations during the past five years, the number of portfolios in the Fund Complex overseen by the Interested Trustee and the other directorships, if any, held by the Trustee, are shown below.
INTERESTED TRUSTEE
| Name, Address and Year of Birth of Interested Trustee* | Position(s) Held with Trust | Term of Office and Length of Time Served** | Principal Occupation(s) During Past 5 Years | Number of Portfolios in Fund Complex Overseen by Trustees*** | Other Directorships Held by Trustees |
Thomas A. Carter,
1966 | Trustee and President | Since March 2008 | Mr. Carter joined ALPS Fund Services, Inc. (“ALPS”) in 1994 and is currently President and Director of ALPS Advisors, Inc. (“AAI”) and ALPS Portfolio Solutions Distributor, Inc. (“APSD”) and Executive Vice President and Director of ALPS and ALPS Holdings, Inc. (“AHI”) and ALPS Distributors, Inc. (“ADI”). Because of his position with AHI, ALPS, ADI, APSD and AAI, Mr. Carter is deemed an affiliate of the Fund as defined under the 1940 Act. Before joining ALPS, Mr. Carter was with Deloitte & Touche LLP, where he worked with a diverse group of clients, primarily within the financial services industry. Mr. Carter is a Certified Public Accountant and received his Bachelor of Science in Accounting from the University of Colorado at Boulder. | 33 | Mr. Carter is a Trustee of ALPS Variable Investment Trust (10 funds); Principal Real Estate Income Fund (1 fund); and RiverNorth Opportunities Fund, Inc. (1 fund). |
| * | The business address of the Trustee is c/o ALPS Advisors, Inc., 1290 Broadway, Suite 1100, Denver, Colorado 80203. |
| ** | This is the period for which the Trustee began serving the Trust. Each Trustee serves an indefinite term, until his successor is elected. |
| *** | The Fund Complex includes all series of the Trust and any other investment companies for which ALPS Advisors, Inc. provides investment advisory services. |
ALPS Equal Sector Weight ETF
| Trustees & Officers | November 30, 2016 (Unaudited) |
OFFICERS
| Name, Address and Year of Birth of Officer* | Position(s) Held with Trust | Length of Time Served** | Principal Occupation(s) During Past 5 Years |
Erin D. Nelson,
1977 | Chief Compliance Officer (“CCO”) | Since December 2015 | Erin Nelson became Senior Vice-President and Chief Compliance Officer of ALPS Advisors, Inc. (“AAI”) on July 1, 2015 and prior to that served as Vice President and Deputy Chief Compliance Officer of AAI since January 1, 2015. Prior to January 1, 2015, Ms. Nelson was Vice-President and Assistant General Counsel of ALPS Fund Services, Inc. Because of her position with AAI, Ms. Nelson is deemed an affiliate of the Trust as defined under the 1940 Act. Ms. Nelson is also the CCO of ALPS Variable Investment Trust, Liberty All-Star Growth Fund, Inc., Liberty All-Star Equity Fund, Principal Real Estate Income Fund, and RiverNorth Opportunities Fund, Inc. |
Patrick D. Buchanan,
1972 | Treasurer | Since June 2012 | Mr. Buchanan is Vice President of AAI. Mr. Buchanan joined ALPS in 2007 and because of his position with AAI, he is deemed an affiliate of the Trust as defined under the 1940 Act. Mr. Buchanan is also Treasurer of the ALPS Variable Insurance Trust, Principal Real Estate Income Fund, Clough Funds Trust and RiverNorth Opportunities Fund, Inc. |
Andrew P. Meloni,
1969 | Assistant Treasurer | Since December 2016 | Mr. Meloni is a Fund Controller for ALPS Fund Services, Inc. Mr. Meloni joined ALPS in 2007 and because of his position with ALPS, he is deemed an affiliate of the Fund as defined under the 1940 Act. Mr. Meloni is also Assistant Treasurer to the Liberty All-Star Equity Fund, Liberty All-Star Growth Fund, Inc., Principal Real Estate Income Fund, RiverNorth Opportunities Fund, Inc. and ALPS Variable Investment Trust. |
Abigail J. Murray,
1975 | Secretary | Since June 2015 | Ms. Murray joined ALPS in April 2015. She is currently Vice President and Senior Counsel of ALPS. Prior to joining ALPS, Ms. Murray was an Attorney and Managing Member at Murray & Rouvina PLC from 2014 to 2015 and an Associate with Vedder Price P.C. from 2007 to 2014. Ms. Murray is also the Secretary of Clough Global Allocation Fund, Clough Global Equity Fund, Clough Global Opportunities Fund, Clough Funds Trust, The Caldwell & Orkin Funds, Inc. and RiverNorth Opportunities Fund, Inc. and Assistant Secretary of Elevation ETF Trust and Principal Real Estate Income Fund. |
Andrea E. Kuchli,
1985 | Assistant Secretary | Since December 2015 | Ms. Kuchli joined ALPS in 2015 and is currently Vice President and Senior Counsel of ALPS. Prior to joining ALPS, Ms. Kuchli was an Associate with Davis Graham & Stubbs LLP from April 2014 to February 2015, and an Associate with Dechert LLP from 2011 to April 2014. Because of her position with ALPS, Ms. Kuchli is deemed an affiliate of the Trust as defined under the 1940 Act. Ms. Kuchli is also Secretary of Elevation ETF Trust and Principal Real Estate Income Fund as well as Assistant Secretary of the James Advantage Funds and RiverNorth Opportunities Fund, Inc. |
Sharon Akselrod,
1974 | Assistant Secretary | Since December 2016 | Ms. Akselrod joined ALPS in August 2014 and is currently Senior Investment Company Act Paralegal of ALPS Fund Services, Inc. Prior to joining ALPS, Ms. Akselrod served as Corporate Governance and Regulatory Associate for Nordstrom fsb (2013-2014) and Senior Legal Assistant – Legal Manager for AXA Equitable Life Insurance Company (2008-2013). Because of her position with ALPS, Ms. Akselrod is deemed an affiliate of the Trust as defined under the 1940 Act. Ms. Akselrod is also Assistant Secretary of Financial Investors Trust. |
| * | The business address of each Officer is c/o ALPS Advisors, Inc., 1290 Broadway, Suite 1100, Denver, Colorado 80203. |
| ** | This is the period for which the Officer began serving the Trust. Each Officer serves an indefinite term, until his/her successor is elected. |
The Statement of Additional Information includes additional information about the Fund's Trustees and is available, without charge, upon request by calling (toll-free) 1-866-675-2639.

| Performance Overview | 1 |
| Disclosure of Fund Expenses | 4 |
| Report of Independent Registered Public Accounting Firm | 5 |
| Schedule of Investments | 6 |
| Statement of Assets & Liabilities | 9 |
| Statement of Operations | 10 |
| Statements of Changes In Net Assets | 11 |
| Financial Highlights | 12 |
| Notes to Financial Statements | 13 |
| Additional Information | 19 |
| Board Considerations Regarding Approval of Investment Advisory Agreement | 20 |
| Trustees & Officers | 21 |
alpsfunds.com
ALPS Medical Breakthroughs ETF
Performance Overview | November 30, 2016 (Unaudited) |
Investment Objective
ALPS Medical Breakthroughs ETF (the “Fund”) employs a “passive management” – or indexing – investment approach designed to seek investment results that correspond (before fees and expenses) generally to the performance of the Poliwogg Medical Breakthroughs Index℠ (the “Underlying Index”).
The Underlying Index is comprised of small‐ and mid‐cap stocks of biotechnology and pharmaceutical companies that have one or more drugs in either Phase II or Phase III U.S. Food and Drug Administration ("FDA") clinical trials. In a Phase II trial, the drug is administered to a group of 100‐300 people to see if it is effective and to evaluate its safety. In a Phase III trial, the drug is given to a larger group, between 500‐3,000 people, to confirm its effectiveness, monitor side effects, compare it to commonly used treatments and collect information that will allow the drug or treatment to be used safely. Stocks selected for inclusion in the Underlying Index must be listed on a U.S. stock exchange. Underlying Index constituents must have a market capitalization of no less than $200 million and no more than $5 billion. Stocks included in the Underlying Index must also sustain an average daily trading volume in excess of $1 million for the 90‐day period preceding an Underlying Index reconstitution. Constituents must be able to sustain the monthly rates at which they use shareholder capital ("cash burn rates") for at least 24 months. The Underlying Index is reconstituted semi‐annually on the third Fridays of June and December.
Performance Overview
ALPS Medical Breakthroughs ETF (SBIO), for the one year period ended November 30, 2016, generated a total return of ‐25.04%, in‐line with Poliwogg Medical Breakthroughs Index℠ the Fund’s underlying index (“Underlying Index”), which returned ‐24.73%. The fund underperformed the broad market, as the S&P 500®returned 8.06%, and was also moderately outpaced by the Nasdaq Biotechnology Index (“NBI”), which lost 17.77% for the same period.
Looking at the macro environment of the biotechnology and pharmaceutical space, returns pulled back for the majority of the period on concerns over alleged pricing abuses in a small number of drugs, concerns over the greater impact of political policy and heightened regulation within the space, and collective macro concerns for the healthcare sector. The space rallied in November 2016 following the U.S. election on optimism over the level of regulation within the drug pricing market.
The Fund’s underperformance was driven by negative impacts from allocation effect, as its relative overweight allocations to mid and small‐cap stocks (average weights for the period of 42.16% vs. 11.74% and 52.60% vs. 16.18%, respectively, in NBI) detracted 7.07% from the Fund’s performance relative to its peer benchmark.
The best performing stocks in the Fund for the period were Exelixis Inc. (EXEL), which increased 122.63% and XBiotech Inc. (XBIT), which saw a gain of 113.92%. Ionis Pharmaceuticals Inc. (IONS), which rose 94.84%, and Eagle Pharmaceuticals Inc. (EGRX), which climbed 76.37%, were other top performers. The largest detractors were Pronai Therapeutics Inc. (DNAI), which decreased 90.88%, Chimerix Inc. (CMRX), which fell 87.90%, and Chiasma Inc. (CHMA), which lost 87.08%.
Due to the high failure rate of companies within the space, the non‐traditional metrics used to evaluate biotech companies, volatility, and specialized knowledge required to succeed in the space, biotechnology is a difficult industry for stock pickers. This environment makes a passive strategy attractive, as it provides a diversified, rules‐ based access vehicle for those looking to gain exposure to the biotechnology space, while seeking to reduce single stock risk. SBIO and its Underlying Index focus on innovation, seeking to capture research and development opportunities in the biotechnology and pharmaceutical industries. Looking forward we believe the Fund’s strategy of providing exposure to small‐ and mid‐cap biotechnology and pharmaceutical companies that have one or more drugs in either Phase II or Phase III FDA clinical trials can provide potential alpha and pure‐play exposure to the biotech space.
ALPS Medical Breakthroughs ETF
Performance Overview | November 30, 2016 (Unaudited) |
Growth Of $10,000 (as of November 30, 2016)
Comparison of change in value of a $10,000 investment in the Fund and the Index
The chart above represents historical performance of a hypothetical investment of $10,000 in the Fund over the life of the Fund. Performance calculations are as of the end of each month. Past performance does not guarantee future results. This chart does not reflect the deduction of taxes that a shareholder would pay on Fund distributions or the redemption of Fund shares.
Fund Performance (as of November 30, 2016)
| | 1 Year | Since Inception^ |
| ALPS Medical Breakthroughs ETF ‐ NAV | ‐25.04% | ‐1.02% |
| ALPS Medical Breakthroughs ETF ‐ Market Price* | ‐25.04% | -1.02% |
| Poliwogg Medical Breakthroughs Total Return Index | ‐24.73% | ‐0.56% |
| NASDAQ Biotechnology Total Return Index | ‐17.77% | ‐5.03% |
Total Expense Ratio (per the current prospectus) 0.50%
Performance data quoted represents past performance. Past performance does not guarantee future results. Investment return and principal value of an investment will fluctuate so that an investor’s shares, when sold or redeemed, may be worth more or less than the original cost. Current performance data may be higher or lower than actual data quoted. For most current month-end performance data please visit www.alpsfunds.com or call 1.844.234.5852.
NAV is an exchange-traded fund’s per-share value. The per-share dollar amount of the fund is derived by dividing the total value of all the securities in its portfolio, less any liabilities, by the number of fund shares outstanding. Market Price is the price at which a share can currently be traded in the market. Information detailing the number of days the Market Price of the Fund was greater than the Fund’s NAV and the number of days it was less than the Fund’s NAV can be obtained at www.alpsfunds.com.
| ^ | The Fund commenced investment operations on December 31, 2014. |
| * | Market Price is based on the midpoint of the bid-ask spread at 4 p.m. ET and does not represent the returns an investor would receive if shares were traded at other times. |
ALPS Medical Breakthroughs ETF
Performance Overview | November 30, 2016 (Unaudited) |
NASDAQ Biotechnology Total Return Index (Ticker: NBI) is a modified market capitalization-weighted index designed to measure the performance of the all NASDAQ stocks in the biotechnology sector. Total return assumes reinvestment of any dividends and distributions realized during a given time period.
Poliwogg Medical Breakthroughs Total Return Index is designed to capture research and development opportunities in the pharmaceutical industry. PMBI consists of small-cap and mid-cap pharmaceutical and biotechnology stocks listed on U.S. stock exchanges that have one or more drugs in either Phase II or Phase III U.S. FDA clinical trials. Total return assumes reinvestment of any dividends and distributions realized during a given time period.
One cannot invest directly in an index. Index performance does not reflect fund performance.
Companies in the pharmaceuticals and biotechnology industry may be subject to extensive litigation based on product liability and similar claims. Legislation introduced or considered by certain governments on such industries or on the healthcare sector cannot be predicted.
Companies in the pharmaceuticals industry are subject to competitive forces that may make it difficult to raise prices and, in fact, may result in price discounting. The profitability of some companies in the pharmaceuticals industry may be dependent on a relatively limited number of products. In addition, their products can become obsolete due to industry innovation, changes in technologies or other market developments. Many new products in the pharmaceuticals industry are subject to government approvals, regulation and reimbursement rates. The process of obtaining government approvals may be long and costly. Many companies in the pharmaceuticals industry are heavily dependent on patents and intellectual property rights. The loss or impairment of these rights may adversely affect the profitability of these companies.
The development of new drugs generally has a high failure rate, and such failures may negatively impact the stock price of the company developing the failed drug. Biotechnology companies may have persistent losses during a new product’s transition from development to production. In order to fund operations, biotechnology companies may require financing from the capital markets, which may not always be available on satisfactory terms or at all.
The Fund’s shares are not individually redeemable. Investors buy and sell shares of the Fund on a secondary market. Only market makers or “authorized participants” may trade directly with the Fund, typically in blocks of 50,000 shares.
The ALPS Medical Breakthroughs ETF is not suitable for all investors. Investments in the Fund are subject to investment risks, including possible loss of the principal amount invested.
ALPS Portfolio Solutions Distributor, Inc., a FINRA member, is the Distributor for the ALPS Medical Breakthroughs ETF.
ALPS Portfolio Solutions Distributor, Inc. is not affiliated with S-Network Global Indexes, Inc.
Top Ten Holdings* (as of November 30, 2016) | |
| | |
| Ionis Pharmaceuticals, Inc. | 5.41% |
| Neurocrine Biosciences, Inc. | 4.12% |
| Exelixis, Inc. | 3.99% |
| Endo International Plc | 3.65% |
| ACADIA Pharmaceuticals, Inc. | 3.31% |
| Horizon Pharma Plc | 3.26% |
| Ultragenyx Pharmaceutical, Inc. | 3.16% |
| Catalent, Inc. | 3.05% |
| Galapagos NV, Sponsored ADR | 2.79% |
| Akorn, Inc. | 2.74% |
| Total % of Top 10 Holdings | 35.48% |
Future holdings are subject to change.
Sector Allocation* (as of November 30, 2016)
ALPS Medical Breakthroughs ETF
| Disclosure of Fund Expenses | November 30, 2016 (Unaudited) |
Shareholder Expense Example: As a shareholder of the Fund, you incur two types of costs: (1) transaction costs which may include creation and redemption fees or brokerage charges, and (2) ongoing costs, including management fees and other Fund expenses. These examples are intended to help you understand your ongoing costs (in dollars) of investing in the Fund and to compare these costs with the ongoing costs of investing in other funds. It is based on an investment of $1,000 invested at the beginning of the (six month) period and held through November 30, 2016.
Actual Return: The first line of the table provides information about actual account values and actual expenses. You may use the information in this line, together with the amount you invested, to estimate the expenses that you incurred over the period. Simply divide your account value by $1,000 (for example, an $8,600 account value divided by $1,000 = 8.6), then multiply the result by the number in the first line under the heading entitled “Expenses Paid During Period” to estimate the expenses attributable to your investment during this period.
Hypothetical 5% Return: The second line of the table provides information about hypothetical account values and hypothetical expenses based on the Fund’s actual expense ratio and an assumed rate of return of 5% per year before expenses, which is not the Fund’s actual return. The hypothetical account values and expenses may not be used to estimate the actual ending account balance or expenses you paid for the period. You may use this information to compare ongoing costs of investing in the Fund and other funds. To do so, compare this 5% hypothetical example with the 5% hypothetical examples that appear in the shareholder reports of the other funds.
The expenses shown in the table are meant to highlight ongoing Fund costs only and do not reflect any transaction costs, such as creation and redemption fees, or brokerage charges. Therefore, the second line is useful in comparing ongoing costs only, and will not help you determine the relative total costs of owning different funds. In addition, if these costs were included, your costs would have been higher.
| | Beginning Account Value 6/1/16 | Ending Account Value 11/30/16 | Expense Ratio(a) | Expenses Paid During Period 6/1/16 - 11/30/16(b) |
| ALPS Medical Breakthroughs ETF | | | | |
| Actual | $1,000.00 | $952.30 | 0.50% | $2.44 |
| Hypothetical (5% return before expenses) | $1,000.00 | $1,022.50 | 0.50% | $2.53 |
(a) | Annualized, based on the Fund's most recent fiscal half year expenses. |
(b) | Expenses are equal to the Fund's annualized expense ratio multiplied by the average account value over the period, multiplied by the number of days in the most recent fiscal half year (183), divided by 366. |
ALPS Medical Breakthroughs ETF
| Report of Independent Registered Public Accounting Firm | |
To the Board of Trustees and Shareholders of ALPS ETF Trust:
We have audited the accompanying statement of assets and liabilities, including the schedule of investments, of ALPS Medical Breakthroughs ETF, one of the portfolios constituting the ALPS ETF Trust (the “Trust”), as of November 30, 2016, and the related statement of operations for the year then ended, and the statements of changes in net assets and the financial highlights for the year then ended and for the period December 31, 2014 (commencement of operations) to November 30, 2015. These financial statements and financial highlights are the responsibility of the Trust’s management. Our responsibility is to express an opinion on these financial statements and financial highlights based on our audits.
We conducted our audits in accordance with the standards of the Public Company Accounting Oversight Board (United States). Those standards require that we plan and perform the audit to obtain reasonable assurance about whether the financial statements and financial highlights are free of material misstatement. The Trust is not required to have, nor were we engaged to perform, an audit of its internal control over financial reporting. Our audits included consideration of internal control over financial reporting as a basis for designing audit procedures that are appropriate in the circumstances, but not for the purpose of expressing an opinion on the effectiveness of the Trust’s internal control over financial reporting. Accordingly, we express no such opinion. An audit also includes examining, on a test basis, evidence supporting the amounts and disclosures in the financial statements, assessing the accounting principles used and significant estimates made by management, as well as evaluating the overall financial statement presentation. Our procedures included confirmation of securities owned as of November 30, 2016, by correspondence with the custodian. We believe that our audits provide a reasonable basis for our opinion.
In our opinion, the financial statements and financial highlights referred to above present fairly, in all material respects, the financial position of ALPS Medical Breakthroughs ETF of the ALPS ETF Trust as of November 30, 2016, the results of its operations for the year then ended, and the changes in its net assets and the financial highlights for the year then ended and for the period December 31, 2014 (commencement of operations) to November 30, 2015, in conformity with accounting principles generally accepted in the United States of America.
DELOITTE & TOUCHE LLP
Denver, Colorado
January 27, 2017
ALPS Medical Breakthroughs ETF
| Schedule of Investments | November 30, 2016 |
| Security Description | | Shares | | | Value | |
| COMMON STOCKS (99.97%) | | | | | | |
| Biotechnology (59.94%) | | | | | | |
ACADIA Pharmaceuticals, Inc.(a)(b) | | | 144,933 | | | $ | 3,911,742 | |
Acceleron Pharma, Inc.(b) | | | 45,505 | | | | 1,533,063 | |
Achillion Pharmaceuticals, Inc.(b) | | | 165,430 | | | | 684,880 | |
Acorda Therapeutics, Inc.(b) | | | 55,842 | | | | 1,161,514 | |
Adamas Pharmaceuticals, Inc.(a)(b) | | | 26,330 | | | | 394,950 | |
Aduro Biotech, Inc.(a)(b) | | | 78,298 | | | | 892,597 | |
Advanced Accelerator Applications SA, ADR(b) | | | 47,540 | | | | 1,390,545 | |
Akebia Therapeutics, Inc.(b) | | | 45,646 | | | | 393,012 | |
Alder Biopharmaceuticals, Inc.(b) | | | 60,740 | | | | 1,430,427 | |
AMAG Pharmaceuticals, Inc.(b) | | | 41,336 | | | | 1,372,355 | |
Applied Genetic Technologies Corp.(b) | | | 21,657 | | | | 199,244 | |
Ardelyx, Inc.(a)(b) | | | 57,187 | | | | 846,368 | |
Atara Biotherapeutics, Inc.(b) | | | 34,593 | | | | 686,671 | |
Bluebird Bio, Inc.(a)(b) | | | 44,987 | | | | 2,714,966 | |
Celldex Therapeutics, Inc.(a)(b) | | | 120,727 | | | | 459,970 | |
Chimerix, Inc.(b) | | | 55,488 | | | | 271,336 | |
Clovis Oncology, Inc.(a)(b) | | | 46,599 | | | | 1,596,948 | |
Emergent BioSolutions, Inc.(b) | | | 48,967 | | | | 1,310,357 | |
Enanta Pharmaceuticals, Inc.(b) | | | 22,858 | | | | 718,656 | |
Epizyme, Inc.(b) | | | 70,147 | | | | 778,632 | |
Exelixis, Inc.(b) | | | 278,773 | | | | 4,716,839 | |
FibroGen, Inc.(b) | | | 75,996 | | | | 1,683,311 | |
Five Prime Therapeutics, Inc.(b) | | | 34,306 | | | | 1,973,281 | |
Halozyme Therapeutics, Inc.(b) | | | 156,635 | | | | 1,849,859 | |
Infinity Pharmaceuticals, Inc.(b) | | | 59,545 | | | | 69,072 | |
Insmed, Inc.(b) | | | 74,893 | | | | 1,022,289 | |
Intercept Pharmaceuticals, Inc.(a)(b) | | | 29,927 | | | | 3,026,218 | |
Ionis Pharmaceuticals, Inc.(b) | | | 146,354 | | | | 6,404,451 | |
Juno Therapeutics, Inc.(a)(b) | | | 128,030 | | | | 2,567,002 | |
Kite Pharma, Inc.(a)(b) | | | 60,027 | | | | 3,057,175 | |
Ligand Pharmaceuticals, Inc.(b) | | | 25,239 | | | | 2,634,952 | |
Loxo Oncology, Inc.(a)(b) | | | 26,010 | | | | 716,836 | |
MacroGenics, Inc.(b) | | | 42,039 | | | | 1,090,071 | |
Neurocrine Biosciences, Inc.(b) | | | 105,001 | | | | 4,877,296 | |
OncoMed Pharmaceuticals, Inc.(b) | | | 43,089 | | | | 365,826 | |
Ophthotech Corp.(b) | | | 43,077 | | | | 1,320,310 | |
Otonomy, Inc.(b) | | | 36,222 | | | | 615,774 | |
| PDL BioPharma, Inc. | | | 200,363 | | | | 438,795 | |
Portola Pharmaceuticals, Inc.(b) | | | 68,384 | | | | 1,230,228 | |
Pronai Therapeutics, Inc.(a)(b) | | | 36,230 | | | | 48,186 | |
PTC Therapeutics, Inc.(a)(b) | | | 41,122 | | | | 458,099 | |
Sage Therapeutics, Inc.(b) | | | 38,846 | | | | 1,946,573 | |
Spark Therapeutics, Inc.(a)(b) | | | 37,062 | | | | 2,038,781 | |
Syndax Pharmaceuticals, Inc.(b) | | | 21,349 | | | | 206,658 | |
Ultragenyx Pharmaceutical, Inc.(a)(b) | | | 47,731 | | | | 3,736,860 | |
Zafgen, Inc.(b) | | | 32,814 | | | | 110,911 | |
| Total Biotechnology | | | | | | | 70,953,886 | |
| | | | | | | | | |
| Pharmaceuticals (40.03%) | | | | | | | | |
Aerie Pharmaceuticals, Inc.(b) | | | 33,761 | | | | 1,254,221 | |
Agios Pharmaceuticals, Inc.(a)(b) | | | 46,048 | | | | 2,680,454 | |
Aimmune Therapeutics, Inc.(a)(b) | | | 51,141 | | | | 1,160,901 | |
Akorn, Inc.(b) | | | 152,539 | | | | 3,236,878 | |
ALPS Medical Breakthroughs ETF
| Schedule of Investments | November 30, 2016 |
| Security Description | | Shares | | | Value | |
| Pharmaceuticals (40.03%) (continued) | | | | | | |
Aralez Pharmaceuticals, Inc.(b) | | | 76,798 | | | $ | 390,134 | |
Axovant Sciences, Ltd.(a)(b) | | | 120,018 | | | | 1,623,844 | |
Catalent, Inc.(b) | | | 150,981 | | | | 3,612,975 | |
Concert Pharmaceuticals, Inc.(b) | | | 26,688 | | | | 241,260 | |
DBV Technologies SA, Sponsored ADR(b) | | | 58,349 | | | | 2,130,905 | |
Depomed, Inc.(b) | | | 74,273 | | | | 1,418,614 | |
Eagle Pharmaceuticals, Inc.(a)(b) | | | 18,925 | | | | 1,494,318 | |
Endo International Plc(b) | | | 269,624 | | | | 4,316,680 | |
Flexion Therapeutics, Inc.(b) | | | 33,309 | | | | 549,598 | |
Galapagos NV, Sponsored ADR(b) | | | 55,810 | | | | 3,299,487 | |
Horizon Pharma Plc(b) | | | 194,751 | | | | 3,856,070 | |
Immune Design Corp.(b) | | | 24,226 | | | | 178,061 | |
Impax Laboratories, Inc.(b) | | | 89,394 | | | | 1,291,743 | |
Inotek Pharmaceuticals Corp.(a)(b) | | | 32,334 | | | | 206,938 | |
Ironwood Pharmaceuticals, Inc.(b) | | | 157,262 | | | | 2,454,074 | |
Lannett Co., Inc.(a)(b) | | | 44,650 | | | | 1,022,485 | |
MediciNova, Inc.(a)(b) | | | 41,388 | | | | 292,613 | |
Neuroderm, Ltd.(b) | | | 25,996 | | | | 423,735 | |
Ocular Therapeutix, Inc.(a)(b) | | | 29,801 | | | | 276,851 | |
Pacira Pharmaceuticals, Inc.(b) | | | 45,121 | | | | 1,437,104 | |
Radius Health, Inc.(b) | | | 52,146 | | | | 2,775,210 | |
Regulus Therapeutics, Inc.(a)(b) | | | 63,425 | | | | 155,391 | |
Revance Therapeutics, Inc.(a)(b) | | | 34,201 | | | | 572,867 | |
SciClone Pharmaceuticals, Inc.(b) | | | 59,961 | | | | 596,612 | |
Seres Therapeutics, Inc.(a)(b) | | | 48,362 | | | | 483,136 | |
Sucampo Pharmaceuticals, Inc., Class A(b) | | | 55,459 | | | | 901,209 | |
Supernus Pharmaceuticals, Inc.(b) | | | 59,922 | | | | 1,291,319 | |
TherapeuticsMD, Inc.(a)(b) | | | 237,821 | | | | 1,412,657 | |
Trevena, Inc.(b) | | | 62,654 | | | | 343,344 | |
| Total Pharmaceuticals | | | | | | | 47,381,688 | |
| | | | | | | | | |
TOTAL COMMON STOCKS (Cost $151,238,977) | | | | | | | 118,335,574 | |
| | | | | | | | | |
RIGHTS (0.00%)(c) | | | | | | | | |
Biotechnology (0.00%)(c) | | | | | | | | |
Dyax Corp. - CVR (Expiring 12/31/2019)(b) | | | 170,016 | | | | 1,700 | |
Prosensa Holding NV - CVR (Expiring 02/15/2017)(b) | | | 3,423 | | | | 3,081 | |
| Total Biotechnology | | | | | | | 4,781 | |
| | | | | | | | | |
TOTAL RIGHTS (Cost $3,697) | | | | | | | 4,781 | |
| | | 7 Day Yield | | | Shares | | | Value | |
| SHORT TERM INVESTMENTS (12.98%) | | | | | | | | | |
| Money Market Fund (0.06%) | | | | | | | | | |
| State Street Institutional Treasury Plus Money Market Fund (Cost $65,768) | | | 0.259 | % | | | 65,768 | | | | 65,768 | |
| | | | | | | | | | | | | |
| Investments Purchased with Collateral from Securities Loaned (12.92%) | | | | | | | | | | | | |
| State Street Navigator Securities Lending Prime Portfolio, 0.26% (Cost $15,293,632) | | | | | | | 15,293,632 | | | | 15,293,632 | |
ALPS Medical Breakthroughs ETF
| Schedule of Investments | November 30, 2016 |
| | | Value | |
| | | | |
TOTAL SHORT TERM INVESTMENTS (Cost $15,359,400) | | $ | 15,359,400 | |
| | | | | |
TOTAL INVESTMENTS (112.95%) (Cost $166,602,074) | | $ | 133,699,755 | |
| | | | | |
| NET LIABILITIES LESS OTHER ASSETS (-12.95%) | | | (15,329,845 | ) |
| | | | | |
| NET ASSETS (100.00%) | | $ | 118,369,909 | |
(a) | Security, or a portion of the security position, is currently on loan. The total market value of securities on loan is $21,723,246. |
(b) | Non-income producing security. |
(c) | Less than 0.005% of Net Assets. |
See Notes to Financial Statements.
ALPS Medical Breakthroughs ETF
| Statement of Assets and Liabilities | November 30, 2016 |
| ASSETS: | | | |
| Investments, at value | | $ | 133,699,755 | |
| Dividends receivable | | | 12,801 | |
| Total Assets | | | 133,712,556 | |
| | | | | |
| LIABILITIES: | | | | |
| Payable to adviser | | | 49,015 | |
| Payable for collateral upon return of securities loaned | | | 15,293,632 | |
| Total Liabilities | | | 15,342,647 | |
| NET ASSETS | | $ | 118,369,909 | |
| | | | | |
| NET ASSETS CONSIST OF: | | | | |
| Paid-in capital | | $ | 180,593,589 | |
| Accumulated net investment loss | | | (510,556 | ) |
| Accumulated net realized loss | | | (28,810,805 | ) |
| Net unrealized depreciation | | | (32,902,319 | ) |
| NET ASSETS | | $ | 118,369,909 | |
| | | | | |
| INVESTMENTS, AT COST | | $ | 166,602,074 | |
| | | | | |
| PRICING OF SHARES | | | | |
| Net Assets | | $ | 118,369,909 | |
| Shares of beneficial interest outstanding (Unlimited number of shares authorized, par value $0.01 per share) | | | 4,900,000 | |
| Net Asset Value, offering and redemption price per share | | $ | 24.16 | |
See Notes to Financial Statements.
ALPS Medical Breakthroughs ETF
| Statement of Operations | For the Year Ended November 30, 2016 |
| INVESTMENT INCOME: | | | |
| Dividends | | $ | 62,260 | |
| Securities Lending Income | | | 87,049 | |
| Total Investment Income | | | 149,309 | |
| | | | | |
| EXPENSES: | | | | |
| Investment adviser fees | | | 629,356 | |
| Total Expenses | | | 629,356 | |
| NET INVESTMENT LOSS | | | (480,047 | ) |
| | | | | |
| REALIZED AND UNREALIZED LOSS | | | | |
| Net realized loss on investments | | | (30,798,551 | ) |
| Net change in unrealized depreciation on investments | | | (12,050,766 | ) |
NET REALIZED AND UNREALIZED LOSS ON INVESTMENTS | | | (42,849,317 | ) |
| NET DECREASE IN NET ASSETS RESULTING FROM OPERATIONS | | $ | (43,329,364 | ) |
See Notes to Financial Statements.
ALPS Medical Breakthroughs ETF
Statements of Changes in Net Assets
| | | For the Year Ended November 30, 2016 | | | For the Period December 31, 2014 (Commencement of Operations) to November 30, 2015(a) | |
| OPERATIONS: | | | | | | |
| Net investment loss | | $ | (480,047 | ) | | $ | (392,292 | ) |
Net realized gain/(loss)(a) | | | (30,798,551 | ) | | | 11,016,697 | |
Net change in unrealized depreciation(a) | | | (12,050,766 | ) | | | (20,851,553 | ) |
| Net decrease in net assets resulting from operations | | | (43,329,364 | ) | | | (10,227,148 | ) |
| | | | | | | | | |
| CAPITAL SHARE TRANSACTIONS: | | | | | | | | |
| Proceeds from sale of shares | | | 38,083,584 | | | | 233,745,688 | |
| Cost of shares redeemed | | | (47,208,086 | ) | | | (52,694,765 | ) |
| Net increase/(decrease) from capital share transactions | | | (9,124,502 | ) | | | 181,050,923 | |
| Net increase/(decrease) in net assets | | | (52,453,866 | ) | | | 170,823,775 | |
| | | | | | | | | |
| NET ASSETS: | | | | | | | | |
| Beginning of year | | | 170,823,775 | | | | – | |
| End of year * | | $ | 118,369,909 | | | $ | 170,823,775 | |
| | | | | | | | | |
| *Including accumulated net investment loss of: | | $ | (510,556 | ) | | $ | (392,292 | ) |
| | | | | | | | | |
| OTHER INFORMATION: | | | | | | | | |
| CAPITAL SHARE TRANSACTIONS: | | | | | | | | |
| Beginning shares | | | 5,300,000 | | | | – | |
| Shares sold | | | 1,550,000 | | | | 6,900,002 | |
| Shares redeemed | | | (1,950,000 | ) | | | (1,600,002 | ) |
| Shares outstanding, end of period | | | 4,900,000 | | | | 5,300,000 | |
(a) | Prior to November 30, 2016, the Fund presented realized gain/loss and unrealized appreciation/depreciation by investment type. This change in presentation was made to conform to industry standards and had no effect on the Fund's change in net assets. |
See Notes to Financial Statements.
ALPS Medical Breakthroughs ETF
| Financial Highlights | For a Share Outstanding Throughout the Periods Presented |
| | | For the Year Ended November 30, 2016 | | | For the Period December 31, 2014 (Commencement of Operations) to November 30, 2015 | |
| NET ASSET VALUE, BEGINNING OF PERIOD | | $ | 32.23 | | | $ | 24.64 | |
| | | | | | | | | |
| INCOME/(LOSS) FROM INVESTMENT OPERATIONS: | | | | | | | | |
Net investment loss (a) | | | (0.09 | ) | | | (0.13 | ) |
| Net realized and unrealized gain/(loss) | | | (7.98 | ) | | | 7.72 | |
| Total from investment operations | | | (8.07 | ) | | | 7.59 | |
| | | | | | | | | |
| Net increase/(decrease) in net asset value | | | (8.07 | ) | | | 7.59 | |
| NET ASSET VALUE, END OF PERIOD | | $ | 24.16 | | | $ | 32.23 | |
TOTAL RETURN(b) | | | (25.04 | )% | | | 30.80 | % |
| | | | | | | | | |
| RATIOS/SUPPLEMENTAL DATA: | | | | | | | | |
| Net assets, end of period (000s) | | $ | 118,370 | | | $ | 170,824 | |
| | | | | | | | | |
| Ratio of expenses to average net assets | | | 0.50 | % | | | 0.50 | %(c) |
| Ratio of net investment loss to average net assets | | | (0.38 | )% | | | (0.42 | )%(c) |
Portfolio turnover rate(d) | | | 62 | % | | | 25 | % |
(a) | Based on average shares outstanding during the period. |
(b) | Total return is calculated assuming an initial investment made at the net asset value at the beginning of the period and redemption at the net asset value on the last day of the period and assuming all distributions are reinvested at reinvestment prices. Total return calculated for a period of less than one year is not annualized. |
(d) | Portfolio turnover for periods less than one year are not annualized and does not include securities received or delivered from processing creations or redemptions in-kind. |
See Notes to Financial Statements.
ALPS Medical Breakthroughs ETF
| Notes to Financial Statements | November 30, 2016 |
1. ORGANIZATION
The ALPS ETF Trust (the “Trust”), a Delaware statutory trust, is an open-end management investment company registered under the Investment Company Act of 1940, as amended (the “1940 Act”). As of November 30, 2016, the Trust consisted of nineteen separate portfolios. Each portfolio represents a separate series of the Trust. This report pertains solely to the ALPS Medical Breakthroughs ETF (the “Fund”). The investment objective of the Fund is to seek investment results that correspond generally, before fees and expenses, to the performance of the Poliwogg Medical Breakthroughs IndexSM(the “Underlying Index”). The Fund is considered non-diversified and may invest a greater portion of assets in securities of individual issuers than a diversified fund. As a result, changes in the market value of a single investment could cause greater fluctuations in share price than would occur in a diversified fund.
The Fund’s Shares (“Shares”) are listed on the New York Stock Exchange (“NYSE”) Arca. The Fund issues and redeems Shares at net asset value (“NAV”) in blocks of 50,000 Shares, each of which is called a “Creation Unit”. Creation Units are issued and redeemed principally in-kind for securities included in the Underlying Index. Except when aggregated in Creation Units, Shares are not redeemable securities of the Fund.
Pursuant to the Trust’s organizational documents, its Officers and Trustees are indemnified against certain liability arising out of the performance of their duties to the Trust. Additionally, in the normal course of business, the Trust enters into contracts with service providers that contain general indemnification clauses. The Trust’s maximum exposure under these arrangements is unknown, as this would involve future claims that may be made against the Trust that have not yet occurred.
2. SIGNIFICANT ACCOUNTING POLICIES
The following is a summary of significant accounting policies consistently followed by the Fund in the preparation of the financial statements. The accompanying financial statements were prepared in accordance with accounting principles generally accepted in the United States of America (“U.S. GAAP”). The preparation of financial statements in conformity with U.S. GAAP requires management to make certain estimates and assumptions that affect the reported amounts of assets and liabilities and disclosures of contingent assets and liabilities at the date of the financial statements and the reported amounts of revenue and expenses during the period. Actual results could differ from those estimates. The Fund is considered an investment company under U.S. GAAP and follows the accounting and reporting guidance applicable to investment companies in the Financial Accounting Standards Board Accounting Standards Codification Topic 946.
A. Portfolio Valuation
The Fund’s NAV is determined daily, as of the close of regular trading on the NYSE, normally 4:00 p.m. Eastern time, on each day the NYSE is open for trading. The NAV is computed by dividing the value of all assets of the Fund (including accrued interest and dividends), less all liabilities (including accrued expenses and dividends declared but unpaid), by the total number of shares outstanding.
Portfolio securities listed on any exchange other than the NASDAQ Stock Market LLC (“NASDAQ”) are valued at the last sale price on the business day as of which such value is being determined. If there has been no sale on such day, the securities are valued at the mean of the most recent bid and ask prices on such day. Securities traded on the NASDAQ are valued at the NASDAQ Official Closing Price as determined by NASDAQ. Portfolio securities traded on more than one securities exchange are valued at the last sale price on the business day as of which such value is being determined at the close of the exchange representing the principal market for such securities. Portfolio securities traded in the over-the-counter market, but excluding securities traded on the NASDAQ, are valued at the last quoted sale price in such market.
The Fund’s investments are valued at market value or, in the absence of market value with respect to any portfolio securities, at fair value according to procedures adopted by the Trust’s Board of Trustees (the “Board”). When market quotations are not readily available or when events occur that make established valuation methods unreliable, securities of the Fund may be valued in good faith by or under the direction of the Board. These securities generally include, but are not limited to, restricted securities (securities which may not be publicly sold without registration under the Securities Act of 1933) for which a pricing service is unable to provide a market price; securities whose trading has been formally suspended; a security whose market price is not available from a pre-established primary pricing source or the pricing source is not willing to provide a price; a security with respect to which an event has occurred that is most likely to materially affect the value of the security after the market has closed but before the calculation of the Fund’s NAV or make it difficult or impossible to obtain a reliable market quotation; or a security whose price, as provided by the pricing service, does not reflect the security’s “fair value” due to the security being de-listed from a national exchange or the security’s primary trading market is temporarily closed at a time when, under normal conditions, it would be open. As a general principle, the current “fair value” of a security would be the amount which the owner might reasonably expect to receive from the sale on the applicable exchange or principal market. A variety of factors may be considered in determining the fair value of such securities.
ALPS Medical Breakthroughs ETF
| Notes to Financial Statements | November 30, 2016 |
B. Fair Value Measurements
The Fund discloses the classification of its fair value measurements following a three-tier hierarchy based on the inputs used to measure fair value. Inputs refer broadly to the assumptions that market participants would use in pricing the asset or liability; including assumptions about risk. Inputs may be observable or unobservable. Observable inputs reflect the assumptions market participants would use in pricing the asset or liability that are developed based on market data obtained from sources independent of the reporting entity. Unobservable inputs reflect the reporting entity’s own assumptions about the assumptions market participants would use in pricing the asset or liability that are developed based on the best information available.
Valuation techniques used to value the Fund's investments by major category are as follows:
Equity securities, including restricted securities, for which market quotations are readily available, are valued at the last reported sale price or official closing price as reported by a third party pricing vendor on the primary market or exchange on which they are traded and are categorized as Level 1 in the hierarchy. In the event there were no sales during the day or closing prices are not available, securities are valued at the mean of the most recent quoted bid and ask prices on such day and are generally categorized as Level 2 in the hierarchy. Investments in open-end mutual funds are valued at their closing NAV each business day and are categorized as Level 1 in the hierarchy.
Changes in valuation techniques may result in transfers in or out of an assigned level within the disclosure hierarchy.
Various inputs are used in determining the value of the Fund’s investments as of the end of the reporting period. When inputs used fall into different levels of the fair value hierarchy, the level in the hierarchy within which the fair value measurement falls is determined based on the lowest level input that is significant to the fair value measurement in its entirety. The designated input levels are not necessarily an indication of the risk or liquidity associated with these investments.
These inputs are categorized in the following hierarchy under applicable financial accounting standards:
| Level 1 – | Unadjusted quoted prices in active markets for identical investments, unrestricted assets or liabilities that a Fund has the ability to access at the measurement date; |
| Level 2 – | Quoted prices which are not active, quoted prices for similar assets or liabilities in active markets or inputs other than quoted prices that are observable (either directly or indirectly) for substantially the full term of the asset or liability; and |
| Level 3 – | Significant unobservable prices or inputs (including the Fund’s own assumptions in determining the fair value of investments) where there is little or no market activity for the asset or liability at the measurement date. |
The following is a summary of the inputs used to value the Fund’s investments as of November 30, 2016:
| Investments in Securities at Value | | Level 1 - Unadjusted Quoted Prices | | | Level 2 - Other Significant Observable Inputs | | | Level 3 - Significant Unobservable Inputs | | | Total | |
Common Stocks* | | $ | 118,335,574 | | | $ | – | | | $ | – | | | $ | 118,335,574 | |
Rights* | | | – | | | | 4,781 | | | | – | | | | 4,781 | |
| Short Term Investments | | | | | | | | | | | | | | | | |
| Money Market Fund | | | 65,768 | | | | – | | | | – | | | | 65,768 | |
| Investments Purchased with Collateral from Securities Loaned | | | 15,293,632 | | | | – | | | | – | | | | 15,293,632 | |
| TOTAL | | $ | 133,694,974 | | | $ | 4,781 | | | $ | – | | | $ | 133,699,755 | |
| * | For a detailed industry breakdown, see the accompanying Schedule of Investments. |
The Fund recognizes transfers between levels as of the end of the period. For the year ended November 30, 2016, the Fund did not have any transfers between Level 1 and Level 2 securities. The Fund did not have any securities that used significant unobservable inputs (Level 3) in determining fair value.
C. Other Risks
Equity Risk: A principal risk of investing in the Fund is equity risk, which is the risk that the value of the securities held by the Fund will fall due to general market and economic conditions, perceptions regarding the industries in which the issuers of securities held by the Fund participate or factors relating to specific companies in which the Fund invests. For example, an adverse event, such as an unfavorable earnings report, may depress the value of equity securities of an issuer held by the Fund; the price of common stock of an issuer may be particularly sensitive to general movements in the stock market; or a drop in the stock market may depress the price of most or all of the common stocks and other equity securities held by the Fund. In addition, common stock of an issuer in the Fund’s portfolio may decline in price if the issuer fails to make anticipated dividend payments because, among other reasons, the issuer of the security experiences a decline in its financial condition.
ALPS Medical Breakthroughs ETF
| Notes to Financial Statements | November 30, 2016 |
Small- and Mid- Capitalization Company Risk: Investments in securities of small and mid-capitalization companies are subject to the risks of common stocks. Investments in smaller companies may involve greater risks because these companies generally have a limited track record. Smaller companies often have narrower markets, more limited managerial and financial resources and a less diversified product offering than larger, more established companies. As a result, their performance can be more volatile, which may increase the volatility of the Fund’s portfolio.
Concentration Risk: The Fund seeks to track the Underlying Index, which itself currently is concentrated in the pharmaceuticals and biotechnology industries and may have concentration in certain other industries or sectors, as well as regions, economies or markets. Underperformance or increased risk in such other concentrated areas may result in underperformance or increased risk in the Fund.
Non-Correlation Risk: The Fund’s return may not match the return of the Underlying Index for a number of reasons. For example, the Fund incurs a number of operating expenses not applicable to the Underlying Index, and incurs costs in buying and selling securities, especially when rebalancing the Fund’s securities holdings to reflect changes in the composition of the Underlying Index. In addition, the performance of the Fund and the Underlying Index may vary due to asset valuation differences and differences between the Fund’s portfolio and the Underlying Index resulting from legal restrictions. Due to legal and regulatory rules and limitations, the Fund may not be able to invest in all securities included in the Underlying Index. For tax efficiency purposes, the Fund may sell certain securities to realize losses, causing it to deviate from the Underlying Index. The Fund may not be fully invested at times, either as a result of cash flows into the Fund or reserves of cash held by the Fund to meet redemptions and expenses. If the Fund utilizes a sampling approach or otherwise does not hold all of the securities in the Underlying Index, its return may not correlate as well with the return on the Underlying Index, as would be the case if it purchased all of the securities in the Underlying Index with the same weightings as the Underlying Index.
D. Securities Transactions and Investment Income
Securities transactions are recorded as of the trade date. Realized gains and losses from securities transactions are recorded on the highest cost basis. Dividend income and capital gains distributions, if any, are recorded on the ex-dividend date. Interest income, if any, is recorded on the accrual basis.
E. Dividends and Distributions to Shareholders
Dividends from net investment income of the Fund, if any, are declared and paid annually or as the Board may determine from time to time. Distributions of net realized capital gains earned by the Fund, if any, are distributed at least annually.
F. Federal Tax and Tax Basis Information
The timing and character of income and capital gain distributions are determined in accordance with income tax regulations, which may differ from U.S. GAAP. Reclassifications are made to the Fund’s capital accounts for permanent tax differences to reflect income and gains available for distribution (or available capital loss carryforwards) under income tax regulations.
For the year ended November 30, 2016, the following reclassifications, which had no impact on results of operations or net assets, were recorded to reflect permanent tax differences resulting primarily from in-kind transactions:
| Fund | | Paid-in Capital | | | Accumulated Net Investment Income/(Loss) | | | Accumulated Net Realized Gain/(Loss) on Investments | |
| ALPS Medical Breakthroughs ETF | | $ | (3,880,465 | ) | | $ | 361,783 | | | $ | 3,518,682 | |
Included in the amounts reclassified was a net operating loss offset to PIC of $312,616.
ALPS Medical Breakthroughs ETF
| Notes to Financial Statements | November 30, 2016 |
There were no distributions paid for the years ended November 30, 2015 and November 30, 2016.
As of November 30, 2016, the components of distributable earnings on a tax basis for the Fund were as follows:
| | | ALPS Medical Breakthroughs ETF | |
| Accumulated net realized loss on investments | | $ | (27,532,124 | ) |
| Net unrealized depreciation on investments | | | (34,242,193 | ) |
| Other accumulated losses | | | (449,363 | ) |
| Total | | $ | (62,223,680 | ) |
At November 30, 2016, the Fund’s post-enactment capital losses deferred to the next tax year were as follows:
| Fund | | Short-Term | | | Long-Term | |
| ALPS Medical Breakthroughs ETF | | $ | 26,933,506 | | | $ | 598,618 | |
The Fund elected to defer to the period ending November 30, 2017, late year ordinary losses in the amount of $449,363.
As of November 30, 2016, the cost of investments for federal income tax purposes and accumulated net unrealized appreciation/(depreciation) on investments were as follows:
| | | ALPS Medical Breakthroughs ETF | |
| Gross appreciation (excess of value over tax cost) | | $ | 10,702,454 | |
| Gross depreciation (excess of tax cost over value) | | | (44,944,647 | ) |
| Net unrealized appreciation (depreciation) | | $ | (34,242,193 | ) |
| Cost of investments for income tax purposes | | $ | 167,941,948 | |
The differences between book-basis and tax-basis are primarily due to Passive Foreign Investment Company (“PFIC”) adjustments and the deferral of losses due to wash sales.
G. Income Taxes
No provision for income taxes is included in the accompanying financial statements, as the Fund intends to distribute to shareholders all taxable investment income and realized gains and otherwise comply with Subchapter M of the Internal Revenue Code of 1986, as amended, applicable to regulated investment companies. The Fund evaluates tax positions taken (or expected to be taken) in the course of preparing the Fund’s tax returns to determine whether these positions meet a “more-likely-than-not” standard that, based on the technical merits, have a more than fifty percent likelihood of being sustained by a taxing authority upon examination. A tax position that meets the “more-likely-than-not” recognition threshold is measured to determine the amount of benefit to recognize in the financial statements.
As of and during the year ended November 30, 2016, the Fund did not have a liability for any unrecognized tax benefits. The Fund files U.S. federal, state, and local tax returns as required. The Fund’s tax returns are subject to examination by the relevant tax authorities until expiration of the applicable statute of limitations, which is generally three years after the filing of the tax return, but may extend to four years in certain jurisdictions. Tax returns for open years have incorporated no uncertain tax positions that require a provision for income taxes.
H. Lending of Portfolio Securities
The Fund has entered into a securities lending agreement with State Street Bank & Trust Co. (“SSB”), the Fund’s lending agent. The Fund may lend its portfolio securities only to borrowers that are approved by SSB. The Fund will limit such lending to not more than 33 1/3% of the value of its total assets. The Fund’s securities held at SSB as custodian shall be available to be lent except those securities the Fund or ALPS Advisors Inc. specifically identifies in writing as not being available for lending. The borrower pledges and maintains with the Fund collateral consisting of cash (U.S. Dollars only), securities issued or guaranteed by the U.S. government or its agencies or instrumentalities, and cash equivalents (including irrevocable bank letters of credit) issued by a person other than the borrower or an affiliate of the borrower. The initial collateral received by the Fund is required to have a value of no less than 102% of the market value of the loaned securities for U.S equity securities and a value of no less than 105% of the market value for non-U.S. equity securities. The collateral is maintained thereafter, at a market value equal to not less than 102% of the current value of the U.S. equity securities on loan and not less than 105% of the current value of the non-U.S. equity securities on loan. The market value of the loaned securities is determined at the close of each business day and any additional required collateral is delivered to the Fund on the next business day. During the term of the loan, the Fund is entitled to all distributions made on or in respect of the loaned securities. Loans of securities are terminable at any time and the borrower, after notice, is required to return borrowed securities within the customary time period for settlement of securities transactions.
ALPS Medical Breakthroughs ETF
| Notes to Financial Statements | November 30, 2016 |
Any cash collateral received is reinvested in a money market fund managed by SSB as disclosed in the Fund’s Schedule of Investments and is reflected in the Statements of Assets and Liabilities as a payable for collateral upon return of securities loaned. Non-cash collateral, in the form of securities issued or guaranteed by the U.S. government or its agencies or instrumentalities, is not disclosed in the Fund’s Statements of Assets and Liabilities as it is held by the lending agent on behalf of the Fund, and the Fund does not have the ability to re-hypothecate these securities. Income earned by the Fund from securities lending activity is disclosed in the Statement of Operations.
The following is a summary of the Fund's securities lending agreement and related cash and non-cash collateral received as of November 30, 2016:
| | | Market Value of Securities on Loan | | Cash Collateral Received | | Non-Cash Collateral Received | | Total Collateral Received | |
| ALPS Medical Breakthroughs ETF | | $ | 21,723,246 | | | $ | 15,293,632 | | | $ | 7,668,624 | | | $ | 22,962,256 | |
The risks of securities lending include the risk that the borrower may not provide additional collateral when required or may not return the securities when due. To mitigate these risks, the Fund benefits from a borrower default indemnity provided by SSB. SSB’s indemnity allows for full replacement of securities lent wherein SSB will purchase the unreturned loaned securities on the open market by applying the proceeds of the collateral, or to the extent such proceeds are insufficient or the collateral is unavailable, SSB will purchase the unreturned loan securities at SSB’s expense. However, the Fund could suffer a loss if the value of the investments purchased with cash collateral falls below the value of the cash collateral received.
The following table reflects a breakdown of transactions accounted for as secured borrowings, the gross obligation by the type of collateral pledged or securities loaned, and the remaining contractual maturity of those transactions as of November 30, 2016:
| ALPS Medical Breakthroughs ETF | | | Remaining contractual maturity of the lending agreement | | | | |
| Securities Lending Transactions | | Overnight & Continuous | | | Up to 30 days | | | 30-90 days | | | Greater than 90 days | | | Total | |
| Common Stocks | | $ | 15,293,632 | | | $ | – | | | $ | – | | | $ | – | | | $ | 15,293,632 | |
| Total Borrowings | | | | | | | | | | | | | | | | | | | 15,293,632 | |
| Gross amount of recognized liabilities for securities lending (collateral received) | | | | | | | | | | | | | | | | | | $ | 15,293,632 | |
3. INVESTMENT ADVISORY FEE AND OTHER AFFILIATED TRANSACTIONS
ALPS Advisors, Inc. (the “Adviser”) acts as the Fund’s investment adviser pursuant to an Advisory Agreement with the Trust on behalf of the Fund (the “Advisory Agreement”). Pursuant to the Advisory Agreement, the Fund pays the Adviser a unitary fee for the services and facilities it provides, payable on a monthly basis at the annual rate of 0.50% of the Fund’s average daily net assets. From time to time, the Adviser may waive all or a portion of its fee.
Out of the unitary management fee, the Adviser pays substantially all expenses of the Fund, including the licensing fees to the Index provider, the cost of transfer agency, custody, fund administration, legal, audit, independent trustees and other services, except for interest expenses, distribution fees or expenses, brokerage expenses, taxes and extraordinary expenses not incurred in the ordinary course of the Fund’s business. The Adviser’s unitary management fee is designed to pay substantially all the Fund’s expenses and to compensate the Adviser for providing services for the Fund.
ALPS Fund Services, Inc., an affiliate of the Adviser, is the administrator of the Fund.
Each Trustee who is not an officer or employee of the Adviser, any sub-adviser or any of their affiliates (“Independent Trustees”) receives (1) a quarterly retainer of $5,000, (2) a per meeting fee for regularly scheduled meetings of $3,750, (3) $1,500 for any special meeting held outside of a regularly scheduled board meeting, and (4) reimbursement for all reasonable out-of-pocket expenses relating to attendance at meetings.
ALPS Medical Breakthroughs ETF
| Notes to Financial Statements | November 30, 2016 |
4. PURCHASES AND SALES OF SECURITIES
For the year ended November 30, 2016, the cost of purchases and proceeds from sales of investment securities, excluding in-kind transactions and short-term investments, were as follows:
| Fund | | Purchases | | | Sales | |
| ALPS Medical Breakthroughs ETF | | $ | 79,380,045 | | | $ | 79,201,508 | |
For the year ended November 30, 2016, the cost of in-kind purchases and proceeds from in-kind sales were as follows:
| Fund | | Purchases | | | Sales | |
| ALPS Medical Breakthroughs ETF | | $ | 38,084,232 | | | $ | 47,774,229 | |
For the year ended November 30, 2016, the ALPS Medical Breakthroughs ETF had in-kind net realized loss of $1,646,810.
Gains on in-kind transactions are not considered taxable for federal income tax purposes and losses on in kind transactions are also not deductible for tax purposes.
5. CAPITAL SHARE TRANSACTIONS
Shares are created and redeemed by the Fund only in Creation Unit size aggregations of 50,000 Shares. Only broker-dealers or large institutional investors with creation and redemption agreements called Authorized Participants (“AP”) are permitted to purchase or redeem Creation Units from the Fund. Such transactions are generally permitted on an in-kind basis, with a balancing cash component to equate the transaction to the NAV per unit of the Fund on the transaction date. Cash may be substituted equivalent to the value of certain securities generally when they are not available in sufficient quantity for delivery, not eligible for trading by the AP or as a result of other market circumstances.
ALPS Medical Breakthroughs ETF
| Additional Information | November 30, 2016 (Unaudited) |
PROXY VOTING RECORDS, POLICIES AND PROCEDURES
Information regarding how the Fund voted proxies relating to portfolio securities during the most recent 12-month period ended June 30 and a description of the Fund’s proxy voting policies and procedures used in determining how to vote for proxies are available without charge on the Securities and Exchange Commission’s (“SEC”) website at www.sec.gov and upon request, by calling (toll-free) 1-866-675-2639.
PORTFOLIO HOLDINGS
The Trust is required to disclose, after its first and third fiscal quarters, the complete schedule of the Fund’s portfolio holdings with the SEC on Form N-Q. Forms N-Q for the Fund are available on the SEC’s website at www.sec.gov. The Fund’s Forms N-Q may also be reviewed and copied at the SEC’s Public Reference Room in Washington, D.C. and information on the operation of the Public Reference Room may be obtained by calling 1-800-SEC-0330. The Fund’s Forms N-Q are available without charge, upon request, by calling (toll-free) 1-866-675-2639 or by writing to ALPS ETF Trust at 1290 Broadway, Suite 1100, Denver, Colorado 80203.
LICENSING AGREEMENT
The Poliwogg Medical Breakthroughs IndexSMis a service mark of S-Network Global Indexes, Inc. and has been licensed for use by ALPS Advisors, Inc. The ALPS Medical Breakthroughs ETF is not sponsored, endorsed, sold or promoted by S-Network Global Indexes, Inc. and S-Network Global Indexes, Inc. makes no representation regarding the advisability of investing in the ALPS Medical Breakthroughs ETF.
The ALPS Medical Breakthroughs ETF is not sponsored, endorsed, sold or promoted by Standard & Poor’s, a division of The McGraw-Hill Companies, Inc. (“S&P”) or its third party licensors. Neither S&P nor its third party licensors make any representation or warranty, express or implied, to the owners of the ALPS Medical Breakthroughs ETF or any member of the public regarding the advisability of investing in securities generally or in the ALPS Medical Breakthroughs ETF particularly or the ability of the Poliwogg Medical Breakthroughs IndexSMto track general stock market performance. S&P’s and its third party licensor’s only relationship to S-Network Global Indexes, LLC is the licensing of certain trademarks, service marks and trade names of S&P and/or its third party licensors and for the providing of calculation and maintenance services related to the Poliwogg Medical Breakthroughs IndexSM. Neither S&P nor its third party licensors is responsible for and has not participated in the determination of the prices and amount of the ALPS Medical Breakthroughs ETF or the timing of the issuance or sale of the ALPS Medical Breakthroughs ETF or in the determination or calculation of the equation by which the ALPS Medical Breakthroughs ETF is to be converted into cash. S&P has no obligation or liability in connection with the administration, marketing or trading of the ALPS Medical Breakthroughs ETF.
NEITHER S&P, ITS AFFILIATES NOR THEIR THIRD PARTY LICENSORS GUARANTEE THE ADEQUACY, ACCURACY, TIMELINESS OR COMPLETENESS OF THE POLIWOGG MEDICAL BREAKTHROUGHS INDEXSMOR ANY DATA INCLUDED THEREIN OR ANY COMMUNICATIONS, INCLUDING BUT NOT LIMITED TO, ORAL OR WRITTEN COMMUNICATIONS (INCLUDING ELECTRONIC COMMUNICATIONS) WITH RESPECT THERETO. S&P, ITS AFFILIATES AND THEIR THIRD PARTY LICENSORS SHALL NOT BE SUBJECT TO ANY DAMAGES OR LIABILITY FOR ANY ERRORS, OMISSIONS OR DELAYS THEREIN. S&P MAKES NO EXPRESS OR IMPLIED WARRANTIES, AND EXPRESSLY DISCLAIMS ALL WARRANTIES OF MERCHANTABILITY OR FITNESS FOR A PARTICULAR PURPOSE OR USE WITH RESPECT TO ITS TRADEMARKS, THE INDEX OR ANY DATA INCLUDED THEREIN. WITHOUT LIMITING ANY OF THE FOREGOING, IN NO EVENT WHATSOEVER SHALL S&P, ITS AFFILIATES OR THEIR THIRD PARTY LICENSORS BE LIABLE FOR ANY INDIRECT, SPECIAL, INCIDENTAL, PUNITIVE OR CONSEQUENTIAL DAMAGES, INCLUDING BUT NOT LIMITED TO, LOSS OF PROFITS, TRADING LOSSES, LOST TIME OR GOODWILL, EVEN IF THEY HAVE BEEN ADVISED OF THE POSSIBILITY OF SUCH DAMAGES, WHETHER IN CONTRACT, TORT, STRICT LIABILITY OR OTHERWISE.
Standard & Poor’s®, and S&P® are registered trademarks of The McGraw-Hill Companies, Inc.; “Calculated by S&P Custom Indices” and its related stylized mark are service marks of The McGraw-Hill Companies, Inc. These marks have been licensed for use by S-Network Global Indexes, LLC.
The Adviser does not guarantee the accuracy and/or the completeness of either Underlying Index or any data included therein, and the Adviser shall have no liability for any errors, omissions or interruptions therein. The Adviser makes no warranty, express or implied, as to results to be obtained by the Funds, owners of the Shares of the Funds or any other person or entity from the use of either Underlying Index or any data included therein. The Adviser makes no express or implied warranties, and expressly disclaims all warranties of merchantability or fitness for a particular purpose or use with respect to either Underlying Index or any data included therein. Without limiting any of the foregoing, in no event shall the Adviser have any liability for any special, punitive, direct, indirect or consequential damages (including lost profits) arising out of matters relating to the use of either Underlying Index even if notified of the possibility of such damages.
ALPS Medical Breakthroughs ETF
| Board Considerations Regarding Approval of Investment Advisory Agreement | November 30, 2016 (Unaudited) |
At an in-person meeting held on June 6, 2016, the Board of Trustees of the Trust (the “Board” or the “Trustees”), including the Trustees who are not “interested persons” of the Trust within the meaning of the 1940 Act, as amended (the “Independent Trustees”), evaluated a proposal to approve the continuance of the Investment Advisory Agreement between the Trust and ALPS Advisors, Inc. (the “Adviser” or “AAI”) with respect to the ALPS Medical Breakthroughs ETF (“SBIO” or “the Fund”). The Independent Trustees also met separately to consider the Investment Advisory Agreement.
In evaluating the Investment Advisory Agreement with respect to SBIO, the Trustees considered various factors, including (i) the nature, extent and quality of the services provided by AAI with respect to the Fund under the Investment Advisory Agreement; (ii) the advisory fees and other expenses paid by the Fund compared to those of similar funds managed by other investment advisers; (iii) the costs of the services provided to the Fund by AAI and the profits realized by AAI and its affiliates from its relationship to the Fund; (iv) the extent to which economies of scale have been or would be realized if and as the assets of the Fund grow and whether fees reflect the economies of scale for the benefit of shareholders; and (v) any additional benefits and other considerations.
With respect to the nature, extent and quality of the services provided by AAI under the Investment Advisory Agreement, the Trustees considered and reviewed information concerning the services provided under the Investment Advisory Agreement, the investment parameters of the index of the Fund, financial information regarding AAI and its parent company, information describing AAI’s current organization and the background and experience of the persons responsible for the day-to-day management of the Fund.
The Trustees reviewed information on the performance of the Fund and its benchmark. The Trustees also evaluated the correlation and tracking error between the underlying index and the Fund’s performance. Based on their review, the Trustees found that the nature and extent of services provided to the Fund under the Investment Advisory Agreement was appropriate and that the quality was satisfactory.
The Trustees noted that the advisory fee for the Fund was a unitary fee pursuant to which AAI assumes all expenses of the Fund (including the cost of transfer agency, custody, fund administration, legal, audit and other services) other than the payments under the Advisory Agreement, brokerage expenses, taxes, interest, litigation expenses and other extraordinary expenses.
With respect to advisory fee rates, the Trustees noted the following: The net advisory fee rate for the Fund is higher than the median of its Broadridge expense group and the Fund’s expense ratio is slightly above the median of its Broadridge expense group.
Based on the foregoing, and the other information available to them, the Trustees concluded that the advisory fee rate for the Fund was reasonable under the circumstances and in light of the quality of the services provided.
The Trustees considered other benefits available to AAI because of its relationship with the Fund and concluded that the advisory fees were reasonable taking into account any such benefits.
The Trustees also considered with respect to the Fund the information provided by AAI about the costs and profitability of AAI with respect to the Fund. The Trustees reviewed and noted the relatively small sizes of the Fund and concluded that AAI was not realizing any economies of scale. The Trustees determined that they would continue to evaluate whether further economies of scale have been achieved on an ongoing basis.
In voting to renew the Investment Advisory Agreement, the Trustees concluded that the terms of the Investment Advisory Agreement are reasonable and fair in light of the services to be performed, the fees paid by certain other funds, expenses to be incurred and such other matters as the Trustees considered relevant in the exercise of their reasonable business judgment. The Trustees did not identify any single factor or group of factors as all important or controlling and considered all factors together.
| ALPS Medical Breakthroughs ETF | |
| Trustees & Officers | November 30, 2016 (Unaudited) |
The general supervision of the duties performed by the Adviser for the Fund under the Investment Advisory Agreement is the responsibility of the Board of Trustees. The Trust currently has four Trustees. Three Trustees have no affiliation or business connection with the Adviser or any of its affiliated persons and do not own any stock or other securities issued by the Adviser. These are the “non‐interested” or “independent” Trustees (“Independent Trustees”). The other Trustee (the “Interested Trustee”) is affiliated with the Adviser.
The Independent Trustees of the Trust, their term of office and length of time served, their principal business occupations during the past five years, the number of portfolios in the Fund Complex overseen by each Independent Trustee, and other directorships, if any, held by the Trustee are shown below.
INDEPENDENT TRUSTEES
Name, Address & Year of Birth* | Position(s) Held with Trust | Term of Office and Length of Time Served** | Principal Occupation(s) During Past 5 Years | Number of Portfolios in Fund Complex Overseen by Trustees*** | Other Directorships Held by Trustees |
Mary K. Anstine,
1940 | Trustee | Since March 2008 | Ms. Anstine was President/Chief Executive Officer of HealthONE Alliance, Denver, Colorado, and former Executive Vice President of First Interstate Bank of Denver. Ms. Anstine is also Trustee/ Director of AV Hunter Trust and Colorado Uplift Board. Ms. Anstine was formerly a Director of the Trust Bank of Colorado (later purchased and now known as Northern Trust Bank), HealthONE and Denver Area Council of the Boy Scouts of America and a member of the American Bankers Association Trust Executive Committee. | 44 | Ms. Anstine is a Trustee of ALPS Variable Investment Trust (10 funds); Financial Investors Trust (31 funds); Reaves Utility Income Fund (1 fund); and Westcore Trust (14 funds). |
Jeremy W. Deems,
1976 | Trustee | Since March 2008 | Mr. Deems is the Co‐Founder, Chief Compliance Officer and Chief Financial Officer of Green Alpha Advisors, LLC. Mr. Deems is Co‐Portfolio Manager of the Shelton Green Alpha Fund. Prior to joining Green Alpha Advisors, Mr. Deems was CFO and Treasurer of Forward Management, LLC, ReFlow Management Co., LLC, ReFlow Fund, LLC, a private investment fund, and Sutton Place Management, LLC, an administrative services company. | 46 | Mr. Deems is a Trustee of ALPS Variable Investment Trust (10 funds); Financial Investors Trust (31 funds); and Reaves Utility Income Fund (1 fund); Clough Funds Trust (1 fund) and Elevation ETF Trust (2 fund). |
Rick A. Pederson, 1952 | Trustee | Since March 2008 | Mr. Pederson is President, Foundation Properties, Inc. (a real estate investment management company), 1994 ‐ present; Advisory Board Member, Bow River Capital Partners (private equity management), 2003 ‐ present; Advisor, The Pauls Corporation (real estate investment management and development), 2008 ‐ present; Chairman, Ross Consulting Group (real estate consulting services) 1983 ‐ 2013; Advisory Board Member, Neenan Company (construction services) 2002 ‐ present; Board Member, Prosci Inc. (private business services) 2013 ‐ 2016; Board Member, Citywide Banks (Colorado community bank) 2014 ‐ present; Board Member, Strong‐Bridge Consulting (management consulting) 2015 ‐ present; Director, National Western Stock Show (not‐for‐profit organization); Director, Biennial of the Americas (not‐for‐profit‐organization), 2012 ‐ 2015; Board Member, History Colorado, 2015 ‐ present. | 22 | Mr. Pederson is Trustee of Westcore Trust (14 funds) and Principal Real Estate Income Fund (1 fund). |
| * | The business address of the Trustee is c/o ALPS Advisors, Inc., 1290 Broadway, Suite 1100, Denver, Colorado 80203. |
| ** | This is the period for which the Trustee began serving the Trust. Each Trustee serves an indefinite term, until his successor is elected. |
| *** | The Fund Complex includes all series of the Trust and any other investment companies for which ALPS Advisors, Inc. provides investment advisory services. |
| ALPS Medical Breakthroughs ETF | |
| Trustees & Officers | November 30, 2016 (Unaudited) |
The Trustee who is affiliated with the Adviser or affiliates of the Adviser and executive officers of the Trust, his term of office and length of time served, his principal business occupations during the past five years, the number of portfolios in the Fund Complex overseen by the Interested Trustee and the other directorships, if any, held by the Trustee, are shown below.
INTERESTED TRUSTEE
| Name, Address and Year of Birth of Interested Trustee* | Position(s) Held with Trust | Term of Office and Length of Time Served** | Principal Occupation(s) During Past 5 Years | Number of Portfolios in Fund Complex Overseen by Trustees*** | Other Directorships Held by Trustees |
Thomas A. Carter, 1966 | Trustee and President | Since March 2008 | Mr. Carter joined ALPS Fund Services, Inc. (“ALPS”) in 1994 and is currently President and Director of ALPS Advisors, Inc. (“AAI”) and ALPS Portfolio Solutions Distributor, Inc. (“APSD”) and Executive Vice President and Director of ALPS and ALPS Holdings, Inc. (“AHI”) and ALPS Distributors, Inc. (“ADI”). Because of his position with AHI, ALPS, ADI, APSD and AAI, Mr. Carter is deemed an affiliate of the Fund as defined under the 1940 Act. Before joining ALPS, Mr. Carter was with Deloitte & Touche LLP, where he worked with a diverse group of clients, primarily within the financial services industry. Mr. Carter is a Certified Public Accountant and received his Bachelor of Science in Accounting from the University of Colorado at Boulder. | 33 | Mr. Carter is a Trustee of ALPS Variable Investment Trust (10 funds); Principal Real Estate Income Fund (1 fund); and RiverNorth Opportunities Fund, Inc. (1 fund). |
| * | The business address of the Trustee is c/o ALPS Advisors, Inc., 1290 Broadway, Suite 1100, Denver, Colorado 80203. |
| ** | This is the period for which the Trustee began serving the Trust. Each Trustee serves an indefinite term, until his successor is elected. |
| *** | The Fund Complex includes all series of the Trust and any other investment companies for which ALPS Advisors, Inc. provides investment advisory services. |
| ALPS Medical Breakthroughs ETF | |
| Trustees & Officers | November 30, 2016 (Unaudited) |
| OFFICERS | | | |
Name, Address and Year of Birth of Officer* | Position(s) Held with Trust | Length of Time Served** | Principal Occupation(s) During Past 5 Years |
Erin D. Nelson, 1977 | Chief Compliance Officer (“CCO”) | Since December 2015 | Erin Nelson became Senior Vice‐President and Chief Compliance Officer of ALPS Advisors, Inc. (“AAI”) on July 1, 2015 and prior to that served as Vice President and Deputy Chief Compliance Officer of AAI since January 1, 2015. Prior to January 1, 2015, Ms. Nelson was Vice‐President and Assistant General Counsel of ALPS Fund Services, Inc. Because of her position with AAI, Ms. Nelson is deemed an affiliate of the Trust as defined under the 1940 Act. Ms. Nelson is also the CCO of ALPS Variable Investment Trust, Liberty All‐Star Growth Fund, Inc., Liberty All‐ Star Equity Fund, Principal Real Estate Income Fund, and RiverNorth Opportunities Fund, Inc. |
Patrick D. Buchanan, 1972 | Treasurer | Since June 2012 | Mr. Buchanan is Vice President of AAI. Mr. Buchanan joined ALPS in 2007 and because of his position with AAI, he is deemed an affiliate of the Trust as defined under the 1940 Act. Mr. Buchanan is also Treasurer of the ALPS Variable Insurance Trust, Principal Real Estate Income Fund, Clough Funds Trust and RiverNorth Opportunities Fund, Inc. |
Andrew P. Meloni, 1969 | Assistant Treasurer | Since December 2016 | Mr. Meloni is a Fund Controller for ALPS Fund Services, Inc. Mr. Meloni joined ALPS in 2007 and because of his position with ALPS, he is deemed an affiliate of the Fund as defined under the 1940 Act. Mr. Meloni is also Assistant Treasurer to the Liberty All‐Star Equity Fund, Liberty All‐Star Growth Fund, Inc., Principal Real Estate Income Fund, RiverNorth Opportunities Fund, Inc. and ALPS Variable Investment Trust. |
Abigail J. Murray, 1975 | Secretary | Since June 2015 | Ms. Murray joined ALPS in April 2015. She is currently Vice President and Senior Counsel of ALPS. Prior to joining ALPS, Ms. Murray was an Attorney and Managing Member at Murray & Rouvina PLC from 2014 to 2015 and an Associate with Vedder Price P.C. from 2007 to 2014. Ms. Murray is also the Secretary of Clough Global Allocation Fund, Clough Global Equity Fund, Clough Global Opportunities Fund, Clough Funds Trust, The Caldwell & Orkin Funds, Inc. and RiverNorth Opportunities Fund, Inc. and Assistant Secretary of Elevation ETF Trust and Principal Real Estate Income Fund. |
Andrea E. Kuchli, 1985 | Assistant Secretary | Since December 2015 | Ms. Kuchli joined ALPS in 2015 and is currently Vice President and Senior Counsel of ALPS. Prior to joining ALPS, Ms. Kuchli was an Associate with Davis Graham & Stubbs LLP from April 2014 to February 2015, and an Associate with Dechert LLP from 2011 to April 2014. Because of her position with ALPS, Ms. Kuchli is deemed an affiliate of the Trust as defined under the 1940 Act. Ms. Kuchli is also Secretary of Elevation ETF Trust and Principal Real Estate Income Fund as well as Assistant Secretary of the James Advantage Funds and RiverNorth Opportunities Fund, Inc. |
Sharon Akselrod, 1974 | Assistant Secretary | Since December 2016 | Ms. Akselrod joined ALPS in August 2014 and is currently Senior Investment Company Act Paralegal of ALPS Fund Services, Inc. Prior to joining ALPS, Ms. Akselrod served as Corporate Governance and Regulatory Associate for Nordstrom fsb (2013‐2014) and Senior Legal Assistant – Legal Manager for AXA Equitable Life Insurance Company (2008‐2013). Because of her position with ALPS, Ms. Akselrod is deemed an affiliate of the Trust as defined under the 1940 Act. Ms. Akselrod is also Assistant Secretary of Financial Investors Trust. |
| * | The business address of each Officer is c/o ALPS Advisors, Inc., 1290 Broadway, Suite 1100, Denver, Colorado 80203. |
| ** | This is the period for which the Officer began serving the Trust. Each Officer serves an indefinite term, until his/her successor is elected. |
The Statement of Additional Information includes additional information about the Fund's Trustees and is available, without charge, upon request by calling (toll-free) 1-844-234-5852.
| Performance Overview | 1 |
| Disclosure of Fund Expenses | 10 |
| Report of Independent Registered Public Accounting Firm | 11 |
| Schedules of Investments | 12 |
| Statements of Assets and Liabilities | 17 |
| Statements of Operations | 18 |
| Statements of Changes in Net Assets | 19 |
| Financial Highlights | 22 |
| Notes to Financial Statements | 25 |
| Additional Information | 31 |
| Board Considerations Regarding Approval of Investment Advisory Agreements | 33 |
| Trustees & Officers | 34 |
alpsfunds.com
ALPS Sector Dividend Dogs ETF
| Performance Overview | November 30, 2016 (Unaudited) |
Investment Objective
The ALPS Sector Dividend Dogs ETF (the “Fund”) seeks investment results that replicate as closely as possible, before fees and expenses, the performance of the S-Network® Sector Dividend Dogs Index (the “Underlying Index”). The Shares of the Fund are listed and trade on the NYSE Arca under the ticker symbol SDOG. The Fund generally will invest in all of the securities that comprise the Underlying Index in proportion to their weightings in the Underlying Index.
The Underlying Index is a rules based index intended to give investors a means of tracking the overall performance of the highest dividend paying stocks (i.e. “Dividend Dogs”) in the S&P 500® (“SPX”) on a sector-by-sector basis. “Dividend Dogs” refers to the five stocks in each of the ten Global Industry Classification Standard (“GICS”) sectors that make up the S&P 500® which offer the highest dividend yields.
Performance Overview
The Fund, for the twelve month period ended November 30, 2016, generated a total return of 20.86%, in-line with the Fund’s Underlying Index, which returned 21.52%. The Fund outperformed the S&P 500® (SPX), which returned 8.06% for the same period.
The trailing twelve month yield for the Fund’s underlying constituents as of 11/30/2016 was 3.79% vs. 2.12% for the S&P 500®.
The S&P 500® was virtually flat from 11/30/15 through the end of the first calendar quarter in 2016. Fears of a global growth slowdown drove market action early on to start the year as U.S. equities pulled back more than 10%, their second correction in less than 12 months. A rebound in oil prices and continued improvement in consumer confidence helped to lead a rebound during the latter portion of the quarter. The S&P 500® returned 2.46% in Q2 2016. The majority of U.S. equities’ gains came in May as oil continued to climb and an upgrade was made to first quarter U.S. GDP growth. The UK’s decision to exit the European Union in June caused a spike in volatility and a selloff of U.S. equities, but comments from the Federal Reserve suggesting additional rises in U.S. interest rates helped allay worries and the domestic benchmark was able to hold onto its gains. During the third calendar quarter of 2016, the S&P 500® returned 3.85%. The majority of U.S. equities’ gains came in July as initial jobless claims improved and the earnings growth outlook became more positive for domestic firms. Performance leveled off for the last two months of the quarter as uncertainty surrounding the U.S. election tempered optimism, and this uncertainty continued to be an anchor to U.S. equity performance through the end of October. The domestic equity markets rebounded optimistically following the U.S. election in November 2016.
Compared to the S&P 500®, the Fund saw a moderate positive impact (+2.41%) from sector allocation effect for the period. This was largely driven by relative over-weights resulting from the equal sector weight strategy in Utilities (average weight for the period of 10.34% vs. 3.30% in SPX) and Telecommunication Services (average weight for the period of 8.08% vs. 2.66% in SPX). The Fund also saw a strong positive impact (+11.05%) from selection effect, as the constituents in Consumer Discretionary, Information Technology, and Health Care outperformed. The Fund’s Telecommunication Services holdings were the only detractors from a selection effect standpoint for the period.
The best performing stocks in the Fund for the period were Oneok Inc. (OKE), which increased 99.58% and Spectra Energy Corp. (SE), which saw a gain of 95.63%. Cummins Inc. (CMI), which rose 72.20%, and Wynn Resorts Ltd. (WYNN), which climbed 64.56%, were other top performers. The largest detractors were Ensco PLC (ESV), which decreased 39.17%, Pitney Bowes Inc. (PBI), which fell 30.62%, and Staples Inc. (SPLS), which lost 21.96%.
Looking forward we believe the Fund’s strategy of annually selecting the five highest yielding securities in each of the ten sectors in the S&P 500® will provide meaningfully higher yield relative to the S&P 500®, potential for market participation in all economic cycles through equal sector weighting, and a deep value portfolio of securities as identified through high yield relative to their sector peers.
Performance (as of November 30, 2016)
| | 1 Year | 3 Year | Since Inception^ |
| ALPS Sector Dividend Dogs ETF – NAV | 20.86% | 11.64% | 16.68% |
| ALPS Sector Dividend Dogs ETF – Market Price* | 20.85% | 11.65% | 16.70% |
S-Network® Sector Dividend Dogs TR Index | 21.52% | 12.19% | 17.25% |
S&P 500® Total Return Index | 8.06% | 9.07% | 13.86% |
Total Expense Ratio (per the current prospectus) 0.40%.
Performance data quoted represents past performance. Past performance does not guarantee future results. The table does not reflect the deduction of taxes that a shareholder would pay on Fund distributions or the redemption of Fund shares. Investment return and principal value of an investment will fluctuate so that an investor’s shares, when sold or redeemed, may be worth more or less than the original cost. Current performance data may be higher or lower than actual data quoted. For the most current month-end performance data please visit www.alpsfunds.com or call 1.866.675.2639.
ALPS Sector Dividend Dogs ETF
| Performance Overview | November 30, 2016 (Unaudited) |
NAV is an exchange-traded fund’s per-share value. The per-share dollar amount of the Fund is derived by dividing the total value of all the securities in its portfolio, less any liabilities, by the number of Fund shares outstanding. Market Price is the price at which a share can currently be traded in the market. Information detailing the number of days the Market Price of the Fund was greater than the Fund’s NAV and the number of days it was less than the Fund’s NAV can be obtained at www.alpsfunds.com.
| ^ | The Fund Commencement Date was June 29, 2012. |
| * | Market Price is based on the midpoint of the bid-ask spread at 4 p.m. ET and does not represent the returns an investor would receive if shares were traded at other times. |
The S-Network® Sector Dividend Dogs Index is designed to serve as a fair, impartial and transparent measure of the performance of US large cap equities with above average dividend yields. The Underlying Index is a portfolio of fifty stocks derived from the S&P 500® Index. The index is reported on a total return basis, which assumes reinvestment of any dividends and distributions realized during a given time period.
The S&P 500® Total Return Index is an index of 500 stocks chosen for market size, liquidity and industry grouping among other factors.
The indexes are not actively managed and do not reflect any deductions for fees, expenses or taxes. One cannot invest directly in an index. Index performance does not reflect fund performance.
The ALPS Sector Dividend Dogs ETF is not suitable for all investors. Investments in the Fund are subject to investment risks, including possible loss of the principal amount invested.
ALPS Portfolio Solutions Distributor, Inc., a FINRA member, is the distributor for the ETF.
ALPS Sector Dividend Dogs ETF
| Performance Overview | November 30, 2016 (Unaudited) |
Top 10 Holdings* (as of November 30, 2016)
| Nucor Corp. | 2.63% |
| MetLife, Inc. | 2.48% |
| Cummins, Inc. | 2.41% |
| Navient Corp. | 2.40% |
| LyondellBasell Industries NV, Class A | 2.35% |
| Caterpillar, Inc. | 2.35% |
| People's United Financial, Inc. | 2.31% |
| ConocoPhillips | 2.28% |
| National Oilwell Varco, Inc. | 2.23% |
| QUALCOMM, Inc. | 2.23% |
| Total % of Top 10 Holdings | 23.67% |
Future holdings are subject to change.
Sector Allocation* (as of November 30, 2016)
| Financials | 11.23% |
| Materials | 11.16% |
| Industrials | 10.62% |
| Energy | 10.62% |
| Information Technology | 10.58% |
| Consumer Discretionary | 10.09% |
| Consumer Staples | 9.55% |
| Health Care | 9.51% |
| Utilities | 9.47% |
| Telecommunication Services | 7.08% |
| Money Market Fund | 0.09% |
| Total | 100.00% |
Growth of $10,000 (as of November 30, 2016)
Comparison of Change in Value of $10,000 Investment in the Fund and the Indexes
The chart above represents historical performance of a hypothetical investment of $10,000 in the Fund over the life of the Fund. Past performance does not guarantee future results. This chart does not reflect the deduction of taxes that a shareholder would pay on Fund distributions or the redemption of Fund shares.
ALPS International Sector Dividend Dogs ETF
| Performance Overview | November 30, 2016 (Unaudited) |
Investment Objective
The ALPS International Sector Dividend Dogs ETF (the “Fund”) seeks investment results that replicate as closely as possible, before fees and expenses, the performance of the S-Network® International Sector Dividend Dogs Index (the “Underlying Index”). The Shares of the Fund are listed and trade on the NYSE Arca under the ticker symbol IDOG. The Fund generally will invest in all of the securities that comprise the Underlying Index in proportion to their weightings in the Underlying Index.
The Underlying Index is a rules-based index intended to give investors a means of tracking the overall performance of the highest dividend paying stocks (i.e. “Dividend Dogs”) in the S-Net International Developed Markets (ex-Americas) Index, a universe of mainly large capitalization stocks in international developed markets not located in the Americas (the “S-Net Developed Markets”) on a sector-by-sector basis. “Dividend Dogs” refers to the five stocks in each of the ten Global Industry Classification Standard (“GICS”) sectors that make up the S-Net Developed Markets which offer the highest dividend yields.
Performance Overview
The Fund, for the twelve month period ended November 30, 2016, generated a total return of -1.95%, relatively in-line with the Fund’s Net Total Return Underlying Index, which returned -1.54%. The Fund outperformed the MSCI EAFE® Index (MXEA) which returned -3.66% for the same period.
The trailing twelve month yield for the Fund’s constituents as of 11/30/2016 was 5.10% vs. 3.33% on the MSCI EAFE®.
From a macro perspective, international developed markets’ performance from December 2015 through the end of the first calendar quarter of 2016 was uneven. Continued speculation about a potential “Brexit” of Great Britain from the EU was the primary point of interest. Looking East, Japan consumers continued to struggle, leading Japanese officials to postpone additional consumer tax hikes to keep domestic consumption afloat. Eurozone equities fell in Q1 (-2.75%), but the European Central Banks continued accommodative monetary policies with low rates and further stimulus buffered the asset class against further declines. Developed markets followed suit, as the MSCI EAFE® Index lost 2.86% for the quarter. During the second quarter of 2016, Eurozone equities fell 2.19% and the MSCI EAFE® Index lost 1.22% for the quarter in reaction to the UK’s referendum on EU membership. Developed markets saw strong returns across the board with Eurozone equities climbing 4.41% and the MSCI EAFE® up 6.52% in the third calendar quarter of 2016 as worries over the immediate impact of Brexit were assuaged and accommodative central bank policies persisted. Performance slumped during October and November as international equity markets wrestled with uncertainty regarding the implications of the outcome of the U.S. election.
Compared to the MSCI EAFE®, the Fund saw a moderately positive impact (+1.29%) from sector allocation which was largely driven by the relative overweight allocations resulting from the equal sector weight strategy in Energy (average weight for the period of 10.13% vs. 4.91% in MXEA) and Materials (average weight for the period of 10.38% vs. 6.92% in MXEA). The Fund’s relative overweight to the Telecommunication Services sector (average weight for the period of 9.62% vs. 5.00% in MXEA) detracted from performance. The Fund also saw relative outperformance (+2.81%) attributed to selection effect, with names in Consumer Discretionary and Consumer Staples the primary drivers.
From a geographical perspective, performance was supported by selection effect in Finland and the United Kingdom, as well as average relative overweight allocations for the period in Australia and the United Kingdom. The Fund’s performance was adversely impacted by selection effect in Sweden and Switzerland, in addition to average relative overweight allocations to Spain and Chile. The Fund saw the impact of a strong dollar, as currency effect hurt detracted 1.75% from the Fund’s returns.
The best performing stocks for the period were Sands China Ltd. (1928 HK), which increased 56.71%, Tokyo Electron Ltd. (8035 JP), which rose 52.51%, and BHP Billiton Ltd. (BHP AU), which climbed 40.41%. The worst performing stocks were Telefonaktiebolaget LM Ericsson (ERICB SS), which decreased 44.73%, Marks & Spencer Group PLC (MKS LN), which fell 41.95%, and Telefonica SA (TEF SM), which lost 26.66%.
Looking forward, we believe the Fund’s strategy of annually selecting the five highest yielding securities in each of the ten sectors in the S-Net Developed Markets (Ex Americas) Index will provide high yield relative to the MSCI EAFE®, potential for market participation in all economic cycles through equal sector weighting, and a deep value portfolio of securities as identified through high yield relative to their sector peers.
Performance (as of November 30, 2016)
| | 1 Year | 3 Year | Since Inception^ |
| ALPS International Sector Dividend Dogs ETF – NAV | -1.95% | -4.10% | 1.10% |
| ALPS International Sector Dividend Dogs ETF – Market Price* | -1.70% | -4.23% | 1.11% |
S-Network® International Sector Dividend Dogs NTR Index | -1.54% | -3.73% | 1.48% |
| MSCI EAFE Index | -3.66% | -2.22% | 2.48% |
ALPS International Sector Dividend Dogs ETF
| Performance Overview | November 30, 2016 (Unaudited) |
Total Expense Ratio (per the current prospectus) 0.50%.
Performance data quoted represents past performance. Past performance does not guarantee future results. The table does not reflect the deduction of taxes that a shareholder would pay on Fund distributions or the redemption of Fund shares. Investment return and principal value of an investment will fluctuate so that an investor’s shares, when sold or redeemed, may be worth more or less than the original cost. Current performance data may be higher or lower than actual data quoted. For the most current month-end performance data please visit www.alpsfunds.com or call 1.866.675.2639.
NAV is an exchange-traded fund’s per-share value. The per-share dollar amount of the Fund is derived by dividing the total value of all the securities in its portfolio, less any liabilities, by the number of Fund shares outstanding. Market Price is the price at which a share can currently be traded in the market. Information detailing the number of days the Market Price of the Fund was greater than the Fund’s NAV and the number of days it was less than the Fund’s NAV can be obtained at www.alpsfunds.com.
| ^ | The Fund Commencement Date was June 28, 2013. |
| * | Market Price is based on the midpoint of the bid-ask spread at 4 p.m. ET and does not represent the returns an investor would receive if shares were traded at other times. |
The S-Network® International Sector Dividend Dogs Index is designed to serve as a fair, impartial and transparent measure of the performance of international large cap equities with above average dividend yields. The Underlying Index is a portfolio of fifty stocks derived from the S-Net International Developed Markets Index (ex-Americas) Index. Total Return assumes reinvestment of any dividends and distributions realized during a given time period. Net Total Return (NTR) is obtained by reinvesting the net dividend, which is equal to the ordinary gross dividend minus the amount of withholding tax.
MSCI EAFE® Index is a stock market index that is designed to measure the equity market performance of developed markets outside of the U.S. & Canada.
The indexes are not actively managed and do not reflect any deductions for fees, expenses or taxes. One cannot invest directly in an index. Index performance does not reflect fund performance.
The ALPS International Sector Dividend Dogs ETF is not suitable for all investors. Investments in the Fund are subject to investment risks, including possible loss of the principal amount invested.
ALPS Portfolio Solutions Distributor, Inc., a FINRA member, is the distributor for the ETF.
| ALPS International Sector Dividend Dogs ETF |
Performance Overview | November 30, 2016 (Unaudited) |
Top 10 Holdings* (as of November 30, 2016)
| Rio Tinto, Ltd. | 2.48% |
| BHP Billiton, Ltd. | 2.45% |
| Aurizon Holdings, Ltd. | 2.36% |
| UPM-Kymmene OYJ | 2.35% |
| Sands China, Ltd. | 2.31% |
| BASF SE | 2.22% |
| Bouygues SA | 2.22% |
| Australia & New Zealand Banking Group, Ltd. | 2.21% |
| National Australia Bank, Ltd. | 2.21% |
| Westpac Banking Corp. | 2.21% |
| Total % of Top 10 Holdings | 23.02% |
Future holdings are subject to change.
Sector Allocation* (as of November 30, 2016)
| Materials | 11.41% |
| Financials | 10.74% |
| Industrials | 10.55% |
| Energy | 10.33% |
| Consumer Discretionary | 10.15% |
| Consumer Staples | 9.75% |
| Health Care | 9.47% |
| Information Technology | 9.47% |
| Utilities | 9.09% |
| Telecommunication Services | 8.96% |
| Money Market Fund | 0.08% |
| Total | 100.00% |
Growth of $10,000 (as of November 30, 2016)
Comparison of Change in Value of $10,000 Investment in the Fund and the Indexes
The chart above represents historical performance of a hypothetical investment of $10,000 in the Fund over the life of the Fund. Past performance does not guarantee future results. This chart does not reflect the deduction of taxes that a shareholder would pay on Fund distributions or the redemption of Fund shares.
ALPS Emerging Sector Dividend Dogs ETF
| Performance Overview | November 30, 2016 (Unaudited) |
Investment Objective
The ALPS Emerging Sector Dividend Dogs ETF (the “Fund”) seeks investment results that replicate as closely as possible, before fees and expenses, the performance of the S-Network® Emerging Sector Dividend Dogs Index (the “Underlying Index”). The Shares of the Fund are listed and trade on the NYSE Arca under the ticker symbol EDOG. The Fund generally will invest in all of the securities that comprise the Underlying Index in proportion to their weightings in the Underlying Index.
The Underlying Index is a rules-based index intended to give investors a means of tracking the overall performance of the highest dividend paying stocks (i.e. “Dividend Dogs”) in the S-Network® Emerging Markets Index, a universe of mainly large capitalization stocks domiciled in emerging markets (the “S-Network Emerging Markets”) on a sector-by-sector basis. “Dividend Dogs” refers to the five stocks in each of the ten Global Industry Classification Standard (“GICS”) sectors that make up the S-Network® Emerging Markets which offer the highest dividend yields. Emerging market countries are countries that major international financial institutions, such as the World Bank, generally consider to be less economically mature than developed nations.
Performance Overview
The Fund, for the one year period ended November 30, 2016, generated a total return of 5.10%, relatively in-line with the Fund’s Net Total Return Underlying Index, which returned 6.06%. The Fund trailed the MSCI Emerging Markets Net TR Index® (MXEF), which returned 8.47% for the same period.
The trailing twelve month yield for the Fund as of 11/30/2016 was 4.50% vs. 2.49% on the MSCI EM®.
From a macro perspective, after closing 2015 down roughly 2.12% in December 2015, emerging markets equities were one of the top performing asset classes during the first quarter in 2016, with the MSCI Emerging Markets Net TR Index® gaining 5.69%. The asset class has historically been sensitive to natural resource markets, and it benefited from the rebound in the commodity price of oil. After their impressive run to start 2016 in Q1, emerging markets equities were relatively flat in the second quarter, with MXEF gaining 0.80%. The asset class had continued to benefit as the commodity price of oil continued to climb, but the fallout from “Brexit” adversely impacted performance. During the third calendar quarter of 2016, emerging markets continued their torrid 2016 performance, with MXEF gaining 9.16%. China’s economy continued its move towards a more service-oriented system, as the Services segment continued to comprise an increasing amount of national GDP. China’s improved cyclical trajectory helped a number of other emerging market economies during the third quarter. Following the third quarter, the asset class fell during October and November, with the MXEF down 4.36%, as emerging markets attempted to digest the potential implications of the outcome of the U.S. election.
Compared to the MSCI EM®, the Fund saw a moderately negative impact (-1.89%) from sector allocation effect which was largely driven by the relative underweight allocations resulting from the equal sector weight strategy in Information Technology (average weight for the period of 9.70% vs. 21.89% in MXEF) and a relative overweight to Health Care over the one year period (average weight for the period of 10.24% vs. 2.81% in MXEF). Conversely, the Fund’s performance was helped by the relative overweight allocations to Energy (average weight for the period of 11.93% vs. 2.81% in MXEF) and Materials (average weight for the period of 10.46% vs. 6.86% in MXEF). The Fund also saw a slightly negative impact (-0.07%) due to selection effect, as the names in Information Technology and Utilities were leading detractors, while constituents in Consumer Staples and Industrials propped up fund performance.
From a geographical perspective, the Fund’s returns were bolstered by selection effect in Turkey and South Africa, as well as a relative overweight to Brazil. Fund performance for the period was negatively impacted by security selection in Thailand and Malaysia, as well as a relative overweight in Poland. Currency effect had minimal impact on the Fund’s performance, hurting performance by 0.06%.
The best performing stocks for the period were Cia Siderurgica Nacional SA (CSNA3 BZ), which increased 249.22%, Imperial Holdings Ltd. (IPL SJ), which returned 67.30%, and Lukoil PJSC- Sponsored ADR (LKOD LI), which rose 59.32%. The worst performing stocks were BEC World Public Company Ltd. (BEC TB), which lost 40.96%, Lenovo Group Ltd. (992 HK), which fell 35.83%; and UMW Holdings BHD (UMWH MK), which decreased 35.29%.
Looking forward we believe the Fund’s strategy of annually selecting the five highest yielding securities in each of the ten sectors in the S-Net Emerging Markets Index will provide high yield relative to the MSCI Emerging Markets Net TR Index®, potential for market participation in all economic cycles through equal sector weighting, and a deep value portfolio of securities as identified through high yield relative to their sector peers.
Performance (as of November 30, 2016)
| | 1 Year | Since Inception^ |
| ALPS Emerging Sector Dividend Dogs ETF – NAV | 5.10% | -2.63% |
| ALPS Emerging Sector Dividend Dogs ETF – Market Price* | 5.70% | -2.45% |
S-Network® Emerging Sector Dividend Dogs NTR Index | 6.06% | -1.69% |
MSCI Emerging Markets Net TR Index® | 8.47% | -2.06% |
ALPS Emerging Sector Dividend Dogs ETF
| Performance Overview | November 30, 2016 (Unaudited) |
Total Expense Ratio (per the current prospectus) 0.60%.
Performance data quoted represents past performance. Past performance does not guarantee future results. The table does not reflect the deduction of taxes that a shareholder would pay on Fund distributions or the redemption of Fund shares. Investment return and principal value of an investment will fluctuate so that an investor’s shares, when sold or redeemed, may be worth more or less than the original cost. Current performance data may be higher or lower than actual data quoted. For the most current month-end performance data please visit www.alpsfunds.com or call 1.866.675.2639.
NAV is an exchange-traded fund’s per-share value. The per-share dollar amount of the Fund is derived by dividing the total value of all the securities in its portfolio, less any liabilities, by the number of Fund shares outstanding. Market Price is the price at which a share can currently be traded in the market. Information detailing the number of days the Market Price of the Fund was greater than the Fund’s NAV and the number of days it was less than the Fund’s NAV can be obtained at www.alpsfunds.com.
| ^ | The Fund Commencement Date was March 28, 2014. |
| * | Market Price is based on the midpoint of the bid-ask spread at 4 p.m. ET and does not represent the returns an investor would receive if shares were traded at other times. |
The S-Network® Emerging Sector Dividend Dogs Index is a portfolio of stocks derived from a universe of mainly large capitalization stocks domiciled in emerging markets (the “S-Network Emerging Markets Index” “SNEMX”). The index methodology selects the five stocks in each of the ten GICS sectors that make up the universe which offer the highest dividend yields as of the last trading day of November. The fifty stocks that are selected for inclusion in the portfolio are equally weighted. The universe includes stocks whose domicile and primary exchange listings are in countries identified by the World Bank as Upper Middle Income (certain lower middle income countries are also included, as well as stocks traded on the Taiwan Stock Exchange despite non-recognition by the World Bank). The selection criteria for the universe, in addition to the aforementioned country qualifications, also include requirements for sector inclusion, primary exchange listing, minimum market capitalization, share price, average daily trading volume and other factors. Total Return assumes reinvestment of any dividends and distributions realized during a given time period. Net Total Return (NTR) is obtained by reinvesting the net dividend, which is equal to the ordinary gross dividend minus the amount of withholding tax.
The MSCI Emerging Markets Index® is a free float-adjusted market capitalization index that is designed to measure equity market performance in the global emerging markets.
The indexes are not actively managed and do not reflect any deductions for fees, expenses or taxes. One cannot invest directly in an index. Index performance does not reflect fund performance.
The ALPS Emerging Sector Dividend Dogs ETF is not suitable for all investors. Investments in the Fund are subject to investment risks, including possible loss of the principal amount invested.
ALPS Portfolio Solutions Distributor, Inc., a FINRA member, is the distributor for the ETF.
ALPS Emerging Sector Dividend Dogs ETF
Performance Overview | November 30, 2016 (Unaudited) |
Top 10 Holdings* (as of November 30, 2016)
Cia Siderurgica Nacional SA | 2.92% |
United Tractors Tbk PT | 2.45% |
China Oilfield Services, Ltd., Class H | 2.44% |
KGHM Polska Miedz SA | 2.33% |
Total Access Communication Pcl, NVDR | 2.33% |
China Shenhua Energy Co., Ltd., Class H | 2.30% |
Gazprom PAO, Sponsored ADR | 2.30% |
MMC Norilsk Nickel PJSC, ADR | 2.24% |
Cia Brasileira de Distribuicao, Sponsored ADR | 2.20% |
Delta Electronics Thailand Pcl | 2.20% |
Total % of Top 10 Holdings | 23.71% |
Future holdings are subject to change.
Sector Allocation* (as of November 30, 2016)
| Energy | 13.79% |
| Materials | 11.33% |
Telecommunication Services | 10.14% |
Health Care | 9.73% |
Information Technology | 9.62% |
Consumer Staples | 9.37% |
| Utilities | 9.19% |
Consumer Discretionary | 9.06% |
| Industrials | 7.76% |
| Financials | 7.72% |
Real Estate | 2.19% |
Money Market Fund | 0.10% |
| Total | 100.00% |
Growth of $10,000 (as of November 30, 2016)
Comparison of Change in Value of $10,000 Investment in the Fund and the Indexes
The chart above represents historical performance of a hypothetical investment of $10,000 in the Fund over the life of the Fund. Past performance does not guarantee future results. This chart does not reflect the deduction of taxes that a shareholder would pay on Fund distributions or the redemption of Fund shares.
ALPS Sector Dividend Dogs Series
| Disclosure of Fund Expenses | November 30, 2016 (Unaudited) |
Shareholder Expense Example: As a shareholder of a Fund, you incur two types of costs: (1) transaction costs which may include creation and redemption fees or brokerage charges, and (2) ongoing costs, including management fees and other Fund expenses. These examples are intended to help you understand your ongoing costs (in dollars) of investing in the Fund and to compare these costs with the ongoing costs of investing in other funds. It is based on an investment of $1,000 invested at the beginning of the (six month) period and held through November 30, 2016.
Actual Return: The first line of the table provides information about actual account values and actual expenses. You may use the information in this line, together with the amount you invested, to estimate the expenses that you incurred over the period. Simply divide your account value by $1,000 (for example, an $8,600 account value divided by $1,000 = 8.6), then multiply the result by the number in the first line under the heading entitled “Expenses Paid During Period” to estimate the expenses attributable to your investment during this period.
Hypothetical 5% Return: The second line of the table provides information about hypothetical account values and hypothetical expenses based on the Fund’s actual expense ratio and an assumed rate of return of 5% per year before expenses, which is not the Fund’s actual return. The hypothetical account values and expenses may not be used to estimate the actual ending account balance or expenses you paid for the period. You may use this information to compare ongoing costs of investing in the Fund and other funds. To do so, compare this 5% hypothetical example with the 5% hypothetical examples that appear in the shareholder reports of other funds.
The expenses shown in the table are meant to highlight ongoing Fund costs only and do not reflect any transaction costs, such as creation and redemption fees or brokerage charges. Therefore, the second line is useful in comparing ongoing costs only, and will not help you determine the relative total costs of owning different funds. In addition, if these costs were included, your costs would have been higher.
| | Beginning Account Value 6/1/16 | Ending Account Value 11/30/16 | Expense Ratio(a) | Expenses Paid During Period 6/1/16 - 11/30/16(b) |
ALPS Sector Dividend Dogs ETF | | | | |
| Actual | $1,000.00 | $1,080.70 | 0.40% | $2.08 |
Hypothetical (5% return before expenses) | $1,000.00 | $1,023.00 | 0.40% | $2.02 |
| | | | | |
ALPS International Sector Dividend Dogs ETF | | | | |
| Actual | $1,000.00 | $991.60 | 0.50% | $2.49 |
Hypothetical (5% return before expenses) | $1,000.00 | $1,022.50 | 0.50% | $2.53 |
| | | | | |
ALPS Emerging Sector Dividend Dogs ETF | | | | |
| Actual | $1,000.00 | $1,042.30 | 0.60% | $3.06 |
Hypothetical (5% return before expenses) | $1,000.00 | $1,022.00 | 0.60% | $3.03 |
(a) | Annualized based on the Fund's most recent half-year expenses. |
(b) | Expenses are equal to the Fund's annualized expense ratio multiplied by the average account value over the period, multiplied by the number of days in the most recent fiscal half year (183), divided by 366. |
ALPS Sector Dividend Dogs Series
Report of Independent Registered Public Accounting Firm
To the Board of Trustees and Shareholders of ALPS ETF Trust:
We have audited the accompanying statements of assets and liabilities, including the schedules of investments, of ALPS Sector Dividend Dogs ETF, ALPS International Sector Dividend Dogs ETF, and ALPS Emerging Sector Dividend Dogs ETF, three of the portfolios constituting the ALPS ETF Trust (the “Trust”), as of November 30, 2016, and the related statements of operations for the year then ended, the statements of changes in net assets for each of the two years in the period then ended, and the financial highlights for each of the periods presented. These financial statements and financial highlights are the responsibility of the Trust’s management. Our responsibility is to express an opinion on these financial statements and financial highlights based on our audits.
We conducted our audits in accordance with the standards of the Public Company Accounting Oversight Board (United States). Those standards require that we plan and perform the audit to obtain reasonable assurance about whether the financial statements and financial highlights are free of material misstatement. The Trust is not required to have, nor were we engaged to perform, an audit of its internal control over financial reporting. Our audits included consideration of internal control over financial reporting as a basis for designing audit procedures that are appropriate in the circumstances, but not for the purpose of expressing an opinion on the effectiveness of the Trust’s internal control over financial reporting. Accordingly, we express no such opinion. An audit also includes examining, on a test basis, evidence supporting the amounts and disclosures in the financial statements, assessing the accounting principles used and significant estimates made by management, as well as evaluating the overall financial statement presentation. Our procedures included confirmation of securities owned as of November 30, 2016, by correspondence with the custodian and brokers. We believe that our audits provide a reasonable basis for our opinion.
In our opinion, the financial statements and financial highlights referred to above present fairly, in all material respects, the financial position of ALPS Sector Dividend Dogs ETF, ALPS International Sector Dividend Dogs ETF, and ALPS Emerging Sector Dividend Dogs ETF of the ALPS ETF Trust as of November 30, 2016, the results of their operations for the year then ended, the changes in their net assets for each of the two years in the period then ended, and the financial highlights for each of the periods presented, in conformity with accounting principles generally accepted in the United States of America.
DELOITTE & TOUCHE LLP
Denver, Colorado
January 27, 2017
ALPS Sector Dividend Dogs ETF
| Schedule of Investments | November 30, 2016 |
| Security Description | | Shares | | | Value | |
| COMMON STOCKS (99.63%) | | | | | | |
Consumer Discretionary (10.06%) | | | | | | |
| Coach, Inc. | | | 919,957 | | | $ | 33,477,235 | |
| Ford Motor Co. | | | 2,712,024 | | | | 32,435,807 | |
| Garmin, Ltd. | | | 709,558 | | | | 37,010,545 | |
| Mattel, Inc. | | | 1,058,134 | | | | 33,405,290 | |
| Wynn Resorts, Ltd. | | | 342,054 | | | | 34,886,088 | |
| Total Consumer Discretionary | | | | | | | 171,214,965 | |
| | | | | | | | | |
Consumer Staples (9.52%) | | | | | | | | |
| Altria Group, Inc. | | | 529,608 | | | | 33,857,839 | |
| The Coca‐Cola Co. | | | 794,290 | | | | 32,049,602 | |
| Philip Morris International, Inc. | | | 344,219 | | | | 30,387,653 | |
| The Procter & Gamble Co. | | | 389,311 | | | | 32,102,585 | |
| Wal‐Mart Stores, Inc. | | | 478,823 | | | | 33,723,504 | |
| Total Consumer Staples | | | | | | | 162,121,183 | |
| | | | | | | | | |
Energy (10.59%) | | | | | | | | |
| ConocoPhillips | | | 796,713 | | | | 38,656,515 | |
| Kinder Morgan, Inc. | | | 1,517,845 | | | | 33,696,159 | |
| National Oilwell Varco, Inc. | | | 1,015,425 | | | | 37,936,278 | |
| ONEOK, Inc. | | | 689,634 | | | | 37,881,595 | |
| Spectra Energy Corp. | | | 784,460 | | | | 32,123,637 | |
| Total Energy | | | | | | | 180,294,184 | |
| | | | | | | | | |
Financials (11.20%) | | | | | | | | |
| Cincinnati Financial Corp. | | | 445,851 | | | | 34,214,606 | |
| Invesco, Ltd. | | | 1,093,607 | | | | 34,240,835 | |
| MetLife, Inc. | | | 766,595 | | | | 42,170,391 | |
| Navient Corp. | | | 2,365,515 | | | | 40,757,823 | |
| People's United Financial, Inc. | | | 2,093,362 | | | | 39,187,737 | |
| Total Financials | | | | | | | 190,571,392 | |
| | | | | | | | | |
Health Care (9.49%) | | | | | | | | |
| AbbVie, Inc. | | | 529,907 | | | | 32,218,346 | |
| Baxter International, Inc. | | | 744,629 | | | | 33,039,189 | |
| Johnson & Johnson | | | 283,974 | | | | 31,606,306 | |
| Merck & Co., Inc. | | | 538,663 | | | | 32,960,789 | |
| Pfizer, Inc. | | | 984,601 | | | | 31,645,076 | |
| Total Health Care | | | | | | | 161,469,706 | |
| | | | | | | | | |
Industrials (10.59%) | | | | | | | | |
| Caterpillar, Inc. | | | 416,656 | | | | 39,815,647 | |
| Cummins, Inc. | | | 288,168 | | | | 40,856,459 | |
| Eaton Corp. Plc | | | 529,509 | | | | 35,217,644 | |
| Emerson Electric Co. | | | 661,841 | | | | 37,354,306 | |
| Pitney Bowes, Inc. | | | 1,888,357 | | | | 27,097,923 | |
| Total Industrials | | | | | | | 180,341,979 | |
| | | | | | | | | |
Information Technology (10.55%) | | | | | | | | |
| CA, Inc. | | | 1,015,273 | | | | 32,448,125 | |
| HP, Inc. | | | 2,392,417 | | | | 36,843,222 | |
| International Business Machines Corp. | | | 216,204 | | | | 35,072,613 | |
| QUALCOMM, Inc. | | | 556,196 | | | | 37,893,633 | |
| Security Description | | Shares | | | Value | |
| Information Technology (continued) | | | | | | |
| Seagate Technology Plc | | | 932,707 | | | $ | 37,401,551 | |
| Total Information Technology | | | | | | | 179,659,144 | |
| | | | | | | | | |
Materials (11.13%) | | | | | | | | |
| The Dow Chemical Co. | | | 630,238 | | | | 35,116,861 | |
| International Paper Co. | | | 705,534 | | | | 34,373,617 | |
| LyondellBasell Industries NV, Class A | | | 441,810 | | | | 39,904,279 | |
| The Mosaic Co. | | | 1,246,259 | | | | 35,393,756 | |
| Nucor Corp. | | | 718,795 | | | | 44,701,861 | |
| Total Materials | | | | | | | 189,490,374 | |
| | | | | | | | | |
Telecommunication Services (7.06%) | | | | | | | | |
| AT&T, Inc. | | | 845,498 | | | | 32,661,588 | |
| CenturyLink, Inc. | | | 1,205,140 | | | | 28,344,893 | |
| Frontier Communications Corp. | | | 7,362,896 | | | | 26,874,570 | |
| Verizon Communications, Inc. | | | 647,913 | | | | 32,330,859 | |
| Total Telecommunication Services | | | | | | | 120,211,910 | |
| | | | | | | | | |
Utilities (9.44%) | | | | | | | | |
| CenterPoint Energy, Inc. | | | 1,488,788 | | | | 35,522,482 | |
| Duke Energy Corp. | | | 430,724 | | | | 31,774,510 | |
| Entergy Corp. | | | 432,889 | | | | 29,752,461 | |
| NRG Energy, Inc. | | | 2,894,372 | | | | 32,822,178 | |
| The Southern Co. | | | 660,004 | | | | 30,901,387 | |
| Total Utilities | | | | | | | 160,773,018 | |
| | | | | | | | | |
| TOTAL COMMON STOCKS | | | | | | | | |
| (Cost $1,519,320,524) | | | | | | | 1,696,147,855 | |
| | | 7 Day Yield | | | Shares | | | Value | |
| SHORT TERM INVESTMENTS (0.09%) | | | | |
| State Street Institutional | | | | | | | | | |
| Treasury Plus Money | | | | | | | | | |
| Market Fund | | | 0.259 | % | | | 1,448,428 | | | | 1,448,428 | |
| | | | | | | | | | | | | |
| TOTAL SHORT TERM INVESTMENTS | | | | | |
| (Cost $1,448,428) | | | | | | | | | | | 1,448,428 | |
| | | | | | | | | | | | | |
| TOTAL INVESTMENTS (99.72%) | | | | | |
| (Cost $1,520,768,952) | | | | | | | | | | $ | 1,697,596,283 | |
| | | | | | | | | | | | | |
| NET OTHER ASSETS AND LIABILITIES (0.28%) | | | | 4,808,815 | |
| | | | | | | | | | | | | |
| NET ASSETS (100.00%) | | | | | | | | | | $ | 1,702,405,098 | |
See Notes to Financial Statements.
ALPS International Sector Dividend Dogs ETF
| Schedule of Investments | November 30, 2016 |
| Security Description | | Shares | | | Value | |
| COMMON STOCKS (99.19%) | | | | | | |
| Australia (23.63%) | | | | | | |
| Amcor, Ltd. | | | 288,261 | | | $ | 3,061,020 | |
| Aurizon Holdings, Ltd. | | | 1,026,414 | | | | 3,774,620 | |
| Australia & New Zealand Banking Group, Ltd. | | | 168,470 | | | | 3,534,396 | |
| BHP Billiton, Ltd. | | | 216,827 | | | | 3,908,431 | |
| National Australia Bank, Ltd. | | | 165,228 | | | | 3,529,827 | |
| Suncorp Group, Ltd. | | | 358,278 | | | | 3,307,132 | |
| Telstra Corp., Ltd. | | | 891,061 | | | | 3,322,922 | |
| Wesfarmers, Ltd. | | | 105,717 | | | | 3,261,630 | |
| Westpac Banking Corp. | | | 152,726 | | | | 3,526,649 | |
| Woodside Petroleum, Ltd. | | | 159,213 | | | | 3,482,450 | |
| Woolworths, Ltd. | | | 197,336 | | | | 3,335,596 | |
| Total Australia | | | | | | | 38,044,673 | |
| | | | | | | | | |
| Finland (4.29%) | | | | | | | | |
| Fortum OYJ | | | 216,862 | | | | 3,148,823 | |
| UPM‐Kymmene OYJ | | | 164,305 | | | | 3,761,394 | |
| Total Finland | | | | | | | 6,910,217 | |
| | | | | | | | | |
| France (7.93%) | | | | | | | | |
| Bouygues SA | | | 104,470 | | | | 3,543,120 | |
| Engie SA | | | 205,975 | | | | 2,543,225 | |
| Sanofi | | | 42,756 | | | | 3,448,920 | |
| Vivendi SA | | | 169,909 | | | | 3,239,603 | |
| Total France | | | | | | | 12,774,868 | |
| | | | | | | | | |
| Germany (2.21%) | | | | | | | | |
| BASF SE | | | 41,426 | | | | 3,555,893 | |
| | | | | | | | | |
| Hong Kong (2.29%) | | | | | | | | |
| Sands China, Ltd. | | | 749,000 | | | | 3,688,751 | |
| | | | | | | | | |
| | | | | | | | | |
| Italy (1.89%) | | | | | | | | |
| Eni SpA | | | 218,335 | | | | 3,040,626 | |
| | | | | | | | | |
| Japan (7.93%) | | | | | | | | |
| Canon, Inc. | | | 116,263 | | | | 3,313,961 | |
| Ricoh Co., Ltd. | | | 365,500 | | | | 2,942,402 | |
| Takeda Pharmaceutical Co., Ltd. | | | 74,189 | | | | 3,038,114 | |
| Tokyo Electron, Ltd. | | | 38,000 | | | | 3,479,306 | |
| Total Japan | | | | | | | 12,773,783 | |
| | | | | | | | | |
| Netherlands (2.13%) | | | | | | | | |
| Royal Dutch Shell Plc, Class A | | | 134,814 | | | | 3,426,324 | |
| | | | | | | | | |
| Norway (3.77%) | | | | | | | | |
| Orkla ASA | | | 362,176 | | | | 3,228,814 | |
| Security Description | | Shares | | | Value | |
| Norway(continued) | | | | | | |
| Telenor ASA | | | 192,154 | | | $ | 2,839,303 | |
| Total Norway | | | | | | | 6,068,117 | |
| | | | | | | | | |
| Portugal (1.82%) | | | | | | | | |
| EDP ‐ Energias de Portugal SA | | | 1,015,882 | | | | 2,936,113 | |
| | | | | | | | | |
| | | | | | | | | |
| Singapore (3.89%) | | | | | | | | |
| Jardine Cycle & Carriage, Ltd. | | | 109,000 | | | | 3,053,232 | |
| Keppel Corp., Ltd. | | | 845,300 | | | | 3,214,068 | |
| Total Singapore | | | | | | | 6,267,300 | |
| | | | | | | | | |
| Spain (7.38%) | | | | | | | | |
| Abertis Infraestructuras SA | | | 213,427 | | | | 2,851,258 | |
| Banco Santander SA | | | 715,545 | | | | 3,270,851 | |
| Repsol SA | | | 238,654 | | | | 3,187,011 | |
| Telefonica SA | | | 309,025 | | | | 2,571,687 | |
| Total Spain | | | | | | | 11,880,807 | |
| | | | | | | | | |
| Sweden (3.30%) | | | | | | | | |
| Telefonaktiebolaget LM Ericsson, Class B | | | 487,427 | | | | 2,509,857 | |
| Telia Co. AB | | | 745,386 | | | | 2,801,219 | |
| Total Sweden | | | | | | | 5,311,076 | |
| | | | | | | | | |
| Switzerland (1.82%) | | | | | | | | |
| Novartis AG, Registered Shares | | | 42,503 | | | | 2,936,791 | |
| | | | | | | | | |
| | | | | | | | | |
| United Kingdom (24.91%) | | | | | | | | |
| AstraZeneca Plc | | | 52,762 | | | | 2,739,325 | |
| BAE Systems Plc | | | 463,960 | | | | 3,485,942 | |
| BP Plc | | | 588,400 | | | | 3,382,498 | |
| British American Tobacco Plc | | | 54,108 | | | | 2,974,395 | |
| Centrica Plc | | | 1,087,558 | | | | 2,861,662 | |
| GlaxoSmithKline Plc | | | 158,965 | | | | 2,974,504 | |
| Imperial Brands Plc | | | 64,823 | | | | 2,784,386 | |
| Marks & Spencer Group Plc | | | 739,966 | | | | 3,043,253 | |
| Pearson Plc | | | 321,839 | | | | 3,203,358 | |
| Rio Tinto, Ltd. | | | 92,804 | | | | 3,957,674 | |
| SSE Plc | | | 164,591 | | | | 3,037,559 | |
| The Sage Group Plc | | | 350,995 | | | | 2,887,509 | |
| Vodafone Group Plc | | | 1,149,020 | | | | 2,787,610 | |
| Total United Kingdom | | | | | | | 40,119,675 | |
| | | | | | | | | |
| TOTAL COMMON STOCKS | | | | | | | | |
| (Cost $181,328,534) | | | | | | | 159,735,014 | |
ALPS International Sector Dividend Dogs ETF
| Schedule of Investments | November 30, 2016 |
| | | 7 Day Yield | | | Shares | | | Value | |
| SHORT TERM INVESTMENTS (0.07%) | | | | |
| State Street Institutional | | | | | | | | | |
| Treasury Plus Money | | | | | | | | | |
| Market Fund | | | 0.259 | % | | | 118,247 | | | | 118,247 | |
| | | | | | | | | | | | | |
| TOTAL SHORT TERM INVESTMENTS | | | | | |
| (Cost $118,247) | | | | | | | | | | | 118,247 | |
| | | | | | | | | | | | | |
| TOTAL INVESTMENTS (99.26%) | | | | | |
| (Cost $181,446,781) | | | | | | | | | | $ | 159,853,261 | |
| | | | | | | | | | | | | |
| NET OTHER ASSETS AND LIABILITIES (0.74%) | | | | 1,189,130 | |
| | | | | | | | | | | | | |
| NET ASSETS (100.00%) | | | | | | | | | | $ | 161,042,391 | |
See Notes to Financial Statements.
ALPS Emerging Sector Dividend Dogs ETF
| Schedule of Investments | November 30, 2016 |
| Security Description | | Shares | | | Value | |
| COMMON STOCKS (99.82%) | | | | | | |
| Brazil (10.20%) | | | | | | |
| Cia Brasileira de Distribuicao, Sponsored ADR | | | 26,355 | | | $ | 419,572 | |
Cia Siderurgica Nacional SA(a) | | | 151,124 | | | | 555,424 | |
| Natura Cosmeticos SA | | | 41,145 | | | | 318,741 | |
| Telefonica Brasil SA, ADR | | | 28,264 | | | | 368,845 | |
| TOTVS SA | | | 44,287 | | | | 281,667 | |
| Total Brazil | | | | | | | 1,944,249 | |
| | | | | | | | | |
| Chile (4.16%) | | | | | | | | |
| AES Gener SA | | | 1,085,575 | | | | 380,677 | |
| SONDA SA | | | 214,392 | | | | 412,929 | |
| Total Chile | | | | | | | 793,606 | |
| | | | | | | | | |
| China (10.85%) | | | | | | | | |
| China Oilfield Services, Ltd., Class H | | | 490,000 | | | | 464,320 | |
| China Shenhua Energy Co., Ltd., Class H | | | 211,500 | | | | 437,915 | |
| Country Garden Holdings Co., Ltd. | | | 744,000 | | | | 416,291 | |
| Lenovo Group, Ltd. | | | 574,000 | | | | 355,952 | |
| Sinopec Engineering Group Co., Ltd. | | | 454,500 | | | | 392,593 | |
| Total China | | | | | | | 2,067,071 | |
| | | | | | | | | |
| Colombia (1.92%) | | | | | | | | |
| Almacenes Exito SA | | | 78,514 | | | | 365,164 | |
| | | | | | | | | |
| Czech Republic (1.90%) | | | | | | | | |
| CEZ A.S. | | | 22,334 | | | | 362,522 | |
| | | | | | | | | |
| India (4.01%) | | | | | | | | |
| Dr Reddy's Laboratories, Ltd., ADR | | | 8,613 | | | | 402,486 | |
| Infosys, Ltd., Sponsored ADR | | | 25,034 | | | | 362,492 | |
| Total India | | | | | | | 764,978 | |
| | | | | | | | | |
| Indonesia (9.97%) | | | | | | | | |
| Indocement Tunggal Prakarsa Tbk PT | | | 309,500 | | | | 364,823 | |
| Indofood Sukses Makmur Tbk PT | | | 643,400 | | | | 359,620 | |
| Kalbe Farma Tbk PT | | | 3,086,000 | | | | 341,561 | |
| Perusahaan Gas Negara Persero Tbk | | | 1,877,900 | | | | 367,197 | |
| United Tractors Tbk PT | | | 301,100 | | | | 466,563 | |
| Total Indonesia | | | | | | | 1,899,764 | |
| | | | | | | | | |
| Malaysia (8.81%) | | | | | | | | |
| Astro Malaysia Holdings Bhd | | | 565,000 | | | | 330,195 | |
| British American Tobacco Malaysia Bhd | | | 32,427 | | | | 320,930 | |
| Sime Darby Bhd | | | 208,400 | | | | 371,443 | |
| UMW Holdings Bhd | | | 276,400 | | | | 318,114 | |
| YTL Power International Bhd | | | 1,070,618 | | | | 338,014 | |
| Total Malaysia | | | | | | | 1,678,696 | |
| | | | | | | | | |
| Poland (9.53%) | | | | | | | | |
| Bank Handlowy w Warszawie SA | | | 21,127 | | | | 338,302 | |
| Security Description | | Shares | | | Value | |
| Poland (continued) | | | | | | |
| Bank Pekao SA | | | 12,326 | | | $ | 346,650 | |
| KGHM Polska Miedz SA | | | 21,328 | | | | 443,316 | |
| PGE Polska Grupa Energetyczna SA | | | 136,766 | | | | 301,979 | |
| Powszechny Zaklad Ubezpieczen SA | | | 54,920 | | | | 386,396 | |
| Total Poland | | | | | | | 1,816,643 | |
| | | | | | | | | |
| Russia (10.49%) | | | | | | | | |
| Gazprom PAO, Sponsored ADR | | | 94,894 | | | | 437,367 | |
| Lukoil PJSC, Sponsored ADR | | | 8,389 | | | | 411,061 | |
MegaFon PJSC, GDR(b) | | | 38,637 | | | | 338,074 | |
| MMC Norilsk Nickel PJSC, ADR | | | 25,390 | | | | 426,044 | |
| Mobile Telesystems PJSC, Sponsored ADR | | | 49,310 | | | | 386,097 | |
| Total Russia | | | | | | | 1,998,643 | |
| | | | | | | | | |
| South Africa (10.02%) | | | | | | | | |
| Coronation Fund Managers, Ltd. | | | 78,286 | | | | 399,285 | |
| Imperial Holdings, Ltd. | | | 34,261 | | | | 412,690 | |
| Life Healthcare Group Holdings, Ltd. | | | 146,576 | | | | 323,191 | |
| MTN Group, Ltd. | | | 49,055 | | | | 394,461 | |
| Netcare, Ltd. | | | 170,834 | | | | 379,105 | |
| Total South Africa | | | | | | | 1,908,732 | |
| | | | | | | | | |
| Thailand (10.46%) | | | | | | | | |
| Bangkok Dusit Medical Services Pcl | | | 623,300 | | | | 407,038 | |
| BEC World Pcl | | | 631,170 | | | | 327,265 | |
| BTS Group Holdings Pcl | | | 1,631,420 | | | | 397,801 | |
| Delta Electronics Thailand Pcl | | | 196,924 | | | | 418,083 | |
| Total Access Communication Pcl, NVDR | | | 464,900 | | | | 443,016 | |
| Total Thailand | | | | | | | 1,993,203 | |
| | | | | | | | | |
| Turkey (7.50%) | | | | | | | | |
| Eregli Demir ve Celik Fabrikalari TAS | | | 268,726 | | | | 368,396 | |
| Tofas Turk Otomobil Fabrikasi AS | | | 54,056 | | | | 337,329 | |
| Tupras Turkiye Petrol Rafinerileri AS | | | 20,458 | | | | 407,886 | |
| Turk Traktor ve Ziraat Makineleri AS | | | 14,835 | | | | 315,206 | |
| Total Turkey | | | | | | | 1,428,817 | |
| | | | | | | | | |
| TOTAL COMMON STOCKS | | | | | | | | |
| (Cost $19,871,813) | | | | | | | 19,022,088 | |
| | | 7 Day Yield | | | Shares | | | Value | |
| SHORT TERM INVESTMENTS (0.10%) | | | | | | | |
| State Street Institutional Treasury Plus Money Market Fund | | | 0.259 | % | | | 19,958 | | | $ | 19,958 | |
| | | | | | | | | | | | | |
| TOTAL SHORT TERM INVESTMENTS | | | | | |
| (Cost $19,958) | | | | | | | | | | | 19,958 | |
ALPS Emerging Sector Dividend Dogs ETF
| Schedule of Investments | November 30, 2016 |
| Security Description | | Shares | | Value | |
| Turkey (continued) | | | | | |
| TOTAL INVESTMENTS (99.92%) | | | | | |
| (Cost $19,891,771) | | | | $ | 19,042,046 | |
| | | | | | | |
| NET OTHER ASSETS AND LIABILITIES (0.08%) | | | 14,708 | |
| | | | | | | |
| NET ASSETS (100.00%) | | | | $ | 19,056,754 | |
(a) | Non-income producing security. |
(b) | These securities initially sold to other parties pursuant to Regulation S under the 1933 Act and subsequently resold to the Fund. As of November 30, 2016, the aggregate market values of these securities were $338,074, representing 1.77% of the Fund’s net assets. |
See Notes to Financial Statements.
| ALPS Sector Dividend Dogs Series | |
| Statements of Assets and Liabilities | November 30, 2016 |
| | | ALPS Sector
Dividend Dogs
ETF | | | ALPS
International
Sector Dividend
Dogs ETF | | | ALPS Emerging
Sector Dividend
Dogs ETF | |
| ASSETS: | | | | | | | | | |
| Investments, at value | | $ | 1,697,596,283 | | | $ | 159,853,261 | | | $ | 19,042,046 | |
| Foreign currency, at value (Cost –, 49,846 and –) | | | – | | | | 49,924 | | | | – | |
| Foreign tax reclaims | | | – | | | | 511,985 | | | | 2,050 | |
Dividends receivable | | | 7,977,135 | | | | 693,984 | | | | 21,388 | |
Total Assets | | | 1,705,573,418 | | | | 161,109,154 | | | | 19,065,484 | |
| | | | | | | | | | | | | |
| LIABILITIES: | | | | | | | | | | | | |
| Payable for investments purchased | | | 2,646,677 | | | | 259 | | | | – | |
Payable to adviser | | | 521,643 | | | | 66,504 | | | | 8,730 | |
Total Liabilities | | | 3,168,320 | | | | 66,763 | | | | 8,730 | |
| NET ASSETS | | $ | 1,702,405,098 | | | $ | 161,042,391 | | | $ | 19,056,754 | |
| | | | | | | | | | | | | |
| NET ASSETS CONSIST OF: | | | | | | | | | | | | |
| Paid‐in capital | | $ | 1,638,283,038 | | | $ | 203,211,756 | | | $ | 22,379,478 | |
| Accumulated net investment income | | | – | | | | 512,514 | | | | 107,255 | |
| Accumulated net realized loss | | | (112,705,271 | ) | | | (20,998,472 | ) | | | (2,579,662 | ) |
Net unrealized appreciation/(depreciation) | | | 176,827,331 | | | | (21,683,407 | ) | | | (850,317 | ) |
| NET ASSETS | | $ | 1,702,405,098 | | | $ | 161,042,391 | | | $ | 19,056,754 | |
| | | | | | | | | | | | | |
| INVESTMENTS, AT COST | | $ | 1,520,768,952 | | | $ | 181,446,781 | | | $ | 19,891,771 | |
| | | | | | | | | | | | | |
| PRICING OF SHARES: | | | | | | | | | | | | |
| Net Assets | | $ | 1,702,405,098 | | | $ | 161,042,391 | | | $ | 19,056,754 | |
| Shares of beneficial interest outstanding (Unlimited number of shares authorized, par value $0.01 per share) | | | 40,259,141 | | | | 7,050,000 | | | | 900,000 | |
| Net Asset Value, offering and redemption price per share | | $ | 42.29 | | | $ | 22.84 | | | $ | 21.17 | |
See Notes to Financial Statements.
| ALPS Sector Dividend Dogs Series | |
| Statements of Operations | For the Year Ended November 30, 2016 |
| | | ALPS Sector
Dividend Dogs
ETF | | | ALPS
International
Sector Dividend
Dogs ETF | | | ALPS Emerging
Sector Dividend
Dogs ETF | |
| INVESTMENT INCOME: | | | | | | | | | |
| Dividends* | | $ | 44,777,835 | | | $ | 6,594,732 | | | $ | 526,642 | |
Interest and other income | | | – | | | | 77 | | | | – | |
Total Investment Income | | | 44,777,835 | | | | 6,594,809 | | | | 526,642 | |
| | | | | | | | | | | | | |
| EXPENSES: | | | | | | | | | | | | |
Investment adviser fees | | | 4,931,306 | | | | 690,333 | | | | 85,214 | |
| Total Expense | | | 4,931,306 | | | | 690,333 | | | | 85,214 | |
NET INVESTMENT INCOME | | | 39,846,529 | | | | 5,904,476 | | | | 441,428 | |
| | | | | | | | | | | | | |
| REALIZED AND UNREALIZED GAIN/(LOSS) | | | | | | | | | | | | |
| Net realized loss on investments | | | (43,300,773 | ) | | | (8,646,517 | ) | | | (2,102,063 | ) |
Net realized loss on foreign currency transactions | | | – | | | | (34,984 | ) | | | (14,601 | ) |
Total net realized loss | | | (43,300,773 | ) | | | (8,681,501 | ) | | | (2,116,664 | ) |
| Net change in unrealized appreciation/(depreciation) on investments | | | 216,359,606 | | | | (1,507,606 | ) | | | 1,438,695 | |
Net change in unrealized depreciation on translation of assets and liabilities denominated in foreign currencies | | | – | | | | (23,676 | ) | | | (447 | ) |
Total net change in unrealized appreciation/(depreciation) | | | 216,359,606 | | | | (1,531,282 | ) | | | 1,438,248 | |
NET REALIZED AND UNREALIZED GAIN/(LOSS) ON INVESTMENTS | | | 173,058,833 | | | | (10,212,783 | ) | | | (678,416 | ) |
| NET INCREASE/(DECREASE) IN NET ASSETS RESULTING FROM OPERATIONS | | $ | 212,905,362 | | | $ | (4,308,307 | ) | | $ | (236,988 | ) |
*Net of foreign tax withholding: | | $ | – | | | $ | 476,091 | | | $ | 55,412 | |
See Notes to Financial Statements.
| ALPS Sector Dividend Dogs ETF |
| Statements of Changes in Net Assets |
| | | For the Year Ended November 30, 2016 | | | For the Year Ended November 30, 2015(a) | |
| OPERATIONS: | | | | | | |
| Net investment income | | $ | 39,846,529 | | | $ | 37,040,321 | |
Net realized gain/(loss)(a) | | | (43,300,773 | ) | | | 70,582,949 | |
Net change in unrealized appreciation/(depreciation)(a) | | | 216,359,606 | | | | (146,635,118 | ) |
| Net increase/(decrease) in net assets resulting from operations | | | 212,905,362 | | | | (39,011,848 | ) |
| | | | | | | | | |
| Net Equalization Credits | | | 1,934,769 | | | | 1,811,687 | |
| | | | | | | | | |
| DISTRIBUTIONS TO SHAREHOLDERS: | | | | | | | | |
| From net investment income | | | (41,467,278 | ) | | | (39,961,342 | ) |
From tax return of capital | | | (366,916 | ) | | | – | |
Total distributions | | | (41,834,194 | ) | | | (39,961,342 | ) |
| | | | | | | | | |
| CAPITAL SHARE TRANSACTIONS: | | | | | | | | |
| Proceeds from sale of shares | | | 874,355,784 | | | | 597,479,846 | |
| Dividends reinvested | | | – | | | | 148,008 | |
| Cost of shares redeemed | | | (357,920,532 | ) | | | (528,228,637 | ) |
Net income equalization (Note 2) | | | (1,934,769 | ) | | | (1,811,687 | ) |
Net increase from share transactions | | | 514,500,483 | | | | 67,587,530 | |
| Net increase/(decrease) in net assets | | | 687,506,420 | | | | (9,573,973 | ) |
| | | | | | | | | |
| NET ASSETS: | | | | | | | | |
Beginning of period | | | 1,014,898,678 | | | | 1,024,472,651 | |
| End of period * | | $ | 1,702,405,098 | | | $ | 1,014,898,678 | |
| | | | | | | | | |
| * Including accumulated net investment income of: | | $ | – | | | $ | 714,281 | |
| | | | | | | | | |
| OTHER INFORMATION: | | | | | | | | |
| CAPITAL SHARE TRANSACTIONS: | | | | | | | | |
| Beginning shares | | | 28,009,141 | | | | 26,405,255 | |
| Shares sold | | | 22,550,000 | | | | 15,750,000 | |
| Shares reinvested | | | – | | | | 3,888 | |
Shares redeemed | | | (10,300,000 | ) | | | (14,150,002 | ) |
| Shares outstanding, end of period | | | 40,259,141 | | | | 28,009,141 | |
(a) | Prior to November 30, 2016, the Fund presented realized gain/loss and unrealized appreciation/depreciation by investment type. This change in presentation was made to conform to industry standards and had no effect on the Fund's change in net assets. |
See Notes to Financial Statements.
| ALPS International Sector Dividend Dogs ETF |
| Statements of Changes in Net Assets |
| | | For the Year Ended November 30, 2016 | | | For the Year Ended November 30, 2015(a) | |
| OPERATIONS: | | | | | | |
| Net investment income | | $ | 5,904,476 | | | $ | 6,451,827 | |
Net realized loss(a) | | | (8,681,501 | ) | | | (12,439,419 | ) |
Net change in unrealized depreciation(a) | | | (1,531,282 | ) | | | (8,560,626 | ) |
| Net decrease in net assets resulting from operations | | | (4,308,307 | ) | | | (14,548,218 | ) |
| | | | | | | | | |
| Net Equalization Credits | | | 528,824 | | | | 313,588 | |
| | | | | | | | | |
| DISTRIBUTIONS TO SHAREHOLDERS: | | | | | | | | |
| From net investment income | | | (5,356,978 | ) | | | (6,203,669 | ) |
From tax return of capital | | | – | | | | (115,516 | ) |
Total distributions | | | (5,356,978 | ) | | | (6,319,185 | ) |
| | | | | | | | | |
| CAPITAL SHARE TRANSACTIONS: | | | | | | | | |
| Proceeds from sale of shares | | | 45,086,015 | | | | 45,672,933 | |
| Cost of shares redeemed | | | (10,156,797 | ) | | | (32,488,456 | ) |
Net income equalization (Note 2) | | | (528,824 | ) | | | (313,588 | ) |
Net increase from share transactions | | | 34,400,394 | | | | 12,906,215 | |
| Net increase/(decrease) in net assets | | | 25,263,933 | | | | (7,682,926 | ) |
| | | | | | | | | |
| NET ASSETS: | | | | | | | | |
Beginning of period | | | 135,778,458 | | | | 143,461,384 | |
| End of period * | | $ | 161,042,391 | | | $ | 135,778,458 | |
| | | | | | | | | |
| * Including accumulated net investment income of: | | $ | 512,514 | | | $ | – | |
| | | | | | | | | |
| OTHER INFORMATION: | | | | | | | | |
| CAPITAL SHARE TRANSACTIONS: | | | | | | | | |
| Beginning shares | | | 5,600,000 | | | | 5,250,002 | |
| Shares sold | | | 1,900,000 | | | | 1,650,000 | |
Shares redeemed | | | (450,000 | ) | | | (1,300,002 | ) |
| Shares outstanding, end of period | | | 7,050,000 | | | | 5,600,000 | |
(a) | Prior to November 30, 2016, the Fund presented realized gain/loss and unrealized appreciation/depreciation by investment type. This change in presentation was made to conform to industry standards and had no effect on the Fund's change in net assets. |
See Notes to Financial Statements.
| ALPS Emerging Sector Dividend Dogs ETF |
| Statements of Changes in Net Assets |
| | | For the Year Ended November 30, 2016 | | | For the Year Ended November 30, 2015(a) | |
| OPERATIONS: | | | | | | |
| Net investment income | | $ | 441,428 | | | $ | 590,828 | |
Net realized loss(a) | | | (2,116,664 | ) | | | (434,028 | ) |
Net change in unrealized appreciation/(depreciation)(a) | | | 1,438,248 | | | | (2,340,026 | ) |
| Net decrease in net assets resulting from operations | | | (236,988 | ) | | | (2,183,226 | ) |
| | | | | | | | | |
| Net Equalization Credits | | | 239,304 | | | | 14,209 | |
| | | | | | | | | |
| DISTRIBUTIONS TO SHAREHOLDERS: | | | | | | | | |
From net investment income | | | (434,572 | ) | | | (433,154 | ) |
Total distributions | | | (434,572 | ) | | | (433,154 | ) |
| | | | | | | | | |
| CAPITAL SHARE TRANSACTIONS: | | | | | | | | |
| Proceeds from sale of shares | | | 15,512,093 | | | | 2,419,051 | |
| Cost of shares redeemed | | | (5,133,159 | ) | | | (1,081,951 | ) |
Net income equalization (Note 2) | | | (239,304 | ) | | | (14,209 | ) |
Net increase from share transactions | | | 10,139,630 | | | | 1,322,891 | |
| Net increase/(decrease) in net assets | | | 9,707,374 | | | | (1,279,280 | ) |
| | | | | | | | | |
| NET ASSETS: | | | | | | | | |
Beginning of period | | | 9,349,380 | | | | 10,628,660 | |
| End of period * | | $ | 19,056,754 | | | $ | 9,349,380 | |
| | | | | | | | | |
| * Including accumulated net investment income of: | | $ | 107,255 | | | $ | 134,699 | |
| | | | | | | | | |
| OTHER INFORMATION: | | | | | | | | |
| CAPITAL SHARE TRANSACTIONS: | | | | | | | | |
| Beginning shares | | | 450,000 | | | | 400,002 | |
| Shares sold | | | 700,000 | | | | 100,000 | |
Shares redeemed | | | (250,000 | ) | | | (50,002 | ) |
| Shares outstanding, end of period | | | 900,000 | | | | 450,000 | |
(a) | Prior to November 30, 2016, the Fund presented realized gain/loss and unrealized appreciation/depreciation by investment type. This change in presentation was made to conform to industry standards and had no effect on the Fund's change in net assets. |
See Notes to Financial Statements.
ALPS Sector Dividend Dogs ETF
| Financial Highlights | For a Share Outstanding Throughout the Periods Presented |
| | | For the Year Ended November 30, 2016 | | | For the Year Ended November 30, 2015 | | | For the Year Ended November 30, 2014 | | | For the Year Ended November 30, 2013 | | | For the Period June 29, 2012 (Commencement) to November 30, 2012 | |
| NET ASSET VALUE, BEGINNING OF PERIOD | | $ | 36.23 | | | $ | 38.80 | | | $ | 33.76 | | | $ | 26.71 | | | $ | 25.00 | |
| | | | | | | | | | | | | | | | | | | | | |
| INCOME/(LOSS) FROM INVESTMENT OPERATIONS: | | | | | | | | | | | | | | | | | |
Net investment income (a) | | | 1.26 | | | | 1.21 | | | | 1.35 | | | | 1.12 | | | | 0.59 | |
| Net realized and unrealized gain/(loss) | | | 6.15 | | | | (2.47 | ) | | | 4.94 | | | | 7.14 | | | | 1.41 | |
| Total from investment operations | | | 7.41 | | | | (1.26 | ) | | | 6.29 | | | | 8.26 | | | | 2.00 | |
| | | | | | | | | | | | | | | | | | | | | |
| DISTRIBUTIONS: | | | | | | | | | | | | | | | | | | | | |
| From net investment income | | | (1.34 | ) | | | (1.31 | ) | | | (1.25 | ) | | | (1.21 | ) | | | (0.29 | ) |
| Tax return of capital | | | (0.01 | ) | | | – | | | | – | | | | – | | | | – | |
| Total distributions | | | (1.35 | ) | | | (1.31 | ) | | | (1.25 | ) | | | (1.21 | ) | | | (0.29 | ) |
| | | | | | | | | | | | | | | | | | | | | |
| Net increase/(decrease) in net asset value | | | 6.06 | | | | (2.57 | ) | | | 5.04 | | | | 7.05 | | | | 1.71 | |
| NET ASSET VALUE, END OF PERIOD | | $ | 42.29 | | | $ | 36.23 | | | $ | 38.80 | | | $ | 33.76 | | | $ | 26.71 | |
TOTAL RETURN(b) | | | 20.86 | % | | | (3.21 | )% | | | 18.96 | % | | | 31.66 | % | | | 7.99 | % |
| | | | | | | | | | | | | | | | | | | | | |
| RATIOS/SUPPLEMENTAL DATA: | | | | | | | | | | | | | | | | | | | | |
| Net assets, end of period (000s) | | $ | 1,702,405 | | | $ | 1,014,899 | | | $ | 1,024,473 | | | $ | 464,277 | | | $ | 62,768 | |
| | | | | | | | | | | | | | | | | | | | | |
| Ratio of expenses to average net assets | | | 0.40 | % | | | 0.40 | % | | | 0.40 | % | | | 0.40 | % | | | 0.40 | %(c) |
| Ratio of net investment income to average net assets | | | 3.23 | % | | | 3.25 | % | | | 3.74 | % | | | 3.58 | % | | | 5.31 | %(c) |
Portfolio turnover rate(d) | | | 49 | % | | | 55 | % | | | 12 | % | | | 8 | % | | | 0 | % |
Undistributed net investment income included in price of units issued and redeemed(a)(e) | | $ | 0.06 | | | $ | 0.06 | | | $ | 0.09 | | | $ | 0.13 | | | $ | 0.19 | |
| (a) | Based on average shares outstanding during the period. |
| (b) | Total return is calculated assuming an initial investment made at the net asset value at the beginning of the period and redemption at the net asset value on the last day of the period and assuming all distributions are reinvested at reinvestment prices. Total return calculated for a period of less than one year is not annualized. |
| (d) | Portfolio turnover for periods less than one year is not annualized and does not include securities received or delivered from processing creations or redemptions in-kind. |
| (e) | The per share amount of equalization is presented to show the impact of equalization on distributable earnings per share. |
See Notes to Financial Statements.
ALPS International Sector Dividend Dogs ETF
| Financial Highlights | For a Share Outstanding Throughout the Periods Presented |
| | | For the Year Ended November 30, 2016 | | | For the Year Ended November 30, 2015 | | | For the Year Ended November 30, 2014 | | | For the Period June 28, 2013 (Commencement) to November 30, 2013 | |
| NET ASSET VALUE, BEGINNING OF PERIOD | | $ | 24.25 | | | $ | 27.33 | | | $ | 29.21 | | | $ | 25.00 | |
| | | | | | | | | | | | | | | | | |
| INCOME/(LOSS) FROM INVESTMENT OPERATIONS: | | | | | | | | | | | | | | | | |
Net investment income(a) | | | 1.00 | | | | 1.06 | | | | 1.19 | | | | 0.34 | |
| Net realized and unrealized gain/(loss) | | | (1.47 | ) | | | (3.13 | ) | | | (1.83 | ) | | | 4.08 | |
| Total from investment operations | | | (0.47 | ) | | | (2.07 | ) | | | (0.64 | ) | | | 4.42 | |
| | | | | | | | | | | | | | | | | |
| DISTRIBUTIONS: | | | | | | | | | | | | | | | | |
| From net investment income | | | (0.94 | ) | | | (0.99 | ) | | | (1.17 | ) | | | (0.21 | ) |
| Tax return of capital | | | – | | | | (0.02 | ) | | | (0.07 | ) | | | – | |
| Total distributions | | | (0.94 | ) | | | (1.01 | ) | | | (1.24 | ) | | | (0.21 | ) |
| | | | | | | | | | | | | | | | | |
| Net increase/(decrease) in net asset value | | | (1.41 | ) | | | (3.08 | ) | | | (1.88 | ) | | | 4.21 | |
| NET ASSET VALUE, END OF PERIOD | | $ | 22.84 | | | $ | 24.25 | | | $ | 27.33 | | | $ | 29.21 | |
TOTAL RETURN(b) | | | (1.95 | )% | | | (7.76 | )% | | | (2.53 | )% | | | 17.72 | % |
| | | | | | | | | | | | | | | | | |
| RATIOS/SUPPLEMENTAL DATA: | | | | | | | | | | | | | | | | |
| Net assets, end of period (000s) | | $ | 161,042 | | | $ | 135,778 | | | $ | 143,461 | | | $ | 77,411 | |
| | | | | | | | | | | | | | | | | |
| Ratio of expenses to average net assets | | | 0.50 | % | | | 0.50 | % | | | 0.50 | % | | | 0.50 | %(c) |
| Ratio of net investment income to average net assets | | | 4.28 | % | | | 4.05 | % | | | 4.05 | % | | | 2.87 | %(c) |
Portfolio turnover rate(d) | | | 47 | % | | | 67 | % | | | 19 | % | | | 2 | % |
Undistributed net investment income included in price of units issued and redeemed(a)(e) | | $ | 0.09 | | | $ | 0.05 | | | $ | 0.09 | | | $ | 0.14 | |
| (a) | Based on average shares outstanding during the period. |
| (b) | Total return is calculated assuming an initial investment made at the net asset value at the beginning of the period and redemption at the net asset value on the last day of the period and assuming all distributions are reinvested at reinvestment prices. Total return calculated for a period of less than one year is not annualized. |
| (d) | Portfolio turnover for periods less than one year is not annualized and does not include securities received or delivered from processing creations or redemptions in-kind. |
| (e) | The per share amount of equalization is presented to show the impact of equalization on distributable earnings per share. |
See Notes to Financial Statements.
ALPS Emerging Sector Dividend Dogs ETF
| Financial Highlights | For a Share Outstanding Throughout the Periods Presented |
| | | For the Year Ended November 30, 2016 | | | For the Year Ended November 30, 2015 | | | For the Period March 28, 2014 (Commencement to November 30, 2014 | |
| NET ASSET VALUE, BEGINNING OF PERIOD | | $ | 20.78 | | | $ | 26.57 | | | $ | 25.00 | |
| | | | | | | | | | | | | |
| INCOME/(LOSS) FROM INVESTMENT OPERATIONS: | | | | | | | | | | | | |
Net investment income(a) | | | 0.67 | | | | 1.26 | | | | 0.64 | |
| Net realized and unrealized gain/(loss) | | | 0.39 | | | | (6.15 | ) | | | 1.59 | |
| Total from investment operations | | | 1.06 | | | | (4.89 | ) | | | 2.23 | |
| | | | | | | | | | | | | |
| DISTRIBUTIONS: | | | | | | | | | | | | |
| From net investment income | | | (0.67 | ) | | | (0.90 | ) | | | (0.54 | ) |
| Tax return of capital | | | – | | | | – | | | | (0.12 | ) |
| Total distributions | | | (0.67 | ) | | | (0.90 | ) | | | (0.66 | ) |
| | | | | | | | | | | | | |
| Net increase/(decrease) in net asset value | | | 0.39 | | | | (5.79 | ) | | | 1.57 | |
| NET ASSET VALUE, END OF PERIOD | | $ | 21.17 | | | $ | 20.78 | | | $ | 26.57 | |
TOTAL RETURN(b) | | | 5.10 | % | | | (18.66 | )% | | | 8.93 | % |
| | | | | | | | | | | | | |
| RATIOS/SUPPLEMENTAL DATA: | | | | | | | | | | | | |
| Net assets, end of period (000s) | | $ | 19,057 | | | $ | 9,349 | | | $ | 10,629 | |
| | | | | | | | | | | | | |
| Ratio of expenses to average net assets | | | 0.60 | % | | | 0.60 | % | | | 0.60 | %(c) |
| Ratio of net investment income to average net assets | | | 3.11 | % | | | 5.34 | % | | | 3.54 | %(c) |
Portfolio turnover rate(d) | | | 68 | % | | | 96 | % | | | 19 | % |
Undistributed net investment income included in price of units issued and redeemed(a)(e) | | $ | 0.36 | | | $ | 0.03 | | | $ | 0.16 | |
| (a) | Based on average shares outstanding during the period. |
| (b) | Total return is calculated assuming an initial investment made at the net asset value at the beginning of the period and redemption at the net asset value on the last day of the period and assuming all distributions are reinvested at reinvestment prices. Total return calculated for a period of less than one year is not annualized. |
| (d) | Portfolio turnover for periods less than one year is not annualized and does not include securities received or delivered from processing creations or redemptions in-kind. |
| (e) | The per share amount of equalization is presented to show the impact of equalization on distributable earnings per share. |
See Notes to Financial Statements.
| ALPS Sector Dividend Dogs Series | |
| Notes to Financial Statements | November 30, 2016 |
ALPS ETF Trust (the “Trust”), a Delaware statutory trust, is an open‐end management investment company under the Investment Company Act of 1940, as amended (the “1940 Act”). As of November 30, 2016, the Trust consisted of nineteen separate portfolios. Each portfolio represents a separate series of the Trust. This report pertains to the ALPS Sector Dividend Dogs ETF, the ALPS International Sector Dividend Dogs ETF, and the ALPS Emerging Sector Dividend Dogs ETF (each a “Fund” and collectively, the “Funds”). Each Fund has elected to qualify as a diversified series of the Trust under the 1940 Act.
The investment objective of the ALPS Sector Dividend Dogs ETF is to seek investment results that replicate as closely as possible, before fees and expenses, the performance of the S‐Network® Sector Dividend Dogs Index. The investment objective of the ALPS International Sector Dividend Dogs ETF is to seek investment results that replicate as closely as possible, before fees and expenses, the performance of the S‐Network® International Sector Dividend Dogs Index. The investment objective of the ALPS Emerging Sector Dividend Dogs ETF is to seek investment results that replicate as closely as possible, before fees and expenses, the performance of the S‐Network® Emerging Sector Dividend Dogs Index.
Each Fund’s Shares (“Shares”) are listed on the New York Stock Exchange (“NYSE”) Arca. Each Fund issues and redeems Shares, at net asset value (“NAV”) in blocks of 50,000 Shares, each of which is called a “Creation Unit”. Creation Units are issued and redeemed principally in‐kind for securities included in the Underlying Index. Except when aggregated in Creation Units, Shares are not redeemable securities of the Fund.
Pursuant to the Trust’s organizational documents, its Officers and Trustees are indemnified against certain liability arising out of the performance of their duties to the Trust. Additionally, in the normal course of business, the Trust enters into contracts with service providers that contain general indemnification clauses. The Trust’s maximum exposure under these arrangements is unknown, as this would involve future claims that may be made against the Trust that have not yet occurred.
| 2. | SIGNIFICANT ACCOUNTING POLICIES |
The following is a summary of significant accounting policies consistently followed by the Funds in the preparation of the financial statements. The accompanying financial statements were prepared in accordance with accounting principles generally accepted in the United States of America (“U.S. GAAP”). The preparation of financial statements in conformity with U.S. GAAP requires management to make certain estimates and assumptions that affect the reported amounts of assets and liabilities and disclosures of contingent assets and liabilities at the date of the financial statements and the reported amounts of revenue and expenses during the period. Actual results could differ from those estimates. Each Fund is considered an investment company under U.S. GAAP and follows the accounting and reporting guidance applicable to investment companies in the Financial Accounting Standards Board Accounting Standards Codification Topic 946.
A. Portfolio Valuation
Each Fund’s NAV is determined daily, as of the close of regular trading on the New York Stock Exchange (“NYSE”), normally 4:00 p.m. Eastern time, on each day the NYSE is open for trading. The NAV is computed by dividing the value of all assets of the Fund (including accrued interest and dividends), less all liabilities (including accrued expenses and dividends declared but unpaid), by the total number of shares outstanding.
Portfolio securities listed on any exchange other than the NASDAQ Stock Market LLC (“NASDAQ”) are valued at the last sale price on the business day as of which such value is being determined. If there has been no sale on such day, the securities are valued at the mean of the most recent bid and ask prices on such day. Securities traded on the NASDAQ are valued at the NASDAQ Official Closing Price as determined by NASDAQ. Portfolio securities traded on more than one securities exchange are valued at the last sale price on the business day as of which such value is being determined at the close of the exchange representing the principal market for such securities. Portfolio securities traded in the over‐the‐counter market, but excluding securities traded on the NASDAQ, are valued at the latest quoted sale price in such market.
The Funds’ investments are valued at market value or, in the absence of market value with respect to any portfolio securities, at fair value according to procedures adopted by the Trust’s Board of Trustees (the “Board”). When market quotations are not readily available or when events occur that make established valuation methods unreliable, securities of the Funds may be valued in good faith by or under the direction of the Board. These securities generally include, but are not limited to, restricted securities (securities which may not be publicly sold without registration under the Securities Act of 1933) for which a pricing service is unable to provide a market price; securities whose trading has been formally suspended; a security whose market price is not available from a pre‐established primary pricing source or the pricing source is not willing to provide a price; a security with respect to which an event has occurred that is most likely to materially affect the value of the security after the market has closed but before the calculation of the Fund’s NAV or make it difficult or impossible to obtain a reliable market quotation; or a security whose price, as provided by the pricing service, does not reflect the security’s “fair value” due to the security being de‐listed from a national exchange or the security’s primary trading market is temporarily closed at a time when, under normal conditions, it would be open. As a general principle, the current “fair value” of a security would be the amount which the owner might reasonably expect to receive from the sale on the applicable exchange or principal market. A variety of factors may be considered in determining the fair value of such securities.
| ALPS Sector Dividend Dogs Series | |
| Notes to Financial Statements | November 30, 2016 |
B. Fair Value Measurements
Each Fund discloses the classification of its fair value measurements following a three‐tier hierarchy based on the inputs used to measure fair value. Inputs refer broadly to the assumptions that market participants would use in pricing the asset or liability, including assumptions about risk. Inputs may be observable or unobservable. Observable inputs reflect the assumptions market participants would use in pricing the asset or liability that are developed based on market data obtained from sources independent of the reporting entity. Unobservable inputs reflect the reporting entity’s own assumptions about the assumptions market participants would use in pricing the asset or liability that are developed based on the best information available.
Valuation techniques used to value the Funds’ investments by major category are as follows:
Equity securities, including restricted securities, for which market quotations are readily available, are valued at the last reported sale price or official closing price as reported by a third party pricing vendor on the primary market or exchange on which they are traded and are categorized as Level 1 in the hierarchy. In the event there were no sales during the day or closing prices are not available, securities are valued at the mean of the most recent quoted bid and ask prices on such day and are generally categorized as Level 2 in the hierarchy. Investments in open‐end mutual funds are valued at their closing NAV each business day and are categorized as Level 1 in the hierarchy.
Changes in valuation techniques may result in transfers in or out of an assigned level within the disclosure hierarchy.
Various inputs are used in determining the value of each Fund’s investments as of the end of the reporting period. When inputs used fall into different levels of the fair value hierarchy, the level in the hierarchy within which the fair value measurement falls is determined based on the lowest level input that is significant to the fair value measurement in its entirety. The designated input levels are not necessarily an indication of the risk or liquidity associated with these investments.
These inputs are categorized in the following hierarchy under applicable financial accounting standards:
| Level 1 – | Unadjusted quoted prices in active markets for identical investments, unrestricted assets or liabilities that a Fund has the ability to access at the measurement date; |
| Level 2 – | Quoted prices which are not active, quoted prices for similar assets or liabilities in active markets or inputs other than quoted prices that are observable (either directly or indirectly) for substantially the full term of the asset or liability; and |
| Level 3 – | Significant unobservable prices or inputs (including the Fund’s own assumptions in determining the fair value of investments) where there is little or no market activity for the asset or liability at the measurement date. |
The following is a summary of the inputs used to value the Funds’ investments at November 30, 2016:
ALPS Sector Dividend Dogs ETF
| Investments in Securities at Value* | | Level 1 - Unadjusted Quoted Prices | | | Level 2 - Other Significant Observable Inputs | | | Level 3 - Significant Unobservable Inputs | | | Total | |
| Common Stocks | | $ | 1,696,147,855 | | | $ | – | | | $ | – | | | $ | 1,696,147,855 | |
Short Term Investments | | | 1,448,428 | | | | – | | | | – | | | | 1,448,428 | |
| TOTAL | | $ | 1,697,596,283 | | | $ | – | | | $ | – | | | $ | 1,697,596,283 | |
ALPS International Sector Dividend Dogs ETF
| Investments in Securities at Value* | | Level 1 - Unadjusted Quoted Prices | | | Level 2 - Other Significant Observable Inputs | | | Level 3 - Significant Unobservable Inputs | | | Total | |
| Common Stocks | | $ | 159,735,014 | | | $ | – | | | $ | – | | | $ | 159,735,014 | |
Short Term Investments | | | 118,247 | | | | – | | | | – | | | | 118,247 | |
| TOTAL | | $ | 159,853,261 | | | $ | – | | | $ | – | | | $ | 159,853,261 | |
| ALPS Sector Dividend Dogs Series | |
| Notes to Financial Statements | November 30, 2016 |
ALPS Emerging Sector Dividend Dogs ETF
| Investments in Securities at Value* | | Level 1 - Unadjusted Quoted Prices | | | Level 2 - Other Significant Observable Inputs | | | Level 3 - Significant Unobservable Inputs | | | Total | |
| Common Stocks | | $ | 19,022,088 | | | $ | – | | | $ | – | | | $ | 19,022,088 | |
Short Term Investments | | | 19,958 | | | | – | | | | – | | | | 19,958 | |
| TOTAL | | $ | 19,042,046 | | | $ | – | | | $ | – | | | $ | 19,042,046 | |
| * | For a detailed sector/country breakdown, see the accompanying Schedule of Investments. |
The Funds recognize transfers between levels as of the end of the period. For the year ended November 30, 2016, the Funds did not have any transfers between Level 1 and Level 2 securities. The Funds did not have any securities that used significant unobservable inputs (Level 3) in determining fair value.
C. Foreign Securities
The ALPS International Sector Dividend Dogs ETF and the ALPS Emerging Sector Dividend Dogs ETF may directly purchase securities of foreign issuers. Investments in non‐U.S. issuers may involve unique risks compared to investing in securities of U.S. issuers, including, among others, less liquidity generally, greater market volatility than U.S. securities and less complete financial information than for U.S. issuers. In addition, adverse political, economic or social developments could undermine the value of the Fund’s investments or prevent the Fund from realizing the full value of its investments. Financial reporting standards for companies based in foreign markets differ from those in the United States. Finally, the value of the currency of the country in which the Fund has invested could decline relative to the value of the U.S. dollar, which may affect the value of the investment to U.S. investors.
Because foreign markets may be open on different days than the days during which investors may purchase the shares of each Fund, the value of each Fund's securities may change on the days when investors are not able to purchase the shares of the Funds. The value of securities denominated in foreign currencies is converted into U.S. dollars using exchange rates determined daily as of the close of regular trading on the NYSE or NASDAQ. Any use of a different rate from the rates used by the Index may adversely affect a Fund's ability to track its Index.
D. Foreign Currency Translation
The books and records of the Funds are maintained in U.S. dollars. Investment valuations and other assets and liabilities initially expressed in foreign currencies are converted each business day into U.S. dollars based upon current exchange rates. The portion of realized and unrealized gains or losses on investments due to fluctuations in foreign currency exchange rates is not separately disclosed and is included in realized and unrealized gains or losses on investments, when applicable.
E. Securities Transactions and Investment Income
Securities transactions are recorded as of the trade date. Realized gains and losses from securities transactions are recorded on the highest cost basis. Dividend income and capital gains distributions, if any, are recorded on the ex‐dividend date, net of any foreign taxes withheld. Interest income, if any, is recorded on the accrual basis, including any amortization of premiums and accretion of discounts.
F. Dividends and Distributions to Shareholders
Dividends from net investment income for each Fund, if any, are declared and paid quarterly or as the Board may determine from time to time. Distributions of net realized capital gains earned by the Funds, if any, are distributed at least annually.
G. Equalization
The Funds utilize the accounting practice known as “Equalization” by which a portion of the proceeds from sales and costs of reacquiring the Funds’ shares, equivalent on a per share basis to the amount of distributable net investment income on the date of the transaction, is credited or charged to undistributed net investment income. As a result, undistributed net investment income per share is unaffected by sales or reacquisitions of the Funds’ shares. Amounts related to Equalization can be found on the Statement of Changes in Net Assets.
H. Federal Tax and Tax Basis Information
The timing and character of income and capital gain distributions are determined in accordance with income tax regulations, which may differ from U.S. GAAP. Reclassifications are made to the Fund’s capital accounts for permanent tax differences to reflect income and gains available for distribution (or available capital loss carryforwards) under income tax regulations.
| ALPS Sector Dividend Dogs Series | |
| Notes to Financial Statements | November 30, 2016 |
For the year or period ended November 30, 2016, the following reclassifications, which had no impact on results of operations or net assets, were recorded to reflect permanent tax differences resulting primarily from in‐kind transactions:
| Fund | | Paid-in Capital | | | Accumulated Net Investment Income/(Loss) | | | Accumulated Net Realized Gain/(Loss) on Investments | |
| ALPS Sector Dividend Dogs ETF | | $ | 51,316,729 | | | $ | 906,468 | | | $ | (52,223,197 | ) |
| ALPS International Sector Dividend Dogs ETF | | | (588,561 | ) | | | (34,984 | ) | | | 623,545 | |
| ALPS Emerging Sector Dividend Dogs ETF | | | 111,478 | | | | (34,300 | ) | | | (77,178 | ) |
The tax character of the distributions paid during the fiscal years ended November 30, 2016 and November 30, 2015 were as follows:
| Fund | | Ordinary Income | | | Return of Capital | |
| November 30, 2016 | | | | | | |
| ALPS Sector Dividend Dogs ETF | | $ | 41,467,278 | | | $ | 366,916 | |
| ALPS International Sector Dividend Dogs ETF | | | 5,356,978 | | | | – | |
| ALPS Emerging Sector Dividend Dogs ETF | | | 434,572 | | | | – | |
| November 30, 2015 | | | | | | | | |
| ALPS Sector Dividend Dogs ETF | | | 39,961,342 | | | | – | |
| ALPS International Sector Dividend Dogs ETF | | | 6,203,669 | | | | 115,516 | |
| ALPS Emerging Sector Dividend Dogs ETF | | | 433,154 | | | | – | |
At November 30, 2016, capital losses deferred to the next tax year were as follows:
| Fund | | Short-Term | | | Long-Term | |
| ALPS Sector Dividend Dogs ETF | | $ | 20,518,164 | | | $ | 64,757,527 | |
| ALPS International Sector Dividend Dogs ETF | | | 14,788,660 | | | | 2,977,142 | |
| ALPS Emerging Sector Dividend Dogs ETF | | | 1,210,149 | | | | 1,123,022 | |
As of November 30, 2016, the components of distributable earnings on a tax basis for the Funds were as follows:
| | | Undistributed net investment income | | | Accumulated net realized loss on investments | | | Net unrealized appreciation/ (depreciation) on investments | | | Total | |
| ALPS Sector Dividend Dogs ETF | | $ | – | | | $ | (85,275,691 | ) | | $ | 149,397,751 | | | $ | 64,122,060 | |
| ALPS International Sector Dividend Dogs ETF | | | 512,514 | | | | (17,765,802 | ) | | | (24,916,077 | ) | | | (42,169,365 | ) |
| ALPS Emerging Sector Dividend Dogs ETF | | | 107,255 | | | | (2,333,171 | ) | | | (1,096,808 | ) | | | (3,322,724 | ) |
As of November 30, 2016, the costs of investments for federal income tax purposes and accumulated net unrealized appreciation/(depreciation) on investments were as follows:
| | | Gross
Appreciation
(excess of value
over tax cost) | | | Gross
Depreciation
(excess of tax
cost over value) | | | Net
Appreciation/(Depreciation)
of Foreign Currency | | | Net Unrealized
Appreciation/(Depreciation) | | | Cost of
Investments for
Income Tax
Purposes | |
| ALPS Sector Dividend Dogs ETF | | $ | 213,886,388 | | | $ | (64,488,637 | ) | | $ | – | | | $ | 149,397,751 | | | $ | 1,548,198,532 | |
| ALPS International Sector Dividend Dogs ETF | | | 6,831,118 | | | | (31,657,308 | ) | | | (89,887 | ) | | | (24,916,077 | ) | | | 184,679,451 | |
| ALPS Emerging Sector Dividend Dogs ETF | | | 1,334,537 | | | | (2,430,753 | ) | | | (592 | ) | | | (1,096,808 | ) | | | 20,138,262 | |
The differences between book‐basis and tax‐basis are primarily due to the deferral of losses from wash sales.
| ALPS Sector Dividend Dogs Series | |
| Notes to Financial Statements | November 30, 2016 |
I. Income Taxes
No provision for income taxes is included in the accompanying financial statements, as each Fund intends to distribute to shareholders all taxable investment income and realized gains and otherwise comply with Subchapter M of the Internal Revenue Code of 1986, as amended, applicable to regulated investment companies. Each Fund evaluates tax positions taken (or expected to be taken) in the course of preparing the Fund’s tax returns to determine whether these positions meet a “more‐likely‐than‐not” standard that, based on the technical merits, have a more than fifty percent likelihood of being sustained by a taxing authority upon examination. A tax position that meets the “more‐likely‐than‐not” recognition threshold is measured to determine the amount of benefit to recognize in the financial statements.
As of and during the year ended November 30, 2016, each Fund did not have a liability for any unrecognized tax benefits. Each Fund files U.S. federal, state, and local tax returns as required. Each Fund’s tax returns are subject to examination by the relevant tax authorities until expiration of the applicable statute of limitations, which is generally three years after the filing of the tax return, but may extend to four years in certain jurisdictions. Each Fund’s tax returns for open years have incorporated no uncertain tax positions that require a provision for income taxes.
| 3. | INVESTMENT ADVISORY FEE AND OTHER AFFILIATED TRANSACTIONS |
ALPS Advisors, Inc. (the “Adviser”) acts as the Funds’ investment adviser pursuant to advisory agreements with the Trust on behalf of each Fund (the “Advisory Agreement”). Pursuant to the Advisory Agreement, each Fund pays the Adviser a unitary fee for the services and facilities it provides, payable on a monthly basis as a percentage of each Fund’s average daily net assets as set out below. From time to time, the Adviser may waive all or a portion of its fee.
| Fund | Advisory Fee |
ALPS Sector Dividend Dogs ETF | 0.40% |
ALPS International Sector Dividend Dogs ETF | 0.50% |
| ALPS Emerging Sector Dividend Dogs ETF | 0.60% |
Out of the unitary management fee, the Adviser pays substantially all expenses of each Fund, including the cost of transfer agency, custody, fund administration, legal, audit, independent trustees and other services, except for interest expenses, distribution fees or expenses, brokerage expenses, taxes and extraordinary expenses not incurred in the ordinary course of each Fund's business. The Adviser’s unitary management fee is designed to pay substantially all of each Fund's expenses and to compensate the Adviser for providing services for each Fund.
ALPS Fund Services, Inc., an affiliate of the Adviser, is the administrator for the Funds.
Each Trustee who is not an officer or employee of the Adviser, any sub‐adviser or any of their affiliates (“Independent Trustees”) receives (1) a quarterly retainer of $5,000, (2) a per meeting fee for regularly scheduled meetings of $3,750, (3) $1,500 for any special meeting held outside of a regularly scheduled board meeting, and (4) reimbursement for all reasonable out‐of‐pocket expenses relating to attendance at meetings.
| 4. | PURCHASES AND SALES OF SECURITIES |
For the year ended November 30, 2016, the cost of purchases and proceeds from sales of investment securities, excluding short‐term investments and in‐kind transactions, were as follows:
| Fund | | Purchases | | | Sales | |
ALPS Sector Dividend Dogs ETF | | $ | 635,164,718 | | | $ | 604,283,672 | |
ALPS International Sector Dividend Dogs ETF | | | 65,163,063 | | | | 64,398,237 | |
ALPS Emerging Sector Dividend Dogs ETF | | | 11,950,047 | | | | 9,596,523 | |
For the year ended November 30, 2016, the cost of in‐kind purchases and proceeds from in‐kind sales were as follows:
| Fund | | Purchases | | | Sales | |
ALPS Sector Dividend Dogs ETF | | $ | 872,752,317 | | | $ | 382,676,991 | |
ALPS International Sector Dividend Dogs ETF | | | 45,126,249 | | | | 10,236,042 | |
ALPS Emerging Sector Dividend Dogs ETF | | | 11,960,127 | | | | 3,991,606 | |
| ALPS Sector Dividend Dogs Series | |
| Notes to Financial Statements | November 30, 2016 |
For the year ended November 30, 2016, the in‐kind net realized gains/(losses) were as follows:
| Fund | | Net Realized Gain/(Loss) | |
ALPS Sector Dividend Dogs ETF | | $ | 53,784,709 | |
ALPS International Sector Dividend Dogs ETF | | | (527,167 | ) |
ALPS Emerging Sector Dividend Dogs ETF | | | 138,026 | |
Gains on in‐kind transactions are not considered taxable for federal income tax purposes and losses on in kind transactions are also not deductible for tax purposes.
| 5. | CAPITAL SHARE TRANSACTIONS |
Shares are created and redeemed by each Fund only in Creation Unit size aggregations of 50,000 shares. Only broker‐dealers or large institutional investors with creation and redemption agreements called Authorized Participants (“AP”) are permitted to purchase or redeem Creation Units from the Funds. Such transactions are generally permitted on an in‐kind basis, with a balancing cash component to equate the transaction to the NAV per unit of each Fund on the transaction date. Cash may be substituted equivalent to the value of certain securities generally when they are not available in sufficient quantity for delivery, not eligible for trading by the AP or as a result of other market circumstances.
| 6. | RELATED PARTY TRANSACTIONS |
The ALPS Sector Dividend Dog ETF engaged in cross trades between each other during the year ended November 30, 2016 pursuant to Rule 17a‐7 under the 1940 Act. Cross trading is the buying or selling of portfolio securities between funds to which the Adviser serves as the investment adviser. The Board previously adopted procedures that apply to transactions between the Funds of the Trust pursuant to Rule 17a‐7. These transactions related to cross trades during the period complied with the requirements set forth by Rule 17a‐7 and the Trust’s procedures.
Transactions related to cross trades during the year ended November 30, 2016, were as follows:
| Fund | | Purchase cost paid | | | Sale proceeds received | | | Realized gain/ (loss) on sales | |
| ALPS Sector Dividend Dogs ETF | | $ | 2,790,076 | | | $ | 962,323 | | | $ | (76,336 | ) |
ALPS Sector Dividend Dogs Series
| Additional Information | November 30, 2016 (Unaudited) |
PROXY VOTING POLICIES AND PROCEDURES
Information regarding how the Fund voted proxies relating to portfolio securities during the most recent 12‐month period ended June 30 and a description of the Fund’s proxy voting policies and procedures used in determining how to vote for proxies are available without charge on the Securities and Exchange Commission’s (“SEC”) website at www.sec.gov and upon request, by calling (toll‐free) 1‐866‐675‐2639.
PORTFOLIO HOLDINGS
The Trust is required to disclose, after its first and third fiscal quarters, the complete schedule of each Fund’s portfolio holdings with the SEC on Form N‐Q. Form N‐Q for each Fund will be available on the SEC’s website at www.sec.gov. Each Fund’s Form N‐Q may also be reviewed and copied at the SEC’s Public Reference Room in Washington, D.C. and information on the operation of the Public Reference Room may be obtained by calling 1‐800‐SEC‐0330. Each Fund’s Form N‐Q will be available without charge, upon request, by calling (toll‐free) 1‐866‐675‐2639 or by writing to ALPS ETF Trust at 1290 Broadway, Suite 1100, Denver, Colorado 80203.
TAX INFORMATION
The Funds designated the following for federal income tax purposes for distributions made during the calendar year ended December 31, 2015:
| | Qualified Dividend Income | Dividend Received Deduction |
| ALPS International Sector Dividend Dogs ETF | 100.00% | 0.00% |
| ALPS Sector Dividend Dogs ETF | 100.00% | 91.18% |
| Alps Emerging Sector Dividend Dogs ETF | 100.00% | 0.00% |
In early 2016, if applicable, shareholders of record received this information for the distributions paid to them by the Funds during the calendar year 2015 via Form 1099. The Funds will notify shareholders in early 2017 of amounts paid to them by the Funds, if any, during the calendar year 2016.
Pursuant to Section 853(c) of the Internal Revenue Code, the following Funds designated the following:
| | | Foreign Taxes Paid | | | Foreign Source Income | |
| ALPS International Sector Dividend Dogs ETF | | $ | 413,586 | | | $ | 5,108,471 | |
| Alps Emerging Sector Dividend Dogs ETF | | $ | 55,637 | | | $ | 513,261 | |
LICENSING AGREEMENTS
ALPS Sector Dividend Dogs ETF, ALPS International Sector Dividend Dogs ETF, and ALPS Emerging Sector Dividend Dogs ETF
The Funds are not sponsored, endorsed, sold or promoted by the Index Provider. The Index Provider makes no representation or warranty, express or implied, to the owners of each Fund or any member of the public regarding the advisability of investing in securities generally or in each Fund particularly or the ability of each Fund to track the performance of the physical commodities market. The Index Provider’s only relationship to the Adviser or each Fund is the licensing of certain service marks and trade names of the Index Provider and of each Underlying Index that is determined, composed and calculated by the Index Provider without regard to the Adviser or the Funds. The Index Provider has no obligation to take the needs of the Adviser or the Funds or the owners of each Fund into consideration in determining, composing or calculating each Underlying Index. The Index Provider is not responsible for and has not participated in the determination of the timing of, prices at, or quantities of each Fund to be issued or in the determination or calculation of the equation by which each Fund is to be converted into cash. The Index Provider has no obligation or liability in connection with the administration, marketing or trading of each Fund.
THE INDEX PROVIDER DOES NOT GUARANTEE THE ACCURACY AND/OR THE COMPLETENESS OF EACH UNDERLYING INDEX OR ANY DATA INCLUDED THEREIN AND THE INDEX PROVIDER SHALL HAVE NO LIABILITY FOR ANY ERRORS, OMISSIONS, OR INTERRUPTIONS THEREIN. THE INDEX PROVIDER MAKES NO WARRANTY, EXPRESS OR IMPLIED, AS TO RESULTS TO BE OBTAINED BY THE ADVISER, EACH FUND, OWNERS OF EACH FUND, OR ANY OTHER PERSON OR ENTITY FROM THE USE OF THE UNDERLYING INDEX OR ANY DATA INCLUDED THEREIN. THE INDEX PROVIDER MAKES NO EXPRESS OR IMPLIED WARRANTIES, AND EXPRESSLY DISCLAIMS ALL WARRANTIES OF MERCHANTABILITY OR FITNESS FOR A PARTICULAR PURPOSE OR USE WITH RESPECT TO EACH UNDERLYING INDEX OR ANY DATA INCLUDED THEREIN. WITHOUT LIMITING ANY OF THE FOREGOING, IN NO EVENT SHALL THE INDEX PROVIDER HAVE ANY LIABILITY FOR ANY SPECIAL, PUNITIVE, INDIRECT, OR CONSEQUENTIAL DAMAGES (INCLUDING LOST PROFITS), EVEN IF NOTIFIED OF THE POSSIBILITY OF SUCH DAMAGES.
ALPS Sector Dividend Dogs Series
| Additional Information | November 30, 2016 (Unaudited) |
The Funds are not sponsored, endorsed, sold or promoted by Standard & Poor’s, a division of The McGraw‐Hill Companies, Inc. (“S&P”) or its third party licensors. Neither S&P nor its third party licensors make any representation or warranty, express or implied, to the owners of each Fund or any member of the public regarding the advisability of investing in securities generally or in each Fund particularly or the ability of each Underlying Index to track general stock market performance. S&P’s and its third party licensor’s only relationship to the Index Provider is the licensing of certain trademarks, service marks and trade names of S&P and/or its third party licensors and for the providing of calculation and maintenance services related to the Underlying Index. Neither S&P nor its third party licensors is responsible for and has not participated in the determination of the prices and amount of each Fund or the timing of the issuance or sale of each Fund or in the determination or calculation of the equation by which each Fund is to be converted into cash. S&P has no obligation or liability in connection with the administration, marketing or trading of each Fund.
NEITHER S&P, ITS AFFILIATES NOR THEIR THIRD PARTY LICENSORS GUARANTEE THE ADEQUACY, ACCURACY, TIMELINESS OR COMPLETENESS OF EACH UNDERLYING INDEX OR ANY DATA INCLUDED THEREIN OR ANY COMMUNICATIONS, INCLUDING BUT NOT LIMITED TO, ORAL OR WRITTEN COMMUNICATIONS (INCLUDING ELECTRONIC COMMUNICATIONS) WITH RESPECT THERETO. S&P, ITS AFFILIATES AND THEIR THIRD PARTY LICENSORS SHALL NOT BE SUBJECT TO ANY DAMAGES OR LIABILITY FOR ANY ERRORS, OMISSIONS OR DELAYS THEREIN. S&P MAKES NO EXPRESS OR IMPLIED WARRANTIES, AND EXPRESSLY DISCLAIMS ALL WARRANTIES OF MERCHANTABILITY OR FITNESS FOR A PARTICULAR PURPOSE OR USE WITH RESPECT TO ITS TRADEMARKS, EACH UNDERLYING INDEX OR ANY DATA INCLUDED THEREIN. WITHOUT LIMITING ANY OF THE FOREGOING, IN NO EVENT WHATSOEVER SHALL S&P, ITS AFFILIATES OR THEIR THIRD PARTY LICENSORS BE LIABLE FOR ANY INDIRECT, SPECIAL, INCIDENTAL, PUNITIVE OR CONSEQUENTIAL DAMAGES, INCLUDING BUT NOT LIMITED TO, LOSS OF PROFITS, TRADING LOSSES, LOST TIME OR GOODWILL, EVEN IF THEY HAVE BEEN ADVISED OF THE POSSIBILITY OF SUCH DAMAGES, WHETHER IN CONTRACT, TORT, STRICT LIABILITY OR OTHERWISE.
Standard & Poor’s® and S&P® are registered trademarks of The McGraw‐Hill Companies, Inc.; “Calculated by S&P Custom Indices” and its related stylized mark are service marks of The McGraw‐Hill Companies, Inc. These marks have been licensed for use by the Index Provider.
The S&P 500® is the property of Standard and Poor’s Financial Services LLC (“S&P”) and has been licensed by S&P for use by S‐Network® Global Indexes, Inc. in connection with the S‐Network® Sector Dividend Dogs Index (Ticker: SDOGX), the S‐Network® Emerging Sector Dividend Dogs Index (Ticker: EDOGX), and the S‐Network® International Sector Dividend Dogs Index (Ticker: IDOGX).
The Adviser does not guarantee the accuracy and/or the completeness of each Underlying Index or any data included therein, and the Adviser shall have no liability for any errors, omissions or interruptions therein. The Adviser makes no warranty, express or implied, as to results to be obtained by each Fund, owners of the Shares of each Fund or any other person or entity from the use of each Underlying Index or any data included therein. The Adviser makes no express or implied warranties, and expressly disclaims all warranties of merchantability or fitness for a particular purpose or use with respect to each Underlying Index or any data included therein. Without limiting any of the foregoing, in no event shall the Adviser have any liability for any special, punitive, direct, indirect or consequential damages (including lost profits) arising out of matters relating to the use of each Underlying Index, even if notified of the possibility of such damages.
ALPS Sector Dividend Dogs Series
| Board Considerations Regarding Approval of Investment Advisory Agreements | November 30, 2016 (Unaudited) |
At an in‐person meeting held on June 6, 2016, the Board of Trustees of the Trust (the “Board” or the “Trustees”), including the Trustees who are not “interested persons” of the Trust within the meaning of the 1940 Act, as amended (the “Independent Trustees”), evaluated a proposal to approve the continuance of the Investment Advisory Agreement between the Trust and ALPS Advisors, Inc. (the “Adviser” or “AAI”) with respect to the ALPS Sector Dividend Dogs ETF (“SDOG”), ALPS International Sector Dividend Dogs ETF (“IDOG”) and ALPS Emerging Sector Dividend Dogs ETF (“EDOG”) (each a “Fund” and collectively “the Funds”). The Independent Trustees also met separately to consider the Investment Advisory Agreements.
In evaluating the Investment Advisory Agreements with respect to the Funds, the Trustees considered various factors, including (i) the nature, extent and quality of the services provided by AAI with respect to the applicable Fund under the Investment Advisory Agreements; (ii) the advisory fees and other expenses paid by the Funds compared to those of similar funds managed by other investment advisers; (iii) the costs of the services provided to the Funds by AAI and the profits realized by AAI and its affiliates from its relationship to the Funds; (iv) the extent to which economies of scale have been or would be realized if and as the assets of the Funds grow and whether fees reflect the economies of scale for the benefit of shareholders; and (v) any additional benefits and other considerations.
With respect to the nature, extent and quality of the services provided by AAI under the Investment Advisory Agreements, the Trustees considered and reviewed information concerning the services provided under the Investment Advisory Agreements, the investment parameters of the index of each Fund, financial information regarding AAI and its parent company, information describing AAI’s current organization and the background and experience of the persons responsible for the day‐to‐day management of the Funds.
The Trustees reviewed information on the performance of each Fund and its applicable benchmark. The Trustees also evaluated the correlation and tracking error between each underlying index and its corresponding Fund’s performance. Based on their review, the Trustees found that the nature and extent of services provided to each Fund under the Investment Advisory Agreements was appropriate and that the quality was satisfactory.
The Trustees noted that the advisory fees for each Fund were unitary fees pursuant to which AAI assumes all expenses of the Funds (including the cost of transfer agency, custody, fund administration, legal, audit and other services) other than the payments under the Advisory Agreement, brokerage expenses, taxes, interest, litigation expenses and other extraordinary expenses.
With respect to advisory fee rates, the Trustees noted the following:
The net advisory fee rate for each SDOG and IDOG is higher than the median of its Broadridge expense group. For IDOG, its net advisory fee rates were slightly above the median of its Broadridge expense group. The Funds’ respective expense ratios, however, are (i) in the case of SDOG, slightly above the median of its Broadridge expense group and (ii) in the case of IDOG, below the median of its Broadridge expense group.
EDOG’s net advisory fee rate was slightly below the median of its Broadridge expense group. EDOG’s expense ratio is slightly lower than the median for its Broadridge expense group.
Based on the foregoing, and the other information available to them, the Trustees concluded that the advisory fee rate for each of the Funds was reasonable under the circumstances and in light of the quality of the services provided.
The Trustees considered other benefits available to AAI because of its relationship with the Funds and concluded that the advisory fees were reasonable taking into account any such benefits.
The Trustees also considered with respect to each Fund the information provided by AAI about the costs and profitability of AAI with respect to each of the Funds. The Trustees reviewed and noted the relatively small sizes of the Funds (other than SDOG) and concluded that AAI was not realizing any economies of scale other than SDOG. With respect to SDOG, the Trustees considered the growth in assets and that the Fund may be achieving some economies of scale. They also noted the Adviser’s view that SDOG remains in line with category average for fees and at a smaller scale than many ETFs with similar fees. The Trustees noted that SDOG is still a relatively new product, which makes it difficult to quantify the potential variability in net assets and thus determine the sustainability of any potential economies of scale which may exist. The Trustees determined that they would continue to evaluate whether further economies of scale have been achieved on an ongoing basis.
In voting to renew each Investment Advisory Agreement, the Trustees concluded that the terms of each Investment Advisory Agreement are reasonable and fair in light of the services to be performed, the fees paid by certain other funds, expenses to be incurred and such other matters as the Trustees considered relevant in the exercise of their reasonable business judgment. The Trustees did not identify any single factor or group of factors as all important or controlling and considered all factors together.
| ALPS Sector Dividend Dogs Series | |
| Trustees & Officers | November 30, 2016 (Unaudited) |
The general supervision of the duties performed by the Adviser for the Fund under the Investment Advisory Agreement is the responsibility of the Board of Trustees. The Trust currently has four Trustees. Three Trustees have no affiliation or business connection with the Adviser or any of its affiliated persons and do not own any stock or other securities issued by the Adviser. These are the “non-interested” or “independent” Trustees (“Independent Trustees”). The other Trustee (the “Interested Trustee”) is affiliated with the Adviser.
The Independent Trustees of the Trust, their term of office and length of time served, their principal business occupations during the past five years, the number of portfolios in the Fund Complex overseen by each Independent Trustee, and other directorships, if any, held by the Trustee are shown below.
INDEPENDENT TRUSTEES
Name, Address & Year of Birth* | Position(s) Held with Trust | Term of Office and Length of Time Served** | Principal Occupation(s) During Past 5 Years | Number of Portfolios in Fund Complex Overseen by Trustees*** | Other Directorships Held by Trustees |
| Mary K. Anstine, 1940 | Trustee | Since March 2008 | Ms. Anstine was President/Chief Executive Officer of HealthONE Alliance, Denver, Colorado, and former Executive Vice President of First Interstate Bank of Denver. Ms. Anstine is also Trustee/ Director of AV Hunter Trust and Colorado Uplift Board. Ms. Anstine was formerly a Director of the Trust Bank of Colorado (later purchased and now known as Northern Trust Bank), HealthONE and Denver Area Council of the Boy Scouts of America and a member of the American Bankers Association Trust Executive Committee. | 44 | Ms. Anstine is a Trustee of ALPS Variable Investment Trust (10 funds); Financial Investors Trust (31 funds); Reaves Utility Income Fund (1 fund); and Westcore Trust (14 funds). |
| Jeremy W. Deems, 1976 | Trustee | Since March 2008 | Mr. Deems is the Co-Founder, Chief Compliance Officer and Chief Financial Officer of Green Alpha Advisors, LLC. Mr. Deems is Co-Portfolio Manager of the Shelton Green Alpha Fund. Prior to joining Green Alpha Advisors, Mr. Deems was CFO and Treasurer of Forward Management, LLC, ReFlow Management Co., LLC, ReFlow Fund, LLC, a private investment fund, and Sutton Place Management, LLC, an administrative services company. | 46 | Mr. Deems is a Trustee of ALPS Variable Investment Trust (10 funds); Financial Investors Trust (31 funds); and Reaves Utility Income Fund (1 fund); Clough Funds Trust (1 fund) and Elevation ETF Trust (2 fund). |
| Rick A. Pederson, 1952 | Trustee | Since March 2008 | Mr. Pederson is President, Foundation Properties, Inc. (a real estate investment management company), 1994 - present; Advisory Board Member, Bow River Capital Partners (private equity management), 2003 - present; Advisor, The Pauls Corporation (real estate investment management and development), 2008 - present; Chairman, Ross Consulting Group (real estate consulting services) 1983 - 2013; Advisory Board Member, Neenan Company (construction services) 2002 - present; Board Member, Prosci Inc. (private business services) 2013 - 2016; Board Member, Citywide Banks (Colorado community bank) 2014 - present; Board Member, Strong-Bridge Consulting (management consulting) 2015 - present; Director, National Western Stock Show (not-for-profit organization); Director, Biennial of the Americas (not-for-profit-organization), 2012 - 2015; Board Member, History Colorado, 2015 - present. | 22 | Mr. Pederson is Trustee of Westcore Trust (14 funds) and Principal Real Estate Income Fund (1 fund). |
| * | The business address of the Trustee is c/o ALPS Advisors, Inc., 1290 Broadway, Suite 1100, Denver, Colorado 80203. |
| ** | This is the period for which the Trustee began serving the Trust. Each Trustee serves an indefinite term, until his successor is elected. |
| *** | The Fund Complex includes all series of the Trust and any other investment companies for which ALPS Advisors, Inc. provides investment advisory services. |
| ALPS Sector Dividend Dogs Series | |
| Trustees & Officers | November 30, 2016 (Unaudited) |
The Trustee who is affiliated with the Adviser or affiliates of the Adviser and executive officers of the Trust, his term of office and length of time served, his principal business occupations during the past five years, the number of portfolios in the Fund Complex overseen by the Interested Trustee and the other directorships, if any, held by the Trustee, are shown below.
INTERESTED TRUSTEE
Name, Address and Year of Birth of Interested Trustee* | Position(s) Held with Trust | Term of Office and Length of Time Served** | Principal Occupation(s) During Past 5 Years | Number of Portfolios in Fund Complex Overseen by Trustees*** | Other Directorships Held by Trustees |
| Thomas A. Carter, 1966 | Trustee and President | Since March 2008 | Mr. Carter joined ALPS Fund Services, Inc. (“ALPS”) in 1994 and is currently President and Director of ALPS Advisors, Inc. (“AAI”) and ALPS Portfolio Solutions Distributor, Inc. (“APSD”) and Executive Vice President and Director of ALPS and ALPS Holdings, Inc. (“AHI”) and ALPS Distributors, Inc. (“ADI”). Because of his position with AHI, ALPS, ADI, APSD and AAI, Mr. Carter is deemed an affiliate of the Fund as defined under the 1940 Act. Before joining ALPS, Mr. Carter was with Deloitte & Touche LLP, where he worked with a diverse group of clients, primarily within the financial services industry. Mr. Carter is a Certified Public Accountant and received his Bachelor of Science in Accounting from the University of Colorado at Boulder. | 33 | Mr. Carter is a Trustee of ALPS Variable Investment Trust (10 funds); Principal Real Estate Income Fund (1 fund); and RiverNorth Opportunities Fund, Inc. (1 fund). |
| * | The business address of the Trustee is c/o ALPS Advisors, Inc., 1290 Broadway, Suite 1100, Denver, Colorado 80203. |
| ** | This is the period for which the Trustee began serving the Trust. Each Trustee serves an indefinite term, until his successor is elected. |
| *** | The Fund Complex includes all series of the Trust and any other investment companies for which ALPS Advisors, Inc. provides investment advisory services. |
| ALPS Sector Dividend Dogs Series | |
| Trustees & Officers | November 30, 2016 (Unaudited) |
OFFICERS
Name, Address and Year of Birth of Officer* | Position(s) Held with Trust | Length of Time Served** | Principal Occupation(s) During Past 5 Years |
| Erin D. Nelson, 1977 | Chief Compliance Officer (“CCO”) | Since December 2015 | Erin Nelson became Senior Vice-President and Chief Compliance Officer of ALPS Advisors, Inc. (“AAI”) on July 1, 2015 and prior to that served as Vice President and Deputy Chief Compliance Officer of AAI since January 1, 2015. Prior to January 1, 2015, Ms. Nelson was Vice-President and Assistant General Counsel of ALPS Fund Services, Inc. Because of her position with AAI, Ms. Nelson is deemed an affiliate of the Trust as defined under the 1940 Act. Ms. Nelson is also the CCO of ALPS Variable Investment Trust, Liberty All-Star Growth Fund, Inc., Liberty All- Star Equity Fund, Principal Real Estate Income Fund, and RiverNorth Opportunities Fund, Inc. |
| Patrick D. Buchanan, 1972 | Treasurer | Since June 2012 | Mr. Buchanan is Vice President of AAI. Mr. Buchanan joined ALPS in 2007 and because of his position with AAI, he is deemed an affiliate of the Trust as defined under the 1940 Act. Mr. Buchanan is also Treasurer of the ALPS Variable Insurance Trust, Principal Real Estate Income Fund, Clough Funds Trust and RiverNorth Opportunities Fund, Inc. |
| Andrew P. Meloni, 1969 | Assistant Treasurer | Since December 2016 | Mr. Meloni is a Fund Controller for ALPS Fund Services, Inc. Mr. Meloni joined ALPS in 2007 and because of his position with ALPS, he is deemed an affiliate of the Fund as defined under the 1940 Act. Mr. Meloni is also Assistant Treasurer to the Liberty All-Star Equity Fund, Liberty All-Star Growth Fund, Inc., Principal Real Estate Income Fund, RiverNorth Opportunities Fund, Inc. and ALPS Variable Investment Trust. |
| Abigail J. Murray, 1975 | Secretary | Since June 2015 | Ms. Murray joined ALPS in April 2015. She is currently Vice President and Senior Counsel of ALPS. Prior to joining ALPS, Ms. Murray was an Attorney and Managing Member at Murray & Rouvina PLC from 2014 to 2015 and an Associate with Vedder Price P.C. from 2007 to 2014. Ms. Murray is also the Secretary of Clough Global Allocation Fund, Clough Global Equity Fund, Clough Global Opportunities Fund, Clough Funds Trust, The Caldwell & Orkin Funds, Inc. and RiverNorth Opportunities Fund, Inc. and Assistant Secretary of Elevation ETF Trust and Principal Real Estate Income Fund. |
| Andrea E. Kuchli, 1985 | Assistant Secretary | Since December 2015 | Ms. Kuchli joined ALPS in 2015 and is currently Vice President and Senior Counsel of ALPS. Prior to joining ALPS, Ms. Kuchli was an Associate with Davis Graham & Stubbs LLP from April 2014 to February 2015, and an Associate with Dechert LLP from 2011 to April 2014. Because of her position with ALPS, Ms. Kuchli is deemed an affiliate of the Trust as defined under the 1940 Act. Ms. Kuchli is also Secretary of Elevation ETF Trust and Principal Real Estate Income Fund as well as Assistant Secretary of the James Advantage Funds and RiverNorth Opportunities Fund, Inc. |
| Sharon Akselrod, 1974 | Assistant Secretary | Since December 2016 | Ms. Akselrod joined ALPS in August 2014 and is currently Senior Investment Company Act Paralegal of ALPS Fund Services, Inc. Prior to joining ALPS, Ms. Akselrod served as Corporate Governance and Regulatory Associate for Nordstrom fsb (2013-2014) and Senior Legal Assistant – Legal Manager for AXA Equitable Life Insurance Company (2008-2013). Because of her position with ALPS, Ms. Akselrod is deemed an affiliate of the Trust as defined under the 1940 Act. Ms. Akselrod is also Assistant Secretary of Financial Investors Trust. |
| * | The business address of each Officer is c/o ALPS Advisors, Inc., 1290 Broadway, Suite 1100, Denver, Colorado 80203. |
| ** | This is the period for which the Officer began serving the Trust. Each Officer serves an indefinite term, until his/her successor is elected. |
The Statement of Additional Information includes additional information about the Fund's Trustees and is available, without charge, upon request by calling (toll-free) 1-866-675-2639.
TABLE OF CONTENTS
| Performance Overview | 1 |
| Disclosure of Fund Expenses | 4 |
| Report of Independent Registered Public Accounting Firm | 5 |
| Schedule of Investments | 6 |
| Statement of Assets and Liabilities | 11 |
| Statement of Operations | 12 |
| Statements of Changes in Net Assets | 13 |
| Financial Highlights | 14 |
| Notes to Financial Statements | 15 |
| Additional Information | 21 |
| Board Considerations Regarding Approval of Investment Advisory Agreement | 23 |
| Trustees & Officers | 24 |
| Performance Overview | November 30, 2016 (Unaudited) |
Investment Objective
The Barron’s 400SMETF (the “Fund”) seeks investment results that correspond generally, before fees and expenses, to the performance of the Barron’s 400 IndexSM(the “Underlying Index”). The Underlying Index is a rules‐based index intended to give investors a means of tracking the overall performance of high performing equity securities of U.S. companies. The Fund will invest at least 80% of its total assets in the equity securities which comprise the Underlying Index.
The Underlying Index generally consists of 400 stocks. The Underlying Index’s stocks are constituents of the MarketGrader U.S. Coverage Universe. In compiling the Underlying Index, MarketGrader Capital, LLC (the “Index Provider”) selects the 400 stocks from the MarketGrader U.S. Coverage Universe by using a methodology that selects components based on the strength of their fundamentals in growth, value, profitability and cash flow and then screens such potential Underlying Index components for certain criteria regarding concentration, market capitalization and liquidity. The eligible stocks that are selected for inclusion in the Underlying Index’s portfolio are equally weighted. The Underlying Index is rebalanced by the Index Provider semiannually, on the third Friday of March and September each year.
Performance Overview
The Barron’s 400SMETF (BFOR) had a strong fourth fiscal year ended on November 30, 2016, gaining 9.12%. This trailed the total return of its benchmark, the Barron’s 400 IndexSM, which gained 9.87% over the same time period. Since its inception the Barron’s 400SMETF has gained 39.83% on a cumulative basis.
Following what had been a difficult 2015 for equally weighted indexes relative to traditional market capitalization‐weighted indexes, the Underlying Index rebounded strongly during the most recent year ended on November 30, beating the Dow Jones U.S. Total Stock Market Index (DWCF), the broadest measure of the U.S. equity market, by 163 basis points.1
During the most recently ended fiscal year, a total of 698 stocks were members of the Underlying Index, which rebalances semi‐annually in March and September. Of these, 410 stocks had a net positive return during the index’s fiscal year while 305 had a net negative return. The fact that the number of total stocks in the index during a single fiscal year is higher than its 400‐constituent cap is explained by the fact that each fiscal year includes stocks from three selection periods (in the most recent year’s case these included the selections from September 2015, March 2016 and September 2016). Figure 1 illustrates the top and bottom ten performers in the Underlying Index during the most recent fiscal year.
Figure 1. Top and Bottom 10 Performing Stocks In the Barron’s 400 IndexSMDuring Fiscal Year 20162
| Top Ten Performing Stocks | | | |
| Name | Ticker | Sector | Return (%) |
| Medivation Inc. | MDVN | Health Care | 118.9 |
| John Bean Technologies Corp. | JBT | Industrials | 84.5 |
| Veeva Systems Inc. | VEEV | Technology | 82.0 |
| Keurig Green Mountain Inc. | GMCR | Consumer Staples | 75.1 |
| Drew Industries Inc. | DW | Industrials | 73.9 |
| Thor Industries Inc. | THO | Consumer Discretionary | 73.6 |
| Patrick Industries Inc. | PATK | Industrials | 72.7 |
| Applied Materials Inc. | AMAT | Technology | 71.6 |
| Cirrus Logic Inc. | CRUS | Technology | 65.8 |
| Lydall Inc. | LDL | Industrials | 63.9 |
| Bottom Ten Performing Stocks | | | |
| Name | Ticker | Sector | Return (%) |
| Teekay Tankers Ltd. | TNK | Industrials | ‐63.4 |
| Syntel Inc. | SYNT | Technology | ‐59.9 |
| Atwood Oceanics Inc. | ATW | Energy | ‐57.4 |
| Rubicon Project Inc. | RUBI | Technology | ‐56.2 |
| Waddell & Reed Financial Inc. | WDR | Financials | ‐52.1 |
| Newlink Genetics Corp. | NLNK | Health Care | ‐50.9 |
| WisdomTree Investments Inc. | WETF | Financials | ‐50.3 |
| Fitbit Inc. | FIT | Consumer Discretionary | ‐48.7 |
| Alon USA Partners LP | ALDW | Energy | ‐44.4 |
| Concert Pharmaceuticals Inc. | CNCE | Health Care | ‐43.1 |
1 | Based on a cumulative total return of 9.87% for the Barron’s 400 IndexSM(B400T) vs. 8.24% for the Dow Jones U.S. Total Stock Market Index (DWCFT). Source: Bloomberg. |
2 | Based on cumulative price return for every stock while they were members of the Barron’s 400 IndexSMbetween December 1, 2015 andNovember 30, 2016. Sources: FactSet and MarketGrader Research. |
| Performance Overview | November 30, 2016 (Unaudited) |
Performance (as of November 30, 2016)
| | 1 Year | 3 Year | Since Inception^ |
Barron’s 400SMETF – NAV | 9.12% | 6.06% | 10.07% |
Barron’s 400SMETF – Market Price* | 9.22% | 6.07% | 10.08% |
Barron’s 400 IndexSM | 9.87% | 6.80% | 10.83% |
Total Expense Ratio (per the current prospectus) 0.65%
Performance data quoted represents past performance. Past performance does not guarantee future results. The table does not reflect the deduction of taxes that a shareholder would pay on Fund distributions or the redemption of Fund shares. Investment return and principal value of an investment will fluctuate so that an investor’s shares, when sold or redeemed, may be worth more or less than the original cost. Current performance data may be higher or lower than actual data quoted. For the most current month-end performance data please visit www.alpsfunds.com or call 1.855.724.0450.
NAV is an exchange-traded fund’s per-share value. The per-share dollar amount of the Fund is derived by dividing the total value of all the securities in its portfolio, less any liabilities, by the number of Fund shares outstanding. Market Price is the price at which a share can currently be traded in the market. Information detailing the number of days the Market Price of the Fund was greater than the Fund’s NAV and the number of days it was less than the Fund’s NAV can be obtained at www.alpsfunds.com.
| ^ | The Fund commenced Investment Operations on June 4, 2013. |
| * | Market Price is based on the midpoint of the bid/ask spread at 4 p.m. ET and does not represent the returns an investor would receive if shares were traded at other times. |
The Barron’s 400 IndexSM, calculated by NYSE Arca or its affiliates, measures the performance of a diversified group of U.S. companies selected in part based on fundamentals-related rules-based criteria. The index includes companies that have scored highest according to fundamentals-related rankings calculated by MarketGrader Capital, LLC. Additional rules-based screening provides for sector and market cap diversification. The Underlying Index has been licensed by MarketGrader for use with the Barron’s 400SMETF.
The index is not actively managed and does not reflect any deductions for fees, expenses or taxes. One cannot invest directly in an index. Index performance does not reflect Fund performance.
Funds that emphasize investments in small/mid cap companies will generally experience greater price volatility.
Barron’s 400SMETF shares are not individually redeemable. Investors buy and sell shares of the Barron’s 400SMETF on a secondary market. Only market makers or “authorized participants” may trade directly with the Fund, typically in blocks of 50,000 shares.
The Barron’s 400 SMETF is not suitable for all investors. Investments in the Fund are subject to investment risks, including possible loss of the principal amount invested.
ALPS Portfolio Solutions Distributor, Inc., a FINRA member, is the distributor for the Fund.
| Performance Overview | November 30, 2016 (Unaudited) |
Top 10 Holdings* (as of November 30, 2016) | |
| NVIDIA Corp. | 0.36% |
| Career Education Corp. | 0.35% |
| Texas Pacific Land Trust | 0.35% |
| Capella Education Co. | 0.35% |
| Meta Financial Group, Inc. | 0.34% |
| Spirit Airlines, Inc. | 0.33% |
| ServisFirst Bancshares, Inc. | 0.33% |
| II‐VI, Inc. | 0.33% |
| Grand Canyon Education, Inc. | 0.33% |
| Headwaters, Inc. | 0.32% |
| Total % of Top 10 Holdings (excluding money market fund) | 3.39% |
Future holdings are subject to change.
Sector Allocation* (as of November 30, 2016)
Growth of $10,000 (as of November 30, 2016)
Comparison of change in value of a $10,000 investment in the Fund and the Underlying Index
The chart above represents historical performance of a hypothetical investment of $10,000 in the Fund over the life of the Fund. Past performance does not guarantee future results. This chart does not reflect the deduction of taxes that a shareholder would pay on Fund distributions or the redemption of Fund shares.
| Disclosure of Fund Expenses | November 30, 2016 (Unaudited) |
Shareholder Expense Example: As a shareholder of the Fund, you incur two types of costs: (1) transaction costs which may include creation and redemption fees or brokerage charges, and (2) ongoing costs, including management fees and other Fund expenses. These examples are intended to help you understand your ongoing costs (in dollars) of investing in the Fund and to compare these costs with the ongoing costs of investing in other funds. It is based on an investment of $1,000 invested at the beginning of the (six month) period and held through November 30, 2016.
Actual Return: The first line of the table provides information about actual account values and actual expenses. You may use the information in this line, together with the amount you invested, to estimate the expenses that you incurred over the period. Simply divide your account value by $1,000 (for example, an $8,600 account value divided by $1,000 = 8.6), then multiply the result by the number in the first line under the heading entitled “Expenses Paid During Period” to estimate the expenses attributable to your investment during this period.
Hypothetical 5% Return: The second line of the table provides information about hypothetical account values and hypothetical expenses based on the Fund’s actual expense ratio and an assumed rate of return of 5% per year before expenses, which is not the Fund’s actual return. The hypothetical account values and expenses may not be used to estimate the actual ending account balance or expenses you paid for the period. You may use this information to compare ongoing costs of investing in the Fund and other funds. To do so, compare this 5% hypothetical example with the 5% hypothetical examples that appear in the shareholder reports of other funds.
The expenses shown in the table are meant to highlight ongoing Fund costs only and do not reflect any transaction costs, such as creation and redemption fees or brokerage charges. Therefore, the second line is useful in comparing ongoing costs only, and will not help you determine the relative total costs of owning different funds. In addition, if these costs were included, your costs would have been higher.
| | Beginning Account Value 6/1/16 | Ending Account Value 11/30/16 | Expense Ratio(a) | Expenses Paid During Period 6/1/16 - 11/30/16(b) |
| Actual | $1,000.00 | $1,113.80 | 0.65% | $3.43 |
Hypothetical (5% return before expenses) | $1,000.00 | $1,021.75 | 0.65% | $3.29 |
(a) | Annualized, based on the Fund's most recent fiscal half year expenses. |
(b) | Expenses are equal to the Fund's annualized expense ratio multiplied by the average account value over the period, multiplied by the number of days in the most recent fiscal half year (183), divided by 366. |
Barron’s 400SMETF
| Report of Independent Registered Public Accounting Firm | |
To the Board of Trustees and Shareholders of ALPS ETF Trust:
We have audited the accompanying statement of assets and liabilities, including the schedule of investments, of Barron’s 400SM ETF, one of the portfolios constituting the ALPS ETF Trust (the “Trust”), as of November 30, 2016, and the related statement of operations for the year then ended, the statements of changes in net assets for each of the two years in the period then ended, and the financial highlights for each of the periods presented. These financial statements and financial highlights are the responsibility of the Trust’s management. Our responsibility is to express an opinion on these financial statements and financial highlights based on our audits.
We conducted our audits in accordance with the standards of the Public Company Accounting Oversight Board (United States). Those standards require that we plan and perform the audit to obtain reasonable assurance about whether the financial statements and financial highlights are free of material misstatement. The Trust is not required to have, nor were we engaged to perform, an audit of its internal control over financial reporting. Our audits included consideration of internal control over financial reporting as a basis for designing audit procedures that are appropriate in the circumstances, but not for the purpose of expressing an opinion on the effectiveness of the Trust’s internal control over financial reporting. Accordingly, we express no such opinion. An audit also includes examining, on a test basis, evidence supporting the amounts and disclosures in the financial statements, assessing the accounting principles used and significant estimates made by management, as well as evaluating the overall financial statement presentation. Our procedures included confirmation of securities owned as of November 30, 2016, by correspondence with the custodian. We believe that our audits provide a reasonable basis for our opinion.
In our opinion, the financial statements and financial highlights referred to above present fairly, in all material respects, the financial position of Barron’s 400SM ETF of the ALPS ETF Trust as of November 30, 2016, the results of its operations for the year then ended, the changes in its net assets for each of the two years in the period then ended, and the financial highlights for each of the periods presented, in conformity with accounting principles generally accepted in the United States of America.
DELOITTE & TOUCHE LLP
Denver, Colorado
January 27, 2017
Barron’s 400SMETF
| Schedule of Investments | November 30, 2016 |
| Security Description | | Shares | | | Value | |
| COMMON STOCKS (96.17%) | | | | | | |
| Consumer Discretionary (19.81%) | | | | | | |
AMC Networks, Inc., Class A(a) | | | 7,879 | | | $ | 435,315 | |
American Axle & Manufacturing Holdings, Inc.(a) | | | 25,909 | | | | 405,735 | |
| American Eagle Outfitters, Inc. | | | 22,290 | | | | 369,122 | |
| Bed Bath & Beyond, Inc. | | | 9,473 | | | | 424,485 | |
| Best Buy Co., Inc. | | | 10,940 | | | | 499,958 | |
BJ's Restaurants, Inc.(a) | | | 10,793 | | | | 400,420 | |
Buffalo Wild Wings, Inc.(a) | | | 2,563 | | | | 432,122 | |
| Capella Education Co. | | | 7,061 | | | | 616,072 | |
Career Education Corp.(a) | | | 62,870 | | | | 628,071 | |
| Carter's, Inc. | | | 4,308 | | | | 393,277 | |
| Cato Corp., Class A | | | 12,667 | | | | 374,943 | |
| Cheesecake Factory, Inc. | | | 8,196 | | | | 484,957 | |
| Children's Place, Inc. | | | 5,114 | | | | 531,089 | |
Chuy's Holdings, Inc.(a) | | | 14,272 | | | | 447,427 | |
| Columbia Sportswear Co. | | | 7,611 | | | | 432,838 | |
| Cooper Tire & Rubber Co. | | | 11,864 | | | | 454,391 | |
Cooper‐Standard Holding, Inc.(a) | | | 4,124 | | | | 393,100 | |
Cracker Barrel Old Country Store, Inc.(b) | | | 2,723 | | | | 443,141 | |
Dave & Buster's Entertainment, Inc.(a) | | | 10,113 | | | | 473,794 | |
Del Taco Restaurants, Inc.(a) | | | 37,196 | | | | 540,086 | |
Discovery Communications, Inc., Class C(a) | | | 17,245 | | | | 455,958 | |
| Dollar General Corp. | | | 5,824 | | | | 450,312 | |
Dorman Products, Inc.(a) | | | 6,595 | | | | 476,423 | |
| Drew Industries, Inc. | | | 4,358 | | | | 458,026 | |
Duluth Holdings, Inc., Class B(a)(b) | | | 14,857 | | | | 497,858 | |
Eldorado Resorts, Inc.(a)(b) | | | 29,384 | | | | 404,030 | |
Five Below, Inc.(a) | | | 9,985 | | | | 393,010 | |
| Foot Locker, Inc. | | | 6,333 | | | | 453,886 | |
Fox Factory Holding Corp.(a) | | | 19,947 | | | | 500,670 | |
Francesca's Holdings Corp.(a) | | | 27,345 | | | | 436,973 | |
| General Motors Co. | | | 13,248 | | | | 457,454 | |
| Gentex Corp. | | | 23,681 | | | | 437,862 | |
Gentherm, Inc.(a) | | | 13,479 | | | | 429,306 | |
Grand Canyon Education, Inc.(a) | | | 10,186 | | | | 581,621 | |
Gray Television, Inc.(a) | | | 37,710 | | | | 380,871 | |
| Harman International Industries, Inc. | | | 5,089 | | | | 556,584 | |
| Hasbro, Inc. | | | 5,261 | | | | 449,237 | |
Hibbett Sports, Inc.(a)(b) | | | 10,472 | | | | 421,498 | |
| Home Depot, Inc. | | | 3,260 | | | | 421,844 | |
| ILG, Inc. | | | 24,634 | | | | 445,136 | |
Installed Building Products, Inc.(a) | | | 11,861 | | | | 492,232 | |
Kate Spade & Co.(a) | | | 22,121 | | | | 328,497 | |
| Lear Corp. | | | 3,582 | | | | 463,905 | |
| Leggett & Platt, Inc. | | | 8,342 | | | | 400,917 | |
| Lennar Corp., Class A | | | 9,168 | | | | 390,007 | |
LGI Homes, Inc.(a)(b) | | | 11,301 | | | | 368,978 | |
LKQ Corp.(a) | | | 11,652 | | | | 382,535 | |
MarineMax, Inc.(a) | | | 22,761 | | | | 427,907 | |
Mohawk Industries, Inc.(a) | | | 2,013 | | | | 397,447 | |
Nautilus, Inc.(a) | | | 17,023 | | | | 292,796 | |
| Nexstar Broadcasting Group, Inc., Class A | | | 7,696 | | | | 459,066 | |
| Security Description | | Shares | | | Value | |
| Consumer Discretionary (continued) | | | | | | |
| NIKE, Inc., Class B | | | 7,403 | | | $ | 370,668 | |
| Nutrisystem, Inc. | | | 15,031 | | | | 552,389 | |
NVR, Inc.(a) | | | 253 | | | | 403,535 | |
Ollie's Bargain Outlet Holdings, Inc.(a) | | | 16,246 | | | | 488,192 | |
O'Reilly Automotive, Inc.(a) | | | 1,472 | | | | 404,064 | |
| PetMed Express, Inc. | | | 20,222 | | | | 441,446 | |
| Polaris Industries, Inc. | | | 5,476 | | | | 475,645 | |
| Pool Corp. | | | 4,358 | | | | 438,458 | |
Priceline Group, Inc.(a) | | | 295 | | | | 443,586 | |
| Red Rock Resorts, Inc., Class A | | | 19,707 | | | | 451,684 | |
| Ross Stores, Inc. | | | 6,700 | | | | 452,853 | |
Scripps Networks Interactive, Inc.,
Class A | | | 6,678 | | | | 462,518 | |
| Sinclair Broadcast Group, Inc., Class A | | | 14,408 | | | | 468,980 | |
Skechers U.S.A., Inc., Class A(a) | | | 17,753 | | | | 404,413 | |
Smith & Wesson Holding Corp.(a)(b) | | | 15,346 | | | | 358,022 | |
Sportsman's Warehouse Holdings, Inc.(a) | | | 42,655 | | | | 383,895 | |
| Starbucks Corp. | | | 7,594 | | | | 440,224 | |
Stoneridge, Inc.(a) | | | 23,277 | | | | 369,406 | |
| Sturm Ruger & Co., Inc. | | | 7,299 | | | | 375,169 | |
Tenneco, Inc.(a) | | | 7,415 | | | | 437,114 | |
| Thor Industries, Inc. | | | 5,309 | | | | 533,926 | |
Tile Shop Holdings, Inc.(a) | | | 26,059 | | | | 522,483 | |
| TJX Cos., Inc. | | | 5,516 | | | | 432,123 | |
| Tractor Supply Co. | | | 5,915 | | | | 444,039 | |
TRI Pointe Group, Inc.(a) | | | 32,662 | | | | 379,532 | |
Ulta Salon Cosmetics & Fragrance, Inc.(a) | | | 1,767 | | | | 458,537 | |
| Vail Resorts, Inc. | | | 2,575 | | | | 407,880 | |
| Walt Disney Co. | | | 4,421 | | | | 438,210 | |
| Williams‐Sonoma, Inc. | | | 8,301 | | | | 454,729 | |
| Total Consumer Discretionary | | | | | | | 35,386,909 | |
| | | | | | | | | |
| Consumer Staples (3.55%) | | | | | | | | |
| B&G Foods, Inc. | | | 8,842 | | | | 378,438 | |
Boston Beer Co., Inc., Class A(a) | | | 2,433 | | | | 421,152 | |
Cal‐Maine Foods, Inc.(b) | | | 9,380 | | | | 381,766 | |
| Church & Dwight Co., Inc. | | | 8,729 | | | | 382,243 | |
| Constellation Brands, Inc., Class A | | | 2,541 | | | | 384,047 | |
Hain Celestial Group, Inc.(a) | | | 11,481 | | | | 449,940 | |
| Hormel Foods Corp. | | | 11,218 | | | | 384,104 | |
| Ingredion, Inc. | | | 3,077 | | | | 361,178 | |
| Lancaster Colony Corp. | | | 3,137 | | | | 425,095 | |
| National Beverage Corp. | | | 7,861 | | | | 396,902 | |
Omega Protein Corp.(a) | | | 16,649 | | | | 398,744 | |
| Pinnacle Foods, Inc. | | | 8,209 | | | | 406,838 | |
| Spectrum Brands Holdings, Inc. | | | 3,287 | | | | 394,078 | |
Sprouts Farmers Market, Inc.(a) | | | 21,327 | | | | 426,753 | |
USANA Health Sciences, Inc.(a) | | | 6,086 | | | | 370,942 | |
| WD‐40 Co. | | | 3,590 | | | | 387,361 | |
| Total Consumer Staples | | | | | | | 6,349,581 | |
| | | | | | | | | |
| Energy (0.42%) | | | | | | | | |
| DHT Holdings, Inc. | | | 97,598 | | | | 346,473 | |
Barron’s 400SMETF
| Schedule of Investments | November 30, 2016 |
| Security Description | | Shares | | | Value | |
| Energy (continued) | | | | | | |
Ship Finance International, Ltd.(b) | | | 28,504 | | | $ | 410,458 | |
| Total Energy | | | | | | | 756,931 | |
| | | | | | | | | |
| Financials (20.48%) | | | | | | | | |
| Ameris Bancorp | | | 11,560 | | | | 518,466 | |
| AmTrust Financial Services, Inc. | | | 15,492 | | | | 394,426 | |
Banc of California, Inc.(b) | | | 19,299 | | | | 291,415 | |
| Bank of Hawaii Corp. | | | 5,762 | | | | 480,378 | |
| Bank of the Ozarks, Inc. | | | 10,581 | | | | 513,390 | |
| BankUnited, Inc. | | | 13,129 | | | | 465,160 | |
| BNC Bancorp | | | 16,813 | | | | 507,753 | |
BofI Holding, Inc.(a)(b) | | | 18,837 | | | | 445,118 | |
| Cardinal Financial Corp. | | | 15,621 | | | | 499,716 | |
| Cathay General Bancorp | | | 13,517 | | | | 474,447 | |
| CBOE Holdings, Inc. | | | 6,000 | | | | 413,400 | |
| CenterState Banks, Inc. | | | 23,055 | | | | 516,893 | |
| Central Pacific Financial Corp. | | | 16,350 | | | | 483,142 | |
| Chemical Financial Corp. | | | 9,348 | | | | 484,974 | |
| Citigroup, Inc. | | | 8,736 | | | | 492,623 | |
| City Holding Co. | | | 8,346 | | | | 513,112 | |
| Columbia Banking System, Inc. | | | 13,004 | | | | 517,819 | |
Credit Acceptance Corp.(a)(b) | | | 2,115 | | | | 405,742 | |
Customers Bancorp, Inc.(a) | | | 16,325 | | | | 497,913 | |
Eagle Bancorp, Inc.(a) | | | 8,366 | | | | 491,503 | |
| East West Bancorp, Inc. | | | 11,465 | | | | 548,944 | |
Essent Group, Ltd.(a) | | | 15,808 | | | | 482,460 | |
| FactSet Research Systems, Inc. | | | 2,330 | | | | 373,196 | |
FCB Financial Holdings, Inc., Class A(a) | | | 10,705 | | | | 473,696 | |
| Federated Investors, Inc., Class B | | | 12,996 | | | | 357,260 | |
| Fifth Third Bancorp | | | 20,273 | | | | 527,503 | |
| First Busey Corp. | | | 17,653 | | | | 483,869 | |
| First Citizens BancShares, Inc., Class A | | | 1,468 | | | | 523,151 | |
First Financial Bankshares, Inc.(b) | | | 11,323 | | | | 487,455 | |
| First Merchants Corp. | | | 15,284 | | | | 524,700 | |
| First Midwest Bancorp, Inc. | | | 21,212 | | | | 515,027 | |
Flagstar Bancorp, Inc.(a) | | | 15,020 | | | | 423,264 | |
Franklin Financial Network, Inc.(a) | | | 11,165 | | | | 421,479 | |
| Glacier Bancorp, Inc. | | | 14,287 | | | | 490,044 | |
| Hanmi Financial Corp. | | | 15,550 | | | | 477,385 | |
| Heartland Financial USA, Inc. | | | 11,273 | | | | 483,048 | |
| Heritage Insurance Holdings, Inc. | | | 30,522 | | | | 440,432 | |
| Home BancShares, Inc. | | | 18,497 | | | | 478,517 | |
| Hope Bancorp, Inc. | | | 24,027 | | | | 478,137 | |
| IBERIABANK Corp. | | | 6,078 | | | | 503,562 | |
| Independent Bank Corp. | | | 7,808 | | | | 508,301 | |
| Independent Bank Group, Inc. | | | 9,403 | | | | 565,120 | |
| Intercontinental Exchange, Inc. | | | 7,275 | | | | 403,035 | |
| Investors Bancorp, Inc. | | | 34,159 | | | | 462,513 | |
| Lakeland Financial Corp. | | | 11,575 | | | | 488,465 | |
| Lazard, Ltd., Class A | | | 11,431 | | | | 444,094 | |
| LegacyTexas Financial Group, Inc. | | | 13,257 | | | | 520,470 | |
LendingTree, Inc.(a) | | | 4,210 | | | | 441,208 | |
| MarketAxess Holdings, Inc. | | | 2,418 | | | | 400,832 | |
| MB Financial, Inc. | | | 10,770 | | | | 466,018 | |
| Meta Financial Group, Inc. | | | 6,709 | | | | 610,184 | |
MGIC Investment Corp. (a) | | | 51,367 | | | | 465,899 | |
| Security Description | | Shares | | | Value | |
| Financials (continued) | | | | | | |
| MSCI, Inc. | | | 4,829 | | | $ | 380,525 | |
Pacific Premier Bancorp, Inc.(a) | | | 15,421 | | | | 494,243 | |
| PacWest Bancorp | | | 9,693 | | | | 496,766 | |
| Pinnacle Financial Partners, Inc. | | | 7,363 | | | | 474,914 | |
| Primerica, Inc. | | | 7,402 | | | | 523,321 | |
| S&P Global, Inc. | | | 3,356 | | | | 399,330 | |
| ServisFirst Bancshares, Inc. | | | 8,020 | | | | 590,432 | |
Signature Bank(a) | | | 3,478 | | | | 521,387 | |
| Simmons First National Corp., Class A | | | 8,328 | | | | 503,428 | |
| South State Corp. | | | 5,445 | | | | 462,553 | |
| Sterling Bancorp | | | 23,695 | | | | 539,061 | |
| Suffolk Bancorp | | | 11,732 | | | | 488,755 | |
| SunTrust Banks, Inc. | | | 9,361 | | | | 486,304 | |
| Synovus Financial Corp. | | | 12,663 | | | | 490,185 | |
| Texas Pacific Land Trust | | | 2,100 | | | | 624,351 | |
| Umpqua Holdings Corp. | | | 26,514 | | | | 471,154 | |
| Union Bankshares Corp. | | | 15,182 | | | | 513,152 | |
| United Community Banks, Inc. | | | 19,888 | | | | 540,556 | |
| Universal Insurance Holdings, Inc. | | | 16,953 | | | | 406,872 | |
Walker & Dunlop, Inc.(a) | | | 16,178 | | | | 475,471 | |
| Washington Federal, Inc. | | | 15,633 | | | | 507,291 | |
| WesBanco, Inc. | | | 12,734 | | | | 507,705 | |
Western Alliance Bancorp(a) | | | 11,330 | | | | 529,338 | |
| WSFS Financial Corp. | | | 11,178 | | | | 476,742 | |
| Total Financials | | | | | | | 36,580,494 | |
| | | | | | | | | |
| Health Care (12.81%) | | | | | | | | |
| AbbVie, Inc. | | | 6,472 | | | | 393,498 | |
ABIOMED, Inc.(a) | | | 3,560 | | | | 399,574 | |
Acadia Healthcare Co., Inc.(a) | | | 8,018 | | | | 304,764 | |
Akorn, Inc.(a) | | | 14,868 | | | | 315,499 | |
Align Technology, Inc.(a) | | | 4,456 | | | | 414,631 | |
| Amgen, Inc. | | | 2,421 | | | | 348,793 | |
AMN Healthcare Services, Inc.(a) | | | 11,977 | | | | 398,834 | |
Amphastar Pharmaceuticals, Inc.(a) | | | 22,887 | | | | 463,920 | |
Amsurg Corp.(a) | | | 6,097 | | | | 415,328 | |
Anika Therapeutics, Inc.(a) | | | 8,881 | | | | 414,387 | |
| Baxter International, Inc. | | | 9,033 | | | | 400,794 | |
Biogen, Inc.(a) | | | 1,406 | | | | 413,462 | |
BioTelemetry, Inc.(a) | | | 22,338 | | | | 434,474 | |
| Bristol‐Myers Squibb Co. | | | 7,372 | | | | 416,076 | |
Cambrex Corp.(a) | | | 8,973 | | | | 449,547 | |
| Cantel Medical Corp. | | | 5,347 | | | | 436,155 | |
Celgene Corp.(a) | | | 3,968 | | | | 470,248 | |
Cerner Corp.(a) | | | 6,617 | | | | 329,394 | |
| Chemed Corp. | | | 2,985 | | | | 444,675 | |
| CryoLife, Inc. | | | 23,874 | | | | 469,124 | |
Cynosure, Inc., Class A(a) | | | 8,152 | | | | 369,693 | |
Edwards Lifesciences Corp.(a) | | | 3,587 | | | | 297,183 | |
Enanta Pharmaceuticals, Inc.(a) | | | 17,691 | | | | 556,205 | |
Five Prime Therapeutics, Inc.(a) | | | 8,586 | | | | 493,867 | |
| Gilead Sciences, Inc. | | | 5,250 | | | | 386,925 | |
Globus Medical, Inc., Class A(a) | | | 18,098 | | | | 391,641 | |
HealthEquity, Inc.(a) | | | 12,188 | | | | 542,732 | |
| HealthSouth Corp. | | | 10,076 | | | | 419,867 | |
Heska Corp.(a) | | | 7,505 | | | | 496,156 | |
Hologic, Inc.(a) | | | 10,956 | | | | 419,396 | |
Barron’s 400SMETF
| Schedule of Investments | November 30, 2016 |
| Security Description | | Shares | | | Value | |
| Health Care (continued) | | | | | | |
ICU Medical, Inc.(a) | | | 3,373 | | | $ | 506,793 | |
Illumina, Inc.(a) | | | 2,409 | | | | 320,734 | |
INC Research Holdings, Inc., Class A(a) | | | 9,568 | | | | 473,616 | |
Incyte Corp.(a) | | | 5,175 | | | | 529,351 | |
Insys Therapeutics, Inc.(a)(b) | | | 29,986 | | | | 353,535 | |
Intuitive Surgical, Inc.(a) | | | 622 | | | | 400,406 | |
| Landauer, Inc. | | | 9,270 | | | | 458,865 | |
Luminex Corp.(a) | | | 19,262 | | | | 391,596 | |
Masimo Corp.(a) | | | 7,152 | | | | 442,494 | |
OraSure Technologies, Inc.(a) | | | 47,775 | | | | 402,743 | |
PAREXEL International Corp.(a) | | | 6,118 | | | | 360,962 | |
| Phibro Animal Health Corp., Class A | | | 15,820 | | | | 434,259 | |
Regeneron Pharmaceuticals, Inc.(a) | | | 1,066 | | | | 404,270 | |
| ResMed, Inc. | | | 6,455 | | | | 396,853 | |
SciClone Pharmaceuticals, Inc.(a) | | | 40,266 | | | | 400,647 | |
Supernus Pharmaceuticals, Inc.(a) | | | 18,818 | | | | 405,528 | |
Surgical Care Affiliates, Inc.(a) | | | 9,868 | | | | 414,949 | |
| Teleflex, Inc. | | | 2,285 | | | | 338,020 | |
United Therapeutics Corp.(a) | | | 3,365 | | | | 422,678 | |
| Universal Health Services, Inc., Class B | | | 3,376 | | | | 415,316 | |
| US Physical Therapy, Inc. | | | 6,454 | | | | 413,056 | |
VCA, Inc.(a) | | | 5,994 | | | | 375,224 | |
Veeva Systems, Inc., Class A(a) | | | 10,317 | | | | 479,534 | |
Waters Corp.(a) | | | 2,677 | | | | 360,244 | |
Xencor, Inc.(a) | | | 18,760 | | | | 479,506 | |
| Total Health Care | | | | | | | 22,888,021 | |
| | | | | | | | | |
| Industrials (15.96%) | | | | | | | | |
| AAON, Inc. | | | 15,241 | | | | 501,429 | |
| Acuity Brands, Inc. | | | 1,580 | | | | 397,228 | |
| Alaska Air Group, Inc. | | | 5,999 | | | | 493,538 | |
| Albany International Corp., Class A | | | 10,270 | | | | 479,609 | |
| Allegiant Travel Co. | | | 2,955 | | | | 482,847 | |
| American Airlines Group, Inc. | | | 10,968 | | | | 509,354 | |
American Woodmark Corp.(a) | | | 5,055 | | | | 387,466 | |
| AO Smith Corp. | | | 8,950 | | | | 435,238 | |
| Apogee Enterprises, Inc. | | | 9,219 | | | | 439,746 | |
| Argan, Inc. | | | 7,930 | | | | 479,368 | |
Astronics Corp.(a) | | | 9,834 | | | | 363,071 | |
| AZZ, Inc. | | | 6,527 | | | | 424,908 | |
| BWX Technologies, Inc. | | | 10,758 | | | | 421,283 | |
| Cintas Corp. | | | 3,629 | | | | 415,883 | |
| Comfort Systems USA, Inc. | | | 15,592 | | | | 502,062 | |
Copart, Inc.(a) | | | 8,239 | | | | 450,838 | |
| Crane Co. | | | 6,673 | | | | 490,399 | |
| Delta Air Lines, Inc. | | | 10,922 | | | | 526,222 | |
| Deluxe Corp. | | | 6,075 | | | | 411,277 | |
| Douglas Dynamics, Inc. | | | 13,005 | | | | 415,510 | |
Dycom Industries, Inc.(a) | | | 5,139 | | | | 376,329 | |
| Fortune Brands Home & Security, Inc. | | | 7,172 | | | | 395,536 | |
| G&K Services, Inc., Class A | | | 4,243 | | | | 406,989 | |
Greenbrier Cos., Inc.(b) | | | 12,262 | | | | 475,766 | |
Hawaiian Holdings, Inc.(a) | | | 8,702 | | | | 446,848 | |
| HEICO Corp., Class A | | | 7,118 | | | | 478,330 | |
| Herman Miller, Inc. | | | 11,840 | | | | 384,800 | |
| Security Description | | Shares | | | Value | |
| Industrials (continued) | | | | | | |
| Hexcel Corp. | | | 9,280 | | | $ | 479,962 | |
| HNI Corp. | | | 7,643 | | | | 403,321 | |
| Insteel Industries, Inc. | | | 12,236 | | | | 484,178 | |
| Interface, Inc. | | | 24,255 | | | | 422,037 | |
| JB Hunt Transport Services, Inc. | | | 5,163 | | | | 492,395 | |
JetBlue Airways Corp.(a) | | | 23,845 | | | | 479,046 | |
| John Bean Technologies Corp. | | | 6,260 | | | | 564,652 | |
| Joy Global, Inc. | | | 14,916 | | | | 418,095 | |
| Kadant, Inc. | | | 7,924 | | | | 496,042 | |
| Knoll, Inc. | | | 16,656 | | | | 441,551 | |
Lydall, Inc.(a) | | | 8,915 | | | | 532,225 | |
Mercury Systems, Inc.(a) | | | 18,615 | | | | 553,052 | |
Middleby Corp.(a) | | | 3,379 | | | | 462,855 | |
| Nordson Corp. | | | 4,301 | | | | 459,046 | |
Old Dominion Freight Line, Inc.(a) | | | 6,085 | | | | 531,220 | |
On Assignment, Inc.(a) | | | 11,206 | | | | 462,696 | |
Patrick Industries, Inc.(a) | | | 6,823 | | | | 486,821 | |
| Raytheon Co. | | | 2,988 | | | | 446,826 | |
| Robert Half International, Inc. | | | 10,943 | | | | 491,012 | |
RPX Corp.(a) | | | 39,875 | | | | 416,694 | |
| Snap‐on, Inc. | | | 2,851 | | | | 476,687 | |
| Southwest Airlines Co. | | | 11,037 | | | | 514,435 | |
Spirit AeroSystems Holdings, Inc., Class A(a) | | | 9,051 | | | | 527,221 | |
Spirit Airlines, Inc.(a) | | | 10,672 | | | | 593,363 | |
| Stanley Black & Decker, Inc. | | | 3,425 | | | | 406,308 | |
| Toro Co. | | | 8,762 | | | | 463,773 | |
Trex Co., Inc.(a) | | | 7,141 | | | | 469,806 | |
| United Parcel Service, Inc., Class B | | | 3,836 | | | | 444,669 | |
United Rentals, Inc.(a) | | | 5,323 | | | | 538,209 | |
| Universal Forest Products, Inc. | | | 4,197 | | | | 416,930 | |
USG Corp.(a) | | | 15,421 | | | | 441,657 | |
Virgin America, Inc.(a)(b) | | | 7,330 | | | | 414,145 | |
Wabash National Corp.(a) | | | 31,401 | | | | 433,020 | |
WABCO Holdings, Inc.(a) | | | 4,008 | | | | 394,828 | |
| Wabtec Corp. | | | 5,471 | | | | 463,230 | |
| Total Industrials | | | | | | | 28,513,881 | |
| | | | | | | | | |
| Information Technology (17.10%) | | | | | | | | |
Advanced Energy Industries, Inc.(a) | | | 9,280 | | | | 512,349 | |
Alphabet, Inc., Class A(a) | | | 531 | | | | 411,992 | |
Ambarella, Inc.(a)(b) | | | 6,226 | | | | 383,024 | |
| Amphenol Corp., Class A | | | 6,653 | | | | 454,134 | |
ANSYS, Inc.(a) | | | 4,439 | | | | 417,399 | |
| Apple, Inc. | | | 3,796 | | | | 419,534 | |
| Applied Materials, Inc. | | | 13,951 | | | | 449,222 | |
Arista Networks, Inc.(a) | | | 5,077 | | | | 481,350 | |
| Broadridge Financial Solutions, Inc. | | | 5,964 | | | | 386,109 | |
| CDW Corp. | | | 9,522 | | | | 487,907 | |
Citrix Systems, Inc.(a) | | | 4,929 | | | | 427,492 | |
Coherent, Inc.(a) | | | 4,026 | | | | 525,393 | |
| Convergys Corp. | | | 14,053 | | | | 363,551 | |
| CSG Systems International, Inc. | | | 9,960 | | | | 443,220 | |
| Dolby Laboratories, Inc., Class A | | | 8,351 | | | | 385,399 | |
Electronic Arts, Inc.(a) | | | 5,068 | | | | 401,588 | |
Ellie Mae, Inc.(a) | | | 4,412 | | | | 364,211 | |
Entegris, Inc.(a) | | | 25,241 | | | | 453,076 | |
EPAM Systems, Inc.(a) | | | 6,102 | | | | 402,122 | |
Barron’s 400SMETF
| Schedule of Investments | November 30, 2016 |
| Security Description | | Shares | | | Value | |
| Information Technology (continued) | | | | | | |
Euronet Worldwide, Inc.(a) | | | 5,286 | | | $ | 379,112 | |
| EVERTEC, Inc. | | | 24,768 | | | | 452,016 | |
F5 Networks, Inc.(a) | | | 3,508 | | | | 493,751 | |
Facebook, Inc., Class A(a) | | | 3,222 | | | | 381,549 | |
| Fair Isaac Corp. | | | 3,216 | | | | 365,627 | |
Fiserv, Inc.(a) | | | 4,126 | | | | 431,662 | |
Fitbit, Inc., Class A(a)(b) | | | 27,885 | | | | 233,119 | |
Gigamon, Inc.(a) | | | 9,244 | | | | 493,167 | |
GrubHub, Inc.(a) | | | 9,882 | | | | 365,930 | |
GTT Communications, Inc.(a) | | | 19,280 | | | | 489,712 | |
| Hackett Group, Inc. | | | 25,209 | | | | 447,712 | |
II‐VI, Inc.(a) | | | 19,280 | | | | 582,256 | |
Integrated Device Technology, Inc.(a) | | | 20,475 | | | | 479,115 | |
| InterDigital, Inc. | | | 5,648 | | | | 447,322 | |
IPG Photonics Corp.(a) | | | 5,062 | | | | 485,547 | |
| j2 Global, Inc. | | | 6,067 | | | | 445,985 | |
| Jack Henry & Associates, Inc. | | | 4,773 | | | | 412,578 | |
Keysight Technologies, Inc.(a) | | | 13,764 | | | | 506,928 | |
| KLA‐Tencor Corp. | | | 5,938 | | | | 474,090 | |
| Lam Research Corp. | | | 4,478 | | | | 474,758 | |
Logitech International SA(b) | | | 19,172 | | | | 469,331 | |
Manhattan Associates, Inc.(a) | | | 7,065 | | | | 370,206 | |
| Mastercard, Inc., Class A | | | 4,124 | | | | 421,473 | |
Match Group, Inc.(a)(b) | | | 26,463 | | | | 475,805 | |
| MAXIMUS, Inc. | | | 7,190 | | | | 397,535 | |
MaxLinear, Inc., Class A(a) | | | 22,548 | | | | 460,656 | |
MeetMe, Inc.(a) | | | 75,075 | | | | 361,861 | |
| Methode Electronics, Inc. | | | 11,965 | | | | 442,107 | |
| Microsoft Corp. | | | 7,251 | | | | 436,945 | |
MicroStrategy, Inc., Class A(a) | | | 2,412 | | | | 468,000 | |
| NIC, Inc. | | | 18,153 | | | | 455,640 | |
| NVIDIA Corp. | | | 6,846 | | | | 631,201 | |
| Paychex, Inc. | | | 7,135 | | | | 420,608 | |
Paycom Software, Inc.(a) | | | 8,516 | | | | 382,113 | |
| QUALCOMM, Inc. | | | 6,688 | | | | 455,653 | |
Qualys, Inc.(a) | | | 11,553 | | | | 383,560 | |
Rambus, Inc.(a) | | | 31,776 | | | | 417,854 | |
Rubicon Project, Inc.(a) | | | 49,150 | | | | 371,082 | |
Rudolph Technologies, Inc.(a) | | | 23,695 | | | | 464,422 | |
Silver Spring Networks, Inc.(a) | | | 30,476 | | | | 425,140 | |
| Skyworks Solutions, Inc. | | | 5,909 | | | | 454,107 | |
Stamps.com, Inc.(a)(b) | | | 4,408 | | | | 468,130 | |
| Syntel, Inc. | | | 14,554 | | | | 282,348 | |
| Tessera Technologies, Inc. | | | 12,616 | | | | 499,594 | |
| Texas Instruments, Inc. | | | 6,076 | | | | 449,199 | |
| Total System Services, Inc. | | | 8,506 | | | | 418,665 | |
TTM Technologies, Inc.(a) | | | 39,797 | | | | 540,045 | |
Ubiquiti Networks, Inc.(a)(b) | | | 7,805 | | | | 436,768 | |
Universal Display Corp.(a) | | | 7,061 | | | | 385,884 | |
VMware, Inc., Class A(a)(b) | | | 5,607 | | | | 454,952 | |
WebMD Health Corp.(a) | | | 7,942 | | | | 423,626 | |
| Total Information Technology | | | | | | | 30,535,518 | |
| | | | | | | | | |
| Materials (4.27%) | | | | | | | | |
| Avery Dennison Corp. | | | 5,421 | | | | 390,637 | |
Berry Plastics Group, Inc.(a) | | | 9,369 | | | | 466,295 | |
| Dow Chemical Co. | | | 7,876 | | | | 438,851 | |
| Eagle Materials, Inc. | | | 5,382 | | | | 523,130 | |
| Security Description | | Shares | | | Value | |
| Materials (continued) | | | | | | |
| Graphic Packaging Holding Co. | | | 30,008 | | | $ | 377,201 | |
Headwaters, Inc.(a) | | | 24,326 | | | | 576,526 | |
| Innospec, Inc. | | | 7,057 | | | | 463,645 | |
| Martin Marietta Materials, Inc. | | | 2,296 | | | | 503,857 | |
| NewMarket Corp. | | | 980 | | | | 410,042 | |
| Packaging Corp. of America | | | 5,178 | | | | 438,887 | |
| Rayonier Advanced Materials, Inc. | | | 36,697 | | | | 509,354 | |
| RPM International, Inc. | | | 7,995 | | | | 423,016 | |
| Schweitzer‐Mauduit International, Inc. | | | 10,839 | | | | 455,672 | |
| Sherwin‐Williams Co. | | | 1,528 | | | | 410,528 | |
| Stepan Co. | | | 5,949 | | | | 482,880 | |
| Tahoe Resources, Inc. | | | 30,341 | | | | 290,667 | |
| Trinseo SA | | | 7,817 | | | | 457,685 | |
| Total Materials | | | | | | | 7,618,873 | |
| | | | | | | | | |
| Real Estate (0.51%) | | | | | | | | |
| HFF, Inc., Class A | | | 15,651 | | | | 453,879 | |
Marcus & Millichap, Inc.(a) | | | 16,475 | | | | 452,239 | |
| Total Real Estate | | | | | | | 906,118 | |
| | | | | | | | | |
| Telecommunication Services (0.80%) | | | | | | | | |
| AT&T, Inc. | | | 10,255 | | | | 396,151 | |
| Inteliquent, Inc. | | | 25,025 | | | | 566,566 | |
Level 3 Communications, Inc.(a) | | | 8,458 | | | | 465,782 | |
| Total Telecommunication Services | | | | | | | 1,428,499 | |
| | | | | | | | | |
| Utilities (0.46%) | | | | | | | | |
| Ormat Technologies, Inc. | | | 8,541 | | | | 408,516 | |
| PPL Corp. | | | 12,145 | | | | 406,372 | |
| Total Utilities | | | | | | | 814,888 | |
| | | | | | | | | |
| TOTAL COMMON STOCKS (Cost $150,994,771) | | | 171,779,713 | |
| | | | | | | | | |
| LIMITED PARTNERSHIPS (3.31%) | | | | | | | | |
| Energy (2.75%) | | | | | | | | |
| Antero Midstream Partners LP | | | 15,913 | | | | 448,269 | |
| EQT Midstream Partners LP | | | 5,410 | | | | 396,174 | |
| Holly Energy Partners LP | | | 12,943 | | | | 417,541 | |
| Magellan Midstream Partners LP | | | 5,978 | | | | 413,977 | |
| Phillips 66 Partners LP | | | 8,721 | | | | 393,579 | |
| Rice Midstream Partners LP | | | 19,538 | | | | 421,044 | |
| Shell Midstream Partners LP | | | 13,755 | | | | 379,363 | |
| Spectra Energy Partners LP | | | 9,557 | | | | 406,077 | |
| Tallgrass Energy Partners LP | | | 9,141 | | | | 428,164 | |
| Tesoro Logistics LP | | | 9,113 | | | | 429,496 | |
| Valero Energy Partners LP | | | 9,795 | | | | 395,914 | |
| Western Refining Logistics LP | | | 18,357 | | | | 378,154 | |
| Total Energy | | | | | | | 4,907,752 | |
| | | | | | | | | |
| Financials (0.24%) | | | | | | | | |
| Apollo Global Management LLC,Class A | | | 22,217 | | | | 427,899 | |
| Total Financials | | | | | | | 427,899 | |
Barron’s 400SMETF
| Schedule of Investments | November 30, 2016 |
| Security Description | | | | | Shares | | | Value | |
| Materials (0.32%) | | | | | | | | | |
| SunCoke Energy Partners LP | | | | | | 29,072 | | | $ | 575,626 | |
| Total Materials | | | | | | | | | | 575,626 | |
| | | | | | | | | | | | |
TOTAL LIMITED PARTNERSHIPS
(Cost $5,888,388) | | | | 5,911,277 | |
| | | | | | | | | | | | |
| | | 7 Day Yield | | | Shares | | | Value | |
| SHORT TERM INVESTMENTS (2.81%) | |
| Money Market Fund (0.47%) | | | | | | | | | | | |
| State Street Institutional Treasury Plus Money Market Fund | | | | | | | | | | | |
| (Cost $835,252) | | | 0.259 | % | | | 835,252 | | | | 835,252 | |
| | | | | | | | | | | | | |
| Investments Purchased With Collateral From Securities Loaned (2.34%) | | | | | | | | | | | | |
| State Street Navigator Securities Lending Government Money Market Portfolio, 0.26% | | | | | | | | | | | | |
| (Cost $4,180,347) | | | | | | | 4,180,347 | | | $ | 4,180,347 | |
| | | | | | | | | | | | | |
TOTAL SHORT TERM INVESTMENTS
(Cost $5,015,599) | | | | | 5,015,599 | |
| | | | | | | | | | | | | |
TOTAL INVESTMENTS (102.30%) (Cost $161,898,758) | | $ | 182,706,589 | |
| | | | | | | | | | | | | |
| NET OTHER ASSETS AND LIABILITIES (‐2.30%) | | | | (4,094,911 | ) |
| | | | | | | | | | | | | |
| NET ASSETS (100.00%) | | | | | | | | | | $ | 178,611,678 | |
| (a) | Non-income producing security. |
| (b) | Security, or a portion of the security position, is currently on loan. The total market value of securities on loan is $5,743,530. |
See Notes to Financial Statements.
Barron’s 400SMETF
| Statement of Assets and Liabilities | November 30, 2016 |
| ASSETS: | | | |
| Investments, at value | | $ | 182,706,589 | |
| Foreign tax reclaims | | | 203 | |
Dividends receivable | | | 176,768 | |
Total Assets | | | 182,883,560 | |
| | | | | |
| LIABILITIES: | | | | |
| Payable to adviser | | | 91,535 | |
Payable for collateral upon return of securities loaned | | | 4,180,347 | |
| Total Liabilities | | | 4,271,882 | |
| NET ASSETS | | $ | 178,611,678 | |
| | | | | |
| NET ASSETS CONSIST OF: | | | | |
| Paid‐in capital | | $ | 183,916,957 | |
| Accumulated net investment income | | | 1,157,459 | |
| Accumulated net realized loss | | | (27,270,569 | ) |
Net unrealized appreciation | | | 20,807,831 | |
| NET ASSETS | | $ | 178,611,678 | |
| | | | | |
| INVESTMENTS, AT COST | | $ | 161,898,758 | |
| | | | | |
| PRICING OF SHARES | | | | |
| Net Assets | | $ | 178,611,678 | |
| Shares of beneficial interest outstanding (Unlimited number of shares authorized, par value $0.01 per share) | | | 5,200,000 | |
| Net Asset Value, offering and redemption price per share | | $ | 34.35 | |
See Notes to Financial Statements.
Barron’s 400SMETF
| Statement of Operations | For the Year Ended November 30, 2016 |
| INVESTMENT INCOME: | | | |
Dividends(a) | | $ | 2,913,617 | |
Securities lending income | | | 73,605 | |
Total investment income | | | 2,987,222 | |
| | | | | |
| EXPENSES: | | | | |
Investment adviser fees | | | 1,129,513 | |
Total expenses | | | 1,129,513 | |
NET INVESTMENT INCOME | | | 1,857,709 | |
| | | | | |
| REALIZED AND UNREALIZED GAIN/(LOSS) | | | | |
| Net realized loss on investments | | | (4,619,422 | ) |
Net change in unrealized appreciation on investments | | | 15,004,846 | |
NET REALIZED AND UNREALIZED GAIN ON INVESTMENTS | | | 10,385,424 | |
| NET INCREASE IN NET ASSETS RESULTING FROM OPERATIONS | | $ | 12,243,133 | |
| (a) | Net of foreign tax withholding in the amount of $4,799. |
See Notes to Financial Statements.
Barron’s 400SMETF
Statements of Changes in Net Assets
| | | For the Year Ended November 30, 2016 | | | For the Year Ended November 30, 2015(a) | |
| OPERATIONS: | | | | | | |
| Net investment income | | $ | 1,857,709 | | | $ | 2,096,981 | |
Net realized gain/(loss)(a) | | | (4,619,422 | ) | | | 5,240,912 | |
| Long‐term capital gain distributions from other investment companies | | | – | | | | 3,315 | |
Net change in unrealized appreciation/(depreciation)(a) | | | 15,004,846 | | | | (4,541,491 | ) |
| Net increase in net assets resulting from operations | | | 12,243,133 | | | | 2,799,717 | |
| | | | | | | | | |
| DISTRIBUTIONS TO SHAREHOLDERS: | | | | | | | | |
From net investment income | | | (1,670,002 | ) | | | (1,549,998 | ) |
Total distributions | | | (1,670,002 | ) | | | (1,549,998 | ) |
| | | | | | | | | |
| CAPITAL SHARE TRANSACTIONS: | | | | | | | | |
| Proceeds from sale of shares | | | – | | | | 89,473,920 | |
Cost of shares redeemed | | | (36,766,171 | ) | | | (105,819,769 | ) |
Net decrease from share transactions | | | (36,766,171 | ) | | | (16,345,849 | ) |
| | | | | | | | | |
| Net decrease in net assets | | | (26,193,040 | ) | | | (15,096,130 | ) |
| | | | | | | | | |
| NET ASSETS | | | | | | | | |
Beginning of period | | | 204,804,718 | | | | 219,900,848 | |
| End of period * | | $ | 178,611,678 | | | $ | 204,804,718 | |
| | | | | | | | | |
| *Including accumulated net investment income of: | | $ | 1,157,459 | | | $ | 1,291,721 | |
| | | | | | | | | |
| OTHER INFORMATION: | | | | | | | | |
| CAPITAL SHARE TRANSACTIONS: | | | | | | | | |
| Beginning shares | | | 6,450,000 | | | | 6,950,002 | |
| Shares sold | | | – | | | | 2,700,000 | |
| Shares redeemed | | | (1,250,000 | ) | | | (3,200,002 | ) |
| Shares outstanding, end of period | | | 5,200,000 | | | | 6,450,000 | |
| (a) | Prior to November 30, 2016, the Fund presented realized gain/loss and unrealized appreciation/depreciation by investment type. This change in presentation was made to conform to industry standards and had no effect on the Fund's change in net assets. |
See Notes to Financial Statements.
Barron’s 400SMETF
| Financial Highlights | For a Share Outstanding Throughout the Periods Presented |
| | | For the Year Ended November 30, 2016 | | | For the Year Ended November 30, 2015 | | | For the Year Ended November 30, 2014 | | | For the Period June 4, 2013 (Commencement) to November 30, 2013 | |
| NET ASSET VALUE, BEGINNING OF PERIOD | | $ | 31.75 | | | $ | 31.64 | | | $ | 29.30 | | | $ | 25.00 | |
| | | | | | | | | | | | | | | | | |
| INCOME/(LOSS) FROM INVESTMENT OPERATIONS: | | | | | | | | | | | | |
Net investment income(a) | | 0.33 | | | 0.32 | | | 0.23 | | | 0.10 | |
Net realized and unrealized gain | | | 2.53 | | | | 0.02 | | | | 2.16 | | | | 4.20 | |
Total from investment operations | | | 2.86 | | | | 0.34 | | | | 2.39 | | | | 4.30 | |
| | | | | | | | | | | | | | | | | |
| DISTRIBUTIONS: | | | | | | | | | | | | | | | | |
From net investment income | | | (0.26 | ) | | | (0.23 | ) | | | (0.05 | ) | | | – | |
Total distributions | | | (0.26 | ) | | | (0.23 | ) | | | (0.05 | ) | | | – | |
| | | | | | | | | | | | | | | | | |
NET INCREASE IN NET ASSET VALUE | | | 2.60 | | | | 0.11 | | | | 2.34 | | | | 4.30 | |
| NET ASSET VALUE, END OF PERIOD | | $ | 34.35 | | | $ | 31.75 | | | $ | 31.64 | | | $ | 29.30 | |
TOTAL RETURN(b) | | | 9.12 | % | | | 1.07 | % | | | 8.18 | % | | | 17.20 | % |
| | | | | | | | | | | | | | | | | |
| RATIOS/SUPPLEMENTAL DATA: | | | | | | | | | | | | | | | | |
| Net assets, end of period (000s) | | $ | 178,612 | | | $ | 204,805 | | | $ | 219,901 | | | $ | 181,652 | |
| | | | | | | | | | | | | | | | | |
| Ratio of expenses to average net assets | | | 0.65 | % | | | 0.65 | % | | | 0.65 | % | | | 0.65 | %(c) |
| Ratio of net investment income to average net assets | | | 1.07 | % | | | 1.00 | % | | | 0.75 | % | | | 0.78 | %(c) |
Portfolio turnover rate(d) | | | 88 | % | | | 87 | % | | | 55 | % | | | 11 | % |
| (a) | Based on average shares outstanding during the period. |
| (b) | Total return is calculated assuming an initial investment made at the net asset value at the beginning of the period and redemption at the net asset value on the last day of the period and assuming all distributions are reinvested at actual reinvestment prices. Total return calculated for a period less than one year is not annualized. |
| (d) | Portfolio turnover for periods less than one year is not annualized and does not include securities received or delivered from processing creations or redemptions in-kind. |
See Notes to Financial Statements.
Barron’s 400SMETF
| Notes to Financial Statements | November 30, 2016 |
1. ORGANIZATION
ALPS ETF Trust (the “Trust”), a Delaware statutory trust, is an open‐end management investment company registered under the Investment Company Act of 1940, as amended (the “1940 Act”). As of November 30, 2016, the Trust consisted of nineteen separate portfolios. Each portfolio represents a separate series of the Trust. This report pertains solely to the Barron’s 400SM ETF (the “Fund”). The investment objective of the Fund is to seek investment results that correspond generally, before fees and expenses, to the performance of the Barron’s 400 IndexSM (the “Underlying Index”). The Fund has elected to qualify as a diversified series of the Trust under the 1940 Act.
The Fund’s Shares (“Shares”) are listed on the New York Stock Exchange (“NYSE”) Arca. The Fund issues and redeems Shares at net asset value (“NAV”) in blocks of 50,000 Shares, each of which is called a “Creation Unit”. Creation Units are issued and redeemed principally in‐kind for securities included in the Underlying Index. Except when aggregated in Creation Units, Shares are not redeemable securities of the Fund.
Pursuant to the Trust’s organizational documents, its Officers and Trustees are indemnified against certain liability arising out of the performance of their duties to the Trust. Additionally, in the normal course of business, the Trust enters into contracts with service providers that contain general indemnification clauses. The Trust’s maximum exposure under these arrangements is unknown, as this would involve future claims that may be made against the Trust that have not yet occurred.
2. SIGNIFICANT ACCOUNTING POLICIES
The following is a summary of significant accounting policies consistently followed by the Fund in the preparation of the financial statements. The accompanying financial statements were prepared in accordance with accounting principles generally accepted in the United States of America (“U.S. GAAP”). The preparation of financial statements in conformity with U.S. GAAP requires management to make certain estimates and assumptions that affect the reported amounts of assets and liabilities and disclosures of contingent assets and liabilities at the date of the financial statements and the reported amounts of revenue and expenses during the period. Actual results could differ from those estimates. The Fund is considered an investment company under U.S. GAAP and follows the accounting and reporting guidance applicable to investment companies in the Financial Accounting Standards Board Accounting Standards Codification Topic 946.
A. Portfolio Valuation
The Fund’s NAV is determined daily, as of the close of regular trading on the NYSE, normally 4:00 p.m. Eastern time, on each day the NYSE is open for trading. The NAV is computed by dividing the value of all assets of the Fund (including accrued interest and dividends), less all liabilities (including accrued expenses and dividends declared but unpaid), by the total number of shares outstanding.
Portfolio securities listed on any exchange other than the NASDAQ Stock Market LLC (“NASDAQ”) are valued at the last sale price on the business day as of which such value is being determined. If there has been no sale on such day, the securities are valued at the mean of the most recent bid and ask prices on such day. Securities traded on the NASDAQ are valued at the NASDAQ Official Closing Price as determined by NASDAQ. Portfolio securities traded on more than one securities exchange are valued at the last sale price on the business day as of which such value is being determined at the close of the exchange representing the principal market for such securities. Portfolio securities traded in the over‐the‐counter market, but excluding securities traded on the NASDAQ, are valued at the latest quoted sale price in such market.
The Fund’s investments are valued at market value or, in the absence of market value with respect to any portfolio securities, at fair value according to procedures adopted by the Trust’s Board of Trustees (the “Board”). When market quotations are not readily available or when events occur that make established valuation methods unreliable, securities of the Fund may be valued in good faith by or under the direction of the Board. These securities generally include, but are not limited to, restricted securities (securities which may not be publicly sold without registration under the Securities Act of 1933) for which a pricing service is unable to provide a market price; securities whose trading has been formally suspended; a security whose market price is not available from a pre‐established primary pricing source or the pricing source is not willing to provide a price; a security with respect to which an event has occurred that is most likely to materially affect the value of the security after the market has closed but before the calculation of the Fund’s NAV or make it difficult or impossible to obtain a reliable market quotation; or a security whose price, as provided by the pricing service, does not reflect the security’s “fair value” due to the security being de‐listed from a national exchange or the security’s primary trading market is temporarily closed at a time when, under normal conditions, it would be open. As a general principle, the current “fair value” of a security would be the amount which the owner might reasonably expect to receive from the sale on the applicable exchange or principal market. A variety of factors may be considered in determining the fair value of such securities.
Barron’s 400SMETF
| Notes to Financial Statements | November 30, 2016 |
B. Fair Value Measurements
The Fund discloses the classification of its fair value measurements following a three‐tier hierarchy based on the inputs used to measure fair value. Inputs refer broadly to the assumptions that market participants would use in pricing the asset or liability; including assumptions about risk. Inputs may be observable or unobservable. Observable inputs reflect the assumptions market participants would use in pricing the asset or liability that are developed based on market data obtained from sources independent of the reporting entity. Unobservable inputs reflect the reporting entity’s own assumptions about the assumptions market participants would use in pricing the asset or liability that are developed based on the best information available.
Valuation techniques used to value the Fund’s investments by major category are as follows:
Equity securities and Limited Partnerships, including restricted securities, for which market quotations are readily available, are valued at the last reported sale price or official closing price as reported by a third party pricing vendor on the primary market or exchange on which they are traded and are categorized as Level 1 in the hierarchy. In the event there were no sales during the day or closing prices are not available, securities are valued at the mean of the most recent quoted bid and ask prices on such day and are generally categorized as Level 2 in the hierarchy. Investments in open‐end mutual funds are valued at their closing NAV each business day and are categorized as Level 1 in the hierarchy.
Changes in valuation techniques may result in transfers in or out of an assigned level within the disclosure hierarchy.
Various inputs are used in determining the value of the Fund’s investments as of the end of the reporting period. When inputs used fall into different levels of the fair value hierarchy, the level in the hierarchy within which the fair value measurement falls is determined based on the lowest level input that is significant to the fair value measurement in its entirety. The designated input levels are not necessarily an indication of the risk or liquidity associated with these investments.
These inputs are categorized in the following hierarchy under applicable financial accounting standards:
Level 1 – | Unadjusted quoted prices in active markets for identical investments, unrestricted assets or liabilities that a Fund has the ability to access at the measurement date; |
| Level 2 – | Quoted prices which are not active, quoted prices for similar assets or liabilities in active markets or inputs other than quoted prices that are observable (either directly or indirectly) for substantially the full term of the asset or liability; and |
| Level 3 – | Significant unobservable prices or inputs (including the Fund’s own assumptions in determining the fair value of investments) where there is little or no market activity for the asset or liability at the measurement date. |
The following is a summary of the inputs used to value the Fund’s investments as of November 30 , 2016:
| Investments in Securities at Value* | | Level 1 - Unadjusted Quoted Prices | | | Level 2 - Other Significant Observable Inputs | | | Level 3 - Significant Unobservable Inputs | | | Total | |
| Common Stocks | | $ | 171,779,713 | | | $ | – | | | $ | – | | | $ | 171,779,713 | |
| Limited Partnerships | | | 5,911,277 | | | | – | | | | – | | | | 5,911,277 | |
| Short Term Investments | | | | | | | | | | | | | | | | |
| Money Market Fund | | | 835,252 | | | | – | | | | – | | | | 835,252 | |
| Investments Purchased with Collateral from | | | | | | | | | | | | | | | | |
Securities Loaned | | | 4,180,347 | | | | – | | | | – | | | | 4,180,347 | |
| TOTAL | | $ | 182,706,589 | | | $ | – | | | $ | – | | | $ | 182,706,589 | |
| * | For a detailed sector breakdown, see the accompanying Schedule of Investments. |
The Fund recognizes transfers between levels as of the end of the period. For the year ended November 30, 2016, the Fund did not have any transfers between Level 1 and Level 2 securities. The Fund did not have any securities that used significant unobservable inputs (Level 3) in determining fair value.
Barron’s 400SMETF
| Notes to Financial Statements | November 30, 2016 |
C. Securities Transactions and Investment Income
Securities transactions are recorded as of the trade date. Realized gains and losses from securities transactions are recorded on the highest cost basis. Dividend income and capital gains distributions, if any, are recorded on the ex‐dividend date. Interest income, if any, is recorded on the accrual basis.
D. Dividends and Distributions to Shareholders
Dividends from net investment income of the Fund, if any, are declared and paid annually or as the Board may determine from time to time. Distributions of net realized capital gains earned by the Fund, if any, are distributed at least annually.
E. Federal Tax and Tax Basis Information
The timing and character of income and capital gain distributions are determined in accordance with income tax regulations, which may differ from U.S. GAAP. Reclassifications are made to the Fund’s capital accounts for permanent tax differences to reflect income and gains available for distribution (or available capital loss carryforwards) under income tax regulations.
For the year ended November 30, 2016, the following reclassifications, which had no impact on results of operations or net assets, were recorded to reflect permanent tax differences resulting primarily from in‐kind transactions:
| Fund | | Paid-in Capital | | | Accumulated NetInvestment Gain/(Loss) | | | Accumulated Net RealizedGain/(Loss) on Investments | |
Barron’s 400SM ETF | | $ | 1,645,001 | | | $ | (321,969 | ) | | $ | (1,323,032 | ) |
At November 30, 2016, the Fund had available for tax purposes unused post‐enactment capital loss carryforwards as follows:
| Fund | | Short-Term | | | Long-Term | |
Barron’s 400SM ETF | | $ | 18,956,924 | | | $ | 8,472,185 | |
The tax character of the distributions paid during the fiscal years ended November 30, 2016 and November 30, 2015 were as follows:
| | | Ordinary Income | |
| November 30, 2016 | | | |
Barron’s 400SM ETF | | $ | 1,670,002 | |
| November 30, 2015 | | | | |
Barron’s 400SM ETF | | $ | 1,549,998 | |
As of November 30, 2016, the components of distributable earnings on a tax basis for the Fund were as follows:
| | Barron’s 400SM ETF | |
| Undistributed net investment income | | $ | 1,213,238 | |
| Accumulated net realized loss on investments | | | (27,429,109 | ) |
| Net unrealized appreciation on investments | | | 20,969,391 | |
| Other accumulated losses | | | (58,799 | ) |
| Total | | $ | (5,305,279 | ) |
Other accumulated losses are mostly due to partnership losses being suspended for tax purposes.
As of November 30, 2016, the cost of investments for federal income tax purposes and accumulated net unrealized appreciation/(depreciation) on investments were as follows:
| | | Barron’s 400SM ETF | |
| Gross appreciation (excess of value over tax cost) | | $ | 26,498,202 | |
| Gross depreciation (excess of tax cost over value) | | | (5,528,811 | ) |
| Net unrealized appreciation (depreciation) | | | 20,969,391 | |
| Cost of investments for income tax purposes | | $ | 161,737,198 | |
The differences between book‐basis and tax‐basis are primarily due to the deferral of losses from wash sales and investments in partnerships.
Barron’s 400SMETF
| Notes to Financial Statements | November 30, 2016 |
F. Income Taxes
No provision for income taxes is included in the accompanying financial statements, as the Fund intends to distribute to shareholders all taxable investment income and realized gains and otherwise comply with Subchapter M of the Internal Revenue Code of 1986, as amended, applicable to regulated investment companies. The Fund evaluates tax positions taken (or expected to be taken) in the course of preparing the Fund’s tax returns to determine whether these positions meet a “more‐likely‐than‐not” standard that, based on the technical merits, have a more than fifty percent likelihood of being sustained by a taxing authority upon examination. A tax position that meets the “more‐likely‐than‐not” recognition threshold is measured to determine the amount of benefit to recognize in the financial statements.
As of and during the year ended November 30, 2016, the Fund did not have a liability for any unrecognized tax benefits. The Fund files U.S. federal, state, and local tax returns as required. The Fund’s tax returns are subject to examination by the relevant tax authorities until expiration of the applicable statute of limitations, which is generally three years after the filing of the tax return, but may extend to four years in certain jurisdictions. Tax returns for open years have incorporated no uncertain tax positions that require a provision for income taxes.
G. Lending of Portfolio Securities
The Fund has entered into a securities lending agreement with State Street Bank & Trust Co. (“SSB”), the Fund’s lending agent. The Fund may lend its portfolio securities only to borrowers that are approved by SSB. The Fund will limit such lending to not more than 33 1/3% of the value of its total assets. The Fund’s securities held at SSB as custodian shall be available to be lent except those securities the Fund or ALPS Advisors Inc. specifically identifies in writing as not being available for lending. The borrower pledges and maintains with the Fund collateral consisting of cash (U.S. Dollars only), securities issued or guaranteed by the U.S. government or its agencies or instrumentalities, and cash equivalents (including irrevocable bank letters of credit) issued by a person other than the borrower or an affiliate of the borrower. The initial collateral received by the Fund is required to have a value of no less than 102% of the market value of the loaned securities for U.S equity securities and a value of no less than 105% of the market value for non‐U.S. equity securities. The collateral is maintained thereafter, at a market value equal to not less than 102% of the current value of the U.S. equity securities on loan and not less than 105% of the current value of the non‐U.S. equity securities on loan. The market value of the loaned securities is determined at the close of each business day and any additional required collateral is delivered to the Fund on the next business day. During the term of the loan, the Fund is entitled to all distributions made on or in respect of the loaned securities. Loans of securities are terminable at any time and the borrower, after notice, is required to return borrowed securities within the customary time period for settlement of securities transactions.
Any cash collateral received is reinvested in a money market fund managed by SSB as disclosed in the Fund’s Schedule of Investments and is reflected in the Statements of Assets and Liabilities as a payable for collateral upon return of securities loaned. Non‐cash collateral, in the form of securities issued or guaranteed by the U.S. government or its agencies or instrumentalities, is not disclosed in the Fund’s Statements of Assets and Liabilities as it is held by the lending agent on behalf of the Fund, and the Fund does not have the ability to re‐hypothecate these securities. Income earned by the Fund from securities lending activity is disclosed in the Statement of Operations.
The following is a summary of the Fund’s securities lending agreement and related cash and non‐cash collateral received as of November 30, 2016:
| | | Market Value of Securities on Loan | | | Cash Collateral Received | | | Non-Cash Collateral Received | | | Total Collateral Received | |
| Barron's 400 ETF | | $ | 5,743,530 | | | $ | 4,180,347 | | | $ | 1,804,274 | | | $ | 5,984,621 | |
The risks of securities lending include the risk that the borrower may not provide additional collateral when required or may not return the securities when due. To mitigate these risks, the Fund benefits from a borrower default indemnity provided by SSB. SSB’s indemnity allows for full replacement of securities lent wherein SSB will purchase the unreturned loaned securities on the open market by applying the proceeds of the collateral, or to the extent such proceeds are insufficient or the collateral is unavailable, SSB will purchase the unreturned loan securities at SSB’s expense. However, the Fund could suffer a loss if the value of the investments purchased with cash collateral falls below the value of the cash collateral received.
Barron’s 400SMETF
| Notes to Financial Statements | November 30, 2016 |
The following table reflects a breakdown of transactions accounted for as secured borrowings, the gross obligation by the type of collateral pledged or securities loaned, and the remaining contractual maturity of those transactions as of November 30, 2016:
| Barron's 400 ETF | | Remaining contractual maturity of the agreement | |
| Securities Lending Transactions | | Overnight & Continuous | | | Up to 30 days | | | 30-90 days | | | Greater than 90 days | | | Total | |
Common Stocks | | $ | 4,180,347 | | | $ | – | | | $ | – | | | $ | – | | | $ | 4,180,347 | |
Total Borrowings | | | | | | | | | | | | | | | | | | | 4,180,347 | |
Gross amount of recognized liabilities for securities lending (collateral received) | | | | | | | | | | | | | | | | | | $ | 4,180,347 | |
3. INVESTMENT ADVISORY FEE AND OTHER AFFILIATED TRANSACTIONS
ALPS Advisors, Inc. (the “Adviser”) acts as the Fund’s investment adviser pursuant to an Advisory Agreement with the Trust on behalf of the Fund (the “Advisory Agreement”). Pursuant to the Advisory Agreement, the Fund pays the Adviser a unitary fee for the services and facilities it provides payable on a monthly basis at the annual rate of 0.65% of the Fund’s average daily net assets. From time to time, the Adviser may waive all or a portion of its fee.
Out of the unitary management fee, the Adviser pays substantially all expenses of the Fund, the cost of transfer agency, custody, fund administration, legal, audit, independent trustees and other services, except for interest expenses, distribution fees or expenses, brokerage expenses, taxes and extraordinary expenses not incurred in the ordinary course of the Fund’s business. The Adviser’s unitary management fee is designed to pay substantially all of the Fund’s expenses and to compensate the Adviser for providing services for the Fund.
ALPS Fund Services, Inc., an affiliate of the Adviser, is the administrator of the Fund.
Each Trustee who is not an officer or employee of the Adviser, any sub‐adviser or any of their affiliates (“Independent Trustees”) receives (1) a quarterly retainer of $5,000, (2) a per meeting fee for regularly scheduled meetings of $3,750, (3) $1,500 for any special meeting held outside of a regularly scheduled board meeting, and (4) reimbursement for all reasonable out‐of‐pocket expenses relating to attendance at meetings.
4. PURCHASES AND SALES OF SECURITIES
For the year ended November 30, 2016, the cost of purchases and proceeds from sales of investment securities, excluding in‐kind transactions and short‐term investments, were as follows:
| Fund | | Purchases | | | Sales | |
| Barron’s 400 ETF | | $ | 154,049,983 | | | $ | 154,210,683 | |
For the year ended November 30, 2016, the cost of in‐kind purchases and proceeds from in‐kind sales were as follows:
| Fund | | Purchases | | | Sales | |
| Barron’s 400 ETF | | $ | – | | | $ | 36,655,364 | |
For the year ended November 30, 2016, the Barron’s 400SM ETF had in‐kind net realized gain of $1,723,727.
Gains on in‐kind transactions are not considered taxable for federal income tax purposes.
5. CAPITAL SHARE TRANSACTIONS
Shares are created and redeemed by the Fund only in Creation Unit size aggregations of 50,000 Shares. Only broker‐dealers or large institutional investors with creation and redemption agreements called Authorized Participants (“AP”) are permitted to purchase or redeem Creation Units from the Fund. Such transactions are generally permitted on an in‐kind basis, with a balancing cash component to equate the transaction to the NAV per unit of the Fund on the transaction date. Cash may be substituted equivalent to the value of certain securities generally when they are not available in sufficient quantity for delivery, not eligible for trading by the AP or as a result of other market circumstances.
Barron’s 400SMETF
| Notes to Financial Statements | November 30, 2016 |
6. RELATED PARTY TRANSACTIONS
The Fund engaged in cross trades between other funds in the Trust during the year ended November 30, 2016 pursuant to Rule 17a‐7 under the 1940 Act. Cross trading is the buying or selling of portfolio securities between funds to which the Adviser serves as the investment adviser. The Board previously adopted procedures that apply to transactions between the Funds of the Trust pursuant to Rule 17a‐7. These transactions related to cross trades during the period complied with the requirements set forth by Rule 17a‐7 and the Trust’s procedures.
Transactions related to cross trades during the year ended November 30, 2016, were as follows:
| Fund | Purchase cost paid | | Sale proceeds received | | Realized gain/ (loss) on sales | |
| Barron’s 400 ETF | | $ | 1,471,797 | | | $ | 2,790,076 | | | $ | 15,602 | |
Barron’s 400SMETF
| Additional Information | November 30, 2016 (Unaudited) |
PROXY VOTING RECORDS, POLICIES AND PROCEDURES
Information regarding how the Fund voted proxies relating to portfolio securities during the most recent 12‐month period ended June 30 and a description of the Fund’s proxy voting policies and procedures used in determining how to vote for proxies are available without charge on the Securities and Exchange Commission’s (“SEC”) website at www.sec.gov and upon request, by calling (toll‐free) 1‐866‐675‐2639.
PORTFOLIO HOLDINGS
The Trust is required to disclose, after its first and third fiscal quarters, the complete schedule of the Fund’s portfolio holdings with the SEC on Form N‐Q. Forms N‐Q for the Fund are available on the SEC’s website at www.sec.gov. The Fund’s Forms N‐Q may also be reviewed and copied at the SEC’s Public Reference Room in Washington, D.C. and information on the operation of the Public Reference Room may be obtained by calling 1‐ 800‐SEC‐0330. The Fund’s Forms N‐Q are available without charge, upon request, by calling (toll‐free) 1‐866‐675‐2639 or by writing to ALPS ETF Trust at 1290 Broadway, Suite 1100, Denver, Colorado 80203.
TAX INFORMATION
The Fund designates the following for federal income tax purposes for distributions made during the calendar year ended December 31, 2015:
| | Qualified Dividend Income | Dividend Received Deduction |
Barron's 400SM ETF | 100.00% | 100.00% |
In early 2016, if applicable, shareholders of record received this information for the distribution paid to them by the Fund during the calendar year 2015 via Form 1099. The Fund will notify shareholders in early 2017 of amounts paid to them by the Fund, if any, during the calendar year 2016.
LICENSING AGREEMENT
MarketGrader Capital, LLC has entered into a license agreement with Dow Jones & Company to use the “Barron’s” name and certain related intellectual property in connection with the Underlying Index. MarketGrader Capital, LLC also has entered into a license and services agreement with its parent company, MarketGrader.com, to use the methodology for constructing the Underlying Index. MarketGrader Capital, LLC in turn has entered into the Sublicense Agreement with ALPS Advisers, Inc. to use the Underlying Index. The following disclosure relates to such licensing agreements:
The Barron’s 400SM ETF (the “Fund”) is not sponsored, endorsed, sold or promoted by the MarketGrader Capital, LLC (the “Index Provider”). The Index Provider makes no representation or warranty, express or implied, to the owners of the Fund or any member of the public regarding the advisability of investing in securities generally or in the Fund particularly or the ability of the Fund to track the performance of the physical commodities market. The Index Provider’s only relationship to the ALPS Advisors, Inc. (the “Adviser”) or the Fund is the licensing of certain service marks and trade names of the Index Provider and of the Underlying Index that is determined, composed and calculated by the Index Provider without regard to the Adviser or the Fund. The Index Provider has no obligation to take the needs of the Adviser or the Fund or the owners of the Fund into consideration in determining, composing or calculating the Underlying Index. The Index Provider is not responsible for and has not participated in the determination of the timing of, prices at, or quantities of the Fund to be issued or in the determination or calculation of the equation by which the Fund is to be converted into cash. The Index Provider has no obligation or liability in connection with the administration, marketing or trading of the Fund.
THE INDEX PROVIDER DOES NOT GUARANTEE THE ACCURACY AND/OR THE COMPLETENESS OF THE UNDERLYING INDEX OR ANY DATA INCLUDED THEREIN AND THE INDEX PROVIDER SHALL HAVE NO LIABILITY FOR ANY ERRORS, OMISSIONS, OR INTERRUPTIONS THEREIN. THE INDEX PROVIDER MAKES NO WARRANTY, EXPRESS OR IMPLIED, AS TO RESULTS TO BE OBTAINED BY THE ADVISER, THE FUND, OWNERS OF THE FUND, OR ANY OTHER PERSON OR ENTITY FROM THE USE OF THE UNDERLYING INDEX OR ANY DATA INCLUDED THEREIN. THE INDEX PROVIDER MAKES NO EXPRESS OR IMPLIED WARRANTIES, AND EXPRESSLY DISCLAIMS ALL WARRANTIES OF MERCHANTABILITY OR FITNESS FOR A PARTICULAR PURPOSE OR USE WITH RESPECT TO THE UNDERLYING INDEX OR ANY DATA INCLUDED THEREIN. WITHOUT LIMITING ANY OF THE FOREGOING, IN NO EVENT SHALL THE INDEX PROVIDER HAVE ANY LIABILITY FOR ANY SPECIAL, PUNITIVE, INDIRECT, OR CONSEQUENTIAL DAMAGES (INCLUDING LOST PROFITS), EVEN IF NOTIFIED OF THE POSSIBILITY OF SUCH DAMAGES.
“The Barron’s 400 IndexSM” is calculated and published by MarketGrader Capital, LLC (“MarketGrader”). “Barron’s,” “Barron’s 400” and “Barron’s 400 Index” are trademarks or service marks of DJC & Company, Inc. or its affiliates and have been licensed to MarketGrader and sublicensed for certain purposes by Barron’s 400 Exchange Traded Fund, a sub‐fund of that certain ALPS ETF Trust, a Delaware Statutory Trust (“Sub‐Licensee”).
Barron’s 400SMETF
| Additional Information | November 30, 2016 (Unaudited) |
The Barron’s 400 ETF (the “Product”) is not sponsored, endorsed, sold or promoted by DJC or its affiliates. DJC and its affiliates make no representation or warranty, express or implied, to the owners of the Fund or any member of the public regarding the advisability of trading in the Fund particularly. DJC and its affiliates’ only relationship to the Licensee is the licensing of certain trademarks and trade names of DJC. DJC has no obligation to take the needs of the Licensee or the owners of the Fund into consideration in connection with its licensing of the Barron’s 400 Index to MarketGrader or the sublicense to Licensee. DJC and its affiliates are not responsible for and have not participated in the determination of the timing of, prices at, or quantities of the Fund to be sold or in the determination or calculation of the equation by which the Product are to be converted into cash. DJC and its affiliates have no obligation or liability in connection with the administration, marketing or trading of the Barron’s 400 Index or the Product.
DOW JONES DOES NOT GUARANTEE THE ACCURACY AND/OR THE COMPLETENESS OF THE BARRON’S 400 INDEX OR ANY DATA INCLUDED THEREIN AND DOW JONES AND ITS AFFILIATES SHALL HAVE NO LIABILITY FOR ANY ERRORS, OMISSIONS, OR INTERRUPTIONS THEREIN. DOW JONESAND ITS AFFILIATES MAKE NO WARRANTY, EXPRESS OR IMPLIED, AS TO RESULTS TO BE OBTAINED BY THE LICENSEE, OWNERS OF THE FUND, OR ANY OTHER PERSON OR ENTITY FROM THE USE OF THE BARRON’S 400 INDEX OR ANY DATA INCLUDED THEREIN. DOW JONES AND ITS AFFILIATES MAKE NO EXPRESS OR IMPLIED WARRANTIES. AND EXPRESSLY DISCLAIM ALL WARRANTIES, OF MERCHANTABILITY OR FITNESS FOR A PARTICULAR PURPOSE OR USE WITH RESPECT TO THE BARRON’S 400 INDEX OR ANY DATA INCLUDED THEREIN. WITHOUT LIMITING ANY OF THE FOREGOING, IN NO EVENT SHALL DOW JONES AND ITS AFFILIATES HAVE ANY LIABILITY FOR ANY LOST PROFITS OR INDIRECT, PUNITIVE, SPECIAL OR CONSEQUENTIAL DAMAGES OR LOSSES, EVEN IF NOTIFIED OF THE POSSIBILITY OF SUCH DAMAGES. THERE ARE NO THIRD PARTY BENEFICIARIES OF ANY AGREEMENTS OR ARRANGEMENTS BETWEEN DJC AND THE LICENSEE, OTHER THAN THE LICENSORS OF MARKETGRADER.
The Adviser does not guarantee the accuracy and/or the completeness of the Underlying Index or any data included therein, and the Adviser shall have no liability for any errors, omissions or interruptions therein. The Adviser makes no warranty, express or implied, as to results to be obtained by the Fund, owners of the Shares of the Fund or any other person or entity from the use of the Underlying Index or any data included therein. The Adviser makes no express or implied warranties, and expressly disclaims all warranties of merchantability or fitness for a particular purpose or use with respect to the Underlying Index or any data included therein. Without limiting any of the foregoing, in no event shall the Adviser have any liability for any special, punitive, direct, indirect or consequential damages (including lost profits) arising out of matters relating to the use of the Underlying Index, even if notified of the possibility of such damages.
Barron’s 400SMETF
| Board Considerations Regarding Approval of Investment Advisory Agreement | November 30, 2016 (Unaudited) |
At an in‐person meeting held on June 6, 2016, the Board of Trustees of the Trust (the “Board” or the “Trustees”), including the Trustees who are not “interested persons” of the Trust within the meaning of the 1940 Act, as amended (the “Independent Trustees”), evaluated a proposal to approve the continuance of the Investment Advisory Agreement between the Trust and ALPS Advisors, Inc. (the “Adviser”) with respect to the Barons 400 ETF (“BFOR” or “the Fund”). The Independent Trustees also met separately to consider the Investment Advisory Agreement.
In evaluating the Investment Advisory Agreement with respect to BFOR, the Trustees considered various factors, including (i) the nature, extent and quality of the services provided by AAI with respect to the Fund under the Investment Advisory Agreement; (ii) the advisory fees and other expenses paid by the Fund compared to those of similar funds managed by other investment advisers; (iii) the costs of the services provided to the Fund by AAI and the profits realized by AAI and its affiliates from its relationship to the Fund; (iv) the extent to which economies of scale have been or would be realized if and as the assets of the Fund grow and whether fees reflect the economies of scale for the benefit of shareholders; and (v) any additional benefits and other considerations.
With respect to the nature, extent and quality of the services provided by AAI under the Investment Advisory Agreement, the Trustees considered and reviewed information concerning the services provided under the Investment Advisory Agreement, the investment parameters of the index of the Fund, financial information regarding AAI and its parent company, information describing AAI’s current organization and the background and experience of the persons responsible for the day‐to‐day management of the Fund.
The Trustees reviewed information on the performance of the Fund and its benchmark. The Trustees also evaluated the correlation and tracking error between the Fund’s underlying index and the Fund’s performance. Based on their review, the Trustees found that the nature and extent of services provided to the Fund under the Investment Advisory Agreement was appropriate and that the quality was satisfactory.
The Trustees noted that the advisory fee for the Fund was a unitary fee pursuant to which AAI assumes all expenses of the Fund (including the cost of transfer agency, custody, fund administration, legal, audit and other services) other than the payments under the Advisory Agreement, brokerage expenses, taxes, interest, litigation expenses and other extraordinary expenses.
With respect to advisory fee rates, the Trustees noted the following: The net advisory fee rate for the Fund is higher than the median of its Broadridge expense group and the Fund’s expense ratio is slightly above the median of its Broadridge expense group.
With respect to BFOR, the Trustees took into account, among other things, the unique features and performance of the Fund’s underlying index and the costs and benefits of linkage to the Barron’s name.
Based on the foregoing, and the other information available to them, the Trustees concluded that the advisory fee rate for the Fund was reasonable under the circumstances and in light of the quality of the services provided.
The Trustees considered other benefits available to AAI because of its relationship with the Fund and concluded that the advisory fees were reasonable taking into account any such benefits.
The Trustees also considered with respect to the Fund the information provided by AAI about the costs and profitability of AAI with respect to each of the Fund. The Trustees reviewed and noted the relatively small sizes of the Fund and concluded that AAI was not realizing any economies of scale. The Trustees determined that they would continue to evaluate whether further economies of scale have been achieved on an ongoing basis.
In voting to renew the Investment Advisory Agreement, the Trustees concluded that the terms of the Investment Advisory Agreement are reasonable and fair in light of the services to be performed, the fees paid by certain other funds, expenses to be incurred and such other matters as the Trustees considered relevant in the exercise of their reasonable business judgment. The Trustees did not identify any single factor or group of factors as all important or controlling and considered all factors together.
Barron’s 400SMETF
| Trustees & Officers | November 30, 2016 (Unaudited) |
The general supervision of the duties performed by the Adviser for the Fund under the Investment Advisory Agreement is the responsibility of the Board of Trustees. The Trust currently has four Trustees. Three Trustees have no affiliation or business connection with the Adviser or any of its affiliated persons and do not own any stock or other securities issued by the Adviser. These are the “non‐interested” or “independent” Trustees (“Independent Trustees”). The other Trustee (the “Interested Trustee”) is affiliated with the Adviser.
The Independent Trustees of the Trust, their term of office and length of time served, their principal business occupations during the past five years, the number of portfolios in the Fund Complex overseen by each Independent Trustee, and other directorships, if any, held by the Trustee are shown below.
INDEPENDENT TRUSTEES
| Name, Address & Year of Birth* | Position(s) Held with Trust | Term of Office and Length of Time Served** | Principal Occupation(s) During Past 5 Years | Number of Portfolios in Fund Complex Overseen by Trustees*** | Other Directorships Held by Trustees |
Mary K. Anstine,
1940 | Trustee | Since March 2008 | Ms. Anstine was President/Chief Executive Officer of HealthONE Alliance, Denver, Colorado, and former Executive Vice President of First Interstate Bank of Denver. Ms. Anstine is also Trustee/ Director of AV Hunter Trust and Colorado Uplift Board. Ms. Anstine was formerly a Director of the Trust Bank of Colorado (later purchased and now known as Northern Trust Bank), HealthONE and Denver Area Council of the Boy Scouts of America and a member of the American Bankers Association Trust Executive Committee. | 44 | Ms. Anstine is a Trustee of ALPS Variable Investment Trust (10 funds); Financial Investors Trust (31 funds); Reaves Utility Income Fund (1 fund); and Westcore Trust (14 funds). |
Jeremy W. Deems,
1976 | Trustee | Since March 2008 | Mr. Deems is the Co‐Founder, Chief Compliance Officer and Chief Financial Officer of Green Alpha Advisors, LLC. Mr. Deems is Co‐Portfolio Manager of the Shelton Green Alpha Fund. Prior to joining Green Alpha Advisors, Mr. Deems was CFO and Treasurer of Forward Management, LLC, ReFlow Management Co., LLC, ReFlow Fund, LLC, a private investment fund, and Sutton Place Management, LLC, an administrative services company. | 46 | Mr. Deems is a Trustee of ALPS Variable Investment Trust (10 funds); Financial Investors Trust (31 funds); and Reaves Utility Income Fund (1 fund); Clough Funds Trust (1 fund) and Elevation ETF Trust (2 fund). |
Rick A. Pederson,
1952 | Trustee | Since March 2008 | Mr. Pederson is President, Foundation Properties, Inc. (a real estate investment management company), 1994 ‐ present; Advisory Board Member, Bow River Capital Partners (private equity management), 2003 ‐ present; Advisor, The Pauls Corporation (real estate investment management and development), 2008 ‐ present; Chairman, Ross Consulting Group (real estate consulting services) 1983 ‐ 2013; Advisory Board Member, Neenan Company (construction services) 2002 ‐ present; Board Member, Prosci Inc. (private business services) 2013 ‐ 2016; Board Member, Citywide Banks (Colorado community bank) 2014 ‐ present; Board Member, Strong‐Bridge Consulting (management consulting) 2015 ‐ present; Director, National Western Stock Show (not‐for‐profit organization); Director, Biennial of the Americas (not‐for‐profit‐organization), 2012 ‐ 2015; Board Member, History Colorado, 2015 ‐ present. | 22 | Mr. Pederson is Trustee of Westcore Trust (14 funds) and Principal Real Estate Income Fund (1 fund). |
| * | The business address of the Trustee is c/o ALPS Advisors, Inc., 1290 Broadway, Suite 1100, Denver, Colorado 80203. |
| ** | This is the period for which the Trustee began serving the Trust. Each Trustee serves an indefinite term, until his successor is elected. |
| *** | The Fund Complex includes all series of the Trust and any other investment companies for which ALPS Advisors, Inc. provides investment advisory services. |
Barron’s 400SMETF
| Trustees & Officers | November 30, 2016 (Unaudited) |
The Trustee who is affiliated with the Adviser or affiliates of the Adviser and executive officers of the Trust, his term of office and length of time served, his principal business occupations during the past five years, the number of portfolios in the Fund Complex overseen by the Interested Trustee and the other directorships, if any, held by the Trustee, are shown below.
INTERESTED TRUSTEE
| Name, Address and Year of Birth of Interested Trustee* | Position(s) Held with Trust | Term of Office and Length of Time Served** | Principal Occupation(s) During Past 5 Years | Number of Portfolios in Fund Complex Overseen by Trustees*** | Other Directorships Held by Trustees |
Thomas A. Carter,
1966 | Trustee and President | Since March 2008 | Mr. Carter joined ALPS Fund Services, Inc. (“ALPS”) in 1994 and is currently President and Director of ALPS Advisors, Inc. (“AAI”) and ALPS Portfolio Solutions Distributor, Inc. (“APSD”) and Executive Vice President and Director of ALPS and ALPS Holdings, Inc. (“AHI”) and ALPS Distributors, Inc. (“ADI”). Because of his position with AHI, ALPS, ADI, APSD and AAI, Mr. Carter is deemed an affiliate of the Fund as defined under the 1940 Act. Before joining ALPS, Mr. Carter was with Deloitte & Touche LLP, where he worked with a diverse group of clients, primarily within the financial services industry. Mr. Carter is a Certified Public Accountant and received his Bachelor of Science in Accounting from the University of Colorado at Boulder. | 33 | Mr. Carter is a Trustee of ALPS Variable Investment Trust (10 funds); Principal Real Estate Income Fund (1 fund); and RiverNorth Opportunities Fund, Inc. (1 fund). |
| * | The business address of the Trustee is c/o ALPS Advisors, Inc., 1290 Broadway, Suite 1100, Denver, Colorado 80203. |
| ** | This is the period for which the Trustee began serving the Trust. Each Trustee serves an indefinite term, until his successor is elected. |
| *** | The Fund Complex includes all series of the Trust and any other investment companies for which ALPS Advisors, Inc. provides investment advisory services. |
Barron’s 400SMETF
| Trustees & Officers | November 30, 2016 (Unaudited) |
OFFICERS
| Name, Address and Year of Birth of Officer* | Position(s) Held with Trust | Length of Time Served** | Principal Occupation(s) During Past 5 Years |
Erin D. Nelson,
1977 | Chief Compliance Officer (“CCO”) | Since December 2015 | Erin Nelson became Senior Vice‐President and Chief Compliance Officer of ALPS Advisors, Inc. (“AAI”) on July 1, 2015 and prior to that served as Vice President and Deputy Chief Compliance Officer of AAI since January 1, 2015. Prior to January 1, 2015, Ms. Nelson was Vice‐President and Assistant General Counsel of ALPS Fund Services, Inc. Because of her position with AAI, Ms. Nelson is deemed an affiliate of the Trust as defined under the 1940 Act. Ms. Nelson is also the CCO of ALPS Variable Investment Trust, Liberty All‐Star Growth Fund, Inc., Liberty All‐ Star Equity Fund, Principal Real Estate Income Fund, and RiverNorth Opportunities Fund, Inc. |
Patrick D. Buchanan,
1972 | Treasurer | Since June 2012 | Mr. Buchanan is Vice President of AAI. Mr. Buchanan joined ALPS in 2007 and because of his position with AAI, he is deemed an affiliate of the Trust as defined under the 1940 Act. Mr. Buchanan is also Treasurer of the ALPS Variable Insurance Trust, Principal Real Estate Income Fund, Clough Funds Trust and RiverNorth Opportunities Fund, Inc. |
Andrew P. Meloni,
1969 | Assistant Treasurer | Since December 2016 | Mr. Meloni is a Fund Controller for ALPS Fund Services, Inc. Mr. Meloni joined ALPS in 2007 and because of his position with ALPS, he is deemed an affiliate of the Fund as defined under the 1940 Act. Mr. Meloni is also Assistant Treasurer to the Liberty All‐Star Equity Fund, Liberty All‐Star Growth Fund, Inc., Principal Real Estate Income Fund, RiverNorth Opportunities Fund, Inc. and ALPS Variable Investment Trust. |
Abigail J. Murray,
1975 | Secretary | Since June 2015 | Ms. Murray joined ALPS in April 2015. She is currently Vice President and Senior Counsel of ALPS. Prior to joining ALPS, Ms. Murray was an Attorney and Managing Member at Murray & Rouvina PLC from 2014 to 2015 and an Associate with Vedder Price P.C. from 2007 to 2014. Ms. Murray is also the Secretary of Clough Global Allocation Fund, Clough Global Equity Fund, Clough Global Opportunities Fund, Clough Funds Trust, The Caldwell & Orkin Funds, Inc. and RiverNorth Opportunities Fund, Inc. and Assistant Secretary of Elevation ETF Trust and Principal Real Estate Income Fund. |
Andrea E. Kuchli,
1985 | Assistant Secretary | Since December 2015 | Ms. Kuchli joined ALPS in 2015 and is currently Vice President and Senior Counsel of ALPS. Prior to joining ALPS, Ms. Kuchli was an Associate with Davis Graham & Stubbs LLP from April 2014 to February 2015, and an Associate with Dechert LLP from 2011 to April 2014. Because of her position with ALPS, Ms. Kuchli is deemed an affiliate of the Trust as defined under the 1940 Act. Ms. Kuchli is also Secretary of Elevation ETF Trust and Principal Real Estate Income Fund as well as Assistant Secretary of the James Advantage Funds and RiverNorth Opportunities Fund, Inc. |
Sharon Akselrod,
1974 | Assistant Secretary | Since December 2016 | Ms. Akselrod joined ALPS in August 2014 and is currently Senior Investment Company Act Paralegal of ALPS Fund Services, Inc. Prior to joining ALPS, Ms. Akselrod served as Corporate Governance and Regulatory Associate for Nordstrom fsb (2013‐2014) and Senior Legal Assistant – Legal Manager for AXA Equitable Life Insurance Company (2008‐2013). Because of her position with ALPS, Ms. Akselrod is deemed an affiliate of the Trust as defined under the 1940 Act. Ms. Akselrod is also Assistant Secretary of Financial Investors Trust. |
| * | The business address of each Officer is c/o ALPS Advisors, Inc., 1290 Broadway, Suite 1100, Denver, Colorado 80203. |
| ** | This is the period for which the Officer began serving the Trust. Each Officer serves an indefinite term, until his/her successor is elected. |
The Statement of Additional Information includes additional information about the Fund's Trustees and is available, without charge, upon request by calling (toll-free) 1-855-724-0450.
Page Intentionally Left Blank.
Must be accompanied or preceded by a prospectus.
ALPS Portfolio Solutions Distributor, Inc., a FINRA member, is the Distributor for the Barron's 400SM ETF.

| Performance Overview | 1 |
| Disclosure of Fund Expenses | 4 |
| Report of Independent Registered Public Accounting Firm | 5 |
| Schedule of Investments | 6 |
| Statement of Assets & Liabilities | 9 |
| Statement of Operations | 10 |
| Statements of Changes In Net Assets | 11 |
| Financial Highlights | 12 |
| Notes to Financial Statements | 13 |
| Additional Information | 18 |
| Board Considerations Regarding Approval of Investment Advisory Agreement | 19 |
| Trustees & Officers | 20 |
alpsfunds.com
Cohen & Steers Global Realty Majors ETF
| Performance Overview | November 30, 2016 (Unaudited) |
Investment Objective
The Cohen & Steers Global Realty Majors ETF (the “Fund”) seeks investment results that correspond generally to the performance, before the Fund’s fees and expenses, of an index called the Cohen & Steers Global Realty Majors Index (the “Underlying Index”). The Fund will normally invest at least 90% of its total assets in common stocks and other equity securities (which may include American Depositary Receipts (“ADRs”), American Depositary Shares (“ADSs”) and Global Depositary Receipts (“GDRs”)) that comprise the Underlying Index. The Shares of the Fund are listed and trade on the NYSE Arca under the ticker symbol “GRI”.
The Underlying Index consists of the largest and most liquid securities within the global real estate universe that Cohen & Steers Capital Management, Inc. (“Cohen & Steers” or the “Index Provider”) believes are likely to lead the global securitization of real estate. The Underlying Index is free float and modified market-capitalization weighted, with a limit of 4.0% on any security’s weighting. Underlying Index constituents must have a free float adjusted market-capitalization of $750 million or greater for initial inclusion in the Underlying Index. Cohen & Steers considers country weights relative to each country’s GDP share representing the real estate securities universe and share of the private market for real estate, with up to 10% being allocated to securities of emerging markets. The Underlying Index is rebalanced quarterly.
Performance Overview
For the year ended November 30, 2016, the Fund’s market price increased 0.47% and the Fund’s net asset value (NAV) increased 0.61%.
Global real estate stocks had a modestly positive total return as a group for the period, although performance varied by region. Markets initially tumbled amid declining oil prices, which reached a 13-year low in February 2016, and related concerns about global growth. Stocks then moved higher into June, aided by a rebound in oil, generally better economic data and stimulus policies adopted by several central banks. The European Central Bank announced in March that it would expand its bond-buying program and include corporate debt for the first time. Markets were upended late mid-period when the U.K. unexpectedly voted in favor of leaving the European Union. Real estate markets generally recovered as the shock wore off.
Real estate stocks ended the period on a down note, as generally positive economic data was not enough to compensate for a sharp rise in bond yields globally in November amid a rising inflation outlook. While yields had been trending higher in the previous months, Donald Trump’s surprise victory in the U.S. Presidential election accelerated growth and inflation expectations due to the anticipated impact of changes in fiscal and tax policies. This prompted a rotation out of fixed income and higher-yielding equities, including REITs, into more growth-oriented investments.
In this environment, U.S. REITs (5.0% total return) advanced, despite giving back some of their sizable gains made through July. Although concerns about rising interest rates occasionally weighed on the group, commercial real estate fundamentals remained strong in most property sectors and REITs continued to report earnings that mostly met or exceeded high expectations.
In Europe, the Brexit vote weighed heavily on U.K real estate securities (–16.3%), reflecting concerns that heightened businesses uncertainty would have an immediate and negative impact on the country’s economy and capital values via curtailed hiring and investment activity. The market partly recovered as the worst economic fears were far from realized. The U.K.’s currency also declined in response to Brexit, depreciating significantly against both the euro and U.S. dollar.
On the continent, the Netherlands (–11.4%) and Italy (–28.8%), which have strong anti-EU populist political movements, were among the poorest performers. Any move toward independence by those countries would also involve exiting the euro currency—unlike the U.K.—which further complicates the debate. Italy was also hampered by the weak state of its banking sector. Germany (5.0%) outperformed, lifted by certain apartment landlords that benefited from strong and improving fundamentals in German residential markets.
Asia Pacific markets included some of the period’s best performers, helped by economic stabilization in China. Hong Kong (10.9%) rallied almost across the board. Good performers included certain retailers that benefited as Hong Kong’s high-end retail spending trends turned generally less negative. Residential developers saw some encouraging trends: late-period unit sales were strong in the primary market, while secondary market volume edged up.
In Australia (10.4%), the central bank reduced the official cash rate from 2.0% to 1.5%, a record low, which provided support to developers as well as retail landlords. Certain office companies also rallied, aided by improving fundamentals in Sydney’s office market. Japan (–3.2%) had a negative return, reflecting concerns about the health of its economy and the effectiveness of government stimulus policies.
Cohen & Steers Global Realty Majors ETF
| Performance Overview | November 30, 2016 (Unaudited) |
Performance (as of November 30, 2016)
| | 1 Year | 3 Year | 5 Year | Since Inception^ |
| Cohen & Steers Global Realty Majors ETF - NAV | 0.61% | 4.82% | 8.65% | 1.76% |
| Cohen & Steers Global Realty Majors ETF - Market Price* | 0.47% | 4.75% | 8.28% | 1.76% |
| Cohen & Steers Global Realty Majors Index | 1.33% | 5.57% | 9.44% | 2.58% |
| FTSE EPRA/ NAREIT Developed Real Estate Index | 2.83% | 5.77% | 9.87% | 2.81% |
S&P 500® Total Return Index | 8.06% | 9.07% | 14.45% | 7.81% |
Total Expense Ratio (per the current Prospectus) 0.55%
Performance data quoted represents past performance. Past performance does not guarantee future results. The table does not reflect the deduction of taxes that a shareholder would pay on Fund distributions or the redemption of Fund shares. Investment return and principal value of an investment will fluctuate so that an investor’s shares, when sold or redeemed, may be worth more or less than the original cost. Current performance data may be higher or lower than actual data quoted. For the most current month-end performance data please visit www.alpsfunds.com or call 1.866.513.5856.
NAV is an exchange-traded fund’s per-share value. The per-share dollar amount of the Fund is derived by dividing the total value of all the securities in its portfolio, less any liabilities, by the number of Fund shares outstanding. Market Price is the price at which a share can currently be traded in the market. Information detailing the number of days the Market Price of the Fund was greater than the Fund’s NAV and the number of days it was less than the Fund’s NAV can be obtained at www.alpsfunds.com.
| ^ | Fund Inception May 7, 2008. |
| * | Market Price is based on the midpoint of the bid/ask spread at 4p.m. ET and does not represent the returns an investor would receive if shares were traded at other times. |
Cohen & Steers Global Realty Majors® Index: A free-float adjusted, modified market capitalization-weighted index of global real estate equities. The modified market capitalization weighting approach and qualitative screening process emphasize those companies that, in the opinion of the Cohen & Steers investment committee, are leading the securitization of real estate globally.
FTSE EPRA/NAREIT Developed Real Estate Index: An unmanaged market-weighted total return index that consists of many companies from developed markets whose floats are larger than $100 million and which derive more than half of their revenue from property-related activities.
S&P 500® Total Return Index: The Standard & Poor’s composite index of 500 stocks, a widely recognized, unmanaged index of common stock prices.
The indexes are not actively managed and do not reflect any deductions for fees, expenses or taxes. Total return assumes reinvestment of any dividends and distributions realized during a given time period. One cannot invest directly in an index. Index performance does not reflect fund performance.
The Cohen & Steers Global Realty Majors ETF is not suitable for all investors. Investments in the Fund are subject to investment risks, including possible loss of the principal amount invested.
ALPS Portfolio Solutions Distributor, Inc., a FINRA member, is the distributor for the Cohen & Steers Global Realty Majors ETF.
ALPS Portfolio Solutions Distributor, Inc. is not affiliated with Cohen & Steers.
Cohen & Steers Global Realty Majors ETF
| Performance Overview | November 30, 2016 (Unaudited) |
Top 10 Holdings* (as of November 30, 2016)
| Simon Property Group, Inc. | 4.03% |
| Public Storage | 3.84% |
| Mitsubishi Estate Co., Ltd. | 3.41% |
| ProLogis, Inc. | 3.31% |
| Equinix, Inc. | 2.97% |
| Mitsui Fudosan Co., Ltd. | 2.84% |
| AvalonBay Communities, Inc. | 2.78% |
| Welltower, Inc. | 2.77% |
| Equity Residential | 2.70% |
| Unibail-Rodamco SE | 2.69% |
| Total % of Top 10 Holdings | 31.34% |
Future holdings are subject to change.
Country Allocation* (as of November 30, 2016)
| United States | 52.49% |
| Japan | 11.05% |
| Hong Kong | 11.00% |
| Australia | 8.03% |
| France | 4.31% |
| United Kingdom | 4.12% |
| Germany | 4.09% |
| Singapore | 2.04% |
| Canada | 1.20% |
| Spain | 0.59% |
| Sweden | 0.44% |
| Switzerland | 0.43% |
| Brazil | 0.21% |
| Total | 100.00% |
Growth of $10,000 (as of November 30, 2016)
Comparison of Change in Value of $10,000 Investment in the Fund and the Indexes
The chart above represents historical performance of a hypothetical investment of $10,000 in the Fund over the life of the Fund. Past performance does not guarantee future results. This chart does not reflect the deduction of taxes that a shareholder would pay on Fund distributions or the redemption of Fund shares.
Cohen & Steers Global Realty Majors ETF
| Disclosure of Fund Expenses | November 30, 2016 (Unaudited) |
Shareholder Expense Example: As a shareholder of the Fund, you incur two types of costs: (1) transaction costs which may include creation and redemption fees or brokerage charges, and (2) ongoing costs, including management fees and other Fund expenses. These examples are intended to help you understand your ongoing costs (in dollars) of investing in the Fund and to compare these costs with the ongoing costs of investing in other funds. It is based on an investment of $1,000 invested at the beginning of the (six month) period and held through November 30, 2016.
Actual Return: The first line of the table provides information about actual account values and actual expenses. You may use the information in this line, together with the amount you invested, to estimate the expenses that you incurred over the period. Simply divide your account value by $1,000 (for example, an $8,600 account value divided by $1,000 = 8.6), then multiply the result by the number in the first line under the heading entitled “Expenses Paid During Period” to estimate the expenses attributable to your investment during this period.
Hypothetical 5% Return: The second line of the table provides information about hypothetical account values and hypothetical expenses based on the Fund’s actual expense ratio and an assumed rate of return of 5% per year before expenses, which is not the Fund’s actual return. The hypothetical account values and expenses may not be used to estimate the actual ending account balance or expenses you paid for the period. You may use this information to compare ongoing costs of investing in the Fund and other funds. To do so, compare this 5% hypothetical example with the 5% hypothetical examples that appear in the shareholder reports of other funds.
The expenses shown in the table are meant to highlight ongoing Fund costs only and do not reflect any transaction costs, such as creation and redemption fees or brokerage charges. Therefore, the second line is useful in comparing ongoing costs only, and will not help you determine the relative total costs of owning different funds. In addition, if these costs were included, your costs would have been higher.
| | Beginning Account Value 6/1/16 | Ending Account Value 11/30/16 | Expense Ratio(a) | Expenses Paid During Period 6/1/16 - 11/30/16(b) |
| Cohen & Steers Global Realty Majors ETF | | | | |
| Actual | $1,000.00 | $956.90 | 0.55% | $2.69 |
| Hypothetical (5% return before expenses) | $1,000.00 | $1,022.25 | 0.55% | $2.78 |
| (a) | Annualized, based on the Fund's most recent fiscal half-year expenses. |
| (b) | Expenses are equal to the Fund's annualized expense ratio multiplied by the average account value over the period, multiplied by the number of days in the most recent fiscal half year (183), divided by 366. |
Cohen & Steers Global Realty Majors ETF
Report of Independent Registered Public Accounting Firm
To the Board of Trustees and Shareholders of ALPS ETF Trust:
We have audited the accompanying statement of assets and liabilities, including the schedule of investments, of Cohen & Steers Global Realty Majors ETF, one of the portfolios constituting the ALPS ETF Trust (the “Trust”), as of November 30, 2016, and the related statement of operations for the year then ended, the statements of changes in net assets statements for each of the two years in the period then ended, and the financial highlights for each of the five years in the period then ended. These financial statements and financial highlights are the responsibility of the Trust’s management. Our responsibility is to express an opinion on these financial statements and financial highlights based on our audits.
We conducted our audits in accordance with the standards of the Public Company Accounting Oversight Board (United States). Those standards require that we plan and perform the audit to obtain reasonable assurance about whether the financial statements and financial highlights are free of material misstatement. The Trust is not required to have, nor were we engaged to perform, an audit of its internal control over financial reporting. Our audits included consideration of internal control over financial reporting as a basis for designing audit procedures that are appropriate in the circumstances, but not for the purpose of expressing an opinion on the effectiveness of the Trust’s internal control over financial reporting. Accordingly, we express no such opinion. An audit also includes examining, on a test basis, evidence supporting the amounts and disclosures in the financial statements, assessing the accounting principles used and significant estimates made by management, as well as evaluating the overall financial statement presentation. Our procedures included confirmation of securities owned as of November 30, 2016, by correspondence with the custodian. We believe that our audits provide a reasonable basis for our opinion.
In our opinion, the financial statements and financial highlights referred to above present fairly, in all material respects, the financial position of Cohen & Steers Global Realty Majors ETF of the ALPS ETF Trust as of November 30, 2016, the results of its operations for the year then ended, the changes in its net assets for each of the two years in the period then ended, and the financial highlights for each of the five years in the period then ended, in conformity with accounting principles generally accepted in the United States of America.
DELOITTE & TOUCHE LLP
Denver, Colorado
January 27, 2017
Cohen & Steers Global Realty Majors ETF
| Schedule of Investments | November 30, 2016 |
| Security Description | | Shares | | | Value | |
| COMMON STOCKS (99.55%) | | | | | | |
| Australia (8.01%) | | | | | | |
| Dexus Property Group | | | 95,110 | | | $ | 640,534 | |
| Goodman Group | | | 157,070 | | | | 774,803 | |
| The GPT Group | | | 179,994 | | | | 643,316 | |
| Scentre Group, Ltd. | | | 529,793 | | | | 1,658,798 | |
| Stockland | | | 236,553 | | | | 756,376 | |
| Vicinity Centres | | | 324,459 | | | | 699,623 | |
| Westfield Corp. | | | 190,085 | | | | 1,282,967 | |
| Total Australia | | | | | | | 6,456,417 | |
| | | | | | | | | |
| Brazil (0.21%) | | | | | | | | |
BR Malls Participacoes SA(a) | | | 53,110 | | | | 169,598 | |
| | | | | | | | | |
| Canada (1.20%) | | | | | | | | |
| Allied Properties Real Estate Investment Trust | | | 7,952 | | | | 200,620 | |
| Boardwalk Real Estate Investment Trust | | | 3,765 | | | | 125,005 | |
| RioCan Real Estate Investment Trust | | | 32,197 | | | | 641,879 | |
| Total Canada | | | | | | | 967,504 | |
| | | | | | | | | |
| France (4.30%) | | | | | | | | |
| Gecina SA | | | 4,052 | | | | 532,090 | |
| Klepierre | | | 20,574 | | | | 767,221 | |
| Unibail-Rodamco SE | | | 9,810 | | | | 2,165,202 | |
| Total France | | | | | | | 3,464,513 | |
| | | | | | | | | |
| Germany (4.08%) | | | | | | | | |
| alstria office REIT-AG | | | 9,996 | | | | 122,258 | |
| Deutsche EuroShop AG | | | 4,453 | | | | 173,442 | |
| Deutsche Wohnen AG | | | 33,425 | | | | 1,029,464 | |
| LEG Immobilien AG | | | 6,220 | | | | 471,347 | |
| Vonovia SE | | | 46,350 | | | | 1,494,844 | |
| Total Germany | | | | | | | 3,291,355 | |
| | | | | | | | | |
| Hong Kong (10.98%) | | | | | | | | |
| Cheung Kong Property Holdings, Ltd. | | | 275,000 | | | | 1,882,615 | |
| China Overseas Land & Investment, Ltd. | | | 429,000 | | | | 1,238,909 | |
| Hang Lung Properties, Ltd. | | | 208,000 | | | | 468,748 | |
| Hongkong Land Holdings, Ltd. | | | 116,600 | | | | 747,406 | |
| Link REIT | | | 223,164 | | | | 1,536,383 | |
| Sun Hung Kai Properties, Ltd. | | | 158,000 | | | | 2,067,556 | |
| The Wharf Holdings, Ltd. | | | 121,700 | | | | 902,179 | |
| Total Hong Kong | | | | | | | 8,843,796 | |
| | | | | | | | | |
| Japan (11.04%) | | | | | | | | |
| Japan Real Estate Investment Corp. | | | 123 | | | | 665,504 | |
| Japan Retail Fund Investment Corp. | | | 248 | | | | 503,349 | |
| Mitsubishi Estate Co., Ltd. | | | 136,000 | | | | 2,740,684 | |
| Mitsui Fudosan Co., Ltd. | | | 97,000 | | | | 2,281,181 | |
| Nippon Building Fund, Inc. | | | 137 | | | | 762,807 | |
| Nomura Real Estate Master Fund, Inc. | | | 410 | | | | 611,031 | |
Cohen & Steers Global Realty Majors ETF
| Schedule of Investments | November 30, 2016 |
| Security Description | | Shares | | | Value | |
| Japan (11.04%) (continued) | | | | | | |
| Sumitomo Realty & Development Co., Ltd. | | | 48,000 | | | $ | 1,325,397 | |
| Total Japan | | | | | | | 8,889,953 | |
| | | | | | | | | |
| Singapore (2.04%) | | | | | | | | |
| Ascendas Real Estate Investment Trust | | | 229,805 | | | | 376,769 | |
| CapitaLand Mall Trust | | | 266,047 | | | | 361,943 | |
| CapitaLand, Ltd. | | | 251,200 | | | | 539,782 | |
| City Developments, Ltd. | | | 61,500 | | | | 362,131 | |
| Total Singapore | | | | | | | 1,640,625 | |
| | | | | | | | | |
| Spain (0.59%) | | | | | | | | |
| Merlin Properties Socimi SA | | | 46,903 | | | | 472,743 | |
| | | | | | | | | |
| Sweden (0.44%) | | | | | | | | |
| Castellum AB | | | 27,032 | | | | 356,409 | |
| | | | | | | | | |
| Switzerland (0.42%) | | | | | | | | |
| PSP Swiss Property AG | | | 3,969 | | | | 341,973 | |
| | | | | | | | | |
| United Kingdom (4.12%) | | | | | | | | |
| The British Land Co. PLC | | | 101,396 | | | | 750,416 | |
| Derwent London PLC | | | 10,979 | | | | 331,060 | |
| Hammerson PLC | | | 78,671 | | | | 535,968 | |
| Intu Properties PLC | | | 90,278 | | | | 303,964 | |
| Land Securities Group PLC | | | 79,408 | | | | 963,746 | |
| Segro PLC | | | 82,554 | | | | 431,759 | |
| Total United Kingdom | | | | | | | 3,316,913 | |
| | | | | | | | | |
| United States (52.12%) | | | | | | | | |
| Alexandria Real Estate Equities, Inc. | | | 7,726 | | | | 846,692 | |
| American Campus Communities, Inc. | | | 12,936 | | | | 609,415 | |
| AvalonBay Communities, Inc. | | | 13,595 | | | | 2,236,242 | |
| Boston Properties, Inc. | | | 15,232 | | | | 1,886,940 | |
| Digital Realty Trust, Inc. | | | 15,788 | | | | 1,457,706 | |
| Douglas Emmett, Inc. | | | 14,175 | | | | 520,081 | |
| Equinix, Inc. | | | 7,046 | | | | 2,386,903 | |
| Equity Residential | | | 36,224 | | | | 2,173,802 | |
| Essex Property Trust, Inc. | | | 6,496 | | | | 1,402,616 | |
| Extra Space Storage, Inc. | | | 12,540 | | | | 879,807 | |
| Federal Realty Investment Trust | | | 7,027 | | | | 986,731 | |
| General Growth Properties, Inc. | | | 57,853 | | | | 1,465,995 | |
| HCP, Inc. | | | 46,302 | | | | 1,367,298 | |
| Highwoods Properties, Inc. | | | 9,672 | | | | 464,836 | |
| Host Hotels & Resorts, Inc. | | | 73,541 | | | | 1,311,972 | |
| Kilroy Realty Corp. | | | 9,121 | | | | 659,813 | |
| Kimco Realty Corp. | | | 41,628 | | | | 1,063,179 | |
| The Macerich Co. | | | 11,933 | | | | 810,131 | |
| ProLogis, Inc. | | | 52,235 | | | | 2,658,762 | |
| Public Storage | | | 14,755 | | | | 3,088,222 | |
| Realty Income Corp. | | | 25,621 | | | | 1,420,428 | |
| Regency Centers Corp. | | | 10,285 | | | | 687,449 | |
| Simon Property Group, Inc. | | | 18,048 | | | | 3,242,323 | |
| SL Green Realty Corp. | | | 9,937 | | | | 1,046,962 | |
| UDR, Inc. | | | 26,466 | | | | 900,903 | |
Cohen & Steers Global Realty Majors ETF
| Schedule of Investments | November 30, 2016 |
| Security Description | | Shares | | | Value | |
| United States (52.12%) (continued) | | | | | | |
| Ventas, Inc. | | | 34,783 | | | $ | 2,101,589 | |
| Vornado Realty Trust | | | 17,025 | | | | 1,664,194 | |
| Weingarten Realty Investors | | | 11,652 | | | | 413,763 | |
| Welltower, Inc. | | | 35,467 | | | | 2,226,618 | |
| Total United States | | | | | | | 41,981,372 | |
| | | | | | | | | |
TOTAL COMMON STOCKS (Cost $73,962,009) | | | | | | | 80,193,171 | |
| | | 7 Day Yield | | | Shares | | | Value | |
| | | | | | | | | | |
| SHORT TERM INVESTMENTS (0.30%) | | | | | | | | | |
| Stare Street Institutional Treasury Plus Money Market Fund | | | 0.259 | % | | | 240,347 | | | | 240,347 | |
| | | | | | | | | | | | | |
TOTAL SHORT TERM INVESTMENTS (Cost $240,347) | | | | | | | | | | | 240,347 | |
| | | | | | | | | | | | | |
TOTAL INVESTMENTS (99.85%) (Cost $74,202,356) | | | | | | | | | | $ | 80,433,518 | |
| | | | | | | | | | | | | |
| NET OTHER ASSETS AND LIABILITIES (0.15%) | | | | | | | | | | | 116,840 | |
| | | | | | | | | | | | | |
| NET ASSETS (100.00%) | | | | | | | | | | $ | 80,550,358 | |
(a) | Non-income producing security. |
See Notes to Financial Statements.
Cohen & Steers Global Realty Majors ETF
| Statement of Assets and Liabilities | November 30, 2016 |
| ASSETS: | | | |
| Investments, at value | | $ | 80,433,518 | |
| Foreign currency, at value (Cost 8,442) | | | 8,392 | |
| Foreign tax reclaims | | | 39,938 | |
| Dividends receivable | | | 106,971 | |
| Total Assets | | | 80,588,819 | |
| | | | | |
| LIABILITIES: | | | | |
| Payable to adviser | | | 38,461 | |
| Total Liabilities | | | 38,461 | |
| NET ASSETS | | $ | 80,550,358 | |
| | | | | |
| NET ASSETS CONSIST OF: | | | | |
| Paid-in capital | | $ | 80,633,493 | |
| Accumulated net investment loss | | | (936,753 | ) |
| Accumulated net realized loss | | | (5,369,430 | ) |
| Net unrealized appreciation | | | 6,223,048 | |
| NET ASSETS | | $ | 80,550,358 | |
| | | | | |
| INVESTMENTS, AT COST | | $ | 74,202,356 | |
| | | | | |
| PRICING OF SHARES | | | | |
| Net Assets | | $ | 80,550,358 | |
| Shares of beneficial interest outstanding (Unlimited number of shares authorized, par value $0.01 per share) | | | 1,950,000 | |
| Net Asset Value, offering and redemption price per share | | $ | 41.31 | |
See Notes to Financial Statements.
Cohen & Steers Global Realty Majors ETF
| Statement of Operations | For the Year Ended November 30, 2016 |
| INVESTMENT INCOME: | | | |
Dividends(a) | | $ | 3,252,317 | |
| Total Investment Income | | | 3,252,317 | |
| | | | | |
| EXPENSES: | | | | |
| Investment adviser fees | | | 525,272 | |
| Total Expenses | | | 525,272 | |
| NET INVESTMENT INCOME | | | 2,727,045 | |
| | | | | |
| REALIZED AND UNREALIZED GAIN/(LOSS) | | | | |
| Net realized gain on investments | | | 4,087,617 | |
| Net realized loss on foreign currency transactions | | | (12,681 | ) |
| Total net realized gain | | | 4,074,936 | |
| Net change in unrealized depreciation on investments | | | (5,585,631 | ) |
| Net change in unrealized depreciation on translation of assets and liabilities denominated in foreign currencies | | | (3,936 | ) |
| Total net change in unrealized depreciation | | | (5,589,567 | ) |
NET REALIZED AND UNREALIZED LOSS ON INVESTMENTS | | | (1,514,631 | ) |
| NET INCREASE IN NET ASSETS RESULTING FROM OPERATIONS | | $ | 1,212,414 | |
(a) | Net of foreign tax withholding of $121,451. |
See Notes to Financial Statements.
Cohen & Steers Global Realty Majors ETF
Statements of Changes in Net Assets
| | | For the Year Ended November 30, 2016 | | | For the Year Ended November 30, 2015(a) | |
| OPERATIONS: | | | | | | |
| Net investment income | | $ | 2,727,045 | | | $ | 3,255,648 | |
Net realized gain/(loss)(a) | | | 4,074,936 | | | | (716,962 | ) |
Net change in unrealized depreciation(a) | | | (5,589,567 | ) | | | (3,396,040 | ) |
| Net increase/(decrease) in net assets resulting from operations | | | 1,212,414 | | | | (857,354 | ) |
| | | | | | | | | |
| DISTRIBUTIONS TO SHAREHOLDERS: | | | | | | | | |
| From net investment income | | | (2,806,590 | ) | | | (3,785,555 | ) |
| Total distributions | | | (2,806,590 | ) | | | (3,785,555 | ) |
| | | | | | | | | |
| CAPITAL SHARE TRANSACTIONS: | | | | | | | | |
| Proceeds from sale of shares | | | – | | | | 9,186,084 | |
| Cost of shares redeemed | | | (17,153,596 | ) | | | (2,197,905 | ) |
| Net increase/(decrease) from share transactions | | | (17,153,596 | ) | | | 6,988,179 | |
| Net increase/(decrease) in net assets | | | (18,747,772 | ) | | | 2,345,270 | |
| | | | | | | | | |
| NET ASSETS: | | | | | | | | |
| Beginning of year | | | 99,298,130 | | | | 96,952,860 | |
| End of year * | | $ | 80,550,358 | | | $ | 99,298,130 | |
| | | | | | | | | |
| *Including accumulated net investment loss of: | | $ | (936,753 | ) | | $ | (1,907,379 | ) |
| | | | | | | | | |
| OTHER INFORMATION: | | | | | | | | |
| CAPITAL SHARE TRANSACTIONS: | | | | | | | | |
| Beginning shares | | | 2,350,000 | | | | 2,200,000 | |
| Shares sold | | | – | | | | 200,000 | |
| Shares redeemed | | | (400,000 | ) | | | (50,000 | ) |
| Shares outstanding, end of year | | | 1,950,000 | | | | 2,350,000 | |
(a) | Prior to November 30, 2016, the Fund presented realized gain/loss and unrealized appreciation/depreciation by investment type. This change in presentation was made to conform to industry standards and had no effect on the Fund's change in net assets. |
See Notes to Financial Statements.
Cohen & Steers Global Realty Majors ETF
| Financial Highlights | For a Share Outstanding Throughout the Periods Presented |
| | | For the Year Ended November 30, 2016 | | | For the Year Ended November 30, 2015 | | | For the Year Ended November 30, 2014 | | | For the Year Ended November 30, 2013 | | | For the Year Ended November 30, 2012 | |
| NET ASSET VALUE, BEGINNING OF PERIOD | | $ | 42.25 | | | $ | 44.07 | | | $ | 39.32 | | | $ | 39.59 | | | $ | 32.53 | |
| | | | | | | | | | | | | | | | | | | | | |
| INCOME/(LOSS) FROM INVESTMENT OPERATIONS: | | | | | | | | | | | | | |
Net investment income(a) | | | 1.24 | | | | 1.41 | | | | 0.92 | | | | 0.94 | | | | 0.91 | |
| Net realized and unrealized gain/(loss) | | | (0.90 | ) | | | (1.57 | ) | | | 4.85 | | | | 1.25 | | | | 6.97 | |
| Total from investment operations | | | 0.34 | | | | (0.16 | ) | | | 5.77 | | | | 2.19 | | | | 7.88 | |
| | | | | | | | | | | | | | | | | | | | | |
| DISTRIBUTIONS: | | | | | | | | | | | | | | | | | | | | |
| From net investment income | | | (1.28 | ) | | | (1.66 | ) | | | (1.02 | ) | | | (2.27 | ) | | | (0.82 | ) |
| From tax return of capital | | | – | | | | – | | | | – | | | | (0.19 | ) | | | – | |
| Total distributions | | | (1.28 | ) | | | (1.66 | ) | | | (1.02 | ) | | | (2.46 | ) | | | (0.82 | ) |
| | | | | | | | | | | | | | | | | | | | | |
| NET INCREASE/(DECREASE) IN NET ASSET VALUE | | | (0.94 | ) | | | (1.82 | ) | | | 4.75 | | | | (0.27 | ) | | | 7.06 | |
| NET ASSET VALUE, END OF PERIOD | | $ | 41.31 | | | $ | 42.25 | | | $ | 44.07 | | | $ | 39.32 | | | $ | 39.59 | |
TOTAL RETURN(b) | | | 0.61 | % | | | (0.38 | )% | | | 14.90 | % | | | 5.60 | % | | | 24.50 | % |
| | | | | | | | | | | | | | | | | | | | | |
| RATIOS/SUPPLEMENTAL DATA: | | | | | | | | | | | | | | | | | | | | |
| Net assets, end of period (000s) | | $ | 80,550 | | | $ | 99,298 | | | $ | 96,953 | | | $ | 108,137 | | | $ | 71,258 | |
| | | | | | | | | | | | | | | | | | | | | |
| Ratio of expenses to average net assets | | | 0.55 | % | | | 0.55 | % | | | 0.55 | % | | | 0.55 | % | | | 0.55 | % |
| Ratio of net investment income to average net assets | | | 2.86 | % | | | 3.24 | % | | | 2.21 | % | | | 2.31 | % | | | 2.47 | % |
Portfolio turnover rate(c) | | | 8 | % | | | 7 | % | | | 11 | % | | | 10 | % | | | 4 | % |
(a) | Based on average shares outstanding during the period. |
(b) | Total return is calculated assuming an initial investment made at the net asset value at the beginning of the period and redemption at the net asset value on the last day of the period and assuming all distributions are reinvested at reinvestment prices. |
(c) | Portfolio turnover does not include securities received or delivered from processing creations or redemptions in-kind. |
See Notes to Financial Statements.
| Cohen & Steers Global Realty Majors ETF | |
| Notes to Financial Statements | November 30, 2016 |
1. ORGANIZATION
ALPS ETF Trust (the “Trust”), a Delaware statutory trust, is an open‐end management investment company registered under the Investment Company Act of 1940, as amended (the “1940 Act”). As of November 30, 2016, the Trust consisted of nineteen separate portfolios. Each portfolio represents a separate series of the Trust. This report pertains solely to the Cohen & Steers Global Realty Majors ETF (the “Fund”). The investment objective of the Fund is to seek investment results that correspond generally to the performance, before the Fund’s fees and expenses, of an index called the Cohen & Steers Global Realty Majors Index (the “Underlying Index”). The investment advisor uses a “passive” or indexing approach to try to achieve the Fund’s investment objective. The Fund is considered non‐diversified and may invest a greater portion of assets in securities of individual issuers than a diversified fund. As a result, changes in the market value of a single investment could cause greater fluctuations in share price than would occur in a diversified fund.
The Fund’s Shares (“Shares”) are listed on the New York Stock Exchange (“NYSE”) Arca. The Fund issues and redeems Shares at net asset value (“NAV”) in blocks of 50,000 Shares, each of which is called a “Creation Unit”. Creation Units are issued and redeemed principally in‐kind for securities included in the Underlying Index. Except when aggregated in Creation Units, Shares are not redeemable securities of the Fund.
Pursuant to the Trust’s organizational documents, its Officers and Trustees are indemnified against certain liability arising out of the performance of their duties to the Trust. Additionally, in the normal course of business, the Trust enters into contracts with service providers that contain general indemnification clauses. The Trust’s maximum exposure under these arrangements is unknown, as this would involve future claims that may be made against the Trust that have not yet occurred.
2. SIGNIFICANT ACCOUNTING POLICIES
The following is a summary of significant accounting policies consistently followed by the Fund in the preparation of the financial statements. The accompanying financial statements were prepared in accordance with accounting principles generally accepted in the United States of America (“U.S. GAAP”). The preparation of financial statements in conformity with U.S. GAAP requires management to make certain estimates and assumptions that affect the reported amounts of assets and liabilities and disclosures of contingent assets and liabilities at the date of the financial statements and the reported amounts of revenue and expenses during the period. Actual results could differ from those estimates. The Fund is considered an investment company under U.S. GAAP and follows the accounting and reporting guidance applicable to investment companies in the Financial Accounting Standards Board Accounting Standards Codification Topic 946.
A. Portfolio Valuation
The Fund’s NAV is determined daily, as of the close of regular trading on the NYSE, normally 4:00 p.m. Eastern time, on each day the NYSE is open for trading. The NAV is computed by dividing the value of all assets of the Fund (including accrued interest and dividends), less all liabilities (including accrued expenses and dividends declared but unpaid), by the total number of shares outstanding.
Portfolio securities listed on any exchange other than the NASDAQ Stock Market LLC (“NASDAQ”) are valued at the last sale price on the business day as of which such value is being determined. If there has been no sale on such day, the securities are valued at the mean of the most recent bid and asked prices on such day. Securities traded on the NASDAQ are valued at the NASDAQ Official Closing Price as determined by NASDAQ. Portfolio securities traded on more than one securities exchange are valued at the last sale price on the business day as of which such value is being determined at the close of the exchange representing the principal market for such securities. Portfolio securities traded in the over‐the‐counter market, but excluding securities traded on the NASDAQ, are valued at the latest quoted sale price in such market.
The Fund’s investments are valued at market value or, in the absence of market value with respect to any portfolio securities, at fair value according to procedures adopted by the Trust’s Board of Trustees (the “Board”). When market quotations are not readily available or when events occur that make established valuation methods unreliable, securities of the Fund may be valued in good faith by or under the direction of the Board. These securities generally include, but are not limited to, restricted securities (securities which may not be publicly sold without registration under the Securities Act of 1933) for which a pricing service is unable to provide a market price; securities whose trading has been formally suspended; a security whose market price is not available from a pre‐established primary pricing source or the pricing source is not willing to provide a price; a security with respect to which an event has occurred that is most likely to materially affect the value of the security after the market has closed but before the calculation of the Fund’s NAV or make it difficult or impossible to obtain a reliable market quotation; or a security whose price, as provided by the pricing service, does not reflect the security’s “fair value” due to the security being de‐listed from a national exchange or the security’s primary trading market is temporarily closed at a time when, under normal conditions, it would be open. As a general principle, the current “fair value” of a security would be the amount which the owner might reasonably expect to receive from the sale on the applicable exchange or principal market. A variety of factors may be considered in determining the fair value of such securities.
| Cohen & Steers Global Realty Majors ETF | |
| Notes to Financial Statements | November 30, 2016 |
B. Fair Value Measurements
The Fund discloses the classification of its fair value measurements following a three‐tier hierarchy based on the inputs used to measure fair value. Inputs refer broadly to the assumptions that market participants would use in pricing the asset or liability, including assumptions about risk. Inputs may be observable or unobservable. Observable inputs reflect the assumptions market participants would use in pricing the asset or liability that are developed based on market data obtained from sources independent of the reporting entity. Unobservable inputs reflect the reporting entity’s own assumptions about the assumptions market participants would use in pricing the asset or liability that are developed based on the best information available.
Valuation techniques used to value the Fund’s investments by major category are as follows:
Equity securities, including restricted securities, for which market quotations are readily available, are valued at the last reported sale price or official closing price as reported by a third party pricing vendor on the primary market or exchange on which they are traded and are categorized as Level 1 in the hierarchy. In the event there were no sales during the day or closing prices are not available, securities are valued at the mean of the most recent quoted bid and ask prices on such day and are generally categorized as Level 2 in the hierarchy. Investments in open‐end mutual funds are valued at their NAV each business day and are categorized as Level 1 in the hierarchy.
Changes in valuation techniques may result in transfers in or out of an assigned level within the disclosure hierarchy.
Various inputs are used in determining the value of the Fund’s investments as of the end of the reporting period. When inputs used fall into different levels of the fair value hierarchy, the level in the hierarchy within which the fair value measurement falls is determined based on the lowest level input that is significant to the fair value measurement in its entirety. The designated input levels are not necessarily an indication of the risk or liquidity associated with these investments.
These inputs are categorized in the following hierarchy under applicable financial accounting standards:
Level 1 – | Unadjusted quoted prices in active markets for identical investments, unrestricted assets or liabilities that a Fund has the ability to access at the measurement date; |
| Level 2 – | Quoted prices which are not active, quoted prices for similar assets or liabilities in active markets or inputs other than quoted prices that are observable (either directly or indirectly) for substantially the full term of the asset or liability; and |
| Level 3 – | Significant unobservable prices or inputs (including the Fund’s own assumptions in determining the fair value of investments) where there is little or no market activity for the asset or liability at the measurement date. |
The following is a summary of the inputs used to value the Fund’s investments as of November 30, 2016:
| Investments in Securities at Value* | | Level 1- Unadjusted Quoted Prices | | | Level 2- Other Significant Observable Inputs | | | Level 3- Significant Unobservable Inputs | | | Total | |
| Common Stocks | | $ | 80,193,171 | | | $ | – | | | $ | – | | | $ | 80,193,171 | |
| Short Term Investments | | | 240,347 | | | | – | | | | – | | | | 240,347 | |
| TOTAL | | $ | 80,433,518 | | | $ | – | | | $ | – | | | $ | 80,433,518 | |
| * | For a detailed geographical breakdown, see the accompanying Schedule of Investments. |
The Fund recognizes transfers between levels as of the end of the period. For the year ended November 30, 2016, the Fund did not have any transfers between Level 1 and Level 2 securities. The Fund did not have any securities that used significant unobservable inputs (Level 3) in determining fair value.
C. Foreign Securities
The Fund may directly purchase securities of non‐U.S. issuers. Investing in securities of non‐U.S. issuers may involve unique risks compared to investing in securities of U.S. issuers, including, among others, less liquidity generally, greater market volatility than U.S. securities and less complete financial information than for U.S. issuers. In addition, adverse political, economic or social developments could undermine the value of the Fund’s investments or prevent the Fund from realizing the full value of its investments. Financial reporting standards for companies based in foreign markets differ from those in the United States. Finally, the value of the currency of the country in which the Fund has invested could decline relative to the value of the U.S. dollar, which may affect the value of the investment to U.S. investors.
| Cohen & Steers Global Realty Majors ETF | |
| Notes to Financial Statements | November 30, 2016 |
D. Foreign Currency Translation
The books and records of the Fund are maintained in U.S. dollars. Investment valuations and other assets and liabilities initially expressed in foreign currencies are converted each business day into U.S. dollars based upon current exchange rates. The portion of realized and unrealized gains or losses on investments due to fluctuations in foreign currency exchange rates is not separately disclosed and is included in realized and unrealized gains or losses on investments, when applicable.
E. Securities Transactions and Investment Income
Securities transactions are recorded as of the trade date. Realized gains and losses from securities transactions are recorded on the highest cost basis. Dividend income and capital gains distributions, if any, are recorded on the ex‐dividend date, net of any foreign taxes withheld. Interest income, if any, is recorded on the accrual basis.
F. Dividends and Distributions to Shareholders
Dividends from net investment income of the Fund, if any, are declared and paid quarterly or as the Board may determine from time to time. Distributions of net realized capital gains earned by the Fund, if any, are distributed at least annually.
G. Real Estate Investment Trusts (“REITs”)
As part of its investments in real estate related securities, the Fund will invest in REITs and is subject to certain risks associated with direct investment in REITs. REITs possess certain risks which differ from an investment in common stocks. REITs are financial vehicles that pool investors’ capital to acquire, develop and/or finance real estate and provide services to their tenants. REITs may concentrate their investments in specific geographic areas or in specific property types, e.g., regional malls, shopping centers, office buildings, apartment buildings and industrial warehouses. REITs may be affected by changes in the value of their underlying properties and by defaults by borrowers or tenants. REITs depend generally on their ability to generate cash flow to make distributions to shareowners, and certain REITs have self‐liquidation provisions by which mortgages held may be paid in full and distributions of capital returns may be made at any time.
As REITs generally pay a higher rate of dividends than most other operating companies, to the extent application of the Fund’s investment strategy results in the Fund investing in REIT shares, the percentage of the Fund’s dividend income received from REIT shares will likely exceed the percentage of the Fund’s portfolio that is comprised of REIT shares. Distributions received by the Fund from REITs may consist of dividends, capital gains and/or return of capital.
Dividend income from REITs is recognized on the ex‐dividend date. The calendar year‐end amounts of ordinary income, capital gains, and return of capital included in distributions received from the Fund’s investments in REITs are reported to the Fund after the end of the calendar year; accordingly, the Fund estimates these amounts for accounting purposes until the characterization of REIT distributions is reported to the Fund after the end of the calendar year. Estimates are based on the most recent REIT distribution information available.
The performance of a REIT may be affected by its failure to qualify for tax‐free pass‐through of income under the Internal Revenue Code of 1986, as amended (the “Code”), or its failure to maintain exemption from registration under the 1940 Act. Due to the Fund’s investments in REITs, the Fund may also make distributions in excess of the Fund’s earnings and capital gains. Distributions, if any, in excess of the Fund’s earnings and profits will first reduce the adjusted tax basis of a holder’s Common Shares and, after that basis has been reduced to zero, will constitute capital gains to the Common Shareholder.
H. Federal Tax and Tax Basis Information
The timing and character of income and capital gain distributions are determined in accordance with income tax regulations, which may differ from U.S. GAAP. Reclassifications are made to the Fund’s capital accounts for permanent tax differences to reflect income and gains available for distribution (or available capital loss carryforwards) under income tax regulations.
For the year ended November 30, 2016, the following reclassifications, which had no impact on results of operations or net assets, were recorded to reflect permanent tax differences resulting primarily from in‐kind transactions:
| Fund | | Paid-in Capital | | Accumulated Net Investment Gain/(Loss) | | Accumulated Net Realized Gain (Loss) on Investments | |
| Cohen & Steers Global Realty Majors ETF | | $ | 3,419,374 | | | $ | 1,050,171 | | | $ | (4,469,545 | ) |
| Cohen & Steers Global Realty Majors ETF | |
| Notes to Financial Statements | November 30, 2016 |
The tax character of the distributions paid during the fiscal years ended November 30, 2016 and November 30, 2015 were as follows:
| | | Ordinary Income | |
| November 30, 2016 | | | |
| Cohen & Steers Global Realty Majors ETF | | $ | 2,806,590 | |
| November 30, 2015 | | | | |
| Cohen & Steers Global Realty Majors ETF | | $ | 3,785,555 | |
Under the Regulated Investment Company Modernization Act of 2010 (“the Modernization Act”), net capital losses recognized in tax years beginning after December 22, 2010 may be carried forward indefinitely, and the character of the losses is retained as short‐term and/or long‐term. Under the law in effect prior to the Modernization Act, net capital losses were carried forward for eight years and treated as short‐term. As a transition rule, the Modernization Act requires that post‐enactment net capital losses be used before pre‐enactment net capital losses. Additionally, post‐enactment capital losses that are carried forward will retain their character as either short‐term or long‐term losses rather than being considered all short‐term as under previous law.
At November 30, 2016, the Fund had available for tax purposes unused pre‐enactment capital loss carryforwards as follows:
| Fund | | Expiring in 2017 | | | Expiring in 2018 | |
| Cohen & Steers Global Realty Majors ETF | | $ | 809,982 | | | $ | 187,815 | |
At November 30, 2016, the Fund had available for tax purposes unused post‐enactment capital loss carryforwards as follows:
| Fund | | Short-Term | | | Long-Term | |
| Cohen & Steers Global Realty Majors ETF | | $ | 1,204,033 | | | $ | 2,460,001 | |
As of November 30, 2016, the components of distributable earnings on a tax basis for the Fund were as follows:
| Undistributed net investment income | | $ | 487,785 | |
| Accumulated net realized loss on investments | | | (4,661,831 | ) |
Net unrealized appreciation on investments | | | 4,090,911 | |
| Total | | $ | (83,135 | ) |
As of November 30, 2016, the cost of investments for federal income tax purposes and accumulated net unrealized appreciation/(depreciation) on investments were as follows:
| Gross appreciation (excess of value over tax cost) | | $ | 8,851,524 | |
| Gross depreciation (excess of tax cost over value) | | | (4,752,499 | ) |
| Net depreciation on foreign currency transactions | | | (8,114 | ) |
| Net unrealized appreciation (depreciation) | | | 4,090,911 | |
| Cost of investments for income tax purposes | | $ | 76,334,493 | |
The differences between book‐basis and tax‐basis are primarily due to Passive Foreign Investment Company (“PFIC”) adjustments and the deferral of losses due to wash sales.
I. Income Taxes
No provision for income taxes is included in the accompanying financial statements, as the Fund intends to distribute to shareholders all taxable investment income and realized gains and otherwise comply with Subchapter M of the Internal Revenue Code of 1986, as amended, applicable to regulated investment companies. The Fund evaluates tax positions taken (or expected to be taken) in the course of preparing the Fund’s tax returns to determine whether these positions meet a “more‐likely‐than‐not” standard that, based on the technical merits, have a more than fifty percent likelihood of being sustained by a taxing authority upon examination. A tax position that meets the “more‐likely‐than‐not” recognition threshold is measured to determine the amount of benefit to recognize in the financial statements.
| Cohen & Steers Global Realty Majors ETF | |
| Notes to Financial Statements | November 30, 2016 |
As of and during the year ended November 30, 2016, the Fund did not have a liability for any unrecognized tax benefits. The Fund files U.S. federal, state, and local tax returns as required. The Fund’s tax returns are subject to examination by the relevant tax authorities until expiration of the applicable statute of limitations, which is generally three years after the filing of the tax return, but may extend to four years in certain jurisdictions. Tax returns for open years have incorporated no uncertain tax positions that require a provision for income taxes.
3. INVESTMENT ADVISORY FEE AND OTHER AFFILIATED TRANSACTIONS
ALPS Advisors, Inc. (the “Adviser”) acts as the Fund’s investment adviser pursuant to an Advisory Agreement with the Trust on behalf of the Fund (the “Advisory Agreement”). Pursuant to the Advisory Agreement, the Fund pays the Adviser a unitary fee for the services and facilities it provides payable on a monthly basis at the annual rate of 0.55% of the Fund’s average daily net assets. From time to time, the Adviser may waive all or a portion of its fee.
Out of the unitary management fee, the Adviser pays substantially all expenses of the Fund, including the cost of transfer agency, custody, fund administration, legal, audit, independent trustees and other services, except for interest expenses, distribution fees or expenses, brokerage expenses, taxes and extraordinary expenses such as litigation and other expenses not incurred in the ordinary course of the Fund’s business. The Adviser’s unitary management fee is designed to pay substantially all the Fund's expenses and to compensate the Adviser for providing services for the Fund.
ALPS Fund Services, Inc., an affiliate of the Adviser, is the administrator of the Fund.
Each Trustee who is not an officer or employee of the Adviser, any sub‐adviser or any of their affiliates (“Independent Trustees”) receives (1) a quarterly retainer of $5,000, (2) a per meeting fee for regularly scheduled meetings of $3,750, (3) $1,500 for any special meeting held outside of a regularly scheduled board meeting, and (4) reimbursement for all reasonable out‐of‐pocket expenses relating to attendance at meetings.
4. PURCHASES AND SALES OF SECURITIES
For the year ended November 30, 2016, the cost of purchases and proceeds from sales of investment securities, excluding in‐kind transactions and short‐term investments, were as follows:
| | Purchases | | | | Sales | |
| | $ | 8,048,440 | | | | $ | 7,576,482 | |
For the year ended November 30, 2016, the cost of in‐kind purchases and proceeds from in‐kind sales were as follows:
| | Purchases | | | | Sales | |
| | $ | – | | | | $ | 17,187,614 | |
For the year ended November 30, 2016, the Cohen and Steers Global Realty Majors ETF had in‐kind net realized gain of $4,486,058.
Gains on in‐kind transactions are not considered taxable for federal income tax purposes.
5. CAPITAL SHARE TRANSACTIONS
Shares are created and redeemed by the Fund only in Creation Unit size aggregations of 50,000 Shares. Only broker‐dealers or large institutional investors with creation and redemption agreements called Authorized Participants (“AP”) are permitted to purchase or redeem Creation Units from the Fund. Such transactions are generally permitted on an in‐kind basis, with a balancing cash component to equate the transaction to the NAV per unit of the Fund on the transaction date. Cash may be substituted equivalent to the value of certain securities generally when they are not available in sufficient quantity for delivery, not eligible for trading by the AP or as a result of other market circumstances.
| Cohen & Steers Global Realty Majors ETF | |
| Additional Information | November 30, 2016 (Unaudited) |
PROXY VOTING POLICIES AND PROCEDURES
Information regarding how the Fund voted proxies relating to portfolio securities during the most recent 12‐month period ended June 30 and a description of the Fund’s proxy voting policies and procedures used in determining how to vote for proxies are available without charge on the Securities and Exchange Commission’s (“SEC”) website at www.sec.gov and upon request, by calling (toll‐free) 1‐866‐675‐2639.
PORTFOLIO HOLDINGS
The Trust is required to disclose, after its first and third fiscal quarters, the complete schedule of the Fund’s portfolio holdings with the SEC on Form N‐Q. Forms N‐Q for the Fund are available on the SEC’s website at www.sec.gov. The Fund’s Forms N‐Q may also be reviewed and copied at the SEC’s Public Reference Room in Washington, D.C. and information on the operation of the Public Reference Room may be obtained by calling 1‐800‐SEC‐0330. The Fund’s Forms N‐Q are available without charge, upon request, by calling (toll‐free) 1‐866‐675‐2639 or by writing to ALPS ETF Trust at 1290 Broadway, Suite 1100, Denver, Colorado 80203.
TAX INFORMATION
The Fund designated the following for federal income tax purposes for distributions made during the calendar year ended December 31, 2015:
| | Qualified Dividend Income | Dividend Received Deduction |
| Cohen and Steers Global Realty Majors ETF | 13.63% | 0.00% |
In early 2016, if applicable, shareholders of record received this information for the distribution paid to them by the Fund during the calendar year 2015 via Form 1099. The Fund will notify shareholders in early 2017 of amounts paid to them by the Fund, if any, during the calendar year 2016.
LICENSING AGREEMENT
Cohen & Steers is the Index Provider for the Cohen & Steers Global Realty Majors ETF. Cohen & Steers is not affiliated with the Trust, the Adviser or the Distributor. ALPS, an affiliate of the Adviser, and the Trust have entered into a license agreement with Cohen & Steers to use the Index.
THE FUND IS NOT SPONSORED, MANAGED OR ADVISED BY COHEN & STEERS CAPTIAL MANAGEMENT, INC. (“C&S”). C&S MAKES NO REPRESENTATION OR WARRANTY, EXPRESS OR IMPLIED, TO THE SHAREHOLDERS OF THE FUND OR ANY MEMBER OF THE PUBLIC REGARDING THE ADVISABILITY OF INVESTING IN SECURITIES GENERALLY OR IN THE FUND PARTICULARLY OR THE ABILITY OF THE COHEN & STEERS GLOBAL REALTY MAJORS INDEX TO TRACK PERFORMANCE OF A MARKET OR SECTOR. C&S’S ONLY RELATIONSHIP TO ALPS IS IN RELATION TO THE LICENSING OF CERTAIN TRADEMARKS AND TRADE NAMES OF C&S AND OF ONE OR MORE C&S INDEXES, INCLUDING THE COHEN & STEERS GLOBAL REALTY MAJORS INDEX WHICH IS DETERMINED, COMPOSED AND CALCULATED BY C&S WITHOUT REGARD TO ALPS OR THE FUND. C&S HAS NO OBLIGATION TO TAKE THE NEEDS OF ALPS, THE FUND OR THE FUND SHAREHOLDERS INTO CONSIDERATION IN DETERMINING, COMPOSING OR CALCULATING THE COHEN & STEERS GLOBAL REALTY MAJORS INDEX. C&S IS NOT RESPONSIBLE FOR AND HAS NOT PARTICIPATED IN THE TIMING OF THE ISSUANCE OR SALE OF FUND SHARES OR IN THE DETERMINATION OR CALCULATION OF THE VALUATION OF THE FUND’S ASSETS. C&S HAS NO OBLIGATION OR LIABILITY IN CONNECTION WITH THE ADMINISTRATION, MARKETING OR PORTFOLIO MANAGEMENT OF THE FUND. C&S DOES NOT GUARANTEE THE ACCURACY AND/OR THE COMPLETENESS OF THE COHEN & STEERS GLOBAL REALTY MAJORS INDEX OR ANY DATA INCLUDED THEREIN AND C&S SHALL HAVE NO LIABILITY FOR ANY ERRORS, OMISSIONS, OR INTERRUPTIONS THEREIN. C&S MAKES NO WARRANTY, EXPRESS OR IMPLIED, AS TO RESULTS TO BE OBTAINED BY ALPS, THE FUND, FUND SHAREHOLDERS, OR ANY OTHER PERSON OR ENTITY FROM THE USE OF THE COHEN & STEERS GLOBAL REALTY MAJORS INDEX OR ANY DATA INCLUDED THEREIN. C&S MAKES NO EXPRESS OR IMPLIED WARRANTIES, AND EXPRESSLY DISCLAIMS ALL WARRANTIES OF MERCHANTABILITY OR FITNESS FOR A PARTICULAR PURPOSE OF USE WITH RESPECT TO THE COHEN & STEERS GLOBAL REALTY MAJORS INDEX OR ANY DATA INCLUDED THEREIN. WITHOUT LIMITING ANY OF THE FOREGOING, IN NO EVENT SHALL C&S HAVE ANY LIABILITY FOR ANY SPECIAL, PUNITIVE, INDIRECT OR CONSEQUENTIAL DAMAGES (INCLUDING LOST PROFITS) RESULTING FROM THE USE OF THE COHEN & STEERS GLOBAL REALTY MAJORS INDEX OR ANY DATA INCLUDED THEREIN, EVEN IF NOTIFIED OF THE POSSIBILITY OF SUCH DAMAGES.
The Advisor does not guarantee the accuracy and/or the completeness of the Index or any data included therein, and the Advisor shall have no liability for any errors, omissions or interruptions therein. The Advisor makes no warranty, express or implied, as to results to be obtained by the Fund, owners of the Shares of the Fund or any other person or entity from the use of the Index or any data included therein. The Advisor makes no express or implied warranties, and expressly disclaims all warranties of merchantability or fitness for a particular purpose or use with respect to the Index or any data included therein. Without limiting any of the foregoing, in no event shall the Advisor have any liability for any special, punitive, direct, indirect or consequential damages (including lost profits) arising out of matters relating to the use of the Index even if notified of the possibility of such damages.
| Cohen & Steers Global Realty Majors ETF | |
Board Considerations Regarding Approval
of Investment Advisory Agreement | November 30, 2016 (Unaudited) |
At an in‐person meeting held on June 6, 2016, the Board of Trustees of the Trust (the “Board” or the “Trustees”), including the Trustees who are not “interested persons” of the Trust within the meaning of the 1940 Act, as amended (the “Independent Trustees”), evaluated a proposal to approve the continuance of the Advisory Agreement between the Trust and ALPS Advisors, Inc. (the “Adviser”) with respect to the Cohen & Steers Global Realty Majors ETF (“GRI” or “the Fund”). The Independent Trustees also met separately to consider the Advisory Agreement.
In evaluating the Investment Advisory Agreements with respect to GRI, the Trustees considered various factors, including (i) the nature, extent and quality of the services provided by AAI with respect to the Fund under the Investment Advisory Agreement; (ii) the advisory fees and other expenses paid by the Fund compared to those of similar funds managed by other investment advisers; (iii) the costs of the services provided to the Fund by AAI and the profits realized by AAI and its affiliates from its relationship to the Fund; (iv) the extent to which economies of scale have been or would be realized if and as the assets of the Fund grow and whether fees reflect the economies of scale for the benefit of shareholders; and (v) any additional benefits and other considerations.
With respect to the nature, extent and quality of the services provided by AAI under the Investment Advisory Agreement, the Trustees considered and reviewed information concerning the services provided under the Investment Advisory Agreement, the investment parameters of the index of the Fund, financial information regarding AAI and its parent company, information describing AAI’s current organization and the background and experience of the persons responsible for the day‐to‐day management of the Fund.
The Trustees reviewed information on the performance of the Fund and its benchmark. The Trustees also evaluated the correlation and tracking error between the underlying index and the Fund’s performance. Based on their review, the Trustees found that the nature and extent of services provided to the Fund under the Investment Advisory Agreement was appropriate and that the quality was satisfactory.
The Trustees noted that the advisory fee for the Fund was a unitary fee pursuant to which AAI assumes all expenses of the Fund (including the cost of transfer agency, custody, fund administration, legal, audit and other services) other than the payments under the Advisory Agreement, brokerage expenses, taxes, interest, litigation expenses and other extraordinary expenses.
With respect to advisory fee rates, the Trustees noted the following: The net advisory fee rate for the Fund is higher than the median of its Broadridge expense group. GRI’s net advisory fee rate was slightly above the medians of its Broadridge expense group. The Fund’s expense ratio is at the median of its Broadridge expense group.
Based on the foregoing, and the other information available to them, the Trustees concluded that the advisory fee rate for the Fund was reasonable under the circumstances and in light of the quality of the services provided.
The Trustees considered other benefits available to AAI because of its relationship with the Fund and concluded that the advisory fees were reasonable taking into account any such benefits.
The Trustees also considered with respect to the Fund the information provided by AAI about the costs and profitability of AAI with respect to the Fund. The Trustees reviewed and noted the relatively small sizes of the Fund and concluded that AAI was not realizing any economies of scale. The Trustees determined that they would continue to evaluate whether further economies of scale have been achieved on an ongoing basis.
In voting to renew the Investment Advisory Agreement, the Trustees concluded that the terms of the Investment Advisory Agreement are reasonable and fair in light of the services to be performed, the fees paid by certain other funds, expenses to be incurred and such other matters as the Trustees considered relevant in the exercise of their reasonable business judgment. The Trustees did not identify any single factor or group of factors as all important or controlling and considered all factors together.
| Cohen & Steers Global Realty Majors ETF | |
| Trustees & Officers | November 30, 2016 (Unaudited) |
The general supervision of the duties performed by the Adviser for the Fund under the Investment Advisory Agreement is the responsibility of the Board of Trustees. The Trust currently has four Trustees. Three Trustees have no affiliation or business connection with the Adviser or any of its affiliated persons and do not own any stock or other securities issued by the Adviser. These are the “non‐interested” or “independent” Trustees (“Independent Trustees”). The other Trustee (the “Interested Trustee”) is affiliated with the Adviser.
The Independent Trustees of the Trust, their term of office and length of time served, their principal business occupations during the past five years, the number of portfolios in the Fund Complex overseen by each Independent Trustee, and other directorships, if any, held by the Trustee are shown below.
INDEPENDENT TRUSTEES
Name, Address & Year of Birth* | Position(s) Held with Trust | Term of Office and Length of Time Served** | Principal Occupation(s) During Past 5 Years | Number of Portfolios in Fund Complex Overseen by Trustees*** | Other Directorships Held by Trustees |
Mary K. Anstine, 1940 | Trustee | Since March 2008 | Ms. Anstine was President/Chief Executive Officer of HealthONE Alliance, Denver, Colorado, and former Executive Vice President of First Interstate Bank of Denver. Ms. Anstine is also Trustee/ Director of AV Hunter Trust and Colorado Uplift Board. Ms. Anstine was formerly a Director of the Trust Bank of Colorado (later purchased and now known as Northern Trust Bank), HealthONE and Denver Area Council of the Boy Scouts of America and a member of the American Bankers Association Trust Executive Committee. | 44 | Ms. Anstine is a Trustee of ALPS Variable Investment Trust (10 funds); Financial Investors Trust (31 funds); Reaves Utility Income Fund (1 fund); and Westcore Trust (14 funds). |
Jeremy W. Deems, 1976 | Trustee | Since March 2008 | Mr. Deems is the Co‐Founder, Chief Compliance Officer and Chief Financial Officer of Green Alpha Advisors, LLC. Mr. Deems is Co‐Portfolio Manager of the Shelton Green Alpha Fund. Prior to joining Green Alpha Advisors, Mr. Deems was CFO and Treasurer of Forward Management, LLC, ReFlow Management Co., LLC, ReFlow Fund, LLC, a private investment fund, and Sutton Place Management, LLC, an administrative services company. | 46 | Mr. Deems is a Trustee of ALPS Variable Investment Trust (10 funds); Financial Investors Trust (31 funds); and Reaves Utility Income Fund (1 fund); Clough Funds Trust(1 fund) and Elevation ETF Trust (2 fund). |
Rick A. Pederson, 1952 | Trustee | Since March 2008 | Mr. Pederson is President, Foundation Properties, Inc. (a real estate investment management company), 1994 ‐ present; Advisory Board Member, Bow River Capital Partners (private equity management), 2003 ‐ present; Advisor, The Pauls Corporation (real estate investment management and development), 2008 ‐ present; Chairman, Ross Consulting Group (real estate consulting services) 1983 ‐ 2013; Advisory Board Member, Neenan Company (construction services) 2002 ‐ present; Board Member, Prosci Inc. (private business services) 2013 ‐ 2016; Board Member, Citywide Banks (Colorado community bank) 2014 ‐ present; Board Member, Strong‐Bridge Consulting (management consulting) 2015 ‐ present; Director, National Western Stock Show (not‐for‐profit organization); Director, Biennial of the Americas (not‐for‐profit‐organization), 2012 ‐ 2015; Board Member, History Colorado, 2015 ‐ present. | 22 | Mr. Pederson is Trustee of Westcore Trust (14 funds) and Principal Real Estate Income Fund (1 fund). |
| * | The business address of the Trustee is c/o ALPS Advisors, Inc., 1290 Broadway, Suite 1100, Denver, Colorado 80203. |
| ** | This is the period for which the Trustee began serving the Trust. Each Trustee serves an indefinite term, until his successor is elected. |
| *** | The Fund Complex includes all series of the Trust and any other investment companies for which ALPS Advisors, Inc. provides investment advisory services. |
| Cohen & Steers Global Realty Majors ETF | |
| Trustees & Officers | November 30, 2016 (Unaudited) |
The Trustee who is affiliated with the Adviser or affiliates of the Adviser and executive officers of the Trust, his term of office and length of time served, his principal business occupations during the past five years, the number of portfolios in the Fund Complex overseen by the Interested Trustee and the other directorships, if any, held by the Trustee, are shown below.
INTERESTED TRUSTEE
| Name, Address and Year of Birth of Interested Trustee* | Position(s) Held with Trust | Term of Office and Length of Time Served** | Principal Occupation(s) During Past 5 Years | Number of Portfolios in Fund Complex Overseen by Trustees*** | Other Directorships Held by Trustees |
Thomas A. Carter, 1966 | Trustee and President | Since March 2008 | Mr. Carter joined ALPS Fund Services, Inc. (“ALPS”) in 1994 and is currently President and Director of ALPS Advisors, Inc. (“AAI”) and ALPS Portfolio Solutions Distributor, Inc. (“APSD”) and Executive Vice President and Director of ALPS and ALPS Holdings, Inc. (“AHI”) and ALPS Distributors, Inc. (“ADI”). Because of his position with AHI, ALPS, ADI, APSD and AAI, Mr. Carter is deemed an affiliate of the Fund as defined under the 1940 Act. Before joining ALPS, Mr. Carter was with Deloitte & Touche LLP, where he worked with a diverse group of clients, primarily within the financial services industry. Mr. Carter is a Certified Public Accountant and received his Bachelor of Science in Accounting from the University of Colorado at Boulder. | 33 | Mr. Carter is a Trustee of ALPS Variable Investment Trust (10 funds); Principal Real Estate Income Fund (1 fund); and RiverNorth Opportunities Fund, Inc. (1 fund). |
| * | The business address of the Trustee is c/o ALPS Advisors, Inc., 1290 Broadway, Suite 1100, Denver, Colorado 80203. |
| ** | This is the period for which the Trustee began serving the Trust. Each Trustee serves an indefinite term, until his successor is elected. |
| *** | The Fund Complex includes all series of the Trust and any other investment companies for which ALPS Advisors, Inc. provides investment advisory services. |
| Cohen & Steers Global Realty Majors ETF | |
| Trustees & Officers | November 30, 2016 (Unaudited) |
| OFFICERS | | | |
Name, Address and Year of Birth of Officer* | Position(s) Held with Trust | Length of Time Served** | Principal Occupation(s) During Past 5 Years |
Erin D. Nelson, 1977 | Chief Compliance Officer (“CCO”) | Since December 2015 | Erin Nelson became Senior Vice‐President and Chief Compliance Officer of ALPS Advisors, Inc. (“AAI”) on July 1, 2015 and prior to that served as Vice President and Deputy Chief Compliance Officer of AAI since January 1, 2015. Prior to January 1, 2015, Ms. Nelson was Vice‐President and Assistant General Counsel of ALPS Fund Services, Inc. Because of her position with AAI, Ms. Nelson is deemed an affiliate of the Trust as defined under the 1940 Act. Ms. Nelson is also the CCO of ALPS Variable Investment Trust, Liberty All‐Star Growth Fund, Inc., Liberty All‐Star Equity Fund, Principal Real Estate Income Fund, and RiverNorth Opportunities Fund, Inc. |
Patrick D. Buchanan, 1972 | Treasurer | Since June 2012 | Mr. Buchanan is Vice President of AAI. Mr. Buchanan joined ALPS in 2007 and because of his position with AAI, he is deemed an affiliate of the Trust as defined under the 1940 Act. Mr. Buchanan is also Treasurer of the ALPS Variable Insurance Trust, Principal Real Estate Income Fund, Clough Funds Trust and RiverNorth Opportunities Fund, Inc. |
Andrew P. Meloni, 1969 | Assistant Treasurer | Since December 2016 | Mr. Meloni is a Fund Controller for ALPS Fund Services, Inc. Mr. Meloni joined ALPS in 2007 and because of his position with ALPS, he is deemed an affiliate of the Fund as defined under the 1940 Act. Mr. Meloni is also Assistant Treasurer to the Liberty All‐Star Equity Fund, Liberty All‐Star Growth Fund, Inc., Principal Real Estate Income Fund, RiverNorth Opportunities Fund, Inc. and ALPS Variable Investment Trust. |
Abigail J. Murray, 1975 | Secretary | Since June 2015 | Ms. Murray joined ALPS in April 2015. She is currently Vice President and Senior Counsel of ALPS. Prior to joining ALPS, Ms. Murray was an Attorney and Managing Member at Murray & Rouvina PLC from 2014 to 2015 and an Associate with Vedder Price P.C. from 2007 to 2014. Ms. Murray is also the Secretary of Clough Global Allocation Fund, Clough Global Equity Fund, Clough Global Opportunities Fund, Clough Funds Trust, The Caldwell & Orkin Funds, Inc. and RiverNorth Opportunities Fund, Inc. and Assistant Secretary of Elevation ETF Trust and Principal Real Estate Income Fund. |
Andrea E. Kuchli, 1985 | Assistant Secretary | Since December 2015 | Ms. Kuchli joined ALPS in 2015 and is currently Vice President and Senior Counsel of ALPS. Prior to joining ALPS, Ms. Kuchli was an Associate with Davis Graham & Stubbs LLP from April 2014 to February 2015, and an Associate with Dechert LLP from 2011 to April 2014. Because of her position with ALPS, Ms. Kuchli is deemed an affiliate of the Trust as defined under the 1940 Act. Ms. Kuchli is also Secretary of Elevation ETF Trust and Principal Real Estate Income Fund as well as Assistant Secretary of the James Advantage Funds and RiverNorth Opportunities Fund, Inc. |
Sharon Akselrod, 1974 | Assistant Secretary | Since December 2016 | Ms. Akselrod joined ALPS in August 2014 and is currently Senior Investment Company Act Paralegal of ALPS Fund Services, Inc. Prior to joining ALPS, Ms. Akselrod served as Corporate Governance and Regulatory Associate for Nordstrom fsb (2013‐2014) and Senior Legal Assistant – Legal Manager for AXA Equitable Life Insurance Company (2008‐2013). Because of her position with ALPS, Ms. Akselrod is deemed an affiliate of the Trust as defined under the 1940 Act. Ms. Akselrod is also Assistant Secretary of Financial Investors Trust. |
| * | The business address of each Officer is c/o ALPS Advisors, Inc., 1290 Broadway, Suite 1100, Denver, Colorado 80203. |
| ** | This is the period for which the Officer began serving the Trust. Each Officer serves an indefinite term, until his/her successor is elected. |
The Statement of Additional Information includes additional information about the Fund's Trustees and is available, without charge, upon request by calling (toll-free) 1-866-513-5856.
Intentionally Left Blank
| Performance Overview | 1 |
| Disclosure of Fund Expenses | 4 |
| Report of Independent Registered Public Accounting Firm | 5 |
| Schedule of Investments | 6 |
| Statement of Assets and Liabilities | 8 |
| Statement of Operations | 9 |
| Statements of Changes In Net Assets | 10 |
| Financial Highlights | 11 |
| Notes to Financial Statements | 12 |
| Additional Information | 19 |
| Board Considerations Regarding Approval of Investment Advisory Agreement | 20 |
| Trustees & Officers | 21 |
alpsfunds.com
U.S. Equity High Volatility Put Write Index Fund
| Performance Overview | November 30, 2016 (Unaudited) |
Investment Objective
The U.S. Equity High Volatility Put Write Index Fund (the “Fund”) seeks investment results that correspond generally to the performance, before the Fund’s fees and expenses, of the NYSE Arca U.S. Equity High Volatility Put Write IndexSM (the “Underlying Index”). The Underlying Index reflects the performance of a portfolio of exchange‐traded put options on highly volatile stocks.
The Underlying Index measures the return of a hypothetical portfolio consisting of exchange traded put options which have been sold on each of 40 stocks and a cash position. The 40 stocks on which options are sold (“written”) are those 40 stocks from a selection of the largest capitalized (over
$5 billion in market capitalization) stocks which also have listed options and which have the highest volatility, as determined by the NYSE Arca, Inc. (the “NYSE Arca”), the Fund’s index provider (the “Index Provider”).
Performance Overview
The twelve month period ended November 30th, 2016 marked the third full year for the Fund, which listed on the NYSE Arca Exchange on February 28th, 2013. The Fund was up 0.79% on a total return basis from December 1st, 2015 through November 30th, 2016, while distributing approximately 9% or $1.81 per share in each of the Fund’s six bi‐monthly distributions during this same period.
The Fund’s return was consistent with the Fund’s Underlying Index, which was up 2.20% on a gross basis and up 1.25% on a net of fees basis (exclusive of commissions and the compounding effect of reinvested distributions in the index). Of the 240 two‐month options sold by the Fund that expired prior to November 30th, 2016, 66 expired “in‐the‐money” and were subsequently closed, while 174 expired worthless.
Because the Fund collateralizes its short put positions by purchasing 3‐month T‐bills, part of the Fund’s return is generated by interest income. During the 12‐month period ending November 30th, 2016, interest rates remained very low historically, however, short‐term rates did increase dramatically at the beginning of 2016 and then again after the U.S. Presidential election in early November. Should short‐term interest rates increase further, the Fund’s return from enhanced interest income will also increase.
While not an “apples‐to‐apples” comparison, over the same time period (Dec 1st, 2015 through Nov 30th, 2016), the S&P 500 TR Index was up 8.1%. However, its annualized historical volatility of 16.3% during the period was far greater than the Fund’s annualized historical volatility of 10.7%. Even though the CBOE SPX Volatility Index (VIX) was down almost 17.5% during the period, the market experienced heightened volatility on 3 different occasions during the period (Crude oil collapse, Brexit, & the U.S. Presidential election), which contributed to roughly 27.5% of the Fund’s put positions expiring “in‐the‐money”. The Fund’s correlation and beta to the S&P 500 TR Index for the period were 60.1% and 0.38, respectively.
Looking forward, we believe the Fund’s strategy of selling high implied volatility put options on a diversified selection of large‐capitalization stocks with strike prices that are 15% “out‐of‐the‐money” will continue to provide income potential to investors, while at the same time allowing the Fund to experience lower volatility than the broad market.
Definitions:
Put Options: financial instruments that give the owner/buyer the right, but not the obligation, to sell a specified quantity of a security at a set price called the “strike” price on or before an agreed upon expiration date.
Volatility: the measure of a financial instrument’s price variation over time. Higher volatility suggests that a security's value could vary over a larger range of values. This means that the price of the security could change dramatically over a short time period in either direction. Lower volatility suggests that a security's value does not fluctuate dramatically, but changes in value at a steady pace over a period of time.
Fund Performance (as of November 30, 2016)
| | 1 Year | 3 Year | Since Inception^ |
| U.S. Equity High Volatility Put Write Index Fund ‐ NAV | 0.79% | ‐0.03% | 2.42% |
| U.S. Equity High Volatility Put Write Index Fund ‐ Market Price* | 1.59% | 0.01% | 2.55% |
| U.S. Equity High Volatility Put Write Total Return Index | 2.20% | 1.81% | 4.40% |
S&P 500® Total Return Index | 8.06% | 9.07% | 12.76% |
Total Expense Ratio (per the current prospectus) 0.95%.
Performance data quoted represents past performance. Past performance does not guarantee future results. The table does not reflect the deduction of taxes that a shareholder would pay on Fund distributions or the redemption of Fund shares. Investment return and principal value of an investment will fluctuate so that an investor’s shares, when sold or redeemed, may be worth more or less than the original cost. Current performance data may be higher or lower than actual data quoted. For most current month-end performance data please visit www.alpsfunds.com or call 1.855.325.8020.
U.S. Equity High Volatility Put Write Index Fund
| Performance Overview | November 30, 2016 (Unaudited) |
NAV is an exchange-traded fund’s per-share value. The per-share dollar amount of the Fund is derived by dividing the total value of all the securities in its portfolio, less any liabilities, by the number of Fund shares outstanding. Market Price is the price at which a share can currently be traded in the market. Information detailing the number of days the Market Price of the Fund was greater than the Fund’s NAV and the number of days it was less than the Fund’s NAV can be obtained at www.alpsfunds.com.
| ^ | The Fund commenced Investment Operations on February 28, 2013. |
| * | Market Price is based on the midpoint of the bid/ask spread at 4 p.m. ET and does not represent the returns an investor would receive if shares were traded at other times. |
NYSE Arca U.S. Equity High Volatility Put Write IndexSM- Total Return: measures the return of a hypothetical portfolio of listed put options on each of 40 stocks and a cash (U.S. T-Bill) position. The 40 underlying stocks on which options are written are a selection of the largest capitalized (over $5 billion in market cap) U.S. listed stocks which also have listed options and which have the highest volatility, as determined by the NYSE Arca, Inc., the Fund’s Index provider. No more than 17.5% of the Index positions will be from the same sector. Total return assumes reinvestment of any dividends and distributions realized during a given time period.
The NYSE Arca U.S. Equity High Volatility Put Write Total Return IndexSM: is a service mark of NYSE Euronext or its affiliates and has been licensed for use by ALPS Advisors, Inc. in connection with the U.S. Equity High Volatility Put Write Index Fund. Neither the Trust nor the Fund is sponsored, endorsed, sold or promoted by NYSE Euronext. NYSE Euronext makes no representations or warranties regarding the Trust or the Fund or the ability of the NYSE Arca U.S. Equity HighVolatility Put Write IndexSMto track general stock market performance.
S&P 500®Total Return Index: The Standard & Poor’s composite index of 500 stocks, a widely recognized, unmanaged index of common stock prices.
The indexes are not actively managed and do not reflect any deductions for fees, expenses or taxes. The indexes are reported on a total return basis, which assumes reinvestment of any dividends and distributions realized during a given time period. One cannot invest directly in an index. Index performance does not reflect fund performance.
The U.S. Equity High Volatility Put Write Index Fund is not suitable for all investors. Investments in the Fund are subject to investment risks, including possible loss of the principal amount invested.
ALPS Portfolio Solutions Distributor, Inc., a FINRA member, is the distributor for the U.S. Equity High Volatility Put Write Index Fund.
U.S. Equity High Volatility Put Write Index Fund
| Performance Overview | November 30, 2016 (Unaudited) |
Growth Of $10,000 (as of November 30, 2016)
Comparison of change in value of a $10,000 investment in the Fund and the Underlying Index
The chart above represents historical performance of a hypothetical investment of $10,000 in the Fund over the life of the Fund. Past performance does not guarantee future results. This chart does not reflect the deduction of taxes that a shareholder would pay on Fund distributions or the redemption of Fund shares.
Asset Allocation* (as of November 30, 2016)
| Short Term Investments | | 101.10% | |
| Written Put Options | | ‐1.17% | |
| Common Stocks | | 0.07% | |
| Total | | 100.00% | |
Holdings are subject to change.
U.S. Equity High Volatility Put Write Index Fund
| Disclosure of Fund Expenses | November 30, 2016 (Unaudited) |
Shareholder Expense Example: As a shareholder of the Fund, you incur two types of costs: (1) transaction costs which may include creation and redemption fees or brokerage charges, and (2) ongoing costs, including management fees and other Fund expenses. These examples are intended to help you understand your ongoing costs (in dollars) of investing in the Fund and to compare these costs with the ongoing costs of investing in other funds. It is based on an investment of $1,000 invested at the beginning of the (six month) period and held through November 30, 2016.
Actual Return: The first line of the table provides information about actual account values and actual expenses. You may use the information in this line, together with the amount you invested, to estimate the expenses that you incurred over the period. Simply divide your account value by $1,000 (for example, an $8,600 account value divided by $1,000 = 8.6), then multiply the result by the number in the first line under the heading entitled “Expenses Paid During Period” to estimate the expenses attributable to your investment during this period.
Hypothetical 5% Return: The second line of the table provides information about hypothetical account values and hypothetical expenses based on the Fund’s actual expense ratio and an assumed rate of return of 5% per year before expenses, which is not the Fund’s actual return. The hypothetical account values and expenses may not be used to estimate the actual ending account balance or expenses you paid for the period. You may use this information to compare ongoing costs of investing in the Fund and other funds. To do so, compare this 5% hypothetical example with the 5% hypothetical examples that appear in the shareholder reports of other funds.
The expenses shown in the table are meant to highlight ongoing Fund costs only and do not reflect any transaction costs, such as creation and redemption fees or brokerage charges. Therefore, the second line is useful in comparing ongoing costs only, and will not help you determine the relative total costs of owning different funds. In addition, if these costs were included, your costs would have been higher.
| | Beginning Account Value 6/1/16 | Ending Account Value 11/30/16 | Expense Ratio(a) | Expenses Paid During Period 6/1/16 - 11/30/16(b) |
| U.S. Equity High Volatility Put Write Index Fund | | | | |
| Actual | $1,000.00 | $1,029.60 | 0.95% | $4.82 |
| Hypothetical (5% return before expenses) | $1,000.00 | $1,020.25 | 0.95% | $4.80 |
| (a) | Annualized, based on the Fund's most recent fiscal half year expenses. |
| (b) | Expenses are equal to the Fund's annualized expense ratio multiplied by the average account value over the period, multiplied by the number of days in the most recent fiscal half year (183), divided by 366. |
U.S. Equity High Volatility Put Write Index Fund
| Report of Independent Registered Public Accounting Firm |
To the Board of Trustees and Shareholders of ALPS ETF Trust:
We have audited the accompanying statement of assets and liabilities, including the schedules of investments, of U.S. Equity High Volatility Put Write Index Fund, one of the portfolios constituting the ALPS ETF Trust (the “Trust”), as of November 30, 2016, and the related statement of operations for the year then ended, the statements of changes in net assets for each of the two years in the period then ended, and the financial highlights for each of the periods presented. These financial statements and financial highlights are the responsibility of the Trust’s management. Our responsibility is to express an opinion on these financial statements and financial highlights based on our audits.
We conducted our audits in accordance with the standards of the Public Company Accounting Oversight Board (United States). Those standards require that we plan and perform the audit to obtain reasonable assurance about whether the financial statements and financial highlights are free of material misstatement. The Trust is not required to have, nor were we engaged to perform, an audit of its internal control over financial reporting. Our audits included consideration of internal control over financial reporting as a basis for designing audit procedures that are appropriate in the circumstances, but not for the purpose of expressing an opinion on the effectiveness of the Trust’s internal control over financial reporting. Accordingly, we express no such opinion. An audit also includes examining, on a test basis, evidence supporting the amounts and disclosures in the financial statements, assessing the accounting principles used and significant estimates made by management, as well as evaluating the overall financial statement presentation. Our procedures included confirmation of securities owned as of November 30, 2016, by correspondence with the custodian and broker. We believe that our audits provide a reasonable basis for our opinion.
In our opinion, the financial statements and financial highlights referred to above present fairly, in all material respects, the financial position of U.S. Equity High Volatility Put Write Index Fund of the ALPS ETF Trust as of November 30, 2016, the results of its operations for the year then ended, the changes in its net assets for each of the two years in the period then ended, and the financials highlights for each of the periods presented, in conformity with accounting principles generally accepted in the United States of America.
DELOITTE & TOUCHE LLP
Denver, Colorado
January 27, 2017
U.S. Equity High Volatility Put Write Index Fund
| Schedule of Investments | November 30, 2016 |
| Security Description | | Shares | | | Value | |
| COMMON STOCK (0.07%) | | | | | | |
| Communications (0.07%) | | | | | | |
TripAdvisor, Inc.(a)(b) | | | 500 | | | $ | 24,140 | |
| | | | | | | | | |
| TOTAL COMMON STOCK | | | | | | | | |
| (Cost $26,976) | | | | | | | 24,140 | |
| Security Description | | Principal Amount | | | Value | |
| SHORT TERM INVESTMENTS (100.98%) | | | | | | |
| U.S. Treasury Bill Discount Notes | | | | | | |
0.311%, 12/01/2016(c) | | $ | 7,500,000 | | | $ | 7,500,000 | |
0.288%, 01/12/2017(b)(c) | | | 6,500,000 | | | | 6,497,667 | |
0.304%, 01/19/2017(c) | | | 19,000,000 | | | | 18,991,488 | |
0.348%, 02/02/2017(c) | | | 2,700,000 | | | | 2,698,034 | |
| | | | | | | | | |
TOTAL SHORT TERM INVESTMENTS (Cost $35,688,129) | | | | | | | 35,687,189 | |
| | | | | | | | | |
TOTAL INVESTMENTS (101.05%) (Cost $35,715,105) | | | | | | $ | 35,711,329 | |
| | | | | | | | | |
NET LIABILITIES LESS OTHER ASSETS (‐1.05%)(d) | | | | | | | (371,116 | ) |
| | | | | | | | | |
| NET ASSETS (100.00%) | | | | | | $ | 35,340,213 | |
| (a) | Non-income producing security. |
| (b) | All or a portion of this security is being held as collateral for written options. |
| (c) | Rate shown represents the bond equivalent yield to maturity at date of purchase. |
| (d) | Includes cash, in the amount of $2,496, which is being held as collateral for written options. |
SCHEDULE OF WRITTEN OPTIONS
| | Expiration Date | | Exercise Price | | | Contracts | | | Value | |
| WRITTEN PUT OPTIONS | | | | | | | | | | |
| Akamai Technologies, Inc. | 12/16/2016 | | $ | 50.00 | | | | (175 | ) | | $ | (1,487 | ) |
| American Airlines | 12/16/2016 | | | 34.00 | | | | (258 | ) | | | (1,032 | ) |
| Biogen, Inc. | 12/16/2016 | | | 250.00 | | | | (35 | ) | | | (2,363 | ) |
| BioMarin Pharmaceutical, Inc. | 12/16/2016 | | | 70.00 | | | | (125 | ) | | | (1,563 | ) |
| Cabot Oil & Gas Corp. | 12/16/2016 | | | 18.00 | | | | (488 | ) | | | (3,660 | ) |
| CF Industries Holdings, Inc. | 12/16/2016 | | | 22.50 | | | | (390 | ) | | | (2,535 | ) |
| Continental Resource | 12/16/2016 | | | 44.00 | | | | (199 | ) | | | (1,990 | ) |
| Devon Energy Corp. | 12/16/2016 | | | 35.00 | | | | (251 | ) | | | (502 | ) |
| Energen Corp. | 12/16/2016 | | | 45.00 | | | | (195 | ) | | | (6,825 | ) |
| Herbalife Ltd. | 12/16/2016 | | | 50.00 | | | | (175 | ) | | | (38,500 | ) |
| Illumina, Inc. | 12/16/2016 | | | 120.00 | | | | (73 | ) | | | (3,102 | ) |
| Incyte Corp. | 12/16/2016 | | | 75.00 | | | | (117 | ) | | | (3,510 | ) |
| Ingram Micro, Inc. | 12/16/2016 | | | 30.00 | | | | (293 | ) | | | (1,465 | ) |
| Macy's, Inc. | 12/16/2016 | | | 31.00 | | | | (283 | ) | | | (2,547 | ) |
| Mallinckrodt PLC | 12/16/2016 | | | 55.00 | | | | (159 | ) | | | (60,420 | ) |
| Murphy Oil Corp. | 12/16/2016 | | | 25.00 | | | | (351 | ) | | | (1,755 | ) |
| Mylan NV | 12/16/2016 | | | 32.50 | | | | (270 | ) | | | (3,105 | ) |
| Newmont Mining Corp. | 12/16/2016 | | | 30.00 | | | | (293 | ) | | | (11,427 | ) |
| Nordstrom, Inc. | 12/16/2016 | | | 47.50 | | | | (185 | ) | | | (555 | ) |
| Pilgrim's Pride Corp. | 12/16/2016 | | | 18.25 | | | | (481 | ) | | | (48,100 | ) |
U.S. Equity High Volatility Put Write Index Fund
| Schedule of Investments | November 30, 2016 |
| | Expiration Date | | Exercise Price | | | Contracts | | | Value | |
| WRITTEN PUT OPTIONS (continued) | | | | | | | | | | |
| Qorvo, Inc. | 12/16/2016 | | $ | 50.00 | | | | (175 | ) | | $ | (7,875 | ) |
| Range Resources Corp. | 12/16/2016 | | | 31.00 | | | | (283 | ) | | | (9,197 | ) |
| ServiceNow, Inc. | 12/16/2016 | | | 70.00 | | | | (125 | ) | | | (1,875 | ) |
| Splunk, Inc. | 12/16/2016 | | | 50.00 | | | | (175 | ) | | | (4,375 | ) |
| Stericycle, Inc. | 12/16/2016 | | | 65.00 | | | | (135 | ) | | | (3,712 | ) |
| Targa Resources Corp. | 12/16/2016 | | | 40.00 | | | | (219 | ) | | | (3,833 | ) |
| Tesla Motors, Inc. | 12/16/2016 | | | 175.00 | | | | (50 | ) | | | (6,325 | ) |
| The Mosaic Co. | 12/16/2016 | | | 21.00 | | | | (418 | ) | | | (1,672 | ) |
| Trimble, Inc. | 12/16/2016 | | | 25.00 | | | | (351 | ) | | | (4,387 | ) |
| TripAdvisor, Inc. | 12/16/2016 | | | 55.00 | | | | (154 | ) | | | (100,870 | ) |
| Under Armour, Inc. | 12/16/2016 | | | 32.50 | | | | (270 | ) | | | (56,025 | ) |
| United Continental | 12/16/2016 | | | 47.00 | | | | (187 | ) | | | (748 | ) |
| United Rentals, Inc. | 12/16/2016 | | | 65.00 | | | | (135 | ) | | | (675 | ) |
| Vertex Pharmaceuticals, Inc. | 12/16/2016 | | | 65.00 | | | | (135 | ) | | | (4,050 | ) |
| Western Digital Corp. | 12/16/2016 | | | 45.00 | | | | (195 | ) | | | (292 | ) |
| Westlake Chemical Corp. | 12/16/2016 | | | 45.00 | | | | (195 | ) | | | (2,925 | ) |
| WestRock Co. | 12/16/2016 | | | 40.00 | | | | (219 | ) | | | (3,833 | ) |
| Whole Foods Market, Inc. | 12/16/2016 | | | 24.00 | | | | (366 | ) | | | (1,098 | ) |
| Wynn Resorts Ltd. | 12/16/2016 | | | 82.50 | | | | (106 | ) | | | (1,325 | ) |
| Zillow Group, Inc. | 12/16/2016 | | | 30.00 | | | | (293 | ) | | | (2,198 | ) |
TOTAL WRITTEN PUT OPTIONS (Premiums received $599,619) | | | | | | | | $ | (413,733 | ) |
See Notes to Financial Statements.
U.S. Equity High Volatility Put Write Index Fund
| Statements of Assets and Liabilities | November 30, 2016 |
| | | U.S. Equity High Volatility Put Write Index Fund | |
| ASSETS: | | | |
| Investments, at value | | $ | 35,711,329 | |
| Cash | | | 67,517 | |
| Deposits with brokers for written options | | | 2,496 | |
| Total Assets | | | 35,781,342 | |
| | | | | |
| LIABILITIES: | | | | |
| Written options, at value (Proceeds 599,619) | | | 413,733 | |
| Payable to adviser | | | 27,396 | |
| Total Liabilities | | | 441,129 | |
| NET ASSETS | | $ | 35,340,213 | |
| | | | | |
| NET ASSETS CONSIST OF: | | | | |
| Paid‐in capital | | $ | 35,769,644 | |
| Accumulated net realized loss | | | (611,541 | ) |
| Net unrealized appreciation | | | 182,110 | |
| NET ASSETS | | $ | 35,340,213 | |
| | | | | |
| INVESTMENTS, AT COST | | $ | 35,715,105 | |
| | | | | |
| PRICING OF SHARES | | | | |
| Net Assets | | $ | 35,340,213 | |
| Shares of beneficial interest outstanding (Unlimited number of shares authorized, par value $0.01 per share) | | | 1,800,000 | |
| Net Asset Value, offering and redemption price per share | | $ | 19.63 | |
See Notes to Financial Statements.
U.S. Equity High Volatility Put Write Index Fund
| Statements of Operations | For the Year Ended November 30, 2016 |
| | | U.S. Equity High Volatility Put Write Index Fund | |
| INVESTMENT INCOME: | | | |
| Interest | | $ | 102,029 | |
| Total investment income | | | 102,029 | |
| | | | | |
| EXPENSES: | | | | |
| Investment adviser fees | | | 389,492 | |
| Total Expenses | | | 389,492 | |
| NET INVESTMENT LOSS | | | (287,463 | ) |
| | | | | |
| REALIZED AND UNREALIZED GAIN/(LOSS) | | | | |
| Net realized loss on investments | | | (4,918,882 | ) |
| Net realized gain on written option contracts | | | 5,283,838 | |
| Total realized gain | | | 364,956 | |
| Net change in unrealized appreciation on investments | | | 36,864 | |
| Net change in unrealized depreciation on written option contracts | | | (254,390 | ) |
| Total change in unrealized depreciation | | | (217,526 | ) |
NET REALIZED AND UNREALIZED GAIN ON INVESTMENTS AND WRITTEN OPTION CONTRACTS | | | 147,430 | |
| NET DECREASE IN NET ASSETS RESULTING FROM OPERATIONS | | $ | (140,033 | ) |
See Notes to Financial Statements.
U.S. Equity High Volatility Put Write Index Fund
| Statements of Changes in Net Assets | |
| | | For the Year Ended November 30, 2016 | | | For the Year Ended November 30, 2015(a) | |
| OPERATIONS: | | | | | | |
| Net investment loss | | $ | (287,463 | ) | | $ | (478,439 | ) |
Net realized gain/(loss)(a) | | | 364,956 | | | | (1,207,519 | ) |
Net change in unrealized appreciation/(depreciation)(a) | | | (217,526 | ) | | | 29,837 | |
| Net decrease in net assets resulting from operations | | | (140,033 | ) | | | (1,656,121 | ) |
| | | | | | | | | |
| DISTRIBUTIONS TO SHAREHOLDERS: | | | | | | | | |
| Tax return of capital | | | (3,811,090 | ) | | | (4,785,224 | ) |
| Total distributions | | | (3,811,090 | ) | | | (4,785,224 | ) |
| | | | | | | | | |
| CAPTIAL SHARE TRANSACTIONS: | | | | | | | | |
| Proceeds from sale of shares | | | 4,000,077 | | | | 14,107,670 | |
| Cost of shares redeemed | | | (15,899,656 | ) | | | (8,756,528 | ) |
| Net increase/(decrease) from share transactions | | | (11,899,579 | ) | | | 5,351,142 | |
| Net decrease in net assets | | | (15,850,702 | ) | | | (1,090,203 | ) |
| | | | | | | | | |
| NET ASSETS: | | | | | | | | |
| Beginning of period | | | 51,190,915 | | | | 52,281,118 | |
| End of period* | | $ | 35,340,213 | | | $ | 51,190,915 | |
| | | | | | | | | |
| *Including accumulated net investment income of: | | $ | – | | | $ | – | |
| | | | | | | | | |
| OTHER INFORMATION: | | | | | | | | |
| CAPTIAL SHARE TRANSACTIONS: | | | | | | | | |
| Beginning shares | | | 2,400,000 | | | | 2,200,002 | |
| Shares sold | | | 200,000 | | | | 600,000 | |
| Shares redeemed | | | (800,000 | ) | | | (400,002 | ) |
| Shares outstanding, end of period | | | 1,800,000 | | | | 2,400,000 | |
| (a) | Prior to November 30, 2016, the Fund presented realized gain/loss and unrealized appreciation/depreciation by investment type. This change in presentation was made to conform to industry standards and had no effect on the Fund's change in net assets. |
See Notes to Financial Statements.
U.S. Equity High Volatility Put Write Index Fund
| Financial Highlights | For a Share Outstanding Throughout the Periods Presented |
| | | For the Year Ended November 30, 2016 | | | For the Year Ended November 30, 2015 | | | For the Year Ended November 30, 2014 | | | For the Period February 28, 2013 (Commencement of Operations) to November 30, 2013 | |
| NET ASSET VALUE, BEGINNING OF PERIOD | | $ | 21.33 | | | $ | 23.76 | | | $ | 25.80 | | | $ | 25.00 | |
| | | | | | | | | | | | | | | | | |
| INCOME/(LOSS) FROM INVESTMENT OPERATIONS: | | | | | | | | | | | | | | | | |
Net investment loss(a) | | | (0.14 | ) | | | (0.21 | ) | | | (0.22 | ) | | | (0.18 | ) |
| Net realized and unrealized gain/(loss) | | | 0.25 | | | | (0.15 | ) | | | 0.42 | | | | 2.50 | |
| Total from investment operations | | | 0.11 | | | | (0.36 | ) | | | 0.20 | | | | 2.32 | |
| | | | | | | | | | | | | | | | | |
| DISTRIBUTIONS: | | | | | | | | | | | | | | | | |
| From net investment income | | | – | | | | – | | | | – | | | | (1.52 | ) |
| Tax return of capital | | | (1.81 | ) | | | (2.07 | ) | | | (2.24 | ) | | | – | |
| Total distributions | | | (1.81 | ) | | | (2.07 | ) | | | (2.24 | ) | | | (1.52 | ) |
| | | | | | | | | | | | | | | | | |
| NET INCREASE/(DECREASE) IN NET ASSET VALUE | | | (1.70 | ) | | | (2.43 | ) | | | (2.04 | ) | | | 0.80 | |
| NET ASSET VALUE, END OF PERIOD | | $ | 19.63 | | | $ | 21.33 | | | $ | 23.76 | | | $ | 25.80 | |
TOTAL RETURN(b) | | | 0.79 | % | | | (1.70 | %) | | | 0.84 | % | | | 9.51 | % |
| | | | | | | | | | | | | | | | | |
| RATIOS/SUPPLEMENTAL DATA: | | | | | | | | | | | | | | | | |
| Net assets, end of period (000s) | | $ | 35,340 | | | $ | 51,191 | | | $ | 52,281 | | | $ | 28,379 | |
| | | | | | | | | | | | | | | | | |
| Ratio of expenses to average net assets | | | 0.95 | % | | | 0.95 | % | | | 0.95 | % | | | 0.95 | %(c) |
| Ratio of net investment loss to average net assets | | | (0.70 | %) | | | (0.90 | %) | | | (0.92 | %) | | | (0.92 | %)(c) |
Portfolio turnover rate(d) | | | 0 | %(e) | | | 0 | %(e) | | | 0 | % | | | 0 | % |
| (a) | Based on average shares outstanding during the period. |
| (b) | Total return is calculated assuming an initial investment made at the net asset value at the beginning of the period and redemption at the net asset value on the last day of the period and assuming all distributions are reinvested at reinvestment prices. Total return calculated for a period of less than one year is not annualized. |
| (d) | Portfolio turnover for periods less than one year is not annualized. |
| (e) | The Fund typically holds no long positions at the end of each month because it is not part of the Fund’s principal investment strategy. The Fund held one long position which was excluded from the portfolio turnover calculation. |
See Notes to Financial Statements.
U.S. Equity High Volatility Put Write Index Fund
| Notes to Financial Statements | November 30, 2016 |
1. ORGANIZATION
ALPS ETF Trust (the “Trust”), a Delaware statutory trust, is an open‐end management investment company under the Investment Company Act of 1940, as amended (the “1940 Act”). As of November 30, 2016, the Trust consists of nineteen separate portfolios. Each portfolio represents a separate series of the Trust. This report pertains solely to the U.S. Equity High Volatility Put Write Index Fund (the “Fund”).
The investment objective of the Fund is to seek investment results that correspond generally to the performance, before the Fund’s fees and expenses, of the NYSE Arca U.S. Equity High Volatility Put Write IndexSM (the “Underlying Index”). The Underlying Index reflects the performance of a portfolio of exchange‐traded put options on highly volatile stocks. The Fund is considered non‐diversified and may invest a greater portion of assets in securities of individual issuers than a diversified fund. As a result, changes in the market value of a single investment could cause greater
fluctuations in share price than would occur in a diversified fund.
Shares of the Fund (“Shares”) are listed on the New York Stock Exchange (“NYSE”) Arca. The Fund issues and redeems Shares, at net asset value (“NAV”), in blocks of 100,000 Shares, each of which is called a “Creation Unit.” Creation Units of the Fund are issued and redeemed for cash. Except when aggregated in Creation Units, Shares are not redeemable securities of the Fund.
Pursuant to the Trust’s organizational documents, its Officers and Trustees are indemnified against certain liability arising out of the performance of their duties to the Trust. Additionally, in the normal course of business, the Trust enters into contracts with service providers that contain general indemnification clauses. The Trust’s maximum exposure under these arrangements is unknown, as this would involve future claims that may be made against the Trust that have not yet occurred.
2. SIGNIFICANT ACCOUNTING POLICIES
The following is a summary of significant accounting policies consistently followed by the Fund in the preparation of the financial statements. The accompanying financial statements were prepared in accordance with accounting principles generally accepted in the United States of America (“U.S. GAAP”). The preparation of financial statements in conformity with U.S. GAAP requires management to make certain estimates and assumptions that affect the reported amounts of assets and liabilities and disclosures of contingent assets and liabilities at the date of the financial statements and the reported amounts of revenue and expenses during the period. Actual results could differ from those estimates. The Fund is considered an investment company under U.S. GAAP and follows the accounting and reporting guidance applicable to investment companies in the Financial Accounting Standards Board Accounting Standards Codification Topic 946.
A. Portfolio Valuation
The Fund’s NAV is determined daily, as of the close of the NYSE, usually 4:00 p.m. Eastern time, each day the NYSE is open for trading. The NAV is computed by dividing the value of the Fund’s portfolio securities, cash and other assets (including accrued interest), less all liabilities (including accrued expenses), by the total number of shares outstanding.
Portfolio securities listed on any exchange other than the NASDAQ Stock Market LLC (“NASDAQ”) are valued at the last sale price on the business day as of which such value is being determined. If there has been no sale on such day, the securities are valued at the mean of the most recent bid and ask prices on such day. Securities traded on the NASDAQ are valued at the NASDAQ Official Closing Price as determined by NASDAQ. Portfolio securities traded on more than one securities exchange are valued at the last sale price on the business day as of which such value is being determined at the close of the exchange representing the principal market for such securities. Portfolio securities traded in the over‐the‐counter market, but excluding securities traded on the NASDAQ, are valued at the last quoted sale price in such market. Treasury Bills and Treasury Notes are typically valued at the mean between the evaluated bid and ask prices formulated by an independent pricing service.
The Fund’s listed put options are valued at the mean of the most recent bid and ask prices.
The Fund’s investments are valued at market value or, in the absence of market value with respect to any portfolio securities, at fair value according to procedures adopted by the Trust’s Board of Trustees (the “Board”). When market quotations are not readily available or when events occur that make established valuation methods unreliable, securities of the Fund may be valued in good faith by or under the direction of the Board. These securities generally include, but are not limited to, restricted securities (securities which may not be publicly sold without registration under the Securities Act of 1933) for which a pricing service is unable to provide a market price; securities whose trading has been formally suspended; a security whose market price is not available from a pre‐established primary pricing source or the pricing source is not willing to provide a price; a security with respect to which an event has occurred that is most likely to materially affect the value of the security after the market has closed but before the calculation of the Fund’s NAV or make it difficult or impossible to obtain a reliable market quotation; or a security whose price, as provided by the pricing service, does not reflect the security’s “fair value” due to the security being de‐listed from a national exchange or the security’s primary trading market is temporarily closed at a time when, under normal conditions, it would be open. As a general principle, the current “fair value” of a security would be the amount which the owner might reasonably expect to receive from the sale on the applicable exchange or principal market. A variety of factors may be considered in determining the fair value of such securities.
U.S. Equity High Volatility Put Write Index Fund
| Notes to Financial Statements | November 30, 2016 |
B. Fair Value Measurements
The Fund discloses the classification of its fair value measurements following a three‐tier hierarchy based on the inputs used to measure fair value. Inputs refer broadly to the assumptions that market participants would use in pricing the asset or liability, including assumptions about risk. Inputs may be observable or unobservable. Observable inputs reflect the assumptions market participants would use in pricing the asset or liability that are developed based on market data obtained from sources independent of the reporting entity. Unobservable inputs reflect the reporting entity’s own assumptions about the assumptions market participants would use in pricing the asset or liability that are developed based on the best information available.
Valuation techniques used to value the Fund’s investments by major category are as follows:
Equity securities, including restricted securities, for which market quotations are readily available, are valued at the last reported sale price or official closing price as reported by a third party pricing vendor on the primary market or exchange on which they are traded and are categorized as Level 1 in the hierarchy. In the event there were no sales during the day or closing prices are not available, securities are valued at the mean of the most recent quoted bid and ask prices on such day and are generally categorized as Level 2 in the hierarchy. Investments in open‐end mutual funds are valued at their closing NAV each business day and are categorized as Level 1 in the hierarchy. Treasury Bills and Treasury Notes are typically valued at the mean between the evaluated bid and ask prices formulated by an independent pricing service and are categorized as Level 2 in the hierarchy, due to their active trading, short‐term maturity and liquidity. Listed put options are valued at the mean between the evaluated bid and ask prices formulated by an independent pricing service and are categorized as Level 1 in the hierarchy, due to their active trading and short‐term expiration.
Changes in valuation techniques may result in transfers in or out of an assigned level within the disclosure hierarchy.
Various inputs are used in determining the value of the Fund’s investments as of the end of the reporting period. When inputs used fall into different levels of the fair value hierarchy, the level in the hierarchy within which the fair value measurement falls is determined based on the lowest level input that is significant to the fair value measurement in its entirety. The designated input levels are not necessarily an indication of the risk or liquidity associated with these investments.
These inputs are categorized in the following hierarchy under applicable financial accounting standards:
| Level 1 – | Unadjusted quoted prices in active markets for identical investments, unrestricted assets or liabilities that the Fund has the ability to access at the measurement date; |
| Level 2 – | Quoted prices which are not active, quoted prices for similar assets or liabilities in active markets or inputs other than quoted prices that are observable (either directly or indirectly) for substantially the full term of the asset or liability; and |
| Level 3 – | Significant unobservable prices or inputs (including the Fund’s own assumptions in determining the fair value of investments) where there is little or no market activity for the asset or liability at the measurement date. |
The following is a summary of the inputs used to value the Fund’s investments at November 30, 2016:
U.S. Equity High Volatility Put Write Index Fund
| Investments in Securities at Value | | Level 1 - Unadjusted Quoted Prices | | | Level 2 - Other Significant Observable Inputs | | | Level 3 - Significant Unobservable Inputs | | | Total | |
| Common Stocks* | | $ | 24,140 | | | $ | – | | | $ | – | | | $ | 24,140 | |
| Short Term Investments | | $ | – | | | $ | 35,687,189 | | | $ | – | | | $ | 35,687,189 | |
| Total | | $ | 24,140 | | | $ | 35,687,189 | | | $ | – | | | $ | 35,711,329 | |
| | | | | | | | | | | | | | | | | |
| Other Financial Instruments | | | | | | | | | | | | | | | | |
| Liabilities | | | | | | | | | | | | | | | | |
| Written Option Contracts | | $ | (372,651 | ) | | $ | (41,082 | ) | | $ | – | | | $ | (413,733 | ) |
| Total | | $ | (372,651 | ) | | $ | (41,082 | ) | | $ | – | | | $ | (413,733 | ) |
| * | For a detailed sector breakdown, see the accompanying Schedule of Investments. |
U.S. Equity High Volatility Put Write Index Fund
| Notes to Financial Statements | November 30, 2016 |
The Fund recognizes transfers between levels as of the end of the period. For the year ended November 30, 2016, the Fund did not have any transfers between Level 1 and Level 2 securities. The Fund did not have any securities that used significant unobservable inputs (Level 3) in determining fair value.
C. Securities Transactions and Investment Income
Securities transactions are recorded as of the trade date. Realized gains and losses from securities transactions are recorded on the highest cost basis. Dividend income and capital gains distributions, if any, are recorded on the ex‐dividend date. Interest income, if any, is recorded on the accrual basis.
D. Dividends and Distributions to Shareholders
Dividends from net investment income, if any, and any net short‐term capital gains are distributed to shareholders following each 60 day period. Any other net income or capital gains will be distributed at least annually. Dividends may be declared and paid more frequently to improve Index tracking or to comply with the distribution requirements of the Internal Revenue Code. In addition, the Fund intends to distribute, at the end of each 60‐day period out of net investment income and/or net short‐term capital gains, an amount of cash equal to 1.5% of the Fund’s net assets at the end of such 60‐day period. If the Fund’s net investment income and net short‐term capital gains are insufficient to support a 1.5% distribution in any 60‐day period, the distribution will be reduced by the amount of the shortfall. As a result of the Fund’s investment strategy, it is not expected that the Fund will have income from long‐term capital gains.
E. Federal Tax and Tax Basis Information
The timing and character of income and capital gain distributions are determined in accordance with income tax regulations, which may differ from U.S. GAAP. Reclassifications are made to the Fund’s capital accounts for permanent tax differences to reflect income and gains available for distribution (or available capital loss carryforwards) under income tax regulations.
For the year ended November 30, 2016, the following reclassifications, which had no impact on results of operations or net assets, were recorded to reflect permanent tax differences resulting primarily from in‐kind transactions:
| Fund | | Paid-in Capital | | | Accumulated Net Investment Income/(Loss) | | | Accumulated Net Realized Gain/(Loss) on Investments | |
| U.S. Equity High Volatility Put Write Index Fund | | $ | (329,691 | ) | | $ | 287,463 | | | $ | 42,228 | |
Included with amounts reclassified was a net operating loss offset to paid‐in capital of $287,463.
The tax character of the distributions paid during the fiscal years ended November 30, 2016 and November 30, 2015 were as follows:
| | | Tax Return of Capital | |
| November 30, 2016 | | | |
| U.S. Equity High Volatility Put Write Index Fund | | $ | 3,811,090 | |
| November 30, 2015 | | | | |
| U.S. Equity High Volatility Put Write Index Fund | | $ | 4,785,224 | |
As of November 30, 2016, the components of distributable earnings on a tax basis for the Fund were as follows:
| | | U.S. Equity High Volatility Put Write Index Fund | |
| Accumulated net realized loss on investments | | $ | (611,541 | ) |
| Net unrealized appreciation on investments | | | 182,110 | |
| Total | | $ | (429,431 | ) |
U.S. Equity High Volatility Put Write Index Fund
| Notes to Financial Statements | November 30, 2016 |
At November 30, 2016 the U.S. Equity High Volatility Put Write Index Fund post‐enactment capital losses deferred to the next tax year were as follows:
| Fund | | Short-Term | |
| U.S. Equity High Volatility Put Write Index Fund | | $ | 611,541 | |
Capital loss carryovers used during the period ended November 30, 2016 were $407,184.
As of November 30, 2016, the cost of investments for federal income tax purposes and accumulated net unrealized appreciation/(depreciation) on investments were as follows:
| | | U.S. Equity High Volatility Put Write Index Fund | |
| Gross appreciation (excess of value over tax cost) | | $ | – | |
| Gross depreciation (excess of tax cost over value) | | | (3,776 | ) |
| Net appreciation of derivatives | | | 185,886 | |
| Net unrealized appreciation/ (depreciation) | | | 182,110 | |
| Cost of investments for income tax purposes | | $ | 35,715,105 | |
F. Income Taxes
No provision for income taxes are included in the accompanying financial statements, as the Fund intends to distribute to shareholders all taxable investment income and realized gains and otherwise comply with Subchapter M of the Internal Revenue Code of 1986, as amended, applicable to regulated investment companies. The Fund evaluates tax positions taken (or expected to be taken) in the course of preparing the Fund’s tax returns to determine whether these positions meet a “more‐likely‐than‐not” standard that, based on the technical merits, have a more than fifty percent likelihood of being sustained by a taxing authority upon examination. A tax position that meets the “more‐likely‐than‐not” recognition threshold is measured to determine the amount of benefit to recognize in the financial statements.
As of and during the year ended November 30, 2016, the Fund did not have a liability for any unrecognized tax benefits. The Fund files U.S. federal, state, and local tax returns as required. The Fund’s tax returns are subject to examination by the relevant tax authorities until expiration of the applicable statute of limitations, which is generally three years after the filing of the tax return, but may extend to four years in certain jurisdictions. Tax returns for open years have incorporated no uncertain tax positions that require a provision for income taxes.
G. Derivative Instruments and Hedging Activities
The following discloses the Fund’s use of derivative instruments and hedging activities.
The Fund’s investment objective permits the Fund to purchase derivative contracts including written options. In doing so, the Fund will employ strategies in differing combinations to permit them to increase, decrease, or change the level or types of exposure to market factors. Central to those strategies are features inherent to derivatives that make them more attractive for this purpose than equity or debt securities; they require little or no initial cash investment, they can focus exposure on only certain selected risk factors, and they may not require the ultimate receipt or delivery of the underlying security (or securities) to the contract. This may allow the Fund to pursue their objectives more quickly and efficiently than if they were to make direct purchases or sales of securities capable of affecting a similar response to market factors.
Cash collateral that has been pledged to cover derivative obligations of the Fund and cash collateral received from the counterparty and non‐cash collateral pledged by the Fund, if any, is noted in the Fund’s Schedule of Investments.
A written put option on an asset by the Fund obligates the Fund to buy the specified asset from the purchaser at the exercise price if the option is exercised before the expiration date. Premiums received when writing options are recorded as liabilities and are subsequently adjusted to the current value of the options written. Premiums received from writing options that expire are treated as realized gains. Premiums received from writing options, which are either exercised or closed, are offset against the proceeds received or amount paid on the transaction to determine realized gains or losses which are recorded on the Statement of Operations.
U.S. Equity High Volatility Put Write Index Fund
| Notes to Financial Statements | November 30, 2016 |
Market Risk Factors: In pursuit of the Fund’s investment objectives, the Fund will use derivatives to increase or decrease its exposure to the following market risk factors:
Equity Risk: The value of the options sold by the Fund is based on the value of the instruments directly or indirectly underlying such options. Accordingly, the Fund is exposed to equity risk, which is the risk that the value of the underlying stocks or ETFs underlying options written by the Fund will fall due to general market and economic conditions, perceptions regarding the industries in which the issuers of such stocks or ETFs participate, or factors relating to specific companies. In such event, the value of the options sold by the Fund will likely decline. Additionally, if the value of the stocks or ETFs underlying the options sold by the Fund increases, the Fund’s returns will not increase accordingly.
Put Option Risk: Options are generally subject to volatile swings in price based on changes in value of the underlying instrument, and the options written by the Fund may be particularly subject to this risk because the underlying stocks are selected by the Index Provider to have high volatility. The Fund will incur a form of economic leverage through its use of options, which will increase the volatility of the Fund’s returns and may increase the risk of loss to the Fund. While the Fund will collect premiums on the options it writes, the Fund’s risk of loss if one or more of its options is exercised and expires in‐the‐money may substantially outweigh the gains to the Fund from the receipt of such option premiums. The Fund will either earmark or segregate sufficient liquid assets to cover its obligations under each option on an ongoing basis. Moreover, the options sold by the Fund may have imperfect correlation to the returns of its underlying stocks or ETFs.
Implied Volatility Risk: When the Fund sells a listed put option, it gains the amount of the premium it receives, but also incurs a corresponding liability representing the value of the option it has sold (until the option is exercised and finishes in the money or expires worthless). The value of the options in which the Fund invests is partly based on the volatility used by market participants to price such options (i.e., implied volatility). Accordingly, increases in the implied volatility of such options will cause the value of such options to increase (even if the prices of the options’ underlying stocks or ETFs do not change), which will result in a corresponding increase in the liabilities of the Fund under such options and thus decrease the Fund’s NAV. The Fund is therefore exposed to implied volatility risk before the options expire or are exercised. This is the risk that the value of the implied volatility of the options sold by the Fund will increase due to general market and economic conditions, perceptions regarding the industries in which the issuers of such stock participate, or factors relating to specific companies.
Transactions in written option contracts during the year ended November 30, 2016, were as follows:
| | | Written Put Options | |
| | | Number of Contracts | | | Premiums | |
| Options outstanding at November 30, 2015 | | | (11,817 | ) | | $ | (1,451,725 | ) |
| Options written | | | (69,991 | ) | | | (6,207,424 | ) |
| Options exercised | | | 11,244 | | | | 1,426,177 | |
| Options expired | | | 57,412 | | | | 5,213,871 | |
| Options closed | | | 4,170 | | | | 419,482 | |
| Options outstanding at November 30, 2016 | | | (8,982 | ) | | | (599,619 | ) |
| Market Value, November 30, 2016 | | | | | | $ | (413,733 | ) |
The effect of derivatives instruments on the Statement of Assets and Liabilities as of November 30, 2016:
| | Liability Derivatives | |
| Risk Exposure | Statement of Assets and Liabilities Location | | Fair Value | |
| U.S. Equity High Volatility Put Write Index Fund | | | | |
| Equity Contracts (Written Options) | Written options, at value | | $ | 413,733 | |
| | | | $ | 413,733 | |
U.S. Equity High Volatility Put Write Index Fund
| Notes to Financial Statements | November 30, 2016 |
The effect of derivatives instruments on the Statement of Operations for the year ended November 30, 2016:
| Risk Exposure | Statement of Operations Location | | Realized Gain/(Loss) on Derivatives Recognized in Income | | | Change in Unrealized Gain/(Loss) on Derivatives Recognized in Income | |
| U.S. Equity High Volatility Put Write Index Fund | | | | | | | |
| Equity Contracts (Written Options) | Net realized gain on written option contracts/Net change in unrealized depreciation on written option contracts | | $ | 5,283,838 | | | $ | (254,390 | ) |
| Total | | | $ | 5,283,838 | | | $ | (254,390 | ) |
The average written option contracts volume for the Fund were 11,119 during the year ended November 30, 2016.
3. INVESTMENT ADVISORY FEE AND OTHER AFFILIATED TRANSACTIONS
ALPS Advisors, Inc. (the “Adviser”) acts as the Fund’s investment adviser pursuant to an advisory agreement with the Trust on behalf of the Fund (the “Advisory Agreement”). Pursuant to the Advisory Agreement, the Fund pays the Adviser a unitary fee for the services and facilities it provides payable on a monthly basis at the annual rate of 0.95% of the Fund’s average daily net assets. From time to time, the Investment Adviser may waive all or a portion of its fee.
Out of the unitary management fee, the Investment Adviser pays substantially all expenses of the Fund, including the cost of transfer agency, custody, fund administration, legal, audit, independent trustees and other services, except for interest expenses, distribution fees or expenses, brokerage expenses, taxes and extraordinary expenses such as litigation and other expenses not incurred in the ordinary course of the Fund’s business. The Adviser’s unitary management fee is designed pay substantially all of the Fund's expenses and to compensate the Adviser for providing services for the Fund.
ALPS Fund Services, Inc., an affiliate of the Adviser, is the administrator of the Fund.
Each Trustee who is not an officer or employee of the Adviser, any sub‐adviser or any of their affiliates (“Independent Trustees”) receives (1) a quarterly retainer of $5,000, (2) a per meeting fee for regularly scheduled meetings of $3,750, (3) $1,500 for any special meeting held outside of a regularly scheduled board meeting, and (4) reimbursement for all reasonable out‐of‐pocket expenses relating to attendance at meetings.
4. PURCHASES AND SALES OF SECURITIES
For the year ended November 30, 2016, the cost of purchases and proceeds from sales of common stock related to exercised written put options were as follows:
| Fund | | Purchases | | | Sales | |
| U.S. Equity High Volatility Put Write Index Fund | | $ | 40,520,951 | | | $ | 35,738,893 | |
Investment Transactions in U.S. Government Obligations for the period ended November 30, 2016 were as follows:
| Fund | | Purchases | | | Sales | |
| U.S. Equity High Volatility Put Write Index Fund | | $ | 42,676,875 | | | $ | 57,699,779 | |
U.S. Equity High Volatility Put Write Index Fund
| Notes to Financial Statements | November 30, 2016 |
5. CAPITAL SHARE TRANSACTIONS
Shares are created and redeemed by the Fund on a cash basis only in Creation Unit size aggregations of 100,000 Shares. Only broker‐dealers or large institutional investors with creation and redemption agreements called Authorized Participants (“AP”) are permitted to purchase or redeem Creation Units from the Fund.
U.S. Equity High Volatility Put Write Index Fund
| Additional Information | November 30, 2016 (Unaudited) |
PROXY VOTING RECORDS, POLICIES AND PROCEDURES
Information regarding how the Fund voted proxies relating to portfolio securities during the most recent 12‐month period ended June 30 and a description of the Fund’s proxy voting policies and procedures used in determining how to vote for proxies are available without charge on the Securities and Exchange Commission’s (“SEC”) website at www.sec.gov and upon request, by calling (toll‐free) 1‐866‐675‐2639.
PORTFOLIO HOLDINGS
The Trust is required to disclose, after its first and third fiscal quarters, the complete schedule of the Fund’s portfolio holdings with the SEC on Form N‐Q. Form N‐Q for the Fund will be available on the SEC’s website at www.sec.gov. The Fund’s Form N‐Q may also be reviewed and copied at the SEC’s Public Reference Room in Washington, D.C. and information on the operation of the Public Reference Room may be obtained by calling 1‐800‐SEC‐0330. The Fund’s Form N‐Q will be available without charge, upon request, by calling (toll‐free) 1‐866‐675‐2639 or by writing to ALPS ETF Trust at 1290 Broadway, Suite 1100, Denver, Colorado 80203.
LICENSING AGREEMENT
The U.S. Equity High Volatility Put Write Index Fund is not sponsored, endorsed, sold or promoted by NYSE Group, Inc. or its affiliates (“NYSE Group”). NYSE Group makes no representation or warranty regarding the advisability of investing in securities generally, in The U.S. Equity High Volatility Put Write Index Fund particularly, or the ability of the NYSE Arca U.S. Equity High Volatility Put Write IndexSMto track general stock market performance.
NYSE GROUP MAKES NO EXPRESS OR IMPLIED WARRANTIES, AND HEREBY EXPRESSLY DISCLAIMS ALL WARRANTIES OF MERCHANTABILITY OR FITNESS FOR A PARTICULAR PURPOSE WITH RESPECT TO THE NYSE ARCA U.S. EQUITY HIGH VOLATILITY PUT WRITE INDEXSMOR ANY DATA INCLUDED THEREIN. IN NO EVENT SHALL NYSE GROUP HAVE ANY LIABILITY FOR ANY SPECIAL, PUNITIVE, INDIRECT, OR CONSEQUENTIAL DAMAGES (INCLUDING LOSS OF PROFITS), EVEN IF NOTIFIED OF THE POSSIBLIITY OF SUCH DAMAGES.
The Adviser does not guarantee the accuracy and/or the completeness of the Underlying Index or any data included therein, and the Adviser shall have no liability for any errors, omissions or interruptions therein. The Adviser makes no warranty, express or implied, as to results to be obtained by the Fund, owners of the Shares of the Fund or any other person or entity from the use of the Underlying Index or any data included therein. The Adviser makes no express or implied warranties, and expressly disclaims all warranties of merchantability or fitness for a particular purpose or use with respect to the Underlying Index or any data included therein. Without limiting any of the foregoing, in no event shall the Adviser have any liability for any special, punitive, direct, indirect or consequential damages (including lost profits) arising out of matters relating to the use of the Underlying Index even if notified of the possibility of such damages.
U.S. Equity High Volatility Put Write Index Fund
Board Considerations Regarding Approval of Investment Advisory Agreement | November 30, 2016 (Unaudited) |
At an in‐person meeting held on June 6, 2016, the Board of Trustees of the Trust (the “Board” or the “Trustees”), including the Trustees who are not “interested persons” of the Trust within the meaning of the 1940 Act, as amended (the “Independent Trustees”), evaluated a proposal to approve the continuance of the Advisory Agreement between the Trust and ALPS Advisors, Inc. (the “Adviser”) with respect to the U.S. Equity High Volatility Put Write Index Fund (“HVPW” or “the Fund”). The Independent Trustees also met separately to consider the Advisory Agreement.
In evaluating the Investment Advisory Agreement with respect to HVPW, the Trustees considered various factors, including (i) the nature, extent and quality of the services provided by AAI with respect to the Fund under the Investment Advisory Agreement; (ii) the advisory fees and other expenses paid by the Fund compared to those of similar funds managed by other investment advisers; (iii) the costs of the services provided to the Fund by AAI and the profits realized by AAI and its affiliates from its relationship to the Fund; (iv) the extent to which economies of scale have been or would be realized if and as the assets of the Fund grow and whether fees reflect the economies of scale for the benefit of shareholders; and (v) any additional benefits and other considerations.
With respect to the nature, extent and quality of the services provided by AAI under the Investment Advisory Agreement, the Trustees considered and reviewed information concerning the services provided under the Investment Advisory Agreement, the investment parameters of the index of the Fund, financial information regarding AAI and its parent company, information describing AAI’s current organization and the background and experience of the persons responsible for the day‐to‐day management of the Fund.
The Trustees reviewed information on the performance of the Fund and its benchmark. The Trustees also evaluated the correlation and tracking error between the Fund’s underlying index and the Fund’s performance. Based on their review, the Trustees found that the nature and extent of services provided to the Fund under the Investment Advisory Agreements was appropriate and that the quality was satisfactory.
The Trustees noted that the advisory fee for the Fund was a unitary fee pursuant to which AAI assumes all expenses of the Fund (including the cost of transfer agency, custody, fund administration, legal, audit and other services) other than the payments under the Advisory Agreement, brokerage expenses, taxes, interest, litigation expenses and other extraordinary expenses.
With respect to advisory fee rates, the Trustees noted the following: The net advisory fee rate for the Funds is higher than the median of its Broadridge expense group. The Fund’s expense ratio, however, is HVPW, at the median of its respective Broadridge expense group.
The Trustees took into account, among other things, HVPW’s unique strategy relative to the peer group. The Trustees also took into consideration the Adviser’s ability to manage the fund directly, as well as the anticipated impact of the termination of the sub‐advisory agreement with HVPW’s sub‐adviser, Rich Investment Solutions, LLC on HVPW’s profitability to the Adviser.
Based on the foregoing, and the other information available to them, the Trustees concluded that the advisory fee rate for the Fund was reasonable under the circumstances and in light of the quality of the services provided.
The Trustees considered other benefits available to AAI because of its relationship with the Fund and concluded that the advisory fees were reasonable taking into account any such benefits.
The Trustees also considered with respect to the Fund the information provided by AAI about the costs and profitability of AAI with respect to the Fund. The Trustees reviewed and noted the relatively small sizes of the Fund and concluded that AAI was not realizing any economies of scale. The Trustees determined that they would continue to evaluate whether further economies of scale have been achieved on an ongoing basis.
In voting to renew the Investment Advisory Agreement, the Trustees concluded that the terms of the Investment Advisory Agreement are reasonable and fair in light of the services to be performed, the fees paid by certain other funds, expenses to be incurred and such other matters as the Trustees considered relevant in the exercise of their reasonable business judgment. The Trustees did not identify any single factor or group of factors as all important or controlling and considered all factors together.
U.S. Equity High Volatility Put Write Index Fund
| Trustees & Officers | November 30, 2016 (Unaudited) |
The general supervision of the duties performed by the Adviser for the Fund under the Investment Advisory Agreement is the responsibility of the Board of Trustees. The Trust currently has four Trustees. Three Trustees have no affiliation or business connection with the Adviser or any of its affiliated persons and do not own any stock or other securities issued by the Adviser. These are the “non‐interested” or “independent” Trustees (“Independent Trustees”). The other Trustee (the “Interested Trustee”) is affiliated with the Adviser.
The Independent Trustees of the Trust, their term of office and length of time served, their principal business occupations during the past five years, the number of portfolios in the Fund Complex overseen by each Independent Trustee, and other directorships, if any, held by the Trustee are shown below.
INDEPENDENT TRUSTEES
| Name, Address & Year of Birth* | Position(s) Held with Trust | Term of Office and Length of Time Served** | Principal Occupation(s) During Past 5 Years | Number of Portfolios in Fund Complex Overseen by Trustees*** | Other Directorships Held by Trustees |
Mary K. Anstine,
1940 | Trustee | Since March 2008 | Ms. Anstine was President/Chief Executive Officer of HealthONE Alliance, Denver, Colorado, and former Executive Vice President of First Interstate Bank of Denver. Ms. Anstine is also Trustee/ Director of AV Hunter Trust and Colorado Uplift Board. Ms. Anstine was formerly a Director of the Trust Bank of Colorado (later purchased and now known as Northern Trust Bank), HealthONE and Denver Area Council of the Boy Scouts of America and a member of the American Bankers Association Trust Executive Committee. | 44 | Ms. Anstine is a Trustee of ALPS Variable Investment Trust (10 funds); Financial Investors Trust (31 funds); Reaves Utility Income Fund (1 fund); and Westcore Trust (14 funds). |
Jeremy W. Deems,
1976 | Trustee | Since March 2008 | Mr. Deems is the Co‐Founder, Chief Compliance Officer and Chief Financial Officer of Green Alpha Advisors, LLC. Mr. Deems is Co‐Portfolio Manager of the Shelton Green Alpha Fund. Prior to joining Green Alpha Advisors, Mr. Deems was CFO and Treasurer of Forward Management, LLC, ReFlow Management Co., LLC, ReFlow Fund, LLC, a private investment fund, and Sutton Place Management, LLC, an administrative services company. | 46 | Mr. Deems is a Trustee of ALPS Variable Investment Trust (10 funds); Financial Investors Trust (31 funds); and Reaves Utility Income Fund (1 fund); Clough Funds Trust (1 fund) and Elevation ETF Trust (2 fund). |
Rick A. Pederson,
1952 | Trustee | Since March 2008 | Mr. Pederson is President, Foundation Properties, Inc. (a real estate investment management company), 1994 ‐ present; Advisory Board Member, Bow River Capital Partners (private equity management), 2003 ‐ present; Advisor, The Pauls Corporation (real estate investment management and development), 2008 ‐ present; Chairman, Ross Consulting Group (real estate consulting services) 1983 ‐ 2013; Advisory Board Member, Neenan Company (construction services) 2002 ‐ present; Board Member, Prosci Inc. (private business services) 2013 ‐ 2016; Board Member, Citywide Banks (Colorado community bank) 2014 ‐ present; Board Member, Strong‐Bridge Consulting (management consulting) 2015 ‐ present; Director, National Western Stock Show (not‐for‐profit organization); Director, Biennial of the Americas (not‐for‐profit‐organization), 2012 ‐ 2015; Board Member, History Colorado, 2015 - present. | 22 | Mr. Pederson is Trustee of Westcore Trust (14 funds) and Principal Real Estate Income Fund (1 fund). |
| * | The business address of the Trustee is c/o ALPS Advisors, Inc., 1290 Broadway, Suite 1100, Denver, Colorado 80203. |
| ** | This is the period for which the Trustee began serving the Trust. Each Trustee serves an indefinite term, until his successor is elected. |
| *** | The Fund Complex includes all series of the Trust and any other investment companies for which ALPS Advisors, Inc. provides investment advisory services. |
U.S. Equity High Volatility Put Write Index Fund
| Trustees & Officers | November 30, 2016 (Unaudited) |
The Trustee who is affiliated with the Adviser or affiliates of the Adviser and executive officers of the Trust, his term of office and length of time served, his principal business occupations during the past five years, the number of portfolios in the Fund Complex overseen by the Interested Trustee and the other directorships, if any, held by the Trustee, are shown below.
Interested TRUSTEE
| Name, Address and Year of Birth of Interested Trustee* | Position(s) Held with Trust | Term of Office and Length of Time Served** | Principal Occupation(s) During Past 5 Years | Number of Portfolios in Fund Complex Overseen by Trustees*** | Other Directorships Held by Trustees |
Thomas A. Carter,
1966 | Trustee and President | Since March 2008 | Mr. Carter joined ALPS Fund Services, Inc. (“ALPS”) in 1994 and is currently President and Director of ALPS Advisors, Inc. (“AAI”) and ALPS Portfolio Solutions Distributor, Inc. (“APSD”) and Executive Vice President and Director of ALPS and ALPS Holdings, Inc. (“AHI”) and ALPS Distributors, Inc. (“ADI”). Because of his position with AHI, ALPS, ADI, APSD and AAI, Mr. Carter is deemed an affiliate of the Fund as defined under the 1940 Act. Before joining ALPS, Mr. Carter was with Deloitte & Touche LLP, where he worked with a diverse group of clients, primarily within the financial services industry. Mr. Carter is a Certified Public Accountant and received his Bachelor of Science in Accounting from the University of Colorado at Boulder. | 33 | Mr. Carter is a Trustee of ALPS Variable Investment Trust (10 funds); Principal Real Estate Income Fund (1 fund); and RiverNorth Opportunities Fund, Inc. (1 fund). |
| * | The business address of the Trustee is c/o ALPS Advisors, Inc., 1290 Broadway, Suite 1100, Denver, Colorado 80203. |
| ** | This is the period for which the Trustee began serving the Trust. Each Trustee serves an indefinite term, until his successor is elected. |
| *** | The Fund Complex includes all series of the Trust and any other investment companies for which ALPS Advisors, Inc. provides investment advisory services. |
U.S. Equity High Volatility Put Write Index Fund
| Trustees & Officers | November 30, 2016 (Unaudited) |
| Name, Address and Year of Birth of Officer* | Position(s) Held with Trust | Length of Time Served** | Principal Occupation(s) During Past 5 Years |
Erin D. Nelson, 1977 | Chief Compliance Officer (“CCO”) | Since December 2015 | Erin Nelson became Senior Vice‐President and Chief Compliance Officer of ALPS Advisors, Inc. (“AAI”) on July 1, 2015 and prior to that served as Vice President and Deputy Chief Compliance Officer of AAI since January 1, 2015. Prior to January 1, 2015, Ms. Nelson was Vice‐President and Assistant General Counsel of ALPS Fund Services, Inc. Because of her position with AAI, Ms. Nelson is deemed an affiliate of the Trust as defined under the 1940 Act. Ms. Nelson is also the CCO of ALPS Variable Investment Trust, Liberty All‐Star Growth Fund, Inc., Liberty All‐ Star Equity Fund, Principal Real Estate Income Fund, and RiverNorth Opportunities Fund, Inc. |
Patrick D. Buchanan, 1972 | Treasurer | Since June 2012 | Mr. Buchanan is Vice President of AAI. Mr. Buchanan joined ALPS in 2007 and because of his position with AAI, he is deemed an affiliate of the Trust as defined under the 1940 Act. Mr. Buchanan is also Treasurer of the ALPS Variable Insurance Trust, Principal Real Estate Income Fund, Clough Funds Trust and RiverNorth Opportunities Fund, Inc. |
Andrew P. Meloni, 1969 | Assistant Treasurer | Since December 2016 | Mr. Meloni is a Fund Controller for ALPS Fund Services, Inc. Mr. Meloni joined ALPS in 2007 and because of his position with ALPS, he is deemed an affiliate of the Fund as defined under the 1940 Act. Mr. Meloni is also Assistant Treasurer to the Liberty All‐Star Equity Fund, Liberty All‐Star Growth Fund, Inc., Principal Real Estate Income Fund, RiverNorth Opportunities Fund, Inc. and ALPS Variable Investment Trust. |
Abigail J. Murray, 1975 | Secretary | Since June 2015 | Ms. Murray joined ALPS in April 2015. She is currently Vice President and Senior Counsel of ALPS. Prior to joining ALPS, Ms. Murray was an Attorney and Managing Member at Murray & Rouvina PLC from 2014 to 2015 and an Associate with Vedder Price P.C. from 2007 to 2014. Ms. Murray is also the Secretary of Clough Global Allocation Fund, Clough Global Equity Fund, Clough Global Opportunities Fund, Clough Funds Trust, The Caldwell & Orkin Funds, Inc. and RiverNorth Opportunities Fund, Inc. and Assistant Secretary of Elevation ETF Trust and Principal Real Estate Income Fund. |
Andrea E. Kuchli, 1985 | Assistant Secretary | Since December 2015 | Ms. Kuchli joined ALPS in 2015 and is currently Vice President and Senior Counsel of ALPS. Prior to joining ALPS, Ms. Kuchli was an Associate with Davis Graham & Stubbs LLP from April 2014 to February 2015, and an Associate with Dechert LLP from 2011 to April 2014. Because of her position with ALPS, Ms. Kuchli is deemed an affiliate of the Trust as defined under the 1940 Act. Ms. Kuchli is also Secretary of Elevation ETF Trust and Principal Real Estate Income Fund as well as Assistant Secretary of the James Advantage Funds and RiverNorth Opportunities Fund, Inc. |
Sharon Akselrod, 1974 | Assistant Secretary | Since December 2016 | Ms. Akselrod joined ALPS in August 2014 and is currently Senior Investment Company Act Paralegal of ALPS Fund Services, Inc. Prior to joining ALPS, Ms. Akselrod served as Corporate Governance and Regulatory Associate for Nordstrom fsb (2013‐2014) and Senior Legal Assistant – Legal Manager for AXA Equitable Life Insurance Company (2008‐2013). Because of her position with ALPS, Ms. Akselrod is deemed an affiliate of the Trust as defined under the 1940 Act. Ms. Akselrod is also Assistant Secretary of Financial Investors Trust. |
| * | The business address of each Officer is c/o ALPS Advisors, Inc., 1290 Broadway, Suite 1100, Denver, Colorado 80203. |
| ** | This is the period for which the Officer began serving the Trust. Each Officer serves an indefinite term, until his/her successor is elected. |
The Statement of Additional Information includes additional information about the Fund's Trustees and is available, without charge, upon request by calling (toll-free) 1-855-325-8020.

| Performance Overview | |
| RiverFront Dynamic Core Income ETF | 1 |
| RiverFront Dynamic Unconstrained Income ETF | 3 |
| RiverFront Dynamic US Dividend Advantage ETF | 5 |
| RiverFront Dynamic US Flex-Cap ETF | 8 |
| RiverFront Strategic Income Fund | 11 |
| Disclosure of Fund Expenses | 13 |
| Report of Independent Registered Public Accounting Firm | 14 |
| Financial Statements | |
| Schedule of Investments | |
| RiverFront Dynamic Core Income ETF | 15 |
| RiverFront Dynamic Unconstrained Income ETF | 16 |
| RiverFront Dynamic US Dividend Advantage ETF | 18 |
| RiverFront Dynamic US Flex-Cap ETF | 20 |
| RiverFront Strategic Income Fund | 23 |
| Statements of Assets and Liabilities | 25 |
| Statements of Operations | 26 |
| Statements of Changes in Net Assets | |
| RiverFront Dynamic Core Income ETF | 27 |
| RiverFront Dynamic Unconstrained Income ETF | 28 |
| RiverFront Dynamic US Dividend Advantage ETF | 29 |
| RiverFront Dynamic US Flex-Cap ETF | 30 |
| RiverFront Strategic Income Fund | 31 |
| Financial Highlights | 32 |
| Notes to Financial Statements | 37 |
| Additional Information | 44 |
| Board Consideratons Regarding Approval of Investment Advisory Agreement and Investment Sub-Advisory Agreements | 45 |
| Trustees & Officers | 48 |
alpsfunds.com
RiverFront Dynamic Core Income ETF
| Performance Overview | November 30, 2016 (Unaudited) |
Investment Objective
RiverFront Dynamic Core Income ETF (the “Fund”) seeks total return, with an emphasis on income as the source of that total return. The Fund seeks to achieve its investment objective by investing in a global portfolio of fixed income securities of various maturities, ratings and currency denominations.
Performance Overview
The Fund outperformed its benchmark by 0.36% from its inception date through 11/30/16, based on its return at market. Although it outperformed its benchmark, returns were negative as sharply rising interest rates provided a challenging environment for fixed income assets. The primary sources of the outperformance were the Fund’s strategy of assuming credit risk and limiting interest rate risk, driven by RiverFront’s Price Matters® asset allocation framework, which seeks to optimize returns while limiting downside risk. Over the time period the Fund was primarily invested in investment grade corporate bonds, but also held a small percentage in non-investment grade corporate bonds. The average credit quality of the Fund was approximately BBB+ rated, compared to AA rated for its benchmark. The credit strategy positively contributed to performance as risk premiums on lower quality, investment grade rated bonds tightened more than those on higher quality bonds over the time period. For example, spreads on the BofA Merrill Lynch BBB U.S. Corporate Index narrowed 34 basis points over this time period, offsetting some of the raise in interest rates over the same time period. The average duration of the Fund was marginally less than its benchmark over the time period. Interest rates rose significantly during the time period, with the 10-year Treasury yield up almost 80 basis points.
Performance (as of November 30, 2016)
| | Since Inception^ |
| RiverFront Dynamic Core Income ETF – NAV | -1.77% |
| RiverFront Dynamic Core Income ETF – Market Price* | -1.61% |
| Bloomberg Barclays U.S. Aggregate Bond Total Return Index | -1.97% |
Total Expense Ratio (per the current prospectus) 0.51%.
Performance data quoted represents past performance. Past performance does not guarantee future results. The table does not reflect the deduction of taxes that a shareholder would pay on Fund distributions or the redemption of Fund shares. Investment return and principal value of an investment will fluctuate so that an investor’s shares, when sold or redeemed, may be worth more or less than the original cost. Current performance data may be higher or lower than actual data quoted. For the most current month-end performance data please visit www.alpsfunds.com or call 1.866.759.5679.
NAV is an exchange-traded fund’s per-share value. The per-share dollar amount of the fund is derived by dividing the total value of all the securities in its portfolio, less any liabilities, by the number of fund shares outstanding. Market Price is the price at which a share can currently be traded in the market. Information detailing the number of days the Market Price of the Fund was greater than the Fund’s NAV and the number of days it was less than the Fund’s NAV can be obtained at www.alpsfunds.com.
| ^ | The Fund commenced operations on June 14, 2016. Total return for a period of less than one year is not annualized. |
| * | Market Price is based on the midpoint of the bid-ask spread at 4 p.m. ET and does not represent the returns an investor would receive if shares were traded at other times. |
The Fund is new with limited operating history.
Bloomberg Barclays U.S. Aggregate Bond Index is a broad-based benchmark that measures the investment grade, U.S. dollar-denominated, fixed-rate taxable bond market, including Treasuries, government-related and corporate securities, MBS (agency fixed-rate and hybrid ARM pass-throughs), ABS, and CMBS (agency and non-agency). The index is reported on a total return basis, which assumes reinvestment of any dividends and distributions realized during a given time period. The index is not actively managed and does not reflect any deductions for fees, expenses or taxes. One cannot invest directly in an index. Index performance does not reflect fund performance.
The RiverFront Dynamic Core Income ETF is not suitable for all investors. Investments in the Fund are subject to investment risks, including possible loss of the principal amount invested.
The Fund’s shares are not individually redeemable. Investors buy and sell shares of the Fund on a secondary market. Only market makers or “authorized participants” may trade directly with the Fund, typically in blocks of 50,000 shares.
ALPS Portfolio Solutions Distributor, Inc., a FINRA member, is the Distributor for the RiverFront Dynamic Core Income ETF.
RiverFront Dynamic Core Income ETF
| Performance Overview | November 30, 2016 (Unaudited) |
Top 10 Holdings* (as of November 30, 2016)
| Verizon Communications, Inc., Sr. Unsec. | 4.65% |
| Flextronics International Ltd., Sr. Unsec. | 4.62% |
| PepsiCo, Inc., Sr. Unsec. | 4.53% |
| Morgan Stanley, Sr. Unsec. | 4.50% |
| CIT Group, Inc., Sr. Unsec. | 4.50% |
| Charter Communications Operating LLC | 4.43% |
| United States Treasury Inflation Indexed Bonds | 4.43% |
| Actavis Funding SCS, Sr. Unsec. | 4.41% |
| Kinder Morgan, Inc., Sr. Unsec. | 4.39% |
| The Goldman Sachs Group, Inc., Sr. Unsec. | 4.37% |
| Total% of Top 10 Holdings | 44.83% |
Future holdings are subject to change.
Asset Allocation* (as of November 30, 2016)
Growth of $10,000 (as of November 30, 2016)
Comparison of Change in Value of $10,000 Investment in the Fund and the Fund’s benchmark
The chart above represents historical performance of a hypothetical investment of $10,000 in the Fund over the life of the Fund. Past performance does not guarantee future results. This chart does not reflect the deduction of taxes that a shareholder would pay on Fund distributions or the redemption of Fund shares.
RiverFront Dynamic Unconstrained Income ETF
| Performance Overview | November 30, 2016 (Unaudited) |
Investment Objective
RiverFront Dynamic Unconstrained Income ETF (the “Fund”) seeks total return, with an emphasis on income as the source of that total return. The Fund seeks to achieve its investment objective by investing in a global portfolio of fixed income securities of various maturities, ratings and currency denominations.
Performance Overview
The Fund underperformed its benchmark by 1.17% from its inception through 11/30/16, based on its return at market. The Fund performed well on an absolute basis however, returning 4.64%. The Fund was primarily invested in high yield bonds over the period, driven by RiverFront’s Price Matters® asset allocation framework, which seeks to optimize returns while limiting downside risk. The average credit quality of the Fund was approximately BB- rated, compared to B+ rated for its benchmark. The credit strategy positively contributed to performance as risk premiums on lower rated bonds tightened significantly more than those on higher quality bonds over the course of the year. For example, spreads on the BofA Merrill Lynch U.S. High Yield Index narrowed 140 basis points over this time period, leading to meaningful price appreciation in addition to significant income. The primary reason for the Fund’s underperformance versus its benchmark was a higher average credit quality due to a lower weighting in the lowest rated (CCC) bonds, which had significantly higher returns (11%) than BB and B rated bonds.
Performance (as of November 30, 2016)
| | Since Inception^ |
| RiverFront Dynamic Unconstrained Income ETF – NAV | 4.72% |
| RiverFront Dynamic Unconstrained Income ETF – Market Price* | 4.64% |
| BofA Merrill Lynch U.S. High Yield Master II Total Return Index | 5.81% |
Total Expense Ratio (per the current prospectus) 0.51%.
Performance data quoted represents past performance. Past performance does not guarantee future results. The table does not reflect the deduction of taxes that a shareholder would pay on Fund distributions or the redemption of Fund shares. Investment return and principal value of an investment will fluctuate so that an investor’s shares, when sold or redeemed, may be worth more or less than the original cost. Current performance data may be higher or lower than actual data quoted. For the most current month-end performance data please visit www.alpsfunds.com or call 1.866.759.5679.
NAV is an exchange-traded fund’s per-share value. The per-share dollar amount of the fund is derived by dividing the total value of all the securities in its portfolio, less any liabilities, by the number of fund shares outstanding. Market Price is the price at which a share can currently be traded in the market. Information detailing the number of days the Market Price of the Fund was greater than the Fund’s NAV and the number of days it was less than the Fund’s NAV can be obtained at www.alpsfunds.com.
| ^ | The Fund commenced operations on June 14, 2016. Total return for a period of less than one year is not annualized. |
| * | Market Price is based on the midpoint of the bid-ask spread at 4 p.m. ET and does not represent the returns an investor would receive if shares were traded at other times. |
The Fund is new with limited operating history.
BofA Merrill Lynch U.S. High Yield Master II Index tracks the performance of below-investment grade U.S. dollar-denominated corporate bonds issued in the U.S. Domestic market. The index is reported on a total return basis, which assumes reinvestment of any dividends and distributions realized during a given time period. The index is not actively managed and does not reflect any deductions for fees, expenses or taxes. One cannot invest directly in an index. Index performance does not reflect fund performance.
The RiverFront Dynamic Unconstrained Income ETF is not suitable for all investors. Investments in the Fund are subject to investment risks, including possible loss of the principal amount invested.
The Fund’s shares are not individually redeemable. Investors buy and sell shares of the Fund on a secondary market. Only market makers or “authorized participants” may trade directly with the Fund, typically in blocks of 50,000 shares.
ALPS Portfolio Solutions Distributor, Inc., a FINRA member, is the Distributor for the RiverFront Dynamic Unconstrained Income ETF.
RiverFront Dynamic Unconstrained Income ETF
| Performance Overview | November 30, 2016 (Unaudited) |
Top 10 Holdings* (as of November 30, 2016)
| Teck Resources Ltd., Sr. Unsec. | 3.42% |
| ArcelorMittal, Sr. Unsec. | 3.37% |
| United States Steel Corp., First Lien | 3.30% |
| Sprint Communications, Inc., Sr. Unsec. | 3.28% |
| AK Steel Corp., First Lien | 3.25% |
| ADT Corp., First Lien | 3.23% |
| International Game Technology PLC, First Lien | 3.18% |
| Smithfield Foods, Inc., Sr. Unsec. | 3.16% |
| T-Mobile USA, Inc., Sr. Unsec. | 3.12% |
| TreeHouse Foods, Inc., Sr. Unsec. | 3.11% |
| Total % of Top 10 Holdings | 32.42% |
Future holdings are subject to change.
Asset Allocation* (as of November 30, 2016)
Growth of $10,000 (as of November 30, 2016)
Comparison of Change in Value of $10,000 Investment in the Fund and the Fund’s benchmark
The chart above represents historical performance of a hypothetical investment of $10,000 in the Fund over the life of the Fund. Past performance does not guarantee future results. This chart does not reflect the deduction of taxes that a shareholder would pay on Fund distributions or the redemption of Fund shares.
RiverFront Dynamic US Dividend Advantage ETF
| Performance Overview | November 30, 2016 (Unaudited) |
Investment Objective
RiverFront Dynamic US Dividend Advantage ETF (the “Fund”) seeks to provide capital appreciation and dividend income. The Fund seeks to achieve its investment objective by investing at least 65% of its net assets in a portfolio of equity securities of publicly traded U.S. companies with the potential for dividend growth. Equity securities include common stocks and common or preferred shares of real estate investment trusts (“REITs”).
Performance Overview
2016 occurred under the storm clouds of Brexit, the U.S. presidential election, and major central banks adjusting their policies to accommodate the ever-changing needs of global markets. However, resilient U.S. markets brushed off initial concerns of a global slowdown to produce reasonable returns for the year.
2016 Performance Attribution
The Fund beat its benchmark for the year ended 11/30/16. The source of its returns largely came from two components: sector allocation and security selection.
| 1. | Sector Allocation: The sector allocations in the Fund are determined through a bottoms-up process that ranks stocks on three fundamental cornerstones: value, quality and momentum/sentiment. If a sector produces more highly ranked stocks relative to another sector, that sector’s allocation is allowed to exceed its benchmark by a tolerable level, and vice versa. Sector allocation was a positive contributor for the Fund. |
| a. | Positive contributors: Underweighting interest rate sensitive sectors like REITs and utilities added value for the Fund, as did overweights to more cyclical sectors like technology. |
| b. | Negative contributors: The Fund was hurt from underweights to energy and financials, both of which had significant snap-backs in the 3rd and 4th quarters. An overweight to telecommunication services also had a negative impact on the Fund. |
| 2. | Security Selection: The investment selection process behind the Fund is built on making a number of small bets in the portfolio and avoiding the larger bets that many smart beta products rely on. This means that there are rarely just one or two things contributing to the returns. In 2016, RiverFront’s equity selection posted positive results in aggregate and was diversified across many areas. A few of the top themes that contributed most to performance in the year were: |
| a. | Positive contributors: The Fund had positive security selection experiences in Technology, Healthcare, Consumer Staples, Materials and REITs. The Fund also had positive security selection in Consumer Discretionary. |
| b. | Negative contributors: The Fund had negative security selection results in Financials, Industrials, Telecommunications and Energy. |
2017 Outlook:
If 2016 was the “year of uncertainty”, we believe 2017 could be the “year of greater clarity”. In 2017, with the U.S. presidential race decided, we believe we will see a clearer timeline and better understand the implications of Brexit, another Fed rate hike likely to be behind us, and further information on OPEC production guidelines. We believe that the market values clarity higher than it values uncertainty, even when clarity comes with some disappointments. With clarity, we believe the market can quickly assess the news, adjust valuations and take the necessary steps to move on, something that is impossible when there are many unknowns. In fact, if one could simply set aside the distractions caused by these unknowns, one would, in our view, see that today we have a stronger economic environment, improving corporate earnings, and a slowly recovering employment picture around the world. For these reasons we remain constructive on U.S. equities in 2017.
In 2017, we anticipate a transition of leadership from equity strategies that favor broad market exposure to those that favor more selective exposure. Historically, this has been a normal transition that occurs as a bull market matures. Essentially, in the early stages of a bull market, “the rising tide lifts all boats,” making investment strategies that emphasis broad indexes, like the S&P 500, difficult to beat. We believe this stage of the current bull market was extended several years beyond normal by three successive quantitative easing (QE) programs that created an abnormally high tide. As we enter the ninth year of this bull market and money printing is becoming a more distant memory, we believe the baton of investment success will be passed to more selective strategies that differentiate among sectors, industries and stocks.
RiverFront Dynamic US Dividend Advantage ETF
| Performance Overview | November 30, 2016 (Unaudited) |
Performance (as of November 30, 2016)
| | Since Inception^ |
| RiverFront Dynamic US Dividend Advantage ETF – NAV | 6.64% |
| RiverFront Dynamic US Dividend Advantage ETF – Market Price* | 6.72% |
S&P 500® Total Return Index | 5.35% |
Total Expense Ratio (per the current prospectus) 0.52%.
Performance data quoted represents past performance. Past performance does not guarantee future results. The table does not reflect the deduction of taxes that a shareholder would pay on Fund distributions or the redemption of Fund shares. Investment return and principal value of an investment will fluctuate so that an investor’s shares, when sold or redeemed, may be worth more or less than the original cost. Current performance data may be higher or lower than actual data quoted. For the most current month-end performance data please visit www.alpsfunds.com or call 1.866.759.5679.
NAV is an exchange-traded fund’s per-share value. The per-share dollar amount of the fund is derived by dividing the total value of all the securities in its portfolio, less any liabilities, by the number of fund shares outstanding. Market Price is the price at which a share can currently be traded in the market. Information detailing the number of days the Market Price of the Fund was greater than the Fund’s NAV and the number of days it was less than the Fund’s NAV can be obtained at www.alpsfunds.com.
| ^ | The Fund commenced operations on June 7, 2016. Total return for a period of less than one year is not annualized. |
| * | Market Price is based on the midpoint of the bid-ask spread at 4 p.m. ET and does not represent the returns an investor would receive if shares were traded at other times. |
The Fund is new with limited operating history.
S&P 500® Index is the Standard & Poor’s composite index of 500 stocks, a widely recognized, unmanaged index of common stock prices. The index is reported on a total return basis, which assumes reinvestment of any dividends and distributions realized during a given time period. The index is not actively managed and does not reflect any deductions for fees, expenses or taxes. One cannot invest directly in an index. Index performance does not reflect fund performance.
The RiverFront Dynamic US Dividend Advantage ETF is not suitable for all investors. Investments in the Fund are subject to investment risks, including possible loss of the principal amount invested.
The Fund’s shares are not individually redeemable. Investors buy and sell shares of the Fund on a secondary market. Only market makers or “authorized participants” may trade directly with the Fund, typically in blocks of 50,000 shares.
ALPS Portfolio Solutions Distributor, Inc., a FINRA member, is the Distributor for the RiverFront Dynamic US Dividend Advantage ETF.
RiverFront Dynamic US Dividend Advantage ETF
| Performance Overview | November 30, 2016 (Unaudited) |
Top 10 Holdings* (as of November 30, 2016)
| Intel Corp. | 2.39% |
| Anthem, Inc. | 2.29% |
| Exxon Mobil Corp. | 2.08% |
| Pfizer, Inc. | 2.01% |
| Apple, Inc. | 1.94% |
| International Business Machines Corp. | 1.94% |
| Altria Group, Inc. | 1.87% |
| Honeywell International, Inc. | 1.65% |
| Facebook, Inc., Class A | 1.61% |
| Berkshire Hathaway, Inc., Class B | 1.59% |
| Total % of Top 10 Holdings | 19.37% |
Future holdings are subject to change.
Asset Allocation* (as of November 30, 2016)
Growth of $10,000 (as of November 30, 2016)
Comparison of Change in Value of $10,000 Investment in the Fund and the Fund’s benchmark
The chart above represents historical performance of a hypothetical investment of $10,000 in the Fund over the life of the Fund. Past performance does not guarantee future results. This chart does not reflect the deduction of taxes that a shareholder would pay on Fund distributions or the redemption of Fund shares.
| RiverFront Dynamic US Flex-Cap ETF |
| Performance Overview | November 30, 2016 (Unaudited) |
Investment Objective
RiverFront Dynamic US Flex‐Cap ETF (the “Fund”) seeks to provide capital appreciation. The Fund seeks to achieve its investment objective by investing at least 65% of its net assets in a portfolio of equity securities of publicly traded U.S. companies. Equity securities include common stocks and common or preferred shares of real estate investment trusts (“REITs”).
Performance Overview
2016 occurred under the storm clouds of Brexit, the U.S. presidential election, and major central banks adjusting their policies to accommodate the ever‐changing needs of global markets. However, resilient U.S. markets brushed off initial concerns of a global slowdown to produce reasonable returns for the year.
2016 Performance Attribution
The Fund beat its benchmark for the year ended 11/30/16. The source of its returns largely came from two components: sector allocation and security selection.
| 1. | Sector Allocation: The sector allocations in the Fund are determined through a bottoms‐up process that ranks stocks on three fundamental cornerstones: value, quality and momentum/sentiment. If a sector produces more highly ranked stocks relative to another sector, that sector’s allocation is allowed to exceed its benchmark by a tolerable level, and vice versa. Sector allocation was a positive contributor for the Fund. |
| a. | Positive contributors: Underweighting interest rate sensitive sectors like REITs and utilities added value for the Fund, as did overweights to more cyclical sectors like consumer discretionary and industrials. |
| b. | Negative contributors: The Fund was hurt from underweights to energy and financials, both of which had significant snap‐backs in the 3rd and 4th quarters. |
| 2. | Security Selection: The investment selection process behind the Fund is built on making a number of small bets in the portfolio and avoiding the larger bets that many smart beta products rely on. This means that there are rarely just one or two things contributing to the returns. In 2016, RiverFront’s equity selection posted positive results in aggregate and was diversified across many areas. A few of the top themes that contributed most to performance in the year were: |
| a. | Positive contributors: The Fund had positive security selection experiences in Technology, Healthcare, Consumer Staples, Materials and REITs. |
| b. | Negative contributors: The Fund had negative security selection results in Financials, Industrials, Telecommunications, Energy and Consumer Discretionary. |
2017 Outlook:
If 2016 was the “year of uncertainty”, we believe 2017 could be the “year of greater clarity”. In 2017, with the U.S. presidential race decided, we believe we will see a clearer timeline and better understand the implications of Brexit, another Fed rate hike likely to be behind us, and further information on OPEC production guidelines. We believe that the market values clarity higher than it values uncertainty, even when clarity comes with some disappointments. With clarity, we believe the market can quickly assess the news, adjust valuations and take the necessary steps to move on, something that is impossible when there are many unknowns. In fact, if one could simply set aside the distractions caused by these unknowns, one would, in our view, see that today we have a stronger economic environment, improving corporate earnings, and a slowly recovering employment picture around the world. For these reasons we remain constructive on U.S. equities in 2017.
In 2017, we anticipate a transition of leadership from equity strategies that favor broad market exposure to those that favor more selective exposure. Historically, this has been a normal transition that occurs as a bull market matures. Essentially, in the early stages of a bull market, “the rising tide lifts all boats,” making investment strategies that emphasis broad indexes, like the S&P 500, difficult to beat. We believe this stage of the current bull market was extended several years beyond normal by three successive quantitative easing (QE) programs that created an abnormally high tide. As we enter the ninth year of this bull market and money printing is becoming a more distant memory, we believe the baton of investment success will be passed to more selective strategies that differentiate among sectors, industries and stocks.
| RiverFront Dynamic US Flex-Cap ETF |
| Performance Overview | November 30, 2016 (Unaudited) |
Performance (as of November 30, 2016)
| | Since Inception^ |
| RiverFront Dynamic US Flex‐Cap ETF – NAV | 7.45% |
| RiverFront Dynamic US Flex‐Cap ETF – Market Price* | 7.53% |
S&P Composite 1500® Total Return Index | 5.84% |
Total Expense Ratio (per the current prospectus) 0.52%.
Performance data quoted represents past performance. Past performance does not guarantee future results. The table does not reflect the deduction of taxes that a shareholder would pay on Fund distributions or the redemption of Fund shares. Investment return and principal value of an investment will fluctuate so that an investor’s shares, when sold or redeemed, may be worth more or less than the original cost. Current performance data may be higher or lower than actual data quoted. For the most current month-end performance data please visit www.alpsfunds.com or call 1.866.759.5679.
NAV is an exchange-traded fund’s per-share value. The per-share dollar amount of the fund is derived by dividing the total value of all the securities in its portfolio, less any liabilities, by the number of fund shares outstanding. Market Price is the price at which a share can currently be traded in the market. Information detailing the number of days the Market Price of the Fund was greater than the Fund’s NAV and the number of days it was less than the Fund’s NAV can be obtained at www.alpsfunds.com.
| ^ | The Fund commenced operations on June 7, 2016. Total return for a period of less than one year is not annualized. |
| * | Market Price is based on the midpoint of the bid-ask spread at 4 p.m. ET and does not represent the returns an investor would receive if shares were traded at other times. |
The Fund is new with limited operating history.
S&P Composite 1500®Index is the Standard & Poor’s broad-based unmanaged capitalization-weighted index comprising 1,500 stocks of Large-cap, Mid-cap, and Small-cap U.S. companies. The index is reported on a total return basis, which assumes reinvestment of any dividends and distributions realized during a given time period. The index is not actively managed and does not reflect any deductions for fees, expenses or taxes. One cannot invest directly in an index. Index performance does not reflect fund performance.
The RiverFront Dynamic US Flex-Cap ETF is not suitable for all investors. Investments in the Fund are subject to investment risks, including possible loss of the principal amount invested.
The Fund’s shares are not individually redeemable. Investors buy and sell shares of the Fund on a secondary market. Only market makers or “authorized participants” may trade directly with the Fund, typically in blocks of 50,000 shares.
ALPS Portfolio Solutions Distributor, Inc., a FINRA member, is the Distributor for the RiverFront Dynamic US Flex-Cap ETF.
| RiverFront Dynamic US Flex-Cap ETF |
| Performance Overview | November 30, 2016 (Unaudited) |
Top 10 Holdings*(as of November 30, 2016)
| Alphabet, Inc., Class A & C | 4.45% |
| Facebook, Inc., Class A | 2.14% |
| Intel Corp. | 1.92% |
| Ingram Micro, Inc., Class A | 1.75% |
| International Business Machines Corp. | 1.66% |
| Altria Group, Inc. | 1.59% |
| Amazon.com, Inc. | 1.56% |
| Starbucks Corp. | 1.55% |
| Cognizant Technology Solutions Corp., Class A | 1.54% |
| Apple, Inc. | 1.47% |
| Total % of Top 10 Holdings | 19.63% |
Asset Allocation* (as of November 30, 2016)
Future holdings are subject to change.
Growth of $10,000 (as of November 30, 2016)
Comparison of Change in Value of $10,000 Investment in the Fund and the Fund’s benchmark
The chart above represents historical performance of a hypothetical investment of $10,000 in the Fund over the life of the Fund. Past performance does not guarantee future results. This chart does not reflect the deduction of taxes that a shareholder would pay on Fund distributions or the redemption of Fund shares.
| RiverFront Strategic Income Fund | |
| Performance Overview | November 30, 2016 (Unaudited) |
Investment Objective
The RiverFront Strategic Income Fund (the “Fund”) seeks total return, with an emphasis on income as the source of that total return. The Fund seeks to achieve its investment objective by investing in a global portfolio of fixed income securities of various maturities, ratings and currency denominations. The Fund intends to utilize various investment strategies in a broad array of fixed income sectors.
Performance Overview
The Fund outperformed its benchmark by 5.08% in the one year period ended 11/30/16, based on its return at market. The primary source of the outperformance was the Fund’s strategy of assuming shorter‐term credit risk, driven by RiverFront’s Price Matters® asset allocation framework, which seeks to optimize returns while limiting downside risk. Over the course of the year the Fund was primarily invested in shorter‐maturity, higher quality, below investment grade rated bonds. The average credit quality of the Fund was approximately BB‐rated, compared to AA‐rated for its benchmark. The credit strategy positively contributed to performance as risk premiums on lower rated bonds tightened significantly more than those on higher quality bonds over the course of the year. For example, spreads on the BofA Merrill Lynch 1‐5 Year BB U.S. High Yield Index narrowed 129 basis points over this time period, leading to meaningful price appreciation in addition to significant income. The duration of the Fund averaged around 3 years compared to almost 6 years for its benchmark.
Performance (as of November 30, 2016)
| | 1 Year | 3 Year | Since Inception^ |
| RiverFront Strategic Income Fund – NAV | 7.38% | 4.00% | 4.49% |
| RiverFront Strategic Income Fund – Market Price* | 7.25% | 3.80% | 4.46% |
| Bloomberg Barclays U.S. Aggregate Bond Total Return Index | 2.17% | 2.79% | 2.79% |
Total Expense Ratio (per the current prospectus) 0.46%. Net Expense Ratio (per the current prospectus) 0.16%. Net expense ratio reflects the Sub-Adviser’s decision to voluntarily waive its sub-advisory fee until at least March 31, 2018. Please see the prospectus for additional information.
Performance data quoted represents past performance. Past performance does not guarantee future results. The table does not reflect the deduction of taxes that a shareholder would pay on Fund distributions or the redemption of Fund shares. Investment return and principal value of an investment will fluctuate so that an investor’s shares, when sold or redeemed, may be worth more or less than the original cost. Current performance data may be higher or lower than actual data quoted. For most current month-end performance data please visit www.alpsfunds.com or call 1.866.759.5679.
NAV is an exchange-traded fund’s per-share value. The per-share dollar amount of the Fund is derived by dividing the total value of all the securities in its portfolio, less any liabilities, by the number of Fund shares outstanding. Market Price is the price at which a share can currently be traded in the market. Information detailing the number of days the Market Price of the Fund was greater than the Fund’s NAV and the number of days it was less than the Fund’s NAV can be obtained at www.alpsfunds.com.
| ^ | The Fund commenced Investment Operations on October 8, 2013. |
| * | Market Price is based on the midpoint of the bid/ask spread at 4 p.m. ET and does not represent the returns an investor would receive if shares were traded at other times |
Duration is a measure of the sensitivity of the price (the value of principal) of a fixed-income investment to a change in interest rates. Duration is expressed as a number of years. The duration number is a calculation involving present value, yield, coupon, final maturity and call features. The bigger the duration number, the greater the interest-rate risk or reward for bond prices. Rising interest rates mean falling bond prices, while declining interest rates mean rising bond prices.
Bloomberg Barclays U.S. Aggregate Bond Index is a broad-based benchmark that measures the investment grade, U.S. dollar-denominated, fixed-rate taxable bond market, including Treasuries, government-related and corporate securities, MBS (agency fixed-rate and hybrid ARM pass-throughs), ABS, and CMBS (agency and non-agency). The index is reported on a total return basis, which assumes reinvestment of any dividends and distributions realized during a given time period. The index is not actively managed and does not reflect any deductions for fees, expenses or taxes. One cannot invest directly in an index. Index performance does not reflect fund performance.
One cannot invest directly in an index. Index performance does not reflect fund performance.
The RiverFront Strategic Income Fund is not suitable for all investors. Investments in the Fund are subject to investment risks, including possible loss of the principal amount invested.
ALPS Portfolio Solutions Distributor, Inc., a FINRA member, is the distributor for the RiverFront Strategic Income Fund.
| RiverFront Strategic Income Fund | |
| Performance Overview | November 30, 2016 (Unaudited) |
Top 10 Holdings* (as of November 30, 2016)
| ADT Corp., First Lien | 3.19% |
| WESCO Distribution, Inc., Sr. Unsec. | 3.13% |
| T‐Mobile USA, Inc., Sr. Unsec. | 3.09% |
| Pinnacle Foods Finance LLC, Sr. Unsec. | 2.95% |
| Dollar Tree, Inc., Sr. Unsec. | 2.81% |
| CenturyLink, Inc., Sr. Unsec., Series V | 2.77% |
| Huntsman Intl LLC, Sr. Unsec. | 2.75% |
| Frontier Communications Corp., Sr. Unsec. | 2.72% |
| Goodyear Tire & Rubber Co., Sr. Unsec. | 2.68% |
| Ball Corp., Sr. Unsec. | 2.66% |
| Total % of Top 10 Holdings | 28.75% |
Asset Allocation* (as of November 30, 2016)
Future holdings are subject to change.
Growth of $10,000 (as of November 30, 2016)
Comparison of Change in Value of $10,000 Investment in the Fund and the Fund’s benchmark
The chart above represents historical performance of a hypothetical investment of $10,000 in the Fund over the life of the Fund. Past performance does not guarantee future results. This chart does not reflect the deduction of taxes that a shareholder would pay on Fund distributions or the redemption of Fund shares.
Disclosure of Fund Expenses | November 30, 2016 (Unaudited) |
Shareholder Expense Example: As a shareholder of a Fund, you incur two types of costs: (1) transaction costs which may include creation and redemption fees or brokerage charges, and (2) ongoing costs, including management fees and other Fund expenses. These examples are intended to help you understand your ongoing costs (in dollars) of investing in a Fund and to compare these costs with the ongoing costs of investing in other funds. It is based on an investment of $1,000 invested at the beginning of the (six month) period and held through November 30, 2016.
Actual Return: The first line of the table provides information about actual account values and actual expenses. You may use the information in this line, together with the amount you invested, to estimate the expenses that you incurred over the period. Simply divide your account value by $1,000 (for example, an $8,600 account value divided by $1,000 = 8.6), then multiply the result by the number in the first line under the heading entitled “Expenses Paid During Period” to estimate the expenses attributable to your investment during this period.
Hypothetical 5% Return: The second line of the table provides information about hypothetical account values and hypothetical expenses based on the Fund’s actual expense ratio and an assumed rate of return of 5% per year before expenses, which is not the Fund’s actual return. The hypothetical account values and expenses may not be used to estimate the actual ending account balance or expenses you paid for the period. You may use this information to compare ongoing costs of investing in the Fund and other funds. To do so, compare this 5% hypothetical example with the 5% hypothetical examples that appear in the shareholder reports of other funds.
The expenses shown in the table are meant to highlight ongoing Fund costs only and do not reflect any transaction costs, such as creation and redemption fees or brokerage charges. Therefore, the second line is useful in comparing ongoing costs only, and will not help you determine the relative total costs of owning different funds. In addition, if these costs were included, your costs would have been higher.
| | Beginning Account Value 6/1/16 | Ending Account Value 11/30/16 | Expense Ratio(a) | Expenses Paid During Period 6/1/16 - 11/30/16(b) |
| RiverFront Dynamic Core Income ETF | | | | |
Actual(c) | $1,000.00 | $982.30 | 0.51% | $2.35 |
Hypothetical (5% return before expenses) | $1,000.00 | $1,022.45 | 0.51% | $2.58 |
| RiverFront Dynamic Unconstrained Income ETF | | | | |
Actual(c) | $1,000.00 | $1,047.20 | 0.51% | $2.42 |
Hypothetical (5% return before expenses) | $1,000.00 | $1,022.45 | 0.51% | $2.58 |
| RiverFront Dynamic US Dividend Advantage ETF | | | | |
Actual(d) | $1,000.00 | $1,066.40 | 0.52% | $2.60 |
Hypothetical (5% return before expenses) | $1,000.00 | $1,022.40 | 0.52% | $2.63 |
| RiverFront Dynamic US Flex‐Cap ETF | | | | |
Actual(d) | $1,000.00 | $1,074.50 | 0.52% | $2.61 |
Hypothetical (5% return before expenses) | $1,000.00 | $1,022.40 | 0.52% | $2.63 |
| RiverFront Strategic Income Fund | | | | |
| Actual | $1,000.00 | $1,035.30 | 0.15% | $0.76 |
Hypothetical (5% return before expenses) | $1,000.00 | $1,024.25 | 0.15% | $0.76 |
(a) | Annualized, based on the Fund's most recent fiscal half year expenses. |
| (b) | Expenses are equal to the Fund's annualized expense ratio multiplied by the average account value over the period, multiplied by the number of days in the most recent fiscal half year (183), divided by 366. |
(c) | Actual expenses paid during the period are based on the commencement of operations date of June 14, 2016. |
(d) | Actual expenses paid during the period are based on the commencement of operations date of June 7, 2016. |
Report of Independent Registered Public Accounting Firm | |
To the Board of Trustees and Shareholders of ALPS ETF Trust:
We have audited the accompanying statements of assets and liabilities, including the schedules of investments, of RiverFront Dynamic Core Income ETF, RiverFront Dynamic Unconstrained Income ETF, RiverFront Dynamic US Dividend Advantage ETF, RiverFront Dynamic US Flex‐Cap ETF, and RiverFront Strategic Income Fund, five of the portfolios constituting the ALPS ETF Trust (the “Trust”), as of November 30, 2016, and the related statements of operations, changes in net assets, and the financial highlights for each of the periods presented. These financial statements and financial highlights are the responsibility of the Trust’s management. Our responsibility is to express an opinion on these financial statements and financial highlights based on our audits.
We conducted our audits in accordance with the standards of the Public Company Accounting Oversight Board (United States). Those standards require that we plan and perform the audit to obtain reasonable assurance about whether the financial statements and financial highlights are free of material misstatement. The Trust is not required to have, nor were we engaged to perform, an audit of its internal control over financial reporting. Our audits included consideration of internal control over financial reporting as a basis for designing audit procedures that are appropriate in the circumstances, but not for the purpose of expressing an opinion on the effectiveness of the Trust’s internal control over financial reporting. Accordingly, we express no such opinion. An audit also includes examining, on a test basis, evidence supporting the amounts and disclosures in the financial statements, assessing the accounting principles used and significant estimates made by management, as well as evaluating the overall financial statement presentation. Our procedures included confirmation of securities owned as of November 30, 2016, by correspondence with the custodian. We believe that our audits provide a reasonable basis for our opinion.
In our opinion, the financial statements and financial highlights referred to above present fairly, in all material respects, the financial position of RiverFront Dynamic Core Income ETF, RiverFront Dynamic Unconstrained Income ETF, RiverFront Dynamic US Dividend Advantage ETF, RiverFront Dynamic US Flex‐Cap ETF, and RiverFront Strategic Income Fund of the ALPS ETF Trust as of November 30, 2016, and the results of their operations, changes in their net assets, and the financial highlights for each of the periods presented, in conformity with accounting principles generally accepted in the United States of America.
DELOITTE & TOUCHE LLP
Denver, Colorado
January 27, 2017
RiverFront Dynamic Core Income ETF
| Schedule of Investments | November 30, 2016 |
| Security Description | | Principal Amount | | | Value | |
| CORPORATE BONDS (88.95%) | | | | | | |
| Consumer Discretionary (13.05%) | | | | | | |
| Charter Communications Operating LLC, First Lien | | | | | | |
| 3.58%, 07/23/2020 | | $ | 262,000 | | | $ | 267,625 | |
| Ford Motor Credit Co. LLC, Sr. Unsec. | | | | | | | | |
| 3.34%, 03/18/2021 | | | 262,000 | | | | 262,973 | |
| The Home Depot, Inc., Sr. Unsec. | | | | | | | | |
| 2.63%, 06/01/2022 | | | 262,000 | | | | 263,021 | |
| Total Consumer Discretionary | | | | | | | 793,619 | |
| | | | | | | | | |
| Consumer Staples (8.83%) | | | | | | | | |
| Anheuser-Busch InBev Finance, Inc., Sr. Unsec. | | | | | | | | |
| 2.65%, 02/01/2021 | | | 262,000 | | | | 263,162 | |
| PepsiCo, Inc., Sr. Unsec. | | | | | | | | |
| 3.60%, 03/01/2024 | | | 262,000 | | | | 273,588 | |
| Total Consumer Staples | | | | | | | 536,750 | |
| | | | | | | | | |
| Energy (14.48%) | | | | | | | | |
| Devon Energy Corp., Sr. Unsec. | | | | | | | | |
| 3.25%, 05/15/2022 | | | 262,000 | | | | 254,492 | |
| Enterprise Products Operating LLC, Sr. Unsec. | | | | | | | | |
| 3.35%, 03/15/2023 | | | 262,000 | | | | 261,802 | |
| Kinder Morgan, Inc., Sr. Unsec. | | | | | | | | |
| 3.05%, 12/01/2019 | | | 262,000 | | | | 264,786 | |
| Petroleos Mexicanos, Sr. Unsec. | | | | | | | | |
| 8.00%, 05/03/2019 | | | 91,000 | | | | 99,190 | |
| Total Energy | | | | | | | 880,270 | |
| | | | | | | | | |
| Financials (21.89%) | | | | | | | | |
| Bank of America Corp., Sr. Unsec. | | | | | | | | |
| 3.30%, 01/11/2023 | | | 262,000 | | | | 262,457 | |
| CIT Group, Inc., Sr. Unsec. | | | | | | | | |
| 5.25%, 03/15/2018 | | | 262,000 | | | | 271,621 | |
| The Goldman Sachs Group, Inc., Sr. Unsec. | | | | | | | | |
| 2.55%, 10/23/2019 | | | 262,000 | | | | 263,834 | |
| JPMorgan Chase & Co., Sub. | | | | | | | | |
| 3.38%, 05/01/2023 | | | 262,000 | | | | 262,052 | |
| Morgan Stanley, Sr. Unsec. | | | | | | | | |
| 5.63%, 09/23/2019 | | | 250,000 | | | | 271,867 | |
| Total Financials | | | | | | | 1,331,831 | |
| | | | | | | | | |
| Health Care (8.62%) | | | | | | | | |
| AbbVie, Inc., Sr. Unsec. | | | | | | | | |
| 2.90%, 11/06/2022 | | | 262,000 | | | | 258,525 | |
| Actavis Funding SCS, Sr. Unsec. | | | | | | | | |
| 3.00%, 03/12/2020 | | | 262,000 | | | | 265,930 | |
| Total Health Care | | | | | | | 524,455 | |
| Security Description | | Principal Amount | | | Value | |
| Industrials (4.33%) | | | | | | |
| General Electric Co., Sr. Unsec. | | | | | | |
| 2.70%, 10/09/2022 | | $ | 262,000 | | | $ | 263,073 | |
| Total Industrials | | | | | | | 263,073 | |
| | | | | | | | | |
| Information Technology (4.59%) | | | | | | | | |
| Flextronics International Ltd., Sr. Unsec. | | | | | | | | |
| 5.00%, 02/15/2023 | | | 262,000 | | | | 278,999 | |
| Total Information Technology | | | | | | | 278,999 | |
| | | | | | | | | |
| Telecommunication Services (8.89%) | | | | | | | | |
| AT&T, Inc., Sr. Unsec. | | | | | | | | |
| 2.45%, 06/30/2020 | | | 262,000 | | | | 259,702 | |
| Verizon Communications, Inc., Sr. Unsec. | | | | | | | | |
| 4.50%, 09/15/2020 | | | 262,000 | | | | 280,706 | |
| Total Telecommunication Services | | | | | | | 540,408 | |
| | | | | | | | | |
| Utilities (4.27%) | | | | | | | | |
| The Southern Co., Sr. Unsec. | | | | | | | | |
| 2.95%, 07/01/2023 | | | 262,000 | | | | 259,817 | |
| Total Utilities | | | | | | | 259,817 | |
| | | | | | | | | |
TOTAL CORPORATE BONDS
(Cost $5,518,054) | | | | | | | 5,409,222 | |
| | | | | | | | | |
| GOVERNMENT BONDS (4.40%) | | | | | | | | |
| United States Treasury Inflation Indexed Bonds | | | | | | | | |
| 0.75%, 02/15/2042 | | | 277,776 | | | | 267,488 | |
| | | | | | | | | |
TOTAL GOVERNMENT BONDS
(Cost $282,247) | | | | | | | 267,488 | |
| Security Description | | 7 Day Yield | | | Shares | | | Value | |
| SHORT TERM INVESTMENTS (4.01%) | |
| State Street Institutional Treasury Plus Money Market Fund | | | 0.259 | % | | | 244,032 | | | | 244,032 | |
| | | | | | | | | | | | | |
TOTAL SHORT TERM INVESTMENTS
(Cost $244,032) | | | 244,032 | |
| | | | | | | | | | | | | |
TOTAL INVESTMENTS (97.36%)
(Cost $6,044,333) | | | | | | | $ | 5,920,742 | |
| | | | | | | | | | | | | |
| NET OTHER ASSETS AND LIABILITIES (2.64%) | | | | 160,409 | |
| | | | | | | | | | | | | |
| NET ASSETS (100.00%) | | | | | | | | | | $ | 6,081,151 | |
See Notes to Financial Statements.
RiverFront Dynamic Unconstrained Income ETF
| Schedule of Investments | November 30, 2016 |
| Security Description | | Principal Amount | | | Value | |
| CORPORATE BONDS (95.59%) | | | | | | |
| Consumer Discretionary (16.57%) | | | | | | |
| Avis Budget Car Rental LLC / Avis Budget Finance, Inc., Sr. Unsec. | | | | | | |
5.13%, 06/01/2022(a) | | $ | 150,000 | | | $ | 145,313 | |
| Cablevision Systems Corp., Sr. Unsec. | | | | | | | | |
| 5.88%, 09/15/2022 | | | 150,000 | | | | 140,250 | |
| Clear Channel Worldwide Holdings, Inc., Sr. Unsec. | | | | | | | | |
| 6.50%, 11/15/2022 | | | 150,000 | | | | 152,250 | |
| DISH DBS Corp., Sr. Unsec. | | | | | | | | |
| 5.88%, 11/15/2024 | | | 150,000 | | | | 152,625 | |
| International Game Technology PLC, First Lien | | | | | | | | |
6.25%, 02/15/2022(a) | | | 150,000 | | | | 160,124 | |
| MGM Resorts International, Sr. Unsec. | | | | | | | | |
| 4.63%, 09/01/2026 | | | 100,000 | | | | 95,750 | |
| Total Consumer Discretionary | | | | | | | 846,312 | |
| | | | | | | | | |
| Consumer Staples (8.92%) | | | | | | | | |
| Smithfield Foods, Inc., Sr. Unsec. | | | | | | | | |
| 6.63%, 08/15/2022 | | | 150,000 | | | | 158,812 | |
| Spectrum Brands, Inc., Sr. Unsec. | | | | | | | | |
| 5.75%, 07/15/2025 | | | 135,000 | | | | 140,738 | |
| TreeHouse Foods, Inc., Sr. Unsec. | | | | | | | | |
6.00%, 02/15/2024(a) | | | 150,000 | | | | 156,375 | |
| Total Consumer Staples | | | | | | | 455,925 | |
| | | | | | | | | |
| Energy (13.21%) | | | | | | | | |
| Cheniere Corpus Christi Holdings LLC, Sec. | | | | | | | | |
7.00%, 06/30/2024(a) | | | 100,000 | | | | 107,000 | |
| Newfield Exploration Co., Sr. Unsec. | | | | | | | | |
| 5.75%, 01/30/2022 | | | 150,000 | | | | 156,000 | |
| Southwestern Energy Co., Sr. Unsec. | | | | | | | | |
| 7.50%, 02/01/2018 | | | 10,000 | | | | 10,500 | |
5.80%, 01/23/2020(b) | | | 100,000 | | | | 102,500 | |
| Tesoro Logistics LP / Tesoro Logistics Finance Corp., Sr. Unsec. | | | | | | | | |
| 6.38%, 05/01/2024 | | | 100,000 | | | | 108,250 | |
| Weatherford International Ltd., Sr. Unsec. | | | | | | | | |
| 9.63%, 03/01/2019 | | | 50,000 | | | | 53,050 | |
| Williams Partners/ACMP Finance Corp., Sr. Unsec. | | | | | | | | |
| 6.13%, 07/15/2022 | | | 134,000 | | | | 137,605 | |
| Total Energy | | | | | | | 674,905 | |
| Security Description | | Principal Amount | | | Value | |
| Financials (2.79%) | | | | | | |
| Navient Corp., Sr. Unsec. | | | | | | |
| 6.13%, 03/25/2024 | | $ | 150,000 | | | $ | 142,688 | |
| Total Financials | | | | | | | 142,688 | |
| | | | | | | | | |
| Health Care (1.91%) | | | | | | | | |
| DaVita, Inc., Sr. Unsec. | | | | | | | | |
| 5.00%, 05/01/2025 | | | 100,000 | | | | 97,750 | |
| Total Health Care | | | | | | | 97,750 | |
| | | | | | | | | |
| Industrials (17.05%) | | | | | | | | |
| ADT Corp., First Lien | | | | | | | | |
| 6.25%, 10/15/2021 | | | 150,000 | | | | 162,374 | |
| CNH Industrial NV, Sr. Unsec. | | | | | | | | |
| 4.50%, 08/15/2023 | | | 100,000 | | | | 99,000 | |
| Icahn Enterprises LP / Icahn Enterprises Finance Corp., Sr. Unsec. | | | | | | | | |
| 4.88%, 03/15/2019 | | | 150,000 | | | | 151,875 | |
| Owens-Brockway Glass Container, Inc., Sr. Unsec. | | | | | | | | |
5.00%, 01/15/2022(a) | | | 150,000 | | | | 153,563 | |
| United Rentals North America Inc., Sr. Unsec. | | | | | | | | |
| 5.88%, 09/15/2026 | | | 150,000 | | | | 153,750 | |
| WESCO Distribution, Inc., Sr. Unsec. | | | | | | | | |
5.38%, 06/15/2024(a) | | | 150,000 | | | | 150,375 | |
| Total Industrials | | | | | | | 870,937 | |
| | | | | | | | | |
| Information Technology (1.00%) | | | | | | | | |
| SS&C Technologies Holdings, Inc., Sr. Unsec. | | | | | | | | |
| 5.88%, 07/15/2023 | | | 50,000 | | | | 51,250 | |
| Total Information Technology | | | | | | | 51,250 | |
| | | | | | | | | |
| Materials (14.16%) | | | | | | | | |
| AK Steel Corp., First Lien | | | | | | | | |
| 7.50%, 07/15/2023 | | | 150,000 | | | | 163,500 | |
| ArcelorMittal, Sr. Unsec. | | | | | | | | |
7.25%, 02/25/2022(b) | | | 150,000 | | | | 169,500 | |
| Teck Resources Ltd., Sr. Unsec. | | | | | | | | |
8.00%, 06/01/2021(a) | | | 50,000 | | | | 55,045 | |
8.50%, 06/01/2024(a) | | | 100,000 | | | | 117,000 | |
| United States Steel Corp., First Lien | | | | | | | | |
8.38%, 07/01/2021(a) | | | 150,000 | | | | 166,125 | |
| Vale Overseas Ltd., Sr. Unsec. | | | | | | | | |
| 5.88%, 06/10/2021 | | | 50,000 | | | | 52,525 | |
| Total Materials | | | | | | | 723,695 | |
See Notes to Financial Statements.
RiverFront Dynamic Unconstrained Income ETF
| Schedule of Investments | November 30, 2016 |
| Security Description | | Principal Amount | | | Value | |
| Real Estate (2.99%) | | | | | | |
| Iron Mountain, Inc., Sr. Sub. | | | | | | |
| 5.75%, 08/15/2024 | | $ | 150,000 | | | $ | 152,970 | |
| Total Real Estate | | | | | | | 152,970 | |
| | | | | | | | | |
| Telecommunication Services (11.39%) | | | | | | | | |
| CenturyLink, Inc., Sr. Unsec. | | | | | | | | |
| 7.50%, 04/01/2024 | | | 150,000 | | | | 155,234 | |
| Frontier Communications Corp., Sr. Unsec. | | | | | | | | |
| 8.50%, 04/15/2020 | | | 100,000 | | | | 104,375 | |
| Sprint Communications, Inc., Sr. Unsec. | | | | | | | | |
9.00%, 11/15/2018(a) | | | 150,000 | | | | 165,187 | |
| T-Mobile USA, Inc., Sr. Unsec. | | | | | | | | |
| 6.73%, 04/28/2022 | | | 150,000 | | | | 157,103 | |
| Total Telecommunication Services | | | | | | | 581,899 | |
| | | | | | | | | |
| Utilities (5.60%) | | | | | | | | |
| Dynegy, Inc., Sr. Unsec. | | | | | | | | |
| 7.63%, 11/01/2024 | | | 150,000 | | | | 138,750 | |
| NRG Energy, Inc., Sr. Unsec. | | | | | | | | |
7.25%, 05/15/2026(a) | | | 150,000 | | | | 147,375 | |
| Total Utilities | | | | | | | 286,125 | |
| | | | | | | | | |
TOTAL CORPORATE BONDS
(Cost $4,766,448) | | | | | | | 4,884,456 | |
| Security Description | | 7 Day Yield | | | Shares | | | Value | |
| SHORT TERM INVESTMENTS (2.88%) | |
| State Street Institutional Treasury Plus Money Market Fund | | | 0.259 | % | | | 147,358 | | | | 147,358 | |
| | | | | | | | | | | | | |
TOTAL SHORT TERM INVESTMENTS
(Cost $147,358) | | | | 147,358 | |
| | | | | | | | | | | | | |
TOTAL INVESTMENTS (98.47%) (Cost $4,913,806) | | | | | | | $ | 5,031,814 | |
| | | | | | | | | | | | | |
| NET OTHER ASSETS AND LIABILITIES (1.53%) | | | | 78,014 | |
| | | | | | | | | | | | | |
| NET ASSETS (100.00%) | | | | | | | | | | $ | 5,109,828 | |
(a) | Securities exempt from registration under Rule 144A of the Securities Act of 1933. These securities may be sold in the ordinary course of business in transactions exempt from registration, normally to qualified institutional buyers. At period end, the aggregate market value of those securities was $1,523,482, representing 29.81% of net assets. |
(b) | Represents a step bond. Rate disclosed is as of November 30, 2016. |
See Notes to Financial Statements.
RiverFront Dynamic US Dividend Advantage ETF
| Schedule of Investments | November 30, 2016 |
| Security Description | | Shares | | | Value | |
| COMMON STOCKS (99.73%) | | | | | | |
| Consumer Discretionary (13.42%) | | | | | | |
| Abercrombie & Fitch Co., Class A | | | 4,361 | | | $ | 62,668 | |
Amazon.com, Inc.(a) | | | 260 | | | | 195,148 | |
| Barnes & Noble, Inc. | | | 5,526 | | | | 69,628 | |
| Carnival Corp. | | | 3,865 | | | | 198,699 | |
| CBS Corp., Class B | | | 955 | | | | 57,988 | |
| Darden Restaurants, Inc. | | | 2,552 | | | | 187,062 | |
| Ford Motor Co. | | | 5,327 | | | | 63,711 | |
| Garmin Ltd. | | | 1,289 | | | | 67,234 | |
| The Home Depot, Inc. | | | 508 | | | | 65,735 | |
| International Game Technology PLC | | | 7,260 | | | | 187,163 | |
| Mattel, Inc. | | | 5,265 | | | | 166,216 | |
| McDonald's Corp. | | | 558 | | | | 66,553 | |
| Meredith Corp. | | | 2,205 | | | | 122,488 | |
| Scripps Networks Interactive, Inc., Class A | | | 991 | | | | 68,637 | |
| Starbucks Corp. | | | 3,555 | | | | 206,082 | |
| Total Consumer Discretionary | | | | | | | 1,785,012 | |
| | | | | | | | | |
| Consumer Staples (8.91%) | | | | | | | | |
| Altria Group, Inc. | | | 3,890 | | | | 248,687 | |
| Flowers Foods, Inc. | | | 5,091 | | | | 79,012 | |
| Kimberly-Clark Corp. | | | 1,053 | | | | 121,737 | |
| The Kroger Co. | | | 2,019 | | | | 65,214 | |
| Philip Morris International, Inc. | | | 1,538 | | | | 135,775 | |
| Procter & Gamble Co. | | | 719 | | | | 59,289 | |
| Sysco Corp. | | | 1,426 | | | | 75,935 | |
| Unilever NV, NY Shares | | | 3,456 | | | | 137,652 | |
| Walgreens Boots Alliance, Inc. | | | 731 | | | | 61,938 | |
| Wal-Mart Stores, Inc. | | | 2,824 | | | | 198,894 | |
| Total Consumer Staples | | | | | | | 1,184,133 | |
| | | | | | | | | |
| Energy (6.90%) | | | | | | | | |
| Archrock, Inc. | | | 6,479 | | | | 87,143 | |
| Chevron Corp. | | | 1,201 | | | | 133,984 | |
| Exxon Mobil Corp. | | | 3,159 | | | | 275,780 | |
| Noble Corp., PLC | | | 30,937 | | | | 192,428 | |
| ONEOK, Inc. | | | 2,068 | | | | 113,595 | |
| The Williams Cos, Inc. | | | 3,729 | | | | 114,480 | |
| Total Energy | | | | | | | 917,410 | |
| | | | | | | | | |
| Financials (13.64%) | | | | | | | | |
Berkshire Hathaway, Inc., Class B(a) | | | 1,339 | | | | 210,813 | |
| Federated Investors, Inc., Class B | | | 4,633 | | | | 127,361 | |
| First American Financial Corp. | | | 3,592 | | | | 135,562 | |
| The Hartford Financial Services Group, Inc. | | | 4,336 | | | | 204,313 | |
| JPMorgan Chase & Co. | | | 2,391 | | | | 191,686 | |
| Old Republic International Corp. | | | 5,005 | | | | 89,439 | |
| PacWest Bancorp | | | 1,438 | | | | 73,698 | |
| People's United Financial, Inc. | | | 4,138 | | | | 77,463 | |
| T Rowe Price Group, Inc. | | | 2,517 | | | | 186,409 | |
| Umpqua Holdings Corp. | | | 8,164 | | | | 145,074 | |
| Security Description | | Shares | | | Value | |
| Financials (continued) | | | | | | |
| Waddell & Reed Financial, Inc., Class A | | | 8,747 | | | $ | 170,829 | |
| WisdomTree Investments, Inc. | | | 9,341 | | | | 103,311 | |
| XL Group Ltd. | | | 2,701 | | | | 97,587 | |
| Total Financials | | | | | | | 1,813,545 | |
| | | | | | | | | |
| Health Care (12.24%) | | | | | | | | |
| AbbVie, Inc. | | | 1,214 | | | | 73,811 | |
| Aetna, Inc. | | | 1,548 | | | | 202,540 | |
| AmerisourceBergen Corp. | | | 1,511 | | | | 117,843 | |
| Anthem, Inc. | | | 2,131 | | | | 303,732 | |
| Cigna Corp. | | | 1,077 | | | | 145,115 | |
| Gilead Sciences, Inc. | | | 645 | | | | 47,537 | |
| HealthSouth Corp. | | | 2,651 | | | | 110,467 | |
| Johnson & Johnson | | | 546 | | | | 60,770 | |
| Merck & Co., Inc | | | 3,196 | | | | 195,563 | |
| PDL BioPharma, Inc. | | | 47,193 | | | | 103,353 | |
| Pfizer, Inc. | | | 8,289 | | | | 266,408 | |
| Total Health Care | | | | | | | 1,627,139 | |
| | | | | | | | | |
| Industrials (9.09%) | | | | | | | | |
| Boeing Co. | | | 967 | | | | 145,592 | |
| CH Robinson Worldwide, Inc. | | | 1,623 | | | | 121,482 | |
| Cummins, Inc. | | | 631 | | | | 89,463 | |
| Eaton Corp. PLC | | | 1,277 | | | | 84,933 | |
| Emerson Electric Co. | | | 3,357 | | | | 189,469 | |
| Expeditors International of Washington, Inc. | | | 1,116 | | | | 58,858 | |
| Honeywell International, Inc. | | | 1,919 | | | | 218,650 | |
| United Parcel Service, Inc., Class B | | | 1,055 | | | | 122,296 | |
| Waste Management, Inc. | | | 2,564 | | | | 178,249 | |
| Total Industrials | | | | | | | 1,208,992 | |
| | | | | | | | | |
| Information Technology (22.34%) | | | | | | | | |
Alphabet, Inc., Class A(a) | | | 199 | | | | 154,400 | |
Alphabet, Inc., Class C(a) | | | 210 | | | | 159,188 | |
| Apple, Inc. | | | 2,328 | | | | 257,291 | |
| Applied Materials, Inc. | | | 3,493 | | | | 112,475 | |
Cognizant Technology Solutions Corp., Class A(a) | | | 3,258 | | | | 179,451 | |
| CSG Systems International, Inc. | | | 1,511 | | | | 67,240 | |
Facebook, Inc., Class A(a) | | | 1,808 | | | | 214,103 | |
Ingram Micro, Inc., Class A(a) | | | 3,060 | | | | 114,566 | |
| Intel Corp. | | | 9,155 | | | | 317,678 | |
| InterDigital, Inc. | | | 1,375 | | | | 108,900 | |
| International Business Machines Corp. | | | 1,585 | | | | 257,119 | |
| Intersil Corp., Class A | | | 2,836 | | | | 62,817 | |
| Leidos Holdings, Inc. | | | 3,245 | | | | 166,144 | |
| ManTech International Corp., Class A | | | 1,610 | | | | 69,246 | |
| Microchip Technology, Inc. | | | 1,649 | | | | 109,131 | |
| NVIDIA Corp. | | | 1,029 | | | | 94,874 | |
| QUALCOMM, Inc. | | | 2,874 | | | | 195,806 | |
See Notes to Financial Statements.
RiverFront Dynamic US Dividend Advantage ETF
| Schedule of Investments | November 30, 2016 |
| Security Description | | Shares | | | Value | |
| Information Technology (continued) | | | | | | |
| Science Applications International Corp. | | | 906 | | | $ | 74,808 | |
| Texas Instruments, Inc. | | | 1,476 | | | | 109,121 | |
VeriSign, Inc.(a) | | | 1,848 | | | | 145,715 | |
| Total Information Technology | | | | | | | 2,970,073 | |
| | | | | | | | | |
| Materials (3.31%) | | | | | | | | |
| Compass Minerals International, Inc. | | | 1,041 | | | | 80,730 | |
| LyondellBasell Industries NV, Class A | | | 1,858 | | | | 167,814 | |
| Nucor Corp. | | | 2,304 | | | | 143,286 | |
| The Valspar Corp. | | | 470 | | | | 47,982 | |
| Total Materials | | | | | | | 439,812 | |
| | | | | | | | | |
| Real Estate (3.79%) | | | | | | | | |
| Care Capital Properties, Inc. | | | 2,354 | | | | 56,684 | |
| Core Civic, Inc. | | | 3,345 | | | | 75,965 | |
| Host Hotels & Resorts, Inc. | | | 9,181 | | | | 163,790 | |
| LaSalle Hotel Properties | | | 3,531 | | | | 99,115 | |
| The Macerich Co. | | | 880 | | | | 59,743 | |
| Washington Prime Group, Inc. | | | 4,857 | | | | 48,667 | |
| Total Real Estate | | | | | | | 503,964 | |
| | | | | | | | | |
| Telecommunication Services (4.82%) | | | | | | | | |
| AT&T, Inc. | | | 4,843 | | | | 187,084 | |
| CenturyLink, Inc. | | | 6,219 | | | | 146,271 | |
| Verizon Communications, Inc. | | | 3,134 | | | | 156,387 | |
| Windstream Holdings, Inc. | | | 20,443 | | | | 151,483 | |
| Total Telecommunication Services | | | | | | | 641,225 | |
| | | | | | | | | |
| Utilities (1.27%) | | | | | | | | |
| Consolidated Edison, Inc. | | | 1,226 | | | | 85,538 | |
| The Southern Co. | | | 1,786 | | | | 83,621 | |
| Total Utilities | | | | | | | 169,159 | |
| | | | | | | | | |
TOTAL COMMON STOCKS
(Cost $12,761,243) | | | | | | | 13,260,464 | |
| Security Description | | 7 Day Yield | | | Shares | | | Value | |
| SHORT TERM INVESTMENTS (0.04%) | |
| State Street Institutional Treasury Plus Money Market Fund | | | 0.259 | % | | | 5,024 | | | | 5,024 | |
| | | | | | | | | | | | | |
TOTAL SHORT TERM INVESTMENTS
(Cost $5,024) | | | | 5,024 | |
| | | | | | | | | | | | | |
TOTAL INVESTMENTS (99.77%)
(Cost $12,766,267) | | | $ | 13,265,488 | |
| | | | | | | | | | | | | |
| NET OTHER ASSETS AND LIABILITIES (0.23%) | | | | 31,194 | |
| | | | | | | | | | | | | |
| NET ASSETS (100.00%) | | | | | | | | | | $ | 13,296,682 | |
(a) | Non income producing security. |
See Notes to Financial Statements.
RiverFront Dynamic US Flex-Cap ETF
| Schedule of Investments | November 30, 2016 |
| Security Description | | Shares | | | Value | |
| COMMON STOCKS (99.84%) | | | | | | |
| Consumer Discretionary (14.69%) | | | | | | |
| Abercrombie & Fitch Co., Class A | | | 1,924 | | | $ | 27,648 | |
Amazon.com, Inc.(a) | | | 167 | | | | 125,344 | |
BJ's Restaurants, Inc.(a) | | | 439 | | | | 16,287 | |
Boyd Gaming Corp.(a) | | | 1,137 | | | | 21,421 | |
| Brinker International, Inc. | | | 190 | | | | 10,091 | |
| Brunswick Corp. | | | 556 | | | | 27,867 | |
| Carnival Corp. | | | 1,870 | | | | 96,137 | |
| Darden Restaurants, Inc. | | | 1,197 | | | | 87,740 | |
| Delphi Automotive PLC | | | 654 | | | | 41,856 | |
| International Game Technology PLC | | | 4,239 | | | | 109,281 | |
Kate Spade & Co.(a) | | | 2,947 | | | | 43,763 | |
| Mattel, Inc. | | | 2,687 | | | | 84,829 | |
| McDonald's Corp. | | | 653 | | | | 77,883 | |
| Omnicom Group, Inc. | | | 287 | | | | 24,952 | |
| Polaris Industries, Inc. | | | 316 | | | | 27,448 | |
The Priceline Group, Inc.(a) | | | 17 | | | | 25,563 | |
| Royal Caribbean Cruises Ltd. | | | 1,093 | | | | 88,500 | |
| Starbucks Corp. | | | 2,154 | | | | 124,867 | |
Ulta Salon Cosmetics & Fragrance, Inc.(a) | | | 132 | | | | 34,254 | |
| Williams-Sonoma, Inc. | | | 510 | | | | 27,938 | |
| Yum! Brands, Inc. | | | 941 | | | | 59,650 | |
| Total Consumer Discretionary | | | | | | | 1,183,319 | |
| | | | | | | | | |
| Consumer Staples (7.75%) | | | | | | | | |
| Altria Group, Inc. | | | 2,003 | | | | 128,052 | |
The Boston Beer Co., Inc., Class A(a) | | | 251 | | | | 43,448 | |
| Cal-Maine Foods, Inc. | | | 457 | | | | 18,600 | |
| Campbell Soup Co. | | | 718 | | | | 40,847 | |
| Kimberly-Clark Corp. | | | 155 | | | | 17,920 | |
| Mondelez International, Inc., Class A | | | 1,588 | | | | 65,489 | |
| Procter & Gamble Co. | | | 648 | | | | 53,434 | |
| Unilever NV, CVA | | | 935 | | | | 37,533 | |
| Unilever NV, NY Shares | | | 910 | | | | 36,245 | |
United Natural Foods, Inc.(a) | | | 1,059 | | | | 49,720 | |
| Walgreens Boots Alliance, Inc. | | | 365 | | | | 30,926 | |
| Wal-Mart Stores, Inc. | | | 1,165 | | | | 82,051 | |
| Whole Foods Market, Inc. | | | 664 | | | | 20,179 | |
| Total Consumer Staples | | | | | | | 624,444 | |
| | | | | | | | | |
| Energy (3.86%) | | | | | | | | |
| Chevron Corp. | | | 289 | | | | 32,241 | |
| Ensco PLC, Class A | | | 2,921 | | | | 28,217 | |
| Exxon Mobil Corp. | | | 798 | | | | 69,665 | |
FMC Technologies, Inc.(a) | | | 1,306 | | | | 44,744 | |
| Kinder Morgan, Inc. | | | 3,591 | | | | 79,720 | |
PetroQuest Energy, Inc.(a) | | | 6,515 | | | | 27,298 | |
Stone Energy Corp.(a) | | | 5,848 | | | | 28,772 | |
| Total Energy | | | | | | | 310,657 | |
| | | | | | | | | |
| Financials (14.13%) | | | | | | | | |
| American Express Co. | | | 705 | | | | 50,788 | |
| Security Description | | Shares | | | Value | |
| Financials (continued) | | | | | | |
| Arthur J Gallagher & Co. | | | 593 | | | $ | 29,858 | |
| Banc of California, Inc. | | | 1,442 | | | | 21,774 | |
| Bank of the Ozarks, Inc. | | | 276 | | | | 13,392 | |
Berkshire Hathaway, Inc., Class B(a) | | | 700 | | | | 110,207 | |
| Brookline Bancorp, Inc. | | | 1,740 | | | | 25,926 | |
| Brown & Brown, Inc. | | | 442 | | | | 19,161 | |
| Capstead Mortgage Corp. | | | 2,103 | | | | 21,745 | |
| Citigroup, Inc. | | | 1,162 | | | | 65,525 | |
| FactSet Research Systems, Inc. | | | 186 | | | | 29,792 | |
| Fifth Third Bancorp | | | 1,309 | | | | 34,060 | |
| First American Financial Corp. | | | 2,455 | | | | 92,652 | |
FXCM, Inc., Class A(a) | | | 2,372 | | | | 18,264 | |
| The Hartford Financial Services Group, Inc. | | | 1,934 | | | | 91,130 | |
| Interactive Brokers Group, Inc., Class A | | | 540 | | | | 19,829 | |
| Investment Technology Group, Inc. | | | 645 | | | | 12,023 | |
| Northern Trust Corp. | | | 388 | | | | 31,874 | |
| Old Republic International Corp. | | | 1,234 | | | | 22,052 | |
| PrivateBancorp, Inc. | | | 492 | | | | 23,016 | |
Signature Bank(a) | | | 568 | | | | 85,149 | |
| T Rowe Price Group, Inc. | | | 888 | | | | 65,765 | |
| Umpqua Holdings Corp. | | | 3,183 | | | | 56,562 | |
| Wells Fargo & Co. | | | 736 | | | | 38,949 | |
| WisdomTree Investments, Inc. | | | 6,298 | | | | 69,656 | |
| XL Group Ltd. | | | 2,456 | | | | 88,735 | |
| Total Financials | | | | | | | 1,137,884 | |
| | | | | | | | | |
| Health Care (12.17%) | | | | | | | | |
| Aetna, Inc. | | | 665 | | | | 87,009 | |
Allergan PLC(a) | | | 288 | | | | 55,958 | |
| AmerisourceBergen Corp. | | | 720 | | | | 56,153 | |
Cambrex Corp.(a) | | | 606 | | | | 30,361 | |
| Cigna Corp. | | | 785 | | | | 105,771 | |
| Danaher Corp. | | | 618 | | | | 48,309 | |
DaVita, Inc.(a) | | | 928 | | | | 58,789 | |
Express Scripts Holding Co.(a) | | | 618 | | | | 46,894 | |
| Gilead Sciences, Inc. | | | 756 | | | | 55,717 | |
HCA Holdings, Inc.(a) | | | 588 | | | | 41,683 | |
Hologic, Inc.(a) | | | 533 | | | | 20,403 | |
Incyte Corp.(a) | | | 210 | | | | 21,481 | |
| Johnson & Johnson | | | 294 | | | | 32,722 | |
Lannett Co., Inc(a) | | | 778 | | | | 17,816 | |
Mallinckrodt PLC(a) | | | 750 | | | | 39,525 | |
| McKesson Corp. | | | 328 | | | | 47,170 | |
| Merck & Co., Inc | | | 1,731 | | | | 105,920 | |
Mettler-Toledo International, Inc.(a) | | | 23 | | | | 9,476 | |
MiMedx Group, Inc.(a) | | | 2,450 | | | | 23,226 | |
| Owens & Minor, Inc. | | | 166 | | | | 5,629 | |
| Phibro Animal Health Corp., Class A | | | 945 | | | | 25,940 | |
| Teleflex, Inc. | | | 157 | | | | 23,225 | |
United Therapeutics Corp.(a) | | | 41 | | | | 5,150 | |
See Notes to Financial Statements.
RiverFront Dynamic US Flex-Cap ETF
| Schedule of Investments | November 30, 2016 |
| Security Description | | Shares | | | Value | |
| Health Care (continued) | | | | | | |
| Universal Health Services, Inc., Class B | | | 127 | | | $ | 15,624 | |
| Total Health Care | | | | | | | 979,951 | |
| | | | | | | | | |
| Industrials (11.83%) | | | | | | | | |
| AO Smith Corp. | | | 143 | | | | 6,954 | |
| Boeing Co. | | | 265 | | | | 39,898 | |
| CH Robinson Worldwide, Inc. | | | 1,119 | | | | 83,757 | |
| CLARCOR, Inc. | | | 323 | | | | 22,755 | |
| Curtiss-Wright Corp. | | | 480 | | | | 48,250 | |
| Expeditors International of Washington, Inc. | | | 2,013 | | | | 106,167 | |
| General Electric Co. | | | 1,526 | | | | 46,940 | |
| The Greenbrier Cos, Inc. | | | 708 | | | | 27,470 | |
| Illinois Tool Works, Inc. | | | 377 | | | | 47,193 | |
| Insperity, Inc. | | | 173 | | | | 12,525 | |
JetBlue Airways Corp.(a) | | | 1,395 | | | | 28,026 | |
| L-3 Communications Holdings, Inc. | | | 316 | | | | 49,855 | |
| Lockheed Martin Corp. | | | 118 | | | | 31,300 | |
| ManpowerGroup, Inc. | | | 306 | | | | 26,135 | |
| MSC Industrial Direct Co. Inc, Class A | | | 299 | | | | 26,713 | |
| Northrop Grumman Corp. | | | 193 | | | | 48,182 | |
| Powell Industries, Inc. | | | 262 | | | | 11,276 | |
| Raytheon Co. | | | 209 | | | | 31,254 | |
| Simpson Manufacturing Co. Inc | | | 509 | | | | 23,994 | |
Stericycle, Inc.(a) | | | 199 | | | | 14,521 | |
| Trinity Industries, Inc. | | | 443 | | | | 12,311 | |
| United Parcel Service, Inc., Class B | | | 516 | | | | 59,815 | |
United Rentals, Inc.(a) | | | 582 | | | | 58,846 | |
Wabash National Corp.(a) | | | 771 | | | | 10,632 | |
| Wabtec Corp. | | | 84 | | | | 7,112 | |
| Waste Management, Inc. | | | 1,015 | | | | 70,563 | |
| Total Industrials | | | | | | | 952,444 | |
| | | | | | | | | |
| Information Technology (24.42%) | | | | | | | | |
3D Systems Corp.(a) | | | 2,102 | | | | 29,113 | |
Advanced Micro Devices, Inc.(a) | | | 3,564 | | | | 31,755 | |
Alphabet, Inc., Class A(a) | | | 234 | | | | 181,555 | |
Alphabet, Inc., Class C(a) | | | 233 | | | | 176,622 | |
| Apple, Inc. | | | 1,072 | | | | 118,477 | |
| Applied Materials, Inc. | | | 1,668 | | | | 53,710 | |
| Avnet, Inc. | | | 103 | | | | 4,727 | |
Benchmark Electronics, Inc.(a) | | | 957 | | | | 27,131 | |
Bottomline Technologies de, Inc.(a) | | | 563 | | | | 14,109 | |
CalAmp Corp.(a) | | | 1,375 | | | | 19,993 | |
Cirrus Logic, Inc.(a) | | | 510 | | | | 28,050 | |
Cognizant Technology Solutions Corp., Class A(a) | | | 2,247 | | | | 123,765 | |
Cree, Inc.(a) | | | 941 | | | | 23,826 | |
Facebook, Inc., Class A(a) | | | 1,451 | | | | 171,827 | |
FARO Technologies, Inc.(a) | | | 335 | | | | 12,194 | |
Ingram Micro, Inc., Class A(a) | | | 3,754 | | | | 140,550 | |
Integrated Device Technology, Inc.(a) | | | 1,668 | | | | 39,031 | |
| Intel Corp. | | | 4,446 | | | | 154,276 | |
| Security Description | | Shares | | | Value | |
| Information Technology (continued) | | | | | | |
| International Business Machines Corp. | | | 821 | | | $ | 133,183 | |
Ixia(a) | | | 2,027 | | | | 27,871 | |
| Mentor Graphics Corp. | | | 472 | | | | 17,252 | |
| Microchip Technology, Inc. | | | 706 | | | | 46,723 | |
| Microsoft Corp. | | | 1,297 | | | | 78,157 | |
MicroStrategy, Inc., Class A(a) | | | 96 | | | | 18,627 | |
| National Instruments Corp. | | | 292 | | | | 8,605 | |
| NVIDIA Corp. | | | 504 | | | | 46,469 | |
| QUALCOMM, Inc. | | | 545 | | | | 37,131 | |
| SYNNEX Corp. | | | 389 | | | | 45,478 | |
Tech Data Corp.(a) | | | 294 | | | | 24,952 | |
| Tessera Technologies, Inc. | | | 628 | | | | 24,869 | |
VeriFone Systems, Inc.(a) | | | 439 | | | | 7,415 | |
VeriSign, Inc.(a) | | | 993 | | | | 78,298 | |
WEX, Inc.(a) | | | 185 | | | | 20,444 | |
| Total Information Technology | | | | | | | 1,966,185 | |
| | | | | | | | | |
| Materials (4.25%) | | | | | | | | |
AK Steel Holding Corp.(a) | | | 8,339 | | | | 76,136 | |
| Cabot Corp. | | | 568 | | | | 28,928 | |
| Compass Minerals International, Inc. | | | 335 | | | | 25,979 | |
| LyondellBasell Industries NV, Class A | | | 222 | | | | 20,051 | |
| Martin Marietta Materials, Inc. | | | 191 | | | | 41,915 | |
| Monsanto Co. | | | 286 | | | | 29,375 | |
| Newmont Mining Corp. | | | 593 | | | | 19,237 | |
| Nucor Corp. | | | 886 | | | | 55,100 | |
| Stepan Co. | | | 138 | | | | 11,201 | |
| Vulcan Materials Co. | | | 275 | | | | 34,554 | |
| Total Materials | | | | | | | 342,476 | |
| | | | | | | | | |
| Real Estate (2.20%) | | | | | | | | |
| DiamondRock Hospitality Co. | | | 2,321 | | | | 24,579 | |
Forestar Group, Inc.(a) | | | 1,009 | | | | 13,521 | |
| The GEO Group, Inc. | | | 533 | | | | 17,728 | |
| HFF, Inc., Class A | | | 307 | | | | 8,903 | |
| Jones Lang LaSalle, Inc. | | | 199 | | | | 20,155 | |
| The Macerich Co. | | | 437 | | | | 29,667 | |
| RE/MAX Holdings, Inc., Class A | | | 203 | | | | 9,947 | |
| The RMR Group, Inc., Class A | | | 215 | | | | 8,923 | |
| Summit Hotel Properties, Inc. | | | 1,707 | | | | 24,274 | |
| Washington Prime Group, Inc. | | | 1,918 | | | | 19,218 | |
| Total Real Estate | | | | | | | 176,915 | |
| | | | | | | | | |
| Telecommunication Services (2.45%) | | | | | | | | |
| AT&T, Inc. | | | 2,297 | | | | 88,733 | |
Iridium Communications, Inc.(a) | | | 1,147 | | | | 10,094 | |
| Telephone & Data Systems, Inc. | | | 786 | | | | 21,167 | |
| Verizon Communications, Inc. | | | 1,557 | | | | 77,694 | |
| Total Telecommunication Services | | | | | | | 197,688 | |
| | | | | | | | | |
| Utilities (2.09%) | | | | | | | | |
| Avangrid, Inc. | | | 379 | | | | 13,708 | |
| Consolidated Edison, Inc. | | | 379 | | | | 26,443 | |
See Notes to Financial Statements.
RiverFront Dynamic US Flex-Cap ETF
| Schedule of Investments | November 30, 2016 |
| Security Description | | Shares | | | Value | |
| Utilities (continued) | | | | | | |
| Dominion Resources, Inc. | | | 186 | | | $ | 13,632 | |
| Duke Energy Corp. | | | 265 | | | | 19,549 | |
| Great Plains Energy, Inc. | | | 683 | | | | 18,024 | |
| PG&E Corp. | | | 463 | | | | 27,224 | |
| The Southern Co. | | | 373 | | | | 17,464 | |
Talen Energy Corp.(a) | | | 2,304 | | | | 32,165 | |
| Total Utilities | | | | | | | 168,209 | |
| | | | | | | | | |
TOTAL COMMON STOCKS (Cost $7,726,012) | | | | | | | 8,040,172 | |
| Security Description | | 7 Day Yield | | | Shares | | | Value | |
| SHORT TERM INVESTMENTS (0.03%) | |
| State Street Institutional Treasury Plus Money Market Fund | | | 0.259 | % | | | 2,067 | | | | 2,067 | |
| | | | | | | | | | | | | |
TOTAL SHORT TERM INVESTMENTS (Cost $2,067) | | | | 2,067 | |
| | | | | | | | | | | | | |
TOTAL INVESTMENTS (99.87%)
(Cost $7,728,079) | | | $ | 8,042,239 | |
| | | | | | | | | | | | | |
| NET OTHER ASSETS AND LIABILITIES (0.13%) | | | | 10,644 | |
| | | | | | | | | | | | | |
| NET ASSETS (100.00%) | | | | | | | | | | $ | 8,052,883 | |
(a) | Non income producing security. |
See Notes to Financial Statements.
RiverFront Strategic Income Fund
| Schedule of Investments | November 30, 2016 |
| Security Description | | Principal Amount | | | Value | |
| CORPORATE BONDS (91.86%) | | | | | | |
| Consumer Discretionary (22.06%) | | | | | | |
| Aramark Services, Inc., Sr. Unsec. | | | | | | |
| 5.13%, 01/15/2024 | | $ | 600,000 | | | $ | 617,502 | |
| Avis Budget Car Rental LLC / Avis Budget Finance, Inc., Sr. Unsec. | | | | | | | | |
5.13%, 06/01/2022(a) | | | 4,671,000 | | | | 4,525,031 | |
| Cablevision Systems Corp., Sr. Unsec. | | | | | | | | |
| 8.63%, 09/15/2017 | | | 4,586,000 | | | | 4,775,173 | |
| DISH DBS Corp., Sr. Unsec. | | | | | | | | |
| 7.88%, 09/01/2019 | | | 7,000,000 | | | | 7,770,000 | |
| Dollar Tree, Inc., Sr. Unsec. | | | | | | | | |
| 5.75%, 03/01/2023 | | | 8,450,000 | | | | 9,062,624 | |
| DR Horton, Inc., Sr. Unsec. | | | | | | | | |
| 4.38%, 09/15/2022 | | | 7,140,000 | | | | 7,354,200 | |
| Goodyear Tire & Rubber Co., Sr. Unsec. | | | | | | | | |
| 5.13%, 11/15/2023 | | | 8,400,000 | | | | 8,620,499 | |
| Hanesbrands, Inc., Sr. Unsec. | | | | | | | | |
4.63%, 05/15/2024(a) | | | 2,500,000 | | | | 2,506,250 | |
| International Game Technology PLC, First Lien | | | | | | | | |
6.25%, 02/15/2022(a) | | | 1,000,000 | | | | 1,067,500 | |
| KFC Holding Co./Pizza Hut Holdings LLC/Taco Bell of America LLC, Sr. Unsec. | | | | | | | | |
5.00%, 06/01/2024(a) | | | 4,087,000 | | | | 4,138,088 | |
| Lamar Media Corp., Sr. Sub. | | | | | | | | |
| 5.00%, 05/01/2023 | | | 2,500,000 | | | | 2,556,250 | |
| Lear Corp., Sr. Unsec. | | | | | | | | |
| 4.75%, 01/15/2023 | | | 6,909,000 | | | | 7,150,815 | |
| MGM Resorts International, Sr. Unsec. | | | | | | | | |
| 6.75%, 10/01/2020 | | | 7,140,000 | | | | 7,836,150 | |
| Service Corp. International, Sr. Unsec. | | | | | | | | |
| 5.38%, 01/15/2022 | | | 3,000,000 | | | | 3,120,000 | |
| 5.38%, 05/15/2024 | | | 920,000 | | | | 961,492 | |
| Total Consumer Discretionary | | | | | | | 72,061,574 | |
| | | | | | | | | |
| Consumer Staples (5.36%) | | | | | | | | |
| Pinnacle Foods Finance LLC, Sr. Unsec. | | | | | | | | |
| 4.88%, 05/01/2021 | | | 2,000,000 | | | | 2,055,000 | |
| 5.88%, 01/15/2024 | | | 7,039,000 | | | | 7,443,743 | |
| Smithfield Foods, Inc., Sr. Unsec. | | | | | | | | |
| 6.63%, 08/15/2022 | | | 1,000,000 | | | | 1,058,750 | |
| Spectrum Brands, Inc., Sr. Unsec. | | | | | | | | |
| 6.63%, 11/15/2022 | | | 645,000 | | | | 686,925 | |
| 5.75%, 07/15/2025 | | | 1,000,000 | | | | 1,042,500 | |
| TreeHouse Foods, Inc., Sr. Unsec. | | | | | | | | |
6.00%, 02/15/2024(a) | | | 5,000,000 | | | | 5,212,500 | |
| Total Consumer Staples | | | | | | | 17,499,418 | |
| Security Description | | Principal Amount | | | Value | |
| Energy (12.83%) | | | | | | |
| Concho Resources, Inc., Sr. Unsec. | | | | | | |
| 6.50%, 01/15/2022 | | $ | 5,434,000 | | | $ | 5,651,360 | |
| 5.50%, 04/01/2023 | | | 346,000 | | | | 357,470 | |
| Kinder Morgan Energy Partners LP, Sr. Unsec. | | | | | | | | |
| 5.00%, 10/01/2021 | | | 6,500,000 | | | | 6,937,502 | |
| MPLX LP, Sr. Unsec. | | | | | | | | |
| 5.50%, 02/15/2023 | | | 2,000,000 | | | | 2,074,530 | |
| Newfield Exploration Co., Sr. Unsec. | | | | | | | | |
| 5.75%, 01/30/2022 | | | 7,000,000 | | | | 7,280,000 | |
| Southwestern Energy Co., Sr. Unsec. | | | | | | | | |
| 7.50%, 02/01/2018 | | | 396,000 | | | | 415,800 | |
| Tesoro Corp., Sr. Unsec. | | | | | | | | |
| 5.38%, 10/01/2022 | | | 8,044,000 | | | | 8,395,926 | |
| Tesoro Logistics LP / Tesoro Logistics Finance Corp., Sr. Unsec. | | | | | | | | |
| 5.88%, 10/01/2020 | | | 1,585,000 | | | | 1,638,335 | |
| 6.13%, 10/15/2021 | | | 1,000,000 | | | | 1,046,875 | |
| Williams Partners/ACMP Finance Corp., Sr. Unsec. | | | | | | | | |
| 6.13%, 07/15/2022 | | | 7,893,000 | | | | 8,105,337 | |
| Total Energy | | | | | | | 41,903,135 | |
| | | | | | | | | |
| Financials (6.15%) | | | | | | | | |
| AerCap Ireland Capital Ltd. / AerCap Global Aviation Trust, Sr. Unsec. | | | | | | | | |
| 4.63%, 10/30/2020 | | | 3,106,000 | | | | 3,241,888 | |
| Ally Financial, Inc., Sr. Unsec. | | | | | | | | |
| 4.75%, 09/10/2018 | | | 3,200,000 | | | | 3,296,320 | |
| CIT Group, Inc., Sr. Unsec. | | | | | | | | |
5.50%, 02/15/2019(a) | | | 7,000,000 | | | | 7,406,875 | |
| Navient Corp., Sr. Unsec. | | | | | | | | |
| 8.45%, 06/15/2018 | | | 1,000,000 | | | | 1,080,000 | |
| 5.50%, 01/15/2019 | | | 4,900,000 | | | | 5,069,540 | |
| Total Financials | | | | | | | 20,094,623 | |
| | | | | | | | | |
| Health Care (4.36%) | | | | | | | | |
| DaVita HealthCare Partners, Inc., Sr. Unsec. | | | | | | | | |
| 5.75%, 08/15/2022 | | | 6,000,000 | | | | 6,247,500 | |
| Hologic, Inc., Sr. Unsec. | | | | | | | | |
5.25%, 07/15/2022(a) | | | 5,000,000 | | | | 5,206,250 | |
| Tenet Healthcare Corp., First Lien | | | | | | | | |
4.35%, 06/15/2020(b) | | | 2,765,000 | | | | 2,778,825 | |
| Total Health Care | | | | | | | 14,232,575 | |
| | | | | | | | | |
| Industrials (10.79%) | | | | | | | | |
| ADT Corp., First Lien | | | | | | | | |
| 6.25%, 10/15/2021 | | | 9,500,000 | | | | 10,283,750 | |
| Aircastle Ltd., Sr. Unsec. | | | | | | | | |
| 6.25%, 12/01/2019 | | | 500,000 | | | | 541,250 | |
See Notes to Financial Statements.
RiverFront Strategic Income Fund
| Schedule of Investments | November 30, 2016 |
| Security Description | | Principal Amount | | | Value | |
| Industrials (continued) | | | | | | |
| Case New Holland Industrial, Inc., Sr. Unsec. | | | | | | |
| 7.88%, 12/01/2017 | | $ | 3,205,000 | | | $ | 3,389,640 | |
| Owens‐Brockway Glass Container, Inc., Sr. Unsec. | | | | | | | | |
5.00%, 01/15/2022(a) | | | 6,145,000 | | | | 6,290,944 | |
| United Rentals North America, Inc., Sr. Unsec. | | | | | | | | |
| 7.63%, 04/15/2022 | | | 1,434,000 | | | | 1,523,625 | |
| 5.75%, 11/15/2024 | | | 3,000,000 | | | | 3,120,000 | |
| WESCO Distribution, Inc., Sr. Unsec. | | | | | | | | |
| 5.38%, 12/15/2021 | | | 9,750,000 | | | | 10,066,875 | |
| Total Industrials | | | | | | | 35,216,084 | |
| | | | | | | | | |
| Information Technology (2.41%) | | | | | | | | |
| Flextronics International Ltd., Sr. Unsec. | | | | | | | | |
| 5.00%, 02/15/2023 | | | 2,682,000 | | | | 2,856,011 | |
| SS&C Technologies Holdings, Inc., Sr. Unsec. | | | | | | | | |
| 5.88%, 07/15/2023 | | | 4,900,000 | | | | 5,022,500 | |
| Total Information Technology | | | | | | | 7,878,511 | |
| | | | | | | | | |
| Materials (14.55%) | | | | | | | | |
| AK Steel Corp., First Lien | | | | | | | | |
| 7.50%, 07/15/2023 | | | 1,000,000 | | | | 1,090,000 | |
| Ball Corp., Sr. Unsec. | | | | | | | | |
| 5.00%, 03/15/2022 | | | 8,106,000 | | | | 8,572,095 | |
| Cascades, Inc., Sr. Unsec. | | | | | | | | |
5.50%, 07/15/2022(a) | | | 500,000 | | | | 509,375 | |
| Celanese US Holdings LLC, Sr. Unsec. | | | | | | | | |
| 5.88%, 06/15/2021 | | | 7,220,000 | | | | 8,081,274 | |
| Graphic Packaging International, Inc., Sr. Unsec. | | | | | | | | |
| 4.75%, 04/15/2021 | | | 645,000 | | | | 682,088 | |
| 4.88%, 11/15/2022 | | | 4,615,000 | | | | 4,776,525 | |
| Huntsman Intl LLC, Sr. Unsec. | | | | | | | | |
| 4.88%, 11/15/2020 | | | 8,588,000 | | | | 8,867,109 | |
| Silgan Holdings, Inc., Sr. Unsec. | | | | | | | | |
| 5.00%, 04/01/2020 | | | 7,736,000 | | | | 7,910,060 | |
| Teck Resources Ltd., Sr. Unsec. | | | | | | | | |
8.00%, 06/01/2021(a) | | | 2,545,000 | | | | 2,801,791 | |
| Vale Overseas Ltd., Sr. Unsec. | | | | | | | | |
| 5.88%, 06/10/2021 | | | 4,000,000 | | | | 4,202,000 | |
| Total Materials | | | | | | | 47,492,317 | |
| | | | | | | | | |
| Telecommunication Services (10.00%) | | | | | | | | |
| CenturyLink, Inc., Sr. Unsec., Series V | | | | | | | | |
| 5.63%, 04/01/2020 | | | 8,525,000 | | | | 8,908,625 | |
| Frontier Communications Corp., Sr. Unsec. | | | | | | | | |
| 8.13%, 10/01/2018 | | | 8,199,000 | | | | 8,773,422 | |
| Security Description | | Principal Amount | | | Value | |
| Telecommunication Services (continued) | | | | | |
| Sprint Communications, Inc., Sr. Unsec. | | | | | | |
| 6.00%, 12/01/2016 | | $ | 5,000,000 | | | $ | 5,000,000 | |
| T‐Mobile USA, Inc., Sr. Unsec. | | | | | | | |
| 6.13%, 01/15/2022 | | | 4,000,000 | | | | 4,198,320 | |
| 6.73%, 04/28/2022 | | | 5,500,000 | | | | 5,760,425 | |
| Total Telecommunication Services | | | | | | 32,640,792 | |
| | | | | | | | | |
| Utilities (3.35%) | | | | | | | | |
| AES Corp., Sr. Unsec. | | | | | | | | |
| 8.00%, 06/01/2020 | | | 4,135,000 | | | | 4,837,950 | |
| Dynegy, Inc., Sr. Unsec. | | | | | | | | |
| 6.75%, 11/01/2019 | | | 6,000,000 | | | | 6,090,000 | |
| Total Utilities | | | | | | | 10,927,950 | |
| | | | | | | | | |
TOTAL CORPORATE BONDS
(Cost $292,632,253) | | | | | | 299,946,979 | |
| Security Description | | 7 Day Yield | | | Shares | | | Value | |
| SHORT TERM INVESTMENTS (6.77%) | | | | | |
| State Street Institutional Treasury Plus Money Market Fund | | | 0.259 | % | | | 22,116,268 | | | | 22,116,268 | |
TOTAL SHORT TERM INVESTMENTS (Cost $22,116,268) | | | | 22,116,268 | |
| | | | | | | | | | | | | |
TOTAL INVESTMENTS (98.63%)
(Cost $314,748,521) | | | | | | | $ | 322,063,247 | |
| | | | | | | | | | | | | |
| NET OTHER ASSETS AND LIABILITIES (1.37%) | | | | 4,451,738 | |
| | | | | | | | | | | | | |
| NET ASSETS (100.00%) | | | | | | | | | | $ | 326,514,985 | |
(a) | Securities exempt from registration under Rule 144A of the Securities Act of 1933. These securities may be sold in the ordinary course of business in transactions exempt from registration, normally to qualified institutional buyers. At period end, the aggregate market value of those securities was $39,664,604, representing 12.15% of net assets. |
(b) | Interest rate will change at a future date. Interest rate shown reflects the rate in effect at November 30, 2016. |
See Notes to Financial Statements.
RiverFront ETFs
| Statement of Assets and Liabilities | November 30, 2016 |
| | | RiverFront Dynamic Core Income ETF | | | RiverFront Dynamic Unconstrained Income ETF | | | RiverFront Dynamic US Dividend Advantage ETF | | | RiverFront Dynamic US Flex‐Cap ETF | | | RiverFront Strategic Income Fund | |
| ASSETS: | | | | | | | | | | | | | | | |
| Investments, at value | | $ | 5,920,742 | | | $ | 5,031,814 | | | $ | 13,265,488 | | | $ | 8,042,239 | | | $ | 322,063,247 | |
| Cash | | | 115,399 | | | | – | | | | – | | | | – | | | | – | |
| Interest receivable | | | 47,424 | | | | 80,144 | | | | – | | | | – | | | | 4,494,680 | |
Dividend receivable | | | – | | | | – | | | | 35,920 | | | | 13,226 | | | | – | |
Total Assets | | | 6,083,565 | | | | 5,111,958 | | | | 13,301,408 | | | | 8,055,465 | | | | 326,557,927 | |
| | | | | | | | | | | | | | | | | | | | | |
| LIABILITIES: | | | | | | | | | | | | | | | | | | | | |
Payable to adviser | | | 2,414 | | | | 2,130 | | | | 4,726 | | | | 2,582 | | | | 42,942 | |
Total Liabilities | | | 2,414 | | | | 2,130 | | | | 4,726 | | | | 2,582 | | | | 42,942 | |
| NET ASSETS | | $ | 6,081,151 | | | $ | 5,109,828 | | | $ | 13,296,682 | | | $ | 8,052,883 | | | $ | 326,514,985 | |
| | | | | | | | | | | | | | | | | | | | | |
| NET ASSETS CONSIST OF: | | | | | | | | | | | | | | | | | | | | |
| Paid‐in capital | | $ | 6,252,561 | | | $ | 5,000,000 | | | $ | 12,915,193 | | | $ | 7,854,219 | | | $ | 329,096,584 | |
| Accumulated net investment income | | | 192 | | | | 627 | | | | 2,375 | | | | – | | | | 21,699 | |
| Accumulated net realized loss | | | (48,011 | ) | | | (8,807 | ) | | | (120,107 | ) | | | (115,491 | ) | | | (9,918,024 | ) |
| Net unrealized appreciation/(depreciation) | | | (123,591 | ) | | | 118,008 | | | | 499,221 | | | | 314,155 | | | | 7,314,726 | |
| NET ASSETS | | $ | 6,081,151 | | | $ | 5,109,828 | | | $ | 13,296,682 | | | $ | 8,052,883 | | | $ | 326,514,985 | |
| | | | | | | | | | | | | | | | | | | | | |
| INVESTMENTS, AT COST | | $ | 6,044,333 | | | $ | 4,913,806 | | | $ | 12,766,267 | | | $ | 7,728,079 | | | $ | 314,748,521 | |
| | | | | | | | | | | | | | | | | | | | | |
| PRICING OF SHARES | | | | | | | | | | | | | | | | | | | | |
| Net Assets | | $ | 6,081,151 | | | $ | 5,109,828 | | | $ | 13,296,682 | | | $ | 8,052,883 | | | $ | 326,514,985 | |
| Shares of beneficial interest outstanding (Unlimited number of shares authorized, par value $0.01 per share) | | | 250,000 | | | | 200,000 | | | | 500,002 | | | | 300,002 | | | | 13,050,000 | |
| Net Asset Value, offering and redemption price per share | | $ | 24.32 | | | $ | 25.55 | | | $ | 26.59 | | | $ | 26.84 | | | $ | 25.02 | |
See Notes to Financial Statements.
RiverFront ETFs
| Statement of Operations | For the Period or Year Ended November 30, 2016(a)(b) |
| | | RiverFront Dynamic Core Income ETF(a) | | | RiverFront Dynamic Unconstrained Income ETF(a) | | | RiverFront Dynamic US Dividend Advantage ETF(b) | | | RiverFront Dynamic US Flex‐Cap ETF(b) | | | RiverFront Strategic Income Fund | |
| INVESTMENT INCOME: | | | | | | | | | | | | | | | |
| Interest | | $ | 40,971 | | | $ | 138,134 | | | $ | – | | | $ | – | | | $ | 16,880,821 | |
| Dividends | | | 245 | | | | 730 | | | | 91,805 | | | | 47,701 | | | | 58,813 | |
Foreign taxes withheld on dividends | | | – | | | | – | | | | (130 | ) | | | (66 | ) | | | – | |
Total Investment Income | | | 41,216 | | | | 138,864 | | | | 91,675 | | | | 47,635 | | | | 16,939,634 | |
| | | | | | | | | | | | | | | | | | | | | |
| EXPENSES: | | | | | | | | | | | | | | | | | | | | |
Investment adviser and sub‐adviser fees (note 3) | | | 8,001 | | | | 12,164 | | | | 18,022 | | | | 13,307 | | | | 1,759,443 | |
| Total Expenses before waiver/reimbursement | | | 8,001 | | | | 12,164 | | | | 18,022 | | | | 13,307 | | | | 1,759,443 | |
| Less fees waived/reimbursed by sub‐adviser (note 3) | | | – | | | | – | | | | – | | | | – | | | | (1,097,802 | ) |
Net Expenses | | | 8,001 | | | | 12,164 | | | | 18,022 | | | | 13,307 | | | | 661,641 | |
NET INVESTMENT INCOME | | | 33,215 | | | | 126,700 | | | | 73,653 | | | | 34,328 | | | | 16,277,993 | |
| | | | | | | | | | | | | | | | | | | | | |
| REALIZED AND UNREALIZED GAIN/(LOSS) | | | | | | | | | | | | | |
| Net realized gain/(loss) on investments | | | (47,984 | ) | | | (8,757 | ) | | | (22,926 | ) | | | 29,526 | | | | (1,305,008 | ) |
| Net realized gain on foreign currency transactions | | | – | | | | – | | | | – | | | | 84 | | | | – | |
NET REALIZED GAIN/(LOSS) | | | (47,984 | ) | | | (8,757 | ) | | | (22,926 | ) | | | 29,610 | | | | (1,305,008 | ) |
| Net change in unrealized appreciation/(depreciation) on investments | | | (123,591 | ) | | | 118,008 | | | | 499,221 | | | | 314,160 | | | | 13,124,646 | |
| Net change in unrealized depreciation on translation of assets and liabilities denominated in foreign currencies | | | – | | | | – | | | | – | | | | (5 | ) | | | – | |
| NET CHANGE IN UNREALIZED APPRECIATION/(DEPRECIATION) | | | (123,591 | ) | | | 118,008 | | | | 499,221 | | | | 314,155 | | | | 13,124,646 | |
NET REALIZED AND UNREALIZED GAIN/LOSS ON INVESTMENTS | | | (171,575 | ) | | | 109,251 | | | | 476,295 | | | | 343,765 | | | | 11,819,638 | |
| NET INCREASE/(DECREASE) IN NET ASSETS RESULTING FROM OPERATIONS | | $ | (138,360 | ) | | $ | 235,951 | | | $ | 549,948 | | | $ | 378,093 | | | $ | 28,097,631 | |
| (a) | The RiverFront Dynamic Core Income ETF and RiverFront Dynamic Unconstrained Income ETF commenced operations on June 14, 2016. |
| (b) | The RiverFront Dynamic US Dividend Advantage ETF and RiverFront Dynamic US Flex-Cap ETF commenced operations on June 7, 2016. |
See Notes to Financial Statements.
RiverFront Dynamic Core Income ETF
Statement of Changes in Net Assets
| | | For the Period June 14, 2016 (Commencement) to November 30, 2016 | |
| OPERATIONS: | | | |
| Net investment income | | $ | 33,215 | |
| Net realized loss | | | (47,984 | ) |
Net change in unrealized depreciation | | | (123,591 | ) |
Net decrease in net assets resulting from operations | | | (138,360 | ) |
| | | | | |
| DISTRIBUTIONS TO SHAREHOLDERS: | | | | |
From net investment income | | | (33,050 | ) |
Total distributions | | | (33,050 | ) |
| | | | | |
| CAPITAL SHARE TRANSACTIONS: | | | | |
Proceeds from sale of shares | | | 6,252,561 | |
Net increase from share transactions | | | 6,252,561 | |
| | | | | |
| Net increase in net assets | | | 6,081,151 | |
| | | | | |
| NET ASSETS: | | | | |
Beginning of period | | | – | |
| End of period* | | $ | 6,081,151 | |
| | | | | |
| *Including accumulated net investment income of: | | $ | 192 | |
| | | | | |
| OTHER INFORMATION: | | | | |
| CAPITAL SHARE TRANSACTIONS: | | | | |
| Beginning shares | | | – | |
| Shares sold | | | 250,000 | |
Shares redeemed | | | – | |
| Shares outstanding, end of period | | | 250,000 | |
See Notes to Financial Statements.
RiverFront Dynamic Unconstrained Income ETF
Statement of Changes in Net Assets
| | | For the Period June 14, 2016 (Commencement) to November 30, 2016 | |
| OPERATIONS: | | | |
| Net investment income | | $ | 126,700 | |
| Net realized loss | | | (8,757 | ) |
Net change in unrealized appreciation | | | 118,008 | |
Net increase in net assets resulting from operations | | | 235,951 | |
| | | | | |
| DISTRIBUTIONS TO SHAREHOLDERS: | | | | |
From net investment income | | | (126,123 | ) |
Total distributions | | | (126,123 | ) |
| | | | | |
| CAPITAL SHARE TRANSACTIONS: | | | | |
Proceeds from sale of shares | | | 5,000,000 | |
Net increase from share transactions | | | 5,000,000 | |
| | | | | |
| Net increase in net assets | | | 5,109,828 | |
| | | | | |
| NET ASSETS: | | | | |
Beginning of period | | | – | |
| End of period* | | $ | 5,109,828 | |
| | | | | |
| *Including accumulated net investment income of: | | $ | 627 | |
| | | | | |
| OTHER INFORMATION: | | | | |
| CAPITAL SHARE TRANSACTIONS: | | | | |
| Beginning shares | | | – | |
| Shares sold | | | 200,000 | |
Shares redeemed | | | – | |
| Shares outstanding, end of period | | | 200,000 | |
See Notes to Financial Statements.
RiverFront Dynamic US Dividend Advantage ETF
Statement of Changes in Net Assets
| | | For the Period June 7, 2016 (Commencement) to November 30, 2016 | |
| OPERATIONS: | | | |
| Net investment income | | $ | 73,653 | |
| Net realized loss | | | (22,926 | ) |
Net change in unrealized appreciation | | | 499,221 | |
Net increase in net assets resulting from operations | | | 549,948 | |
| | | | | |
| DISTRIBUTIONS TO SHAREHOLDERS: | | | | |
From net investment income | | | (71,278 | ) |
Total distributions | | | (71,278 | ) |
| | | | | |
| CAPITAL SHARE TRANSACTIONS: | | | | |
| Proceeds from sale of shares | | | 14,111,104 | |
Shares redeemed | | | (1,293,092 | ) |
Net increase from share transactions | | | 12,818,012 | |
| | | | | |
| Net increase in net assets | | | 13,296,682 | |
| | | | | |
| NET ASSETS: | | | | |
Beginning of period | | | – | |
| End of period* | | $ | 13,296,682 | |
| | | | | |
| *Including accumulated net investment income of: | | $ | 2,375 | |
| | | | | |
| OTHER INFORMATION: | | | | |
| CAPITAL SHARE TRANSACTIONS: | | | | |
| Beginning shares | | | – | |
| Shares sold | | | 550,002 | |
| Shares redeemed | | | (50,000 | ) |
| Shares outstanding, end of period | | | 500,002 | |
See Notes to Financial Statements.
RiverFront Dynamic US Flex-Cap ETF
Statement of Changes in Net Assets
| | | For the Period June 7, 2016 (Commencement) to November 30, 2016 | |
| OPERATIONS: | | | |
| Net investment income | | $ | 34,328 | |
| Net realized gain | | | 29,610 | |
Net change in unrealized appreciation | | | 314,155 | |
Net increase in net assets resulting from operations | | | 378,093 | |
| | | | | |
| DISTRIBUTIONS TO SHAREHOLDERS: | | | | |
From net investment income | | | (34,580 | ) |
Total distributions | | | (34,580 | ) |
| | | | | |
| CAPITAL SHARE TRANSACTIONS: | | | | |
| Proceeds from sale of shares | | | 10,289,247 | |
Shares redeemed | | | (2,579,877 | ) |
Net increase from share transactions | | | 7,709,370 | |
| | | | | |
| Net increase in net assets | | | 8,052,883 | |
| | | | | |
| NET ASSETS: | | | | |
Beginning of period | | | – | |
| End of period* | | $ | 8,052,883 | |
| | | | | |
| *Including accumulated net investment income of: | | $ | – | |
| | | | | |
| OTHER INFORMATION: | | | | |
| CAPITAL SHARE TRANSACTIONS: | | | | |
| Beginning shares | | | – | |
| Shares sold | | | 400,002 | |
| Shares redeemed | | | (100,000 | ) |
| Shares outstanding, end of period | | | 300,002 | |
See Notes to Financial Statements.
RiverFront Strategic Income Fund
Statements of Changes in Net Assets
| | | For the Year Ended November 30, 2016 | | | For the Year Ended November 30, 2015(a) | |
| OPERATIONS: | | | | | | |
| Net investment income | | $ | 16,277,993 | | | $ | 16,105,656 | |
Net realized loss(a) | | | (1,305,008 | ) | | | (7,547,910 | ) |
Net change in unrealized appreciation/(depreciation)(a) | | | 13,124,646 | | | | (5,832,347 | ) |
| Net increase in net assets resulting from operations | | | 28,097,631 | | | | 2,725,399 | |
| | | | | | | | | |
| DISTRIBUTIONS TO SHAREHOLDERS: | | | | | | | | |
| From net investment income | | | (16,281,197 | ) | | | (16,112,017 | ) |
| From net realized gains | | | – | | | | (228,129 | ) |
| Total distributions | | | (16,281,197 | ) | | | (16,340,146 | ) |
| | | | | | | | | |
| CAPITAL SHARE TRANSACTIONS: | | | | | | | | |
| Proceeds from sale of shares | | | 106,134,969 | | | | 160,403,465 | |
| Shares redeemed | | | (255,443,492 | ) | | | (51,846,799 | ) |
| Net increase/(decrease) from share transactions | | | (149,308,523 | ) | | | 108,556,666 | |
| | | | | | | | | |
| Net increase/(decrease) in net assets | | | (137,492,089 | ) | | | 94,941,919 | |
| | | | | | | | | |
| NET ASSETS: | | | | | | | | |
| Beginning of period | | | 464,007,074 | | | | 369,065,155 | |
| End of period* | | $ | 326,514,985 | | | $ | 464,007,074 | |
| | | | | | | | | |
| *Including accumulated net investment income of: | | $ | 21,699 | | | $ | 24,903 | |
| | | | | | | | | |
| OTHER INFORMATION: | | | | | | | | |
| CAPITAL SHARE TRANSACTIONS: | | | | | | | | |
| Beginning shares | | | 19,050,000 | | | | 14,750,002 | |
| Shares sold | | | 4,400,000 | | | | 6,400,000 | |
| Shares redeemed | | | (10,400,000 | ) | | | (2,100,002 | ) |
| Shares outstanding, end of period | | | 13,050,000 | | | | 19,050,000 | |
| | | | | | | | | |
(a) | Prior to November 30, 2016, the Fund presented realized gain/loss and unrealized appreciation/depreciation by investment type. This change in presentation was made to conform to industry standards and had no effect on the Fund's change in net assets. |
See Notes to Financial Statements.
RiverFront Dynamic Core Income ETF
| Financial Highlights | For a share outstanding throughout the period presented |
| | | For the Period June 14, 2016 (Commencement) to November 30, 2016 | |
| NET ASSET VALUE, BEGINNING OF PERIOD | | $ | 25.00 | |
| | | | | |
| INCOME/(LOSS) FROM INVESTMENT OPERATIONS: | | | | |
Net investment income(a) | | | 0.24 | |
| Net realized and unrealized loss | | | (0.68 | ) |
| Total from investment operations | | | (0.44 | ) |
| | | | | |
| DISTRIBUTIONS: | | | | |
| From net investment income | | | (0.24 | ) |
| Total distributions | | | (0.24 | ) |
| | | | | |
| NET (DECREASE) IN NET ASSET VALUE | | | (0.68 | ) |
| NET ASSET VALUE, END OF PERIOD | | $ | 24.32 | |
TOTAL RETURN(b) | | | (1.77 | )% |
| | | | | |
| RATIOS/SUPPLEMENTAL DATA: | | | | |
| Net assets, end of period (000s) | | $ | 6,081 | |
| | | | | |
| Ratio of expenses excluding waiver/reimbursement to average net assets | | | 0.51 | %(c) |
| Ratio of expenses including waiver/reimbursement to average net assets | | | 0.51 | %(c) |
| Ratio of net investment income including expenses waiver/reimbursement to average net assets | | | 2.12 | %(c) |
Portfolio turnover rate(d) | | | 26 | % |
(a) | Based on average shares outstanding during the period. |
(b) | Total return is calculated assuming an initial investment made at the net asset value at the beginning of the period and the redemption at the net asset value on the last day of the period and assuming all distributions are reinvested at the actual reinvestment prices. Total return calculated for a period of less than one year is not annualized. |
(d) | Portfolio turnover for periods less than one year are not annualized and does not include securities received or delivered from processing creations or redemptions in-kind. |
See Notes to Financial Statements.
RiverFront Dynamic Unconstrained Income ETF
| Financial Highlights | For a share outstanding throughout the period presented |
| | | For the Period June 14, 2016 (Commencement) to November 30, 2016 | |
| NET ASSET VALUE, BEGINNING OF PERIOD | | $ | 25.00 | |
| | | | | |
| INCOME/(LOSS) FROM INVESTMENT OPERATIONS: | | | | |
Net investment income(a) | | | 0.63 | |
| Net realized and unrealized gain | | | 0.55 | |
| Total from investment operations | | | 1.18 | |
| | | | | |
| DISTRIBUTIONS: | | | | |
| From net investment income | | | (0.63 | ) |
| Total distributions | | | (0.63 | ) |
| | | | | |
| NET INCREASE IN NET ASSET VALUE | | | 0.55 | |
| NET ASSET VALUE, END OF PERIOD | | $ | 25.55 | |
TOTAL RETURN(b) | | | 4.72 | % |
| | | | | |
| RATIOS/SUPPLEMENTAL DATA: | | | | |
| Net assets, end of period (000s) | | $ | 5,110 | |
| | | | | |
| Ratio of expenses excluding waiver/reimbursement to average net assets | | | 0.51 | %(c) |
| Ratio of expenses including waiver/reimbursement to average net assets | | | 0.51 | %(c) |
| Ratio of net investment income including expenses waiver/reimbursement to average net assets | | | 5.31 | %(c) |
Portfolio turnover rate(d) | | | 11 | % |
(a) | Based on average shares outstanding during the period. |
(b) | Total return is calculated assuming an initial investment made at the net asset value at the beginning of the period and the redemption at the net asset value on the last day of the period and assuming all distributions are reinvested at the actual reinvestment prices. Total return calculated for a period of less than one year is not annualized. |
(d) | Portfolio turnover for periods less than one year are not annualized and does not include securities received or delivered from processing creations or redemptions in-kind. |
See Notes to Financial Statements.
RiverFront Dynamic US Dividend Advantage ETF
| Financial Highlights | For a share outstanding throughout the period presented |
| | | For the Period June 7, 2016 (Commencement) to November 30, 2016 | |
| NET ASSET VALUE, BEGINNING OF PERIOD | | $ | 25.14 | |
| | | | | |
| INCOME/(LOSS) FROM INVESTMENT OPERATIONS: | | | | |
Net investment income(a) | | | 0.26 | |
| Net realized and unrealized gain | | | 1.40 | |
| Total from investment operations | | | 1.66 | |
| | | | | |
| DISTRIBUTIONS: | | | | |
| From net investment income | | | (0.21 | ) |
| Total distributions | | | (0.21 | ) |
| | | | | |
| NET INCREASE IN NET ASSET VALUE | | | 1.45 | |
| NET ASSET VALUE, END OF PERIOD | | $ | 26.59 | |
TOTAL RETURN(b) | | | 6.64 | % |
| | | | | |
| RATIOS/SUPPLEMENTAL DATA: | | | | |
| Net assets, end of period (000s) | | $ | 13,297 | |
| | | | | |
| Ratio of expenses excluding waiver/reimbursement to average net assets | | | 0.52 | %(c) |
| Ratio of expenses including waiver/reimbursement to average net assets | | | 0.52 | %(c) |
| Ratio of net investment income including expenses waiver/reimbursement to average net assets | | | 2.13 | %(c) |
Portfolio turnover rate(d) | | | 45 | % |
(a) | Based on average shares outstanding during the period. |
(b) | Total return is calculated assuming an initial investment made at the net asset value at the beginning of the period and the redemption at the net asset value on the last day of the period and assuming all distributions are reinvested at the actual reinvestment prices. Total return calculated for a period of less than one year is not annualized. |
(d) | Portfolio turnover for periods less than one year are not annualized and does not include securities received or delivered from processing creations or redemptions in-kind. |
See Notes to Financial Statements.
RiverFront Dynamic US Flex-Cap ETF
| Financial Highlights | For a share outstanding throughout the period presented |
| | | For the Period June 7, 2016 (Commencement) to November 30, 2016 | |
| NET ASSET VALUE, BEGINNING OF PERIOD | | $ | 25.13 | |
| | | | | |
| INCOME/(LOSS) FROM INVESTMENT OPERATIONS: | | | | |
Net investment income(a) | | | 0.17 | |
| Net realized and unrealized gain | | | 1.70 | |
| Total from investment operations | | | 1.87 | |
| | | | | |
| DISTRIBUTIONS: | | | | |
| From net investment income | | | (0.16 | ) |
| Total distributions | | | (0.16 | ) |
| | | | | |
| NET INCREASE IN NET ASSET VALUE | | | 1.71 | |
| NET ASSET VALUE, END OF PERIOD | | $ | 26.84 | |
TOTAL RETURN(b) | | | 7.45 | % |
| | | | | |
| RATIOS/SUPPLEMENTAL DATA: | | | | |
| Net assets, end of period (000s) | | $ | 8,053 | |
| | | | | |
| Ratio of expenses excluding waiver/reimbursement to average net assets | | | 0.52 | %(c) |
| Ratio of expenses including waiver/reimbursement to average net assets | | | 0.52 | %(c) |
| Ratio of net investment income including expenses waiver/reimbursement to average net assets | | | 1.34 | %(c) |
Portfolio turnover rate(d) | | | 41 | % |
(a) | Based on average shares outstanding during the period. |
(b) | Total return is calculated assuming an initial investment made at the net asset value at the beginning of the period and the redemption at the net asset value on the last day of the period and assuming all distributions are reinvested at the actual reinvestment prices. Total return calculated for a period of less than one year is not annualized. |
(d) | Portfolio turnover for periods less than one year are not annualized and does not include securities received or delivered from processing creations or redemptions in-kind. |
See Notes to Financial Statements.
RiverFront Strategic Income Fund
| Financial Highlights | For a share outstanding throughout the periods presented |
| | | For the Year Ended November 30, 2016 | | | For the Year Ended November 30, 2015 | | | For the Year Ended November 30, 2014 | | | For the Period October 8, 2013 (Commencement) to November 30, 2013 | |
| NET ASSET VALUE, BEGINNING OF PERIOD | | $ | 24.36 | | | $ | 25.02 | | | $ | 24.90 | | | $ | 24.42 | |
| | | | | | | | | | | | | | | | | |
| INCOME/(LOSS) FROM INVESTMENT OPERATIONS: | | | | | | | | | |
Net investment income(a) | | | 1.05 | | | | 0.88 | | | | 0.83 | | | | 0.11 | |
| Net realized and unrealized gain/(loss) | | | 0.71 | | | | (0.65 | ) | | | 0.11 | | | | 0.40 | |
| Total from investment operations | | | 1.76 | | | | 0.23 | | | | 0.94 | | | | 0.51 | |
| | | | | | | | | | | | | | | | | |
| DISTRIBUTIONS: | | | | | | | | | | | | | | | | |
| From net investment income | | | (1.10 | ) | | | (0.87 | ) | | | (0.82 | ) | | | (0.03 | ) |
| From net realized gains | | | – | | | | (0.02 | ) | | | – | | | | – | |
| Total distributions | | | (1.10 | ) | | | (0.89 | ) | | | (0.82 | ) | | | (0.03 | ) |
| | | | | | | | | | | | | | | | | |
| NET INCREASE/(DECREASE) IN NET ASSET VALUE | | | 0.66 | | | | (0.66 | ) | | | 0.12 | | | | 0.48 | |
| NET ASSET VALUE, END OF PERIOD | | $ | 25.02 | | | $ | 24.36 | | | $ | 25.02 | | | $ | 24.90 | |
TOTAL RETURN(b) | | | 7.38 | % | | | 0.91 | % | | | 3.80 | % | | | 2.08 | % |
| | | | | | | | | | | | | | | | | |
| RATIOS/SUPPLEMENTAL DATA: | | | | | | | | | | | | | | | | |
| Net assets, end of period (000s) | | $ | 326,515 | | | $ | 464,007 | | | $ | 369,065 | | | $ | 97,102 | |
| | | | | | | | | | | | | | | | | |
| Ratio of expenses excluding waiver/reimbursement to average net assets | | | 0.46 | % | | | 0.46 | % | | | 0.46 | % | | | 0.46 | %(c) |
| Ratio of expenses including waiver/reimbursement to average net assets | | | 0.17 | %(d) | | | 0.22 | % | | | 0.22 | % | | | 0.22 | %(c) |
| Ratio of net investment income including expenses waiver/reimbursement to average net assets | | | 4.26 | % | | | 3.54 | % | | | 3.30 | % | | | 3.28 | %(c) |
Portfolio turnover rate(e) | | | 52 | % | | | 36 | % | | | 27 | % | | | 0 | % |
| | | | | | | | | | | | | | | | | |
(a) | Based on average shares outstanding during the period. |
(b) | Total return is calculated assuming an initial investment made at the net asset value at the beginning of the period and the redemption at the net asset value on the last day of the period and assuming all distributions are reinvested at the actual reinvestment prices. Total return calculated for a period of less than one year is not annualized. |
(d) | Effective July 1, 2016, the Fund’s management fee consists of a fee of 0.16% paid to the Fund’s investment adviser and a fee of 0.30% paid to the Fund’s sub-adviser. The Fund’s sub-adviser will voluntarily waive all of its 0.30% annual sub-advisory fee payable by the Fund until March 31, 2018. |
(e) | Portfolio turnover for periods less than one year are not annualized and does not include securities received or delivered from processing creations or redemptions in-kind. |
See Notes to Financial Statements.
RiverFront ETFs
| Notes to Financial Statements | November 30, 2016 |
1. ORGANIZATION
ALPS ETF Trust (the “Trust”), a Delaware statutory trust, is an open‐end management investment company registered under the Investment Company Act of 1940, as amended (the “1940 Act”). As of November 30, 2016, the Trust consists of nineteen separate portfolios. Each portfolio represents a separate series of the Trust. This report pertains solely to the RiverFront Dynamic Core Income ETF, the RiverFront Dynamic Unconstrained Income ETF, the RiverFront Dynamic US Dividend Advantage ETF, the RiverFront Dynamic US Flex‐Cap ETF, and the RiverFront Strategic Income Fund (each a “Fund” and collectively, the “Funds”).
The investment objective of the RiverFront Dynamic Core Income ETF Fund is to seek total return, with an emphasis on income as the source of that total return. The Fund is considered non‐diversified and may invest a greater portion of assets in securities of individual issuers than a diversified fund. As a result, changes in the market value of a single investment could cause greater fluctuations in share price than would occur in a diversified fund. The RiverFront Dynamic Core Income ETF commenced operations on June 14, 2016.
The investment objective of the RiverFront Dynamic Unconstrained Income ETF Fund is to seek total return, with an emphasis on income as the source of that total return. The Fund is considered non‐diversified and may invest a greater portion of assets in securities of individual issuers than a diversified fund. As a result, changes in the market value of a single investment could cause greater fluctuations in share price than would occur in a diversified fund. The RiverFront Dynamic Unconstrained Income ETF commenced operations on June 14, 2016.
The investment objective of the RiverFront Dynamic US Dividend Advantage ETF Fund is to seek to provide capital appreciation and dividend income. The Fund is considered non‐diversified and may invest a greater portion of assets in securities of individual issuers than a diversified fund. As a result, changes in the market value of a single investment could cause greater fluctuations in share price than would occur in a diversified fund. The RiverFront US Dividend Advantage ETF commenced operations on June 7, 2016.
The investment objective of the RiverFront Dynamic US Flex‐Cap ETF Fund is to seek to provide capital appreciation. The Fund is considered non‐diversified and may invest a greater portion of assets in securities of individual issuers than a diversified fund. As a result, changes in the market value of a single investment could cause greater fluctuations in share price than would occur in a diversified fund. The RiverFront US Flex‐Cap ETF commenced operations on June 7, 2016.
The investment objective of the RiverFront Strategic Income Fund is to seek total return, with an emphasis on income as the source of that total return. The Fund is considered non‐diversified and may invest a greater portion of assets in securities of individual issuers than a diversified fund. As a result, changes in the market value of a single investment could cause greater fluctuations in share price than would occur in a diversified fund. The RiverFront Strategic Income Fund commenced operations on October 8, 2013.
Each Fund’s Shares (“Shares”) are listed on the New York Stock Exchange (“NYSE”) Arca. Each Fund issues and redeems Shares at net asset value (“NAV”) in blocks of 50,000 Shares, each of which is called a “Creation Unit”. Creation Units are issued and redeemed principally in‐kind for securities and/or cash. Except when aggregated in Creation Units, Shares are not redeemable securities of a Fund.
Pursuant to the Trust’s organizational documents, its Officers and Trustees are indemnified against certain liability arising out of the performance of their duties to the Trust. Additionally, in the normal course of business, the Trust enters into contracts with service providers that contain general indemnification clauses. The Trust’s maximum exposure under these arrangements is unknown, as this would involve future claims that may be made against the Trust that have not yet occurred.
2. SIGNIFICANT ACCOUNTING POLICIES
The following is a summary of significant accounting policies consistently followed by the Funds in the preparation of the financial statements. The accompanying financial statements were prepared in accordance with accounting principles generally accepted in the United States of America (“U.S. GAAP”). The preparation of financial statements in conformity with U.S. GAAP requires management to make certain estimates and assumptions that affect the reported amounts of assets and liabilities and disclosures of contingent assets and liabilities at the date of the financial statements and the reported amounts of revenue and expenses during the period. Actual results could differ from those estimates. Each Fund is considered an investment company under U.S. GAAP and follows the accounting and reporting guidance applicable to investment companies in the Financial Accounting Standards Board Accounting Standards Codification Topic 946.
RiverFront ETFs
| Notes to Financial Statements | November 30, 2016 |
A. Portfolio Valuation
Each Fund’s NAV is determined daily, as of the close of regular trading on the NYSE, normally 4:00 p.m. Eastern time, on each day the NYSE is open for trading. The NAV is computed by dividing the value of all assets of each Fund (including accrued interest and dividends), less all liabilities (including accrued expenses and dividends declared but unpaid), by the total number of shares outstanding.
Portfolio securities listed on any exchange other than the NASDAQ Stock Market LLC (“NASDAQ”) are valued at the last sale price on the business day as of which such value is being determined. If there has been no sale on such day, the securities are valued at the mean of the most recent bid and ask prices on such day. Securities traded on the NASDAQ are valued at the NASDAQ Official Closing Price as determined by NASDAQ. Portfolio securities traded on more than one securities exchange are valued at the last sale price on the business day as of which such value is being determined at the close of the exchange representing the principal market for such securities. Portfolio securities traded in the over‐the‐counter market, but excluding securities traded on the NASDAQ, are valued at the last quoted sale price in such market.
Corporate bonds and United States government bonds are typically valued at the mean between the evaluated bid and ask prices formulated by an independent pricing service.
Each Fund’s investments are valued at market value or, in the absence of market value with respect to any portfolio securities, at fair value according to procedures adopted by the Trust’s Board of Trustees (the “Board”). When market quotations are not readily available or when events occur that make established valuation methods unreliable, securities of the Funds may be valued in good faith by or under the direction of the Board. These securities generally include, but are not limited to, restricted securities (securities which may not be publicly sold without registration under the Securities Act of 1933) for which a pricing service is unable to provide a market price; securities whose trading has been formally suspended; a security whose market price is not available from a pre‐established primary pricing source or the pricing source is not willing to provide a price; a security with respect to which an event has occurred that is most likely to materially affect the value of the security after the market has closed but before the calculation of a Fund’s NAV or make it difficult or impossible to obtain a reliable market quotation; or a security whose price, as provided by the pricing service, does not reflect the security’s “fair value” due to the security being de‐listed from a national exchange or the security’s primary trading market is temporarily closed at a time when, under normal conditions, it would be open. As a general principle, the current “fair value” of a security would be the amount which the owner might reasonably expect to receive from the sale on the applicable exchange or principal market. A variety of factors may be considered in determining the fair value of such securities.
B. Fair Value Measurements
Each Fund discloses the classification of its fair value measurements following a three‐tier hierarchy based on the inputs used to measure fair value. Inputs refer broadly to the assumptions that market participants would use in pricing the asset or liability, including assumptions about risk. Inputs may be observable or unobservable. Observable inputs reflect the assumptions market participants would use in pricing the asset or liability that are developed based on market data obtained from sources independent of the reporting entity. Unobservable inputs reflect the reporting entity’s own assumptions about the assumptions market participants would use in pricing the asset or liability that are developed based on the best information available.
Valuation techniques used to value the Funds’ investments by major category are as follows:
Equity securities, including restricted securities, for which market quotations are readily available, are valued at the last reported sale price or official closing price as reported by a third party pricing vendor on the primary market or exchange on which they are traded and are categorized as Level 1 in the hierarchy. In the event there were no sales during the day or closing prices are not available, securities are valued at the mean of the most recent quoted bid and ask prices on such day and are generally categorized as Level 2 in the hierarchy. Investments in open‐end mutual funds are valued at their closing NAV each business day and are categorized as Level 1 in the hierarchy.
Debt securities, including restricted securities, are valued based on evaluated prices received from third party pricing vendors or from brokers who make markets in such securities. For corporate bonds, pricing vendors utilize matrix pricing which considers yield or price of bonds of comparable quality, coupon, maturity and type as well as broker‐supplied prices. When independent prices are unavailable or unreliable, debt securities may be valued utilizing pricing methodologies which consider similar factors that would be used by third party pricing vendors. Debt securities are generally categorized as Level 2 in the hierarchy but may be Level 3 depending on the circumstances. The RiverFront Dynamic Core Income ETF, the RiverFront Dynamic Unconstrained Income ETF, and the RiverFront Strategic Income Fund may invest a significant portion of their assets in below investment grade securities. The value of these securities can be more volatile due to changes in the credit quality of the issuer and is sensitive to changes in economic, market and regulatory conditions.
Changes in valuation techniques may result in transfers in or out of an assigned level within the disclosure hierarchy.
RiverFront ETFs
| Notes to Financial Statements | November 30, 2016 |
Various inputs are used in determining the value of each Fund’s investments as of the end of the reporting period. When inputs used fall into different levels of the fair value hierarchy, the level in the hierarchy within which the fair value measurement falls is determined based on the lowest level input that is significant to the fair value measurement in its entirety. The designated input levels are not necessarily an indication of the risk or liquidity associated with these investments.
These inputs are categorized in the following hierarchy under applicable financial accounting standards:
| Level 1 – | Unadjusted quoted prices in active markets for identical investments, unrestricted assets or liabilities that a Fund has the ability to access at the measurement date; |
| Level 2 – | Quoted prices which are not active, quoted prices for similar assets or liabilities in active markets or inputs other than quoted prices that are observable (either directly or indirectly) for substantially the full term of the asset or liability; and |
| Level 3 – | Significant unobservable prices or inputs (including the Fund’s own assumptions in determining the fair value of investments) where there is little or no market activity for the asset or liability at the measurement date. |
The following is a summary of the inputs used to value the Funds’ investments as of November 30, 2016:
RiverFront Dynamic Core Income ETF
| Investments in Securities at Value | | Level 1 - Unadjusted Quoted Prices | | | Level 2 - Other Significant Observable Inputs | | | Level 3 - Significant Unobservable Inputs | | | Total | |
| Corporate Bonds* | | $ | – | | | $ | 5,409,222 | | | $ | – | | | $ | 5,409,222 | |
| Government Bonds | | | – | | | | 267,488 | | | | – | | | | 267,488 | |
Short Term Investments | | | 244,032 | | | | – | | | | – | | | | 244,032 | |
| TOTAL | | $ | 244,032 | | | $ | 5,676,710 | | | $ | – | | | $ | 5,920,742 | |
RiverFront Dynamic Unconstrained Income ETF
| Investments in Securities at Value | | Level 1 - Unadjusted Quoted Prices | | | Level 2 - Other Significant Observable Inputs | | | Level 3 - Significant Unobservable Inputs | | | Total | |
| Corporate Bonds* | | $ | – | | | $ | 4,884,456 | | | $ | – | | | $ | 4,884,456 | |
Short Term Investments | | | 147,358 | | | | – | | | | – | | | | 147,358 | |
| TOTAL | | $ | 147,358 | | | $ | 4,884,456 | | | $ | – | | | $ | 5,031,814 | |
RiverFront Dynamic US Dividend Advantage ETF
| Investments in Securities at Value | | Level 1 - Unadjusted Quoted Prices | | | Level 2 - Other Significant Observable Inputs | | | Level 3 - Significant Unobservable Inputs | | | Total | |
| Common Stocks* | | $ | 13,260,464 | | | $ | – | | | $ | – | | | $ | 13,260,464 | |
Short Term Investments | | | 5,024 | | | | – | | | | – | | | | 5,024 | |
| TOTAL | | $ | 13,265,488 | | | $ | – | | | $ | – | | | $ | 13,265,488 | |
RiverFront Dynamic US Flex‐Cap ETF
| Investments in Securities at Value | | Level 1 - Unadjusted Quoted Prices | | | Level 2 - Other Significant Observable Inputs | | | Level 3 - Significant Unobservable Inputs | | | Total | |
| Common Stocks* | | $ | 8,040,172 | | | $ | – | | | $ | – | | | $ | 8,040,172 | |
Short Term Investments | | | 2,067 | | | | – | | | | – | | | | 2,067 | |
| TOTAL | | $ | 8,042,239 | | | $ | – | | | $ | – | | | $ | 8,042,239 | |
RiverFront ETFs
| Notes to Financial Statements | November 30, 2016 |
RiverFront Strategic Income Fund
| Investments in Securities at Value | | Level 1 - Unadjusted Quoted Prices | | | Level 2 - Other Significant Observable Inputs | | | Level 3 - Significant Unobservable Inputs | | | Total | |
| Corporate Bonds* | | $ | – | | | $ | 299,946,979 | | | $ | – | | | $ | 299,946,979 | |
Short Term Investments | | | 22,116,268 | | | | – | | | | – | | | | 22,116,268 | |
| TOTAL | | $ | 22,116,268 | | | $ | 299,946,979 | | | $ | – | | | $ | 322,063,247 | |
| * | For a detailed sector breakdown, see the accompanying Schedule of Investments. |
The Funds recognize transfers between levels as of the end of the period. For the year or period ended November 30, 2016, the Funds did not have any transfers between Level 1 and Level 2 securities. The Funds did not have any securities that used significant unobservable inputs (Level 3) in determining fair value.
C. Securities Transactions and Investment Income
Securities transactions are recorded as of the trade date. Realized gains and losses from securities transactions are recorded on the highest cost basis. Dividend income and capital gains distributions, if any, are recorded on the ex‐dividend date. Interest income, if any, is recorded on the accrual basis, including amortization of premiums and accretion of discounts.
D. Dividends and Distributions to Shareholders
Dividends from net investment income for each Fund, if any, are declared and paid monthly or as the Board may determine from time to time. Distributions of net realized capital gains earned by the Funds, if any, are distributed at least annually.
E. Federal Tax and Tax Basis Information
The timing and character of income and capital gain distributions are determined in accordance with income tax regulations, which may differ from U.S. GAAP. Reclassifications are made to the Funds’ capital accounts for permanent tax differences to reflect income and gains available for distribution (or available capital loss carryforwards) under income tax regulations.
For the year or period ended November 30, 2016, the following reclassifications, which had no impact on results of operations or net assets, were recorded to reflect permanent tax differences resulting primarily from in‐kind transactions:
| Fund | | Paid-in Capital | | | Accumulated Net Investment Income/(Loss) | | | Accumulated Net Realized Gain/(Loss) on Investments | |
| RiverFront Dynamic Core Income ETF | | $ | – | | | $ | 27 | | | $ | (27 | ) |
| RiverFront Dynamic Unconstrained Income ETF | | | – | | | | 50 | | | | (50 | ) |
| RiverFront Dynamic US Dividend Advantage ETF | | | 97,181 | | | | – | | | | (97,181 | ) |
| RiverFront Dynamic US Flex‐Cap ETF | | | 144,849 | | | | 252 | | | | (145,101 | ) |
| RiverFront Strategic Income Fund | | | 1,609,245 | | | | – | | | | (1,609,245 | ) |
The tax character of the distributions paid by the Funds during the fiscal year or period ended November 30, 2016 were as follows:
| | Ordinary Income | |
| November 30, 2016 | | | |
| RiverFront Dynamic Core Income ETF | | $ | 33,050 | |
| RiverFront Dynamic Unconstrained Income ETF | | | 126,123 | |
| RiverFront Dynamic US Dividend Advantage ETF | | | 71,278 | |
RiverFront Dynamic US Flex‐Cap ETF | | | 34,555 | |
| RiverFront Strategic Income Fund | | | 16,281,197 | |
RiverFront ETFs
| Notes to Financial Statements | November 30, 2016 |
The tax character of the distributions paid by the RiverFront Strategic Income Fund during the fiscal year ended November 30, 2015 were as follows:
| | | Ordinary Income | | | Long-Term Capital Gain | |
| November 30, 2015 | | | | | | |
| RiverFront Strategic Income Fund | | $ | 16,315,420 | | | $ | 24,726 | |
As of November 30, 2016, the components of distributable earnings on a tax basis were as follows:
| | | RiverFront Dynamic Core Income ETF | | | RiverFront Dynamic Unconstrained Income ETF | | | RiverFront Dynamic US Dividend Advantage ETF | | | RiverFront Dynamic US Flex-Cap ETF | | | RiverFront Strategic Income Fund | |
| Accumulated net investment income | | $ | 192 | | | $ | 627 | | | $ | 2,375 | | | $ | – | | | $ | 21,699 | |
| Accumulated net realized loss on investments | | | (48,011 | ) | | | (8,807 | ) | | | (118,722 | ) | | | (115,491 | ) | | | (9,858,004 | ) |
Net unrealized appreciation/(depreciation) on investments | | | (123,591 | ) | | | 118,008 | | | | 497,836 | | | | 314,155 | | | | 7,254,706 | |
| Total | | $ | (171,410 | ) | | $ | 109,828 | | | $ | 381,489 | | | $ | 198,664 | | | $ | (2,581,599 | ) |
As of November 30, 2016, the cost of investments for federal income tax purposes and accumulated net unrealized appreciation/(depreciation) on investments were as follows:
| | RiverFront Dynamic Core Income ETF | | | RiverFront Dynamic Unconstrained Income ETF | | | RiverFront Dynamic US Dividend Advantage ETF | | | RiverFront Dynamic US Flex-Cap ETF | | | RiverFront Strategic Income Fund | |
| Gross appreciation (excess of value over tax cost) | | $ | 5,892 | | | $ | 147,783 | | | $ | 771,547 | | | $ | 449,439 | | | $ | 7,422,750 | |
| Gross depreciation (excess of tax cost over value) | | | (129,483 | ) | | | (29,775 | ) | | | (273,711 | ) | | | (135,279 | ) | | | (168,044 | ) |
| Net appreciation/(depreciation) of foreign currency | | | – | | | | – | | | | – | | | | (5 | ) | | | – | |
| Net unrealized appreciation (depreciation) | | | (123,591 | ) | | | 118,008 | | | | 497,836 | | | | 314,155 | | | | 7,254,706 | |
| Cost of investments for income tax purposes | | $ | 6,044,333 | | | $ | 4,913,806 | | | $ | 12,767,652 | | | $ | 7,728,079 | | | $ | 314,808,541 | |
The differences between book‐basis and tax‐basis are primarily due to the deferral of losses from wash sales.
At November 30, 2016, the Funds post‐enactment capital losses deferred to the next tax year were as follows:
| Fund | | Short-Term | | | Long-Term | |
| RiverFront Dynamic Core Income ETF | | $ | 48,011 | | | $ | – | |
| RiverFront Dynamic Unconstrained Income ETF | | | 8,807 | | | | – | |
| RiverFront Dynamic US Dividend Advantage ETF | | | 118,722 | | | | – | |
| RiverFront Dynamic US Flex‐Cap ETF | | | 115,491 | | | | – | |
| RiverFront Strategic Income Fund | | | 5,769,746 | | | | 4,088,258 | |
F. Income Taxes
No provision for income taxes is included in the accompanying financial statements, as each Fund intends to distribute to shareholders all taxable investment income and realized gains and otherwise comply with Subchapter M of the Internal Revenue Code of 1986, as amended, applicable to regulated investment companies. Each Fund evaluates tax positions taken (or expected to be taken) in the course of preparing the Funds’ tax returns to determine whether these positions meet a “more‐likely‐than‐not” standard that, based on the technical merits, have a more than fifty percent likelihood of being sustained by a taxing authority upon examination. A tax position that meets the “more‐likely‐than‐not” recognition threshold is measured to determine the amount of benefit to recognize in the financial statements.
RiverFront ETFs
| Notes to Financial Statements | November 30, 2016 |
As of and during the year or period ended November 30, 2016, the Funds did not have a liability for any unrecognized tax benefits. Each Fund files U.S. federal, state, and local tax returns as required. Each Fund’s tax returns are subject to examination by the relevant tax authorities until expiration of the applicable statute of limitations, which is generally three years after the filing of the tax return, but may extend to four years in certain jurisdictions. Tax returns for open years have incorporated no uncertain tax positions that require a provision for income taxes. Being that the RiverFront Dynamic US Dividend Advantage ETF and the RiverFront Dynamic US Flex‐Cap ETF commenced operations on June 7, 2016 and the RiverFront Dynamic Core Income ETF and the RiverFront Dynamic Unconstrained Income ETF commenced operations on June 14, 2016, no tax returns have been filed for those Funds as of the date of this report.
3. INVESTMENT ADVISORY FEE AND OTHER AFFILIATED TRANSACTIONS
ALPS Advisors, Inc. (the “Adviser”) acts as each Fund’s investment adviser pursuant to an Advisory Agreement with the Trust on behalf of each Fund (the “Advisory Agreement”). Pursuant to the Advisory Agreement, each Fund pays the Adviser an annual management fee for the services and facilities it provides as a percentage of the relevant Fund’s average daily net assets as set out below:
| Fund | Advisory Fee |
| RiverFront Dynamic Core Income ETF | 0.51%(a) |
| RiverFront Dynamic Unconstrained Income ETF | 0.51%(a) |
| RiverFront Dynamic US Dividend Advantage ETF | 0.52%(b) |
RiverFront Dynamic US Flex‐Cap ETF | 0.52%(b) |
| RiverFront Strategic Income Fund | 0.46% |
(a) | The unitary advisory fee as a percentage of net assets is subject to the following breakpoints: (i) 0.51% for average net assets up to $600 million, (ii) 0.48% for average net assets equal to or greater than $600 million. |
(b) | The unitary advisory fee as a percentage of net assets is subject to the following breakpoints: (i) 0.52% for average net assets up to $600 million, (ii) 0.49% for average net assets equal to or greater than $600 million. |
Out of the advisory fee, the Adviser pays substantially all expenses of each Fund, including the cost of transfer agency, custody, fund administration, legal, audit, independent trustees and other services, except for interest expenses, distribution fees or expenses, brokerage expenses, taxes and extraordinary expenses such as litigation and other expenses not incurred in the ordinary course of the Fund’s business. The Adviser’s unitary management fee is designed to pay substantially all of each Fund’s expenses and to compensate the Adviser for providing services for the Funds.
RiverFront Investment Group, LLC acts as each Fund’s sub��adviser (“Sub‐Adviser”) pursuant to a sub‐advisory agreement with the Trust (the ‘‘Sub‐ Advisory Agreement’’). Pursuant to the Sub‐Advisory Agreement, the Adviser pays the Sub‐Adviser a sub‐advisory fee out of the Adviser’s advisory fee for the services it provides, payable on a monthly basis at the annual rate of the relevant Fund’s average daily net assets as set out below:
| Fund | Sub-Advisory Fee |
| RiverFront Dynamic Core Income ETF | 0.35% |
| RiverFront Dynamic Unconstrained Income ETF | 0.35% |
| RiverFront Dynamic US Dividend Advantage ETF | 0.35% |
RiverFront Dynamic US Flex‐Cap ETF | 0.35% |
| RiverFront Strategic Income Fund | 0.30%(c) |
(c) | Prior to March 31, 2016, the Fund paid the Sub-Adviser an annual management fee equal to 0.24%. Between April 1, 2016 and June 30, 2016, the Fund paid the Sub-Adviser an annual management fee equal to 0.35%. |
For the RiverFront Strategic Income Fund, the Sub‐Adviser has agreed to waive all of its sub‐advisory fee until March 31, 2018. This waiver may only be terminated by the Fund’s Board (and not by the Fund’s Sub‐Adviser) prior to such date.
ALPS Fund Services, Inc., an affiliate of the Adviser, is the administrator of the Funds.
Each Trustee who is not an officer or employee of the Adviser, any sub‐adviser or any of their affiliates (“Independent Trustees”) receives (1) a quarterly retainer of $5,000, (2) a per meeting fee for regularly scheduled meetings of $3,750, (3) $1,500 for any special meeting held outside of a regularly scheduled board meeting, and (4) reimbursement for all reasonable out‐of‐pocket expenses relating to attendance at meetings.
RiverFront ETFs
| Notes to Financial Statements | November 30, 2016 |
4. PURCHASES AND SALES OF SECURITIES
For the year or period ended November 30, 2016, the cost of purchases and proceeds from sales of investment securities, excluding in‐kind transactions and short‐term investments, were as follows:
| Fund | | Purchases | | | Sales | |
| RiverFront Dynamic Core Income ETF | | $ | 1,081,498 | | | $ | 925,347 | |
| RiverFront Dynamic Unconstrained Income ETF | | | 3,003,355 | | | | 521,770 | |
| RiverFront Dynamic US Dividend Advantage ETF | | | 3,601,323 | | | | 3,623,217 | |
| RiverFront Dynamic US Flex‐Cap ETF | | | 2,289,563 | | | | 2,292,109 | |
| RiverFront Strategic Income Fund | | | 185,206,958 | | | | 195,366,768 | |
For the year or period ended November 30, 2016, the cost of in‐kind purchases and proceeds from in‐kind sales were as follows:
| Fund | | Purchases | | | Sales | |
| RiverFront Dynamic Core Income ETF | | $ | 5,702,223 | | | $ | – | |
| RiverFront Dynamic Unconstrained Income ETF | | | 2,297,387 | | | | – | |
| RiverFront Dynamic US Dividend Advantage ETF | | | 14,106,290 | | | | 1,295,853 | |
| RiverFront Dynamic US Flex‐Cap ETF | | | 10,296,146 | | | | 2,594,864 | |
| RiverFront Strategic Income Fund | | | 94,253,252 | | | | 225,560,105 | |
For the year or period ended November 30, 2016, the in‐kind net realized gains/(losses) were as follows:
| Fund | | Net Realized Gain/(Loss) | |
| RiverFront Dynamic Core Income ETF | | $ | _ | |
| RiverFront Dynamic Unconstrained Income ETF | | | _ | |
| RiverFront Dynamic US Dividend Advantage ETF | | | 97,181 | |
| RiverFront Dynamic US Flex‐Cap ETF | | | 144,705 | |
| RiverFront Strategic Income Fund | | | 1,610,263 | |
Gains on in‐kind transactions are not considered taxable for federal income tax purposes.
5. CAPITAL SHARE TRANSACTIONS
Shares are created and redeemed by each Fund only in Creation Unit size aggregations of 50,000 Shares. Only broker‐dealers or large institutional investors with creation and redemption agreements called Authorized Participants (“AP”) are permitted to purchase or redeem Creation Units from each Fund. Such transactions are generally permitted on an in‐kind basis, with a balancing cash component to equate the transaction to the NAV per unit of each Fund on the transaction date. Cash may be substituted equivalent to the value of certain securities generally when they are not available in sufficient quantity for delivery, not eligible for trading by the AP or as a result of other market circumstances.
RiverFront ETFs
| Additional Information | November 30, 2016 (Unaudited) |
PROXY VOTING RECORDS, POLICIES AND PROCEDURES
Information regarding how each Fund voted proxies relating to portfolio securities during the most recent 12‐month period ended June 30 and a description of the Funds’ proxy voting policies and procedures used in determining how to vote for proxies are available without charge on the Securities and Exchange Commission’s (“SEC”) website at www.sec.gov and upon request, by calling (toll‐free) 1‐866‐675‐2639.
PORTFOLIO HOLDINGS
The Trust is required to disclose, after its first and third fiscal quarters, the complete schedule of each Fund’s portfolio holdings with the SEC on Form N‐Q. Forms N‐Q for each Fund are available on the SEC’s website at www.sec.gov. Each Fund’s Forms N‐Q may also be reviewed and copied at the SEC’s Public Reference Room in Washington, D.C. and information on the operation of the Public Reference Room may be obtained by calling 1‐ 800‐SEC‐0330. Each Fund’s Forms N‐Q are available without charge, upon request, by calling (toll‐free) 1‐866‐675‐2639 or by writing to ALPS ETF Trust at 1290 Broadway, Suite 1100, Denver, Colorado 80203.
RiverFront ETFs
Board Considerations Regarding Approval of
Investment Advisory Agreement and
Investment Sub-Advisory Agreements | November 30, 2016 (Unaudited) |
RiverFront Strategic Income Fund
At an in‐person meeting held on June 6, 2016, the Board of Trustees of the Trust (the “Board” or the “Trustees”), including the Trustees who are not “interested persons” of the Trust within the meaning of the 1940 Act, as amended (the “Independent Trustees”), evaluated a proposal to approve the continuance of the Investment Advisory Agreement between the Trust and ALPS Advisors, Inc. (the “Adviser” or “AAI”) with respect to the RiverFront Strategic Income Fund (“RIGS” or “the Fund”). The Independent Trustees also met separately to consider the Investment Advisory Agreement.
In evaluating the Investment Advisory Agreement with respect to RIGS, the Trustees considered various factors, including (i) the nature, extent and quality of the services provided by AAI with respect to the Fund under the Investment Advisory Agreement; (ii) the advisory fees and other expenses paid by the Fund compared to those of similar funds managed by other investment advisers; (iii) the costs of the services provided to the Fund by AAI and the profits realized by AAI and its affiliates from its relationship to the Fund; (iv) the extent to which economies of scale have been or would be realized if and as the assets of the Fund grow and whether fees reflect the economies of scale for the benefit of shareholders; and (v) any additional benefits and other considerations.
With respect to the nature, extent and quality of the services provided by AAI under the Investment Advisory Agreement, the Trustees considered and reviewed information concerning the services provided under the Investment Advisory Agreement, financial information regarding AAI and its parent company, information describing AAI’s current organization and the background and experience of the persons responsible for the day‐to‐day management of the Fund.
The Trustees reviewed information on the performance of the Fund and its benchmark, and the Broadridge performance group. The Trustees also evaluated the correlation and tracking error between the Fund’s underlying index and the Fund’s performance. Based on their review, the Trustees found that the nature and extent of services provided to the Fund under the Investment Advisory Agreement was appropriate and that the quality was satisfactory.
The Trustees noted that the advisory fee for the Fund was a unitary fee pursuant to which AAI assumes all expenses of the Fund (including the cost of transfer agency, custody, fund administration, legal, audit and other services) other than the payments under the Advisory Agreement, brokerage expenses, taxes, interest, litigation expenses and other extraordinary expenses.
With respect to advisory fee rate, the Trustees noted that the net advisory fee rate and expense ratio for the Fund is lower than the respective medians of its Broadridge expense group.
Based on the foregoing, and the other information available to them, the Trustees concluded that the advisory fee rate for the Fund was reasonable under the circumstances and in light of the quality of the services provided. The Trustees also concluded that the proposed change in advisory fee rate for RIGS, from 0.11% to 0.16% of daily net assets, in connection with a corresponding 0.05% reduction in the RiverFront Investment Group, LLC (“RiverFront”) sub‐advisory fee rate for RIGS (along with a full waiver of RiverFront’s sub‐advisory fee through March 31, 2018) was reasonable under the circumstances and in light of the quality of the services provided.
The Trustees considered other benefits available to AAI because of its relationship with the Fund and concluded that the advisory fee was reasonable taking into account any such benefits.
The Trustees also considered the information provided by AAI about the costs and profitability of AAI with respect to the Fund. The Trustees noted that the Fund had declined in assets. The Trustees noted that RIGS is still a relatively new product, which makes it difficult to quantify the potential variability in net assets and thus determine the sustainability of any potential economies of scale which may exist. The Trustees determined that they would continue to evaluate whether further economies of scale have been achieved on an ongoing basis.
In voting to renew the Investment Advisory Agreement, the Trustees concluded that the terms of the Investment Advisory Agreement are reasonable and fair in light of the services to be performed, the fees paid by certain other funds, expenses to be incurred and such other matters as the Trustees considered relevant in the exercise of their reasonable business judgment. The Trustees did not identify any single factor or group of factors as all important or controlling and considered all factors together.
RIGS Sub‐Advisory Agreement
In evaluating the RIGS Sub‐Advisory Agreement, the Trustees considered various factors, including (i) the nature, extent and quality of the services provided by RiverFront with respect to RIGS under the RIGS Sub‐Advisory Agreement; (ii) the advisory fees and other expenses paid by RIGS compared to those of similar funds managed by other investment advisers; (iii) the profitability to RiverFront of its sub‐advisory relationship with RIGS and reasonableness of compensation to RiverFront; (iv) the extent to which economies of scale would be realized if, and as, RIGS’ assets increase, and whether the fee level in the RIGS Sub‐Advisory Agreement reflects these economies of scale; and (v) any additional benefits and other considerations.
RiverFront ETFs
Board Considerations Regarding Approval of
Investment Advisory Agreement and
Investment Sub-Advisory Agreements | November 30, 2016 (Unaudited) |
With respect to the nature, extent and quality of the services provided by RiverFront under the RIGS Sub‐Advisory Agreement, the Trustees considered and reviewed information concerning the services provided under the RIGS Sub‐Advisory Agreement, RIGS’ performance, financial information regarding RiverFront, information describing RiverFront’s current organization and the background and experience of the persons responsible for the day‐to‐day management of RIGS. Based upon their review, the Trustees concluded that RiverFront was qualified to oversee the portfolio management of RIGS and that the services provided by RiverFront to RIGS are satisfactory.
The Trustees considered that the contractual sub‐advisory fee to be paid to RiverFront from RIGS was 0.35% of RIGS’ average daily net assets out of a total management fee of 0.46% of RIGS’ average daily net assets. The Trustees considered that RiverFront has waived its fee through June 30, 2016. The Trustees also considered that RiverFront and AAI had proposed that (i) the RIGS Sub‐Advisory Agreement be amended such that RiverFront would receive a fee of 0.30% of RIGS’ daily net assets, (ii) RiverFront waive its sub‐advisory fee from July 1, 2016 through March 31, 2018, and (iii) the AAI Advisory Agreement with respect to RIGS be amended such that AAI would receive a fee of 0.16% of RIGS’s daily net assets. The Trustees noted that the foregoing proposals would result in no change to RIGS’ total management fee of 0.46% of daily net assets. Based on consideration of all factors deemed relevant by them, the Trustees concluded that the proposed sub‐advisory fee of 0.30% of RIGS’ daily net assets for the RIGS Sub‐Advisory Agreement was reasonable under the circumstances and in light of the quality of services provided.
With respect to the costs of services provided and profits realized by RiverFront, the Trustees considered the resources involved in managing RIGS as well as the fact that RiverFront has waived its fee through June 30, 2016 and proposed to waive its fee thereafter until March 31, 2018. Based on its review, the Trustees concluded that the profitability of RIGS to RiverFront was not unreasonable.
The Trustees also considered other benefits that have been and may be realized by RiverFront from its relationships with RIGS and concluded that the sub‐advisory fees were reasonable taking into account such benefits.
The Trustees noted that RIGS had recently declined in assets. The Trustees considered the extent to which economies of scale may be realized if RIGS’ assets increase to its previous levels and continue to grow in size and whether fee levels reflect a reasonable sharing of such economies of scale for the benefit of the Fund’s investors. Given that RiverFront is currently waiving its entire fee through June 30, 2016 and has proposed to waive its entire fee through March 31, 2018, the Trustees concluded that economies of scale were not being achieved by RiverFront with respect to RIGS. The Trustees considered that the Fund may be achieving some economies of scale. They also noted that RIGS is still a relatively new product that has experienced fluctuations in assets, which makes it difficult to quantify the potential variability in net assets and thus determine the sustainability of any potential economies of scale which may exist. The Trustees determined that they would continue to evaluate whether further economies of scale have been achieved on an ongoing basis.
In voting to approve the RIGS Sub‐Advisory Agreement, the Trustees concluded that the terms of the RIGS Sub‐Advisory Agreement are reasonable and fair in light of the services performed, expenses incurred and such other matters as the Trustees considered relevant in the exercise of their reasonable business judgment. The Trustees did not identify any single factor or group of factors as all important or controlling and considered all factors together.
RiverFront Dynamic Core Income ETF, RiverFront Dynamic Unconstrained Income ETF, RiverFront Dynamic US Dividend Advantage ETF, and RiverFront Dynamic US Flex‐Cap ETF
At an in‐person meeting held on March 7, 2016, the Board of Trustees of the Trust (the “Board” or the “Trustees”), including the Trustees who are not “interested persons” of the Trust within the meaning of the 1940 Act, as amended (the “Independent Trustees”), evaluated a proposal to approve the Investment Advisory Agreement between the Trust and ALPS Advisors, Inc. (the “Adviser” or “AAI”) with respect to the RiverFront Dynamic US Flex‐Cap ETF (“RFFC”), RiverFront Dynamic Core Income ETF (“RFCI”), RiverFront Dynamic US Dividend Advantage ETF (“RFDA”) and RiverFront Dynamic Unconstrained Income ETF (“RFUN”) (each a “Fund” and collectively, “the Funds”) and the Investment Sub‐Advisory Agreement between the Trust and RiverFront Investment Group, LLC (“RiverFront”) with respect to the Funds. The Independent Trustees also met separately to consider the Investment Advisory Agreement and Investment Sub‐Advisory Agreement (each an “Investment Advisory Agreement” and collectively, the “Investment Advisory Agreements”).
In evaluating the Investment Advisory Agreements, the Trustees considered various factors, including (i) the nature, extent and quality of the services expected to be provided by the Adviser and RiverFront with respect to each Fund, under the applicable Investment Advisory Agreement; (ii) the advisory fees and other expenses proposed to be paid by each Fund compared to those of similar funds managed by other investment advisers; (iii) the expected profitability to the Adviser of its proposed advisory relationship with each Fund and reasonableness of compensation to the Adviser and RiverFront; (iv) the extent to which economies of scale would be realized if and as each Fund’s assets increase and whether the fee level in the Investment Advisory Agreements reflects these economies of scale; and (v) any additional benefits and other considerations.
RiverFront ETFs
Board Considerations Regarding Approval of
Investment Advisory Agreement and
Investment Sub-Advisory Agreements | November 30, 2016 (Unaudited) |
With respect to the nature, extent and quality of the services to be provided by the Adviser and RiverFront under the Investment Advisory Agreements, the Trustees considered and reviewed information concerning the services proposed to be provided under the Investment Advisory Agreements, and the investment strategies of the Funds, financial information regarding the Adviser, its parent company and RiverFront, information describing the Adviser’s and RiverFront’s current organizations and the background and experience of the persons who would be responsible for the day‐to‐day management of the Funds, the anticipated financial support of the Funds, and the nature and quality of services provided to other ETFs, open‐end and closed‐end funds sponsored by the Adviser or RiverFront, as applicable. Based upon their review, the Trustees concluded that the Adviser was qualified to oversee the services to be provided by other service providers and that the services to be provided by the Adviser and RiverFront to the Funds are expected to be satisfactory.
For each Fund, with respect to the costs of services to be provided and profits to be realized by the Adviser, the Trustees considered the resources involved in managing the Fund as well as the fact that the Adviser agreed to pay all of the Fund’s expenses (except for interest expenses, distribution fees or expenses, brokerage expenses, taxes and extraordinary expenses such as litigation and other expenses not incurred in the ordinary course of the Fund’s business) out of the unitary advisory fee. Based on their review, the Trustees concluded that the expected profitability of each Fund to the Adviser was not unreasonable.
The Trustees also reviewed comparative fee and expense data provided by Broadridge regarding each Fund. With respect to RFUN and RFCI, the Trustees noted the proposed advisory fee for services to be provided to the Funds by the Adviser was 0.51% of each such Fund’s average daily net assets. With respect to RFDA and RFFC, the Trustees noted the proposed advisory fee for services to be provided to the Funds by the Adviser was 0.52% of each such Fund’s average daily net assets. The Trustees also considered that the advisory fee with respect to each Fund was a unitary one and that, as set forth above, the Adviser had agreed to pay all of the Fund’s expenses (except for interest expenses, marketing fees, distribution fees or expenses, brokerage expenses, taxes and extraordinary expenses such as litigation and other expenses not incurred in the ordinary course of the Funds’ business) out of the unitary fee. The Trustees considered that, taking into account the impact of the Funds’ unitary advisory fee, RFUN’s expense ratio was below the median of its Broadridge expense group, RFCI’s expense ratio was below the median of its Broadridge expense group, RFDA’s expense ratio was above the median of its Broadridge expense group and RFFC’s expense ratio was below the median of its Broadridge expense group. Based on the foregoing and the other information available to them, the Trustees concluded that the advisory fees for each Fund were reasonable under the circumstances and in light of the quality of services provided.
The Trustees also considered other benefits that may be realized by the Adviser from its relationship with the Funds and concluded that the advisory fees were reasonable taking into account such benefits.
The Trustees considered the extent to which economies of scale would be realized as a Fund grows and whether fee levels reflect a reasonable sharing of such economies of scale for the benefit of Fund investors. Because each Fund is newly organized, the Trustees reviewed each Funds’ proposed unitary advisory fee and anticipated expenses and determined to review economies of scale in the future when each Funds had attracted assets.
In voting to approve the Investment Advisory Agreements, the Trustees concluded that the terms of each Investment Advisory Agreement are reasonable and fair in light of the services to be performed, the fees paid by certain other funds, expenses to be incurred and such other matters as the Trustees considered relevant in the exercise of their reasonable business judgment. The Trustees did not identify any single factor or group of factors as all important or controlling and considered all factors together.
RiverFront ETFs
Trustees & Officers | November 30, 2016 (Unaudited) |
The general supervision of the duties performed by the Adviser for the Fund under the Investment Advisory Agreement is the responsibility of the Board of Trustees. The Trust currently has four Trustees. Three Trustees have no affiliation or business connection with the Adviser or any of its affiliated persons and do not own any stock or other securities issued by the Adviser. These are the “non‐interested” or “independent” Trustees (“Independent Trustees”). The other Trustee (the “Interested Trustee”) is affiliated with the Adviser.
The Independent Trustees of the Trust, their term of office and length of time served, their principal business occupations during the past five years, the number of portfolios in the Fund Complex overseen by each Independent Trustee, and other directorships, if any, held by the Trustee are shown below.
INDEPENDENT TRUSTEES
Name, Address & Year of Birth* | Position(s) Held with Trust | Term of Office and Length of Time Served** | Principal Occupation(s) During Past 5 Years | Number of Portfolios in Fund Complex Overseen by Trustees*** | Other Directorships Held by Trustees |
Mary K. Anstine, 1940 | Trustee | Since March 2008 | Ms. Anstine was President/Chief Executive Officer of HealthONE Alliance, Denver, Colorado, and former Executive Vice President of First Interstate Bank of Denver. Ms. Anstine is also Trustee/ Director of AV Hunter Trust and Colorado Uplift Board. Ms. Anstine was formerly a Director of the Trust Bank of Colorado (later purchased and now known as Northern Trust Bank), HealthONE and Denver Area Council of the Boy Scouts of America and a member of the American Bankers Association Trust Executive Committee. | 44 | Ms. Anstine is a Trustee of ALPS Variable Investment Trust (10 funds); Financial Investors Trust (31 funds); Reaves Utility Income Fund (1 fund); and Westcore Trust (14 funds). |
Jeremy W. Deems, 1976 | Trustee | Since March 2008 | Mr. Deems is the Co‐Founder, Chief Compliance Officer and Chief Financial Officer of Green Alpha Advisors, LLC. Mr. Deems is Co‐Portfolio Manager of the Shelton Green Alpha Fund. Prior to joining Green Alpha Advisors, Mr. Deems was CFO and Treasurer of Forward Management, LLC, ReFlow Management Co., LLC, ReFlow Fund, LLC, a private investment fund, and Sutton Place Management, LLC, an administrative services company. | 46 | Mr. Deems is a Trustee of ALPS Variable Investment Trust (10 funds); Financial Investors Trust (31 funds); and Reaves Utility Income Fund (1 fund); Clough Funds Trust (1 fund) and Elevation ETF Trust (2 fund). |
Rick A. Pederson, 1952 | Trustee | Since March 2008 | Mr. Pederson is President, Foundation Properties, Inc. (a real estate investment management company), 1994 ‐ present; Advisory Board Member, Bow River Capital Partners (private equity management), 2003 ‐ present; Advisor, The Pauls Corporation (real estate investment management and development), 2008 ‐ present; Chairman, Ross Consulting Group (real estate consulting services) 1983 ‐ 2013; Advisory Board Member, Neenan Company (construction services) 2002 ‐ present; Board Member, Prosci Inc. (private business services) 2013 ‐ 2016; Board Member, Citywide Banks (Colorado community bank) 2014 ‐ present; Board Member, Strong‐Bridge Consulting (management consulting) 2015 ‐ present; Director, National Western Stock Show (not‐for‐profit organization); Director, Biennial of the Americas (not‐for‐profit‐organization), 2012 ‐ 2015; Board Member, History Colorado, 2015 ‐ present. | 22 | Mr. Pederson is Trustee of Westcore Trust (14 funds) and Principal Real Estate Income Fund (1 fund). |
| * | The business address of the Trustee is c/o ALPS Advisors, Inc., 1290 Broadway, Suite 1100, Denver, Colorado 80203. |
| ** | This is the period for which the Trustee began serving the Trust. Each Trustee serves an indefinite term, until his successor is elected. |
| *** | The Fund Complex includes all series of the Trust and any other investment companies for which ALPS Advisors, Inc. provides investment advisory services. |
RiverFront ETFs
Trustees & Officers | November 30, 2016 (Unaudited) |
The Trustee who is affiliated with the Adviser or affiliates of the Adviser and executive officers of the Trust, his term of office and length of time served, his principal business occupations during the past five years, the number of portfolios in the Fund Complex overseen by the Interested Trustee and the other directorships, if any, held by the Trustee, are shown below.
INTERESTED TRUSTEE
| Name, Address and Year of Birth of Interested Trustee* | Position(s) Held with Trust | Term of Office and Length of Time Served** | Principal Occupation(s) During Past 5 Years | Number of Portfolios in FundComplex Overseen by Trustees*** | Other Directorships Held by Trustees |
Thomas A. Carter, 1966 | Trustee and President | Since March 2008 | Mr. Carter joined ALPS Fund Services, Inc. (“ALPS”) in 1994 and is currently President and Director of ALPS Advisors, Inc. (“AAI”) and ALPS Portfolio Solutions Distributor, Inc. (“APSD”) and Executive Vice President and Director of ALPS and ALPS Holdings, Inc. (“AHI”) and ALPS Distributors, Inc. (“ADI”). Because of his position with AHI, ALPS, ADI, APSD and AAI, Mr. Carter is deemed an affiliate of the Fund as defined under the 1940 Act. Before joining ALPS, Mr. Carter was with Deloitte & Touche LLP, where he worked with a diverse group of clients, primarily within the financial services industry. Mr. Carter is a Certified Public Accountant and received his Bachelor of Science in Accounting from the University of Colorado at Boulder. | 33 | Mr. Carter is a Trustee of ALPS Variable Investment Trust (10 funds); Principal Real Estate Income Fund (1 fund); and RiverNorth Opportunities Fund, Inc. (1 fund). |
| * | The business address of the Trustee is c/o ALPS Advisors, Inc., 1290 Broadway, Suite 1100, Denver, Colorado 80203. |
| ** | This is the period for which the Trustee began serving the Trust. Each Trustee serves an indefinite term, until his successor is elected. |
| *** | The Fund Complex includes all series of the Trust and any other investment companies for which ALPS Advisors, Inc. provides investment advisory services. |
Trustees & Officers | November 30, 2016 (Unaudited) |
| OFFICERS | | | |
Name, Address and Year of Birth of Officer* | Position(s) Held with Trust | Length of Time Served** | Principal Occupation(s) During Past 5 Years |
Erin D. Nelson, 1977 | Chief Compliance Officer (“CCO”) | Since December 2015 | Erin Nelson became Senior Vice‐President and Chief Compliance Officer of ALPS Advisors, Inc. (“AAI”) on July 1, 2015 and prior to that served as Vice President and Deputy Chief Compliance Officer of AAI since January 1, 2015. Prior to January 1, 2015, Ms. Nelson was Vice‐President and Assistant General Counsel of ALPS Fund Services, Inc. Because of her position with AAI, Ms. Nelson is deemed an affiliate of the Trust as defined under the 1940 Act. Ms. Nelson is also the CCO of ALPS Variable Investment Trust, Liberty All‐Star Growth Fund, Inc., Liberty All‐ Star Equity Fund, Principal Real Estate Income Fund, and RiverNorth Opportunities Fund, Inc. |
Patrick D. Buchanan, 1972 | Treasurer | Since June 2012 | Mr. Buchanan is Vice President of AAI. Mr. Buchanan joined ALPS in 2007 and because of his position with AAI, he is deemed an affiliate of the Trust as defined under the 1940 Act. Mr. Buchanan is also Treasurer of the ALPS Variable Insurance Trust, Principal Real Estate Income Fund, Clough Funds Trust and RiverNorth Opportunities Fund, Inc. |
Andrew P. Meloni, 1969 | Assistant Treasurer | Since December 2016 | Mr. Meloni is a Fund Controller for ALPS Fund Services, Inc. Mr. Meloni joined ALPS in 2007 and because of his position with ALPS, he is deemed an affiliate of the Fund as defined under the 1940 Act. Mr. Meloni is also Assistant Treasurer to the Liberty All‐Star Equity Fund, Liberty All‐Star Growth Fund, Inc., Principal Real Estate Income Fund, RiverNorth Opportunities Fund, Inc. and ALPS Variable Investment Trust. |
Abigail J. Murray, 1975 | Secretary | Since June 2015 | Ms. Murray joined ALPS in April 2015. She is currently Vice President and Senior Counsel of ALPS. Prior to joining ALPS, Ms. Murray was an Attorney and Managing Member at Murray & Rouvina PLC from 2014 to 2015 and an Associate with Vedder Price P.C. from 2007 to 2014. Ms. Murray is also the Secretary of Clough Global Allocation Fund, Clough Global Equity Fund, Clough Global Opportunities Fund, Clough Funds Trust, The Caldwell & Orkin Funds, Inc. and RiverNorth Opportunities Fund, Inc. and Assistant Secretary of Elevation ETF Trust and Principal Real Estate Income Fund. |
Andrea E. Kuchli, 1985 | Assistant Secretary | Since December 2015 | Ms. Kuchli joined ALPS in 2015 and is currently Vice President and Senior Counsel of ALPS. Prior to joining ALPS, Ms. Kuchli was an Associate with Davis Graham & Stubbs LLP from April 2014 to February 2015, and an Associate with Dechert LLP from 2011 to April 2014. Because of her position with ALPS, Ms. Kuchli is deemed an affiliate of the Trust as defined under the 1940 Act. Ms. Kuchli is also Secretary of Elevation ETF Trust and Principal Real Estate Income Fund as well as Assistant Secretary of the James Advantage Funds and RiverNorth Opportunities Fund, Inc. |
Sharon Akselrod, 1974 | Assistant Secretary | Since December 2016 | Ms. Akselrod joined ALPS in August 2014 and is currently Senior Investment Company Act Paralegal of ALPS Fund Services, Inc. Prior to joining ALPS, Ms. Akselrod served as Corporate Governance and Regulatory Associate for Nordstrom fsb (2013‐2014) and Senior Legal Assistant – Legal Manager for AXA Equitable Life Insurance Company (2008‐2013). Because of her position with ALPS, Ms. Akselrod is deemed an affiliate of the Trust as defined under the 1940 Act. Ms. Akselrod is also Assistant Secretary of Financial Investors Trust. |
| * | The business address of each Officer is c/o ALPS Advisors, Inc., 1290 Broadway, Suite 1100, Denver, Colorado 80203. |
| ** | This is the period for which the Officer began serving the Trust. Each Officer serves an indefinite term, until his/her successor is elected. |
The Statement of Additional Information includes additional information about the Fund's Trustees and is available, without charge, upon request by calling (toll-free) 1-866-759-5679.
Intentionally Left Blank
TABLE OF CONTENTS
| Performance Overview | |
| Sprott Gold Miners ETF | 1 |
| Sprott Junior Gold Miners ETF | 4 |
| Sprott BUZZ Social Media Insights ETF | 7 |
| Disclosure of Fund Expenses | 10 |
| Report of Independent Registered Public Accounting Firm | 11 |
| Financial Statements | |
| Schedules of Investments | |
| Sprott Gold Miners ETF | 12 |
| Sprott Junior Gold Miners ETF | 13 |
| Sprott BUZZ Social Media Insights ETF | 14 |
| Statements of Assets and Liabilities | 16 |
| Statements of Operations | 17 |
| Statements of Changes in Net Assets | |
| Sprott Gold Miners ETF | 18 |
| Sprott Junior Gold Miners ETF | 19 |
| Sprott BUZZ Social Media Insights ETF | 20 |
| Financial Highlights | 21 |
| Notes to Financial Statements | 24 |
| Additional Information | 32 |
| Board Considerations Regarding Approval of Investment Advisory Agreements | 35 |
| Trustee & Officers | 36 |
alpsfunds.com
Sprott Gold Miners ETF
| Performance Overview | November 30, 2016 (Unaudited) |
Investment Objective
Sprott Gold Miners ETF (the “Fund”) employs a “passive management”—or indexing—investment approach designed to seek investment results that correspond (before fees and expenses) generally to the performance of the Sprott Zacks Gold Miners Index (the “Underlying Index”).
The Underlying Index was created by Zacks Index Services to provide a means of generally tracking the performance of gold and silver mining companies whose stocks are traded on major U.S. exchanges. The Underlying Index uses a transparent, rules-based methodology that is designed to identify the stocks of 25 gold and silver mining companies with the highest beta† to the spot price of gold, with each stock’s weighting in the index adjusted based on its quarterly revenue growth on a year-over-year basis and the quality of its balance sheet, as measured by long-term debt to equity. The Underlying Index is rebalanced on a quarterly basis to incorporate the latest financial data into the screening process. At least 80% of the Underlying Index (by weight) must consist of gold mining companies while no more than 20% may consist of silver mining companies.
Performance Overview
The Fund for the one-year period ended November 30, 2016 generated a total return of 49.82%, in-line with the Underlying Index, which returned 51.09%. The Fund’s Underlying Index emphasizes companies with the highest historical sensitivity to the price of gold, the highest relative revenue growth and the lowest relative long-term debt to equity. We believe these are important factors in determining the long-run success of senior gold miners.
After a multi-year bear market, gold stocks generated strong absolute and relative gains as interest in gold and gold stocks rebounded. The price of gold was lifted by growing investment demand in response to concerns about the trillions of dollars in negative yielding debt around the world and the “experimental” monetary policies by a number of central banks. Investment demand for gold, as measured by the total ounces of gold held by ETFs, grew from 46.2 million to 60.4 million ounces, a gain of 31%1.
The higher price of gold coupled with earlier cost cutting initiatives allowed many gold companies to generate better financial results during the period. Despite the strong performance for gold stocks, they remain inexpensive based on a number of valuation metrics.
The most notable change to the Underlying Index for the period was a shift to gold stocks with higher historical sensitivity to the price of gold. Companies such as Franco-Nevada, Newmont Mining and Goldcorp were deleted from the Underlying Index during the period in exchange for companies with greater historical stock price sensitivity to gold.
Looking forward, we continue to believe the Index’s methodology of emphasizing companies with the highest relative revenue growth and lowest relative long-term debt to equity will provide exposure to higher-quality gold companies with stronger production results and the financial strength to take advantage of opportunities in the sector.
1 | Source: Bloomberg – December 1st 2015 to November 30th 2016 |
Performance (as of November 30, 2016)
| 1 Year | Since Inception^ |
Sprott Gold Miners ETF - NAV | 49.82% | -9.94% |
Sprott Gold Miners ETF - Market Price* | 49.70% | -9.94% |
| Sprott Zacks Gold Miners Total Return Index | 51.09% | -9.26% |
S&P 500® Total Return Index | 8.06% | 6.83% |
Total Expense Ratio (per the current prospectus) 0.57%
Performance data quoted represents past performance. Past performance does not guarantee future results. The table does not reflect the deduction of taxes that a shareholder would pay on Fund distributions or the redemption of Fund shares. Investment return and principal value of an investment will fluctuate so that an investor’s shares, when sold or redeemed, may be worth more or less than the original cost. Current performance data may be higher or lower than actual data quoted. For the most current month-end performance data please visit www.alpsfunds.com or call 1.855.215.1425.
Sprott Gold Miners ETF
| Performance Overview | November 30, 2016 (Unaudited) |
NAV is an exchange-traded fund’s per-share value. The per-share dollar amount of the Fund is derived by dividing the total value of all the securities in its portfolio, less any liabilities, by the number of Fund shares outstanding. Market Price is the price at which a share can currently be traded in the market. Information detailing the number of days the Market Price of the Fund was greater than the Fund’s NAV and the number of days it was less than the Fund’s NAV can be obtained at www.alpsfunds.com.
| † | Beta is defined as a sensitivity measure based on regression against the spot gold price movement during the trailing 36 months. |
| ^ | The Fund’s Commencement date was July 15, 2014. |
| * | Market Price is based on the midpoint of the bid-ask spread at 4 p.m. ET and does not represent the returns an investor would receive if shares were traded at other times. |
Sprott Zacks Gold Miners Total Return Index is comprised of approximately 25 stocks selected, based on investment and other criteria, from a universe of gold and silver mining companies whose stock is listed on a major U.S. exchange. The stocks are selected using a proprietary, quantitative rules-based methodology developed by Zacks Index Services.
S&P 500®Index is the Standard & Poor’s composite index of 500 stocks, a widely recognized, unmanaged index of common stock prices.
The indexes are reported on a total return basis, which assumes reinvestment of any dividends and distributions realized during a given time period. The indexes are not actively managed and do not reflect any deductions for fees, expenses or taxes. One cannot invest directly in an index. Index performance does not reflect fund performance.
The Fund is concentrated in the gold and silver mining industry. As a result, the Fund will be sensitive to changes in, and its performance will depend to a greater extent on, the overall condition of the gold and silver mining industry. Also, gold and silver mining companies are highly dependent on the price of gold and silver bullion. These prices may fluctuate substantially over short periods of time so the Fund’s Share price may be more volatile than other types of investments.
Funds that emphasize investments in small-cap and mid-cap companies will generally experience greater price volatility.
Funds investing in foreign and emerging markets will also generally experience greater price volatility.
The Fund’s shares are not individually redeemable. Investors buy and sell shares of the Fund on a secondary market. Only market makers or “authorized participants” may trade directly with the Fund, typically in blocks of 50,000 shares.
The Sprott Gold Miners ETF is not suitable for all investors. Investments in the Fund are subject to investment risks, including possible loss of the principal amount invested.
ALPS Portfolio Solutions Distributor, Inc., a FINRA member, is the distributor for the Sprott Gold Miners ETF.
ALPS Portfolio Solutions Distributor, Inc. is not affiliated with Sprott or Zacks Index Services, a division of Zacks Investment Management.
Sprott Gold Miners ETF
| Performance Overview | November 30, 2016 (Unaudited) |
Top 10 Holdings* (as of November 30, 2016)
| Randgold Resources Ltd., ADR | 16.55% |
| Agnico Eagle Mines Ltd. | 15.16% |
| Royal Gold, Inc. | 13.90% |
| Cia de Minas Buenaventura SAA, ADR | 4.77% |
| Yamana Gold, Inc. | 4.75% |
| Barrick Gold Corp. | 4.57% |
| B2Gold Corp. | 4.46% |
| Kinross Gold Corp. | 4.34% |
| AngloGold Ashanti Ltd., Sponsored ADR | 3.72% |
| First Majestic Silver Corp. | 3.08% |
| Total % of Top 10 Holdings | 75.30% |
Future holdings are subject to change.
Country Allocation* (as of November 30, 2016)
| Canada | 51.88% |
| United States | 18.37% |
| Jersey | 16.55% |
| South Africa | 8.43% |
| Peru | 4.77% |
| Total | 100.00% |
Growth of $10,000 (as of November 30, 2016)
Comparison of Change in Value of $10,000 Investment in the Fund and the Underlying Index
The chart above represents historical performance of a hypothetical investment of $10,000 in the Fund over the life of the Fund. Past performance does not guarantee future results. This chart does not reflect the deduction of taxes that a shareholder would pay on Fund distributions or the redemption of Fund shares.
Sprott Junior Gold Miners ETF
| Performance Overview | November 30, 2016 (Unaudited) |
Investment Objective
Sprott Junior Gold Miners ETF (the “Fund”) employs a “passive management”—or indexing—investment approach designed to seek investment results that correspond (before fees and expenses) generally to the performance of the Sprott Zacks Junior Gold Miners Index (the “Underlying Index”).
The Underlying Index was created by Zacks Index Services to provide a means of generally tracking the performance of “junior” gold and silver mining companies whose stocks are traded on major U.S. or Canadian exchanges. Junior companies include early stage mining companies that are in the exploration stage only or that hold properties that might not ultimately produce gold or silver. The Underlying Index uses a transparent, rules-based methodology that is designed to identify between 30 to 40 junior gold and silver stocks with market capitalization between $250 million and $2 billion. Excluding companies with market capitalization below $250 million aims to exclude very early stage exploration companies whose historical success rate is low. Each stock’s weighting in the Underlying Index is adjusted based on 2 company factors: 1) Revenue Growth and 2) Price Momentum. The Underlying Index is reconstituted on a semi-annual basis, in November and May, to incorporate the latest factor scores into the selection and weighting process. At least 80% of the Underlying Index (by weight) must consist of junior gold mining companies while no more than 20% may consist of junior silver mining companies.
Performance Overview
The Fund for the one-year period to November 30, 2016 generated a total return of 69.35%, in-line with the Underlying Index, which returned 71.04%. The Fund’s Underlying Index emphasizes companies with the highest historical revenue growth and the strongest relative stock price momentum. We believe these are important factors in determining the long-run success of junior gold miners.
After a multi-year bear market, gold stocks generated strong absolute and relative gains as interest in gold and gold stocks rebounded. The price of gold was lifted by growing investment demand in response to concerns about the trillions of dollars in negative yielding debt around the world and the “experimental” monetary policies by a number of central banks. Investment demand for gold, as measured by the total ounces of gold held by ETFs, grew from 46.2 million to 60.4 million ounces, a gain of 31%1.
Junior gold stocks outperformed their larger counterparts during the period due to their higher sensitivity to the price of gold and speculation about acquisitions by senior miners. With improving financial results and balance sheets, we expect that many senior miners are reconsidering mergers and acquisitions to grow their production and gold reserves. Many junior gold companies were also able to raise capital during the period, allowing them to progress their exploration and development programs.
The most notable change to the Underlying Index for the period was a shift to smaller market capitalization stocks during the Q2 rebalancing as a number of companies had appreciated in value in excess of the upper market capitalization threshold of $2 billion.
Looking forward, we continue to believe the Index’s methodology of emphasizing companies with the highest dollar revenue growth and strongest price momentum will provide exposure to emerging producers as well as exploration companies with promising new discoveries.
1 | Source: Bloomberg – December 1st 2015 to November 30th 2016 |
Performance (as of November 30, 2016)
| | 1 Year | Since Inception^ |
Sprott Junior Gold Miners ETF - NAV | 69.35% | 21.06% |
Sprott Junior Gold Miners ETF - Market Price* | 69.59% | 21.12% |
| Sprott Zacks Junior Gold Miners Total Return Index | 71.04% | 22.19% |
S&P 500® Total Return Index | 8.06% | 5.47% |
Total Expense Ratio (per the current prospectus) 0.57%
Performance data quoted represents past performance. Past performance does not guarantee future results. The table does not reflect the deduction of taxes that a shareholder would pay on Fund distributions or the redemption of Fund shares. Investment return and principal value of an investment will fluctuate so that an investor’s shares, when sold or redeemed, may be worth more or less than the original cost. Current performance data may be higher or lower than actual data quoted. For the most current month-end performance data please visit www.alpsfunds.com or call 1.855.215.1425.
Sprott Junior Gold Miners ETF
| Performance Overview | November 30, 2016 (Unaudited) |
NAV is an exchange-traded fund’s per-share value. The per-share dollar amount of the Fund is derived by dividing the total value of all the securities in its portfolio, less any liabilities, by the number of Fund shares outstanding. Market Price is the price at which a share can currently be traded in the market. Information detailing the number of days the Market Price of the Fund was greater than the Fund’s NAV and the number of days it was less than the Fund’s NAV can be obtained at www.alpsfunds.com.
| ^ | The Fund’s Commencement date was March 31, 2015. Total return for a period of less than one year is not annualized. |
| * | Market Price is based on the midpoint of the bid-ask spread at 4 p.m. ET and does not represent the returns an investor would receive if shares were traded at other times. |
Sprott Zacks Junior Gold Miners Total Return Index is comprised of between 30 to 40 stocks selected, based on investment and other criteria, from a universe of gold and silver mining companies whose stocks are listed on a major U.S. or Canadian exchange. The stocks are selected using a proprietary, quantitative rules-based methodology developed by Zacks Index Services.
S&P 500®Index is the Standard & Poor’s composite index of 500 stocks, a widely recognized, unmanaged index of common stock prices.
The indexes are reported on a total return basis, which assumes reinvestment of any dividends and distributions realized during a given time period. The indexes are not actively managed and do not reflect any deductions for fees, expenses or taxes. One cannot invest directly in an index. Index performance does not reflect fund performance.
The Fund is concentrated in the gold and silver mining industry. As a result, the Fund will be sensitive to changes in, and its performance will depend to a greater extent on, the overall condition of the gold and silver mining industry. Also, gold and silver mining companies are highly dependent on the price of gold and silver bullion. These prices may fluctuate substantially over short periods of time so the Fund’s Share price may be more volatile than other types of investments.
Funds that emphasize investments in small-cap and mid-cap companies will generally experience greater price volatility. Micro-cap stocks involve substantially greater risks of loss and price fluctuations because their earnings and revenues tend to be less predictable. These companies may be newly formed or in the early stages of development, with limited product lines, markets or financial resources and may lack management depth.
Funds investing in foreign and emerging markets will also generally experience greater price volatility.
The Fund’s shares are not individually redeemable. Investors buy and sell shares of the Fund on a secondary market. Only market makers or “authorized participants” may trade directly with the Fund, typically in blocks of 50,000 shares.
The Sprott Junior Gold Miners ETF is not suitable for all investors. Investments in the Fund are subject to investment risks, including possible loss of the principal amount invested.
ALPS Portfolio Solutions Distributor, Inc., a FINRA member, is the distributor for the Sprott Junior Gold Miners ETF.
ALPS Portfolio Solutions Distributor, Inc. is not affiliated with Sprott or Zacks Index Services, a division of Zacks Investment Management.
Sprott Junior Gold Miners ETF
| Performance Overview | November 30, 2016 (Unaudited) |
Top 10 Holdings* (as of November 30, 2016)
| OceanaGold Corp. | 6.98% |
| Alamos Gold, Inc., Class A | 6.93% |
| IAMGOLD Corp. | 6.69% |
| Endeavour Mining Corp. | 5.92% |
| New Gold, Inc. | 5.31% |
| Coeur Mining, Inc. | 4.85% |
| Osisko Gold Royalties Ltd. | 4.28% |
| Centerra Gold, Inc. | 4.13% |
| First Majestic Silver Corp. | 4.02% |
| Klondex Mines Ltd. | 3.51% |
| Total % of Top 10 Holdings | 52.62% |
Future holdings are subject to change.
Country Allocation* (as of November 30, 2016)
| Canada | 93.74% |
| United States | 4.85% |
| South Africa | 1.41% |
| Total | 100.00% |
Growth of $10,000 (as of November 30, 2016)
Comparison of Change in Value of $10,000 Investment in the Fund and the Underlying Index
The chart above represents historical performance of a hypothetical investment of $10,000 in the Fund over the life of the Fund. Past performance does not guarantee future results. This chart does not reflect the deduction of taxes that a shareholder would pay on Fund distributions or the redemption of Fund shares.
Sprott BUZZ Social Media Insights ETF
| Performance Overview | November 30, 2016 (Unaudited) |
Investment Objective
Sprott BUZZ Social Media Insights ETF (the “Fund”) employs a “passive management” – or indexing – investment approach designed to seek investment results that correspond (before fees and expenses) generally to the performance of the BUZZ Social Media Insights Index (the “Underlying Index”).
The Underlying Index was created by BUZZ Indexes Inc. (“Index Provider”) to provide a means of generally tracking the performance of a select subset of U.S. companies which are selected by analyzing unstructured data from the social media landscape with the intention to identify those stocks which rank highest in terms of bullish perception and breadth of discussion. The methodology factors insights based on brand and investor perception while incorporating user reliability and influence considerations. The 75 companies with the highest “positive insight” rankings, which meet certain market capitalization and average daily trading volume requirements, will be selected for inclusion in the Underlying Index and will be weighted based on a proprietary scoring model.
Performance Overview
The Fund generated a total return of 2.74% for the period from April 19, 2016 to November 30, 2016, which is in-line with the 3.03% return of the Underlying Index. The Fund’s Underlying Index contains those stocks which exhibit the highest levels of bullish sentiment across the social media landscape, incorporating factors such as breadth of discussion and user influence and reliability. Social sentiment is influenced by the perceptions of users towards a company’s stock, as well as their opinions on the company’s brand, if applicable. The Underlying Index employs algorithms which utilize artificial intelligence and natural language processing techniques to analyze large datasets of social media content, including Twitter tweets, blog posts, and forum discussions across various social media sources.
Short- to medium-term sentiment is heavily influenced by day-to-day news events and prevailing macroeconomic and consumer trends. As such, the amount of discussion on social media tends to be higher in growth-oriented, innovative industries such as technology and biotechnology, along with high-profile retailers and brands within the consumer sector. During 2016, several macroeconomic events such as the U.K. referendum (“Brexit”) and the U.S. election had large implications for various industries, and public perceptions and sentiment towards these companies were volatile. Large swings in the price of oil and gold influenced sentiment on energy and mining companies. Other notable events during the year included the emergence and recognition of the competitive advantage with respect to artificial intelligence and machine learning computing by chipset producers Advanced Micro Devices Inc. and NVIDIA Corporation, the decline and resurgence of the “FANG” (Facebook Inc., Apple Inc., Netflix Inc., Google/Alphabet Inc.) group of stocks, the negative bias towards biotechnology stocks resulting from the perceived likelihood of a Hillary Clinton victory in the U.S. elections, and the surge in financial stocks sparked by the ensuing Donald Trump victory.
Prior to August 2016, the Fund’s Underlying Index was composed of 25 stocks, each with a maximum 15% weight. This often resulted in large exposures to single stocks, mostly in the technology sector. The Underlying Index construction methodology was revised in August 2016 to expand the number of names to 75 and to decrease the maximum weight of any single stock to 3%. This resulted in a more balanced and diversified index that better captured the social sentiment factor with less individual stock concentration risk. Prior to the change, the Underlying Index’s heavy weighting in Google/Alphabet Inc. and Apple Inc., which underperformed the broad market in the first half of 2016, caused the index’s returns to lag the S&P 500 total return between April 19, 2016 and June 30, 2016. However, the subsequent post-“Brexit” outperformance of technology stocks helped the Underlying Index outperform the S&P 500 total return by approximately 6.32% between July 1, 2016 and August 18, 2016. Following the Underlying Index’s expansion to 75 names on the August 18 rebalance, the index returned -0.10% between August 19, 2016 and November 30, 2016, slightly lagging the S&P 500 total return of 1.16%.
Performance (as of November 30, 2016)
| | Since Inception^ |
Sprott BUZZ Social Media Insights ETF - NAV | 2.74% |
Sprott BUZZ Social Media Insights - Market Price* | 2.74% |
| BUZZ Social Media Insights Total Return Index | 3.03% |
S&P 500® Total Return Index | 6.44% |
Total Expense Ratio (per the current prospectus) 0.75%
Performance data quoted represents past performance. Past performance does not guarantee future results. The table does not reflect the deduction of taxes that a shareholder would pay on Fund distributions or the redemption of Fund shares. Investment return and principal value of an investment will fluctuate so that an investor’s shares, when redeemed, may be worth more or less than their original cost. Current performance may be higher or lower than actual data quoted. For the most current month-end performance data please visit www.alpsfunds.com or call 1.855.215.1425.
Sprott BUZZ Social Media Insights ETF
| Performance Overview | November 30, 2016 (Unaudited) |
NAV is an exchange-traded fund’s per-share value. The per-share dollar amount of the Fund is derived by dividing the total value of all the securities in its portfolio, less any liabilities, by the number of Fund shares outstanding. Market Price is the price at which a share can currently be traded in the market. Information detailing the number of days the Market Price of the Fund was greater than the Fund’s NAV and the number of days it was less than the Fund’s NAV can be obtained at www.alpsfunds.com.
| ^ | The Fund’s Commencement date was April 19, 2016. Total return for a period of less than one year is not annualized. |
| * | Market Price is based on the midpoint of the bid-ask spread at 4 p.m. ET and does not represent the returns an investor would receive if shares were traded at other times. |
The Fund is new with limited operating history.
BUZZ Social Media Insights Index is comprised of 75 stocks with the highest “positive insight” rankings, which meet certain market capitalization and average daily trading volume requirements are selected for inclusion in the Underlying Index and are weighted based on a proprietary, quantitative rules-driven methodology developed by BUZZ Indexes Inc.
S&P 500®Index is the Standard & Poor’s composite index of 500 stocks, a widely recognized, unmanaged index of common stock prices.
The indexes are reported on a total return basis, which assumes reinvestment of any dividends and distributions realized during a given time period. The indexes are not actively managed and do not reflect any deductions for fees, expenses or taxes. One cannot invest directly in an index. Index performance does not reflect fund performance.
Funds that invest in securities of medium capitalization companies involve greater risk than customarily is associated with investing in larger, more established companies. A medium capitalization company is defined as a company with a market capitalization between $2 billion and $10 billion. These companies’ securities may be more volatile and less liquid than those of more established companies. These securities may have returns that vary, sometimes significantly, from the overall securities market. Often medium capitalization companies and the industries in which they focus are still evolving and, as a result, they may be more sensitive to changing market conditions.
The Fund’s shares are not individually redeemable. Investors buy and sell shares of the Fund on a secondary market. Only market makers or “authorized participants” may trade directly with the Fund, typically in blocks of 50,000 shares.
The Sprott BUZZ Social Media Insights ETF is not suitable for all investors. Investments in the Fund are subject to investment risks, including possible loss of the principal amount invested.
ALPS Portfolio Solutions Distributor, Inc., a FINRA member, is the distributor for the Sprott BUZZ Social Media Insights ETF.
ALPS Portfolio Solutions Distributor, Inc. is not affiliated with Sprott Asset Management LP or BUZZ Indexes Inc.
Sprott BUZZ Social Media Insights ETF
| Performance Overview | November 30, 2016 (Unaudited) |
Top 10 Holdings* (as of November 30, 2016)
| Advanced Micro Devices, Inc. | 3.16% |
| Facebook, Inc., Class A | 3.02% |
| Apple, Inc. | 3.02% |
| Tesla Motors, Inc. | 3.01% |
| The Walt Disney Co. | 3.00% |
| NVIDIA Corp. | 3.00% |
| Twitter, Inc. | 2.99% |
Bristol-Myers Squibb Co. | 2.99% |
| Microsoft Corp. | 2.98% |
| Amazon.com, Inc. | 2.98% |
| Total % of Top 10 Holdings | 30.15% |
Future holdings are subject to change.
Sector Allocation* (as of November 30, 2016)
| Information Technology | 30.33% |
| Health Care | 23.57% |
| Consumer Discretionary | 17.32% |
| Industrials | 6.36% |
| Energy | 5.09% |
| Telecommunication Services | 4.93% |
| Financials | 4.92% |
| Consumer Staples | 4.43% |
| Materials | 2.92% |
| Money Market Fund | 0.13% |
| Total | 100.00% |
Growth of $10,000 (as of November 30, 2016)
Comparison of Change in Value of $10,000 Investment in the Fund and the Underlying Index
The chart above represents historical performance of a hypothetical investment of $10,000 in the Fund over the life of the Fund. Past performance does not guarantee future results. This chart does not reflect the deduction of taxes that a shareholder would pay on Fund distributions or the redemption of Fund shares.
Sprott ETFs
| Disclosure of Fund Expenses | November 30, 2016 (Unaudited) |
Shareholder Expense Example: As a shareholder of a Fund, you incur two types of costs: (1) transaction costs which may include creation and redemption fees or brokerage charges, and (2) ongoing costs, including management fees and other Fund expenses. These examples are intended to help you understand your ongoing costs (in dollars) of investing in a Fund and to compare these costs with the ongoing costs of investing in other funds. It is based on an investment of $1,000 invested at the beginning of the (six month) period and held through November 30, 2016.
Actual Return: The first line of the table provides information about actual account values and actual expenses. You may use the information in this line, together with the amount you invested, to estimate the expenses that you incurred over the period. Simply divide your account value by $1,000 (for example, an $8,600 account value divided by $1,000 = 8.6), then multiply the result by the number in the first line under the heading entitled “Expenses Paid During Period” to estimate the expenses attributable to your investment during this period.
Hypothetical 5% Return: The second line of the table provides information about hypothetical account values and hypothetical expenses based on each Fund’s actual expense ratio and an assumed rate of return of 5% per year before expenses, which is not the Fund’s actual return. The hypothetical account values and expenses may not be used to estimate the actual ending account balance or expenses you paid for the period. You may use this information to compare ongoing costs of investing in each Fund and other funds. To do so, compare this 5% hypothetical example with the 5% hypothetical examples that appear in the shareholder reports of other funds.
The expenses shown in the table are meant to highlight ongoing Fund costs only and do not reflect any transaction costs, such as creation and redemption fees or brokerage charges. Therefore, the second line is useful in comparing ongoing costs only, and will not help you determine the relative total costs of owning different funds. In addition, if these costs were included, your costs would have been higher.
| | Beginning Account Value 6/1/16 | Ending Account Value 11/30/16 | Expense Ratio(a) | Expenses Paid During Period 6/1/16 - 11/30/16(b) |
| Sprott Gold Miners ETF | | | | |
| Actual | $1,000.00 | $918.00 | 0.57% | $2.73 |
| Hypothetical (5% return before expenses) | $1,000.00 | $1,022.15 | 0.57% | $2.88 |
| Sprott Junior Gold Miners ETF | | | | |
| Actual | $1,000.00 | $1,007.30 | 0.57% | $2.86 |
| Hypothetical (5% return before expenses) | $1,000.00 | $1,022.15 | 0.57% | $2.88 |
| Sprott BUZZ Social Media Insights ETF | | | | |
| Actual | $1,000.00 | $1,066.40 | 0.75% | $3.87 |
| Hypothetical (5% return before expenses) | $1,000.00 | $1,021.25 | 0.75% | $3.79 |
(a) | Annualized, based on the Fund's most recent fiscal half year expenses. |
(b) | Expenses are equal to the Fund's annualized expense ratio multiplied by the average account value over the period, multiplied by the number of days in the most recent fiscal half year (183), divided by 366. |
Sprott ETFs
Report of Independent Registered Public Accounting Firm
To the Board of Trustees and Shareholders of ALPS ETF Trust:
We have audited the accompanying statements of assets and liabilities, including the schedules of investments, of Sprott Gold Miners ETF, Sprott Junior Gold Miners ETF, and Sprott BUZZ Social Media Insights ETF, three of the portfolios constituting the ALPS ETF Trust (the “Trust”), as of November 30, 2016, and the related statements of operations for the year then ended (as to Sprott BUZZ Social Media Insights ETF, for the period April 19, 2016 (commencement of operations) to November 30, 2016), the statements of changes in net assets for each of the two years in the period then ended (as to Sprott Junior Gold Miners ETF, for the year then ended and the period March 31, 2015 (commencement of operations) to November 30, 2015; and as to Sprott BUZZ Social Media Insights ETF, for the period April 19, 2016 (commencement of operations) to November 30, 2016), and the financial highlights for each of the periods presented. These financial statements and financial highlights are the responsibility of the Trust’s management. Our responsibility is to express an opinion on these financial statements and financial highlights based on our audits.
We conducted our audits in accordance with the standards of the Public Company Accounting Oversight Board (United States). Those standards require that we plan and perform the audit to obtain reasonable assurance about whether the financial statements and financial highlights are free of material misstatement. The Trust is not required to have, nor were we engaged to perform, an audit of its internal control over financial reporting. Our audits included consideration of internal control over financial reporting as a basis for designing audit procedures that are appropriate in the circumstances, but not for the purpose of expressing an opinion on the effectiveness of the Trust’s internal control over financial reporting. Accordingly, we express no such opinion. An audit also includes examining, on a test basis, evidence supporting the amounts and disclosures in the financial statements, assessing the accounting principles used and significant estimates made by management, as well as evaluating the overall financial statement presentation. Our procedures included confirmation of securities owned as of November 30, 2016, by correspondence with the custodian and broker. We believe that our audits provide a reasonable basis for our opinion.
In our opinion, the financial statements and financial highlights referred to above present fairly, in all material respects, the financial position of Sprott Gold Miners ETF, Sprott Junior Gold Miners ETF, and Sprott BUZZ Social Media Insights ETF of the ALPS ETF Trust as of November 30, 2016, and the results of their operations, the changes in their net assets, and the financial highlights for each of the periods presented, in conformity with accounting principles generally accepted in the United States of America.
DELOITTE & TOUCHE LLP
Denver, Colorado
January 27, 2017
Sprott Gold Miners ETF
| Schedule of Investments | November 30, 2016 |
| Security Description | | Shares | | | Value | |
| COMMON STOCKS (99.89%) | | | | | | |
| Gold Mining (88.94%) | | | | | | |
| Agnico Eagle Mines Ltd. | | | 678,590 | | | $ | 27,856,119 | |
AngloGold Ashanti Ltd., Sponsored ADR(a) | | | 624,056 | | | | 6,827,173 | |
Asanko Gold, Inc.(a)(b) | | | 836,047 | | | | 2,934,525 | |
B2Gold Corp.(a)(b) | | | 3,382,984 | | | | 8,186,821 | |
| Barrick Gold Corp. | | | 558,733 | | | | 8,392,170 | |
| Cia de Minas Buenaventura SAA, ADR | | | 784,210 | | | | 8,759,626 | |
| Gold Fields Ltd., Sponsored ADR | | | 1,285,803 | | | | 3,947,415 | |
Harmony Gold Mining Co. Ltd., Sponsored ADR(b) | | | 743,502 | | | | 1,695,184 | |
IAMGOLD Corp.(a) | | | 679,841 | | | | 2,495,016 | |
Kinross Gold Corp.(a) | | | 2,421,151 | | | | 7,965,587 | |
McEwen Mining, Inc.(b) | | | 1,194,830 | | | | 3,381,369 | |
New Gold, Inc.(a) | | | 1,561,508 | | | | 5,590,199 | |
NOVAGOLD RESOURCES, Inc.(a)(b) | | | 500,449 | | | | 2,292,056 | |
Pretium Resources, Inc.(a) | | | 280,778 | | | | 2,454,000 | |
| Randgold Resources Ltd., ADR | | | 423,051 | | | | 30,408,906 | |
| Royal Gold, Inc. | | | 366,756 | | | | 25,540,888 | |
Sandstorm Gold Ltd.(a)(b) | | | 522,848 | | | | 1,934,538 | |
Seabridge Gold, Inc.(a)(b) | | | 121,624 | | | | 1,131,103 | |
| Sibanye Gold Ltd., Sponsored ADR | | | 362,516 | | | | 3,012,508 | |
| Yamana Gold, Inc. | | | 2,916,920 | | | | 8,721,591 | |
| Total Gold Mining | | | | | | | 163,526,794 | |
| | | | | | | | | |
| Silver Mining (10.95%) | | | | | | | | |
Coeur Mining, Inc.(a) | | | 499,091 | | | | 4,816,228 | |
Endeavour Silver Corp.(a)(b) | | | 653,511 | | | | 2,483,342 | |
First Majestic Silver Corp.(a)(b) | | | 638,007 | | | | 5,659,122 | |
Fortuna Silver Mines, Inc.(a) | | | 598,102 | | | | 3,630,479 | |
Silver Standard Resources, Inc.(a) | | | 359,372 | | | | 3,543,408 | |
| Total Silver Mining | | | | | | | 20,132,579 | |
| | | | | | | | | |
TOTAL COMMON STOCKS (Cost $207,244,836) | | | 183,659,373 | |
| | | | | | | | | |
| RIGHTS (0.02%) | | | | | | | | |
| Gold Mining (0.02%) | | | | | | | | |
| Yamana Gold, Inc., Strike Price $3.25 CAD (expiring 12/21/16) | | | | | | | 30,292 | |
| Total Gold Mining | | | | | | | 30,292 | |
| | | | | | | | | |
TOTAL RIGHTS (Cost $–) | | | | | | | 30,292 | |
| | | | | | | | | |
SHORT TERM INVESTMENTS (4.11%) | | | | | |
| Investments Purchased with Collateral from Securities Loaned (4.11%) | |
| State Street Navigator Securities Lending Government Money Market Portfolio, 0.26% | | | | | | | | |
| (Cost $7,566,057) | | | 7,566,057 | | | | 7,566,057 | |
| Security Description | | Shares | | | Value | |
TOTAL INVESTMENTS (104.02%) (Cost $214,810,893) | | | | | | $ | 191,255,722 | |
| | | | | | | | | |
NET OTHER ASSETS AND LIABILITIES (-4.02%) | | | | (7,390,772 | ) |
| | | | | | | | | |
| NET ASSETS (100.00%) | | | | | | $ | 183,864,950 | |
| (a) | Non-income producing security. |
| (b) | Security, or a portion of the security position, is currently on loan. The total market value of securities on loan is $8,380,321. |
See Notes to Financial Statements.
Sprott Junior Gold Miners ETF
| Schedule of Investments | November 30, 2016 |
Security Description | | Shares | | | Value | |
| COMMON STOCKS (99.97%) | | | | | | |
| Gold Mining (79.82%) | | | | | | |
Alacer Gold Corp.(a) | | | 401,654 | | $ | 735,553 | |
| Alamos Gold, Inc., Class A | | | 518,747 | | | | 3,314,793 | |
Argonaut Gold, Inc.(a) | | | 211,335 | | | | 388,593 | |
Asanko Gold, Inc.(a) | | | 391,087 | | | | 1,371,265 | |
| Centerra Gold, Inc. | | | 382,080 | | | | 1,973,971 | |
China Gold International Resources Corp., Ltd.(a) | | | 770,088 | | | | 1,582,255 | |
Continental Gold, Inc.(a)(b) | | | 88,823 | | | | 221,512 | |
Eldorado Gold Corp.(a) | | | 492,622 | | | | 1,349,784 | |
Endeavour Mining Corp.(a) | | | 188,135 | | | | 2,833,299 | |
Gold Standard Ventures Corp(a)(b) | | | 160,568 | | | | 358,067 | |
Guyana Goldfields, Inc.(a) | | | 361,454 | | | | 1,479,935 | |
| Harmony Gold Mining Co. Ltd., | | | | | | | | |
| Sponsored ADR | | | 296,454 | | | | 675,915 | |
IAMGOLD Corp.(a) | | | 872,247 | | | | 3,201,147 | |
Kirkland Lake Gold, Inc.(a) | | | 164,662 | | | | 914,448 | |
Klondex Mines Ltd.(a) | | | 347,417 | | | | 1,681,092 | |
Lundin Gold, Inc.(a)(b) | | | 83,325 | | | | 322,556 | |
New Gold, Inc.(a) | | | 709,066 | | | | 2,538,456 | |
NOVAGOLD RESOURCES, Inc.(a) | | | 219,718 | | | | 1,006,309 | |
| OceanaGold Corp. | | | 1,203,365 | | | | 3,341,436 | |
| Osisko Gold Royalties Ltd. | | | 209,074 | | | | 2,048,250 | |
Premier Gold Mines Ltd.(a) | | | 152,146 | | | | 259,372 | |
Pretium Resources, Inc.(a) | | | 120,172 | | | | 1,050,303 | |
Richmont Mines, Inc.(a) | | | 89,681 | | | | 580,827 | |
Sandstorm Gold Ltd.(a)(b) | | | 105,082 | | | | 388,804 | |
Seabridge Gold, Inc.(a)(b) | | | 38,289 | | | | 356,088 | |
SEMAFO, Inc.(a) | | | 452,110 | | | | 1,376,558 | |
Teranga Gold Corp.(a) | | | 922,546 | | | | 576,892 | |
TMAC Resources, Inc.(a)(c) | | | 56,343 | | | | 654,322 | |
Torex Gold Resources, Inc.(a) | | | 107,812 | | | | 1,614,812 | |
| Total Gold Mining | | | | | | | 38,196,614 | |
| | | | | | | | | |
| Silver Mining (20.15%) | | | | | | | | |
Coeur Mining, Inc.(a) | | | 240,306 | | | | 2,318,953 | |
Endeavour Silver Corp.(a) | | | 172,382 | | | | 655,052 | |
First Majestic Silver Corp.(a)(b) | | | 216,989 | | | | 1,924,692 | |
Fortuna Silver Mines, Inc.(a) | | | 273,176 | | | | 1,658,178 | |
MAG Silver Corp.(a) | | | 55,290 | | | | 685,723 | |
Silver Standard Resources, Inc.(a) | | | 162,478 | | | | 1,602,033 | |
| Silvercorp Metals, Inc. | | | 315,131 | | | | 799,968 | |
| Total Silver Mining | | | | | | | 9,644,599 | |
| | | | | | | | | |
TOTAL COMMON STOCKS
(Cost $47,136,678) | | | | 47,841,213 | |
| | | 7 Day Yield | | | Shares | | | Value | |
| SHORT TERM INVESTMENTS (5.64%) |
| Money Market Fund (1.35%) | | | | | | | | | |
| State Street Institutional Treasury Plus Money Market | | | | |
| (Cost $644,671) | | | 0.259 | % | | | 644,671 | | | $ | 644,671 | |
| | | | | | | | | | | | | |
| Investments Purchased with Collateral from Securities Loaned (4.29%) | |
State Street Navigator Securities Lending Government Money Market Portfolio, 0.26% | | | | | |
| (Cost $2,052,930) | | | | | | | 2,052,930 | | | | 2,052,930 | |
| | | | | | | | | | | | | |
TOTAL SHORT TERM INVESTMENTS
(Cost $2,697,601) | | | | 2,697,601 | |
| | | | | | | | | | | | | |
TOTAL INVESTMENTS (105.61%) (Cost $49,834,279) | $ | 50,538,814 | |
| | | | | | | | | | | | | |
| NET LIABILITIES LESS OTHER ASSETS (5.61%) | | | | (2,682,118 | ) |
| | | | | | | | | | | | | |
| NET ASSETS (100.00%) | | | | | | | | | | $ | 47,856,696 | |
| (a) | Non-income producing security. |
| (b) | Security, or a portion of the security position, is currently on loan. The total market value of securities on loan is $2,188,446. |
| (c) | Securities were purchased pursuant to Regulation S under the Securities Act of 1933, which exempts securities offered and sold outside of the United States from registration. Such securities cannot be sold in the United States without either an effective registration statement filed pursuant to the Securities Act of 1933, or pursuant to an exemption from registration. As of November 30, 2016, the market value of those securities was $654,322, representing 1.37% of net assets. |
See Notes to Financial Statements.
Sprott BUZZ Social Media Insights ETF
| Schedule of Investments | November 30, 2016 |
| Security Description | | Shares | | | Value | |
| COMMON STOCKS (99.80%) | | | | | | |
| Consumer Discretionary (17.31%) | | | | | | |
Amazon.com, Inc.(a) | | | 205 | | | $ | 153,867 | |
| Ford Motor Co. | | | 3,425 | | | | 40,963 | |
| General Motors Co. | | | 706 | | | | 24,378 | |
| McDonald's Corp. | | | 147 | | | | 17,533 | |
MGM Resorts International(a) | | | 524 | | | | 15,044 | |
| NIKE, Inc., Class B | | | 2,097 | | | | 104,997 | |
| Starbucks Corp. | | | 858 | | | | 49,738 | |
Tesla Motors, Inc.(a) | | | 822 | | | | 155,687 | |
Under Armour, Inc., Class A(a) | | | 4,800 | | | | 147,840 | |
| The Walt Disney Co. | | | 1,561 | | | | 154,726 | |
| Wynn Resorts Ltd. | | | 293 | | | | 29,883 | |
| Total Consumer Discretionary | | | | | | | 894,656 | |
| | | | | | | | | |
| Consumer Staples (4.43%) | | | | | | | | |
| Altria Group, Inc. | | | 903 | | | | 57,729 | |
The Coca-Cola Co. | | | 829 | | | | 33,450 | |
| CVS Health Corp. | | | 568 | | | | 43,673 | |
| The Kroger Co. | | | 970 | | | | 31,331 | |
| The Procter & Gamble Co. | | | 441 | | | | 36,365 | |
Wal-Mart Stores, Inc. | | | 376 | | | | 26,482 | |
| Total Consumer Staples | | | | | | | 229,030 | |
| | | | | | | | | |
| Energy (5.09%) | | | | | | | | |
| Chevron Corp. | | | 207 | | | | 23,093 | |
| Devon Energy Corp. | | | 589 | | | | 28,466 | |
| Energy Transfer Equity LP | | | 4,260 | | | | 72,548 | |
| Exxon Mobil Corp. | | | 200 | | | | 17,460 | |
| Kinder Morgan, Inc. | | | 2,585 | | | | 57,387 | |
| Marathon Oil Corp. | | | 2,326 | | | | 42,008 | |
| Schlumberger Ltd. | | | 261 | | | | 21,937 | |
| Total Energy | | | | | | | 262,899 | |
| | | | | | | | | |
| Financials (4.91%) | | | | | | | | |
| American Express Co. | | | 391 | | | | 28,168 | |
| Bank of America Corp. | | | 4,282 | | | | 90,436 | |
| The Blackstone Group LP | | | 1,142 | | | | 29,395 | |
| Citigroup, Inc. | | | 555 | | | | 31,296 | |
| The Goldman Sachs Group, Inc. | | | 133 | | | | 29,166 | |
| JPMorgan Chase & Co. | | | 337 | | | | 27,017 | |
| Morgan Stanley | | | 446 | | | | 18,446 | |
| Total Financials | | | | | | | 253,924 | |
| | | | | | | | | |
| Health Care (23.55%) | | | | | | | | |
| AbbVie, Inc. | | | 2,513 | | | | 152,790 | |
Allergan Plc(a) | | | 225 | | | | 43,718 | |
| Amgen, Inc. | | | 529 | | | | 76,213 | |
Biogen, Inc.(a) | | | 238 | | | | 69,989 | |
Bristol-Myers Squibb Co. | | | 2,736 | | | | 154,420 | |
Celgene Corp.(a) | | | 1,218 | | | | 144,345 | |
| Gilead Sciences, Inc. | | | 2,052 | | | | 151,232 | |
Incyte Corp.(a) | | | 166 | | | | 16,980 | |
| Johnson & Johnson | | | 557 | | | | 61,994 | |
Mallinckrodt Plc(a) | | | 423 | | | | 22,292 | |
| Merck & Co., Inc. | | | 534 | | | | 32,675 | |
OPKO Health, Inc.(a) | | | 6,363 | | | | 66,112 | |
| Pfizer, Inc. | | | 1,828 | | | | 58,752 | |
| Security Description | | Shares | | | Value | |
| Health Care (continued) | | | | | | |
Regeneron Pharmaceuticals, Inc.(a) | | | 79 | | | $ | 29,960 | |
Valeant Pharmaceuticals International,
Inc.(a) | | | 8,615 | | | | 136,031 | |
| Total Health Care | | | | | | | 1,217,503 | |
| | | | | | | | | |
| Industrials (6.36%) | | | | | | | | |
| The Boeing Co. | | | 316 | | | | 47,577 | |
| Delta Air Lines, Inc. | | | 518 | | | | 24,957 | |
| General Electric Co. | | | 2,143 | | | | 65,919 | |
JetBlue Airways Corp.(a) | | | 3,658 | | | | 73,489 | |
| Lockheed Martin Corp. | | | 188 | | | | 49,867 | |
| Southwest Airlines Co. | | | 977 | | | | 45,538 | |
| United Technologies Corp. | | | 198 | | | | 21,328 | |
| Total Industrials | | | | | | | 328,675 | |
| | | | | | | | | |
| Information Technology (30.31%) | | | | | | | | |
| Activision Blizzard, Inc. | | | 1,511 | | | | 55,318 | |
Advanced Micro Devices, Inc.(a) | | | 18,330 | | | | 163,320 | |
Alphabet, Inc., Class A(a) | | | 197 | | | | 152,848 | |
| Apple, Inc. | | | 1,410 | | | | 155,833 | |
Facebook, Inc., Class A(a) | | | 1,317 | | | | 155,959 | |
| Intel Corp. | | | 3,588 | | | | 124,504 | |
| International Business Machines Corp. | | | 347 | | | | 56,290 | |
Micron Technology, Inc.(a) | | | 1,084 | | | | 21,171 | |
| Microsoft Corp. | | | 2,557 | | | | 154,085 | |
| NVIDIA Corp. | | | 1,678 | | | | 154,712 | |
PayPal Holdings, Inc.(a) | | | 1,686 | | | | 66,226 | |
| QUALCOMM, Inc. | | | 516 | | | | 35,155 | |
salesforce.com, Inc.(a) | | | 446 | | | | 32,112 | |
Twitter, Inc.(a) | | | 8,360 | | | | 154,576 | |
| Visa, Inc., Class A | | | 819 | | | | 63,325 | |
| Western Digital Corp. | | | 331 | | | | 21,072 | |
| Total Information Technology | | | | | | | 1,566,506 | |
| | | | | | | | | |
| Materials (2.91%) | | | | | | | | |
| Alcoa Corp. | | | 518 | | | | 15,007 | |
Freeport-McMoRan, Inc.(a) | | | 7,307 | | | | 112,162 | |
| Newmont Mining Corp. | | | 725 | | | | 23,519 | |
| Total Materials | | | | | | | 150,688 | |
| | | | | | | | | |
| Telecommunication Services (4.93%) | | | | | | | | |
| AT&T, Inc. | | | 2,545 | | | | 98,313 | |
Sprint Corp.(a) | | | 17,763 | | | | 139,262 | |
| Verizon Communications, Inc. | | | 346 | | | | 17,266 | |
| Total Telecommunication Services | | | | | | | 254,841 | |
| | | | | | | | | |
TOTAL COMMON STOCKS
(Cost $5,003,248) | | | | | | | 5,158,722 | |
Sprott BUZZ Social Media Insights ETF
| Schedule of Investments | November 30, 2016 |
| | | 7 Day Yield | | | Shares | | | Value | |
| SHORT TERM INVESTMENTS (0.13%) | | | | | |
| State Street Institutional Treasury Plus Money Market | | | 0.259 | % | | | 6,473 | | | $ | 6,473 | |
| | | | | | | | | | | | | |
TOTAL SHORT TERM INVESTMENTS (Cost $6,473) | | | 6,473 | |
| | | | | | | | | | | | | |
TOTAL INVESTMENTS (99.93%) (Cost $5,009,721) | | $ | 5,165,195 | |
| | | | | | | | | | | | | |
| NET OTHER ASSETS AND LIABILITIES (0.07%) | | | | 3,846 | |
| | | | | | | | | | | | | |
| NET ASSETS (100.00%) | | | | | | | | | | $ | 5,169,041 | |
| (a) | Non-income producing security. |
See Notes to Financial Statements.
Sprott ETFs
| Statements of Assets and Liabilities | November 30, 2016 |
| | | Sprott Gold Miners ETF | | | Sprott Junior Gold Miners ETF | | | Sprott BUZZ Social Media Insights ETF | |
| ASSETS: | | | | | | | | | |
| Investments, at value | | $ | 191,255,722 | | | $ | 50,538,814 | | | $ | 5,165,195 | |
| Receivable for investments sold | | | 649,097 | | | | 25,813 | | | | – | |
| Foreign tax reclaims | | | 69,091 | | | | 1,339 | | | | – | |
| Dividends receivable | | | 97,307 | | | | 5,532 | | | | 6,958 | |
| Total Assets | | | 192,071,217 | | | | 50,571,498 | | | | 5,172,153 | |
| | | | | | | | | | | | | |
| LIABILITIES: | | | | | | | | | | | | |
| Payable for investments purchased | | | – | | | | 637,760 | | | | – | |
| Payable to adviser | | | 91,089 | | | | 24,112 | | | | 3,112 | |
| Payable to custodian for overdraft | | | 549,121 | | | | – | | | | – | |
| Payable for collateral upon return of securities loaned | | | 7,566,057 | | | | 2,052,930 | | | | – | |
| Total Liabilities | | | 8,206,267 | | | | 2,714,802 | | | | 3,112 | |
| NET ASSETS | | $ | 183,864,950 | | | $ | 47,856,696 | | | $ | 5,169,041 | |
| | | | | | | | | | | | | |
| NET ASSETS CONSIST OF: | | | | | | | | | | | | |
| Paid‐in capital | | $ | 255,629,183 | | | $ | 55,186,277 | | | $ | 5,236,632 | |
| Accumulated net investment income/(loss) | | | (92,793 | ) | | | (102,091 | ) | | | 24,716 | |
| Accumulated net realized loss | | | (48,116,269 | ) | | | (7,928,963 | ) | | | (247,781 | ) |
| Net unrealized appreciation/(depreciation) | | | (23,555,171 | ) | | | 701,473 | | | | 155,474 | |
| NET ASSETS | | $ | 183,864,950 | | | $ | 47,856,696 | | | $ | 5,169,041 | |
| | | | | | | | | | | | | |
| INVESTMENTS, AT COST | | $ | 214,810,893 | | | $ | 49,834,279 | | | $ | 5,009,721 | |
| | | | | | | | | | | | | |
| PRICING OF SHARES | | | | | | | | | | | | |
| Net Assets | | $ | 183,864,950 | | | $ | 47,856,696 | | | $ | 5,169,041 | |
| Shares of beneficial interest outstanding (Unlimited number of shares authorized,par value $0.01 per share) | | | 9,600,000 | | | | 1,450,000 | | | | 200,002 | |
| Net Asset Value, offering and redemption price per share | | $ | 19.15 | | | $ | 33.00 | | | $ | 25.84 | |
See Notes to Financial Statements.
Sprott ETFs
| Statements of Operations | For the Year Ended November 30, 2016 |
| | | Sprott Gold Miners ETF | | | Sprott Junior Gold Miners ETF | | | Sprott BUZZ Social Media Insights ETF(a) | |
| INVESTMENT INCOME: | | | | | | | | | |
Dividends(b) | | $ | 963,741 | | | $ | 164,314 | | | $ | 48,448 | |
Securities lending income | | | 59,282 | | | | 17,787 | | | | – | |
| Total Investment Income | | | 1,023,023 | | | | 182,101 | | | | 48,448 | |
| | | | | | | | | | | | | |
| EXPENSES: | | | | | | | | | | | | |
| Investment adviser fees | | | 1,045,388 | | | | 241,488 | | | | 22,444 | |
| Total Expense | | | 1,045,388 | | | | 241,488 | | | | 22,444 | |
NET INVESTMENT INCOME/(LOSS) | | | (22,365 | ) | | | (59,387 | ) | | | 26,004 | |
| | | | | | | | | | | | | |
| REALIZED AND UNREALIZED GAIN/(LOSS) | | | | | | | | | | | | |
| Net realized gain on investments | | | 28,894,011 | | | | 10,166,192 | | | | 17,488 | |
| Net realized gain on foreign currency transactions | | | – | | | | 6,232 | | | | – | |
| Net realized gain | | | 28,894,011 | | | | 10,172,424 | | | | 17,488 | |
| Net change in unrealized appreciation on investments | | | 18,872,591 | | | | 2,287,422 | | | | 155,474 | |
| Net change in unrealized depreciation on translation of assets and liabilities denominated in foreign currencies | | | – | | | | (5,427 | ) | | | – | |
| Net change in unrealized appreciation/(depreciation) | | | 18,872,591 | | | | 2,281,995 | | | | 155,474 | |
NET REALIZED AND UNREALIZED GAIN ON INVESTMENTS | | | 47,766,602 | | | | 12,454,419 | | | | 172,962 | |
| NET INCREASE IN NET ASSETS RESULTING FROM OPERATIONS | | $ | 47,744,237 | | | $ | 12,395,032 | | | $ | 198,966 | |
| (a) | The Sprott BUZZ Social Media Insights ETF commenced operations on April 19, 2016. |
| (b) | Net of foreign tax withholding in the amounts of $129,120, $30,766 and $0 respectively. |
See Notes to Financial Statements.
Sprott Gold Miners ETF
Statements of Changes in Net Assets
| | | For the Year Ended November 30, 2016 | | | For the Year Ended November 30, 2015(a) | |
| OPERATIONS: | | | | | | |
| Net investment income/(loss) | | $ | (22,365 | ) | | $ | 911,400 | |
Net realized gain/(loss) (a) | | | 28,894,011 | | | | (30,480,573 | ) |
Net change in unrealized appreciation/(depreciation) (a) | | | 18,872,591 | | | | (28,677,091 | ) |
| Net increase/(decrease) in net assets resulting from operations | | | 47,744,237 | | | | (58,246,264 | ) |
| | | | | | | | | |
| DISTRIBUTIONS TO SHAREHOLDERS: | | | | | | | | |
| From net investment income | | | (1,513,542 | ) | | | (277,011 | ) |
| Total distributions | | | (1,513,542 | ) | | | (277,011 | ) |
| | | | | | | | | |
| CAPITAL SHARE TRANSACTIONS: | | | | | | | | |
| Proceeds from sale of shares | | | 177,943,316 | | | | 151,779,023 | |
| Cost of shares redeemed | | | (152,466,664 | ) | | | (70,053,767 | ) |
| Net increase from capital share transactions | | | 25,476,652 | | | | 81,725,256 | |
| Net increase in net assets | | | 71,707,347 | | | | 23,201,981 | |
| | | | | | | | | |
| NET ASSETS: | | | | | | | | |
| Beginning of year | | | 112,157,603 | | | | 88,955,622 | |
| End of year * | | $ | 183,864,950 | | | $ | 112,157,603 | |
| | | | | | | | | |
| *Including accumulated net investment income/(loss) of: | | $ | (92,793 | ) | | $ | 996,661 | |
| | | | | | | | | |
| OTHER INFORMATION: | | | | | | | | |
| CAPITAL SHARE TRANSACTIONS: | | | | | | | | |
| Beginning shares | | | 8,650,000 | | | | 5,100,002 | |
| Shares sold | | | 7,650,000 | | | | 7,800,000 | |
| Shares redeemed | | | (6,700,000 | ) | | | (4,250,002 | ) |
| Shares outstanding, end of period | | | 9,600,000 | | | | 8,650,000 | |
| (a) | Prior to November 30, 2016, the Fund presented realized gain/loss and unrealized appreciation/depreciation by investment type. This change in presentation was made to conform to industry standards and had no effect on the Fund's change in net assets. |
See Notes to Financial Statements.
Sprott Junior Gold Miners ETF
Statements of Changes in Net Assets
| | | For the Year Ended November 30, 2016 | | | For the Period March 31, 2015 (Commencement of Operations) to November 30, 2015(a) | |
| OPERATIONS: | | | | | | |
| Net investment income/(loss) | | $ | (59,387 | ) | | $ | 37,732 | |
Net realized gain/(loss) (a) | | | 10,172,424 | | | | (4,019,269 | ) |
Net change in unrealized appreciation/(depreciation) (a) | | | 2,281,995 | | | | (1,580,522 | ) |
| Net increase/(decrease) in net assets resulting from operations | | | 12,395,032 | | | | (5,562,059 | ) |
| | | | | | | | | |
| DISTRIBUTIONS TO SHAREHOLDERS: | | | | | | | | |
| From net investment income | | | (195,292 | ) | | | – | |
Total distributions | | | (195,292 | ) | | | – | |
| | | | | | | | | |
| CAPITAL SHARE TRANSACTIONS: | | | | | | | | |
| Proceeds from sale of shares | | | 53,843,641 | | | | 33,407,426 | |
| Cost of shares redeemed | | | (41,765,613 | ) | | | (4,266,439 | ) |
| Net increase from capital share transactions | | | 12,078,028 | | | | 29,140,987 | |
| Net increase in net assets | | | 24,277,768 | | | | 23,578,928 | |
| | | | | | | | | |
| NET ASSETS: | | | | | | | | |
| Beginning of year | | | 23,578,928 | | | | – | |
| End of year * | | $ | 47,856,696 | | | $ | 23,578,928 | |
| | | | | | | | | |
| *Including accumulated net investment income/(loss) of: | | $ | (102,091 | ) | | $ | 50,828 | |
| | | | | | | | | |
| OTHER INFORMATION: | | | | | | | | |
| CAPITAL SHARE TRANSACTIONS: | | | | | | | | |
| Beginning shares | | | 1,200,000 | | | | – | |
| Shares sold | | | 1,500,000 | | | | 1,350,002 | |
| Shares redeemed | | | (1,250,000 | ) | | | (150,002 | ) |
| Shares outstanding, end of period | | | 1,450,000 | | | | 1,200,000 | |
| (a) | Prior to November 30, 2016, the Fund presented realized gain/loss and unrealized appreciation/depreciation by investment type. This change in presentation was made to conform to industry standards and had no effect on the Fund's change in net assets. |
See Notes to Financial Statements.
Sprott BUZZ Social Media Insights ETF
Statement of Changes in Net Assets
| | | For the Period April 19, 2016 (Commencement of Operations) to November 30, 2016 | |
| OPERATIONS: | | | |
| Net investment income | | $ | 26,004 | |
| Net realized gain | | | 17,488 | |
| Net change in unrealized appreciation | | | 155,474 | |
| Net increase in net assets resulting from operations | | | 198,966 | |
| | | | | |
| CAPITAL SHARE TRANSACTIONS: | | | | |
| Proceeds from sale of shares | | | 7,542,694 | |
| Cost of shares redeemed | | | (2,572,619 | ) |
| Net increase from capital share transactions | | | 4,970,075 | |
| Net increase in net assets | | | 5,169,041 | |
| | | | | |
| NET ASSETS: | | | | |
| Beginning of period | | | – | |
| End of period * | | $ | 5,169,041 | |
| | | | | |
| *Including accumulated net investment income of: | | $ | 24,716 | |
| | | | | |
| OTHER INFORMATION: | | | | |
| CAPITAL SHARE TRANSACTIONS: | | | | |
| Beginning shares | | | – | |
| Shares sold | | | 300,002 | |
| Shares redeemed | | | (100,000 | ) |
| Shares outstanding, end of period | | | 200,002 | |
See Notes to Financial Statements.
Sprott Gold Miners ETF
| Financial Highlights | For a Share Outstanding Throughout the Periods Presented |
| | | For the Year Ended November 30, 2016 | | | For the Year Ended November 30, 2015 | | | For the Period July 15, 2014 (Commencement of Operations) to November 30, 2014 | |
| NET ASSET VALUE, BEGINNING OF PERIOD | | $ | 12.97 | | | $ | 17.44 | | | $ | 25.00 | |
| | | | | | | | | | | | | |
| INCOME/(LOSS) FROM INVESTMENT OPERATIONS: | | | | | | | | | | | | |
Net investment income (a) | | | (0.00 | )(b) | | | 0.10 | | | | 0.02 | |
| Net realized and unrealized gain/(loss) | | | 6.37 | | | | (4.52 | ) | | | (7.58 | ) |
| Total from investment operations | | | 6.37 | | | | (4.42 | ) | | | (7.56 | ) |
| | | | | | | | | | | | | |
| DISTRIBUTIONS: | | | | | | | | | | | | |
| From net investment income | | | (0.19 | ) | | | (0.05 | ) | | | – | |
| Total distributions | | | (0.19 | ) | | | (0.05 | ) | | | – | |
| | | | | | | | | | | | | |
| Net increase/(decrease) in net asset value | | | 6.18 | | | | (4.47 | ) | | | (7.56 | ) |
| NET ASSET VALUE, END OF PERIOD | | $ | 19.15 | | | $ | 12.97 | | | $ | 17.44 | |
TOTAL RETURN(c) | | | 49.82 | % | | | (25.44 | )% | | | (30.24 | )% |
| | | | | | | | | | | | | |
| RATIOS/SUPPLEMENTAL DATA: | | | | | | | | | | | | |
| Net assets, end of period (000s) | | $ | 183,865 | | | $ | 112,158 | | | $ | 88,956 | |
| | | | | | | | | | | | | |
| Ratio of expenses to average net assets | | | 0.57 | % | | | 0.57 | % | | | 0.57 | %(d) |
| Ratio of net investment income/(loss) to average net assets | | | (0.01 | )% | | | 0.61 | % | | | 0.31 | %(d) |
Portfolio turnover rate(e) | | | 74 | % | | | 78 | % | | | 36 | % |
| (a) | Based on average shares outstanding during the period. |
| (b) | Less than $0.005 per share. |
| (c) | Total return is calculated assuming an initial investment made at the net asset value at the beginning of the period and redemption at the net asset value on the last day of the period and assuming all distributions are reinvested at reinvestment prices. Total return calculated for a period of less than one year is not annualized. |
| (e) | Portfolio turnover for periods less than one year are not annualized and does not include securities received or delivered from processing creations or redemptions in-kind. |
See Notes to Financial Statements.
Sprott Junior Gold Miners ETF
| Financial Highlights | For a Share Outstanding Throughout the Periods Presented |
| | | For the Year Ended November 30, 2016 | | | For the Period March 31, 2015 (Commencement of Operations) to November 30, 2015 | |
| NET ASSET VALUE, BEGINNING OF PERIOD | | $ | 19.65 | | | $ | 24.18 | |
| | | | | | | | | |
| INCOME/(LOSS) FROM INVESTMENT OPERATIONS: | | | | | | | | |
Net investment income/(loss) (a) | | | (0.05 | ) | | | 0.04 | |
| Net realized and unrealized gain/(loss) | | | 13.56 | | | | (4.57 | ) |
| Total from investment operations | | | 13.51 | | | | (4.53 | ) |
| | | | | | | | | |
| DISTRIBUTIONS: | | | | | | | | |
| From net investment income | | | (0.16 | ) | | | – | |
| Total distributions | | | (0.16 | ) | | | – | |
| | | | | | | | | |
| Net increase/(decrease) in net asset value | | | 13.35 | | | | (4.53 | ) |
| NET ASSET VALUE, END OF PERIOD | | $ | 33.00 | | | $ | 19.65 | |
TOTAL RETURN(b) | | | 69.35 | % | | | (18.73 | )% |
| | | | | | | | | |
| RATIOS/SUPPLEMENTAL DATA: | | | | | | | | |
| Net assets, end of period (000s) | | $ | 47,857 | | | $ | 23,579 | |
| | | | | | | | | |
| Ratio of expenses to average net assets | | | 0.57 | % | | | 0.57 | %(c) |
| Ratio of net investment income/(loss) to average net assets | | | (0.14 | )% | | | 0.29 | %(c) |
Portfolio turnover rate(d) | | | 61 | % | | | 71 | % |
| (a) | Based on average shares outstanding during the period. |
| (b) | Total return is calculated assuming an initial investment made at the net asset value at the beginning of the period and redemption at the net asset value on the last day of the period and assuming all distributions are reinvested at reinvestment prices. Total return calculated for a period of less than one year is not annualized. |
| (d) | Portfolio turnover for periods less than one year are not annualized and does not include securities received or delivered from processing creations or redemptions in-kind. |
See Notes to Financial Statements.
Sprott BUZZ Social Media Insights ETF
| Financial Highlights | For a Share Outstanding Throughout the Period Presented |
| | | For the Period April 19, 2016 (Commencement of Operations) to November 30, 2016 | |
| NET ASSET VALUE, BEGINNING OF PERIOD | | $ | 25.15 | |
| | | | | |
| INCOME/(LOSS) FROM INVESTMENT OPERATIONS: | | | | |
Net investment income (a) | | | 0.13 | |
| Net realized and unrealized gain | | | 0.56 | |
| Total from investment operations | | | 0.69 | |
| | | | | |
| Net increase in net asset value | | | 0.69 | |
| NET ASSET VALUE, END OF PERIOD | | $ | 25.84 | |
TOTAL RETURN(b) | | | 2.74 | % |
| | | | | |
| RATIOS/SUPPLEMENTAL DATA: | | | | |
| Net assets, end of period (000s) | | $ | 5,169 | |
| | | | | |
| Ratio of expenses to average net assets | | | 0.75 | %(c) |
| Ratio of net investment income to average net assets | | | 0.87 | %(c) |
Portfolio turnover rate(d) | | | 157 | % |
| (a) | Based on average shares outstanding during the period. |
| (b) | Total return is calculated assuming an initial investment made at the net asset value at the beginning of the period and redemption at the net asset value on the last day of the period and assuming all distributions are reinvested at reinvestment prices. Total return calculated for a period of less than one year is not annualized. |
| (d) | Portfolio turnover for periods less than one year are not annualized and does not include securities received or delivered from processing creations or redemptions in-kind. |
See Notes to Financial Statements.
Sprott ETFs
| Notes to Financial Statements | November 30, 2016 |
1. ORGANIZATION
ALPS ETF Trust (the “Trust”), a Delaware statutory trust, is an open‐end management investment company under the Investment Company Act of 1940, as amended (the “1940 Act”). As of November 30, 2016, the Trust consists of nineteen separate portfolios. Each portfolio represents a separate series of the Trust. This report pertains to the Sprott Gold Miners ETF, the Sprott Junior Gold Miners ETF, and the Sprott BUZZ Social Media Insights ETF (each a “Fund” and collectively, the “Funds”).
The investment objective of the Sprott Gold Miners ETF is to seek investment results that correspond (before fees and expenses) generally to the performance of its underlying index, the Sprott Zacks Gold Miners Index (the “Underlying Index”). The investment advisor uses a “passive” or indexing approach to try to achieve the Fund’s investment objective. The Sprott Gold Miners ETF is considered non‐diversified and may invest a greater portion of assets in securities of individual issuers than a diversified fund. As a result, changes in the market value of a single investment could cause greater fluctuations in share price than would occur in a diversified fund.
The investment objective of the Sprott Junior Gold Miners ETF is to seek investment results that correspond (before fees and expenses) generally to the performance of its underlying index, the Sprott Zacks Junior Gold Miners Index (the “Underlying Index”). The investment advisor uses a “passive” or indexing approach to try to achieve the Fund’s investment objective. The Sprott Junior Gold Miners ETF is considered non‐diversified and may invest a greater portion of assets in securities of individual issuers than a diversified fund. As a result, changes in the market value of a single investment could cause greater fluctuations in share price than would occur in a diversified fund.
The investment objective of the Sprott BUZZ Social Media Insights ETF is to seek investment results that correspond (before fees and expenses) generally to the performance of its underlying index, the BUZZ Social Media Insights Index (the “Underlying Index”). The investment advisor uses a “passive” or indexing approach to try to achieve the Fund’s investment objective. The Sprott BUZZ Social Media Insights ETF is considered non‐diversified and may invest a greater portion of assets in securities of individual issuers than a diversified fund. As a result, changes in the market value of a single investment could cause greater fluctuations in share price than would occur in a diversified fund. The Sprott BUZZ Social Media Insights ETF commenced operations on April 19, 2016.
The Funds’ Shares (“Shares”) are listed on the New York Stock Exchange (“NYSE”) Arca. Each Fund issues and redeems Shares, at net asset value (“NAV”) in blocks of 50,000 Shares, each of which is called a “Creation Unit”. Creation Units are issued and redeemed principally in‐kind for securities included in the specified Underlying Index. Except when aggregated in Creation Units, Shares are not redeemable securities of the Fund.
Pursuant to the Trust’s organizational documents, its Officers and Trustees are indemnified against certain liability arising out of the performance of their duties to the Trust. Additionally, in the normal course of business, the Trust enters into contracts with service providers that contain general indemnification clauses. The Trust’s maximum exposure under these arrangements is unknown, as this would involve future claims that may be made against the Trust that have not yet occurred.
2. SIGNIFICANT ACCOUNTING POLICIES
The following is a summary of significant accounting policies consistently followed by the Funds in the preparation of the financial statements. The accompanying financial statements were prepared in accordance with accounting principles generally accepted in the United States of America (“U.S. GAAP”). The preparation of financial statements in conformity with U.S. GAAP requires management to make certain estimates and assumptions that affect the reported amounts of assets and liabilities and disclosures of contingent assets and liabilities at the date of the financial statements and the reported amounts of revenue and expenses during the period. Actual results could differ from those estimates. Each Fund is considered an investment company under U.S. GAAP and follows the accounting and reporting guidance applicable to investment companies in the Financial Accounting Standards Board Accounting Standards Codification Topic 946.
A. Portfolio Valuation
Each Fund’s NAV is determined daily, as of the close of regular trading on the NYSE, normally 4:00 p.m. Eastern time, on each day the NYSE is open for trading. The NAV is computed by dividing the value of all assets of the Fund (including accrued interest and dividends), less all liabilities (including accrued expenses and dividends declared but unpaid), by the total number of shares outstanding.
Sprott ETFs
| Notes to Financial Statements | November 30, 2016 |
Portfolio securities listed on any exchange other than the NASDAQ Stock Market LLC (“NASDAQ”) are valued at the last sale price on the business day as of which such value is being determined. If there has been no sale on such day, the securities are valued at the mean of the most recent bid and ask prices on such day. Securities traded on the NASDAQ are valued at the NASDAQ Official Closing Price as determined by NASDAQ. Portfolio securities traded on more than one securities exchange are valued at the last sale price on the business day as of which such value is being determined at the close of the exchange representing the principal market for such securities. Portfolio securities traded in the over‐the‐counter market, but excluding securities traded on the NASDAQ, are valued at the last quoted sale price in such market.
The Funds’ investments are valued at market value or, in the absence of market value with respect to any portfolio securities, at fair value according to procedures adopted by the Trust’s Board of Trustees (the “Board”). When market quotations are not readily available or when events occur that make established valuation methods unreliable, securities of the Funds may be valued in good faith by or under the direction of the Board. These securities generally include, but are not limited to, restricted securities (securities which may not be publicly sold without registration under the Securities Act of 1933) for which a pricing service is unable to provide a market price; securities whose trading has been formally suspended; a security whose market price is not available from a pre‐established primary pricing source or the pricing source is not willing to provide a price; a security with respect to which an event has occurred that is most likely to materially affect the value of the security after the market has closed but before the calculation of the Fund’s NAV or make it difficult or impossible to obtain a reliable market quotation; or a security whose price, as provided by the pricing service, does not reflect the security’s “fair value” due to the security being de‐listed from a national exchange or the security’s primary trading market is temporarily closed at a time when, under normal conditions, it would be open. As a general principle, the current “fair value” of a security would be the amount which the owner might reasonably expect to receive from the sale on the applicable exchange or principal market. A variety of factors may be considered in determining the fair value of such securities.
B. Fair Value Measurements
Each Fund discloses the classification of its fair value measurements following a three‐tier hierarchy based on the inputs used to measure fair value. Inputs refer broadly to the assumptions that market participants would use in pricing the asset or liability, including assumptions about risk. Inputs may be observable or unobservable. Observable inputs reflect the assumptions market participants would use in pricing the asset or liability that are developed based on market data obtained from sources independent of the reporting entity. Unobservable inputs reflect the reporting entity’s own assumptions about the assumptions market participants would use in pricing the asset or liability that are developed based on the best information available.
Valuation techniques used to value the Funds’ investments by major category are as follows:
Equity securities, including restricted securities, for which market quotations are readily available, are valued at the last reported sale price or official closing price as reported by a third party pricing vendor on the primary market or exchange on which they are traded and are categorized as Level 1 in the hierarchy. In the event there were no sales during the day or closing prices are not available, securities are valued at the mean of the most recent quoted bid and ask prices on such day and are generally categorized as Level 2 in the hierarchy. Investments in open‐end mutual funds are valued at their closing NAV each business day and are categorized as Level 1 in the hierarchy.
Changes in valuation techniques may result in transfers in or out of an assigned level within the disclosure hierarchy.
Various inputs are used in determining the value of each Fund’s investments as of the end of the reporting period. When inputs used fall into different levels of the fair value hierarchy, the level in the hierarchy within which the fair value measurement falls is determined based on the lowest level input that is significant to the fair value measurement in its entirety. The designated input levels are not necessarily an indication of the risk or liquidity associated with these investments.
These inputs are categorized in the following hierarchy under applicable financial accounting standards:
| Level 1 – | Unadjusted quoted prices in active markets for identical investments, unrestricted assets or liabilities that a Fund has the ability to access at the measurement date; |
| Level 2 – | Quoted prices which are not active, quoted prices for similar assets or liabilities in active markets or inputs other than quoted prices that are observable (either directly or indirectly) for substantially the full term of the asset or liability; and |
| Level 3 – | Significant unobservable prices or inputs (including the Fund’s own assumptions in determining the fair value of investments) where there is little or no market activity for the asset or liability at the measurement date. |
Sprott ETFs
| Notes to Financial Statements | November 30, 2016 |
The following is a summary of the inputs used to value the Funds’ investments at November 30, 2016:
Sprott Gold Miners ETF
| Investments in Securities at Value* | | Level 1 - Unadjusted Quoted Prices | | | Level 2 - Other Significant Observable Inputs | | | Level 3 - Significant Unobservable Inputs | | | Total | |
| Common Stocks | | $ | 183,659,373 | | | $ | – | | | $ | – | | | $ | 183,659,373 | |
| Rights | | | 30,292 | | | | – | | | | – | | | | 30,292 | |
| Short Term Investments | | | | | | | | | | | | | | | | |
Investments Purchased with Collateral from Securities Loaned | | | 7,566,057 | | | | – | | | | – | | | | 7,566,057 | |
| TOTAL | | $ | 191,255,722 | | | $ | – | | | $ | – | | | $ | 191,255,722 | |
Sprott Junior Gold Miners ETF
| Investments in Securities at Value* | | Level 1 - Unadjusted Quoted Prices | | | Level 2 - Other Significant Observable Inputs | | | Level 3 - Significant Unobservable Inputs | | | Total | |
| Common Stocks | | $ | 47,841,213 | | | $ | – | | | $ | – | | | $ | 47,841,213 | |
| Short Term Investments | | | | | | | | | | | | | | | | |
| Money Market Fund | | | 644,671 | | | | – | | | | – | | | | 644,671 | |
Investments Purchased with Collateral from Securities Loaned | | | 2,052,930 | | | | – | | | | – | | | | 2,052,930 | |
| TOTAL | | $ | 50,538,814 | | | $ | – | | | $ | – | | | $ | 50,538,814 | |
Sprott BUZZ Social Media Insights ETF
| Investments in Securities at Value* | | Level 1 - Unadjusted Quoted Prices | | | Level 2 - Other Significant Observable Inputs | | | Level 3 - Significant Unobservable Inputs | | | Total | |
| Common Stocks | | $ | 5,158,722 | | | $ | – | | | $ | – | | | $ | 5,158,722 | |
Short Term Investments | | | 6,473 | | | | – | | | | – | | | | 6,473 | |
| TOTAL | | $ | 5,165,195 | | | $ | – | | | $ | – | | | $ | 5,165,195 | |
| * | For a detailed sector breakdown, see the accompanying Schedule of Investments. |
The Funds recognize transfers between levels as of the end of the period. For the year ended November 30, 2016, the Funds did not have any transfers between Level 1 and Level 2 securities. The Funds did not have any securities that used significant unobservable inputs (Level 3) in determining fair value.
Due to the short term nature of the payable to custodian for overdraft for Sprott Gold Miners ETF, face value approximates fair value at November 30, 2016. This fair value is based on Level 2 inputs under the three‐tier fair valuation hierarchy described above.
C. Gold and Silver Mining Industry Risk
The Underlying Indexes for the Sprott Gold Miners ETF and the Sprott Junior Gold Miners ETF are concentrated in the gold and silver mining industry. As a result, these Funds will be sensitive to changes in, and their performance will depend to a greater extent on, the overall condition of the gold and silver mining industry. Competitive pressures may have a significant effect on the financial condition of such companies in the gold and silver mining industry. Also, gold and silver mining companies are highly dependent on the price of gold and silver bullion. These prices may fluctuate substantially over short periods of time so a Fund’s Share price may be more volatile than other types of investments. In times of significant inflation or great economic uncertainty, gold, silver and other precious metals may outperform traditional investments such as bonds and stocks. However, in times of stable economic growth, traditional equity and debt investments could offer greater appreciation potential and the value of gold, silver and other precious metals may be adversely affected, which could in turn affect a Fund’s returns. The production and sale of precious metals by governments or central banks or other large holders can be affected by various economic, financial, social and political factors, which may be unpredictable and may have a significant impact on the supply and prices of precious metals. Economic and political conditions in those countries that are the largest producers of gold may have a direct effect on the production and marketing of gold and on sales of central bank gold holdings. Some gold and precious metals mining operation companies may hedge their exposure to falls in gold and precious metals prices by selling forward future production, which may result in lower returns during periods when the price of gold and precious metals increases. The gold and precious metals industry can be significantly affected by events relating to international political developments, the success of exploration projects, commodity prices and tax and government regulations. If a natural disaster or other event with a significant economic impact occurs in a region where the companies in which each Fund invests operate, such disaster or event could negatively affect the profitability of such companies and, in turn, the Funds’ investment in them.
Sprott ETFs
| Notes to Financial Statements | November 30, 2016 |
D. Social Media Analytics Risk
The Underlying Index for the Sprott BUZZ Social Media Insights ETF utilizes a rules‐based quantitative methodology developed by BUZZ Indexes Inc. (the “Index Provider”), which is designed to identify the U.S. common stocks with the most “positive insights” collected from social media networks. The ability to invest based on social media analytics is relatively new and untested. “Social media” is an umbrella term that encompasses various activities that integrate technology, social interaction and content creation. Social media may use many technologies, including, but not limited to, blogs, microblogs, wikis, photos and video sharing, podcasts, social networking, and virtual worlds. Some examples of social media sites may include, but are not limited to, the following: Facebook, Twitter, LinkedIn, Digg, Reddit, RSS, blogs, Investopedia, stock forums, etc. Investing in companies based on social media analytics involves the potential for market manipulation because social media posts may be made with an intent to inflate, or otherwise manipulate, the public perception of a stock or other investment. Although the Underlying Index attempts to mitigate the potential for such market manipulation by employing screens to identify posts which may be computer generated or deceptive, and by employing market capitalization and trading volume criteria to remove small and penny‐cap stocks which may be more likely targets for such manipulation, there is no guarantee that the Underlying Index’s model will successfully reduce such risk. Furthermore, text and sentiment analysis of social media postings may prove inaccurate; that is, high positive sentiment may not correlate with positive change in the value of a company’s stock and low positive or negative sentiment may not correlate with negative change in the value of a company’s stock. Additionally, as data suppliers for the Index Provider’s algorithm, social media companies are susceptible to the following risks which may disrupt the Index Provider’s ability to receive meaningful data from such sites: permanent cessation of operations, disruption in service caused by hardware or software failure, interruptions or delays in service by third‐party data center hosting facilities and maintenance providers, security breaches involving certain private, sensitive, proprietary and confidential information managed and transmitted by social media companies, and privacy concerns and laws, evolving Internet regulation and other foreign or domestic regulations that may limit or otherwise affect the operations of social media companies.
E. Foreign Investment Risk
The Sprott Gold Miners ETF and the Sprott Junior Gold Miners ETF investments in non‐U.S. issuers may involve unique risks compared to investing in securities of U.S. issuers, including, among others, greater market volatility than U.S. securities and less complete financial information than for U.S. issuers. In addition, adverse political, economic or social developments could undermine the value of a Fund’s investments or prevent a Fund from realizing the full value of its investments. Financial reporting standards for companies based in foreign markets differ from those in the United States. Finally, the value of the currency of the country in which a Fund has invested could decline relative to the value of the U.S. dollar, which may affect the value of the investment to U.S. investors. The Funds will not enter into transactions to hedge against declines in the value of a Fund’s assets that are denominated in a foreign currency.
Countries with emerging markets may have relatively unstable governments and may present the risks of nationalization of businesses, restrictions on foreign ownership and prohibitions on the repatriation of assets. The economies of emerging markets countries also may be based on only a few industries, making them more vulnerable to changes in local or global trade conditions and more sensitive to debt burdens or inflation rates.
F. Foreign Currency Translation
The books and records of the Funds are maintained in U.S. dollars. Investment valuations and other assets and liabilities initially expressed in foreign currencies are converted each business day into U.S. dollars based upon current exchange rates. The portion of realized and unrealized gains or losses on investments due to fluctuations in foreign currency exchange rates is not separately disclosed and is included in realized and unrealized gains or losses on investments, when applicable.
G. Concentration Risk
Each Fund seeks to track its respective Underlying Index, which itself may have concentration in certain regions, economies, countries, markets, industries or sectors. Based on the current composition of their respective Underlying Indexes, the Sprott Gold Miners ETF and the Sprott Junior Gold Miners ETF will be concentrated in the gold and silver mining industry. Underperformance or increased risk in such concentrated areas may result in underperformance or increased risk in each Fund.
Sprott ETFs
| Notes to Financial Statements | November 30, 2016 |
H. Securities Transactions and Investment Income
Securities transactions are recorded as of the trade date. Realized gains and losses from securities transactions are recorded on the highest cost basis. Dividend income and capital gains distributions, if any, are recorded on the ex‐dividend date. Interest income, if any, is recorded on the accrual basis.
I. Dividends and Distributions to Shareholders
Dividends from net investment income for each Fund, if any, are declared and paid annually or as the Board may determine from time to time. Distributions of net realized capital gains earned by the Funds, if any, are distributed at least annually.
J. Federal Tax and Tax Basis Information
The timing and character of income and capital gain distributions are determined in accordance with income tax regulations, which may differ from U.S. GAAP. Reclassifications are made to the Funds’ capital accounts for permanent tax differences to reflect income and gains available for distribution (or available capital loss carryforwards) under income tax regulations.
For the year or period ended November 30, 2016, the following reclassifications, which had no impact on results of operations or net assets, were recorded to reflect permanent tax differences resulting primarily from in‐kind transactions:
| Fund | | Paid-in Capital | | | Accumulated Net Investment Income/(Loss) | | | Accumulated Net Realized Gain/(Loss) on Investments | |
| Sprott Gold Miners ETF | | $ | 44,475,547 | | | $ | 446,453 | | | $ | (44,922,000 | ) |
| Sprott Junior Gold Miners ETF | | | 13,325,299 | | | | 101,760 | | | | (13,427,059 | ) |
| Sprott BUZZ Social Media Insights ETF | | | 266,557 | | | | (1,288 | ) | | | (265,269 | ) |
The tax character of the distributions paid by the Funds were as follows:
| | | Ordinary Income | |
| November 30, 2016 | | | |
| Sprott Gold Miners ETF | | $ | 1,513,542 | |
| Sprott Junior Gold Miners ETF | | | 195,292 | |
| November 30, 2015 | | | | |
| Sprott Gold Miners ETF | | $ | 277,011 | |
As of the period ended November 30, 2016, the Sprott BUZZ Social Media Insights ETF paid no distributions. As of the period ended November 30, 2015, the Sprott Junior Gold Miners ETF paid no distributions.
At November 30, 2016, the Funds had available for tax purposes unused capital loss carryforwards as follows:
| Fund | | Short-Term | | | Long-Term | |
| Sprott Gold Miners ETF | | $ | 33,438,184 | | | $ | 14,410,663 | |
| Sprott Junior Gold Miners ETF | | | 7,620,754 | | | | 49,903 | |
| Sprott BUZZ Social Media Insights ETF | | | 222,444 | | | | – | |
As of November 30, 2016, the components of distributable earnings on a tax basis for each Fund were as follows:
| | | Accumulated netinvestment income | | | Accumulated net realized loss on investments | | | Other accumulated differences | | | Net unrealize dappreciation/(depreciation) on investments | | | Total | |
| Sprott Gold Miners ETF | | $ | 26,993 | | | $ | (47,848,847 | ) | | $ | – | | | $ | (23,942,379 | ) | | $ | (71,764,233 | ) |
| Sprott Junior Gold Miners ETF | | | 811,677 | | | | (7,670,657 | ) | | | – | | | | (470,601 | ) | | | (7,329,581 | ) |
| Sprott BUZZ Social Media Insights ETF | | | 24,716 | | | | (222,444 | ) | | | (472 | ) | | | 130,609 | | | | (67,591 | ) |
Sprott ETFs
| Notes to Financial Statements | November 30, 2016 |
As of November 30, 2016, the costs of investments for federal income tax purposes and accumulated net unrealized appreciation/(depreciation) on investments were as follows:
| | | Sprott Gold Miners ETF | | | Sprott Junior Gold Miners ETF | | | Sprott BUZZ Social Media Insights ETF | |
| Gross appreciation (excess of value over tax cost) | | $ | 13,043,899 | | | $ | 2,737,177 | | | $ | 339,401 | |
| Gross depreciation (excess of tax cost over value) | | | (36,986,278 | ) | | | (3,204,716 | ) | | | (208,792 | ) |
Net depreciation of foreign currency | | | – | | | | (3,062 | ) | | | – | |
| Net unrealized appreciation (depreciation) | | | (23,942,379 | ) | | | (470,601 | ) | | | 130,609 | |
| Cost of investments for income tax purposes | | $ | 215,198,101 | | | $ | 51,006,353 | | | $ | 5,034,586 | |
The differences between book‐basis and tax‐basis are due to the deferral of losses from wash sales and Passive Foreign Investment Company (“PFIC”) adjustments.
K. Income Taxes
No provision for income taxes is included in the accompanying financial statements, as each Fund intends to distribute to shareholders all taxable investment income and realized gains and otherwise comply with Subchapter M of the Internal Revenue Code of 1986, as amended, applicable to regulated investment companies. Each Fund evaluates tax positions taken (or expected to be taken) in the course of preparing the Fund’s tax returns to determine whether these positions meet a “more‐likely‐than‐not” standard that, based on the technical merits, have a more than fifty percent likelihood of being sustained by a taxing authority upon examination. A tax position that meets the “more‐likely‐than‐not” recognition threshold is measured to determine the amount of benefit to recognize in the financial statements.
As of and during the year or period ended November 30, 2016, the Funds did not have a liability for any unrecognized tax benefits. Each Fund files U.S. federal, state, and local tax returns as required. Each Fund’s tax returns are subject to examination by the relevant tax authorities until expiration of the applicable statute of limitations, which is generally three years after the filing of the tax return, but may extend to four years in certain jurisdictions. Tax returns for open years for the Sprott Gold Miners ETF and the Sprott Junior Gold Miners ETF have incorporated no uncertain tax positions that require a provision for income taxes. Being that the Sprott BUZZ Social Media Insights ETF commenced operations on April 19, 2016, no tax returns have been filed for that Fund as of the date of this report.
H. Lending of Portfolio Securities
The Sprott Gold Miners ETF and Sprott Junior Gold Miners ETF (the “Funds”) have entered into a securities lending agreement with State Street Bank & Trust Co. (“SSB”), the Funds’ lending agent. The Funds may lend their portfolio securities only to borrowers that are approved by SSB. Each Fund will limit such lending to not more than 33 1/3% of the value of its total assets. Each Fund’s securities held at SSB as custodian shall be available to be lent except those securities the Fund or ALPS Advisors Inc. specifically identifies in writing as not being available for lending. The borrower pledges and maintains with each Fund collateral consisting of cash (U.S. Dollars only), securities issued or guaranteed by the U.S. government or its agencies or instrumentalities, and by cash equivalents (including irrevocable bank letters of credit issued by a person other than the borrower or an affiliate of the borrower). The initial collateral received by each Fund is required to have a value of no less than 102% of the market value of the loaned securities for U.S. equity securities and a value of no less than 105% of the market value for non‐U.S. equity securities. The collateral is maintained thereafter, at a market value equal to not less than 102% of the current value of the U.S. equity securities on loan and not less than 105% of the current value of the non‐U.S. equity securities on loan. The market value of the loaned securities is determined at the close of each business day and any additional required collateral is delivered to each Fund on the next business day. During the term of the loan, each Fund is entitled to all distributions made on or in respect of the loaned securities. Loans of securities are terminable at any time and the borrower, after notice, is required to return borrowed securities within the customary time period for settlement of securities transactions.
Any cash collateral received is reinvested in a money market fund managed by SSB as disclosed in each Fund’s Schedule of Investments and is reflected in the Statements of Assets and Liabilities as a payable for collateral upon return of securities loaned. Non‐cash collateral, in the form of securities issued or guaranteed by the U.S. government or its agencies or instrumentalities, is not disclosed in a Fund’s Statements of Assets and Liabilities as it is held by the lending agent on behalf of each Fund, and each Fund does not have the ability to re‐hypothecate these securities. Income earned by the Fund from securities lending activity is disclosed in the Statement of Operations.
The following is a summary of each Funds’ securities lending agreements and related cash and non‐cash collateral received as of November 30, 2016:
| | | Market Value of Securities on Loan | | | Cash Collateral Received | | | Non-Cash Collateral Received | | | Total Collateral Received | |
| Sprott Gold Miners ETF | | $ | 8,380,321 | | | $ | 7,566,057 | | | $ | 1,301,349 | | | $ | 8,867,406 | |
| Sprott Junior Gold Miners ETF | | | 2,188,446 | | | | 2,052,930 | | | | 255,975 | | | | 2,308,905 | |
Sprott ETFs
| Notes to Financial Statements | November 30, 2016 |
The risks of securities lending include the risk that the borrower may not provide additional collateral when required or may not return the securities when due. To mitigate these risks, each Fund benefits from a borrower default indemnity provided by SSB. SSB’s indemnity allows for full replacement of securities lent wherein SSB will purchase the unreturned loaned securities on the open market by applying the proceeds of the collateral, or to the extent such proceeds are insufficient or the collateral is unavailable, SSB will purchase the unreturned loan securities at SSB’s expense. However, the Funds could suffer a loss if the value of the investments purchased with cash collateral falls below the value of the cash collateral received.
The following tables reflect a breakdown of transactions accounted for as secured borrowings, the gross obligation by the type of collateral pledged or securities loaned, and the remaining contractual maturity of those transactions as of November 30, 2016:
| Sprott Gold Miners ETF | | Remaining contractual maturity of the agreements |
| Securities Lending Transactions | | Overnight & Continuous | | | Up to 30 days | | | 30-90 days | | | Greater than 90 days | | | Total | |
| Common Stocks | | $ | 7,566,057 | | | $ | – | | | $ | – | | | $ | – | | | $ | 7,566,057 | |
| Total Borrowings | | | | | | | | | | | | | | | | | | | 7,566,057 | |
| Gross amount of recognized liabilities for securities lending (collateral received) | | | | | | | | | | | $ | 7,566,057 | |
| Sprott Junior Gold Miners ETF | | Remaining contractual maturity of the agreements |
| Securities Lending Transactions | | Overnight & Continuous | | | Up to 30 days | | | 30-90 days | | | Greater than 90 days | | | Total | |
| Common Stocks | | $ | 2,052,930 | | | $ | – | | | $ | – | | | $ | – | | | $ | 2,052,930 | |
| Total Borrowings | | | | | | | | | | | | | | | | | | | 2,052,930 | |
| Gross amount of recognized liabilities for securities lending (collateral received) | | | | | | | | | | | $ | 2,052,930 | |
3. INVESTMENT ADVISORY FEE AND OTHER AFFILIATED TRANSACTIONS
ALPS Advisors, Inc. (the “Adviser”) acts as the Funds’ investment adviser pursuant to an advisory agreement with the Trust on behalf of each Fund (the “Advisory Agreement”). Pursuant to the Advisory Agreement, each Fund pays the Adviser a unitary fee for the services and facilities it provides, payable on a monthly basis as a percentage of each Fund’s average daily net assets as set forth below. From time to time, the Adviser may waive all or a portion of its fee.
| Fund | Advisory Fee |
| Sprott Gold Miners ETF | 0.57% |
| Sprott Junior Gold Miners ETF | 0.57% |
| Sprott BUZZ Social Media Insights ETF | 0.75% |
Out of the unitary management fee, the Adviser pays substantially all expenses for each Fund, including the cost of transfer agency, custody, fund administration, legal, audit, independent trustees and other services, except for interest expenses, distribution fees or expenses, brokerage expenses, taxes and extraordinary expenses, such as litigation, not incurred in the ordinary course of each Fund’s business. The Adviser’s unitary management fee is designed to pay substantially all of the Funds’ expenses and to compensate the Adviser for providing services for the Funds.
ALPS Fund Services, Inc., an affiliate of the Adviser, is the administrator to the Funds.
Each Trustee who is not an officer or employee of the Adviser, any sub‐adviser or any of their affiliates (“Independent Trustees”) receives (1) a quarterly retainer of $5,000, (2) a per meeting fee for regularly scheduled meetings of $3,750, (3) $1,500 for any special meeting held outside of a regularly scheduled board meeting, and (4) reimbursement for all reasonable out‐of‐pocket expenses relating to attendance at meetings.
Sprott ETFs
| Notes to Financial Statements | November 30, 2016 |
4. PURCHASES AND SALES OF SECURITIES
For the year or period ended November 30, 2016, the cost of purchases and proceeds from sales of investment securities, excluding short‐term investments and in‐kind transactions, were as follows:
| Fund | | Purchases | | | Sales | |
| Sprott Gold Miners ETF | | $ | 145,149,015 | | | $ | 131,911,959 | |
| Sprott Junior Gold Miners ETF | | | 28,500,000 | | | | 24,880,211 | |
| Sprott BUZZ Social Media Insights ETF | | | 7,805,480 | | | | 8,282,238 | |
For the year or period ended November 30, 2016, the cost of in‐kind purchases and proceeds from in‐kind sales were as follows:
| Fund | | Purchases | | | Sales | |
| Sprott Gold Miners ETF | | $ | 177,954,425 | | | $ | 167,109,136 | |
| Sprott Junior Gold Miners ETF | | | 53,861,378 | | | | 45,611,150 | |
| Sprott BUZZ Social Media Insights ETF | | | 7,542,142 | | | | 2,078,786 | |
For the year or period ended November 30, 2016, the Sprott Gold Miners ETF, Sprott Junior Gold Miners ETF, and Sprott BUZZ Social Media Insights ETF had in‐kind net realized gains of $45,147,018, $13,746,204 and $274,747 respectively.
Gains on in‐kind transactions are not considered taxable for federal income tax purposes.
5. CAPITAL SHARE TRANSACTIONS
Shares are created and redeemed by each Fund only in Creation Unit size aggregations of 50,000 Shares. Only broker‐dealers or large institutional investors with creation and redemption agreements called Authorized Participants (“AP”) are permitted to purchase or redeem Creation Units from the Funds. Such transactions are generally permitted on an in‐kind basis, with a balancing cash component to equate the transaction to the NAV per unit of each Fund on the transaction date. Cash may be substituted equivalent to the value of certain securities generally when they are not available in sufficient quantity for delivery, not eligible for trading by the AP or as a result of other market circumstances.
6. RELATED PARTY TRANSACTIONS
Sprott Gold Miners ETF and Sprott Junior Gold Miners ETF engaged in cross trades between each other during the year ended November 30, 2016 pursuant to Rule 17a‐7 under the 1940 Act. Cross trading is the buying or selling of portfolio securities between funds to which the Adviser serves as the investment adviser. The Board previously adopted procedures that apply to transactions between the Funds of the Trust pursuant to Rule 17a‐7. These transactions related to cross trades during the period complied with the requirements set forth by Rule 17a‐7 and the Trust’s procedures.
Transactions related to cross trades during the year ended November 30, 2016 was as follows:
| Fund | | Purchase cost paid | | | Sale proceeds received | | | Realized gain (loss) on sales | |
| Sprott Gold Miners ETF | | $ | 1,581,839 | | | $ | 3,006,643 | | | $ | (787,775 | ) |
| Sprott Junior Gold Miners ETF | | $ | 3,006,643 | | | $ | 1,581,839 | | | $ | (341,810 | ) |
Sprott ETFs
| Additional Information | November 30, 2016 (Unaudited) |
PROXY VOTING RECORDS, POLICIES AND PROCEDURES
Information regarding how each Fund voted proxies relating to portfolio securities during the most recent 12‐month period ended June 30 and a description of the Funds’ proxy voting policies and procedures used in determining how to vote for proxies are available without charge on the Securities and Exchange Commission’s (“SEC”) website at www.sec.gov and upon request, by calling (toll‐free) 1‐866‐675‐2639.
PORTFOLIO HOLDINGS
The Trust is required to disclose, after its first and third fiscal quarters, the complete schedule of each Fund’s portfolio holdings with the SEC on Form N‐Q. Form N‐Q for each Fund will be available on the SEC’s website at www.sec.gov. Each Fund’s Form N‐Q may also be reviewed and copied at the SEC’s Public Reference Room in Washington, D.C. and information on the operation of the Public Reference Room may be obtained by calling 1‐800‐SEC‐0330. Each Fund’s Form N‐Q will be available without charge, upon request, by calling (toll‐free) 1‐866‐675‐2639 or by writing to ALPS ETF Trust at 1290 Broadway, Suite 1100, Denver, Colorado 80203.
TAX INFORMATION
The Funds designated the following for federal income tax purposes for distributions made during the calendar year ended December 31, 2015:
| | Qualified Dividend Income | Dividend Received Deduction |
| Sprott Gold Miners ETF | 63.41% | 9.53% |
| Sprott Junior Gold Miners ETF | 21.29% | 2.10% |
In early 2016, if applicable, shareholders of record received this information for the distribution paid to them by the Fund during the calendar year 2015 via Form 1099. The Funds will notify shareholders in early 2017 of amounts paid to them by the Fund, if any, during the calendar year 2016.
Pursuant to Section 853(c) of the Internal Revenue Code, the following Funds designated the following:
| | | Foreign Taxes Paid | | | Foreign Source Income | |
| Sprott Gold Miners ETF | | $ | 125,192 | | | $ | 881,383 | |
| Sprott Junior Gold Miners ETF | | $ | 32,995 | | | $ | 219,969 | |
LICENSING AGREEMENTS
Sprott Gold Miners ETF
Zacks Investment Management, Inc. (the “Licensor”) has entered into a license agreement with Sprott Asset Management LP (“Sprott”) to use the “Sprott” name and certain related intellectual property in connection with the underlying index, the Sprott Zacks Gold Miners Index (the “Underlying Index”) (the “Sprott License Agreement”). Pursuant to the Sprott License Agreement, Sprott in turn has entered into a sublicense agreement with ALPS Advisers, Inc. to use the Underlying Index (the “Sublicense Agreement”) in connection with the Sprott Gold Miners ETF (the “Product”).
The following disclosure relates to the Licensor and Sprott:
The Product(s) is not sponsored, endorsed, sold or promoted by ZACKS INVESTMENT MANAGEMENT, INC. (“Licensor”) Licensor makes no representation or warranty, express or implied, regarding the advisability of investing in securities generally or in the Product(s) particularly or the ability of the Index to track general market performance. Licensor’s only relationship to the Licensee is the licensing of the Index which is determined and composed by Licensor without regard to the Licensee or the owners of the Product(s). Licensor has no obligation to take the needs of the Licensee or the owners of the Product(s) into consideration in determining or composing the Index. Licensor shall not be liable to any person for any error in the Index nor shall it be under any obligation to advise any person of any error therein.
The Fund is not sponsored by Sprott. Sprott makes no representation or warranty, express or implied, to the owners of the Fund or any member of the public regarding the advisability of investing in securities or commodities generally or in the Fund particularly and does not guarantee the quality, accuracy or completeness of the Underlying Index or any Underlying Index data included herein or derived therefrom and assume no liability in connection with their use. The Underlying Index is determined and composed without regard to the Adviser or the Fund. Sprott has no obligation to take the needs of the Adviser, the Fund or the shareholders of the Fund into consideration in connection with the foregoing. Sprott is not responsible for and has not participated in the determination of pricing or the timing of the issuance or sale of the Shares of the Fund or in the determination or calculation of the NAV of the Fund. Sprott has no obligation or liability in connection with the administration or trading of the Fund.
Sprott ETFs
| Additional Information | November 30, 2016 (Unaudited) |
Sprott does not guarantee the accuracy and/or completeness of the Underlying Index or any data included therein, and Sprott shall have no liability for any errors, omissions, or interruptions therein. Sprott makes no warranty, express or implied, as to results to be obtained by the Adviser, the Fund, Fund shareholders or any other person or entity from the use of the Underlying Index or any data included therein. Sprott makes no express or implied warranties, and expressly disclaims all warranties of merchantability or fitness for a particular purpose or use with respect to the Underlying Index or any data included therein. Without limiting any of the foregoing, in no event shall Sprott have any liability for any special, punitive, indirect, or consequential damages (including lost profits) arising out of matters relating to the use of the Underlying Index, even if notified of the possibility of such damages.
Sprott Junior Gold Miners ETF
Zacks Investment Management, Inc. (the “Licensor”) has entered into a license agreement with Sprott Asset Management LP (“Sprott”) to use the “Sprott” name and certain related intellectual property in connection with the underlying index, the Sprott Zacks Junior Gold Miners Index (the “Underlying Index”) (the “Sprott License Agreement”). Pursuant to the Sprott License Agreement, Sprott in turn has entered into a sublicense agreement with ALPS Advisers, Inc. to use the Underlying Index (the “Sublicense Agreement”) in connection with the Sprott Junior Gold Miners ETF (the “Product”).
The following disclosure relates to the Licensor and Sprott:
The Product(s) is not sponsored, endorsed, sold or promoted by ZACKS INVESTMENT MANAGEMENT, INC. (“Licensor”) Licensor makes no representation or warranty, express or implied, regarding the advisability of investing in securities generally or in the Product(s) particularly or the ability of the Index to track general market performance. Licensor’s only relationship to the Licensee is the licensing of the Index which is determined and composed by Licensor without regard to the Licensee or the owners of the Product(s). Licensor has no obligation to take the needs of the Licensee or the owners of the Product(s) into consideration in determining or composing the Index. Licensor shall not be liable to any person for any error in the Index nor shall it be under any obligation to advise any person of any error therein.
The Fund is not sponsored by Sprott. Sprott makes no representation or warranty, express or implied, to the owners of the Fund or any member of the public regarding the advisability of investing in securities or commodities generally or in the Fund particularly and does not guarantee the quality, accuracy or completeness of the Underlying Index or any Underlying Index data included herein or derived therefrom and assume no liability in connection with their use. The Underlying Index is determined and composed without regard to the Adviser or the Fund. Sprott has no obligation to take the needs of the Adviser, the Fund or the shareholders of the Fund into consideration in connection with the foregoing. Sprott is not responsible for and has not participated in the determination of pricing or the timing of the issuance or sale of the Shares of the Fund or in the determination or calculation of the NAV of the Fund. Sprott has no obligation or liability in connection with the administration or trading of the Fund.
Sprott does not guarantee the accuracy and/or completeness of the Underlying Index or any data included therein, and Sprott shall have no liability for any errors, omissions, or interruptions therein. Sprott makes no warranty, express or implied, as to results to be obtained by the Adviser, the Fund, Fund shareholders or any other person or entity from the use of the Underlying Index or any data included therein. Sprott makes no express or implied warranties, and expressly disclaims all warranties of merchantability or fitness for a particular purpose or use with respect to the Underlying Index or any data included therein. Without limiting any of the foregoing, in no event shall Sprott have any liability for any special, punitive, indirect, or consequential damages (including lost profits) arising out of matters relating to the use of the Underlying Index, even if notified of the possibility of such damages.
Sprott BUZZ Social Media Insights ETF
BUZZ Social Media Insights Index (the “BUZZ Index”) is a product of BUZZ Indexes Inc. (“BUZZ Indexes”), and has been licensed to Sprott and its affiliates, who have sublicensed the BUZZ Index to ALPS Advisors, Inc. for use in connection with the Sprott BUZZ Social Media Insights ETF.
“BUZZ” is a trademark of BUZZ Indexes and “Sprott” is a trademark of Sprott Inc. and its affiliates, which have been licensed by ALPS Advisors, Inc. for use in connection with the BUZZ Index.
Sprott BUZZ Social Media Insights ETF is not sponsored, endorsed, sold or promoted by BUZZ Indexes, or its shareholders, or the licensor of the BUZZ Index, Sprott, and/or their respective affiliates and third party licensors. BUZZ Indexes makes no representation or warranty, express or implied, to the owners of the Sprott BUZZ Social Media Insights ETF or any member of the public regarding the advisability of investing in securities generally or in Sprott BUZZ Social Media Insights ETF, particularly or the ability of the BUZZ Index to track general market performance.
BUZZ Indexes’ only relationship to ALPS Advisors, Inc. with respect to the BUZZ Index is the licensing of the BUZZ Index and certain trademarks of BUZZ Indexes. The BUZZ Indexes are determined and composed by BUZZ Indexes without regard to ALPS Advisors, Inc. or the Sprott BUZZ Social Media Insights ETF. BUZZ Indexes has no obligation to take the needs of ALPS Advisors, Inc. or the owners of Sprott BUZZ Social Media Insights ETF into consideration in determining and composing the BUZZ Index.
Sprott ETFs
| Additional Information | November 30, 2016 (Unaudited) |
BUZZ Indexes is not responsible for and has not participated in the determination of the prices of Sprott BUZZ Social Media Insights ETF or the timing of the issuance or sale of securities of Sprott BUZZ Social Media Insights ETF or in the determination or calculation of the equation by which Sprott BUZZ Social Media Insights ETF securities may be converted into cash, surrendered, or redeemed, as the case may be. BUZZ Indexes have no obligation or liability in connection with the administration, marketing or trading of Sprott BUZZ Social Media Insights ETF. There is no assurance that investment products based on the BUZZ Index will accurately track index performance or provide positive investment returns.
BUZZ Indexes is not an investment advisor and the inclusion of a security in the BUZZ Index is not a recommendation by BUZZ Indexes to buy, sell, or hold such security, nor should it be considered investment advice.
BUZZ INDEXES DOES NOT GUARANTEE THE ADEQUACY, ACCURACY, TIMELINESS AND/OR THE COMPLETENESS OF THE BUZZ INDEX OR ANY DATA RELATED THERETO OR ANY COMMUNICATION WITH RESPECT THERETO, INCLUDING BUT NOT LIMITED TO, ORAL OR WRITTEN COMMUNICATION (INCLUDING ELECTRONIC COMMUNICATIONS). BUZZ INDEXES SHALL NOT BE SUBJECT TO ANY DAMAGES OR LIABILITY FOR ANY ERRORS, OMISSIONS, OR DELAYS THEREIN. BUZZ INDEXES MAKES NO EXPRESS OR IMPLIED WARRANTIES, AND EXPRESSLY DISCLAIMS ALL WARRANTIES, OF MERCHANTABILITY OR FITNESS FOR A PARTICULAR PURPOSE OR USE OR AS TO RESULTS TO BE OBTAINED BY ALPS ADVISORS, INC., OWNERS OF THE SPROTT BUZZ SOCIAL MEDIA INSIGHTS ETF, OR ANY OTHER PERSON OR ENTITY FROM THE USE OF THE BUZZ INDEX OR WITH RESPECT TO ANY DATA RELATED THERETO. WITHOUT LIMITING ANY OF THE FOREGOING, IN NO EVENT WHATSOEVER SHALL BUZZ INDEXES BE LIABLE FOR ANY INDIRECT, SPECIAL, INCIDENTAL, PUNITIVE, OR CONSEQUENTIAL DAMAGES INCLUDING BUT NOT LIMITED TO, LOSS OF PROFITS, TRADING LOSSES, LOST TIME OR GOODWILL, EVEN IF THEY HAVE BEEN ADVISED OF THE POSSIBILITY OF SUCH DAMAGES, WHETHER IN CONTRACT, TORT, STRICT LIABILITY, OR OTHERWISE. THERE ARE NO THIRD PARTY BENEFICIARIES OF ANY AGREEMENTS OR ARRANGEMENTS BETWEEN BUZZ INDEXES AND ALPS ADVISORS, INC., OTHER THAN THE LICENSORS OF BUZZ INDEXES.
The Fund is not sponsored by Sprott. Sprott makes no representation or warranty, express or implied, to the owners of the Fund or any member of the public regarding the advisability of investing in securities or commodities generally or in the Fund particularly and does not guarantee the quality, accuracy or completeness of the Underlying Index or any Underlying Index data included herein or derived therefrom and assume no liability in connection with their use. The Underlying Index is determined and composed without regard to the Adviser or the Fund. Sprott has no obligation to take the needs of the Adviser, the Fund or the shareholders of the Fund into consideration in connection with the foregoing. Sprott is not responsible for and has not participated in the determination of pricing or the timing of the issuance or sale of the Shares of the Fund or in the determination or calculation of the NAV of the Fund. Sprott has no obligation or liability in connection with the administration or trading of the Fund.
Sprott does not guarantee the accuracy and/or completeness of the Underlying Index or any data included therein, and Sprott shall have no liability for any errors, omissions, or interruptions therein. Sprott makes no warranty, express or implied, as to results to be obtained by the Adviser, the Fund, Fund shareholders or any other person or entity from the use of the Underlying Index or any data included therein. Sprott makes no express or implied warranties, and expressly disclaims all warranties of merchantability or fitness for a particular purpose or use with respect to the Underlying Index or any data included therein. Without limiting any of the foregoing, in no event shall Sprott have any liability for any special, punitive, indirect, or consequential damages (including lost profits) arising out of matters relating to the use of the Underlying Index, even if notified of the possibility of such damages.
The Adviser does not guarantee the accuracy and/or the completeness of the Underlying Index or any data included therein, and the Adviser shall have no liability for any errors, omissions or interruptions therein. The Adviser makes no warranty, express or implied, as to results to be obtained by the Fund, owners of the Shares of the Fund or any other person or entity from the use of the Underlying Index or any data included therein. The Adviser makes no express or implied warranties, and expressly disclaims all warranties of merchantability or fitness for a particular purpose or use with respect to the Underlying Index or any data included therein. Without limiting any of the foregoing, in no event shall the Adviser have any liability for any special, punitive, direct, indirect, or consequential damages (including lost profits) arising out of matters relating to the use of the Underlying Index even if notified of the possibility of such damages.
Sprott ETFs
| Board Considerations Regarding Approval of investment Advisory Agreements | November 30, 2016 (Unaudited) |
At an in‐person meeting held on June 6, 2016, the Board of Trustees of the Trust (the “Board” or the “Trustees”), including the Trustees who are not “interested persons” of the Trust within the meaning of the 1940 Act, as amended (the “Independent Trustees”), evaluated a proposal to approve the continuance of the Investment Advisory Agreements between the Trust and ALPS Advisors, Inc. (the “Adviser” or “AAI”) with respect to the Sprott Gold Miners ETF (“SGDM”) and Sprott Junior Gold Miners ETF (“SGDJ”) (each a “Fund” and collectively, “the Funds”). The Independent Trustees also met separately to consider the Investment Advisory Agreements.
In evaluating the Investment Advisory Agreements with respect to Funds, the Trustees considered various factors, including (i) the nature, extent and quality of the services provided by AAI with respect to the applicable Fund under the Investment Advisory Agreements; (ii) the advisory fees and other expenses paid by the Fund compared to those of similar funds managed by other investment advisers; (iii) the costs of the services provided to the Fund by AAI and the profits realized by AAI and its affiliates from its relationship to the Fund; (iv) the extent to which economies of scale have been or would be realized if and as the assets of the Fund grow and whether fees reflect the economies of scale for the benefit of shareholders; and (v) any additional benefits and other considerations.
With respect to the nature, extent and quality of the services provided by AAI under the Investment Advisory Agreements, the Trustees considered and reviewed information concerning the services provided under the Investment Advisory Agreements, the investment parameters of the index of each Fund, financial information regarding AAI and its parent company, information describing AAI’s current organization and the background and experience of the persons responsible for the day‐to‐day management of the Funds.
The Trustees reviewed information on the performance of each Fund and its applicable benchmark. The Trustees also evaluated the correlation and tracking error between each underlying index and its corresponding Fund’s performance. Based on their review, the Trustees found that the nature and extent of services provided to each Fund under the Investment Advisory Agreements was appropriate and that the quality was satisfactory.
The Trustees noted that the advisory fees for each Fund were unitary fees pursuant to which AAI assumes all expenses of the Funds (including the cost of transfer agency, custody, fund administration, legal, audit and other services) other than the payments under the Investment Advisory Agreement, brokerage expenses, taxes, interest, litigation expenses and other extraordinary expenses.
With respect to advisory fee rates, the Trustees noted the following:
The net advisory fee rate for SGDM is slightly above the median of its Broadridge expense group and the expense ratio for SGDM is below the median of its Broadridge expense group. The Trustees also noted that the net advisory fee rate for SGDJ is slightly below the median of its Broadridge expense group and the expense ratio for SGDJ is below the median of its Broadridge expense group.
Based on the foregoing, and the other information available to them, the Trustees concluded that the advisory fee rate for each of the Funds was reasonable under the circumstances and in light of the quality of the services provided.
The Trustees considered other benefits available to AAI because of its relationship with the Funds and concluded that the advisory fees were reasonable taking into account any such benefits.
The Trustees also considered with respect to each Fund the information provided by AAI about the costs and profitability of AAI with respect to each of the Funds. The Trustees reviewed and noted the relatively small sizes of the Funds and concluded that AAI was not realizing any economies of scale. The Trustees determined that they would continue to evaluate whether further economies of scale have been achieved on an ongoing basis.
In voting to renew each Investment Advisory Agreement, the Trustees concluded that the terms of each Investment Advisory Agreement are reasonable and fair in light of the services to be performed, the fees paid by certain other funds, expenses to be incurred and such other matters as the Trustees considered relevant in the exercise of their reasonable business judgment. The Trustees did not identify any single factor or group of factors as all important or controlling and considered all factors together.
Sprott ETFs
| Trustees & Officers | November 30, 2016 (Unaudited) |
The general supervision of the duties performed by the Adviser for the Fund under the Investment Advisory Agreement is the responsibility of the Board of Trustees. The Trust currently has four Trustees. Three Trustees have no affiliation or business connection with the Adviser or any of its affiliated persons and do not own any stock or other securities issued by the Adviser. These are the “non-interested” or “independent” Trustees (“Independent Trustees”). The other Trustee (the “Interested Trustee”) is affiliated with the Adviser.
The Independent Trustees of the Trust, their term of office and length of time served, their principal business occupations during the past five years, the number of portfolios in the Fund Complex overseen by each Independent Trustee, and other directorships, if any, held by the Trustee are shown below.
| INDEPENDENT TRUSTEES |
| Name, Address & Year of Birth* | Position(s) Held with Trust | Term of Office and Length of Time Served** | Principal Occupation(s) During Past 5 Years | Number of Portfolios in Fund Complex Overseen by Trustees*** | Other Directorships Held by Trustees |
Mary K. Anstine,
1940 | Trustee | Since
March 2008 | Ms. Anstine was President/Chief Executive Officer of HealthONE Alliance, Denver, Colorado, and former Executive Vice President of First Interstate Bank of Denver. Ms. Anstine is also Trustee/ Director of AV Hunter Trust and Colorado Uplift Board. Ms. Anstine was formerly a Director of the Trust Bank of Colorado (later purchased and now known as Northern Trust Bank), HealthONE and Denver Area Council of the Boy Scouts of America and a member of the American Bankers Association Trust Executive Committee. | 44 | Ms. Anstine is a Trustee of ALPS Variable Investment Trust (10 funds); Financial Investors Trust (31 funds); Reaves Utility Income Fund (1 fund); and Westcore Trust (14 funds). |
Jeremy W. Deems,
1976 | Trustee | Since
March 2008 | Mr. Deems is the Co-Founder, Chief Compliance Officer and Chief Financial Officer of Green Alpha Advisors, LLC. Mr. Deems is Co-Portfolio Manager of the Shelton Green Alpha Fund. Prior to joining Green Alpha Advisors, Mr. Deems was CFO and Treasurer of Forward Management, LLC, ReFlow Management Co., LLC, ReFlow Fund, LLC, a private investment fund, and Sutton Place Management, LLC, an administrative services company. | 46 | Mr. Deems is a Trustee of ALPS Variable Investment Trust (10 funds); Financial Investors Trust (31 funds); and Reaves Utility Income Fund (1 fund); Clough Funds Trust (1 fund) and Elevation ETF Trust (2 fund). |
Rick A. Pederson, 1952 | Trustee | Since
March 2008 | Mr. Pederson is President, Foundation Properties, Inc. (a real estate investment management company), 1994 - present; Advisory Board Member, Bow River Capital Partners (private equity management), 2003 - present; Advisor, The Pauls Corporation (real estate investment management and development), 2008 - present; Chairman, Ross Consulting Group (real estate consulting services) 1983 - 2013; Advisory Board Member, Neenan Company (construction services) 2002 - present; Board Member, Prosci Inc. (private business services) 2013 - 2016; Board Member, Citywide Banks (Colorado community bank) 2014 - present; Board Member, Strong-Bridge Consulting (management consulting) 2015 - present; Director, National Western Stock Show (not-for-profit organization); Director, Biennial of the Americas (not-for-profit-organization), 2012 - 2015; Board Member, History Colorado, 2015 - present. | 22 | Mr. Pederson is Trustee of Westcore Trust (14 funds) and Principal Real Estate Income Fund (1 fund). |
| * | The business address of the Trustee is c/o ALPS Advisors, Inc., 1290 Broadway, Suite 1100, Denver, Colorado 80203. |
| ** | This is the period for which the Trustee began serving the Trust. Each Trustee serves an indefinite term, until his successor is elected. |
| *** | The Fund Complex includes all series of the Trust and any other investment companies for which ALPS Advisors, Inc. provides investment advisory services. |
Sprott ETFs
| Trustees & Officers | November 30, 2016 (Unaudited) |
The Trustee who is affiliated with the Adviser or affiliates of the Adviser and executive officers of the Trust, his term of office and length of time served, his principal business occupations during the past five years, the number of portfolios in the Fund Complex overseen by the Interested Trustee and the other directorships, if any, held by the Trustee, are shown below.
| INTERESTED TRUSTEE |
| Name, Address and Year of Birth of Interested Trustee* | Position(s) Held with Trust | Term of Office and Length of Time Served** | Principal Occupation(s) During Past 5 Years | Number of Portfolios in Fund Complex Overseen by Trustees*** | Other Directorships Held by Trustees |
Thomas A. Carter,
1966 | Trustee and President | Since
March 2008 | Mr. Carter joined ALPS Fund Services, Inc. (“ALPS”) in 1994 and is currently President and Director of ALPS Advisors, Inc. (“AAI”) and ALPS Portfolio Solutions Distributor, Inc. (“APSD”) and Executive Vice President and Director of ALPS and ALPS Holdings, Inc. (“AHI”) and ALPS Distributors, Inc. (“ADI”). Because of his position with AHI, ALPS, ADI, APSD and AAI, Mr. Carter is deemed an affiliate of the Fund as defined under the 1940 Act. Before joining ALPS, Mr. Carter was with Deloitte & Touche LLP, where he worked with a diverse group of clients, primarily within the financial services industry. Mr. Carter is a Certified Public Accountant and received his Bachelor of Science in Accounting from the University of Colorado at Boulder. | 33 | Mr. Carter is a Trustee of ALPS Variable Investment Trust (10 funds); Principal Real Estate Income Fund (1 fund); and RiverNorth Opportunities Fund, Inc. (1 fund). |
| * | The business address of the Trustee is c/o ALPS Advisors, Inc., 1290 Broadway, Suite 1100, Denver, Colorado 80203. |
| ** | This is the period for which the Trustee began serving the Trust. Each Trustee serves an indefinite term, until his successor is elected. |
| *** | The Fund Complex includes all series of the Trust and any other investment companies for which ALPS Advisors, Inc. provides investment advisory services. |
Sprott ETFs
| Trustees & Officers | November 30, 2016 (Unaudited) |
| OFFICERS |
| Name, Address and Year of Birth of Officer* | Position(s) Held with Trust | Length of Time Served** | Principal Occupation(s) During Past 5 Years |
Erin D. Nelson,
1977 | Chief
Compliance
Officer (“CCO”) | Since
December 2015 | Erin Nelson became Senior Vice-President and Chief Compliance Officer of ALPS Advisors, Inc. (“AAI”) on July 1, 2015 and prior to that served as Vice President and Deputy Chief Compliance Officer of AAI since January 1, 2015. Prior to January 1, 2015, Ms. Nelson was Vice-President and Assistant General Counsel of ALPS Fund Services, Inc. Because of her position with AAI, Ms. Nelson is deemed an affiliate of the Trust as defined under the 1940 Act. Ms. Nelson is also the CCO of ALPS Variable Investment Trust, Liberty All-Star Growth Fund, Inc., Liberty All-Star Equity Fund, Principal Real Estate Income Fund, and RiverNorth Opportunities Fund, Inc. |
Patrick D. Buchanan,
1972 | Treasurer | Since
June 2012 | Mr. Buchanan is Vice President of AAI. Mr. Buchanan joined ALPS in 2007 and because of his position with AAI, he is deemed an affiliate of the Trust as defined under the 1940 Act. Mr. Buchanan is also Treasurer of the ALPS Variable Insurance Trust, Principal Real Estate Income Fund, Clough Funds Trust and RiverNorth Opportunities Fund, Inc. |
Andrew P. Meloni,
1969 | Assistant
Treasurer | Since
December 2016 | Mr. Meloni is a Fund Controller for ALPS Fund Services, Inc. Mr. Meloni joined ALPS in 2007 and because of his position with ALPS, he is deemed an affiliate of the Fund as defined under the 1940 Act. Mr. Meloni is also Assistant Treasurer to the Liberty All-Star Equity Fund, Liberty All-Star Growth Fund, Inc., Principal Real Estate Income Fund, RiverNorth Opportunities Fund, Inc. and ALPS Variable Investment Trust. |
Abigail J. Murray,
1975 | Secretary | Since
June 2015 | Ms. Murray joined ALPS in April 2015. She is currently Vice President and Senior Counsel of ALPS. Prior to joining ALPS, Ms. Murray was an Attorney and Managing Member at Murray & Rouvina PLC from 2014 to 2015 and an Associate with Vedder Price P.C. from 2007 to 2014. Ms. Murray is also the Secretary of Clough Global Allocation Fund, Clough Global Equity Fund, Clough Global Opportunities Fund, Clough Funds Trust, The Caldwell & Orkin Funds, Inc. and RiverNorth Opportunities Fund, Inc. and Assistant Secretary of Elevation ETF Trust and Principal Real Estate Income Fund. |
Andrea E. Kuchli,
1985 | Assistant
Secretary | Since
December 2015 | Ms. Kuchli joined ALPS in 2015 and is currently Vice President and Senior Counsel of ALPS. Prior to joining ALPS, Ms. Kuchli was an Associate with Davis Graham & Stubbs LLP from April 2014 to February 2015, and an Associate with Dechert LLP from 2011 to April 2014. Because of her position with ALPS, Ms. Kuchli is deemed an affiliate of the Trust as defined under the 1940 Act. Ms. Kuchli is also Secretary of Elevation ETF Trust and Principal Real Estate Income Fund as well as Assistant Secretary of the James Advantage Funds and RiverNorth Opportunities Fund, Inc. |
Sharon Akselrod,
1974 | Assistant
Secretary | Since December 2016 | Ms. Akselrod joined ALPS in August 2014 and is currently Senior Investment Company Act Paralegal of ALPS Fund Services, Inc. Prior to joining ALPS, Ms. Akselrod served as Corporate Governance and Regulatory Associate for Nordstrom fsb (2013-2014) and Senior Legal Assistant – Legal Manager for AXA Equitable Life Insurance Company (2008-2013). Because of her position with ALPS, Ms. Akselrod is deemed an affiliate of the Trust as defined under the 1940 Act. Ms. Akselrod is also Assistant Secretary of Financial Investors Trust. |
| * | The business address of each Officer is c/o ALPS Advisors, Inc., 1290 Broadway, Suite 1100, Denver, Colorado 80203. |
| ** | This is the period for which the Officer began serving the Trust. Each Officer serves an indefinite term, until his/her successor is elected. |
The Statement of Additional Information includes additional information about the Fund's Trustees and is available, without charge, upon request by calling (toll-free) 1-855-215-1425.
Intentionally Left Blank
November 30, 2016
2016
ANNUAL REPORT
ALPS ETF TRUST
table of
CONTENTS
| Performance Overview | 1 |
| Disclosure of Fund Expenses | 4 |
| Report of Independent Registered Public Accounting Firm | 5 |
| Financial Statements | |
| Schedule of Investments | 6 |
| Statement of Assets and Liabilities | 9 |
| Statement of Operations | 10 |
| Statements of Changes in Net Assets | 11 |
| Financial Highlights | 12 |
| Notes to Financial Statements | 13 |
| Additional Information | 17 |
| Board Considerations Regarding Approval of Investment Advisory Agreement | 18 |
| Trustees & Officers | 19 |
www.alpsfunds.com
Workplace Equality Portfolio
| Performance Overview | November 30, 2016 (Unaudited) |
Investment Objective
The Workplace Equality Portfolio (the “Fund”) seeks investment results that correspond (before fees and expenses) generally to the price and yield performance of its underlying index, the Workplace Equality Index™ (the “Underlying Index”).
The Underlying Index is designed to provide a means of tracking the performance of companies which support workplace equality for lesbian, gay, bisexual and transgender (“LGBT”) employees. The Underlying Index consists of approximately 200 publicly traded stocks of U.S. and foreign companies which support equality for LGBT employees through their workplace practices, including non-discrimination policies regarding sexual orientation and gender identity and providing full benefits to for same-sex spouses, domestic partners and transgender individuals. The Underlying Index is compiled by Denver Investment Advisors LLC (“Denver Investments” or the “Index Provider”). The Index Provider uses publicly available lists and screening sources such as the National Gay & Lesbian Chamber of Commerce® Diversity Inc. Top 50®, Stonewall® or other screening sources, to identify companies with workplace policies that meet the Underlying Index’s criteria for equality for LGBT employees as described above (as well as market capitalization and liquidity requirements). The Index Provider also utilizes its own proprietary database for LGBT screening. The criteria are subject to change in response to changes in law.
Performance Overview
The Fund, for the twelve month period ended November 30, 2016, generated a total return of 11.04% (NAV). For the same period, the Workplace Equality Index® returned 11.95%, once again outperforming the S&P 500 Index return of 8.06%. Three quarters of the outperformance came from stock selection and sector allocation added the remaining outperformance.
This year our equal-weight approach added value, as many of the previous years’ large stock winners, such as Apple, Alphabet (Google), and Johnson & Johnson didn’t affect performance as much as in past years. Small- and mid-cap stocks, which comprise 22% of the Underlying Index, contributed an outsized amount to return this year. Smaller stocks such as Sprint (0.43% of our Underlying Index, not in the S&P 500 Index), NVIDIA (0.54% of our index, 0.17% of the S&P 500 Index), and Wynn Resorts (0.33% of our Underlying Index, 0.02% of the S&P 500 Index) all were among top performers.
The best contribution to return came from the DuPont spin-off Chemours (up 313%), NVIDIA (up 174%), Sprint (up 116%), Cummins (up 58%), and Wynn Resorts (up 56%). Interestingly, another one of our best performing stocks, Groupon (up 38%), was one of the worst performers last year, as was Wynn Resorts. The worst performing stocks in the Underlying Index this year were Abercrombie & Fitch (-42%), Sears Holding (-41%), Nokia (-40%), Deutsche Bank (-39%) and BT Group (-37%). Many of our foreign banks stocks suffered this year, as did stock of select retailers.
The Workplace Equality Index has very divergent sector weightings in comparison to the benchmark S&P 500 Index due to our selection methodology. The adoption of LGBT inclusive workplace policies has been widespread in some sectors while others have not embraced a diverse workforce with as much enthusiasm. Although some of the best performing sectors in the S&P 500 Index were those where we are considerably underweight (Energy and Materials), stock selection in our overweight sectors (Information Technology, Consumer Discretionary, and Telecommunication Services) made up the difference, and then some. Our average stock return in the sectors in which we are underweight was 10.1% versus the average stock return of 7.0% in those same sectors in the S&P 500 Index. For the sectors where the Workplace Equality Index is overweight versus the S&P 500 Index, the average stock in our index returned 16.4% versus the S&P 500 Index constituents’ average return in those same sectors of 10.2%. This stock-specific outperformance is driven by what we call Return on Equality™, or the Real ROE.
Identifying companies that treat their LGBT employees with equality, dignity and respect, in our view, uncovers companies that treat all of their employees well. We believe that companies that value all of their employees benefit from a Return on Equality™ whereas other companies may not have as dedicated and hardworking workforces, which, if true, ultimately will show up in stock performance over long time periods.
Workplace Equality Portfolio
| Performance Overview | November 30, 2016 (Unaudited) |
Performance (as of November 30, 2016)
| | 1 Year | Since Inception^ |
| Workplace Equality Portfolio – NAV | 11.04% | 8.33% |
| Workplace Equality Portfolio – Market Price* | 11.04% | 8.34% |
Workplace Equality IndexTM | 11.95% | 9.17% |
S&P 500® Total Return Index | 8.06% | 8.78% |
Total Expense Ratio (per the current prospectus) 0.75%
Performance data quoted represents past performance. Past performance does not guarantee future results. The table does not reflect the deduction of taxes that a shareholder would pay on Fund distributions or the redemption of Fund shares. Investment return and principal value of an investment will fluctuate so that an investor’s shares, when sold or redeemed, may be worth more or less than the original cost. Current performance data may be higher or lower than actual data quoted. For the most current month-end performance data please visit www.alpsfunds.com or call 1.844.375.8383.
NAV is an exchange-traded fund’s per-share value. The per-share dollar amount of the Fund is derived by dividing the total value of all the securities in its portfolio, less any liabilities, by the number of Fund shares outstanding. Market Price is the price at which a share can currently be traded in the market. Information detailing the number of days the Market Price of the Fund was greater than the Fund’s NAV and the number of days it was less than the Fund’s NAV can be obtained at www.alpsfunds.com.
| ^ | The Fund Commencement date was February 25, 2014. |
| * | Market Price is based on the midpoint of the bid-ask spread at 4 p.m. ET and does not represent the returns an investor would receive if shares were traded at other times. |
The Workplace Equality IndexTM: an equal weighted index of companies that support lesbian, gay, bisexual and transgender (LGBT) equality in their workplace.
The S&P 500® Total Return Index: the Standard & Poor’s composite index of 500 stocks, a widely recognized, unmanaged index of common stock prices.
The indexes are not actively managed and do not reflect any deductions for fees, expenses or taxes. The indexes are reported on a total return basis, which assumes reinvestment of any dividends and distributions realized during a given time period. One cannot invest directly in an index. Index performance does not reflect Fund performance.
The Fund invests in stocks of companies which meet the Underlying Index's criteria for supporting workplace equality for LGBT employees. The trend of companies supporting workplace equality in this fashion is relatively recent, and there may be a limited number of companies which meet the Underlying Index's criteria.
The Workplace Equality Portfolio is not suitable for all investors. Investments in the Fund are subject to investment risks, including possible loss of the principal amount invested.
ALPS Portfolio Solutions Distributor, Inc., a FINRA member, is the distributor for the Workplace Equality Portfolio.
ALPS Portfolio Solutions Distributor, Inc. is not affiliated with Denver Investments.
Workplace Equality Portfolio
| Performance Overview | November 30, 2016 (Unaudited) |
Top 10 Holdings* (as of November 30, 2016)
| Marriott International, Inc., Class A | 0.79% |
| The Chemours Company | 0.67% |
| NVIDIA Corp. | 0.58% |
| KeyCorp | 0.56% |
| Bank of America Corp. | 0.54% |
| Comerica, Inc. | 0.54% |
| United Continental Holdings, Inc. | 0.54% |
| Voya Financial, Inc. | 0.53% |
| Office Depot, Inc. | 0.53% |
| Goldman Sachs Group, Inc. | 0.52% |
| Total % of Top 10 Holdings | 5.80% |
Future holdings are subject to change.
Sector Allocation* (as of November 30, 2016)
| Financials | 22.90% |
| Consumer Discretionary | 21.62% |
| Information Technology | 15.84% |
| Industrials | 12.27% |
| Health Care | 8.37% |
| Consumer Staples | 7.97% |
| Materials | 3.22% |
| Utilities | 2.62% |
| Telecommunication Services | 2.50% |
| Real Estate | 1.17% |
| Energy | 0.89% |
| Money Market Fund | 0.63% |
| Total | 100.00% |
Growth of $10,000 (as of November 30, 2016)
Comparison of Change in Value of $10,000 Investment in the Fund and the Indexes
The chart above represents historical performance of a hypothetical investment of $10,000 in the Fund over the life of the Fund. Past performance does not guarantee future results. This chart does not reflect the deduction of taxes that a shareholder would pay on Fund distributions or the redemption of Fund shares.
Workplace Equality Portfolio
| Disclosure of Fund Expenses | November 30, 2016 (Unaudited) |
Shareholder Expense Example: As a shareholder of the Fund, you incur two types of costs: (1) transaction costs which may include creation and redemption fees or brokerage charges, and (2) ongoing costs, including management fees and other Fund expenses. These examples are intended to help you understand your ongoing costs (in dollars) of investing in the Fund and to compare these costs with the ongoing costs of investing in other funds. It is based on an investment of $1,000 invested at the beginning of the (six month) period and held through November 30, 2016.
Actual Return: The first line of the table provides information about actual account values and actual expenses. You may use the information in this line, together with the amount you invested, to estimate the expenses that you incurred over the period. Simply divide your account value by $1,000 (for example, an $8,600 account value divided by $1,000 = 8.6), then multiply the result by the number in the first line under the heading entitled “Expenses Paid During Period” to estimate the expenses attributable to your investment during this period.
Hypothetical 5% Return: The second line of the table provides information about hypothetical account values and hypothetical expenses based on the Fund’s actual expense ratio and an assumed rate of return of 5% per year before expenses, which is not the Fund’s actual return. The hypothetical account values and expenses may not be used to estimate the actual ending account balance or expenses you paid for the period. You may use this information to compare ongoing costs of investing in the Fund and other funds. To do so, compare this 5% hypothetical example with the 5% hypothetical examples that appear in the shareholder reports of other funds.
The expenses shown in the table are meant to highlight ongoing Fund costs only and do not reflect any transaction costs, such as creation and redemption fees or brokerage charges. Therefore, the second line is useful in comparing ongoing costs only, and will not help you determine the relative total costs of owning different funds. In addition, if these costs were included, your costs would have been higher.
| | Beginning Account Value 6/1/16 | Ending Account Value 11/30/16 | Expense Ratio(a) | Expenses Paid During Period 6/1/16 - 11/30/16(b) |
| Workplace Equality Portfolio | | | | |
| Actual | $1,000.00 | $1,099.40 | 0.75% | $3.94 |
| Hypothetical (5% return before expenses) | $1,000.00 | $1,021.25 | 0.75% | $3.79 |
| (a) | Annualized, based on the Fund's most recent fiscal half year expenses. |
| (b) | Expenses are equal to the Fund's annualized expense ratio multiplied by the average account value over the period, multiplied by the number of days in the most recent fiscal half year (183), divided by 366. |
Workplace Equality Portfolio
Report of Independent Registered Public Accounting Firm
To the Board of Trustees and Shareholders of ALPS ETF Trust:
We have audited the accompanying statement of assets and liabilities, including the schedule of investments, of Workplace Equality Portfolio, one of the portfolios constituting the ALPS ETF Trust (the “Trust”), as of November 30, 2016, and the related statement of operations for the year then ended, the statements of changes in net assets for each of the two years in the period then ended, and the financial highlights for each of the periods presented. These financial statements and financial highlights are the responsibility of the Trust’s management. Our responsibility is to express an opinion on these financial statements and financial highlights based on our audits.
We conducted our audits in accordance with the standards of the Public Company Accounting Oversight Board (United States). Those standards require that we plan and perform the audit to obtain reasonable assurance about whether the financial statements and financial highlights are free of material misstatement. The Trust is not required to have, nor were we engaged to perform, an audit of its internal control over financial reporting. Our audits included consideration of internal control over financial reporting as a basis for designing audit procedures that are appropriate in the circumstances, but not for the purpose of expressing an opinion on the effectiveness of the Trust’s internal control over financial reporting. Accordingly, we express no such opinion. An audit also includes examining, on a test basis, evidence supporting the amounts and disclosures in the financial statements, assessing the accounting principles used and significant estimates made by management, as well as evaluating the overall financial statement presentation. Our procedures included confirmation of securities owned as of November 30, 2016, by correspondence with the custodian and broker. We believe that our audits provide a reasonable basis for our opinion.
In our opinion, the financial statements and financial highlights referred to above present fairly, in all material respects, the financial position of Workplace Equality Portfolio of the ALPS ETF Trust as of November 30, 2016, the results of its operations for the year then ended, the changes in its net assets for each of the two years in the period then ended, and the financial highlights for each of the periods presented, in conformity with accounting principles generally accepted in the United States of America.
DELOITTE & TOUCHE LLP
Denver, Colorado
January 27, 2017
Workplace Equality Portfolio
| Schedule of Investments | November 30, 2016 |
| Security Description | | Shares | | | Value | |
| COMMON STOCKS (99.77%) | | | | | | |
| Consumer Discretionary (21.71%) | | | | | | |
| Abercrombie & Fitch Co., Class A | | | 2,778 | | | $ | 39,920 | |
| American Eagle Outfitters, Inc. | | | 2,601 | | | | 43,073 | |
| Aramark | | | 1,287 | | | | 44,286 | |
Barnes & Noble Education, Inc.(a) | | | 4,951 | | | | 56,293 | |
| Barnes & Noble, Inc. | | | 4,476 | | | | 56,398 | |
| Best Buy Co., Inc. | | | 1,253 | | | | 57,262 | |
Caesars Entertainment Corp.(a) | | | 7,110 | | | | 53,325 | |
| CBS Corp., Class B | | | 926 | | | | 56,227 | |
| Choice Hotels International, Inc. | | | 1,047 | | | | 53,868 | |
| Coach, Inc. | | | 1,357 | | | | 49,381 | |
| Comcast Corp., Class A | | | 735 | | | | 51,090 | |
| Darden Restaurants, Inc. | | | 782 | | | | 57,321 | |
| Ford Motor Co. | | | 4,013 | | | | 47,995 | |
| GameStop Corp., Class A | | | 1,784 | | | | 44,047 | |
| Gap, Inc. | | | 2,075 | | | | 51,813 | |
| General Motors Co. | | | 1,558 | | | | 53,798 | |
Groupon, Inc.(a) | | | 9,227 | | | | 36,631 | |
| Hilton Worldwide Holdings, Inc. | | | 2,086 | | | | 52,296 | |
| The Home Depot, Inc. | | | 382 | | | | 49,431 | |
Hyatt Hotels Corp., Class A(a) | | | 947 | | | | 48,619 | |
| InterContinental Hotels Group PLC, ADR | | | 1,121 | | | | 46,308 | |
| Interpublic Group of Cos., Inc. | | | 2,143 | | | | 51,582 | |
| L Brands, Inc. | | | 667 | | | | 46,837 | |
| Macy's, Inc. | | | 1,343 | | | | 56,675 | |
| Marriott International, Inc., Class A | | | 1,216 | | | | 95,796 | |
| Mattel, Inc. | | | 1,555 | | | | 49,091 | |
| McDonald's Corp. | | | 419 | | | | 49,974 | |
MGM Resorts International(a) | | | 1,872 | | | | 53,745 | |
| Newell Rubbermaid, Inc. | | | 949 | | | | 44,612 | |
| NIKE, Inc., Class B | | | 861 | | | | 43,110 | |
| Nordstrom, Inc. | | | 944 | | | | 52,788 | |
| Office Depot, Inc. | | | 13,166 | | | | 64,118 | |
| Pearson PLC, Sponsored ADR | | | 4,676 | | | | 46,152 | |
| Royal Caribbean Cruises Ltd. | | | 733 | | | | 59,351 | |
Sears Holdings Corp.(a) | | | 3,970 | | | | 51,134 | |
| Sirius XM Holdings, Inc. | | | 11,793 | | | | 53,894 | |
| Sony Corp., Sponsored ADR | | | 1,494 | | | | 43,431 | |
| Staples, Inc. | | | 5,674 | | | | 54,868 | |
| Starbucks Corp. | | | 897 | | | | 51,999 | |
| Target Corp. | | | 699 | | | | 53,991 | |
Tesla Motors, Inc.(a) | | | 233 | | | | 44,130 | |
| Tiffany & Co. | | | 655 | | | | 54,024 | |
| Time Warner, Inc. | | | 644 | | | | 59,132 | |
| Time, Inc. | | | 3,289 | | | | 53,282 | |
| TJX Cos., Inc. | | | 645 | | | | 50,529 | |
| Viacom, Inc., Class B | | | 1,315 | | | | 49,286 | |
| Visteon Corp. | | | 674 | | | | 53,024 | |
| Walt Disney Co. | | | 518 | | | | 51,344 | |
| Whirlpool Corp. | | | 297 | | | | 48,245 | |
| Wyndham Worldwide Corp. | | | 712 | | | | 51,257 | |
| Wynn Resorts Ltd. | | | 446 | | | | 45,487 | |
| Total Consumer Discretionary | | | | | | | 2,632,270 | |
| | | | | | | | | |
| Consumer Staples (8.00%) | | | | | | | | |
Avon Products, Inc.(a) | | | 9,158 | | | | 49,178 | |
| Brown‐Forman Corp., Class B | | | 1,037 | | | | 47,028 | |
| Security Description | | Shares | | | Value | |
| Consumer Staples (continued) | | | | | | |
| Campbell Soup Co. | | | 872 | | | $ | 49,608 | |
| Clorox Co. | | | 393 | | | | 45,415 | |
| Coca‐Cola Co. | | | 1,148 | | | | 46,322 | |
| Colgate‐Palmolive Co. | | | 670 | | | | 43,704 | |
| ConAgra Foods, Inc. | | | 1,115 | | | | 40,909 | |
| CVS Health Corp. | | | 535 | | | | 41,136 | |
| Diageo PLC, Sponsored ADR | | | 424 | | | | 42,926 | |
| The Estee Lauder Cos., Inc., Class A | | | 549 | | | | 42,657 | |
| General Mills, Inc. | | | 742 | | | | 45,218 | |
| Hershey Co. | | | 507 | | | | 48,996 | |
| Hormel Foods Corp. | | | 1,332 | | | | 45,608 | |
| Kellogg Co. | | | 621 | | | | 44,712 | |
| The Kraft Heinz Co. | | | 544 | | | | 44,418 | |
| The Kroger Co. | | | 1,538 | | | | 49,677 | |
Lamb Weston Holdings, Inc.(a) | | | 367 | | | | 12,287 | |
| Mondelez International, Inc., Class A | | | 1,123 | | | | 46,313 | |
| Pepsi Co., Inc. | | | 459 | | | | 45,946 | |
| Procter & Gamble Co. | | | 549 | | | | 45,271 | |
| Unilever NV, NY Shares | | | 1,075 | | | | 42,817 | |
| Walgreens Boots Alliance, Inc. | | | 586 | | | | 49,652 | |
| Total Consumer Staples | | | | | | | 969,798 | |
| | | | | | | | | |
| Energy (0.89%) | | | | | | | | |
| Chevron Corp. | | | 495 | | | | 55,222 | |
| Royal Dutch Shell PLC, Class A ‐ Sponsored ADR | | | 1,032 | | | | 52,735 | |
| Total Energy | | | | | | | 107,957 | |
| | | | | | | | | |
| Financials (23.00%) | | | | | | | | |
| American Express Co. | | | 761 | | | | 54,822 | |
| American International Group, Inc. | | | 835 | | | | 52,881 | |
| Ameriprise Financial, Inc. | | | 487 | | | | 55,620 | |
| Aon PLC | | | 441 | | | | 50,318 | |
| Bank of America Corp. | | | 3,128 | | | | 66,063 | |
| Bank of Montreal | | | 751 | | | | 49,461 | |
| Bank of New York Mellon Corp. | | | 1,203 | | | | 57,046 | |
| Barclays PLC, Sponsored ADR | | | 5,595 | | | | 60,146 | |
| BlackRock, Inc. | | | 133 | | | | 49,315 | |
| Capital One Financial Corp. | | | 687 | | | | 57,735 | |
| Charles Schwab Corp. | | | 1,575 | | | | 60,890 | |
| Chubb Corp. | | | 390 | | | | 49,920 | |
| Citigroup, Inc. | | | 1,037 | | | | 58,476 | |
| CNA Financial Corp. | | | 1,491 | | | | 57,061 | |
| Comerica, Inc. | | | 1,035 | | | | 65,981 | |
| Credit Suisse Group AG, Sponsored ADR | | | 3,744 | | | | 49,945 | |
Deutsche Bank AG(a) | | | 3,557 | | | | 56,201 | |
| Discover Financial Services | | | 845 | | | | 57,266 | |
| FactSet Research Systems, Inc. | | | 274 | | | | 43,887 | |
| Fifth Third Bancorp | | | 2,380 | | | | 61,928 | |
Genworth Financial, Inc., Class A(a) | | | 9,622 | | | | 41,182 | |
| Goldman Sachs Group, Inc. | | | 291 | | | | 63,813 | |
| Hartford Financial Services Group, Inc. | | | 1,154 | | | | 54,376 | |
| HSBC Holdings PLC, Sponsored ADR | | | 1,308 | | | | 51,718 | |
| Huntington Bancshares, Inc. | | | 4,968 | | | | 61,901 | |
| JPMorgan Chase & Co. | | | 734 | | | | 58,845 | |
Workplace Equality Portfolio
| Schedule of Investments | November 30, 2016 |
| Security Description | | Shares | | | Value | |
| Financials (continued) | | | | | | |
| KeyCorp | | | 3,923 | | | $ | 67,907 | |
| M&T Bank Corp. | | | 420 | | | | 60,455 | |
| Marsh & McLennan Cos., Inc. | | | 732 | | | | 50,735 | |
| MetLife, Inc. | | | 1,104 | | | | 60,731 | |
| Moody's Corp. | | | 439 | | | | 44,119 | |
| Morgan Stanley | | | 1,528 | | | | 63,198 | |
| Northern Trust Corp. | | | 705 | | | | 57,916 | |
| PNC Financial Services Group, Inc. | | | 539 | | | | 59,581 | |
| Principal Financial Group, Inc. | | | 988 | | | | 56,998 | |
| Progressive Corp. | | | 1,552 | | | | 51,682 | |
| Prudential Financial, Inc. | | | 608 | | | | 61,165 | |
| Royal Bank of Canada | | | 793 | | | | 51,402 | |
| S&P Global, Inc. | | | 392 | | | | 46,644 | |
| State Street Corp. | | | 702 | | | | 55,318 | |
| Sun Life Financial, Inc. | | | 1,540 | | | | 59,136 | |
| SunTrust Banks, Inc. | | | 1,110 | | | | 57,665 | |
| T Rowe Price Group, Inc. | | | 709 | | | | 52,509 | |
| Thomson Reuters Corp. | | | 1,196 | | | | 51,679 | |
| Toronto‐Dominion Bank | | | 1,119 | | | | 53,029 | |
| The Travelers Cos., Inc. | | | 414 | | | | 46,927 | |
| UBS Group AG | | | 3,455 | | | | 54,762 | |
| US Bancorp | | | 1,144 | | | | 56,765 | |
| Voya Financial, Inc. | | | 1,654 | | | | 64,291 | |
| Wells Fargo & Co. | | | 1,065 | | | | 56,360 | |
| Total Financials | | | | | | | 2,787,771 | |
| | | | | | | | | |
| Health Care (8.40%) | | | | | | | | |
| AbbVie, Inc. | | | 763 | | | | 46,390 | |
| Aetna, Inc. | | | 418 | | | | 54,691 | |
| Baxter International, Inc. | | | 1,014 | | | | 44,991 | |
Biogen, Inc.(a) | | | 156 | | | | 45,875 | |
Boston Scientific Corp.(a) | | | 2,038 | | | | 41,698 | |
| Bristol‐Myers Squibb Co. | | | 869 | | | | 49,046 | |
| Cardinal Health, Inc. | | | 621 | | | | 44,097 | |
| Cigna Corp. | | | 361 | | | | 48,641 | |
| Danaher Corp. | | | 628 | | | | 49,091 | |
| Eli Lilly & Co. | | | 609 | | | | 40,876 | |
| GlaxoSmithKline PLC, Sponsored ADR | | | 1,129 | | | | 42,665 | |
Henry Schein, Inc.(a) | | | 290 | | | | 43,198 | |
| Humana, Inc. | | | 275 | | | | 58,476 | |
| Johnson & Johnson | | | 408 | | | | 45,410 | |
| McKesson Corp. | | | 287 | | | | 41,274 | |
| Medtronic PLC | | | 565 | | | | 41,251 | |
| Merck & Co., Inc. | | | 763 | | | | 46,688 | |
| Novartis AG, Sponsored ADR | | | 599 | | | | 41,187 | |
| Pfizer, Inc. | | | 1,428 | | | | 45,896 | |
| St Jude Medical, Inc. | | | 603 | | | | 47,758 | |
| Thermo Fisher Scientific, Inc. | | | 317 | | | | 44,415 | |
| UnitedHealth Group, Inc. | | | 348 | | | | 55,095 | |
| Total Health Care | | | | | | | 1,018,709 | |
| | | | | | | | | |
| Industrials (12.32%) | | | | | | | | |
| 3M Co. | | | 276 | | | | 47,400 | |
| Alaska Air Group, Inc. | | | 736 | | | | 60,551 | |
| American Airlines Group, Inc. | | | 1,359 | | | | 63,112 | |
| Arconic, Inc. | | | 1,689 | | | | 32,564 | |
| Boeing Co. | | | 382 | | | | 57,514 | |
| Security Description | | Shares | | | Value | |
| Industrials (continued) | | | | | | |
| CEB, Inc. | | | 907 | | | $ | 53,468 | |
| Cummins, Inc. | | | 404 | | | | 57,279 | |
| Eaton Corp. PLC | | | 777 | | | | 51,678 | |
| Fortive Corp. | | | 950 | | | | 52,240 | |
| General Electric Co. | | | 1,602 | | | | 49,278 | |
| Herman Miller, Inc. | | | 1,381 | | | | 44,882 | |
Huron Consulting Group, Inc.(a) | | | 791 | | | | 41,725 | |
IHS Markit Ltd.(a) | | | 1,302 | | | | 46,794 | |
JetBlue Airways Corp.(a) | | | 2,814 | | | | 56,533 | |
| Lockheed Martin Corp. | | | 204 | | | | 54,111 | |
| ManpowerGroup, Inc. | | | 715 | | | | 61,068 | |
Navigant Consulting, Inc.(a) | | | 2,433 | | | | 60,095 | |
| Northrop Grumman Corp. | | | 227 | | | | 56,671 | |
| Owens Corning | | | 948 | | | | 48,708 | |
| Raytheon Co. | | | 353 | | | | 52,788 | |
| Rockwell Automation, Inc. | | | 424 | | | | 56,693 | |
| Rockwell Collins, Inc. | | | 596 | | | | 55,261 | |
| Southwest Airlines Co. | | | 1,323 | | | | 61,665 | |
| Steelcase, Inc., Class A | | | 3,495 | | | | 54,347 | |
United Continental Holdings, Inc.(a) | | | 948 | | | | 65,365 | |
| United Technologies Corp. | | | 483 | | | | 52,029 | |
Virgin America, Inc.(a) | | | 864 | | | | 48,816 | |
| WW Grainger, Inc. | | | 221 | | | | 50,956 | |
| Total Industrials | | | | | | | 1,493,591 | |
| | | | | | | | | |
| Information Technology (15.91%) | | | | | | | | |
| Accenture PLC, Class A | | | 440 | | | | 52,549 | |
Adobe Systems, Inc.(a) | | | 485 | | | | 49,863 | |
Alphabet, Inc., Class C(a) | | | 63 | | | | 47,757 | |
| Apple, Inc. | | | 420 | | | | 46,418 | |
| Automatic Data Processing, Inc. | | | 553 | | | | 53,099 | |
| Booz Allen Hamilton Holding Corp. | | | 1,633 | | | | 61,744 | |
| Broadridge Financial Solutions, Inc. | | | 693 | | | | 44,865 | |
| CA, Inc. | | | 1,514 | | | | 48,387 | |
| Cisco Systems, Inc. | | | 1,579 | | | | 47,086 | |
| Convergys Corp. | | | 1,682 | | | | 43,513 | |
| Corning, Inc. | | | 2,134 | | | | 51,280 | |
eBay, Inc.(a) | | | 1,497 | | | | 41,632 | |
Electronic Arts, Inc.(a) | | | 573 | | | | 45,405 | |
Facebook, Inc., Class A(a) | | | 369 | | | | 43,697 | |
| Harris Corp. | | | 539 | | | | 55,819 | |
| Hewlett Packard Enterprise Co. | | | 2,141 | | | | 50,956 | |
| HP, Inc. | | | 3,331 | | | | 51,297 | |
| Intel Corp. | | | 1,270 | | | | 44,069 | |
| International Business Machines Corp. | | | 314 | | | | 50,937 | |
| Intuit, Inc. | | | 441 | | | | 50,133 | |
LinkedIn Corp., Class A(a) | | | 247 | | | | 48,224 | |
| MasterCard, Inc., Class A | | | 486 | | | | 49,669 | |
| Microsoft Corp. | | | 844 | | | | 50,859 | |
NCR Corp.(a) | | | 1,514 | | | | 58,667 | |
| NetApp, Inc. | | | 1,386 | | | | 50,672 | |
| Nokia OYJ, Sponsored ADR | | | 8,737 | | | | 37,569 | |
| NVIDIA Corp. | | | 765 | | | | 70,533 | |
| Oracle Corp. | | | 1,244 | | | | 49,996 | |
PayPal Holdings, Inc.(a) | | | 1,172 | | | | 46,036 | |
| QUALCOMM, Inc. | | | 768 | | | | 52,324 | |
Salesforce.com, Inc.(a) | | | 655 | | | | 47,160 | |
Workplace Equality Portfolio
| Schedule of Investments | November 30, 2016 |
| Security Description | | Shares | | | Value | |
| Information Technology (continued) | | | | | | |
| Symantec Corp. | | | 1,922 | | | $ | 46,878 | |
Tech Data Corp.(a) | | | 695 | | | | 58,985 | |
| Texas Instruments, Inc. | | | 697 | | | | 51,529 | |
Twitter, Inc.(a) | | | 2,512 | | | | 46,447 | |
| Visa, Inc., Class A | | | 584 | | | | 45,155 | |
| Xerox Corp. | | | 4,905 | | | | 45,862 | |
Yahoo!, Inc.(a) | | | 1,089 | | | | 44,671 | |
Yelp, Inc.(a) | | | 1,253 | | | | 46,612 | |
| Total Information Technology | | | | | | | 1,928,354 | |
| | | | | | | | | |
| Materials (3.23%) | | | | | | | | |
| Alcoa, Inc. | | | 563 | | | | 16,311 | |
| Ball Corp. | | | 608 | | | | 45,636 | |
| The Chemours Company | | | 3,301 | | | | 81,601 | |
| Dow Chemical Co. | | | 925 | | | | 51,541 | |
| Ecolab, Inc. | | | 405 | | | | 47,276 | |
| EI du Pont de Nemours & Co. | | | 717 | | | | 52,778 | |
| Monsanto Co. | | | 467 | | | | 47,966 | |
| Praxair, Inc. | | | 408 | | | | 49,082 | |
| Total Materials | | | | | | | 392,191 | |
| | | | | | | | | |
| Real Estate (1.17%) | | | | | | | | |
CBRE Group, Inc., Class A(a) | | | 1,699 | | | | 49,339 | |
| Jones Lang LaSalle, Inc. | | | 426 | | | | 43,145 | |
| Weyerhaeuser Co., REIT | | | 1,612 | | | | 49,698 | |
| Total Real Estate | | | | | | | 142,182 | |
| | | | | | | | | |
| Telecommunication Services (2.51%) | | | | | | | | |
| AT&T, Inc. | | | 1,208 | | | | 46,665 | |
| BT Group PLC, Sponsored ADR | | | 1,893 | | | | 42,649 | |
Level 3 Communications, Inc.(a) | | | 986 | | | | 54,299 | |
Sprint Corp.(a) | | | 7,277 | | | | 57,052 | |
T‐Mobile US, Inc.(a) | | | 1,040 | | | | 56,379 | |
| Verizon Communications, Inc. | | | 936 | | | | 46,706 | |
| Total Telecommunication Services | | | | | | | 303,750 | |
| | | | | | | | | |
| Utilities (2.63%) | | | | | | | | |
| American Electric Power Co., Inc | | | 747 | | | | 44,110 | |
| Edison International | | | 666 | | | | 45,801 | |
| Exelon Corp. | | | 1,433 | | | | 46,587 | |
| PG&E Corp. | | | 775 | | | | 45,570 | |
| Portland General Electric Co. | | | 1,113 | | | | 46,301 | |
| PPL Corp. | | | 1,362 | | | | 45,573 | |
| Sempra Energy | | | 449 | | | | 44,810 | |
| Total Utilities | | | | | | | 318,752 | |
| | | | | | | | | |
| TOTAL COMMON STOCKS (Cost $10,697,822) | | 12,095,325 | |
| | | 7 Day Yield | | | Shares | | | Value | |
| SHORT TERM INVESTMENTS (0.63%) | | | | |
| Stare Street Institutional Treasury Plus Money Market Fund | | | 0.259 | % | | | 76,836 | | | $ | 76,836 | |
| | | | | | | | | | | | | |
TOTAL SHORT TERM INVESTMENTS
(Cost $76,836) | | | | 76,836 | |
| | | | | | | | | | | | | |
TOTAL INVESTMENTS (100.41%)
(Cost $10,774,658) | | | $ | 12,172,161 | |
| | | | | | | | | | | | | |
| NET LIABILITIES LESS OTHER ASSETS (‐0.41%) | | (49,538 | ) |
| | | | | | | | | | | | | |
| NET ASSETS (100.00%) | | | | | | | | | | $ | 12,122,623 | |
| (a) | Non-income producing security. |
See Notes to Financial Statements.
Workplace Equality Portfolio
| Statement of Assets and Liabilities | November 30, 2016 |
| ASSETS: | | | |
| Investments, at value | | $ | 12,172,161 | |
| Cash | | | 61 | |
| Dividends receivable | | | 26,615 | |
| Total Assets | | | 12,198,837 | |
| | | | | |
| LIABILITIES: | | | | |
| Payable for investments purchased | | | 68,960 | |
| Payable to adviser | | | 7,254 | |
| Total Liabilities | | | 76,214 | |
| NET ASSETS | | $ | 12,122,623 | |
| | | | | |
| NET ASSETS CONSIST OF: | | | | |
| Paid‐in capital | | $ | 10,785,149 | |
| Accumulated net investment income | | | 166,615 | |
| Accumulated net realized loss on investments | | | (226,644 | ) |
| Net unrealized appreciation on investments | | | 1,397,503 | |
| NET ASSETS | | $ | 12,122,623 | |
| | | | | |
| INVESTMENTS, AT COST | | $ | 10,774,658 | |
| | | | | |
| PRICING OF SHARES | | | | |
| Net Assets | | $ | 12,122,623 | |
| Shares of beneficial interest outstanding (Unlimited number of shares authorized, par value $0.01 per share) | | | 400,000 | |
| Net Asset Value, offering and redemption price per share | | $ | 30.31 | |
See Notes to Financial Statements.
Workplace Equality Portfolio
| Statement of Operations | For the Year Ended November 30, 2016 |
| INVESTMENT INCOME: | | | |
Dividends(a) | | $ | 251,654 | |
| Total Investment Income | | | 251,654 | |
| | | | | |
| EXPENSES: | | | | |
| Investment adviser fees | | | 77,406 | |
| Total Expenses | | | 77,406 | |
NET INVESTMENT INCOME | | | 174,248 | |
| | | | | |
| REALIZED AND UNREALIZED GAIN/(LOSS) | | | | |
| Net realized loss on investments | | | (201,456 | ) |
| Net change in unrealized appreciation on investments | | | 1,251,679 | |
NET REALIZED AND UNREALIZED GAIN ON INVESTMENTS | | | 1,050,223 | |
| NET INCREASE IN NET ASSETS RESULTING FROM OPERATIONS | | $ | 1,224,471 | |
| (a) | Net of foreign tax withholding $2,202. |
See Notes to Financial Statements.
Workplace Equality Portfolio
Statements of Changes in Net Assets
| | | For the Year Ended November 30, 2016 | | | For the Year Ended November 30, 2015 (a) | |
| OPERATIONS: | | | | | | |
| Net investment income | | $ | 174,248 | | | $ | 108,513 | |
Net realized gain/(loss)(a) | | | (201,456 | ) | | | 318,475 | |
Net change in unrealized appreciation/(depreciation)(a) | | | 1,251,679 | | | | (377,592 | ) |
| Net increase in net assets resulting from operations | | | 1,224,471 | | | | 49,396 | |
| | | | | | | | | |
| DISTRIBUTIONS: | | | | | | | | |
| Dividends to shareholders from net investment income | �� | | (135,078 | ) | | | (98,693 | ) |
| Net decrease in net assets from distributions | | | (135,078 | ) | | | (98,693 | ) |
| | | | | | | | | |
| CAPITAL SHARE TRANSACTIONS: | | | | | | | | |
| Proceeds from sale of shares | | | 1,342,125 | | | | 5,633,317 | |
| Cost of shares redeemed | | | – | | | | (2,872,224 | ) |
| Net increase from capital share transactions | | | 1,342,125 | | | | 2,761,093 | |
| Net increase in net assets | | | 2,431,518 | | | | 2,711,796 | |
| | | | | | | | | |
| NET ASSETS: | | | | | | | | |
| Beginning of year | | | 9,691,105 | | | | 6,979,309 | |
| End of year* | | $ | 12,122,623 | | | $ | 9,691,105 | |
| | | | | | | | | |
| *Including accumulated net investment income of: | | $ | 166,615 | | | $ | 103,087 | |
| | | | | | | | | |
| OTHER INFORMATION: | | | | | | | | |
| CAPITAL SHARE TRANSACTIONS: | | | | | | | | |
| Beginning shares | | | 350,000 | | | | 250,002 | |
| Shares sold | | | 50,000 | | | | 200,000 | |
| Shares redeemed | | | – | | | | (100,002 | ) |
| Shares outstanding, end of period | | | 400,000 | | | | 350,000 | |
| (a) | Prior to November 30, 2016, the Fund presented realized gain/loss and unrealized appreciation/depreciation by investment type. This change in presentation was made to conform to industry standards and had no effect on the Fund's change in net assets. |
See Notes to Financial Statements.
Workplace Equality Portfolio
| Financial Highlights | For a Share Outstanding Throughout the Periods Presented |
| | | For the Year Ended November 30, 2016 | | | For the Year Ended November 30, 2015 | | | For the Period February 25, 2014 (Commencement of Operations) to November 30, 2014 | |
| NET ASSET VALUE, BEGINNING OF PERIOD | | $ | 27.69 | | | $ | 27.92 | | | $ | 25.00 | |
| | | | | | | | | | | | | |
| INCOME/(LOSS) FROM INVESTMENT OPERATIONS: | | | | | | | | | | | | |
Net investment income(a) | | | 0.46 | | | | 0.36 | | | | 0.28 | |
| Net realized and unrealized gain/(loss) | | | 2.55 | | | | (0.20 | ) | | | 2.64 | |
| Total from investment operations | | | 3.01 | | | | 0.16 | | | | 2.92 | |
| | | | | | | | | | | | | |
| DISTRIBUTIONS: | | | | | | | | | | | | |
| From net investment income | | | (0.39 | ) | | | (0.39 | ) | | | – | |
| Total distributions | | | (0.39 | ) | | | (0.39 | ) | | | – | |
| | | | | | | | | | | | | |
| Net increase/(decrease) in net asset value | | | 2.62 | | | | (0.23 | ) | | | 2.92 | |
| NET ASSET VALUE, END OF PERIOD | | $ | 30.31 | | | $ | 27.69 | | | $ | 27.92 | |
TOTAL RETURN(b) | | | 11.04 | % | | | 0.59 | % | | | 11.68 | % |
| | | | | | | | | | | | | |
| RATIOS/SUPPLEMENTAL DATA: | | | | | | | | | | | | |
| Net assets, end of period (000s) | | $ | 12,123 | | | $ | 9,691 | | | $ | 6,979 | |
| | | | | | | | | | | | | |
| Ratio of expenses to average net assets | | | 0.75 | % | | | 0.75 | % | | | 0.75 | %(c) |
| Ratio of net investment income to average net assets | | | 1.69 | % | | | 1.31 | % | | | 1.42 | %(c) |
Portfolio turnover rate(d) | | | 34 | % | | | 26 | % | | | 8 | % |
| (a) | Based on average shares outstanding during the period. |
| (b) | Total return is calculated assuming an initial investment made at the net asset value at the beginning of the period and redemption at the net asset value on the last day of the period and assuming all distributions are reinvested at reinvestment prices. Total return calculated for a period of less than one year is not annualized. |
| (d) | Portfolio turnover for periods less than one year are not annualized and does not include securities received or delivered from processing creations or redemptions in-kind. |
See Notes to Financial Statements.
Workplace Equality Portfolio
| Notes to Financial Statements | November 30, 2016 |
1. ORGANIZATION
ALPS ETF Trust (the “Trust”), a Delaware statutory trust, is an open‐end management investment company registered under the Investment Company Act of 1940, as amended (the “1940 Act”). As of November 30, 2016, the Trust consisted of nineteen separate portfolios. Each portfolio represents a separate series of the Trust. This report pertains solely to the Workplace Equality Portfolio (the “Fund”). The investment objective of the Fund is to seek investment results that correspond generally, before fees and expenses, to the price and yield of the Workplace Equality IndexTM. The investment advisor uses a “passive” or indexing approach to try to achieve the Fund’s investment objective. The Fund has elected to qualify as a diversified series of the Trust under the 1940 Act.
The Fund’s Shares (“Shares”) are listed on the New York Stock Exchange (“NYSE”) Arca. The Fund issues and redeems Shares at net asset value (“NAV”) in blocks of 50,000 Shares, each of which is called a “Creation Unit”. Creation Units are issued and redeemed principally in‐kind for securities included in the Underlying Index. Except when aggregated in Creation Units, Shares are not redeemable securities of the Fund.
Pursuant to the Trust’s organizational documents, its Officers and Trustees are indemnified against certain liability arising out of the performance of their duties to the Trust. Additionally, in the normal course of business, the Trust enters into contracts with service providers that contain general indemnification clauses. The Trust’s maximum exposure under these arrangements is unknown, as this would involve future claims that may be made against the Trust that have not yet occurred.
2. SIGNIFICANT ACCOUNTING POLICIES
The following is a summary of significant accounting policies consistently followed by the Fund in the preparation of the financial statements. The accompanying financial statements were prepared in accordance with accounting principles generally accepted in the United States of America (“U.S. GAAP”). The preparation of financial statements in conformity with U.S. GAAP requires management to make certain estimates and assumptions that affect the reported amounts of assets and liabilities and disclosures of contingent assets and liabilities at the date of the financial statements and the reported amounts of revenue and expenses during the period. Actual results could differ from those estimates. The Fund is considered an investment company under U.S. GAAP and follows the accounting and reporting guidance applicable to investment companies in the Financial Accounting Standards Board Accounting Standards Codification Topic 946.
A. Portfolio Valuation
The Fund’s NAV is determined daily, as of the close of regular trading on the NYSE, normally 4:00 p.m. Eastern time, on each day the NYSE is open for trading. The NAV is computed by dividing the value of all assets of the Fund (including accrued interest and dividends), less all liabilities (including accrued expenses and dividends declared but unpaid), by the total number of shares outstanding.
Portfolio securities listed on any exchange other than the NASDAQ Stock Market LLC (“NASDAQ”) are valued at the last sale price on the business day as of which such value is being determined. If there has been no sale on such day, the securities are valued at the mean of the most recent bid and ask prices on such day. Securities traded on the NASDAQ are valued at the NASDAQ Official Closing Price as determined by NASDAQ. Portfolio securities traded on more than one securities exchange are valued at the last sale price on the business day as of which such value is being determined at the close of the exchange representing the principal market for such securities. Portfolio securities traded in the over‐the‐counter market, but excluding securities traded on the NASDAQ, are valued at the latest quoted sale price in such market.
The Fund’s investments are valued at market value or, in the absence of market value with respect to any portfolio securities, at fair value according to procedures adopted by the Trust’s Board of Trustees (the “Board”). When market quotations are not readily available or when events occur that make established valuation methods unreliable, securities of the Fund may be valued in good faith by or under the direction of the Board. These securities generally include, but are not limited to, restricted securities (securities which may not be publicly sold without registration under the Securities Act of 1933) for which a pricing service is unable to provide a market price; securities whose trading has been formally suspended; a security whose market price is not available from a pre‐established primary pricing source or the pricing source is not willing to provide a price; a security with respect to which an event has occurred that is most likely to materially affect the value of the security after the market has closed but before the calculation of the Fund’s NAV or make it difficult or impossible to obtain a reliable market quotation; or a security whose price, as provided by the pricing service, does not reflect the security’s “fair value” due to the security being de‐listed from a national exchange or the security’s primary trading market is temporarily closed at a time when, under normal conditions, it would be open. As a general principle, the current “fair value” of a security would be the amount which the owner might reasonably expect to receive from the sale on the applicable exchange or principal market. A variety of factors may be considered in determining the fair value of such securities.
Workplace Equality Portfolio
| Notes to Financial Statements | November 30, 2016 |
B. Fair Value Measurements
The Fund discloses the classification of its fair value measurements following a three‐tier hierarchy based on the inputs used to measure fair value. Inputs refer broadly to the assumptions that market participants would use in pricing the asset or liability; including assumptions about risk. Inputs may be observable or unobservable. Observable inputs reflect the assumptions market participants would use in pricing the asset or liability that are developed based on market data obtained from sources independent of the reporting entity. Unobservable inputs reflect the reporting entity’s own assumptions about the assumptions market participants would use in pricing the asset or liability that are developed based on the best information available.
Valuation techniques used to value the Fund's investments by major category are as follows:
Equity securities, including restricted securities, for which market quotations are readily available, are valued at the last reported sale price or official closing price as reported by a third party pricing vendor on the primary market or exchange on which they are traded and are categorized as Level 1 in the hierarchy. In the event there were no sales during the day or closing prices are not available, securities are valued at the mean of the most recent quoted bid and ask prices on such day and are generally categorized as Level 2 in the hierarchy. Investments in open‐end mutual funds are valued at their closing NAV each business day and are categorized as Level 1 in the hierarchy.
Changes in valuation techniques may result in transfers in or out of an assigned level within the disclosure hierarchy.
Various inputs are used in determining the value of the Fund’s investments as of the end of the reporting period. When inputs used fall into different levels of the fair value hierarchy, the level in the hierarchy within which the fair value measurement falls is determined based on the lowest level input that is significant to the fair value measurement in its entirety. The designated input levels are not necessarily an indication of the risk or liquidity associated with these investments.
These inputs are categorized in the following hierarchy under applicable financial accounting standards:
| Level 1 – | Unadjusted quoted prices in active markets for identical investments, unrestricted assets or liabilities that a Fund has the ability to access at the measurement date; |
| Level 2 – | Quoted prices which are not active, quoted prices for similar assets or liabilities in active markets or inputs other than quoted prices that are observable (either directly or indirectly) for substantially the full term of the asset or liability; and |
| Level 3 – | Significant unobservable prices or inputs (including the Fund’s own assumptions in determining the fair value of investments) where there is little or no market activity for the asset or liability at the measurement date. |
The following is a summary of the inputs used to value the Fund’s investments as of November 30, 2016:
| Investments in Securities at Value* | | Level 1 - Unadjusted Quoted Prices | | | Level 2 - Other Significant Observable Inputs | | | Level 3 - Significant Unobservable Inputs | | | Total | |
| Common Stocks* | | $ | 12,095,325 | | | $ | – | | | $ | – | | | $ | 12,095,325 | |
| Short Term Investments | | | 76,836 | | | | – | | | | – | | | | 76,836 | |
| TOTAL | | $ | 12,172,161 | | | $ | – | | | $ | – | | | $ | 12,172,161 | |
| * | For a detailed sector breakdown, see the accompanying Schedule of Investments. |
The Fund recognizes transfers between levels as of the end of the period. For the year ended November 30, 2016, the Fund did not have any transfers between Level 1 and Level 2 securities. The Fund did not have any securities that used significant unobservable inputs (Level 3) in determining fair value.
C. Securities Transactions and Investment Income
Securities transactions are recorded as of the trade date. Realized gains and losses from securities transactions are recorded on the highest cost basis. Dividend income and capital gains distributions, if any, are recorded on the ex‐dividend date. Interest income, if any, is recorded on the accrual basis.
Workplace Equality Portfolio
| Notes to Financial Statements | November 30, 2016 |
D. Dividends and Distributions to Shareholders
Dividends from net investment income of the Fund, if any, are declared and paid annually or as the Board may determine from time to time. Distributions of net realized capital gains earned by the Fund, if any, are distributed at least annually.
E. Federal Tax and Tax Basis Information
The timing and character of income and capital gain distributions are determined in accordance with income tax regulations, which may differ from U.S. GAAP. Reclassifications are made to the Fund’s capital accounts for permanent tax differences to reflect income and gains available for distribution (or available capital loss carryforwards) under income tax regulations.
For the year ended November 30, 2016, the following reclassifications, which had no impact on results of operations or net assets, were recorded to reflect tax character:
| Fund | | Paid-in Capital | | | Accumulated Net Investment Income/(Loss) | | | Accumulated Net Realized Gain/(Loss) on Investments | |
| Workplace Equality Portfolio | | $ | – | | | $ | 24,358 | | | $ | (24,358 | ) |
At November 30, 2016, the Fund had available for tax purposes unused post‐enactment capital loss carryforwards as follows:
| Fund | | Short-Term | | | Long-Term | |
| Workplace Equality Portfolio | | $ | 50,427 | | | $ | 129,844 | |
The tax character of the distributions paid during the fiscal years ended November 30, 2016 and November 30, 2015 were as follows:
| | | Ordinary Income | | | Long-Term Capital Gain | | | Return of Capital | |
| November 30, 2016 | | | | | | | | | |
| Workplace Equality Portfolio | | $ | 135,078 | | | $ | – | | | $ | – | |
| November 30, 2015 | | | | | | | | | | | | |
| Workplace Equality Portfolio | | $ | 98,693 | | | | – | | | $ | – | |
As of November 30, 2016, the components of distributable earnings on a tax basis for the Fund were as follows:
| | | Workplace Equality Portfolio Fund | |
| Undistributed net investment income | | $ | 166,615 | |
| Accumulated net realized loss on investments | | | (180,271 | ) |
| Net unrealized appreciation on investments | | | 1,351,130 | |
| Total | | $ | 1,337,474 | |
As of November 30, 2016, the cost of investments for federal income tax purposes and accumulated net unrealized appreciation/(depreciation) on investments were as follows:
| | | Workplace Equality Portfolio | |
| Gross appreciation (excess of value over tax cost) | | $ | 1,846,795 | |
| Gross depreciation (excess of tax cost over value) | | | (495,665 | ) |
| Net unrealized appreciation (depreciation) | | $ | 1,351,130 | |
| Cost of investments for income tax purposes | | $ | 10,821,031 | |
The differences between book‐basis and tax‐basis are primarily due to the deferral of losses from wash sales.
Workplace Equality Portfolio
| Notes to Financial Statements | November 30, 2016 |
F. Income Taxes
No provision for income taxes is included in the accompanying financial statements, as the Fund intends to distribute to shareholders all taxable investment income and realized gains and otherwise comply with Subchapter M of the Internal Revenue Code of 1986, as amended, applicable to regulated investment companies. The Fund evaluates tax positions taken (or expected to be taken) in the course of preparing the Fund’s tax returns to determine whether these positions meet a “more‐likely‐than‐not” standard that, based on the technical merits, have a more than fifty percent likelihood of being sustained by a taxing authority upon examination. A tax position that meets the “more‐likely‐than‐not” recognition threshold is measured to determine the amount of benefit to recognize in the financial statements.
As of and during the year ended November 30, 2016, the Fund did not have a liability for any unrecognized tax benefits. The Fund files U.S. federal, state, and local tax returns as required. The Fund’s tax returns are subject to examination by the relevant tax authorities until expiration of the applicable statute of limitations, which is generally three years after the filing of the tax return, but may extend to four years in certain jurisdictions. Tax returns for open years have incorporated no uncertain tax positions that require a provision for income taxes.
3. INVESTMENT ADVISORY FEE AND OTHER AFFILIATED TRANSACTIONS
ALPS Advisors, Inc. (the “Adviser”) acts as the Fund’s investment adviser pursuant to an Advisory Agreement with the Trust on behalf of the Fund (the “Advisory Agreement”). Pursuant to the Advisory Agreement, the Fund pays the Adviser a unitary fee for the services and facilities it provides payable on a monthly basis at the annual rate of 0.75% of the Fund’s average daily net assets. From time to time, the Adviser may waive all or a portion of its fee.
Out of the unitary management fee, the Adviser pays substantially all expenses of the Fund, including the licensing fees to the Index provider, the cost of transfer agency, custody, fund administration, legal, audit, independent trustees and other services, except for interest expenses, distribution fees or expenses, brokerage expenses, taxes and extraordinary expenses not incurred in the ordinary course of the Fund’s business. The Adviser’s unitary management fee is designed to pay substantially all the Fund’s expenses and to compensate the Adviser for providing services for the Fund.
ALPS Fund Services, Inc., an affiliate of the Adviser, is the administrator of the Fund.
Each Trustee who is not an officer or employee of the Adviser, any sub‐adviser or any of their affiliates (“Independent Trustees”) receives (1) a quarterly retainer of $5,000, (2) a per meeting fee for regularly scheduled meetings of $3,750, (3) $1,500 for any special meeting held outside of a regularly scheduled board meeting, and (4) reimbursement for all reasonable out‐of‐pocket expenses relating to attendance at meetings.
4. PURCHASES AND SALES OF SECURITIES
For the year ended November 30, 2016, the cost of purchases and proceeds from sales of investment securities, excluding in‐kind transactions and short‐term investments, were as follows:
| Fund | | Purchases | | | Sales | |
| Workplace Equality Portfolio | | $ | 3,625,052 | | | $ | 3,583,646 | |
For the year ended November 30, 2016, the cost of in‐kind purchases and proceeds from in‐kind sales were as follows:
| Fund | | Purchases | | | Sales | |
| Workplace Equality Portfolio | | $ | 1,342,284 | | | $ | – | |
Gains on in‐kind transactions are not considered taxable for federal income tax purposes.
5. CAPITAL SHARE TRANSACTIONS
Shares are created and redeemed by the Fund only in Creation Unit size aggregations of 50,000 Shares. Only broker‐dealers or large institutional investors with creation and redemption agreements called Authorized Participants (“AP”) are permitted to purchase or redeem Creation Units from the Fund. Such transactions are generally permitted on an in‐kind basis, with a balancing cash component to equate the transaction to the NAV per unit of the Fund on the transaction date. Cash may be substituted equivalent to the value of certain securities generally when they are not available in sufficient quantity for delivery, not eligible for trading by the AP or as a result of other market circumstances.
Workplace Equality Portfolio
| Additional Information | November 30, 2016 (Unaudited) |
PROXY VOTING RECORDS, POLICIES AND PROCEDURES
Information regarding how the Fund voted proxies relating to portfolio securities during the most recent 12‐month period ended June 30 and a description of the Fund’s proxy voting policies and procedures used in determining how to vote for proxies are available without charge on the Securities and Exchange Commission’s (“SEC”) website at www.sec.gov and upon request, by calling (toll‐free) 1‐866‐675‐2639.
PORTFOLIO HOLDINGS
The Trust is required to disclose, after its first and third fiscal quarters, the complete schedule of the Fund’s portfolio holdings with the SEC on Form N‐Q. Forms N‐Q for the Fund are available on the SEC’s website at www.sec.gov. The Fund’s Forms N‐Q may also be reviewed and copied at the SEC’s Public Reference Room in Washington, D.C. and information on the operation of the Public Reference Room may be obtained by calling 1‐800‐SEC‐0330. The Fund’s Forms N‐Q are available without charge, upon request, by calling (toll‐free) 1‐866‐675‐2639 or by writing to ALPS ETF Trust at 1290 Broadway, Suite 1100, Denver, Colorado 80203.
TAX INFORMATION
The Fund designates the following for federal income tax purposes for distributions made during the calendar year ended December 31, 2015:
| | Qualified Dividend Income | Dividend Received Deduction |
| Workplace Equality Portfolio | 100.00% | 100.00% |
In early 2016, if applicable, shareholders of record received this information for the distributions paid to them by the Fund during the calendar year 2015 via Form 1099. The Fund will notify shareholders in early 2017 of amounts paid to them by the Fund, if any, during the calendar year 2016.
LICENSING AGREEMENT
Denver Investments has entered into an index licensing agreement with ALPS Advisors Inc. (the “Adviser”) to allow the Adviser’s use of the Workplace Equality Index™, the underlying index of the Workplace Equality Portfolio (the “Fund”). The following disclosure relates to such licensing agreement:
Denver Investments is the designer of the construction and methodology for the Index. “Denver Investments” and “Workplace Equality Index™” are service marks or trademarks of Denver Investments. Denver Investments acts as brand licensor for the Index. Denver Investments is not responsible for the descriptions of the Index or the Fund that appear herein. Denver Investments is not affiliated with the Trust, the Adviser or the Distributor.
The Fund is not sponsored, endorsed or promoted by Denver Investments. Denver Investments makes no representation or warranty, express or implied, to the owners of the Fund or any member of the public regarding the advisability of investing in securities or commodities generally or in the Fund particularly and does not guarantee the quality, accuracy or completeness of the Index or any Index data included herein or derived there from and assume no liability in connection with their use. The Index is determined and composed without regard to the Adviser or the Fund. Denver Investments has no obligation to take the needs of the Adviser, the Fund or the shareholders of the Fund into consideration in connection with the foregoing. Denver Investments is not responsible for and has not participated in the determination of pricing or the timing of the issuance or sale of the Shares of the Fund or in the determination or calculation of the NAV of the Fund. Denver Investments has no obligation or liability in connection with the administration or trading of the Fund.
Denver Investments does not guarantee the accuracy and/or completeness of the Index or any data included therein, and Denver Investments shall have no liability for any errors, omissions, or interruptions therein. Denver Investments makes no warranty, express or implied, as to results to be obtained by the Adviser, the Fund, Fund shareholders or any other person or entity from the use of the Index or any data included therein. Denver Investments makes no express or implied warranties, and expressly disclaims all warranties of merchantability or fitness for a particular purpose or use with respect to the Index or any data included therein. Without limiting any of the foregoing, in no event shall Denver Investments have any liability for any special, punitive, indirect, or consequential damages (including lost profits) arising out of matters relating to the use of the Index, even if notified of the possibility of such damages.
The Adviser does not guarantee the accuracy and/or the completeness of the Index or any data included therein, and the Adviser shall have no liability for any errors, omissions or interruptions therein. The Adviser makes no warranty, express or implied, as to results to be obtained by the Fund, owners of the Shares of the Fund or any other person or entity from the use of the Index or any data included therein. The Adviser makes no express or implied warranties, and expressly disclaims all warranties of merchantability or fitness for a particular purpose or use with respect to the Index or any data included therein. Without limiting any of the foregoing, in no event shall the Adviser have any liability for any special, punitive, direct, indirect, or consequential damages (including lost profits) arising out of matters relating to the use of the Index, even if notified of the possibility of such damages.
Workplace Equality Portfolio
Board Considerations Regarding Approval of
Investment Advisory Agreement | November 30, 2016 (Unaudited) |
At an in‐person meeting held on June 6, 2016, the Board of Trustees of the Trust (the “Board” or the “Trustees”), including the Trustees who are not “interested persons” of the Trust within the meaning of the 1940 Act, as amended (the “Independent Trustees”), evaluated a proposal to approve the continuance of the Investment Advisory Agreement between the Trust and ALPS Advisors, Inc. (the “Adviser” or “AAI”) with respect to the Workplace Equality Portfolio (“EQLT” or “the Fund”). The Independent Trustees also met separately to consider the Investment Advisory Agreement.
In evaluating the Investment Advisory Agreement with respect to EQLT, the Trustees considered various factors, including (i) the nature, extent and quality of the services provided by AAI with respect to the Fund under the Investment Advisory Agreement; (ii) the advisory fees and other expenses paid by the Fund compared to those of similar funds managed by other investment advisers; (iii) the costs of the services provided to the Fund by AAI and the profits realized by AAI and its affiliates from its relationship to the Fund; (iv) the extent to which economies of scale have been or would be realized if and as the assets of the Fund grow and whether fees reflect the economies of scale for the benefit of shareholders; and (v) any additional benefits and other considerations.
With respect to the nature, extent and quality of the services provided by AAI under the Investment Advisory Agreement, the Trustees considered and reviewed information concerning the services provided under the Investment Advisory Agreement, the investment parameters of the index of the Fund, financial information regarding AAI and its parent company, information describing AAI’s current organization and the background and experience of the persons responsible for the day‐to‐day management of the Fund.
The Trustees reviewed information on the performance of the Fund and its benchmark. The Trustees also evaluated the correlation and tracking error between the Fund’s underlying index and the Fund’s performance. Based on their review, the Trustees found that the nature and extent of services provided to the Fund under the Investment Advisory Agreement was appropriate and that the quality was satisfactory.
The Trustees noted that the advisory fee for the Fund was a unitary fee pursuant to which AAI assumes all expenses of the Fund (including the cost of transfer agency, custody, fund administration, legal, audit and other services) other than the payments under the Investment Advisory Agreement, brokerage expenses, taxes, interest, litigation expenses and other extraordinary expenses.
With respect to advisory fee rates, the Trustees noted that the net advisory fee rate and expense ratio for the Fund is higher than the respective medians of its Broadridge expense group.
The Trustees also took into account, among other things, the uniqueness of the Fund’s underlying index (and the fees charged by the index provider for licensing its index) and AAI’s view that “socially responsible” funds (which the Broadridge peer group did not include) would be the Fund’s closest competitors in the marketplace and the supplemental peer group provided by AAI.
Based on the foregoing, and the other information available to them, the Trustees concluded that the advisory fee rate for the Fund was reasonable under the circumstances and in light of the quality of the services provided.
The Trustees considered other benefits available to AAI because of its relationship with the Fund and concluded that the advisory fees were reasonable taking into account any such benefits.
The Trustees also considered with respect to the Fund the information provided by AAI about the costs and profitability of AAI with respect to the Fund. The Trustees reviewed and noted the relatively small size of the Fund and concluded that AAI was not realizing any economies of scale. The Trustees determined that they would continue to evaluate whether further economies of scale have been achieved on an ongoing basis.
In voting to renew the Investment Advisory Agreement, the Trustees concluded that the terms of the Investment Advisory Agreement are reasonable and fair in light of the services to be performed, the fees paid by certain other funds, expenses to be incurred and such other matters as the Trustees considered relevant in the exercise of their reasonable business judgment. The Trustees did not identify any single factor or group of factors as all important or controlling and considered all factors together.
Workplace Equality Portfolio
| Trustees & Officers | November 30, 2016 (Unaudited) |
The general supervision of the duties performed by the Adviser for the Fund under the Investment Advisory Agreement is the responsibility of the Board of Trustees. The Trust currently has four Trustees. Three Trustees have no affiliation or business connection with the Adviser or any of its affiliated persons and do not own any stock or other securities issued by the Adviser. These are the “non‐interested” or “independent” Trustees (“Independent Trustees”). The other Trustee (the “Interested Trustee”) is affiliated with the Adviser.
The Independent Trustees of the Trust, their term of office and length of time served, their principal business occupations during the past five years, the number of portfolios in the Fund Complex overseen by each Independent Trustee, and other directorships, if any, held by the Trustee are shown below.
| INDEPENDENT TRUSTEES |
Name, Address & Year of Birth* | Position(s) Held with Trust | Term of Office and Length of Time Served** | Principal Occupation(s) During Past 5 Years | Number of Portfolios in Fund Complex Overseen by Trustees*** | Other Directorships Held by Trustees |
Mary K. Anstine, 1940 | Trustee | Since March 2008 | Ms. Anstine was President/Chief Executive Officer of HealthONE Alliance, Denver, Colorado, and former Executive Vice President of First Interstate Bank of Denver. Ms. Anstine is also Trustee/ Director of AV Hunter Trust and Colorado Uplift Board. Ms. Anstine was formerly a Director of the Trust Bank of Colorado (later purchased and now known as Northern Trust Bank), HealthONE and Denver Area Council of the Boy Scouts of America and a member of the American Bankers Association Trust Executive Committee. | 44 | Ms. Anstine is a Trustee of ALPS Variable Investment Trust (10 funds); Financial Investors Trust (31 funds); Reaves Utility Income Fund (1 fund); and Westcore Trust (14 funds). |
Jeremy W. Deems, 1976 | Trustee | Since March 2008 | Mr. Deems is the Co‐Founder, Chief Compliance Officer and Chief Financial Officer of Green Alpha Advisors, LLC. Mr. Deems is Co‐Portfolio Manager of the Shelton Green Alpha Fund. Prior to joining Green Alpha Advisors, Mr. Deems was CFO and Treasurer of Forward Management, LLC, ReFlow Management Co., LLC, ReFlow Fund, LLC, a private investment fund, and Sutton Place Management, LLC, an administrative services company. | 46 | Mr. Deems is a Trustee of ALPS Variable Investment Trust (10 funds); Financial Investors Trust (31 funds); and Reaves Utility Income Fund (1 fund); Clough Funds Trust (1 fund) and Elevation ETF Trust (2 fund). |
Rick A. Pederson, 1952 | Trustee | Since March 2008 | Mr. Pederson is President, Foundation Properties, Inc. (a real estate investment management company), 1994 ‐ present; Advisory Board Member, Bow River Capital Partners (private equity management), 2003 ‐ present; Advisor, The Pauls Corporation (real estate investment management and development), 2008 ‐ present; Chairman, Ross Consulting Group (real estate consulting services) 1983 ‐ 2013; Advisory Board Member, Neenan Company (construction services) 2002 ‐ present; Board Member, Prosci Inc. (private business services) 2013 ‐ 2016; Board Member, Citywide Banks (Colorado community bank) 2014 ‐ present; Board Member, Strong‐Bridge Consulting (management consulting) 2015 ‐ present; Director, National Western Stock Show (not‐for‐profit organization); Director, Biennial of the Americas (not‐for‐profit‐organization), 2012 ‐ 2015; Board Member, History Colorado, 2015 ‐ present. | 22 | Mr. Pederson is Trustee of Westcore Trust (14 funds) and Principal Real Estate Income Fund (1 fund). |
* | The business address of the Trustee is c/o ALPS Advisors, Inc., 1290 Broadway, Suite 1100, Denver, Colorado 80203. |
** | This is the period for which the Trustee began serving the Trust. Each Trustee serves an indefinite term, until his successor is elected. |
*** | The Fund Complex includes all series of the Trust and any other investment companies for which ALPS Advisors, Inc. provides investment advisory services. |
Workplace Equality Portfolio
| Trustees & Officers | November 30, 2016 (Unaudited) |
The Trustee who is affiliated with the Adviser or affiliates of the Adviser and executive officers of the Trust, his term of office and length of time served, his principal business occupations during the past five years, the number of portfolios in the Fund Complex overseen by the Interested Trustee and the other directorships, if any, held by the Trustee, are shown below.
| INTERESTED TRUSTEE | | |
| Name, Address and Year of Birth of Interested Trustee* | Position(s) Held with Trust | Term of Office and Length of Time Served** | Principal Occupation(s) During Past 5 Years | Number of Portfolios in Fund Complex Overseen by Trustees*** | Other Directorships Held by Trustees |
Thomas A. Carter, 1966 | Trustee and President | Since March 2008 | Mr. Carter joined ALPS Fund Services, Inc. (“ALPS”) in 1994 and is currently President and Director of ALPS Advisors, Inc. (“AAI”) and ALPS Portfolio Solutions Distributor, Inc. (“APSD”) and Executive Vice President and Director of ALPS and ALPS Holdings, Inc. (“AHI”) and ALPS Distributors, Inc. (“ADI”). Because of his position with AHI, ALPS, ADI, APSD and AAI, Mr. Carter is deemed an affiliate of the Fund as defined under the 1940 Act. Before joining ALPS, Mr. Carter was with Deloitte & Touche LLP, where he worked with a diverse group of clients, primarily within the financial services industry. Mr. Carter is a Certified Public Accountant and received his Bachelor of Science in Accounting from the University of Colorado at Boulder. | 33 | Mr. Carter is a Trustee of ALPS Variable Investment Trust (10 funds); Principal Real Estate Income Fund (1 fund); and RiverNorth Opportunities Fund, Inc. (1 fund). |
| * | The business address of the Trustee is c/o ALPS Advisors, Inc., 1290 Broadway, Suite 1100, Denver, Colorado 80203. |
| ** | This is the period for which the Trustee began serving the Trust. Each Trustee serves an indefinite term, until his successor is elected. |
| *** | The Fund Complex includes all series of the Trust and any other investment companies for which ALPS Advisors, Inc. provides investment advisory services. |
Workplace Equality Portfolio
| Trustees & Officers | November 30, 2016 (Unaudited) |
| OFFICERS | | | |
| Name, Address and Year of Birth of Officer* | Position(s) Held with Trust | Length of Time Served** | Principal Occupation(s) During Past 5 Years |
| Chief Compliance Officer (“CCO”) | Since December 2015 | Erin Nelson became Senior Vice‐President and Chief Compliance Officer of ALPS Advisors, Inc. (“AAI”) on July 1, 2015 and prior to that served as Vice President and Deputy Chief Compliance Officer of AAI since January 1, 2015. Prior to January 1, 2015, Ms. Nelson was Vice‐President and Assistant General Counsel of ALPS Fund Services, Inc. Because of her position with AAI, Ms. Nelson is deemed an affiliate of the Trust as defined under the 1940 Act. Ms. Nelson is also the CCO of ALPS Variable Investment Trust, Liberty All‐Star Growth Fund, Inc., Liberty All‐Star Equity Fund, Principal Real Estate Income Fund, and RiverNorth Opportunities Fund, Inc. |
Patrick D. Buchanan, 1972 | Treasurer | Since June 2012 | Mr. Buchanan is Vice President of AAI. Mr. Buchanan joined ALPS in 2007 and because of his position with AAI, he is deemed an affiliate of the Trust as defined under the 1940 Act. Mr. Buchanan is also Treasurer of the ALPS Variable Insurance Trust, Principal Real Estate Income Fund, Clough Funds Trust and RiverNorth Opportunities Fund, Inc. |
Andrew P. Meloni, 1969 | Assistant Treasurer | Since December 2016 | Mr. Meloni is a Fund Controller for ALPS Fund Services, Inc. Mr. Meloni joined ALPS in 2007 and because of his position with ALPS, he is deemed an affiliate of the Fund as defined under the 1940 Act. Mr. Meloni is also Assistant Treasurer to the Liberty All‐Star Equity Fund, Liberty All‐Star Growth Fund, Inc., Principal Real Estate Income Fund, RiverNorth Opportunities Fund, Inc. and ALPS Variable Investment Trust. |
Abigail J. Murray, 1975 | Secretary | Since June 2015 | Ms. Murray joined ALPS in April 2015. She is currently Vice President and Senior Counsel of ALPS. Prior to joining ALPS, Ms. Murray was an Attorney and Managing Member at Murray & Rouvina PLC from 2014 to 2015 and an Associate with Vedder Price P.C. from 2007 to 2014. Ms. Murray is also the Secretary of Clough Global Allocation Fund, Clough Global Equity Fund, Clough Global Opportunities Fund, Clough Funds Trust, The Caldwell & Orkin Funds, Inc. and RiverNorth Opportunities Fund, Inc. and Assistant Secretary of Elevation ETF Trust and Principal Real Estate Income Fund. |
Andrea E. Kuchli, 1985 | Assistant Secretary | Since December 2015 | Ms. Kuchli joined ALPS in 2015 and is currently Vice President and Senior Counsel of ALPS. Prior to joining ALPS, Ms. Kuchli was an Associate with Davis Graham & Stubbs LLP from April 2014 to February 2015, and an Associate with Dechert LLP from 2011 to April 2014. Because of her position with ALPS, Ms. Kuchli is deemed an affiliate of the Trust as defined under the 1940 Act. Ms. Kuchli is also Secretary of Elevation ETF Trust and Principal Real Estate Income Fund as well as Assistant Secretary of the James Advantage Funds and RiverNorth Opportunities Fund, Inc. |
Sharon Akselrod, 1974 | Assistant Secretary | Since December 2016 | Ms. Akselrod joined ALPS in August 2014 and is currently Senior Investment Company Act Paralegal of ALPS Fund Services, Inc. Prior to joining ALPS, Ms. Akselrod served as Corporate Governance and Regulatory Associate for Nordstrom fsb (2013‐2014) and Senior Legal Assistant – Legal Manager for AXA Equitable Life Insurance Company (2008‐2013). Because of her position with ALPS, Ms. Akselrod is deemed an affiliate of the Trust as defined under the 1940 Act. Ms. Akselrod is also Assistant Secretary of Financial Investors Trust. |
| * | The business address of each Officer is c/o ALPS Advisors, Inc., 1290 Broadway, Suite 1100, Denver, Colorado 80203. |
| ** | This is the period for which the Officer began serving the Trust. Each Officer serves an indefinite term, until his/her successor is elected. |
The Statement of Additional Information includes additional information about the Fund's Trustees and is available, without charge, upon request by calling (toll-free) 1-866-375-8383.

Item 2. Code of Ethics.
| (a) | The Registrant, as of the end of the period covered by this report, has adopted a code of ethics that applies to the Registrant's principal executive officer, principal financial officer, principal accounting officer or controller or any persons performing similar functions on behalf of the Registrant. |
| (c) | During the period covered by this report, no amendments to the provisions of the code of ethics adopted in 2(a) above were made. |
| (d) | During the period covered by this report, no implicit or explicit waivers to the provisions of the code of ethics adopted in 2(a) above were granted. |
| (f) | The Registrant's Code of Ethics is attached as an Exhibit hereto. |
Item 3. Audit Committee Financial Expert.
The Board of Trustees of the Registrant has determined that the Registrant has at least one Audit Committee Financial Expert serving on its audit committee. The Board of Trustees of the Registrant has designated Jeremy W. Deems as the Registrant’s “Audit Committee Financial Expert”. Mr. Deems is “independent” as defined in paragraph (a)(2) of Item 3 to Form N-CSR.
Item 4. Principal Accountant Fees and Services.
| (a) | Audit Fees: For the Registrant’s fiscal year ended November 30, 2016 and November 30, 2015, the aggregate fees billed for professional services rendered by the principal accountant for the audit of the Registrant’s annual financial statements were $318,575 and $353,300, respectively. |
| (b) | Audit-Related Fees: For the Registrant’s fiscal year ended November 30, 2016 and November 30, 2015, the aggregate fees billed for professional services rendered by the principal accountant for the verification of the Registrant’s securities and similar investments in accordance with Rule 17f-2 under the Investment Company Act of 1940 were $0 and $0, respectively. |
| (c) | Tax Fees: For the Registrant’s fiscal year ended November 30, 2016 and November 30, 2015, the aggregate fees billed for professional services rendered by the principal accountant for tax compliance, tax advice and tax planning were $192,650 and $110,160, respectively. The fiscal year 2016 and 2015 tax fees were for services pertaining to federal and state income tax return review, review of year end dividend distributions and excise tax preparation. |
| (d) | All Other Fees: For the Registrant’s fiscal year ended November 30, 2016 and November 30, 2015, aggregate fees billed to the Registrant by the principal accountant for services provided by the principal accountant other than the services reported in paragraphs (a) through (c) of this Item 4 were $0 and $0, respectively. |
| (e)(1) | Audit Committee Pre-Approval Policies and Procedures: All services to be performed by the Registrant's principal accountant must be pre-approved by the Registrant's audit committee. |
| (e)(2) | No services described in paragraphs (b) through (d) of this Item were approved by the Registrant’s audit committee pursuant to paragraph (c)(7)(i)(C) of Rule 2-01 of Regulation S-X. |
| (g) | The aggregate non-audit fees billed by the Registrant’s accountant for the fiscal year ended November 30, 2016 and November 30, 2015 of the Registrant were $520,050 and $417,560, respectively. These fees consisted of non-audit fees billed to (i) the Registrant of $192,650 and $110,160 as described in response to paragraph (c) above and (ii) to ALPS Fund Services, Inc. (“AFS”), an entity under common control with ALPS Advisors, Inc., the Registrant’s investment adviser, of $327,400 and $307,400, respectively. The non-audit fees billed to AFS related to SSAE 16 services and other compliance-related matters. |
| (h) | The Registrant’s audit committee has considered whether the provision of non-audit services that were rendered to the Registrant’s investment adviser (not including any sub-adviser whose role is primarily portfolio management and is subcontracted with or overseen by another investment adviser), and any entity controlling, controlled by, or under common control with the investment adviser that provides ongoing services to the Registrant that were not pre-approved pursuant to paragraph (c)(7)(ii) of Rule 2-01 of Regulation S-X, is compatible with maintaining the principal accountant’s independence. The Registrant’s audit committee determined that the provision of such non-audit services is compatible with maintaining the principal accountant’s independence. |
Item 5. Audit Committee of Listed Registrants.
Not applicable.
Item 6. Investments.
| (a) | Schedule of Investments is included as part of the Report to Stockholders filed under Item 1 of this Form N-CSR. |
Item 7. Disclosure of Proxy Voting Policies and Procedures for Closed-End Management Investment Companies.
Not applicable.
Item 8. Portfolio Managers of Closed-End Management Investment Companies.
Not applicable.
Item 9. Purchases of Equity Securities by Closed-End Management Investment Company and Affiliated Purchasers.
Not applicable.
Item 10. Submission of Matters to Vote of Security Holders.
There have been no material changes to the procedures by which shareholders may recommend nominees to the Registrant’s Board of Trustees, where those changes were implemented after the Registrant last provided disclosure in response to the requirements of Item 407(c)(2) of Regulation S-K, or this Item.
Item 11. Controls and Procedures.
| (a) | The Registrant’s principal executive officer and principal financial officer have concluded that the Registrant’s disclosure controls and procedures (as defined in Rule 30a-3(c) under the Investment Company Act of 1940, as amended) are effective based on their evaluation of these controls and procedures as of a date within 90 days of the filing date of this report. |
| (b) | There was no change in the Registrant's internal control over financial reporting (as defined in Rule 30a-3(d) under the Investment Company Act of 1940, as amended) during the second fiscal quarter of the period covered by this report that has materially affected, or is reasonably likely to materially affect, the Registrant's internal control over financial reporting. |
Item 12. Exhibits.
| (a)(1) | Registrant’s Code of Ethics for Senior Financial Officers, which is the subject of the disclosure required by Item 2 of Form N-CSR, was filed as Exhibit 12(a)(1) to the Registrant’s Certified Shareholder Report on Form N-CSR, File No. 811-22175, on February 6, 2015. |
| (a)(2) | The certifications required by Rule 30a-2(a) of the Investment Company Act of 1940, as amended, and Section 302 of the Sarbanes-Oxley Act of 2002 are attached hereto as Exhibit 99.Cert. |
| (b) | The certifications by the Registrant’s principal executive officer and principal financial officer, as required by Rule 30a-2(b) of the Investment Company Act of 1940, as amended, and Section 906 of the Sarbanes-Oxley Act of 2002 are attached hereto as Exhibit 99.906Cert. |
SIGNATURES
Pursuant to the requirements of the Securities Exchange Act of 1934 and the Investment Company Act of 1940, the registrant has duly caused this report to be signed on its behalf by the undersigned, thereunto duly authorized.
| | ALPS ETF TRUST |
| | | | |
| | By: | /s/ Thomas A. Carter | |
| | | Thomas A. Carter | |
| | | President (Principal Executive Officer) | |
| | | | |
| | Date: | February 9, 2017 | |
Pursuant to the requirements of the Securities Exchange Act of 1934 and the Investment Company Act of 1940, this report has been signed below by the following persons on behalf of the registrant and in the capacities and on the dates indicated.
| | By: | /s/ Thomas A. Carter | |
| | | Thomas A. Carter | |
| | | President (Principal Executive Officer) | |
| | | | |
| | Date: | February 9, 2017 | |
| | | | |
| | By: | /s/ Patrick D. Buchanan | |
| | | Patrick D. Buchanan | |
| | | Treasurer (Principal Financial Officer) | |
| | | | |
| | Date: | February 9, 2017 | |