UNITED STATES
SECURITIES AND EXCHANGE COMMISSION
Washington, D.C. 20549
FORM N-CSR
CERTIFIED SHAREHOLDER REPORT OF REGISTERED
MANAGEMENT INVESTMENT COMPANIES
Investment Company Act file number:
811-22175
ALPS ETF TRUST
(Exact name of registrant as specified in charter)
1290 Broadway, Suite 1000, Denver, Colorado 80203
(Address of principal executive offices) (Zip code)
Michael Lawlor, Esq., Secretary
ALPS ETF Trust
1290 Broadway, Suite 1000
Denver, Colorado 80203
(Name and address of agent for service)
Registrant’s Telephone Number, including Area Code: 877-398-8461
Date of fiscal year end: November 30
Date of reporting period: December 1, 2021 – November 30, 2022
| Item 1. | Report to Stockholders. |

Table of Contents
| Performance Overview | |
| Alerian MLP ETF | 1 |
| Alerian Energy Infrastructure ETF | 4 |
| Disclosure of Fund Expenses | 7 |
| Report of Independent Registered Public Accounting Firm | 8 |
| Financial Statements | |
| Alerian MLP ETF | |
| Schedule of Investments | 9 |
| Statement of Assets and Liabilities | 10 |
| Statement of Operations | 11 |
| Statements of Changes in Net Assets | 12 |
| Financial Highlights | 13 |
| | |
| Alerian Energy Infrastructure ETF | |
| Schedule of Investments | 14 |
| Statement of Assets and Liabilities | 16 |
| Statement of Operations | 17 |
| Statements of Changes in Net Assets | 18 |
| Financial Highlights | 19 |
| Notes to Financial Statements | 20 |
| Additional Information | 31 |
| Board Considerations Regarding Approval of Investment Advisory Agreements | 33 |
| Trustees & Officers | 35 |
alpsfunds.com
Alerian MLP ETF
| Performance Overview | November 30, 2022 (Unaudited) |
INVESTMENT OBJECTIVE
The Alerian MLP ETF (the “Fund” or “AMLP”) seeks investment results that correspond (before fees and expenses) generally to the price and yield performance of its underlying index, the Alerian MLP Infrastructure Total Return Index (the “Underlying Index” or “AMZI”). The shares of the Fund are listed and trade on the NYSE Arca, Inc. (“NYSE”) under the ticker symbol AMLP. The Fund will normally invest at least 90% of its total assets in securities that comprise the Underlying Index.
The Underlying Index is a rules based, modified capitalization weighted, float-adjusted index intended to give investors a means of tracking the overall performance of the United States energy infrastructure Master Limited Partnership (“MLP”) asset class. The Underlying Index is comprised of energy infrastructure MLPs that earn a majority of their cash flow from the transportation, storage, and processing of energy commodities.
PERFORMANCE OVERVIEW
During the twelve-month period from December 1, 2021, to November 30, 2022, the Fund delivered a total return of 36.59% (36.31% NAV). This compares to the Fund’s Underlying Index, which increased 32.75% on a price-return basis and 42.92% on a total-return basis. The difference in performance between the AMZI and AMLP is primarily attributable to the Fund’s operating expenses and the tax impact of the Fund’s C-Corporation structure, including the accrual of a tax liability of approximately $260.6 million (approximately $1.56 per share) on November 30, 2022.
During the period, the Fund paid four distributions:
| • | $0.7100 per share on February 17, 2022 |
| • | $0.7300 per share on May 19, 2022 |
| • | $0.7400 per share on August 18, 2022 |
| • | $0.7500 per share on November 16, 2022 |
The growing payouts from the Fund over the course of the fiscal year reflected strong distribution trends for AMZI constituents. The majority of AMZI constituents increased their distributions during the year, and there were no cuts. Comparing the latest distribution announcements for the third calendar quarter in 2022 (paid in the fourth calendar quarter in 2022) with the payouts from the third calendar quarter in 2021, 92.17% of the Underlying Index by weighting grew their distributions and 7.83% maintained their payouts based on weightings from November 30, 2022.
During the fiscal year, Hess Midstream (HESM) and Delek Logistics Partners (DKL) were added to the Underlying Index during quarterly rebalancings. Enable Midstream Partners (ENBL), Phillips 66 Partners (PSXP), and Shell Midstream Partners (SHLX) were removed from the Underlying Index in relation to their acquisition by another entity. In June 2022, the methodology for the Underlying Index was updated and applied at the September 2022 rebalancing. Specifically, the constituent criteria for median daily trading volume was lowered, and the volume requirement for existing constituents to remain in AMZI was also lowered. The methodology update was meant to, among other things, better capture the investable universe and minimize future index turnover.
Energy infrastructure MLPs saw strong outperformance during the fiscal year, benefitting from macro and company-level tailwinds, even as the broader market was negatively impacted by inflation and rising interest rates. Constituents provide real asset exposure and often have annual inflation adjustments built into their contracts, both of which can be supportive in periods of elevated inflation as seen in 2022. Performance also benefitted from company-level tailwinds, as solid free cash flow generation fueled both distribution increases and buyback activity. As of November 30, 2022, 74.75% of the AMZI by weighting had a buyback authorization.
Energy infrastructure MLPs continue to advance select growth opportunities, generally biased towards natural gas and natural gas liquids, while also positioning to participate in the evolving energy landscape. Constituents are pursuing opportunities related to carbon capture and renewable fuels, which stand to benefit from provisions included in the Inflation Reduction Act.
Global energy markets have generally tightened as a result of sanctions applied to Russia in response to the ongoing war in Ukraine, but commodity prices have been volatile. Alerian believes energy infrastructure MLPs remain well positioned to weather potential volatility due to the fee-based nature of their cash flows, which should allow companies to generate free cash flow regardless of the commodity price backdrop.
Excess cash flow is expected to continue supporting both dividend increases and buybacks, which could remain supportive for equity performance.
1 | November 30, 2022
Alerian MLP ETF
| Performance Overview | November 30, 2022 (Unaudited) |
Performance (as of November 30, 2022)
| | 1 Year | 5 Year | 10 Year | Since Inception^ |
| Alerian MLP ETF – NAV | 36.31% | 3.63% | 0.88% | 2.57% |
| Alerian MLP ETF – Market Price* | 36.59% | 3.67% | 0.89% | 2.58% |
| Alerian MLP Infrastructure Total Return Index | 42.92% | 5.49% | 2.23% | 4.87% |
| Alerian MLP Total Return Index | 42.25% | 6.06% | 2.15% | 4.69% |
Total Expense Ratio (per the current prospectus) is 0.87%.
Performance data quoted represents past performance. Past performance does not guarantee future results. Total return figures assume reinvestment of dividends, if any. The table does not reflect the deduction of taxes that a shareholder would pay on Fund distributions or the redemption of Fund shares. Investment return and principal value of an investment will fluctuate so that an investor’s shares, when sold or redeemed, may be worth more or less than the original cost. Current performance data may be higher or lower than actual data quoted. For the most current month-end performance data please visit www.alpsfunds.com or call 1.866.759.5679. The Fund accrues deferred income taxes for future tax liabilities associated with the portion of MLP distributions considered to be a tax-deferred return of capital and for any net operating gains as well as capital appreciation of its investment. This deferred tax liability is reflected in the daily Net Asset Value (NAV) and as a result the fund's after-tax performance could differ significantly from the underlying assets even if the pre-tax performance is closely tracked.
NAV is an exchange-traded fund’s per-share value. The per-share dollar amount of the Fund is derived by dividing the total value of all the securities in its portfolio, less any liabilities, by the number of Fund shares outstanding. Market Price is the price at which a share can currently be traded in the market. Information detailing the number of days the Market Price of the Fund was greater than the Fund’s NAV and the number of days it was less than the Fund’s NAV can be obtained at www.alpsfunds.com.
| ^ | The Fund commenced Investment Operations on August 24, 2010 with an Inception Date, the first day of trading on the NYSE ARCA, of August 25, 2010. |
| * | Market Price means the official closing price of a share or, if it more accurately reflects the market value of a share at the time as of which the Fund calculates current net asset value per share, the price that is the midpoint of the bid-ask spread as of that time. It does not represent the returns an investor would receive if shares were traded at other times. |
The Alerian MLP Infrastructure Total Return Index is comprised of 15 midstream energy Master Limited Partnerships and provides investors with an unbiased benchmark for the infrastructure component of this emerging asset class. Total return assumes reinvestment of any dividends and distributions realized during a given time period.
The Alerian MLP Total Return Index is recognized as a leading gauge of energy infrastructure Master Limited Partnerships (MLPs).
The capped, float-adjusted, capitalization-weighted index, whose constituents earn the majority of their cash flow from midstream activities involving energy commodities, is reported on a total-return basis (AMZX), which assumes reinvestment of any dividends and distributions realized during a given period. The indexes are not actively managed and do not reflect any deductions for fees, expenses or taxes. One cannot invest directly in an index. Index performance does not reflect fund performance.
The Fund’s shares are not individually redeemable. Investors buy and sell shares of the Fund on a secondary market. Only market makers or “authorized participants” may trade directly with the Fund, typically in blocks of 25,000 shares.
The Alerian MLP ETF is not suitable for all investors. Investments in the Fund are subject to investment risks, including possible loss of the principal amount invested.
ALPS Portfolio Solutions Distributor, Inc., a FINRA member, is the distributor for the Fund.
2 | November 30, 2022
Alerian MLP ETF
| Performance Overview | November 30, 2022 (Unaudited) |
Top 10 Holdings* (as of November 30, 2022)
| Energy Transfer LP | 10.73% |
| Plains All American Pipeline LP | 10.56% |
| Magellan Midstream Partners LP | 10.40% |
| MPLX LP | 10.31% |
| Western Midstream Partners LP | 9.98% |
| Enterprise Products Partners LP | 9.27% |
| EnLink Midstream LLC | 8.89% |
| DCP Midstream LP | 7.68% |
| Cheniere Energy Partners LP | 5.86% |
| Crestwood Equity Partners LP | 4.55% |
| Total % of Top 10 Holdings | 88.23% |
Future holdings are subject to change.
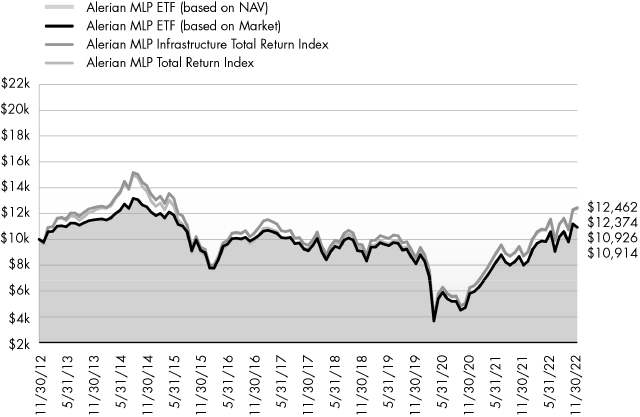
Growth of $10,000 (as of November 30, 2022)
Comparison of change in value of a $10,000 investment in the Fund and the Indexes
The chart above compares historical performance of a hypothetical investment of $10,000 in the Fund over the past ten years with the performance of the Fund’s benchmark index. Results include the reinvestment of all dividends and capital gains distributions. Past performance does not guarantee future results. The chart does not reflect the deduction of taxes that a shareholder would pay on Fund distributions or the redemption of Fund shares.
3 | November 30, 2022
Alerian Energy Infrastructure ETF
| Performance Overview | November 30, 2022 (Unaudited) |
INVESTMENT OBJECTIVE
The Alerian Energy Infrastructure ETF (the “Fund” or “ENFR”) seeks investment results that correspond (before fees and expenses) generally to the price and yield performance of its underlying index, the Alerian Midstream Energy Select Total Return Index (the “Underlying Index” or “AMEI”). As a secondary objective, the Fund seeks to provide total return through income and capital appreciation. The Shares of the Fund are listed and trade on the NYSE Arca, Inc. (“NYSE”) under the ticker symbol ENFR. The Fund will normally invest at least 90% of its total assets in securities that comprise the Underlying Index.
The Underlying Index is a composite of North American energy infrastructure companies engaged in midstream activities involving energy commodities, including gathering and processing, liquefaction, pipeline transportation, rail terminaling, and storage (also known as “midstream energy businesses”). Midstream energy companies include midstream Master Limited Partnerships ("MLPs") and midstream corporations, either based in the United States or Canada. The Underlying Index has a 25% limit for companies taxed as pass-through entities.
PERFORMANCE OVERVIEW
During the twelve-month period from December 1, 2021, to November 30, 2022, the Fund delivered a total return of 28.37% (28.21% NAV). This compares to the Fund’s Underlying Index, which increased 21.66% on a price-return basis and 29.16% on a total-return basis.
During the period, the Fund paid four quarterly distributions:
| • | $0.21107 per share on February 17, 2022 |
| • | $0.32249 per share on May 19, 2022 |
| • | $0.27624 per share on August 18, 2022 |
| • | $0.29618 per share on November 16, 2022 |
AMEI constituents largely increased their dividends during the fiscal year. Comparing the latest dividend announcements for the third calendar quarter in 2022 (paid in the fourth calendar quarter in 2022) with the payouts from the third calendar quarter in 2021, 81.78% of the constituents of the Underlying Index by weighting grew their dividends and 16.97% maintained their payouts based on weightings from November 30, 2022. Constituents that do not pay a dividend accounted for 1.25% of the Underlying Index.
During the fiscal year, DT Midstream (DTM), Delek Logistics Partners (DKL), and NextDecade (NEXT) were added to the Underlying Index and PBF Logistics LP (PBFX) and NGL Energy Partners (NGL) were removed from the Underlying Index during quarterly rebalancings. BP Midstream Partners LP (BPMP), Enable Midstream Partners (ENBL), Macquarie Infrastructure Holdings (MIC), Oasis Midstream Partners (OMP), Phillips 66 Partners (PSXP), Rattler Midstream (RTLR), and Shell Midstream Partners (SHLX) were removed from the Underlying Index in relation to their acquisition by another entity. There were no changes to the Underlying Index methodology during the period.
Energy infrastructure saw strong outperformance during the fiscal year, benefitting from macro and company-level tailwinds, even as the broader market was negatively impacted by inflation and rising interest rates. Constituents provide real asset exposure and often have annual inflation adjustments built into their contracts, both of which can be supportive in periods of elevated inflation as seen in 2022. Performance also benefitted from company-level tailwinds, as solid free cash flow generation fueled both dividend increases and buyback activity. As of November 30, 2022, 73.17% of the constituents of the AMEI by weighting had a buyback authorization.
Energy infrastructure corporations and MLPs continue to advance select growth opportunities, generally biased towards natural gas and natural gas liquids, while also positioning to participate in the evolving energy landscape. Constituents are pursuing opportunities related to carbon capture, hydrogen, and renewable fuels, which stand to benefit in the U.S. from provisions included in the Inflation Reduction Act. Multiple constituents have announced partnerships with household names like Shell, Chevron, and ExxonMobil and renewable energy leaders like Ørsted and Neste in support of providing cleaner energy. Alerian believes these partnerships reinforce the important role that energy infrastructure companies will play even as the energy complex changes over time.
Global energy markets have generally tightened as a result of sanctions applied to Russia in response to the ongoing war in Ukraine, but commodity prices have been volatile. Alerian believes energy infrastructure companies remain well positioned to weather potential volatility due to the fee-based nature of their cash flows, which should allow for free cash flow generation regardless of the commodity price backdrop. Excess cash flow is expected to continue supporting both dividend increases and buybacks, which could remain supportive for equity performance.
4 | November 30, 2022
Alerian Energy Infrastructure ETF
| Performance Overview | November 30, 2022 (Unaudited) |
Performance (as of November 30, 2022)
| | 1 Year | 5 Year | Since Inception^ |
| Alerian Energy Infrastructure ETF - NAV | 28.21% | 6.50% | 3.52% |
| Alerian Energy Infrastructure ETF - Market Price* | 28.37% | 6.55% | 3.54% |
| Alerian Midstream Energy Select Total Return Index | 29.16% | 7.45% | 4.42% |
| Alerian MLP Total Return Index | 42.25% | 6.06% | 0.29% |
Total Expense Ratio (per the current prospectus) is 0.35%.
Performance data quoted represents past performance. Past performance does not guarantee future results. Total return figures assume reinvestment of dividends and capital gains distributions, if any. The table does not reflect the deduction of taxes that a shareholder would pay on Fund distributions or the redemption of Fund shares. Investment return and principal value of an investment will fluctuate so that an investor’s shares, when sold or redeemed, may be worth more or less than the original cost. Current performance data may be higher or lower than actual data quoted. For most current month-end performance data please visit www.alpsfunds.com or call 1.866.759.5679.
Net Asset Value (NAV) is an exchange-traded fund’s per-share value. The per-share dollar amount of the Fund is derived by dividing the total value of all the securities in its portfolio, less any liabilities, by the number of Fund shares outstanding. Market Price is the price at which a share can currently be traded in the market. Information detailing the number of days the Market Price of the Fund was greater than the Fund’s NAV and the number of days it was less than the Fund’s NAV can be obtained at www.alpsfunds.com.
| ^ | The Fund commenced Investment Operations on November 1, 2013. |
| * | Market Price means the official closing price of a share or, if it more accurately reflects the market value of a share at the time as of which the Fund calculates current net asset value per share, the price that is the midpoint of the bid-ask spread as of that time. It does not represent the returns an investor would receive if shares were traded at other times. |
The Alerian Midstream Energy Select Total Return Index is comprised of 29 equity securities of issuers headquartered or incorporated in the United States and Canada that engage in the transportation, storage, and processing of energy commodities. Total return assumes reinvestment of any dividends and distributions realized during a given time period.
The Alerian MLP Total Return Index is recognized as a leading gauge of energy infrastructure Master Limited Partnerships (MLPs). The capped, float-adjusted, capitalization-weighted index, whose constituents earn the majority of their cash flow from midstream activities involving energy commodities, is reported on a total-return basis (AMZX), which assumes reinvestment of any dividends and distributions realized during a given period.
The indexes are not actively managed and do not reflect any deductions for fees, expenses or taxes. One cannot invest directly in an index. Index performance does not reflect fund performance.
The Fund’s shares are not individually redeemable. Investors buy and sell shares of the Fund on a secondary market. Only market makers or “authorized participants” may trade directly with the Fund, typically in blocks of 25,000 shares. The Alerian Energy Infrastructure ETF is not suitable for all investors.
Investments in the Fund are subject to investment risks, including possible loss of the principal amount invested. ALPS Portfolio Solutions Distributor, Inc., a FINRA member, is the distributor for the Fund.
5 | November 30, 2022
Alerian Energy Infrastructure ETF
| Performance Overview | November 30, 2022 (Unaudited) |
Top 10 Holdings* (as of November 30, 2022)
| Enbridge, Inc. | 9.78% |
| Enterprise Products Partners LP | 7.80% |
| Energy Transfer LP | 7.19% |
| Cheniere Energy, Inc. | 5.76% |
| TC Energy Corp. | 5.60% |
| Plains GP Holdings LP | 5.33% |
| The Williams Cos., Inc. | 5.28% |
| Pembina Pipeline Corp. | 4.90% |
| ONEOK, Inc. | 4.90% |
| Kinder Morgan, Inc. | 4.89% |
| Total % of Top 10 Holdings | 61.43% |
Future holdings are subject to change.
Growth of $10,000 (as of November 30, 2022)
Comparison of change in value of a $10,000 investment in the Fund and the Indexes

The chart above compares historical performance of a hypothetical investment of $10,000 in the Fund since inception with the performance of the Fund’s benchmark index. Results include the reinvestment of all dividends and capital gains distributions. Past performance does not guarantee future results. The chart does not reflect the deduction of taxes that a shareholder would pay on Fund distributions or the redemption of Fund shares.
6 | November 30, 2022
Alerian Exchange Traded Funds
| Disclosure of Fund Expenses | November 30, 2022 (Unaudited) |
Shareholder Expense Example: As a shareholder of a Fund, you incur certain ongoing costs, including management fees and other Fund expenses. These examples are intended to help you understand your ongoing costs (in dollars) of investing in the Fund and to compare these costs with the ongoing costs of investing in other funds. It is based on an investment of $1,000 invested at the beginning of the six month period and held through November 30, 2022.
Actual Return: The first line of the table provides information about actual account values and actual expenses. You may use the information in this line, together with the amount you invested, to estimate the expenses that you incurred over the period. Simply divide your account value by $1,000 (for example, an $8,600 account value divided by $1,000 = 8.6), then multiply the result by the number in the first line under the heading entitled “Expenses Paid During Period” to estimate the expenses attributable to your investment during this period.
Hypothetical 5% Return: The second line of the table provides information about hypothetical account values and hypothetical expenses based on the Fund’s actual expense ratio and an assumed rate of return of 5% per year before expenses, which is not the Fund’s actual return. The hypothetical account values and expenses may not be used to estimate the actual ending account balance or expenses you paid for the period. You may use this information to compare ongoing costs of investing in the Fund and other funds. To do so, compare this 5% hypothetical example with the 5% hypothetical examples that appear in the shareholder reports of other funds.
The expenses shown in the table are meant to highlight ongoing Fund costs only and do not reflect any transaction costs, such as brokerage commissions and other fees to financial intermediaries. Therefore, the second line is useful in comparing ongoing costs only, and will not help you determine the relative total costs of owning different funds. In addition, if these costs were included, your costs would have been higher.
| | Beginning Account Value 6/1/22 | Ending Account Value 11/30/22 | Expense Ratio(a) | Expenses Paid During Period 6/1/22 - 11/30/22(b) |
| Alerian MLP ETF(c) | | | | |
| Actual | $1,000.00 | $1,030.70 | 0.85% | $4.33 |
| Hypothetical (5% return before expenses) | $1,000.00 | $1,020.81 | 0.85% | $4.31 |
| | | | | |
| Alerian Energy Infrastructure ETF | | | | |
| Actual | $1,000.00 | $999.10 | 0.35% | $1.75 |
| Hypothetical (5% return before expenses) | $1,000.00 | $1,023.31 | 0.35% | $1.78 |
| (a) | Annualized, based on the Fund's most recent fiscal half-year expenses. |
| (b) | Expenses are equal to the Fund's annualized expense ratio multiplied by the average account value over the period, multiplied by the number of days in the most recent fiscal half year (183), divided by 365. |
| (c) | Expenses for Alerian MLP ETF are calculated using the Fund's annualized net expense ratio, which represents the ongoing expenses of the Fund. Current and deferred tax benefit (expense) is not included in the ratio calculation. |
7 | November 30, 2022
Alerian Exchange Traded Funds
Report of Independent Registered Public Accounting Firm
To the Board of Trustees of ALPS ETF Trust and the Shareholders of Alerian MLP ETF and Alerian Energy Infrastructure ETF:
Opinion on the Financial Statements
We have audited the accompanying statements of assets and liabilities of Alerian MLP ETF and Alerian Energy Infrastructure ETF, each a series of shares of beneficial interest in ALPS ETF Trust (the “Funds”), including the schedules of investments, as of November 30, 2022, and the related statements of operations and changes in net assets and the financial highlights for the year then ended, and the related notes (collectively referred to as the “financial statements”). In our opinion, the financial statements present fairly, in all material respects, the financial position of the Funds as of November 30, 2022, and the results of their operations, the changes in their net assets, and their financial highlights for the year then ended, in conformity with accounting principles generally accepted in the United States of America. The statements of changes in net assets for the year ended November 30, 2021 and the financial highlights for each of the years in the four-year period then ended were audited by other auditors whose report dated January 26, 2022, expressed an unqualified opinion on those financial statements and financial highlights.
Basis for Opinion
These financial statements are the responsibility of the Funds' management. Our responsibility is to express an opinion on the Funds’ financial statements based on our audits. We are a public accounting firm registered with the Public Company Accounting Oversight Board (United States) (“PCAOB”) and are required to be independent with respect to the Funds in accordance with the U.S. federal securities law and the applicable rules and regulations of the Securities and Exchange Commission and the PCAOB.
We conducted our audits in accordance with the standards of the PCAOB. Those standards require that we plan and perform the audits to obtain reasonable assurance about whether the financial statements are free of material misstatement, whether due to error or fraud. The Funds are not required to have, nor were we engaged to perform, an audit of their internal control over financial reporting. As part of our audits we are required to obtain an understanding of internal control over financial reporting but not for the purpose of expressing an opinion on the effectiveness of the Funds’ internal control over financial reporting. Accordingly, we express no such opinion.
Our audits included performing procedures to assess the risk of material misstatement of the financial statements, whether due to error or fraud, and performing procedures that respond to those risks. Such procedures included examining, on a test basis, evidence regarding the amounts and disclosures in the financial statements. Our procedures included confirmation of securities owned as of November 30, 2022 by correspondence with the custodian, brokers, or by other appropriate auditing procedures where replies from brokers were not received. Our audits also included evaluating the accounting principles used and significant estimates made by management, as well as evaluating the overall presentation of the financial statements. We believe that our audits provide a reasonable basis for our opinion.

BBD, LLP
We have served as the auditor of one or more of the Funds in the ALPS ETF Trust since 2022.
Philadelphia, Pennsylvania January 27, 2023
8 | November 30, 2022
Alerian MLP ETF
| Schedule of Investments | November 30, 2022 |
| Security Description | | Shares | | | Value | |
| MASTER LIMITED PARTNERSHIPS (103.86%) | | | | | | |
| Gathering + Processing (35.33%) | | | | | | |
| Crestwood Equity Partners LP(a) | | | 10,653,725 | $ | | | 315,563,335 | |
| DCP Midstream LP(a) | | | 13,557,968 | | | | 533,370,461 | |
| EnLink Midstream LLC(a) | | | 48,003,728 | | | | 617,327,942 | |
| Hess Midstream LP, Class A | | | 6,428,444 | | | | 200,760,306 | |
| Western Midstream Partners | | | | | | | | |
| LP(a) | | | 24,762,267 | | | | 692,848,231 | |
| Total Gathering + Processing | | | | | | | 2,359,870,275 | |
| | | | | | | | | |
| Liquefaction (6.10%) | | | | | | | | |
| Cheniere Energy Partners LP | | | 6,558,293 | | | | 407,138,828 | |
| Pipeline Transportation | Natural Gas (20.78%) | | | | | | | | |
| Energy Transfer LP | | | 59,403,896 | | | | 744,924,856 | |
| Enterprise Products Partners LP | | | 25,928,995 | | | | 643,298,366 | |
| Total Pipeline Transportation | Natural Gas | | | | | | | 1,388,223,222 | |
| | | | | | | | | |
| Pipeline Transportation | Petroleum (41.65%) | | | | | | | | |
| Delek Logistics Partners LP | | | 1,307,907 | | | | 66,964,839 | |
| Genesis Energy LP(a) | | | 16,303,586 | | | | 172,328,904 | |
| Holly Energy Partners LP(a) | | | 6,825,593 | | | | 127,775,101 | |
| Magellan Midstream Partners | | | | | | | | |
| LP(a) | | | 13,703,086 | | | | 722,152,632 | |
| MPLX LP | | | 21,062,358 | | | | 715,909,549 | |
| NuStar Energy LP(a) | | | 14,886,525 | | | | 243,096,953 | |
| Plains All American Pipeline | | | | | | | | |
| LP(a) | | | 59,046,913 | | | | 733,362,659 | |
| Total Pipeline Transportation | Petroleum | | | | | | | 2,781,590,637 | |
| | | | | | | | | |
| TOTAL MASTER LIMITED PARTNERSHIPS | | | | | | | | |
| (Cost $3,595,241,134) | | | | | | | 6,936,822,962 | |
| | | 7 Day Yield | | | Shares | | | Value | |
| SHORT TERM INVESTMENTS (0.09%) | | | | | | | | | | | | |
| State Street Institutional Treasury Plus Money Market Fund | | | 3.69 | % | | | 6,192,160 | | | | 6,192,160 | |
| | | | | | | | | | | | | |
| TOTAL SHORT TERM INVESTMENTS | | | | | | | | | | | | |
| (Cost $6,192,160) | | | | | | | | | | | 6,192,160 | |
| | | | | | | | | | | | | |
| TOTAL INVESTMENTS (103.95%) | | | | | | | | | | | | |
| (Cost $3,601,433,294) | | | | | | | | | | $ | 6,943,015,122 | |
| LIABILITIES IN EXCESS OF OTHER ASSETS (-3.95%) | | | | | | | | | | | (263,814,915 | ) |
| NET ASSETS - 100.00% | | | | | | | | | | $ | 6,679,200,207 | |
| (a) | Affiliated Company. See Note 8 in Notes to Financial Statement. |
See Notes to Financial Statements.
9 | November 30, 2022
Alerian MLP ETF
| Statement of Assets and Liabilities | November 30, 2022 |
| ASSETS: | | | |
| Investments, at value | | $ | 2,785,188,904 | |
| Investments in affiliates, at value | | | 4,157,826,218 | |
| Receivable for investments sold | | | 7,217,836 | |
| Receivable for shares sold | | | 13,005,057 | |
| Deferred tax asset (Note 2) | | | – | (a) |
| Franchise tax receivable | | | 341,759 | |
| Total Assets | | | 6,963,579,774 | |
| | | | | |
| LIABILITIES: | | | | |
| Payable for investments purchased | | | 12,998,766 | |
| Payable for shares redeemed | | | 7,208,233 | |
| Income tax payable | | | 23,727,994 | |
| Deferred tax liability | | | 235,679,812 | |
| Payable to adviser | | | 4,764,762 | |
| Total Liabilities | | | 284,379,567 | |
| NET ASSETS | | $ | 6,679,200,207 | |
| | | | | |
| NET ASSETS CONSIST OF: | | | | |
| Paid-in capital | | $ | 8,179,973,446 | |
| Distributable earnings/(accumulated losses) | | | (1,500,773,239 | ) |
| NET ASSETS | | $ | 6,679,200,207 | |
| | | | | |
| INVESTMENTS, AT COST | | $ | 1,483,905,084 | |
| INVESTMENTS IN AFFILIATES, AT COST | | | 2,117,528,210 | |
| | | | | |
| PRICING OF SHARES | | | | |
| Net Assets | | $ | 6,679,200,207 | |
| Shares of beneficial interest outstanding (Unlimited number of shares authorized, par value $0.01 per share) | | | 166,932,420 | |
| Net Asset Value, offering and redemption price per share | | $ | 40.01 | |
| (a) | Net Deferred Tax Asset of $23,979,665 is offset by a Valuation Allowance. |
See Notes to Financial Statements.
10 | November 30, 2022
Alerian MLP ETF
| Statement of Operations | For the Year Ended November 30, 2022 |
| INVESTMENT INCOME: | | | |
| Distributions from master limited partnerships | | $ | 474,028,106 | |
| Less return of capital distributions | | | (474,028,106 | ) |
| Total Investment Income | | | – | |
| | | | | |
| EXPENSES: | | | | |
| Franchise tax expense | | | 52,245 | |
| Investment adviser fee | | | 53,018,349 | |
| Total Expenses | | | 53,070,594 | |
| NET INVESTMENT LOSS, BEFORE INCOME TAXES | | | (53,070,594 | ) |
| Current income tax benefit/(expense) | | | 6,802,187 | |
| NET INVESTMENT LOSS | | | (46,268,407 | ) |
| | | | | |
| REALIZED AND UNREALIZED GAIN/(LOSS): | | | | |
| Net realized gain on investments, before income taxes | | | 172,861,747 | |
| Net realized loss on affiliated investments, before income taxes | | | (117,676,258 | ) |
| Current income tax benefit/(expense) | | | (7,073,259 | ) |
| Net realized gain | | | 48,112,230 | |
| Net change in unrealized appreciation on investments, before income taxes | | | 699,452,270 | |
| Net change in unrealized appreciation on affiliated investments, before income taxes | | | 1,331,918,894 | |
| Deferred income tax benefit/(expense) | | | (260,365,792 | ) |
| Net change in unrealized appreciation | | | 1,771,005,372 | |
| NET REALIZED AND UNREALIZED GAIN ON INVESTMENTS | | | 1,819,117,602 | |
| NET INCREASE IN NET ASSETS RESULTING FROM OPERATIONS | | $ | 1,772,849,195 | |
See Notes to Financial Statements.
11 | November 30, 2022
Alerian MLP ETF
Statements of Changes in Net Assets
| | | For the Year Ended November 30, 2022 | | | For the Year Ended November 30, 2021 | |
| OPERATIONS: | | | | | | | | |
| Net investment loss | | $ | (46,268,407 | ) | | $ | (43,507,191 | ) |
| Net realized gain/(loss) | | | 48,112,230 | | | | (451,685,458 | ) |
| Net change in unrealized appreciation | | | 1,771,005,372 | | | | 1,975,726,648 | |
| Net increase in net assets resulting from operations | | | 1,772,849,195 | | | | 1,480,533,999 | |
| | | | | | | | | |
| DISTRIBUTIONS TO SHAREHOLDERS: | | | | | | | | |
| From tax return of capital | | | (491,866,741 | ) | | | (444,037,776 | ) |
| Total distributions | | | (491,866,741 | ) | | | (444,037,776 | ) |
| | | | | | | | | |
| CAPITAL SHARE TRANSACTIONS: | | | | | | | | |
| Proceeds from sale of shares | | | 2,448,152,574 | | | | 1,051,399,959 | |
| Cost of shares redeemed | | | (2,030,110,111 | ) | | | (987,858,170 | ) |
| Net increase from share transactions | | | 418,042,463 | | | | 63,541,789 | |
| | | | | | | | | |
| Net increase in net assets | | | 1,699,024,917 | | | | 1,100,038,012 | |
| | | | | | | | | |
| NET ASSETS: | | | | | | | | |
| Beginning of year | | | 4,980,175,290 | | | | 3,880,137,278 | |
| End of year | | $ | 6,679,200,207 | | | $ | 4,980,175,290 | |
| | | | | | | | | |
| OTHER INFORMATION: | | | | | | | | |
| SHARE TRANSACTIONS: | | | | | | | | |
| Beginning shares | | | 157,457,420 | | | | 155,057,420 | |
| Shares sold | | | 64,300,000 | | | | 33,250,000 | |
| Shares redeemed | | | (54,825,000 | ) | | | (30,850,000 | ) |
| Shares outstanding, end of year | | | 166,932,420 | | | | 157,457,420 | |
See Notes to Financial Statements.
12 | November 30, 2022
Alerian MLP ETF
| Financial Highlights | For a Share Outstanding Throughout the Periods Presented |
| | | For the Year Ended November 30, 2022 | | | For the Year Ended November 30, 2021 | | | For the Year Ended November
30, 2020 (a) | | | For the Year Ended November
30, 2019 (a) | | | For the Year Ended November
30, 2018 (a) | |
| NET ASSET VALUE, BEGINNING OF PERIOD | | $ | 31.63 | | | $ | 25.02 | | | $ | 39.15 | | | $ | 47.75 | | | $ | 51.85 | |
| | | | | | | | | | | | | | | | | | | | | |
| INCOME/(LOSS) FROM OPERATIONS: | | | | | | | | | | | | | | | | | | | | |
| Net investment loss(b) | | | (0.28 | ) | | | (0.27 | ) | | | (0.24 | ) | | | (0.35 | ) | | | (0.45 | ) |
| Net realized and unrealized gain/(loss) on investments | | | 11.59 | | | | 9.68 | | | | (10.73 | ) | | | (4.35 | ) | | | 0.40 | |
| Total from investment operations | | | 11.31 | | | | 9.41 | | | | (10.97 | ) | | | (4.70 | ) | | | (0.05 | ) |
| | | | | | | | | | | | | | | | | | | | | |
| DISTRIBUTIONS: | | | | | | | | | | | | | | | | | | | | |
| From net realized gains | | | – | | | | – | | | | – | | | | – | | | | (4.05 | ) |
| From tax return of capital | | | (2.93 | ) | | | (2.80 | ) | | | (3.16 | ) | | | (3.90 | ) | | | – | |
| Total distributions | | | (2.93 | ) | | | (2.80 | ) | | | (3.16 | ) | | | (3.90 | ) | | | (4.05 | ) |
| | | | | | | | | | | | | | | | | | | | | |
| NET INCREASE/(DECREASE) IN NET ASSET VALUE | | | 8.38 | | | | 6.61 | | | | (14.13 | ) | | | (8.60 | ) | | | (4.10 | ) |
| NET ASSET VALUE, END OF PERIOD | | $ | 40.01 | | | $ | 31.63 | | | $ | 25.02 | | | $ | 39.15 | | | $ | 47.75 | |
| TOTAL RETURN(c) | | | 36.31 | % | | | 37.97 | % | | | (28.36 | )% | | | (10.79 | )% | | | (0.55 | )% |
| | | | | | | | | | | | | | | | | | | | | |
| RATIOS/SUPPLEMENTAL DATA: | | | | | | | | | | | | | | | | | | | | |
| Net assets, end of period (000s) | | $ | 6,679,200 | | | $ | 4,980,175 | | | $ | 3,880,137 | | | $ | 7,249,005 | | | $ | 8,699,748 | |
| | | | | | | | | | | | | | | | | | | | | |
| RATIO TO AVERAGE NET ASSETS: | | | | | | | | | | | | | | | | | | | | |
| Expenses (excluding net current and deferred tax expenses/benefits and franchise tax expense) | | | 0.85 | % | | | 0.85 | % | | | 0.85 | % | | | 0.85 | % | | | 0.85 | % |
| Expenses (including current and deferred tax expenses/benefits)(d) | | | 0.74 | % | | | 0.85 | % | | | 0.85 | % | | | 0.85 | % | | | 0.85 | % |
| Expenses (including net current and deferred tax expenses/benefits)(e) | | | 5.03 | % | | | 0.87 | % | | | 0.90 | % | | | 0.87 | % | | | 0.85 | % |
| Net investment loss (excluding deferred tax expenses/benefits and franchise tax expense) | | | (0.85 | )% | | | (0.85 | )% | | | (0.85 | )% | | | (0.77 | )% | | | (0.85 | )% |
| Net investment loss (including deferred tax expenses/benefits)(d) | | | (0.74 | )% | | | (0.85 | )% | | | (0.85 | )% | | | (0.77 | )% | | | (0.85 | )% |
| PORTFOLIO TURNOVER RATE(f) | | | 26 | % | | | 20 | % | | | 23 | % | | | 34 | % | | | 26 | % |
| (a) | On May 18, 2020, the Alerian MLP ETF underwent a one for five reverse stock split. The capital share activity presented here has been retroactively adjusted to reflect this reverse split. |
| (b) | Based on average shares outstanding during the period. |
| (c) | Total return is calculated assuming an initial investment made at the net assets value at the beginning of the period and redemption at the net asset value on the last day of the period and assuming all distributions are reinvested at actual reinvestment prices. Total return calculated for a period of less than one year is not annualized. |
| (d) | Includes amount of current and deferred tax benefit associated with net investment income/(loss). |
| (e) | Includes amount of current and deferred income tax expense/benefit for all components of the Statement of Operations, including amounts associated with realized and unrealized gain/(loss). |
| (f) | Portfolio turnover for periods less than one year is not annualized and does not include securities received or delivered from processing creations or redemptions in-kind. |
See Notes to Financial Statements.
13 | November 30, 2022
Alerian Energy Infrastructure ETF
| Schedule of Investments | November 30, 2022 |
| Security Description | | | Shares | | | | Value | |
| CANADIAN ENERGY INFRASTRUCTURE COMPANIES (26.58%) | | | | | | | | |
| Gathering + Processing (4.17%) Keyera Corp. | | | 254,646 | | | $ | 5,932,874 | |
| | | | | | | | | |
| Pipeline Transportation | Natural Gas (5.60%) | | | | | | | | |
| TC Energy Corp.(a) | | | 179,442 | | | | 7,950,595 | |
| | | | | | | | | |
| Pipeline Transportation | Petroleum (14.66%) | | | | | | | | |
| Enbridge, Inc. | | | 335,993 | | | | 13,875,339 | |
| Pembina Pipeline Corp. | | | 190,404 | | | | 6,951,448 | |
| Total Pipeline Transportation | | | | | | | | | |
| Petroleum | | | | | | | 20,826,787 | |
| | | | | | | | | |
| Storage (2.15%) | | | | | | | | |
| Gibson Energy, Inc. | | | 168,476 | | | | 3,057,279 | |
| | | | | | | | | |
| TOTAL CANADIAN ENERGY INFRASTRUCTURE COMPANIES | | | | | | | | |
| (Cost $38,238,443) | | | | | | | 37,767,535 | |
| Security Description | | | Shares | | | | Value | |
| EXCHANGE TRADED FUND (1.18%) | | | | | | | | |
| Exchange Traded Fund (1.18%) | | | | | | | | |
| Energy Select Sector SPDR Fund | | | 18,320 | | | | 1,669,868 | |
| | | | | | | | | |
| TOTAL EXCHANGE TRADED FUND | | | | | | | | |
| (Cost $1,670,005) | | | | | | | 1,669,868 | |
| Security Description | | | Shares | | | | Value | |
| U.S. ENERGY INFRASTRUCTURE COMPANIES (29.95%) | | | | | | | | |
| Gathering + Processing (10.17%) | | | | | | | | |
| Kinetik Holdings, Inc.(a) | | | 16,806 | | | | 571,908 | |
| ONEOK, Inc. | | | 103,847 | | | | 6,949,441 | |
| Targa Resources Corp. | | | 93,124 | | | | 6,927,494 | |
| Total Gathering + Processing | | | | | | | 14,448,843 | |
| | | | | | | | | |
| Liquefaction (6.99%) | | | | | | | | |
| Cheniere Energy, Inc. | | | 46,604 | | | | 8,172,478 | |
| NextDecade Corp.(a)(b) | | | 35,517 | | | | 192,857 | |
| Tellurian, Inc.(a)(b) | | | 585,141 | | | | 1,574,030 | |
| Total Liquefaction | | | | | | | 9,939,365 | |
| | | | | | | | | |
| Pipeline Transportation | Natural Gas | | | | | | | | |
| (12.79%) | | | | | | | | |
| DT Midstream, Inc. | | | 111,898 | | | | 6,750,806 | |
| Equitrans Midstream Corp. | | | 532,866 | | | | 4,470,746 | |
| Kinder Morgan, Inc. | | | 363,215 | | | | 6,944,671 | |
| Total Pipeline Transportation | Natural | | | | | | | | |
| Gas | | | | | | | 18,166,223 | |
| | | | | | | | | |
| TOTAL U.S. ENERGY INFRASTRUCTURE COMPANIES | | | | | | | | |
| (Cost $34,685,184) | | | | | | | 42,554,431 | |
| Security Description | | Shares | | | Value | |
| U.S. ENERGY INFRASTRUCTURE MLPS (25.17%) | | | | | | | | |
| Gathering + Processing (6.29%) | | | | | | | | |
| Crestwood Equity Partners LP | | | 26,341 | | | $ | 780,221 | |
| Hess Midstream LP, Class A | | | 49,479 | | | | 1,545,229 | |
| MPLX LP | | | 134,806 | | | | 4,582,056 | |
| Western Midstream Partners LP | | | 72,694 | | | | 2,033,978 | |
| Total Gathering + Processing | | | | | | | 8,941,484 | |
| | | | | | | | | |
Pipeline Transportation | Natural Gas (14.97%) | | | | | | | | |
| Energy Transfer LP | | | 813,580 | | | | 10,202,293 | |
| Enterprise Products Partners LP | | | 446,126 | | | | 11,068,386 | |
| Total Pipeline Transportation | Natural Gas | | | | | | | 21,270,679 | |
| | | | | | | | | |
| Pipeline Transportation | Petroleum (3.91%) | | | | | | | | |
| Delek Logistics Partners LP | | | 3,256 | | | | 166,707 | |
| Genesis Energy LP | | | 40,270 | | | | 425,654 | |
| Holly Energy Partners LP | | | 16,869 | | | | 315,788 | |
| Magellan Midstream Partners LP | | | 76,707 | | | | 4,042,459 | |
| NuStar Energy LP | | | 36,756 | | | | 600,225 | |
| Total Pipeline Transportation | Petroleum | | | | | | | 5,550,833 | |
| | | | | | | | | |
| TOTAL U.S. ENERGY INFRASTRUCTURE MLPS | | | | | | | | |
| (Cost $33,848,420) | | | | | | | 35,762,996 | |
| Security Description | | Shares | | | Value | |
| U.S. GENERAL PARTNERS (16.91%) | | | | | | | | |
| Gathering + Processing (11.59%) | | | | | | | | |
| Antero Midstream Corp. | | | 371,468 | | | | 4,208,732 | |
| EnLink Midstream LLC | | | 370,516 | | | | 4,764,836 | |
| The Williams Cos., Inc. | | | 215,864 | | | | 7,490,481 | |
| Total Gathering + Processing | | | | | | | 16,464,049 | |
| | | | | | | | | |
| Pipeline Transportation | Petroleum (5.32%) | | | | | | | | |
| Plains GP Holdings LP, Class A | | | 571,775 | | | | 7,564,583 | |
| | | | | | | | | |
| TOTAL U.S. GENERAL PARTNERS | | | | | | | | |
| (Cost $18,530,498) | | | | | | | 24,028,632 | |
See Notes to Financial Statements.
14 | November 30, 2022
Alerian Energy Infrastructure ETF
| Schedule of Investments | November 30, 2022 |
| | | 7 Day Yield | | | Shares | | | Value | |
| SHORT TERM INVESTMENTS (6.23%) | | | | | | | | | | | | |
| Money Market Fund (0.07%) | | | | | | | | | | | | |
| State Street Institutional Treasury Plus Money Market Fund (Premier Class) | | | | | | | | | | | | |
| (Cost $103,924) | | | 3.69 | % | | | 103,924 | | | $ | 103,924 | |
| | | | | | | | | | | | | |
| Investments Purchased with Collateral from Securities Loaned (6.16%) | | | | | | | | | | | | |
| State Street Navigator Securities Lending Government Money Market Portfolio, 3.86% (Cost $8,752,373) | | | | | | | 8,752,373 | | | | 8,752,373 | |
| TOTAL SHORT TERM INVESTMENTS | | | | | | | | | | | | |
| (Cost $8,856,297) | | | | | | | | | | | 8,856,297 | |
| | | | | | | | | | | | | |
| TOTAL INVESTMENTS (106.02%) | | | | | | | | | | | | |
| (Cost $135,828,847) | | | | | | | | | | $ | 150,639,759 | |
| LIABILITIES IN EXCESS OF OTHER ASSETS (-6.02%) | | | | | | | | | | | (8,553,833 | ) |
| NET ASSETS - 100.00% | | | | | | | | | | $ | 142,085,926 | |
| (a) | Security, or a portion of the security position is currently on loan. The total market value of securities on loan is $8,851,198 |
| (b) | Non-income producing security. |
See Notes to Financial Statements.
15 | November 30, 2022
Alerian Energy Infrastructure ETF
| Statement of Assets and Liabilities | November 30, 2022 |
| ASSETS: | | | |
| Investments, at value* | | $ | 150,639,759 | |
| Receivable for investments sold | | | 1,675,643 | |
| Dividends receivable | | | 231,954 | |
| Total Assets | | | 152,547,356 | |
| | | | | |
| LIABILITIES: | | | | |
| Payable for investments purchased | | | 1,670,005 | |
| Payable to adviser | | | 39,052 | |
| Payable for collateral upon return of securities loaned | | | 8,752,373 | |
| Total Liabilities | | | 10,461,430 | |
| NET ASSETS | | $ | 142,085,926 | |
| | | | | |
| NET ASSETS CONSIST OF: | | | | |
| Paid-in capital | | $ | 132,332,363 | |
| Distributable earnings | | | 9,753,563 | |
| NET ASSETS | | $ | 142,085,926 | |
| | | | | |
| INVESTMENTS, AT COST | | $ | 135,828,847 | |
| | | | | |
| PRICING OF SHARES | | | | |
| Net Assets | | $ | 142,085,926 | |
| Shares of beneficial interest outstanding (Unlimited number of shares authorized, par value $0.01 per share) | | | 6,275,000 | |
| Net Asset Value, offering and redemption price per share | | $ | 22.64 | |
* Includes $8,851,198 of securities on loan.
See Notes to Financial Statements.
16 | November 30, 2022
Alerian Energy Infrastructure ETF
| Statement of Operations | For the Year Ended November 30, 2022 |
| INVESTMENT INCOME: | | | |
| Dividends* | | $ | 3,304,329 | |
| Securities lending income | | | 6,423 | |
| Total Investment Income | | | 3,310,752 | |
| | | | | |
| EXPENSES: | | | | |
| Investment adviser fees | | | 362,953 | |
| Total Expenses | | | 362,953 | |
| NET INVESTMENT INCOME | | | 2,947,799 | |
| | | | | |
| REALIZED AND UNREALIZED GAIN/(LOSS): | | | | |
| Net realized gain on investments(a) | | | 809,795 | |
| Net realized loss on foreign currency transactions | | | (5,861 | ) |
| Net realized gain | | | 803,934 | |
| Net change in unrealized appreciation on investments | | | 17,049,732 | |
| Net change in unrealized appreciation on translation of assets and liabilities denominated in foreign currencies | | | 540 | |
| Net change in unrealized appreciation | | | 17,050,272 | |
| NET REALIZED AND UNREALIZED GAIN ON INVESTMENTS AND FOREIGN CURRENCIES | | | 17,854,206 | |
| NET INCREASE IN NET ASSETS RESULTING FROM OPERATIONS | | $ | 20,802,005 | |
| * Net of foreign tax withholding. | | $ | 266,349 | |
| (a) | Includes realized gain or loss as a result of in-kind transactions (See Note 4 in Notes to Financial Statements). |
See Notes to Financial Statements.
17 | November 30, 2022
Alerian Energy Infrastructure ETF
| Statements of Changes in Net Assets |
| | | For the Year Ended November 30, 2022 | | | For the Year Ended November 30, 2021 | |
| OPERATIONS: | | | | | | | | |
| Net investment income | | $ | 2,947,799 | | | $ | 3,334,283 | |
| Net realized gain/(loss) | | | 803,934 | | | | (5,679,007 | ) |
| Net change in unrealized appreciation | | | 17,050,272 | | | | 18,196,470 | |
| Net increase in net assets resulting from operations | | | 20,802,005 | | | | 15,851,746 | |
| | | | | | | | | |
| DISTRIBUTIONS: | | | | | | | | |
| From distributable earnings | | | (1,089,790 | ) | | | (2,301,342 | ) |
| From tax return of capital | | | (4,610,796 | ) | | | (2,346,411 | ) |
| Total distributions | | | (5,700,586 | ) | | | (4,647,753 | ) |
| | | | | | | | | |
| CAPITAL SHARE TRANSACTIONS: | | | | | | | | |
| Proceeds from sale of shares | | | 79,527,083 | | | | 22,119,720 | |
| Cost of shares redeemed | | | (12,029,422 | ) | | | (10,825,316 | ) |
| Net increase from share transactions | | | 67,497,661 | | | | 11,294,404 | |
| Net increase in net assets | | | 82,599,080 | | | | 22,498,397 | |
| | | | | | | | | |
| NET ASSETS: | | | | | | | | |
| Beginning of year | | | 59,486,846 | | | | 36,988,449 | |
| End of year | | $ | 142,085,926 | | | $ | 59,486,846 | |
| | | | | | | | | |
| OTHER INFORMATION: | | | | | | | | |
| CAPITAL SHARE TRANSACTIONS: | | | | | | | | |
| Beginning shares | | | 3,200,000 | | | | 2,550,000 | |
| Shares sold | | | 3,650,000 | | | | 1,250,000 | |
| Shares redeemed | | | (575,000 | ) | | | (600,000 | ) |
| Shares outstanding, end of year | | | 6,275,000 | | | | 3,200,000 | |
See Notes to Financial Statements.
18 | November 30, 2022
Alerian Energy Infrastructure ETF
| Financial Highlights | For a Share Outstanding Throughout the Periods Presented |
| | | For the Year Ended November 30, 2022 | | | For the Year Ended November 30, 2021 | | | For the Year Ended November 30, 2020 | | | For the Year Ended November 30, 2019 | | | For the Year Ended November 30, 2018 | |
| NET ASSET VALUE, BEGINNING OF PERIOD | | $ | 18.59 | | | $ | 14.51 | | | $ | 19.19 | | | $ | 20.34 | | | $ | 22.30 | |
| | | | | | | | | | | | | | | | | | | | | |
| INCOME/(LOSS) FROM INVESTMENT OPERATIONS: | | | | | | | | | | | | | | | | | | | | |
| Net investment income(a) | | | 0.61 | | | | 1.08 | | | | 0.90 | | | | 0.88 | | | | 0.85 | |
| Net realized and unrealized gain/(loss) on investments | | | 4.57 | | | | 4.49 | | | | (4.50 | ) | | | (0.64 | ) | | | (2.23 | ) |
| Total from investment operations | | | 5.18 | | | | 5.57 | | | | (3.60 | ) | | | 0.24 | | | | (1.38 | ) |
| | | | | | | | | | | | | | | | | | | | | |
| DISTRIBUTIONS: | | | | | | | | | | | | | | | | | | | | |
| From net investment income | | | (0.21 | ) | | | (0.74 | ) | | | (0.45 | ) | | | (0.50 | ) | | | (0.47 | ) |
| Tax return of capital | | | (0.92 | ) | | | (0.75 | ) | | | (0.63 | ) | | | (0.89 | ) | | | (0.11 | ) |
| Total distributions | | | (1.13 | ) | | | (1.49 | ) | | | (1.08 | ) | | | (1.39 | ) | | | (0.58 | ) |
| | | | | | | | | | | | | | | | | | | | | |
| NET INCREASE/(DECREASE) IN NET ASSET VALUE | | | 4.05 | | | | 4.08 | | | | (4.68 | ) | | | (1.15 | ) | | | (1.96 | ) |
| NET ASSET VALUE, END OF PERIOD | | $ | 22.64 | | | $ | 18.59 | | | $ | 14.51 | | | $ | 19.19 | | | $ | 20.34 | |
| TOTAL RETURN(b) | | | 28.21 | % | | | 38.93 | % | | | (18.82 | )% | | | 1.09 | % | | | (6.27 | )% |
| | | | | | | | | | | | | | | | | | | | | |
| RATIOS/SUPPLEMENTAL DATA: | | | | | | | | | | | | | | | | | | | | |
| Net assets, end of period (000s) | | $ | 142,086 | | | $ | 59,487 | | | $ | 36,988 | | | $ | 51,809 | | | $ | 41,699 | |
| | | | | | | | | | | | | | | | | | | | | |
| Ratio of expenses to average net assets | | | 0.35 | % | | | 0.51 | %(c) | | | 0.65 | % | | | 0.65 | % | | | 0.65 | % |
| Ratio of net investment income to average net assets | | | 2.84 | % | | | 5.84 | % | | | 5.91 | % | | | 4.23 | % | | | 3.86 | % |
| PORTFOLIO TURNOVER RATE(d) | | | 26 | % | | | 34 | % | | | 34 | % | | | 26 | % | | | 73 | % |
| (a) | Based on average shares outstanding during the period. |
| (b) | Total return is calculated assuming an initial investment made at the net assets value at the beginning of the period and redemption at the net asset value on the last day of the period and assuming all distributions are reinvested at actual reinvestment prices. Total return calculated for a period of less than one year is not annualized. |
| (c) | Effective July 1, 2021, the Fund's Advisory Fee changed from 0.65% to 0.35%. |
| (d) | Portfolio turnover for periods less than one year is not annualized and does not include securities received or delivered from processing creations or redemptions in-kind. |
See Notes to Financial Statements.
19 | November 30, 2022
Alerian Exchange Traded Funds
| Notes to Financial Statements | November 30, 2022 |
1. ORGANIZATION
ALPS ETF Trust (the “Trust”), a Delaware statutory trust, is an open-end management investment company registered under the Investment Company Act of 1940, as amended (the “1940 Act”). As of November 30, 2022, the Trust consisted of twenty-three separate portfolios. Each portfolio represents a separate series of the Trust. This report pertains to the Alerian MLP ETF and the Alerian Energy Infrastructure ETF (each a “Fund” and collectively, the “Funds”).
The investment objective of the Alerian MLP ETF is to seek investment results that correspond (before fees and expenses) generally to the price and yield performance of its underlying index, the Alerian MLP Infrastructure Index. The investment objective of the Alerian Energy Infrastructure ETF is to seek investment results that correspond (before fees and expenses) generally to the price and yield performance of its underlying index, the Alerian Midstream Energy Select Index. The investment advisor uses a “passive management” or indexing investment approach to try to achieve each Fund’s investment objective. Each Fund is considered non-diversified and may invest a greater portion of assets in securities of individual issuers than a diversified fund. As a result, changes in the market value of a single investment could cause greater fluctuations in share price than would occur in a diversified fund.
Each Fund’s Shares (“Shares”) are listed on the NYSE Arca, Inc. (the “NYSE Arca”). Each Fund issues and redeems Shares, at net asset value (“NAV”), in blocks of 25,000 Shares, each of which is called a “Creation Unit”. Creation Units are issued and redeemed principally in-kind for securities included in the Underlying Index. Except when aggregated in Creation Units, Shares are not redeemable securities of the Fund.
Pursuant to the Trust’s organizational documents, its Officers and Trustees are indemnified against certain liability arising out of the performance of their duties to the Trust. Additionally, in the normal course of business, the Trust enters into contracts with service providers that contain general indemnification clauses. The Trust’s maximum exposure under these arrangements is unknown, as this would involve future claims that may be made against the Trust that have not yet occurred.
2. SIGNIFICANT ACCOUNTING POLICIES
The following is a summary of significant accounting policies consistently followed by the Funds in the preparation of the financial statements. The accompanying financial statements were prepared in accordance with accounting principles generally accepted in the United States of America (“U.S. GAAP”). The preparation of financial statements in conformity with U.S. GAAP requires management to make certain estimates and assumptions that affect the reported amounts of assets and liabilities and disclosures of contingent assets and liabilities at the date of the financial statements and the reported amounts of revenue and expenses during the period. Actual results could differ from those estimates. Each Fund is considered an investment company under U.S. GAAP and follows the accounting and reporting guidance applicable to investment companies in the Financial Accounting Standards Board (“FASB”) Accounting Standards Codification Topic 946.
A. Portfolio Valuation
Each Fund’s NAV is determined daily, as of the close of regular trading on the New York Stock Exchange (“NYSE”), normally 4:00 p.m. Eastern Time, on each day the NYSE is open for trading. The NAV is computed by dividing the value of all assets of the Fund (including accrued interest and dividends), less all liabilities (including accrued expenses and dividends declared but unpaid), by the total number of shares outstanding.
Portfolio securities listed on any exchange other than the NASDAQ Stock Market LLC (“NASDAQ”) are valued at the last sale price on the business day as of which such value is being determined. If there has been no sale on such day, the securities are valued at the mean of the most recent bid and ask prices on such day. Securities traded on the NASDAQ are valued at the NASDAQ Official Closing Price as determined by NASDAQ. Portfolio securities traded on more than one securities exchange are valued at the last sale price on the business day as of which such value is being determined at the close of the exchange representing the principal market for such securities. Portfolio securities traded in the over-the-counter market, but excluding securities traded on the NASDAQ, are valued at the last quoted sale price in such market.
The Funds’ investments are valued at market value or, in the absence of market value with respect to any portfolio securities, at fair value according to procedures adopted by the Trust’s Board of Trustees (the “Board”). Pursuant to Rule 2a-5 under the 1940 Act, the Board designated ALPS Advisors, Inc. (the "Adviser") as the valuation designee ("Valuation Designee") for each Fund to perform the fair value determinations relating to Fund investments. The Adviser may carry out its designated responsibilities as Valuation Designee through various teams and committees. When market quotations are not readily available or when events occur that make established valuation methods unreliable, securities of the Funds may be valued in good faith by the Valuation Designee. These securities generally include, but are not limited to, restricted securities (securities which may not be publicly sold without registration under the Securities Act of 1933) for which a pricing service is unable to provide a market price; securities whose trading has been formally suspended; a security whose market price is not available from a pre-established primary pricing source or the pricing source is not willing to provide a price; a security with respect to which an event has occurred that is most likely to materially affect the value of the security after the market has closed but before the calculation of the Funds’ NAV or make it difficult or impossible to obtain a reliable market quotation; or a security whose price, as provided by the pricing service, does not reflect the security’s “fair value” due to the security being de-listed from a national exchange or the security’s primary trading market is temporarily closed at a time when, under normal conditions, it would be open. As a general principle, the current “fair value” of a security would be the amount which the owner might reasonably expect to receive from the sale on the applicable exchange or principal market. A variety of factors may be considered in determining the fair value of such securities.
20 | November 30, 2022
Alerian Exchange Traded Funds
| Notes to Financial Statements | November 30, 2022 |
B. Fair Value Measurements
Each Fund discloses the classification of its fair value measurements following a three-tier hierarchy based on the inputs used to measure fair value. Inputs refer broadly to the assumptions that market participants would use in pricing the asset or liability, including assumptions about risk. Inputs may be observable or unobservable. Observable inputs reflect the assumptions market participants would use in pricing the asset or liability that are developed based on market data obtained from sources independent of the reporting entity. Unobservable inputs reflect the reporting entity’s own assumptions about the assumptions market participants would use in pricing the asset or liability that are developed based on the best information available.
Valuation techniques used to value the Funds’ investments by major category are as follows:
Equity securities, including restricted securities, and Limited Partnerships for which market quotations are readily available, are valued at the last reported sale price or official closing price as reported by a third party pricing vendor on the primary market or exchange on which they are traded and are categorized as Level 1 in the hierarchy. In the event there were no sales during the day or closing prices are not available, securities are valued at the mean of the most recent quoted bid and ask prices on such day and are generally categorized as Level 2 in the hierarchy. Investments in open-end mutual funds are valued at their closing NAV each business day and are categorized as Level 1 in the hierarchy.
Changes in valuation techniques may result in transfers in or out of an assigned level within the disclosure hierarchy.
Various inputs are used in determining the value of the Funds’ investments as of the end of the reporting period. When inputs used fall into different levels of the fair value hierarchy, the level in the hierarchy within which the fair value measurement falls is determined based on the lowest level input that is significant to the fair value measurement in its entirety. The designated input levels are not necessarily an indication of the risk or liquidity associated with these investments.
These inputs are categorized in the following hierarchy under applicable financial accounting standards:
| Level 1 | – | Unadjusted quoted prices in active markets for identical investments, unrestricted assets or liabilities that a Fund has the ability to access at the measurement date; |
| Level 2 | – | Quoted prices which are not active, quoted prices for similar assets or liabilities in active markets or inputs other than quoted prices that are observable (either directly or indirectly) for substantially the full term of the asset or liability; and |
| Level 3 | – | Significant unobservable prices or inputs (including the Fund’s own assumptions in determining the fair value of investments) where there is little or no market activity for the asset or liability at the measurement date. |
The following is a summary of the inputs used to value each Fund’s investments as of November 30, 2022:
Alerian MLP ETF
| Investments in Securities at Value | | Level 1 - Quoted and Unadjusted Prices | | | Level 2 - Other Significant
Observable Inputs | | | Level 3 - Significant
Unobservable Inputs | | | Total | |
| Master Limited Partnerships* | | $ | 6,936,822,962 | | | $ | – | | | $ | – | | | $ | 6,936,822,962 | |
| Short Term Investments | | | 6,192,160 | | | | – | | | | – | | | | 6,192,160 | |
| Total | | $ | 6,943,015,122 | | | $ | – | | | $ | – | | | $ | 6,943,015,122 | |
21 | November 30, 2022
Alerian Exchange Traded Funds
| Notes to Financial Statements | November 30, 2022 |
Alerian Energy Infrastructure ETF
| Investments in Securities at Value | | Level 1 - Quoted and Unadjusted Prices | | | Level 2 - Other Significant Observable Inputs | | | Level 3 - Significant Unobservable Inputs | | | Total | |
| Canadian Energy Infrastructure Companies* | | $ | 37,767,535 | | | $ | – | | | $ | – | | | $ | 37,767,535 | |
| Exchange Traded Fund | | | 1,669,868 | | | | – | | | | – | | | | 1,669,868 | |
| U.S. Energy Infrastructure Companies* | | | 42,554,431 | | | | – | | | | – | | | | 42,554,431 | |
| U.S. Energy Infrastructure MLPs* | | | 35,762,996 | | | | – | | | | – | | | | 35,762,996 | |
| U.S. General Partners* | | | 24,028,632 | | | | – | | | | – | | | | 24,028,632 | |
| Short Term Investments | | | 8,856,297 | | | | – | | | | – | | | | 8,856,297 | |
| Total | | $ | 150,639,759 | | | $ | – | | | $ | – | | | $ | 150,639,759 | |
| * | For a detailed breakdown of sectors, see the accompanying Schedule of Investments. |
The Funds did not have any securities that used significant unobservable inputs (Level 3) in determining fair value and there were no transfers into or out of Level 3 during the year ended November 30, 2022.
C. Foreign Currency Translation
The books and records of the Funds are maintained in U.S. dollars. Investment valuations and other assets and liabilities initially expressed in foreign currencies are converted each business day into U.S. dollars based upon current exchange rates. The portion of realized and unrealized gains or losses on investments due to fluctuations in foreign currency exchange rates is not separately disclosed and is included in realized and unrealized gains or losses on investments, when applicable.
D. Securities Transactions and Investment Income
Securities transactions are recorded as of the trade date. Realized gains and losses from securities transactions are recorded on the specific identification in accordance with GAAP. Dividend income and capital gains distributions, if any, are recorded on the ex-dividend date, net of any foreign taxes withheld. Interest income, if any, is recorded on the accrual basis, including amortization of premiums and accretion of discounts.
E. Dividends and Distributions to Shareholders
Each Fund intends to declare and make quarterly distributions, or as the Board may determine from time to time. Distributions of net realized capital gains earned by the Alerian Energy Infrastructure ETF, if any, are distributed at least annually. Distributions from net investment income and capital gains are determined in accordance with income tax regulations, which may differ from U.S. GAAP. These differences are primarily due to differing treatments of income and gains on various investment securities held by the Funds, timing differences and differing characterization of distributions made by the Funds.
Distributions received from each Fund’s investments in Master Limited Partnerships (“MLPs”) may be comprised of both income and return of capital. Each Fund records investment income and return of capital based on estimates made at the time such distributions are received. Such estimates are based on historical information available from each MLP and other industry sources. These estimates may subsequently be revised based on information received from MLPs after their tax reporting periods are concluded.
Each Fund expects a portion of its distributions to shareholders might be comprised of tax deferred return of capital. Return of capital distributions are not taxable income to the shareholder, but reduce the investor’s tax basis in the investor’s Fund Shares. Such a reduction in tax basis will result in larger taxable gains and/or lower tax losses on a subsequent sale of Fund Shares. Shareholders who periodically receive the payment of dividends or other distributions consisting of a return of capital may be under the impression that they are receiving net profits from the Funds when, in fact, they are not. Shareholders should not assume that the source of the distributions is from the net profits of the Funds.
F. Federal Income Taxation and Tax Basis Information
Alerian MLP ETF
The Fund is taxed as a regular C-corporation for federal income tax purposes and as such is obligated to pay federal and state income tax. This treatment differs from most investment companies, which elect to be treated as “regulated investment companies” under the Internal Revenue Code of 1986, as amended (the “Code”) in order to avoid paying entity level income taxes. Under current law, the Fund is not eligible to elect treatment as a regulated investment company due to its investments primarily in MLPs invested in energy assets. The Fund expects that substantially all of the distributions it receives from MLPs may be treated as a tax-deferred return of capital, thus reducing the Fund’s current tax liability. However, the amount of taxes paid by the Fund will vary depending on the amount of income and gains derived from investments and/or sales of MLP interests and such taxes will reduce your return from an investment in the Fund.
22 | November 30, 2022
Alerian Exchange Traded Funds
| Notes to Financial Statements | November 30, 2022 |
Since the Fund will be subject to taxation on its taxable income, the NAV of the Fund shares will also be reduced by the accrual of any deferred tax liabilities. The Underlying Index however is calculated without any deductions for taxes. As a result, the Fund's after tax performance could differ significantly from the Underlying Index even if the pretax performance of the Fund and the performance of Underlying Index are closely related.
Cash distributions from MLPs to the Fund that exceed the Fund’s allocable share of such MLP’s net taxable income are considered a tax deferred return of capital that will reduce the Fund’s adjusted tax basis in the equity securities of the MLP. These reductions in the Fund’s adjusted tax basis in the MLP equity securities will increase the amount of any taxable gain (or decrease the amount of any tax loss) recognized by the Fund on a subsequent sale of the securities. A portion of any gain or loss recognized by the Fund on a sale of an MLP equity security (or by an MLP on a sale of an underlying asset) may be separately computed and treated as ordinary income or loss under the Code to the extent attributable to assets of the MLP that give rise to depreciation recapture, intangible drilling and development cost recapture, or other "unrealized receivables" or "inventory items" under the Code. Any such gain may exceed net taxable gain realized on the sale and will be recognized even if there is a net taxable loss on the sale. The Fund's net capital losses may only be used to offset capital gains and therefore cannot be used to offset gains that are treated as ordinary income. Thus, the Fund could recognize both gain that is treated as ordinary income and a capital loss on a sale of an MLP equity security (or on an MLP's sale of an underlying asset) and would not be able to use the capital loss to offset that gain. The Fund will accrue deferred income taxes for any future tax liability associated with (i) that portion of MLP distributions considered to be a tax-deferred return of capital as well as (ii) capital appreciation of its investments. Upon the sale of an MLP security, the Fund may be liable for previously deferred taxes. The Fund will rely to some extent on information provided by the MLPs, which is not necessarily timely, to estimate the deferred tax liability for purposes of financial statement reporting and determining the Fund’s NAV. From time to time, the Adviser will modify the estimates or assumptions related to the Fund’s deferred tax liability as new information becomes available and may consider, among other matters, the duration of statutory carryforward periods, shareholder transactions, underlying index constituent changes and market conditions. The Fund will generally compute deferred income taxes based on the federal income tax rate applicable to corporations and an assumed rate attributable to state taxes.
The Fund’s income tax expense/(benefit) consists of the following:
| Alerian MLP ETF | | Year ended November 30, 2022 | |
| | Current | | | Deferred | | | Total | |
| Federal | | $ | 23,221,005 | | | $ | 407,151,705 | | | $ | 430,372,710 | |
| State | | | 1,736,047 | | | | 36,726,112 | | | | 38,462,159 | |
| Valuation Allowance | | | – | | | | (208,198,005 | ) | | | (208,198,005 | ) |
| Total tax expense/(benefit) | | $ | 24,957,052 | | | $ | 235,679,812 | | | $ | 260,636,864 | |
Deferred income taxes reflect the net tax effect of temporary differences between the carrying amount of assets and liabilities for financial reporting and tax purposes.
Components of the Fund’s deferred tax assets and liabilities are as follows:
| Alerian MLP ETF | | As of November 30, 2022 | | | As of November 30, 2021 | |
| Deferred tax assets: | | | | | | | | |
| Capital loss carryforward | | $ | 752,720,954 | | | $ | 555,109,326 | |
| Net operating loss carryforward | | | 14,189,498 | | | | 145,850,354 | |
| Income recognized from MLP investments | | | 1,503,943,492 | | | | 1,474,568,495 | |
| Other deferred tax assets | | | – | | | | 9,517,179 | |
| Valuation allowance | | | (259,659,477 | ) | | | (467,857,482 | ) |
| Less Deferred tax liabilities: | | | | | | | | |
| Net unrealized gain on investment securities | | | (2,246,799,456 | ) | | | (1,717,187,872 | ) |
| Other deferred tax liabilities | | | (74,823 | ) | | | – | |
| Net Deferred Tax Asset/(Liability) | | $ | (235,679,812 | ) | | $ | – | |
Due to the activities of the MLPs that the fund is invested in, the Fund is required to pay franchise tax in certain states. Generally speaking, franchise tax expense is a tax on equity of a corporation, or base minimum fees, imposed by various jurisdictions. The amounts of the tax are estimated throughout the year based upon the Fund's estimate of underlying activities conducted in the states and reconciled to actual amounts paid upon the filing of the tax returns for the states. These taxes are paid as either estimated tax payments, extension payments, or with the tax return filings of the various states.
23 | November 30, 2022
Alerian Exchange Traded Funds
| Notes to Financial Statements | November 30, 2022 |
The capital loss carryforward is available to offset future taxable income. Capital losses can be carried forward for 5 years, after which they expire. The Fund has net capital loss carryforwards for federal income tax purposes as follows:
| Alerian MLP ETF | | Period-Ended | | | Amount | | | Expiration | |
| Federal | | | 11/30/2019 | | | $ | 757,980,977 | | | | 11/30/2024 | |
| Federal | | | 11/30/2020 | | | | 1,033,570,046 | | | | 11/30/2025 | |
| Federal | | | 11/30/2021 | | | | 673,784,686 | | | | 11/30/2026 | |
| Federal | | | 11/30/2022 | | | | 870,010,596 | | | | 11/30/2027 | |
| Total | | | | | | $ | 3,335,346,305 | | | | | |
The Fund had a capital loss carryforward expire in the current year in the amount of $20,624,857.
The net operating loss carryforward is available to offset future taxable income. The Fund has no net operating loss carryforwards for federal income tax purposes and has state tax net operating loss carryforwards of various amounts per state. The Deferred Tax Assets associated with these state tax net operating losses are as follows:
| Alerian MLP ETF | | Period-Ended | | | Amount | | | Expiration |
| State | | | 11/30/2017 | | | $ | 832,482 | | | Varies by State |
| State | | | 11/30/2018 | | | | 2,553,292 | | | Varies by State |
| State | | | 11/30/2019 | | | | 2,244,759 | | | Varies by State |
| State | | | 11/30/2020 | | | | 8,558,965 | | | Varies by State |
| Total | | | | | | $ | 14,189,498 | | | |
The Tax Cuts and Jobs Act (“TCJA”) was signed into law on December 22, 2017. The TCJA made modifications to the net operating loss (“NOL”) deduction. The TCJA eliminated the NOL carryback ability and replaced the 20 year carryforward period with an indefinite carryforward period for any NOLs arising in tax years beginning after December 31, 2017. The TCJA also established a limitation for any NOLs generated in tax years beginning after December 31, 2017 to the lesser of the aggregate of available NOLs or 80% of taxable income before any NOL utilization (the "80% limitation"). The Coronavirus Aid, Relief, and Economic Security Act ("Cares Act"), signed into law on March 27, 2020, restricted the application of the 80% limitation to tax years beginning after December 31, 2020.
The Fund reviews the recoverability of its deferred tax assets based upon the weight of available evidence. When assessing the recoverability of its deferred tax assets, significant weight was given to the effects of potential future realized and unrealized gains on investments and the period over which these deferred tax assets can be realized. Currently, any capital losses that may be generated by the Fund are eligible to be carried back up to three years and can be carried forward for five years to offset capital gains recognized by the Fund in those years.
Based upon the Fund’s assessment, it has determined that it is “more-likely-than-not” that a portion of its deferred tax assets will not be realized through future taxable income of the appropriate character. Accordingly, a valuation allowance has been established for the Fund’s deferred tax assets related to capital loss carryforwards. The Fund will continue to assess the need for a valuation allowance in the future. Significant increases in the fair value of its portfolio of investments may change the Fund’s assessment of the recoverability of these assets and may result in the removal of the valuation allowance against all or a portion of the Fund’s gross deferred tax assets.
As of November 30, 2022, the Fund’s federal net operating losses (including carryforwards) were fully utilized. The Fund’s ordinary taxable income as of November 30, 2022, was greater than the net operating losses available, resulting in full utilization of the net operating loss carryforward, and an incremental tax liability. As a result of tax law changes, and based on Fund investments, the Fund expects to have taxable income in future periods. Given the anticipated character of future taxable income recognized, realization of the Fund's capital loss carryforwards available to offset future capital gains is not deemed to be more likely than not and therefore supports a full valuation allowance against this amount. The change in accounting estimates related to valuation allowances as of November 30, 2022 resulted in the net deferred tax liability.
24 | November 30, 2022
Alerian Exchange Traded Funds
| Notes to Financial Statements | November 30, 2022 |
Total income tax expense/(benefit) (current and deferred) differs from the amount computed by applying the federal statutory income tax rate of 21% to net investment income and realized and unrealized gain/(losses) on investment before taxes as follows:
| Alerian MLP ETF | | As of November 30, 2022 | |
| Income tax expense at statutory rate | | $ | 427,032,073 | |
| State income taxes (net of federal benefit) | | | 33,621,108 | |
| Permanent differences, net | | | 6,164,012 | |
| Effect of tax rate change (state level) | | | 2,017,676 | |
| Valuation allowance | | | (208,198,005 | ) |
| Net income tax expense | | $ | 260,636,864 | |
The Fund recognizes interest accrued related to unrecognized tax benefits and penalties as income tax expense. For the year ended November 30, 2022, the Fund had no penalties or interest.
The Fund recognizes the tax benefits of uncertain tax positions only where the position is “more-likely-than-not” to be sustained assuming examination by tax authorities. Management has analyzed the Fund’s tax positions, and has concluded that no liability for unrecognized tax benefits should be recorded related to uncertain tax positions taken on U.S. tax returns and state tax returns filed since inception of the Fund. Tax periods ended November 30, 2019 through November 30, 2021 remain subject to examination by tax authorities in the United States. Due to the nature of the Fund’s investments, the Fund may be required to file income tax returns in several states. The Fund is not aware of any tax positions for which it is reasonably possible that the total amounts of unrecognized tax benefits will change materially in the next 12 months.
Alerian Energy Infrastructure ETF
The timing and character of income and capital gain distributions are determined in accordance with income tax regulations, which may differ from U.S. GAAP. Reclassifications are made to the Fund’s capital accounts for permanent tax differences to reflect income and gains available for distribution (or available capital loss carryforwards) under income tax regulations.
No provision for income taxes is included in the accompanying financial statements, as the Alerian Energy Infrastructure ETF intends to distribute to shareholders all taxable investment income and realized gains and otherwise comply with Subchapter M of the Code, applicable to regulated investment companies. The Alerian Energy Infrastructure ETF evaluates tax positions taken (or expected to be taken) in the course of preparing the Fund’s tax returns to determine whether these positions meet a “more-likely-than-not” standard that, based on the technical merits, have a more than fifty percent likelihood of being sustained by a taxing authority upon examination. A tax position that meets the “more-likely-than-not” recognition threshold is measured to determine the amount of benefit to recognize in the financial statements.
As of and during the year ended November 30, 2022, the Alerian Energy Infrastructure ETF did not have a liability for any unrecognized tax benefits. The Alerian Energy Infrastructure ETF files U.S. federal, state, and local tax returns as required. The Fund’s tax returns are subject to examination by the relevant tax authorities until expiration of the applicable statute of limitations, which is generally three years after the filing of the tax return, but may extend to four years in certain jurisdictions. The Fund’s tax returns for open years have incorporated no uncertain tax positions that require a provision for income taxes.
For the year ended November 30, 2022, permanent book and tax differences resulting primarily from differing treatment of investments in partnerships and redemptions in kind were identified and reclassified among components of the Fund’s net assets as follows:
| Fund | | Paid-in Capital | | | Total Distributable Earnings/(Accumulated Losses) | |
| Alerian Energy Infrastructure ETF | | $ | 1,811,352 | | | $ | (1,811,352 | ) |
25 | November 30, 2022
Alerian Exchange Traded Funds
| Notes to Financial Statements | November 30, 2022 |
The tax character of the distributions paid during the fiscal years ended November 30, 2022 and November 30, 2021 was as follows:
| Fund | | Ordinary Income | | | Long-Term Capital Gain | | | Return of Capital | |
| November 30, 2022 | | | | | | | | | |
| Alerian Energy Infrastructure ETF | | $ | 1,089,790 | | | $ | – | | | $ | 4,610,796 | |
| | | Ordinary Income | | | Long-Term Capital Gain | | | Return of Capital | |
| November 30, 2021 | | | | | | | | | | | | |
| Alerian Energy Infrastructure ETF | | $ | 2,301,342 | | | $ | – | | | $ | 2,346,411 | |
Under current law, capital losses maintain their character as short-term or long-term and are carried forward to the next tax year without expiration. As of November 30, 2022, the following amounts are available as carry forwards to the next tax year:
| Fund | | Short-Term | | | Long-Term | |
| Alerian Energy Infrastructure ETF | | $ | – | | | $ | 2,867,984 | |
During the year ended November 30, 2022, Alerian Energy Infrastructure ETF utilized $81,078 in capital loss carryovers.
As of November 30, 2022, the components of distributable earnings on a tax basis were as follows:
| | | Alerian Energy Infrastructure ETF | |
| Accumulated net realized loss on investments | | $ | (2,867,984 | ) |
| Net unrealized appreciation on investments | | | 12,624,772 | |
| Other accumulated losses | | | (3,225 | ) |
| Total | | $ | 9,753,563 | |
As of November 30, 2022, the costs of investments for federal income tax purposes and accumulated net unrealized appreciation/(depreciation) on investments were as follows:
| | | Alerian MLP ETF | | | Alerian Energy Infrastructure ETF | |
| Cost of investments for income tax purposes | | $ | 3,600,813,139 | | | $ | 138,013,621 | |
| Gross appreciation (excess of value over tax cost) | | $ | 4,150,257,679 | | | $ | 16,913,052 | |
| Gross depreciation (excess of tax cost over value) | | | (808,055,696 | ) | | | (4,286,914 | ) |
| Net appreciation (depreciation) of foreign currency | | | – | | | | (1,366 | ) |
| Net unrealized appreciation/(depreciation) | | $ | 3,342,201,983 | | | $ | 12,624,772 | |
The difference between cost amounts for financial statement purposes is due primarily to the recognition of pass-through income from a Fund’s investments in master limited partnerships and wash sales.
G. Lending of Portfolio Securities
The Alerian Energy Infrastructure ETF has entered into a securities lending agreement with State Street Bank & Trust Co. (“SSB”), the Fund’s lending agent. The Fund may lend its portfolio securities only to borrowers that are approved by SSB. The Fund will limit such lending to not more than 33 1/3% of the value of its total assets. The Fund’s securities held at SSB as custodian shall be available to be lent except those securities the Fund or ALPS Advisors, Inc. specifically identifies in writing as not being available for lending. The borrower pledges and maintains with the Fund collateral consisting of cash (U.S. Dollars only), securities issued or guaranteed by the U.S. government or its agencies or instrumentalities, and cash equivalents (including irrevocable bank letters of credit) issued by a person other than the borrower or an affiliate of the borrower. The initial collateral received by the Fund is required to have a value of no less than 102% of the market value of the loaned securities for U.S equity securities and a value of no less than 105% of the market value for non-U.S. equity securities. The collateral is maintained thereafter, at a market value equal to not less than 102% of the current value of the U.S. equity securities on loan and not less than 105% of the current value of the non-U.S. equity securities on loan. The market value of the loaned securities is determined at the close of each business day and any additional required collateral is delivered to the Fund on the next business day. During the term of the loan, the Fund is entitled to all distributions made on or in respect of the loaned securities. Loans of securities are terminable at any time and the borrower, after notice, is required to return borrowed securities within the customary time period for settlement of securities transactions.
26 | November 30, 2022
Alerian Exchange Traded Funds
| Notes to Financial Statements | November 30, 2022 |
Any cash collateral received is reinvested in a money market fund managed by SSB as disclosed in the Fund's Schedule of Investments and is reflected in the Statement of Assets and Liabilities as a payable for collateral upon return of securities loaned. Non-cash collateral, in the form of securities issued or guaranteed by the U.S. government or its agencies or instrumentalities, is not disclosed in the Fund's Statement of Assets and Liabilities as it is held by the lending agent on behalf of the Fund, and the Fund does not have the ability to re-hypothecate these securities. Income earned by the Fund from securities lending activity is disclosed in the Statement of Operations.
The following is a summary of the Fund's securities lending agreement and related cash and non-cash collateral received as of November 30, 2022:
| Fund | | Market Value of Securities on Loan | | | Cash Collateral Received | | | Non-Cash Collateral Received | | | Total Collateral Received | |
| Alerian Energy Infrastructure ETF | | $ | 8,851,198 | | | $ | 8,752,373 | | | $ | 586,610 | | | $ | 9,338,983 | |
The risks of securities lending include the risk that the borrower may not provide additional collateral when required or may not return the securities when due. To mitigate these risks, the Fund benefits from a borrower default indemnity provided by SSB. SSB’s indemnity allows for full replacement of securities lent wherein SSB will purchase the unreturned loaned securities on the open market by applying the proceeds of the collateral, or to the extent such proceeds are insufficient or the collateral is unavailable, SSB will purchase the unreturned loan securities at SSB’s expense. However, the Fund could suffer a loss if the value of the investments purchased with cash collateral falls below the value of the cash collateral received.
The following table reflects a breakdown of transactions accounted for as secured borrowings, the gross obligation by the type of collateral pledged or securities loaned, and the remaining contractual maturity of those transactions as of November 30, 2022:
| Alerian Energy Infrastructure ETF | Remaining contractual maturity of the agreements | |
| Securities Lending Transactions | | Overnight & Continuous | | | Up to 30 Days | | | 30-90 Days | | | Greater than 90 Days | | | Total | |
| Common Stocks | | $ | 8,752,373 | | | $ | – | | | $ | – | | | $ | – | | | $ | 8,752,373 | |
| Total Borrowings | | | | | | | | | | | | | | | | | | | 8,752,373 | |
| Gross amount of recognized liabilities for securities lending (collateral received) | | | | | | | | | | | | | | | | | | $ | 8,752,373 | |
3. INVESTMENT ADVISORY FEE AND OTHER AFFILIATED TRANSACTIONS
ALPS Advisors, Inc. serves as the Funds’ investment adviser pursuant to an Investment Advisory Agreement with the Trust on behalf of each Fund (the “Advisory Agreement”). Pursuant to the Advisory Agreement, each Fund pays the Adviser an annual management fee for the services and facilities it provides, payable on a monthly basis as a percentage of the relevant Fund’s average daily net assets as set out below.
| Fund | | Advisory Fee |
| Alerian MLP ETF | 0.85% | Average net assets up to and including $7 billion |
| | 0.825% | Average net assets greater than $7 billion up to and including $8.5 billion |
| | 0.80% | Average net assets greater than $8.5 billion up to and including $10.5 billion |
| | 0.75% | Average net assets greater than $10.5 billion up to and including $12.5 billion |
| | 0.70% | Average net assets greater than $12.5 billion up to and including $14.5 billion |
| | 0.65% | Average net assets greater than $14.5 billion up to and including $16.5 billion |
| | 0.60% | Average net assets greater than $16.5 billion up to and including $18.5 billion |
| | 0.55% | Average net assets greater than $18.5 billion up to and including $20.5 billion |
| | 0.50% | Average net assets greater than $20.5 billion up to and including $22.5 billion |
| | 0.45% | Average net assets greater than $22.5 billion up to and including $25 billion |
| | 0.40% | Average net assets greater than $25 billion |
| Fund | | Advisory Fee |
| Alerian Energy Infrastructure ETF | 0.35% | |
27 | November 30, 2022
Alerian Exchange Traded Funds
| Notes to Financial Statements | November 30, 2022 |
Prior to July 1, 2022, the unitary fee of the Alerian MLP ETF was subject to the following breakpoints:
| Fund | | Advisory Fee |
| Alerian MLP ETF | 0.85% | up to and including $10 billion |
| | 0.80% | greater than $10 billion up to and including $15 billion |
| | 0.70% | greater than $15 billion up to and including $20 billion |
| | 0.55% | greater than $20 billion up to and including $25 billion |
| | 0.40% | greater than $25 billion |
Out of the unitary management fees, the Adviser pays substantially all expenses of each Fund, including the cost of transfer agency, custody, fund administration, legal, audit, trustees and other services, except for interest expenses, distribution fees or expenses, brokerage expenses, taxes and extraordinary expenses not incurred in the ordinary course of each Fund's business. The Adviser’s unitary management fee is designed to pay substantially all of each Fund’s expenses and to compensate the Adviser for providing services for each Fund.
ALPS Fund Services, Inc., an affiliate of the Adviser, is the administrator of the Funds.
Effective February 16, 2022, each Trustee receives (1) a quarterly retainer of $20,000, (2) a per meeting fee of $10,000, (3) $2,500 for any special meeting held outside of a regularly scheduled board meeting, and (4) reimbursement for all reasonable out-of-pocket expenses relating to attendance at meetings. In addition, the Chairman of the Board receives a quarterly retainer of $5,000, the Chairman of the Audit Committee receives a quarterly retainer of $3,000, and the Chairman of the Nominating & Governance Committee receives a quarterly retainer of $2,000, each in connection with their respective roles. Prior to February 16, 2022, each Trustee received (1) a quarterly retainer of $10,000, (2) a per meeting fee of $5,000, (3) $1,500 for any special meeting held outside of a regularly scheduled board meeting, and (4) reimbursement for all reasonable out-of-pocket expenses relating to attendance at meetings. In addition, the Chairman of the Board and Chairman of the Audit Committee each received a quarterly retainer of $2,000, in connection with their respective roles.
4. PURCHASES AND SALES OF SECURITIES
For the year ended November 30, 2022, the cost of purchases and proceeds from sales of investment securities, excluding short-term investments and in-kind transactions, were as follows:
| Fund | | Purchases | | | Sales | |
| Alerian MLP ETF | | $ | 1,674,577,115 | | | $ | 3,778,426,197 | |
| Alerian Energy Infrastructure ETF | | | 28,376,790 | | | | 28,620,357 | |
For the year ended November 30, 2022, the cost of in-kind purchases and proceeds from in-kind sales were as follows:
| Fund | | Purchases | | | Sales | |
| Alerian MLP ETF | | $ | 2,446,353,824 | | | $ | – | |
| Alerian Energy Infrastructure ETF | | | 79,519,407 | | | | 12,015,760 | |
For the year ended November 30, 2022, the in-kind net realized gains/(losses) were as follows:
| Fund | | Net Realized Gain/(Loss) |
| Alerian Energy Infrastructure ETF | | $ | 3,288,920 | |
Gains on in-kind transactions are not considered taxable for federal income tax purposes and losses on in-kind transactions are also not deductible for tax purposes.
5. MASTER LIMITED PARTNERSHIPS
MLPs are publicly traded partnerships engaged in, among other things, the transportation, storage and processing of minerals and natural resources, and are treated as partnerships for U.S. federal income tax purposes. By confining their operations to these specific activities, their interests, or units, are able to trade on public securities exchanges exactly like the shares of a corporation, without entity level taxation. To qualify as a MLP and to not be taxed as a corporation, a partnership must receive at least 90% of its income from qualifying sources as set forth in Section 7704(d) of the Code.
28 | November 30, 2022
Alerian Exchange Traded Funds
| Notes to Financial Statements | November 30, 2022 |
These qualifying sources include, among other things, natural resource-based activities such as the processing, transportation and storage of mineral or natural resources. MLPs generally have two classes of owners, the general partner and limited partners. The general partner of an MLP is typically owned by a major energy company, an investment fund, the direct management of the MLP, or is an entity owned by one or more of such parties. The general partner may be structured as a private or publicly traded corporation or other entity. The general partner typically controls the operations and management of the MLP through an up to 2% equity interest in the MLP plus, in many cases, ownership of common units and subordinated units. Limited partners typically own the remainder of the partnership, through ownership of common units, and have a limited role in the partnership’s operations and management.
MLPs are typically structured such that common units and general partner interests have first priority to receive quarterly cash distributions up to an established minimum amount (“minimum quarterly distributions” or “MQD”). Common and general partner interests also accrue arrearages in distributions to the extent the MQD is not paid. Once common and general partner interests have been paid, subordinated units receive distributions of up to the MQD; however, subordinated units do not accrue arrearages. Distributable cash in excess of the MQD is distributed to both common and subordinated units and generally on a pro rata basis. The general partner is also eligible to receive incentive distributions if the general partner operates the business in a manner which results in distributions paid per common unit surpassing specified target levels. As the general partner increases cash distributions to the limited partners, the general partner receives an increasingly higher percentage of the incremental cash distributions.
6. CAPITAL SHARE TRANSACTIONS
Shares are created and redeemed by each Fund only in Creation Unit size aggregations of 25,000 Shares. Only broker-dealers or large institutional investors with creation and redemption agreements called Authorized Participants (“AP”) are permitted to purchase or redeem Creation Units from the Funds. Such transactions are generally permitted on an in-kind basis, with a balancing cash component to equate the transaction to the NAV per unit of each Fund on the transaction date. Cash may be substituted equivalent to the value of certain securities generally when they are not available in sufficient quantity for delivery, not eligible for trading by the AP or as a result of other market circumstances.
7. RELATED PARTY TRANSACTIONS
The Funds engaged in cross trades between other funds in the Trust during the year ended November 30, 2022 pursuant to Rule 17a-7 under the 1940 Act. Cross trading is the buying or selling of portfolio securities between funds to which the Adviser serves as the investment adviser. The Board previously adopted procedures that apply to transactions between the Funds of the Trust pursuant to Rule 17a-7. These transactions related to cross trades during the period complied with the requirements set forth by Rule 17a-7 and the Trust’s procedures.
Transactions related to cross trades during the year ended November 30, 2022, were as follows:
| Fund | | Purchase Cost Paid | | | Sale Proceeds Received | | | Realized Gain/(Loss) on Sales | |
| Alerian MLP ETF | | $ | 1,453,950 | | | $ | 2,044,603 | | | $ | (31,219 | ) |
| Alerian Energy Infrastructure ETF | | | 814,351 | | | | 1,661,210 | | | | (255,815 | ) |
8. AFFILIATED COMPANIES
As defined by the Investment Company Act of 1940, an affiliated person, including an affiliated company, is one in which a Fund owns 5% or more of the outstanding voting securities, or a company which is under common ownership or control with the Fund.
29 | November 30, 2022
Alerian Exchange Traded Funds
| Notes to Financial Statements | November 30, 2022 |
For the year ended November 30, 2022, the Alerian MLP ETF held shares in the following affiliates, as defined by the Investment Company Act of 1940.
| Security Name | | Share Balance as of November 30, 2022 | | | Market Value as of November 30, 2021 | | | Purchases | | | Purchases In-Kind | | | Sales | | | Market Value as of November 30, 2022 | | | Dividends* | | | Change in Unrealized Appreciation/ Depreciation | | | Realized Gain/(Loss) | |
| Crestwood Equity | | | | | | | | | | | | | | | | | | | | | | | | | | | | | | | | | | | | |
| Partners LP | | | 10,653,725 | | | $ | 191,619,639 | | | $ | 97,603,624 | | | $ | 106,082,912 | | | $ | (105,484,006 | ) | | $ | 315,563,335 | | | $ | – | | | $ | 58,254,399 | $ | | | (6,657,887 | ) |
| DCP Midstream LP | | | 13,557,968 | | | | 305,805,520 | | | | 63,948,281 | | | | 169,376,538 | | | | (164,143,312 | ) | | | 533,370,461 | | | | – | | | | 186,684,002 | | | | (6,615,918 | ) |
| EnLink Midstream LLC | | | 48,003,728 | | | | 279,392,241 | | | | 59,772,047 | | | | 174,161,852 | | | | (184,077,983 | ) | | | 617,327,942 | | | | – | | | | 313,398,689 | | | | (4,075,332 | ) |
| Genesis Energy LP | | | 16,303,586 | | | | 142,731,294 | | | | 24,690,007 | | | | 69,531,311 | | | | (65,438,446 | ) | | | 172,328,904 | | | | – | | | | 32,656,639 | | | | (22,326,016 | ) |
| Holly Energy Partners LP 6,825,593 | | | | | | | 99,394,845 | | | | 15,766,032 | | | | 46,229,400 | | | | (44,430,761 | ) | | | 127,775,101 | | | | – | | | | 22,123,956 | | | | (1,977,707 | ) |
| Magellan Midstream | | | | | | | | | | | | | | | | | | | | | | | | | | | | | | | | | | | | |
| Partners LP | | | 13,703,086 | | | | 495,004,139 | | | | 124,158,405 | | | | 241,630,635 | | | | (216,082,512 | ) | | | 722,152,632 | | | | – | | | | 133,436,438 | | | | (2,756,794 | ) |
| NuStar Energy LP | | | 14,886,525 | | | | 179,635,876 | | | | 31,734,809 | | | | 88,577,620 | | | | (82,470,356 | ) | | | 243,096,953 | | | | – | | | | 65,692,234 | | | | (16,789,347 | ) |
| Plains All American | | | | | | | | | | | | | | | | | | | | | | | | | | | | | | | | | | | | |
| Pipeline LP | | | 59,046,913 | | | | 497,343,940 | | | | 92,688,399 | | | | 247,931,412 | | | | (270,638,701 | ) | | | 733,362,659 | | | | – | | | | 262,088,742 | | | | (47,943,337 | ) |
| Western Midstream | | | | | | | | | | | | | | | | | | | | | | | | | | | | | | | | | | | | |
| Partners LP | | | 24,762,267 | | | | 489,748,659 | | | | 79,053,631 | | | | 254,077,393 | | | | (333,340,588 | ) | | | 692,848,231 | | | | – | | | | 257,583,795 | | | | (8,533,920 | ) |
| | | | | | | | | | | | | | | | | | | | | | | $ | 4,157,826,218 | | | $ | – | | | $ | 1,331,918,894 | $ | | | (117,676,258 | ) |
* 100% of the income received was estimated as Return of Capital.
9. MARKET RISK
The Funds are subject to investment and operational risks associated with financial, economic and other global market developments and disruptions, including the recent spread of an infectious respiratory illness caused by a novel strain of coronavirus (known as COVID-19), which can negatively impact the securities markets and cause each Fund to lose value. Securities in each Fund’s portfolio may underperform in comparison to securities in general financial markets, a particular financial market or other asset classes due to a number of factors, including inflation (or expectations for inflation), deflation (or expectations for deflation), interest rates, global demand for particular products or resources, market instability, debt crises and downgrades, embargoes, tariffs, sanctions and other trade barriers, regulatory events, other governmental trade or market control programs and related geopolitical events. In addition, the value of the Fund’s investments may be negatively affected by the occurrence of global events such as war, terrorism, environmental disasters, natural disasters or events, country instability, and infectious disease epidemics or pandemics.
The spread of COVID-19 has caused volatility, severe market dislocations and liquidity constraints in many markets, including markets for the securities each Fund holds, and may adversely affect each Fund’s investments and operations. The transmission of COVID-19 and efforts to contain its spread have resulted in travel restrictions and disruptions, closed international borders, enhanced health screenings at ports of entry and elsewhere, disruption of and delays in healthcare service preparation and delivery, quarantines, event and service cancellations or interruptions, disruptions to business operations and supply chains, and a reduction in consumer and business spending, as well as general concern and uncertainty that has negatively affected the economy. These disruptions have led to instability in the market place and the jobs market. The impact of COVID-19 could adversely affect the economies of many nations or the entire global economy, the financial well-being and performance of individual issuers, borrowers and sectors and the health of the markets generally in potentially significant and unforeseen ways.
The foregoing could lead to a significant economic downturn or recession, increased market volatility, a greater number of market closures, higher default rates and adverse effects on the values and liquidity of each Fund’s securities or other assets. Such impacts may adversely affect the performance of the Funds.
10. SUBSEQUENT EVENTS
A federal excise tax on stock repurchases is expected to apply to the Alerian MLP ETF with respect to share redemptions occurring on or after January 1, 2023 in accordance with the provisions of the Inflation Reduction Act of 2022. The excise tax is one percent (1%) of the fair market value of Alerian MLP ETF share redemptions less the fair market value of Alerian MLP ETF share issuances (in excess of $1 million of fair market value) annually on a taxable year basis.
30 | November 30, 2022
Alerian Exchange Traded Funds
| Additional Information | November 30, 2022 (Unaudited) |
PROXY VOTING RECORDS, POLICIES AND PROCEDURES
Information regarding how each Fund voted proxies relating to portfolio securities during the most recent 12-month period ended June 30 and a description of the Funds’ proxy voting policies and procedures used in determining how to vote for proxies are available without charge on the SEC’s website at www.sec.gov and upon request, by calling (toll-free) 1-866-759-5679.
PORTFOLIO HOLDINGS
The Funds file a complete schedule of portfolio holdings with the U.S. Securities and Exchange Commission (“SEC”) for the first and third quarters of each fiscal year on Form N-PORT within 60 days after the end of the period. Copies of the Fund’s Form N-PORT are available without a charge, upon request, by contacting the Fund at 1-866-759-5679 and on the SEC’s website at https://www.sec.gov.
TAX INFORMATION
The Alerian Energy Infrastructure ETF designates the following as a percentage of taxable ordinary income distributions, or up to the maximum amount allowable, for the calendar year ended December 31, 2021:
| | Qualified Dividend Income | Dividend Received Deduction |
| Alerian Energy Infrastructure ETF | 100.00% | 15.44% |
In early 2022, if applicable, shareholders of record received this information for the distributions paid to them by the Funds during the calendar year 2021 via Form 1099. The Funds will notify shareholders in early 2023 of amounts paid to them by the Funds, if any, during the calendar year 2022.
LICENSING AGREEMENTS
Alerian (the “Licensor”) has entered into an index licensing agreement with ALPS Advisors Inc. (the “Adviser”) with respect to each of the Alerian MLP ETF and the Alerian Energy Infrastructure ETF, to allow the Adviser’s use of AMZI and AMEI. The following disclosure relates to the Licensor:
Alerian is the designer of the construction and methodology for the underlying index (each an “Underlying Index”) for each of the Alerian MLP ETF and the Alerian Energy Infrastructure ETF (each a “Fund” and collectively, the “Funds”). “Alerian,” “Alerian MLP Infrastructure Index,” “Alerian Energy Infrastructure Index,” “Alerian Index Series” and “AMZI” are service marks or trademarks of Alerian. Alerian acts as brand licensor for each Underlying Index. Alerian is not responsible for the descriptions of either Underlying Index or the Funds that appear herein. Alerian is not affiliated with the Trust, the Adviser or the Distributor.
Neither Fund is issued, sponsored, endorsed, sold or promoted by Alerian (“Licensor”) or its affiliates. Licensor makes no representation or warranty, express or implied, to the owners of the Fund or any member of the public regarding the advisability of investing in securities generally or in the Fund particularly or the ability of the Alerian MLP Infrastructure Index (“Index”) to track general market performance. Licensor’s only relationship to the Licensee is the licensing of the Index which is determined, composed and calculated by Licensor without regard to the Licensee or the Fund. Licensor has no obligation to take the needs of the Licensee or the owners of the Fund into consideration in determining, composing or calculating the Index. Licensor is not responsible for and has not participated in the determination of the timing of, prices at, or quantities of the Fund to be issued or in the determination or calculation of the equation by which the Fund is to be converted into cash. Licensor has no obligation or liability in connection with the issuance, administration, marketing or trading of either Fund and is not responsible for and has not participated in the determination of pricing or the timing of the issuance or sale of the Shares of either Fund or in the determination or calculation of the NAV of the relevant Fund. Alerian MLP Infrastructure Index, Alerian MLP Infrastructure Total Return Index, AMZI and AMZIX are trademarks of GKD Index Partners, LLC and their general use is granted under a license from GKD Index Partners, LLC.
LICENSOR DOES NOT GUARANTEE THE QUALITY, ACCURACY AND/OR THE COMPLETENESS OF THE INDEX OR ANY DATA INCLUDED THEREIN AND SHALL HAVE NO LIABILITY FOR ERRORS OR OMISSIONS OF ANY KIND RELATED TO THE INDEX OR DATA. LICENSOR MAKES NO WARRANTY, EXPRESS OR IMPLIED, AS TO RESULTS TO BE OBTAINED BY LICENSEE, OWNERS OF THE FUND, OR ANY OTHER PERSON OR ENTITY FROM THE USE OF THE INDEX OR ANY DATA INCLUDED THEREIN IN CONNECTION WITH THE RIGHTS LICENSED TO LICENSEE OR FOR ANY OTHER USE. LICENSOR MAKES NO EXPRESS OR IMPLIED WARRANTIES, AND HEREBY EXPRESSLY DISCLAIMS ALL WARRANTIES OF MERCHANTABILITY OR FITNESS FOR A PARTICULAR PURPOSE OR USE WITH RESPECT TO THE INDEX OR ANY DATA INCLUDED THEREIN. WITHOUT LIMITING ANY OF THE FOREGOING, IN NO EVENT SHALL LICENSOR
31 | November 30, 2022
Alerian Exchange Traded Funds
| Additional Information | November 30, 2022 (Unaudited) |
HAVE ANY LIABILITY FOR ANY SPECIAL, PUNITIVE, INDIRECT, OR CONSEQUENTIAL DAMAGES (INCLUDING LOST PROFITS), EVEN IF NOTIFIED OF THE POSSIBILITY OF SUCH DAMAGES.
The Adviser does not guarantee the accuracy and/or the completeness of either Underlying Index or any data included therein, and the Adviser shall have no liability for any errors, omissions or interruptions therein. The Adviser makes no warranty, express or implied, as to results to be obtained by either Fund, owners of the Shares of the relevant Fund or any other person or entity from the use of either Underlying Index or any data included therein. The Adviser makes no express or implied warranties, and expressly disclaims all warranties of merchantability or fitness for a particular purpose or use with respect to either Underlying Index or any data included therein. Without limiting any of the foregoing, in no event shall the Adviser have any liability for any special, punitive, direct, indirect, or consequential damages (including lost profits) arising out of matters relating to the use of either Underlying Index, even if notified of the possibility of such damages.
(Applicable to the Alerian Energy Infrastructure ETF only)
The Underlying Index is the exclusive property of GKD Index Partners LLC d/b/a Alerian, which has contracted with S&P Opco, LLC (a subsidiary of S&P Dow Jones Indices LLC) (“S&P Dow Jones Indices”) to calculate and maintain the Underlying Index. S&P® is a registered trademark of Standard & Poor’s Financial Services LLC (“SPFS”); Dow Jones® is a registered trademark of Dow Jones Trademark Holdings LLC (“Dow Jones”); and these trademarks have been licensed to S&P Dow Jones Indices. “Calculated by S&P Dow Jones Indices” and its related stylized mark(s) have been licensed for use by Alerian.
The Fund is not sponsored, endorsed, sold or promoted by S&P Dow Jones Indices, SPFS, Dow Jones or any of their affiliates (collectively, “S&P Dow Jones Indices Entities”). S&P Dow Jones Indices Entities do not make any representation or warranty, express or implied, to the owners of the Fund or any member of the public regarding the advisability of investing in securities generally or in the Fund particularly or the ability of the Underlying Index to track general market performance. S&P Dow Jones Indices Entities only relationship to Alerian with respect to the Underlying Index is the licensing of certain trademarks, service marks and trade names of S&P Dow Jones Indices Entities and for the providing of calculation and maintenance services related to the Underlying Index. S&P Dow Jones Indices Entities are not responsible for and have not participated in the determination of the prices and amount of the Fund or the timing of the issuance or sale of the Fund or in the determination or calculation of the equation by which the Fund is to be converted into cash. S&P Dow Jones Indices Entities have no obligation or liability in connection with the administration, marketing or trading of the Fund. S&P Dow Jones Indices LLC is not an investment advisor. Inclusion of a security within the Underlying Index is not a recommendation by S&P Dow Jones Indices Entities to buy, sell, or hold such security, nor is it considered to be investment advice.
S&P DOW JONES INDICES ENTITIES DO NOT GUARANTEE THE ADEQUACY, ACCURACY, TIMELINESS AND/OR THE COMPLETENESS OF THE UNDERLYING INDEX OR ANY DATA RELATED THERETO OR ANY COMMUNICATION, INCLUDING BUT NOT LIMITED TO, ORAL OR WRITTEN COMMUNICATION (INCLUDING ELECTRONIC COMMUNICATIONS) WITH RESPECT THERETO. S&P DOW JONES INDICES ENTITIES SHALL NOT BE SUBJECT TO ANY DAMAGES OR LIABILITY FOR ANY ERRORS, OMISSIONS, OR DELAYS THEREIN. S&P DOW JONES INDICES ENTITIES MAKE NO EXPRESS OR IMPLIED WARRANTIES, AND EXPRESSLY DISCLAIMS ALL WARRANTIES, OF MERCHANTABILITY OR FITNESS FOR A PARTICULAR PURPOSE OR USE OR AS TO RESULTS TO BE OBTAINED BY ALERIAN, OWNERS OF THE FUND, OR ANY OTHER PERSON OR ENTITY FROM THE USE OF THE UNDERLYING INDEX OR WITH RESPECT TO ANY DATA RELATED THERETO. WITHOUT LIMITING ANY OF THE FOREGOING, IN NO EVENT WHATSOEVER SHALL S&P DOW JONES INDICES ENTITIES BE LIABLE FOR ANY INDIRECT, SPECIAL, INCIDENTAL, PUNITIVE, OR CONSEQUENTIAL DAMAGES INCLUDING BUT NOT LIMITED TO, LOSS OF PROFITS, TRADING LOSSES, LOST TIME OR GOODWILL, EVEN IF THEY HAVE BEEN ADVISED OF THE POSSIBILITY OF SUCH DAMAGES, WHETHER IN CONTRACT, TORT, STRICT LIABILITY, OR OTHERWISE.
32 | November 30, 2022
Alerian Exchange Traded Funds
| Board Considerations Regarding Approval of | November 30, 2022 (Unaudited) |
| Investment Advisory Agreements | |
At a meeting held on June 21, 2022 via electronic means (video-conference), the Board of Trustees of the Trust (the “Board” or the “Trustees”), including the Trustees who are not “interested persons” of the Trust within the meaning of the Investment Company Act of 1940, as amended (the “Independent Trustees”), evaluated a proposal to approve (i) the continuance of the Investment Advisory Agreements between the Trust and ALPS Advisors, Inc. (the “Adviser” or “AAI”) with respect to the Alerian MLP ETF (“AMLP”) and the Alerian Energy Infrastructure ETF (“ENFR”) (each “a Fund” and collectively the “Funds”), as well as a (ii) proposed reduction to the advisory fee breakpoints for AMLP. The Independent Trustees also met separately to consider (i) each Investment Advisory Agreement and (ii) the proposed reduction to the advisory fee breakpoints for AMLP.
In evaluating the (i) proposed reduction to the advisory fee breakpoints for AMLP and (ii) renewal of the Investment Advisory Agreements with respect to each Fund, the Board, including the Independent Trustees; considered various factors, including (i) the nature, extent and quality of the services provided by AAI with respect to the applicable Fund under the Investment Advisory Agreements; (ii) the advisory fees and other expenses paid by the Fund compared to those of similar funds managed by other investment advisers; (iii) the costs of the services provided to the Fund by AAI and the profits realized by AAI and its affiliates from its relationship to the Fund; (iv) the extent to which economies of scale have been or would be realized if and as the assets of the Fund grow and whether fees reflect the economies of scale for the benefit of shareholders; and (v) any additional benefits and other considerations.
With respect to the nature, extent and quality of the services provided by AAI under the Investment Advisory Agreements, the Board considered and reviewed information concerning the services provided under the Investment Advisory Agreements, the investment parameters of the index of each Fund, financial information regarding AAI and its parent company, information describing AAI’s current organization and the background and experience of the persons responsible for the day-to-day management of the Funds. For AMLP, the Board noted that the amended Advisory Agreement was identical to the Advisory Agreement currently in place for AMLP other than with respect to the reduced advisory fee breakpoints.
The Board reviewed information on the performance of each Fund and its applicable benchmark. The Board also evaluated the correlation and tracking error between each underlying index and its corresponding Fund’s performance. Based on this review, the Board, including the Independent Trustees, found that the nature and extent of services provided to each Fund under the Investment Advisory Agreements was appropriate and that the quality was satisfactory and, for AMLP, that there will be no diminution in the nature or level of services provided to AMLP.
The Board noted that the advisory fees for each Fund were unitary fees pursuant to which AAI assumes all expenses of the Funds (including the cost of transfer agency, custody, fund administration, legal, audit and other services) other than the payments under the Advisory Agreement, brokerage expenses, taxes, interest, litigation expenses and other extraordinary expenses.
With respect to advisory fee rates, the Board, including the Independent Trustees, noted the following:
The gross management fee rate for AMLP is higher than the median of its FUSE expense group. AMLP’s net expense ratio is also higher than the median of its FUSE expense group.
The gross management fee rate for ENFR is lower than the median of its FUSE expense group. ENFR’s net expense ratio is also below the median of its FUSE expense group.
With respect to AMLP, the Board took into account, among other things, supplemental information provided by the Adviser showing AMLP’s total expenses were in line with the total expenses of peer groups deemed by the Adviser to be more comparable, including peer groups comprised of (i) the master limited partnership (“MLP”) asset class as a whole and (ii) exchange-traded products focused solely on MLP investments. The Board also considered the brand recognition of AMLP’s index provider and the fees charged by the index provider for licensing its indexes, the additional costs and expenses incurred by AAI in managing and administering the Fund, and that AMLP’s investment advisory fee schedule included breakpoints, which are being further reduced for the benefit of AMLP shareholders.
Based on the foregoing, and the other information available to them, the Board, including the Independent Trustees, concluded that the advisory fee rate for each Fund and the proposed reduction in advisory fee breakpoints for AMLP were reasonable under the circumstances and in light of the quality of the services provided.
The Board, including the Independent Trustees, considered other benefits available to AAI because of its relationship with the Funds and concluded that the advisory fees were reasonable taking into account any such benefits.
The Board, including the Independent Trustees, also considered with respect to each Fund the information provided by AAI about the costs and profitability of AAI with respect to each of the Funds, including the asset levels and other factors that influence the profitability and financial viability of the Funds. The Board, including the Independent Trustees; reviewed and noted the relatively small size of ENFR and concluded that AAI was not realizing any economies of scale.
33 | November 30, 2022
Alerian Exchange Traded Funds
| Board Considerations Regarding Approval of | November 30, 2022 (Unaudited) |
| Investment Advisory Agreements | |
With respect to AMLP, the Independent Trustees noted that the Fund’s asset levels have not recovered to its historic high. The Independent Trustees determined that AAI should continue to keep the Board informed on an ongoing basis of any significant developments (e.g., material increases in asset levels) so as to facilitate the Independent Trustees’ evaluation of whether further economies of scale have been achieved.
With respect to AMLP, the Board considered, among other things the brand recognition of AMLP’s index provider as well as the trading volumes of the Fund and the narrow trading spreads. The Board considered the breakpoint schedule adopted previously, as well as the further reductions proposed for adoption, and whether the breakpoints would benefit shareholders and appropriately reflect economies of scale achieved by AAI with respect to AMLP should AMLP’s assets increase, noting that AMLP’s assets were still below historical highs, but increasing. Upon discussion, the Board, including the Independent Trustees, determined that the advisory fee rate for the Fund, inclusive of the revised breakpoint schedule, reflects an appropriate sharing of economies of scale.
In voting to renew each Investment Advisory Agreement, the Board, including the Independent Trustees, concluded that the terms of each Investment Advisory Agreement are reasonable and fair in light of the services to be performed, the fees paid by certain other funds, expenses to be incurred and such other matters as the members of the Board, including the Independent Trustees, considered relevant in the exercise of their reasonable business judgment. The Independent Trustees did not identify any single factor or group of factors as all important or controlling and considered all factors together.
34 | November 30, 2022
Alerian Exchange Traded Funds
| Trustees & Officers | November 30, 2022 (Unaudited) |
The general supervision of the duties performed by the Adviser for the Fund under the Investment Advisory Agreement is the responsibility of the Board of Trustees. The Trust currently has four Trustees, each of whom have no affiliation or business connection with the Adviser or any of its affiliated persons and do not own any stock or other securities issued by the Adviser. These are the “non-interested” or “independent” Trustees (“Independent Trustees”).
The Independent Trustees of the Trust, their term of office and length of time served, their principal business occupations during the past five years, the number of portfolios in the Fund Complex overseen by each Independent Trustee, and other directorships, if any, held by the Trustee are shown below.
INDEPENDENT TRUSTEES
| Name, Address & Year of Birth* | Position(s) Held with Trust | Term of Office and Length of Time Served** | Principal Occupation(s) During Past 5 Years | Number of Portfolios in Fund Complex Overseen by Trustees*** | Other Directorships Held by Trustees |
Mary K. Anstine,
1940 | Trustee | Since
March 2008 | Ms. Anstine is Trustee/Director of AV Hunter Trust and Colorado Uplift Board. | 38 | Ms. Anstine is a Trustee of ALPS Variable Investment Trust (7 funds); Financial Investors Trust (29 funds); and Reaves Utility Income Fund. |
Jeremy W. Deems,
1976 | Trustee | Since
March 2008 | Mr. Deems is the Co-Founder and Chief Financial Officer of Green Alpha Advisors, LLC, a registered investment advisor, and Co-Portfolio Manager of the Shelton Green Alpha Fund. | 38 | Mr. Deems is a Trustee of ALPS Variable Investment Trust (7 funds); Financial Investors Trust (29 funds); and Reaves Utility Income Fund; and Clough Funds Trust (1 fund). |
Rick A. Pederson,
1952 | Trustee | Since
March 2008 | Mr. Pederson is Partner, Bow River Capital Partners (private equity management), 2003 - present; Board Member, Prosci Inc. (private business services) 2013-2016; Advisory Board Member, Citywide Banks (Colorado community bank) 2014- 2017; Board Member, Strong-Bridge Consulting, 2015- 2019; Board Member, IRI/ODMS Holdings LLC, 2017 – 2019; Director, National Western Stock Show (not for profit) 2010 - present; Director, History Colorado (not for profit) 2015- present; Director, Citywide Bank Advisory Board 2017-present; Trustee, Boettcher Foundation, 2018 -present. | 24 | Mr. Pederson is Trustee of Segall Bryant & Hamill Trust (14 funds), Principal Real Estate Income Fund (1 fund). |
| * | The business address of the Trustee is c/o ALPS Advisors, Inc., 1290 Broadway, Suite 1000, Denver, Colorado 80203. |
| ** | This is the period for which the Trustee began serving the Trust. Each Trustee serves an indefinite term, until his or her successor is elected. |
| *** | The Fund Complex includes all series of the Trust and any other investment companies for which ALPS Advisors, Inc. provides investment advisory services. |
35 | November 30, 2022
Alerian Exchange Traded Funds
| Trustees & Officers | November 30, 2022 (Unaudited) |
Name, Address &
Year of Birth* | Position(s) Held with Trust | Term of Office and Length of Time Served** | Principal Occupation(s) During Past 5 Years | Number of Portfolios in Fund Complex Overseen by Trustees*** | Other Directorships Held by Trustees |
Edmund J. Burke,
1961 | Trustee | Since
December 2017 | Mr. Burke joined ALPS in 1991 and served as the President and Director of ALPS Holdings, Inc., and ALPS Advisors, Inc., and Director of ALPS Distributors, Inc., ALPS Fund Services, Inc. (“ALPS”), and ALPS Portfolio Solutions Distributor, Inc. (collectively, the “ALPS Companies”). Mr. Burke retired from the ALPS Companies in June 2019. Mr. Burke is currently a partner at ETF Action, a web-based system that provides data and analytics to registered investment advisers, (since 2020) and a Director of Alliance Bioenergy Plus, Inc., a technology company focused on emerging technologies in the renewable energy, biofuels, and bioplastics technology sectors (since 2020). | 33 | Mr. Burke is a Trustee of Clough Global Dividend and Income Fund (1 fund); Clough Global Equity Fund (1 fund); Clough Global Opportunities Fund (1 fund); Clough Funds Trust (1 fund); Liberty All-Star Equity Fund (1 fund); Director of the Liberty All-Star Growth Fund, Inc. (1 fund) and Financial Investors Trust (29 funds). |
| * | The business address of the Trustee is c/o ALPS Advisors, Inc., 1290 Broadway, Suite 1000, Denver, Colorado 80203. |
| ** | This is the period for which the Trustee began serving the Trust. Each Trustee serves an indefinite term, until his or her successor is elected. |
| *** | The Fund Complex includes all series of the Trust and any other investment companies for which ALPS Advisors, Inc. provides investment advisory services. |
36 | November 30, 2022
Alerian Exchange Traded Funds
| Trustees & Officers | November 30, 2022 (Unaudited) |
OFFICERS:
| Name, Address and Year of Birth of Officer* | Position(s) Held with Trust | Length of Time Served** | Principal Occupation(s) During Past 5 Years |
Laton Spahr,
1975 | President | Since
June 2021 | Mr. Spahr joined ALPS in 2019 and currently serves as President and Portfolio Manager of AAI. Prior to his current role, Mr. Spahr was a Senior Vice President and Strategy Leader of the Value & Income Team for Oppenheimer Funds from 2013 to 2019. |
Matthew Sutula,
1985 | Chief Compliance Officer (“CCO”) | Since
December 2019 | Mr. Sutula joined ALPS in 2012 and currently serves as Chief Compliance Officer of AAI. Prior to his current role, Mr. Sutula served as interim Compliance Officer of the Trust (September 2019 to December 2019). Compliance Manager and Senior Compliance Analyst for AAI, as well as Compliance Analyst for AFS. Prior to joining ALPS, he spent seven years at Morningstar, Inc. in various analyst roles supporting the registered investment company databases. Mr. Sutula is also Chief Compliance Officer of Principal Real Estate Income Fund, ALPS Variable Investment Trust, Liberty All-Star Equity Fund and Liberty All-Star Growth Fund, Inc. From September 2019 to September 2022 he served as Chief Compliance Officer of RiverNorth Opportunities Fund, Inc. |
Kathryn Burns,
1976 | Treasurer | Since
September 2018 | Ms. Burns serves as Vice President, Director of Fund Operations of AAI since 2018. From 2013 to 2018, she served as Vice President and Fund Controller at AFS. Prior to joining ALPS, she worked at Old Mutual Capital where she served as Vice President and Chief Compliance Officer (2010 – 2012) and Regulatory Reporting Manager and Assistant Treasurer to the Old Mutual Funds Trusts (2006 – 2012). She also served as a CPA for PricewaterhouseCoopers LLP. Ms. Burns also serves as President of ALPS Variable Investment Trust and Principal Real Estate Income Fund. From June 2019 to September 2022 she served as President of RiverNorth Opportunities Fund, Inc. and from June 2018 to November 2021 she served as Treasurer of Boulder Growth & Income Fund, Inc. |
Michael P. Lawlor,
1969 | Secretary | Since
December 2022 | Mr. Lawlor joined ALPS in January 2022, and is currently Vice President and Principal Legal Counsel. Prior to joining ALPS, Mr. Lawlor was Lead Fund Counsel at Brighthouse Financial (insurance company) (January 2007-April 2021). Mr. Lawlor also serves as Secretary of Financial Investors Trust and ALPS Variable Investment Trust. |
| * | The business address of each Officer is c/o ALPS Advisors, Inc., 1290 Broadway, Suite 1000, Denver, Colorado 80203. Each Officer is deemed an affiliate of the Trust as defined under the 1940 Act. |
| ** | This is the period for which the Officer began serving the Trust. Each Officer serves an indefinite term, until his or her successor is elected. |
The Statement of Additional Information includes additional information about the Fund’s Trustees and is available, without charge, upon request by calling (toll-free) 1-866-759-5679.
37 | November 30, 2022


Table of Contents
| Performance Overview | 1 |
| Disclosure of Fund Expenses | 4 |
| Report of Independent Registered Public Accounting Firm | 5 |
| Financial Statements | |
| Schedule of Investments | 6 |
| Statement of Assets and Liabilities | 7 |
| Statement of Operations | 8 |
| Statements of Changes in Net Assets | 9 |
| Financial Highlights | 10 |
| Notes to Financial Statements | 11 |
| Additional Information | 17 |
| Board Considerations Regarding Approval of Investment Advisory Agreement and Investment Sub-Advisory Agreement | 18 |
| Trustees & Officers | 20 |
alpsfunds.com
ALPS Active REIT ETF
| Performance Overview | November 30, 2022 (Unaudited) |
Investment Objective
The ALPS Active REIT ETF (the "Fund") seeks total return through dividends and capital appreciation. The Fund will, under normal circumstances, seek to achieve its investment objective by investing at least 80% of its net assets in publicly traded equity securities of real estate investment trusts (“REITs”).
Performance Overview
Negative market returns driven by concerns over increasing interest rates and discount rates amid an uncertain economic backdrop continued throughout much of the fiscal year. These macro headwinds impacted virtually all risk assets, producing significant negative returns year-to-date for most asset classes, including REITs. Concerns about a weaker economy and a possible recession grew throughout the year as bearish market sentiment became the norm.
The S&P United States REIT Index declined 13.27% for the twelve months ended November 30, 2022. These strong valuation declines continued to be driven by negative macro headwinds. This dynamic environment and market volatility provided a backdrop where the concentrated, fundamental investment approach employed by the Fund was able to continue to deliver meaningful excess returns relative to its benchmark.
The investment strategy of the Fund produced returns of -10.17% for the twelve months ended November 30, 2022, net of all fees and expenses. In this difficult and volatile environment, the benefits of active management were clear as the portfolio was able to outperform its benchmark by 310 basis points year-to-date, net of all fees and expenses. The primary driver of the Fund’s excess returns this year has been stock selection. The contributions to this excess return have been broad-based in both property sectors and individual names. Since inception in February 2021, the Fund has outperformed its benchmark by 88 basis points, net of all fees and expenses.
The Fund continues to be concentrated with 28 total holdings and 57% of the portfolio invested in the ten largest positions. The dividend yield of the portfolio has increased from 2.5% to 3.9% since the beginning of the fiscal year, with reasonable dividend growth expected for the foreseeable future. The Fund maintained a quality bias through most of the year by having a majority of the portfolio invested in sector-leading companies with the best management teams, highest quality assets and strongest balance sheets. The Fund's sub-adviser has more recently begun to move the portfolio to a more balanced position, as some out-of-favor companies appear oversold and offer the potential for a meaningful bounce.
The negative returns during the year have resulted in much more favorable REIT valuation metrics. From December 31, 2021, through the most recent calendar quarter, the portfolio has gone from trading at an 8% premium to net asset value to a 21% discount, resulting from the fact that REITs have significantly sold off, while private market real estate values have declined approximately 10%. Industrial, retail, residential and storage property sectors are trading at NAV discounts between 20%-30%. The office sector, which has some obvious difficulties, remains valued at an NAV discount of approximately 50%. The Fund's sub-adviser believes fundamentals in most property types remain solid, with high occupancy levels and stable and increasing net operating income. The Fund's sub-adviser believes balance sheets are also in excellent shape with leverage levels of 25%. Given the asset quality, balance sheet strength, and operating fundamentals, these discounts appear greater than warranted, with history dictating that discounts at these levels will not persist.
Given the dramatic discounts observed in the public market, certain companies and asset portfolios have been sought after by investors with a long-term investment horizon. Notwithstanding wide bid/ask spreads in the market, there have been several significant transactions this year, including two fairly recent ones. First, the merger of Prologis and Duke Realty, announced in the second calendar quarter, closed on October 3, 2022. This merger creates an industrial property giant and the largest company in the REIT universe. The combined company has $175 billion in total market capitalization with a portfolio totaling 1.1 billion square feet of space that is 97.5% leased at rents that are 47% below market. At May 9, 2022, the offer represented a 31% premium to the share price of Duke Realty.
Second, STORE Capital Corporation, a net lease REIT that invests in single tenant operational real estate, entered into a definitive merger agreement under which institutional investors GIC and funds managed by Oak Street will acquire STORE Capital in an all-cash transaction valued at approximately $14 billion. Under the terms of the agreement, STORE Capital shareholders will receive $32.25 per share in cash, which represents a premium of 20% to STORE Capital’s closing stock price as of September 14, 2022. The transaction is expected to close in the first quarter of 2023.
As valuations in the REIT market continued to reset lower throughout the year, with an overall average discount to net asset value of 15%, the privatization transactions that have taken place this year are evidence of the disparity between public and private market pricing. They also reflect the attractiveness of how real estate is now priced in the public market. The Fund's sub-adviser believes REITs are positioned to perform relatively well from this point, cushioning any further negative market returns and participating in a recovering and/or high inflation environment. While there could be continued negative pressure on valuations, it seems there is more upside potential than downside risk with significant negativity already reflected in the current pricing of REITs. Of course, the future is unknown, but investing in REITs at large discounts to net asset value has led to historically favorable investment returns.
1 | November 30, 2022
ALPS Active REIT ETF
| Performance Overview | November 30, 2022 (Unaudited) |
Fund Performance (as of November 30, 2022)
| | 1 Year | Since Inception^ |
| ALPS Active REIT ETF - NAV | -10.17% | 5.34% |
| ALPS Active REIT ETF - Market Price* | -10.22% | 5.39% |
| S&P United States REIT Index | -13.27% | 4.48% |
Total Expense Ratio (per the current prospectus) is 0.68%.
Performance data quoted represents past performance. Past performance does not guarantee future results. Total return figures assume reinvestment of dividends and capital gains distributions, if any. The table does not reflect the deduction of taxes that a shareholder would pay on Fund distributions or the redemption of Fund shares. Investment return and principal value of an investment will fluctuate so that an investor’s shares, when sold or redeemed, may be worth more or less than the original cost. Current performance data may be higher or lower than actual data quoted. For the most current month-end performance data please visit www.alpsfunds.com or call 1.866.759.5679.
Net Asset Value (NAV) is an exchange-traded fund’s per-share value. The per-share dollar amount of the fund is derived by dividing the total value of all the securities in its portfolio, less any liabilities, by the number of fund shares outstanding. Market Price is the price at which a share can currently be traded in the market. Information detailing the number of days the Market Price of the Fund was greater than the Fund’s NAV and the number of days it was less than the Fund’s NAV can be obtained at www.alpsfunds.com.
| ^ | The Fund commenced operations on February 25, 2021, with the first day of trading on the exchange of February 26, 2021. |
| * | Market Price means the official closing price of a share or, if it more accurately reflects the market value of a share at the time as of which the Fund calculates current net asset value per share, the price that is the midpoint of the bid-ask spread as of that time. It does not represent the returns an investor would receive if shares were traded at other times. |
The S&P United States REIT Index defines and measures the investable universe of publicly traded real estate investment trusts domiciled in the United States.
One cannot invest directly in an index. Index performance does not reflect fund performance.
The Fund’s shares are not individually redeemable. Investors buy and sell shares of the Fund on a secondary market. Only market makers or “authorized participants” may trade directly with the Fund, typically in blocks of 5,000 shares.
The ALPS Active REIT ETF is not suitable for all investors. Investments in the Fund are subject to investment risks, including possible loss of the principal amount invested.
ALPS Portfolio Solutions Distributor, Inc., a FINRA member, is the Distributor for the ALPS Active REIT ETF.
2 | November 30, 2022
ALPS Active REIT ETF
| Performance Overview | November 30, 2022 (Unaudited) |
Top Ten Holdings* (as of November 30, 2022)
| Prologis, Inc. | 10.62% |
| Equinix, Inc. | 6.82% |
| Simon Property Group, Inc. | 6.78% |
| Public Storage | 6.18% |
| Realty Income Corp. | 5.29% |
| VICI Properties, Inc. | 4.99% |
| Welltower, Inc. | 4.95% |
| Equity Residential | 4.00% |
| Invitation Homes, Inc. | 3.85% |
| AvalonBay Communities, Inc. | 3.74% |
| Total % of Top 10 Holdings | 57.22% |
Sector Allocation* (as of November 30, 2022)
| Specialized REITs | 23.92% |
| Residential REITs | 18.22% |
| Retail REITs | 17.51% |
| Industrial REITs | 15.36% |
| Health Care REITs | 10.14% |
| Office REITs | 6.66% |
| Hotel & Resort REITs | 4.10% |
| Diversified REITs | 1.92% |
| Money Market Fund | 2.17% |
| Total | 100.00% |
Future holdings are subject to change.
Growth of $10,000 (as of November 30, 2022)
Comparison of change in value of a $10,000 investment in the Fund and the Index

The chart above compares historical performance of a hypothetical investment of $10,000 in the Fund since inception with the performance of the Fund’s benchmark index. Results include the reinvestment of all dividends and capital gains distributions. Past performance does not guarantee future results. The chart does not reflect the deduction of taxes that a shareholder would pay on Fund distributions or the redemption of Fund shares.
3 | November 30, 2022
ALPS Active REIT ETF
| Disclosure of Fund Expenses | November 30, 2022 (Unaudited) |
Shareholder Expense Example: As a shareholder of a Fund, you incur certain ongoing costs, including management fees and other Fund expenses. These examples are intended to help you understand your ongoing costs (in dollars) of investing in the Fund and to compare these costs with the ongoing costs of investing in other funds. The example is based on an investment of $1,000 invested at the beginning of the six month period and held through November 30, 2022.
Actual Return: The first line of the table provides information about actual account values and actual expenses. You may use the information in this line, together with the amount you invested, to estimate the expenses that you incurred over the period. Simply divide your account value by $1,000 (for example, an $8,600 account value divided by $1,000 = 8.6), then multiply the result by the number in the first line under the heading entitled “Expenses Paid During Period” to estimate the expenses attributable to your investment during this period.
Hypothetical 5% Return: The second line of the table provides information about hypothetical account values and hypothetical expenses based on the Fund’s actual expense ratio and an assumed rate of return of 5% per year before expenses, which is not the Fund’s actual return. The hypothetical account values and expenses may not be used to estimate the actual ending account balance or expenses you paid for the period. You may use this information to compare ongoing costs of investing in the Fund and other funds. To do so, compare this 5% hypothetical example with the 5% hypothetical examples that appear in the shareholder reports of other funds.
The expenses shown in the table are meant to highlight ongoing Fund costs only and do not reflect any transaction costs, such as brokerage commissions and other fees to financial intermediaries. Therefore, the second line of the table is useful in comparing ongoing costs only, and will not help you determine the relative total costs of owning different funds. In addition, if these costs were included, your costs would have been higher.
| | Beginning Account Value | Ending Account Value | Expense | Expenses Paid During Period |
| | 6/1/22 | 11/30/22 | Ratio(a) | 6/1/22 - 11/30/22(b) |
| ALPS Active REIT ETF |
| Actual | $1,000.00 | $935.90 | 0.68% | $3.30 |
| Hypothetical (5% return before expenses) | $1,000.00 | $1,021.66 | 0.68% | $3.45 |
| (a) | Annualized, based on the Fund's most recent fiscal half year expenses. |
| (b) | Expenses are equal to the Fund's annualized expense ratio multiplied by the average account value over the period, multiplied by the number of days in the most recent fiscal half year (183), divided by 365. |
4 | November 30, 2022
ALPS Active REIT ETF
Report of Independent Registered Public Accounting Firm
To the Board of Trustees of ALPS ETF Trust and the Shareholders of ALPS Active REIT ETF
Opinion on the Financial Statements
We have audited the accompanying statement of assets and liabilities of ALPS Active REIT ETF, a series of shares of beneficial interest in ALPS ETF Trust (the “Fund”), including the schedule of investments, as of November 30, 2022, and the related statements of operations and changes in net assets and the financial highlights for the year then ended, and the related notes (collectively referred to as the “financial statements”). In our opinion, the financial statements present fairly, in all material respects, the financial position of the Fund as of November 30, 2022, and the results of its operations, the changes in its net assets, and its financial highlights for the year then ended, in conformity with accounting principles generally accepted in the United States of America. The statement of changes in net assets and the financial highlights for the period from February 25, 2021 (commencement of operations) through November 30, 2021, were audited by other auditors whose report dated January 26, 2022 expressed an unqualified opinion on those financial statements and financial highlights.
Basis for Opinion
These financial statements are the responsibility of the Fund’s management. Our responsibility is to express an opinion on the Fund's financial statements based on our audit. We are a public accounting firm registered with the Public Company Accounting Oversight Board (United States) (“PCAOB”) and are required to be independent with respect to the Fund in accordance with the U.S. federal securities law and the applicable rules and regulations of the Securities and Exchange Commission and the PCAOB.
We conducted our audit in accordance with the standards of the PCAOB. Those standards require that we plan and perform the audit to obtain reasonable assurance about whether the financial statements are free of material misstatement, whether due to error or fraud. The Fund is not required to have, nor were we engaged to perform, an audit of its internal control over financial reporting. As part of our audit we are required to obtain an understanding of internal control over financial reporting but not for the purpose of expressing an opinion on the effectiveness of the Fund’s internal control over financial reporting. Accordingly, we express no such opinion.
Our audit included performing procedures to assess the risk of material misstatement of the financial statements, whether due to error or fraud, and performing procedures that respond to those risks. Such procedures included examining, on a test basis, evidence regarding the amounts and disclosures in the financial statements. Our procedures included confirmation of securities owned as of November 30, 2022 by correspondence with the custodian, brokers, or by other appropriate auditing procedures where replies from brokers were not received. Our audit also included evaluating the accounting principles used and significant estimates made by management, as well as evaluating the overall presentation of the financial statements. We believe that our audit provides a reasonable basis for our opinion.

BBD, LLP
We have served as the auditor of one or more of the Funds in the ALPS ETF Trust since 2022.
Philadelphia, Pennsylvania
January 27, 2023
5 | November 30, 2022
ALPS Active REIT ETF
| Schedule of Investments | November 30, 2022 |
| Security Description | | Shares | | | Value | |
| COMMON STOCKS (97.97%) | | | | | | | | |
| Diversified REITs (1.93%) | | | | | | | | |
| WP Carey, Inc. | | | 4,412 | | | $ | 347,666 | |
| | | | | | | | | |
| Health Care REITs (10.16%) | | | | | | | | |
| Healthpeak Properties, Inc. | | | 25,582 | | | | 671,783 | |
| Sabra Health Care REIT, Inc. | | | 20,579 | | | | 265,675 | |
| Welltower, Inc. | | | 12,595 | | | | 894,623 | |
| Total Health Care REITs | | | | | | | 1,832,081 | |
| | | | | | | | | |
| Hotel & Resort REITs (4.11%) | | | | | | | | |
| Host Hotels & Resorts, Inc. | | | 27,721 | | | | 525,036 | |
| Park Hotels & Resorts, Inc. | | | 16,813 | | | | 215,711 | |
| Total Hotel & Resort REITs | | | | | | | 740,747 | |
| | | | | | | | | |
| Industrial REITs (15.38%) | | | | | | | | |
| First Industrial Realty Trust, | | | | | | | | |
| Inc. | | | 6,694 | | | | 338,382 | |
| Prologis, Inc. | | | 16,297 | | | | 1,919,623 | |
| Rexford Industrial Realty, Inc. | | | 9,358 | | | | 517,404 | |
| Total Industrial REITs | | | | | | | 2,775,409 | |
| | | | | | | | | |
| Office REITs (6.67%) | | | | | | | | |
| Boston Properties, Inc. | | | 6,666 | | | | 480,485 | |
| Highwoods Properties, Inc. | | | 18,843 | | | | 561,522 | |
| Kilroy Realty Corp. | | | 3,747 | | | | 161,945 | |
| Total Office REITs | | | | | | | 1,203,952 | |
| | | | | | | | | |
| Residential REITs (18.24%) | | | | | | | | |
| AvalonBay Communities, Inc. | | | 3,867 | | | | 676,338 | |
| Equity Residential | | | 11,135 | | | | 722,217 | |
| Invitation Homes, Inc. | | | 21,343 | | | | 696,422 | |
| Mid-America Apartment | | | | | | | | |
| Communities, Inc. | | | 3,615 | | | | 596,041 | |
| Sun Communities, Inc. | | | 4,081 | | | | 599,499 | |
| Total Residential REITs | | | | | | | 3,290,517 | |
| | | | | | | | | |
| Retail REITs (17.54%) | | | | | | | | |
| Agree Realty Corp. | | | 3,343 | | | | 233,843 | |
| Federal Realty Investment | | | | | | | | |
| Trust | | | 3,668 | | | | 407,515 | |
| Realty Income Corp. | | | 15,152 | | | | 955,637 | |
| Simon Property Group, Inc. | | | 10,261 | | | | 1,225,573 | |
| SITE Centers Corp. | | | 25,115 | | | | 341,313 | |
| Total Retail REITs | | | | | | | 3,163,881 | |
| | | | | | | | | |
| Specialized REITs (23.94%) | | | | | | | | |
| Digital Realty Trust, Inc. | | | 4,252 | | | | 478,180 | |
| Equinix, Inc. | | | 1,783 | | | | 1,231,428 | |
| | | | | | | | | |
| Security Description | | Shares | | | Value | |
| Specialized REITs (continued) | | | | | | | | |
| Life Storage, Inc. | | | 5,525 | | | $ | 593,882 | |
| Public Storage | | | 3,746 | | | | 1,116,158 | |
| VICI Properties, Inc. | | | 26,338 | | | | 900,760 | |
| Total Specialized REITs | | | | | | | 4,320,408 | |
| | | | | | | | | |
| TOTAL COMMON STOCKS | | | | | | | | |
| (Cost $18,081,505) | | | | | | | 17,674,661 | |
| | | 7 Day Yield | | | Shares | | | Value | |
| SHORT TERM INVESTMENTS(2.18%) | | | | | | | | | | | | |
| Money Market Fund (2.18%) | | | | | | | | | | | | |
| State Street Institutional Treasury Plus Money Market Fund(Premier Class) | | | 3.69 | % | | | 392,506 | | | | 392,506 | |
| | | | | | | | | | | | | |
| TOTAL SHORT TERM INVESTMENTS | | | | | | | | | | | | |
| (Cost $392,506) | | | | | | | | | | | 392,506 | |
| TOTAL INVESTMENTS (100.15%) | | | | | | | | | | | | |
| (Cost $18,474,011) | | | | | | | | | | $ | 18,067,167 | |
| LIABILITIES IN EXCESS OF OTHER ASSETS (-0.15%) | | | | | | | | | | | (26,881 | ) |
| NET ASSETS - 100.00% | | | | | | | | | | $ | 18,040,286 | |
See Notes to Financial Statements.
6 | November 30, 2022
| Statement of Assets and Liabilities | November 30, 2022 |
| ASSETS: | | | |
| Investments, at value | | $ | 18,067,167 | |
| Receivable for investments sold | | | 340,449 | |
| Dividends receivable | | | 20,409 | |
| Total Assets | | | 18,428,025 | |
| | | | | |
| LIABILITIES: | | | | |
| Payable for investments purchased | | | 378,088 | |
| Payable to adviser | | | 9,651 | |
| Total Liabilities | | | 387,739 | |
| NET ASSETS | | $ | 18,040,286 | |
| | | | | |
| NET ASSETS CONSIST OF: | | | | |
| Paid-in capital | | $ | 19,354,685 | |
| Total distributable earnings/(accumulated losses) | | | (1,314,399 | ) |
| NET ASSETS | | $ | 18,040,286 | |
| INVESTMENTS, AT COST | | $ | 18,474,011 | |
| | | | | |
| PRICING OF SHARES | | | | |
| Net Assets | | $ | 18,040,286 | |
| Shares of beneficial interest outstanding (Unlimited number of shares authorized, par value $0.01 per share) | | | 715,002 | |
| Net Asset Value, offering and redemption price per share | | $ | 25.23 | |
See Notes to Financial Statements.
7 | November 30, 2022
ALPS Active REIT ETF
| Statement of Operations | For the Year Ended November 30, 2022 |
| INVESTMENT INCOME: | | | |
| Dividends | | $ | 520,184 | |
| Securities Lending Income | | | 30 | |
| Total Investment Income | | | 520,214 | |
| | | | | |
| EXPENSES: | | | | |
| Investment adviser fees | | | 133,745 | |
| Total Expenses | | | 133,745 | |
| NET INVESTMENT INCOME | | | 386,469 | |
| | | | | |
| REALIZED AND UNREALIZED GAIN/(LOSS): | | | | |
| Net realized gain on investments(a) | | | 76,312 | |
| Net change in unrealized depreciation on investments | | | (2,499,595 | ) |
| NET REALIZED AND UNREALIZED LOSS ON INVESTMENTS | | | (2,423,283 | ) |
| NET DECREASE IN NET ASSETS RESULTING FROM OPERATIONS | | $ | (2,036,814 | ) |
| (a) | Includes realized gain or loss as a result of in-kind transactions (See Note 4 in Notes to Financial Statements). |
See Notes to Financial Statements.
8 | November 30, 2022
ALPS Active REIT ETF
| Statements of Changes in Net Assets |
| | | For the Year Ended November 30, 2022 | | | For the Period February 25, 2021 (Commencement of Operations) to November 30, 2021 | |
| OPERATIONS: | | | | | | |
| Net investment income | | $ | 386,469 | | | $ | 238,110 | |
| Net realized gain | | | 76,312 | | | | 718,062 | |
| Net change in unrealized appreciation/(depreciation) | | | (2,499,595 | ) | | | 2,092,751 | |
| Net increase/(decrease) in net assets resulting from operations | | | (2,036,814 | ) | | | 3,048,923 | |
| | | | | | | | | |
| DISTRIBUTIONS TO SHAREHOLDERS: | | | | | | | | |
| From distributable earnings | | | (1,095,528 | ) | | | (277,240 | ) |
| From tax return of capital | | | (83,271 | ) | | | – | |
| Total distributions | | | (1,178,799 | ) | | | (277,240 | ) |
| | | | | | | | | |
| CAPITAL SHARE TRANSACTIONS: | | | | | | | | |
| Proceeds from sale of shares | | | 4,984,526 | | | | 21,611,468 | |
| Cost of shares redeemed | | | (7,966,498 | ) | | | (145,280 | ) |
| Net increase/(decrease) from capital share transactions | | | (2,981,972 | ) | | | 21,466,188 | |
| Net increase/(decrease) in net assets | | | (6,197,585 | ) | | | 24,237,871 | |
| | | | | | | | | |
| NET ASSETS: | | | | | | | | |
| Beginning of period | | | 24,237,871 | | | | – | |
| End of year | | $ | 18,040,286 | | | $ | 24,237,871 | |
| | | | | | | | | |
| OTHER INFORMATION: | | | | | | | | |
| CAPITAL SHARE TRANSACTIONS: | | | | | | | | |
| Beginning shares | | | 820,002 | | | | – | |
| Shares sold | | | 175,000 | | | | 825,002 | |
| Shares redeemed | | | (280,000 | ) | | | (5,000 | ) |
| Shares outstanding, end of period | | | 715,002 | | | | 820,002 | |
See Notes to Financial Statements.
9 | November 30, 2022
| Financial Highlights | For a Share Outstanding Throughout the Periods Presented |
| | | For the Year Ended November 30, 2022 | | | For the Period February 25, 2021 (Commencement of Operations) to November 30, 2021 | |
| NET ASSET VALUE, BEGINNING OF PERIOD | | $ | 29.56 | | | $ | 24.62 | |
| | | | | | | | | |
| INCOME FROM OPERATIONS: | | | | | | | | |
| Net investment income(a) | | | 0.54 | | | | 0.37 | |
| Net realized and unrealized gain/(loss) | | | (3.39 | ) | | | 5.01 | |
| Total from investment operations | | | (2.85 | ) | | | 5.38 | |
| | | | | | | | | |
| DISTRIBUTIONS: | | | | | | | | |
| From net investment income | | | (0.53 | ) | | | (0.38 | ) |
| From net realized gains | | | (0.83 | ) | | | (0.06 | ) |
| From tax return of capital | | | (0.12 | ) | | | – | |
| Total distributions | | | (1.48 | ) | | | (0.44 | ) |
| | | | | | | | | |
| NET INCREASE/(DECREASE) IN NET ASSET VALUE | | | (4.33 | ) | | | 4.94 | |
| NET ASSET VALUE, END OF PERIOD | | $ | 25.23 | | | $ | 29.56 | |
| TOTAL RETURN(b) | | | (10.17 | )% | | | 22.01 | % |
| | | | | | | | | |
| RATIOS/SUPPLEMENTAL DATA: | | | | | | | | |
| Net assets, end of period (in 000s) | | $ | 18,040 | | | $ | 24,238 | |
| | | | | | | | | |
| RATIOS TO AVERAGE NET ASSETS | | | | | | | | |
| Ratio of expenses to average net assets | | | 0.68 | % | | | 0.68 | %(c) |
| Ratio of net investment income to average net assets | | | 1.96 | % | | | 1.69 | %(c) |
| Portfolio turnover rate(d) | | | 120 | % | | | 92 | % |
| (a) | Based on average shares outstanding during the period. |
| (b) | Total return is calculated assuming an initial investment made at the net asset value at the beginning of the period and redemption at the net asset value on the last day of the year and assuming all distributions are reinvested at the reinvestment prices. Total return calculated for a period of less than one year is not annualized. |
| (d) | Portfolio turnover for periods less than one year are not annualized and does not include securities received or delivered from processing creations or redemptions in-kind. |
See Notes to Financial Statements.
10 | November 30, 2022
ALPS Active REIT ETF
| Notes to Financial Statements | November 30, 2022 |
1. ORGANIZATION
ALPS ETF Trust (the “Trust”), a Delaware statutory trust, is an open-end management investment company registered under the Investment Company Act of 1940, as amended (the “1940 Act”). As of November 30, 2022, the Trust consisted of twenty-three separate portfolios. Each portfolio represents a separate series of the Trust. This report pertains solely to the ALPS Active REIT ETF (the “Fund”). The investment objective of the Fund is to seek total return through dividends and capital appreciation. The Fund is considered non-diversified and may invest a greater portion of assets in securities of individual issuers than a diversified fund. As a result, changes in the market value of a single investment could cause greater fluctuations in share price than would occur in a diversified fund.
The Fund’s Shares (“Shares”) are listed on the Nasdaq Stock Market LLC (“Nasdaq Exchange”). The Fund issues and redeems Shares, at net asset value (“NAV”) in blocks of 5,000 Shares, each of which is called a “Creation Unit”. Creation Units are issued and redeemed principally in-kind for securities. Except when aggregated in Creation Units, Shares are not redeemable securities of the Fund.
Pursuant to the Trust’s organizational documents, its Officers and Trustees are indemnified against certain liability arising out of the performance of their duties to the Trust. Additionally, in the normal course of business, the Trust enters into contracts with service providers that contain general indemnification clauses. The Trust’s maximum exposure under these arrangements is unknown, as this would involve future claims that may be made against the Trust that have not yet occurred.
2. SIGNIFICANT ACCOUNTING POLICIES
The following is a summary of significant accounting policies consistently followed by the Fund in the preparation of the financial statements. The accompanying financial statements were prepared in accordance with accounting principles generally accepted in the United States of America (“U.S. GAAP”). The preparation of financial statements in conformity with U.S. GAAP requires management to make certain estimates and assumptions that affect the reported amounts of assets and liabilities and disclosures of contingent assets and liabilities at the date of the financial statements and the reported amounts of revenue and expenses during the period. Actual results could differ from those estimates. The Fund is considered an investment company under U.S. GAAP and follows the accounting and reporting guidance applicable to investment companies in the Financial Accounting Standards Board (“FASB”) Accounting Standards Codification Topic 946.
A. Portfolio Valuation
The Fund’s NAV is determined daily, as of the close of regular trading on the New York Stock Exchange ("NYSE"), normally 4:00 p.m. Eastern Time, on each day the NYSE is open for trading. The NAV is computed by dividing the value of all assets of the Fund (including accrued interest and dividends), less all liabilities (including accrued expenses and dividends declared but unpaid), by the total number of shares outstanding.
Portfolio securities listed on any exchange other than the NASDAQ Stock Market LLC (“NASDAQ”) are valued at the last sale price on the business day as of which such value is being determined. If there has been no sale on such day, the securities are valued at the mean of the most recent bid and ask prices on such day. Securities traded on the NASDAQ are valued at the NASDAQ Official Closing Price as determined by NASDAQ. Portfolio securities traded on more than one securities exchange are valued at the last sale price on the business day as of which such value is being determined at the close of the exchange representing the principal market for such securities. Portfolio securities traded in the over-the-counter market, but excluding securities traded on the NASDAQ, are valued at the last quoted sale price in such market.
The Fund’s investments are valued at market value or, in the absence of market value with respect to any portfolio securities, at fair value according to procedures adopted by the Trust’s Board of Trustees (the “Board”). Pursuant to Rule 2a-5 under the 1940 Act, the Board designated ALPS Advisors, Inc. (the "Adviser") as the valuation designee ("Valuation Designee") for each Fund to perform the fair value determinations relating to Fund investments. The Adviser may carry out its designated responsibilities as Valuation Designee through various teams and committees. When market quotations are not readily available or when events occur that make established valuation methods unreliable, securities of the Fund may be valued in good faith by the Valuation Designee. These securities generally include, but are not limited to, restricted securities (securities which may not be publicly sold without registration under the Securities Act of 1933) for which a pricing service is unable to provide a market price; securities whose trading has been formally suspended; a security whose market price is not available from a pre-established primary pricing source or the pricing source is not willing to provide a price; a security with respect to which an event has occurred that is most likely to materially affect the value of the security after the market has closed but before the calculation of the Fund’s NAV or make it difficult or impossible to obtain a reliable market quotation; or a security whose price, as provided by the pricing service, does not reflect the security’s “fair value” due to the security being de-listed from a national exchange or the security’s primary trading market is temporarily closed at a time when, under normal conditions, it would be open. As a general principle, the current “fair value” of a security would be the amount which the owner might reasonably expect to receive from the sale on the applicable exchange or principal market. A variety of factors may be considered in determining the fair value of such securities.
11 | November 30, 2022
ALPS Active REIT ETF
| Notes to Financial Statements | November 30, 2022 |
B. Fair Value Measurements
The Fund discloses the classification of its fair value measurements following a three-tier hierarchy based on the inputs used to measure fair value. Inputs refer broadly to the assumptions that market participants would use in pricing the asset or liability, including assumptions about risk. Inputs may be observable or unobservable. Observable inputs reflect the assumptions market participants would use in pricing the asset or liability that are developed based on market data obtained from sources independent of the reporting entity. Unobservable inputs reflect the reporting entity’s own assumptions about the assumptions market participants would use in pricing the asset or liability that are developed based on the best information available.
Valuation techniques used to value the Fund’s investments by major category are as follows:
Equity securities, including restricted securities, for which market quotations are readily available, are valued at the last reported sale price or official closing price as reported by a third party pricing vendor on the primary market or exchange on which they are traded and are categorized as Level 1 in the hierarchy. In the event there were no sales during the day or closing prices are not available, securities are valued at the mean of the most recent quoted bid and ask prices on such day and are generally categorized as Level 2 in the hierarchy. Investments in open-end mutual funds are valued at their closing NAV each business day and are categorized as Level 1 in the hierarchy.
Changes in valuation techniques may result in transfers in or out of an assigned level within the disclosure hierarchy.
Various inputs are used in determining the value of the Fund’s investments as of the end of the reporting period. When inputs used fall into different levels of the fair value hierarchy, the level in the hierarchy within which the fair value measurement falls is determined based on the lowest level input that is significant to the fair value measurement in its entirety. The designated input levels are not necessarily an indication of the risk or liquidity associated with these investments.
These inputs are categorized in the following hierarchy under applicable financial accounting standards:
| Level 1 | – | Unadjusted quoted prices in active markets for identical investments, unrestricted assets or liabilities that a Fund has the ability to access at the measurement date; |
| Level 2 | – | Quoted prices which are not active, quoted prices for similar assets or liabilities in active markets or inputs other than quoted prices that are observable (either directly or indirectly) for substantially the full term of the asset or liability; and |
| Level 2 | – | Significant unobservable prices or inputs (including the Fund’s own assumptions in determining the fair value of investments) where there is little or no market activity for the asset or liability at the measurement date. |
The following is a summary of the inputs used to value the Fund’s investments as of November 30, 2022:
ALPS Active REIT ETF
| Investments in Securities at Value | | Level 1 - Quoted and Unadjusted Prices | | | Level 2 - Other Significant Observable Inputs | | | Level 3 - Significant Unobservable Inputs | | | Total | |
| Common Stocks* | | $ | 17,674,661 | | | $ | – | | | $ | – | | | $ | 17,674,661 | |
| Short Term Investments | | | 392,506 | | | | – | | | | – | | | | 392,506 | |
| Total | | $ | 18,067,167 | | | $ | – | | | $ | – | | | $ | 18,067,167 | |
| * | For a detailed breakdown of sectors, see the accompanying Schedule of Investments. |
The Fund did not have any securities that used significant unobservable inputs (Level 3) in determining fair value and there were no transfers into or out of Level 3 during the year ended November 30, 2022.
C. Securities Transactions and Investment Income
Securities transactions are recorded as of the trade date. Realized gains and losses from securities transactions are recorded on the specific identification in accordance with GAAP. Dividend income and capital gains distributions, if any, are recorded on the ex-dividend date. Interest income, if any, is recorded on the accrual basis.
D. Dividends and Distributions to Shareholders
Dividends from net investment income of the Fund, if any, are declared and paid quarterly or as the Board may determine from time to time. Distributions of net realized capital gains earned by the Fund, if any, are distributed at least annually.
12 | November 30, 2022
ALPS Active REIT ETF
| Notes to Financial Statements | November 30, 2022 |
E. Federal Tax and Tax Basis Information
The timing and character of income and capital gain distributions are determined in accordance with income tax regulations, which may differ from U.S. GAAP. Reclassifications are made to the Fund’s capital accounts for permanent tax differences to reflect income and gains available for distribution (or available capital loss carryforwards) under income tax regulations.
For the year ended November 30, 2022, the following reclassifications, which had no impact on results of operations or net assets, were recorded to reflect permanent tax differences resulting primarily from in-kind transactions:
| Fund | | Paid-in Capital | | | Total Distributable Earnings/(Accumulated Losses) | |
| ALPS Active REIT ETF | | $ | 958,443 | | | $ | (958,443 | ) |
The tax character of the distributions paid during the year ended November 30, 2022 and the fiscal period ended November 30, 2021 was as follows:
| Fund | | Ordinary Income | | | Long-Term Capital Gain | | | Return of Capital | |
| November 30, 2022 | | | | | | | | | |
| ALPS Active REIT ETF | | $ | 1,070,973 | | | $ | 24,555 | | | $ | 83,271 | |
| Fund | | Ordinary Income | | | Long-Term Capital Gain | | | Return of Capital | |
| November 30, 2021 | | | | | | | | | |
| ALPS Active REIT ETF | | $ | 277,240 | | | $ | – | | | $ | – | |
The character of distributions made during the year may differ from its ultimate characterization for federal income tax purposes.
Under current law, capital losses maintain their character as short-term or long-term and are carried forward to the next tax year without expiration. As of November 30, 2022, the following amounts are available as carry forwards to the next tax year:
| Fund | | Short-Term | | | Long-Term | |
| ALPS Active REIT ETF | | $ | 875,539 | | | $ | – | |
As of November 30, 2022, the components of distributable earnings/(accumulated losses) on a tax basis were as follows:
| Fund | | Accumulated Net Investment Income | | | Accumulated Net Realized Gain/(Loss) on Investments | | | Other Accumulated Gains | | | Net Unrealized Appreciation/(Depreciation) on Investments | | | Total | |
| ALPS Active REIT ETF | | $ | – | | | $ | (875,539 | ) | | $ | – | | | $ | (438,860 | ) | | $ | (1,314,399 | ) |
As of November 30, 2022, the cost of investments for federal income tax purposes and accumulated net unrealized appreciation/(depreciation) on investments were as follows:
| | | ALPS Active REIT ETF | |
| Gross appreciation (excess of value over tax cost) | | $ | 796,643 | |
| Gross depreciation (excess of tax cost over value) | | | (1,235,503 | ) |
| Net unrealized appreciation/(depreciation) | | $ | (438,860 | ) |
| Cost of investments for income tax purposes | | $ | 18,506,027 | |
The differences between book-basis and tax-basis are primarily due to the deferral of losses from wash sales.
F. Real Estate Investment Trusts (“REITs”)
As part of its investments in real estate related securities, the Fund will invest in REITs and is subject to certain risks associated with direct investment in REITs. REITs possess certain risks which differ from an investment in common stocks. REITs are financial vehicles that pool investors’ capital to acquire, develop and/or finance real estate and provide services to their tenants. REITs may concentrate their investments in specific geographic areas or in specific property types, e.g., regional malls, shopping centers, office buildings, apartment buildings and industrial warehouses. REITs may be affected by changes in the value of their underlying properties and by defaults by borrowers or tenants. REITs depend generally on their ability to generate cash flow to make distributions to shareowners, and certain REITs have self-liquidation provisions by which mortgages held may be paid in full and distributions of capital returns may be made at any time.
13 | November 30, 2022
ALPS Active REIT ETF
| Notes to Financial Statements | November 30, 2022 |
As REITs generally pay a higher rate of dividends than most other operating companies, to the extent application of the Fund's investment strategy results in the Fund investing in REIT shares, the percentage of the Fund's dividend income received from REIT shares will likely exceed the percentage of the Fund's portfolio that is comprised of REIT shares. Distributions received by the Fund from REITs may consist of dividends, capital gains and/or return of capital.
Dividend income from REITs is recognized on the ex-dividend date. The calendar year-end amounts of ordinary income, capital gains, and return of capital included in distributions received from the Fund's investments in REITs are reported to the Fund after the end of the calendar year; accordingly, the Fund estimates these amounts for accounting purposes until the characterization of REIT distributions is reported to the Fund after the end of the calendar year. Estimates are based on the most recent REIT distribution information available.
The performance of a REIT may be affected by its failure to qualify for tax-free pass-through of income under the Internal Revenue Code of 1986, as amended (the “Code”), or its failure to maintain exemption from registration under the 1940 Act. Due to the Fund's investments in REITs, the Fund may also make distributions in excess of the Fund's earnings and capital gains. Distributions, if any, in excess of the Fund's earnings and profits will first reduce the adjusted tax basis of a holder’ shares and, after that basis has been reduced to zero, will constitute capital gains to the shareholder.
G. Income Taxes
No provision for income taxes is included in the accompanying financial statements, as the Fund intends to distribute to shareholders all taxable investment income and realized gains and otherwise comply with Subchapter M of the Code applicable to regulated investment companies. The Fund evaluates tax positions taken (or expected to be taken) in the course of preparing the Fund’s tax returns to determine whether these positions meet a “more-likely-than-not” standard that, based on the technical merits, have a more than fifty percent likelihood of being sustained by a taxing authority upon examination. A tax position that meets the “more-likely-than-not” recognition threshold is measured to determine the amount of benefit to recognize in the financial statements.
As of and during the year ended November 30, 2022, the Fund did not have a liability for any unrecognized tax benefits. The Fund files U.S. federal, state, and local tax returns as required. The Fund’s tax returns are subject to examination by the relevant tax authorities until expiration of the applicable statute of limitations, which is generally three years after the filing of the tax return, but may extend to four years in certain jurisdictions. Tax returns for open years have incorporated no uncertain tax positions that require a provision for income taxes.
H. Lending of Portfolio Securities
The Fund has entered into a securities lending agreement with State Street Bank & Trust Co. (“SSB”), the Fund’s lending agent. The Fund may lend its portfolio securities only to borrowers that are approved by SSB. The Fund will limit such lending to not more than 33 1/3% of the value of its total assets. The Fund’s securities held at SSB as custodian shall be available to be lent except those securities the Fund or ALPS Advisors, Inc. specifically identifies in writing as not being available for lending. The borrower pledges and maintains with the Fund collateral consisting of cash (U.S. Dollars only), securities issued or guaranteed by the U.S. government or its agencies or instrumentalities, and cash equivalents (including irrevocable bank letters of credit) issued by a person other than the borrower or an affiliate of the borrower. The initial collateral received by the Fund is required to have a value of no less than 102% of the market value of the loaned securities for U.S equity securities and a value of no less than 105% of the market value for non-U.S. equity securities. The collateral is maintained thereafter, at a market value equal to not less than 102% of the current value of the U.S. equity securities on loan and not less than 105% of the current value of the non-U.S. equity securities on loan. The market value of the loaned securities is determined at the close of each business day and any additional required collateral is delivered to the Fund on the next business day. During the term of the loan, the Fund is entitled to all distributions made on or in respect of the loaned securities. Loans of securities are terminable at any time and the borrower, after notice, is required to return borrowed securities within the customary time period for settlement of securities transactions.
Any cash collateral received is reinvested in a money market fund managed by SSB as disclosed in the Fund’s Schedule of Investments and is reflected in the Statements of Assets and Liabilities as a payable for collateral upon return of securities loaned. Non-cash collateral, in the form of securities issued or guaranteed by the U.S. government or its agencies or instrumentalities, is not disclosed in the Fund’s Statements of Assets and Liabilities as it is held by the lending agent on behalf of the Fund, and the Fund does not have the ability to re-hypothecate these securities. Income earned by the Fund from securities lending activity is disclosed in the Statement of Operations. As of November 30, 2022, the Fund did not have any securities on loan.
14 | November 30, 2022
ALPS Active REIT ETF
| Notes to Financial Statements | November 30, 2022 |
3. INVESTMENT ADVISORY FEE AND OTHER AFFILIATED TRANSACTIONS
ALPS Advisors, Inc. serves as the Fund’s investment adviser pursuant to an Investment Advisory Agreement with the Trust on behalf of the Fund (the “Advisory Agreement”). Pursuant to the Advisory Agreement, the Fund pays the Adviser an annual management fee for the services and facilities it provides, payable on a monthly basis at the annual rate of 0.68% of the Fund’s average daily net assets.
Out of the unitary management fee, the Adviser pays substantially all expenses of the Fund, including the cost of sub-advisory, transfer agency, custody, fund administration, legal, audit, trustees and other services, except for acquired fund fees and expenses, interest expenses, distribution fees or expenses, brokerage expenses, taxes and extraordinary expenses not incurred in the ordinary course of the Fund's business. The Adviser’s unitary management fee is designed to pay substantially all of the Fund’s expenses and to compensate the Adviser for providing services to the Fund.
GSI Capital Advisors LLC (the “Sub-Adviser”) serves as the Fund's sub-adviser pursuant to a sub-advisory agreement with the Trust (the ‘‘Sub-Advisory Agreement’’). Pursuant to the Sub-Advisory Agreement, the Adviser pays the Sub-Adviser a sub-advisory fee out of the Adviser’s advisory fee for the services it provides. The fee is payable on a monthly basis at the annual rate of 0.35% of the Fund's average daily net assets.
ALPS Fund Services, Inc., an affiliate of the Adviser, is the administrator of the Fund.
Effective February 16, 2022, each Trustee receives (1) a quarterly retainer of $20,000, (2) a per meeting fee of $10,000, (3) $2,500 for any special meeting held outside of a regularly scheduled board meeting, and (4) reimbursement for all reasonable out-of-pocket expenses relating to attendance at meetings. In addition, the Chairman of the Board receives a quarterly retainer of $5,000, the Chairman of the Audit Committee receives a quarterly retainer of $3,000, and the Chairman of the Nominating & Governance Committee receives a quarterly retainer of $2,000, each in connection with their respective roles. Prior to February 16, 2022, each Trustee received (1) a quarterly retainer of $10,000, (2) a per meeting fee of $5,000, (3) $1,500 for any special meeting held outside of a regularly scheduled board meeting, and (4) reimbursement for all reasonable out-of-pocket expenses relating to attendance at meetings. In addition, the Chairman of the Board and Chairman of the Audit Committee each received a quarterly retainer of $2,000, in connection with their respective roles.
4. PURCHASES AND SALES OF SECURITIES
For the year ended November 30, 2022, the cost of purchases and proceeds from sales of investment securities, excluding short-term investments and in-kind transactions, were as follows:
| Fund | | Purchases | | | Sales | |
| ALPS Active REIT ETF | | $ | 23,344,267 | | | $ | 23,830,120 | |
For the year ended November 30, 2022, the cost of in-kind purchases and proceeds from in-kind sales were as follows:
| Fund | | Purchases | | | Sales | |
| ALPS Active REIT ETF | | $ | 4,820,916 | | | $ | 7,753,542 | |
For the year ended November 30, 2022, the ALPS Active REIT ETF had in-kind net realized gain of $960,264.
Gains on in-kind transactions are not considered taxable for federal income tax purposes and losses on in-kind transactions are also not deductible for tax purposes.
5. CAPITAL SHARE TRANSACTIONS
Shares are created and redeemed by the Fund only in Creation Unit size aggregations of 5,000 Shares. Only broker-dealers or large institutional investors with creation and redemption agreements called Authorized Participants (“AP”) are permitted to purchase or redeem Creation Units from the Fund. Such transactions are generally permitted on an in-kind basis, with a balancing cash component to equate the transaction to the NAV per unit of the Fund on the transaction date. Cash may be substituted equivalent to the value of certain securities generally when they are not available in sufficient quantity for delivery, not eligible for trading by the AP or as a result of other market circumstances.
15 | November 30, 2022
ALPS Active REIT ETF
| Notes to Financial Statements | November 30, 2022 |
6. MARKET RISK
The Fund is subject to investment and operational risks associated with financial, economic and other global market developments and disruptions, including the recent spread of an infectious respiratory illness caused by a novel strain of coronavirus (known as COVID-19), which can negatively impact the securities markets and cause the Fund to lose value. Securities in the Fund’s portfolio may underperform in comparison to securities in general financial markets, a particular financial market or other asset classes due to a number of factors, including inflation (or expectations for inflation), deflation (or expectations for deflation), interest rates, global demand for particular products or resources, market instability, debt crises and downgrades, embargoes, tariffs, sanctions and other trade barriers, regulatory events, other governmental trade or market control programs and related geopolitical events. In addition, the value of the Fund’s investments may be negatively affected by the occurrence of global events such as war, terrorism, environmental disasters, natural disasters or events, country instability, and infectious disease epidemics or pandemics.
The spread of COVID-19 has caused volatility, severe market dislocations and liquidity constraints in many markets, including markets for the securities the Fund holds, and may adversely affect the Fund’s investments and operations. The transmission of COVID-19 and efforts to contain its spread have resulted in travel restrictions and disruptions, closed international borders, enhanced health screenings at ports of entry and elsewhere, disruption of and delays in healthcare service preparation and delivery, quarantines, event and service cancellations or interruptions, disruptions to business operations and supply chains, and a reduction in consumer and business spending, as well as general concern and uncertainty that has negatively affected the economy. These disruptions have led to instability in the market place and the jobs market. The impact of COVID-19 could adversely affect the economies of many nations or the entire global economy, the financial well-being and performance of individual issuers, borrowers and sectors and the health of the markets generally in potentially significant and unforeseen ways.
The foregoing could lead to a significant economic downturn or recession, increased market volatility, a greater number of market closures, higher default rates and adverse effects on the values and liquidity of the Fund’s securities or other assets. Such impacts may adversely affect the performance of the Fund.
7. SUBSEQUENT EVENTS
Subsequent events, if any, after the date of the Statement of Assets and Liabilities have been evaluated through the date the financial statements were issued. Management has determined that there were no subsequent events to report through the issuance of these financial statements.
16 | November 30, 2022
ALPS Active REIT ETF
| Additional Information | November 30, 2022 (Unaudited) |
PROXY VOTING RECORDS, POLICIES AND PROCEDURES
Information regarding how the Fund voted proxies relating to portfolio securities during the most recent 12-month period ended June 30 and a description of the Fund’s proxy voting policies and procedures used in determining how to vote for proxies are available without charge on the SEC’s website at www.sec.gov and upon request, by calling (toll-free) 1-866-759-5679.
PORTFOLIO HOLDINGS
The Fund files a complete schedule of portfolio holdings with the U.S. Securities and Exchange Commission (“SEC”) for the first and third quarters of each fiscal year on Form N-PORT within 60 days after the end of the period. Copies of the Fund’s Form N-PORT are available without a charge, upon request, by contacting the Fund at 1-866-759-5679 and on the SEC’s website at https://www.sec.gov.
TAX INFORMATION
The ALPS Active REIT ETF designates the following as a percentage of taxable ordinary income distributions, or up to the maximum amount allowable, for the calendar year ended December 31, 2021:
| | Qualified Dividend Income | Dividend Received Deduction | 199A |
| ALPS Active REIT ETF | 0.00% | 0.00% | 20.33% |
In early 2022, if applicable, shareholders of record received this information for the distributions paid to them by the Fund during the calendar year 2021 via Form 1099. The Fund will notify shareholders in early 2023 of amounts paid to them by the Fund, if any, during the calendar year 2022.
17 | November 30, 2022
ALPS Active REIT ETF
| Board Considerations Regarding Approval of | November 30, 2022 (Unaudited) |
| Investment Advisory Agreement and Investment Sub-Advisory Agreement |
At a meeting held June 21, 2022 via electronic means (video-conference), the Board of Trustees of the Trust (the “Board” or the “Trustees”),including the Trustees who are not “interested persons” of the Trust within the meaning of the Investment Company Act of 1940, as amended (the “Independent Trustees”), evaluated a proposal to approve the continuance of (i) the Investment Advisory Agreement between the Trust and ALPS Advisors, Inc. (the “Adviser” or “AAI”) with respect to the ALPS Active REIT ETF (“REIT” or the "Fund") (the “REIT Advisory Agreement”) and (ii) the Investment Sub-Advisory Agreement between AAI and GSI Capital Advisors LLC (the “Sub-Adviser” or “GSI”) with respect to REIT (the “GSI Capital Sub-Advisory Agreement”). The Independent Trustees also met separately to consider the REIT Advisory Agreement and GSI Capital Sub-Advisory Agreement.
In evaluating the REIT Advisory Agreement, the Board, including the Independent Trustees, considered various factors, including (i) the nature, extent and quality of the services provided by the Adviser to REIT under the REIT Advisory Agreement; (ii) the advisory fees and other expenses paid by REIT compared to those of similar funds managed by other investment advisers; (iii) the costs of the services provided to REIT and the profits realized by the Adviser and its affiliates from the Adviser’s relationship with REIT; (iv) the extent to which economies of scale have been or would be realized, if and as REIT’s assets grow and whether fees reflect the economies of scale for the benefit of shareholders; and (v) any additional benefits and other considerations.
With respect to the nature, extent and quality of the services provided by the Adviser under the REIT Advisory Agreement, the Board, including the Independent Trustees, considered and reviewed information concerning the services provided under the REIT Advisory Agreement, the investment strategy, financial information regarding the Adviser and its parent company, information describing the Adviser’s current organization and the background and experience of the persons responsible for the day-to-day management of REIT, the financial support of REIT, and the nature and quality of services provided to other ETFs, open-end and closed-end funds sponsored by the Adviser. Based upon their review, the Board, including the Independent Trustees, concluded that the Adviser was qualified to oversee the services to be provided by other service providers and that the services provided by the Adviser to REIT are satisfactory.
With respect to the nature, extent and quality of the services provided by the Adviser under the REIT Advisory Agreement, the Board considered and reviewed information concerning the services provided under the REIT Advisory Agreement, financial information regarding the Adviser and its parent company, information describing the Adviser’s current organization and the background and experience of the persons responsible for the day-to-day management of the Fund.
The Board reviewed information on the performance of the Fund and its benchmark and the FUSE performance group. Based on this review, the Board, including the Independent Trustees, found that the nature and extent of services provided to the Fund under the REIT Advisory Agreement was appropriate and that the quality was satisfactory.
The Board noted that the advisory fee for the Fund was a unitary fee pursuant to which the Adviser assumes all expenses of the Fund (including the cost of transfer agency, custody, fund administration, legal, audit and other services) other than the payments under the REIT Advisory Agreement, brokerage expenses, taxes, interest, litigation expenses and other extraordinary expenses.
With respect to advisory fee rates, the Board, including the Independent Trustees, noted the following:
The gross management fee rate for the Fund is higher than the median of its FUSE expense group. The Fund's net expense ratio is slightly above the median of its FUSE expense group.
Based on the foregoing, and the other information available to them, the Board, including the Independent Trustees, concluded that the advisory fee rate for the Fund was reasonable under the circumstances and in light of the quality of the services provided.
The Board, including the Independent Trustees, considered other benefits available to the Adviser because of its relationship with the Fund and concluded that the advisory fees were reasonable taking into account any such benefits.
The Board, including the Independent Trustees, also considered with respect to the Fund the information provided by the Adviser about the costs and profitability of the Adviser with respect to the Fund, including the asset levels and other factors that influence the profitability and financial viability of the Fund. The Board, including the Independent Trustees, reviewed and noted the relatively small size of the Fund and concluded that the Adviser was not realizing any economies of scale. The Independent Trustees determined that the Adviser should continue to keep the Board informed on an ongoing basis of any significant developments (e.g., material increases in asset levels) so as to facilitate the Independent Trustees’ evaluation of whether further economies of scale have been achieved.
In voting to renew the REIT Advisory Agreement, the Board, including the Independent Trustees, concluded that the terms of the REIT Advisory Agreement are reasonable and fair in light of the services to be performed, the fees paid by certain other funds, expenses to be incurred and such other matters as the members of the Board, including the Independent Trustees, considered relevant in the exercise of their reasonable business judgment. The Independent Trustees did not identify any single factor or group of factors as all important or controlling and considered all factors together.
18 | November 30, 2022
ALPS Active REIT ETF
| Board Considerations Regarding Approval of | November 30, 2022 (Unaudited) |
| Investment Advisory Agreement and Investment Sub-Advisory Agreement |
GSI Capital Sub-Advisory Agreement
The Board, including the Independent Trustees, discussed the GSI Sub-Advisory Agreement.
In evaluating the GSI Sub-Advisory Agreement, the Board, including the Independent Trustees, considered various factors, including (i) the nature, extent and quality of the services provided by GSI with respect to REIT under the GSI Sub-Advisory Agreement; (ii) the advisory fees and other expenses paid by REIT compared to those of similar funds managed by other investment advisers; (iii) the profitability to GSI of its sub-advisory relationship with REIT and the reasonableness of compensation to GSI; (iv) the extent to which economies of scale would be realized if, and as, REIT’s assets increase, and whether the fee level in the GSI Sub-Advisory Agreement reflects these economies of scale; and (v) any additional benefits and other considerations.
With respect to the nature, extent and quality of the services provided by GSI under the GSI Sub-Advisory Agreement, the Board, including the Independent Trustees, considered and reviewed information concerning the services provided under the GSI Sub-Advisory Agreement, REIT’s performance, financial information regarding GSI, information describing GSI’s current organization and the background and experience of the persons responsible for the day-to-day management of REIT. Based upon their review, the Board, including the Independent Trustees, concluded that GSI was qualified to oversee the portfolio management of REIT and that the services provided by GSI to REIT are satisfactory. The Board, including the Independent Trustees, considered that the contractual sub-advisory fee to be paid to GSI with respect to REIT was 0.35% of REIT’s average daily net assets out of a total management fee of 0.68% of REIT’s average daily net assets. Based on the consideration of all factors deemed relevant by them, the Board, including the Independent Trustees, concluded that the sub-advisory fees received by GSI under the GSI Sub-Advisory Agreement were reasonable under the circumstances and in light of the quality of services provided.
With respect to the costs of services provided and profits realized by GSI, the Board, including the Independent Trustees, considered the resources involved in managing REIT. Based on their review of the profitability of REIT to GSI, the Board, including the Independent Trustees, concluded that the profitability of REIT to GSI was not unreasonable.
The Board, including the Independent Trustees, also considered other benefits that have been and may be realized by GSI from its relationship with REIT and concluded that the sub-advisory fees with respect to REIT were reasonable taking into account such benefits.
The Board, including the Independent Trustees, considered the extent to which economies of scale may be realized if REIT’s assets continue to grow in size and whether fee levels reflect a reasonable sharing of such economies of scale for the benefit of the Fund’s investors. The Board, including the Independent Trustees, noted that REIT launched in February 2021 and had not yet achieved scale in terms of assets. The Independent Trustees determined that AAI should continue to keep the Board informed on an ongoing basis of any significant developments (e.g., material increases in asset levels) so as to facilitate the Independent Trustees’ evaluation of whether further economies of scale have been achieved with respect to REIT.
In voting to approve the GSI Sub-Advisory Agreement, the Board, including the Independent Trustees, concluded that the terms of the GSI Sub-Advisory Agreement are reasonable and fair in light of the services performed, expenses incurred and such other matters as the Board, including the Independent Trustees, considered relevant in the exercise of their reasonable business judgment. The Board, including the Independent Trustees, did not identify any single factor or group of factors as all important or controlling and considered all factors together.
19 | November 30, 2022
ALPS Active REIT ETF
| Trustees & Officers | November 30, 2022 (Unaudited) |
The general supervision of the duties performed by the Adviser for the Fund under the Investment Advisory Agreement is the responsibility of the Board of Trustees. The Trust currently has four Trustees, each of whom have no affiliation or business connection with the Adviser or any of its affiliated persons and do not own any stock or other securities issued by the Adviser. These are the “non-interested” or “independent” Trustees (“Independent Trustees”).
The Independent Trustees of the Trust, their term of office and length of time served, their principal business occupations during the past five years, the number of portfolios in the Fund Complex overseen by each Independent Trustee, and other directorships, if any, held by the Trustee are shown below.
| INDEPENDENT TRUSTEES | | | | |
Name, Address & Year of Birth* | Position(s) Held with Trust | Term of Office and Length of Time Served** | Principal Occupation(s) During Past 5 Years | Number of Portfolios in Fund Complex Overseen by Trustees*** | Other Directorships Held by Trustees |
| Mary K. Anstine, 1940 | Trustee | Since March 2008 | Ms. Anstine is Trustee/Director of AV Hunter Trust and Colorado Uplift Board. | 38 | Ms. Anstine is a Trustee of ALPS Variable Investment Trust (7 funds); Financial Investors Trust (29 funds); and Reaves Utility Income Fund. |
| Jeremy W. Deems, 1976 | Trustee | Since March 2008 | Mr. Deems is the Co-Founder and Chief Financial Officer of Green Alpha Advisors, LLC, a registered investment advisor, and Co-Portfolio Manager of the Shelton Green Alpha Fund. | 38 | Mr. Deems is a Trustee of ALPS Variable Investment Trust (7 funds); Financial Investors Trust (29 funds); and Reaves Utility Income Fund; and Clough Funds Trust (1 fund). |
Rick A. Pederson, 1952 | Trustee | Since March 2008 | Mr. Pederson is Partner, Bow River Capital Partners (private equity management), 2003 - present; Board Member, Prosci Inc. (private business services) 2013-2016; Advisory Board Member, Citywide Banks (Colorado community bank) 2014- 2017; Board Member, Strong-Bridge Consulting, 2015- 2019; Board Member, IRI/ODMS Holdings LLC, 2017 – 2019; Director, National Western Stock Show (not for profit) 2010 - present; Director, History Colorado (not for profit) 2015- present; Director, Citywide Bank Advisory Board 2017-present;Trustee, Boettcher Foundation,2018 -present. | 24 | Mr. Pederson is Trustee of Segall Bryant & Hamill Trust (14 funds), Principal Real Estate Income Fund (1 fund). |
| * | The business address of the Trustee is c/o ALPS Advisors, Inc., 1290 Broadway, Suite 1000, Denver, Colorado 80203. |
| ** | This is the period for which the Trustee began serving the Trust. Each Trustee serves an indefinite term, until his or her successor is elected. |
| *** | The Fund Complex includes all series of the Trust and any other investment companies for which ALPS Advisors, Inc. provides investment advisory services. |
20 | November 30, 2022
ALPS Active REIT ETF
| Trustees & Officers | November 30, 2022 (Unaudited) |
Name, Address & Year of Birth* | Position(s) Held with Trust | Term of Office and Length of Time Served** | Principal Occupation(s) During Past 5 Years | Number of Portfolios in Fund Complex Overseen by Trustees*** | Other Directorships Held by Trustees |
| Edmund J. Burke, 1961 | Trustee | Since December 2017 | Mr. Burke joined ALPS in 1991 and served as the President and Director of ALPS Holdings, Inc., and ALPS Advisors, Inc., and Director of ALPS Distributors, Inc., ALPS Fund Services, Inc. (“ALPS”), and ALPS Portfolio Solutions Distributor, Inc. (collectively, the “ALPS Companies”). Mr. Burke retired from the ALPS Companies in June 2019. Mr. Burke is currently a partner at ETF Action, a webbased system that provides data and analytics to registered investment advisers, (since 2020) and a Director of Alliance Bioenergy Plus, Inc., a technology company focused on emerging technologies in the renewable energy, biofuels, and bioplastics technology sectors (since 2020). | 33 | Mr. Burke is a Trustee of Clough Global Dividend and Income Fund (1 fund); Clough Global Equity Fund (1 fund); Clough Global Opportunities Fund (1 fund); Clough Funds Trust (1 fund); Liberty All-Star Equity Fund (1 fund); Director of the Liberty All-Star Growth Fund, Inc. (1 fund) and Financial Investors Trust (29 funds). |
| * | The business address of the Trustee is c/o ALPS Advisors, Inc., 1290 Broadway, Suite 1000, Denver, Colorado 80203. |
| ** | This is the period for which the Trustee began serving the Trust. Each Trustee serves an indefinite term, until his or her successor is elected. |
| *** | The Fund Complex includes all series of the Trust and any other investment companies for which ALPS Advisors, Inc. provides investment advisory services. |
21 | November 30, 2022
ALPS Active REIT ETF
| Trustees & Officers | November 30, 2022 (Unaudited) |
| OFFICERS: | | | |
Name, Address and Year of Birth of Officer* | Position(s) Held with Trust | Length of Time Served** | Principal Occupation(s) During Past 5 Years |
| Laton Spahr, 1975 | President | Since June 2021 | Mr. Spahr joined ALPS in 2019 and currently serves as President and Portfolio Manager of AAI. Prior to his current role, Mr. Spahr was a Senior Vice President and Strategy Leader of the Value & Income Team for Oppenheimer Funds from 2013 to 2019. |
| Matthew Sutula, 1985 | Chief Compliance Officer (“CCO”) | Since December 2019 | Mr. Sutula joined ALPS in 2012 and currently serves as Chief Compliance Officer of AAI. Prior to his current role, Mr. Sutula served as interim Compliance Officer of the Trust (September 2019 to December 2019), Compliance Manager and Senior Compliance Analyst for AAI, as well as Compliance Analyst for AFS. Prior to joining ALPS, he spent seven years at Morningstar, Inc. in various analyst roles supporting the registered investment company databases. Mr. Sutula is also Chief Compliance Officer of Principal Real Estate Income Fund, ALPS Variable Investment Trust, Liberty All-Star Equity Fund and Liberty All-Star Growth Fund, Inc. From September 2019 to September 2022 he served as Chief Compliance Officer of RiverNorth Opportunities Fund, Inc |
| Kathryn Burns, 1976 | Treasurer | Since September 2018 | Ms. Burns serves as Vice President, Director of Fund Operations of AAI since 2018. From 2013 to 2018, she served as Vice President and Fund Controller at AFS. Prior to joining ALPS, she worked at Old Mutual Capital where she served as Vice President and Chief Compliance Officer (2010 – 2012) and Regulatory Reporting Manager and Assistant Treasurer to the Old Mutual Funds Trusts (2006 – 2012). She also served as a CPA for PricewaterhouseCoopers LLP. Ms. Burns also serves as President of ALPS Variable Investment Trust and Principal Real Estate Income Fund. From June 2019 to September 2022 she served as President of RiverNorth Opportunities Fund, Inc. and from June 2018 to November 2021 she served as Treasurer of Boulder Growth & Income Fund, Inc. |
| Michael P. Lawlor, 1969 | Secretary | Since December 2022 | Mr. Lawlor joined ALPS in January 2022, and is currently Vice President and Principal Legal Counsel. Prior to joining ALPS, Mr. Lawlor was Lead Fund Counsel at Brighthouse Financial (insurance company) (January 2007-April 2021). Mr. Lawlor also serves as Secretary of Financial Investors Trust and ALPS Variable Investment Trust. |
| * | The business address of each Officer is c/o ALPS Advisors, Inc., 1290 Broadway, Suite 1000, Denver, Colorado 80203. Each Officer is deemed an affiliate of the Trust as defined under the 1940 Act. |
| ** | This is the period for which the Officer began serving the Trust. Each Officer serves an indefinite term, until his or her successor is elected. |
The Statement of Additional Information includes additional information about the Fund’s Trustees and is available, without charge, upon request by calling (toll-free) 1-866-759-5679.
22 | November 30, 2022
Intentionally Left Blank

Table of Contents
| Performance Overview | 1 |
| Disclosure of Fund Expenses | 4 |
| Report of Independent Registered Public Accounting Firm | 5 |
| Financial Statements | |
| Schedule of Investments | 6 |
| Statement of Assets and Liabilities | 7 |
| Statement of Operations | 8 |
| Statements of Changes in Net Assets | 9 |
| Financial Highlights | 10 |
| Notes to Financial Statements | 11 |
| Additional Information | 17 |
| Board Considerations Regarding Approval of Investment Advisory Agreement | 18 |
| Trustees & Officers | 19 |
alpsfunds.com
| ALPS Equal Sector Weight ETF | |
| Performance Overview | November 30, 2022 (Unaudited) |
Investment Objective
The ALPS Equal Sector Weight ETF (the “Fund”) seeks investment results that replicate as closely as possible, before fees and expenses, the performance of the NYSE® Equal Sector Weight Index™ (the “Underlying Index”).
The Underlying Index is an index of exchange-traded funds (“ETFs") comprised of all active Select Sector SPDR® ETFs in an equal-weighted portfolio. These are the Communication Services Select Sector SPDR® Fund, Consumer Discretionary Select Sector SPDR® Fund, Consumer Staples Select Sector SPDR® Fund, Materials Select Sector SPDR® Fund, Energy Select Sector SPDR® Fund, Technology Select Sector SPDR® Fund, Utilities Select Sector SPDR® Fund, Financial Select Sector SPDR® Fund, Industrial Select Sector SPDR® Fund, Health Care Select Sector SPDR® Fund and Real Estate Select Sector SPDR® Fund (each, an “Underlying Sector ETF” and collectively, the “Underlying Sector ETFs”). In order to track the Underlying Index, the Fund will use a “fund of funds” approach, and seek to achieve its investment objective by investing at least 90% of its total assets in the shares of the Underlying Sector ETFs.
The Underlying Index is designed to track performance of the equally weighted Underlying Sector ETFs. Accordingly, the Underlying Index is rebalanced to an equal weighting quarterly during the months of March, June, September, and December.
Each Underlying Sector ETF is an “index fund” that invests in the equity securities of companies in a particular sector or group of industries. The objective of each Underlying Sector ETF is to track its respective underlying sector index by replicating the securities in the underlying sector index. Together, the Underlying Sector ETFs represent the Underlying Index as a whole.
Performance Overview
For the twelve-month period ended November 30, 2022, the Fund generated a total return of -0.59%, relatively in-line with the Fund’s Underlying Index, net of fees, which returned -0.48%. The Fund outperformed the S&P 500® Total Return Index (the “S&P 500”), which returned -9.21% for the same period.
The S&P 500 returned -9.21% for the trailing twelve-month (TTM) period ended November 30, 2022, as fiscal year 2022 saw the worst drawdown for equities since the pandemic. Pressured by the Federal Reserve (Fed) raising interest rates to combat inflation, markets adjusted equity values to reflect a forward-looking slowed economy. Main macroeconomic talking points throughout 2022 centered on the path of future interest rates driven by monetary policy, and inflation sustaining levels well above the Fed’s 2% inflation target. Inflation fears continued to be justified with the year-over-year Consumer Price Index (CPI) surging above 9% in June, along with core inflation readings maintaining levels above 6%. Despite the quantitative tightening efforts in 2022, many economic indicators remain strong including consumer spending, wage growth and low unemployment in the U.S., offering a sliver of hope for a soft landing. Global supply chains were relieved of backlogs and most delays stemming from COVID-19 restrictions, benefitting company margins and lowering some pressure on prices of inflated goods. The latest economic data shows U.S. Real gross domestic product year-over-year rising 1.9%, offset by CPI of 7.7%. Looking forward, the Fund's adviser believes markets have likely discounted a significant portion of quantitative tightening as the S&P 500 Price-to-Earnings ratio is below its 10-year average, and any pause or pivot in rate hikes would serve as a positive catalyst for U.S. and global equities.
The best performing Fund holdings for the period were the Energy Select Sector SPDR® (XLE) (+74.42%), the Consumer Staples Select Sector SPDR® (XLP) (+12.60%) and the Utilities Select Sector SPDR® (XLU) (+11.79%). The worst performing Fund holdings for the period were the Communication Services Select Sector SPDR® (XLC) which lost 31.03% and the Consumer Discretionary Select Sector SPDR® (XLY) which fell 27.97%.
Looking forward, the Fund’s strategy of holding each of the eleven sectors in the S&P 500 via the Select SPDR® Funds can result in a diversified core holding, and potential for market participation in all economic cycles through equal sector weighting.
1 | November 30, 2022
| ALPS Equal Sector Weight ETF | |
| Performance Overview | November 30, 2022 (Unaudited) |
Performance (as of November 30, 2022)
| | 1 Year | 5 Year | 10 Year | Since Inception^ |
| ALPS Equal Sector Weight ETF - NAV | -0.59% | 10.27% | 12.19% | 13.31% |
| ALPS Equal Sector Weight ETF - Market Price* | -0.54% | 10.26% | 12.19% | 13.32% |
| NYSE® Equal Sector Weight Total Return Index™ | -0.48% | 10.43% | 12.41% | 13.57% |
| S&P 500® Total Return Index | -9.21% | 10.98% | 13.34% | 14.19% |
Total Expense Ratio (per the current Prospectus) is 0.48%. Net Expense Ratio (per the current Prospectus) is 0.27%. Net expense ratio reflects the reimbursement of distribution fees for underlying sector ETFs. In addition, the Adviser has contractually agreed, through March 31, 2023, to reduce its advisory fee by 0.19%. This fee waiver may only be terminated by the Fund’s Board of Trustees (and not by the Adviser) prior to such date. Please see the prospectus for additional information.
Performance data quoted represents past performance. Past performance does not guarantee future results. Total return figures assume reinvestment of dividends and capital gains distributions, if any. The table does not reflect the deduction of taxes that a shareholder would pay on Fund distributions or the redemption of Fund shares. Investment return and principal value of an investment will fluctuate so that an investor’s shares, when sold or redeemed, may be worth more or less than the original cost. Current performance data may be higher or lower than actual data quoted. For the most current month-end performance data please visit www.alpsfunds.com or call 1.866.759.5679.
Net Asset Value (NAV) is an exchange-traded fund’s per-share value. The per-share dollar amount of the Fund is derived by dividing the total value of all the securities in its portfolio, less any liabilities, by the number of Fund shares outstanding. Market Price is the price at which a share can currently be traded in the market. Information detailing the number of days the Market Price of the Fund was greater than the Fund’s NAV and the number of days it was less than the Fund’s NAV can be obtained at www.alpsfunds.com.
| ^ | The Fund commenced Investment Operations on July 6, 2009 with an Inception Date, the first day of trading on the Exchange, of July 7, 2009. |
| | | |
| * | Market Price means the official closing price of a share or, if it more accurately reflects the market value of a share at the time as of which the Fund calculates current net asset value per share, the price that is the midpoint of the bid-ask spread as of that time. It does not represent the returns an investor would receive if shares were traded at other times. |
The NYSE® Equal Sector Weight Total Return Index™ consists of a strategy that holds all active Select Sector SPDR® ETFs in an equal-weighted portfolio. Total return assumes reinvestment of any dividends and distributions realized during a given time period.
S&P 500® Total Return Index: the Standard & Poor’s composite index of 500 stocks, a widely recognized, unmanaged index of common stock prices. Total return assumes reinvestment of any dividends and distributions realized during a given time period.
The indexes are not actively managed and do not reflect any deductions for fees, expenses or taxes. The indexes are reported on a total return basis, which assumes reinvestment of any dividends and distributions realized during a given time period. One cannot invest directly in an index. Index performance does not reflect fund performance.
The Fund’s shares are not individually redeemable. Investors buy and sell shares of the Fund on a secondary market. Only market makers or “authorized participants” may trade directly with the Fund, typically in blocks of 25,000 shares.
The ALPS Equal Sector Weight ETF is not suitable for all investors. Investments in the Fund are subject to investment risks, including possible loss of the principal amount invested.
ALPS Portfolio Solutions Distributor, Inc., a FINRA member, is the distributor for the Fund.
2 | November 30, 2022
| ALPS Equal Sector Weight ETF | |
| Performance Overview | November 30, 2022 (Unaudited) |
The following table shows the sector weights of both the Fund and the S&P 500® Total Return Index as of November 30, 2022:
Sector Weighting Comparison (as of November 30, 2022)
| | EQL* | S&P 500® | +/- |
| Energy | 10.01% | 5.12% | 4.89% |
| Industrials | 9.82% | 8.44% | 1.38% |
| Materials | 9.77% | 2.68% | 7.09% |
| Financials | 9.46% | 11.61% | -2.15% |
| Health Care | 9.39% | 15.22% | -5.83% |
| Consumer Staples | 9.32% | 6.99% | 2.33% |
| Technology | 9.10% | 26.41% | -17.31% |
| Communication Services | 8.51% | 7.46% | 1.05% |
| Real Estate | 8.37% | 2.68% | 5.69% |
| Utilities | 8.26% | 2.99% | 5.27% |
| Consumer Discretionary | 7.97% | 10.40% | -2.43% |
| Money Market Fund | 0.02% | – | 0.02% |
| Total | 100.00% | 100.00% | |
Source: S&P 500®
| * | % of Total Investments (excluding investments purchased with collateral from securities loaned). |
Future holdings are subject to change.
Growth of $10,000 (as of November 30, 2022)
Comparison of Change in Value of $10,000 Investment in the Fund and the Indexes
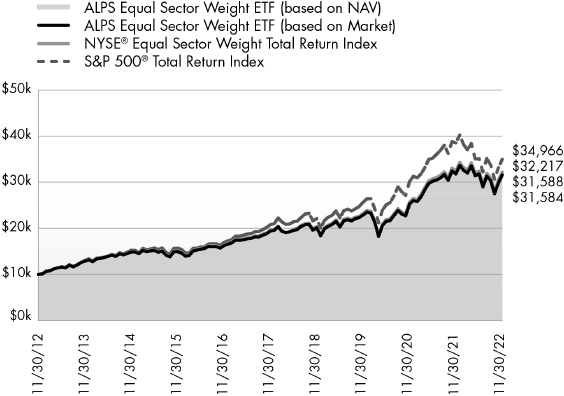
The chart above compares historical performance of a hypothetical investment of $10,000 in the Fund over the past ten years including dividend reinvestment with the performance of the Fund’s benchmark index. Results include the reinvestment of all dividends and capital gain distributions. Past performance does not guarantee future results. The chart does not reflect the deduction of taxes that a shareholder would pay on Fund distributions or the redemption of Fund shares.
3 | November 30, 2022
| ALPS Equal Sector Weight ETF | |
| Disclosure of Fund Expenses | November 30, 2022 (Unaudited) |
Shareholder Expense Example: As a shareholder of the Fund, you incur certain ongoing costs, including management fees and other Fund expenses. These examples are intended to help you understand your ongoing costs (in dollars) of investing in the Fund and to compare these costs with the ongoing costs of investing in other funds. The example is based on an investment of $1,000 invested at the beginning of the six month period and held through November 30, 2022.
Actual Return: The first line of the table provides information about actual account values and actual expenses. You may use the information in this line, together with the amount you invested, to estimate the expenses that you incurred over the period. Simply divide your account value by $1,000 (for example, an $8,600 account value divided by $1,000 = 8.6), then multiply the result by the number in the first line under the heading entitled “Expenses Paid During Period” to estimate the expenses attributable to your investment during this period.
Hypothetical 5% Return: The second line of the table provides information about hypothetical account values and hypothetical expenses based on the Fund’s actual expense ratio and an assumed rate of return of 5% per year before expenses, which is not the Fund’s actual return. The hypothetical account values and expenses may not be used to estimate the actual ending account balance or expenses you paid for the period. You may use this information to compare ongoing costs of investing in the Fund and other funds. To do so, compare this 5% hypothetical example with the 5% hypothetical examples that appear in the shareholder reports of other funds.
The expenses shown in the table are meant to highlight ongoing Fund costs only and do not reflect any transaction costs, such as brokerage commissions and other fees to financial intermediaries. Therefore, the second line of the table is useful in comparing ongoing costs only, and will not help you determine the relative total costs of owning different funds. In addition, if these costs were included, your costs would have been higher.
| | Beginning Account Value 6/1/22 | Ending Account Value 11/30/22 | Expense Ratio(a) | Expenses Paid During Period 6/1/22 - 11/30/22(b) |
| ALPS Equal Sector Weight ETF | | | | |
| Actual | $1,000.00 | $994.40 | 0.16% | $0.80 |
| Hypothetical (5% return before expenses) | $1,000.00 | $1,024.27 | 0.16% | $0.81 |
| (a) | Annualized, based on the Fund's most recent fiscal half year expenses. |
| (b) | Expenses are equal to the Fund's annualized expense ratio multiplied by the average account value over the period, multiplied by the number of days in the most recent fiscal half year (183), divided by 365. |
4 | November 30, 2022
ALPS Equal Sector Weight ETF
Report of Independent Registered Public Accounting Firm
To the Board of Trustees of ALPS ETF Trust and the Shareholders of ALPS Equal Sector Weight ETF
Opinion on the Financial Statements
We have audited the accompanying statement of assets and liabilities of ALPS Equal Sector Weight ETF, a series of shares of beneficial interest in ALPS ETF Trust (the “Fund”), including the schedule of investments, as of November 30, 2022, and the related statements of operations and changes in net assets and the financial highlights for the year then ended, and the related notes (collectively referred to as the “financial statements”). In our opinion, the financial statements present fairly, in all material respects, the financial position of the Fund as of November 30, 2022, and the results of its operations, the changes in its net assets, and its financial highlights for the year then ended, in conformity with accounting principles generally accepted in the United States of America. The statement of changes in net assets for the year ended November 30, 2021 and the financial highlights for each of the years in the four-year period then ended were audited by other auditors whose report dated January 26, 2022, expressed an unqualified opinion on those financial statements and financial highlights.
Basis for Opinion
These financial statements are the responsibility of the Fund’s management. Our responsibility is to express an opinion on the Fund's financial statements based on our audit. We are a public accounting firm registered with the Public Company Accounting Oversight Board (United States) (“PCAOB”) and are required to be independent with respect to the Fund in accordance with the U.S. federal securities law and the applicable rules and regulations of the Securities and Exchange Commission and the PCAOB.
We conducted our audit in accordance with the standards of the PCAOB. Those standards require that we plan and perform the audit to obtain reasonable assurance about whether the financial statements are free of material misstatement, whether due to error or fraud. The Fund is not required to have, nor were we engaged to perform, an audit of its internal control over financial reporting. As part of our audit we are required to obtain an understanding of internal control over financial reporting but not for the purpose of expressing an opinion on the effectiveness of the Fund’s internal control over financial reporting. Accordingly, we express no such opinion.
Our audit included performing procedures to assess the risk of material misstatement of the financial statements, whether due to error or fraud, and performing procedures that respond to those risks. Such procedures included examining, on a test basis, evidence regarding the amounts and disclosures in the financial statements. Our procedures included confirmation of securities owned as of November 30, 2022 by correspondence with the custodian. Our audit also included evaluating the accounting principles used and significant estimates made by management, as well as evaluating the overall presentation of the financial statements. We believe that our audit provides a reasonable basis for our opinion.
BBD, LLP
We have served as the auditor of one or more of the Funds in the ALPS ETF Trust since 2022.
Philadelphia, Pennsylvania
January 27, 2023
5 | November 30, 2022
| ALPS Equal Sector Weight ETF | |
| Schedule of Investments | November 30, 2022 |
| Security Description | | Shares | | | Value | |
| EXCHANGE TRADED FUNDS (99.99%) | | | | | | |
| Communication Services (8.51%) | | | | | | |
| Communication Services | | | | | | |
| Select Sector SPDR Fund(a) | | | 565,047 | | | $ | 29,105,571 | |
| | | | | | | | | |
| Consumer Discretionary (7.97%) | | | | | | | | |
| Consumer Discretionary | | | | | | | | |
| Select Sector SPDR Fund(a) | | | 186,534 | | | | 27,265,675 | |
| | | | | | | | | |
| Consumer Staples (9.32%) | | | | | | | | |
| Consumer Staples Select | | | | | | | | |
| Sector SPDR Fund(a) | | | 413,038 | | | | 31,882,403 | |
| | | | | | | | | |
| Energy (10.01%) | | | | | | | | |
| Energy Select Sector SPDR Fund | | | 375,606 | | | | 34,236,487 | |
| | | | | | | | | |
| Financials (9.46%) | | | | | | | | |
| Financial Select Sector SPDR Fund | | | 891,169 | | | | 32,358,346 | |
| | | | | | | | | |
| Healthcare (9.39%) | | | | | | | | |
| Health Care Select Sector SPDR Fund(a) | | | 231,167 | | | | 32,136,836 | |
| | | | | | | | | |
| Industrials (9.82%) | | | | | | | | |
| Industrial Select Sector SPDR Fund(a) | | | 330,253 | | | | 33,593,335 | |
| | | | | | | | | |
| Materials (9.78%) | | | | | | | | |
| Materials Select Sector SPDR Fund(a) | | | 404,134 | | | | 33,442,089 | |
| | | | | | | | | |
| Real Estate (8.37%) | | | | | | | | |
| Real Estate Select Sector SPDR Fund | | | 730,157 | | | | 28,651,361 | |
| | | | | | | | | |
| Technology (9.10%) | | | | | | | | |
| Technology Select Sector SPDR Fund | | | 228,905 | | | | 31,121,924 | |
| | | | | | | | | |
| Utilities (8.26%) | | | | | | | | |
| Utilities Select Sector SPDR Fund(a) | | | 395,622 | | | | 28,259,279 | |
| | | | | | | | | |
| TOTAL EXCHANGE TRADED FUNDS | | | | | | | | |
| (Cost $279,695,621) | | | | | | | 342,053,306 | |
| | | 7 Day Yield | | | Shares | | | Value | |
| SHORT TERM INVESTMENTS(24.50%) | | | | | | | | | |
| Money Market Fund (0.02%) | | | | | | |
| State Street Institutional Treasury Plus Money Market Fund (Premier Class) | | | | | | | | | |
| (Cost $69,789) | | | 3.69 | % | | | 69,789 | | | $ | 69,789 | |
| | | | | | | | | | | | | |
| | | | | | | | | | | | | |
| Investments Purchased with Collateral from Securities Loaned (24.48%) | | | | | | | | | | | | |
| State Street Navigator | | | | | | | | | | | | |
| Securities Lending | | | | | | | | | | | | |
| Government Money | | | | | | | | | | | | |
| Market Portfolio, 3.86% | | | | | | | | | | | | |
| (Cost $83,760,048) | | | | | | | 83,760,048 | | | | 83,760,048 | |
| TOTAL SHORT TERM INVESTMENTS | | | | | | | | | | | | |
| (Cost $83,829,837) | | | | | | | | | | | 83,829,837 | |
| | | | | | | | | | | | | |
| TOTAL INVESTMENTS (124.49%) | | | | | | | | | | | | |
| (Cost $363,525,458) | | | | | | | | | | $ | 425,883,143 | |
| LIABILITIES IN EXCESS OF OTHER ASSETS(-24.49%) | | | | | | | | | | | (83,784,309 | ) |
| NET ASSETS - 100.00% | | | | | | | | | | $ | 342,098,834 | |
| (a) | Security, or a portion of the security position is currently on loan. |
The total market value of securities on loan is $91,196,271.
Common Abbreviations:
SPDR® - Standard & Poor's Depositary Receipts
See Notes to Financial Statements.
6 | November 30, 2022
| ALPS Equal Sector Weight ETF | |
| Statement of Assets and Liabilities | November 30, 2022 |
| ASSETS: | | | |
| Investments, at value(a) | | $ | 425,883,143 | |
| Dividends receivable | | | 17,413 | |
| Total Assets | | | 425,900,556 | |
| | | | | |
| LIABILITIES: | | | | |
| Payable to adviser | | | 41,674 | |
| Payable for collateral upon return of securities loaned | | | 83,760,048 | |
| Total Liabilities | | | 83,801,722 | |
| NET ASSETS | | $ | 342,098,834 | |
| | | | | |
| NET ASSETS CONSIST OF: | | | | |
| Paid-in capital | | $ | 284,579,180 | |
| Total distributable earnings/(accumulated losses) | | | 57,519,654 | |
| NET ASSETS | | $ | 342,098,834 | |
| | | | | |
| INVESTMENTS, AT COST | | $ | 363,525,458 | |
| | | | | |
| PRICING OF SHARES | | | | |
| Net Assets | | $ | 342,098,834 | |
| Shares of beneficial interest outstanding (Unlimited number of shares authorized, par value $0.01 per share) | | | 3,375,000 | |
| Net Asset Value, offering and redemption price per share | | $ | 101.36 | |
| (a) | Includes $91,196,271 of securities on loan. |
See Notes to Financial Statements.
7 | November 30, 2022
| ALPS Equal Sector Weight ETF | |
| Statement of Operations | For the Year Ended November 30, 2022 |
| INVESTMENT INCOME: | | | |
| Dividends | | $ | 4,863,390 | |
| Securities Lending Income | | | 108,817 | |
| Total Investment Income | | | 4,972,207 | |
| | | | | |
| EXPENSES: | | | | |
| Investment adviser fees | | | 900,819 | |
| Total Expenses before waiver/reimbursement | | | 900,819 | |
| Less fee waiver/reimbursement by investment adviser | | | (518,506 | ) |
| Net Expenses | | | 382,313 | |
| NET INVESTMENT INCOME | | | 4,589,894 | |
| | | | | |
| REALIZED AND UNREALIZED GAIN/(LOSS): | | | | |
| Net realized gain on investments(a) | | | 5,922,093 | |
| Net change in unrealized appreciation/(depreciation) on investments | | | (9,615,305 | ) |
| NET REALIZED AND UNREALIZED LOSS ON INVESTMENTS | | | (3,693,212 | ) |
| NET INCREASE IN NET ASSETS RESULTING FROM OPERATIONS | | $ | 896,682 | |
| (a) | Includes realized gain or loss as a result of in-kind transactions (See Note 4 in Notes to Financial Statements). |
See Notes to Financial Statements.
8 | November 30, 2022
| ALPS Equal Sector Weight ETF | | | | |
| Statements of Changes in Net Assets | | | | |
| | | For the Year Ended November 30, 2022 | | | For the Year Ended November 30, 2021 | |
| OPERATIONS: | | | | | | |
| Net investment income | | $ | 4,589,894 | | | $ | 3,568,055 | |
| Net realized gain | | | 5,922,093 | | | | 7,438,861 | |
| Net change in unrealized appreciation/(depreciation) | | | (9,615,305 | ) | | | 32,612,619 | |
| Net increase in net assets resulting from operations | | | 896,682 | | | | 43,619,535 | |
| | | | | | | | | |
| DISTRIBUTIONS TO SHAREHOLDERS: | | | | | | | | |
| From distributable earnings | | | (4,607,523 | ) | | | (3,568,055 | ) |
| From tax return of capital | | | – | | | | (37,609 | ) |
| Total distributions | | | (4,607,523 | ) | | | (3,605,664 | ) |
| | | | | | | | | |
| CAPITAL SHARE TRANSACTIONS: | | | | | | | | |
| Proceeds from sale of shares | | | 153,184,146 | | | | 27,797,544 | |
| Cost of shares redeemed | | | (15,270,895 | ) | | | (24,055,755 | ) |
| Net increase from capital share transactions | | | 137,913,251 | | | | 3,741,789 | |
| Net increase in net assets | | | 134,202,410 | | | | 43,755,660 | |
| | | | | | | | | |
| NET ASSETS: | | | | | | | | |
| Beginning of year | | | 207,896,424 | | | | 164,140,764 | |
| End of year | | $ | 342,098,834 | | | $ | 207,896,424 | |
| | | | | | | | | |
| OTHER INFORMATION: | | | | | | | | |
| CAPITAL SHARE TRANSACTIONS: | | | | | | | | |
| Beginning shares | | | 2,000,000 | | | | 1,950,000 | |
| Shares sold | | | 1,525,000 | | | | 300,000 | |
| Shares redeemed | | | (150,000 | ) | | | (250,000 | ) |
| Shares outstanding, end of period | | | 3,375,000 | | | | 2,000,000 | |
See Notes to Financial Statements.
9 | November 30, 2022
| ALPS Equal Sector Weight ETF |
| Financial Highlights | For a Share Outstanding Throughout the Periods Presented |
| | | For the Year Ended November 30, 2022 | | | For the Year Ended November 30, 2021 | | | For the Year Ended November 30, 2020 | | | For the Year Ended November 30, 2019 | | | For the Year Ended November 30, 2018 | |
| NET ASSET VALUE, BEGINNING OF PERIOD | | $ | 103.95 | | | $ | 84.17 | | | $ | 78.33 | | | $ | 70.34 | | | $ | 69.28 | |
| | | | | | | | | | | | | | | | | | | | | |
| INCOME FROM OPERATIONS: | | | | | | | | | | | | | | | | | | | | |
| Net investment income(a) | | | 1.89 | | | | 1.76 | | | | 1.91 | | | | 1.53 | | | | 1.50 | |
| Net realized and unrealized gain/(loss) | | | (2.55 | ) | | | 19.82 | | | | 5.84 | | | | 8.03 | | | | 1.02 | |
| Total from investment operations | | | (0.66 | ) | | | 21.58 | | | | 7.75 | | | | 9.56 | | | | 2.52 | |
| | | | | | | | | | | | | | | | | | | | | |
| DISTRIBUTIONS: | | | | | | | | | | | | | | | | | | | | |
| From net investment income | | | (1.93 | ) | | | (1.78 | ) | | | (1.90 | ) | | | (1.57 | ) | | | (1.46 | ) |
| From tax return of capital | | | – | | | | (0.02 | ) | | | (0.01 | ) | | | – | | | | – | |
| Total distributions | | | (1.93 | ) | | | (1.80 | ) | | | (1.91 | ) | | | (1.57 | ) | | | (1.46 | ) |
| | | | | | | | | | | | | | | | | | | | | |
| NET INCREASE/(DECREASE) IN NET ASSET | | | | | | | | | | | | | | | | | | | | |
| VALUE | | | (2.59 | ) | | | 19.78 | | | | 5.84 | | | | 7.99 | | | | 1.06 | |
| NET ASSET VALUE, END OF PERIOD | | $ | 101.36 | | | $ | 103.95 | | | $ | 84.17 | | | $ | 78.33 | | | $ | 70.34 | |
| TOTAL RETURN(b) | | | (0.59 | )% | | | 25.89 | % | | | 10.37 | % | | | 13.86 | % | | | 3.66 | % |
| | | | | | | | | | | | | | | | | | | | | |
| RATIOS/SUPPLEMENTAL DATA: | | | | | | | | | | | | | | | | | | | | |
| Net assets, end of year (in 000s) | | $ | 342,099 | | | $ | 207,896 | | | $ | 164,141 | | | $ | 168,407 | | | $ | 154,742 | |
| | | | | | | | | | | | | | | | | | | | | |
| Ratio of expenses excluding waiver/reimbursement to average net assets | | | 0.37 | % | | | 0.37 | % | | | 0.37 | % | | | 0.37 | % | | | 0.37 | % |
| Ratio of expenses including waiver/reimbursement to average net assets | | | 0.16 | % | | | 0.15 | % | | | 0.15 | % | | | 0.15 | % | | | 0.15 | % |
| Ratio of net investment income excluding waiver/reimbursement to average net assets | | | 1.68 | % | | | 1.59 | % | | | 2.31 | % | | | 1.89 | % | | | 1.92 | % |
| Ratio of net investment income including waiver/reimbursement to average net assets | | | 1.89 | % | | | 1.81 | % | | | 2.53 | % | | | 2.11 | % | | | 2.14 | % |
| Portfolio turnover rate(c) | | | 12 | % | | | 8 | % | | | 11 | % | | | 4 | % | | | 14 | % |
| (a) | Based on average shares outstanding during the period. |
| (b) | Total return is calculated assuming an initial investment made at the net asset value at the beginning of the period and redemption at the net asset value on the last day of the period and assuming all distributions are reinvested at the reinvestment prices. Total return calculated for a period of less than one year is not annualized. |
| (c) | Portfolio turnover for periods less than one year are not annualized and does not include securities received or delivered from processing creations or redemptions in-kind. |
See Notes to Financial Statements.
10 | November 30, 2022
| ALPS Equal Sector Weight ETF | |
| Notes to Financial Statements | November 30, 2022 |
1. ORGANIZATION
ALPS ETF Trust (the “Trust”), a Delaware statutory trust, is an open-end management investment company registered under the Investment Company Act of 1940, as amended (the “1940 Act”). As of November 30, 2022, the Trust consisted of twenty-three separate portfolios. Each portfolio represents a separate series of the Trust. This report pertains solely to the ALPS Equal Sector Weight ETF (the “Fund”). The investment objective of the Fund is to seek investment results that replicate as closely as possible, before fees and expenses, the performance of the NYSE® Equal Sector Weight Index (the “Underlying Index”). The Fund is considered non-diversified and may invest a greater portion of assets in securities of individual issuers than a diversified fund. As a result, changes in the market value of a single investment could cause greater fluctuations in share price than would occur in a diversified fund.
The Fund’s Shares (“Shares”) are listed on the NYSE Arca, Inc (the “NYSE Arca”). The Fund issues and redeems Shares, at net asset value (“NAV”) in blocks of 25,000 Shares, each of which is called a “Creation Unit”. Creation Units are issued and redeemed principally in-kind for securities included in the Underlying Index. Except when aggregated in Creation Units, Shares are not redeemable securities of the Fund.
Pursuant to the Trust’s organizational documents, its Officers and Trustees are indemnified against certain liability arising out of the performance of their duties to the Trust. Additionally, in the normal course of business, the Trust enters into contracts with service providers that contain general indemnification clauses. The Trust’s maximum exposure under these arrangements is unknown, as this would involve future claims that may be made against the Trust that have not yet occurred.
2. SIGNIFICANT ACCOUNTING POLICIES
The following is a summary of significant accounting policies consistently followed by the Fund in the preparation of the financial statements. The accompanying financial statements were prepared in accordance with accounting principles generally accepted in the United States of America (“U.S. GAAP”). The preparation of financial statements in conformity with U.S. GAAP requires management to make certain estimates and assumptions that affect the reported amounts of assets and liabilities and disclosures of contingent assets and liabilities at the date of the financial statements and the reported amounts of revenue and expenses during the period. Actual results could differ from those estimates. The Fund is considered an investment company under U.S. GAAP and follows the accounting and reporting guidance applicable to investment companies in the Financial Accounting Standards Board (“FASB”) Accounting Standards Codification Topic 946.
A. Portfolio Valuation
The Fund’s NAV is determined daily, as of the close of regular trading on the New York Stock Exchange (the “NYSE”), normally 4:00 p.m. Eastern Time, on each day the NYSE is open for trading. The NAV is computed by dividing the value of all assets of the Fund (including accrued interest and dividends), less all liabilities (including accrued expenses and dividends declared but unpaid), by the total number of shares outstanding.
Portfolio securities listed on any exchange other than the NASDAQ Stock Market LLC (“NASDAQ”) are valued at the last sale price on the business day as of which such value is being determined. If there has been no sale on such day, the securities are valued at the mean of the most recent bid and ask prices on such day. Securities traded on the NASDAQ are valued at the NASDAQ Official Closing Price as determined by NASDAQ. Portfolio securities traded on more than one securities exchange are valued at the last sale price on the business day as of which such value is being determined at the close of the exchange representing the principal market for such securities. Portfolio securities traded in the over-the-counter market, but excluding securities traded on the NASDAQ, are valued at the last quoted sale price in such market.
The Fund’s investments are valued at market value or, in the absence of market value with respect to any portfolio securities, at fair value according to procedures adopted by the Trust’s Board of Trustees (the “Board”). Pursuant to Rule 2a-5 under the 1940 Act, the Board designated ALPS Advisors, Inc. (the "Adviser") as the valuation designee ("Valuation Designee") for each Fund to perform the fair value determinations relating to Fund investments. The Adviser may carry out its designated responsibilities as Valuation Designee through various teams and committees. When market quotations are not readily available or when events occur that make established valuation methods unreliable, securities of the Fund may be valued in good faith by the Valuation Designee. These securities generally include, but are not limited to, restricted securities (securities which may not be publicly sold without registration under the Securities Act of 1933) for which a pricing service is unable to provide a market price; securities whose trading has been formally suspended; a security whose market price is not available from a pre-established primary pricing source or the pricing source is not willing to provide a price; a security with respect to which an event has occurred that is most likely to materially affect the value of the security after the market has closed but before the calculation of the Fund’s NAV or make it difficult or impossible to obtain a reliable market quotation; or a security whose price, as provided by the pricing service, does not reflect the security’s “fair value” due to the security being de-listed from a national exchange or the security’s primary trading market is temporarily closed at a time when, under normal conditions, it would be open. As a general principle, the current “fair value” of a security would be the amount which the owner might reasonably expect to receive from the sale on the applicable exchange or principal market. A variety of factors may be considered in determining the fair value of such securities.
11 | November 30, 2022
| ALPS Equal Sector Weight ETF | |
| Notes to Financial Statements | November 30, 2022 |
B. Fair Value Measurements
The Fund discloses the classification of its fair value measurements following a three-tier hierarchy based on the inputs used to measure fair value. Inputs refer broadly to the assumptions that market participants would use in pricing the asset or liability, including assumptions about risk. Inputs may be observable or unobservable. Observable inputs reflect the assumptions market participants would use in pricing the asset or liability that are developed based on market data obtained from sources independent of the reporting entity. Unobservable inputs reflect the reporting entity’s own assumptions about the assumptions market participants would use in pricing the asset or liability that are developed based on the best information available.
Valuation techniques used to value the Fund’s investments by major category are as follows:
Exchange Traded Funds, for which market quotations are readily available, are valued at the last reported sale price or official closing price as reported by a third party pricing vendor on the primary market or exchange on which they are traded and are categorized as Level 1 in the hierarchy. In the event there were no sales during the day or closing prices are not available, securities are valued at the mean of the most recent quoted bid and ask prices on such day and are generally categorized as Level 2 in the hierarchy. Investments in open-end mutual funds are valued at their closing NAV each business day and are categorized as Level 1 in the hierarchy.
Changes in valuation techniques may result in transfers in or out of an assigned level within the disclosure hierarchy.
Various inputs are used in determining the value of the Fund’s investments as of the end of the reporting period. When inputs used fall into different levels of the fair value hierarchy, the level in the hierarchy within which the fair value measurement falls is determined based on the lowest level input that is significant to the fair value measurement in its entirety. The designated input levels are not necessarily an indication of the risk or liquidity associated with these investments.
These inputs are categorized in the following hierarchy under applicable financial accounting standards:
| Level 1 – | Unadjusted quoted prices in active markets for identical investments, unrestricted assets or liabilities that a Fund has the ability to access at the measurement date; |
| Level 2 – | Quoted prices which are not active, quoted prices for similar assets or liabilities in active markets or inputs other than quoted prices that are observable (either directly or indirectly) for substantially the full term of the asset or liability; and |
| Level 3 – | Significant unobservable prices or inputs (including the Fund’s own assumptions in determining the fair value of investments) where there is little or no market activity for the asset or liability at the measurement date. |
The following is a summary of the inputs used to value the Fund’s investments as of November 30, 2022:
ALPS Equal Sector Weight ETF
| Investments in Securities at Value | | Level 1 - Quoted and Unadjusted Prices | | | Level 2 - Other Significant Observable Inputs | | | Level 3 - Significant Unobservable Inputs | | | Total | |
| Exchange Traded Funds* | | $ | 342,053,306 | | | $ | – | | | $ | – | | | $ | 342,053,306 | |
| Short Term Investments | | | 83,829,837 | | | | – | | | | – | | | | 83,829,837 | |
| Total | | $ | 425,883,143 | | | $ | – | | | $ | – | | | $ | 425,883,143 | |
| * | For a detailed breakdown of sectors, see the accompanying Schedule of Investments. |
The Fund did not have any securities that used significant unobservable inputs (Level 3) in determining fair value and there were no transfers into or out of Level 3 during the year ended November 30, 2022.
C. Securities Transactions and Investment Income
Securities transactions are recorded as of the trade date. Realized gains and losses from securities transactions are recorded on the specific identification in accordance with GAAP. Dividend income and capital gains distributions, if any, are recorded on the ex-dividend date. Interest income, if any, is recorded on the accrual basis.
D. Dividends and Distributions to Shareholders
Dividends from net investment income of the Fund, if any, are declared and paid quarterly or as the Board may determine from time to time. Distributions of net realized capital gains earned by the Fund, if any, are distributed at least annually.
12 | November 30, 2022
| ALPS Equal Sector Weight ETF | |
| Notes to Financial Statements | November 30, 2022 |
E. Federal Tax and Tax Basis Information
The timing and character of income and capital gain distributions are determined in accordance with income tax regulations, which may differ from U.S. GAAP. Reclassifications are made to the Fund’s capital accounts for permanent tax differences to reflect income and gains available for distribution (or available capital loss carryforwards) under income tax regulations.
For the year ended November 30, 2022, the following reclassifications, which had no impact on results of operations or net assets, were recorded to reflect permanent tax differences resulting primarily from in-kind transactions:
| Fund | | Paid-in Capital | | | Total Distributable Earnings/(Accumulated Losses) | |
| ALPS Equal Sector Weight ETF | | $ | 7,171,474 | | | $ | (7,171,474 | ) |
The tax character of the distributions paid during the fiscal years ended November 30, 2022 and November 30, 2021 was as follows:
| Fund | | Ordinary Income | | | Long-Term Capital Gain | | | Return of Capital | |
| November 30, 2022 | | | | | | | | | |
| ALPS Equal Sector Weight ETF | | $ | 4,607,523 | | | $ | – | | | $ | – | |
| | | Ordinary Income | | | Long-Term Capital Gain | | | Return of Capital | |
| November 30, 2021 | | | | | | | | | |
| ALPS Equal Sector Weight ETF | | $ | 3,568,055 | | | $ | – | | | $ | 37,609 | |
The character of distributions made during the year may differ from its ultimate characterization for federal income tax purposes.
Under current law, capital losses maintain their character as short-term or long-term and are carried forward to the next tax year without expiration. As of November 30, 2022, the following amounts are available as carry forwards to the next tax year:
| Fund | | Short-Term | | | Long-Term | |
| ALPS Equal Sector Weight ETF | | $ | 992,242 | | | $ | 3,075,574 | |
As of November 30, 2022, the components of distributable earnings/(accumulated losses) on a tax basis were as follows:
| Fund | | Accumulated Net Investment Income | | | Accumulated Net Realized Gain/(Loss) on Investments | | | Other Accumulated Gains | | | Net Unrealized Appreciation/(Depreciation) on Investments | | | Total | |
| ALPS Equal Sector Weight ETF | | $ | – | | | $ | (4,067,816 | ) | | $ | – | | | $ | 61,587,470 | | | $ | 57,519,654 | |
As of November 30, 2022, the cost of investments for federal income tax purposes and accumulated net unrealized appreciation/(depreciation) on investments were as follows:
| | | ALPS Equal Sector Weight ETF | |
| Gross appreciation (excess of value over tax cost) | | $ | 68,491,139 | |
| Gross depreciation (excess of tax cost over value) | | | (6,903,669 | ) |
| Net unrealized appreciation/(depreciation) | | $ | 61,587,470 | |
| Cost of investments for income tax purposes | | $ | 364,295,673 | |
The differences between book-basis and tax-basis are primarily due to the deferral of losses from wash sales.
13 | November 30, 2022
| ALPS Equal Sector Weight ETF | |
| Notes to Financial Statements | November 30, 2022 |
F. Income Taxes
No provision for income taxes is included in the accompanying financial statements, as the Fund intends to distribute to shareholders all taxable investment income and realized gains and otherwise comply with Subchapter M of the Internal Revenue Code of 1986, as amended, applicable to regulated investment companies. The Fund evaluates tax positions taken (or expected to be taken) in the course of preparing the Fund’s tax returns to determine whether these positions meet a “more-likely-than-not” standard that, based on the technical merits, have a more than fifty percent likelihood of being sustained by a taxing authority upon examination. A tax position that meets the “more-likely-than-not” recognition threshold is measured to determine the amount of benefit to recognize in the financial statements.
As of and during the year ended November 30, 2022, the Fund did not have a liability for any unrecognized tax benefits. The Fund files U.S. federal, state, and local tax returns as required. The Fund’s tax returns are subject to examination by the relevant tax authorities until expiration of the applicable statute of limitations, which is generally three years after the filing of the tax return, but may extend to four years in certain jurisdictions. Tax returns for open years have incorporated no uncertain tax positions that require a provision for income taxes.
G. Lending of Portfolio Securities
The Fund has entered into a securities lending agreement with State Street Bank & Trust Co. (“SSB”), the Fund’s lending agent. The Fund may lend its portfolio securities only to borrowers that are approved by SSB. The Fund will limit such lending to not more than 33 1/3% of the value of its total assets. The Fund’s securities held at SSB as custodian shall be available to be lent except those securities the Fund or ALPS Advisors, Inc. specifically identifies in writing as not being available for lending. The borrower pledges and maintains with the Fund collateral consisting of cash (U.S. Dollars only), securities issued or guaranteed by the U.S. government or its agencies or instrumentalities, and cash equivalents (including irrevocable bank letters of credit) issued by a person other than the borrower or an affiliate of the borrower. The initial collateral received by the Fund is required to have a value of no less than 102% of the market value of the loaned securities for U.S equity securities and a value of no less than 105% of the market value for non-U.S. equity securities. The collateral is maintained thereafter, at a market value equal to not less than 102% of the current value of the U.S. equity securities on loan and not less than 105% of the current value of the non-U.S. equity securities on loan. The market value of the loaned securities is determined at the close of each business day and any additional required collateral is delivered to the Fund on the next business day. During the term of the loan, the Fund is entitled to all distributions made on or in respect of the loaned securities. Loans of securities are terminable at any time and the borrower, after notice, is required to return borrowed securities within the customary time period for settlement of securities transactions.
Any cash collateral received is reinvested in a money market fund managed by SSB as disclosed in the Fund’s Schedule of Investments and is reflected in the Statements of Assets and Liabilities as a payable for collateral upon return of securities loaned. Non-cash collateral, in the form of securities issued or guaranteed by the U.S. government or its agencies or instrumentalities, is not disclosed in the Fund’s Statements of Assets and Liabilities as it is held by the lending agent on behalf of the Fund, and the Fund does not have the ability to re-hypothecate these securities. Income earned by the Fund from securities lending activity is disclosed in the Statement of Operations.
The following is a summary of the Fund's securities lending agreement and related cash and non-cash collateral received as of November 30, 2022:
| | | Market Value of Securities on Loan | | | Cash Collateral Received | | | Non-Cash Collateral Received | | | Total Collateral Received | |
| ALPS Equal Sector Weight ETF | | $ | 91,196,271 | | | $ | 83,760,048 | | | $ | 7,558,240 | | | $ | 91,318,288 | |
The risks of securities lending include the risk that the borrower may not provide additional collateral when required or may not return the securities when due. To mitigate these risks, the Fund benefits from a borrower default indemnity provided by SSB. SSB’s indemnity allows for full replacement of securities lent wherein SSB will purchase the unreturned loaned securities on the open market by applying the proceeds of the collateral, or to the extent such proceeds are insufficient or the collateral is unavailable, SSB will purchase the unreturned loan securities at SSB’s expense. However, the Fund could suffer a loss if the value of the investments purchased with cash collateral falls below the value of the cash collateral received.
14 | November 30, 2022
| ALPS Equal Sector Weight ETF | |
| Notes to Financial Statements | November 30, 2022 |
The following table reflects a breakdown of transactions accounted for as secured borrowings, the gross obligation by the type of collateral pledged or securities loaned, and the remaining contractual maturity of those transactions as of November 30, 2022:
ALPS Equal Sector Weight ETF Remaining contractual maturity of the agreements
| Securities Lending Transactions | | Overnight & Continuous | | | Up to 30 Days | | | 30-90 Days | | | Greater than 90 Days | | | Total | |
| Common Stocks | | $ | 83,760,048 | | | $ | – | | | $ | – | | | $ | – | | | $ | 83,760,048 | |
| Total Borrowings | | | | | | | | | | | | | | | | | | | 83,760,048 | |
| Gross amount of recognized liabilities for securities lending (collateral received) | | | | | | | | | | | | $ | 83,760,048 | |
3. INVESTMENT ADVISORY FEE AND OTHER AFFILIATED TRANSACTIONS
ALPS Advisors, Inc. serves as the Fund’s investment adviser pursuant to an Investment Advisory Agreement with the Trust on behalf of the Fund (the “Advisory Agreement”). Pursuant to the Advisory Agreement, the Fund pays the Adviser an annual management fee for the services and facilities it provides, payable on a monthly basis at the annual rate of 0.37% of the Fund’s average daily net assets.
The Adviser has contractually agreed to waive 0.19% of its annual unitary fee payable by the Fund until at least March 31, 2023. The waiver may only be terminated by the Fund's Board of Trustees prior to such date.
ALPS Portfolio Solutions Distributor, Inc. (“APSD”) is both the distributor for the Fund as well as the Select Sector SPDR exchange traded funds (“Underlying Sector ETFs”) that the Fund invests in. As required by exemptive relief obtained by the Underlying Sector ETFs, the Adviser will reimburse the Fund an amount equal to the distribution fee received by APSD from the Underlying Sector ETFs attributable to the Fund’s investment in the Underlying Sector ETFs, for so long as APSD acts as the distributor to the Fund and the Underlying Sector ETFs. Such reimbursement is generally expected to be approximately 0.02% - 0.03% annually.
Out of the unitary management fees, the Adviser pays substantially all expenses of the Fund, including licensing fees to the Underlying Index provider, the cost of transfer agency, custody, fund administration, legal, audit, trustees and other services, except for acquired fund fees and expenses, interest expenses, distribution fees or expenses, brokerage expenses, taxes and extraordinary expenses not incurred in the ordinary course of the Fund's business. The Adviser’s unitary management fee is designed to pay substantially all of the Fund’s expenses and to compensate the Adviser for providing services to the Fund.
ALPS Fund Services, Inc., an affiliate of the Adviser, is the administrator of the Fund.
Effective February 16, 2022, each Trustee receives (1) a quarterly retainer of $20,000, (2) a per meeting fee of $10,000, (3) $2,500 for any special meeting held outside of a regularly scheduled board meeting, and (4) reimbursement for all reasonable out-of-pocket expenses relating to attendance at meetings. In addition, the Chairman of the Board receives a quarterly retainer of $5,000, the Chairman of the Audit Committee receives a quarterly retainer of $3,000, and the Chairman of the Nominating & Governance Committee receives a quarterly retainer of $2,000, each in connection with their respective roles. Prior to February 16, 2022, each Trustee received (1) a quarterly retainer of $10,000, (2) a per meeting fee of $5,000, (3) $1,500 for any special meeting held outside of a regularly scheduled board meeting, and (4) reimbursement for all reasonable out-of-pocket expenses relating to attendance at meetings. In addition, the Chairman of the Board and Chairman of the Audit Committee each received a quarterly retainer of $2,000, in connection with their respective roles.
15 | November 30, 2022
| ALPS Equal Sector Weight ETF | |
| Notes to Financial Statements | November 30, 2022 |
4. PURCHASES AND SALES OF SECURITIES
For the year ended November 30, 2022 the cost of purchases and proceeds from sales of investment securities, excluding short-term investments and in-kind transactions, were as follows:
| Fund | | Purchases | | | Sales | |
| ALPS Equal Sector Weight ETF | | $ | 28,712,812 | | | $ | 28,770,607 | |
For the year ended November 30, 2022, the cost of in-kind purchases and proceeds from in-kind sales were as follows:
| Fund | | Purchases | | | Sales | |
| ALPS Equal Sector Weight ETF | | $ | 153,188,314 | | | $ | 15,270,806 | |
For the year ended November 30, 2022, the ALPS Equal Sector Weight ETF had in-kind net realized gain of $7,076,803.
Gains on in-kind transactions are not considered taxable for federal income tax purposes and losses on in-kind transactions are also not deductible for tax purposes.
5. CAPITAL SHARE TRANSACTIONS
Shares are created and redeemed by the Fund only in Creation Unit size aggregations of 25,000 Shares. Only broker-dealers or large institutional investors with creation and redemption agreements called Authorized Participants (“AP”) are permitted to purchase or redeem Creation Units from the Fund. Such transactions are generally permitted on an in-kind basis, with a balancing cash component to equate the transaction to the NAV per unit of the Fund on the transaction date. Cash may be substituted equivalent to the value of certain securities generally when they are not available in sufficient quantity for delivery, not eligible for trading by the AP or as a result of other market circumstances.
6. MARKET RISK
The Fund is subject to investment and operational risks associated with financial, economic and other global market developments and disruptions, including the recent spread of an infectious respiratory illness caused by a novel strain of coronavirus (known as COVID-19), which can negatively impact the securities markets and cause the Fund to lose value. Securities in the Fund’s portfolio may underperform in comparison to securities in general financial markets, a particular financial market or other asset classes due to a number of factors, including inflation (or expectations for inflation), deflation (or expectations for deflation), interest rates, global demand for particular products or resources, market instability, debt crises and downgrades, embargoes, tariffs, sanctions and other trade barriers, regulatory events, other governmental trade or market control programs and related geopolitical events. In addition, the value of the Fund’s investments may be negatively affected by the occurrence of global events such as war, terrorism, environmental disasters, natural disasters or events, country instability, and infectious disease epidemics or pandemics.
The spread of COVID-19 has caused volatility, severe market dislocations and liquidity constraints in many markets, including markets for the securities the Fund holds, and may adversely affect the Fund’s investments and operations. The transmission of COVID-19 and efforts to contain its spread have resulted in travel restrictions and disruptions, closed international borders, enhanced health screenings at ports of entry and elsewhere, disruption of and delays in healthcare service preparation and delivery, quarantines, event and service cancellations or interruptions, disruptions to business operations and supply chains, and a reduction in consumer and business spending, as well as general concern and uncertainty that has negatively affected the economy. These disruptions have led to instability in the market place and the jobs market. The impact of COVID-19 could adversely affect the economies of many nations or the entire global economy, the financial well-being and performance of individual issuers, borrowers and sectors and the health of the markets generally in potentially significant and unforeseen ways.
The foregoing could lead to a significant economic downturn or recession, increased market volatility, a greater number of market closures, higher default rates and adverse effects on the values and liquidity of the Fund’s securities or other assets. Such impacts may adversely affect the performance of the Fund.
7. SUBSEQUENT EVENTS
Subsequent events, if any, after the date of the Statement of Assets and Liabilities have been evaluated through the date the financial statements were issued. Management has determined that there were no subsequent events to report through the issuance of these financial statements.
16 | November 30, 2022
| ALPS Equal Sector Weight ETF | |
| Additional Information | November 30, 2022 (Unaudited) |
PROXY VOTING RECORDS, POLICIES AND PROCEDURES
Information regarding how the Fund voted proxies relating to portfolio securities during the most recent 12-month period ended June 30 and a description of the Fund’s proxy voting policies and procedures used in determining how to vote for proxies are available without charge on the SEC’s website at www.sec.gov and upon request, by calling (toll-free) 1-866-759-5679.
PORTFOLIO HOLDINGS
The Fund files a complete schedule of portfolio holdings with the U.S. Securities and Exchange Commission (“SEC”) for the first and third quarters of each fiscal year on Form N-PORT within 60 days after the end of the period. Copies of the Fund’s Form N-PORT are available without a charge, upon request, by contacting the Fund at 1-866-759-5679 and on the SEC’s website at https://www.sec.gov.
TAX INFORMATION
The ALPS Equal Sector Weight ETF designates the following as a percentage of taxable ordinary income distributions, or up to the maximum amount allowable, for the calendar year ended December 31, 2021:
| | Qualified Dividend Income | Dividend Received Deduction |
| ALPS Equal Sector Weight ETF | 88.31% | 85.80% |
In early 2022, if applicable, shareholders of record received this information for the distributions paid to them by the Fund during the calendar year 2021 via Form 1099. The Fund will notify shareholders in early 2023 of amounts paid to them by the Fund, if any, during the calendar year 2022.
LICENSING AGREEMENT
ICE Data Indices, LLC (the “Index Provider”) is not affiliated with the ALPS Equal Sector Weight ETF (the “Fund”) or ALPS Advisors, Inc. (the “Adviser”). The Fund is entitled to use the Underlying Index pursuant to a licensing agreement with the Index Provider and the Adviser. The Adviser pays a licensing fee to the Index Provider out of the management fee.
The only relationship that the Index Provider has with the Fund, the Adviser or Distributor of the Fund in connection with the Fund is that the Index Provider has licensed certain of its intellectual property, including the determination of the component stocks of the Underlying Index and the name of the Underlying Index. The Underlying Index is selected and calculated without regard to the Adviser, Distributor or owners of the Fund. The Index Provider has no obligation to take the specific needs of the Adviser, Distributor or owners of the Fund into consideration in the determination and calculation of the Underlying Index. The Index Provider is not responsible for and has not participated in the determination of pricing or the timing of the issuance or sale of the Shares of the Fund or in the determination or calculation of the net asset value of the Fund. The Index Provider has no obligation or liability in connection with the administration or trading of the Fund.
NYSE® Equal Sector Weight Index is a service mark of ICE Data Indices, LLC or its affiliates (“ICE Data”) and has been licensed for use by the Adviser in connection with the Fund. Neither the Trust nor the Fund is sponsored, endorsed, sold or promoted by ICE Data. ICE Data makes no representations or warranties regarding the Adviser or the Fund or the ability of the NYSE® Equal Sector Weight Index to track general stock market performance.
ICE DATA MAKES NO EXPRESS OR IMPLIED WARRANTIES, AND HEREBY EXPRESSLY DISCLAIMS ALL WARRANTIES OF MERCHANTABILITY OR FITNESS FOR A PARTICULAR PURPOSE WITH RESPECT TO THE NYSE® EQUAL SECTOR WEIGHT INDEX OR ANY DATA INCLUDED THEREIN. IN NO EVENT SHALL ICE DATA HAVE ANY LIABILITY FOR ANY SPECIAL, PUNITIVE, INDIRECT, OR CONSEQUENTIAL DAMAGES (INCLUDING LOST PROFITS), EVEN IF NOTIFIED OF THE POSSIBILITY OF SUCH DAMAGES.
The Adviser does not guarantee the accuracy and/or the completeness of the Underlying Index or any data included therein, and the Adviser shall have no liability for any errors, omissions or interruptions therein. The Adviser makes no warranty, express or implied, as to results to be obtained by the Fund, owners of the Shares of the Fund or any other person or entity from the use of the Underlying Index or any data included therein. The Adviser makes no express or implied warranties, and expressly disclaims all warranties of merchantability or fitness for a particular purpose or use with respect to the Underlying Index or any data included therein. Without limiting any of the foregoing, in no event shall the Adviser have any liability for any special, punitive, direct, indirect or consequential damages (including lost profits) arising out of matters relating to the use of the Underlying Index even if notified of the possibility of such damages.
17 | November 30, 2022
| ALPS Equal Sector Weight ETF | |
| Board Considerations Regarding Approval of | November 30, 2022 (Unaudited) |
| Investment Advisory Agreement | |
At a meeting held on June 21, 2022 via electronic means (video-conference), the Board of Trustees of the Trust (the “Board” or the “Trustees”), including the Trustees who are not “interested persons” of the Trust within the meaning of the Investment Company Act of 1940, as amended (the “Independent Trustees”), evaluated a proposal to approve the continuance of the Investment Advisory Agreement between the Trust and ALPS Advisors, Inc. (the “Adviser” or “AAI”) with respect to the ALPS Equal Sector Weight ETF (“EQL” or the “Fund”). The Independent Trustees also met separately to consider the Investment Advisory Agreement.
In evaluating the Investment Advisory Agreement with respect to the Fund, the Board, including the Independent Trustees, considered various factors, including (i) the nature, extent and quality of the services provided by AAI with respect to the Fund under the Investment Advisory Agreement; (ii) the advisory fees and other expenses paid by the Fund compared to those of similar funds managed by other investment advisers; (iii) the costs of the services provided to the Fund by AAI and the profits realized by AAI and its affiliates from its relationship to the Fund; (iv) the extent to which economies of scale have been or would be realized if and as the assets of the Fund grow and whether fees reflect the economies of scale for the benefit of shareholders; and (v) any additional benefits and other considerations.
With respect to the nature, extent and quality of the services provided by AAI under the Investment Advisory Agreement, the Board considered and reviewed information concerning the services provided under the Investment Advisory Agreement, the investment parameters of the index of the Fund, financial information regarding AAI and its parent company, information describing AAI’s current organization and the background and experience of the persons responsible for the day-to-day management of the Fund.
The Board reviewed information on the performance of the Fund and its applicable benchmark. The Board also evaluated the correlation and tracking error between the underlying index and the Fund’s performance. Based on this review, the Board, including the Independent Trustees, found that the nature and extent of services provided to the Fund under the Investment Advisory Agreement was appropriate and that the quality was satisfactory.
The Board noted that the advisory fee for the Fund was a unitary fee pursuant to which AAI assumes all expenses of the Fund (including the cost of transfer agency, custody, fund administration, legal, audit and other services) other than the payments under the Investment Advisory Agreement, brokerage expenses, taxes, interest, litigation expenses and other extraordinary expenses.
With respect to advisory fee rates, the Board, including the Independent Trustees, noted the following:
The gross management fee rate the Fund is higher than the median of its FUSE expense group. The Fund’s net expense ratio, however, is lower than the median of its FUSE expense group.
Based on the foregoing, and the other information available to them, the Board, including the Independent Trustees, concluded that the advisory fee rate for the Fund was reasonable under the circumstances and in light of the quality of the services provided.
The Board, including the Independent Trustees, considered other benefits available to AAI because of its relationship with the Fund and concluded that the advisory fees were reasonable taking into account any such benefits.
The Board, including the Independent Trustees, also considered, with respect to the Fund, the information provided by AAI about the costs and profitability of AAI with respect to the Fund, including the asset levels and other factors that influence the profitability and financial viability of the Fund. The Board, including the Independent Trustees, reviewed and noted the relatively small size of the Fund and concluded that AAI was not realizing any economies of scale. The Independent Trustees determined that AAI should continue to keep the Board informed on an ongoing basis of any significant developments (e.g., material increases in asset levels) so as to facilitate the Independent Trustees’ evaluation of whether further economies of scale have been achieved.
In voting to renew the Investment Advisory Agreement, the Board, including the Independent Trustees, concluded that the terms of the Investment Advisory Agreement are reasonable and fair in light of the services to be performed, the fees paid by certain other funds, expenses to be incurred and such other matters as the members of the Board, including the Independent Trustees, considered relevant in the exercise of their reasonable business judgment. The Independent Trustees did not identify any single factor or group of factors as all important or controlling and considered all factors together.
18 | November 30, 2022
| ALPS Equal Sector Weight ETF | |
| Trustees & Officers | November 30, 2022 (Unaudited) |
The general supervision of the duties performed by the Adviser for the Fund under the Investment Advisory Agreement is the responsibility of the Board of Trustees. The Trust currently has four Trustees, each of whom have no affiliation or business connection with the Adviser or any of its affiliated persons and do not own any stock or other securities issued by the Adviser. These are the “non-interested” or “independent” Trustees (“Independent Trustees”).
The Independent Trustees of the Trust, their term of office and length of time served, their principal business occupations during the past five years, the number of portfolios in the Fund Complex overseen by each Independent Trustee, and other directorships, if any, held by the Trustee are shown below.
INDEPENDENT TRUSTEES
| Name, Address & Year of Birth* | Position(s) Held with Trust | Term of Office and Length of Time Served** | Principal Occupation(s) During Past 5 Years | Number of Portfolios in Fund Complex Overseen by Trustees*** | Other Directorships Held by Trustees |
Mary K. Anstine, 1940 | Trustee | Since March 2008 | Ms. Anstine is Trustee/Director of AV Hunter Trust and Colorado Uplift Board. | 38 | Ms. Anstine is a Trustee of ALPS Variable Investment Trust (7 funds); Financial Investors Trust (29 funds); and Reaves Utility Income Fund. |
Jeremy W. Deems, 1976 | Trustee | Since March 2008 | Mr. Deems is the Co-Founder and Chief Financial Officer of Green Alpha Advisors, LLC, a registered investment advisor, and Co-Portfolio Manager of the Shelton Green Alpha Fund. | 38 | Mr. Deems is a Trustee of ALPS Variable Investment Trust (7 funds); Financial Investors Trust (29 funds); and Reaves Utility Income Fund; and Clough Funds Trust (1 fund). |
Rick A. Pederson, 1952 | Trustee | Since March 2008 | Mr. Pederson is Partner, Bow River Capital Partners (private equity management), 2003 - present; Board Member, Prosci Inc. (private business services) 2013-2016; Advisory Board Member, Citywide Banks (Colorado community bank) 2014- 2017; Board Member, Strong-Bridge Consulting, 2015- 2019; Board Member, IRI/ODMS Holdings LLC, 2017 – 2019; Director, National Western Stock Show (not for profit) 2010 - present; Director, History Colorado (not for profit) 2015- present; Director, Citywide Bank Advisory Board 2017-present; Trustee, Boettcher Foundation, 2018 -present. | 24 | Mr. Pederson is Trustee of Segall Bryant & Hamill Trust (14 funds), Principal Real Estate Income Fund (1 fund). |
| * | The business address of the Trustee is c/o ALPS Advisors, Inc., 1290 Broadway, Suite 1000, Denver, Colorado 80203. |
| ** | This is the period for which the Trustee began serving the Trust. Each Trustee serves an indefinite term, until his or her successor is elected. |
| *** | The Fund Complex includes all series of the Trust and any other investment companies for which ALPS Advisors, Inc. provides investment advisory services. |
19 | November 30, 2022
| ALPS Equal Sector Weight ETF | |
| Trustees & Officers | November 30, 2022 (Unaudited) |
| Name, Address & Year of Birth* | Position(s) Held with Trust | Term of Office and Length of Time Served** | Principal Occupation(s) During Past 5 Years | Number of Portfolios in Fund Complex Overseen by Trustees*** | Other Directorships Held by Trustees |
Edmund J. Burke, 1961 | Trustee | Since December 2017 | Mr. Burke joined ALPS in 1991 and served as the President and Director of ALPS Holdings, Inc., and ALPS Advisors, Inc., and Director of ALPS Distributors, Inc., ALPS Fund Services, Inc. (“ALPS”), and ALPS Portfolio Solutions Distributor, Inc. (collectively, the “ALPS Companies”). Mr. Burke retired from the ALPS Companies in June 2019. Mr. Burke is currently a partner at ETF Action, a web- based system that provides data and analytics to registered investment advisers, (since 2020) and a Director of Alliance Bioenergy Plus, Inc., a technology company focused on emerging technologies in the renewable energy, biofuels, and bioplastics technology sectors (since 2020). | 33 | Mr. Burke is a Trustee of Clough Global Dividend and Income Fund (1 fund); Clough Global Equity Fund (1 fund); Clough Global Opportunities Fund (1 fund); Clough Funds Trust (1 fund); Liberty All -Star Equity Fund (1 fund); Director of the Liberty All- Star Growth Fund, Inc. (1 fund) and Financial Investors Trust (29 funds). |
| * | The business address of the Trustee is c/o ALPS Advisors, Inc., 1290 Broadway, Suite 1000, Denver, Colorado 80203. |
| ** | This is the period for which the Trustee began serving the Trust. Each Trustee serves an indefinite term, until his or her successor is elected. |
| *** | The Fund Complex includes all series of the Trust and any other investment companies for which ALPS Advisors, Inc. provides investment advisory services. |
20 | November 30, 2022
| ALPS Equal Sector Weight ETF | |
| Trustees & Officers | November 30, 2022 (Unaudited) |
OFFICERS:
| Name, Address and Year of Birth of Officer* | Position(s) Held with Trust | Length of Time Served** | Principal Occupation(s) During Past 5 Years |
Laton Spahr, 1975 | President | Since June 2021 | Mr. Spahr joined ALPS in 2019 and currently serves as President and Portfolio Manager of AAI. Prior to his current role, Mr. Spahr was a Senior Vice President and Strategy Leader of the Value & Income Team for Oppenheimer Funds from 2013 to 2019. |
Matthew Sutula, 1985 | Chief Compliance Officer (“CCO”) | Since December 2019 | Mr. Sutula joined ALPS in 2012 and currently serves as Chief Compliance Officer of AAI. Prior to his current role, Mr. Sutula served as interim Compliance Officer of the Trust (September 2019 to December 2019). Compliance Manager and Senior Compliance Analyst for AAI, as well as Compliance Analyst for AFS. Prior to joining ALPS, he spent seven years at Morningstar, Inc. in various analyst roles supporting the registered investment company databases. Mr. Sutula is also Chief Compliance Officer of Principal Real Estate Income Fund, ALPS Variable Investment Trust, Liberty All-Star Equity Fund and Liberty All-Star Growth Fund, Inc. From September 2019 to September 2022 he served as Chief Compliance Officer of RiverNorth Opportunities Fund, Inc. |
Kathryn Burns, 1976 | Treasurer | Since September 2018 | Ms. Burns serves as Vice President, Director of Fund Operations of AAI since 2018. From 2013 to 2018, she served as Vice President and Fund Controller at AFS. Prior to joining ALPS, she worked at Old Mutual Capital where she served as Vice President and Chief Compliance Officer (2010 – 2012) and Regulatory Reporting Manager and Assistant Treasurer to the Old Mutual Funds Trusts (2006 – 2012). She also served as a CPA for PricewaterhouseCoopers LLP. Ms. Burns also serves as President of ALPS Variable Investment Trust and Principal Real Estate Income Fund. From June 2019 to September 2022 she served as President of RiverNorth Opportunities Fund, Inc. and from June 2018 to November 2021 she served as Treasurer of Boulder Growth & Income Fund, Inc. |
Michael P. Lawlor, 1969 | Secretary | Since December 2022 | Mr. Lawlor joined ALPS in January 2022, and is currently Vice President and Principal Legal Counsel. Prior to joining ALPS, Mr. Lawlor was Lead Fund Counsel at Brighthouse Financial (insurance company) (January 2007-April 2021). Mr. Lawlor also serves as Secretary of Financial Investors Trust and ALPS Variable Investment Trust. |
| * | The business address of each Officer is c/o ALPS Advisors, Inc., 1290 Broadway, Suite 1000, Denver, Colorado 80203. Each Officer is deemed an affiliate of the Trust as defined under the 1940 Act. |
| ** | This is the period for which the Officer began serving the Trust. Each Officer serves an indefinite term, until his or her successor is elected. |
The Statement of Additional Information includes additional information about the Fund’s Trustees and is available, without charge, upon request by calling (toll-free) 1-866-759-5679.
21 | November 30, 2022


| Table of Contents | |
| | |
| Performance Overview | 1 |
| Disclosure of Fund Expenses | 4 |
| Report of Independent Registered Public Accounting Firm | 5 |
| Financial Statements | |
| Schedule of Investments | 6 |
| Statement of Assets and Liabilities | 8 |
| Statement of Operations | 9 |
| Statements of Changes in Net Assets | 10 |
| Financial Highlights | 11 |
| Notes to Financial Statements | 12 |
| Additional Information | 18 |
| Board Considerations Regarding Approval of Investment Advisory Agreement and Investment | |
| Sub-Advisory Agreement | 19 |
| Trustees & Officers | 21 |
alpsfunds.com
| ALPS Hillman Active Value ETF | |
| Performance Overview | November 30, 2022 (Unaudited) |
Investment Objective
The ALPS Hillman Active Value ETF (the "Fund") seeks long-term total return from a combination of income and capital gains. The Fund seeks to achieve its investment objective by investing in U.S. companies that Hillman Capital Management, Inc. (“HCM”), the Fund's sub-adviser believes have competitive advantages and have temporarily fallen out of favor for reasons that are considered non-recurring or short-term; whose value is not currently well known; or whose value is not fully recognized by the public.
Performance Overview
For the fiscal year ended November 30, 2022, the Fund returned, at NAV, -3.05% versus a return of 2.42% for the Russell 1000® Value Total Return Index. While the team at HCM is not pleased with the short-term performance versus the Fund’s benchmark index, it is our view that investment in enterprises which we believe possess sustainable competitive advantages, coupled with strict adherence to our fundamentally sound valuation discipline, should work well for long term investors.
During the period, U.S. equity investors appeared concerned by rising interest rates and inflation. Further dampening enthusiasm, supply chain issues lingered, exacerbated by war in Ukraine and China’s zero tolerance COVID policy. The U.S. Federal Reserve Bank’s Open Market Committee increased the target federal funds rate from a range of 0.00% to 0.25% to a range of 3.75% to 4.00%, and the yield on the benchmark Ten Year U.S. Treasury Note rose from 1.43% to 3.68%.
The Fund benefitted from strong performance in the Consumer Staples, Health Care, and Energy sectors. The Communication Services, Information Technology, and Consumer Discretionary sectors weighed heavily on relative performance.
The top 5 performers for the period were Biogen Inc. (BIIB), Merck & Co Inc. (MRK), Bristol-Myers Squibb Company (BMY), Plains All American Pipeline LP (PAA), and Exxon Mobil Corporation (XOM).
The bottom 5 performers for the fiscal year were Meta Platforms Inc (META), Warner Brothers Discovery (WBD), Amazon.com Inc. (AMZN), Salesforce.com Inc. (CRM), and ServiceNow Inc. (NOW).
HCM’s equity strategies are driven by its core belief that competitively advantaged companies will outperform their peers through economic cycles and market cycles. HCM’s goal is to invest in great enterprises at attractive prices. HCM’s investment team will continue to invest according to this precept for the long-term interest of our clients. HCM feels that the Fund is well positioned with investments in companies with sustainable competitive advantages, at prices that it believes to be reasonable.
1 | November 30, 2022
| ALPS Hillman Active Value ETF | |
| Performance Overview | November 30, 2022 (Unaudited) |
Performance (as of November 30, 2022)
| | 1 Year | Since Inception^ |
| ALPS Hillman Active Value ETF - NAV | -3.05% | -4.81% |
| ALPS Hillman Active Value ETF – Market Price* | -3.21% | -4.87% |
| Russell 1000® Value Total Return Index | 2.42% | 2.18% |
Total Expense Ratio (per the current prospectus) is 0.55%.
Performance data quoted represents past performance. Past performance does not guarantee future results. Total return figures assume reinvestment of dividends and capital gains distributions, if any. The table does not reflect the deduction of taxes that a shareholder would pay on Fund distributions or the redemption of Fund shares. Investment return and principal value of an investment will fluctuate so that an investor’s shares, when sold or redeemed, may be worth more or less than the original cost. Current performance data may be higher or lower than actual data quoted. For the most current month-end performance data please visit www.alpsfunds.com or call 1.866.759.5679.
Net Asset Value (NAV) is an exchange-traded fund’s per-share value. The per-share dollar amount of the Fund is derived by dividing the total value of all the securities in its portfolio, less any liabilities, by the number of Fund shares outstanding. Market Price is the price at which a share can currently be traded in the market. Information detailing the number of days the Market Price of the Fund was greater than the Fund’s NAV and the number of days it was less than the Fund’s NAV can be obtained at www.alpsfunds.com.
| ^ | The Fund commenced operations on July 15, 2021, with the first day of trading on the exchange of July 16, 2021. |
| * | Market Price means the official closing price of a share or, if it more accurately reflects the market value of a share at the time as of which the Fund calculates current net asset value per share, the price that is the midpoint of the bid-ask spread as of that time. It does not represent the returns an investor would receive if shares were traded at other times. . |
Russell 1000® Value Total Return is a broad-based benchmark that measures the performance of the large cap value segment of the US equity universe. It includes those Russell 1000® companies with lower price-to-book ratios and lower expected growth values. The index is not actively managed and does not reflect any deductions for fees, expenses or taxes. The index is reported on a total return basis, which assumes reinvestment of any dividends and distributions realized during a given time period. One cannot invest directly in an index. Index performance does not reflect fund performance.
The Fund’s shares are not individually redeemable. Investors buy and sell shares of the Fund on a secondary market. Only market makers or “authorized participants” may trade directly with the Fund, typically in blocks of 25,000 shares.
The ALPS Hillman Active Value ETF is not suitable for all investors. Investments in the Fund are subject to investment risks, including possible loss of the principal amount invested.
ALPS Portfolio Solutions Distributor, Inc., a FINRA member, is the distributor for the Fund.
2 | November 30, 2022
| ALPS Hillman Active Value ETF | |
| Performance Overview | November 30, 2022 (Unaudited) |
| Top 10 Holdings* (as of November 30, 2022) | |
| | |
| Air Products and Chemicals, Inc. | 2.91% |
| Constellation Brands, Inc. | 2.78% |
| Wells Fargo & Co. | 2.61% |
| Enterprise Products Partners LP | 2.51% |
| Becton Dickinson and Co. | 2.48% |
| Kraft Heinz Co. | 2.47% |
| Meta Platforms, Inc. | 2.41% |
| Emerson Electric Co. | 2.39% |
| AT&T, Inc. | 2.38% |
| Lam Research Corp. | 2.37% |
| Total % of Top 10 Holdings | 25.31% |
| Sector Allocation* (as of November 30, 2022) | |
| | |
| Information Technology | 19.79% |
| Communication Services | 15.21% |
| Health Care | 12.16% |
| Consumer Staples | 11.48% |
| Financials | 11.44% |
| Industrials | 10.92% |
| Materials | 7.42% |
| Consumer Discretionary | 5.68% |
| Energy | 2.51% |
| Real Estate | 2.29% |
| Money Market Fund | 1.10% |
| Total Investments | 100.00% |
| * | % of Total Investments (excluding investments purchased with collateral from securities loaned). |
Future holdings are subject to change.
Growth of $10,000 (as of November 30, 2022)
Comparison of Change in Value of $10,000 Investment in the Fund and the Fund's benchmark
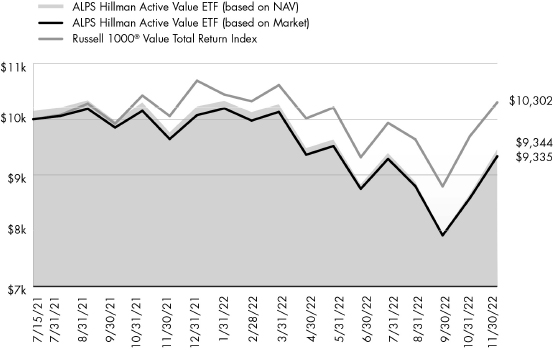
The chart above compares historical performance of a hypothetical investment of $10,000 in the Fund since inception with the performance of the Fund’s benchmark index. Past performance does not guarantee future results. The chart does not reflect the deduction of taxes that a shareholder would pay on Fund distributions or the redemption of Fund shares.
3 | November 30, 2022
| ALPS Hillman Active Value ETF | |
| Disclosure of Fund Expenses | November 30, 2022 (Unaudited) |
Shareholder Expense Example: As a shareholder of a Fund, you incur certain ongoing costs, including management fees and other Fund expenses. These examples are intended to help you understand your ongoing costs (in dollars) of investing in the Fund and to compare these costs with the ongoing costs of investing in other funds. It is based on an investment of $1,000 invested at the beginning of the six month period and held through November 30, 2022.
Actual Return: The first line of the table provides information about actual account values and actual expenses. You may use the information in this line, together with the amount you invested, to estimate the expenses that you incurred over the period. Simply divide your account value by $1,000 (for example, an $8,600 account value divided by $1,000 = 8.6), then multiply the result by the number in the first line under the heading entitled “Expenses Paid During Period” to estimate the expenses attributable to your investment during this period.
Hypothetical 5% Return: The second line of the table provides information about hypothetical account values and hypothetical expenses based on the Fund’s actual expense ratio and an assumed rate of return of 5% per year before expenses, which is not the Fund’s actual return. The hypothetical account values and expenses may not be used to estimate the actual ending account balance or expenses you paid for the period. You may use this information to compare ongoing costs of investing in the Fund and other funds. To do so, compare this 5% hypothetical example with the 5% hypothetical examples that appear in the shareholder reports of other funds.
The expenses shown in the table are meant to highlight ongoing Fund costs only and do not reflect any transaction costs, such as brokerage commissions and other fees to financial intermediaries. Therefore, the second line is useful in comparing ongoing costs only, and will not help you determine the relative total costs of owning different funds. In addition, if these costs were included, your costs would have been higher.
| | | Beginning Account Value 6/1/22 | | | Ending Account Value 11/30/22 | | | Expense Ratio(a) | | | Expenses Paid During Period 6/1/22 - 11/30/22(b) | |
| ALPS Hillman Active Value ETF | | | | | | | | | | | | |
| Actual | | $ | 1,000.00 | | | $ | 982.10 | | | | 0.55 | % | | $ | 2.73 | |
| Hypothetical (5% return before expenses) | | $ | 1,000.00 | | | $ | 1,022.31 | | | | 0.55 | % | | $ | 2.79 | |
| (a) | Annualized, based on the Fund's most recent fiscal half year expenses. |
| (b) | Expenses are equal to the Fund's annualized expense ratio multiplied by the average account value over the period, multiplied by the number of days in the most recent fiscal half year (183), divided by 365. |
4 | November 30, 2022
| ALPS Hillman Active Value ETF |
| Report of Independent Registered Public Accounting Firm |
To the Board of Trustees of ALPS ETF Trust and the Shareholders of ALPS Hillman Active Value ETF
Opinion on the Financial Statements
We have audited the accompanying statement of assets and liabilities of ALPS Hillman Active Value ETF, a series of shares of beneficial interest in ALPS ETF Trust (the “Fund”), including the schedule of investments, as of November 30, 2022, and the related statements of operations and changes in net assets and the financial highlights for the year then ended, and the related notes (collectively referred to as the “financial statements”). In our opinion, the financial statements present fairly, in all material respects, the financial position of the Fund as of November 30, 2022, and the results of its operations, the changes in its net assets, and its financial highlights for the year then ended, in conformity with accounting principles generally accepted in the United States of America. The statement of changes in net assets and the financial highlights for the period from July 15, 2021 (commencement of operations) through November 30, 2021 were audited by other auditors whose report dated January 26, 2022, expressed an unqualified opinion on those financial statements and financial highlights.
Basis for Opinion
These financial statements are the responsibility of the Fund’s management. Our responsibility is to express an opinion on the Fund's financial statements based on our audit. We are a public accounting firm registered with the Public Company Accounting Oversight Board (United States) (“PCAOB”) and are required to be independent with respect to the Fund in accordance with the U.S. federal securities law and the applicable rules and regulations of the Securities and Exchange Commission and the PCAOB.
We conducted our audit in accordance with the standards of the PCAOB. Those standards require that we plan and perform the audit to obtain reasonable assurance about whether the financial statements are free of material misstatement, whether due to error or fraud. The Fund is not required to have, nor were we engaged to perform, an audit of its internal control over financial reporting. As part of our audit we are required to obtain an understanding of internal control over financial reporting but not for the purpose of expressing an opinion on the effectiveness of the Fund’s internal control over financial reporting. Accordingly, we express no such opinion.
Our audit included performing procedures to assess the risk of material misstatement of the financial statements, whether due to error or fraud, and performing procedures that respond to those risks. Such procedures included examining, on a test basis, evidence regarding the amounts and disclosures in the financial statements. Our procedures included confirmation of securities owned as of November 30, 2022 by correspondence with the custodian. Our audit also included evaluating the accounting principles used and significant estimates made by management, as well as evaluating the overall presentation of the financial statements. We believe that our audit provides a reasonable basis for our opinion.

BBD, LLP
We have served as the auditor of one or more of the Funds in the ALPS ETF Trust since 2022.
Philadelphia, Pennsylvania
January 27, 2023
5 | November 30, 2022
| ALPS Hillman Active Value ETF | |
| Schedule of Investments | November 30, 2022 |
| Security Description | | Shares | | | Value | |
| COMMON STOCKS (96.22%) | | | | | | |
| Communication Services (15.18%) | | | | | | |
| Alphabet, Inc., Class A(a) | | | 1,360 | | | $ | 137,346 | |
| AT&T, Inc. | | | 8,358 | | | | 161,142 | |
| Comcast Corp., Class A | | | 3,972 | | | | 145,534 | |
| Meta Platforms, Inc., Class A(a) | | | 1,385 | | | | 163,569 | |
| Verizon Communications, Inc. | | | 2,943 | | | | 114,718 | |
| Walt Disney Co.(a) | | | 1,550 | | | | 151,699 | |
| Warner Bros Discovery, Inc.(a) | | | 13,759 | | | | 156,852 | |
| Total Communication Services | | | | | | | 1,030,860 | |
| | | | | | | | | |
| Consumer Discretionary (5.67%) | | | | | | | | |
| Amazon.com, Inc.(a) | | | 1,400 | | | | 135,156 | |
| CarMax, Inc.(a) | | | 1,760 | | | | 122,074 | |
| Nordstrom, Inc.(b) | | | 6,095 | | | | 127,812 | |
| Total Consumer Discretionary | | | | | | | 385,042 | |
| | | | | | | | | |
| Consumer Staples (11.46%) | | | | | | | | |
| Anheuser-Busch InBev SA, ADR(b) | | | 2,385 | | | | 140,453 | |
| Conagra Brands, Inc. | | | 3,789 | | | | 143,906 | |
| Constellation Brands, Inc., Class A | | | 733 | | | | 188,637 | |
| Kellogg Co. | | | 1,893 | | | | 138,094 | |
| Kraft Heinz Co. | | | 4,250 | | | | 167,238 | |
| Total Consumer Staples | | | | | | | 778,328 | |
| | | | | | | | | |
| Financials (11.42%) | | | | | | | | |
| Bank of New York Mellon Corp. | | | 3,359 | | | | 154,178 | |
| BlackRock, Inc. | | | 217 | | | | 155,372 | |
| T Rowe Price Group, Inc. | | | 1,077 | | | | 134,528 | |
| Wells Fargo & Co. | | | 3,684 | | | | 176,648 | |
| Western Union Co. | | | 10,581 | | | | 155,117 | |
| Total Financials | | | | | | | 775,843 | |
| | | | | | | | | |
| Health Care (12.14%) | | | | | | | | |
| Becton Dickinson and Co. | | | 673 | | | | 167,806 | |
| Biogen, Inc.(a) | | | 477 | | | | 145,566 | |
| CVS Health Corp. | | | 1,487 | | | | 151,496 | |
| GSK PLC, ADR(b) | | | 3,454 | | | | 119,474 | |
| Medtronic PLC | | | 1,299 | | | | 102,673 | |
| Zimmer Biomet Holdings, Inc. | | | 1,143 | | | | 137,274 | |
| Total Health Care | | | | | | | 824,289 | |
| | | | | | | | | |
| Industrials (10.90%) | | | | | | | | |
| 3M Co. | | | 1,139 | | | | 143,480 | |
| Boeing Co.(a) | | | 826 | | | | 147,755 | |
| Emerson Electric Co. | | | 1,692 | | | | 162,043 | |
| General Electric Co. | | | 1,641 | | | | 141,077 | |
| Raytheon Technologies Corp. | | | 1,477 | | | | 145,809 | |
| Total Industrials | | | | | | | 740,164 | |
| | | | | | | | | |
| Information Technology (19.76%) | | | | | | | | |
| Adobe, Inc.(a) | | | 463 | | | | 159,702 | |
| ASML Holding NV | | | 242 | | | | 147,165 | |
| Equifax, Inc. | | | 740 | | | | 146,054 | |
| Intel Corp. | | | 4,341 | | | | 130,534 | |
| Security Description | | Shares | | | Value | |
| Information Technology (continued) | | | | | | |
| Lam Research Corp. | | | 340 | | | $ | 160,610 | |
| Microsoft Corp. | | | 589 | | | | 150,277 | |
| Salesforce, Inc.(a) | | | 915 | | | | 146,629 | |
| ServiceNow, Inc.(a) | | | 377 | | | | 156,945 | |
| Taiwan Semiconductor | | | | | | | | |
| Manufacturing Co., Ltd., ADR | | | 1,732 | | | | 143,721 | |
| Total Information Technology | | | | | | | 1,341,637 | |
| | | | | | | | | |
| Materials (7.41%) | | | | | | | | |
| Air Products and Chemicals, Inc. | | | 637 | | | | 197,572 | |
| Compass Minerals | | | | | | | | |
| International, Inc. | | | 3,571 | | | | 158,374 | |
| DuPont de Nemours, Inc. | | | 2,084 | | | | 146,943 | |
| Total Materials | | | | | | | 502,889 | |
| | | | | | | | | |
| Real Estate (2.28%) | | | | | | | | |
| Simon Property Group, Inc. | | | 1,299 | | | | 155,153 | |
| | | | | | | | | |
| TOTAL COMMON STOCKS | | | | | | | | |
| (Cost $7,446,926) | | | | | | | 6,534,205 | |
| Security Description | | Shares | | | Value | |
| MASTER LIMITED PARTNERSHIPS (2.50%) | | | | | | |
| Energy (2.50%) | | | | | | |
| Enterprise Products Partners LP | | | 6,852 | | | | 169,998 | |
| | | | | | | | | |
| TOTAL MASTER LIMITED PARTNERSHIPS | | | | | | | | |
| (Cost $171,009) | | | | | | | 169,998 | |
| | | 7 Day Yield | | | Shares | | | Value | |
| SHORT TERM INVESTMENTS (5.09%) | | | | | | |
| Money Market Fund (1.11%) | | | | | | | | | |
| State Street Institutional Treasury Plus Money Market Fund (Premier Class) | | | | | | | | | |
| (Cost $75,268) | | | 3.69 | % | | | 75,268 | | | | 75,268 | |
| | | | | | | | | | | | | |
| | | | | | | | | | | | | |
| Investments Purchased with Collateral from Securities Loaned (3.98%) | | | | | | | | | | | | |
| State Street Navigator Securities Lending Government Money Market Portfolio, 3.86% | | | | | | | | | | | | |
| (Cost $270,198) | | | | | | | 270,198 | | | | 270,198 | |
| TOTAL SHORT TERM INVESTMENTS | | | | | | | | | | | | |
| (Cost $345,466) | | | | | | | | | | | 345,466 | |
| | | | | | | | | | | | | |
| TOTAL INVESTMENTS (103.81%) | | | | | | | | | | | | |
| (Cost $7,963,401) | | | | | | | | | | $ | 7,049,669 | |
| LIABILITIES IN EXCESS OF OTHER ASSETS (-3.81%) | | | | | | | | | | | (258,577 | ) |
| NET ASSETS - 100.00% | | | | | | | | | | $ | 6,791,092 | |
6 | November 30, 2022
| ALPS Hillman Active Value ETF | |
| Schedule of Investments | November 30, 2022 |
| (a) | Non-income producing security. |
| (b) | Security, or a portion of the security position is currently on loan. The total market value of securities on loan is $266,932. |
See Notes to Financial Statements.
7 | November 30, 2022
| ALPS Hillman Active Value ETF | |
| Statement of Assets and Liabilities | November 30, 2022 |
| ASSETS: | | | |
| Investments, at value* | | $ | 7,049,669 | |
| Dividends receivable | | | 14,665 | |
| Total Assets | | | 7,064,334 | |
| | | | | |
| LIABILITIES: | | | | |
| Payable to adviser | | | 3,044 | |
| Payable for collateral upon return of securities loaned | | | 270,198 | |
| Total Liabilities | | | 273,242 | |
| NET ASSETS | | $ | 6,791,092 | |
| | | | | |
| NET ASSETS CONSIST OF: | | | | |
| Paid-in capital | | $ | 7,573,022 | |
| Total distributable earnings/(accumulated losses) | | | (781,930 | ) |
| NET ASSETS | | $ | 6,791,092 | |
| | | | | |
| INVESTMENTS, AT COST | | $ | 7,963,401 | |
| | | | | |
| PRICING OF SHARES | | | | |
| Net Assets | | $ | 6,791,092 | |
| Shares of beneficial interest outstanding (Unlimited number of shares authorized, par value $0.01 per share) | | | 300,002 | |
| Net Asset Value, offering and redemption price per share | | $ | 22.64 | |
| * | Includes $266,932 of securities on loan. |
See Notes to Financial Statements.
8 | November 30, 2022
| ALPS Hillman Active Value ETF | |
| Statement of Operations | For the Year Ended November 30, 2022 |
| INVESTMENT INCOME: | | | |
| Dividends* | | $ | 158,169 | |
| Securities Lending Income | | | 169 | |
| Total Investment Income | | | 158,338 | |
| | | | | |
| EXPENSES: | | | | |
| Investment adviser fees | | | 35,841 | |
| Net Expenses | | | 35,841 | |
| NET INVESTMENT INCOME | | | 122,497 | |
| | | | | |
| REALIZED AND UNREALIZED GAIN/(LOSS): | | | | |
| Net realized gain on investments(a) | | | 151,616 | |
| Net change in unrealized appreciation/(depreciation) on investments | | | (602,794 | ) |
| NET REALIZED AND UNREALIZED LOSS ON INVESTMENTS | | | (451,178 | ) |
| NET DECREASE IN NET ASSETS RESULTING FROM OPERATIONS | | $ | (328,681 | ) |
| * | Net of foreign tax withholding of $865. |
| (a) | Includes realized gain or loss as a result of in-kind transactions (See Note 4 in Notes to Financial Statements). |
See Notes to Financial Statements.
9 | November 30, 2022
| ALPS Hillman Active Value ETF |
| Statements of Changes in Net Assets |
| | | For the Year Ended November 30, 2022 | | | For the Period July 15, 2021 (Commencement of Operations) to November 30, 2021 | |
| OPERATIONS: | | | | | | |
| Net investment income | | $ | 122,497 | | | $ | 50,743 | |
| Net realized gain | | | 151,616 | | | | 60,733 | |
| Net change in unrealized depreciation | | | (602,794 | ) | | | (310,938 | ) |
| Net decrease in net assets resulting from operations | | | (328,681 | ) | | | (199,462 | ) |
| | | | | | | | | |
| DISTRIBUTIONS TO SHAREHOLDERS: | | | | | | | | |
| From distributable earnings | | | (144,140 | ) | | | (17,283 | ) |
| Total distributions | | | (144,140 | ) | | | (17,283 | ) |
| | | | | | | | | |
| CAPITAL SHARE TRANSACTIONS: | | | | | | | | |
| Proceeds from sale of shares | | | 3,537,225 | | | | 6,232,629 | |
| Cost of shares redeemed | | | (1,652,974 | ) | | | (636,222 | ) |
| Net increase from capital share transactions | | | 1,884,251 | | | | 5,596,407 | |
| Net increase in net assets | | | 1,411,430 | | | | 5,379,662 | |
| | | | | | | | | |
| NET ASSETS: | | | | | | | | |
| Beginning of period | | | 5,379,662 | | | | – | |
| End of period | | $ | 6,791,092 | | | $ | 5,379,662 | |
| | | | | | | | | |
| OTHER INFORMATION: | | | | | | | | |
| CAPITAL SHARE TRANSACTIONS: | | | | | | | | |
| Beginning shares | | | 225,002 | | | | – | |
| Shares sold | | | 150,000 | | | | 250,002 | |
| Shares redeemed | | | (75,000 | ) | | | (25,000 | ) |
| Shares outstanding, end of period | | | 300,002 | | | | 225,002 | |
See Notes to Financial Statements.
10 | November 30, 2022
| ALPS Hillman Active Value ETF | |
| Financial Highlights | For a Share Outstanding Throughout the Periods Presented |
| | | For the Year Ended November 30, 2022 | | | For the Period July 15, 2021 (Commencement of Operations) to November 30, 2021 | |
| NET ASSET VALUE, BEGINNING OF PERIOD | | $ | 23.91 | | | $ | 24.88 | |
| | | | | | | | | |
| INCOME FROM OPERATIONS: | | | | | | | | |
| Net investment income(a) | | | 0.42 | | | | 0.22 | |
| Net realized and unrealized loss | | | (1.14 | ) | | | (1.12 | ) |
| Total from investment operations | | | (0.72 | ) | | | (0.90 | ) |
| | | | | | | | | |
| DISTRIBUTIONS: | | | | | | | | |
| From net investment income | | | (0.34 | ) | | | (0.07 | ) |
| From net realized gains | | | (0.21 | ) | | | – | |
| Total distributions | | | (0.55 | ) | | | (0.07 | ) |
| | | | | | | | | |
| NET (DECREASE) IN NET ASSET VALUE | | | (1.27 | ) | | | (0.97 | ) |
| NET ASSET VALUE, END OF PERIOD | | $ | 22.64 | | | $ | 23.91 | |
| TOTAL RETURN(b) | | | (3.05 | )% | | | (3.63 | )% |
| | | | | | | | | |
| RATIOS/SUPPLEMENTAL DATA: | | | | | | | | |
| Net assets, end of period (in 000s) | | $ | 6,791 | | | $ | 5,380 | |
| | | | | | | | | |
| RATIOS TO AVERAGE NET ASSETS | | | | | | | | |
| Ratio of expenses to average net assets | | | 0.55 | % | | | 0.55 | %(c) |
| Ratio of net investment income to average net assets | | | 1.88 | % | | | 2.28 | %(c) |
| Portfolio turnover rate(d) | | | 33 | % | | | 10 | % |
| (a) | Based on average shares outstanding during the period. |
| (b) | Total return is calculated assuming an initial investment made at the net asset value at the beginning of the period and redemption at the net asset value on the last day of the period and assuming all distributions are reinvested at the reinvestment prices. Total return calculated for a period of less than one year is not annualized. |
| (d) | Portfolio turnover for periods less than one year are not annualized and does not include securities received or delivered from processing creations or redemptions in-kind. |
See Notes to Financial Statements.
11 | November 30, 2022
| ALPS Hillman Active Value ETF | |
| Notes to Financial Statements | November 30, 2022 |
1. ORGANIZATION
ALPS ETF Trust (the “Trust”), a Delaware statutory trust, is an open-end management investment company registered under the Investment Company Act of 1940, as amended (the “1940 Act”). As of November 30, 2022, the Trust consisted of twenty-three separate portfolios. Each portfolio represents a separate series of the Trust. This report pertains solely to the ALPS Hillman Active Value ETF (the “Fund”). The Fund seeks long-term total return from a combination of income and capital gains. The Fund has elected to qualify as a diversified series of the Trust under the 1940 Act.
The Fund’s Shares (“Shares”) are listed on the NYSE Arca, Inc. (the “NYSE Arca”). The Fund issues and redeems Shares, at net asset value (“NAV”) in blocks of 25,000 Shares, each of which is called a “Creation Unit”. Creation Units are issued and redeemed principally in-kind for securities. Except when aggregated in Creation Units, Shares are not redeemable securities of the Fund.
Pursuant to the Trust’s organizational documents, its Officers and Trustees are indemnified against certain liability arising out of the performance of their duties to the Trust. Additionally, in the normal course of business, the Trust enters into contracts with service providers that contain general indemnification clauses. The Trust’s maximum exposure under these arrangements is unknown, as this would involve future claims that may be made against the Trust that have not yet occurred.
2. SIGNIFICANT ACCOUNTING POLICIES
The following is a summary of significant accounting policies consistently followed by the Fund in the preparation of the financial statements. The accompanying financial statements were prepared in accordance with accounting principles generally accepted in the United States of America (“U.S. GAAP”). The preparation of financial statements in conformity with U.S. GAAP requires management to make certain estimates and assumptions that affect the reported amounts of assets and liabilities and disclosures of contingent assets and liabilities at the date of the financial statements and the reported amounts of revenue and expenses during the period. Actual results could differ from those estimates. The Fund is considered an investment company under U.S. GAAP and follows the accounting and reporting guidance applicable to investment companies in the Financial Accounting Standards Board (“FASB”) Accounting Standards Codification Topic 946.
A. Portfolio Valuation
The Fund’s NAV is determined daily, as of the close of regular trading on the New York Stock Exchange (the “NYSE”), normally 4:00 p.m. Eastern time, on each day the NYSE is open for trading. The NAV is computed by dividing the value of all assets of the Fund (including accrued interest and dividends), less all liabilities (including accrued expenses and dividends declared but unpaid), by the total number of shares outstanding.
Portfolio securities listed on any exchange other than the NASDAQ Stock Market LLC (“NASDAQ”) are valued at the last sale price on the business day as of which such value is being determined. If there has been no sale on such day, the securities are valued at the mean of the most recent bid and ask prices on such day. Securities traded on the NASDAQ are valued at the NASDAQ Official Closing Price as determined by NASDAQ. Portfolio securities traded on more than one securities exchange are valued at the last sale price on the business day as of which such value is being determined at the close of the exchange representing the principal market for such securities. Portfolio securities traded in the over-the-counter market, but excluding securities traded on the NASDAQ, are valued at the last quoted sale price in such market.
The Fund’s investments are valued at market value or, in the absence of market value with respect to any portfolio securities, at fair value according to procedures adopted by the Trust’s Board of Trustees (the “Board”). Pursuant to Rule 2a-5 under the 1940 Act, the Board designated ALPS Advisors, Inc. (the "Adviser") as the valuation designee ("Valuation Designee") for each Fund to perform the fair value determinations relating to Fund investments. The Adviser may carry out its designated responsibilities as Valuation Designee through various teams and committees. When market quotations are not readily available or when events occur that make established valuation methods unreliable, securities of the Fund may be valued in good faith by the Valuation Designee. These securities generally include, but are not limited to, restricted securities (securities which may not be publicly sold without registration under the Securities Act of 1933) for which a pricing service is unable to provide a market price; securities whose trading has been formally suspended; a security whose market price is not available from a pre-established primary pricing source or the pricing source is not willing to provide a price; a security with respect to which an event has occurred that is most likely to materially affect the value of the security after the market has closed but before the calculation of the Fund’s NAV or make it difficult or impossible to obtain a reliable market quotation; or a security whose price, as provided by the pricing service, does not reflect the security’s “fair value” due to the security being de-listed from a national exchange or the security’s primary trading market is temporarily closed at a time when, under normal conditions, it would be open. As a general principle, the current “fair value” of a security would be the amount which the owner might reasonably expect to receive from the sale on the applicable exchange or principal market. A variety of factors may be considered in determining the fair value of such securities.
12 | November 30, 2022
| ALPS Hillman Active Value ETF | |
| Notes to Financial Statements | November 30, 2022 |
B. Fair Value Measurements
The Fund discloses the classification of its fair value measurements following a three-tier hierarchy based on the inputs used to measure fair value. Inputs refer broadly to the assumptions that market participants would use in pricing the asset or liability; including assumptions about risk. Inputs may be observable or unobservable. Observable inputs reflect the assumptions market participants would use in pricing the asset or liability that are developed based on market data obtained from sources independent of the reporting entity. Unobservable inputs reflect the reporting entity’s own assumptions about the assumptions market participants would use in pricing the asset or liability that are developed based on the best information available.
Valuation techniques used to value the Fund's investments by major category are as follows:
Equity securities and Limited Partnerships, including restricted securities, for which market quotations are readily available, are valued at the last reported sale price or official closing price as reported by a third party pricing vendor on the primary market or exchange on which they are traded and are categorized as Level 1 in the hierarchy. In the event there were no sales during the day or closing prices are not available, securities are valued at the mean of the most recent quoted bid and ask prices on such day and are generally categorized as Level 2 in the hierarchy. Investments in open-end mutual funds are valued at their closing NAV each business day and are categorized as Level 1 in the hierarchy.
Changes in valuation techniques may result in transfers in or out of an assigned level within the disclosure hierarchy.
Various inputs are used in determining the value of the Fund’s investments as of the end of the reporting period. When inputs used fall into different levels of the fair value hierarchy, the level in the hierarchy within which the fair value measurement falls is determined based on the lowest level input that is significant to the fair value measurement in its entirety. The designated input levels are not necessarily an indication of the risk or liquidity associated with these investments.
These inputs are categorized in the following hierarchy under applicable financial accounting standards:
| Level 1 – | Unadjusted quoted prices in active markets for identical investments, unrestricted assets or liabilities that a Fund has the ability to access at the measurement date; |
| Level 2 – | Quoted prices which are not active, quoted prices for similar assets or liabilities in active markets or inputs other than quoted prices that are observable (either directly or indirectly) for substantially the full term of the asset or liability; and |
| Level 3 – | Significant unobservable prices or inputs (including the Fund’s own assumptions in determining the fair value of investments) where there is little or no market activity for the asset or liability at the measurement date. |
The following is a summary of the inputs used to value the Fund’s investments as of November 30, 2022:
ALPS Hillman Active Value ETF
| Investments in Securities at Value | | Level 1 - Quoted and Unadjusted Prices | | | Level 2 - Other Significant Observable Inputs | | | Level 3 - Significant Unobservable Inputs | | | Total | |
| Common Stocks* | | $ | 6,534,205 | | | $ | – | | | $ | – | | | $ | 6,534,205 | |
| Master Limited Partnerships* | | | 169,998 | | | | – | | | | – | | | | 169,998 | |
| Short Term Investments | | | 345,466 | | | | – | | | | – | | | | 345,466 | |
| Total | | $ | 7,049,669 | | | $ | – | | | $ | – | | | $ | 7,049,669 | |
| * | For a detailed sector breakdown, see the accompanying Schedule of Investments. |
The Fund did not have any securities that used significant unobservable inputs (Level 3) in determining fair value and there were no transfers into or out of Level 3 during the year ended November 30, 2022.
C. Securities Transactions and Investment Income
Securities transactions are recorded as of the trade date. Realized gains and losses from securities transactions are recorded on the specific identification in accordance with GAAP. Dividend income and capital gains distributions, if any, are recorded on the ex-dividend date. Interest income, if any, is recorded on the accrual basis.
D. Dividends and Distributions to Shareholders
Dividends from net investment income of the Fund, if any, are declared and paid quarterly or as the Board may determine from time to time. Distributions of net realized capital gains earned by the Fund, if any, are declared and distributed at least annually.
13 | November 30, 2022
| ALPS Hillman Active Value ETF | |
| Notes to Financial Statements | November 30, 2022 |
E. Federal Tax and Tax Basis Information
The timing and character of income and capital gain distributions are determined in accordance with income tax regulations, which may differ from U.S. GAAP. Reclassifications are made to the Fund’s capital accounts for permanent tax differences to reflect income and gains available for distribution (or available capital loss carryforwards) under income tax regulations.
For the year ended November 30, 2022, the following reclassifications, which had no impact on results of operations or net assets, were recorded to reflect permanent tax differences resulting primarily from in-kind transactions:
| Fund | | Paid-in Capital | | | Total Distributable Earnings/(Accumulated Losses) | |
| ALPS Hillman Active Value ETF | | $ | 78,568 | | | $ | (78,568 | ) |
The tax character of the distributions paid during the year ended November 30, 2022 and the fiscal period ended November 30, 2021 was as follows:
| Fund | | Ordinary Income | | | Long-Term Capital Gain | | | Return of Capital | |
| November 30, 2022 | | | | | | | | | |
| ALPS Hillman Active Value ETF | | $ | 144,059 | | | $ | 81 | | | $ | – | |
| | | Ordinary Income | | | Long-Term Capital Gain | | | Return of Capital | |
| November 30, 2021 | | | | | | | | | |
| ALPS Hillman Active Value ETF | | $ | 17,283 | | | $ | – | | | $ | – | |
The character of distributions made during the year may differ from its ultimate characterization for federal income tax purposes.
As of November 30, 2022, the components of distributable earnings/(accumulated losses) on a tax basis were as follows:
| Fund | | Accumulated Net Investment Income | | | Accumulated Net Realized Gain/(Loss) on Investments | | | Other Accumulated Gains | | | Net Unrealized Appreciation/(Depreciation) on Investments | | | Total | |
| ALPS Hillman Active Value ETF | | $ | 112,135 | | | $ | 14,414 | | | $ | – | | | $ | (908,479 | ) | | $ | (781,930 | ) |
As of November 30, 2022, the cost of investments for federal income tax purposes and accumulated net unrealized appreciation/(depreciation) on investments were as follows:
| | | ALPS Hillman Active Value ETF | |
| Gross appreciation (excess of value over tax cost) | | $ | 255,484 | |
| Gross depreciation (excess of tax cost over value) | | | (1,163,963 | ) |
| Net unrealized appreciation/(depreciation) | | $ | (908,479 | ) |
| Cost of investments for income tax purposes | | $ | 7,958,148 | |
The differences between book-basis and tax-basis are primarily due to the deferral of losses from investments in partnerships.
F. Income Taxes
No provision for income taxes is included in the accompanying financial statements, as the Fund intends to distribute to shareholders all taxable investment income and realized gains and otherwise comply with Subchapter M of the Internal Revenue Code of 1986, as amended, applicable to regulated investment companies. The Fund evaluates tax positions taken (or expected to be taken) in the course of preparing the Fund’s tax returns to determine whether these positions meet a “more-likely-than-not” standard that, based on the technical merits, have a more than fifty percent likelihood of being sustained by a taxing authority upon examination. A tax position that meets the “more-likely-than-not” recognition threshold is measured to determine the amount of benefit to recognize in the financial statements.
As of and during the year ended November 30, 2022, the Fund did not have a liability for any unrecognized tax benefits. The Fund files U.S. federal, state, and local tax returns as required. The Fund’s tax returns are subject to examination by the relevant tax authorities until expiration of the
14 | November 30, 2022
| ALPS Hillman Active Value ETF | |
| Notes to Financial Statements | November 30, 2022 |
applicable statute of limitations, which is generally three years after the filing of the tax return, but may extend to four years in certain jurisdictions. Tax returns for open years have incorporated no uncertain tax positions that require a provision for income taxes.
G. Lending of Portfolio Securities
The Fund has entered into a securities lending agreement with State Street Bank & Trust Co. (“SSB”), the Fund’s lending agent. The Fund may lend its portfolio securities only to borrowers that are approved by SSB. The Fund will limit such lending to not more than 33 1/3% of the value of its total assets. The Fund’s securities held at SSB as custodian shall be available to be lent except those securities the Fund or ALPS Advisors, Inc. specifically identifies in writing as not being available for lending. The borrower pledges and maintains with the Fund collateral consisting of cash (U.S. Dollars only), securities issued or guaranteed by the U.S. government or its agencies or instrumentalities, and cash equivalents (including irrevocable bank letters of credit) issued by a person other than the borrower or an affiliate of the borrower. The initial collateral received by the Fund is required to have a value of no less than 102% of the market value of the loaned securities for U.S equity securities and a value of no less than 105% of the market value for non-U.S. equity securities. The collateral is maintained thereafter, at a market value equal to not less than 102% of the current value of the U.S. equity securities on loan and not less than 105% of the current value of the non-U.S. equity securities on loan. The market value of the loaned securities is determined at the close of each business day and any additional required collateral is delivered to the Fund on the next business day. During the term of the loan, the Fund is entitled to all distributions made on or in respect of the loaned securities. Loans of securities are terminable at any time and the borrower, after notice, is required to return borrowed securities within the customary time period for settlement of securities transactions.
Any cash collateral received is reinvested in a money market fund managed by SSB as disclosed in the Fund’s Schedule of Investments and is reflected in the Statements of Assets and Liabilities as a payable for collateral upon return of securities loaned. Non-cash collateral, in the form of securities issued or guaranteed by the U.S. government or its agencies or instrumentalities, is not disclosed in the Fund’s Statements of Assets and Liabilities as it is held by the lending agent on behalf of the Fund, and the Fund does not have the ability to re-hypothecate these securities. Income earned by the Fund from securities lending activity is disclosed in the Statement of Operations.
The following is a summary of the fund's securities lending agreement and related cash and non-cash collateral received as of November 30,2022
| | | Market Value of Securities on Loan | | | Cash Collateral Received | | | Non-Cash Collateral Received | | | Total Collateral Received | |
| ALPS Hillman Active Value ETF | | $ | 266,932 | | | $ | 270,198 | | | $ | – | | | $ | 270,198 | |
The following table reflects a breakdown of transactions accounted for as secured borrowings, the gross obligation by the type of collateral pledged or securities loaned, and the remaining contractual maturity of those transactions as of November 30, 2022:
ALPS Hillman Active Value ETF Remaining contractual maturity of the agreements
| Securities Lending Transactions | | Overnight & Continuous | | | Up to 30 Days | | | 30-90 Days | | | Greater than 90 Days | | | Total | |
| Common Stocks | | $ | 270,198 | | | $ | – | | | $ | – | | | $ | – | | | $ | 270,198 | |
| Total Borrowings | | | | | | | | | | | | | | | | | | | 270,198 | |
| Gross amount of recognized liabilities for securities lending (collateral received) | | | | | | | | | | | | | | | | | | $ | 270,198 | |
3. INVESTMENT ADVISORY FEE AND OTHER AFFILIATED TRANSACTIONS
ALPS Advisors, Inc. serves as the Fund’s investment adviser pursuant to an Investment Advisory Agreement with the Trust on behalf of the Fund (the “Advisory Agreement”). Pursuant to the Advisory Agreement, the Fund pays the Adviser an annual management fee for the services and facilities it provides, payable on a monthly basis at the annual rate of 0.55% of the Fund’s average daily net assets.
Out of the unitary management fees, the Adviser pays substantially all expenses of the Fund, including the cost of sub-advisory, transfer agency, custody, fund administration, legal, audit, trustees and other services, except for interest expenses, distribution fees or expenses, brokerage expenses, taxes and extraordinary expenses not incurred in the ordinary course of the Fund's business. The Adviser’s unitary management fee is designed to pay substantially all of the Fund’s expenses and to compensate the Adviser for providing services to the Fund.
15 | November 30, 2022
| ALPS Hillman Active Value ETF | |
| Notes to Financial Statements | November 30, 2022 |
Hillman Capital Management, Inc. (the “Sub-Adviser”) serves as the Fund’s sub-adviser pursuant to a sub-advisory agreement with the Trust (the ‘‘Sub-Advisory Agreement’’). Pursuant to the Sub-Advisory Agreement, the Adviser pays the Sub-Adviser a sub-advisory fee out of the Adviser’s advisory fee for the services it provides. The fee is payable on a monthly basis at the annual rate of 0.25% of the Fund's average daily net assets.
ALPS Fund Services, Inc., an affiliate of the Adviser, is the administrator of the Fund.
Effective February 16, 2022, each Trustee receives (1) a quarterly retainer of $20,000, (2) a per meeting fee of $10,000, (3) $2,500 for any special meeting held outside of a regularly scheduled board meeting, and (4) reimbursement for all reasonable out-of-pocket expenses relating to attendance at meetings. In addition, the Chairman of the Board receives a quarterly retainer of $5,000, the Chairman of the Audit Committee receives a quarterly retainer of $3,000, and the Chairman of the Nominating & Governance Committee receives a quarterly retainer of $2,000, each in connection with their respective roles. Prior to February 16, 2022, each Trustee received (1) a quarterly retainer of $10,000, (2) a per meeting fee of $5,000, (3) $1,500 for any special meeting held outside of a regularly scheduled board meeting, and (4) reimbursement for all reasonable out-of-pocket expenses relating to attendance at meetings. In addition, the Chairman of the Board and Chairman of the Audit Committee each received a quarterly retainer of $2,000, in connection with their respective roles.
4. PURCHASES AND SALES OF SECURITIES
For the year ended November 30, 2022, the cost of purchases and proceeds from sales of investment securities, excluding in-kind transactions and short-term investments, were as follows:
| Fund | | Purchases | | | Sales | |
| ALPS Hillman Active Value ETF | | $ | 2,192,924 | | | $ | 2,144,801 | |
For the year ended November 30, 2022, the cost of in-kind purchases and proceeds from in-kind sales were as follows:
| Fund | | Purchases | | | Sales | |
| ALPS Hillman Active Value ETF | | $ | 3,485,680 | | | $ | 1,640,955 | |
For the year ended November 30, 2022, Fund had in-kind net realized gains of $71,453.
Gains on in-kind transactions are not considered taxable for federal income tax purposes and losses on in-kind transactions are also not deductible for tax purposes.
5. CAPITAL SHARE TRANSACTIONS
Shares are created and redeemed by the Fund only in Creation Unit size aggregations of 25,000 Shares (prior to October 1, 2021, the Creation Unit size was 50,000 Shares). Only broker-dealers or large institutional investors with creation and redemption agreements called Authorized Participants (“AP”) are permitted to purchase or redeem Creation Units from the Fund. Such transactions are generally permitted on an in-kind basis, with a balancing cash component to equate the transaction to the NAV per unit of the Fund on the transaction date. Cash may be substituted equivalent to the value of certain securities generally when they are not available in sufficient quantity for delivery, not eligible for trading by the AP or as a result of other market circumstances.
6. MARKET RISK
The Fund is subject to investment and operational risks associated with financial, economic and other global market developments and disruptions, including the recent spread of an infectious respiratory illness caused by a novel strain of coronavirus (known as COVID-19), which can negatively impact the securities markets and cause the Fund to lose value. Securities in the Fund's portfolio may underperform in comparison to securities in general financial markets, a particular financial market or other asset classes due to a number of factors, including inflation (or expectations for inflation), deflation (or expectations for deflation), interest rates, global demand for particular products or resources, market instability, debt crises and downgrades, embargoes, tariffs, sanctions and other trade barriers, regulatory events, other governmental trade or market control programs and related geopolitical events. In addition, the value of the Fund's investments may be negatively affected by the occurrence of global events such as war, terrorism, environmental disasters, natural disasters or events, country instability, and infectious disease epidemics or pandemics.
The spread of COVID-19 has caused volatility, severe market dislocations and liquidity constraints in many markets, including markets for the securities the Fund holds, and may adversely affect the Fund’s investments and operations. The transmission of COVID-19 and efforts to contain its spread have resulted in travel restrictions and disruptions, closed international borders, enhanced health screenings at ports of entry and elsewhere, disruption of and delays in healthcare service preparation and delivery, quarantines, event and service cancellations or interruptions, disruptions to
16 | November 30, 2022
| ALPS Hillman Active Value ETF | |
| Notes to Financial Statements | November 30, 2022 |
business operations and supply chains, and a reduction in consumer and business spending, as well as general concern and uncertainty that has negatively affected the economy. These disruptions have led to instability in the market place and the jobs market. The impact of COVID-19 could adversely affect the economies of many nations or the entire global economy, the financial well-being and performance of individual issuers, borrowers and sectors and the health of the markets generally in potentially significant and unforeseen ways.
The foregoing could lead to a significant economic downturn or recession, increased market volatility, a greater number of market closures, higher default rates and adverse effects on the values and liquidity of the Fund’s securities or other assets. Such impacts may adversely affect the performance of the Fund.
7. SUBSEQUENT EVENTS
Subsequent events, if any, after the date of the Statement of Assets and Liabilities have been evaluated through the date the financial statements ere issued. Management has determined that there were no subsequent events to report through the issuance of these financial statements.
17 | November 30, 2022
| ALPS Hillman Active Value ETF | |
| Additional Information | November 30, 2022 (Unaudited) |
PROXY VOTING RECORDS, POLICIES AND PROCEDURES
Information regarding how the Fund voted proxies relating to portfolio securities during the most recent 12-month period ended June 30 and a description of the Fund’s proxy voting policies and procedures used in determining how to vote for proxies are available without charge on the SEC’s website at www.sec.gov and upon request, by calling (toll-free) 1-866-759-5679.
PORTFOLIO HOLDINGS
The Fund files a complete schedule of portfolio holdings with the U.S. Securities and Exchange Commission (“SEC”) for the first and third quarters of each fiscal year on Form N-PORT within 60 days after the end of the period. Copies of the Fund’s Form N-PORT are available without a charge, upon request, by contacting the Fund at 1-866-759-5679 and on the SEC’s website at https://www.sec.gov.
TAX INFORMATION
The Fund designates the following as a percentage of taxable ordinary income distributions, or up to the maximum amount allowable, for the calendar year ended December 31, 2021:
| | Qualified Dividend Income | Dividend Received Deduction |
| ALPS Hillman Active Value ETF | 57.96% | 52.67% |
In early 2022, if applicable, shareholders of record received this information for the distributions paid to them by the Fund during the calendar year 2021 via Form 1099. The Fund will notify shareholders in early 2023 of amounts paid to them by the Fund, if any, during the calendar year 2022.
18 | November 30, 2022
| ALPS Hillman Active Value ETF | |
| Board Considerations Regarding Approval of | November 30, 2022 (Unaudited) |
| Investment Advisory Agreement and Investment Sub-Advisory Agreement |
At a meeting held on June 21, 2022, via electronic means (video-conference), the Board of Trustees of the Trust (the “Board” or the “Trustees”), including the Trustees who are not “interested persons” of the Trust within the meaning of the Investment Company Act of 1940, as amended (the “Independent Trustees”), evaluated a proposal to approve the continuance of (i) the Investment Advisory Agreement (the “HVAL Advisory Agreement”) between the Trust and ALPS Advisors, Inc. (the “Adviser” or “AAI”) with respect to the ALPS Hillman Active Value ETF (“HVAL” or the “Fund”) and (ii) the Investment Sub-Advisory Agreement (the “HCM Sub-Advisory Agreement”) between AAI and Hillman Capital Management, Inc. (the “Sub-Adviser” or “HCM”) with respect to the Fund. The Independent Trustees also met separately to consider each Agreement.
In evaluating the HVAL Advisory Agreement, the Board, including the Independent Trustees, considered various factors, including (i) the nature, extent and quality of the services provided by the Adviser to HVAL under the HVAL Advisory Agreement; (ii) the advisory fees and other expenses paid by the Fund compared to those of similar funds managed by other investment advisers; (iii) the costs of the services provided to the Fund and the profits realized by the Adviser and its affiliates from the Adviser’s relationship with the Fund; (iv) the extent to which economies of scale have been or would be realized if and as the Fund’s assets grow and whether fees reflect these economies of scale for the benefit of shareholders; and (v) any additional benefits and other considerations.
With respect to the nature, extent and quality of the services provided by the Adviser under the HVAL Advisory Agreement, the Board considered and reviewed information concerning the services provided under the HVAL Advisory Agreement, financial information regarding the Adviser and its parent company, information describing the Adviser’s current organization and the background and experience of the persons responsible for the day-to-day management of the Fund.
The Board reviewed information on the performance of the Fund and its benchmark and the FUSE performance group. Based on this review, the Board, including the Independent Trustees, found that the nature and extent of services provided to the Fund under the HVAL Advisory Agreement was appropriate and that the quality was satisfactory.
The Board noted that the advisory fee for the Fund was a unitary fee pursuant to which the Adviser assumes all expenses of the Fund (including the cost of transfer agency, custody, fund administration, legal, audit and other services) other than the payments under the HVAL Advisory Agreement, brokerage expenses, taxes, interest, litigation expenses and other extraordinary expenses.
With respect to advisory fee rates, the Board, including the Independent Trustees, noted the following: The gross management fee rate for the Fund is approximately equal to the median of its FUSE expense group.
Based on the foregoing, and the other information available to them, the Board, including the Independent Trustees concluded that the advisory fee rate for the Fund was reasonable under the circumstances and in light of the quality of the services provided.
The Board, including the Independent Trustees considered other benefits available to the Adviser because of its relationship with the Fund and concluded that the advisory fees were reasonable taking into account any such benefits.
The Board, including the Independent Trustees also considered with respect to the Fund the information provided by the Adviser about the costs and profitability of the Adviser with respect to the Fund, including the asset levels and other factors that influence the profitability and financial viability of the Fund. The Board, including the Independent Trustees reviewed and noted the relatively small size of the Fund and concluded that the Adviser was not realizing any economies of scale. The Independent Trustees determined that the Adviser should continue to keep the Board informed on an ongoing basis of any significant developments (e.g., material increases in asset levels) so as to facilitate the Independent Trustees’ evaluation of whether further economies of scale have been achieved.
In voting to renew the HVAL Advisory Agreement, the Board, including the Independent Trustees concluded that the terms of the HVAL Advisory Agreement are reasonable and fair in light of the services to be performed, the fees paid by certain other funds, expenses to be incurred and such other matters as the members of the Board, including the Independent Trustees, considered relevant in the exercise of their reasonable business judgment. The Independent Trustees did not identify any single factor or group of factors as all important or controlling and considered all factors together.
19 | November 30, 2022
| ALPS Hillman Active Value ETF | |
| Board Considerations Regarding Approval of | November 30, 2022 (Unaudited) |
| Investment Advisory Agreement and Investment Sub-Advisory Agreement |
HCM Sub-Advisory Agreement
In evaluating the HCM Sub-Advisory Agreement, the Board, including the Independent Trustees considered various factors, including (i) the nature, extent and quality of the services provided by HCM with respect to HVAL under the HCM Sub-Advisory Agreement; (ii) the advisory fees and other expenses paid by HVAL compared to those of similar funds managed by other investment advisers; (iii) the profitability to HCM of its sub-advisory relationship with HVAL and the reasonableness of compensation to HCM (iv) the extent to which economies of scale would be realized if, and as, HVAL’s assets increase, and whether the fee level in the HCM Sub-Advisory Agreement reflects these economies of scale; and (v) any additional benefits and other considerations.
With respect to the nature, extent and quality of the services provided by HCM under the HCM Sub-Advisory Agreement, the Board, including the Independent Trustees considered and reviewed information concerning the services provided under the HCM Sub-Advisory Agreement, HVAL's performance, financial information regarding HCM, information describing HCM’s current organization and the background and experience of the persons responsible for the day-to-day management of HVAL. Based upon their review, the Board, including the Independent Trustees concluded that HCM was qualified to oversee the portfolio management of HVAL and that the services provided by HCM to HVAL are satisfactory. The Board, including the Independent Trustees considered that the contractual sub-advisory fee to be paid to HCM with respect to HVAL was 0.25% of HVAL’s average daily net assets out of a total management fee of 0.55% of HVAL's average daily net assets. Based on the consideration of all factors deemed relevant by them, the Board, including the Independent Trustees concluded that the sub-advisory fees received by HCM under the HCM Sub-Advisory Agreement were reasonable under the circumstances and in light of the quality of services provided.
With respect to the costs of services provided and profits realized by HCM, the Board, including the Independent Trustees considered the resources involved in managing HVAL. Based on their review of the profitability of HVAL to HCM, the Board including the Independent Trustees, concluded that the profitability of HVAL to HCM was not unreasonable.
The Board, including the Independent Trustees also considered other benefits that have been and may be realized by HCM from its relationships with HVAL and concluded that the sub-advisory fees with respect to HVAL were reasonable taking into account such benefits.
The Board, including the Independent Trustees considered the extent to which economies of scale may be realized if HVAL’s assets continue to grow in size and whether fee levels reflect a reasonable sharing of such economies of scale for the benefit of the Fund’s investors. The Board, including the Independent Trustees noted that HVAL was launched in July 2021 and has not yet achieved scale in terms of assets. The Independent Trustees determined that the Adviser should continue to keep the Board informed on an ongoing basis of any significant developments (e.g., material increases in asset levels) so as to facilitate the Independent Trustees’ evaluation of whether further economies of scale have been achieved with respect to HVAL.
In voting to approve the HCM Sub-Advisory Agreement, the Board, including the Independent Trustees concluded that the terms of the HCM Sub-Advisory Agreement are reasonable and fair in light of the services performed, expenses incurred and such other matters as the Board, including the Independent Trustees considered relevant in the exercise of their reasonable business judgment. The Independent Trustees did not identify any single factor or group of factors as all important or controlling and considered all factors together.
20 | November 30, 2022
| ALPS Hillman Active Value ETF | |
| Trustees & Officers | November 30, 2022 (Unaudited) |
The general supervision of the duties performed by the Adviser for the Fund under the Investment Advisory Agreement is the responsibility of the Board of Trustees. The Trust currently has four Trustees, each of whom have no affiliation or business connection with the Adviser or any of its affiliated persons and do not own any stock or other securities issued by the Adviser. These are the “non-interested” or “independent” Trustees (“Independent Trustees”).
The Independent Trustees of the Trust, their term of office and length of time served, their principal business occupations during the past five years, the number of portfolios in the Fund Complex overseen by each Independent Trustee, and other directorships, if any, held by the Trustee are shown below.
INDEPENDENT TRUSTEES
| Name, Address & Year of Birth* | Position(s) Held with Trust | Term of Office and Length of Time Served** | Principal Occupation(s) During Past 5 Years | Number of Portfolios in Fund Complex Overseen by Trustees*** | Other Directorships Held by Trustees |
| Mary K. Anstine, 1940 | Trustee | Since March 2008 | Ms. Anstine is Trustee/Director of AV Hunter Trust and Colorado Uplift Board. | 38 | Ms. Anstine is a Trustee of ALPS Variable Investment Trust (7 funds); Financial Investors Trust (29 funds); and Reaves Utility Income Fund. |
| Jeremy W. Deems, 1976 | Trustee | Since March 2008 | Mr. Deems is the Co-Founder and Chief Financial Officer of Green Alpha Advisors, LLC, a registered investment advisor, and Co-Portfolio Manager of the Shelton Green Alpha Fund. | 38 | Mr. Deems is a Trustee of ALPS Variable Investment Trust (7 funds); Financial Investors Trust (29 funds); and Reaves Utility Income Fund; and Clough Funds Trust (1 fund). |
| Rick A. Pederson, 1952 | Trustee | Since March 2008 | Mr. Pederson is Partner, Bow River Capital Partners (private equity management), 2003 - present; Board Member, Prosci Inc. (private business services) 2013-2016; Advisory Board Member, Citywide Banks (Colorado community bank) 2014- 2017; Board Member, Strong-Bridge Consulting, 2015- 2019; Board Member, IRI/ODMS Holdings LLC, 2017 – 2019; Director, National Western Stock Show (not for profit) 2010 - present; Director, History Colorado (not for profit) 2015- present; Director, Citywide Bank Advisory Board 2017-present; Trustee, Boettcher Foundation, 2018 -present. | 24 | Mr. Pederson is Trustee of Segall Bryant & Hamill Trust (14 funds), Principal Real Estate Income Fund (1 fund). |
| * | The business address of the Trustee is c/o ALPS Advisors, Inc., 1290 Broadway, Suite 1000, Denver, Colorado 80203. |
| ** | This is the period for which the Trustee began serving the Trust. Each Trustee serves an indefinite term, until his or her successor is elected. |
| *** | The Fund Complex includes all series of the Trust and any other investment companies for which ALPS Advisors, Inc. provides investment advisory services. |
21 | November 30, 2022
| ALPS Hillman Active Value ETF | |
| Trustees & Officers | November 30, 2022 (Unaudited) |
| Name, Address & Year of Birth* | Position(s) Held with Trust | Term of Office and Length of Time Served** | Principal Occupation(s) During Past 5 Years | Number of Portfolios in Fund Complex Overseen by Trustees*** | Other Directorships Held by Trustees |
| Edmund J. Burke, 1961 | Trustee | Since December 2017 | Mr. Burke joined ALPS in 1991 and served as the President and Director of ALPS Holdings, Inc., and ALPS Advisors, Inc., and Director of ALPS Distributors, Inc., ALPS Fund Services, Inc. (“ALPS”), and ALPS Portfolio Solutions Distributor, Inc. (collectively, the “ALPS Companies”). Mr. Burke retired from the ALPS Companies in June 2019. Mr. Burke is currently a partner at ETF Action, a web- based system that provides data and analytics to registered investment advisers, (since 2020) and a Director of Alliance Bioenergy Plus, Inc., a technology company focused on emerging technologies in the renewable energy, biofuels, and bioplastics technology sectors (since 2020). | 33 | Mr. Burke is a Trustee of Clough Global Dividend and Income Fund (1 fund); Clough Global Equity Fund (1 fund); Clough Global Opportunities Fund (1 fund); Clough Funds Trust (1 fund); Liberty All-Star Equity Fund (1 fund); Director of the Liberty All- Star Growth Fund, Inc. (1 fund) and Financial Investors Trust (29 funds). |
| * | The business address of the Trustee is c/o ALPS Advisors, Inc., 1290 Broadway, Suite 1000, Denver, Colorado 80203. |
| ** | This is the period for which the Trustee began serving the Trust. Each Trustee serves an indefinite term, until his or her successor is elected. |
| *** | The Fund Complex includes all series of the Trust and any other investment companies for which ALPS Advisors, Inc. provides investment advisory services. |
22 | November 30, 2022
| ALPS Hillman Active Value ETF | |
| Trustees & Officers | November 30, 2022 (Unaudited) |
| OFFICERS: | | | |
| Name, Address and Year of Birth of Officer* | Position(s) Held with Trust | Length of Time Served** | Principal Occupation(s) During Past 5 Years |
| Laton Spahr, 1975 | President | Since June 2021 | Mr. Spahr joined ALPS in 2019 and currently serves as President and Portfolio Manager of AAI. Prior to his current role, Mr. Spahr was a Senior Vice President and Strategy Leader of the Value & Income Team for Oppenheimer Funds from 2013 to 2019. |
| Matthew Sutula, 1985 | Chief Compliance Officer (“CCO”) | Since December 2019 | Mr. Sutula joined ALPS in 2012 and currently serves as Chief Compliance Officer of AAI. Prior to his current role, Mr. Sutula served as interim Compliance Officer of the Trust (September 2019 to December 2019). Compliance Manager and Senior Compliance Analyst for AAI, as well as Compliance Analyst for AFS. Prior to joining ALPS, he spent seven years at Morningstar, Inc. in various analyst roles supporting the registered investment company databases. Mr. Sutula is also Chief Compliance Officer of Principal Real Estate Income Fund, ALPS Variable Investment Trust, Liberty All-Star Equity Fund and Liberty All-Star Growth Fund, Inc. From September 2019 to September 2022 he served as Chief Compliance Officer of RiverNorth Opportunities Fund, Inc. |
| Kathryn Burns, 1976 | Treasurer | Since September 2018 | Ms. Burns serves as Vice President, Director of Fund Operations of AAI since 2018. From 2013 to 2018, she served as Vice President and Fund Controller at AFS. Prior to joining ALPS, she worked at Old Mutual Capital where she served as Vice President and Chief Compliance Officer (2010 – 2012) and Regulatory Reporting Manager and Assistant Treasurer to the Old Mutual Funds Trusts (2006 – 2012). She also served as a CPA for PricewaterhouseCoopers LLP. Ms. Burns also serves as President of ALPS Variable Investment Trust and Principal Real Estate Income Fund. From June 2019 to September 2022 she served as President of RiverNorth Opportunities Fund, Inc. and from June 2018 to November 2021 she served as Treasurer of Boulder Growth & Income Fund, Inc. |
| Michael P. Lawlor, 1969 | Secretary | Since December 2022 | Mr. Lawlor joined ALPS in January 2022, and is currently Vice President and Principal Legal Counsel. Prior to joining ALPS, Mr. Lawlor was Lead Fund Counsel at Brighthouse Financial (insurance company) (January 2007-April 2021). Mr. Lawlor also serves as Secretary of Financial Investors Trust and ALPS Variable Investment Trust. |
| * | The business address of each Officer is c/o ALPS Advisors, Inc., 1290 Broadway, Suite 1000, Denver, Colorado 80203. Each Officer is deemed an affiliate of the Trust as defined under the 1940 Act. |
| ** | This is the period for which the Officer began serving the Trust. Each Officer serves an indefinite term, until his or her successor is elected. |
The Statement of Additional Information includes additional information about the Fund’s Trustees and is available, without charge, upon request by calling (toll-free) 1-866-759-5679.
23 | November 30, 2022


Table of Contents
| Performance Overview | 1 |
| Disclosure of Fund Expenses | 4 |
| Report of Independent Registered Public Accounting Firm | 5 |
| Financial Statements | |
| Schedule of Investments | 6 |
| Statement of Assets and Liabilities | 10 |
| Statement of Operations | 11 |
| Statement of Changes in Net Assets | 12 |
| Financial Highlights | 13 |
| Notes to Financial Statements | 14 |
| Additional Information | 19 |
| Trustees & Officers | 20 |
alpsfunds.com
| ALPS Intermediate Municipal Bond ETF | |
| Performance Overview | November 30, 2022 (Unaudited) |
Investment Objective
ALPS Intermediate Municipal Bond ETF (the “Fund") seeks to protect investor's capital and generate attractive risk-adjusted returns. The Fund seeks to actively achieve its investment objective by applying bottom-up fundamental analysis and investing in a long-term, tax-aware manner. Under normal circumstances, the Fund will invest at least 80% of its net assets in municipal bonds that pay interest that is generally excludable from gross income for federal income tax purposes (except that the interest paid by certain municipal securities may be includable in taxable income for purposes of the federal alternative minimum tax).
Performance Overview
The ALPS Intermediate Municipal Bond ETF produced a total return of 3.19%, based on its market price and 2.38%, based on its NAV from its inception date of May 19, 2022 through November 30, 2022. By comparison, the Fund’s benchmark, the Bloomberg Municipal Bond 1-15 Year Blend Index had a return of 2.03%. Throughout the measurement period, the bond market experienced elevated volatility amid the Federal Reserve’s (Fed’s) most aggressive inflation-fighting campaign in decades.
The objective of the Fund is to protect investors’ capital and generate attractive risk-adjusted returns. The Fund seeks to achieve this objective by investing in a limited number of durable credits that provide attractive yields or return potential. From its launch, the Fund’s net assets increased from both net inflows and positive investment returns, ending November 2022 at $31 million.
In the Municipal market, valuations are often disconnected from their underlying fundamentals, particularly during periods of heightened market volatility. 2022 began with elevated valuations that the Fund’s sub-adviser viewed as heavily dependent on fiscal and monetary stimulus measures as well as record inflows into industry funds. These market supports crumbled as the Fed pivoted to contain the 40-year high in domestic inflation. By the fall, yields increased to their highest levels since the Global Financial Crisis, credit valuations normalized, and fund redemptions hit record levels. The Fund’s sub-adviser views volatility constructively and actively engaged throughout the year as our opportunity set expanded.
In addition to higher yields, the Fund’s sub-adviser was pleased that credit valuations normalized, reversing much of last year’s outperformance of lower-rated credits. The Fund’s exposure to BBB-rated bonds has been modest, at around 4%, and it has zero high-yield exposure. The Fund owns a portfolio of resilient, higher-quality credits which provided the Fund’s sub-adviser the flexibility to take advantage of many opportunities that emerged during the year.
The Fund's sub-adviser invests the Fund's portfolio from the bottom-up and have continued to identify more opportunities in Revenue Bonds than in General Obligation issues (GO). As of November 30, 2022, the Fund held approximately 84% of its net assets in Revenue Bonds and the balance in GOs. Within the Revenue sector, the Fund’s largest exposure was to the State Housing Finance Authority (HFA) sector, which comprised 24% of net assets at the end of November. The Fund also held significant exposures of Prepaid Natural Gas bonds and Airport bonds, which represented 14% and 12% of the Fund’s net assets, respectively. The combination of higher base yields, wider credit spreads and rampant forced selling helped generate a wide range of opportunities. Consequently, the Fund had elevated levels of portfolio activity.
The Fund also held large exposures to bonds with non-standard coupons such as zero-coupon bonds and floating-rate notes. As of November 30th, 2022, these two types of bonds comprised 18% and 7% of the Fund’s net assets, respectively. The magnitude of rate increases also materially extended the duration of the Fund’s benchmark. Consistent with the Fund’s sub-adviser’s strategy, they executed many purchases in ten- to fifteen-year maturities to keep the Fund’s duration relatively in-line.
Heightened volatility and forced selling throughout the Fund’s fiscal period provided a wide range of credit opportunities as well as attractive entry points for bonds with non-standard coupon structures. Together, these opportunities helped drive the outperformance of the Fund. Although the Fund’s State Housing Finance Authority bonds detracted from performance, they offer generous risk-adjusted yields.
Despite the performance headwinds from rising interest rates, municipal market valuations have improved significantly. The Fund’s sub-adviser believes the Fund is well-positioned going forward with its holdings of high-quality credits that are providing attractive yields.
1 | November 30, 2022
| ALPS Intermediate Municipal Bond ETF | |
| Performance Overview | November 30, 2022 (Unaudited) |
Fund Performance (as of November 30, 2022)
| | 6 Months | Since Inception^ |
| ALPS Intermediate Municipal Bond ETF - NAV | -0.53% | 2.38% |
| ALPS Intermediate Municipal Bond ETF - Market* | -0.01% | 3.19% |
| Bloomberg Municipal Bond 1-15 Year Blend Index | -0.40% | 2.03% |
Total Expense Ratio (per the current prospectus) is 0.50%.
Performance data quoted represents past performance. Past performance does not guarantee future results. Total return figures assume reinvestment of dividends and capital gains distributions, if any. The table does not reflect the deduction of taxes that a shareholder would pay on Fund distributions or the redemption of Fund shares. Investment return and principal value of an investment will fluctuate so that an investor’s shares, when sold or redeemed, may be worth more or less than the original cost. Current performance data may be higher or lower than actual data quoted. For the most current month-end performance data please visit www.alpsfunds.com or call 1.866.759.5679.
Net Asset Value (NAV) is an exchange-traded fund’s per-share value. The per-share dollar amount of the Fund is derived by dividing the total value of all the securities in its portfolio, less any liabilities, by the number of Fund shares outstanding. Market Price is the price at which a share can currently be traded in the market. Information detailing the number of days the Market Price of the Fund was greater than the Fund’s NAV and the number of days it was less than the Fund’s NAV can be obtained at www.alpsfunds.com.
| ^ | The Fund commenced operations on May 19, 2022, with the first day of trading on the exchange of May 20, 2022. |
| | | |
| * | Market Price means the official closing price of a share or, if it more accurately reflects the market value of a share at the time as of which the Fund calculates current net asset value per share, the price that is the midpoint of the bid-ask spread as of that time. It does not represent the returns an investor would receive if shares were traded at other times. |
Bloomberg Municipal Bond 1-15 Year Blend Index is an unmanaged index comprised of fixed-rate, investment-grade tax-exempt bonds with remaining maturities between 1 and 17 years. One cannot invest directly in an index. Index performance does not reflect fund performance.
The Fund is new with limited operating history.
ALPS Intermediate Municipal Bond ETF's shares are not individually redeemable. Investors buy and sell shares of the Fund on a secondary market. Only market makers or “authorized participants” may trade directly with the Fund, typically in blocks of 25,000 shares.
ALPS Intermediate Municipal Bond ETF is not suitable for all investors. Investments in the Fund are subject to investment risks, including possible loss of the principal amount invested.
ALPS Portfolio Solutions Distributor, Inc., a FINRA member, is the distributor for the Fund.
2 | November 30, 2022
| ALPS Intermediate Municipal Bond ETF | |
| Performance Overview | November 30, 2022 (Unaudited) |
Top Ten Holdings* (as of November 30, 2022)
| Port Authority of New York & New Jersey | 3.81% |
| City of San Antonio TX Electric & Gas Systems Revenue | 3.67% |
| City of Houston TX Airport System Revenue | 3.43% |
| Deschutes & Jefferson Counties School District No 2J Redmond | 3.36% |
| South Dakota Housing Development Authority | 3.33% |
| Tennessee Housing Development Agency | 3.33% |
| Ohio Housing Finance Agency | 3.33% |
| Connecticut State Health & Educational Facilities Authority | 3.08% |
| E-470 Public Highway Authority | 3.03% |
| North Dakota Housing Finance Agency | 3.02% |
| Total % of Top 10 Holdings | 33.39% |
Future holdings are subject to change.
Growth of $10,000 (as of November 30, 2022)
Comparison of Change in Value of $10,000 Investment in the Fund and the Indexes

Sector Allocation* (as of November 30, 2022)
| Revenue Bonds | 82.40% |
| General Obligation Bonds | 14.88% |
| Money Market Fund | 2.72% |
| Total | 100.00% |
The chart above compares historical performance of a hypothetical investment of $10,000 in the Fund since inception with the performance of the Fund’s benchmark index. Results include the reinvestment of all dividends and capital gains distributions. Past performance does not guarantee future results. The graph does not reflect the deduction of taxes that a shareholder would pay on Fund distributions or the redemption of Fund shares.
3 | November 30, 2022
| ALPS Intermediate Municipal Bond ETF | |
| Disclosure of Fund Expenses | November 30, 2022 (Unaudited) |
Shareholder Expense Example: As a shareholder of the Fund, you incur certain ongoing costs, including management fees and other Fund expenses. These examples are intended to help you understand your ongoing costs (in dollars) of investing in the Fund and to compare these costs with the ongoing costs of investing in other funds. The example is based on an investment of $1,000 invested at the beginning of the six month period and held through November 30, 2022.
Actual Return: The first line of the table provides information about actual account values and actual expenses. You may use the information in this line, together with the amount you invested, to estimate the expenses that you incurred over the period. Simply divide your account value by $1,000 (for example, an $8,600 account value divided by $1,000 = 8.6), then multiply the result by the number in the first line under the heading entitled “Expenses Paid During Period” to estimate the expenses attributable to your investment during this period.
Hypothetical 5% Return: The second line of the table provides information about hypothetical account values and hypothetical expenses based on the Fund’s actual expense ratio and an assumed rate of return of 5% per year before expenses, which is not the Fund’s actual return. The hypothetical account values and expenses may not be used to estimate the actual ending account balance or expenses you paid for the period. You may use this information to compare ongoing costs of investing in the Fund and other funds. To do so, compare this 5% hypothetical example with the 5% hypothetical examples that appear in the shareholder reports of other funds.
The expenses shown in the table are meant to highlight ongoing Fund costs only and do not reflect any transaction costs, such as brokerage commissions and other fees to financial intermediaries. Therefore, the second line of the table is useful in comparing ongoing costs only, and will not help you determine the relative total costs of owning different funds. In addition, if these costs were included, your costs would have been higher.
| | Beginning Account Value 6/1/22 | Ending Account Value 11/30/22 | Expense Ratio(a) | Expenses Paid During Period 6/1/22 - 11/30/22(b) |
| ALPS Intermediate Municipal Bond ETF | | | | |
| Actual | $1,000.00 | $994.70 | 0.50% | $2.50 |
| Hypothetical (5% return before expenses) | $1,000.00 | $1,022.56 | 0.50% | $2.54 |
| (a) | Annualized, based on the Fund's most recent fiscal half year expenses. |
| (b) | Expenses are equal to the Fund's annualized expense ratio multiplied by the average account value over the period, multiplied by the number of days in the most recent fiscal half year (183), divided by 365. |
4 | November 30, 2022
ALPS Intermediate Municipal Bond ETF
Report of Independent Registered Public Accounting Firm
To the Board of Trustees of ALPS ETF Trust and the Shareholders of ALPS Intermediate Municipal Bond ETF
Opinion on the Financial Statements
We have audited the accompanying statement of assets and liabilities of ALPS Intermediate Municipal Bond ETF, a series of shares of beneficial interest in ALPS ETF Trust (the “Fund”), including the schedule of investments, as of November 30, 2022, and the related statements of operations and changes in net assets and the financial highlights for the period from May 19, 2022 (commencement of operations) through November 30, 2022, and the related notes (collectively referred to as the “financial statements”). In our opinion, the financial statements present fairly, in all material respects, the financial position of the Fund as of November 30, 2022, and the results of its operations, the changes in its net assets, and its financial highlights for the period May 19, 2022 through November 30, 2022, in conformity with accounting principles generally accepted in the United States of America.
Basis for Opinion
These financial statements are the responsibility of the Fund’s management. Our responsibility is to express an opinion on the Fund's financial statements based on our audit. We are a public accounting firm registered with the Public Company Accounting Oversight Board (United States) (“PCAOB”) and are required to be independent with respect to the Fund in accordance with the U.S. federal securities law and the applicable rules and regulations of the Securities and Exchange Commission and the PCAOB.
We conducted our audit in accordance with the standards of the PCAOB. Those standards require that we plan and perform the audit to obtain reasonable assurance about whether the financial statements are free of material misstatement, whether due to error or fraud. The Fund is not required to have, nor were we engaged to perform, an audit of its internal control over financial reporting. As part of our audit we are required to obtain an understanding of internal control over financial reporting but not for the purpose of expressing an opinion on the effectiveness of the Fund’s internal control over financial reporting. Accordingly, we express no such opinion.
Our audit included performing procedures to assess the risk of material misstatement of the financial statements, whether due to error or fraud, and performing procedures that respond to those risks. Such procedures included examining, on a test basis, evidence regarding the amounts and disclosures in the financial statements. Our procedures included confirmation of securities owned as of November 30, 2022 by correspondence with the custodian, brokers, or by other appropriate auditing procedures where replies from brokers were not received. Our audit also included evaluating the accounting principles used and significant estimates made by management, as well as evaluating the overall presentation of the financial statements. We believe that our audit provides a reasonable basis for our opinion.

BBD, LLP
We have served as the auditor of one or more of the Funds in the ALPS ETF Trust since 2022.
Philadelphia, Pennsylvania
January 27, 2023
5 | November 30, 2022
| ALPS Intermediate Municipal Bond ETF | |
| Schedule of Investments | November 30, 2022 |
| Security Description | | Principal Amount | | | Value | |
| MUNICIPAL BONDS (98.08%) | | | | | | |
| General Obligation Limited (2.33%) | | | | | | |
| Pennsylvania (2.33%) | | | | | | |
| School District of Philadelphia | | | | | | |
| 5.00%, 09/01/2034 | | $ | 500,000 | | | $ | 521,518 | |
| 4.00%, 09/01/2036 | | | 200,000 | | | | 199,481 | |
| Total Pennsylvania | | | | | | | 720,999 | |
| | | | | | | | | |
| Total General Obligation Limited | | | | | | | 720,999 | |
| | | | | | | | | |
| General Obligation Unlimited (12.67%) | | | | | | | | |
| California (6.82%) | | | | | | | | |
| Chino Valley Unified School | | | | | | | | |
| District | | | | | | | | |
| 0.00%, 08/01/2035(a) | | | 95,000 | | | | 57,800 | |
| Long Beach Community College | | | | | | | | |
| District | | | | | | | | |
| 0.00%, 06/01/2030(a) | | | 1,000,000 | | | | 774,569 | |
| Oak Grove School District | | | | | | | | |
| 0.00%, 08/01/2031(a) | | | 200,000 | | | | 144,897 | |
| Rio Hondo Community College | | | | | | | | |
| District | | | | | | | | |
| 0.00%, 08/01/2036(a) | | | 300,000 | | | | 173,634 | |
| Rowland Unified School District | | | | | | | | |
| 0.00%, 08/01/2033(a) | | | 1,000,000 | | | | 612,140 | |
| San Diego Unified School District | | | | | | | | |
| 0.00%, 07/01/2034(a) | | | 100,000 | | | | 63,974 | |
| San Mateo County Community | | | | | | | | |
| College District | | | | | | | | |
| 0.00%, 09/01/2035(a) | | | 110,000 | | | | 68,515 | |
| San Mateo Union High School | | | | | | | | |
| District | | | | | | | | |
| 0.00%, 09/01/2041(a) | | | 220,000 | | | | 209,767 | |
| Total California | | | | | | | 2,105,296 | |
| | | | | | | | | |
| New York (0.81%) | | | | | | | | |
| City of New York NY | | | | | | | | |
| 4.00%, 08/01/2037 | | | 250,000 | | | | 251,413 | |
| Total New York | | | | | | | 251,413 | |
| | | | | | | | | |
| Oregon (3.38%) | | | | | | | | |
| Deschutes & Jefferson Counties | | | | | | | | |
| School District No 2J Redmond | | | | | | | | |
| 0.00%, 06/15/2028(a) | | | 1,250,000 | | | | 1,047,344 | |
| Total Oregon | | | | | | | 1,047,344 | |
| | | | | | | | | |
| Texas (1.66%) | | | | | | | | |
| Northside Independent School | | | | | | | | |
| District | | | | | | | | |
| 0.70%, 06/01/2050(b) | | | 200,000 | | | | 188,592 | |
| 2.00%, 06/01/2052(b) | | | 345,000 | | | | 323,529 | |
| Total Texas | | | | | | | 512,121 | |
| | | | | | | | | |
| Total General Obligation Unlimited | | | | | | | 3,916,174 | |
| Security Description | | Principal Amount | | | Value | |
| Revenue Bonds (83.08%) | | | | | | |
| Arizona (3.80%) | | | | | | |
| Salt Verde Financial Corp. | | | | | | |
| 5.00%, 12/01/2032 | | $ | 675,000 | | | $ | 708,875 | |
| 5.00%, 12/01/2037 | | | 450,000 | | | | 465,755 | |
| Total Arizona | | | | | | | 1,174,630 | |
| | | | | | | | | |
| California (3.97%) | | | | | | | | |
| Anaheim Public Financing | | | | | | | | |
| Authority | | | | | | | | |
| 0.00%, 09/01/2030(a) | | | 275,000 | | | | 208,128 | |
| Long Beach Bond Finance | | | | | | | | |
| Authority | | | | | | | | |
| 3M US L + 1.45%, | | | | | | | | |
| 11/15/2027(b) | | | 430,000 | | | | 407,657 | |
| Northern California Gas Authority | | | | | | | | |
| No 1 | | | | | | | | |
| 3M US L + 0.72%, | | | | | | | | |
| 07/01/2027(b) | | | 275,000 | | | | 266,384 | |
| University of California | | | | | | | | |
| 5.00%, 05/15/2031(c) | | | 300,000 | | | | 347,685 | |
| Total California | | | | | | | 1,229,854 | |
| | | | | | | | | |
| Colorado (4.65%) | | | | | | | | |
| City & County of Denver Co. | | | | | | | | |
| Airport System Revenue | | | | | | | | |
| 5.75%, 11/15/2036 | | | 250,000 | | | | 293,849 | |
| Colorado Health Facilities | | | | | | | | |
| Authority | | | | | | | | |
| 4.00%, 01/01/2038 | | | 200,000 | | | | 201,958 | |
| E-470 Public Highway Authority | | | | | | | | |
| 0.00%, 09/01/2024(a) | | | 1,000,000 | | | | 944,445 | |
| Total Colorado | | | | | | | 1,440,252 | |
| | | | �� | | | | | |
| Connecticut (4.63%) | | | | | | | | |
| Connecticut Housing Finance | | | | | | | | |
| Authority | | | | | | | | |
| 4.00%, 11/15/2047 | | | 465,000 | | | | 465,453 | |
| Connecticut State Health & | | | | | | | | |
| Educational Facilities Authority | | | | | | | | |
| 0.25%, 07/01/2037(b) | | | 1,000,000 | | | | 960,710 | |
| Total Connecticut | | | | | | | 1,426,163 | |
| | | | | | | | | |
| Florida (2.26%) | | | | | | | | |
| County of Broward FL Airport | | | | | | | | |
| System Revenue | | | | | | | | |
| 5.00%, 10/01/2031 | | | 200,000 | | | | 215,701 | |
| Florida Housing Finance Corp. | | | | | | | | |
| 5.50%, 01/01/2054 | | | 150,000 | | | | 159,467 | |
| Greater Orlando Aviation | | | | | | | | |
| Authority | | | | | | | | |
| 5.00%, 10/01/2033 | | | 300,000 | | | | 321,591 | |
| Total Florida | | | | | | | 696,759 | |
6 | November 30, 2022
| ALPS Intermediate Municipal Bond ETF | |
| Schedule of Investments | November 30, 2022 |
| Security Description | | Principal Amount | | | Value | |
| Revenue Bonds (continued) | | | | | | |
| Georgia (4.42%) | | | | | | |
| Development Authority of Burke | | | | | | |
| County | | | | | | |
| 1.50%, 01/01/2040(b) | | $ | 255,000 | | | $ | 239,537 | |
| 1.70%, 12/01/2049(b) | | | 650,000 | | | | 625,164 | |
| Main Street Natural Gas, Inc. | | | | | | | | |
| 4.00%, 08/01/2049(b) | | | 500,000 | | | | 503,338 | |
| Total Georgia | | | | | | | 1,368,039 | |
| | | | | | | | | |
| Illinois (3.17%) | | | | | | | | |
| Illinois Finance Authority | | | | | | | | |
| 5.00%, 08/15/2035 | | | 225,000 | | | | 245,609 | |
| 5.00%, 02/15/2036 | | | 200,000 | | | | 210,597 | |
| Railsplitter Tobacco Settlement | | | | | | | | |
| Authority | | | | | | | | |
| 5.00%, 06/01/2025 | | | 500,000 | | | | 524,245 | |
| Total Illinois | | | | | | | 980,451 | |
| | | | | | | | | |
| Indiana (0.32%) | | | | | | | | |
| Indiana Finance Authority | | | | | | | | |
| 1.00%, 11/01/2037(b) | | | 100,000 | | | | 100,000 | |
| Total Indiana | | | | | | | 100,000 | |
| | | | | | | | | |
| Kentucky (1.65%) | | | | | | | | |
| Kentucky Public Energy Authority | | | | | | | | |
| 4.00%, 12/01/2049(b) | | | 210,000 | | | | 208,766 | |
| 1D US SOFR + 1.20%, | | | | | | | | |
| 08/01/2052(b) | | | 325,000 | | | | 298,464 | |
| Total Kentucky | | | | | | | 507,230 | |
| | | | | | | | | |
| Massachusetts (2.32%) | | | | | | | | |
| Massachusetts Development | | | | | | | | |
| Finance Agency | | | | | | | | |
| 4.00%, 07/01/2035 | | | 200,000 | | | | 201,398 | |
| 1.05%, 09/01/2037(b) | | | 100,000 | | | | 100,000 | |
| Massachusetts Housing Finance | | | | | | | | |
| Agency | | | | | | | | |
| 4.15%, 12/01/2037 | | | 250,000 | | | | 245,814 | |
| 3.00%, 12/01/2050 | | | 175,000 | | | | 170,146 | |
| Total Massachusetts | | | | | | | 717,358 | |
| | | | | | | | | |
| Minnesota (0.44%) | | | | | | | | |
| Minnesota Housing Finance | | | | | | | | |
| Agency | | | | | | | | |
| 2.47%, 01/01/2050 | | | 149,237 | | | | 136,458 | |
| Total Minnesota | | | | | | | 136,458 | |
| | | | | | | | | |
| Missouri (0.61%) | | | | | | | | |
| Missouri Housing Development | | | | | | | | |
| Commission | | | | | | | | |
| 4.00%, 05/01/2050 | | | 190,000 | | | | 190,142 | |
| Total Missouri | | | | | | | 190,142 | |
| Security Description | | Principal Amount | | | Value | |
| Revenue Bonds (continued) | | | | | | |
| Nebraska (3.27%) | | | | | | |
| Central Plains Energy Project | | | | | | |
| 5.00%, 05/01/2053(b) | | $ | 725,000 | | | $ | 743,691 | |
| Nebraska Investment Finance | | | | | | | | |
| Authority | | | | | | | | |
| 3.50%, 09/01/2046 | | | 270,000 | | | | 267,663 | |
| Total Nebraska | | | | | | | 1,011,354 | |
| | | | | | | | | |
| New Jersey (3.77%) | | | | | | | | |
| New Jersey Health Care Facilities | | | | | | | | |
| Financing Authority | | | | | | | | |
| 5.00%, 07/01/2045(b) | | | 220,000 | | | | 234,509 | |
| New Jersey Transportation Trust | | | | | | | | |
| Fund Authority | | | | | | | | |
| 0.00%, 12/15/2031(a) | | | 1,375,000 | | | | 932,222 | |
| Total New Jersey | | | | | | | 1,166,731 | |
| | | | | | | | | |
| New Mexico (0.97%) | | | | | | | | |
| New Mexico Mortgage Finance | | | | | | | | |
| Authority | | | | | | | | |
| 5.25%, 03/01/2053 | | | 285,000 | | | | 300,755 | |
| Total New Mexico | | | | | | | 300,755 | |
| | | | | | | | | |
| New York (8.59%) | | | | | | | | |
| Metropolitan Transportation | | | | | | | | |
| Authority | | | | | | | | |
| 1D US SOFR + 0.33%, | | | | | | | | |
| 11/01/2035(b) | | | 470,000 | | | | 458,624 | |
| New York City Transitional | | | | | | | | |
| Finance Authority Future Tax | | | | | | | | |
| Secured Revenue | | | | | | | | |
| 1.00%, 11/01/2036(b) | | | 100,000 | | | | 100,000 | |
| 4.00%, 02/01/2038 | | | 250,000 | | | | 250,155 | |
| New York State Dormitory | | | | | | | | |
| Authority | | | | | | | | |
| 4.00%, 03/15/2036 | | | 200,000 | | | | 202,905 | |
| Port Authority of New York & | | | | | | | | |
| New Jersey | | | | | | | | |
| 5.00%, 11/01/2030 | | | 1,100,000 | | | | 1,186,465 | |
| Triborough Bridge & Tunnel | | | | | | | | |
| Authority | | | | | | | | |
| 0.00%, 11/15/2039(a) | | | 1,000,000 | | | | 453,260 | |
| Total New York | | | | | | | 2,651,409 | |
| | | | | | | | | |
| North Carolina (1.63%) | | | | | | | | |
| Charlotte-Mecklenburg Hospital | | | | | | | | |
| Authority | | | | | | | | |
| 4.00%, 01/15/2037 | | | 500,000 | | | | 500,145 | |
| Total North Carolina | | | | | | | 500,145 | |
7 | November 30, 2022
| ALPS Intermediate Municipal Bond ETF | |
| Schedule of Investments | November 30, 2022 |
| Security Description | | Principal Amount | | | Value | |
| Revenue Bonds (continued) | | | | | | |
| North Dakota (4.50%) | | | | | | |
| North Dakota Housing Finance | | | | | | |
| Agency | | | | | | |
| 4.25%, 01/01/2049 | | $ | 445,000 | | | $ | 447,694 | |
| 3.00%, 01/01/2052 | | | 975,000 | | | | 942,767 | |
| Total North Dakota | | | | | | | 1,390,461 | |
| | | | | | | | | |
| Ohio (4.96%) | | | | | | | | |
| Ohio Air Quality Development | | | | | | | | |
| Authority | | | | | | | | |
| 4.25%, 11/01/2039(b) | | | 500,000 | | | | 498,020 | |
| Ohio Housing Finance Agency | | | | | | | | |
| 5.00%, 03/01/2052 | | | 1,000,000 | | | | 1,036,660 | |
| Total Ohio | | | | | | | 1,534,680 | |
| | | | | | | | | |
| Oklahoma (1.68%) | | | | | | | | |
| Oklahoma Housing Finance | | | | | | | | |
| Agency | | | | | | | | |
| 5.00%, 03/01/2052 | | | 500,000 | | | | 518,403 | |
| Total Oklahoma | | | | | | | 518,403 | |
| | | | | | | | | |
| Pennsylvania (0.27%) | | | | | | | | |
| State Public School Building | | | | | | | | |
| Authority | | | | | | | | |
| 5.00%, 06/01/2033 | | | 80,000 | | | | 83,698 | |
| Total Pennsylvania | | | | | | | 83,698 | |
| | | | | | | | | |
| South Dakota (3.34%) | | | | | | | | |
| South Dakota Housing | | | | | | | | |
| Development Authority | | | | | | | | |
| 5.00%, 05/01/2053 | | | 1,000,000 | | | | 1,036,694 | |
| Total South Dakota | | | | | | | 1,036,694 | |
| | | | | | | | | |
| Tennessee (3.34%) | | | | | | | | |
| Tennessee Housing Development | | | | | | | | |
| Agency | | | | | | | | |
| 5.00%, 01/01/2053 | | | 1,000,000 | | | | 1,036,680 | |
| Total Tennessee | | | | | | | 1,036,680 | |
| | | | | | | | | |
| Texas (11.32%) | | | | | | | | |
| City of Houston TX Airport System | | | | | | | | |
| Revenue | | | | | | | | |
| 5.00%, 07/01/2028 | | | 1,000,000 | | | | 1,069,579 | |
| City of San Antonio TX Electric & | | | | | | | | |
| Gas Systems Revenue | | | | | | | | |
| 5.00%, 02/01/2031 | | | 1,000,000 | | | | 1,143,145 | |
| Texas Department of Housing & | | | | | | | | |
| Community Affairs | | | | | | | | |
| 4.40%, 07/01/2037 | | | 200,000 | | | | 206,302 | |
| 3.50%, 07/01/2052 | | | 300,000 | | | | 292,200 | |
| Security Description | | Principal Amount | | | Value | |
| Revenue Bonds (continued) | | | | | | |
| Texas Municipal Gas Acquisition | | | | | | |
| and Supply Corp. I | | | | | | |
| 3M US L + 0.70%, | | | | | | |
| 12/15/2026(b) | | $ | 750,000 | | | $ | 735,701 | |
| 6.25%, 12/15/2026 | | | 50,000 | | | | 52,253 | |
| Total Texas | | | | | | | 3,499,180 | |
| | | | | | | | | |
| Washington D.C. (1.74%) | | | | | | | | |
| Metropolitan Washington | | | | | | | | |
| Airports Authority Aviation | | | | | | | | |
| Revenue | | | | | | | | |
| 5.00%, 10/01/2028 | | | 500,000 | | | | 538,523 | |
| Total Washington D.C. | | | | | | | 538,523 | |
| | | | | | | | | |
| Wisconsin (1.46%) | | | | | | | | |
| Public Finance Authority | | | | | | | | |
| 3.70%, 10/01/2046(b) | | | 150,000 | | | | 150,200 | |
| University of Wisconsin Hospitals | | | | | | | | |
| & Clinics | | | | | | | | |
| 1.00%, 04/01/2048(b) | | | 100,000 | | | | 100,000 | |
| Wisconsin Health & Educational | | | | | | | | |
| Facilities Authority | | | | | | | | |
| 4.00%, 08/15/2036 | | | 200,000 | | | | 200,549 | |
| Total Wisconsin | | | | | | | 450,749 | |
| | | | | | | | | |
| Total Revenue Bonds | | | | | | | 25,686,798 | |
| | | | | | | | | |
| TOTAL MUNICIPAL BONDS | | | | | | | | |
| (Cost $30,511,864) | | | | | | | 30,323,971 | |
| | | 7 Day Yield | | | Shares | | | Value | |
| SHORT TERM INVESTMENTS (2.74%) | | | | | | | | | |
| Money Market Fund | | | | | | | | | |
| State Street Institutional US | | | | | | | | | |
| Government Money Market | | | | | | | | | | | | |
| Fund | | | 3.66 | % | | | 848,284 | | | | 848,284 | |
| | | | | | | | | | | | | |
| TOTAL SHORT TERM INVESTMENTS | | | | | | | | | | | | |
| (Cost $848,284) | | | | | | | | | | | 848,284 | |
| | | | | | | | | | | | | |
| TOTAL INVESTMENTS (100.82%) | | | | | | | | | | | | |
| (Cost $31,360,148) | | | | | | | | | | $ | 31,172,255 | |
| LIABILITIES IN EXCESS OF OTHER ASSETS (-0.82%) | | | | (252,902 | ) |
| NET ASSETS - 100.00% | | | | | | | | | | $ | 30,919,353 | |
8 | November 30, 2022
| ALPS Intermediate Municipal Bond ETF | |
| Schedule of Investments | November 30, 2022 |
| (b) | Floating or variable rate security. Interest rate resets periodically on specific dates. The rate shown represents the coupon or interest rate in effect as of November 30, 2022. Security description includes the reference rate and spread if published and available. |
| (c) | Represents a security purchased on a when-issued basis. |
See Notes to Financial Statements.
9 | November 30, 2022
| ALPS Intermediate Municipal Bond ETF | |
| Statement of Assets and Liabilities | November 30, 2022 |
| ASSETS: | | | |
| Investments, at value | | $ | 31,172,255 | |
| Interest receivable | | | 279,336 | |
| Total Assets | | | 31,451,591 | |
| | | | | |
| LIABILITIES: | | | | |
| Payable for investments purchased | | | 519,750 | |
| Payable to adviser | | | 12,488 | |
| Total Liabilities | | | 532,238 | |
| NET ASSETS | | $ | 30,919,353 | |
| | | | | |
| NET ASSETS CONSIST OF: | | | | |
| Paid-in capital | | $ | 30,876,770 | |
| Total distributable earnings | | | 42,583 | |
| NET ASSETS | | $ | 30,919,353 | |
| | | | | |
| INVESTMENTS, AT COST | | $ | 31,360,148 | |
| | | | | |
| PRICING OF SHARES | | | | |
| Net Assets | | $ | 30,919,353 | |
| Shares of beneficial interest outstanding (Unlimited number of shares authorized, par value $0.01 per share) | | | 1,225,002 | |
| Net Asset Value, offering and redemption price per share | | $ | 25.24 | |
See Notes to Financial Statements.
10 | November 30, 2022
| ALPS Intermediate Municipal Bond ETF | |
| Statement of Operations | For the Period Ended November 30, 2022(a) |
| INVESTMENT INCOME: | | | |
| Interest | | $ | 510,587 | |
| Dividends | | | 3,880 | |
| Total Investment Income | | | 514,467 | |
| | | | | |
| EXPENSES: | | | | |
| Investment adviser fees | | | 81,021 | |
| Net Expenses | | | 81,021 | |
| NET INVESTMENT INCOME | | | 433,446 | |
| | | | | |
| REALIZED AND UNREALIZED GAIN/(LOSS): | | | | |
| Net realized gain on investments | | | 225,977 | |
| Net change in unrealized depreciation on investments | | | (187,893 | ) |
| NET REALIZED AND UNREALIZED GAIN ON INVESTMENTS | | | 38,084 | |
| NET INCREASE IN NET ASSETS RESULTING FROM OPERATIONS | | $ | 471,530 | |
| (a) | The ALPS Intermediate Municipal Bond ETF commenced operations on May 19, 2022. |
See Notes to Financial Statements.
11 | November 30, 2022
| ALPS Intermediate Municipal Bond ETF |
| Statement of Changes in Net Assets |
| | | For the Period May 19, 2022 (Commencement of Operations) to November 30, 2022 | |
| OPERATIONS: | | | | |
| Net investment income | | $ | 433,446 | |
| Net realized gain | | | 225,977 | |
| Net change in unrealized depreciation | | | (187,893 | ) |
| Net increase in net assets resulting from operations | | | 471,530 | |
| | | | | |
| DISTRIBUTIONS TO SHAREHOLDERS: | | | | |
| From distributable earnings | | | (428,947 | ) |
| Total distributions | | | (428,947 | ) |
| | | | | |
| CAPITAL SHARE TRANSACTIONS: | | | | |
| Proceeds from sale of shares | | | 30,876,770 | |
| Net increase from capital share transactions | | | 30,876,770 | |
| Net increase in net assets | | | 30,919,353 | |
| | | | | |
| NET ASSETS: | | | | |
| Beginning of period | | | – | |
| End of period | | $ | 30,919,353 | |
| | | | | |
| OTHER INFORMATION: | | | | |
| CAPITAL SHARE TRANSACTIONS: | | | | |
| Beginning shares | | | – | |
| Shares sold | | | 1,225,002 | |
| Shares outstanding, end of period | | | 1,225,002 | |
See Notes to Financial Statements.
12 | November 30, 2022
| ALPS Intermediate Municipal Bond ETF |
| Financial Highlights | For a Share Outstanding Throughout the Period Presented |
| | | For the Period May 19, 2022 (Commencement of Operations) to November 30, 2022 | |
| NET ASSET VALUE, BEGINNING OF PERIOD | | $ | 25.00 | |
| | | | | |
| INCOME FROM OPERATIONS: | | | | |
| Net investment income(a) | | | 0.36 | |
| Net realized and unrealized gain | | | 0.23 | |
| Total from investment operations | | | 0.59 | |
| | | | | |
| DISTRIBUTIONS: | | | | |
| From net investment income | | | (0.35 | ) |
| Total distributions | | | (0.35 | ) |
| | | | | |
| NET INCREASE IN NET ASSET VALUE | | | 0.24 | |
| NET ASSET VALUE, END OF PERIOD | | $ | 25.24 | |
| TOTAL RETURN(b) | | | 2.38 | % |
| | | | | |
| RATIOS/SUPPLEMENTAL DATA: | | | | |
| Net assets, end of period (in 000s) | | $ | 30,919 | |
| | | | | |
| RATIOS TO AVERAGE NET ASSETS | | | | |
| Ratio of expenses to average net assets | | | 0.50 | %(c) |
| Ratio of net investment income to average net assets | | | 2.67 | %(c) |
| Portfolio turnover rate(d) | | | 75 | % |
| (a) | Based on average shares outstanding during the period. |
| (b) | Total return is calculated assuming an initial investment made at the net asset value at the beginning of the period and redemption at the net asset value on the last day of the period and assuming all distributions are reinvested at the reinvestment prices. Total return calculated for a period of less than one year is not annualized. |
| (d) | Portfolio turnover for periods less than one year are not annualized and does not include securities received or delivered from processing creations or redemptions in-kind. |
See Notes to Financial Statements.
13 | November 30, 2022
| ALPS Intermediate Municipal Bond ETF | |
| Notes to Financial Statements | November 30, 2022 |
1. ORGANIZATION
ALPS ETF Trust (the “Trust”), a Delaware statutory trust, is an open-end management investment company registered under the Investment Company Act of 1940, as amended (the “1940 Act”). As of November 30, 2022, the Trust consisted of twenty-three separate portfolios. Each portfolio represents a separate series of the Trust. This report pertains solely to the ALPS Intermediate Municipal Bond ETF (the “Fund”). The investment objective of the Fund is to protect investor’s capital and generate attractive risk-adjusted returns. The Fund has elected to qualify as a diversified series of the Trust under the 1940 Act.
The Fund’s Shares (“Shares”) are listed on the NYSE Arca, Inc. (the “NYSE Arca”). The Fund issues and redeems Shares, at net asset value (“NAV”) in blocks of 25,000 Shares, each of which is called a “Creation Unit”. Creation Units are issued and redeemed principally in-kind for securities. Except when aggregated in Creation Units, Shares are not redeemable securities of the Fund.
Pursuant to the Trust’s organizational documents, its Officers and Trustees are indemnified against certain liability arising out of the performance of their duties to the Trust. Additionally, in the normal course of business, the Trust enters into contracts with service providers that contain general indemnification clauses. The Trust’s maximum exposure under these arrangements is unknown, as this would involve future claims that may be made against the Trust that have not yet occurred.
2. SIGNIFICANT ACCOUNTING POLICIES
The following is a summary of significant accounting policies consistently followed by the Fund in the preparation of the financial statements. The accompanying financial statements were prepared in accordance with accounting principles generally accepted in the United States of America (“U.S. GAAP”). The preparation of financial statements in conformity with U.S. GAAP requires management to make certain estimates and assumptions that affect the reported amounts of assets and liabilities and disclosures of contingent assets and liabilities at the date of the financial statements and the reported amounts of revenue and expenses during the period. Actual results could differ from those estimates. The Fund is considered an investment company under U.S. GAAP and follows the accounting and reporting guidance applicable to investment companies in the Financial Accounting Standards Board (“FASB”) Accounting Standards Codification Topic 946.
A. Portfolio Valuation
The Fund’s NAV is determined daily, as of the close of regular trading on the New York Stock Exchange (the "NYSE"), normally 4:00 p.m. Eastern Time, on each day the NYSE is open for trading. The NAV is computed by dividing the value of all assets of the Fund (including accrued interest and dividends), less all liabilities (including accrued expenses and dividends declared but unpaid), by the total number of shares outstanding.
Portfolio securities listed on any exchange other than the NASDAQ Stock Market LLC (“NASDAQ”) are valued at the last sale price on the business day as of which such value is being determined. If there has been no sale on such day, the securities are valued at the mean of the most recent bid and ask prices on such day. Securities traded on the NASDAQ are valued at the NASDAQ Official Closing Price as determined by NASDAQ. Portfolio securities traded on more than one securities exchange are valued at the last sale price on the business day as of which such value is being determined at the close of the exchange representing the principal market for such securities. Portfolio securities traded in the over-the-counter market, but excluding securities traded on the NASDAQ, are valued at the last quoted sale price in such market.
The market price for debt securities is generally the evaluated price supplied by an independent third-party pricing service approved by the Board, which references a combination of transactions and quotations for the same or other securities believed to be comparable in quality, coupon, maturity, type of issue, call provisions, trading characteristics and other features deemed to be relevant. To the extent the Fund’s debt securities are valued based on price quotations or other equivalent indications of value provided by a third-party pricing service, any such third-party pricing service may use a variety of methodologies to value some or all of the Fund’s debt securities to determine the market price.
The Fund’s investments are valued at market value or, in the absence of market value with respect to any portfolio securities, at fair value according to procedures adopted by the Trust’s Board. Pursuant to Rule 2a-5 under the 1940 Act, the Board of Trustees designated ALPS Advisors, Inc. (the “Adviser”) as the valuation designee ("Valuation Designee") for the Fund to perform the fair value determinations relating to all Fund investments. The Adviser may carry out its designated responsibilities as Valuation Designee through various teams and committees. When market quotations are not readily available or when events occur that make established valuation methods unreliable, securities of the Fund may be valued in good faith by the Valuation Designee. These securities generally include, but are not limited to, restricted securities (securities which may not be publicly sold without registration under the Securities Act of 1933) for which a pricing service is unable to provide a market price; securities whose trading has been formally suspended; a security whose market price is not available from a pre-established primary pricing source or the pricing source is not willing to provide a price; a security with respect to which an event has occurred that is most likely to materially affect the value of the security after the market has closed but before the calculation of the Fund’s NAV or make it difficult or impossible to obtain a reliable market quotation; or a security whose price, as provided by the pricing service, does not reflect the security’s “fair value” due to the security being de-listed from a national exchange or the security’s primary trading market is temporarily closed at a time when, under normal conditions, it would be open. As a general principle, the current “fair value” of a security would be the amount which the owner might reasonably expect to receive from the sale on the applicable exchange or principal market. A variety of factors may be considered in determining the fair value of such securities.
14 | November 30, 2022
| ALPS Intermediate Municipal Bond ETF | |
| Notes to Financial Statements | November 30, 2022 |
B. Fair Value Measurements
The Fund discloses the classification of its fair value measurements following a three-tier hierarchy based on the inputs used to measure fair value. Inputs refer broadly to the assumptions that market participants would use in pricing the asset or liability, including assumptions about risk. Inputs may be observable or unobservable. Observable inputs reflect the assumptions market participants would use in pricing the asset or liability that are developed based on market data obtained from sources independent of the reporting entity. Unobservable inputs reflect the reporting entity’s own assumptions about the assumptions market participants would use in pricing the asset or liability that are developed based on the best information available.
Valuation techniques used to value the Fund’s investments by major category are as follows:
Equity securities, including restricted securities, for which market quotations are readily available, are valued at the last reported sale price or official closing price as reported by a third party pricing vendor on the primary market or exchange on which they are traded and are categorized as Level 1 in the hierarchy. In the event there were no sales during the day or closing prices are not available, securities are valued at the mean of the most recent quoted bid and ask prices on such day and are generally categorized as Level 2 in the hierarchy. Investments in open-end mutual funds are valued at their closing NAV each business day and are categorized as Level 1 in the hierarchy.
Debt securities, including restricted securities, are valued based on evaluated prices received from third party pricing vendors or from brokers who make markets in such securities. For municipal bonds, pricing vendors utilize matrix pricing which considers yield or price of bonds of comparable quality, coupon, maturity and type as well as broker-supplied prices. When independent prices are unavailable or unreliable, debt securities may be valued utilizing pricing methodologies which consider similar factors that would be used by third party pricing vendors. Debt securities are generally categorized as Level 2 in the hierarchy but may be Level 3 depending on the circumstances.
Changes in valuation techniques may result in transfers in or out of an assigned level within the disclosure hierarchy.
Various inputs are used in determining the value of the Fund’s investments as of the end of the reporting period. When inputs used fall into different levels of the fair value hierarchy, the level in the hierarchy within which the fair value measurement falls is determined based on the lowest level input that is significant to the fair value measurement in its entirety. The designated input levels are not necessarily an indication of the risk or liquidity associated with these investments.
These inputs are categorized in the following hierarchy under applicable financial accounting standards:
| Level 1 – | Unadjusted quoted prices in active markets for identical investments, unrestricted assets or liabilities that a Fund has the ability to access at the measurement date; |
| Level 2 – | Quoted prices which are not active, quoted prices for similar assets or liabilities in active markets or inputs other than quoted prices that are observable (either directly or indirectly) for substantially the full term of the asset or liability; and |
| Level 3 – | Significant unobservable prices or inputs (including the Fund’s own assumptions in determining the fair value of investments) where there is little or no market activity for the asset or liability at the measurement date. |
The following is a summary of the inputs used to value the Fund’s investments as of November 30, 2022:
ALPS Intermediate Municipal Bond ETF
| Investments in Securities at Value | | Level 1 - Quoted and Unadjusted Prices | | | Level 2 - Other Significant Observable Inputs | | | Level 3 - Significant Unobservable Inputs | | | Total | |
| Municipal Bonds* | | $ | – | | | $ | 30,323,971 | | | $ | – | | | $ | 30,323,971 | |
| Short Term Investments | | | 848,284 | | | | – | | | | – | | | | 848,284 | |
| Total | | $ | 848,284 | | | $ | 30,323,971 | | | $ | – | | | $ | 31,172,255 | |
| * | For a detailed breakdown of sectors, see the accompanying Schedule of Investments. |
The Fund did not have any securities that used significant unobservable inputs (Level 3) in determining fair value and there were no transfers into or out of Level 3 during the period ended November 30, 2022.
15 | November 30, 2022
| ALPS Intermediate Municipal Bond ETF | |
| Notes to Financial Statements | November 30, 2022 |
C. Securities Transactions and Investment Income
Securities transactions are recorded as of the trade date. Realized gains and losses from securities transactions are recorded on the specific identification in accordance with GAAP. Dividend income and capital gains distributions, if any, are recorded on the ex-dividend date. Interest income, if any, is recorded on the accrual basis, including amortization of premiums and accretion of discounts.
D. Dividends and Distributions to Shareholders
Dividends from net investment income of the Fund, if any, are declared and paid monthly or as the Board may determine from time to time. Distributions of net realized capital gains earned by the Fund, if any, are distributed at least annually.
E. Federal Tax and Tax Basis Information
The timing and character of income and capital gain distributions are determined in accordance with income tax regulations, which may differ from U.S. GAAP. Reclassifications are made to the Fund’s capital accounts for permanent tax differences to reflect income and gains available for distribution (or available capital loss carryforwards) under income tax regulations. For the fiscal period ended November 30, 2022, there were no reclassifications between Paid-in-Capital and Total Distributable Earnings.
The tax character of the distributions paid during the fiscal period ended November 30, 2022 was as follows:
| Fund | | Ordinary Income | | | Tax Exempt Income | | | Long-Term Capital Gain | | | Return of Capital | |
| November 30, 2022 | | | | | | | | | | | | |
| ALPS Intermediate Municipal Bond ETF | | $ | 83,654 | | | $ | 345,293 | | | $ | – | | | $ | – | |
The character of distributions made during the period may differ from its ultimate characterization for federal income tax purposes.
Under current law, capital losses maintain their character as short-term or long-term and are carried forward to the next tax year without expiration. As of November 30, 2022, the Fund did not have any amounts available to carry forward to the next tax year.
As of November 30, 2022, the components of distributable earnings on a tax basis were as follows.
| Fund | | Accumulated Net Investment Income | | | Accumulated Net Realized Gain/(Loss) on Investments | | | Other Accumulated Gains | | | Net Unrealized Appreciation/(Depreciation) on Investments | | | Total | |
| ALPS Intermediate Municipal Bond ETF | | | 230,476 | | | $ | – | | | $ | – | | | $ | (187,893 | ) | | $ | 42,583 | |
As of November 30, 2022, the cost of investments for federal income tax purposes and accumulated net unrealized appreciation/(depreciation) on investments were as follows:
| | ALPS Intermediate
Municipal Bond ETF | |
| Gross appreciation (excess of value over tax cost) | | $ | 127,008 | |
| Gross depreciation (excess of tax cost over value) | | | (314,901 | ) |
| Net unrealized appreciation/(depreciation) | | $ | (187,893 | ) |
| Cost of investments for income tax purposes | | $ | 31,360,148 | |
G. Income Taxes
No provision for income taxes is included in the accompanying financial statements, as the Fund intends to distribute to shareholders all taxable investment income and realized gains and otherwise comply with Subchapter M of the Internal Revenue Code of 1986, as amended, applicable to regulated investment companies. The Fund evaluates tax positions taken (or expected to be taken) in the course of preparing the Fund’s tax returns to determine whether these positions meet a “more-likely-than-not” standard that, based on the technical merits, have a more than fifty percent likelihood of being sustained by a taxing authority upon examination. A tax position that meets the “more-likely-than-not” recognition threshold is measured to determine the amount of benefit to recognize in the financial statements.
As of and during the period ended November 30, 2022, the Fund did not have a liability for any unrecognized tax benefits. The Fund files U.S. federal, state, and local tax returns as required. The Fund’s tax returns are subject to examination by the relevant tax authorities until expiration of the applicable statute of limitations, which is generally three years after the filing of the tax return, but may extend to four years in certain jurisdictions. Tax returns for open years have incorporated no uncertain tax positions that require a provision for income taxes.
16 | November 30, 2022
| ALPS Intermediate Municipal Bond ETF | |
| Notes to Financial Statements | November 30, 2022 |
3. INVESTMENT ADVISORY FEE AND OTHER AFFILIATED TRANSACTIONS
ALPS Advisors, Inc. serves as the Fund’s investment adviser pursuant to an Investment Advisory Agreement with the Trust on behalf of the Fund (the “Advisory Agreement”). Pursuant to the Advisory Agreement, the Fund pays the Adviser an annual management fee for the services and facilities it provides, payable on a monthly basis at the annual rate of 0.50% of the Fund’s average daily net assets.
Out of the unitary management fee, the Adviser pays substantially all expenses of the Fund, including the cost of sub-advisory, transfer agency, custody, fund administration, legal, audit, trustees and other services, except for acquired fund fees and expenses, interest expenses, distribution fees or expenses, brokerage expenses, taxes and extraordinary expenses not incurred in the ordinary course of the Fund's business. The Adviser’s unitary management fee is designed to pay substantially all of the Fund’s expenses and to compensate the Adviser for providing services to the Fund.
Brown Brothers Harriman & Co. (the “Sub-Adviser”) serves as the Fund's sub-adviser pursuant to a sub-advisory agreement with the Trust (the ‘‘Sub-Advisory Agreement’’). Pursuant to the Sub-Advisory Agreement, the Adviser pays the Sub-Adviser a sub-advisory fee out of the Adviser's advisory fee for the services it provides. The fee is payable on a monthly basis at the annual rate of 0.25% of the Fund's average daily net assets.
ALPS Fund Services, Inc., an affiliate of the Adviser, is the administrator of the Fund.
Each Trustee receives (1) a quarterly retainer of $20,000, (2) a per meeting fee of $10,000, (3) $2,500 for any special meeting held outside of a regularly scheduled board meeting, and (4) reimbursement for all reasonable out-of-pocket expenses relating to attendance at meetings. In addition, the Chairman of the Board receives a quarterly retainer of $5,000, the Chairman of the Audit Committee receives a quarterly retainer of $3,000, and the Chairman of the Nominating & Givernance Committee receives a quarterly retainer of $2,000, each in connection with their respective roles.
4. PURCHASES AND SALES OF SECURITIES
For the period starting with the commencement of operations and ending November 30, 2022, the cost of purchases and proceeds from sales of investment securities, excluding short-term investments and in-kind transactions, were as follows:
| Fund | | Purchases | | | Sales | |
| ALPS Intermediate Municipal Bond ETF | | $ | 53,194,511 | | | $ | 22,915,562 | |
For the period starting with the commencement of operations and ending November 30, 2022, there were no in-kind transactions or realized gain/(loss) on in-kind transactions.
5. CAPITAL SHARE TRANSACTIONS
Shares are created and redeemed by the Fund only in Creation Unit size aggregations of 25,000 Shares. Only broker-dealers or large institutional investors with creation and redemption agreements called Authorized Participants (“AP”) are permitted to purchase or redeem Creation Units from the Fund. Such transactions are generally permitted on an in-kind basis, with a balancing cash component to equate the transaction to the NAV per unit of the Fund on the transaction date. Cash may be substituted equivalent to the value of certain securities generally when they are not available in sufficient quantity for delivery, not eligible for trading by the AP or as a result of other market circumstances.
6. MARKET RISK
The Fund is subject to investment and operational risks associated with financial, economic and other global market developments and disruptions, including the recent spread of an infectious respiratory illness caused by a novel strain of coronavirus (known as COVID-19), which can negatively impact the securities markets and cause the Fund to lose value. Securities in the Fund's portfolio may underperform in comparison to securities in general financial markets, a particular financial market or other asset classes due to a number of factors, including inflation (or expectations for inflation), deflation (or expectations for deflation), interest rates, global demand for particular products or resources, market instability, debt crises and downgrades, embargoes, tariffs, sanctions and other trade barriers, regulatory events, other governmental trade or market control programs and related geopolitical events. In addition, the value of the Fund's investments may be negatively affected by the occurrence of global events such as war, terrorism, environmental disasters, natural disasters or events, country instability, and infectious disease epidemics or pandemics.
17 | November 30, 2022
| ALPS Intermediate Municipal Bond ETF | |
| Notes to Financial Statements | November 30, 2022 |
The spread of COVID-19 has caused volatility, severe market dislocations and liquidity constraints in many markets, including markets for the securities the Fund holds, and may adversely affect the Fund’s investments and operations. The transmission of COVID-19 and efforts to contain its spread have resulted in travel restrictions and disruptions, closed international borders, enhanced health screenings at ports of entry and elsewhere, disruption of and delays in healthcare service preparation and delivery, quarantines, event and service cancellations or interruptions, disruptions to business operations and supply chains, and a reduction in consumer and business spending, as well as general concern and uncertainty that has negatively affected the economy. These disruptions have led to instability in the market place and the jobs market. The impact of COVID-19 could adversely affect the economies of many nations or the entire global economy, the financial well-being and performance of individual issuers, borrowers and sectors and the health of the markets generally in potentially significant and unforeseen ways.
The foregoing could lead to a significant economic downturn or recession, increased market volatility, a greater number of market closures, higher default rates and adverse effects on the values and liquidity of the Fund’s securities or other assets. Such impacts may adversely affect the performance of the Fund.
7. SUBSEQUENT EVENTS
Subsequent events, if any, after the date of the Statement of Assets and Liabilities have been evaluated through the date the financial statements were issued. Management has determined that there were no subsequent events to report through the issuance of these financial statements.
18 | November 30, 2022
| ALPS Intermediate Municipal Bond ETF | |
| Additional Information | November 30, 2022 (Unaudited) |
PROXY VOTING RECORDS, POLICIES AND PROCEDURES
Information regarding how the Fund voted proxies relating to portfolio securities during the most recent 12-month period ended June 30 and a description of the Fund’s proxy voting policies and procedures used in determining how to vote for proxies are available without charge on the SEC’s website at www.sec.gov and upon request, by calling (toll-free) 1-866-759-5679.
PORTFOLIO HOLDINGS
The Fund files a complete schedule of portfolio holdings with the U.S. Securities and Exchange Commission (“SEC”) for the first and third quarters of each fiscal year on Form N-PORT within 60 days after the end of the period. Copies of the Fund’s Form N-PORT are available without a charge, upon request, by contacting the Fund at 1-866-759-5679 and on the SEC’s website at https://www.sec.gov.
TAX INFORMATION
The Fund will notify shareholders in early 2023 via Form 1099 of amounts paid to them by the Fund, if any, during the calendar year 2022.
19 | November 30, 2022
| ALPS Intermediate Municipal Bond ETF | |
| Trustees & Officers | November 30, 2022 (Unaudited) |
The general supervision of the duties performed by the Adviser for the Fund under the Investment Advisory Agreement is the responsibility of the Board of Trustees. The Trust currently has four Trustees, each of whom have no affiliation or business connection with the Adviser or any of its affiliated persons and do not own any stock or other securities issued by the Adviser. These are the “non-interested” or “independent” Trustees (“Independent Trustees”).
The Independent Trustees of the Trust, their term of office and length of time served, their principal business occupations during the past five years, the number of portfolios in the Fund Complex overseen by each Independent Trustee, and other directorships, if any, held by the Trustee are shown below.
INDEPENDENT TRUSTEES
| Name, Address & Year of Birth* | Position(s) Held with Trust | Term of Office and Length of Time Served** | Principal Occupation(s) During Past 5 Years | Number of Portfolios in Fund Complex Overseen by Trustees*** | Other Directorships Held by Trustees |
Mary K. Anstine, 1940 | Trustee | Since March 2008 | Ms. Anstine is Trustee/Director of AV Hunter Trust and Colorado Uplift Board. | 38 | Ms. Anstine is a Trustee of ALPS Variable Investment Trust (7 funds); Financial Investors Trust (29 funds); and Reaves Utility Income Fund. |
Jeremy W. Deems, 1976 | Trustee | Since March 2008 | Mr. Deems is the Co-Founder and Chief Financial Officer of Green Alpha Advisors, LLC, a registered investment advisor, and Co-Portfolio Manager of the Shelton Green Alpha Fund. | 38 | Mr. Deems is a Trustee of ALPS Variable Investment Trust (7 funds); Financial Investors Trust (29 funds); and Reaves Utility Income Fund; and Clough Funds Trust (1 fund). |
Rick A. Pederson, 1952 | Trustee | Since March 2008 | Mr. Pederson is Partner, Bow River Capital Partners (private equity management), 2003 - present; Board Member, Prosci Inc. (private business services) 2013-2016; Advisory Board Member, Citywide Banks (Colorado community bank) 2014- 2017; Board Member, Strong-Bridge Consulting, 2015- 2019; Board Member, IRI/ODMS Holdings LLC, 2017 – 2019; Director, National Western Stock Show (not for profit) 2010 - present; Director, History Colorado (not for profit) 2015- present; Director, Citywide Bank Advisory Board 2017-present; Trustee, Boettcher Foundation, 2018 -present. | 24 | Mr. Pederson is Trustee of Segall Bryant & Hamill Trust (14 funds), Principal Real Estate Income Fund (1 fund). |
| | | | | | |
20 | November 30, 2022
| ALPS Intermediate Municipal Bond ETF | |
| Trustees & Officers | November 30, 2022 (Unaudited) |
| Name, Address & Year of Birth* | Position(s) Held with Trust | Term of Office and Length of Time Served** | Principal Occupation(s) During Past 5 Years | Number of Portfolios in Fund Complex Overseen by Trustees*** | Other Directorships Held by Trustees |
Edmund J. Burke, 1961 | Trustee | Since December 2017 | Mr. Burke joined ALPS in 1991 and served as the President and Director of ALPS Holdings, Inc., and ALPS Advisors, Inc., and Director of ALPS Distributors, Inc., ALPS Fund Services, Inc. (“ALPS”), and ALPS Portfolio Solutions Distributor, Inc. (collectively, the “ALPS Companies”). Mr. Burke retired from the ALPS Companies in June 2019. Mr. Burke is currently a partner at ETF Action, a web- based system that provides data and analytics to registered investment advisers, (since 2020) and a Director of Alliance Bioenergy Plus, Inc., a technology company focused on emerging technologies in the renewable energy, biofuels, and bioplastics technology sectors (since 2020). | 33 | Mr. Burke is a Trustee of Clough Global Dividend and Income Fund (1 fund); Clough Global Equity Fund (1 fund); Clough Global Opportunities Fund (1 fund); Clough Funds Trust (1 fund); Liberty All-Star Equity Fund (1 fund); Director of the Liberty All-Star Growth Fund, Inc. (1 fund) and Financial Investors Trust (29 funds). |
| | | | | | |
| * | The business address of the Trustee is c/o ALPS Advisors, Inc., 1290 Broadway, Suite 1000, Denver, Colorado 80203. |
| ** | This is the period for which the Trustee began serving the Trust. Each Trustee serves an indefinite term, until his or her successor is elected. |
| *** | The Fund Complex includes all series of the Trust and any other investment companies for which ALPS Advisors, Inc. provides investment advisory services. |
21 | November 30, 2022
| ALPS Intermediate Municipal Bond ETF | |
| Trustees & Officers | November 30, 2022 (Unaudited) |
OFFICERS:
| Name, Address and Year of Birth of Officer* | Position(s) Held with Trust | Length of Time Served** | Principal Occupation(s) During Past 5 Years |
Laton Spahr, 1975 | President | Since June 2021 | Mr. Spahr joined ALPS in 2019 and currently serves as President and Portfolio Manager of AAI. Prior to his current role, Mr. Spahr was a Senior Vice President and Strategy Leader of the Value & Income Team for Oppenheimer Funds from 2013 to 2019. |
Matthew Sutula, 1985 | Chief Compliance Officer (“CCO”) | Since December 2019 | Mr. Sutula joined ALPS in 2012 and currently serves as Chief Compliance Officer of AAI. Prior to his current role, Mr. Sutula served as interim Compliance Officer of the Trust (September 2019 to December 2019). Compliance Manager and Senior Compliance Analyst for AAI, as well as Compliance Analyst for AFS. Prior to joining ALPS, he spent seven years at Morningstar, Inc. in various analyst roles supporting the registered investment company databases. Mr. Sutula is also Chief Compliance Officer of Principal Real Estate Income Fund, ALPS Variable Investment Trust, Liberty All-Star Equity Fund and Liberty All-Star Growth Fund, Inc. From September 2019 to September 2022 he served as Chief Compliance Officer of RiverNorth Opportunities Fund, Inc. |
Kathryn Burns, 1976 | Treasurer | Since September 2018 | Ms. Burns serves as Vice President, Director of Fund Operations of AAI since 2018. From 2013 to 2018, she served as Vice President and Fund Controller at AFS. Prior to joining ALPS, she worked at Old Mutual Capital where she served as Vice President and Chief Compliance Officer (2010 – 2012) and Regulatory Reporting Manager and Assistant Treasurer to the Old Mutual Funds Trusts (2006 – 2012). She also served as a CPA for PricewaterhouseCoopers LLP. Ms. Burns also serves as President of ALPS Variable Investment Trust and Principal Real Estate Income Fund. From June 2019 to September 2022 she served as President of RiverNorth Opportunities Fund, Inc. and from June 2018 to November 2021 she served as Treasurer of Boulder Growth & Income Fund, Inc. |
Michael P. Lawlor, 1969 | Secretary | Since December 2022 | Mr. Lawlor joined ALPS in January 2022, and is currently Vice President and Principal Legal Counsel. Prior to joining ALPS, Mr. Lawlor was Lead Fund Counsel at Brighthouse Financial (insurance company) (January 2007-April 2021). Mr. Lawlor also serves as Secretary of Financial Investors Trust and ALPS Variable Investment Trust. |
| * | The business address of each Officer is c/o ALPS Advisors, Inc., 1290 Broadway, Suite 1000, Denver, Colorado 80203. Each Officer is deemed an affiliate of the Trust as defined under the 1940 Act. |
| ** | This is the period for which the Officer began serving the Trust. Each Officer serves an indefinite term, until his or her successor is elected. |
The Statement of Additional Information includes additional information about the Funds' Trustees and is available, without charge, upon request by calling (toll-free) 1-866-759-5679.
22 | November 30, 2022
Intentionally Left Blank


Table of Contents
| Performance Overview | |
| ALPS Clean Energy ETF | 1 |
| ALPS Disruptive Technologies ETF | 4 |
| ALPS Global Travel Beneficiaries ETF | 7 |
| ALPS Medical Breakthroughs ETF | 10 |
| Disclosure of Fund Expenses | 13 |
| Report of Independent Registered Public Accounting Firm | 14 |
| Financial Statements | |
| Schedules of Investments | |
| ALPS Clean Energy ETF | 15 |
| ALPS Disruptive Technologies ETF | 17 |
| ALPS Global Travel Beneficiaries ETF | 19 |
| ALPS Medical Breakthroughs ETF | 21 |
| Statements of Assets and Liabilities | 23 |
| Statements of Operations | 24 |
| Statements of Changes in Net Assets | |
| ALPS Clean Energy ETF | 25 |
| ALPS Disruptive Technologies ETF | 26 |
| ALPS Global Travel Beneficiaries ETF | 27 |
| ALPS Medical Breakthroughs ETF | 28 |
| Financial Highlights | 29 |
| Notes to Financial Statements | 33 |
| Additional Information | 42 |
| Board Considerations Regarding Approval of Investment Advisory Agreements | 46 |
| Trustees & Officers | 47 |
alpsfunds.com
| ALPS Clean Energy ETF | |
| Performance Overview | November 30, 2022 (Unaudited) |
Investment Objective
The ALPS Clean Energy ETF (the “Fund” or “ACES”) seeks investment results that correspond (before fees and expenses) generally to the performance of its underlying index, the CIBC Atlas Clean Energy Total Return Index (ticker symbol NACEX) (the “Underlying Index”). The Underlying Index utilizes a rules-based methodology developed by CIBC National Trust Company, which is designed to provide exposure to a diverse set of U.S. and Canadian companies involved in the clean energy sector including renewables and clean technology.
The Fund employs a “passive management” – or indexing – investment approach designed to track the performance of the Underlying Index. The Underlying Index utilizes a rules-based methodology developed by CIBC National Trust Company (the “Index Provider”), which is designed to provide exposure to a diverse set of U.S. and Canadian companies involved in the clean energy sector including renewables and clean technology. The clean energy sector is comprised of companies that provide the products and services that enable the evolution of a more sustainable energy sector. Clean energy business segments include, but are not limited to, the following activities: (i) renewable energy sources, including solar power, wind power, hydroelectricity, geothermal energy, biomass, biofuels, and tidal/wave energy, (ii) clean technologies, including electric vehicles, energy storage, lithium, fuel cell, smart grid, and energy efficiency technologies and (iii) other emerging clean energy activities and technologies. The Underlying Index is compiled by the Index Provider and may be comprised of U.S. or Canadian companies. In order to be eligible for inclusion in the Underlying Index, a company’s stock must be traded on one or more major U.S. or Canadian securities exchanges, be based in the U.S. or in Canada, have a minimum float-adjusted market capitalization and minimum average daily trading value thresholds established by the index rulebook of at least $300 million, and have a minimum median average daily trading liquidity of greater than $3 million over the last 60 trading days prior to the selection date, and the company must derive a majority of its value from clean energy business segments (as defined above). Such eligible companies shall be defined as the “Index Universe.” All equity securities meeting the above criteria are selected for inclusion in the Index Universe. The Underlying Index is reconstituted and rebalanced quarterly on the third Friday in March, June, September and December.
Performance Overview
For the twelve-month period ended November 30, 2022, the Fund generated a total return of -24.00%. Performance was relatively in-line with the Fund’s Underlying Index, net of fees, which returned -23.92%. The Fund underperformed the S&P 1000 Total Return Index, which returned -4.11% for the same period.
The S&P 500® Total Return Index (S&P 500), returned -9.21% for the trailing twelve-month (TTM) period that ended November 30, 2022, as fiscal year 2022 saw the worst drawdown for equities since the pandemic. Pressured by the Federal Reserve (Fed) raising interest rates to combat inflation, markets adjusted equity values to reflect a forward-looking slowed economy. Main macroeconomic talking points throughout 2022 centered on the path of future interest rates driven by monetary policy, and inflation sustaining levels well above the Fed’s 2% inflation target. Inflation fears continued to be justified with the year-over-year Consumer Price Index (CPI) surging above 9% in June, along with core inflation readings maintaining levels above 6%. Despite the quantitative tightening efforts in 2022, many economic indicators remain strong including consumer spending, wage growth and low unemployment in the US, offering a sliver of hope for a soft landing. Global supply chains were relieved of backlogs and most delays stemming from COVID-19 restrictions, benefitting company margins and lowering some pressure on prices of inflated goods. The latest economic data shows US Real GDP year-over-year rising 1.9% in the US, offset by CPI of 7.7%. Looking forward, we believe markets have likely discounted a significant portion of quantitative tightening as the S&P 500 Price-to-Earnings (P/E) ratio is below its 10-year average, and any pause or pivot in rate hikes would serve as a positive catalyst for US and global equities.
2022 saw an acceleration of clean energy adoption and mandates driven by legislation. The Biden Administration has set forth enormous initiatives to reduce greenhouse gas emissions by 50% by 2030, setting the precedent for further infrastructure spending and tax credits aimed at achieving these goals. The $260 billion Inflation Reduction Act was signed into law on August 16, 2022, with specific mandates and tax credits targeting all reaches of clean energy with initiatives that aim to create a 100% carbon pollution-free power sector by 2035. Solar and wind stocks stole the spotlight throughout the year, as tax credits from the Inflation Reduction Act were highly geared towards those clean energy segments. It is likely that North America will see more policy support targeted at clean energy infrastructure in the near future, as projections call for immediate increases in policy action in order to meet a net-zero global fleet by 2050.
The best performing stocks in the Fund for the period were First Solar, Inc. (FSLR US), which increased 66.53%, Infrastructure and Energy Alternatives, Inc. (IEA US), which saw a gain of 45.03%, and Renewable Energy Group, Inc. (REGI US), which rose 28.71%. The largest detractors were Volta, Inc. (VLTA US), which decreased 94.07%, Lion Electric Co. (LEV US), falling 74.50%, and Spruce Power Holdings Corp. (SPRU US), which lost 73.35%.
ACES Underlying Index has a differentiated approach to investing in clean energy. First, by narrowing the list of constituents to companies whose primary operations are focused on clean energy, the Fund offers more pure-play exposure to the clean energy sector. Second, constituents are diversified across the sector and offer exposure to the full opportunity set of the transition from fossil fuels to renewable energy. Lastly, focusing on U.S. and Canadian-based companies helps to further minimize the risk of investing in a global industry by reducing risks related to foreign holdings, including currency exchange rates, financial disclosures, and regulatory and policy changes.
| ALPS Clean Energy ETF | |
| Performance Overview | November 30, 2022 (Unaudited) |
Fund Performance (as of November 30, 2022)
| | 1 Year | 3 Year | Since Inception^ |
| ALPS Clean Energy ETF - NAV | -24.00% | 21.16% | 21.21% |
| ALPS Clean Energy ETF - Market Price* | -24.10% | 20.94% | 21.18% |
| S&P 1000® Total Return Index | -4.11% | 10.01% | 7.55% |
| CIBC Atlas Clean Energy Total Return Index | -23.92% | 21.53% | 21.81% |
Total Expense Ratio (per the current prospectus) is 0.55%.
Performance data quoted represents past performance. Past performance does not guarantee future results. Total return figures assume reinvestment of dividends and capital gains distributions, if any. The table does not reflect the deduction of taxes that a shareholder would pay on Fund distributions or the redemption of Fund shares. Investment return and principal value of an investment will fluctuate so that an investor’s shares, when sold or redeemed, may be worth more or less than the original cost. Current performance data may be higher or lower than actual data quoted. For the most current month-end performance data please visit www.alpsfunds.com or call 1.866.759.5679.
Net Asset Value (NAV) is an exchange-traded fund’s per-share value. The per-share dollar amount of the fund is derived by dividing the total value of all the securities in its portfolio, less any liabilities, by the number of fund shares outstanding. Market Price is the price at which a share can currently be traded in the market. Information detailing the number of days the Market Price of the Fund was greater than the Fund’s NAV and the number of days it was less than the Fund’s NAV can be obtained at www.alpsfunds.com.
| ^ | The Fund commenced operations on June 28, 2018, with the first day of trading on the exchange of June 29, 2018. |
| * | Market Price means the official closing price of a share or, if it more accurately reflects the market value of a share at the time as of which the Fund calculates current net asset value per share, the price that is the midpoint of the bid-ask spread as of that time. It does not represent the returns an investor would receive if shares were traded at other times. |
CIBC Atlas Clean Energy Total Return Index is an adjusted market cap weighted index designed to provide exposure to a diverse set of U.S. or Canadian based companies involved in the clean energy sector including renewables and clean technology. The clean energy sector is comprised of companies that provide the products and services which enable the evolution of a more sustainable energy sector. Clean energy business segments include but are not limited to: solar, wind, hydro, geothermal, electric vehicles, LED, biomass, smart grid, energy efficiency and storage. Total return assumes reinvestment of any dividends and distributions realized during a given time period.
The S&P 1000® Total Return Index combines the S&P MidCap 400® and the S&P SmallCap 600® to form an investable benchmark for the mid- to small-cap segment of the U.S. equity market. Total return assumes reinvestment of any dividends and distributions realized during a given time period.
One cannot invest directly in an index. Index performance does not reflect fund performance.
The Fund’s shares are not individually redeemable. Investors buy and sell shares of the Fund on a secondary market. Only market makers or “authorized participants” may trade directly with the Fund, typically in blocks of 25,000 shares.
The ALPS Clean Energy ETF is not suitable for all investors. Investments in the Fund are subject to investment risks, including possible loss of the principal amount invested.
ALPS Portfolio Solutions Distributor, Inc., a FINRA member, is the Distributor for the ALPS Clean Energy ETF.
| ALPS Clean Energy ETF | |
| Performance Overview | November 30, 2022 (Unaudited) |
Top Ten Holdings* (as of November 30, 2022)
| First Solar, Inc. | 7.49% |
| Enphase Energy, Inc. | 6.30% |
| Sunrun, Inc. | 5.69% |
| Rivian Automotive, Inc. | 5.48% |
| NextEra Energy Partners LP | 5.43% |
| Livent Corp. | 4.60% |
| Northland Power, Inc. | 4.58% |
| Brookfield Renewable Partners LP | 4.18% |
| Tesla, Inc. | 3.96% |
| Lucid Group, Inc. | 3.67% |
| Total % of Top 10 Holdings | 51.38% |
| * | % of Total Investments (excluding investments purchased with collateral from securities loaned) |
Future holdings are subject to change.
Clean Energy Segment Allocation* (as of November 30, 2022)
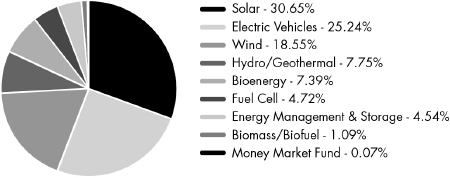
Growth of $10,000 (as of November 30, 2022)
Comparison of change in value of a $10,000 investment in the Fund and the Index
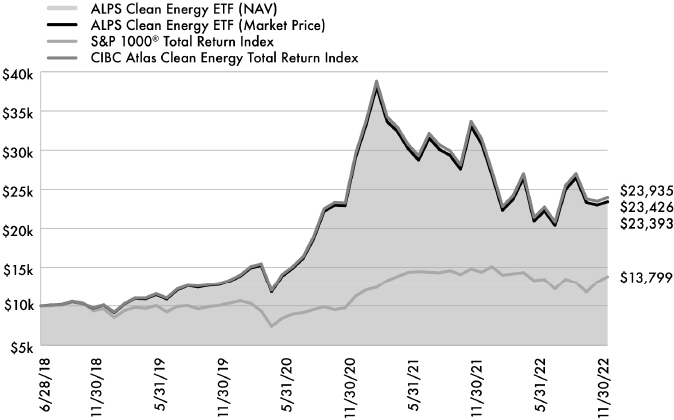
The chart above compares historical performance of a hypothetical investment of $10,000 in the Fund since inception with the performance of the Fund’s benchmark indices. Results include the reinvestment of all dividends and capital gains distributions. Past performance does not guarantee future results. The chart does not reflect the deduction of taxes that a shareholder would pay on Fund distributions or the redemption of Fund shares.
| ALPS Disruptive Technologies ETF | |
| Performance Overview | November 30, 2022 (Unaudited) |
Investment Objective
ALPS Disruptive Technologies ETF (the “Fund” or “DTEC”) seeks investment results that correspond (before fees and expenses) generally to the performance of the Indxx Disruptive Technologies Net Total Return Index (ticker symbol IDTEC) (the “Underlying Index”). The Fund will invest at least 80% of its net assets in securities that comprise the Underlying Index.
The Fund employs a “passive management” – or indexing – investment approach designed to track the performance of the Underlying Index. The Underlying Index utilizes a rules-based methodology developed by Indxx, LLC (the “Index Provider”), which is designed to identify the companies using disruptive technologies in each of ten thematic areas: Healthcare Innovation, Internet of Things, Clean Energy and Smart Grid, Cloud Computing, Data and Analytics, FinTech, Robotics and Artificial Intelligence, Cybersecurity, 3D Printing, and Mobile Payments (each a “Theme” and together, the “Themes”). Companies using disruptive technologies are those that are entering traditional markets with new digital forms of production and distribution, seek to disrupt an existing market and value network, displace established market-leading firms, products and alliances and increasingly gain market share. The Underlying Index is compiled by the Index Provider and may be comprised of U.S. and non-U.S. companies, including foreign and emerging markets companies. In order to be eligible for inclusion in the Underlying Index’s Index Universe, a company’s stock must be traded on one or more major global securities exchanges, have a minimum market capitalization of at least $500 million, and have a six month minimum average daily trading volume of $2 million, and the company must derive a minimum of 50% of its revenue from a single Theme. All equity securities meeting the above criteria are selected for inclusion in the Index Universe. From the Index Universe, the Underlying Index methodology selects ten stocks in each Theme according to proprietary quantitative and qualitative factors. The eligible stocks that are selected for inclusion in the Underlying Index’s portfolio are equally weighted. The Underlying Index is reconstituted annually on the third Friday of September and rebalanced quarterly.
Performance Overview
For the twelve-month period ended November 30, 2022, the Fund generated a total return of -27.41%. Performance was relatively in-line with the Fund’s Underlying Index, net of fees, which returned -27.24%. The Fund underperformed the Morningstar Global Markets Index, which returned -11.76% for the same period.
The S&P 500® Total Return Index returned -9.21% for the trailing twelve-month (TTM) period that ended November 30, 2022, as fiscal year 2022 saw the worst drawdown for equities since the pandemic. Pressured by the Federal Reserve (Fed) raising interest rates to combat inflation, markets adjusted equity values to reflect a forward-looking slowed economy. Main macroeconomic talking points throughout 2022 centered on the path of future interest rates driven by monetary policy, and inflation sustaining levels well above the Fed’s 2% inflation target. Inflation fears continued to be justified with the year-over-year Consumer Price Index surging above 9% in June, along with core inflation readings maintaining levels above 6%. Despite the quantitative tightening efforts in 2022, many economic indicators remain strong including consumer spending, wage growth and low unemployment across developed and emerging markets, offering a sliver of hope for a soft landing. Global supply chains were relieved of backlogs and most delays stemming from COVID-19 restrictions, benefitting company margins and lowering some pressure on prices of inflated goods. The latest economic data shows Real GDP year-over-year rising 1.9% in the U.S., 2.3% in the Eurozone, 1.8% in Japan and 3.9% in China. Looking forward, global markets have likely discounted a significant portion of quantitative tightening. We believe that global stocks, as measured by the Morningstar Global Markets Index, that exhibit Price-to-Earnings ratios below 10-year averages, along with any pause or pivot in rate hikes across developed central banks, will likely serve as positive catalysts for global equities.
DTEC underperformed the Morningstar Global Markets Index, which returned -11.76% for the trailing twelve-month period ended November 30, 2022. The Fund holds roughly 69% U.S. equities and 31% foreign equities. The U.S. Dollar strengthened relative to the Euro, causing U.S. equities to pull back along with weakening potential growth. Value equities far outperformed growth equities internationally in 2022, with energy and other cyclical companies benefitting from elevated prices. Future growth prospects remain cautiously optimistic, predicated on a slowing of interest rate hikes and a strong consumer.
We believe that disruptive technologies pave the way for a brighter future through innovation and fundamentally alter the way industries operate. Furthermore, the potential to capture returns within different disruptive technology themes is compelling and offers the potential to supercharge a portfolio. DTEC employs an equal-weighted strategy to its disruptive themes, resulting in 10 sub-themes (3D Printing, Clean Energy & Smart Grid, Cloud Computing, Cyber Security, Data & Analytics, FinTech, Healthcare Innovation, IoT, Mobile Payments, Robotics & AI), each with a 10% holding. The Fund picks the top 10 names from its universe that most represent the specific theme. Cybersecurity was the best-performing theme for the year, although all DTEC themes were negative for the TTM period. DTEC’s top performing name on the year was First Solar, Inc. (FSLR), a solar module manufacturer, gaining an impressive 66.53%. In contrast, the worst-performing name for DTEC was Cerence, Inc. (CRNC), an application software provider for roadmap visibility, falling 76.15%.
Looking ahead, the Fund’s strategy of selecting the top disruptive themes in the market today will provide exposure to areas of the market ALPS Advisors, Inc. believes will be high-growth relative to the Morningstar Global Markets Index.
| ALPS Disruptive Technologies ETF | |
| Performance Overview | November 30, 2022 (Unaudited) |
Fund Performance (as of November 30, 2022)
| | 1 Year | 3 Year | Since Inception^ |
| ALPS Disruptive Technologies ETF - NAV | -27.41% | 3.44% | 7.25% |
| ALPS Disruptive Technologies ETF - Market Price* | -27.41% | 3.38% | 7.27% |
| Indxx Disruptive Technologies Net Total Return Index | -27.24% | 3.73% | 7.52% |
| Morningstar® Global Markets Net Return Index | -11.76% | 6.27% | 5.79% |
Total Expense Ratio (per the current prospectus) is 0.50%.
Performance data quoted represents past performance. Past performance does not guarantee future results. Total return figures assume reinvestment of dividends and capital gains distributions, if any. The table does not reflect the deduction of taxes that a shareholder would pay on Fund distributions or the redemption of Fund shares. Investment return and principal value of an investment will fluctuate so that an investor’s shares, when sold or redeemed, may be worth more or less than the original cost. Current performance data may be higher or lower than actual data quoted. For the most current month-end performance data please visit www.alpsfunds.com or call 1.866.759.5679.
Net Asset Value (NAV) is an exchange-traded fund’s per-share value. The per-share dollar amount of the fund is derived by dividing the total value of all the securities in its portfolio, less any liabilities, by the number of fund shares outstanding. Market Price is the price at which a share can currently be traded in the market. Information detailing the number of days the Market Price of the Fund was greater than the Fund’s NAV and the number of days it was less than the Fund’s NAV can be obtained at www.alpsfunds.com.
| ^ | The Fund commenced operations on December 28, 2017, with the first day of trading on the exchange of December 29, 2017. |
| * | Market Price means the official closing price of a share or, if it more accurately reflects the market value of a share at the time as of which the Fund calculates current net asset value per share, the price that is the midpoint of the bid-ask spread as of that time. It does not represent the returns an investor would receive if shares were traded at other times. |
Indxx Disruptive Technologies Net Total Return Index (Ticker: IDTEC) is based around companies that enter traditional markets with new digital forms of production and distribution, are likely to disrupt an existing market and value network, displace established market leading firms, products and alliances and increasingly gain market share. Total Return assumes reinvestment of any dividends and distributions realized during a given time period. Net Total Return (NTR) is obtained by reinvesting the net dividend, which is equal to the ordinary gross dividend minus the amount of withholding tax.
The Morningstar® Global Markets Net Return Index, measures the performance of the stocks located in the developed and emerging countries across the world. Stocks in the index are weighted by their float capital, which removes corporate cross ownership, government holdings and other locked-in shares.
One cannot invest directly in an index. Index performance does not reflect fund performance.
The Fund’s shares are not individually redeemable. Investors buy and sell shares of the Fund on a secondary market. Only market makers or “authorized participants” may trade directly with the Fund, typically in blocks of 25,000 shares.
The ALPS Disruptive Technologies ETF is not suitable for all investors. Investments in the Fund are subject to investment risks, including possible loss of the principal amount invested.
ALPS Portfolio Solutions Distributor, Inc., a FINRA member, is the Distributor for the ALPS Disruptive Technologies ETF.
| ALPS Disruptive Technologies ETF | |
| Performance Overview | November 30, 2022 (Unaudited) |
Top Ten Holdings* (as of November 30, 2022)
| ABIOMED, Inc. | 1.39% |
| Kaspi.KZ JSC | 1.38% |
| AutoStore Holdings, Ltd. | 1.37% |
| Allegro MicroSystems, Inc. | 1.37% |
| Netflix, Inc. | 1.36% |
| SAP SE | 1.32% |
| Dexcom, Inc. | 1.29% |
| Intuitive Surgical, Inc. | 1.28% |
| First Solar, Inc. | 1.27% |
| Schneider Electric SE | 1.21% |
| Total % of Top 10 Holdings | 13.24% |
| * | % of Total Investments (excluding investments purchased with collateral from securities loaned) |
Future holdings are subject to change.
Thematic Allocation* (as of November 30, 2022)
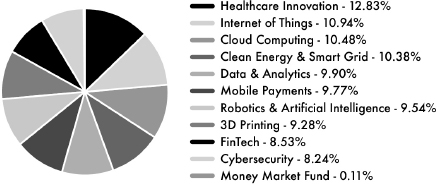
Growth of $10,000 (as of November 30, 2022)
Comparison of change in value of a $10,000 investment in the Fund and the Index
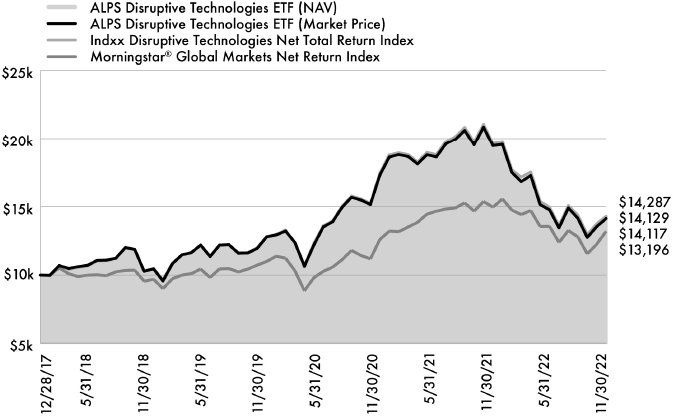
The chart above compares historical performance of a hypothetical investment of $10,000 in the Fund since inception with the performance of the Fund’s benchmark indices. Results include the reinvestment of all dividends and capital gains distributions. Past performance does not guarantee future results. The chart does not reflect the deduction of taxes that a shareholder would pay on Fund distributions or the redemption of Fund shares.
| ALPS Global Travel Beneficiaries ETF | |
| Performance Overview | November 30, 2022 (Unaudited) |
Investment Objective
ALPS Global Travel Beneficiaries ETF (the "Fund" or "JRNY") seeks investment results that replicate as closely as possible, before fees and expenses, the performance of the S-Network Global Travel Net Total Return Index (ticker symbol TRAVEL) (the “Underlying Index”).
The Underlying Index uses a rules-based methodology developed by S-Network Global Indexes Inc. (the "Index Provider"), which is designed to identify exchange-traded stocks of companies that are materially engaged in the global travel industry, including four segments: Airlines & Airport Services; Hotels, Casinos, Cruise Lines; Booking & Rental Agencies; and Ancillary Beneficiaries. The Underlying Index is compiled by the Index Provider and may be comprised of U.S. and non-U.S. companies, including foreign and emerging markets companies. In order to be eligible for inclusion in the Underlying Index's Index Universe, a company's stock must be traded on one or more major global securities exchanges and is principally engaged in or derives significant revenue from one of the segments. In addition, a company's stock must have a minimum market capitalization of at least $100 million, a three-month minimum average daily trading volume of $1 million, and a minimum free float factor of 18%. All equity securities meeting the above criteria are selected for inclusion in the Index Universe. From the Index Universe, the Underlying Index methodology selects and weights twenty stocks in each segment, subject to a minimum of one constituent per geographic region (U.S. & Canada, Europe, Pacific (ex-Canada), and Emerging) and a 65% maximum weight per geographic region. The Underlying Index is rebalanced and reconstituted quarterly on the third Friday of the last month in each calendar quarter.
Performance Overview
For the twelve-month period ended November 30, 2022, the Fund generated a total return of -10.27%, relatively in-line with the Fund’s Underlying Index, net of fees, which returned -10.04%. The Fund outperformed the Morningstar Global Markets Index, which returned -11.76% for the same period.
The S&P 500 Total Return Index returned -9.21% for the trailing twelve-month (TTM) period that ended November 30, 2022, as fiscal year 2022 saw the worst drawdown for equities since the pandemic. Pressured by the Federal Reserve (Fed) raising interest rates to combat inflation, markets adjusted equity values to reflect a forward-looking slowed economy. Main macroeconomic talking points throughout 2022 centered on the path of future interest rates driven by monetary policy, and inflation sustaining levels well above the Fed’s 2% inflation target. Inflation fears continued to be justified with the year-over-year Consumer Price Index surging above 9% in June, along with core inflation readings maintaining levels above 6%. Despite the quantitative tightening efforts in 2022, many economic indicators remain strong including consumer spending, wage growth and low unemployment across developed and emerging markets, offering a sliver of hope for a soft landing. Global supply chains were relieved of backlogs and most delays stemming from COVID-19 restrictions, benefitting company margins and lowering some pressure on prices of inflated goods. The latest economic data shows Real GDP year-over-year rising 1.9% in the US, 2.3% in the Eurozone, 1.8% in Japan and 3.9% in China. Looking forward, global markets have likely discounted a significant portion of quantitative tightening. We believe that global stocks, as measured by the Morningstar Global Markets Index, that exhibit Price-to-Earnings ratios below 10-year averages, along with any pause or pivot in rate hikes across developed central banks, will likely serve as positive catalysts for global equities.
In terms of global travel, we believe travel companies and beneficiaries are poised to benefit from the continued global re-opening. Global travel continues to have its pulse on the state of the consumer with strong travel spending expected to continue into 2023, affirmed by Thanksgiving weekend seeing the highest foot traffic across U.S. airports since the pandemic began, according to the U.S. Transportation Security Administration. Additionally, global air traffic and flights booked are expected to continue to increase as the International Air Transportation Association reported total airport traffic spiked +44.6% year-over-year in October of 2022. Travel beneficiaries have so far been able to pass the majority of increased costs related to inflation and supply chain disruptions on to consumers, reducing pressure on profit margins.
The best-performing stocks in the Fund for the TTM period were Dassault Aviation SA (AM FP), which increased 68.10%, and Localiza Rent A Car SA (RENT1 BZ), which saw a gain of 58.14%. Furthermore, the top-performing JRNY segment was Airlines & Airport Services, returning -2.58%. The largest individual detractors for the TTM period were SWVL Holdings Corp. (SWVL US), decreasing 94.64%, and Lyft, Inc. (LYFT US), which lost 72.37%.
Looking ahead, the Fund’s strategy of identifying companies that are materially engaged in global travel industries, including airlines, hotels, casinos and cruise lines, and companies that support and stand to benefit from those industries, is designed to provide a holistic and more diversified exposure to the secular tailwinds in global travel.
| ALPS Global Travel Beneficiaries ETF | |
| Performance Overview | November 30, 2022 (Unaudited) |
Fund Performance (as of November 30, 2022)
| | 1 Year | Since Inception^ |
| ALPS Global Travel Beneficiaries ETF - NAV | -10.27% | -12.45% |
| ALPS Global Travel Beneficiaries ETF - Market Price* | -10.08% | -12.21% |
| S-Network Global Travel Net Total Return Index | -10.04% | -12.23% |
| Morningstar® Global Markets Net Return Index | -11.76% | -11.38% |
Total Expense Ratio (per the current prospectus) is 0.65%.
Performance data quoted represents past performance. Past performance does not guarantee future results. Total return figures assume reinvestment of dividends and capital gains distributions, if any. The table does not reflect the deduction of taxes that a shareholder would pay on Fund distributions or the redemption of Fund shares. Investment return and principal value of an investment will fluctuate so that an investor’s shares, when sold or redeemed, may be worth more or less than the original cost. Current performance data may be higher or lower than actual data quoted. For the most current month-end performance data please visit www.alpsfunds.com or call 1.866.759.5679.
Net Asset Value (NAV) is an exchange-traded fund’s per-share value. The per-share dollar amount of the fund is derived by dividing the total value of all the securities in its portfolio, less any liabilities, by the number of fund shares outstanding. Market Price is the price at which a share can currently be traded in the market. Information detailing the number of days the Market Price of the Fund was greater than the Fund’s NAV and the number of days it was less than the Fund’s NAV can be obtained at www.alpsfunds.com.
| ^ | The Fund commenced operations on September 8, 2021, with the first day of trading on the exchange of September 9, 2021. |
| * | Market Price means the official closing price of a share or, if it more accurately reflects the market value of a share at the time as of which the Fund calculates current net asset value per share, the price that is the midpoint of the bid-ask spread as of that time. It does not represent the returns an investor would receive if shares were traded at other times. |
The S-Network Global Travel Net Total Return Index (Ticker: TRAVEL) is an Index of stocks listed on global recognized stock exchanges that are materially engaged in segments of the global travel industry, including Airlines & Airport Services; Hotels, Casinos, and Cruise Lines; Booking & Rental Agencies; and ancillary beneficiaries of global travel. Total Return assumes reinvestment of any dividends and distributions realized during a given time period. Net Total Return (NTR) is obtained by reinvesting the net dividend, which is equal to the ordinary gross dividend minus the amount of withholding tax.
The Morningstar® Global Markets Net Return Index, measures the performance of the stocks located in the developed and emerging countries across the world. Stocks in the index are weighted by their float capital, which removes corporate cross ownership, government holdings and other locked-in shares.
One cannot invest directly in an index. Index performance does not reflect fund performance.
The Fund’s shares are not individually redeemable. Investors buy and sell shares of the Fund on a secondary market. Only market makers or “authorized participants” may trade directly with the Fund, typically in blocks of 25,000 shares.
The ALPS Global Travel Beneficiaries ETF is not suitable for all investors. Investments in the Fund are subject to investment risks, including possible loss of the principal amount invested.
ALPS Portfolio Solutions Distributor, Inc., a FINRA member, is the Distributor for the ALPS Global Travel Beneficiaries ETF.
| ALPS Global Travel Beneficiaries ETF | |
| Performance Overview | November 30, 2022 (Unaudited) |
Top Ten Holdings* (as of November 30, 2022)
| LVMH Moet Hennessy Louis Vuitton SE | 5.12% |
| L'Oreal SA | 4.64% |
| Booking Holdings, Inc. | 4.62% |
| Hilton Worldwide Holdings, Inc. | 4.51% |
| Marriott International, Inc. | 4.45% |
| Cintas Corp. | 4.43% |
| American Express Co. | 4.41% |
| The Estee Lauder Company, Inc. | 4.07% |
| Walt Disney Co. | 3.74% |
| Airbnb, Inc. | 3.69% |
| Total % of Top 10 Holdings | 43.68% |
| * | % of Total Investments (excluding investments purchased with collateral from securities loaned) |
Future holdings are subject to change.
Thematic Allocation* (as of November 30, 2022)
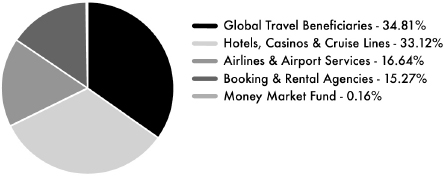
Growth of $10,000 (as of November 30, 2022)
Comparison of change in value of a $10,000 investment in the Fund and the Index
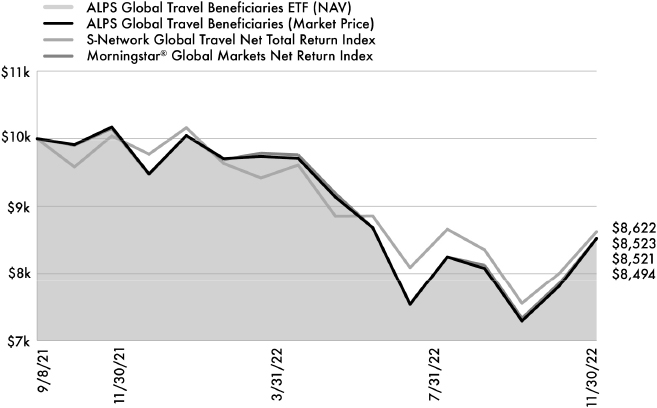
The chart above compares historical performance of a hypothetical investment of $10,000 in the Fund since inception with the performance of the Fund’s benchmark indices. Results include the reinvestment of all dividends and capital gains distributions. Past performance does not guarantee future results. The chart does not reflect the deduction of taxes that a shareholder would pay on Fund distributions or the redemption of Fund shares.
| ALPS Medical Breakthroughs ETF | |
| Performance Overview | November 30, 2022 (Unaudited) |
Investment Objective
ALPS Medical Breakthroughs ETF (the “Fund” or “SBIO”) seeks investment results that correspond (before fees and expenses) generally to the performance of the S-Network® Medical Breakthroughs Total Return Index (the “Underlying Index”). The Fund will normally invest at least 80% of its net assets in securities that comprise the Underlying Index (or depository receipts based on such securities).
The Fund employs a “passive management” – or indexing – investment approach designed to track the performance of the Underlying Index. The Underlying Index is comprised of small- and mid-cap stocks of biotechnology companies that have one or more drugs in either Phase II or Phase III of the U.S. Food and Drug Administration ("FDA") clinical trials. In a Phase II trial, the drug is administered to a group of 100-300 people to see if it is effective and to evaluate its safety. In a Phase III trial, the drug is given to a larger group, between 500-3,000 people, to confirm its effectiveness, monitor side effects, compare it to commonly used treatments and collect information that will allow the drug or treatment to be used safely. Stocks selected for inclusion in the Underlying Index must be listed on a U.S. stock exchange. Underlying Index constituents must have a market capitalization of no less than $200 million and no more than $5 billion. Stocks included in the Underlying Index must also sustain an average daily trading volume in excess of $1 million for the 90-day period preceding an Underlying Index reconstitution. Constituents must be able to sustain the monthly rates at which they use shareholder capital ("cash burn rates") for at least 24 months. The Underlying Index is reconstituted semi-annually on the third Fridays of June and December.
Performance Overview
For the twelve-month period ended November 30, 2022, the Fund generated a total return of -27.13%, relatively in-line with the Fund’s Underlying Index, net of fees, which returned -26.43%. The Fund underperformed the broad market, as represented by the S&P 500® Total Return Index (S&P 500), which returned -9.21% for the period, and also underperformed the NASDAQ Biotechnology Total Return Index’s (XNBI Index) return of -8.54% as the small and mid-cap (SMID) biotech companies saw multiples compress further than their large-cap counterparts.
The S&P 500 returned -9.21% for the trailing twelve-month (TTM) period ended November 30, 2022, as the fiscal year 2022 saw the worst drawdown for equities since the pandemic. Pressured by the Federal Reserve (Fed) raising interest rates to combat inflation, markets adjusted equity values to reflect a forward-looking slowed economy. Despite the quantitative tightening efforts in 2022, many economic indicators remain strong including consumer spending, wage growth and low unemployment in the US, offering a sliver of hope for a soft landing. Global supply chains were relieved of backlogs and most delays stemming from COVID-19 restrictions, benefitting company margins and lowering some pressure on prices of inflated goods. The latest economic data shows US Real GDP year-over-year rising 1.9% in the US, offset by Consumer Price Index of 7.7%. Looking forward, markets have likely discounted a significant portion of quantitative tightening as the S&P 500 Price-to-Earnings ratio is below its 10-year average, and any pause or pivot in rate hikes would serve as a positive catalyst for U.S. and global equities.
Specifically for the biotech industry and its high-growth stocks, 2022’s headwinds weighed on performance more than other segments of the market. Although Congress’ efforts to reduce drug pricing could potentially slow the pace of innovation for many drug companies, 2022 has seen a number of positive catalysts including major acquisitions by big pharma looking to add promising drugs to their pipeline and exceedingly positive drug trial results. Despite headwinds, the biotech industry’s continued positive fundamentals and depressed valuations paint an exciting future for drug therapies, and continued innovation. There have been 272 U.S. biotech M&A deals in 2022, with an average premium paid of +98.24% for the acquired biotech companies, highlighting what we believe to be attractive prices and a positive outlook for U.S. biotech.
The Fund’s volatility during the year was higher than the S&P 500, which is not unusual for the biotech industry as the space typically carries a higher beta relative to the broad market. The best-performing stocks in the Fund for the period were 4D Molecular Therapeutics Inc. (FDMT), Nuvalent, Inc. (NUVL), and Global Blood Therapeutics, Inc. (GBT), which returned 272.42%, 228.14%, and 177.93%, respectively. In contrast, the worst-performing stocks for the period were Allakos, Inc. (ALLK), Kodiak Sciences, Inc. (KOD), and Instil Bio, Inc. (TIL), which declined 96.40%, 91.96%, and 91.71%, respectively.
Due to the high failure rate of companies within the space, the non-traditional metrics used to evaluate biotech companies, and the technical knowledge required to succeed in the space, biotechnology is a difficult industry for stock pickers. We believe this environment makes a passive strategy attractive, as it provides a diversified, rules-based access vehicle for those looking to gain exposure to the biotechnology space, while mitigating single-stock risk. The Fund and its Underlying Index focus on innovation, seeking to capture research and development opportunities in the biotechnology industry. Looking forward, the Fund’s strategy of providing exposure to small and mid-cap biotechnology companies that have one or more drugs in either Phase II or Phase III FDA clinical trials can provide potential alpha and pure-play exposure to the biotech space.
| ALPS Medical Breakthroughs ETF | |
| Performance Overview | November 30, 2022 (Unaudited) |
Fund Performance (as of November 30, 2022)
| | 1 Year | 5 Year | Since Inception^ |
| ALPS Medical Breakthroughs ETF - NAV | -27.13% | 0.66% | 3.66% |
| ALPS Medical Breakthroughs ETF - Market Price* | -27.12% | 0.65% | 3.65% |
| S-Network Medical Breakthroughs Total Return Index | -26.43% | 1.06% | 4.07% |
| NASDAQ Biotechnology Total Return Index | -8.54% | 6.27% | 4.57% |
Total Expense Ratio (per the current prospectus) is 0.50%
Performance data quoted represents past performance. Past performance does not guarantee future results. Total return figures assume reinvestment of dividends and capital gains distributions, if any. Investment return and principal value of an investment will fluctuate so that an investor’s shares, when sold or redeemed, may be worth more or less than the original cost. Current performance data may be higher or lower than actual data quoted. For most current month-end performance data please visit www.alpsfunds.com or call 1.866.759.5679.
Net Asset Value (NAV) is an exchange-traded fund’s per-share value. The per-share dollar amount of the fund is derived by dividing the total value of all the securities in its portfolio, less any liabilities, by the number of fund shares outstanding. Market Price is the price at which a share can currently be traded in the market. Information detailing the number of days the Market Price of the Fund was greater than the Fund’s NAV and the number of days it was less than the Fund’s NAV can be obtained at www.alpsfunds.com.
| ^ | The Fund commenced investment operations on December 30, 2014. |
| * | Market Price means the official closing price of a share or, if it more accurately reflects the market value of a share at the time as of which the Fund calculates current net asset value per share, the price that is the midpoint of the bid-ask spread as of that time. It does not represent the returns an investor would receive if shares were traded at other times. |
NASDAQ Biotechnology Total Return Index (Ticker: NBI) is a modified market capitalization-weighted index designed to measure the performance of all the NASDAQ stocks in the biotechnology sector. Total return assumes reinvestment of any dividends and distributions realized during a given time period.
S-Network Medical Breakthroughs Total Return Index (Ticker: PMBI) is designed to capture research and development opportunities in the biotechnology industry. PMBI consists of small-cap and mid-cap biotechnology stocks listed on U.S. stock exchanges that have one or more drugs in either Phase II or Phase III U.S. FDA clinical trials. Total return assumes reinvestment of any dividends and distributions realized during a given time period.
One cannot invest directly in an index. Index performance does not reflect fund performance.
Companies in the pharmaceuticals and biotechnology industry may be subject to extensive litigation based on product liability and similar claims. Legislation introduced or considered by certain governments on such industries or on the healthcare sector cannot be predicted.
Companies in the pharmaceuticals industry are subject to competitive forces that may make it difficult to raise prices and, in fact, may result in price discounting. The profitability of some companies in the pharmaceuticals industry may be dependent on a relatively limited number of products. In addition, their products can become obsolete due to industry innovation, changes in technologies or other market developments. Many new products in the pharmaceuticals industry are subject to government approvals, regulation and reimbursement rates. The process of obtaining government approvals may be long and costly. Many companies in the pharmaceuticals industry are heavily dependent on patents and intellectual property rights. The loss or impairment of these rights may adversely affect the profitability of these companies.
The development of new drugs generally has a high failure rate, and such failures may negatively impact the stock price of the company developing the failed drug. Biotechnology companies may have persistent losses during a new product’s transition from development to production. In order to fund operations, biotechnology companies may require financing from the capital markets, which may not always be available on satisfactory terms or at all.
The Fund’s shares are not individually redeemable. Investors buy and sell shares of the Fund on a secondary market. Only market makers or “authorized participants” may trade directly with the Fund, typically in blocks of 25,000 shares.
The ALPS Medical Breakthroughs ETF is not suitable for all investors. Investments in the Fund are subject to investment risks, including possible loss of the principal amount invested.
ALPS Portfolio Solutions Distributor, Inc., a FINRA member, is the Distributor for the ALPS Medical Breakthroughs ETF.
ALPS Portfolio Solutions Distributor, Inc. is not affiliated with S-Network Global Indexes, Inc.
| ALPS Medical Breakthroughs ETF | |
| Performance Overview | November 30, 2022 (Unaudited) |
Top Ten Holdings* (as of November 30, 2022)
| Karuna Therapeutics, Inc. | 4.41% |
| Ascendis Pharma A/S | 3.85% |
| Ionis Pharmaceuticals, Inc. | 3.25% |
| Mirati Therapeutics, Inc. | 2.85% |
| Cerevel Therapeutics Holdings, Inc. | 2.53% |
| CRISPR Therapeutics AG | 2.40% |
| Alkermes PLC | 2.28% |
| Cytokinetics, Inc. | 2.24% |
| Zai Lab, Ltd. | 2.24% |
| Denali Therapeutics, Inc. | 2.21% |
| Total % of Top 10 Holdings | 28.26% |
| * | % of Total Investments (excluding investments purchased with collateral from securities loaned) |
Future holdings are subject to change.
Sector Allocation* (as of November 30, 2022)
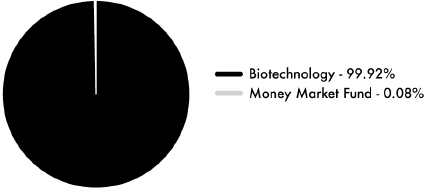
Growth of $10,000 (as of November 30, 2022)
Comparison of change in value of a $10,000 investment in the Fund and the Index

The chart above compares historical performance of a hypothetical investment of $10,000 in the Fund since inception with the performance of the Fund’s benchmark indices. Results include the reinvestment of all dividends and capital gains distributions. Past performance does not guarantee future results. The chart does not reflect the deduction of taxes that a shareholder would pay on Fund distributions or the redemption of Fund shares.
| ALPS ETF Trust | |
| Disclosure of Fund Expenses | November 30, 2022 (Unaudited) |
Shareholder Expense Example: As a shareholder of a Fund, you incur certain ongoing costs, including management fees and other Fund expenses. These examples are intended to help you understand your ongoing costs (in dollars) of investing in a Fund and to compare these costs with the ongoing costs of investing in other funds. It is based on an investment of $1,000 invested at the beginning of the six month period and held through November 30, 2022.
Actual Return: The first line of the table provides information about actual account values and actual expenses. You may use the information in this line, together with the amount you invested, to estimate the expenses that you incurred over the period. Simply divide your account value by $1,000 (for example, an $8,600 account value divided by $1,000 = 8.6), then multiply the result by the number in the first line under the heading entitled “Expenses Paid During Period” to estimate the expenses attributable to your investment during this period.
Hypothetical 5% Return: The second line of the table provides information about hypothetical account values and hypothetical expenses based on the Fund’s actual expense ratio and an assumed rate of return of 5% per year before expenses, which is not the Fund’s actual return. The hypothetical account values and expenses may not be used to estimate the actual ending account balance or expenses you paid for the period. You may use this information to compare ongoing costs of investing in the Fund and other funds. To do so, compare this 5% hypothetical example with the 5% hypothetical examples that appear in the shareholder reports of the other funds.
The expenses shown in the table are meant to highlight ongoing Fund costs only and do not reflect any transaction costs, such as brokerage commissions and other fees to financial intermediaries. Therefore, the second line is useful in comparing ongoing costs only, and will not help you determine the relative total costs of owning different funds. In addition, if these costs were included, your costs would have been higher.
| | Beginning Account Value 6/1/22 | Ending Account Value 11/30/22 | Expense Ratio(a) | Expenses Paid During Period 6/1/22 - 11/30/22(b) |
| ALPS Clean Energy ETF | | | | |
| Actual | $1,000.00 | $1,053.70 | 0.55% | $2.83 |
| Hypothetical (5% return before expenses) | $1,000.00 | $1,022.31 | 0.55% | $2.79 |
| ALPS Disruptive Technologies ETF | | | | |
| Actual | $1,000.00 | $956.50 | 0.50% | $2.45 |
| Hypothetical (5% return before expenses) | $1,000.00 | $1,022.56 | 0.50% | $2.54 |
| ALPS Global Travel Beneficiaries ETF | | | | |
| Actual | $1,000.00 | $982.30 | 0.65% | $3.23 |
| Hypothetical (5% return before expenses) | $1,000.00 | $1,021.81 | 0.65% | $3.29 |
| ALPS Medical Breakthroughs ETF | | | | |
| Actual | $1,000.00 | $1,217.00 | 0.50% | $2.78 |
| Hypothetical (5% return before expenses) | $1,000.00 | $1,022.56 | 0.50% | $2.54 |
| (a) | Annualized, based on the Fund's most recent fiscal half year expenses. |
| (b) | Expenses are equal to the Fund's annualized expense ratio multiplied by the average account value over the period, multiplied by the number of days in the most recent fiscal half year (183), divided by 365. |
| ALPS ETF Trust |
| Report of Independent Registered Public Accounting Firm |
To the Board of Trustees of ALPS ETF Trust and the Shareholders of ALPS Clean Energy ETF, ALPS Disruptive Technologies ETF, ALPS Global Travel Beneficiaries ETF, and ALPS Medical Breakthroughs ETF
Opinion on the Financial Statements
We have audited the accompanying statements of assets and liabilities of ALPS Clean Energy ETF, ALPS Disruptive Technologies ETF, ALPS Global Travel Beneficiaries ETF, and ALPS Medical Breakthroughs ETF, each a series of shares of beneficial interest in ALPS ETF Trust (the “Funds”), including the schedules of investments, as of November 30, 2022, and the related statements of operations and changes in net assets and the financial highlights for the year then ended, and the related notes (collectively referred to as the “financial statements”). In our opinion, the financial statements present fairly, in all material respects, the financial position of the Funds as of November 30, 2022, and the results of their operations, the changes in their net assets, and their financial highlights for the year then ended, in conformity with accounting principles generally accepted in the United States of America. The financial statements and financial highlights for the periods presented below were audited by other auditors whose report dated January 26, 2022 expressed an unqualified opinion on those financial statements and financial highlights.
| Fund | Financial Statements and Financial Highlights Audited by Other Auditor |
| ALPS Clean Energy ETF | Statement of Changes in Net Assets for the year ended November 30, 2021 and Financial Highlights for each of the years ended November 30, 2021, 2020, 2019 and for the period June 28, 2018 (commencement of operations) to November 30, 2018 |
| ALPS Disruptive Technologies ETF | Statement of Changes in Net Assets for the year ended November 30, 2021 and Financial Highlights for each of the years ended November 30, 2021, 2020, 2019 and for the period December 28, 2017 (commencement of operations) to November 30, 2018 |
| ALPS Global Travel Beneficiaries ETF | Statement of Changes in Net Assets and Financial Highlights for the period September 8, 2021 (commencement of operations) to November 30, 2021 |
| ALPS Medical Breakthroughs ETF | Statement of Changes in Net Assets for the year ended November 30, 2021 and Financial Highlights for each of the years in the four-year period ended November 30, 2021 |
Basis for Opinion
These financial statements are the responsibility of the Funds' management. Our responsibility is to express an opinion on the Funds’ financial statements based on our audits. We are a public accounting firm registered with the Public Company Accounting Oversight Board (United States) (“PCAOB”) and are required to be independent with respect to the Funds in accordance with the U.S. federal securities law and the applicable rules and regulations of the Securities and Exchange Commission and the PCAOB.
We conducted our audits in accordance with the standards of the PCAOB. Those standards require that we plan and perform the audits to obtain reasonable assurance about whether the financial statements are free of material misstatement, whether due to error or fraud. The Funds are not required to have, nor were we engaged to perform, an audit of their internal control over financial reporting. As part of our audits we are required to obtain an understanding of internal control over financial reporting but not for the purpose of expressing an opinion on the effectiveness of the Funds’ internal control over financial reporting. Accordingly, we express no such opinion.
Our audits included performing procedures to assess the risk of material misstatement of the financial statements, whether due to error or fraud, and performing procedures that respond to those risks. Such procedures included examining, on a test basis, evidence regarding the amounts and disclosures in the financial statements. Our procedures included confirmation of securities owned as of November 30, 2022 by correspondence with the custodian, brokers, or by other appropriate auditing procedures where replies from brokers were not received. Our audits also included evaluating the accounting principles used and significant estimates made by management, as well as evaluating the overall presentation of the financial statements. We believe that our audits provide a reasonable basis for our opinion.

BBD, LLP
We have served as the auditor of one or more of the Funds in the ALPS ETF Trust since 2022.
Philadelphia, Pennsylvania
January 27, 2023
| ALPS Clean Energy ETF | |
| Schedule of Investments | November 30, 2022 |
| Security Description | | Shares | | | Value | |
| COMMON STOCKS (88.61%) | | | | | | | | |
| Consumer Discretionary (13.88%) | | | | | | | | |
| EVgo, Inc.(a)(b) | | | 446,769 | | | $ | 2,859,322 | |
| Lucid Group, Inc.(a)(b) | | | 2,560,508 | | | | 25,963,550 | |
| Rivian Automotive, Inc.(a)(b) | | | 1,210,239 | | | | 38,776,057 | |
| Tesla, Inc.(a) | | | 143,727 | | | | 27,983,647 | |
| Volta, Inc.(a)(b) | | | 699,046 | | | | 344,140 | |
| Workhorse Group, Inc.(a) | | | 1,002,006 | | | | 2,304,614 | |
| Total Consumer Discretionary | | | | | | | 98,231,330 | |
| | | | | | | | | |
| Energy (4.27%) | | | | | | | | |
| Aemetis, Inc.(a)(b) | | | 192,273 | | | | 1,059,424 | |
| Archaea Energy, Inc., Class A(a) | | | 522,268 | | | | 13,547,632 | |
| Green Plains, Inc.(a) | | | 365,423 | | | | 12,629,019 | |
| REX American Resources Corp.(a) | | | 101,378 | | | | 2,991,665 | |
| Total Energy | | | | | | | 30,227,740 | |
| | | | | | | | | |
| Financials (2.57%) | | | | | | | | |
| Hannon Armstrong Sustainable Infrastructure Capital, Inc. | | | 561,775 | | | | 18,223,981 | |
| | | | | | | | | |
| Industrials (28.08%) | | | | | | | | |
| Ameresco, Inc., Class A(a)(b) | | | 206,351 | | | | 13,520,118 | |
| Array Technologies, Inc.(a) | | | 929,905 | | | | 19,472,211 | |
| Ballard Power Systems, Inc.(a)(b) | | | 1,548,922 | | | | 9,448,424 | |
| Blink Charging Co.(a)(b) | | | 289,002 | | | | 4,011,348 | |
| ChargePoint Holdings, Inc.(a)(b) | | | 1,667,499 | | | | 20,710,337 | |
| Fluence Energy, Inc.(a)(b) | | | 242,155 | | | | 4,160,223 | |
| Hyliion Holdings Corp.(a)(b) | | | 812,983 | | | | 2,455,209 | |
| Li-Cycle Holdings Corp.(a)(b) | | | 778,829 | | | | 4,961,141 | |
| Lion Electric Co.(a)(b) | | | 591,456 | | | | 1,644,248 | |
| Microvast Holdings, Inc.(a) | | | 957,177 | | | | 2,096,218 | |
| Nikola Corp.(a)(b) | | | 1,702,543 | | | | 4,460,663 | |
| Plug Power, Inc.(a)(b) | | | 1,499,999 | | | | 23,939,984 | |
| Proterra, Inc.(a)(b) | | | 1,334,156 | | | | 7,391,224 | |
| Shoals Technologies Group, Inc., Class A(a) | | | 400,138 | | | | 11,591,998 | |
| Stem, Inc.(a)(b) | | | 950,428 | | | | 12,422,094 | |
| SunPower Corp.(a)(b) | | | 554,385 | | | | 13,443,836 | |
| Sunrun, Inc.(a) | | | 1,235,526 | | | | 40,253,437 | |
| TPI Composites, Inc.(a) | | | 234,150 | | | | 2,828,532 | |
| Total Industrials | | | | | | | 198,811,245 | |
| | | | | | | | | |
| Information Technology (15.97%) | | | | | | | | |
| Enphase Energy, Inc.(a) | | | 139,061 | | | | 44,581,565 | |
| First Solar, Inc.(a) | | | 307,027 | | | | 52,971,369 | |
| Itron, Inc.(a) | | | 292,234 | | | | 15,541,004 | |
| Total Information Technology | | | | | | | 113,093,938 | |
| Security Description | | Shares | | | Value | |
| Materials (4.60%) | | | | | | | | |
| Livent Corp.(a) | | | 1,162,631 | | | $ | 32,542,042 | |
| | | | | | | | | |
| Utilities (19.24%) | | | | | | | | |
| Altus Power, Inc.(a) | | | 216,834 | | | | 1,550,363 | |
| Boralex, Inc., Class A(b) | | | 666,942 | | | | 18,746,665 | |
| Clearway Energy, Inc., Class C | | | 532,025 | | | | 18,854,966 | |
| Innergex Renewable Energy, Inc.(b) | | | 1,005,071 | | | | 12,582,534 | |
| Montauk Renewables, Inc.(a)(b) | | | 388,225 | | | | 4,685,876 | |
| Northland Power, Inc. | | | 1,143,467 | | | | 32,387,535 | |
| Ormat Technologies, Inc.(b) | | | 279,240 | | | | 25,251,673 | |
| Sunnova Energy International, Inc.(a)(b) | | | 644,123 | | | | 14,705,328 | |
| TransAlta Renewables, Inc.(b) | | | 695,494 | | | | 7,388,477 | |
| Total Utilities | | | | | | | 136,153,417 | |
| | | | | | | | | |
| TOTAL COMMON STOCKS | | | | | | | | |
| (Cost $728,185,609) | | | | | | | 627,283,693 | |
| Security Description | | Shares | | | Value | |
| MASTER LIMITED PARTNERSHIPS (11.23%) | | | | | | | | |
| Energy (1.62%) | | | | | | | | |
| Enviva, Inc.(b) | | | 202,325 | | | | 11,481,944 | |
| | | | | | | | | |
| Utilities (9.61%) | | | | | | | | |
| Brookfield Renewable Partners LP | | | 1,047,446 | | | | 29,566,609 | |
| NextEra Energy Partners LP(b) | | | 477,391 | | | | 38,425,202 | |
| Total Utilities | | | | | | | 67,991,811 | |
| | | | | | | | | |
| TOTAL MASTER LIMITED PARTNERSHIPS | | | | | | | | |
| (Cost $81,873,114) | | | | | | | 79,473,755 | |
| ALPS Clean Energy ETF | |
| Schedule of Investments | November 30, 2022 |
| | | 7 Day Yield | | | Shares | | | Value | |
| SHORT TERM INVESTMENTS (13.81%) | | | | | |
| Money Market Fund (0.06%) | | | | | |
| State Street Institutional Treasury Plus Money Market Fund (Premier Class) | | | | | | | | | | | | |
| (Cost $438,918) | | | 3.69 | % | | | 438,918 | | | $ | 438,918 | |
| | | | | | | | | | | | | |
| Investments Purchased with Collateral from Securities Loaned (13.75%) | | | | | | | | | | | | |
| State Street Navigator Securities Lending Government Money Market Portfolio, 3.86% | | | | | | | | | | | | |
| (Cost $97,315,282) | | | | | | | 97,315,282 | | | | 97,315,282 | |
| TOTAL SHORT TERM INVESTMENTS | | | | | | | | | | | | |
| (Cost $97,754,200) | | | | | | | | | | | 97,754,200 | |
| | | | | | | | | | | | | |
| TOTAL INVESTMENTS (113.65%) | | | | | | | | | | | | |
| (Cost $907,812,923) | | | | | | | | | | $ | 804,511,648 | |
| LIABILITIES IN EXCESS OF OTHER ASSETS (-13.65%) | | | | | | | | | | | (96,600,794 | ) |
| NET ASSETS - 100.00% | | | | | | | | | | $ | 707,910,854 | |
| (a) | Non-income producing security. |
| (b) | Security, or a portion of the security position is currently on loan. The total market value of securities on loan is $162,310,785. |
See Notes to Financial Statements.
| ALPS Disruptive Technologies ETF | |
| Schedule of Investments | November 30, 2022 |
| Security Description | | Shares | | | Value | |
| COMMON STOCKS (99.04%) | | | | | | | | |
| Communication Services (1.36%) | | | | | | | | |
| Netflix, Inc.(a) | | | 5,442 | | | $ | 1,662,694 | |
| | | | | | | | | |
| Consumer Discretionary (3.79%) | | | | | | | | |
| ADT, Inc. | | | 151,699 | | | | 1,416,869 | |
| Garmin, Ltd. | | | 13,795 | | | | 1,282,797 | |
| iRobot Corp.(a) | | | 21,082 | | | | 1,098,161 | |
| Tesla, Inc.(a) | | | 4,275 | | | | 832,343 | |
| Total Consumer Discretionary | | | | | | | 4,630,170 | |
| | | | | | | | | |
| Financials (4.42%) | | | | | | | | |
| American Express Co. | | | 8,101 | | | | 1,276,637 | |
| Kaspi.KZ JSC, GDR(b) | | | 22,163 | | | | 1,682,172 | |
| Moody's Corp. | | | 4,203 | | | | 1,253,628 | |
| S&P Global, Inc. | | | 3,387 | | | | 1,194,934 | |
| Total Financials | | | | | | | 5,407,371 | |
| | | | | | | | | |
| Health Care (12.81%) | | | | | | | | |
| ABIOMED, Inc.(a) | | | 4,500 | | | | 1,700,054 | |
| Align Technology, Inc.(a) | | | 4,847 | | | | 953,211 | |
| Boston Scientific Corp.(a) | | | 29,069 | | | | 1,315,954 | |
| Cutera, Inc.(a)(c) | | | 24,894 | | | | 1,184,457 | |
| Dexcom, Inc.(a) | | | 13,556 | | | | 1,576,292 | |
| DiaSorin SpA(c) | | | 9,274 | | | | 1,225,139 | |
| HealthEquity, Inc.(a) | | | 18,854 | | | | 1,196,852 | |
| Insulet Corp.(a) | | | 4,608 | | | | 1,379,497 | |
| Intuitive Surgical, Inc.(a) | | | 5,788 | | | | 1,565,017 | |
| PROCEPT BioRobotics Corp.(a) | | | 24,908 | | | | 1,068,553 | |
| ResMed, Inc. | | | 5,319 | | | | 1,224,434 | |
| Smith & Nephew PLC, Sponsored ADR | | | 48,096 | | | | 1,275,506 | |
| Total Health Care | | | | | | | 15,664,966 | |
| | | | | | | | | |
| Industrials (16.46%) | | | | | | | | |
| ABB, Ltd., Sponsored ADR(c) | | | 44,465 | | | | 1,400,203 | |
| AeroVironment, Inc.(a) | | | 12,180 | | | | 1,120,438 | |
| AutoStore Holdings, Ltd.(a)(b)(c)(d) | | | 923,988 | | | | 1,671,039 | |
| Experian PLC | | | 39,942 | | | | 1,398,475 | |
| FANUC Corp. | | | 7,793 | | | | 1,149,283 | |
| Proto Labs, Inc.(a) | | | 32,248 | | | | 855,217 | |
| RELX PLC, Sponsored ADR(c) | | | 47,513 | | | | 1,338,916 | |
| Schneider Electric SE | | | 10,210 | | | | 1,475,965 | |
| Sensata Technologies Holding PLC | | | 30,231 | | | | 1,363,418 | |
| Siemens Gamesa Renewable Energy SA(a) | | | 68,975 | | | | 1,294,116 | |
| Thomson Reuters Corp.(c) | | | 11,134 | | | | 1,311,017 | |
| TransUnion | | | 16,194 | | | | 1,021,518 | |
| Security Description | | Shares | | | Value | |
| Industrials (continued) | | | | | | | | |
| Verisk Analytics, Inc. | | | 6,518 | | | $ | 1,197,422 | |
| Vestas Wind Systems A/S | | | 50,693 | | | | 1,272,866 | |
| Wolters Kluwer NV | | | 12,191 | | | | 1,334,568 | |
| Xinjiang Goldwind Science & Technology Co., Ltd., Class H | | | 844,200 | | | | 906,783 | |
| Total Industrials | | | | | | | 20,111,244 | |
| | | | | | | | | |
| Information Technology (58.38%) | | | | | | | | |
| Adobe, Inc.(a) | | | 3,211 | | | | 1,107,570 | |
| Adyen NV(a)(b)(d) | | | 857 | | | | 1,305,414 | |
| Alarm.com Holdings, Inc.(a) | | | 17,528 | | | | 874,647 | |
| Allegro MicroSystems, Inc.(a) | | | 53,621 | | | | 1,669,758 | |
| ams-OSRAM AG(a) | | | 177,296 | | | | 1,440,103 | |
| ANSYS, Inc.(a) | | | 4,896 | | | | 1,245,053 | |
| Autodesk, Inc.(a) | | | 5,915 | | | | 1,194,534 | |
| Black Knight, Inc.(a) | | | 18,803 | | | | 1,165,598 | |
| Block, Inc., Class A(a) | | | 17,581 | | | | 1,191,464 | |
| Check Point Software Technologies, Ltd.(a) | | | 10,324 | | | | 1,371,337 | |
| Cognex Corp. | | | 27,910 | | | | 1,389,360 | |
| Crowdstrike Holdings, Inc., Class A(a) | | | 6,902 | | | | 812,020 | |
| CyberArk Software, Ltd.(a) | | | 8,531 | | | | 1,271,716 | |
| Dassault Systemes SE | | | 32,060 | | | | 1,170,498 | |
| Datadog, Inc., Class A(a) | | | 12,673 | | | | 960,360 | |
| Dynatrace, Inc.(a) | | | 31,202 | | | | 1,209,078 | |
| FARO Technologies, Inc.(a) | | | 36,652 | | | | 1,096,628 | |
| Fidelity National Information Services, Inc. | | | 13,794 | | | | 1,001,169 | |
| First Solar, Inc.(a) | | | 9,016 | | | | 1,555,530 | |
| Fiserv, Inc.(a) | | | 11,740 | | | | 1,225,187 | |
| FleetCor Technologies, Inc.(a) | | | 5,789 | | | | 1,135,802 | |
| Fortinet, Inc.(a) | | | 23,987 | | | | 1,275,148 | |
| Gen Digital, Inc. | | | 53,071 | | | | 1,218,510 | |
| Global Payments, Inc. | | | 9,424 | | | | 978,023 | |
| GMO Payment Gateway, Inc. | | | 16,600 | | | | 1,461,771 | |
| Guidewire Software, Inc.(a) | | | 18,296 | | | | 1,085,136 | |
| Intuit, Inc. | | | 2,828 | | | | 1,152,665 | |
| Itron, Inc.(a) | | | 25,090 | | | | 1,334,286 | |
| Keyence Corp. | | | 3,309 | | | | 1,369,224 | |
| Mastercard, Inc., Class A | | | 3,771 | | | | 1,343,984 | |
| Materialise NV, ADR(a) | | | 101,053 | | | | 975,161 | |
| Nemetschek SE | | | 21,388 | | | | 1,037,150 | |
| Okta, Inc.(a) | | | 19,800 | | | | 1,055,736 | |
| Omron Corp. | | | 24,300 | | | | 1,239,548 | |
| Pagseguro Digital, Ltd., Class A(a)(c) | | | 84,467 | | | | 889,438 | |
| Palo Alto Networks, Inc.(a) | | | 6,805 | | | | 1,156,170 | |
| PayPal Holdings, Inc.(a) | | | 12,884 | | | | 1,010,234 | |
| ALPS Disruptive Technologies ETF | |
| Schedule of Investments | November 30, 2022 |
| Security Description | | Shares | | | Value | |
| Information Technology (continued) | | | | | | | | |
| PTC, Inc.(a) | | | 10,374 | | | $ | 1,319,676 | |
| Qorvo, Inc.(a) | | | 13,618 | | | | 1,351,587 | |
| Qualys, Inc.(a) | | | 8,063 | | | | 994,329 | |
| Renishaw PLC | | | 31,248 | | | | 1,390,474 | |
| Salesforce, Inc.(a) | | | 7,930 | | | | 1,270,783 | |
| SAP SE, Sponsored ADR | | | 14,535 | | | | 1,611,496 | |
| ServiceNow, Inc.(a) | | | 2,746 | | | | 1,143,160 | |
| Silicon Laboratories, Inc.(a) | | | 9,865 | | | | 1,434,765 | |
| Skyworks Solutions, Inc. | | | 12,434 | | | | 1,188,939 | |
| Snowflake, Inc., Class A(a) | | | 6,886 | | | | 984,009 | |
| SolarEdge Technologies, Inc.(a) | | | 3,936 | | | | 1,176,313 | |
| Splunk, Inc.(a) | | | 13,888 | | | | 1,078,820 | |
| SS&C Technologies Holdings, Inc. | | | 21,910 | | | | 1,177,882 | |
| Stratasys, Ltd.(a) | | | 74,521 | | | | 1,045,530 | |
| Temenos AG | | | 15,303 | | | | 922,789 | |
| Trend Micro, Inc.(c) | | | 21,253 | | | | 1,048,106 | |
| Visa, Inc., Class A | | | 6,170 | | | | 1,338,890 | |
| VMware, Inc., Class A(a) | | | 10,633 | | | | 1,291,802 | |
| Workday, Inc., Class A(a) | | | 7,401 | | | | 1,242,628 | |
| Xero, Ltd.(a) | | | 21,033 | | | | 1,008,465 | |
| Xinyi Solar Holdings, Ltd. | | | 946,000 | | | | 1,091,220 | |
| Zoom Video Communications, Inc., Class A(a) | | | 15,452 | | | | 1,165,544 | |
| Zscaler, Inc.(a) | | | 8,049 | | | | 1,074,139 | |
| Total Information Technology | | | | | | | 71,326,356 | |
| | | | | | | | | |
| Real Estate (1.07%) | | | | | | | | |
| Equinix, Inc. | | | 1,899 | | | | 1,311,544 | |
| | | | | | | | | |
| Utilities (0.75%) | | | | | | | | |
| China Longyuan Power Group Corp., Ltd., Class H | | | 757,000 | | | | 922,633 | |
| | | | | | | | | |
| TOTAL COMMON STOCKS | | | | | | | | |
| (Cost $140,738,263) | | | | | | | 121,036,978 | |
| Security Description | | Shares | | | Value | |
| MASTER LIMITED PARTNERSHIPS (0.76%) | | | | | | | | |
| Utilities (0.76%) | | | | | | | | |
| Brookfield Renewable Partners LP | | | 32,989 | | | | 931,192 | |
| | | | | | | | | |
| TOTAL MASTER LIMITED PARTNERSHIPS | | | | | | | | |
| (Cost $979,249) | | | | | | | 931,192 | |
| | | 7 Day Yield | | | Shares | | | Value | |
| SHORT TERM INVESTMENTS (4.20%) | | | | | |
| Money Market Fund (0.11%) | | | | | |
| State Street Institutional Treasury Plus Money Market Fund (Premier Class) | | | | | | | | | | | | |
| (Cost $138,234) | | | 3.69 | % | | | 138,234 | | | $ | 138,234 | |
| | | | | | | | | | | | | |
| Investments Purchased with Collateral from Securities Loaned (4.09%) | | | | | | | | | | | | |
| State Street Navigator Securities Lending Government Money Market Portfolio, 3.86% | | | | | | | | | | | | |
| (Cost $5,000,014) | | | | | | | 5,000,014 | | | | 5,000,014 | |
| TOTAL SHORT TERM INVESTMENTS | | | | | | | | | | | | |
| (Cost $5,138,248) | | | | | | | | | | | 5,138,248 | |
| | | | | | | | | | | | | |
| TOTAL INVESTMENTS (104.00%) | | | | | | | | | | | | |
| (Cost $146,855,760) | | | | | | | | | | $ | 127,106,418 | |
| LIABILITIES IN EXCESS OF OTHER ASSETS (-4.00%) | | | | | | | | | | | (4,892,834 | ) |
| NET ASSETS - 100.00% | | | | | | | | | | $ | 122,213,584 | |
| (a) | Non-income producing security. |
| (b) | Securities were purchased pursuant to Regulation S under the Securities Act of 1933, which exempts securities offered and sold outside of the United States from registration. Such securities cannot be sold in the United States without either an effective registration statement filed pursuant to the Securities Act of 1933, or pursuant to an exemption from registration. As of November 30, 2022, the market value of those securities was $4,658,625 representing 3.81% of net assets. |
| (c) | Security, or a portion of the security position is currently on loan. The total market value of securities on loan is $5,154,490. |
| (d) | Securities exempt from registration under Rule 144A of the Securities Act of 1933. These securities may be sold in the ordinary course of business in transactions exempt from registration, normally to qualified institutional buyers. At period end, the aggregate market value of those securities was $2,976,453, representing 2.44% of net assets. |
See Notes to Financial Statements.
| ALPS Global Travel Beneficiaries ETF | |
| Schedule of Investments | November 30, 2022 |
| Security Description | | Shares | | | Value | |
| COMMON STOCKS (99.86%) | | | | | | | | |
| Communication Services (3.94%) | | | | | | | | |
| TripAdvisor, Inc.(a) | | | 764 | | | $ | 15,578 | |
| Walt Disney Co.(a) | | | 3,023 | | | | 295,861 | |
| Total Communication Services | | | | | | | 311,439 | |
| | | | | | | | | |
| Consumer Discretionary (43.47%) | | | | | | | | |
| Airbnb, Inc., Class A(a) | | | 2,859 | | | | 292,017 | |
| Booking Holdings, Inc.(a) | | | 176 | | | | 365,983 | |
| Caesars Entertainment, Inc.(a) | | | 1,384 | | | | 70,321 | |
| Choice Hotels International, Inc. | | | 332 | | | | 40,909 | |
| Churchill Downs, Inc. | | | 281 | | | | 62,371 | |
| Dufry AG(a) | | | 515 | | | | 20,801 | |
| Expedia Group, Inc.(a) | | | 1,183 | | | | 126,392 | |
| Flight Centre Travel Group, Ltd.(a) | | | 1,621 | | | | 17,670 | |
| Galaxy Entertainment Group, Ltd. | | | 21,000 | | | | 125,555 | |
| H World Group, Ltd. | | | 13,700 | | | | 54,285 | |
| Hilton Grand Vacations, Inc.(a) | | | 932 | | | | 41,027 | |
| Hilton Worldwide Holdings, Inc. | | | 2,503 | | | | 356,977 | |
| Intercontinental Hotels Group | | | 922 | | | | 53,306 | |
| Las Vegas Sands Corp.(a) | | | 2,256 | | | | 105,671 | |
| LVMH Moet Hennessy Louis Vuitton SE | | | 529 | | | | 405,869 | |
| Marriott International, Inc., Class A | | | 2,130 | | | | 352,195 | |
| Marriott Vacations Worldwide Corp. | | | 331 | | | | 49,312 | |
| MGM Resorts International | | | 2,796 | | | | 103,061 | |
| Moncler SpA | | | 1,184 | | | | 60,434 | |
| Oriental Land Co., Ltd. | | | 1,160 | | | | 165,655 | |
| Penn Entertainment, Inc.(a) | | | 1,248 | | | | 43,917 | |
| Samsonite International SA(a)(b)(c) | | | 17,400 | | | | 46,335 | |
| Sonder Holdings, Inc.(a) | | | 8,486 | | | | 15,020 | |
| Thule Group AB(b)(c) | | | 802 | | | | 18,687 | |
| Tongcheng Travel Holdings, Ltd.(a)(c) | | | 7,600 | | | | 16,230 | |
| Trainline PLC(a)(b)(c) | | | 4,785 | | | | 19,285 | |
| Trip.com Group, Ltd., ADR(a) | | | 6,732 | | | | 215,087 | |
| TUI AG(a) | | | 12,328 | | | | 21,796 | |
| Vacasa, Inc.(a) | | | 4,751 | | | | 7,459 | |
| Vail Resorts, Inc. | | | 367 | | | | 94,517 | |
| WH Smith PLC | | | 1,172 | | | | 19,959 | |
| Security Description | | Shares | | | Value | |
| Consumer Discretionary (continued) | | | | | | | | |
| Wyndham Hotels & Resorts, Inc. | | | 743 | | | $ | 54,477 | |
| Total Consumer Discretionary | | | | | | | 3,442,580 | |
| | | | | | | | | |
| Consumer Staples (12.76%) | | | | | | | | |
| Estee Lauder Cos., Inc., Class A | | | 1,366 | | | | 322,089 | |
| Hormel Foods Corp. | | | 2,325 | | | | 109,275 | |
| L'Oreal SA | | | 996 | | | | 367,730 | |
| Premium Brands Holdings Corp. | | | 255 | | | | 16,081 | |
| Shiseido Co., Ltd. | | | 4,670 | | | | 196,114 | |
| Total Consumer Staples | | | | | | | 1,011,289 | |
| | | | | | | | | |
| Financials (4.41%) | | | | | | | | |
| American Express Co. | | | 2,216 | | | | 349,219 | |
| | | | | | | | | |
| Industrials (27.99%) | | | | | | | | |
| Aena SME SA(a)(b)(c) | | | 418 | | | | 53,632 | |
| Air China, Ltd., Class H(a)(d) | | | 21,000 | | | | 16,669 | |
| Airports of Thailand PCL(a) | | | 13,800 | | | | 29,349 | |
| Alaska Air Group, Inc.(a) | | | 1,326 | | | | 62,905 | |
| American Airlines Group, Inc.(a) | | | 3,927 | | | | 56,667 | |
| ANA Holdings, Inc.(a) | | | 2,800 | | | | 59,705 | |
| Auckland International Airport, Ltd.(a) | | | 9,647 | | | | 48,876 | |
| Avis Budget Group, Inc.(a) | | | 119 | | | | 26,608 | |
| China Airlines, Ltd. | | | 81,000 | | | | 47,438 | |
| China Southern Airlines Co., Ltd., Class H(a)(d) | | | 38,000 | | | | 22,476 | |
| Cintas Corp. | | | 760 | | | | 350,953 | |
| Dassault Aviation SA | | | 144 | | | | 22,657 | |
| Delta Air Lines, Inc.(a) | | | 5,030 | | | | 177,911 | |
| Deutsche Lufthansa AG(a) | | | 3,054 | | | | 24,334 | |
| Elis SA | | | 1,512 | | | | 19,667 | |
| Eva Airways Corp. | | | 68,000 | | | | 61,497 | |
| Flughafen Zurich AG(a) | | | 116 | | | | 19,124 | |
| Grab Holdings, Ltd.(a) | | | 13,445 | | | | 40,604 | |
| Grupo Aeroportuario del Pacifico SAB de CV, ADR | | | 392 | | | | 63,719 | |
| Grupo Aeroportuario del | | | | | | | | |
| Sureste SAB de CV, Class B | | | 2,030 | | | | 50,222 | |
| Hertz Global Holdings, Inc.(a) | | | 993 | | | | 17,080 | |
| Korean Air Lines Co., Ltd.(a) | | | 4,043 | | | | 78,018 | |
| Localiza Rent a Car SA | | | 4,935 | | | | 57,155 | |
| Lyft, Inc., Class A(a) | | | 1,094 | | | | 12,275 | |
| Qantas Airways, Ltd.(a) | | | 23,275 | | | | 98,579 | |
| Ryanair Holdings PLC, ADR(a) | | | 275 | | | | 20,815 | |
| Sixt SE | | | 195 | | | | 18,658 | |
| Southwest Airlines Co.(a) | | | 5,686 | | | | 226,928 | |
| ALPS Global Travel Beneficiaries ETF | |
| Schedule of Investments | November 30, 2022 |
| Security Description | | Shares | | | Value | |
| Industrials (continued) | | | | | | | | |
| Swvl Holdings Corp.(a) | | | 12,257 | | | $ | 4,535 | |
| Textron, Inc. | | | 1,641 | | | | 117,135 | |
| Uber Technologies, Inc.(a) | | | 7,273 | | | | 211,935 | |
| United Airlines Holdings, Inc.(a) | | | 2,241 | | | | 98,985 | |
| Total Industrials | | | | | | | 2,217,111 | |
| | | | | | | | | |
| Information Technology (3.98%) | | | | | | | | |
| Agilysys, Inc.(a) | | | 382 | | | | 25,365 | |
| Amadeus IT Group SA(a) | | | 4,303 | | | | 229,528 | |
| Euronet Worldwide, Inc.(a) | | | 457 | | | | 42,478 | |
| Sabre Corp.(a) | | | 2,864 | | | | 17,499 | |
| Total Information Technology | | | | | | | 314,870 | |
| | | | | | | | | |
| Real Estate (3.31%) | | | | | | | | |
| Gaming and Leisure | | | | | | | | |
| Properties, Inc. | | | 2,634 | | | | 138,575 | |
| Host Hotels & Resorts, Inc. | | | 6,543 | | | | 123,924 | |
| Total Real Estate | | | | | | | 262,499 | |
| | | | | | | | | |
| TOTAL COMMON STOCKS | | | | | | | | |
| (Cost $8,626,832) | | | | | | | 7,909,007 | |
| | | 7 Day Yield | | | Shares | | | Value | |
| SHORT TERM INVESTMENTS (0.59%) | | | | | |
| Money Market Fund (0.14%) | | | | | |
| State Street Institutional Treasury Plus Money Market Fund (Premier Class) | | | | | | | | | | | | |
| (Cost $11,318) | | | 3.69 | % | | | 11,318 | | | | 11,318 | |
| | | | | | | | | | | | | |
| Investments Purchased with Collateral from Securities Loaned (0.45%) | | | | | | | | | | | | |
| State Street Navigator Securities Lending Government Money Market Portfolio, 3.86% | | | | | | | | | | | | |
| (Cost $35,640) | | | | | | | 35,640 | | | | 35,640 | |
| TOTAL SHORT TERM INVESTMENTS | | | | | | | | | | | | |
| (Cost $46,958) | | | | | | | | | | | 46,958 | |
| | | | | | | | | | | | | |
| TOTAL INVESTMENTS (100.45%) | | | | | | | | | | | | |
| (Cost $8,673,790) | | | | | | | | | | $ | 7,955,965 | |
| LIABILITIES IN EXCESS OF OTHER ASSETS (-0.45%) | | | | | | | | | | | (35,251 | ) |
| NET ASSETS - 100.00% | | | | | | | | | | $ | 7,920,714 | |
| (a) | Non-income producing security. |
| (b) | Securities exempt from registration under Rule 144A of the Securities Act of 1933. These securities may be sold in the ordinary course of business in transactions exempt from registration, normally to qualified institutional buyers. At period end, the aggregate market value of those securities was $137,939, representing 1.74% of net assets. |
| (c) | Securities were purchased pursuant to Regulation S under the Securities Act of 1933, which exempts securities offered and sold outside of the United States from registration. Such securities cannot be sold in the United States without either an effective registration statement filed pursuant to the Securities Act of 1933, or pursuant to an exemption from registration. As of November 30, 2022, the market value of those securities was $154,169 representing 1.95% of net assets. |
| (d) | Security, or a portion of the security position is currently on loan. The total market value of securities on loan is $35,256. |
See Notes to Financial Statements.
| ALPS Medical Breakthroughs ETF | |
| Schedule of Investments | November 30, 2022 |
| Security Description | | Shares | | | Value | |
| COMMON STOCKS (99.95%) | | | | | | | | |
| Biotechnology (98.61%) | | | | | | | | |
| 4D Molecular Therapeutics, Inc.(a)(b) | | | 20,890 | | | $ | 504,911 | |
| Aadi Bioscience, Inc.(a) | | | 13,556 | | | | 181,379 | |
| ACADIA Pharmaceuticals, Inc.(a) | | | 104,428 | | | | 1,626,988 | |
| Adaptimmune Therapeutics PLC, ADR(a)(b) | | | 104,441 | | | | 226,637 | |
| ADC Therapeutics SA(a) | | | 45,643 | | | | 167,053 | |
| Adicet Bio, Inc.(a)(b) | | | 25,834 | | | | 469,662 | |
| Affimed NV(a)(b) | | | 94,167 | | | | 201,517 | |
| Agenus, Inc.(a)(b) | | | 182,707 | | | | 493,309 | |
| Agios Pharmaceuticals, Inc.(a) | | | 35,371 | | | | 1,066,082 | |
| Akero Therapeutics, Inc.(a) | | | 24,243 | | | | 1,127,300 | |
| Albireo Pharma, Inc.(a)(b) | | | 12,654 | | | | 279,400 | |
| Aldeyra Therapeutics, Inc.(a) | | | 37,629 | | | | 210,722 | |
| Alector, Inc.(a) | | | 53,279 | | | | 452,339 | |
| Alkermes PLC(a) | | | 105,978 | | | | 2,626,135 | |
| Allogene Therapeutics, Inc.(a)(b) | | | 92,794 | | | | 914,949 | |
| Allovir, Inc.(a)(b) | | | 60,054 | | | | 451,006 | |
| Altimmune, Inc.(a) | | | 31,629 | | | | 314,709 | |
| ALX Oncology Holdings, Inc.(a) | | | 26,293 | | | | 291,852 | |
| Amarin Corp. PLC, ADR(a)(b) | | | 260,034 | | | | 299,039 | |
| Amicus Therapeutics, Inc.(a) | | | 180,987 | | | | 2,189,943 | |
| AnaptysBio, Inc.(a)(b) | | | 18,218 | | | | 503,363 | |
| Anavex Life Sciences Corp.(a)(b) | | | 50,287 | | | | 443,531 | |
| Arbutus Biopharma Corp.(a)(b) | | | 96,758 | | | | 227,381 | |
| Arcturus Therapeutics Holdings, Inc.(a) | | | 17,153 | | | | 316,301 | |
| Arcus Biosciences, Inc.(a) | | | 46,562 | | | | 1,637,586 | |
| Arcutis Biotherapeutics, Inc.(a) | | | 38,827 | | | | 668,989 | |
| Arrowhead Pharmaceuticals, Inc.(a) | | | 68,296 | | | | 2,199,131 | |
| Ascendis Pharma A/S, ADR(a) | | | 36,006 | | | | 4,430,899 | |
| Aurinia Pharmaceuticals, Inc.(a) | | | 91,548 | | | | 469,641 | |
| Autolus Therapeutics PLC, ADR(a)(b) | | | 58,651 | | | | 154,839 | |
| Avidity Biosciences, Inc.(a) | | | 33,632 | | | | 391,476 | |
| BELLUS Health, Inc.(a) | | | 80,766 | | | | 797,160 | |
| Bicycle Therapeutics PLC, ADR(a)(b) | | | 19,141 | | | | 554,323 | |
| BioCryst Pharmaceuticals, Inc.(a)(b) | | | 119,982 | | | | 1,602,959 | |
| Bioxcel Therapeutics, Inc.(a)(b) | | | 18,079 | | | | 299,569 | |
| C4 Therapeutics, Inc.(a) | | | 31,561 | | | | 270,478 | |
| Catalyst Pharmaceuticals, Inc.(a) | | | 66,309 | | | | 1,112,002 | |
| Celldex Therapeutics, Inc.(a) | | | 30,168 | | | | 1,118,931 | |
| Centessa Pharmaceuticals PLC, ADR(a)(b) | | | 60,862 | | | | 243,448 | |
| Security Description | | Shares | | | Value | |
| Biotechnology (continued) | | | | | | | | |
| Cerevel Therapeutics Holdings, Inc.(a)(b) | | | 100,494 | | | $ | 2,910,307 | |
| Chinook Therapeutics, Inc.(a) | | | 61,279 | | | | 919,114 | |
| Cogent Biosciences, Inc.(a) | | | 42,430 | | | | 533,769 | |
| Compass Pathways PLC, ADR(a)(b) | | | 27,440 | | | | 282,632 | |
| Concert Pharmaceuticals, Inc.(a) | | | 30,939 | | | | 149,126 | |
| Crinetics Pharmaceuticals, Inc.(a) | | | 34,682 | | | | 619,767 | |
| CRISPR Therapeutics AG(a)(b) | | | 50,340 | | | | 2,758,128 | |
| Cullinan Oncology, Inc.(a) | | | 29,426 | | | | 365,765 | |
| Cytokinetics, Inc.(a)(b) | | | 60,752 | | | | 2,581,960 | |
| Day One Biopharmaceuticals, Inc.(a) | | | 47,403 | | | | 1,006,366 | |
| Denali Therapeutics, Inc.(a) | | | 79,591 | | | | 2,539,749 | |
| Eagle Pharmaceuticals, Inc.(a) | | | 8,567 | | | | 311,153 | |
| Editas Medicine, Inc.(a)(b) | | | 44,351 | | | | 470,121 | |
| Emergent BioSolutions, Inc.(a) | | | 32,170 | | | | 395,691 | |
| Enanta Pharmaceuticals, Inc.(a) | | | 13,371 | | | | 585,516 | |
| EQRx, Inc.(a) | | | 289,153 | | | | 1,087,215 | |
| Erasca, Inc.(a) | | | 78,818 | | | | 595,076 | |
| Essa Pharma, Inc.(a)(b) | | | 28,447 | | | | 104,969 | |
| Fate Therapeutics, Inc.(a)(b) | | | 62,586 | | | | 1,303,041 | |
| FibroGen, Inc.(a) | | | 60,490 | | | | 869,241 | |
| Galapagos NV, Sponsored ADR(a)(b) | | | 42,841 | | | | 1,703,787 | |
| HilleVax, Inc.(a) | | | 21,569 | | | | 431,380 | |
| Icosavax, Inc.(a)(b) | | | 25,731 | | | | 85,942 | |
| Ideaya Biosciences, Inc.(a) | | | 25,367 | | | | 453,562 | |
| I-Mab, ADR(a) | | | 53,325 | | | | 197,303 | |
| Imago Biosciences, Inc.(a)(b) | | | 21,766 | | | | 776,829 | |
| Immunocore Holdings PLC, ADR(a) | | | 28,306 | | | | 1,777,900 | |
| ImmunoGen, Inc.(a) | | | 142,407 | | | | 739,092 | |
| Immunovant, Inc.(a) | | | 75,219 | | | | 986,121 | |
| Instil Bio, Inc.(a)(b) | | | 83,688 | | | | 111,305 | |
| Intellia Therapeutics, Inc.(a) | | | 49,045 | | | | 2,523,856 | |
| Intercept Pharmaceuticals, Inc.(a) | | | 19,230 | | | | 286,719 | |
| Invivyd, Inc.(a) | | | 70,218 | | | | 158,693 | |
| Ionis Pharmaceuticals, Inc.(a) | | | 91,576 | | | | 3,735,386 | |
| Iovance Biotherapeutics, Inc.(a) | | | 101,816 | | | | 651,622 | |
| Ironwood Pharmaceuticals, Inc.(a) | | | 98,866 | | | | 1,197,267 | |
| iTeos Therapeutics, Inc.(a) | | | 22,951 | | | | 462,463 | |
| IVERIC bio, Inc.(a) | | | 76,195 | | | | 1,799,726 | |
| Jounce Therapeutics, Inc.(a) | | | 33,354 | | | | 29,352 | |
| KalVista Pharmaceuticals, Inc.(a)(b) | | | 15,856 | | | | 85,464 | |
| ALPS Medical Breakthroughs ETF | |
| Schedule of Investments | November 30, 2022 |
| Security Description | | Shares | | | Value | |
| Biotechnology (continued) | | | | | | | | |
| Karuna Therapeutics, Inc.(a) | | | 21,578 | | | $ | 5,077,520 | |
| Keros Therapeutics, Inc.(a)(b) | | | 16,615 | | | | 828,092 | |
| Kezar Life Sciences, Inc.(a) | | | 44,110 | | | | 344,499 | |
| Kodiak Sciences, Inc.(a) | | | 33,587 | | | | 247,872 | |
| Kronos Bio, Inc.(a) | | | 36,623 | | | | 69,584 | |
| Krystal Biotech, Inc.(a) | | | 16,564 | | | | 1,287,685 | |
| Kura Oncology, Inc.(a) | | | 43,166 | | | | 680,728 | |
| LianBio, ADR(a)(b) | | | 69,098 | | | | 108,484 | |
| MannKind Corp.(a)(b) | | | 166,037 | | | | 777,053 | |
| Merus NV(a)(b) | | | 29,607 | | | | 454,467 | |
| MiMedx Group, Inc.(a) | | | 73,301 | | | | 238,228 | |
| Mirati Therapeutics, Inc.(a) | | | 35,878 | | | | 3,278,533 | |
| MoonLake Immunotherapeutics(a) | | | 23,821 | | | | 229,396 | |
| Novavax, Inc.(a)(b) | | | 50,470 | | | | 832,250 | |
| Nuvalent, Inc.(a) | | | 27,733 | | | | 911,861 | |
| Ocugen, Inc.(a) | | | 139,730 | | | | 217,979 | |
| Organogenesis Holdings, Inc.(a) | | | 84,456 | | | | 231,409 | |
| PMV Pharmaceuticals, Inc.(a)(b) | | | 29,433 | | | | 293,741 | |
| Point Biopharma Global, Inc.(a) | | | 58,154 | | | | 396,029 | |
| Prometheus Biosciences, Inc.(a) | | | 26,397 | | | | 1,085,181 | |
| Protagonist Therapeutics, Inc.(a) | | | 31,678 | | | | 250,573 | |
| Prothena Corp. PLC(a) | | | 30,276 | | | | 1,892,553 | |
| PTC Therapeutics, Inc.(a) | | | 46,154 | | | | 1,914,929 | |
| Rallybio Corp.(a) | | | 20,732 | | | | 119,416 | |
| RAPT Therapeutics, Inc.(a) | | | 19,133 | | | | 338,271 | |
| Recursion Pharmaceuticals, Inc.(a)(b) | | | 106,546 | | | | 1,001,532 | |
| REGENXBIO, Inc.(a) | | | 27,897 | | | | 666,738 | |
| Repare Therapeutics, Inc.(a)(b) | | | 27,058 | | | | 433,740 | |
| Replimune Group, Inc.(a) | | | 31,820 | | | | 651,355 | |
| Rigel Pharmaceuticals, Inc.(a) | | | 111,517 | | | | 74,895 | |
| Rocket Pharmaceuticals, Inc.(a) | | | 42,610 | | | | 804,477 | |
| Sage Therapeutics, Inc.(a) | | | 38,342 | | | | 1,573,556 | |
| Seres Therapeutics, Inc.(a)(b) | | | 80,055 | | | | 520,358 | |
| SpringWorks Therapeutics, Inc.(a)(b) | | | 31,897 | | | | 771,269 | |
| Stoke Therapeutics, Inc.(a) | | | 25,433 | | | | 191,765 | |
| Syndax Pharmaceuticals, Inc.(a) | | | 36,488 | | | | 874,252 | |
| Tango Therapeutics, Inc.(a) | | | 56,814 | | | | 426,673 | |
| Travere Therapeutics, Inc.(a) | | | 41,269 | | | | 830,745 | |
| uniQure NV(a)(b) | | | 30,149 | | | | 797,743 | |
| Vanda Pharmaceuticals, Inc.(a) | | | 36,446 | | | | 397,626 | |
| Vaxart, Inc.(a)(b) | | | 81,630 | | | | 96,323 | |
| Vaxcyte, Inc.(a) | | | 38,275 | | | | 1,762,947 | |
| VBI Vaccines, Inc.(a)(b) | | | 166,629 | | | | 86,647 | |
| Vera Therapeutics, Inc.(a)(b) | | | 17,453 | | | | 291,465 | |
| Vericel Corp.(a) | | | 30,435 | | | | 694,831 | |
| Vir Biotechnology, Inc.(a) | | | 85,587 | | | | 2,415,265 | |
| Security Description | | Shares | | | Value | |
| Biotechnology (continued) | | | | | | | | |
| Viridian Therapeutics, Inc.(a) | | | 24,631 | | | $ | 622,425 | |
| Xencor, Inc.(a) | | | 38,514 | | | | 1,144,636 | |
| Xenon Pharmaceuticals, Inc.(a) | | | 40,172 | | | | 1,481,543 | |
| Zai Lab, Ltd., ADR(a) | | | 66,684 | | | | 2,571,335 | |
| Total Biotechnology | | | | | | | 113,409,888 | |
| | | | | | | | | |
| Health Care Providers & Services (0.65%) | | | | | | | | |
| OPKO Health, Inc.(a)(b) | | | 498,088 | | | | 747,132 | |
| | | | | | | | | |
| Pharmaceuticals (0.69%) | | | | | | | | |
| Ligand Pharmaceuticals, Inc.(a) | | | 10,893 | | | | 794,100 | |
| | | | | | | | | |
| TOTAL COMMON STOCKS | | | | | | | | |
| (Cost $127,157,082) | | | | | | | 114,951,120 | |
| | | 7 Day Yield | | | Shares | | | Value | |
| SHORT TERM INVESTMENTS (6.46%) | | | | | |
| Money Market Fund (0.08%) | | | | | |
| State Street Institutional Treasury Plus Money Market Fund (Premier Class) | | | | | | | | | | | | |
| (Cost $95,179) | | | 3.69 | % | | | 95,179 | | | | 95,179 | |
| | | | | | | | | | | | | |
| Investments Purchased with Collateral from Securities Loaned (6.38%) | | | | | | | | | | | | |
| State Street Navigator Securities Lending Government Money Market Portfolio, 3.86% | | | | | | | | | | | | |
| (Cost $7,329,078) | | | | | | | 7,329,078 | | | | 7,329,078 | |
| TOTAL SHORT TERM INVESTMENTS | | | | | | | | | | | | |
| (Cost $7,424,257) | | | | | | | | | | | 7,424,257 | |
| | | | | | | | | | | | | |
| TOTAL INVESTMENTS (106.41%) | | | | | | | | | | | | |
| (Cost $134,581,339) | | | | | | | | | | $ | 122,375,377 | |
| LIABILITIES IN EXCESS OF OTHER ASSETS (-6.41%) | | | | | | | | | | | (7,366,801 | ) |
| NET ASSETS - 100.00% | | | | | | | | | | $ | 115,008,576 | |
| (a) | Non-income producing security. |
| (b) | Security, or a portion of the security position is currently on loan. The total market value of securities on loan is $12,973,826. See Notes to Financial Statements |
| ALPS ETF Trust | |
| Statements of Assets and Liabilities | November 30, 2022 |
| | | ALPS Clean Energy ETF | | | ALPS Disruptive Technologies ETF | | | ALPS Global Travel Beneficiaries ETF | | | ALPS Medical Breakthroughs ETF | |
| ASSETS: | | | | | | | | | | | | | | | | |
| Investments, at value(a) | | $ | 804,511,648 | | | $ | 127,106,418 | | | $ | 7,955,965 | | | $ | 122,375,377 | |
| Foreign Currency, at value (Cost $34,097, $30, $– and $–) | | | 34,097 | | | | 32 | | | | – | | | | – | |
| Dividends receivable | | | 992,836 | | | | 155,844 | | | | 4,467 | | | | 4,922 | |
| Due from Authorized Participant | | | 3,444,433 | | | | – | | | | – | | | | – | |
| Receivable for shares sold | | | – | | | | – | | | | – | | | | 2,347,114 | |
| Total Assets | | | 808,983,014 | | | | 127,262,294 | | | | 7,960,432 | | | | 124,727,413 | |
| | | | | | | | | | | | | | | | | |
| LIABILITIES: | | | | | | | | | | | | | | | | |
| Payable to adviser | | | 312,209 | | | | 48,696 | | | | 4,078 | | | | 42,479 | |
| Payable for investments purchased | | | 3,444,669 | | | | – | | | | – | | | | 2,347,280 | |
| Payable for collateral upon return of securities loaned | | | 97,315,282 | | | | 5,000,014 | | | | 35,640 | | | | 7,329,078 | |
| Total Liabilities | | | 101,072,160 | | | | 5,048,710 | | | | 39,718 | | | | 9,718,837 | |
| NET ASSETS | | $ | 707,910,854 | | | $ | 122,213,584 | | | $ | 7,920,714 | | | $ | 115,008,576 | |
| | | | | | | | | | | | | | | | | |
| NET ASSETS CONSIST OF: | | | | | | | | | | | | | | | | |
| Paid-in capital | | $ | 928,666,797 | | | $ | 159,327,519 | | | $ | 9,487,310 | | | $ | 260,687,365 | |
| Total distributable earnings/(accumulated losses) | | | (220,755,943 | ) | | | (37,113,935 | ) | | | (1,566,596 | ) | | | (145,678,789 | ) |
| NET ASSETS | | $ | 707,910,854 | | | $ | 122,213,584 | | | $ | 7,920,714 | | | $ | 115,008,576 | |
| | | | | | | | | | | | | | | | | |
| INVESTMENTS, AT COST | | $ | 907,812,923 | | | $ | 146,855,760 | | | $ | 8,673,790 | | | $ | 134,581,339 | |
| | | | | | | | | | | | | | | | | |
| PRICING OF SHARES | | | | | | | | | | | | | | | | |
| Net Assets | | $ | 707,910,854 | | | $ | 122,213,584 | | | $ | 7,920,714 | | | $ | 115,008,576 | |
| Shares of beneficial interest outstanding (Unlimited number of shares authorized, par value $0.01 per share) | | | 12,700,002 | | | | 3,500,002 | | | | 375,002 | | | | 3,675,000 | |
| Net Asset Value, offering and redemption price per share | | $ | 55.74 | | | $ | 34.92 | | | $ | 21.12 | | | $ | 31.29 | |
| (a) | Includes $162,310,785, $5,154,490, $35,256 and $12,973,826 of securities on loan. |
See Notes to Financial Statements.
| ALPS ETF Trust | |
| Statements of Operations | For the Year Ended November 30, 2022 |
| | | ALPS Clean Energy ETF | | | ALPS Disruptive Technologies ETF | | | ALPS Global Travel Beneficiaries ETF | | | ALPS Medical Breakthroughs ETF | |
| INVESTMENT INCOME: | | | | | | | | | | | | | | | | |
| Dividends* | | $ | 5,315,090 | | | $ | 695,505 | | | $ | 39,436 | | | $ | 715 | |
| Securities Lending Income | | | 3,851,234 | | | | 23,421 | | | | 1,544 | | | | 128,789 | |
| Total Investment Income | | | 9,166,324 | | | | 718,926 | | | | 40,980 | | | | 129,504 | |
| | | | | | | | | | | | | | | | | |
| EXPENSES: | | | | | | | | | | | | | | | | |
| Investment adviser fees | | | 4,050,594 | | | | 793,281 | | | | 57,189 | | | | 610,816 | |
| Total Expenses | | | 4,050,594 | | | | 793,281 | | | | 57,189 | | | | 610,816 | |
| NET INVESTMENT INCOME/(LOSS) | | | 5,115,730 | | | | (74,355 | ) | | | (16,209 | ) | | | (481,312 | ) |
| | | | | | | | | | | | | | | | | |
| REALIZED AND UNREALIZED GAIN/LOSS | | | | | | | | | | | | | | | | |
| Net realized gain/(loss) on investments(a) | | | (19,724,263 | ) | | | 4,744,055 | | | | (512,883 | ) | | | (64,609,014 | ) |
| Net realized gain/(loss) on foreign currency transactions | | | (50,285 | ) | | | 44,186 | | | | (960 | ) | | | – | |
| Total net realized gain/(loss) | | | (19,774,548 | ) | | | 4,788,241 | | | | (513,843 | ) | | | (64,609,014 | ) |
| Net change in unrealized appreciation/(depreciation) on investments | | | (235,887,640 | ) | | | (64,941,945 | ) | | | (342,636 | ) | | | 14,490,450 | |
| Net change in unrealized appreciation/(depreciation) on translation of assets and liabilities denominated in foreign currencies | | | 4,374 | | | | 2,289 | | | | (22 | ) | | | – | |
| Total net change in unrealized appreciation/(depreciation) | | | (235,883,266 | ) | | | (64,939,656 | ) | | | (342,658 | ) | | | 14,490,450 | |
| NET REALIZED AND UNREALIZED LOSS ON INVESTMENTS | | | (255,657,814 | ) | | | (60,151,415 | ) | | | (856,501 | ) | | | (50,118,564 | ) |
| NET DECREASE IN NET ASSETS RESULTING FROM OPERATIONS | | $ | (250,542,084 | ) | | $ | (60,225,770 | ) | | $ | (872,710 | ) | | $ | (50,599,876 | ) |
| *Net of foreign tax withholding. | | $ | 467,857 | | | $ | 66,068 | | | $ | 2,410 | | | $ | – | |
| (a) | Includes realized gain or loss as a result of in-kind transactions (See Note 4 in Notes to Financial Statements). |
See Notes to Financial Statements.
| ALPS Clean Energy ETF |
| Statements of Changes in Net Assets |
| | | For the Year Ended November 30, 2022 | | | For the Year Ended November 30, 2021 | |
| OPERATIONS: | | | | | | | | |
| Net investment income | | $ | 5,115,730 | | | $ | 2,492,485 | |
| Net realized gain/(loss) | | | (19,774,548 | ) | | | 85,403,452 | |
| Net change in unrealized depreciation | | | (235,883,266 | ) | | | (103,058,310 | ) |
| Net decrease in net assets resulting from operations | | | (250,542,084 | ) | | | (15,162,373 | ) |
| | | | | | | | | |
| DISTRIBUTIONS TO SHAREHOLDERS: | | | | | | | | |
| From distributable earnings | | | (2,463,315 | ) | | | (2,023,844 | ) |
| From tax return of capital | | | (3,378,816 | ) | | | (3,160,255 | ) |
| Total distributions | | | (5,842,131 | ) | | | (5,184,099 | ) |
| | | | | | | | | |
| CAPITAL SHARE TRANSACTIONS: | | | | | | | | |
| Proceeds from sale of shares | | | 203,438,962 | | | | 667,197,824 | |
| Cost of shares redeemed | | | (253,910,852 | ) | | | (241,541,495 | ) |
| Net increase/(decrease) from capital share transactions | | | (50,471,890 | ) | | | 425,656,329 | |
| Net increase/(decrease) in net assets | | | (306,856,105 | ) | | | 405,309,857 | |
| | | | | | | | | |
| NET ASSETS: | | | | | | | | |
| Beginning of year | | | 1,014,766,959 | | | | 609,457,102 | |
| End of year | | $ | 707,910,854 | | | $ | 1,014,766,959 | |
| | | | | | | | | |
| OTHER INFORMATION: | | | | | | | | |
| CAPITAL SHARE TRANSACTIONS: | | | | | | | | |
| Beginning shares | | | 13,725,002 | | | | 8,700,002 | |
| Shares sold | | | 3,625,000 | | | | 8,400,000 | |
| Shares redeemed | | | (4,650,000 | ) | | | (3,375,000 | ) |
| Shares outstanding, end of year | | | 12,700,002 | | | | 13,725,002 | |
See Notes to Financial Statements.
| ALPS Disruptive Technologies ETF |
| Statements of Changes in Net Assets |
| | | For the Year Ended November 30, 2022 | | | For the Year Ended November 30, 2021 | |
| OPERATIONS: | | | | | | | | |
| Net investment income/(loss) | | $ | (74,355 | ) | | $ | 676,422 | |
| Net realized gain | | | 4,788,241 | | | | 14,565,809 | |
| Net change in unrealized appreciation/(depreciation) | | | (64,939,656 | ) | | | 5,497,585 | |
| Net increase/(decrease) in net assets resulting from operations | | | (60,225,770 | ) | | | 20,739,816 | |
| | | | | | | | | |
| DISTRIBUTIONS TO SHAREHOLDERS: | | | | | | | | |
| From distributable earnings | | | (621,900 | ) | | | (633,863 | ) |
| Total distributions | | | (621,900 | ) | | | (633,863 | ) |
| | | | | | | | | |
| CAPITAL SHARE TRANSACTIONS: | | | | | | | | |
| Proceeds from sale of shares | | | 14,781,795 | | | | 100,271,458 | |
| Cost of shares redeemed | | | (69,266,142 | ) | | | (33,290,851 | ) |
| Net increase/(decrease) from capital share transactions | | | (54,484,347 | ) | | | 66,980,607 | |
| Net increase/(decrease) in net assets | | | (115,332,017 | ) | | | 87,086,560 | |
| | | | | | | | | |
| NET ASSETS: | | | | | | | | |
| Beginning of year | | | 237,545,601 | | | | 150,459,041 | |
| End of year | | $ | 122,213,584 | | | $ | 237,545,601 | |
| | | | | | | | | |
| OTHER INFORMATION: | | | | | | | | |
| CAPITAL SHARE TRANSACTIONS: | | | | | | | | |
| Beginning shares | | | 4,925,002 | | | | 3,500,002 | |
| Shares sold | | | 325,000 | | | | 2,125,000 | |
| Shares redeemed | | | (1,750,000 | ) | | | (700,000 | ) |
| Shares outstanding, end of year | | | 3,500,002 | | | | 4,925,002 | |
See Notes to Financial Statements.
| ALPS Global Travel Beneficiaries ETF |
| Statements of Changes in Net Assets |
| | | For the Year Ended November 30, 2022 | | | For the Period September 8, 2021 (Commencement of Operations) to November 30, 2021 | |
| OPERATIONS: | | | | | | | | |
| Net investment income/(loss) | | $ | (16,209 | ) | | $ | 12,482 | |
| Net realized loss | | | (513,843 | ) | | | (19,713 | ) |
| Net change in unrealized depreciation | | | (342,658 | ) | | | (375,185 | ) |
| Net decrease in net assets resulting from operations | | | (872,710 | ) | | | (382,416 | ) |
| | | | | | | | | |
| DISTRIBUTIONS: | | | | | | | | |
| From distributable earnings | | | (12,194 | ) | | | – | |
| Total distributions | | | (12,194 | ) | | | – | |
| CAPITAL SHARE TRANSACTIONS: | | | | | | | | |
| Proceeds from sale of shares | | | 9,593,771 | | | | 8,047,426 | |
| Cost of shares redeemed | | | (8,453,163 | ) | | | – | |
| Net increase from capital share transactions | | | 1,140,608 | | | | 8,047,426 | |
| Net increase in net assets | | | 255,704 | | | | 7,665,010 | |
| | | | | | | | | |
| NET ASSETS: | | | | | | | | |
| Beginning of period | | | 7,665,010 | | | | – | |
| End of period | | $ | 7,920,714 | | | $ | 7,665,010 | |
| | | | | | | | | |
| OTHER INFORMATION: | | | | | | | | |
| CAPITAL SHARE TRANSACTIONS: | | | | | | | | |
| Beginning shares | | | 325,002 | | | | – | |
| Shares sold | | | 450,000 | | | | 325,002 | |
| Shares redeemed | | | (400,000 | ) | | | – | |
| Shares outstanding, end of period | | | 375,002 | | | | 325,002 | |
See Notes to Financial Statements.
| ALPS Medical Breakthroughs ETF |
| Statements of Changes in Net Assets |
| | | For the Year Ended November 30, 2022 | | | For the Year Ended November 30, 2021 | |
| OPERATIONS: | | | | | | | | |
| Net investment loss | | $ | (481,312 | ) | | $ | (852,170 | ) |
| Net realized gain/(loss) | | | (64,609,014 | ) | | | 46,250,415 | |
| Net change in unrealized appreciation/(depreciation) | | | 14,490,450 | | | | (77,077,650 | ) |
| Net decrease in net assets resulting from operations | | | (50,599,876 | ) | | | (31,679,405 | ) |
| | | | | | | | | |
| CAPITAL SHARE TRANSACTIONS: | | | | | | | | |
| Proceeds from sale of shares | | | 23,693,301 | | | | 97,970,744 | |
| Cost of shares redeemed | | | (47,014,164 | ) | | | (119,904,054 | ) |
| Net decrease from capital share transactions | | | (23,320,863 | ) | | | (21,933,310 | ) |
| Net decrease in net assets | | | (73,920,739 | ) | | | (53,612,715 | ) |
| | | | | | | | | |
| NET ASSETS: | | | | | | | | |
| Beginning of year | | | 188,929,315 | | | | 242,542,030 | |
| End of year | | $ | 115,008,576 | | | $ | 188,929,315 | |
| | | | | | | | | |
| OTHER INFORMATION: | | | | | | | | |
| CAPITAL SHARE TRANSACTIONS: | | | | | | | | |
| Beginning shares | | | 4,400,000 | | | | 4,950,000 | |
| Shares sold | | | 725,000 | | | | 1,800,000 | |
| Shares redeemed | | | (1,450,000 | ) | | | (2,350,000 | ) |
| Shares outstanding, end of year | | | 3,675,000 | | | | 4,400,000 | |
See Notes to Financial Statements.
| ALPS Clean Energy ETF |
| Financial Highlights | For a Share Outstanding Throughout the Periods Presented |
| | | For the Year Ended November 30, 2022 | | | For the Year Ended November 30, 2021 | | | For the Year Ended November 30, 2020 | | | For the Year Ended November 30, 2019 | | | For the Period June 28, 2018 (Commencement of Operations) to November 30, 2018 | |
| NET ASSET VALUE, BEGINNING OF PERIOD | | $ | 73.94 | | | $ | 70.05 | | | $ | 32.23 | | | $ | 25.03 | | | $ | 24.95 | |
| | | | | | | | | | | | | | | | | | | | | |
| INCOME/(LOSS) FROM INVESTMENT OPERATIONS: | | | | | | | | | | | | | | | | | | | | |
| Net investment income(a) | | | 0.39 | | | | 0.20 | | | | 0.25 | | | | 0.32 | | | | 0.09 | |
| Net realized and unrealized gain/(loss) | | | (18.14 | ) | | | 4.11 | | | | 38.08 | | | | 7.42 | | | | (0.01 | ) |
| Total from investment operations | | | (17.75 | ) | | | 4.31 | | | | 38.33 | | | | 7.74 | | | | 0.08 | |
| | | | | | | | | | | | | | | | | | | | | |
| DISTRIBUTIONS: | | | | | | | | | | | | | | | | | | | | |
| From net investment income | | | (0.19 | ) | | | (0.17 | ) | | | (0.18 | ) | | | (0.23 | ) | | | – | |
| Tax return of capital | | | (0.26 | ) | | | (0.25 | ) | | | (0.33 | ) | | | (0.31 | ) | | | – | |
| Total distributions | | | (0.45 | ) | | | (0.42 | ) | | | (0.51 | ) | | | (0.54 | ) | | | – | |
| | | | | | | | | | | | | | | | | | | | | |
| Net increase/(decrease) in net asset value | | | (18.20 | ) | | | 3.89 | | | | 37.82 | | | | 7.20 | | | | 0.08 | |
| NET ASSET VALUE, END OF PERIOD | | $ | 55.74 | | | $ | 73.94 | | | $ | 70.05 | | | $ | 32.23 | | | $ | 25.03 | |
| TOTAL RETURN(b) | | | (24.00 | )% | | | 6.16 | % | | | 120.45 | % | | | 31.28 | % | | | 0.32 | % |
| | | | | | | | | | | | | | | | | | | | | |
| RATIOS/SUPPLEMENTAL DATA: | | | | | | | | | | | | | | | | | | | | |
| Net assets, end of period (000s) | | $ | 707,911 | | | $ | 1,014,767 | | | $ | 609,457 | | | $ | 106,359 | | | $ | 16,271 | |
| | | | | | | | | | | | | | | | | | | | | |
| Ratio of expenses to average net assets | | | 0.55 | % | | | 0.56 | %(c) | | | 0.65 | % | | | 0.65 | % | | | 0.65 | %(d) |
| Ratio of net investment income to average net assets | | | 0.69 | % | | | 0.26 | % | | | 0.57 | % | | | 1.10 | % | | | 0.89 | %(d) |
| Portfolio turnover rate(e) | | | 44 | % | | | 39 | % | | | 34 | % | | | 15 | % | | | 9 | % |
| (a) | Based on average shares outstanding during the period. |
| (b) | Total return is calculated assuming an initial investment made at the net asset value at the beginning of the period and redemption at the net asset value on the last day of the period and assuming all distributions are reinvested at reinvestment prices. Total return calculated for a period of less than one year is not annualized. |
| (c) | Effective January 1, 2021, the Fund's Advisory Fee changed from 0.65% to 0.55%. |
| (e) | Portfolio turnover for periods less than one year are not annualized and does not include securities received or delivered from processing creations or redemptions in-kind. |
See Notes to Financial Statements.
| ALPS Disruptive Technologies ETF |
| Financial Highlights | For a Share Outstanding Throughout the Periods Presented |
| | | For the Year Ended November 30, 2022 | | | For the Year Ended November 30, 2021 | | | For the Year Ended November 30, 2020 | | | For the Year Ended November 30, 2019 | | | For the Period December 28, 2017 (Commencement of Operations) to November 30, 2018 | |
| NET ASSET VALUE, BEGINNING OF PERIOD | | $ | 48.23 | | | $ | 42.99 | | | $ | 31.88 | | | $ | 26.21 | | | $ | 25.08 | |
| | | | | | | | | | | | | | | | | | | | | |
| INCOME/(LOSS) FROM INVESTMENT OPERATIONS: | | | | | | | | | | | | | | | | | | | | |
| Net investment income/(loss)(a) | | | (0.02 | ) | | | 0.15 | | | | 0.25 | | | | 0.14 | | | | 0.13 | |
| Net realized and unrealized gain/(loss) | | | (13.17 | ) | | | 5.26 | | | | 11.00 | | | | 5.61 | | | | 1.00 | (b) |
| Total from investment operations | | | (13.19 | ) | | | 5.41 | | | | 11.25 | | | | 5.75 | | | | 1.13 | |
| | | | | | | | | | | | | | | | | | | | | |
| DISTRIBUTIONS: | | | | | | | | | | | | | | | | | | | | |
| From net investment income | | | (0.12 | ) | | | (0.17 | ) | | | (0.14 | ) | | | (0.08 | ) | | | – | |
| Total distributions | | | (0.12 | ) | | | (0.17 | ) | | | (0.14 | ) | | | (0.08 | ) | | | – | |
| | | | | | | | | | | | | | | | | | | | | |
| Net increase/(decrease) in net asset value | | | (13.31 | ) | | | 5.24 | | | | 11.11 | | | | 5.67 | | | | 1.13 | |
| NET ASSET VALUE, END OF PERIOD | | $ | 34.92 | | | $ | 48.23 | | | $ | 42.99 | | | $ | 31.88 | | | $ | 26.21 | |
| TOTAL RETURN(c) | | | (27.41 | )% | | | 12.60 | % | | | 35.42 | % | | | 22.04 | % | | | 4.47 | % |
| | | | | | | | | | | | | | | | | | | | | |
| RATIOS/SUPPLEMENTAL DATA: | | | | | | | | | | | | | | | | | | | | |
| Net assets, end of period (000s) | | $ | 122,214 | | | $ | 237,546 | | | $ | 150,459 | | | $ | 74,910 | | | $ | 48,483 | |
| | | | | | | | | | | | | | | | | | | | | |
| Ratio of expenses to average net assets | | | 0.50 | % | | | 0.50 | % | | | 0.50 | % | | | 0.50 | % | | | 0.50 | %(d) |
| Ratio of net investment income/(loss) to average net assets | | | (0.05 | )% | | | 0.31 | % | | | 0.72 | % | | | 0.48 | % | | | 0.53 | %(d) |
| Portfolio turnover rate(e) | | | 31 | % | | | 26 | % | | | 38 | % | | | 42 | % | | | 33 | % |
| (a) | Based on average shares outstanding during the period. |
| (b) | Net realized and unrealized gain on investments per share does not correlate to aggregate of the net realized and unrealized loss in the Statements of Operations for the period ended November 30, 2018, primarily due to the timing of the sales and repurchases of the Fund's shares in relation to the fluctuating market values for the Fund's portfolio. |
| (c) | Total return is calculated assuming an initial investment made at the net asset value at the beginning of the period and redemption at the net asset value on the last day of the period and assuming all distributions are reinvested at reinvestment prices. Total return calculated for a period of less than one year is not annualized. |
| (e) | Portfolio turnover for periods less than one year are not annualized and does not include securities received or delivered from processing creations or redemptions in-kind. |
See Notes to Financial Statements.
| ALPS Global Travel Beneficiaries ETF |
| Financial Highlights | For a Share Outstanding Throughout the Periods Presented |
| | | For the Year Ended November 30, 2022 | | | For the Period September 8, 2021 (Commencement of Operations) to November 30, 2021 | |
| NET ASSET VALUE, BEGINNING OF PERIOD | | $ | 23.58 | | | $ | 24.91 | |
| | | | | | | | | |
| INCOME/(LOSS) FROM INVESTMENT OPERATIONS: | | | | | | | | |
| Net investment income/(loss)(a) | | | (0.04 | ) | | | 0.05 | |
| Net realized and unrealized loss | | | (2.39 | ) | | | (1.38 | ) |
| Total from investment operations | | | (2.43 | ) | | | (1.33 | ) |
| | | | | | | | | |
| DISTRIBUTIONS: | | | | | | | | |
| From net investment income | | | (0.03 | ) | | | – | |
| Total distributions | | | (0.03 | ) | | | – | |
| | | | | | | | | |
| Net (decrease) in net asset value | | | (2.46 | ) | | | (1.33 | ) |
| NET ASSET VALUE, END OF PERIOD | | $ | 21.12 | | | $ | 23.58 | |
| TOTAL RETURN(b) | | | (10.27 | )% | | | (5.34 | )% |
| | | | | | | | | |
| RATIOS/SUPPLEMENTAL DATA: | | | | | | | | |
| Net assets, end of period (000s) | | $ | 7,921 | | | $ | 7,665 | |
| | | | | | | | | |
| Ratio of expenses to average net assets | | | 0.65 | % | | | 0.65 | %(c) |
| Ratio of net investment income/(loss) to average net assets | | | (0.18 | )% | | | 0.82 | %(c) |
| Portfolio turnover rate(d) | | | 57 | % | | | 19 | % |
| (a) | Based on average shares outstanding during the period. |
| (b) | Total return is calculated assuming an initial investment made at the net asset value at the beginning of the period and redemption at the net asset value on the last day of the period and assuming all distributions are reinvested at reinvestment prices. Total return calculated for a period of less than one year is not annualized. |
| (d) | Portfolio turnover for periods less than one year are not annualized and does not include securities received or delivered from processing creations or redemptions in-kind. |
See Notes to Financial Statements.
| ALPS Medical Breakthroughs ETF |
| Financial Highlights | For a Share Outstanding Throughout the Periods Presented |
| | | For the Year Ended November 30, 2022 | | | For the Year Ended November 30, 2021 | | | For the Year Ended November 30, 2020 | | | For the Year Ended November 30, 2019 | | | For the Year Ended November 30, 2018 | |
| NET ASSET VALUE, BEGINNING OF PERIOD | | $ | 42.94 | | | $ | 49.00 | | | $ | 39.51 | | | $ | 33.59 | | | $ | 31.70 | |
| | | | | | | | | | | | | | | | | | | | | |
| INCOME/(LOSS) FROM INVESTMENT OPERATIONS: | | | | | | | | | | | | | | | | | | | | |
| Net investment income/(loss)(a) | | | (0.13 | ) | | | (0.18 | ) | | | (0.13 | ) | | | 0.03 | | | | (0.10 | ) |
| Net realized and unrealized gain/(loss) | | | (11.52 | ) | | | (5.88 | ) | | | 9.64 | | | | 6.67 | | | | 2.57 | (b) |
| Total from investment operations | | | (11.65 | ) | | | (6.06 | ) | | | 9.51 | | | | 6.70 | | | | 2.47 | |
| | | | | | | | | | | | | | | | | | | | | |
| DISTRIBUTIONS: | | | | | | | | | | | | | | | | | | | | |
| From net investment income | | | – | | | | – | | | | (0.02 | ) | | | (0.78 | ) | | | (0.58 | ) |
| Total distributions | | | – | | | | – | | | | (0.02 | ) | | | (0.78 | ) | | | (0.58 | ) |
| | | | | | | | | | | | | | | | | | | | | |
| Net increase/(decrease) in net asset value | | | (11.65 | ) | | | (6.06 | ) | | | 9.49 | | | | 5.92 | | | | 1.89 | |
| NET ASSET VALUE, END OF PERIOD | | $ | 31.29 | | | $ | 42.94 | | | $ | 49.00 | | | $ | 39.51 | | | $ | 33.59 | |
| TOTAL RETURN(c) | | | (27.13 | )% | | | (12.37 | )% | | | 24.07 | % | | | 20.99 | % | | | 7.81 | % |
| | | | | | | | | | | | | | | | | | | | | |
| RATIOS/SUPPLEMENTAL DATA: | | | | | | | | | | | | | | | | | | | | |
| Net assets, end of period (000s) | | $ | 115,009 | | | $ | 188,929 | | | $ | 242,542 | | | $ | 197,570 | | | $ | 221,694 | |
| | | | | | | | | | | | | | | | | | | | | |
| Ratio of expenses to average net assets | | | 0.50 | % | | | 0.50 | % | | | 0.50 | % | | | 0.50 | % | | | 0.50 | % |
| Ratio of net investment income/(loss) to average net assets | | | (0.39 | )% | | | (0.36 | )% | | | (0.33 | )% | | | 0.09 | % | | | (0.27 | )% |
| Portfolio turnover rate(d) | | | 88 | % | | | 81 | % | | | 68 | % | | | 88 | % | | | 48 | % |
| (a) | Based on average shares outstanding during the period. |
| (b) | Net realized and unrealized gain on investments per share does not correlate to aggregate of the net realized and unrealized loss in the Statements of Operations for the year ended November 30, 2018, primarily due to the timing of the sales and repurchases of the Fund's shares in relation to the fluctuating market values for the Fund's portfolio. |
| (c) | Total return is calculated assuming an initial investment made at the net asset value at the beginning of the period and redemption at the net asset value on the last day of the period and assuming all distributions are reinvested at reinvestment prices. Total return calculated for a period of less than one year is not annualized. |
| (d) | Portfolio turnover for periods less than one year are not annualized and does not include securities received or delivered from processing creations or redemptions in-kind. |
See Notes to Financial Statements.
| ALPS ETF Trust | |
| Notes to Financial Statements | November 30, 2022 |
1. ORGANIZATION
ALPS ETF Trust (the “Trust”), a Delaware statutory trust, is an open-end management investment company registered under the Investment Company Act of 1940, as amended (the “1940 Act”). As of November 30, 2022, the Trust consisted of twenty-three separate portfolios. Each portfolio represents a separate series of the Trust. This report pertains to the ALPS Clean Energy ETF, ALPS Disruptive Technologies ETF, ALPS Global Travel Beneficiaries ETF and the ALPS Medical Breakthroughs ETF (each a “Fund” and collectively, the “Funds”).
The investment objective of the ALPS Clean Energy ETF is to seek investment results that correspond generally, before fees and expenses, to the performance of the CIBC Atlas Clean Energy Index. The investment objective of the ALPS Disruptive Technologies ETF is to seek investment results that correspond generally, before fees and expenses, to the performance of the Indxx Disruptive Technologies Index. The investment objective of the ALPS Global Travel Beneficiaries ETF is to seek investment results that correspond generally, before fees and expenses, to the performance of the S-Network Global Travel Index. The investment objective of the ALPS Medical Breakthroughs ETF is to seek investment results that correspond generally, before fees and expenses, to the performance of the S-Network Medical Breakthroughs Index.
ALPS Clean Energy ETF is considered non-diversified and may invest a greater portion of assets in securities of individual issuers than a diversified fund. As a result, changes in the market value of a single investment could cause greater fluctuations in share price than would occur in a diversified fund. ALPS Disruptive Technologies ETF, ALPS Global Travel Beneficiaries ETF and ALPS Medical Breakthroughs ETF have elected to qualify as a diversified series of the Trust under the 1940 Act.
Each Fund’s Shares (“Shares”) are listed on the NYSE Arca, Inc. (the “NYSE Arca”). Each Fund issues and redeems Shares, at net asset value (“NAV”) in blocks of 25,000 Shares, each of which is called a “Creation Unit”. Creation Units are issued and redeemed principally in-kind for securities included in the Underlying Index. Except when aggregated in Creation Units, Shares are not redeemable securities of the Fund.
Pursuant to the Trust’s organizational documents, its Officers and Trustees are indemnified against certain liability arising out of the performance of their duties to the Trust. Additionally, in the normal course of business, the Trust enters into contracts with service providers that contain general indemnification clauses. The Trust’s maximum exposure under these arrangements is unknown, as this would involve future claims that may be made against the Trust that have not yet occurred.
2. SIGNIFICANT ACCOUNTING POLICIES
The following is a summary of significant accounting policies consistently followed by the Funds in the preparation of the financial statements. The accompanying financial statements were prepared in accordance with accounting principles generally accepted in the United States of America (“U.S. GAAP”). The preparation of financial statements in conformity with U.S. GAAP requires management to make certain estimates and assumptions that affect the reported amounts of assets and liabilities and disclosures of contingent assets and liabilities at the date of the financial statements and the reported amounts of revenue and expenses during the period. Actual results could differ from those estimates. Each Fund is considered an investment company under U.S. GAAP and follows the accounting and reporting guidance applicable to investment companies in the Financial Accounting Standards Board (“FASB”) Accounting Standards Codification Topic 946.
A. Portfolio Valuation
Each Fund’s NAV is determined daily, as of the close of regular trading on the New York Stock Exchange (the “NYSE”), normally 4:00 p.m. Eastern time, on each day the NYSE is open for trading. The NAV is computed by dividing the value of all assets of the Fund (including accrued interest and dividends), less all liabilities (including accrued expenses and dividends declared but unpaid), by the total number of shares outstanding.
Portfolio securities listed on any exchange other than the NASDAQ Stock Market LLC (“NASDAQ”) are valued at the last sale price on the business day as of which such value is being determined. If there has been no sale on such day, the securities are valued at the mean of the most recent bid and ask prices on such day. Securities traded on the NASDAQ are valued at the NASDAQ Official Closing Price as determined by NASDAQ. Portfolio securities traded on more than one securities exchange are valued at the last sale price on the business day as of which such value is being determined at the close of the exchange representing the principal market for such securities. Portfolio securities traded in the over-the-counter market, but excluding securities traded on the NASDAQ, are valued at the last quoted sale price in such market.
The Funds’ investments are valued at market value or, in the absence of market value with respect to any portfolio securities, at fair value according to procedures adopted by the Trust’s Board of Trustees (the “Board”). Pursuant to Rule 2a-5 under the 1940 Act, the Board designated ALPS Advisors, Inc. (the "Adviser") as the valuation designee ("Valuation Designee") for each Fund to perform the fair value determinations relating to Fund investments. The Adviser may carry out its designated responsibilities as Valuation Designee through various teams and committees. When market quotations are not readily available or when events occur that make established valuation methods unreliable, securities of the Funds may be valued in good faith by the Valuation Designee. These securities generally include, but are not limited to, restricted securities (securities which may not be publicly sold without registration under the Securities Act of 1933) for which a pricing service is unable to provide a market price; securities whose trading has been formally suspended; a security whose market price is not available from a pre-established primary pricing source or the pricing source is not willing to provide a price; a security with respect to which an event has occurred that is most likely to materially affect the value of the security after the market has closed but before the calculation of the Fund’s NAV or make it difficult or impossible to obtain a reliable market quotation; or a security whose price, as provided by the pricing service, does not reflect the security’s “fair value” due to the security being de-listed from a national exchange or the security’s primary trading market is temporarily closed at a time when, under normal conditions, it would be open. As a general principle, the current “fair value” of a security would be the amount which the owner might reasonably expect to receive from the sale on the applicable exchange or principal market. A variety of factors may be considered in determining the fair value of such securities.
| ALPS ETF Trust | |
| Notes to Financial Statements | November 30, 2022 |
B. Fair Value Measurements
Each Fund discloses the classification of its fair value measurements following a three-tier hierarchy based on the inputs used to measure fair value. Inputs refer broadly to the assumptions that market participants would use in pricing the asset or liability; including assumptions about risk. Inputs may be observable or unobservable. Observable inputs reflect the assumptions market participants would use in pricing the asset or liability that are developed based on market data obtained from sources independent of the reporting entity. Unobservable inputs reflect the reporting entity’s own assumptions about the assumptions market participants would use in pricing the asset or liability that are developed based on the best information available.
Valuation techniques used to value the Funds’ investments by major category are as follows:
Equity securities, including restricted securities, for which market quotations are readily available, are valued at the last reported sale price or official closing price as reported by a third party pricing vendor on the primary market or exchange on which they are traded and are categorized as Level 1 in the hierarchy. In the event there were no sales during the day or closing prices are not available, securities are valued at the mean of the most recent quoted bid and ask prices on such day and are generally categorized as Level 2 in the hierarchy. Investments in open-end mutual funds are valued at their closing NAV each business day and are categorized as Level 1 in the hierarchy.
Changes in valuation techniques may result in transfers in or out of an assigned level within the disclosure hierarchy.
Various inputs are used in determining the value of each Fund’s investments as of the end of the reporting period. When inputs used fall into different levels of the fair value hierarchy, the level in the hierarchy within which the fair value measurement falls is determined based on the lowest level input that is significant to the fair value measurement in its entirety. The designated input levels are not necessarily an indication of the risk or liquidity associated with these investments.
These inputs are categorized in the following hierarchy under applicable financial accounting standards:
| Level 1 – | Unadjusted quoted prices in active markets for identical investments, unrestricted assets or liabilities that a Fund has the ability to access at the measurement date; |
| | |
| Level 2 – | Quoted prices which are not active, quoted prices for similar assets or liabilities in active markets or inputs other than quoted prices that are observable (either directly or indirectly) for substantially the full term of the asset or liability; and |
| | |
| Level 3 – | Significant unobservable prices or inputs (including the Fund’s own assumptions in determining the fair value of investments) where there is little or no market activity for the asset or liability at the measurement date. |
| ALPS ETF Trust | |
| Notes to Financial Statements | November 30, 2022 |
The following is a summary of the inputs used to value the Funds’ investments as of November 30, 2022:
ALPS Clean Energy ETF
| Investments in Securities at Value | | Level 1 - Quoted and Unadjusted Prices | | | Level 2 - Other Significant Observable Inputs | | | Level 3 - Significant Unobservable Inputs | | | Total | |
| Common Stocks* | | $ | 627,283,693 | | | $ | – | | | $ | – | | | $ | 627,283,693 | |
| Master Limited Partnerships* | | | 79,473,755 | | | | – | | | | – | | | | 79,473,755 | |
| Short Term Investments | | | 97,754,200 | | | | – | | | | – | | | | 97,754,200 | |
| Total | | $ | 804,511,648 | | | $ | – | | | $ | – | | | $ | 804,511,648 | |
ALPS Disruptive Technologies ETF
| Investments in Securities at Value | | Level 1 - Quoted and Unadjusted Prices | | | Level 2 - Other Significant Observable Inputs | | | Level 3 - Significant Unobservable Inputs | | | Total | |
| Common Stocks* | | $ | 121,036,978 | | | $ | – | | | $ | – | | | $ | 121,036,978 | |
| Master Limited Partnerships* | | | 931,192 | | | | – | | | | – | | | | 931,192 | |
| Short Term Investments | | | 5,138,248 | | | | – | | | | – | | | | 5,138,248 | |
| Total | | $ | 127,106,418 | | | $ | – | | | $ | – | | | $ | 127,106,418 | |
| ALPS Global Travel Beneficiaries ETF | | | | | | | | | | | | |
| Investments in Securities at Value | | Level 1 - Quoted and Unadjusted Prices | | | Level 2 - Other Significant Observable Inputs | | | Level 3 - Significant Unobservable Inputs | | | Total | |
| Common Stocks* | | $ | 7,909,007 | | | $ | – | | | $ | – | | | $ | 7,909,007 | |
| Short Term Investments | | | 46,958 | | | | – | | | | – | | | | 46,958 | |
| Total | | $ | 7,955,965 | | | $ | – | | | $ | – | | | $ | 7,955,965 | |
ALPS Medical Breakthroughs ETF
| Investments in Securities at Value | | Level 1 - Quoted and Unadjusted Prices | | | Level 2 - Other Significant Observable Inputs | | | Level 3 - Significant Unobservable Inputs | | | Total | |
| Common Stocks* | | $ | 114,951,120 | | | $ | – | | | $ | – | | | $ | 114,951,120 | |
| Short Term Investments | | | 7,424,257 | | | | – | | | | – | | | | 7,424,257 | |
| Total | | $ | 122,375,377 | | | $ | – | | | $ | – | | | $ | 122,375,377 | |
| * | For a detailed sector breakdown, see the accompanying Schedule of Investments. |
The Funds did not have any securities that used significant unobservable inputs (Level 3) in determining fair value and there were no transfers into or out of Level 3 during the year ended November 30, 2022.
C. Foreign Investment Risk
The Funds may directly purchase securities of foreign issuers. Investments in non-U.S. issuers may involve unique risks compared to investing in securities of U.S. issuers, including, among others, less liquidity generally, greater market volatility than U.S. securities and less complete financial information than for U.S. issuers. In addition, adverse political, economic or social developments could undermine the value of the Fund’s investments or prevent the Fund from realizing the full value of its investments. Financial reporting standards for companies based in foreign markets differ from those in the United States. Finally, the value of the currency of the country in which the Fund has invested could decline relative to the value of the U.S. dollar, which may affect the value of the investment to U.S. investors. The Fund will not enter into transactions to hedge against declines in the value of the Fund’s assets that are denominated in foreign currency.
Countries with emerging markets may have relatively unstable governments and may present the risks of nationalization of businesses, restrictions on foreign ownership and prohibitions on the repatriation of assets. The economies of emerging markets countries also may be based on only a few industries, making them more vulnerable to changes in local or global trade conditions and more sensitive to debt burdens, inflation rates or adverse news and events.
| ALPS ETF Trust | |
| Notes to Financial Statements | November 30, 2022 |
Because foreign markets may be open on different days than the days during which investors may purchase the shares of the Fund, the value of the Funds’ securities may change on the days when investors are not able to purchase the shares of the Fund. The value of securities denominated in foreign currencies is converted into U.S. dollars using exchange rates determined daily as of the close of regular trading on the NYSE. Any use of a different rate from the rates used by the Index may adversely affect a Fund's ability to track its Index.
D. Foreign Currency Translation
The books and records of the Funds are maintained in U.S. dollars. Investment valuations and other assets and liabilities initially expressed in foreign currencies are converted each business day into U.S. dollars based upon current exchange rates. The portion of realized and unrealized gains or losses on investments due to fluctuations in foreign currency exchange rates is not separately disclosed and is included in realized and unrealized gains or losses on investments, when applicable.
E. Securities Transactions and Investment Income
Securities transactions are recorded as of the trade date. Realized gains and losses from securities transactions are recorded on the specific identification in accordance with GAAP. Dividend income and capital gains distributions, if any, are recorded on the ex-dividend date, net of any foreign taxes withheld. Interest income, if any, is recorded on the accrual basis.
F. Dividends and Distributions to Shareholders
Dividends from net investment income for the ALPS Disruptive Technologies ETF, the ALPS Global Travel Beneficiaries ETF and the ALPS Medical Breakthroughs ETF, if any, are declared and paid annually or as the Board may determine from time to time. Dividends from net investment income for ALPS Clean Energy ETF, if any, are declared and paid quarterly or as the Board may determine from time to time. Distributions of net realized capital gains earned by the Funds, if any, are distributed at least annually.
G. Federal Tax and Tax Basis Information
The timing and character of income and capital gain distributions are determined in accordance with income tax regulations, which may differ from U.S. GAAP. Reclassifications are made to the Funds’ capital accounts for permanent tax differences to reflect income and gains available for distribution (or available capital loss carryforwards) under income tax regulations.
For the year ended November 30, 2022, the following reclassifications, which had no impact on results of operations or net assets, were recorded to reflect permanent tax differences resulting primarily from in-kind transactions:
| Fund | | Paid-in Capital | | | Total Distributable Earnings/(Accumulated Losses) | |
| ALPS Clean Energy ETF | | $ | 51,104,581 | | | $ | (51,104,581 | ) |
| ALPS Disruptive Technologies ETF | | | 17,201,594 | | | | (17,201,594 | ) |
| ALPS Global Travel Beneficiaries ETF | | | 299,276 | | | | (299,276 | ) |
| ALPS Medical Breakthroughs ETF | | | (10,218,894 | ) | | | 10,218,894 | |
Included in the amounts reclassified was a net operating loss offset to Paid-in Capital as follows:
| | | Paid-in Capital | |
| ALPS Clean Energy ETF | | $ | – | |
| ALPS Disruptive Technologies ETF | | | – | |
| ALPS Global Travel Beneficiaries ETF | | | 16,966 | |
| ALPS Medical Breakthroughs ETF | | | 601,772 | |
| ALPS ETF Trust | |
| Notes to Financial Statements | November 30, 2022 |
The tax character of the distributions paid during the fiscal years ended November 30, 2022 and November 30, 2021 was as follows:
| Fund | | Ordinary Income | | | Long-Term Capital Gain | | | Return of Capital | |
| November 30, 2022 | | | | | | | | | | | | |
| ALPS Clean Energy ETF | | $ | 2,463,315 | | | $ | – | | | $ | 3,378,816 | |
| ALPS Disruptive Technologies ETF | | | 621,900 | | | | – | | | | – | |
| ALPS Global Travel Beneficiaries ETF | | | 12,194 | | | | – | | | | – | |
| ALPS Medical Breakthroughs ETF | | | – | | | | – | | | | – | |
| Fund | | Ordinary Income | | | Long-Term Capital Gain | | | Return of Capital | |
| November 30, 2021 | | | | | | | | | | | | |
| ALPS Clean Energy ETF | | $ | 2,023,844 | | | $ | – | | | $ | 3,160,255 | |
| ALPS Disruptive Technologies ETF | | | 633,863 | | | | – | | | | – | |
| ALPS Global Travel Beneficiaries ETF | | | – | | | | – | | | | – | |
| ALPS Medical Breakthroughs ETF | | | – | | | | – | | | | – | |
The character of distributions made during the year may differ from its ultimate characterization for federal income tax purposes.
Under current law, capital losses maintain their character as short-term or long-term and are carried forward to the next tax year without expiration.
As of November 30, 2022, the following amounts are available as carry forwards to the next tax year:
| Fund | | Short-Term | | | Long-Term | |
| ALPS Clean Energy ETF | | $ | 95,237,759 | | | $ | 17,824,699 | |
| ALPS Disruptive Technologies ETF | | | 9,594,458 | | | | 6,638,043 | |
| ALPS Global Travel Beneficiaries ETF | | | 770,617 | | | | 68,861 | |
| ALPS Medical Breakthroughs ETF | | | 81,852,451 | | | | 50,190,516 | |
As of November 30, 2022, the components of distributable earnings/(accumulated losses) on a tax basis were as follows:
| Fund | | Accumulated Net Investment Income | | | Accumulated Net Realized Gain/(Loss) on Investments | | | Other Accumulated Losses(a) | | | Net Unrealized Appreciation/(Depreciation) on Investments | | | Total | |
| ALPS Clean Energy ETF | | $ | – | | | $ | (113,062,458 | ) | | $ | – | | | $ | (107,693,485 | ) | | $ | (220,755,943 | ) |
| ALPS Disruptive Technologies ETF | | | – | | | | (16,232,501 | ) | | | (93,177 | ) | | | (20,788,257 | ) | | | (37,113,935 | ) |
| ALPS Global Travel Beneficiaries ETF | | | – | | | | (839,478 | ) | | | (104 | ) | | | (727,014 | ) | | | (1,566,596 | ) |
| ALPS Medical Breakthroughs ETF | | | – | | | | (132,042,967 | ) | | | (413,192 | ) | | | (13,222,630 | ) | | | (145,678,789 | ) |
| (a) | Other accumulated losses represents late year ordinary losses the Fund elects to defer to the year ending November 30, 2023. |
| ALPS ETF Trust | |
| Notes to Financial Statements | November 30, 2022 |
As of November 30, 2022, the cost of investments for federal income tax purposes and accumulated net unrealized appreciation/(depreciation) on investments were as follows:
| Fund | | ALPS Clean Energy ETF | | | ALPS Disruptive Technologies ETF | | | ALPS Global Travel Beneficiaries ETF | | | ALPS Medical Breakthroughs ETF | |
| Gross appreciation (excess of value over tax cost) | | $ | 101,756,757 | | | $ | 10,744,487 | | | $ | 336,337 | | | $ | 20,753,364 | |
| Gross depreciation (excess of tax cost over value) | | | (209,451,394 | ) | | | (31,534,866 | ) | | | (1,063,332 | ) | | | (33,975,994 | ) |
| Net appreciation/(depreciation) of foreign currency | | | 1,152 | | | | 2,122 | | | | (19 | ) | | | – | |
| Net unrealized appreciation/(depreciation) | | $ | (107,693,485 | ) | | $ | (20,788,257 | ) | | $ | (727,014 | ) | | $ | (13,222,630 | ) |
| Cost of investments for income tax purposes | | $ | 912,206,285 | | | $ | 147,896,797 | | | $ | 8,682,960 | | | $ | 135,598,007 | |
The differences between book-basis and tax-basis are primarily due to the deferral of losses from wash sales, investments in partnerships and investments in passive foreign investment companies.
H. Income Taxes
No provision for income taxes is included in the accompanying financial statements, as each Fund intends to distribute to shareholders all taxable investment income and realized gains and otherwise comply with Subchapter M of the Internal Revenue Code of 1986, as amended, applicable to regulated investment companies. Each Fund evaluates tax positions taken (or expected to be taken) in the course of preparing the Fund’s tax returns to determine whether these positions meet a “more-likely-than-not” standard that, based on the technical merits, have a more than fifty percent likelihood of being sustained by a taxing authority upon examination. A tax position that meets the “more-likely-than-not” recognition threshold is measured to determine the amount of benefit to recognize in the financial statements.
As of and during the year ended November 30, 2022, each Fund did not have a liability for any unrecognized tax benefits. Each Fund files U.S. federal, state, and local tax returns as required. Each Fund’s tax returns are subject to examination by the relevant tax authorities until expiration of the applicable statute of limitations, which is generally three years after the filing of the tax return, but may extend to four years in certain jurisdictions. Each Fund’s tax returns for open years have incorporated no uncertain tax positions that require a provision for income taxes.
I. Lending of Portfolio Securities
The Funds have entered into a securities lending agreement with State Street Bank & Trust Co. (“SSB”), the Funds’ lending agent. Each Fund may lend their portfolio securities only to borrowers that are approved by SSB. Each Fund will limit such lending to not more than 33 1/3% of the value of its total assets. Each Funds’ securities held at SSB as custodian shall be available to be lent except those securities the Fund or ALPS Advisors, Inc. specifically identifies in writing as not being available for lending. The borrower pledges and maintains with each Fund collateral consisting of cash (U.S. Dollars only), securities issued or guaranteed by the U.S. government or its agencies or instrumentalities, and cash equivalents (including irrevocable bank letters of credit) issued by a person other than the borrower or an affiliate of the borrower. The initial collateral received by each Fund is required to have a value of no less than 102% of the market value of the loaned securities for U.S equity securities and a value of no less than 105% of the market value for non-U.S. equity securities. The collateral is maintained thereafter, at a market value equal to not less than 102% of the current value of the U.S. equity securities on loan and not less than 105% of the current value of the non-U.S. equity securities on loan. The market value of the loaned securities is determined at the close of each business day and any additional required collateral is delivered to each Fund on the next business day. During the term of the loan, each Fund is entitled to all distributions made on or in respect of the loaned securities. Loans of securities are terminable at any time and the borrower, after notice, is required to return borrowed securities within the customary time period for settlement of securities transactions.
Any cash collateral received is reinvested in a money market fund managed by SSB as disclosed in the Fund’s Schedule of Investments and is reflected in the Statements of Assets and Liabilities as a payable for collateral upon return of securities loaned. Non-cash collateral, in the form of securities issued or guaranteed by the U.S. government or its agencies or instrumentalities, is not disclosed in a Fund’s Statements of Assets and Liabilities as it is held by the lending agent on behalf of each Fund, and each Fund does not have the ability to re-hypothecate these securities. Income earned by the Fund from securities lending activity is disclosed in the Statement of Operations.
| ALPS ETF Trust | |
| Notes to Financial Statements | November 30, 2022 |
The following is a summary of each Fund's securities lending agreement and related cash and non-cash collateral received as of November 30, 2022:
| Fund | | Market Value of Securities on Loan | | | Cash Collateral Received | | | Non-Cash Collateral Received | | | Total Collateral Received | |
| ALPS Clean Energy ETF | | $ | 162,310,785 | | | $ | 97,315,282 | | | $ | 61,664,500 | | | $ | 158,979,782 | |
| ALPS Disruptive Technologies ETF | | | 5,154,490 | | | | 5,000,014 | | | | 202,098 | | | | 5,202,112 | |
| ALPS Global Travel Beneficiaries ETF | | | 35,256 | | | | 35,640 | | | | – | | | | 35,640 | |
| ALPS Medical Breakthroughs ETF | | | 12,973,826 | | | | 7,329,078 | | | | 5,717,977 | | | | 13,047,055 | |
The risks of securities lending include the risk that the borrower may not provide additional collateral when required or may not return the securities when due. To mitigate these risks, each Fund benefits from a borrower default indemnity provided by SSB. SSB’s indemnity allows for full replacement of securities lent wherein SSB will purchase the unreturned loaned securities on the open market by applying the proceeds of the collateral or to the extent such proceeds are insufficient or the collateral is unavailable, SSB will purchase the unreturned loan securities at SSB’s expense. However, the Funds could suffer a loss if the value of the investments purchased with cash collateral falls below the value of the cash collateral received. The following tables reflect a breakdown of transactions accounted for as secured borrowings, the gross obligation by the type of collateral pledged or securities loaned, and the remaining contractual maturity of those transactions as of November 30, 2022:
| ALPS Clean Energy ETF | | Remaining Contractual Maturity of the Agreements | |
| Securities Lending Transactions | | Overnight & Continuous | | | Up to 30 Days | | | 30-90 Days | | | Greater than 90 Days | | | Total | |
| Common Stocks | | $ | 97,315,282 | | | $ | – | | | $ | – | | | $ | – | | | $ | 97,315,282 | |
| Total Borrowings | | | | | | | | | | | | | | | | | | | 97,315,282 | |
| Gross amount of recognized liabilities for securities lending (collateral received) | | | | $ | 97,315,282 | |
| ALPS Disruptive Technologies ETF | | Remaining Contractual Maturity of the Agreements | |
| Securities Lending Transactions | | Overnight & Continuous | | | Up to 30 Days | | | 30-90 Days | | | Greater than 90 Days | | | Total | |
| Common Stocks | | $ | 5,000,014 | | | $ | – | | | $ | – | | | $ | – | | | $ | 5,000,014 | |
| Total Borrowings | | | | | | | | | | | | | | | | | | | 5,000,014 | |
| Gross amount of recognized liabilities for securities lending (collateral received) | | | | $ | 5,000,014 | |
| ALPS Global Travel Beneficiaries ETF | | Remaining Contractual Maturity of the Agreements | |
| Securities Lending Transactions | | Overnight & Continuous | | | Up to 30 Days | | | 30-90 Days | | | Greater than 90 Days | | | Total | |
| Common Stocks | | $ | 35,640 | | | $ | – | | | $ | – | | | $ | – | | | $ | 35,640 | |
| Total Borrowings | | | | | | | | | | | | | | | | | | | 35,640 | |
| Gross amount of recognized liabilities for securities lending (collateral received) | | | | $ | 35,640 | |
| ALPS Medical Breakthroughs ETF | | Remaining Contractual Maturity of the Agreements | |
| Securities Lending Transactions | | Overnight & Continuous | | | Up to 30 Days | | | 30-90 Days | | | Greater than 90 Days | | | Total | |
| Common Stocks | | $ | 7,329,078 | | | $ | – | | | $ | – | | | $ | – | | | $ | 7,329,078 | |
| Total Borrowings | | | | | | | | | | | | | | | | | | | 7,329,078 | |
| Gross amount of recognized liabilities for securities lending (collateral received) | | | | $ | 7,329,078 | |
3. INVESTMENT ADVISORY FEE AND OTHER AFFILIATED TRANSACTIONS
ALPS Advisors, Inc. serves as the Funds’ investment adviser pursuant to an Investment Advisory Agreement with the Trust on behalf of each Fund (the “Advisory Agreement”). Pursuant to the Advisory Agreement, each Fund pays the Adviser an annual management fee for the services and facilities it provides, payable on a monthly basis as a percentage of the relevant Fund’s average daily net assets as set out below. From time to time, the Adviser may waive all or a portion of its fee.
| ALPS ETF Trust | |
| Notes to Financial Statements | November 30, 2022 |
| Fund | Advisory Fee |
| ALPS Clean Energy ETF | 0.55% |
| ALPS Disruptive Technologies ETF | 0.50% |
| ALPS Global Travel Beneficiaries ETF | 0.65% |
| ALPS Medical Breakthroughs ETF | 0.50% |
Out of the unitary management fee, the Adviser pays substantially all expenses of each Fund, including licensing fees to the Underlying Index provider, the cost of transfer agency, custody, fund administration, legal, audit, trustees and other services, except for interest expenses, distribution fees or expenses, brokerage expenses, taxes and extraordinary expenses not incurred in the ordinary course of each Fund's business. The Adviser’s unitary management fee is designed to pay substantially all of each Fund's expenses and to compensate the Adviser for providing services for each Fund.
ALPS Fund Services, Inc., an affiliate of the Adviser, is the administrator for the Funds.
Effective February 16, 2022, each Trustee receives (1) a quarterly retainer of $20,000, (2) a per meeting fee of $10,000, (3) $2,500 for any special meeting held outside of a regularly scheduled board meeting, and (4) reimbursement for all reasonable out-of-pocket expenses relating to attendance at meetings. In addition, the Chairman of the Board receives a quarterly retainer of $5,000, the Chairman of the Audit Committee receives a quarterly retainer of $3,000, and the Chairman of the Nominating & Governance Committee receives a quarterly retainer of $2,000, each in connection with their respective roles. Prior to February 16, 2022, each Trustee received (1) a quarterly retainer of $10,000, (2) a per meeting fee of $5,000, (3) $1,500 for any special meeting held outside of a regularly scheduled board meeting, and (4) reimbursement for all reasonable out-of-pocket expenses relating to attendance at meetings. In addition, the Chairman of the Board and Chairman of the Audit Committee each received a quarterly retainer of $2,000, in connection with their respective roles.
4. PURCHASES AND SALES OF SECURITIES
For the year ended November 30, 2022, the cost of purchases and proceeds from sales of investment securities, excluding short-term investments and in-kind transactions, were as follows:
| Fund | | Purchases | | | Sales | |
| ALPS Clean Energy ETF | | $ | 332,361,831 | | | $ | 331,976,581 | |
| ALPS Disruptive Technologies ETF | | | 49,926,252 | | | | 50,282,898 | |
| ALPS Global Travel Beneficiaries ETF | | | 5,084,806 | | | | 4,960,320 | |
| ALPS Medical Breakthroughs ETF | | | 109,147,623 | | | | 109,526,765 | |
For the year ended November 30, 2022, the cost of in-kind purchases and proceeds from in-kind sales were as follows:
| Fund | | Purchases | | | Sales | |
| ALPS Clean Energy ETF | | $ | 198,444,514 | | | $ | 247,677,009 | |
| ALPS Disruptive Technologies ETF | | | 14,720,020 | | | | 69,259,744 | |
| ALPS Global Travel Beneficiaries ETF | | | 9,269,955 | | | | 8,270,922 | |
| ALPS Medical Breakthroughs ETF | | | 23,696,044 | | | | 47,008,604 | |
For the year ended November 30, 2022, the in-kind net realized gain/(loss) were as follows:
| Fund | | Net Realized Gain/(Loss) | |
| ALPS Clean Energy ETF | | $ | 57,641,943 | |
| ALPS Disruptive Technologies ETF | | | 18,070,066 | |
| ALPS Global Travel Beneficiaries ETF | | | 323,693 | |
| ALPS Medical Breakthroughs ETF | | | (8,477,163 | ) |
Gains on in-kind transactions are not considered taxable for federal income tax purposes and losses on in-kind transactions are also not deductible for tax purposes.
| ALPS ETF Trust | |
| Notes to Financial Statements | November 30, 2022 |
5. CAPITAL SHARE TRANSACTIONS
Shares are created and redeemed by each Fund only in Creation Unit size aggregations of 25,000 Shares. Only broker-dealers or large institutional investors with creation and redemption agreements called Authorized Participants (“AP”) are permitted to purchase or redeem Creation Units from the Funds. Such transactions are generally permitted on an in-kind basis, with a balancing cash component to equate the transaction to the NAV per unit of each Fund on the transaction date. Cash may be substituted equivalent to the value of certain securities generally when they are not available in sufficient quantity for delivery, not eligible for trading by the AP or as a result of other market circumstances.
6. MARKET RISK
The Funds are subject to investment and operational risks associated with financial, economic and other global market developments and disruptions, including the recent spread of an infectious respiratory illness caused by a novel strain of coronavirus (known as COVID-19), which can negatively impact the securities markets and cause each Fund to lose value. Securities in each Fund's portfolio may underperform in comparison to securities in general financial markets, a particular financial market or other asset classes due to a number of factors, including inflation (or expectations for inflation), deflation (or expectations for deflation), interest rates, global demand for particular products or resources, market instability, debt crises and downgrades, embargoes, tariffs, sanctions and other trade barriers, regulatory events, other governmental trade or market control programs and related geopolitical events. In addition, the value of the Fund's investments may be negatively affected by the occurrence of global events such as war, terrorism, environmental disasters, natural disasters or events, country instability, and infectious disease epidemics or pandemics.
The spread of COVID-19 has caused volatility, severe market dislocations and liquidity constraints in many markets, including markets for the securities each Fund holds, and may adversely affect each Fund’s investments and operations. The transmission of COVID-19 and efforts to contain its spread have resulted in travel restrictions and disruptions, closed international borders, enhanced health screenings at ports of entry and elsewhere, disruption of and delays in healthcare service preparation and delivery, quarantines, event and service cancellations or interruptions, disruptions to business operations and supply chains, and a reduction in consumer and business spending, as well as general concern and uncertainty that has negatively affected the economy. These disruptions have led to instability in the market place and the jobs market. The impact of COVID-19 could adversely affect the economies of many nations or the entire global economy, the financial well-being and performance of individual issuers, borrowers and sectors and the health of the markets generally in potentially significant and unforeseen ways.
The foregoing could lead to a significant economic downturn or recession, increased market volatility, a greater number of market closures, higher default rates and adverse effects on the values and liquidity of each Fund’s securities or other assets. Such impacts may adversely affect the performance of the Funds.
7. CONCENTRATION RISK
Each Fund seeks to track an underlying index, which itself may have concentration in certain regions, economies, countries, markets, industries or sectors. Underperformance or increased risk in such concentrated areas may result in underperformance or increased risk in the Fund.
8. SUBSEQUENT EVENTS
Subsequent events, if any, after the date of the Statements of Assets and Liabilities have been evaluated through the date the financial statements were issued. Management has determined that there were no subsequent events to report through the issuance of these financial statements.
| ALPS ETF Trust | |
| Additional Information | November 30, 2022 (Unaudited) |
PROXY VOTING RECORDS, POLICIES AND PROCEDURES
Information regarding how each Fund voted proxies relating to portfolio securities during the most recent 12-month period ended June 30 and a description of the Fund’s proxy voting policies and procedures used in determining how to vote for proxies are available without charge on the SEC’s website at www.sec.gov and upon request, by calling (toll-free) 1-866-759-5679.
PORTFOLIO HOLDINGS
The Funds file a complete schedule of portfolio holdings with the U.S. Securities and Exchange Commission (“SEC”) for the first and third quarters of each fiscal year on Form N-PORT within 60 days after the end of the period. Copies of the Fund’s Form N-PORT are available without a charge, upon request, by contacting the Fund at 1-866-759-5679 and on the SEC’s website at https://www.sec.gov.
TAX INFORMATION
The Funds designate the following as a percentage of taxable ordinary income distributions, or up to the maximum amount allowable, for the calendar year ended December 31, 2021:
| Fund | Qualified Dividend Income | Dividend Received Deduction |
| ALPS Clean Energy ETF | 76.58% | 15.40% |
| ALPS Disruptive Technologies ETF | 100.00% | 100.00% |
| ALPS Global Travel Beneficiaries ETF | 77.73% | 28.51% |
| ALPS Medical Breakthroughs ETF | 0.00% | 0.00% |
In early 2022, if applicable, shareholders of record received this information for the distributions paid to them by the Funds during the calendar year 2021 via Form 1099. The Funds will notify shareholders in early 2023 of amounts paid to them by the Funds, if any, during the calendar year 2022.
LICENSING AGREEMENT
ALPS Clean Energy ETF
CIBC NTC is the designer of the construction and methodology for the Underlying Index. “CIBC NTC” and “CIBC Atlas Clean Energy Index” are service marks or trademarks of the Index Provider. CIBC NTC acts as brand licensor for the Underlying Index and is not responsible for the descriptions of the Fund that appear herein.
The Fund is not sponsored by CIBC NTC or any of its affiliates. CIBC NTC makes no representation or warranty, express or implied, to the owners of the Fund or any member of the public regarding the advisability of investing in securities or commodities generally or in the Fund particularly. CIBC NTC does not guarantee the quality, accuracy or completeness of the Underlying Index or any Underlying Index data included herein or derived therefrom and assumes no liability in connection with their use. The Underlying Index is determined and composed without regard to the Adviser or the Fund. CIBC NTC has no obligation to take the needs of the Adviser, the Fund or the shareholders of the Fund into consideration in determining, composing or calculating the Underlying Index. CIBC NTC is not responsible for and has not participated in the determination of the timing of, prices at, or quantities of the Fund to be issued or in the determination or calculation of the equation by which the Fund is to be converted into cash. CIBC NTC has no obligation or liability in connection with the administration, marketing or trading of the Fund and is not responsible for and has not participated in the determination of pricing or the timing of the issuance or sale of the Shares of the Fund or in the determination or calculation of the NAV of the Fund.
CIBC NTC has no obligation or liability in connection with the administration, marketing or trading of the Fund. CIBC NTC makes no warranty, express or implied, as to results to be obtained by the Adviser, the Fund, Fund shareholders or any other person or entity from the use of the Underlying Index or any data included therein. CIBC NTC makes no express or implied warranties, and expressly disclaims all warranties of merchantability or fitness for a particular purpose or use with respect to the Underlying Index or any data included therein. Without limiting any of the foregoing, in no event shall CIBC NTC have any liability for any special, punitive, indirect, or consequential damages (including lost profits) arising out of matters relating to the use of the Underlying Index, even if notified of the possibility of such damages.
All intellectual property rights in the Underlying Index vests in CIBC NTC.
| ALPS ETF Trust | |
| Additional Information | November 30, 2022 (Unaudited) |
The Underlying Index is the property of CIBC NTC, which has contracted with S&P Opco, LLC (a subsidiary of S&P Dow Jones Indices LLC) to calculate and maintain the Underlying Index. The Underlying Index is not sponsored by S&P Dow Jones Indices or its affiliates or its third party licensors (collectively, “S&P Dow Jones Indices”). S&P Dow Jones Indices will not be liable for any errors or omissions in calculating the Underlying Index. “Calculated by S&P Dow Jones Indices” and the related stylized mark(s) are service marks of S&P Dow Jones Indices and have been licensed for use by CIBC NTC. S&P® is a registered trademark of Standard & Poor’s Financial Services LLC (“SPFS”), and Dow Jones® is a registered trademark of Dow Jones Trademark Holdings LLC (“Dow Jones”).
The Fund is not sponsored, endorsed, sold or promoted by S&P Dow Jones Indices. S&P Dow Jones Indices does not make any representation or warranty, express or implied, to the owners of the Fund or any member of the public regarding the advisability of investing in securities generally or in the Fund particularly or the ability of the Underlying Index to track general market performance. S&P Dow Jones Indices’ only relationship to CIBC NTC with respect to the Underlying Index is the licensing of certain trademarks, service marks and trade names of S&P Dow Jones Indices, and the provision of the calculation services related to the Underlying Index. S&P Dow Jones Indices is not responsible for and has not participated in the determination of the prices and amount of the Fund or the timing of the issuance or sale of the Fund or in the determination or calculation of the equation by which the Fund may be converted into cash or other redemption mechanics. S&P Dow Jones Indices has no obligation or liability in connection with the administration, marketing or trading of the Fund. S&P Dow Jones Indices LLC is not an investment advisor. Inclusion of a security within the Underlying Index is not a recommendation by S&P Dow Jones Indices to buy, sell, or hold such security, nor is it investment advice.
S&P DOW JONES INDICES DOES NOT GUARANTEE THE ADEQUACY, ACCURACY, TIMELINESS AND/OR THE COMPLETENESS OF THE UNDERLYING INDEX OR ANY DATA RELATED THERETO OR ANY COMMUNICATION WITH RESPECT THERETO, INCLUDING, ORAL, WRITTEN, OR ELECTRONIC COMMUNICATIONS. S&P DOW JONES INDICES SHALL NOT BE SUBJECT TO ANY DAMAGES OR LIABILITY FOR ANY ERRORS, OMISSIONS, OR DELAYS THEREIN. S&P DOW JONES INDICES MAKES NO EXPRESS OR IMPLIED WARRANTIES, AND EXPRESSLY DISCLAIMS ALL WARRANTIES, OF MERCHANTABILITY OR FITNESS FOR A PARTICULAR PURPOSE OR USE OR AS TO RESULTS TO BE OBTAINED BY CIBC NTC, OWNERS OF THE FUND, OR ANY OTHER PERSON OR ENTITY FROM THE USE OF THE UNDERLYING INDEX OR WITH RESPECT TO ANY DATA RELATED THERETO. WITHOUT LIMITING ANY OF THE FOREGOING, IN NO EVENT WHATSOEVER SHALL S&P DOW JONES INDICES BE LIABLE FOR ANY INDIRECT, SPECIAL, INCIDENTAL, PUNITIVE, OR CONSEQUENTIAL DAMAGES, INCLUDING BUT NOT LIMITED TO, LOSS OF PROFITS, TRADING LOSSES, LOST TIME, OR GOODWILL, EVEN IF THEY HAVE BEEN ADVISED OF THE POSSIBILITY OF SUCH DAMAGES, WHETHER IN CONTRACT, TORT, STRICT LIABILITY, OR OTHERWISE.
The Index Provider is not affiliated with the Trust, the Adviser or ALPS Portfolio Solutions Distributor, Inc. (the “Distributor”). The Index Provider has entered into a license agreement with the Adviser (the “License Agreement”). The use of the Underlying Index by the Adviser and the Fund is subject to the terms of the License Agreement, which impose certain limitations and conditions on the Fund’s ability to use the Underlying Index.
The Adviser does not guarantee the accuracy and/or the completeness of the Underlying Index or any data included therein, and the Adviser shall have no liability for any errors, omissions or interruptions therein. The Adviser makes no warranty, express or implied, as to results to be obtained by the Fund, owners of the Shares of the Fund or any other person or entity from the use of the Underlying Index or any data included therein. The Adviser makes no express or implied warranties, and expressly disclaims all warranties of merchantability or fitness for a particular purpose or use with respect to the Underlying Index or any data included therein. Without limiting any of the foregoing, in no event shall the Adviser have any liability for any special, punitive, direct, indirect, or consequential damages (including lost profits) arising out of matters relating to the use of the Underlying Index, even if notified of the possibility of such damages.
ALPS Disruptive Technologies ETF
“Indxx” is a service mark of Indxx, LLC (“Indxx” or the “Index Provider”) and has been licensed for use for certain purposes by ALPS Advisors, Inc. (the “Adviser”).
The ALPS Disruptive Technologies ETF is not sponsored, endorsed, sold or promoted by Indxx. Indxx makes no representation or warranty, express or implied, to the owners of the ALPS Disruptive Technologies ETF or any member of the public regarding the advisability of investing in securities generally or in the ALPS Disruptive Technologies ETF particularly. Indxx has no obligation to take the needs of ALPS Advisors, Inc. or the shareholders of ALPS Disruptive Technologies ETF into consideration in determining, composing, or calculating the Underlying Index. Indxx is not responsible for and has not participated in the determination of the timing, amount or pricing of the ALPS Disruptive Technologies ETF shares to be issued or in the determination or calculation of the equation by which the ALPS Disruptive Technologies ETF is to be converted into cash. Indxx has no obligation or liability in connection with the administration, marketing or trading of the ALPS Disruptive Technologies ETF.
INDXX MAKES NO WARRANTY, EXPRESS OR IMPLIED, AS TO THE RESULTS TO BE OBTAINED BY ANY PERSON OR ENTITY FROM THE USE OF THE INDEX(ES), TRADING BASED ON THE INDEX(ES), OR ANY DATA INCLUDED THEREIN IN CONNECTION WITH THE PRODUCTS, OR FOR ANY OTHER USE. INDXX EXPRESSLY DISCLAIMS ALL WARRANTIES AND CONDITIONS, EXPRESS, STATUTORY, OR IMPLIED, EXCEPT AS SET FORTH IN THIS AGREEMENT. EXCEPT AS OTHERWISE SPECIFICALLY SET FORTH IN THIS AGREEMENT, INDXX HEREBY EXPRESSLY DISCLAIMS ALL IMPLIED WARRANTIES AND CONDITIONS OF MERCHANTABILITY, TITLE, OR FITNESS FOR A PARTICULAR PURPOSE OR USE WITH RESPECT TO THE INDEX(ES) OR ANY DATA INCLUDED THEREIN. INDXX DOES NOT GUARANTEE THE ACCURACY AND/OR THE COMPLETENESS OF ANY DATA SUPPLIED BY IT OR ANY DATA INCLUDED THEREIN. INDXX MAKES NO WARRANTY, EXPRESS OR IMPLIED, AS TO RESULTS TO BE OBTAINED BY THE FUNDS, ITS SHAREHOLDERS OR AFFILIATES, OR ANY OTHER PERSON OR ENTITY FROM THE USE OF THE DATA SUPPLIED BY INDXX OR ANY DATA INCLUDED THEREIN. INDXX MAKES NO EXPRESS OR IMPLIED WARRANTIES, AND EXPRESSLY DISCLAIMS ALL WARRANTIES OF MERCHANTABILITY OR FITNESS FOR A PARTICULAR PURPOSE OR USE WITH RESPECT TO THE DATA SUPPLIED BY INDXX OR ANY DATA INCLUDED THEREIN. WITHOUT LIMITING ANY OF THE FOREGOING, IN NO EVENT SHALL INDXX HAVE ANY LIABILITY FOR ANY SPECIAL, PUNITIVE, INDIRECT, OR CONSEQUENTIAL DAMAGES (INCLUDING LOST PROFITS), EVEN IF NOTIFIED OF THE POSSIBILITY OF SUCH DAMAGES.
| ALPS ETF Trust | |
| Additional Information | November 30, 2022 (Unaudited) |
The Adviser does not guarantee the accuracy and/or the completeness of the Underlying Index or any data included therein, and the Adviser shall have no liability for any errors, omissions or interruptions therein. The Adviser makes no warranty, express or implied, as to results to be obtained by the Fund, owners of the Shares of the Fund or any other person or entity from the use of the Underlying Index or any data included therein. Adviser makes no express or implied warranties, and expressly disclaims all warranties of merchantability or fitness for a particular purpose or use with respect to the Underlying Index or any data included therein. Without limiting any of the foregoing, in no event shall the Adviser have any liability for any special, punitive, direct, indirect or consequential damages (including lost profits) arising out of matters relating to the use of the Underlying Index, even if notified of the possibility of such damages.
ALPS Global Travel Beneficiaries ETF
S-Network and S-Network Global Travel Index are service marks of S-Network Global Indexes, Inc. ("S-Network") and have been licensed for use by the ALPS Advisors, Inc. (“ALPS” or the “Adviser”). The Fund is not issued, sponsored, endorsed, sold or promoted by S-Network or its affiliates. S-Network makes no representation or warranty, express or implied, to the purchasers or owners of the Fund or any member of the public regarding the advisability of investing in securities generally or in the Fund particularly or the ability of the Index to track general market performance. S-Network's only relationship to the Fund is the licensing of the service marks and the Index, which is determined, composed and calculated by S-Network without regard to ALPS or the Fund. S-Network is not responsible for and has not participated in the determination of the timing of, prices at, or quantities of the Fund issued by ALPS. S-Network has no obligation or liability in connection with the issuance, administration, marketing or trading of the Fund.
S-NETWORK DOES NOT GUARANTEE THE ACCURACY AND/OR THE COMPLETENESS OF THE S-NETWORK GLOBAL TRAVEL INDEX OR ANY DATA INCLUDED THEREIN AND S-NETWORK SHALL HAVE NO LIABILITY FOR ANY ERRORS, OMISSIONS, OR INTERRUPTIONS THEREIN. S-NETWORK MAKES NO WARRANTY, EXPRESS OR IMPLIED, AS TO RESULTS TO BE OBTAINED BY LICENSEE, OWNERS OF THE FUND, OR ANY OTHER PERSON OR ENTITY FROM THE USE OF THE S-NETWORK GLOBAL TRAVEL INDEX OR ANY DATA INCLUDED THEREIN. S-NETWORK MAKES NO EXPRESS OR IMPLIED WARRANTIES, AND EXPRESSLY DISCLAIMS ALL WARRANTIES OF MERCHANTABILITY OR FITNESS FOR A PARTICULAR PURPOSE OR USE WITH RESPECT TO THE S-NETWORK GLOBAL TRAVEL INDEX OR ANY DATA INCLUDED THEREIN. WITHOUT LIMITING ANY OF THE FOREGOING, UNLESS ARISING AS A RESULT OF S-NETWORK'S (i) GROSS NEGLIGENCE OR WILLFUL MISCONDUCT, (ii) BREACH OF ITS CONFIDENTIALITY OBLIGATIONS: OR (iii) INDEMNIFICATION OBLIGATIONS, S-NETWORK SHALL NOT HAVE ANY LIABILITY FOR ANY SPECIAL, PUNITIVE, INDIRECT, OR CONSEQUENTIAL DAMAGES (INCLUDING LOST PROFITS), EVEN IF NOTIFIED OF THE POSSIBILITY OF SUCH DAMAGES.
The Adviser does not guarantee the accuracy and/or the completeness of the Underlying Index or any data included therein, and the Adviser shall have no liability for any errors, omissions or interruptions therein. The Adviser makes no warranty, express or implied, as to results to be obtained by the Fund, owners of the Shares of the Fund or any other person or entity from the use of the Underlying Index or any data included therein. The Adviser makes no express or implied warranties, and expressly disclaims all warranties of merchantability or fitness for a particular purpose or use with respect to the Underlying Index or any data included therein. Without limiting any of the foregoing, in no event shall the Adviser have any liability for any special, punitive, direct, indirect or consequential damages (including lost profits) arising out of matters relating to the use of the Underlying Index even if notified of the possibility of such damages.
ALPS Medical Breakthroughs ETF
The Fund is not sponsored, endorsed, sold or promoted by S-Network Global Indexes, Inc. (“Licensor”). Licensor makes no representation or warranty, express or implied, to the owners of the Fund or any member of the public regarding the advisability of investing in securities generally or in the Fund particularly or the ability of the Underlying Index to track the performance of the physical commodities market. Licensor’s only relationship to the Licensee is the licensing of certain service marks and trade names of Licensor and of the Underlying Index that is determined, composed and calculated by Licensor without regard to the Licensee or the Fund. Licensor has no obligation to take the needs of the Licensee or the owners of the Fund into consideration in determining, composing or calculating the Underlying Index. Licensor is not responsible for and has not participated in the determination of the timing of, prices at, or quantities of the Fund to be issued or in the determination or calculation of the equation by which the Fund is to be converted into cash. Licensor has no obligation or liability in connection with the administration, marketing or trading of the Fund.
| ALPS ETF Trust | |
| Additional Information | November 30, 2022 (Unaudited) |
LICENSOR DOES NOT GUARANTEE THE ACCURACY AND/OR THE COMPLETENESS OF THE UNDERLYING INDEX OR ANY DATA INCLUDED THEREIN AND LICENSOR SHALL HAVE NO LIABILITY FOR ANY ERRORS, OMISSIONS, OR INTERRUPTIONS THEREIN. LICENSOR MAKES NO WARRANTY, EXPRESS OR IMPLIED, AS TO RESULTS TO BE OBTAINED BY LICENSEE, OWNERS OF THE FUND, OR ANY OTHER PERSON OR ENTITY FROM THE USE OF THE UNDERLYING INDEX OR ANY DATA INCLUDED THEREIN. LICENSOR MAKES NO EXPRESS OR IMPLIED WARRANTIES, AND EXPRESSLY DISCLAIMS ALL WARRANTIES OF MERCHANTABILITY OR FITNESS FOR A PARTICULAR PURPOSE OR USE WITH RESPECT TO THE UNDERLYING INDEX OR ANY DATA INCLUDED THEREIN. WITHOUT LIMITING ANY OF THE FOREGOING, IN NO EVENT SHALL LICENSOR HAVE ANY LIABILITY FOR ANY SPECIAL, PUNITIVE, INDIRECT, OR CONSEQUENTIAL DAMAGES (INCLUDING LOST PROFITS), EVEN IF NOTIFIED OF THE POSSIBILITY OF SUCH DAMAGES.
Standard & Poor’s Custom Indexes serves as calculation agent for the Index. The Fund is not sponsored, endorsed, sold or promoted by Standard & Poor’s, a division of The McGraw-Hill Companies, Inc. (“S&P”) or its third party licensors. Neither S&P nor its third party licensors make any representation or warranty, express or implied, to the owners of the Fund or any member of the public regarding the advisability of investing in securities generally or in the Fund particularly or the ability of the Underlying Index to track general stock market performance. S&P’s and its third party licensor’s only relationship to S-Network Global Indexes, Inc. is the licensing of certain trademarks, service marks and trade names of S&P and/or its third party licensors and for the providing of calculation and maintenance services related to the Underlying Index. Neither S&P nor its third party licensors is responsible for and has not participated in the determination of the prices and amount of the Fund or the timing of the issuance or sale of the Fund or in the determination or calculation of the equation by which the Fund is to be converted into cash. S&P has no obligation or liability in connection with the administration, marketing or trading of the Fund.
NEITHER S&P, ITS AFFILIATES NOR THEIR THIRD PARTY LICENSORS GUARANTEE THE ADEQUACY, ACCURACY, TIMELINESS OR COMPLETENESS OF THE UNDERLYING INDEX OR ANY DATA INCLUDED THEREIN OR ANY COMMUNICATIONS, INCLUDING BUT NOT LIMITED TO, ORAL OR WRITTEN COMMUNICATIONS (INCLUDING ELECTRONIC COMMUNICATIONS) WITH RESPECT THERETO. S&P, ITS AFFILIATES AND THEIR THIRD PARTY LICENSORS SHALL NOT BE SUBJECT TO ANY DAMAGES OR LIABILITY FOR ANY ERRORS, OMISSIONS OR DELAYS THEREIN. S&P MAKES NO EXPRESS OR IMPLIED WARRANTIES, AND EXPRESSLY DISCLAIMS ALL WARRANTIES OF MERCHANTABILITY OR FITNESS FOR A PARTICULAR PURPOSE OR USE WITH RESPECT TO ITS TRADEMARKS, THE UNDERLYING INDEX OR ANY DATA INCLUDED THEREIN. WITHOUT LIMITING ANY OF THE FOREGOING, IN NO EVENT WHATSOEVER SHALL S&P, ITS AFFILIATES OR THEIR THIRD PARTY LICENSORS BE LIABLE FOR ANY INDIRECT, SPECIAL, INCIDENTAL, PUNITIVE OR CONSEQUENTIAL DAMAGES, INCLUDING BUT NOT LIMITED TO, LOSS OF PROFITS, TRADING LOSSES, LOST TIME OR GOODWILL, EVEN IF THEY HAVE BEEN ADVISED OF THE POSSIBILITY OF SUCH DAMAGES, WHETHER IN CONTRACT, TORT, STRICT LIABILITY OR OTHERWISE.
Standard & Poor’s®, and S&P® are registered trademarks of The McGraw-Hill Companies, Inc.; “Calculated by S&P Custom Indices” and its related stylized mark are service marks of The McGraw-Hill Companies, Inc. These marks have been licensed for use by S-Network Global Indexes, Inc.
The Adviser does not guarantee the accuracy and/or the completeness of the Underlying Index or any data included therein, and the Adviser shall have no liability for any errors, omissions or interruptions therein. The Adviser makes no warranty, express or implied, as to results to be obtained by the Fund, owners of the Shares of the Fund or any other person or entity from the use of the Underlying Index or any data included therein. The Adviser makes no express or implied warranties, and expressly disclaims all warranties of merchantability or fitness for a particular purpose or use with respect to the Underlying Index or any data included therein. Without limiting any of the foregoing, in no event shall the Adviser have any liability for any special, punitive, direct, indirect, or consequential damages (including lost profits) arising out of matters relating to the use of the Underlying Index, even if notified of the possibility of such damages.
| ALPS ETF Trust | |
| Board Considerations Regarding Approval of Investment Advisory Agreements | November 30, 2022 (Unaudited) |
ALPS Clean Energy ETF, ALPS Disruptive Technologies ETF, ALPS Medical Breakthroughs ETF
At a meeting held on June 21, 2022 via electronic means (video-conference), the Board of Trustees of the Trust (the “Board” or the “Trustees”), including the Trustees who are not “interested persons” of the Trust within the meaning of the Investment Company Act of 1940, as amended (the “Independent Trustees”), evaluated a proposal to approve the continuance of the Investment Advisory Agreements between the Trust and ALPS Advisors, Inc. (the “Adviser” or “AAI”) with respect to the ALPS Clean Energy ETF (“ACES”), the ALPS Disruptive Technologies ETF (“DTEC”) and the ALPS Medical Breakthroughs ETF (“SBIO”) (each “a Fund” and collectively the “Funds”). The Independent Trustees also met separately to consider each Investment Advisory Agreement.
In evaluating the Investment Advisory Agreements with respect to each Fund, the Board, including the Independent Trustees, considered various factors, including (i) the nature, extent and quality of the services provided by AAI with respect to the applicable Fund under the Investment Advisory Agreements; (ii) the advisory fees and other expenses paid by the Fund compared to those of similar funds managed by other investment advisers; (iii) the costs of the services provided to the Fund by AAI and the profits realized by AAI and its affiliates from its relationship to the Fund; (iv) the extent to which economies of scale have been or would be realized if and as the assets of the Fund grow and whether fees reflect the economies of scale for the benefit of shareholders; and (v) any additional benefits and other considerations.
With respect to the nature, extent and quality of the services provided by AAI under the Investment Advisory Agreements, the Board considered and reviewed information concerning the services provided under the Investment Advisory Agreements, the investment parameters of the index of each Fund, financial information regarding AAI and its parent company, information describing AAI’s current organization and the background and experience of the persons responsible for the day-to-day management of the Funds.
The Board reviewed information on the performance of each Fund and its applicable benchmark. The Board also evaluated the correlation and tracking error between each underlying index and its corresponding Fund’s performance. Based on this review, the Board, including the Independent Trustees found that the nature and extent of services provided to each Fund under the Investment Advisory Agreements was appropriate and that the quality was satisfactory.
The Board noted that the advisory fees for each Fund were unitary fees pursuant to which AAI assumes all expenses of the Funds (including the cost of transfer agency, custody, fund administration, legal, audit and other services) other than the payments under the Advisory Agreement, brokerage expenses, taxes, interest, litigation expenses and other extraordinary expenses.
With respect to advisory fee rates, the Board, including the Independent Trustees, noted the following:
The gross management fee rate for ACES is higher than the median of its FUSE expense group. The gross management fee rates for DTEC and SBIO are approximately equal to the median of their respective FUSE expense groups. DTEC's and SBIO's net expense ratios are at the median of their respective FUSE expense groups. ACES' net expense ratio is slightly above the median of its FUSE expense group.
Based on the foregoing, and the other information available to them, the Board, including the Independent Trustees, concluded that the advisory fee rate for each of the Funds was reasonable under the circumstances and in light of the quality of the services provided.
The Board, including the Independent Trustees, considered other benefits available to AAI because of its relationship with the Funds and concluded that the advisory fees were reasonable taking into account any such benefits.
The Board, including the Independent Trustees, also considered with respect to each Fund the information provided by AAI about the costs and profitability of AAI with respect to each of the Funds, including the asset levels and other factors that influence the profitability and financial viability of the Funds. The Board, including the Independent Trustees, reviewed and noted the relatively small sizes of DTEC and SBIO and concluded that AAI was not realizing any economies of scale. With respect to ACES, the Independent Trustees noted that the Fund’s asset levels have decreased over the prior year and that current profitability levels were not unreasonable. The Independent Trustees determined that AAI should continue to keep the Board informed on an ongoing basis of any significant developments (e.g., material increases in asset levels) so as to facilitate the Independent Trustees’ evaluation of whether further economies of scale have been achieved.
In voting to renew each Investment Advisory Agreement, the Board, including the Independent Trustees concluded that the terms of each Investment Advisory Agreement are reasonable and fair in light of the services to be performed, the fees paid by certain other funds, expenses to be incurred and such other matters as the members of the Board, including the Independent Trustees, considered relevant in the exercise of their reasonable business judgment. The Independent Trustees did not identify any single factor or group of factors as all important or controlling and considered all factors together.
| ALPS ETF Trust | |
| Trustees & Officers | November 30, 2022 (Unaudited) |
The general supervision of the duties performed by the Adviser for the Fund under the Investment Advisory Agreement is the responsibility of the Board of Trustees. The Trust currently has four Trustees, each of whom have no affiliation or business connection with the Adviser or any of its affiliated persons and do not own any stock or other securities issued by the Adviser. These are the “non-interested” or “independent” Trustees (“Independent Trustees”).
The Independent Trustees of the Trust, their term of office and length of time served, their principal business occupations during the past five years, the number of portfolios in the Fund Complex overseen by each Independent Trustee, and other directorships, if any, held by the Trustee are shown below.
| INDEPENDENT TRUSTEES | | |
| Name, Address & Year of Birth* | Position(s) Held with Trust | Term of Office and Length of Time Served** | Principal Occupation(s) During Past 5 Years | Number of Portfolios in Fund Complex Overseen by Trustees*** | Other Directorships Held by Trustees |
Mary K. Anstine, 1940 | Trustee | Since March 2008 | Ms. Anstine is Trustee/Director of AV Hunter Trust and Colorado Uplift Board. | 38 | Ms. Anstine is a Trustee of ALPS Variable Investment Trust (7 funds); Financial Investors Trust (29 funds); and Reaves Utility Income Fund. |
Jeremy W. Deems, 1976 | Trustee | Since March 2008 | Mr. Deems is the Co-Founder and Chief Financial Officer of Green Alpha Advisors, LLC, a registered investment advisor, and Co-Portfolio Manager of the Shelton Green Alpha Fund. | 38 | Mr. Deems is a Trustee of ALPS Variable Investment Trust (7 funds); Financial Investors Trust (29 funds); and Reaves Utility Income Fund; and Clough Funds Trust (1 fund). |
Rick A. Pederson, 1952 | Trustee | Since March 2008 | Mr. Pederson is Partner, Bow River Capital Partners (private equity management), 2003 - present; Board Member, Prosci Inc. (private business services) 2013-2016; Advisory Board Member, Citywide Banks (Colorado community bank) 2014- 2017; Board Member, Strong-Bridge Consulting, 2015- 2019; Board Member, IRI/ODMS Holdings LLC, 2017 – 2019; Director, National Western Stock Show (not for profit) 2010 - present; Director, History Colorado (not for profit) 2015- present; Director, Citywide Bank Advisory Board 2017-present; Trustee, Boettcher Foundation, 2018 -present. | 24 | Mr. Pederson is Trustee of Segall Bryant & Hamill Trust (14 funds), Principal Real Estate Income Fund (1 fund). |
| * | The business address of the Trustee is c/o ALPS Advisors, Inc., 1290 Broadway, Suite 1000, Denver, Colorado 80203. |
| ** | This is the period for which the Trustee began serving the Trust. Each Trustee serves an indefinite term, until his or her successor is elected. |
| *** | The Fund Complex includes all series of the Trust and any other investment companies for which ALPS Advisors, Inc. provides investment advisory services. |
| ALPS ETF Trust | |
| Trustees & Officers | November 30, 2022 (Unaudited) |
| Name, Address & Year of Birth* | Position(s) Held with Trust | Term of Office and Length of Time Served** | Principal Occupation(s) During Past 5 Years | Number of Portfolios in Fund Complex Overseen by Trustees*** | Other Directorships Held by Trustees |
Edmund J. Burke, 1961 | Trustee | Since December 2017 | Mr. Burke joined ALPS in 1991 and served as the President and Director of ALPS Holdings, Inc., and ALPS Advisors, Inc., and Director of ALPS Distributors, Inc., ALPS Fund Services, Inc. (“ALPS”), and ALPS Portfolio Solutions Distributor, Inc. (collectively, the “ALPS Companies”). Mr. Burke retired from the ALPS Companies in June 2019. Mr. Burke is currently a partner at ETF Action, a web-based system that provides data and analytics to registered investment advisers, (since 2020) and a Director of Alliance Bioenergy Plus, Inc., a technology company focused on emerging technologies in the renewable energy, biofuels, and bioplastics technology sectors (since 2020). | 33 | Mr. Burke is a Trustee of Clough Global Dividend and Income Fund (1 fund); Clough Global Equity Fund (1 fund); Clough Global Opportunities Fund (1 fund); Clough Funds Trust (1 fund); Liberty All-Star Equity Fund (1 fund); Director of the Liberty All-Star Growth Fund, Inc. (1 fund) and Financial Investors Trust (29 funds). |
| * | The business address of the Trustee is c/o ALPS Advisors, Inc., 1290 Broadway, Suite 1000, Denver, Colorado 80203. |
| ** | This is the period for which the Trustee began serving the Trust. Each Trustee serves an indefinite term, until his or her successor is elected. |
| *** | The Fund Complex includes all series of the Trust and any other investment companies for which ALPS Advisors, Inc. provides investment advisory services. |
| ALPS ETF Trust | |
| Trustees & Officers | November 30, 2022 (Unaudited) |
| OFFICERS: | |
| Name, Address and Year of Birth of Officer* | Position(s) Held with Trust | Length of Time Served** | Principal Occupation(s) During Past 5 Years |
Laton Spahr, 1975 | President | Since June 2021 | Mr. Spahr joined ALPS in 2019 and currently serves as President and Portfolio Manager of AAI. Prior to his current role, Mr. Spahr was a Senior Vice President and Strategy Leader of the Value & Income Team for Oppenheimer Funds from 2013 to 2019. |
Matthew Sutula, 1985 | Chief Compliance Officer (“CCO”) | Since December 2019 | Mr. Sutula joined ALPS in 2012 and currently serves as Chief Compliance Officer of AAI. Prior to his current role, Mr. Sutula served as interim Compliance Officer of the Trust (September 2019 to December 2019). Compliance Manager and Senior Compliance Analyst for AAI, as well as Compliance Analyst for AFS. Prior to joining ALPS, he spent seven years at Morningstar, Inc. in various analyst roles supporting the registered investment company databases. Mr. Sutula is also Chief Compliance Officer of Principal Real Estate Income Fund, ALPS Variable Investment Trust, Liberty All-Star Equity Fund and Liberty All-Star Growth Fund, Inc. From September 2019 to September 2022 he served as Chief Compliance Officer of RiverNorth Opportunities Fund, Inc. |
Kathryn Burns, 1976 | Treasurer | Since September 2018 | Ms. Burns serves as Vice President, Director of Fund Operations of AAI since 2018. From 2013 to 2018, she served as Vice President and Fund Controller at AFS. Prior to joining ALPS, she worked at Old Mutual Capital where she served as Vice President and Chief Compliance Officer (2010 – 2012) and Regulatory Reporting Manager and Assistant Treasurer to the Old Mutual Funds Trusts (2006 – 2012). She also served as a CPA for PricewaterhouseCoopers LLP. Ms. Burns also serves as President of ALPS Variable Investment Trust and Principal Real Estate Income Fund. From June 2019 to September 2022 she served as President of RiverNorth Opportunities Fund, Inc. and from June 2018 to November 2021 she served as Treasurer of Boulder Growth & Income Fund, Inc. |
Michael P. Lawlor, 1969 | Secretary | Since December 2022 | Mr. Lawlor joined ALPS in January 2022, and is currently Vice President and Principal Legal Counsel. Prior to joining ALPS, Mr. Lawlor was Lead Fund Counsel at Brighthouse Financial (insurance company) (January 2007-April 2021). Mr. Lawlor also serves as Secretary of Financial Investors Trust and ALPS Variable Investment Trust. |
| * | The business address of each Officer is c/o ALPS Advisors, Inc., 1290 Broadway, Suite 1000, Denver, Colorado 80203. Each Officer is deemed an affiliate of the Trust as defined under the 1940 Act. |
| ** | This is the period for which the Officer began serving the Trust. Each Officer serves an indefinite term, until his or her successor is elected. |
The Statement of Additional Information includes additional information about the Fund’s Trustees and is available, without charge, upon request by calling (toll-free) 1-866-759-5679.


Table of Contents
| Performance Overview | 1 |
| Disclosure of Fund Expenses | 13 |
| Report of Independent Registered Public Accounting Firm | 14 |
| Financial Statements | |
| Schedule of Investments | 15 |
| Statements of Assets and Liabilities | 22 |
| Statements of Operations | 23 |
| Statements of Changes in Net Assets | 24 |
| Financial Highlights | 28 |
| Notes to Financial Statements | 32 |
| Additional Information | 41 |
| Board Considerations Regarding Approval of Investment Advisory Agreements | 43 |
| Trustees and Officers | 44 |
alpsfunds.com
| ALPS Sector Dividend Dogs ETF | |
| Performance Overview | November 30, 2022 (Unaudited) |
Investment Objective
The ALPS Sector Dividend Dogs ETF (the “Fund” or “SDOG”) seeks investment results that replicate as closely as possible, before fees and expenses, the performance of the S-Network® Sector Dividend Dogs Index (the “Underlying Index”).
The Underlying Index is a rules based index intended to give investors a means of tracking the overall performance of the highest dividend paying stocks (i.e. “Dividend Dogs”) in the S&P 500® Total Return Index (“SPX”) on a sector-by-sector basis. “Dividend Dogs” refers to the five stocks in each of the Global Industry Classification Standard (“GICS”) sectors, excluding the Real Estate sector, that make up the S&P 500® Total Return Index which offer the highest dividend yields.
Performance Overview
The ALPS Sector Dividend Dogs ETF, for the twelve-month period ended November 30, 2022, generated a total return of 10.42%, in-line with the Fund’s Underlying Index, net of fees, which returned 10.81%. The Fund greatly outperformed the S&P 500® Total Return Index (S&P 500), which returned -9.21% for the same period.
The trailing twelve-month (TTM) yield for the Fund’s underlying constituents as of November 30, 2022 was 3.77% vs. 1.57% for the S&P 500®.
The S&P 500 returned -9.21% for the TTM period ended November 30, 2022, as fiscal year 2022 saw the worst drawdown for equities since the pandemic. Pressured by the Federal Reserve (Fed) raising interest rates to combat inflation, markets adjusted equity values to reflect a forward-looking slowed economy. Main macroeconomic talking points throughout 2022 centered on the path of future interest rates driven by monetary policy, and inflation sustaining levels well above the Fed’s 2% inflation target. Inflation fears continued to be justified with the year-over-year Consumer Price Index (CPI) surging above 9% in June, along with core inflation readings maintaining levels above 6%. Despite the quantitative tightening efforts in 2022, many economic indicators remain strong including consumer spending, wage growth and low unemployment in the US, offering a sliver of hope for a soft landing. Global supply chains were relieved of backlogs and most delays stemming from COVID-19 restrictions, benefitting company margins and lowering some pressure on prices of inflated goods. The latest economic data shows US Real GDP year-over-year rising 1.9% in the U.S., offset by CPI of 7.7%. Looking forward, markets have likely discounted a significant portion of quantitative tightening as the S&P 500 Price-to-Earnings ratio is below its 10-year average, and any pause or pivot in rate hikes would serve as a positive catalyst for U.S. and global equities.
Compared to the S&P 500, the Fund saw a positive impact from security selection and asset allocation, leading to an approximately 2,000 bps outperformance over the S&P 500. The asset allocation outperformance was largely driven by relative over-weightings to cyclical sectors including Energy and Materials, while the security selection outperformance was mainly attributed to SDOG’s selection of high-yielding value securities across all sectors (excluding the Real Estate sector) that far outperformed core and growth year-to-date. The Fund also saw a negative impact (-7.48%) from selection effect, with Information Technology lagging all other sectors and detracting 3.32%. The Fund’s Health Care, Energy, and Industrials sectors led in terms of contribution to overall return over the TTM period.
The best performing stocks in the fund for the period were Valero Energy Corp. (VLO), which increased 106.85%, Exxon Mobil Corp. (XOM), which saw a gain of 93.39%, and Cardinal Health Inc. (CAH), rising 79.58%. The largest detractors for the Fund were Lumen Technologies Inc. (LUMN), which decreased 52.60%, VF Corp. (VFC), which fell 52.30%, and Seagate Technology Holdings (STX), which lost 41.15%.
Looking ahead, the Fund’s strategy of annually selecting the five highest yielding securities in each of the ten sectors (excluding the Real Estate sector) in the S&P 500 is intended to provide meaningfully higher yield relative to the S&P 500, the potential for market participation in all economic cycles through equal sector weighting, and a portfolio of securities that is identified through low valuations and high yield relative to sector peers.
Performance (as of November 30, 2022)
| | 1 Year | 5 Year | 10 Years | Since Inception^ |
| ALPS Sector Dividend Dogs ETF – NAV | 10.42% | 7.29% | 11.26% | 11.60% |
| ALPS Sector Dividend Dogs ETF – Market Price* | 10.46% | 7.29% | 11.25% | 11.60% |
| S-Network® Sector Dividend Dogs Total Return Index | 10.81% | 7.73% | 11.76% | 12.10% |
| S&P 500® Total Return Index | -9.21% | 10.98% | 13.34% | 13.29% |
Total Expense Ratio (per the current prospectus) 0.40%.
1 | November 30, 2022
| ALPS Sector Dividend Dogs ETF | |
| Performance Overview | November 30, 2022 (Unaudited) |
Performance data quoted represents past performance. Past performance does not guarantee future results. Total return figures assume reinvestment of dividends and capital gains distributions, if any. The table does not reflect the deduction of taxes that a shareholder would pay on Fund distributions or the redemption of Fund shares. Investment return and principal value of an investment will fluctuate so that an investor’s shares, when sold or redeemed, may be worth more or less than the original cost. Current performance data may be higher or lower than actual data quoted. For the most current month-end performance data please visit www.alpsfunds.com or call 1.866.675.2639.
Net Asset Value (NAV) is an exchange-traded fund’s per-share value. The per-share dollar amount of the Fund is derived by dividing the total value of all the securities in its portfolio, less any liabilities, by the number of Fund shares outstanding. Market Price is the price at which a share can currently be traded in the market. Information detailing the number of days the Market Price of the Fund was greater than the Fund’s NAV and the number of days it was less than the Fund’s NAV can be obtained at www.alpsfunds.com.
| ^ | The Fund Commencement Date was June 29, 2012. |
| * | Market Price means the official closing price of a share or, if it more accurately reflects the market value of a share at the time as of which the Fund calculates current net asset value per share, the price that is the midpoint of the bid-ask spread as of that time. It does not represent the returns an investor would receive if shares were traded at other times. The S-Network® Sector Dividend Dogs Total Return Index is designed to serve as a fair, impartial and transparent measure of the performance of US large cap equities with above average dividend yields. The Underlying Index is a portfolio of fifty stocks derived from the S&P 500® Index. The index is reported on a total return basis, which assumes reinvestment of any dividends and distributions realized during a given time period. |
The S&P 500® Total Return Index is an index of 500 stocks chosen for market size, liquidity and industry grouping among other factors. Total return assumes reinvestment of any dividends and distributions realized during a given time period.
The indexes are not actively managed and do not reflect any deductions for fees, expenses or taxes. One cannot invest directly in an index. Index performance does not reflect fund performance.
The Fund’s shares are not individually redeemable. Investors buy and sell shares of the Fund on a secondary market. Only market makers or “authorized participants” may trade directly with the Fund, typically in blocks of 25,000 shares.
The ALPS Sector Dividend Dogs ETF is not suitable for all investors. Investments in the Fund are subject to investment risks, including possible loss of the principal amount invested.
ALPS Portfolio Solutions Distributor, Inc., a FINRA member, is the distributor for the ETF.
2 | November 30, 2022
ALPS Sector Dividend Dogs ETF | |
| Performance Overview | November 30, 2022 (Unaudited) |
Top 10 Holdings* (as of November 30, 2022)
| Gilead Sciences, Inc. | | | 2.60 | % |
| Hewlett Packard Enterprise Co. | | | 2.41 | % |
| Interpublic Group of Cos., Inc. | | | 2.32 | % |
| Valero Energy Corp. | | | 2.28 | % |
| Amgen, Inc. | | | 2.23 | % |
| Exxon Mobil Corp. | | | 2.23 | % |
| International Business Machines Corp. | | | 2.23 | % |
| Lockheed Martin Corp. | | | 2.22 | % |
| Cummins, Inc. | | | 2.22 | % |
| Cardinal Health, Inc. | | | 2.21 | % |
| Total % of Top 10 Holdings | | | 22.95 | % |
Sector Allocation* (as of November 30, 2022)
| Health Care | | | 11.45 | % |
| Energy | | | 10.63 | % |
| Industrials | | | 10.40 | % |
| Consumer Staples | | | 10.38 | % |
| Financials | | | 10.27 | % |
| Information Technology | | | 10.07 | % |
| Materials | | | 9.68 | % |
| Communication Services | | | 9.54 | % |
| Utilities | | | 9.30 | % |
| Consumer Discretionary | | | 8.26 | % |
| Money Market Fund | | | 0.02 | % |
| Total | | | 100.00 | % |
| * | % of Total Investments (excluding investments purchased with collateral from securities loaned). |
Future holdings are subject to change.
Growth of $10,000 (as of November 30, 2022)
Comparison of Change in Value of $10,000 Investment in the Fund and the Indexes
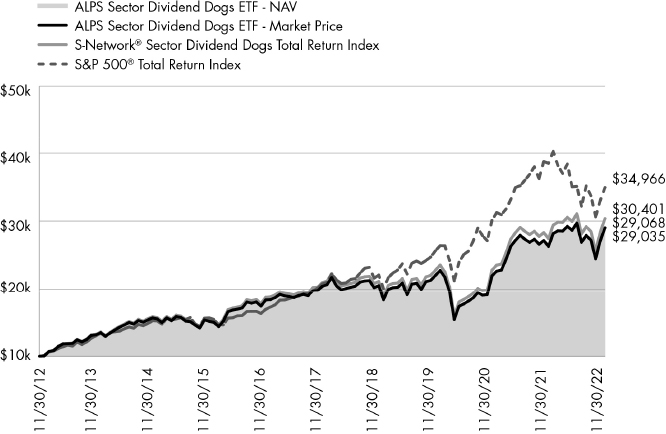
The chart above compares historical performance of a hypothetical investment of $10,000 in the Fund over the past ten years with the performance of the Fund’s benchmark index. Results include the reinvestment of all dividends and capital gains distributions. Past performance does not guarantee future results. The graph does not reflect the deduction of taxes that a shareholder would pay on Fund distributions or the redemption of Fund shares.
3 | November 30, 2022
ALPS International Sector Dividend Dogs ETF | |
| Performance Overview | November 30, 2022 (Unaudited) |
Investment Objective
The ALPS International Sector Dividend Dogs ETF (the “Fund” or “IDOG”) seeks investment results that replicate as closely as possible, before fees and expenses, the performance of the S-Network® International Sector Dividend Dogs Net Total Return Index (the “Underlying Index”).
The Underlying Index is a rules-based index intended to give investors a means of tracking the overall performance of the highest dividend paying stocks (i.e. “Dividend Dogs”) in the S-Network® Developed Markets (ex NA) Index, a universe of mainly large capitalization stocks in international developed markets not located in the Americas (the “S-Net Developed Markets”) on a sector-by-sector basis. “Dividend Dogs” refers to the five stocks in each of the Global Industry Classification Standard (“GICS”) sectors, excluding the Real Estate sector, that make up the S-Net Developed Markets which offer the highest dividend yields.
Performance Overview
The ALPS International Sector Dividend Dogs ETF, for the trailing twelve-month period ended November 30, 2022, generated a total return of 1.92%, relatively in-line with the Fund’s Underlying Index, net of fees, which returned 2.15%. The Fund greatly outperformed the Morningstar Developed Markets ex-North America Index (MSDINUS), which returned -11.63% for the same period.
The trailing twelve-month (TTM) yield for the Fund’s constituents as of November 30, 2022 was 4.18%, compared to the MSDINUS yield of 3.29%.
Developed Markets (ex-U.S.), as represented by the MSDINUS, returned -11.63% for the TTM period ended November 30, 2022 compared to the S&P 500® Total Return Index return of -9.21%, as the fiscal year 2022 saw the worst drawdown for equities since the pandemic. Pressured by the Federal Reserve (Fed) raising interest rates to combat inflation, markets adjusted equity values to reflect a forward-looking slowed economy. Main macroeconomic talking points throughout 2022 centered on the path of future interest rates driven by monetary policy, and inflation sustaining levels well above the Fed’s 2% inflation target. Inflation fears continued to be justified with the year-over-year Consumer Price Index surging above 9% in June, along with core inflation readings maintaining levels above 6%. Despite the quantitative tightening efforts in 2022, many economic indicators remain strong, including consumer spending, wage growth and low unemployment across developed and emerging markets, offering a sliver of hope for a soft landing. Global supply chains were relieved of backlogs and most delays stemming from COVID-19 restrictions, benefitting company margins and lowering some pressure on prices of inflated goods. The latest economic data shows Real GDP year-over-year rising 1.9% in the U.S., 2.3% in the Eurozone, 1.8% in Japan and 3.9% in China. Looking forward, global markets have likely discounted a significant portion of quantitative tightening as global stocks, as measured by the MSDINUS, exhibits a Price-to-Earnings ratio below its 10-year average, with any pause or pivot in rate hikes across developed central banks serving as a positive catalyst for global equities.
Compared to the MSDINUS, the Fund saw a positive impact from security selection and asset allocation, leading to a 1,355 bps outperformance over the index. The asset allocation outperformance was largely driven by relative over-weightings to cyclical sectors including Energy, Materials and Industrials, while the security selection outperformance was mainly attributed to IDOG’s selection of high-yielding value securities across all sectors (excluding the Real Estate sector) that far outperformed core and growth year-to-date. Conversely, the Fund’s relative overweight to the Communication Services sector detracted from positive performance.
From a geographical perspective, the highest contribution to return was attributed to holdings based in Australia, while the Fund’s performance was adversely impacted by holdings based in Sweden.
The best-performing stocks for the TTM period were Repsol SA (REP SM), which increased 45.75%, BP Plc. (BP/ LN), which returned 43.65%, and TotalEnergies SE (TTE FP), which gained 43.61%. The worst performing stocks for the TTM period were Ericsson LM (ERICB SS), losing 40.76%, Tokyo Electron LTD (8035 JP), falling 37.94%; and Hennes & Mauritz AB (HMB SS), which decreased 37.57%.
Looking ahead, the Fund’s strategy of annually selecting the five highest-yielding securities in each of the ten sectors in the S-Network Developed Markets (Ex NA) Index is intended to provide a high yield relative to the MSDINUS, the potential for market participation in all economic cycles through equal sector weighting, and a portfolio of securities that is identified through low valuations and high yield relative to sector peers.
Performance (as of November 30, 2022)
| | 1 Year | 5 Year | Since Inception^ |
| ALPS International Sector Dividend Dogs ETF – NAV | 1.92% | 2.54% | 4.46% |
| ALPS International Sector Dividend Dogs ETF – Market Price* | 2.86% | 2.55% | 4.52% |
| S-Network® International Sector Dividend Dogs Net Total Return Index | 2.15% | 2.90% | 4.85% |
Morningstar® Developed Markets ex-North America Net Total Return Index | -11.63% | 1.58% | 4.54% |
Total Expense Ratio (per the current prospectus) 0.50%.
4 | November 30, 2022
ALPS International Sector Dividend Dogs ETF | |
| Performance Overview | November 30, 2022 (Unaudited) |
Performance data quoted represents past performance. Past performance does not guarantee future results. Total return figures assume reinvestment of dividends and capital gains distributions, if any. The table does not reflect the deduction of taxes that a shareholder would pay on Fund distributions or the redemption of Fund shares. Investment return and principal value of an investment will fluctuate so that an investor’s shares, when sold or redeemed, may be worth more or less than the original cost. Current performance data may be higher or lower than actual data quoted. For the most current month-end performance data please visit www.alpsfunds.com or call 1.866.675.2639.
Net Asset Value (NAV) is an exchange-traded fund’s per-share value. The per-share dollar amount of the Fund is derived by dividing the total value of all the securities in its portfolio, less any liabilities, by the number of Fund shares outstanding. Market Price is the price at which a share can currently be traded in the market. Information detailing the number of days the Market Price of the Fund was greater than the Fund’s NAV and the number of days it was less than the Fund’s NAV can be obtained at www.alpsfunds.com.
| ^ | The Fund Commencement Date was June 28, 2013. |
| * | Market Price means the official closing price of a share or, if it more accurately reflects the market value of a share at the time as of which the Fund calculates current net asset value per share, the price that is the midpoint of the bid-ask spread as of that time. It does not represent the returns an investor would receive if shares were traded at other times. |
The S-Network® International Sector Dividend Dogs Net Total Return Index is designed to serve as a fair, impartial and transparent measure of the performance of international large cap equities with above average dividend yields. The Underlying Index is a portfolio of fifty stocks derived from the S-Network International Developed Markets (ex-Americas) Index. Total Return assumes reinvestment of any dividends and distributions realized during a given time period. Net Total Return (NTR) is obtained by reinvesting the net dividend, which is equal to the ordinary gross dividend minus the amount of withholding tax.
Morningstar® Developed Markets ex-North America Net Total Return Index measures the performance of companies in developed markets ex-North America. It covers approximately 97% of the full market capitalization in the Developed Markets ex-North America.
The indexes are not actively managed and do not reflect any deductions for fees, expenses or taxes. One cannot invest directly in an index. Index performance does not reflect fund performance.
The Fund’s shares are not individually redeemable. Investors buy and sell shares of the Fund on a secondary market. Only market makers or “authorized participants” may trade directly with the Fund, typically in blocks of 25,000 shares.
The ALPS International Sector Dividend Dogs ETF is not suitable for all investors. Investments in the Fund are subject to investment risks, including possible loss of the principal amount invested.
ALPS Portfolio Solutions Distributor, Inc., a FINRA member, is the distributor for the ETF.
5 | November 30, 2022
ALPS International Sector Dividend Dogs ETF | |
| Performance Overview | November 30, 2022 (Unaudited) |
Top 10 Holdings* (as of November 30, 2022)
| Eni SpA | | | 2.37 | % |
| OMV AG | | | 2.34 | % |
| TotalEnergies SE | | | 2.34 | % |
| SAP SE | | | 2.33 | % |
| Japan Tobacco, Inc. | | | 2.27 | % |
| Bayerische Motoren Werke AG | | | 2.26 | % |
| Anglo American PLC | | | 2.25 | % |
| Rio Tinto PLC | | | 2.21 | % |
| Swedbank AB | | | 2.21 | % |
| Sumitomo Corp. | | | 2.21 | % |
| Total % of Top 10 Holdings | | | 22.79 | % |
Sector Allocation* (as of November 30, 2022)
| Energy | | | 11.36 | % |
| Materials | | | 10.82 | % |
| Financials | | | 10.24 | % |
| Industrials | | | 10.17 | % |
| Health Care | | | 10.07 | % |
| Consumer Staples | | | 9.95 | % |
| Consumer Discretionary | | | 9.76 | % |
| Utilities | | | 9.67 | % |
| Information Technology | | | 9.39 | % |
| Communication Services | | | 8.45 | % |
| Money Market Fund | | | 0.12 | % |
| Total | | | 100.00 | % |
| | | | | |
| * | % of Total Investments (excluding investments purchased with collateral from securities loaned). |
Future holdings are subject to change.
Growth of $10,000 (as of November 30, 2022)
Comparison of Change in Value of $10,000 Investment in the Fund and the Indexes
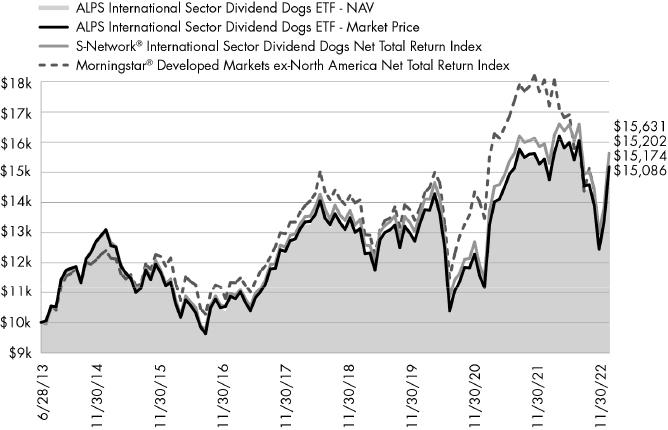
The chart above compares historical performance of a hypothetical investment of $10,000 in the Fund since inception with the performance of the Fund’s benchmark index. Results include the reinvestment of all dividends and capital gains distributions. Past performance does not guarantee future results. The graph does not reflect the deduction of taxes that a shareholder would pay on Fund distributions or the redemption of Fund shares.
6 | November 30, 2022
ALPS Emerging Sector Dividend Dogs ETF | |
| Performance Overview | November 30, 2022 (Unaudited) |
Investment Objective
The ALPS Emerging Sector Dividend Dogs ETF (the “Fund” or “EDOG”) seeks investment results that replicate as closely as possible, before fees and expenses, the performance of the S-Network® Emerging Sector Dividend Dogs Net Total Return Index (the “Underlying Index”).
The Underlying Index is a rules-based index intended to give investors a means of tracking the overall performance of the highest dividend paying stocks (i.e. “Dividend Dogs”) in the S-Network® Emerging Markets Index, a universe of mainly large capitalization stocks domiciled in emerging markets (the ��S-Network Emerging Markets”) on a sector-by-sector basis. “Dividend Dogs” refers to the five stocks in each of the Global Industry Classification Standard (“GICS”) sectors, excluding the real estate sector, that make up the S-Network® Emerging Markets which offer the highest dividend yields. Emerging market countries are countries that major international financial institutions, such as the World Bank, generally consider to be less economically mature than developed nations.
Performance Overview
The ALPS Emerging Sector Dividend Dogs ETF, for the trailing twelve-month period ended November 30, 2022, generated a total return of -5.20%, relatively in-line with the Fund’s Underlying Index, net of fees, which returned -4.43%. The Fund outperformed the Morningstar Emerging Markets Index (MEMMN), which returned -15.44% for the same period. It is important to note that the excess return difference of the benchmark and the Fund was partially attributed to the removal and delisting of Russian securities, which were essentially worthless after Russia’s invasion of Ukraine.
The trailing twelve-month (TTM) yield for the Fund’s constituents as of November 30, 2022 was 4.66% vs. 3.60% for the MEMMN.
Through the first half of the year, emerging markets benefitted from the continued recovery from the COVID-19 pandemic, as countries saw growth in export volumes and consumption. Despite higher inflation and weakening currencies relative to the U.S. dollar, emerging markets exhibited strong support from increased activity. The TTM period saw emerging market equities underperform broad U.S. indexes, a result of a stronger dollar, as Fiscal year 2022 saw the worst drawdown for equities since the pandemic. Pressured by the Federal Reserve (Fed) raising interest rates to combat inflation, markets adjusted equity values to reflect a forward-looking slowed economy. Main macroeconomic talking points throughout 2022 centered on the path of future interest rates driven by monetary policy, and inflation sustaining levels well above the Fed’s 2% inflation target. Inflation fears continued to be justified with the year-over-year Consumer Price Index surging in the high double-digits across many emerging market countries. Global supply chains were relieved of backlogs and most delays stemming from COVID-19 restrictions, benefitting company margins and lowering some pressure on prices of inflated goods. The latest economic data shows Real GDP year-over-year rising 1.9% in the U.S., 2.3% in the Eurozone, 1.8% in Japan and 3.9% in China. China continues to pose significant headwinds for emerging market performance as U.S. regulators threaten to potentially delist a number of Chinese equities on U.S. exchanges along with the global impact of China’s COVID-zero policy, although positive reforms point to a relaxation of strict mandates in the near future. Looking forward, emerging markets have likely discounted a significant portion of quantitative tightening. Global stocks, as measured by the MEMMN, that exhibit Price-to-Earnings ratios below their 10-year averages, along with any pause or pivot in rate hikes across developed central banks or a weaker dollar, will likely serve as positive catalysts for global and emerging market equities.
Compared to the MEMMN, the Fund saw a positive impact from security selection and asset allocation, leading to a 1,024 bps outperformance over the index. The asset allocation outperformance was largely driven by relative overweight to the Energy sector and relative underweight to the Information Technology sector, a result of the equal sector weighting strategy. Security selection outperformance was mainly attributed to EDOG’s selection of high-yielding value securities across all sectors (excluding the Real Estate sector) that far outperformed core and growth year-to-date.
From a geographical perspective, the highest contribution to return was attributed to holdings based in South Africa. The Fund’s performance was adversely impacted by holdings based in Russia.
The best-performing stocks for the period were Petroleo Brasileiro SA (PETR3 BZ), which increased 71.68%, Exxaro Resources Ltd. (EXX SJ), gaining 60.03%, and Bim Birlesik Magazalar AS (BIMAS TI), which gained 56.47%. The worst-performing stocks for the TTM period were Magnit PJSC (MGNT TI), losing 99.92%, Severstal (SVST LI), which fell 99.70%; and Novolipetsk Steel PJSC (NLMK LI), decreasing 98.93%.
Looking ahead, the Fund’s strategy of annually selecting the five highest-yielding securities in each of the ten sectors in the S-Net Emerging Markets Index is intended to provide high yield relative to the MEMMN, potential for market participation in all economic cycles through equal sector weighting, and a portfolio of securities that is identified through low valuations and high yield relative to sector peers.
7 | November 30, 2022
| ALPS Emerging Sector Dividend Dogs ETF | |
| Performance Overview | November 30, 2022 (Unaudited) |
Performance (as of November 30, 2022)
| | 1 Year | 5 Year | Since Inception^ |
| ALPS Emerging Sector Dividend Dogs ETF – NAV | -5.20% | 1.76% | 2.15% |
| ALPS Emerging Sector Dividend Dogs ETF – Market Price* | -5.00% | 1.69% | 2.16% |
| S-Network® Emerging Sector Dividend Dogs Net Total Return Index | -4.43% | 2.53% | 2.98% |
| Morningstar® Emerging Markets Net Total Return Index | -15.44% | 0.72% | 3.20% |
Total Expense Ratio (per the current prospectus) 0.60%.
Performance data quoted represents past performance. Past performance does not guarantee future results. Total return figures assume reinvestment of dividends and capital gains distributions, if any. The table does not reflect the deduction of taxes that a shareholder would pay on Fund distributions or the redemption of Fund shares. Investment return and principal value of an investment will fluctuate so that an investor’s shares, when sold or redeemed, may be worth more or less than the original cost. Current performance data may be higher or lower than actual data quoted. For the most current month-end performance data please visit www.alpsfunds.com or call 1.866.675.2639.
Net Asset Value (NAV) is an exchange-traded fund’s per-share value. The per-share dollar amount of the Fund is derived by dividing the total value of all the securities in its portfolio, less any liabilities, by the number of Fund shares outstanding. Market Price is the price at which a share can currently be traded in the market. Information detailing the number of days the Market Price of the Fund was greater than the Fund’s NAV and the number of days it was less than the Fund’s NAV can be obtained at www.alpsfunds.com.
| ^ | The Fund Commencement Date was March 28, 2014. |
| * | Market Price means the official closing price of a share or, if it more accurately reflects the market value of a share at the time as of which the Fund calculates current net asset value per share, the price that is the midpoint of the bid-ask spread as of that time. It does not represent the returns an investor would receive if shares were traded at other times. |
The S-Network® Emerging Sector Dividend Dogs Net Total Return Index is a portfolio of stocks derived from a universe of mainly large capitalization stocks domiciled in emerging markets (the “S-Network Emerging Markets Index” or “SNEMX”). The index methodology selects the five stocks in each of the GICS sectors, excluding the real estate sector, that make up the universe which offer the highest dividend yields as of the last trading day of November. The fifty stocks that are selected for inclusion in the portfolio are equally weighted. The universe includes stocks whose domicile and primary exchange listings are in countries identified by the World Bank as Upper Middle Income (certain lower middle income countries are also included, as well as stocks traded on the Taiwan Stock Exchange despite non-recognition by the World Bank). The selection criteria for the universe, in addition to the aforementioned country qualifications, also include requirements for sector inclusion, primary exchange listing, minimum market capitalization, share price, average daily trading volume and other factors. Total Return assumes reinvestment of any dividends and distributions realized during a given time period. Net Total Return (NTR) is obtained by reinvesting the net dividend, which is equal to the ordinary gross dividend minus the amount of withholding tax.
Morningstar® Emerging Markets Net Total Return Index measures the performance of emerging markets targeting the top 97% of stocks by market capitalization. The indexes are not actively managed and do not reflect any deductions for fees, expenses or taxes. One cannot invest directly in an index. Index performance does not reflect fund performance.
The Fund’s shares are not individually redeemable. Investors buy and sell shares of the Fund on a secondary market. Only market makers or “authorized participants” may trade directly with the Fund, typically in blocks of 25,000 shares.
The ALPS Emerging Sector Dividend Dogs ETF is not suitable for all investors. Investments in the Fund are subject to investment risks, including possible loss of the principal amount invested.
ALPS Portfolio Solutions Distributor, Inc., a FINRA member, is the distributor for the ETF.
8 | November 30, 2022
| ALPS Emerging Sector Dividend Dogs ETF |
| Performance Overview | November 30, 2022 (Unaudited) |
| Top 10 Holdings* (as of November 30, 2022) | | |
| | | |
| Turkcell Iletisim Hizmetleri AS | | | 2.60 | % |
| Enka Insaat ve Sanayi AS | | | 2.54 | % |
| Eregli Demir ve Celik Fabrikalari TAS | | | 2.48 | % |
| Ford Otomotiv Sanayi AS | | | 2.39 | % |
| Enel Chile SA | | | 2.31 | % |
| Kimberly-Clark de Mexico SAB de CV | | | 2.29 | % |
| Globe Telecom, Inc. | | | 2.29 | % |
| Powszechny Zaklad Ubezpieczen SA | | | 2.28 | % |
| El Puerto de Liverpool SAB de CV | | | 2.28 | % |
| LPP SA | | | 2.21 | % |
| Total % of Top 10 Holdings | | | 23.67 | % |
| Sector Allocation* (as of November 30, 2022) | | |
| | | |
| Communication Services | | | 10.86 | % |
| Health Care | | | 10.55 | % |
| Industrials | | | 10.52 | % |
| Consumer Discretionary | | | 10.28 | % |
| Materials | | | 10.20 | % |
| Financials | | | 10.09 | % |
| Information Technology | | | 9.73 | % |
| Utilities | | | 9.41 | % |
| Consumer Staples | | | 9.35 | % |
| Energy | | | 8.77 | % |
| Money Market Fund | | | 0.24 | % |
| Total | | | 100.00 | % |
| * | % of Total Investments (excluding investments purchased with collateral from securities loaned). |
Future holdings are subject to change.
Growth of $10,000 (as of November 30, 2022)
Comparison of Change in Value of $10,000 Investment in the Fund and the Indexes
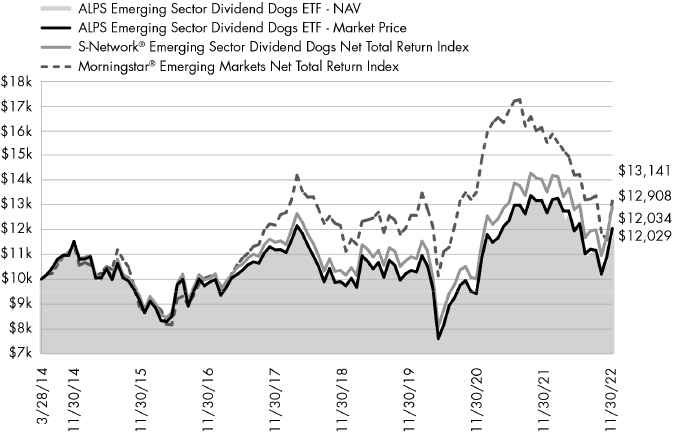
The chart above compares historical performance of a hypothetical investment of $10,000 in the Fund since inception with the performance of the Fund’s benchmark index. Results include the reinvestment of all dividends and capital gains distributions. Past performance does not guarantee future results. The graph does not reflect the deduction of taxes that a shareholder would pay on Fund distributions or the redemption of Fund shares.
9 | November 30, 2022
| ALPS REIT Dividend Dogs ETF | |
| Performance Overview | November 30, 2022 (Unaudited) |
Investment Objective
The ALPS REIT Dividend Dogs ETF (the “Fund” or "RDOG") seeks investment results that replicate as closely as possible, before fees and expenses, the performance of the S-Network® REIT Dividend Dogs Total Return Index (the “Underlying Index”).
The Underlying Index is a rules-based index intended to give investors a means of tracking the overall performance of the highest dividend paying real estate investment trusts (“REITs”) (i.e. “Dividend Dogs”) in the S-Network® Composite US REIT Index, a universe of mainly REITs listed in the United States (the “S-Net U.S. REIT” or "SNREIT"), on a segment-by-segment basis. “Dividend Dogs” refers to the five REITs in each of the nine segments that make up the S-Net U.S. REIT which offer the highest dividend yields.
Performance Overview
The ALPS REIT Dividend Dogs ETF, for the twelve-month period ended November 30, 2022, generated a total return of -13.06%, slightly underperforming the Fund’s Underlying Index, net of fees, which returned -12.76%. The Fund outperformed the broader U.S. REIT market, as represented by the S-Network Composite US REIT Index (SNREIT), which returned -13.86% for the same period.
The trailing twelve-month (TTM) yield for the Fund as of November 30, 2022 was 4.87% while the SNREIT TTM yield was 4.36%.
The S&P 500® Total Return Index (S&P 500) returned -9.21% for the TTM period ended November 30, 2022, as fiscal year 2022 saw the worst drawdown for equities since the pandemic. Pressured by the Federal Reserve (Fed) raising interest rates to combat inflation, markets adjusted equity values to reflect a forward-looking slowed economy. Main macroeconomic talking points throughout 2022 centered on the path of future interest rates driven by monetary policy, and inflation sustaining levels well above the Fed’s 2% inflation target. Inflation fears continued to be justified with the year-over-year Consumer Price Index (CPI) surging above 9% in June, along with core inflation readings maintaining levels above 6%. Despite the quantitative tightening efforts in 2022, many economic indicators remain strong, including consumer spending, wage growth and low unemployment in the U.S., offering a sliver of hope for a soft landing. Global supply chains were relieved of backlogs and most delays stemming from COVID-19 restrictions, benefitting company margins and lowering some pressure on prices of inflated goods. The latest economic data shows U.S. Real GDP year-over-year rising 1.9% in the U.S., offset by CPI of 7.7%. Looking forward, markets have likely discounted a significant portion of quantitative tightening as the S&P 500 Price-to-Earnings ratio is below its 10-year average, and any pause or pivot in rate hikes would serve as a positive catalyst for U.S. and global equities.
Rising rates and a work-from-home culture negatively impacted Office REITs and Mortgage REITs, as properties became less attractive with higher cap rates and pressure of funds-from-operations (FFO). In contrast, defensive REIT segments including Health Care REITs and Specialized REITs, provided positive performance for the Fund, benefitting from more consistent lease demand.
The best-performing stocks in the Fund for the period were VICI Properties Inc. (VICI), which increased 32.18%, LTC Properties Inc. (LTC), gaining 31.45%, and American Campus Communities (ACC), which rose 27.59%. The largest detractors were Industrial Logistics Properties (ILPT), falling 81.00%, Innovative Industrial Properties (IIPR), losing 47.18% and Brandywine Realty Trust (BDN), which fell 41.98%.
Looking ahead, the Fund’s strategy of annually selecting the five highest-yielding securities in each of the nine segments in the S-Network Composite US REIT Index is intended to provide meaningfully higher yield relative to the S-Network Composite US REIT Index, potential for market participation in all economic cycles through equal segment weighting, and a portfolio of securities that is identified through low valuations and high yield relative to segment peers.
| Performance (as of November 30, 2022) | | | | |
| | | | | |
| | | | | Since |
| | 1 Year | 5 Year | 10 Year | Inception^ |
| ALPS REIT Dividend Dogs ETF – NAV | -13.06% | 2.56% | 4.52% | 2.76% |
| ALPS REIT Dividend Dogs ETF – Market Price* | -13.61% | 2.45% | 4.47% | 2.72% |
| S-Network® REIT Dividend Dogs Total Return Index | -12.76% | – | – | – |
| S-Network® Composite US REIT Index | -13.86% | 5.10% | – | – |
| S-Network® REIT Dividend Dogs Index/S&P United States REIT Index** | -12.76% | 3.42% | 6.66% | 5.63% |
Total Expense Ratio (per the current prospectus) is 0.35%.
Performance data quoted represents past performance. Past performance does not guarantee future results. On January 2, 2020, the Fund changed its Underlying Index and principal investment strategies. Consequently, the Fund's total returns shown above for the periods prior to January 2, 2020 are not necessarily indicative of the performance of the Fund, as it is currently managed. Total return figures assume reinvestment of dividends and capital gains distributions, if any. The table does not reflect the deduction of taxes that a shareholder would pay on
10 | November 30, 2022
| ALPS REIT Dividend Dogs ETF | |
| Performance Overview | November 30, 2022 (Unaudited) |
Fund distributions or the redemption of Fund shares. Investment return and principal value of an investment will fluctuate so that an investor’s shares, when sold or redeemed, may be worth more or less than the original cost. Current performance data may be higher or lower than actual data quoted. For the most current month-end performance data please visit www.alpsfunds.com or call 1.866.759.5679.
Net Asset Value (NAV) is an exchange-traded fund’s per-share value. The per-share dollar amount of the Fund is derived by dividing the total value of all the securities in its portfolio, less any liabilities, by the number of Fund shares outstanding. Market Price is the price at which a share can currently be traded in the market. Information detailing the number of days the Market Price of the Fund was greater than the Fund’s NAV and the number of days it was less than the Fund’s NAV can be obtained at www.alpsfunds.com.
| ^ | The Fund Inception Date was May 7, 2008. |
| * | Market Price means the official closing price of a share or, if it more accurately reflects the market value of a share at the time as of which the Fund calculates current net asset value per share, the price that is the midpoint of the bid-ask spread as of that time. It does not represent the returns an investor would receive if shares were traded at other times. |
| ** | The performance shown reflects a combination of the Fund's Underlying Index, and for periods prior to January 2, 2020, the S&P United States REIT Index. Prior to January 2, 2020, the Fund used a different Underlying Index than the S&P United States REIT Index. Therefore, the historical returns shown for the periods prior to January 2, 2020, are not necessarily indicative of the historical strategy of the Fund. |
The S-Network® REIT Dividend Dogs Total Return Index, like the S-Net U.S. REIT from which components of the Underlying Index are selected, divides into nine segments, eight of which are based on Global Industry Classification Standard (“GICS”) Sub-Industries (excluding Technology REITs involved in cell towers and/or data centers) and a separate Technology REIT segment based on the research of the Underlying Index provider, S-Network® Global Indexes, Inc. (the “Index Provider”). The Underlying Index generally consists of 45 REITs on each annual reconstitution date. The Underlying Index’s REITs must be constituents of the S-Net U.S. REIT universe, which includes a universe of mainly REITs listed in the United States. The selection criteria for the universe also includes requirements for segment inclusion, primary exchange listing, minimum market capitalization, share price, average daily trading volume and other factors. The Underlying Index is rebalanced quarterly. The index is reported on a total return basis, which assumes reinvestment of any dividends and distributions realized during a given time period. The index commenced operations on October 29, 2019.
The S-Network® Composite US REIT Index (the “S-Net U.S. REIT” or “SNREIT”) is a benchmark index for the Real Estate Investment Trust component of the US stock market. The SNREIT provides the universe of stocks for RDOGX. The selection criteria for SNREIT include requirements for sector inclusion, primary exchange listing, minimum market capitalization, minimum average daily trading volume, and other factors. All constituents of RDOGX must be constituents of SNREIT. The index commenced operations on February 12, 2016.
The indexes are not actively managed and do not reflect any deductions for fees, expenses or taxes. Total return assumes reinvestment of any dividends and distributions realized during a given time period. One cannot invest directly in an index. Index performance does not reflect fund performance.
The Fund’s shares are not individually redeemable. Investors buy and sell shares of the Fund on a secondary market. Only market makers or “authorized participants” may trade directly with the Fund, typically in blocks of 25,000 shares.
The ALPS REIT Dividend Dogs ETF is not suitable for all investors. Investments in the Fund are subject to investment risks, including possible loss of the principal amount invested.
ALPS Portfolio Solutions Distributor, Inc., a FINRA member, is the distributor for the ETF.
11 | November 30, 2022
| ALPS REIT Dividend Dogs ETF | |
| Performance Overview | November 30, 2022 (Unaudited) |
| Top 10 Holdings* (as of November 30, 2022) | | |
| | | |
| Innovative Industrial Properties, Inc. | | | 3.16 | % |
| Simon Property Group, Inc. | | | 2.84 | % |
| STORE Capital Corp. | | | 2.84 | % |
| Service Properties Trust | | | 2.77 | % |
| Apple Hospitality REIT, Inc. | | | 2.60 | % |
| Gaming and Leisure Properties, Inc. | | | 2.60 | % |
| Equinix, Inc. | | | 2.59 | % |
| American Assets Trust, Inc. | | | 2.58 | % |
| Essential Properties Realty Trust, Inc. | | | 2.55 | % |
| STAG Industrial, Inc. | | | 2.55 | % |
| Total % of Top 10 Holdings | | | 27.08 | % |
| REIT Sector Allocation* (as of November 30, 2022) | | |
| | | |
| Retail REITs | | | 12.47 | % |
| Diversified REITs | | | 12.36 | % |
| Specialized REITs | | | 11.92 | % |
| Technology REITs | | | 11.33 | % |
| Health Care REITs | | | 10.89 | % |
| Office REITs | | | 10.63 | % |
| Residential REITs | | | 10.44 | % |
| Hotel & Resort REITs | | | 10.02 | % |
| Industrial REITs | | | 9.65 | % |
| Money Market Fund | | | 0.29 | % |
| Total | | | 100.00 | % |
Future holdings are subject to change.
Growth of $10,000 (as of November 30, 2022)
Comparison of Change in Value of $10,000 Investment in the Fund and the Indexes
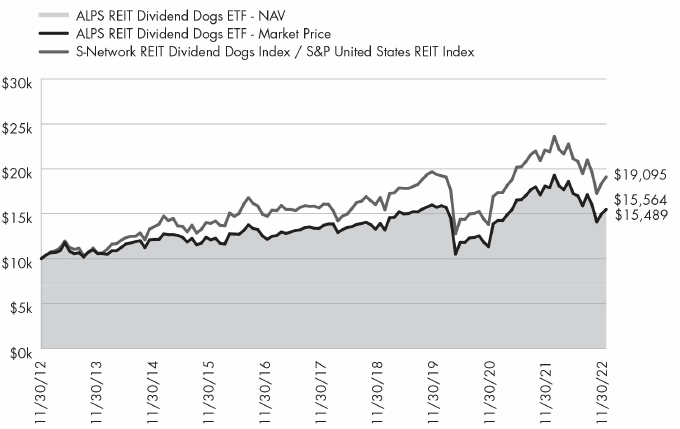
The chart above compares historical performance of a hypothetical investment of $10,000 in the Fund over the past ten years with the performance of the Fund’s benchmark index. Results include the reinvestment of all dividends and capital gains distributions. Past performance does not guarantee future results. The graph does not reflect the deduction of taxes that a shareholder would pay on Fund distributions or the redemption of Fund shares.
12 | November 30, 2022
| ALPS ETF Trust | |
| Disclosure of Fund Expenses | November 30, 2022 (Unaudited) |
Shareholder Expense Example: As a shareholder of a Fund, you incur certain ongoing costs, including management fees and other Fund expenses. These examples are intended to help you understand your ongoing costs (in dollars) of investing in the Fund and to compare these costs with the ongoing costs of investing in other funds. It is based on an investment of $1,000 invested at the beginning of the six month period and held through November 30, 2022.
Actual Return: The first line of the table provides information about actual account values and actual expenses. You may use the information in this line, together with the amount you invested, to estimate the expenses that you incurred over the period. Simply divide your account value by $1,000 (for example, an $8,600 account value divided by $1,000 = 8.6), then multiply the result by the number in the first line under the heading entitled “Expenses Paid During Period” to estimate the expenses attributable to your investment during this period.
Hypothetical 5% Return: The second line of the table provides information about hypothetical account values and hypothetical expenses based on the Fund’s actual expense ratio and an assumed rate of return of 5% per year before expenses, which is not the Fund’s actual return. The hypothetical account values and expenses may not be used to estimate the actual ending account balance or expenses you paid for the period. You may use this information to compare ongoing costs of investing in the Fund and other funds. To do so, compare this 5% hypothetical example with the 5% hypothetical examples that appear in the shareholder reports of other funds.
The expenses shown in the table are meant to highlight ongoing Fund costs only and do not reflect any transaction costs, such as brokerage commissions and other fees to financial intermediaries. Therefore, the second line is useful in comparing ongoing costs only, and will not help you determine the relative total costs of owning different funds. In addition, if these costs were included, your costs would have been higher.
| | Beginning Account Value 6/1/22 | Ending Account Value 11/30/22 | Expense Ratio(a) | Expenses Paid During Period 6/1/22 - 11/30/22(b) |
| ALPS Sector Dividend Dogs ETF | | | | |
| Actual | $ 1,000.00 | $ 977.10 | 0.40% | $ 1.98 |
| Hypothetical (5% return before expenses) | $ 1,000.00 | $ 1,023.06 | 0.40% | $ 2.03 |
| ALPS International Sector Dividend Dogs ETF | | | | |
| Actual | $ 1,000.00 | $ 942.50 | 0.50% | $ 2.43 |
| Hypothetical (5% return before expenses) | $ 1,000.00 | $ 1,022.56 | 0.50% | $ 2.54 |
| ALPS Emerging Sector Dividend Dogs ETF | | | | |
| Actual | $ 1,000.00 | $ 989.10 | 0.60% | $ 2.99 |
| Hypothetical (5% return before expenses) | $ 1,000.00 | $ 1,022.06 | 0.60% | $ 3.04 |
| ALPS REIT Dividend Dogs ETF | | | | |
| Actual | $ 1,000.00 | $ 915.90 | 0.35% | $ 1.68 |
| Hypothetical (5% return before expenses) | $ 1,000.00 | $ 1,023.31 | 0.35% | $ 1.78 |
| (a) | Annualized based on the Fund's most recent fiscal half-year expenses. |
| (b) | Expenses are equal to the Fund's annualized expense ratio multiplied by the average account value over the period, multiplied by the number of days in the most recent fiscal half year (183), divided by 365. |
13 | November 30, 2022
| ALPS ETF Trust |
| Report of Independent Registered Public Accounting Firm |
To the Board of Trustees of ALPS ETF Trust and the Shareholders of ALPS Sector Dividend Dogs ETF, ALPS International Sector Dividend Dogs ETF, ALPS Emerging Sector Dividend Dogs ETF, and ALPS REIT Dividend Dogs ETF
Opinion on the Financial Statements
We have audited the accompanying statements of assets and liabilities of ALPS Sector Dividend Dogs ETF, ALPS International Sector Dividend Dogs ETF, ALPS Emerging Sector Dividend Dogs ETF, and ALPS REIT Dividend Dogs ETF, each a series of shares of beneficial interest in ALPS ETF Trust (the “Funds”), including the schedules of investments, as of November 30, 2022, and the related statements of operations and changes in net assets and the financial highlights for the year then ended, and the related notes (collectively referred to as the “financial statements”). In our opinion, the financial statements present fairly, in all material respects, the financial position of the Funds as of November 30, 2022, and the results of their operations, the changes in their net assets, and their financial highlights for the year then ended, in conformity with accounting principles generally accepted in the United States of America. The statements of changes in net assets for the year ended November 30, 2021 and the financial highlights for each of the years in the four-year period then ended were audited by other auditors whose report dated January 26, 2022, expressed an unqualified opinion on those financial statements and financial highlights.
Basis for Opinion
These financial statements are the responsibility of the Funds' management. Our responsibility is to express an opinion on the Funds’ financial statements based on our audits. We are a public accounting firm registered with the Public Company Accounting Oversight Board (United States) (“PCAOB”) and are required to be independent with respect to the Funds in accordance with the U.S. federal securities law and the applicable rules and regulations of the Securities and Exchange Commission and the PCAOB.
We conducted our audits in accordance with the standards of the PCAOB. Those standards require that we plan and perform the audits to obtain reasonable assurance about whether the financial statements are free of material misstatement, whether due to error or fraud. The Funds are not required to have, nor were we engaged to perform, an audit of their internal control over financial reporting. As part of our audits we are required to obtain an understanding of internal control over financial reporting but not for the purpose of expressing an opinion on the effectiveness of the Funds’ internal control over financial reporting. Accordingly, we express no such opinion.
Our audits included performing procedures to assess the risk of material misstatement of the financial statements, whether due to error or fraud, and performing procedures that respond to those risks. Such procedures included examining, on a test basis, evidence regarding the amounts and disclosures in the financial statements. Our procedures included confirmation of securities owned as of November 30, 2022 by correspondence with the custodian, brokers, or by other appropriate auditing procedures where replies from brokers were not received. Our audits also included evaluating the accounting principles used and significant estimates made by management, as well as evaluating the overall presentation of the financial statements. We believe that our audits provide a reasonable basis for our opinion.

BBD, LLP
We have served as the auditor of one or more of the Funds in the ALPS ETF Trust since 2022.
Philadelphia, Pennsylvania
January 27, 2023
14 | November 30, 2022
| ALPS Sector Dividend Dogs ETF | |
| Schedule of Investments | November 30, 2022 |
| Security Description | | Shares | | | Value | |
| COMMON STOCKS (99.50%) | | | | | | |
| Communication Services (9.49%) | | | | | | |
| AT&T, Inc. | | | 1,469,667 | | | $ | 28,335,180 | |
| Interpublic Group of Cos., Inc. | | | 876,654 | | | | 30,121,832 | |
| Lumen Technologies, Inc.(a) | | | 2,510,377 | | | | 13,731,762 | |
| Omnicom Group, Inc. | | | 355,467 | | | | 28,352,048 | |
| Verizon Communications, Inc. | | | 592,533 | | | | 23,096,936 | |
| Total Communication Services | | | | | | | 123,637,758 | |
| | | | | | | | | |
| Consumer Discretionary (8.22%) | | | | | | | | |
| Best Buy Co., Inc. | | | 328,287 | | | | 28,002,881 | |
| Hasbro, Inc. | | | 307,281 | | | | 19,303,392 | |
| Newell Brands, Inc. | | | 1,378,217 | | | | 17,875,475 | |
| VF Corp. | | | 577,225 | | | | 18,944,525 | |
| Whirlpool Corp. | | | 156,223 | | | | 22,891,356 | |
| Total Consumer Discretionary | | | | | | | 107,017,629 | |
| | | | | | | | | |
| Consumer Staples (10.34%) | | | | | | | | |
| Altria Group, Inc. | | | 549,233 | | | | 25,583,273 | |
| Conagra Brands, Inc. | | | 728,204 | | | | 27,657,188 | |
| Kraft Heinz Co. | | | 686,461 | | | | 27,012,241 | |
| Philip Morris International, Inc. | | | 257,863 | | | | 25,701,205 | |
| Walgreens Boots Alliance, Inc. | | | 690,634 | | | | 28,661,311 | |
| Total Consumer Staples | | | | | | | 134,615,218 | |
| | | | | | | | | |
| Energy (10.58%) | | | | | | | | |
| Exxon Mobil Corp. | | | 259,364 | | | | 28,877,588 | |
| Kinder Morgan, Inc. | | | 1,366,925 | | | | 26,135,606 | |
| ONEOK, Inc. | | | 400,516 | | | | 26,802,531 | |
| Valero Energy Corp. | | | 220,865 | | | | 29,511,981 | |
| Williams Cos., Inc. | | | 763,765 | | | | 26,502,645 | |
| Total Energy | | | | | | | 137,830,351 | |
| | | | | | | | | |
| Financials (10.22%) | | | | | | | | |
| Franklin Resources, Inc.(a) | | | 948,770 | | | | 25,436,524 | |
| Huntington Bancshares, Inc. | | | 1,770,048 | | | | 27,400,343 | |
| Principal Financial Group, Inc. | | | 319,685 | | | | 28,669,351 | |
| Prudential Financial, Inc. | | | 254,144 | | | | 27,455,176 | |
| Truist Financial Corp. | | | 516,259 | | | | 24,166,084 | |
| Total Financials | | | | | | | 133,127,478 | |
| | | | | | | | | |
| Health Care (11.40%) | | | | | | | | |
| AbbVie, Inc. | | | 176,981 | | | | 28,525,797 | |
| Amgen, Inc. | | | 101,042 | | | | 28,938,429 | |
| Bristol-Myers Squibb Co. | | | 356,735 | | | | 28,638,686 | |
| Cardinal Health, Inc. | | | 358,117 | | | | 28,710,240 | |
| Gilead Sciences, Inc. | | | 383,399 | | | | 33,673,934 | |
| Total Health Care | | | | | | | 148,487,086 | |
| | | | | | | | | |
| Industrials (10.35%) | | | | | | |
| 3M Co. | | | 203,313 | | | | 25,611,339 | |
| Cummins, Inc. | | | 114,560 | | | | 28,772,889 | |
| Huntington Ingalls Industries, Inc. | | | 106,367 | | | | 24,672,889 | |
| Lockheed Martin Corp. | | | 59,378 | | | | 28,809,612 | |
| Security Description | | Shares | | | Value | |
| Industrials (continued) | | | | | | |
| Snap-On, Inc. | | | 112,025 | | | $ | 26,953,215 | |
| Total Industrials | | | | | | | 134,819,944 | |
| | | | | | | | | |
| Information Technology (10.02%) | | | | | | | | |
| Cisco Systems, Inc. | | | 546,835 | | | | 27,188,636 | |
| Hewlett Packard Enterprise Co. | | | 1,863,621 | | | | 31,271,561 | |
| Intel Corp. | | | 795,561 | | | | 23,922,519 | |
| International Business | | | | | | | | |
| Machines Corp. | | | 193,737 | | | | 28,847,439 | |
| Seagate Technology Holdings PLC | | | 363,627 | | | | 19,261,322 | |
| Total Information Technology | | | | | | | 130,491,477 | |
| | | | | | | | | |
| Materials (9.63%) | | | | | | | | |
| Amcor PLC | | | 2,036,484 | | | | 25,150,577 | |
| International Paper Co. | | | 599,920 | | | | 22,269,030 | |
| LyondellBasell Industries NV, Class A | | | 297,495 | | | | 25,290,050 | |
| Newmont Mining Corp. | | | 579,765 | | | | 27,521,445 | |
| The Dow Chemical Co. | | | 495,517 | | | | 25,256,502 | |
| Total Materials | | | | | | | 125,487,604 | |
| | | | | | | | | |
| Utilities (9.25%) | | | | | | | | |
| Edison International | | | 362,205 | | | | 24,144,585 | |
| FirstEnergy Corp. | | | 602,947 | | | | 24,865,534 | |
| Pinnacle West Capital Corp. | | | 324,876 | | | | 25,444,288 | |
| PPL Corp. | | | 838,476 | | | | 24,751,812 | |
| Southern Co. | | | 314,740 | | | | 21,289,014 | |
| Total Utilities | | | | | | | 120,495,233 | |
| | | | | | | | | |
| TOTAL COMMON STOCKS | | | | | | | | |
| (Cost $1,227,997,950) | | | | | | | 1,296,009,778 | |
15 | November 30, 2022
| ALPS Sector Dividend Dogs ETF | |
| Schedule of Investments | November 30, 2022 |
| | | 7 Day Yield | | | Shares | | | Value | |
| SHORT TERM INVESTMENTS (0.36%) | | | | | | | | | |
| Money Market Fund (0.02%) | | | | | | | | | |
| State Street Institutional Treasury Plus Money Market Fund (Premier Class) | | | | | | | | | | | | |
| (Cost $318,909) | | | 3.69 | % | | | 318,909 | | | $ | 318,909 | |
| | | | | | | | | | | | | |
| Investments Purchased with Collateral from Securities Loaned (0.34%) | | | | | | | | | | | | |
| State Street Navigator | | | | | | | | | | | | |
| Securities Lending | | | | | | | | | | | | |
| Government Money | | | | | | | | | | | | |
| Market Portfolio, 3.86% | | | | | | | | | | | | |
| (Cost $4,423,194) | | | | | | | 4,423,194 | | | | 4,423,194 | |
| TOTAL SHORT TERM INVESTMENTS | | | | | | | | | | | | |
| (Cost $4,742,103) | | | | | | | | | | | 4,742,103 | |
| | | | | | | | | | | | | |
| TOTAL INVESTMENTS (99.86%) | | | | | | | | | | | | |
| (Cost $1,232,740,053) | | | | | | | | | | $ | 1,300,751,881 | |
| OTHER ASSETS IN EXCESS OF LIABILITIES (0.14%) | | | | | | | | | | | 1,816,517 | |
| NET ASSETS - 100.00% | | | | | | | | | | $ | 1,302,568,398 | |
| (a) | Security, or a portion of the security position is currently on loan. The total market value of securities on loan is $10,861,316. |
See Notes to Financial Statements.
16 | November 30, 2022
| ALPS International Sector Dividend Dogs ETF | |
| Schedule of Investments | November 30, 2022 |
| Security Description | | Shares | | | Value | |
| COMMON STOCKS (99.14%) | | | | | | |
| Australia (11.84%) | | | | | | |
| Australia & New Zealand | | | | | | | | |
| Banking Group, Ltd.(a) | | | 198,458 | | | $ | 3,332,553 | |
| BHP Group, Ltd. | | | 119,941 | | | | 3,705,772 | |
| Coles Group, Ltd.(a) | | | 264,995 | | | | 3,048,711 | |
| Fortescue Metals Group, Ltd. | | | 256,526 | | | | 3,374,380 | |
| Wesfarmers, Ltd.(a) | | | 96,632 | | | | 3,185,649 | |
| Westpac Banking Corp. | | | 214,995 | | | | 3,468,697 | |
| Total Australia | | | | | | | 20,115,762 | |
| | | | | | | | | |
| Austria (2.32%) | | | | | | | | |
| OMV AG | | | 75,640 | | | | 3,948,159 | |
| | | | | | | | | |
| Finland (2.00%) | | | | | | | | |
| Nordea Bank Abp | | | 326,367 | | | | 3,402,942 | |
| | | | | | | | | |
| France (8.08%) | | | | | | | | |
| Danone SA | | | 61,132 | | | | 3,185,800 | |
| Orange SA | | | 309,117 | | | | 3,142,058 | |
| Sanofi | | | 38,481 | | | | 3,462,962 | |
| TotalEnergies SE | | | 62,874 | | | | 3,945,900 | |
| Total France | | | | | | | 13,736,720 | |
| | | | | | | | | |
| Germany (8.69%) | | | | | | | | |
| BASF SE | | | 71,924 | | | | 3,631,077 | |
| Bayer AG | | | 59,064 | | | | 3,403,780 | |
| Bayerische Motoren Werke AG | | | 42,497 | | | | 3,816,850 | |
| SAP SE | | | 36,095 | | | | 3,923,582 | |
| Total Germany | | | | | | | 14,775,289 | |
| | | | | | | | | |
| Hong Kong (1.81%) | | | | | | | | |
| CITIC, Ltd. | | | 3,001,000 | | | | 3,069,792 | |
| | | | | | | | | |
| Italy (6.32%) | | | | | | | | |
| Enel SpA | | | 643,119 | | | | 3,435,839 | |
| Eni SpA | | | 267,818 | | | | 3,991,993 | |
| Snam SpA | | | 655,239 | | | | 3,319,219 | |
| Total Italy | | | | | | | 10,747,051 | |
| | | | | | | | | |
| Japan (19.61%) | | | | | | | | |
| Bridgestone Corp. | | | 86,200 | | | | 3,225,399 | |
| Canon, Inc. | | | 135,363 | | | | 3,148,569 | |
| Honda Motor Co., Ltd. | | | 120,900 | | | | 2,938,232 | |
| Japan Tobacco, Inc.(a) | | | 187,500 | | | | 3,822,914 | |
| Kyocera Corp. | | | 56,120 | | | | 2,837,090 | |
| Marubeni Corp. | | | 316,400 | | | | 3,546,869 | |
| Mitsubishi Corp. | | | 101,800 | | | | 3,394,808 | |
| Sumitomo Corp. | | | 228,800 | | | | 3,723,033 | |
| Takeda Pharmaceutical Co., | | | | | | | | |
| Ltd. | | | 114,600 | | | | 3,361,069 | |
| Tokyo Electron, Ltd. | | | 10,200 | | | | 3,330,567 | |
| Total Japan | | | | | | | 33,328,550 | |
| | | | | | | | | |
| Norway (3.64%) | | | | | | | | |
| DNB Bank ASA | | | 172,530 | | | | 3,337,459 | |
| Security Description | | Shares | | | Value | |
| Norway (continued) | | | | | | |
| Telenor ASA | | | 293,729 | | | $ | 2,842,472 | |
| Total Norway | | | | | | | 6,179,931 | |
| | | | | | | | | |
| Spain (7.70%) | | | | | | | | |
| Endesa SA | | | 178,613 | | | | 3,289,819 | |
| Naturgy Energy Group SA | | | 113,463 | | | | 3,161,917 | |
| Repsol SA | | | 238,822 | | | | 3,678,085 | |
| Telefonica SA | | | 794,723 | | | | 2,964,767 | |
| Total Spain | | | | | | | 13,094,588 | |
| | | | | | | | | |
| Sweden (7.17%) | | | | | | | | |
| H & M Hennes & Mauritz AB, | | | | | | | | |
| Class B | | | 297,112 | | | | 3,300,474 | |
| Swedbank AB, Class A | | | 231,612 | | | | 3,731,604 | |
| Telefonaktiebolaget LM | | | | | | | | |
| Ericsson, Class B | | | 419,674 | | | | 2,602,320 | |
| Telia Co. AB | | | 933,360 | | | | 2,543,625 | |
| Total Sweden | | | | | | | 12,178,023 | |
| | | | | | | | | |
| Switzerland (1.98%) | | | | | | | | |
| Novartis AG | | | 38,006 | | | | 3,359,791 | |
| | | | | | | | | |
| United Kingdom (17.98%) | | | | | | | | |
| Anglo American PLC | | | 92,509 | | | | 3,799,258 | |
| BAE Systems PLC | | | 344,882 | | | | 3,419,307 | |
| BP PLC | | | 601,375 | | | | 3,605,931 | |
| British American Tobacco PLC | | | 77,610 | | | | 3,171,936 | |
| GSK PLC | | | 200,611 | | | | 3,401,465 | |
| Imperial Brands PLC | | | 138,656 | | | | 3,551,211 | |
| Rio Tinto PLC | | | 55,508 | | | | 3,736,437 | |
| SSE PLC | | | 151,196 | | | | 3,113,395 | |
| Vodafone Group PLC | | | 2,493,788 | | | | 2,760,389 | |
| Total United Kingdom | | | | | | | 30,559,329 | |
| | | | | | | | | |
| TOTAL COMMON STOCKS | | | | | | | | |
| (Cost $179,743,663) | | | | | | | 168,495,927 | |
17 | November 30, 2022
| ALPS International Sector Dividend Dogs ETF | |
| Schedule of Investments | November 30, 2022 |
| | | 7 Day Yield | | | Shares | | | Value | |
| SHORT TERM INVESTMENTS (2.25%) | | | | | | |
| Money Market Fund (0.10%) | | | | | | | | | |
| State Street Institutional | | | | | | | | | |
| Treasury Plus Money | | | | | | | | | |
| Market Fund (Premier Class) | | | | | | | | | | | | |
| (Cost $166,933) | | | 3.69 | % | | | 166,933 | | | $ | 166,933 | |
| | | | | | | | | | | | | |
| Investments Purchased with Collateral from Securities Loaned (2.15%) | | | | | | | | | | | | |
| State Street Navigator Securities Lending Government Money Market Portfolio, 3.86% | | | | | | | | | | | | |
| (Cost $3,652,196) | | | | | | | 3,652,196 | | | | 3,652,196 | |
| TOTAL SHORT TERM INVESTMENTS | | | | | | | | | | | | |
| (Cost $3,819,129) | | | | | | | | | | | 3,819,129 | |
| | | | | | | | | | | | | |
| TOTAL INVESTMENTS (101.39%) | | | | | | | | | | | | |
| (Cost $183,562,792) | | | | | | | | | | $ | 172,315,056 | |
| LIABILITIES IN EXCESS OF OTHER ASSETS (-1.39%) | | | | | | | | | | | (2,364,414 | ) |
| NET ASSETS - 100.00% | | | | | | | | | | $ | 169,950,642 | |
| (a) | Security, or a portion of the security position is currently on loan. The total market value of securities on loan is $3,499,054. |
See Notes to Financial Statements.
18 | November 30, 2022
| ALPS Emerging Sector Dividend Dogs ETF | |
| Schedule of Investments | November 30, 2022 |
| Security Description | | Shares | | | Value | |
| COMMON STOCKS (99.40%) | | | | | | |
| Brazil (8.65%) | | | | | | |
| Centrais Eletricas Brasileiras | | | | | | |
| SA, ADR(a) | | | 61,087 | | | $ | 547,340 | |
| Engie Brasil Energia SA | | | 68,700 | | | | 522,927 | |
| JBS SA | | | 99,287 | | | | 421,879 | |
| Petroleo Brasileiro SA | | | 78,175 | | | | 457,810 | |
| Vibra Energia SA | | | 153,607 | | | | 489,295 | |
| Total Brazil | | | | | | | 2,439,251 | |
| | | | | | | | | |
| Chile (9.49%) | | | | | | | | |
| Banco Santander Chile | | | 13,198,263 | | | | 513,109 | |
| Cencosud SA | | | 366,449 | | | | 544,838 | |
| Empresas CMPC SA | | | 303,465 | | | | 502,651 | |
| Empresas COPEC SA | | | 66,511 | | | | 464,868 | |
| Enel Chile SA, ADR(a) | | | 297,944 | | | | 649,518 | |
| Total Chile | | | | | | | 2,674,984 | |
| | | | | | | | | |
| China (9.16%) | | | | | | | | |
| China Railway Signal & | | | | | | | | |
| Communication Corp., Ltd., | | | | | | | | |
| Class H(b)(c) | | | 1,731,000 | | | | 554,030 | |
| China Shenhua Energy Co., | | | | | | | | |
| Ltd., Class H | | | 164,500 | | | | 505,444 | |
| Huadian Power International | | | | | | | | |
| Corp., Ltd., Class H(a) | | | 1,140,000 | | | | 439,306 | |
| Legend Holdings Corp., Class | | | | | | | | |
| H(b)(c) | | | 504,500 | | | | 514,127 | |
| Zoomlion Heavy Industry | | | | | | | | |
| Science and Technology | | | | | | | | |
| Co., Ltd., Class H | | | 1,223,000 | | | | 568,368 | |
| Total China | | | | | | | 2,581,275 | |
| | | | | | | | | |
| Czech Republic (1.71%) | | | | | | | | |
| CEZ AS | | | 14,031 | | | | 482,161 | |
| | | | | | | | | |
| Hungary (2.11%) | | | | | | | | |
| Richter Gedeon Nyrt | | | 27,653 | | | | 594,220 | |
| | | | | | | | | |
| India (3.92%) | | | | | | | | |
| Infosys, Ltd., Sponsored ADR | | | 28,254 | | | | 574,969 | |
| Wipro, Ltd., ADR(a) | | | 103,334 | | | | 529,070 | |
| Total India | | | | | | | 1,104,039 | |
| | | | | | | | | |
| Indonesia (3.72%) | | | | | | |
| Gudang Garam Tbk PT | | | 338,000 | | | | 428,637 | |
| Kalbe Farma Tbk PT | | | 4,711,700 | | | | 619,980 | |
| Total Indonesia | | | | | | | 1,048,617 | |
| | | | | | | | | |
| Luxembourg (1.89%) | | | | | | | | |
| Ternium SA, Sponsored ADR(a) | | | 16,879 | | | | 531,520 | |
| | | | | | | | | |
| Malaysia (9.82%) | | | | | | | | |
| Hartalega Holdings Bhd | | | 1,500,100 | | | | 583,513 | |
| Malayan Banking Bhd | | | 271,000 | | | | 525,853 | |
| RHB Bank Bhd | | | 421,900 | | | | 533,126 | |
| Sime Darby Bhd | | | 1,089,800 | | | | 526,828 | |
| Security Description | | Shares | | | Value | |
| Malaysia (continued) | | | | | | | | |
| Top Glove Corp. Bhd | | | 3,057,400 | | | $ | 598,075 | |
| Total Malaysia | | | | | | | 2,767,395 | |
| | | | | | | | | |
| Mexico (8.61%) | | | | | | | | |
| El Puerto de Liverpool SAB de | | | | | | | | |
| CV | | | 109,777 | | | | 639,693 | |
| Grupo Aeroportuario del | | | | | | | | |
| Sureste SAB de CV, ADR | | | 2,446 | | | | 604,871 | |
| Kimberly-Clark de Mexico SAB | | | | | | | | |
| de CV, Class A | | | 378,700 | | | | 643,794 | |
| Orbia Advance Corp. SAB de | | | | | | | | |
| CV | | | 275,407 | | | | 538,567 | |
| Total Mexico | | | | | | | 2,426,925 | |
| | | | | | | | | |
| Philippines (4.33%) | | | | | | | | |
| Globe Telecom, Inc. | | | 15,819 | | | | 643,276 | |
| PLDT, Inc. | | | 18,595 | | | | 575,998 | |
| Total Philippines | | | | | | | 1,219,274 | |
| | | | | | | | | |
| Poland (4.48%) | | | | | | | | |
| LPP SA | | | 291 | | | | 620,287 | |
| Powszechny Zaklad | | | | | | | | |
| Ubezpieczen SA | | | 91,109 | | | | 641,599 | |
| Total Poland | | | | | | | 1,261,886 | |
| | | | | | | | | |
| Russia (0.01%) | | | | | | | | |
| Magnit PJSC, GDR(c)(d) | | | 32,174 | | | | 321 | |
| Mobile TeleSystems PJSC, | | | | | | | | |
| Sponsored ADR(d)(e) | | | 64,600 | | | | 646 | |
| Novolipetsk Steel PJSC, | | | | | | | | |
| GDR(c)(d) | | | 17,594 | | | | 176 | |
| Severstal PAO, GDR(c)(d) | | | 23,283 | | | | 233 | |
| X5 Retail Group NV, GDR(c)(d) | | | 17,785 | | | | 178 | |
| Total Russia | | | | | | | 1,554 | |
| | | | | | | | | |
| South Africa (9.55%) | | | | | | | | |
| African Rainbow Minerals, Ltd. | | | 35,572 | | | | 597,091 | |
| Exxaro Resources, Ltd. | | | 40,541 | | | | 530,037 | |
| Mr Price Group, Ltd. | | | 47,574 | | | | 465,940 | |
| MultiChoice Group | | | 83,704 | | | | 576,053 | |
| Vodacom Group, Ltd. | | | 71,800 | | | | 522,596 | |
| Total South Africa | | | | | | | 2,691,717 | |
| | | | | | | | | |
| Thailand (9.90%) | | | | | | | | |
| Bangkok Dusit Medical | | | | | | | | |
| Services PCL | | | 660,100 | | | | 566,228 | |
| BTS Group Holdings PCL | | | 2,272,100 | | | | 541,206 | |
| Delta Electronics Thailand PCL | | | 29,400 | | | | 560,238 | |
| PTT PCL | | | 535,100 | | | | 504,525 | |
| TMBThanachart Bank PCL | | | 15,594,200 | | | | 619,081 | |
| Total Thailand | | | | | | | 2,791,278 | |
| | | | | | | | | |
| Turkey (12.05%) | | | | | | | | |
| BIM Birlesik Magazalar AS | | | 81,344 | | | | 587,014 | |
| Enka Insaat ve Sanayi AS | | | 517,140 | | | | 711,976 | |
19 | November 30, 2022
| ALPS Emerging Sector Dividend Dogs ETF |
| Schedule of Investments | November 30, 2022 |
| Security Description | | Shares | | | Value | |
| Turkey (continued) | | | | | | |
| Eregli Demir ve Celik | | | | | | |
| Fabrikalari TAS | | | 303,644 | | | $ | 695,002 | |
| Ford Otomotiv Sanayi AS | | | 28,115 | | | | 671,122 | |
| Turkcell Iletisim Hizmetleri AS, | | | | | | | | |
| ADR | | | 162,428 | | | | 730,926 | |
| Total Turkey | | | | | | | 3,396,040 | |
| | | | | | | | | |
| TOTAL COMMON STOCKS | | | | | | | | |
| (Cost $29,815,829) | | | | | | | 28,012,136 | |
| | | 7 Day Yield | | | Shares | | | Value | |
| SHORT TERM INVESTMENTS (3.64%) | | | | | | |
| Money Market Fund (0.22%) | | | | | | | | | |
| State Street Institutional | | | | | | | | | |
| Treasury Plus Money | | | | | | | | | |
| Market Fund (Premier | | | | | | | | | |
| Class) | | | | | | | | | |
| (Cost $62,759) | | | 3.69 | % | | | 62,759 | | | | 62,759 | |
| | | | | | | | | | | | | |
| Investments Purchased with Collateral from Securities Loaned (3.42%) | | | | | | | | | | | | |
| State Street Navigator | | | | | | | | | | | | |
| Securities Lending | | | | | | | | | | | | |
| Government Money Market | | | | | | | | | | | | |
| Portfolio, 3.86% | | | | | | | | | | | | |
| (Cost $964,712) | | | | | | | 964,712 | | | | 964,712 | |
| TOTAL SHORT TERM INVESTMENTS | | | | | | | | | | | | |
| (Cost $1,027,471) | | | | | | | | | | | 1,027,471 | |
| | | | | | | | | | | | | |
| TOTAL INVESTMENTS (103.04%) | | | | | | | | | | | | |
| (Cost $30,843,300) | | | | | | | | | | $ | 29,039,607 | |
| LIABILITIES IN EXCESS OF OTHER ASSETS (-3.04%) | | | | | | | | | | | (857,621 | ) |
| NET ASSETS - 100.00% | | | | | | | | | | $ | 28,181,986 | |
| (a) | Security, or a portion of the security position is currently on loan. The total market value of securities on loan is $1,755,722. |
| (b) | Securities exempt from registration under Rule 144A of the Securities Act of 1933. These securities may be sold in the ordinary course of business in transactions exempt from registration, normally to qualified institutional buyers. At period end, the aggregate market value of those securities was $1,068,157, representing 3.79% of net assets. |
| (c) | Securities were purchased pursuant to Regulation S under the Securities Act of 1933, which exempts securities offered and sold outside of the United States from registration. Such securities cannot be sold in the United States without either an effective registration statement filed pursuant to the Securities Act of 1933, or pursuant to an exemption from registration. As of November 30, 2022, the market value of those securities was $1,069,065 representing 3.79% of net assets. |
| (d) | As a result of the use of significant unobservable inputs to determine fair value, these investments have been classified as Level 3 securities under the fair value hierarchy. |
| (e) | Non-income producing security. See Notes to Financial Statements. |
See Notes to Financial Statements.
20 | November 30, 2022
| ALPS REIT Dividend Dogs ETF |
| Schedule of Investments | November 30, 2022 |
| Security Description | | Shares | | | Value | |
| COMMON STOCKS (99.62%) | | | | | | |
| Diversified REITs (12.35%) | | | | | | |
| American Assets Trust, Inc. | | | 18,235 | | | $ | 534,103 | |
| Broadstone Net Lease, Inc. | | | 26,207 | | | | 444,733 | |
| Essential Properties Realty | | | | | | | | |
| Trust, Inc. | | | 22,746 | | | | 527,935 | |
| STORE Capital Corp. | | | 18,447 | | | | 588,459 | |
| WP Carey, Inc. | | | 5,934 | | | | 467,599 | |
| Total Diversified REITs | | | | | | | 2,562,829 | |
| | | | | | | | | |
| Health Care REITs (10.88%) | | | | | | | | |
| LTC Properties, Inc. | | | 11,545 | | | | 453,603 | |
| Medical Properties Trust, Inc. | | | 34,446 | | | | 451,932 | |
| National Health Investors, Inc. | | | 7,733 | | | | 435,059 | |
| Omega Healthcare Investors, Inc. | | | 15,654 | | | | 474,003 | |
| Sabra Health Care REIT, Inc. | | | 34,310 | | | | 442,942 | |
| Total Health Care REITs | | | | | | | 2,257,539 | |
| | | | | | | | | |
| Hotel & Resort REITs (10.01%) | | | | | | | | |
| Apple Hospitality REIT, Inc. | | | 31,656 | | | | 540,051 | |
| Pebblebrook Hotel Trust | | | 27,997 | | | | 466,150 | |
| RLJ Lodging Trust | | | 40,989 | | | | 496,787 | |
| Service Properties Trust | | | 73,285 | | | | 575,287 | |
| Total Hotel & Resort REITs | | | | | | | 2,078,275 | |
| | | | | | | | | |
| Industrial REITs (9.65%) | | | | | | | | |
| Industrial Logistics Properties | | | | | | | | |
| Trust | | | 71,854 | | | | 292,446 | |
| Innovative Industrial | | | | | | | | |
| Properties, Inc. | | | 5,398 | | | | 654,291 | |
| LXP Industrial Trust | | | 48,999 | | | | 527,229 | |
| STAG Industrial, Inc. | | | 16,037 | | | | 527,778 | |
| Total Industrial REITs | | | | | | | 2,001,744 | |
| | | | | | | | | |
| Office REITs (10.62%) | | | | | | | | |
| Brandywine Realty Trust | | | 60,969 | | | | 421,296 | |
| Easterly Government | | | | | | | | |
| Properties, Inc. | | | 27,984 | | | | 443,267 | |
| Piedmont Office Realty Trust, | | | | | | | | |
| Inc., Class A | | | 41,189 | | | | 428,777 | |
| SL Green Realty Corp. | | | 10,591 | | | | 444,398 | |
| Vornado Realty Trust | | | 18,465 | | | | 466,980 | |
| Total Office REITs | | | | | | | 2,204,718 | |
| | | | | | | | | |
| Residential REITs (10.43%) | | | | | | |
| Apartment Income REIT Corp. | | | 11,908 | | | | 453,099 | |
| AvalonBay Communities, Inc. | | | 2,383 | | | | 416,787 | |
| Centerspace | | | 6,546 | | | | 422,217 | |
| Equity Residential | | | 6,626 | | | | 429,762 | |
| UDR, Inc. | | | 10,661 | | | | 442,112 | |
| Total Residential REITs | | | | | | | 2,163,977 | |
| | | | | | | | | |
| Retail REITs (12.45%) | | | | | | | | |
| Agree Realty Corp. | | | 6,845 | | | | 478,808 | |
| National Retail Properties, Inc. | | | 11,314 | | | | 524,517 | |
| Realty Income Corp. | | | 7,657 | | | | 482,927 | |
| Security Description | | Shares | | | Value | |
| Retail REITs (continued) | | | | | | |
| Simon Property Group, Inc. | | | 4,931 | | | $ | 588,958 | |
| Spirit Realty Capital, Inc. | | | 12,295 | | | | 509,259 | |
| Total Retail REITs | | | | | | | 2,584,469 | |
| | | | | | | | | |
| Specialized REITs (19.01%) | | | | | | | | |
| American Tower Corp. | | | 1,954 | | | | 432,323 | |
| EPR Properties | | | 11,690 | | | | 486,421 | |
| Equinix, Inc. | | | 778 | | | | 537,326 | |
| Four Corners Property Trust, Inc. | | | 19,208 | | | | 521,305 | |
| Gaming and Leisure | | | | | | | | |
| Properties, Inc. | | | 10,234 | | | | 538,411 | |
| Iron Mountain, Inc. | | | 9,264 | | | | 503,313 | |
| Uniti Group, Inc. | | | 53,454 | | | | 407,319 | |
| VICI Properties, Inc. | | | 15,172 | | | | 518,882 | |
| Total Specialized REITs | | | | | | | 3,945,300 | |
| | | | | | | | | |
| Technology REITs (4.22%) | | | | | | | | |
| Crown Castle, Inc. | | | 2,931 | | | | 414,532 | |
| Digital Realty Trust, Inc. | | | 4,111 | | | | 462,323 | |
| Total Technology REITs | | | | | | | 876,855 | |
| | | | | | | | | |
| TOTAL COMMON STOCKS | | | | | | | | |
| (Cost $24,407,667) | | | | | | | 20,675,706 | |
| | | 7 Day Yield | | | Shares | | | Value | |
| SHORT TERM INVESTMENTS (0.29%) | | | | | | |
| Money Market Fund (0.29%) | | | | | | | | | |
| State Street Institutional | | | | | | | | | |
| Treasury Plus Money | | | | | | | | | | | | |
| Market Fund (Premier | | | | | | | | | | | | |
| Class) | | | 3.69 | % | | | 59,397 | | | | 59,397 | |
| | | | | | | | | | | | | |
| TOTAL SHORT TERM INVESTMENTS | | | | | | | | | | | | |
| (Cost $59,397) | | | 59,397 | |
| | | | | |
| TOTAL INVESTMENTS (99.91%) | | | | |
| (Cost $24,467,064) | | $ | 20,735,103 | |
| OTHER ASSETS IN EXCESS OF LIABILITIES (0.09%) | | | 18,539 | |
| NET ASSETS - 100.00% | | $ | 20,753,642 | |
See Notes to Financial Statements.
21 | November 30, 2022
| ALPS ETF Trust | |
| Statements of Assets and Liabilities | November 30, 2022 |
| | | ALPS Sector Dividend Dogs ETF | | | ALPS International Sector Dividend Dogs ETF | | | ALPS Emerging Sector Dividend Dogs ETF | | | ALPS REIT Dividend Dogs ETF | |
| ASSETS: | | | | | | | | | | | | |
| Investments, at value* | | $1,300,751,881 | | | $172,315,056 | | | $29,039,607 | | | $20,735,103 | |
| Foreign currency, at value (Cost $–, $45,304, $3,619 and $–) | | | – | | | | 45,343 | | | | 3,838 | | | | – | |
| Foreign tax reclaims | | | – | | | | 441,520 | | | | 5,505 | | | | 1,223 | |
| Dividends receivable | | | 6,649,592 | | | | 867,675 | | | | 110,965 | | | | 23,209 | |
| Total Assets | | | 1,307,401,473 | | | | 173,669,594 | | | | 29,159,915 | | | | 20,759,535 | |
| | | | | | | | | | | | | | | | | |
| LIABILITIES: | | | | | | | | | | | | | | | | |
| Payable for investments purchased | | | – | | | | 445 | | | | – | | | | – | |
| Payable to adviser | | | 409,881 | | | | 66,311 | | | | 13,217 | | | | 5,893 | |
| Payable for collateral upon return of securities loaned | | | 4,423,194 | | | | 3,652,196 | | | | 964,712 | | | | – | |
| Total Liabilities | | | 4,833,075 | | | | 3,718,952 | | | | 977,929 | | | | 5,893 | |
| NET ASSETS | | $ | 1,302,568,398 | | | $ | 169,950,642 | | | $ | 28,181,986 | | | $ | 20,753,642 | |
| | | | | | | | | | | | | | | | | |
| NET ASSETS CONSIST OF: | | | | | | | | | | | | | | | | |
| Paid-in capital | | $ | 1,438,158,765 | | | $ | 235,550,533 | | | $ | 38,754,471 | | | $ | 31,006,108 | |
| Total Distributable earnings/(Accumulated losses) | | | (135,590,367 | ) | | | (65,599,891 | ) | | | (10,572,485 | ) | | | (10,252,466 | ) |
| NET ASSETS | | $ | 1,302,568,398 | | | $ | 169,950,642 | | | $ | 28,181,986 | | | $ | 20,753,642 | |
| | | | | | | | | | | | | | | | | |
| INVESTMENTS, AT COST | | $ | 1,232,740,053 | | | $ | 183,562,792 | | | $ | 30,843,300 | | | $ | 24,467,064 | |
| | | | | | | | | | | | | | | | | |
| PRICING OF SHARES: | | | | | | | | | | | | | | | | |
| Net Assets | | $ | 1,302,568,398 | | | $ | 169,950,642 | | | $ | 28,181,986 | | | $ | 20,753,642 | |
| Shares of beneficial interest outstanding (Unlimited number of shares authorized, par value $0.01 per share) | | | 24,309,141 | | | | 6,575,000 | | | | 1,325,000 | | | | 500,000 | |
| Net Asset Value, offering and redemption price per share | | $ | 53.58 | | | $ | 25.85 | | | $ | 21.27 | | | $ | 41.51 | |
| * | Includes $10,861,316, $3,499,054, $1,755,722, and $– respectively of securities on loan. |
See Notes to Financial Statements.
22 | November 30, 2022
| ALPS ETF Trust |
| Statements of Operations | For the Year Ended November 30, 2022 |
| | | ALPS Sector Dividend Dogs ETF | | ALPS International Sector Dividend Dogs ETF | | ALPS Emerging Sector Dividend Dogs ETF | | ALPS REIT Dividend Dogs ETF |
| INVESTMENT INCOME: | | | | | | | | |
| Dividends* | | $ | 51,964,957 | | | $ | 8,086,188 | | | $ | 1,492,225 | | | $ | 888,417 | |
| Securities Lending Income | | | 44,480 | | | | 5,539 | | | | 8,583 | | | | 216 | |
| Total Investment Income | | | 52,009,437 | | | | 8,091,727 | | | | 1,500,808 | | | | 888,633 | |
| | | | | | | | | | | | | | | | | |
| EXPENSES: | | | | | | | | | | | | | | | | |
| Investment adviser fees | | | 4,902,751 | | | | 820,322 | | | | 156,027 | | | | 86,810 | |
| Total Expenses | | | 4,902,751 | | | | 820,322 | | | | 156,027 | | | | 86,810 | |
| NET INVESTMENT INCOME | | | 47,106,686 | | | | 7,271,405 | | | | 1,344,781 | | | | 801,823 | |
| | | | | | | | | | | | | | | | | |
| REALIZED AND UNREALIZED GAIN/(LOSS) | | | | | | | | | | | | | | | | |
| Net realized gain/(loss) on investments(a) | | | 79,831,594 | | | | 212,315 | | | | (66,267 | ) | | | 3,120,138 | |
| Net realized loss on foreign currency transactions | | | – | | | | (200,262 | ) | | | (31,253 | ) | | | (10 | ) |
| Total net realized gain/(loss) | | | 79,831,594 | | | | 12,053 | | | | (97,520 | ) | | | 3,120,128 | |
| Net change in unrealized depreciation on investments | | | (10,173,890 | ) | | | (5,821,516 | ) | | | (2,292,345 | ) | | | (7,304,443 | ) |
| Net change in unrealized appreciation/(depreciation) on | | | | | | | | | | | | | | | | |
| translation of assets and liabilities denominated in foreign currencies | | | – | | | | 17,347 | | | | 2,199 | | | | (262 | ) |
| Total net change in unrealized depreciation | | | (10,173,890 | ) | | | (5,804,169 | ) | | | (2,290,146 | ) | | | (7,304,705 | ) |
| NET REALIZED AND UNREALIZED GAIN/(LOSS) ON INVESTMENTS | | | 69,657,704 | | | | (5,792,116 | ) | | | (2,387,666 | ) | | | (4,184,577 | ) |
| NET INCREASE/(DECREASE) IN NET ASSETS RESULTING FROM OPERATIONS | | $ | 116,764,390 | | | $ | 1,479,289 | | | $ | (1,042,885 | ) | | $ | (3,382,754 | ) |
| *Net of foreign tax withholding: | | $ | – | | | $ | 875,356 | | | $ | 153,295 | | | $ | 1,603 | |
(a) Includes realized gain or loss as a result of in-kind transactions (See Note 4 in Notes to Financial Statements).
See Notes to Financial Statements.
23 | November 30, 2022
ALPS Sector Dividend Dogs ETF |
| Statements of Changes in Net Assets |
| | | For the Year Ended November 30, 2022 | | For the Year Ended November 30, 2021 |
| OPERATIONS: | | | | |
| Net investment income | | $ | 47,106,686 | | | $ | 39,668,912 | |
| Net realized gain` | | | 79,831,594 | | | | 20,856,818 | |
| Net change in unrealized appreciation/(depreciation) | | | (10,173,890 | ) | | | 133,811,971 | |
| Net increase in net assets resulting from operations | | | 116,764,390 | | | | 194,337,701 | |
| | | | | | | | | |
| Net Equalization Credits/(Debits) | | | 1,492,734 | | | | (376,556 | ) |
| | | | | | | | | |
| DISTRIBUTIONS TO SHAREHOLDERS: | | | | | | | | |
| From distributable earnings | | | (46,839,426 | ) | | | (41,129,463 | ) |
| Total distributions | | | (46,839,426 | ) | | | (41,129,463 | ) |
| | | | | | | | | |
| CAPITAL SHARE TRANSACTIONS: | | | | | | | | |
| Proceeds from sale of shares | | | 142,289,681 | | | | 42,671,156 | |
| Cost of shares redeemed | | | (44,389,643 | ) | | | (68,650,049 | ) |
| Net income equalization (Note 2) | | | (1,492,734 | ) | | | 376,556 | |
| Net increase/(decrease) from share transactions | | | 96,407,304 | | | | (25,602,337 | ) |
| Net increase in net assets | | | 167,825,002 | | | | 127,229,345 | |
| | | | | | | | | |
| NET ASSETS: | | | | | | | | |
| Beginning of year | | | 1,134,743,396 | | | | 1,007,514,051 | |
| End of year | | $ | 1,302,568,398 | | | $ | 1,134,743,396 | |
| | | | | | | | | |
| OTHER INFORMATION: | | | | | | | | |
| CAPITAL SHARE TRANSACTIONS: | | | | | | | | |
| Beginning shares | | | 22,484,141 | | | | 23,059,141 | |
| Shares sold | | | 2,700,000 | | | | 800,000 | |
| Shares redeemed | | | (875,000 | ) | | | (1,375,000 | ) |
| Shares outstanding, end of year | | | 24,309,141 | | | | 22,484,141 | |
See Notes to Financial Statements.
24 | November 30, 2022
| ALPS International Sector Dividend Dogs ETF |
| Statements of Changes in Net Assets |
| | | For the Year Ended November 30, 2022 | | For the Year Ended November 30, 2021 |
| OPERATIONS: | | | | |
| Net investment income | | $ | 7,271,405 | | | $ | 6,944,021 | |
| Net realized gain/(loss) | | | 12,053 | | | | (3,001,108 | ) |
| Net change in unrealized appreciation/(depreciation) | | | (5,804,169 | ) | | | 12,459,941 | |
| Net increase in net assets resulting from operations | | | 1,479,289 | | | | 16,402,854 | |
| Net Equalization Credits/(Debits) | | | 157,925 | | | | (1,568,545 | ) |
| | | | | | | | | |
| DISTRIBUTIONS TO SHAREHOLDERS: | | | | | | | | |
| From distributable earnings | | | (6,875,035 | ) | | | (7,018,603 | ) |
| From tax return of capital | | | (104,515 | ) | | | (36,242 | ) |
| Total distributions | | | (6,979,550 | ) | | | (7,054,845 | ) |
| | | | | | | | | |
| CAPITAL SHARE TRANSACTIONS: | | | | | | | | |
| Proceeds from sale of shares | | | 47,390,193 | | | | 22,093,394 | |
| Cost of shares redeemed | | | (29,427,911 | ) | | | (20,383,668 | ) |
| Net income equalization (Note 2) | | | (157,925 | ) | | | 1,568,545 | |
| Net increase from share transactions | | | 17,804,357 | | | | 3,278,271 | |
| Net increase in net assets | | | 12,462,021 | | | | 11,057,735 | |
| | | | | | | | | |
| NET ASSETS: | | | | | | | | |
| Beginning of year | | | 157,488,621 | | | | 146,430,886 | |
| End of year | | $ | 169,950,642 | | | $ | 157,488,621 | |
| | | | | | | | | |
| OTHER INFORMATION: | | | | | | | | |
| CAPITAL SHARE TRANSACTIONS: | | | | | | | | |
| Beginning shares | | | 5,950,000 | | | | 5,900,000 | |
| Shares sold | | | 1,775,000 | | | | 800,000 | |
| Shares redeemed | | | (1,150,000 | ) | | | (750,000 | ) |
| Shares outstanding, end of year | | | 6,575,000 | | | | 5,950,000 | |
See Notes to Financial Statements.
25 | November 30, 2022
| ALPS Emerging Sector Dividend Dogs ETF |
| Statements of Changes in Net Assets |
| | | For the Year Ended November 30, 2022 | | For the Year Ended November 30, 2021 |
| OPERATIONS: | | | | |
| Net investment income | | $ | 1,344,781 | | | $ | 1,061,607 | |
| Net realized gain/(loss) | | | (97,520 | ) | | | 998,537 | |
| Net change in unrealized appreciation/(depreciation) | | | (2,290,146 | ) | | | 1,419,906 | |
| Net increase/(decrease) in net assets resulting from operations | | | (1,042,885 | ) | | | 3,480,050 | |
| | | | | | | | | |
| Net Equalization Credits | | | 69,251 | | | | 19,079 | |
| | | | | | | | | |
| DISTRIBUTIONS TO SHAREHOLDERS: | | | | | | | | |
| From distributable earnings | | | (1,199,258 | ) | | | (971,386 | ) |
| Total distributions | | | (1,199,258 | ) | | | (971,386 | ) |
| | | | | | | | | |
| CAPITAL SHARE TRANSACTIONS: | | | | | | | | |
| Proceeds from sale of shares | | | 8,949,252 | | | | 1,275,304 | |
| Cost of shares redeemed | | | (3,266,629 | ) | | | – | |
| Net income equalization (Note 2) | | | (69,251 | ) | | | (19,079 | ) |
| Net increase from share transactions | | | 5,613,372 | | | | 1,256,225 | |
| Net increase in net assets | | | 3,440,480 | | | | 3,783,968 | |
| | | | | | | | | |
| NET ASSETS: | | | | | | | | |
| Beginning of year | | | 24,741,506 | | | | 20,957,538 | |
| End of year | | $ | 28,181,986 | | | $ | 24,741,506 | |
| | | | | | | | | |
| OTHER INFORMATION: | | | | | | | | |
| CAPITAL SHARE TRANSACTIONS: | | | | | | | | |
| Beginning shares | | | 1,050,000 | | | | 1,000,000 | |
| Shares sold | | | 450,000 | | | | 50,000 | |
| Shares redeemed | | | (175,000 | ) | | | – | |
| Shares outstanding, end of year | | | 1,325,000 | | | | 1,050,000 | |
See Notes to Financial Statements.
26 | November 30, 2022
| ALPS REIT Dividend Dogs ETF |
| Statements of Changes in Net Assets |
| | | For the Year Ended November 30, 2022 | | For the Year Ended November 30, 2021 |
| OPERATIONS: | | | | |
| Net investment income | | $ | 801,823 | | | $ | 770,660 | |
| Net realized gain/(loss) | | | 3,120,128 | | | | (1,539,997 | ) |
| Net change in unrealized appreciation/(depreciation) | | | (7,304,705 | ) | | | 8,191,103 | |
| Net increase/(decrease) in net assets resulting from operations | | | (3,382,754 | ) | | | 7,421,766 | |
| | | | | | | | | |
| DISTRIBUTIONS TO SHAREHOLDERS: | | | | | | | | |
| From distributable earnings | | | (825,395 | ) | | | (874,838 | ) |
| From tax return of capital | | | (282,853 | ) | | | (444,426 | ) |
| Total distributions | | | (1,108,248 | ) | | | (1,319,264 | ) |
| | | | | | | | | |
| CAPITAL SHARE TRANSACTIONS: | | | | | | | | |
| Cost of shares redeemed | | | (3,444,778 | ) | | | (3,733,564 | ) |
| Net decrease from share transactions | | | (3,444,778 | ) | | | (3,733,564 | ) |
| Net increase/(decrease) in net assets | | | (7,935,780 | ) | | | 2,368,938 | |
| | | | | | | | | |
| NET ASSETS: | | | | | | | | |
| Beginning of year | | | 28,689,422 | | | | 26,320,484 | |
| End of year | | $ | 20,753,642 | | | $ | 28,689,422 | |
| | | | | | | | | |
| OTHER INFORMATION: | | | | | | | | |
| CAPITAL SHARE TRANSACTIONS: | | | | | | | | |
| Beginning shares | | | 575,000 | | | | 650,000 | |
| Shares sold | | | – | | | | – | |
| Shares redeemed | | | (75,000 | ) | | | (75,000 | ) |
| Shares outstanding, end of year | | | 500,000 | | | | 575,000 | |
See Notes to Financial Statements.
27 | November 30, 2022
| ALPS Sector Dividend Dogs ETF |
| Financial Highlights | For a Share Outstanding Throughout the Periods Presented |
| | | For the Year Ended November 30, 2022 | | For the Year Ended November 30, 2021 | | For the Year Ended November 30, 2020 | | For the Year Ended November 30, 2019 | | For the Year Ended November 30, 2018 |
| NET ASSET VALUE, BEGINNING OF PERIOD | | $ | 50.47 | | | $ | 43.69 | | | $ | 45.78 | | | $ | 44.26 | | | $ | 45.61 | |
| | | | | | | | | | | | | | | | | | | | | |
| INCOME/(LOSS) FROM INVESTMENT OPERATIONS: | | | | | | | | | | | | | | | | | | | | |
| Net investment income(a) | | | 2.02 | | | | 1.75 | | | | 1.70 | | | | 1.71 | | | | 1.54 | |
| Net realized and unrealized gain/(loss) | | | 3.11 | | | | 6.84 | | | | (2.14 | ) | | | 1.34 | | | | (1.31 | ) |
| Total from investment operations | | | 5.13 | | | | 8.59 | | | | (0.44 | ) | | | 3.05 | | | | 0.23 | |
| | | | | | | | | | | | | | | | | | | | | |
| DISTRIBUTIONS: | | | | | | | | | | | | | | | | | | | | |
| From net investment income | | | (2.02 | ) | | | (1.81 | ) | | | (1.65 | ) | | | (1.53 | ) | | | (1.58 | ) |
| Total distributions | | | (2.02 | ) | | | (1.81 | ) | | | (1.65 | ) | | | (1.53 | ) | | | (1.58 | ) |
| | | | | | | | | | | | | | | | | | | | | |
| Net increase/(decrease) in net asset value | | | 3.11 | | | | 6.78 | | | | (2.09 | ) | | | 1.52 | | | | (1.35 | ) |
| NET ASSET VALUE, END OF PERIOD | | $ | 53.58 | | | $ | 50.47 | | | $ | 43.69 | | | $ | 45.78 | | | $ | 44.26 | |
| TOTAL RETURN(b) | | | 10.42 | % | | | 19.77 | % | | | (0.27 | )% | | | 7.26 | % | | | 0.51 | % |
| | | | | | | | | | | | | | | | | | | | | |
| RATIOS/SUPPLEMENTAL DATA: | | | | | | | | | | | | | | | | | | | | |
| Net assets, end of period (000s) | | $ | 1,302,568 | | | $ | 1,134,743 | | | $ | 1,007,514 | | | $ | 1,746,784 | | | $ | 2,166,709 | |
| | | | | | | | | | | | | | | | | | | | | |
| Ratio of expenses to average net assets | | | 0.40 | % | | | 0.40 | % | | | 0.40 | % | | | 0.40 | % | | | 0.40 | % |
| Ratio of net investment income to average net assets | | | 3.84 | % | | | 3.43 | % | | | 4.27 | % | | | 3.97 | % | | | 3.40 | % |
| Portfolio turnover rate(c) | | | 53 | % | | | 54 | % | | | 77 | % | | | 55 | % | | | 61 | % |
| Undistributed net investment income included in price of units issued and redeemed(a)(d) | | $ | 0.06 | | | $ | (0.02 | ) | | $ | 0.12 | | | $ | 0.06 | | | $ | 0.04 | |
| (a) | Based on average shares outstanding during the period. |
| (b) | Total return is calculated assuming an initial investment made at the net asset value at the beginning of the period and redemption at the net asset value on the last day of the period and assuming all distributions are reinvested at reinvestment prices. Total return calculated for a period of less than one year is not annualized. |
| (c) | Portfolio turnover for periods less than one year is not annualized and does not include securities received or delivered from processing creations or redemptions in-kind. |
| (d) | The per share amount of equalization is presented to show the impact of equalization on distributable earnings per share. |
See Notes to Financial Statements.
28 | November 30, 2022
| ALPS International Sector Dividend Dogs ETF |
| Financial Highlights | For a Share Outstanding Throughout the Periods Presented |
| | | For the Year Ended November 30, 2022 | | | For the Year Ended November 30, 2021 | | | For the Year Ended November 30, 2020 | | | For the Year Ended November 30, 2019 | | | For the Year Ended November 30, 2018 | |
| NET ASSET VALUE, BEGINNING OF PERIOD | | $ | 26.47 | | | $ | 24.82 | | | $ | 26.88 | | | $ | 25.14 | | | $ | 28.27 | |
| | | | | | | | | | | | | | | | | | | | | |
| INCOME/(LOSS) FROM INVESTMENT OPERATIONS: | | | | | | | | | | | | | | | | | | | | |
| Net investment income(a) | | | 1.15 | | | | 1.09 | | | | 0.75 | | | | 1.20 | | | | 1.15 | |
| Net realized and unrealized gain/(loss) | | | (0.68 | ) | | | 1.65 | | | | (1.66 | ) | | | 1.69 | | | | (3.19 | ) |
| Total from investment operations | | | 0.47 | | | | 2.74 | | | | (0.91 | ) | | | 2.89 | | | | (2.04 | ) |
| | | | | | | | | | | | | | | | | | | | | |
| DISTRIBUTIONS: | | | | | | | | | | | | | | | | | | | | |
| From net investment income | | | (1.07 | ) | | | (1.08 | ) | | | (1.11 | ) | | | (1.15 | ) | | | (1.09 | ) |
| Tax return of capital | | | (0.02 | ) | | | (0.01 | ) | | | (0.04 | ) | | | – | | | | – | |
| Total distributions | | | (1.09 | ) | | | (1.09 | ) | | | (1.15 | ) | | | (1.15 | ) | | | (1.09 | ) |
| | | | | | | | | | | | | | | | | | | | | |
| Net increase/(decrease) in net asset value | | | (0.62 | ) | | | 1.65 | | | | (2.06 | ) | | | 1.74 | | | | (3.13 | ) |
| NET ASSET VALUE, END OF PERIOD | | $ | 25.85 | | | $ | 26.47 | | | $ | 24.82 | | | $ | 26.88 | | | $ | 25.14 | |
| TOTAL RETURN(b) | | | 1.92 | % | | | 10.93 | % | | | (3.08 | )% | | | 11.79 | % | | | (7.47 | )% |
| | | | | | | | | | | | | | | | | | | | | |
| RATIOS/SUPPLEMENTAL DATA: | | | | | | | | | | | | | | | | | | | | |
| Net assets, end of period (000s) | | $ | 169,951 | | | $ | 157,489 | | | $ | 146,431 | | | $ | 221,741 | | | $ | 285,327 | |
| | | | | | | | | | | | | | | | | | | | | |
| Ratio of expenses to average net assets | | | 0.50 | % | | | 0.50 | % | | | 0.50 | % | | | 0.50 | % | | | 0.50 | % |
| Ratio of net investment income to average net assets | | | 4.43 | % | | | 3.92 | % | | | 3.22 | % | | | 4.65 | % | | | 4.16 | % |
| Portfolio turnover rate(c) | | | 53 | % | | | 61 | % | | | 79 | % | | | 58 | % | | | 72 | % |
| Undistributed net investment income included in price of units issued and redeemed(a)(d) | | $ | 0.03 | | | $ | (0.25 | ) | | $ | 0.00 | (e) | | $ | 0.04 | | | $ | 0.05 | |
| (a) | Based on average shares outstanding during the period. |
| (b) | Total return is calculated assuming an initial investment made at the net asset value at the beginning of the period and redemption at the net asset value on the last day of the period and assuming all distributions are reinvested at reinvestment prices. Total return calculated for a period of less than one year is not annualized. |
| (c) | Portfolio turnover for periods less than one year is not annualized and does not include securities received or delivered from processing creations or redemptions in-kind. |
| (d) | The per share amount of equalization is presented to show the impact of equalization on distributable earnings per share |
See Notes to Financial Statements.
29 | November 30, 2022
| ALPS Emerging Sector Dividend Dogs ETF |
| Financial Highlights | For a Share Outstanding Throughout the Periods Presented |
| | | For the Year Ended November 30, 2022 | | | For the Year Ended November 30, 2021 | | | For the Year Ended November 30, 2020 | | | For the Year Ended November 30, 2019 | | | For the Year Ended November 30, 2018 | |
| NET ASSET VALUE, BEGINNING OF PERIOD | | $ | 23.56 | | | $ | 20.96 | | | $ | 20.67 | | | $ | 21.33 | | | $ | 24.29 | |
| | | | | | | | | | | | | | | | | | | | | |
| INCOME/(LOSS) FROM INVESTMENT OPERATIONS: | | | | | | | | | | | | | | | | | | | | |
| Net investment income(a) | | | 1.11 | | | | 1.04 | | | | 0.56 | | | | 0.89 | | | | 0.91 | |
| Net realized and unrealized gain/(loss) | | | (2.41 | ) | | | 2.50 | | | | 0.42 | | | | (0.33 | ) | | | (3.02 | ) |
| Total from investment operations | | | (1.30 | ) | | | 3.54 | | | | 0.98 | | | | 0.56 | | | | (2.11 | ) |
| | | | | | | | | | | | | | | | | | | | | |
| DISTRIBUTIONS: | | | | | | | | | | | | | | | | | | | | |
| From net investment income | | | (0.99 | ) | | | (0.94 | ) | | | (0.69 | ) | | | (1.22 | ) | | | (0.85 | ) |
| Total distributions | | | (0.99 | ) | | | (0.94 | ) | | | (0.69 | ) | | | (1.22 | ) | | | (0.85 | ) |
| | | | | | | | | | | | | | | | | | | | | |
| Net increase/(decrease) in net asset value | | | (2.29 | ) | | | 2.60 | | | | 0.29 | | | | (0.66 | ) | | | (2.96 | ) |
NET ASSET VALUE, END OF PERIOD | | $ | 21.27 | | | $ | 23.56 | | | $ | 20.96 | | | $ | 20.67 | | | $ | 21.33 | |
| TOTAL RETURN(b) | | | (5.20 | )% | | | 16.81 | % | | | 5.20 | % | | | 2.67 | % | | | (8.76 | )% |
| | | | | | | | | | | | | | | | | | | | | |
| RATIOS/SUPPLEMENTAL DATA: | | | | | | | | | | | | | | | | | | | | |
| Net assets, end of period (000s) | | $ | 28,182 | | | $ | 24,742 | | | $ | 20,958 | | | $ | 28,941 | | | $ | 35,201 | |
| | | | | | | | | | | | | | | | | | | | | |
| Ratio of expenses to average net assets | | | 0.60 | % | | | 0.60 | % | | | 0.60 | % | | | 0.60 | % | | | 0.60 | % |
| Ratio of net investment income to average net assets | | | 5.17 | % | | | 4.32 | % | | | 2.92 | % | | | 4.16 | % | | | 3.88 | % |
| Portfolio turnover rate(c) | | | 90 | % | | | 84 | % | | | 93 | % | | | 83 | % | | | 85 | % |
| Undistributed net investment income included in price of units issued and redeemed(a)(d) | | $ | 0.06 | | | $ | 0.02 | | | $ | 0.02 | | | $ | 0.01 | | | $ | 0.10 | |
| (a) | Based on average shares outstanding during the period. |
| (b) | Total return is calculated assuming an initial investment made at the net asset value at the beginning of the period and redemption at the net asset value on the last day of the period and assuming all distributions are reinvested at reinvestment prices. Total return calculated for a period of less than one year is not annualized. |
| (c) | Portfolio turnover for periods less than one year is not annualized and does not include securities received or delivered from processing creations or redemptions in-kind. |
| (d) | The per share amount of equalization is presented to show the impact of equalization on distributable earnings per share. |
See Notes to Financial Statements.
30 | November 30, 2022
| ALPS REIT Dividend Dogs ETF |
| Financial Highlights | For a Share Outstanding Throughout the Periods Presented |
| | | For the Year Ended November 30, 2022 | | | For the Year Ended November 30, 2021 | | | For the Year Ended November 30, 2020(a) | | | For the Year Ended November 30, 2019 | | | For the Year Ended November 30, 2018 | |
| NET ASSET VALUE, BEGINNING OF PERIOD | | $ | 49.89 | | | $ | 40.49 | | | $ | 48.42 | | | $ | 44.18 | | | $ | 45.37 | |
| | | | | | | | | | | | | | | | | | | | | |
INCOME/(LOSS) FROM INVESTMENT OPERATIONS: | | | | | | | | | | | | | | | | | | | | |
| Net investment income(b) | | | 1.49 | | | | 1.21 | | | | 1.29 | | | | 1.19 | | | | 1.17 | |
| Net realized and unrealized gain/(loss) | | | (7.86 | ) | | | 10.25 | | | | (7.26 | ) | | | 4.45 | | | | (0.53 | ) |
| Total from investment operations | | | (6.37 | ) | | | 11.46 | | | | (5.97 | ) | | | 5.64 | | | | 0.64 | |
| | | | | | | | | | | | | | | | | | | | | |
| DISTRIBUTIONS: | | | | | | | | | | | | | | | | | | | | |
| From net investment income | | | (1.51 | ) | | | (1.36 | ) | | | (1.57 | ) | | | (1.40 | ) | | | (1.83 | ) |
| Tax return of capital | | | (0.50 | ) | | | (0.70 | ) | | | (0.39 | ) | | | – | | | | – | |
| Total distributions | | | (2.01 | ) | | | (2.06 | ) | | | (1.96 | ) | | | (1.40 | ) | | | (1.83 | ) |
| | | | | | | | | | | | | | | | | | | | | |
| Net increase/(decrease) in net asset value | | | (8.38 | ) | | | 9.40 | | | | (7.93 | ) | | | 4.24 | | | | (1.19 | ) |
| NET ASSET VALUE, END OF PERIOD | | $ | 41.51 | | | $ | 49.89 | | | $ | 40.49 | | | $ | 48.42 | | | $ | 44.18 | |
| TOTAL RETURN(c) | | | (13.06 | )% | | | 29.03 | % | | | (11.77 | )% | | | 13.00 | % | | | 1.47 | % |
| | | | | | | | | | | | | | | | | | | | | |
| RATIOS/SUPPLEMENTAL DATA: | | | | | | | | | | | | | | | | | | | | |
| Net assets, end of period (000s) | | $ | 20,754 | | | $ | 28,689 | | | $ | 26,320 | | | $ | 53,265 | | | $ | 55,222 | |
| | | | | | | | | | | | | | | | | | | | | |
| Ratio of expenses to average net assets | | | 0.35 | % | | | 0.35 | % | | | 0.38 | %(d) | | | 0.55 | % | | | 0.55 | % |
| Ratio of net investment income to average net assets | | | 3.23 | % | | | 2.60 | % | | | 3.26 | % | | | 2.56 | % | | | 2.67 | % |
| Portfolio turnover rate(e) | | | 85 | % | | | 78 | % | | | 148 | % | | | 10 | % | | | 14 | % |
| (a) | Prior to January 2, 2020, the ALPS REIT Dividend Dogs ETF was known as the Cohen & Steers Global Realty Majors ETF. |
| (b) | Based on average shares outstanding during the period. |
| (c) | Total return is calculated assuming an initial investment made at the net asset value at the beginning of the period and redemption at the net asset value on the last day of the period and assuming all distributions are reinvested at reinvestment prices. Total return calculated for a period of less than one year is not annualized. |
| (d) | Effective January 2, 2020 the Fund's Advisory Fee changed from 0.55% to 0.35%. |
| (e) | Portfolio turnover for periods less than one year is not annualized and does not include securities received or delivered from processing creations or redemptions in-kind. |
See Notes to Financial Statements.
31 | November 30, 2022
| ALPS ETF Trust | |
| Notes to Financial Statements | November 30, 2022 |
1. ORGANIZATION
ALPS ETF Trust (the “Trust”), a Delaware statutory trust, is an open-end management investment company registered under the Investment Company Act of 1940, as amended (the “1940 Act”). As of November 30, 2022, the Trust consisted of twenty-three separate portfolios. Each portfolio represents a separate series of the Trust. This report pertains to the ALPS Sector Dividend Dogs ETF, the ALPS International Sector Dividend Dogs ETF, the ALPS Emerging Sector Dividend Dogs ETF, and the ALPS REIT Dividend Dogs ETF (each a “Fund” and collectively, the “Funds”).
The investment objective of the ALPS Sector Dividend Dogs ETF is to seek investment results that replicate as closely as possible, before fees and expenses, the performance of the S-Network® Sector Dividend Dogs Index. The investment objective of the ALPS International Sector Dividend Dogs ETF is to seek investment results that replicate as closely as possible, before fees and expenses, the performance of the S-Network® International Sector Dividend Dogs Index. The investment objective of the ALPS Emerging Sector Dividend Dogs ETF is to seek investment results that replicate as closely as possible, before fees and expenses, the performance of the S-Network® Emerging Sector Dividend Dogs Index. The investment objective of the ALPS REIT Dividend Dogs ETF is to seek investment results that replicate as closely as possible, before fees and expenses, the performance of the S-Network® REIT Dividend Dogs Index. Each Fund has elected to qualify as a diversified series of the Trust under the 1940 Act.
Each Fund’s Shares (“Shares”) are listed on the NYSE Arca, Inc. (the “NYSE Arca”). Each Fund issues and redeems Shares, at net asset value (“NAV”) in blocks of 25,000 Shares, each of which is called a “Creation Unit”. Creation Units are issued and redeemed principally in-kind for securities included in the Underlying Index. Except when aggregated in Creation Units, Shares are not redeemable securities of the Fund.
Pursuant to the Trust’s organizational documents, its Officers and Trustees are indemnified against certain liability arising out of the performance of their duties to the Trust. Additionally, in the normal course of business, the Trust enters into contracts with service providers that contain general indemnification clauses. The Trust’s maximum exposure under these arrangements is unknown, as this would involve future claims that may be made against the Trust that have not yet occurred.
2. SIGNIFICANT ACCOUNTING POLICIES
The following is a summary of significant accounting policies consistently followed by the Funds in the preparation of the financial statements. The accompanying financial statements were prepared in accordance with accounting principles generally accepted in the United States of America (“U.S. GAAP”). The preparation of financial statements in conformity with U.S. GAAP requires management to make certain estimates and assumptions that affect the reported amounts of assets and liabilities and disclosures of contingent assets and liabilities at the date of the financial statements and the reported amounts of revenue and expenses during the period. Actual results could differ from those estimates. Each Fund is considered an investment company under U.S. GAAP and follows the accounting and reporting guidance applicable to investment companies in the Financial Accounting Standards Board (“FASB”) Accounting Standards Codification Topic 946.
A. Portfolio Valuation
Each Fund’s NAV is determined daily, as of the close of regular trading on the New York Stock Exchange (“NYSE”), normally 4:00 p.m. Eastern time, on each day the NYSE is open for trading. The NAV is computed by dividing the value of all assets of the Fund (including accrued interest and dividends), less all liabilities (including accrued expenses and dividends declared but unpaid), by the total number of shares outstanding.
Portfolio securities listed on any exchange other than the NASDAQ Stock Market LLC (“NASDAQ”) are valued at the last sale price on the business day as of which such value is being determined. If there has been no sale on such day, the securities are valued at the mean of the most recent bid and ask prices on such day. Securities traded on the NASDAQ are valued at the NASDAQ Official Closing Price as determined by NASDAQ. Portfolio securities traded on more than one securities exchange are valued at the last sale price on the business day as of which such value is being determined at the close of the exchange representing the principal market for such securities. Portfolio securities traded in the over-the-counter market, but excluding securities traded on the NASDAQ, are valued at the last quoted sale price in such market.
The Funds’ investments are valued at market value or, in the absence of market value with respect to any portfolio securities, at fair value according to procedures adopted by the Trust’s Board of Trustees (the “Board”). Pursuant to Rule 2a-5 under the 1940 Act, the Board designated ALPS Advisors, Inc. (the "Adviser") as the valuation designee ("Valuation Designee") for each Fund to perform the fair value determinations relating to Fund investments. The Adviser may carry out its designated responsibilities as Valuation Designee through various teams and committees. When market quotations are not readily available or when events occur that make established valuation methods unreliable, securities of the Funds may be valued in good faith by the Valuation Designee. These securities generally include, but are not limited to, restricted securities (securities which may not be publicly sold without registration under the Securities Act of 1933) for which a pricing service is unable to provide a market price; securities whose trading has been formally suspended; a security whose market price is not available from a pre-established primary pricing source or the pricing source is not willing to provide a price; a security with respect to which an event has occurred that is most likely to materially affect the value of the security after the market has closed but before the calculation of the Fund’s NAV or make it difficult or impossible to obtain a reliable market quotation; or a security whose price, as provided by the pricing service, does not reflect the security’s “fair value” due to the security being de-listed from a national exchange or the security’s primary trading market is temporarily closed at a time when, under normal conditions, it would be open. As a general principle, the current “fair value” of a security would be the amount which the owner might reasonably expect to receive from the sale on the applicable exchange or principal market. A variety of factors may be considered in determining the fair value of such securities.
32 | November 30, 2022
| ALPS ETF Trust | |
| Notes to Financial Statements | November 30, 2022 |
B. Fair Value Measurements
Each Fund discloses the classification of its fair value measurements following a three-tier hierarchy based on the inputs used to measure fair value. Inputs refer broadly to the assumptions that market participants would use in pricing the asset or liability, including assumptions about risk. Inputs may be observable or unobservable. Observable inputs reflect the assumptions market participants would use in pricing the asset or liability that are developed based on market data obtained from sources independent of the reporting entity. Unobservable inputs reflect the reporting entity’s own assumptions about the assumptions market participants would use in pricing the asset or liability that are developed based on the best information available.
Valuation techniques used to value the Funds’ investments by major category are as follows:
Equity securities, including restricted securities, for which market quotations are readily available, are valued at the last reported sale price or official closing price as reported by a third party pricing vendor on the primary market or exchange on which they are traded and are categorized as Level 1 in the hierarchy. In the event there were no sales during the day or closing prices are not available, securities are valued at the mean of the most recent quoted bid and ask prices on such day and are generally categorized as Level 2 in the hierarchy. Investments in open-end mutual funds are valued at their closing NAV each business day and are categorized as Level 1 in the hierarchy.
Changes in valuation techniques may result in transfers in or out of an assigned level within the disclosure hierarchy.
Various inputs are used in determining the value of each Fund’s investments as of the end of the reporting period. When inputs used fall into different levels of the fair value hierarchy, the level in the hierarchy within which the fair value measurement falls is determined based on the lowest level input that is significant to the fair value measurement in its entirety. The designated input levels are not necessarily an indication of the risk or liquidity associated with these investments.
These inputs are categorized in the following hierarchy under applicable financial accounting standards:
| Level 1 – | Unadjusted quoted prices in active markets for identical investments, unrestricted assets or liabilities that a Fund has the ability to access at the measurement date; |
| Level 2 – | Quoted prices which are not active, quoted prices for similar assets or liabilities in active markets or inputs other than quoted prices that are observable (either directly or indirectly) for substantially the full term of the asset or liability; and |
| Level 3 – | Significant unobservable prices or inputs (including the Fund’s own assumptions in determining the fair value of investments) where there is little or no market activity for the asset or liability at the measurement date. |
The following is a summary of the inputs used to value the Funds’ investments as of November 30, 2022:
ALPS Sector Dividend Dogs ETF
| Investments in Securities at Value | | Level 1 - Quoted and Unadjusted Prices | | | Level 2 - Other Significant Observable Inputs | | | Level 3 - Significant Unobservable Inputs | | | Total | |
| Common Stocks* | | $ | 1,296,009,778 | | | $ | – | | | $ | – | | | $ | 1,296,009,778 | |
| Short Term Investments | | | 4,742,103 | | | | – | | | | – | | | | 4,742,103 | |
| Total | | $ | 1,300,751,881 | | | $ | – | | | $ | – | | | $ | 1,300,751,881 | |
ALPS International Sector Dividend Dogs ETF
| Investments in Securities at Value | | Level 1 - Quoted and Unadjusted Prices | | | Level 2 - Other Significant Observable Inputs | | | Level 3 - Significant Unobservable Inputs | | | Total | |
| Common Stocks* | | $ | 168,495,927 | | | $ | – | | | $ | – | | | $ | 168,495,927 | |
| Short Term Investments | | | 3,819,129 | | | | – | | | | – | | | | 3,819,129 | |
| Total | | $ | 172,315,056 | | | $ | – | | | $ | – | | | $ | 172,315,056 | |
33 | November 30, 2022
| ALPS ETF Trust | |
| Notes to Financial Statements | November 30, 2022 |
ALPS Emerging Sector Dividend Dogs ETF
| Investments in Securities at Value | | Level 1 - Quoted and Unadjusted Prices | | | Level 2 - Other Significant Observable Inputs | | | Level 3 - Significant Unobservable Inputs | | | Total | |
| Common Stocks* | | | | | | | | | | | | | | | | |
| Russia | | $ | – | | | $ | – | | | $ | 1,554 | | | $ | 1,554 | |
| Other* | | $ | 28,010,582 | | | | – | | | | – | | | $ | 28,010,582 | |
| Short Term Investments | | | 1,027,471 | | | | – | | | | – | | | | 1,027,471 | |
| Total | | $ | 29,038,053 | | | $ | – | | | $ | 1,554 | | | $ | 29,039,607 | |
ALPS REIT Dividend Dogs ETF
| Investments in Securities at Value | | Level 1 - Quoted and Unadjusted Prices | | | Level 2 - Other Significant Observable Inputs | | | Level 3 - Significant Unobservable Inputs | | | Total | |
| Common Stocks* | | $ | 20,675,706 | | | $ | – | | | $ | – | | | $ | 20,675,706 | |
| Short Term Investments | | | 59,397 | | | | – | | | | – | | | | 59,397 | |
| Total | | $ | 20,735,103 | | | $ | – | | | $ | – | | | $ | 20,735,103 | |
| * | For a detailed sector/country breakdown, see the accompanying Schedules of Investments. |
The Funds, except for the ALPS Emerging Sector Dividend Dogs ETF, did not have any securities that used significant unobservable inputs (Level 3) in determining fair value and there were no transfers into or out of Level 3 during the year ended November 30, 2022. As of November 30, 2022, ALPS Emerging Sector Dividend Dogs ETF held securities classified as Level 3 in the fair value hierarchy valued at $1,554, which represents 0.01% of net assets. The net change in unrealized depreciation included in the Statements of Operations attributable to Level 3 investments held at November 30, 2022 is $2,459,526.
C. Foreign Securities
The ALPS International Sector Dividend Dogs ETF, the ALPS Emerging Sector Dividend Dogs ETF, and the ALPS REIT Dividend Dogs ETF may directly purchase securities of foreign issuers. Investments in non-U.S. issuers may involve unique risks compared to investing in securities of U.S. issuers, including, among others, less liquidity generally, greater market volatility than U.S. securities and less complete financial information than for U.S. issuers. In addition, adverse political, economic or social developments could undermine the value of the Fund’s investments or prevent the Fund from realizing the full value of its investments. Financial reporting standards for companies based in foreign markets differ from those in the United States. Finally, the value of the currency of the country in which the Fund has invested could decline relative to the value of the U.S. dollar, which may affect the value of the investment to U.S. investors.
Because foreign markets may be open on different days than the days during which investors may purchase the shares of each Fund, the value of each Fund's securities may change on the days when investors are not able to purchase the shares of the Funds. The value of securities denominated in foreign currencies is converted into U.S. dollars using exchange rates determined daily as of the close of regular trading on the NYSE or NASDAQ. Any use of a different rate from the rates used by the Index may adversely affect a Fund's ability to track its Index.
D. Foreign Currency Translation
The books and records of the Funds are maintained in U.S. dollars. Investment valuations and other assets and liabilities initially expressed in foreign currencies are converted each business day into U.S. dollars based upon current exchange rates. The portion of realized and unrealized gains or losses on investments due to fluctuations in foreign currency exchange rates is not separately disclosed and is included in realized and unrealized gains or losses on investments, when applicable.
E. Securities Transactions and Investment Income
Securities transactions are recorded as of the trade date. Realized gains and losses from securities transactions are recorded on the specific identification in accordance with GAAP. Dividend income and capital gains distributions, if any, are recorded on the ex-dividend date, net of any foreign taxes withheld. Interest income, if any, is recorded on the accrual basis, including any amortization of premiums and accretion of discounts.
F. Dividends and Distributions to Shareholders
Dividends from net investment income for each Fund, if any, are declared and paid quarterly or as the Board may determine from time to time. Distributions of net realized capital gains earned by the Funds, if any, are distributed at least annually.
34 | November 30, 2022
| ALPS ETF Trust | |
| Notes to Financial Statements | November 30, 2022 |
G. Equalization
The ALPS Sector Dividend Dogs ETF, the ALPS International Sector Dividend Dogs ETF, and the ALPS Emerging Sector Dividend Dogs ETF utilize the accounting practice known as “Equalization” by which a portion of the proceeds from sales and costs of reacquiring the Funds’ shares, equivalent on a per share basis to the amount of distributable net investment income on the date of the transaction, is credited or charged to undistributed net investment income. As a result, undistributed net investment income per share is unaffected by sales or reacquisitions of the Funds’ shares. Amounts related to Equalization can be found on the Statements of Changes in Net Assets.
H. Real Estate Investment Trusts (“REITs”)
As part of its investments in real estate related securities, the ALPS REIT Dividend Dogs ETF (“RDOG”) will invest in REITs and is subject to certain risks associated with direct investment in REITs. REITs possess certain risks which differ from an investment in common stocks. REITs are financial vehicles that pool investors’ capital to acquire, develop and/or finance real estate and provide services to their tenants. REITs may concentrate their investments in specific geographic areas or in specific property types, e.g., regional malls, shopping centers, office buildings, apartment buildings and industrial warehouses. REITs may be affected by changes in the value of their underlying properties and by defaults by borrowers or tenants. REITs depend generally on their ability to generate cash flow to make distributions to shareowners, and certain REITs have self-liquidation provisions by which mortgages held may be paid in full and distributions of capital returns may be made at any time.
As REITs generally pay a higher rate of dividends than most other operating companies, to the extent application of RDOG’s investment strategy results in RDOG investing in REIT shares, the percentage of RDOG’s dividend income received from REIT shares will likely exceed the percentage of RDOG’s portfolio that is comprised of REIT shares. Distributions received by RDOG from REITs may consist of dividends, capital gains and/or return of capital.
Dividend income from REITs is recognized on the ex-dividend date. The calendar year-end amounts of ordinary income, capital gains, and return of capital included in distributions received from RDOG’s investments in REITs are reported to RDOG after the end of the calendar year; accordingly, RDOG estimates these amounts for accounting purposes until the characterization of REIT distributions is reported to RDOG after the end of the calendar year. Estimates are based on the most recent REIT distribution information available.
The performance of a REIT may be affected by its failure to qualify for tax-free pass-through of income under the Internal Revenue Code of 1986, as amended (the “Code”), or its failure to maintain exemption from registration under the 1940 Act. Due to RDOG’s investments in REITs, RDOG may also make distributions in excess of RDOG’s earnings and capital gains. Distributions, if any, in excess of RDOG’s earnings and profits will first reduce the adjusted tax basis of a holder’s shares and, after that basis has been reduced to zero, will constitute capital gains to the shareholder.
I. Federal Tax and Tax Basis Information
The timing and character of income and capital gain distributions are determined in accordance with income tax regulations, which may differ from U.S. GAAP. Reclassifications are made to the Funds’ capital accounts for permanent tax differences to reflect income and gains available for distribution (or available capital loss carryforwards) under income tax regulations.
For the year ended November 30, 2022, the following reclassifications, which had no impact on results of operations or net assets, were recorded to reflect permanent tax differences resulting primarily from in-kind transactions:
| Fund | | Paid-in Capital | | | Total Distributable Earnings | |
| ALPS Sector Dividend Dogs ETF | | $ | 5,275,846 | | | $ | (5,275,846 | ) |
| ALPS International Sector Dividend Dogs ETF | | | 1,392,749 | | | | (1,392,749 | ) |
| ALPS Emerging Sector Dividend Dogs ETF | | | 165,862 | | | | (165,862 | ) |
| ALPS REIT Dividend Dogs ETF | | | 166,844 | | | | (166,844 | ) |
35 | November 30, 2022
| ALPS ETF Trust | |
| Notes to Financial Statements | November 30, 2022 |
The tax character of distributions paid during the fiscal years ended November 30, 2022 and November 30, 2021 was as follows:
| Fund | | Ordinary Income | | | Return of Capital | |
| November 30, 2022 | | | | | | |
| ALPS Sector Dividend Dogs ETF | | $ | 46,839,426 | | | $ | – | |
| ALPS International Sector Dividend Dogs ETF | | | 6,875,035 | | | | 104,515 | |
| ALPS Emerging Sector Dividend Dogs ETF | | | 1,199,258 | | | | – | |
| ALPS REIT Dividend Dogs ETF | | | 825,395 | | | | 282,853 | |
| Fund | | Ordinary Income | | | Return of Capital | |
| November 30, 2021 | | | | | | |
| ALPS Sector Dividend Dogs ETF | | $ | 41,129,463 | | | $ | – | |
| ALPS International Sector Dividend Dogs ETF | | | 7,018,603 | | | | 36,242 | |
| ALPS Emerging Sector Dividend Dogs ETF | | | 971,386 | | | | – | |
| ALPS REIT Dividend Dogs ETF | | | 874,838 | | | | 444,426 | |
The character of distributions made during the year may differ from its ultimate characterization for federal income tax purposes.
Under current law, capital losses maintain their character as short-term or long-term and are carried forward to the next tax year without expiration. As of November 30, 2022, the following amounts are available as carry forwards to the next tax year:
| Fund | | Short-Term | | | Long-Term | |
| ALPS Sector Dividend Dogs ETF | | $ | – | | | $ | 200,576,307 | |
| ALPS International Sector Dividend Dogs ETF | | | 4,571,287 | | | | 48,986,381 | |
| ALPS Emerging Sector Dividend Dogs ETF | | | 436,837 | | | | 7,651,923 | |
| ALPS REIT Dividend Dogs ETF | | | 5,407,710 | | | | 979,936 | |
The ALPS Sector Dividend Dogs ETF, ALPS Emerging Sector Dividend Dogs ETF and ALPS REIT Dividend Dogs ETF used capital loss carryovers during the year ended November 30, 2022 in the amount of $78,336,431, $465,578, and $ 2,884,455, respectively.
As of November 30, 2022, the components of distributable earnings on a tax basis for each Fund were as follows:
| | | Undistributed net investment income | | | Accumulated net realized loss on investments | | | Net unrealized appreciation/ (depreciation) on investments | | | Total | |
| ALPS Sector Dividend Dogs ETF | | $ | 4,643,070 | | | $ | (200,576,307 | ) | | $ | 60,342,870 | | | $ | (135,590,367 | ) |
| ALPS International Sector Dividend Dogs ETF | | | – | | | | (53,557,668 | ) | | | (12,042,223 | ) | | | (65,599,891 | ) |
| ALPS Emerging Sector Dividend Dogs ETF | | | 224,618 | | | | (8,088,760 | ) | | | (2,708,343 | ) | | | (10,572,485 | ) |
| ALPS REIT Dividend Dogs ETF | | | – | | | | (6,387,646 | ) | | | (3,864,820 | ) | | | (10,252,466 | ) |
As of November 30, 2022, the cost of investments for federal income tax purposes and accumulated net unrealized appreciation/(depreciation) on investments were as follows:
| | | Gross Appreciation (excess of value over tax cost) | | | Gross Depreciation (excess of tax cost over value) | | | Net Appreciation/ (Depreciation) of Foreign Currency | | | Net Unrealized Appreciation/ (Depreciation) | | | Cost of Investments for Income Tax Purposes | |
| ALPS Sector Dividend Dogs ETF | | $ | 187,745,253 | | | $ | (127,402,383 | ) | | $ | – | | | $ | 60,342,870 | | | $ | 1,240,409,011 | |
| ALPS International Sector Dividend Dogs ETF | | | 10,879,886 | | | | (22,930,955 | ) | | | 8,846 | | | | (12,042,223 | ) | | | 184,366,125 | |
| ALPS Emerging Sector Dividend Dogs ETF | | | 2,545,409 | | | | (5,255,270 | ) | | | 1,518 | | | | (2,708,343 | ) | | | 31,749,468 | |
| ALPS REIT Dividend Dogs ETF | | | 885,736 | | | | (4,750,453 | ) | | | (103 | ) | | | (3,864,820 | ) | | | 24,599,820 | |
The differences between book-basis and tax-basis are primarily due to the deferral of losses from wash sales
36 | November 30, 2022
| ALPS ETF Trust | |
| Notes to Financial Statements | November 30, 2022 |
J. Income Taxes
No provision for income taxes is included in the accompanying financial statements, as each Fund intends to distribute to shareholders all taxable investment income and realized gains and otherwise comply with Subchapter M of the Code, applicable to regulated investment companies. Each Fund evaluates tax positions taken (or expected to be taken) in the course of preparing the Fund’s tax returns to determine whether these positions meet a “more-likely-than-not” standard that, based on the technical merits, have a more than fifty percent likelihood of being sustained by a taxing authority upon examination. A tax position that meets the “more-likely-than-not” recognition threshold is measured to determine the amount of benefit to recognize in the financial statements.
As of and during the year ended November 30, 2022, each Fund did not have a liability for any unrecognized tax benefits. Each Fund files U.S. federal, state, and local tax returns as required. Each Fund’s tax returns are subject to examination by the relevant tax authorities until expiration of the applicable statute of limitations, which is generally three years after the filing of the tax return, but may extend to four years in certain jurisdictions. Each Fund’s tax returns for open years have incorporated no uncertain tax positions that require a provision for income taxes.
K. Lending of Portfolio Securities
The Funds have entered into a securities lending agreement with State Street Bank & Trust Co. (“SSB”), the Funds’ lending agent. Each Fund may lend its portfolio securities only to borrowers that are approved by SSB. Each Fund will limit such lending to not more than 33 1/3% of the value of its total assets. The Fund’s securities held at SSB as custodian shall be available to be lent except those securities the Fund or ALPS Advisors, Inc. specifically identifies in writing as not being available for lending. The borrower pledges and maintains with the Fund collateral consisting of cash (U.S. Dollars only), securities issued or guaranteed by the U.S. government or its agencies or instrumentalities, and cash equivalents (including irrevocable bank letters of credit) issued by a person other than the borrower or an affiliate of the borrower. The initial collateral received by the Fund is required to have a value of no less than 102% of the market value of the loaned securities for U.S equity securities and a value of no less than 105% of the market value for non-U.S. equity securities. The collateral is maintained thereafter, at a market value equal to not less than 102% of the current value of the U.S. equity securities on loan and not less than 105% of the current value of the non-U.S. equity securities on loan. The market value of the loaned securities is determined at the close of each business day and any additional required collateral is delivered to the Fund on the next business day. During the term of the loan, each Fund is entitled to all distributions made on or in respect of the loaned securities. Loans of securities are terminable at any time and the borrower, after notice, is required to return borrowed securities within the customary time period for settlement of securities transactions.
Any cash collateral received is reinvested in a money market fund managed by SSB as disclosed in the Fund’s Schedule of Investments and is reflected in the Statements of Assets and Liabilities as a payable for collateral upon return of securities loaned. Non-cash collateral, in the form of securities issued or guaranteed by the U.S. government or its agencies or instrumentalities, is not disclosed in the Fund’s Statement of Assets and Liabilities as it is held by the lending agent on behalf of the Fund, and the Fund does not have the ability to re-hypothecate these securities. Income earned by the Fund from securities lending activity is disclosed in the Statements of Operations.
The following is a summary of the Fund's securities lending agreement and related cash and non-cash collateral received as of November 30, 2022:
| Fund | | Market Value of Securities on Loan | | | Cash Collateral Received | | | Non-Cash Collateral Received | | | Total Collateral Received | |
| ALPS Sector Dividend Dogs ETF | | $ | 10,861,316 | | | $ | 4,423,194 | | | $ | 6,613,669 | | | $ | 11,036,863 | |
| ALPS International Sector Dividend Dogs ETF | | | 3,499,054 | | | | 3,652,196 | | | | – | | | | 3,652,196 | |
| ALPS Emerging Sector Dividend Dogs ETF | | | 1,755,722 | | | | 964,712 | | | | 871,650 | | | | 1,836,362 | |
The risks of securities lending include the risk that the borrower may not provide additional collateral when required or may not return the securities when due. To mitigate these risks, the Funds benefit from a borrower default indemnity provided by SSB. SSB’s indemnity allows for full replacement of securities lent wherein SSB will purchase the unreturned loaned securities on the open market by applying the proceeds of the collateral, or to the extent such proceeds are insufficient or the collateral is unavailable, SSB will purchase the unreturned loan securities at SSB’s expense. However, the Funds could suffer a loss if the value of the investments purchased with cash collateral falls below the value of the cash collateral received.
37 | November 30, 2022
| ALPS ETF Trust | |
| Notes to Financial Statements | November 30, 2022 |
The following table reflects a breakdown of transactions accounted for as secured borrowings, the gross obligation by the type of collateral pledged or securities loaned, and the remaining contractual maturity of those transactions as of November 30, 2022:
| ALPS Sector Dividend Dogs ETF | | Remaining contractual maturity of the agreements |
| Securities Lending Transactions | | Overnight & Continuous | | Up to 30 Days | | | 30-90 Days | | | Greater than 90 Days | | | Total | |
| Common Stocks | | $4,423,194 | | $ | – | | | $ | – | | | $ | – | | | $ | 4,423,194 | |
| Total Borrowings | | | | | | | | | | | | | | | | | 4,423,194 | |
| Gross amount of recognized liabilities for securities lending (collateral received) | | | | $ | 4,423,194 | |
| ALPS International Sector Dividend Dogs ETF | | Remaining contractual maturity of the agreements |
| Securities Lending Transactions | | Overnight & Continuous | | Up to 30 Days | | | 30-90 Days | | | Greater than 90 Days | | | Total | |
| Common Stocks | | $3,652,196 | | $ | – | | | $ | – | | | $ | – | | | $ | 3,652,196 | |
| Total Borrowings | | | | | | | | | | | | | | | | | 3,652,196 | |
| Gross amount of recognized liabilities for securities lending (collateral received) | | | $ | 3,652,196 | |
| ALPS Emerging Sector Dividend Dogs ETF | | Remaining contractual maturity of the agreements |
| Securities Lending Transactions | | Overnight & Continuous | | Up to 30 Days | | | 30-90 Days | | | Greater than 90 Days | | | Total | |
| Common Stocks | | $964,712 | | $ | – | | | $ | – | | | $ | – | | | $ | 964,712 | |
| Total Borrowings | | | | | | | | | | | | | | | | | 964,712 | |
| Gross amount of recognized liabilities for securities lending (collateral received) | | | $ | 964,712 | |
3. INVESTMENT ADVISORY FEE AND OTHER AFFILIATED TRANSACTIONS
ALPS Advisors, Inc. serves as the Funds’ investment adviser pursuant to an Investment Advisory Agreement with the Trust on behalf of each Fund (the “Advisory Agreement”). Pursuant to the Advisory Agreement, each Fund pays the Adviser an annual management fee for the services and facilities it provides, payable on a monthly basis as a percentage of the relevant Fund’s average daily net assets as set out below. From time to time, the Adviser may waive all or a portion of its fee.
| Fund | Advisory Fee |
| ALPS Sector Dividend Dogs ETF | 0.40% |
| ALPS International Sector Dividend Dogs ETF | 0.50% |
| ALPS Emerging Sector Dividend Dogs ETF | 0.60% |
| ALPS REIT Dividend Dogs ETF | 0.35% |
Out of the unitary management fee, the Adviser pays substantially all expenses of each Fund, including licensing fees to the Underlying Index provider, the cost of transfer agency, custody, fund administration, legal, audit, trustees and other services, except for interest expenses, distribution fees or expenses, brokerage expenses, taxes and extraordinary expenses not incurred in the ordinary course of each Fund's business. The Adviser’s unitary management fee is designed to pay substantially all of each Fund's expenses and to compensate the Adviser for providing services for each Fund.
ALPS Fund Services, Inc., an affiliate of the Adviser, is the administrator of the Funds.
Effective February 16, 2022, each Trustee receives (1) a quarterly retainer of $20,000, (2) a per meeting fee of $10,000, (3) $2,500 for any special meeting held outside of a regularly scheduled board meeting, and (4) reimbursement for all reasonable out-of-pocket expenses relating to attendance at meetings. In addition, the Chairman of the Board receives a quarterly retainer of $5,000, the Chairman of the Audit Committee receives a quarterly retainer of $3,000, and the Chairman of the Nominating & Governance Committee receives a quarterly retainer of $2,000, each in connection with their respective roles. Prior to February 16, 2022, each Trustee received (1) a quarterly retainer of $10,000, (2) a per meeting fee of $5,000, (3) $1,500 for any special meeting held outside of a regularly scheduled board meeting, and (4) reimbursement for all reasonable out-of-pocket expenses relating to attendance at meetings. In addition, the Chairman of the Board and Chairman of the Audit Committee each received a quarterly retainer of $2,000, in connection with their respective roles.
38 | November 30, 2022
| ALPS ETF Trust | |
| Notes to Financial Statements | November 30, 2022 |
4. PURCHASES AND SALES OF SECURITIES
For the year ended November 30, 2022, the cost of purchases and proceeds from sales of investment securities, excluding short-term investments and in-kind transactions, were as follows:
| Fund | | Purchases | | | Sales | |
| ALPS Sector Dividend Dogs ETF | | $ | 651,111,558 | | | $ | 648,908,071 | |
| ALPS International Sector Dividend Dogs ETF | | | 87,117,978 | | | | 86,616,339 | |
| ALPS Emerging Sector Dividend Dogs ETF | | | 25,056,436 | | | | 23,208,308 | |
| ALPS REIT Dividend Dogs ETF | | | 20,965,868 | | | | 20,980,488 | |
For the year ended November 30, 2022, the cost of in-kind purchases and proceeds from in-kind sales were as follows:
| Fund | | Purchases | | | Sales | |
| ALPS Sector Dividend Dogs ETF | | $ | 142,270,611 | | | $ | 44,382,656 | |
| ALPS International Sector Dividend Dogs ETF | | | 46,694,143 | | | | 29,331,781 | |
| ALPS Emerging Sector Dividend Dogs ETF | | | 6,282,279 | | | | 2,428,929 | |
| ALPS REIT Dividend Dogs ETF | | | – | | | | 3,445,174 | |
For the year ended November 30, 2022, the in-kind net realized gains/(losses) were as follows:
| Fund | | Net Realized Gain/(Loss) | |
| ALPS Sector Dividend Dogs ETF | | $ | 6,300,891 | |
| ALPS International Sector Dividend Dogs ETF | | | 1,706,733 | |
| ALPS Emerging Sector Dividend Dogs ETF | | | 231,858 | |
| ALPS REIT Dividend Dogs ETF | | | 301,728 | |
Gains on in-kind transactions are not considered taxable for federal income tax purposes and losses on in-kind transactions are also not deductible for tax purposes.
5. CAPITAL SHARE TRANSACTIONS
Shares are created and redeemed by each Fund only in Creation Unit size aggregations of 25,000 shares. Only broker-dealers or large institutional investors with creation and redemption agreements called Authorized Participants (“AP”) are permitted to purchase or redeem Creation Units from the Funds. Such transactions are generally permitted on an in-kind basis, with a balancing cash component to equate the transaction to the NAV per unit of each Fund on the transaction date. Cash may be substituted equivalent to the value of certain securities generally when they are not available in sufficient quantity for delivery, not eligible for trading by the AP or as a result of other market circumstances.
6. RELATED PARTY TRANSACTIONS
The ALPS Sector Dividend Dogs ETF and ALPS International Sector Dividend Dogs ETF engaged in cross trades between other funds in the Trust during the year ended November 30, 2022 pursuant to Rule 17a-7 under the 1940 Act. Cross trading is the buying or selling of portfolio securities between funds to which the Adviser serves as the investment adviser. The Board previously adopted procedures that apply to transactions between the Funds of the Trust pursuant to Rule 17a-7. These transactions related to cross trades during the period complied with the requirements set forth by Rule 17a-7 and the Trust’s procedures.
Transactions related to cross trades during the year ended November 30, 2022, were as follows:
| | | Purchase cost paid | | | Sale proceeds received | | | Realized gain/(loss) on sales | |
| ALPS Sector Dividend Dogs ETF | | $ | 8,768,015 | | | $ | 3,311,891 | | | $ | (731,437 | ) |
| ALPS International Sector Dividend Dogs ETF | | | 412,584 | | | | 513,553 | | | | (197,524 | ) |
39 | November 30, 2022
| ALPS ETF Trust | |
| Notes to Financial Statements | November 30, 2022 |
7. MARKET RISK
The Funds are subject to investment and operational risks associated with financial, economic and other global market developments and disruptions, including the recent spread of an infectious respiratory illness caused by a novel strain of coronavirus (known as COVID-19), which can negatively impact the securities markets and cause each Fund to lose value. Securities in each Fund’s portfolio may underperform in comparison to securities in general financial markets, a particular financial market or other asset classes due to a number of factors, including inflation (or expectations for inflation), deflation (or expectations for deflation), interest rates, global demand for particular products or resources, market instability, debt crises and downgrades, embargoes, tariffs, sanctions and other trade barriers, regulatory events, other governmental trade or market control programs and related geopolitical events. In addition, the value of the Fund’s investments may be negatively affected by the occurrence of global events such as war, terrorism, environmental disasters, natural disasters or events, country instability, and infectious disease epidemics or pandemics.
The spread of COVID-19 has caused volatility, severe market dislocations and liquidity constraints in many markets, including markets for the securities each Fund holds, and may adversely affect each Fund’s investments and operations. The transmission of COVID-19 and efforts to contain its spread have resulted in travel restrictions and disruptions, closed international borders, enhanced health screenings at ports of entry and elsewhere, disruption of and delays in healthcare service preparation and delivery, quarantines, event and service cancellations or interruptions, disruptions to business operations and supply chains, and a reduction in consumer and business spending, as well as general concern and uncertainty that has negatively affected the economy. These disruptions have led to instability in the market place and the jobs market. The impact of COVID-19 could adversely affect the economies of many nations or the entire global economy, the financial well-being and performance of individual issuers, borrowers and sectors and the health of the markets generally in potentially significant and unforeseen ways.
The foregoing could lead to a significant economic downturn or recession, increased market volatility, a greater number of market closures, higher default rates and adverse effects on the values and liquidity of each Fund’s securities or other assets. Such impacts may adversely affect the performance of the Funds.
8. SUBSEQUENT EVENTS
Subsequent events, if any, after the date of the Statements of Assets and Liabilities have been evaluated through the date the financial statements were issued. Management has determined that there were no subsequent events to report through the issuance of these financial statements.
40 | November 30, 2022
| ALPS ETF Trust | |
| Additional Information | November 30, 2022 (Unaudited) |
PROXY VOTING RECORDS, POLICIES AND PROCEDURES
Information regarding how each Fund voted proxies relating to portfolio securities during the most recent 12-month period ended June 30 and a description of the Fund’s proxy voting policies and procedures used in determining how to vote for proxies are available without charge on the SEC’s website at www.sec.gov and upon request, by calling (toll-free) 1-866-759-5679.
PORTFOLIO HOLDINGS
The Fund files a complete schedule of portfolio holdings with the U.S. Securities and Exchange Commission (“SEC”) for the first and third quarters of each fiscal year on Form N-PORT within 60 days after the end of the period. Copies of the Fund’s Form N-PORT are available without a charge, upon request, by contacting the Fund at 1-866-759-5679 and on the SEC’s website at https://www.sec.gov.
TAX INFORMATION
The Funds designate the following as a percentage of taxable ordinary income distributions, or up to the maximum amount allowable, for the calendar year ended December 31, 2021:
| | | | Qualified Dividend Income | | | | Dividend Received Deduction | | | | 199A | |
| ALPS Sector Dividend Dogs ETF | | | 97.81 | % | | | 91.15 | % | | | 0.00 | % |
| ALPS International Sector Dividend Dogs ETF | | | 100.00 | % | | | 0.00 | % | | | 0.00 | % |
| ALPS Emerging Sector Dividend Dogs ETF | | | 73.67 | % | | | 0.00 | % | | | 0.00 | % |
| ALPS REIT Dividend Dogs ETF | | | 0.47 | % | | | 0.00 | % | | | 70.35 | % |
In early 2022, if applicable, shareholders of record received this information for the distributions paid to them by the Funds during the calendar year 2021 via Form 1099. The Funds will notify shareholders in early 2023 of amounts paid to them by the Funds, if any, during the calendar year 2022.
Pursuant to Section 853(c) of the Internal Revenue Code, the following Funds designated the following for the calendar year ended December 31, 2022:
| | | Foreign Taxes Paid | | | Foreign Source Income | |
| ALPS International Sector Dividend Dogs ETF | | $ | 751,325 | | | $ | 8,734,207 | |
| ALPS Emerging Sector Dividend Dogs ETF | | $ | 136,708 | | | $ | 1,576,116 | |
LICENSING AGREEMENTS
ALPS Sector Dividend Dogs ETF, ALPS International Sector Dividend Dogs ETF, ALPS Emerging Sector Dividend Dogs ETF, and ALPS REIT Dividend Dogs ETF
The Funds are not sponsored, endorsed, sold or promoted by S-Network Global Indexes, Inc.SM (“Licensor”). Licensor makes no representation or warranty, express or implied, to the owners of the Funds or any member of the public regarding the advisability of investing in securities generally or in the Funds particularly or the ability of the (i) in the case of SDOG, S-Network Sector Dividend DogsSM, (ii) in the case of IDOG, S-Network International Sector Dividend DogsSM, (iii) in the case of EDOG, S-Network Emerging Sector Dividend Dogs IndexSM, and (iv) in the case of RDOG, S-Network REIT Dividend Dogs IndexSM (each an “Underlying Index”) to track the performance of a market or sector. Licensor’s only relationship to the Licensee is the licensing of certain service marks and trade names of Licensor and of the Underlying Index that is determined, composed and calculated by Licensor without regard to the Licensee or the Fund. Licensor has no obligation to take the needs of the Licensee or the owners of the Fund into consideration in determining, composing or calculating the Underlying Index. Licensor is not responsible for and has not participated in the determination of the timing of, prices at, or quantities of the Fund to be issued or in the determination or calculation of the equation by which the Fund is to be converted into cash. Licensor has no obligation or liability in connection with the administration, marketing or trading of the Fund.
LICENSOR DOES NOT GUARANTEE THE ACCURACY AND/OR THE COMPLETENESS OF THE UNDERLYING INDEX OR ANY DATA INCLUDED THEREIN AND LICENSOR SHALL HAVE NO LIABILITY FOR ANY ERRORS, OMISSIONS, OR INTERRUPTIONS THEREIN. LICENSOR MAKES NO WARRANTY, EXPRESS OR IMPLIED, AS TO RESULTS TO BE OBTAINED BY LICENSEE, OWNERS OF THE FUND, OR ANY OTHER PERSON OR ENTITY FROM THE USE OF THE UNDERLYING INDEX OR ANY DATA INCLUDED THEREIN. LICENSOR MAKES NO EXPRESS OR IMPLIED WARRANTIES, AND EXPRESSLY DISCLAIMS ALL WARRANTIES OF MERCHANTABILITY OR FITNESS FOR A PARTICULAR PURPOSE OR USE WITH RESPECT TO THE UNDERLYING INDEX OR ANY DATA INCLUDED THEREIN. WITHOUT LIMITING ANY OF THE FOREGOING, IN NO EVENT SHALL LICENSOR HAVE ANY LIABILITY FOR ANY SPECIAL, PUNITIVE, INDIRECT, OR CONSEQUENTIAL DAMAGES (INCLUDING LOST PROFITS), EVEN IF NOTIFIED OF THE POSSIBILITY OF SUCH DAMAGES.
41 | November 30, 2022
| ALPS ETF Trust | |
| Additional Information | November 30, 2022 (Unaudited) |
The Funds are not sponsored, endorsed, sold or promoted by Standard & Poor’s, a division of The McGraw-Hill Companies, Inc. (“S&P”) or its third party licensors. Neither S&P nor its third party licensors make any representation or warranty, express or implied, to the owners of each Fund or any member of the public regarding the advisability of investing in securities generally or in each Fund particularly or the ability of each Underlying Index to track general stock market performance. S&P’s and its third party licensor’s only relationship to the Index Provider is the licensing of certain trademarks, service marks and trade names of S&P and/or its third party licensors and for the providing of calculation and maintenance services related to the Underlying Index. Neither S&P nor its third party licensors is responsible for and has not participated in the determination of the prices and amount of each Fund or the timing of the issuance or sale of each Fund or in the determination or calculation of the equation by which each Fund is to be converted into cash. S&P has no obligation or liability in connection with the administration, marketing or trading of each Fund.
NEITHER S&P, ITS AFFILIATES NOR THEIR THIRD PARTY LICENSORS GUARANTEE THE ADEQUACY, ACCURACY, TIMELINESS OR COMPLETENESS OF EACH UNDERLYING INDEX OR ANY DATA INCLUDED THEREIN OR ANY COMMUNICATIONS, INCLUDING BUT NOT LIMITED TO, ORAL OR WRITTEN COMMUNICATIONS (INCLUDING ELECTRONIC COMMUNICATIONS) WITH RESPECT THERETO. S&P, ITS AFFILIATES AND THEIR THIRD PARTY LICENSORS SHALL NOT BE SUBJECT TO ANY DAMAGES OR LIABILITY FOR ANY ERRORS, OMISSIONS OR DELAYS THEREIN. S&P MAKES NO EXPRESS OR IMPLIED WARRANTIES, AND EXPRESSLY DISCLAIMS ALL WARRANTIES OF MERCHANTABILITY OR FITNESS FOR A PARTICULAR PURPOSE OR USE WITH RESPECT TO ITS TRADEMARKS, EACH UNDERLYING INDEX OR ANY DATA INCLUDED THEREIN. WITHOUT LIMITING ANY OF THE FOREGOING, IN NO EVENT WHATSOEVER SHALL S&P, ITS AFFILIATES OR THEIR THIRD PARTY LICENSORS BE LIABLE FOR ANY INDIRECT, SPECIAL, INCIDENTAL, PUNITIVE OR CONSEQUENTIAL DAMAGES, INCLUDING BUT NOT LIMITED TO, LOSS OF PROFITS, TRADING LOSSES, LOST TIME OR GOODWILL, EVEN IF THEY HAVE BEEN ADVISED OF THE POSSIBILITY OF SUCH DAMAGES, WHETHER IN CONTRACT, TORT, STRICT LIABILITY OR OTHERWISE.
Standard & Poor’s® and S&P® are registered trademarks of The McGraw-Hill Companies, Inc.; “Calculated by S&P Custom Indices” and its related stylized mark are service marks of The McGraw-Hill Companies, Inc. These marks have been licensed for use by the Index Provider.
The S&P 500® is the property of Standard and Poor’s Financial Services LLC (“S&P”) and has been licensed by S&P for use by S-Network® Global Indexes, Inc. in connection with the S-Network® Sector Dividend Dogs Index (Ticker: SDOGX), the S-Network® International Sector Dividend Dogs Index (Ticker: IDOGX), the S-Network® Emerging Sector Dividend Dogs Index (Ticker: EDOGX), and the S-Network® REIT Dividend Dogs Index (Ticker: RDOGX).
The Adviser does not guarantee the accuracy and/or the completeness of each Underlying Index or any data included therein, and the Adviser shall have no liability for any errors, omissions or interruptions therein. The Adviser makes no warranty, express or implied, as to results to be obtained by each Fund, owners of the Shares of each Fund or any other person or entity from the use of each Underlying Index or any data included therein. The Adviser makes no express or implied warranties, and expressly disclaims all warranties of merchantability or fitness for a particular purpose or use with respect to each Underlying Index or any data included therein. Without limiting any of the foregoing, in no event shall the Adviser have any liability for any special, punitive, direct, indirect or consequential damages (including lost profits) arising out of matters relating to the use of each Underlying Index, even if notified of the possibility of such damages.
42 | November 30, 2022
| ALPS ETF Trust | |
| Board Considerations Regarding Approval of | November 30, 2022 (Unaudited) |
| Investment Advisory Agreements | |
At a meeting held on June 21, 2022 via electronic means (video-conference), the Board of Trustees of the Trust (the “Board” or the “Trustees”), including the Trustees who are not “interested persons” of the Trust within the meaning of the Investment Company Act of 1940, as amended (the “Independent Trustees”), evaluated a proposal to approve the continuance of the Investment Advisory Agreements between the Trust and ALPS Advisors, Inc. (the “Adviser” or “AAI”) with respect to the ALPS Sector Dividend Dogs ETF (“SDOG”), the ALPS International Sector Dividend Dogs ETF (“IDOG”), the ALPS Emerging Sector Dividend Dogs ETF (“EDOG”), and the ALPS REIT Dividend Dogs ETF (“RDOG”) (each “a Fund” and collectively the “Funds”). The Independent Trustees also met separately to consider each Investment Advisory Agreement.
In evaluating the Investment Advisory Agreements with respect to each Fund, the Board, including the Independent Trustees considered various factors, including (i) the nature, extent and quality of the services provided by AAI with respect to the applicable Fund under the Investment Advisory Agreements; (ii) the advisory fees and other expenses paid by the Fund compared to those of similar funds managed by other investment advisers; (iii) the costs of the services provided to the Fund by AAI and the profits realized by AAI and its affiliates from its relationship to the Fund; (iv) the extent to which economies of scale have been or would be realized if and as the assets of the Fund grow and whether fees reflect the economies of scale for the benefit of shareholders; and (v) any additional benefits and other considerations.
With respect to the nature, extent and quality of the services provided by AAI under the Investment Advisory Agreements, the Board considered and reviewed information concerning the services provided under the Investment Advisory Agreements, the investment parameters of the index of each Fund, financial information regarding AAI and its parent company, information describing AAI’s current organization and the background and experience of the persons responsible for the day-to-day management of the Funds.
The Board reviewed information on the performance of each Fund and its applicable benchmark. The Board also evaluated the correlation and tracking error between each underlying index and its corresponding Fund’s performance. Based on this review, the Board, including the Independent Trustees found that the nature and extent of services provided to each Fund under the Investment Advisory Agreements was appropriate and that the quality was satisfactory.
The Board noted that the advisory fees for each Fund were unitary fees pursuant to which AAI assumes all expenses of the Funds (including the cost of transfer agency, custody, fund administration, legal, audit and other services) other than the payments under the Advisory Agreement, brokerage expenses, taxes, interest, litigation expenses and other extraordinary expenses.
With respect to advisory fee rates, the Board, including the Independent Trustees, noted the following:
The gross management fee rate for SDOG and IDOG is higher than the median of their respective FUSE expense groups. These Funds’ respective net expense ratios, however, are slightly above the median of their respective FUSE expense groups.
The gross management fee rate for EDOG is approximately equal to the median of its FUSE expense group. EDOG'S net expense ratio is at the median of its FUSE expense group.
The gross management fee rate for RDOG is lower than the median of its FUSE expense group. RDOG’s net expense ratio is also below the median of its FUSE expense group.
Based on the foregoing, and the other information available to them, the Board, including the Independent Trustees, concluded that the advisory fee rate for each of the Funds was reasonable under the circumstances and in light of the quality of the services provided.
The Board, including the Independent Trustees, considered other benefits available to AAI because of its relationship with the Funds and concluded that the advisory fees were reasonable taking into account any such benefits.
The Board, including the Independent Trustees, also considered with respect to each Fund the information provided by AAI about the costs and profitability of AAI with respect to each of the Funds, including the asset levels and other factors that influence the profitability and financial viability of the Funds. The Board, including the Independent Trustees, reviewed and noted the relatively small sizes of the Funds (other than SDOG) and concluded that AAI was not realizing any economies of scale. With respect to SDOG, the Independent Trustees noted that the Fund’s asset levels have not recovered to its historic highs. The Independent Trustees determined that AAI should continue to keep the Board informed on an ongoing basis of any significant developments (e.g., material increases in asset levels) so as to facilitate the Independent Trustees’ evaluation of whether further economies of scale have been achieved.
In voting to renew each Investment Advisory Agreement, the Board, including the Independent Trustees concluded that the terms of each Investment Advisory Agreement are reasonable and fair in light of the services to be performed, the fees paid by certain other funds, expenses to be incurred and such other matters as the members of the Board, including the Independent Trustees, considered relevant in the exercise of their reasonable business judgment. The Independent Trustees did not identify any single factor or group of factors as all important or controlling and considered all factors together.
43 | November 30, 2022
| ALPS ETF Trust | |
| Trustees and Officers | November 30, 2022 (Unaudited) |
The general supervision of the duties performed by the Adviser for the Fund under the Investment Advisory Agreement is the responsibility of the Board of Trustees. The Trust currently has four Trustees, each of whom have no affiliation or business connection with the Adviser or any of its affiliated persons and do not own any stock or other securities issued by the Adviser. These are the “non-interested” or “independent” Trustees (“Independent Trustees”).
The Independent Trustees of the Trust, their term of office and length of time served, their principal business occupations during the past five years, the number of portfolios in the Fund Complex overseen by each Independent Trustee, and other directorships, if any, held by the Trustee are shown below.
| Name, Address & Year of Birth* | Position(s) Held with Trust | Term of Office and Length of Time Served** | Principal Occupation(s) During Past 5 Years | Number of Portfolios in Fund Complex Overseen by Trustees*** | Other Directorships Held by Trustees |
Mary K. Anstine,
1940 | Trustee | Since March 2008 | Ms. Anstine is Trustee/Director of AV Hunter Trust and Colorado Uplift Board. | 38 | Ms. Anstine is a Trustee of ALPS Variable Investment Trust (7 funds); Financial Investors Trust (29 funds); and Reaves Utility Income Fund. |
Jeremy W. Deems,
1976 | Trustee | Since March 2008 | Mr. Deems is the Co-Founder and Chief Financial Officer of Green Alpha Advisors, LLC, a registered investment advisor, and Co-Portfolio Manager of the Shelton Green Alpha Fund. | 38 | Mr. Deems is a Trustee of ALPS Variable Investment Trust (7 funds); Financial Investors Trust (29 funds); and Reaves Utility Income Fund; and Clough Funds Trust (1 fund). |
Rick A. Pederson,
1952 | Trustee | Since March 2008 | Mr. Pederson is Partner, Bow River Capital Partners (private equity management), 2003 - present; Board Member, Prosci Inc. (private business services) 2013-2016; Advisory Board Member, Citywide Banks (Colorado community bank) 2014- 2017; Board Member, Strong-Bridge Consulting, 2015- 2019; Board Member, IRI/ODMS Holdings LLC, 2017 – 2019; Director, National Western Stock Show (not for profit) 2010 - present; Director, History Colorado (not for profit) 2015- present; Director, Citywide Bank Advisory Board 2017-present; Trustee, Boettcher Foundation, 2018 -present. | 24 | Mr. Pederson is Trustee of Segall Bryant & Hamill Trust (14 funds), Principal Real Estate Income Fund (1 fund). |
| * | The business address of the Trustee is c/o ALPS Advisors, Inc., 1290 Broadway, Suite 1000, Denver, Colorado 80203. |
| ** | This is the period for which the Trustee began serving the Trust. Each Trustee serves an indefinite term, until his successor is elected. |
| *** | The Fund Complex includes all series of the Trust and any other investment companies for which ALPS Advisors, Inc. provides investment advisory services. |
44 | November 30, 2022
| ALPS ETF Trust | |
| Trustees and Officers | November 30, 2022 (Unaudited) |
| Name, Address & Year of Birth* | Position(s) Held with Trust | Term of Office and Length of Time Served** | Principal Occupation(s) During Past 5 Years | Number of Portfolios in Fund Complex Overseen by Trustees*** | Other Directorships Held by Trustees |
Edmund J. Burke,
1961 | Trustee | Since December 2017 | Mr. Burke joined ALPS in 1991 and served as the President and Director of ALPS Holdings, Inc., and ALPS Advisors, Inc., and Director of ALPS Distributors, Inc., ALPS Fund Services, Inc. (“ALPS”), and ALPS Portfolio Solutions Distributor, Inc. (collectively, the “ALPS Companies”). Mr. Burke retired from the ALPS Companies in June 2019. Mr. Burke is currently a partner at ETF Action, a web- based system that provides data and analytics to registered investment advisers, (since 2020) and a Director of Alliance Bioenergy Plus, Inc., a technology company focused on emerging technologies in the renewable energy, biofuels, and bioplastics technology sectors (since 2020). | 33 | Mr. Burke is a Trustee of Clough Global Dividend and Income Fund (1 fund); Clough Global Equity Fund (1 fund); Clough Global Opportunities Fund (1 fund); Clough Funds Trust (1 fund); Liberty All-Star Equity Fund (1 fund); Director of the Liberty All- Star Growth Fund, Inc. (1 fund) and Financial Investors Trust (29 funds). |
| * | The business address of the Trustee is c/o ALPS Advisors, Inc., 1290 Broadway, Suite 1000, Denver, Colorado 80203. |
| ** | This is the period for which the Trustee began serving the Trust. Each Trustee serves an indefinite term, until his or her successor is elected. |
| *** | The Fund Complex includes all series of the Trust and any other investment companies for which ALPS Advisors, Inc. provides investment advisory services. |
45 | November 30, 2022
| ALPS ETF Trust | |
| Trustees and Officers | November 30, 2022 (Unaudited) |
| OFFICERS: | | | |
| Name, Address and Year of Birth of Officer* | Position(s) Held with Trust | Length of Time Served** | Principal Occupation(s) During Past 5 Years |
Laton Spahr,
1975 | President | Since June 2021 | Mr. Spahr joined ALPS in 2019 and currently serves as President and Portfolio Manager of AAI. Prior to his current role, Mr. Spahr was a Senior Vice President and Strategy Leader of the Value & Income Team for Oppenheimer Funds from 2013 to 2019. |
Matthew Sutula,
1985 | Chief Compliance Officer (“CCO”) | Since December 2019 | Mr. Sutula joined ALPS in 2012 and currently serves as Chief Compliance Officer of AAI. Prior to his current role, Mr. Sutula served as interim Compliance Officer of the Trust (September 2019 to December 2019), Compliance Manager and Senior Compliance Analyst for AAI, as well as Compliance Analyst for AFS. Prior to joining ALPS, he spent seven years at Morningstar, Inc. in various analyst roles supporting the registered investment company databases. Mr. Sutula is also Chief Compliance Officer of Principal Real Estate Income Fund, ALPS Variable Investment Trust, Liberty All-Star Equity Fund and Liberty All-Star Growth Fund, Inc. From September 2019 to September 2022 he served as Chief Compliance Officer of RiverNorth Opportunities Fund, Inc |
Kathryn Burns,
1976 | Treasurer | Since September 2018 | Ms. Burns serves as Vice President, Director of Fund Operations of AAI since 2018. From 2013 to 2018, she served as Vice President and Fund Controller at AFS. Prior to joining ALPS, she worked at Old Mutual Capital where she served as Vice President and Chief Compliance Officer (2010 – 2012) and Regulatory Reporting Manager and Assistant Treasurer to the Old Mutual Funds Trusts (2006 – 2012). She also served as a CPA for PricewaterhouseCoopers LLP. Ms. Burns also serves as President of ALPS Variable Investment Trust and Principal Real Estate Income Fund. From June 2019 to September 2022 she served as President of RiverNorth Opportunities Fund, Inc. and from June 2018 to November 2021 she served as Treasurer of Boulder Growth & Income Fund, Inc. |
Michael P. Lawlor,
1969 | Secretary | Since December 2022 | Mr. Lawlor joined ALPS in January 2022, and is currently Vice President and Principal Legal Counsel. Prior to joining ALPS, Mr. Lawlor was Lead Fund Counsel at Brighthouse Financial (insurance company) (January 2007-April 2021). Mr. Lawlor also serves as Secretary of Financial Investors Trust and ALPS Variable Investment Trust. |
| * | The business address of each Officer is c/o ALPS Advisors, Inc., 1290 Broadway, Suite 1000, Denver, Colorado 80203. Each Officer is deemed an affiliate of the Trust as defined under the 1940 Act. |
| ** | This is the period for which the Officer began serving the Trust. Each Officer serves an indefinite term, until his/her successor is elected. |
The Statement of Additional Information includes additional information about the Fund’s Trustees and is available, without charge, upon request by calling (toll-free) 1-866-759-5679.
46 | November 30, 2022
Intentionally Left Blank


Table of Contents
| Performance Overview | 1 |
| Disclosure of Fund Expenses | 14 |
| Report of Independent Registered Public Accounting Firm | 15 |
| Financial Statements | |
| Schedules of Investments | 16 |
| Statements of Assets and Liabilities | 26 |
| Statements of Operations | 27 |
| Statements of Changes in Net Assets | 29 |
| Financial Highlights | 33 |
| Notes to Financial Statements | 37 |
| Additional Information | 46 |
| Trustees & Officers | 48 |
alpsfunds.com
| ALPS | O’Shares U.S. Quality Dividend ETF | |
| Performance Overview | November 30, 2022 (Unaudited) |
Performance Objective
The ALPS|O’Shares U.S. Quality Dividend ETF (the "Fund") seeks investment results that track the performance, before fees and expenses, of the O'Shares U.S. Quality Dividend Index (the "Underlying Index").
The Underlying Index is designed to measure the performance of publicly-listed large-capitalization and mid-capitalization dividend-paying issuers in the United States that meet certain market capitalization, liquidity, high quality, low volatility and dividend yield thresholds, as determined by O'Shares Investment Advisers, LLC. The high quality and low volatility requirements are designed to reduce exposure to high dividend equities that have experienced large price declines. The constituents of the Underlying Index are selected from the S-Network U.S. Equity Large-Cap 500 Index.
Performance Overview
The ALPS | O’Shares U.S. Quality Dividend ETF, for the trailing five-month period ended November 30, 2022, generated a total return of 8.27%, performing relatively in line with the Fund’s Underlying Index, net of fees, which returned 8.51%. The Fund slightly underperformed the Russell 1000® Value Index and the S&P 500® Total Return Index (S&P 500), which returned 10.56% and 8.56%, respectively.
The trailing-twelve-month yield for the Fund’s underlying constituents as of November 30, 2022 was 1.85% vs. 1.88% for the Russell 1000® Value Index.
The S&P 500 returned 8.56% for the trailing five-month period ended November 30, 2022. Pressured by the Federal Reserve (Fed) raising interest rates to combat inflation, markets adjusted equity values to reflect a forward-looking slowed economy. Main macroeconomic talking points throughout 2022 centered on the path of future interest rates driven by monetary policy, and inflation sustaining levels well above the Fed’s 2% inflation target. Inflation fears continued to be justified with the year-over-year Consumer Price Index (CPI) surging above 9% in June, along with core inflation readings maintaining levels above 6%. Despite the quantitative tightening efforts in 2022, many economic indicators remain strong including consumer spending, wage growth and low unemployment in the U.S., offering a sliver of hope for a soft landing. Global supply chains were relieved of backlogs and most delays stemming from COVID-19 restrictions, benefitting company margins and lowering some pressure on prices of inflated goods. The latest economic data shows U.S. Real Gross Domestic Product year-over-year rising 1.9% in the U.S., offset by CPI of 7.7%. Looking forward, we believe markets have likely discounted a significant portion of quantitative tightening as the S&P 500® Index Price-to-Earnings ratio is below its 10-year average, and any pause or pivot in rate hikes would serve as a positive catalyst for U.S. and global equities.
Compared to the Russell 1000® Value Index, for the trailing five-month period ended November 30, 2022, the Fund saw a positive impact from its higher-quality holdings across non-cyclical sectors. The Fund outperformed the Index across Consumer Discretionary, Information Technology, and Health Care sectors, although its underweight to Energy drove the bulk of relative underperformance.
The best-performing stocks in the Fund for the period were TJX Companies Inc. (TJX), which increased 44.61%, Gilead Sciences Inc. (GILD), which saw a gain of 43.69%, and Trane Technologies Plc (TT), rising 37.97%. The largest detractors for the Fund were Verizon Communications Inc. (VZ), which decreased 20.88%, Intel Corp. (INTC), which fell 17.75%, and Church & Dwight Co Inc. (CHD), which lost 17.15%.
Looking forward we believe the Fund’s methodology of selecting large-cap and mid-cap companies in the U.S. with fundamental determinates including quality, low volatility, and dividend growth, provides a cost-efficient core investment holding.
Effective November 30, 2022, the Board of Trustees approved changing the fiscal year-end of the Fund from June 30 to November 30.
Performance (as of November 30, 2022)
| | 1 Year | 5 Year | Since Inception^ |
| ALPS | O'Shares U.S. Quality Dividend ETF – NAV | 1.09% | 8.99% | 10.21% |
| ALPS | O'Shares U.S. Quality Dividend ETF – Market Price* | 0.96% | 8.96% | 10.20% |
| O'Shares U.S. Quality Dividend Index** | 1.58% | 9.54% | 10.77% |
| Russell 1000® Value Index | 2.42% | 7.86% | 8.58% |
Total Expense Ratio (per the current prospectus) is 0.48%.
Performance data quoted represents past performance. The Fund adopted the historical performance of the O'Shares U.S. Quality Dividend ETF (the "Predecessor Fund") as the result of a reorganization in which the Fund acquired all of the assets, subject to liabilities, of the Predecessor Fund on June 17, 2022. The returns presented for the Fund for periods prior to June 17, 2022 reflect the performance of the Predecessor Fund. At the time of the reorganization, the investment objectives of the Fund and the Predecessor Fund were identical and the investment strategies of the Fund and the Predecessor Fund were substantially the same. Previously, the Predecessor Fund had adopted the historical performance of the O’Shares FTSE U.S. Quality Dividend ETF (the “Previous Predecessor Fund”), a series of FQF Trust, as the result of a reorganization in which the Predecessor Fund acquired all of the assets, subject to liabilities, of the Previous Predecessor Fund on June 28, 2018. The returns presented for the Predecessor Fund for periods prior to June 28, 2018 reflect the performance of the Previous Predecessor Fund. At the time of the reorganization, the investment objectives of the Previous Predecessor Fund and the Predecessor Fund were identical and the investment strategies of the Previous Predecessor Fund and the Predecessor Fund were substantially the same. Effective June 1, 2020, the Predecessor Fund’s underlying index was changed to the Underlying Index from the FTSE USA Qual/Vol/Yield Factor 5% Capped Index (the “Former Index”). Thus, Predecessor Fund performance shown through May 31, 2020 reflects the Predecessor Fund seeking to track the performance of the Former Index, and Predecessor Fund performance shown beginning June 1, 2020 reflects the Predecessor Fund seeking to track the performance of the Underlying Index. In addition, the Underlying Index performance shown reflects the blended performance of the Former Index through May 31, 2020 and the Underlying Index thereafter. Past performance does not guarantee future results. Total return figures assume reinvestment of dividends and capital gains distributions, if any. The table does not reflect the deduction of taxes that a shareholder would pay on Fund distributions or the redemption of Fund shares. Investment return and principal value of an investment will fluctuate so that an investor’s shares, when sold or redeemed, may be worth more or less than the original cost. Current performance data may be higher or lower than actual data quoted. For the most current month-end performance data please visit www.alpsfunds.com or call 1.866.675.2639.
1 | November 30, 2022
| ALPS | O’Shares U.S. Quality Dividend ETF | |
| Performance Overview | November 30, 2022 (Unaudited) |
Net Asset Value (NAV) is an exchange-traded fund's per-share value. The per-share dollar amount of the Fund is derived by dividing the total value of all the securities in its portfolio, less any liabilities, by the number of Fund shares outstanding. Market price is the price at which a share can currently be traded in the market. Information detailing the number of days the Market Price of the Fund was greater than the Fund's NAV and the number of days it was less than the Fund's NAV can be obtained at www.alpsfunds.com.
| ^ | The Fund commencement date was July 14, 2015. |
| * | Market Price means the official closing price of a share or, if it more accurately reflects the market value of a share at the time as of which the Fund calculates current net asset value per shares, the price that is the midpoint of the bid-ask spread as of that time. It does not represent the returns an investor would receive if shares were traded at other times. |
| ** | The O’Shares U.S. Quality Dividend Index performance information reflects the blended performance of the FTSE USA Qual/Vol/Yield Factor 5% Capped Index through May 31, 2020 and the O’Shares U.S. Quality Dividend Index thereafter. |
The O’Shares U.S. Quality Dividend Index is designed to measure the performance of publicly-listed large-capitalization and mid-capitalization dividend-paying issuers in the United States that meet certain market capitalization, liquidity, high quality, low volatility and dividend yield thresholds. The high quality and low volatility requirements are designed to reduce exposure to high dividend equities that have experienced large price declines. The index is reported on a total return basis, which assumes reinvestment of any dividends and distributions realized during a given time period.
The Russell 1000® Value Index measures the performance of the large-cap value segment of the U.S. equity universe. It includes those Russell 1000 companies with lower price-to-book ratios and lower expected growth values.
The indexes are not actively managed and do not reflect any deductions for fees, expenses or taxes. One cannot invest directly in an index. Index performance does not reflect fund performance.
The Fund's shares are not individually redeemable. Investors buy and sell shares of the Fund on a secondary market. Only market makers or "authorized participants" may trade directly with the Fund, typically in blocks of 25,000 shares.
The ALPS | O’Shares U.S. Quality Dividend ETF is not suitable for all investors. Investments in the Fund are subject to investment risks, including possible loss of the principal amount invested.
ALPS Portfolio Solutions Distributor, Inc., a FINRA member, is the distributor for the Fund.
2 | November 30, 2022
| ALPS | O’Shares U.S. Quality Dividend ETF | |
| Performance Overview | November 30, 2022 (Unaudited) |
Top 10 Holdings* (as of November 30, 2022)
| Home Depot, Inc. | 5.11% |
| Microsoft Corp. | 4.66% |
| Johnson & Johnson | 4.25% |
| Pfizer, Inc. | 4.03% |
| S&P Global, Inc. | 3.91% |
| Merck & Co., Inc. | 3.82% |
| Marsh & McLennan Cos., Inc. | 3.80% |
| T Rowe Price Group, Inc. | 3.73% |
| Apple, Inc. | 3.39% |
| McDonald's Corp. | 3.15% |
| Total % of Top 10 Holdings | 39.85% |
* % of Total Investments (excluding short term investments)
Future holdings are subject to change.
Sector Allocation* (as of November 30, 2022)
| Information Technology | 21.43% |
| Health Care | 21.02% |
| Consumer Discretionary | 16.43% |
| Financials | 15.31% |
| Industrials | 11.15% |
| Consumer Staples | 9.64% |
| Communication Services | 4.90% |
| Money Market Fund | 0.12% |
| Total | 100.00% |
Growth of $10,000 (as of November 30, 2022)
Comparison of Change in Value of $10,000 Investment in the Fund and the Indexes
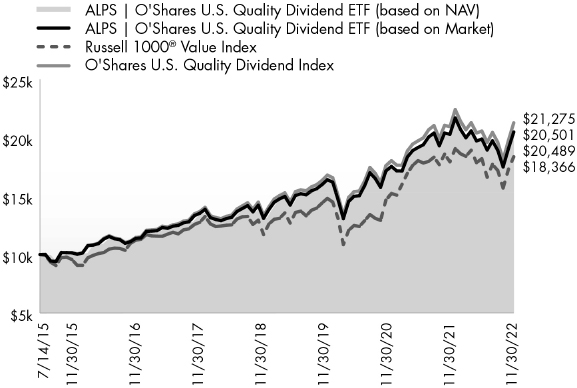
The chart above compares historical performance of a hypothetical investment of $10,000 in the Fund since inception with the performance of the Fund’s benchmark index. Results include the reinvestment of all dividends and capital gains distributions. Past performance does not guarantee future results. The chart does not reflect the deduction of taxes that a shareholder would pay on Fund distributions or the redemption of Fund shares.
3 | November 30, 2022
| ALPS | O’Shares U.S. Small-Cap Quality Dividend ETF | |
| Performance Overview | November 30, 2022 (Unaudited) |
Performance Objective
The ALPS|O’Shares U.S. Small-Cap Quality Dividend ETF (the "Fund") seeks investment results that track the performance, before fees and expenses, of the O'Shares U.S. Small-Cap Quality Dividend Index (the "Underlying Index").
The Underlying Index is designed to measure the performance of publicly-listed small-capitalization dividend-paying issuers in the United States that meet certain market capitalization, liquidity, high quality, low volatility and dividend yield thresholds, as determined by O'Shares Investment Advisers, LLC. The high quality and low volatility factors are designed to reduce exposure to high dividend equities that have experienced large price declines, as may occur with some dividend investing strategies. The constituents of the Underlying Index are selected from the S-Network U.S. Equity Mid/Small-Cap 2500 Index.
Performance Overview
The ALPS | O’Shares U.S. Small-Cap Quality Dividend ETF, for the trailing five-month period ended November 30, 2022, generated a total return of 12.39%, relatively in line with the Fund’s Underlying Index, net of fees, which returned 12.63%. The Fund outperformed the S&P 500® Total Return Index and Russell 2000® Value Index, which returned 8.56% and 10.68%, respectively, for the same period.
The trailing-twelve-month yield for the Fund’s underlying constituents as of 11/30/2022 was 1.81% vs. 1.95% for the Russell 2000 Value Index. The Russell 2000® Value Index returned 10.68% for the trailing five-month period ended November 30, 2022. Pressured by the Federal Reserve (Fed) raising interest rates to combat inflation, markets adjusted equity values to reflect a forward-looking slowed economy. Main macroeconomic talking points throughout 2022 centered on the path of future interest rates driven by monetary policy, and inflation sustaining levels well above the Fed’s 2% inflation target. Inflation fears continued to be justified with the year-over-year Consumer Price Index (CPI) surging above 9% in June, along with core inflation readings maintaining levels above 6%. Despite the quantitative tightening efforts in 2022, many economic indicators remain strong including consumer spending, wage growth and low unemployment in the U.S., offering a sliver of hope for a soft landing. Global supply chains were relieved of backlogs and most delays stemming from COVID-19 restrictions, benefitting company margins and lowering some pressure on prices of inflated goods. The latest economic data shows U.S. Real Gross Domestic Product year-over-year rising 1.9% in the U.S., offset by CPI of 7.7%. Looking forward, we believe markets have likely discounted a significant portion of quantitative tightening as the Russell 2000 Value Index Price-to-Earnings ratio is below its 10-year average, and any pause or pivot in rate hikes would serve as a positive catalyst for U.S. and global equities.
Compared to the Russell 2000® Value Index, for the trailing five-month period ended November 30, 2022, the Fund saw a positive impact from its higher-quality holdings across non-cyclical sectors. The Fund outperformed the Index across Information Technology, Consumer Staples, Communication Services and Industrials sectors, although its underweight to Energy drove the bulk of relative underperformance.
The best-performing stocks in the Fund for the period were Lancaster Colony Corp. (LANC), which increased 61.60%, Erie Indemnity Company (ERIE), which saw a gain of 48.47%, and National Instruments Corp. (NATI), rising 33.28%. The largest detractors for the Fund were Cable One Inc. (CABO), which decreased 43.46%, Mercury General Corp. (MCY), which fell 27.03%, and Standard Motor Products, Inc. (SMP), which lost 23.09%. Looking forward, we believe the Fund’s methodology of selecting small-cap companies in the U.S. with fundamental determinates including quality, low volatility, and dividend growth, provides a cost-efficient core investment holding.
Effective November 30, 2022, the Board of Trustees approved changing the fiscal year-end of the Fund from June 30 to November 30.
Performance (as of November 30, 2022)
| | 1 Year | 5 Year | Since Inception^ |
| ALPS | O'Shares U.S. Small-Cap Quality Dividend ETF – NAV | 2.51% | 7.58% | 8.23% |
| ALPS | O'Shares U.S. Small-Cap Quality Dividend ETF – Market Price* | 2.53% | 7.56% | 8.23% |
| O'Shares U.S. Small-Cap Quality Dividend Index** | 3.02% | 8.11% | 8.77% |
| Russell 2000® Value Index | -4.75% | 5.35% | 5.93% |
Total Expense Ratio (per the current prospectus) is 0.48%.
Performance data quoted represents past performance. The Fund adopted the historical performance of the O'Shares U.S. Small-Cap Quality Dividend ETF (the "Predecessor Fund") as the result of a reorganization in which the Fund acquired all of the assets, subject to liabilities, of the Predecessor Fund on June 17, 2022. The returns presented for the Fund for periods prior to June 17, 2022 reflect the performance of the Predecessor Fund. At the time of the reorganization, the investment objectives of the Fund and the Predecessor Fund were identical and the investment strategies of the Fund and the Predecessor Fund were substantially the same. Effective May 4, 2018, the Predecessor Fund’s underlying index was changed from the FTSE USA Small Cap Qual/Vol/Yield Factor 3% Capped Index (the “Former Underlying Index 1”) to the FTSE USA Small Cap ex Real Estate 2Qual/Vol/Yield 3% Capped Factor Index (the “Former Underlying Index 2” and together with the Former Underlying Index 1, the “Former Underlying Indexes”). Effective June 1, 2020, the Predecessor Fund’s underlying index was changed from the Former Underlying Index 2 to the Underlying Index. Thus, Predecessor Fund performance shown prior to May 4, 2018 reflects the Predecessor Fund seeking to track the performance of the Former Underlying Index 1, Predecessor Fund performance shown from May 4, 2018 through May 31, 2020 reflects the Predecessor Fund seeking to track the performance of the Former Underlying Index 2, and Predecessor Fund performance shown beginning June 1, 2020 reflects the Predecessor Fund seeking to track the performance of the Underlying Index.
4 | November 30, 2022
| ALPS | O’Shares U.S. Small-Cap Quality Dividend ETF | |
| Performance Overview | November 30, 2022 (Unaudited) |
In addition, the Underlying Index performance shown reflects the blended performance of the Former Underlying Index 1 through May 3, 2018, the Former Underlying Index 2 from May 4, 2018 through May 31, 2020 and the Underlying Index thereafter. Past performance does not guarantee future results. Total return figures assume reinvestment of dividends and capital gains distributions, if any. The table does not reflect the deduction of taxes that a shareholder would pay on Fund distributions or the redemption of Fund shares. Investment return and principal value of an investment will fluctuate so that an investor’s shares, when sold or redeemed, may be worth more or less than the original cost. Current performance data may be higher or lower than actual data quoted. For the most current month end performance data please visit www.alpsfunds.com or call 1.866.675.2639.
Net Asset Value (NAV) is an exchange-traded fund's per-share value. The per-share dollar amount of the Fund is derived by dividing the total value of all the securities in its portfolio, less any liabilities, by the number of Fund shares outstanding. Market price is the price at which a share can currently be traded in the market. Information detailing the number of days the Market Price of the Fund was greater than the Fund's NAV and the number of days it was less than the Fund's NAV can be obtained at www.alpsfunds.com.
| ^ | The Fund commencement date was December 30, 2016. |
| * | Market Price means the official closing price of a share or, if it more accurately reflects the market value of a share at the time as of which the Fund calculates current net asset value per shares, the price that is the midpoint of the bid-ask spread as of that time. It does not represent the returns an investor would receive if shares were traded at other times. |
| ** | The O’Shares U.S. Small-Cap Quality Dividend Index performance information reflects the blended performance of the FTSE USA Small Cap Qual/Vol/Yield 3% Capped Factor Index through May 3, 2018, the FTSE USA Small Cap ex Real Estate 2Qual/Vol/Yield 3% Capped Factor Index from May 4, 2018 through May 31, 2020 and the O’Shares U.S. Small-Cap Quality Dividend Index thereafter. |
The O’Shares U.S. Small-Cap Quality Dividend Index is designed to reflect the performance of publicly-listed small-capitalization dividend paying issuers in the United States that meet certain market capitalization, liquidity, high quality, low volatility and dividend yield thresholds. The quality and low volatility requirements are designed to reduce exposure to high dividend equities that have experienced large price declines. The index is reported on a total return basis, which assumes reinvestment of any dividends and distributions realized during a given time period.
The Russell 2000® Value Index measures the performance of the small capitalization value sector of the U.S. equity market.
The indexes are not actively managed and do not reflect any deductions for fees, expenses or taxes. One cannot invest directly in an index. Index performance does not reflect fund performance.
The Fund's shares are not individually redeemable. Investors buy and sell shares of the Fund on a secondary market. Only market makers or "authorized participants" may trade directly with the Fund, typically in blocks of 25,000 shares.
The ALPS | O’Shares U.S. Small-Cap Quality Dividend ETF is not suitable for all investors. Investments in the Fund are subject to investment risks, including possible loss of the principal amount invested.
ALPS Portfolio Solutions Distributor, Inc., a FINRA member, is the distributor for the Fund.
5 | November 30, 2022
| ALPS | O’Shares U.S. Small-Cap Quality Dividend ETF | |
| Performance Overview | November 30, 2022 (Unaudited) |
Top 10 Holdings* (as of November 30, 2022)
| Houlihan Lokey, Inc. | 2.41% |
| Erie Indemnity Co. | 2.40% |
| Juniper Networks, Inc. | 2.21% |
| Interpublic Group of Cos., Inc. | 2.18% |
| Encompass Health Corp. | 2.18% |
| Donaldson Co., Inc. | 2.16% |
| SEI Investments Co. | 2.12% |
| Old Republic International Corp. | 2.11% |
| Snap-on, Inc. | 2.07% |
| Gentex Corp. | 2.05% |
| Total % of Top 10 Holdings | 21.89% |
* % of Total Investments (excluding short term investments)
Future holdings are subject to change.
Sector Allocation* (as of November 30, 2022)
| Industrials | 22.69% |
| Financials | 21.30% |
| Information Technology | 20.19% |
| Consumer Discretionary | 13.30% |
| Health Care | 7.96% |
| Consumer Staples | 5.68% |
| Utilities | 4.51% |
| Communication Services | 4.28% |
| Money Market Fund | 0.09% |
| Total | 100.00% |
Growth of $10,000 (as of November 30, 2022)
Comparison of Change in Value of $10,000 Investment in the Fund and the Indexes
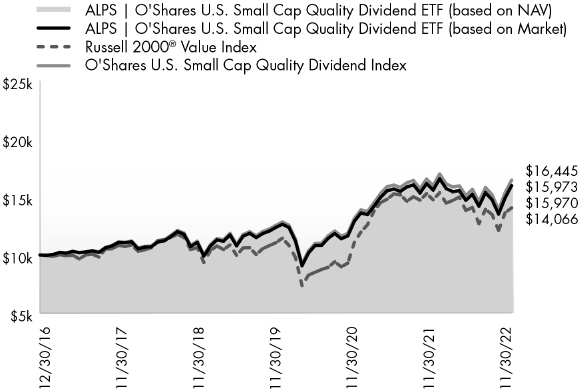
The chart above compares historical performance of a hypothetical investment of $10,000 in the Fund since inception with the performance of the Fund’s benchmark index. Results include the reinvestment of all dividends and capital gains distributions. Past performance does not guarantee future results. The chart does not reflect the deduction of taxes that a shareholder would pay on Fund distributions or the redemption of Fund shares.
6 | November 30, 2022
| ALPS | O’Shares Global Internet Giants ETF | |
| Performance Overview | November 30, 2022 (Unaudited) |
Performance Objective
The ALPS|O’Shares Global Internet Giants ETF (the "Fund") seeks investment results that track the performance, before fees and expenses, of the O'Shares Global Internet Giants Index (the "Underlying Index").
The Underlying Index is a rules-based index intended to give investors a means of tracking stocks exhibiting quality and growth characteristics in the "internet sector", as defined by O'Shares Investment Advisers, LLC.
Performance Overview
The ALPS|O’Shares Global Internet Giants ETF generated a total return of -7.27% for the trailing five-month period ended November 30, 2022, relatively in line with the Fund’s Underlying Index, net of fees, which returned -7.07%. The Fund underperformed the NASDAQ 100 Index, which returned 4.99% for the same period.
The S&P 500® Total Return Index returned 8.56% for the trailing five-month period that ended November 30, 2022. Pressured by the Federal Reserve (Fed) raising interest rates to combat inflation, markets adjusted equity values to reflect a forward-looking slowed economy. Main macroeconomic talking points throughout 2022 centered on the path of future interest rates driven by monetary policy, and inflation sustaining levels well above the Fed’s 2% inflation target. Inflation fears continued to be justified with the year-over-year Consumer Price Index surging above 9% in June, along with core inflation readings maintaining levels above 6%. Despite the quantitative tightening efforts in 2022, many economic indicators remain strong including consumer spending, wage growth and low unemployment across developed and emerging markets, offering a sliver of hope for a soft landing. Global supply chains were relieved of backlogs and most delays stemming from COVID-19 restrictions, benefitting company margins and lowering some pressure on prices of inflated goods. The latest economic data shows Real Gross Domestic Product year-over-year rising 1.9% in the U.S., 2.3% in the Eurozone, 1.8% in Japan and 3.9% in China. Looking forward, we believe global markets have likely discounted a significant portion of quantitative tightening. We believe that global stocks, as measured by the Morningstar Global Markets Index, that exhibit Price-to-Earnings ratios below 10-year averages, along with any pause or pivot in rate hikes across developed central banks, will likely serve as positive catalysts for global equities.
The Fund underperformed the NASDAQ 100 Index, which returned 4.99% for the trailing five-month period ending November 30, 2022. The Fund holds roughly 80% U.S. equities and 20% foreign equities, with the majority of foreign holdings domiciled in China. The U.S. Dollar created a headwind for global equities, strengthening relative to global currencies and cementing its status as the global reserve currency, causing ex-U.S. markets to underperform. Global markets and economic activity were directly impacted by Russia’s invasion of Ukraine, as well as the combined impact of regulatory crackdowns and the Zero COVID mandate in China pressuring supply chains. For emerging economies, higher energy prices and inflation was uncontrollable, disproportionately impacting yields and output compared to developed economies. Energy and natural gas shortages stemming from Russia have exacerbated inflation, adding to currency devaluation across ex-U.S. countries. Value outperformed growth equities in global markets for the trailing twelve-month period, with cyclical sectors leading due to company pricing power amidst higher prices. Although global growth prospects remain murky, quantitative tightening, defined as monetary policies that contract or reduce the Federal Reserve balance sheet, is well on its way, with China ahead of the pack and beginning to stimulate its economy through easing COVID-19 restrictions and monetary policy.
The best-performing stocks in the Fund for the period were Etsy Inc. (ETSY US), which increased by 80.43%, and Netflix Inc. (NFLX US), which saw a gain of 74.72%. Other top performers included Global-E Online Ltd (GLBE US), which climbed 64.95%. The largest detractors were Applovin Corp. (APP US), which decreased 58.16%, Sinch AB (SINCH SS), which fell 52.79%, and Twilio Inc. (TWLO) lost 41.51%.
Looking forward, we believe the Fund’s rules-based approach of investing in some of the largest global companies that derive most of their revenue from the internet technology and e-commerce business segments with above-average growth potential provides a quality and differentiated investment holding.
Effective November 30, 2022, the Board of Trustees approved changing the fiscal year-end of the Fund from June 30 to November 30.
Performance (as of November 30, 2022)
| | 1 Year | Since Inception^ |
| ALPS | O'Shares Global Internet Giants ETF – NAV | -51.83% | 0.10% |
| ALPS | O'Shares Global Internet Giants ETF – Market Price* | -51.72% | 0.14% |
| O'Shares Global Internet Giants Index | -51.58% | 0.60% |
| NASDAQ 100 Index | -24.81% | 13.32% |
Total Expense Ratio (per the current prospectus) is 0.48%.
Performance data quoted represents past performance. The Fund adopted the historical performance of the O'Shares Global Internet Giants ETF (the "Predecessor Fund") as the result of a reorganization in which the Fund acquired all of the assets, subject to liabilities, of the Predecessor Fund on June 17, 2022. The returns presented for the Fund for periods prior to June 17, 2022 reflect the performance of the Predecessor Fund. At the time of the reorganization, the investment objectives of the Fund and the Predecessor Fund were identical and the investment strategies of the Fund and the Predecessor Fund were substantially the same. Past performance does not guarantee future results. Total return figures assume reinvestment of dividends and capital gains distributions, if any. The table does not reflect the deduction of taxes that a shareholder would pay on Fund distributions or the redemption of Fund shares. Investment return and principal value of an investment will fluctuate so that an investor’s shares, when sold or redeemed, may be worth more or less than the original cost. Current performance data may be higher or lower than actual data quoted. For the most current month-end performance data please visit www.alpsfunds.com or call 1.866.675.2639.
7 | November 30, 2022
| ALPS | O’Shares Global Internet Giants ETF | |
| Performance Overview | November 30, 2022 (Unaudited) |
Net Asset Value (NAV) is an exchange-traded fund's per-share value. The per-share dollar amount of the Fund is derived by dividing the total value of all the securities in its portfolio, less any liabilities, by the number of Fund shares outstanding. Market price is the price at which a share can currently be traded in the market. Information detailing the number of days the Market Price of the Fund was greater than the Fund's NAV and the number of days it was less than the Fund's NAV can be obtained at www.alpsfunds.com.
| ^ | The Fund commencement date was June 5, 2018. |
| * | Market Price means the official closing price of a share or, if it more accurately reflects the market value of a share at the time as of which the Fund calculates current net asset value per shares, the price that is the midpoint of the bid-ask spread as of that time. It does not represent the returns an investor would receive if shares were traded at other times. |
The O’Shares Global Internet Giants Index is a rules-based index intended to give investors a means of tracking stocks exhibiting quality and growth characteristics in the internet technology and e-commerce business segments and pass screens for gross margin and cash burn sustainability. Companies included in the Underlying Index derive at least 50% of their revenues from a) internet technology companies whose principal business is to provide the technologies that support internet commerce; and b) internet commerce companies whose principal business is to sell products and services via the internet. The index is reported on a total return basis, which assumes reinvestment of any dividends and distributions realized during a given time period.
The NASDAQ 100 Index includes 100 of the largest domestic and international non-financial companies listed on the Nasdaq Stock Market based on market capitalization.
The indexes are not actively managed and do not reflect any deductions for fees, expenses or taxes. One cannot invest directly in an index. Index performance does not reflect fund performance.
The Fund's shares are not individually redeemable. Investors buy and sell shares of the Fund on a secondary market. Only market makers or "authorized participants" may trade directly with the Fund, typically in blocks of 25,000 shares.
The ALPS | O’Shares Global Internet Giants ETF is not suitable for all investors. Investments in the Fund are subject to investment risks, including possible loss of the principal amount invested.
ALPS Portfolio Solutions Distributor, Inc., a FINRA member, is the distributor for the Fund.
Top 10 Holdings* (as of November 30, 2022)
| Microsoft Corp. | 6.88% |
| Alphabet, Inc. | 5.93% |
| Amazon.com, Inc. | 5.18% |
| Meituan | 2.30% |
| Pinduoduo, Inc. | 1.86% |
| Shopify, Inc. | 1.81% |
| Snowflake, Inc. | 1.77% |
| ServiceNow, Inc. | 1.75% |
| MercadoLibre, Inc. | 1.75% |
| Take-Two Interactive Software, Inc. | 1.48% |
| Total % of Top 10 Holdings | 30.71% |
| * | % of Total Investments (excluding short term investments) |
Future holdings are subject to change.
Country Exposure* (as of November 30, 2022)
| United States | 76.98% |
| China | 12.18% |
| Canada | 1.81% |
| Uruguay | 1.75% |
| Germany | 1.71% |
| Israel | 1.70% |
| Poland | 1.21% |
| Singapore | 1.08% |
| New Zealand | 0.72% |
| Japan | 0.52% |
| Sweden | 0.34% |
| Total | 100.00% |
8 | November 30, 2022
| ALPS | O’Shares Global Internet Giants ETF | |
| Performance Overview | November 30, 2022 (Unaudited) |
Growth of $10,000 (as of November 30, 2022)
Comparison of Change in Value of $10,000 Investment in the Fund and the Indexes

The chart above compares historical performance of a hypothetical investment of $10,000 in the Fund since inception with the performance of the Fund’s benchmark index. Results include the reinvestment of all dividends and capital gains distributions. Past performance does not guarantee future results. The chart does not reflect the deduction of taxes that a shareholder would pay on Fund distributions or the redemption of Fund shares.
9 | November 30, 2022
| ALPS | O’Shares Europe Quality Dividend ETF | |
| Performance Overview | November 30, 2022 (Unaudited) |
Performance Objective
The ALPS|O’Shares Europe Quality Dividend ETF (the "Fund") seeks investment results that track the performance, before fees and expenses, of the O'Shares Europe Quality Dividend Index (the "Underlying Index").
The Underlying Index is designed to measure the performance of publicly-listed large-capitalization and mid-capitalization dividend-paying issuers in Europe that meet certain market capitalization, liquidity, high quality, low volatility and dividend yield thresholds, as determined by O'Shares Investment Advisers, LLC. The high quality and low volatility requirements are designed to reduce exposure to high dividend equities that have experienced large price declines. The constituents of the Underlying Index are selected from the S-Network Europe Equity 500 Index.
Performance Overview
The ALPS|O’Shares Europe Quality Dividend ETF generated a total return of 7.78% for the trailing five-month period ended November 30, 2022, relatively in-line with the Fund’s Underlying Index, net of fees, which returned 8.41%. The Fund outperformed the Morningstar Developed Markets ex-North America Index (MSDINUS Index) but lagged the Euro Stoxx 50 Index, which returned 5.73% and 13.48%, respectively, for the same period.
The trailing five-month yield for the Fund’s constituents as of November 30, 2022 was 1.90% vs. 3.29% for the MSDINUS Index.
European stocks, as represented by the Euro Stoxx 50 Index, returned 15.36% for the trailing five-month period ended November 30, 2022.
Developed Markets (ex-U.S.), as represented by the MSDINUS Index, returned 5.73% for the trailing five-month period ended November 30, 2022 compared to the S&P 500 Total Return Index return of 8.56%. Pressured by the Federal Reserve (Fed) raising interest rates to combat inflation, markets adjusted equity values to reflect a forward-looking slowed economy. Main macroeconomic talking points throughout 2022 centered on the path of future interest rates driven by monetary policy, and inflation sustaining levels well above the Fed’s 2% inflation target. Inflation fears continued to be justified with the year-over-year Consumer Price Index surging above 9% in June, along with core inflation readings maintaining levels above 6%. Despite the quantitative tightening efforts in 2022, many economic indicators remain strong including consumer spending, wage growth and low unemployment across developed and emerging markets, offering a sliver of hope for a soft landing. Global supply chains were relieved of backlogs and most delays stemming from COVID-19 restrictions, benefitting company margins and lowering some pressure on prices of inflated goods. The latest economic data shows Real Gross Domestic Product year-over-year rising 1.9% in the U.S., 2.3% in the Eurozone, 1.8% in Japan, and 3.9% in China. Looking forward, we believe global markets have likely discounted a significant portion of quantitative tightening. We believe that global stocks, as measured by the MSDINUS Index, that exhibit Price-to-Earnings ratios below 10-year averages, along with any pause or pivot in rate hikes across developed central banks, will likely serve as positive catalysts for global equities.
Compared to the Euro Stoxx 50 Index, the Fund saw a positive impact of +0.36% from its relative underweight to Industrials while the Fund’s underweight to Financials was the largest detractor (-2.11%) from relative performance. From a geographical perspective, the highest contribution to return was attributed to holdings based in Germany, which contributed +1.83% towards overall Fund performance. All regions in the Fund contributed positive performance for the trailing five-month period.
The best-performing stocks for the trailing five-month period were Hermes International (RMS FP), which increased 42.43%, Atlas Copco AB (ATCOA SS), which returned 31.15%, and LVMH Moet Hennessy Louis Vuitton (MC FP), which gained 24.88%. The worst performing stocks were GSK PLC (GSK LN), losing 21.08%, Essity Aktiebolag (ESSITYB SS), which fell 16.66%, and Accelleron Industries AG (ACLN SW), which decreased by 13.57%.
Looking forward, we believe the Fund’s methodology of selecting large-cap and mid-cap companies in Europe with fundamental determinates including quality, low volatility and dividend growth, provides a cost-efficient core investment holding.
Effective November 30, 2022, the Board of Trustees approved changing the fiscal year-end of the Fund from June 30 to November 30.
Performance (as of November 30, 2022)
| | 1 Year | 5 Year | Since Inception^ |
| ALPS | O'Shares Europe Quality Dividend ETF – NAV | -10.59% | 2.18% | 2.51% |
| ALPS | O'Shares Europe Quality Dividend ETF – Market Price* | -10.27% | 2.33% | 2.65% |
| O'Shares Europe Quality Dividend Index** | -10.25% | 2.66% | 3.00% |
| EURO STOXX 50 Net Return USD Index | -8.49% | 1.55% | 3.24% |
Total Expense Ratio (per the current prospectus) is 0.48%.
Performance data quoted represents past performance. The Fund adopted the historical performance of the O'Shares Europe Quality Dividend ETF (the "Predecessor Fund") as the result of a reorganization in which the Fund acquired all of the assets, subject to liabilities, of the Predecessor Fund on June 17, 2022. The returns presented for the Fund for periods prior to June 17, 2022 reflect the performance of the Predecessor Fund. At the time of the reorganization, the investment objectives of the Fund and the Predecessor Fund were identical and the investment strategies of the Fund and the Predecessor Fund were substantially the same. Previously, the Predecessor Fund had adopted the historical performance of the O’Shares FTSE Europe Quality Dividend ETF (the “Previous Predecessor Fund”), a series of FQF Trust, as the result of a reorganization in which the Predecessor Fund acquired all of the assets, subject to liabilities, of the Previous Predecessor Fund on June 28, 2018. The returns presented for the Predecessor Fund for periods prior to June 28, 2018 reflect the performance of the Previous Predecessor Fund. At the time of the reorganization, the investment objectives of the Previous Predecessor Fund and the Predecessor Fund were identical and the investment strategies of the Previous Predecessor Fund and the Predecessor Fund were substantially the same.
10 | November 30, 2022
| ALPS | O’Shares Europe Quality Dividend ETF | |
| Performance Overview | November 30, 2022 (Unaudited) |
Effective June 1, 2020, the Predecessor Fund’s underlying index was changed to the Underlying Index from the FTSE Developed Europe Qual/Vol/Yield 5% Capped Factor Index (the “Former Index”). Thus, Predecessor Fund performance shown through May 31, 2020 reflects the Predecessor Fund seeking to track the performance of the Former Index, and Predecessor Fund performance shown beginning June 1, 2020 reflects the Predecessor Fund seeking to track the performance of the Underlying Index. In addition, the Underlying Index performance shown reflects the blended performance of the Former Index through May 31, 2020 and the Underlying Index thereafter. Past performance does not guarantee future results. Total return figures assume reinvestment of dividends and capital gains distributions, if any. The table does not reflect the deduction of taxes that a shareholder would pay on Fund distributions or the redemption of Fund shares. Investment return and principal value of an investment will fluctuate so that an investor’s shares, when sold or redeemed, may be worth more or less than the original cost. Current performance data may be higher or lower than actual data quoted. For the most current month end performance data please visit www.alpsfunds.com or call 1.866.675.2639.
Net Asset Value (NAV) is an exchange-traded fund's per-share value. The per-share dollar amount of the Fund is derived by dividing the total value of all the securities in its portfolio, less any liabilities, by the number of Fund shares outstanding. Market price is the price at which a share can currently be traded in the market. Information detailing the number of days the Market Price of the Fund was greater than the Fund's NAV and the number of days it was less than the Fund's NAV can be obtained at www.alpsfunds.com.
| ^ | The Fund commencement date was August 19, 2015. |
| * | Market Price means the official closing price of a share or, if it more accurately reflects the market value of a share at the time as of which the Fund calculates current net asset value per shares, the price that is the midpoint of the bid-ask spread as of that time. It does not represent the returns an investor would receive if shares were traded at other times. |
| ** | The O’Shares Europe Quality Dividend Index performance information reflects the blended performance of the FTSE Developed Europe Qual/Vol/Yield 5% Capped Factor Index through May 31, 2020 and the O’Shares Europe Quality Dividend Index thereafter. |
The O’Shares Europe Quality Dividend Index is designed to reflect the performance of publicly-listed large-capitalization and mid-capitalization dividend paying issuers in Europe that meet certain market capitalization, liquidity, high quality, low volatility and high dividend yield thresholds. The quality and low volatility requirements are designed to reduce exposure to high dividend equities that have experienced large price declines. The index is reported on a Net Total Return basis which assumes reinvestment of any dividends and distributions realized during a given time period (net of any amounts of withholding tax).
The EURO STOXX 50 Net Return USD Index represents the performance of the 50 largest companies among the 20 supersectors in terms of free-float market cap in Eurozone countries.
The indexes are not actively managed and do not reflect any deductions for fees, expenses or taxes. One cannot invest directly in an index. Index performance does not reflect fund performance.
The Fund's shares are not individually redeemable. Investors buy and sell shares of the Fund on a secondary market. Only market makers or "authorized participants" may trade directly with the Fund, typically in blocks of 25,000 shares.
The ALPS | O’Shares Europe Quality Dividend ETF is not suitable for all investors. Investments in the Fund are subject to investment risks, including possible loss of the principal amount invested.
ALPS Portfolio Solutions Distributor, Inc., a FINRA member, is the distributor for the Fund.
11 | November 30, 2022
| ALPS | O’Shares Europe Quality Dividend ETF | |
| Performance Overview | November 30, 2022 (Unaudited) |
Top 10 Holdings* (as of November 30, 2022)
| SAP SE | 5.67% |
| ASML Holding NV | 5.49% |
| LVMH Moet Hennessy Louis Vuitton SE | 5.38% |
| Novartis AG | 4.92% |
| Nestle SA | 4.73% |
| Novo Nordisk A/S | 4.61% |
| Roche Holding AG | 3.93% |
| Schneider Electric SE | 3.40% |
| Kering SA | 2.81% |
| 3i Group PLC | 2.72% |
| Total % of Top 10 Holdings | 43.66% |
Country Exposure* (as of November 30, 2022)
| Switzerland | 21.86% |
| France | 18.59% |
| Great Britain | 13.77% |
| Germany | 13.02% |
| Netherlands | 10.65% |
| Sweden | 8.05% |
| Denmark | 6.73% |
| Finland | 3.44% |
| Spain | 2.47% |
| Ireland | 1.37% |
| United States | 0.05% |
| Total | 100.00% |
| * | % of Total Investments (excluding short term investments) |
Future holdings are subject to change.
Sector Allocation* (as of November 30, 2022)
| Industrials | 23.39% |
| Health Care | 15.68% |
| Information Technology | 15.64% |
| Consumer Staples | 15.23% |
| Consumer Discretionary | 14.92% |
| Utilities | 6.56% |
| Financials | 5.84% |
| Communication Services | 1.52% |
| Transportation | 1.17% |
| Money Market Fund | 0.05% |
| Total | 100.00% |
12 | November 30, 2022
| ALPS | O’Shares Europe Quality Dividend ETF | |
| Performance Overview | November 30, 2022 (Unaudited) |
Growth of $10,000 (as of November 30, 2022)
Comparison of Change in Value of $10,000 Investment in the Fund and the Indexes
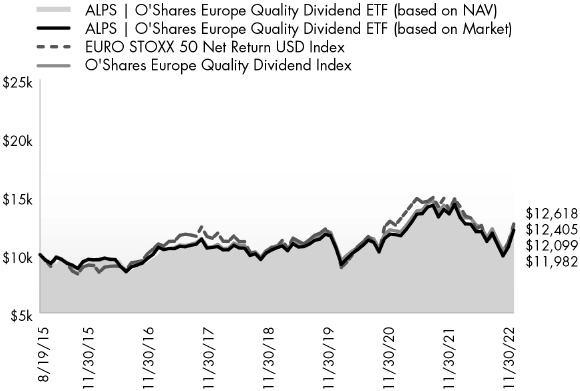
The chart above compares historical performance of a hypothetical investment of $10,000 in the Fund since inception with the performance of the Fund’s benchmark index. Results include the reinvestment of all dividends and capital gains distributions. Past performance does not guarantee future results. The chart does not reflect the deduction of taxes that a shareholder would pay on Fund distributions or the redemption of Fund shares.
13 | November 30, 2022
| ALPS ETF Trust | |
| Disclosure of Fund Expenses | November 30, 2022 (Unaudited) |
Shareholder Expense Example: As a shareholder of a Fund, you incur certain ongoing costs, including management fees and other Fund expenses. These examples are intended to help you understand your ongoing costs (in dollars) of investing in the Fund and to compare these costs with the ongoing costs of investing in other funds. It is based on an investment of $1,000 invested at the beginning of the six month period and held through November 30, 2022.
Actual Return: The first line of the table provides information about actual account values and actual expenses. You may use the information in this line, together with the amount you invested, to estimate the expenses that you incurred over the period. Simply divide your account value by $1,000 (for example, an $8,600 account value divided by $1,000 = 8.6), then multiply the result by the number in the first line under the heading entitled “Expenses Paid During Period” to estimate the expenses attributable to your investment during this period.
Hypothetical 5% Return: The second line of the table provides information about hypothetical account values and hypothetical expenses based on the Fund’s actual expense ratio and an assumed rate of return of 5% per year before expenses, which is not the Fund’s actual return. The hypothetical account values and expenses may not be used to estimate the actual ending account balance or expenses you paid for the period. You may use this information to compare ongoing costs of investing in the Fund and other funds. To do so, compare this 5% hypothetical example with the 5% hypothetical examples that appear in the shareholder reports of other funds.
The expenses shown in the table are meant to highlight ongoing Fund costs only and do not reflect any transaction costs, such as brokerage commissions and other fees to financial intermediaries. Therefore, the second line is useful in comparing ongoing costs only, and will not help you determine the relative total costs of owning different funds. In addition, if these costs were included, your costs would have been higher.
| | Beginning Account Value 6/1/22 | Ending Account Value 11/30/22 | Expense Ratio(a) | Expenses Paid During Period 6/1/22 - 11/30/22(b) |
| ALPS | O’Shares U.S. Quality Dividend ETF | | | | |
| Actual(c) | $ 1,000.00 | $ 1,082.70 | 0.48% | $ 2.10 |
| Hypothetical (5% return before expenses) | $ 1,000.00 | $ 1,018.95 | 0.48% | $ 2.03 |
| | | | | |
| ALPS | O’Shares U.S. Small-Cap Quality Dividend ETF | | | | |
| Actual(c) | $ 1,000.00 | $ 1,123.90 | 0.48% | $ 2.14 |
| Hypothetical (5% return before expenses) | $ 1,000.00 | $ 1,018.95 | 0.48% | $ 2.03 |
| | | | | |
| ALPS | O’Shares Global Internet Giants ETF | | | | |
| Actual(c) | $ 1,000.00 | $ 927.30 | 0.48% | $ 1.94 |
| Hypothetical (5% return before expenses) | $ 1,000.00 | $ 1,018.95 | 0.48% | $ 2.03 |
| | | | | |
| ALPS | O’Shares Europe Quality Dividend ETF | | | | |
| Actual(c) | $ 1,000.00 | $ 1,077.80 | 0.48% | $ 2.09 |
| Hypothetical (5% return before expenses) | $ 1,000.00 | $ 1,018.95 | 0.48% | $ 2.03 |
| (a) | Annualized based on the Fund's most recent fiscal half-year expenses. |
| (b) | Expenses are equal to the Fund's annualized expense ratio multiplied by the average account value over the period, multiplied by the number of days in the most recent fiscal half year (183), divided by 365. |
| (c) | The Funds' fiscal year end changed from June 30th to November 30th. Actual expenses on the Funds are equal to the Fund's annualized expense ratio multiplied by the average account value of the period, multiplied by the number of days since the prior year-end (153) divided by 365. Actual returns for the Funds represent the period July 1, 2022 to November 30, 2022. |
14 | November 30, 2022
| ALPS ETF Trust |
| Report of Independent Registered Public Accounting Firm |
To the Board of Trustees of ALPS ETF Trust and the Shareholders of ALPS | O’Shares U.S. Quality Dividend ETF, ALPS | O’Shares U.S. Small-Cap Quality Dividend ETF, ALPS | O’Shares Global Internet Giants ETF, and ALPS | O’Shares Europe Quality Dividend ETF
Opinion on the Financial Statements
We have audited the accompanying statements of assets and liabilities of ALPS | O’Shares U.S. Quality Dividend ETF, ALPS | O’Shares U.S. Small-Cap Quality Dividend ETF, ALPS | O’Shares Global Internet Giants ETF, and ALPS | O’Shares Europe Quality Dividend ETF, each a series of shares of beneficial interest in ALPS ETF Trust (the “Funds”), including the schedules of investments, as of November 30, 2022, and the related statements of operations for the period July 1, 2022 through November 30, 2022 and for the year ended June 30, 2022, the statements of changes in net assets for the period July 1, 2022 through November 30, 2022 and for each of the years in the two-year period ended June 30, 2022, the financial highlights as noted in the table below, and the related notes (collectively referred to as the “financial statements”). In our opinion, the financial statements present fairly, in all material respects, the financial position of the Funds as of November 30, 2022, and the results of their operations and the changes in their net assets for each of the periods noted above and their financial highlights for each of the periods noted in the table below, in conformity with accounting principles generally accepted in the United States of America.
| Fund | Financial Highlights Presented |
| ALPS | O’Shares U.S. Quality Dividend ETF | For the period July 1, 2022 through November 30, 2022 and each of the years in the five-year period ended June 30, 2022 |
| ALPS | O’Shares U.S. Small-Cap Quality Dividend ETF | For the period July 1, 2022 through November 30, 2022 and each of the years in the five-year period ended June 30, 2022 |
| ALPS | O’Shares Global Internet Giants ETF | For the period July 1, 2022 through November 30, 2022 and each of the years in the four-year period ended June 30, 2022 and for the period from June 5, 2018 (commencement of operations) to June 30, 2018 |
| ALPS | O’Shares Europe Quality Dividend ETF | For the period July 1, 2022 through November 30, 2022 and each of the years in the five-year period ended June 30, 2022 |
Basis for Opinion
These financial statements are the responsibility of the Funds' management. Our responsibility is to express an opinion on the Funds’ financial statements based on our audits. We are a public accounting firm registered with the Public Company Accounting Oversight Board (United States) (“PCAOB”) and are required to be independent with respect to the Funds in accordance with the U.S. federal securities law and the applicable rules and regulations of the Securities and Exchange Commission and the PCAOB.
We conducted our audits in accordance with the standards of the PCAOB. Those standards require that we plan and perform the audits to obtain reasonable assurance about whether the financial statements are free of material misstatement, whether due to error or fraud. The Funds are not required to have, nor were we engaged to perform, an audit of their internal control over financial reporting. As part of our audits we are required to obtain an understanding of internal control over financial reporting but not for the purpose of expressing an opinion on the effectiveness of the Funds’ internal control over financial reporting. Accordingly, we express no such opinion.
Our audits included performing procedures to assess the risk of material misstatement of the financial statements, whether due to error or fraud, and performing procedures that respond to those risks. Such procedures included examining, on a test basis, evidence regarding the amounts and disclosures in the financial statements. Our procedures included confirmation of securities owned as of November 30, 2022 by correspondence with the custodian. Our audits also included evaluating the accounting principles used and significant estimates made by management, as well as evaluating the overall presentation of the financial statements. We believe that our audits provide a reasonable basis for our opinion.

BBD, LLP
We have served as the auditor of one or more of the Funds in the ALPS ETF Trust and the former OSI ETF Trust since 2017.
Philadelphia, Pennsylvania
January 27, 2023
15 | November 30, 2022
| ALPS | O’Shares U.S. Quality Dividend ETF | |
| Schedule of Investments | November 30, 2022 |
| Security Description | | Shares | | | Value | |
| COMMON STOCKS (99.87%) | | | | | | |
| Aerospace & Defense (2.06%) | | | | | | |
| General Dynamics Corp. | | | 9,684 | | | $ | 2,444,145 | |
| L3Harris Technologies, Inc. | | | 4,529 | | | | 1,028,445 | |
| Lockheed Martin Corp. | | | 14,014 | | | | 6,799,453 | |
| Northrop Grumman Corp. | | | 9,702 | | | | 5,173,980 | |
| Total Aerospace & Defense | | | | | | | 15,446,023 | |
| | | | | | | | | |
| Air Freight & Logistics (2.48%) | | | | | | | | |
| CH Robinson Worldwide, Inc. | | | 7,791 | | | | 780,814 | |
| Expeditors International of Washington, Inc. | | | 14,999 | | | | 1,740,784 | |
| United Parcel Service, Inc., Class B | | | 84,975 | | | | 16,122,308 | |
| Total Air Freight & Logistics | | | | | | | 18,643,906 | |
| | | | | | | | | |
| Beverages (2.79%) | | | | | | | | |
| Brown-Forman Corp., Class B | | | 13,139 | | | | 959,410 | |
| Coca-Cola Co. | | | 159,487 | | | | 10,144,968 | |
| PepsiCo, Inc. | | | 52,749 | | | | 9,785,467 | |
| Total Beverages | | | | | | | 20,889,845 | |
| | | | | | | | | |
| Biotechnology (3.22%) | | | | | | | | |
| AbbVie, Inc. | | | 65,107 | | | | 10,493,946 | |
| Amgen, Inc. | | | 34,801 | | | | 9,967,006 | |
| Gilead Sciences, Inc. | | | 41,353 | | | | 3,632,034 | |
| Total Biotechnology | | | | | | | 24,092,986 | |
| | | | | | | | | |
| Building Products (0.18%) | | | | | | | | |
| Trane Technologies PLC | | | 7,379 | | | | 1,316,561 | |
| | | | | | | | | |
| Capital Markets (10.91%) | | | | | | | | |
| BlackRock, Inc. | | | 8,046 | | | | 5,760,936 | |
| Blackstone, Inc. | | | 78,275 | | | | 7,164,511 | |
| Moody's Corp. | | | 21,928 | | | | 6,540,465 | |
| MSCI, Inc. | | | 9,965 | | | | 5,060,526 | |
| S&P Global, Inc. | | | 82,816 | | | | 29,217,484 | |
| T Rowe Price Group, Inc. | | | 223,207 | | | | 27,880,786 | |
| Total Capital Markets | | | | | | | 81,624,708 | |
| | | | | | | | | |
| Commercial Services & Supplies (0.45%) | | | | | | | | |
| Cintas Corp. | | | 2,932 | | | | 1,353,939 | |
| Waste Management, Inc. | | | 11,909 | | | | 1,997,377 | |
| Total Commercial Services & Supplies | | | | | | | 3,351,316 | |
| | | | | | | | | |
| Communications Equipment (2.61%) | | | | | | | | |
| Cisco Systems, Inc. | | | 369,578 | | | | 18,375,418 | |
| Motorola Solutions, Inc. | | | 4,244 | | | | 1,155,217 | |
| Total Communications Equipment | | | | | | | 19,530,635 | |
| | | | | | | | | |
| Diversified Telecommunication Services (2.52%) | | | | | | | | |
| AT&T, Inc. | | | 245,015 | | | | 4,723,889 | |
| Verizon Communications, Inc. | | | 364,080 | | | | 14,191,839 | |
| Total Diversified Telecommunication Services | | | | | | | 18,915,728 | |
| Security Description | | Shares | | | Value | |
| Electrical Equipment (0.42%) | | | | | | |
| Eaton Corp. PLC | | | 7,210 | | | $ | 1,178,475 | |
| Emerson Electric Co. | | | 20,194 | | | | 1,933,979 | |
| Total Electrical Equipment | | | | | | | 3,112,454 | |
| | | | | | | | | |
| Electronic Equipment, Instruments & Components (0.56%) | | | | | | | | |
| Amphenol Corp., Class A | | | 19,324 | | | | 1,554,229 | |
| Corning, Inc. | | | 17,525 | | | | 598,128 | |
| TE Connectivity, Ltd. | | | 15,993 | | | | 2,017,038 | |
| Total Electronic Equipment, Instruments & Components | | | | | | | 4,169,395 | |
| | | | | | | | | |
| Food & Staples Retailing (1.34%) | | | | | | | | |
| Costco Wholesale Corp. | | | 9,415 | | | | 5,077,039 | |
| Walmart, Inc. | | | 32,463 | | | | 4,948,010 | |
| Total Food & Staples Retailing | | | | | | | 10,025,049 | |
| | | | | | | | | |
| Food Products (0.94%) | | | | | | | | |
| Archer-Daniels-Midland Co. | | | 8,837 | | | | 861,608 | |
| General Mills, Inc. | | | 14,936 | | | | 1,274,041 | |
| Hershey Co. | | | 6,920 | | | | 1,627,376 | |
| Mondelez International, Inc., Class A | | | 36,530 | | | | 2,469,793 | |
| Tyson Foods, Inc., Class A | | | 12,328 | | | | 817,100 | |
| Total Food Products | | | | | | | 7,049,918 | |
| | | | | | | | | |
| Health Care Equipment & Supplies (1.85%) | | | | | | | | |
| Abbott Laboratories | | | 103,504 | | | | 11,134,961 | |
| Medtronic PLC | | | 34,631 | | | | 2,737,234 | |
| Total Health Care Equipment & Supplies | | | | | | | 13,872,195 | |
| | | | | | | | | |
| Health Care Providers & Services (1.67%) | | | | | | | | |
| CVS Health Corp. | | | 5,513 | | | | 561,664 | |
| Elevance Health, Inc. | | | 1,357 | | | | 723,172 | |
| Quest Diagnostics, Inc. | | | 4,922 | | | | 747,308 | |
| UnitedHealth Group, Inc. | | | 19,061 | | | | 10,440,854 | |
| Total Health Care Providers & Services | | | | | | | 12,472,998 | |
| | | | | | | | | |
| Hotels, Restaurants & Leisure (6.31%) | | | | | | | | |
| McDonald's Corp. | | | 86,351 | | | | 23,555,689 | |
| Starbucks Corp. | | | 177,081 | | | | 18,097,678 | |
| Yum! Brands, Inc. | | | 43,168 | | | | 5,553,995 | |
| Total Hotels, Restaurants & Leisure | | | | | | | 47,207,362 | |
| | | | | | | | | |
| Household Durables (0.34%) | | | | | | | | |
| Garmin, Ltd. | | | 27,086 | | | | 2,518,727 | |
| | | | | | | | | |
| Household Products (3.47%) | | | | | | | | |
| Colgate-Palmolive Co. | | | 37,066 | | | | 2,871,874 | |
| Kimberly-Clark Corp. | | | 12,085 | | | | 1,639,089 | |
| Procter & Gamble Co. | | | 143,909 | | | | 21,465,466 | |
| Total Household Products | | | | | | | 25,976,429 | |
| | | | | | | | | |
| Industrial Conglomerates (1.80%) | | | | | | | | |
| 3M Co. | | | 38,333 | | | | 4,828,808 | |
16 | November 30, 2022
| ALPS | O’Shares U.S. Quality Dividend ETF | |
| Schedule of Investments | November 30, 2022 |
| Security Description | | Shares | | | Value | |
| Industrial Conglomerates (continued) | | | | | | |
| Honeywell International, Inc. | | | 39,373 | | | $ | 8,644,342 | |
| Total Industrial Conglomerates | | | | | | | 13,473,150 | |
| | | | | | | | | |
| Insurance (4.40%) | | | | | | | | |
| Chubb, Ltd. | | | 20,444 | | | | 4,489,298 | |
| Marsh & McLennan Cos., Inc. | | | 164,149 | | | | 28,427,324 | |
| Total Insurance | | | | | | | 32,916,622 | |
| | | | | | | | | |
| IT Services (5.31%) | | | | | | | | |
| Accenture PLC, Class A | | | 42,251 | | | | 12,714,594 | |
| Automatic Data Processing, Inc. | | | 10,320 | | | | 2,725,925 | |
| Cognizant Technology Solutions Corp., Class A | | | 44,643 | | | | 2,777,241 | |
| International Business Machines Corp. | | | 8,580 | | | | 1,277,562 | |
| Mastercard, Inc., Class A | | | 11,246 | | | | 4,008,074 | |
| Paychex, Inc. | | | 18,368 | | | | 2,278,183 | |
| Visa, Inc., Class A | | | 64,471 | | | | 13,990,208 | |
| Total IT Services | | | | | | | 39,771,787 | |
| | | | | | | | | |
| Life Sciences Tools & Services (0.27%) | | | | | | | | |
| Agilent Technologies, Inc. | | | 4,488 | | | | 695,550 | |
| Danaher Corp. | | | 2,959 | | | | 809,021 | |
| Thermo Fisher Scientific, Inc. | | | 964 | | | | 540,052 | |
| Total Life Sciences Tools & Services | | | | | | | 2,044,623 | |
| | | | | | | | | |
| Machinery (1.58%) | | | | | | | | |
| Caterpillar, Inc. | | | 7,691 | | | | 1,818,229 | |
| Cummins, Inc. | | | 6,666 | | | | 1,674,233 | |
| Illinois Tool Works, Inc. | | | 30,029 | | | | 6,830,697 | |
| Otis Worldwide Corp. | | | 18,772 | | | | 1,465,905 | |
| Total Machinery | | | | | | | 11,789,064 | |
| | | | | | | | | |
| Media (2.38%) | | | | | | | | |
| Comcast Corp., Class A | | | 485,032 | | | | 17,771,572 | |
| | | | | | | | | |
| Multiline Retail (0.78%) | | | | | | | | |
| Dollar General Corp. | | | 11,185 | | | | 2,859,781 | |
| Target Corp. | | | 17,665 | | | | 2,951,291 | |
| Total Multiline Retail | | | | | | | 5,811,072 | |
| | | | | | | | | |
| Personal Products (0.09%) | | | | | | | | |
| Estee Lauder Cos., Inc., Class A | | | 2,760 | | | | 650,780 | |
| | | | | | | | | |
| Pharmaceuticals (14.01%) | | | | | | | | |
| Bristol-Myers Squibb Co. | | | 65,139 | | | | 5,229,359 | |
| Eli Lilly & Co. | | | 19,733 | | | | 7,322,522 | |
| Johnson & Johnson | | | 178,491 | | | | 31,771,397 | |
| Merck & Co., Inc. | | | 259,821 | | | | 28,611,489 | |
| Pfizer, Inc. | | | 601,042 | | | | 30,130,234 | |
| Zoetis, Inc. | | | 10,912 | | | | 1,681,976 | |
| Total Pharmaceuticals | | | | | | | 104,746,977 | |
| Security Description | | Shares | | | Value | |
| Professional Services (0.10%) | | | | | | |
| Verisk Analytics, Inc. | | | 4,151 | | | $ | 762,580 | |
| | | | | | | | | |
| Road & Rail (1.64%) | | | | | | | | |
| CSX Corp. | | | 54,830 | | | | 1,792,393 | |
| Norfolk Southern Corp. | | | 9,009 | | | | 2,310,809 | |
| Union Pacific Corp. | | | 37,398 | | | | 8,131,446 | |
| Total Road & Rail | | | | | | | 12,234,648 | |
| | | | | | | | | |
| Semiconductors & Semiconductor Equipment (4.42%) | | | | | | | | |
| Analog Devices, Inc. | | | 15,064 | | | | 2,589,652 | |
| Broadcom, Inc. | | | 5,390 | | | | 2,970,052 | |
| Intel Corp. | | | 115,875 | | | | 3,484,361 | |
| QUALCOMM, Inc. | | | 7,865 | | | | 994,844 | |
| Texas Instruments, Inc. | | | 127,548 | | | | 23,017,312 | |
| Total Semiconductors & Semiconductor Equipment | | | | | | | 33,056,221 | |
| | | | | | | | | |
| Software (5.01%) | | | | | | | | |
| Microsoft Corp. | | | 136,740 | | | | 34,887,844 | |
| Oracle Corp. | | | 31,346 | | | | 2,602,658 | |
| Total Software | | | | | | | 37,490,502 | |
| | | | | | | | | |
| Specialty Retail (8.49%) | | | | | | | | |
| Home Depot, Inc. | | | 117,997 | | | | 38,229,849 | |
| Lowe's Cos., Inc. | | | 59,962 | | | | 12,744,923 | |
| TJX Cos., Inc. | | | 115,370 | | | | 9,235,369 | |
| Tractor Supply Co. | | | 14,646 | | | | 3,314,536 | |
| Total Specialty Retail | | | | | | | 63,524,677 | |
| | | | | | | | | |
| Technology Hardware, Storage & Peripherals (3.51%) | | | | | | | | |
| Apple, Inc. | | | 171,198 | | | | 25,342,440 | |
| HP, Inc. | | | 29,383 | | | | 882,665 | |
| Total Technology Hardware, Storage & Peripherals | | | | | | | 26,225,105 | |
| | | | | | | | | |
| Textiles, Apparel & Luxury Goods (0.51%) | | | | | | | | |
| NIKE, Inc., Class B | | | 35,041 | | | | 3,843,647 | |
| | | | | | | | | |
| Tobacco (1.01%) | | | | | | | | |
| Altria Group, Inc. | | | 29,582 | | | | 1,377,930 | |
| Philip Morris International, Inc. | | | 61,895 | | | | 6,169,074 | |
| Total Tobacco | | | | | | | 7,547,004 | |
| | | | | | | | | |
| Trading Companies & Distributors (0.44%) | | | | | | | | |
| Fastenal Co. | | | 63,493 | | | | 3,270,524 | |
| | | | | | | | | |
| TOTAL COMMON STOCKS | | | | | | | | |
| (Cost $654,946,874) | | | | | | | 747,146,790 | |
17 | November 30, 2022
| ALPS | O’Shares U.S. Quality Dividend ETF | |
| Schedule of Investments | November 30, 2022 |
| | | 7 Day Yield | | | Shares | | | Value | |
| SHORT TERM INVESTMENTS (0.12%) | | | | | | | | | |
| Money Market Fund (0.12%) | | | | | | | | | |
| State Street Institutional Treasury Plus Money Market Fund (Premier Class) | | | 3.69 | % | | | 925,127 | | | $ | 925,127 | |
| | | | | | | | | | | | | |
| TOTAL SHORT TERM INVESTMENTS | | | | | | | | | | | | |
| (Cost $925,127) | | | | | | | | | | | 925,127 | |
| | | | | | | | | | | | | |
| TOTAL INVESTMENTS (99.99%) | | | | | | | | | | | | |
| (Cost $655,872,001) | | | | | | | | | | $ | 748,071,917 | |
| OTHER ASSETS IN EXCESS OF LIABILITIES (0.01%) | | | | | | | | | | | 49,585 | |
| NET ASSETS - 100.00% | | | | | | | | | | $ | 748,121,502 | |
See Notes to Financial Statements.
18 | November 30, 2022
| ALPS | O’Shares U.S. Small-Cap Quality Dividend ETF | |
| Schedule of Investments | November 30, 2022 |
| Security Description | | Shares | | | Value | |
| COMMON STOCKS (99.88%) | | | | | | |
| Air Freight & Logistics (0.43%) | | | | | | |
| Forward Air Corp. | | | 6,962 | | | $ | 782,320 | |
| | | | | | | | | |
| Auto Components (3.04%) | | | | | | | | |
| BorgWarner, Inc. | | | 29,368 | | | | 1,248,434 | |
| Gentex Corp. | | | 129,201 | | | | 3,733,908 | |
| Lear Corp. | | | 3,853 | | | | 555,757 | |
| Total Auto Components | | | | | | | 5,538,099 | |
| | | | | | | | | |
| Beverages (0.32%) | | | | | | | | |
| Molson Coors Beverage Co., Class B | | | 10,706 | | | | 590,008 | |
| | | | | | | | | |
| Building Products (2.75%) | | | | | | | | |
| A O Smith Corp. | | | 61,138 | | | | 3,713,522 | |
| Simpson Manufacturing Co., Inc. | | | 6,918 | | | | 643,720 | |
| UFP Industries, Inc. | | | 7,874 | | | | 644,566 | |
| Total Building Products | | | | | | | 5,001,808 | |
| | | | | | | | | |
| Capital Markets (12.34%) | | | | | | | | |
| Artisan Partners Asset | | | | | | | | |
| Management, Inc., Class A | | | 35,803 | | | | 1,242,006 | |
| Cohen & Steers, Inc. | | | 20,657 | | | | 1,368,526 | |
| Diamond Hill Investment Group, Inc. | | | 4,759 | | | | 846,912 | |
| Evercore, Inc., Class A | | | 18,548 | | | | 2,136,359 | |
| GCM Grosvenor, Inc. | | | 166,823 | | | | 1,463,038 | |
| Hamilton Lane, Inc., Class A | | | 13,389 | | | | 989,179 | |
| Houlihan Lokey, Inc. | | | 44,515 | | | | 4,378,049 | |
| Invesco, Ltd. | | | 40,269 | | | | 769,541 | |
| Lazard, Ltd., Class A | | | 57,969 | | | | 2,122,245 | |
| Moelis & Co., Class A | | | 55,716 | | | | 2,408,046 | |
| Morningstar, Inc. | | | 3,558 | | | | 872,173 | |
| SEI Investments Co. | | | 62,047 | | | | 3,864,287 | |
| Total Capital Markets | | | | | | | 22,460,361 | |
| | | | | | | | | |
| Commercial Services & Supplies (1.21%) | | | | | | | | |
| Ennis, Inc. | | | 40,165 | | | | 933,033 | |
| Tetra Tech, Inc. | | | 8,190 | | | | 1,266,092 | |
| Total Commercial Services & Supplies | | | | | | | 2,199,125 | |
| | | | | | | | | |
| Communications Equipment (2.21%) | | | | | | | | |
| Juniper Networks, Inc. | | | 120,959 | | | | 4,020,677 | |
| | | | | | | | | |
| Consumer Finance (0.55%) | | | | | | | | |
| FirstCash Holdings, Inc. | | | 10,716 | | | | 1,005,804 | |
| | | | | | | | | |
| Diversified Consumer Services (2.42%) | | | | | | | | |
| H&R Block, Inc. | | | 30,910 | | | | 1,351,076 | |
| Service Corp. International | | | 42,647 | | | | 3,047,128 | |
| Total Diversified Consumer Services | | | | | | | 4,398,204 | |
| Security Description | | Shares | | | Value | |
| Diversified Telecommunication Services (0.43%) | | | | | | |
| Cogent Communications | | | | | | |
| Holdings, Inc. | | | 13,598 | | | $ | 789,364 | |
| | | | | | | | | |
| Electric Utilities (1.97%) | | | | | | | | |
| ALLETE, Inc. | | | 3,789 | | | | 250,832 | |
| IDACORP, Inc. | | | 3,470 | | | | 383,539 | |
| MGE Energy, Inc. | | | 2,654 | | | | 191,115 | |
| NRG Energy, Inc. | | | 21,318 | | | | 904,950 | |
| OGE Energy Corp. | | | 22,277 | | | | 901,327 | |
| Otter Tail Corp. | | | 4,754 | | | | 283,481 | |
| Pinnacle West Capital Corp. | | | 5,582 | | | | 437,182 | |
| Portland General Electric Co. | | | 4,630 | | | | 227,935 | |
| Total Electric Utilities | | | | | | | 3,580,361 | |
| | | | | | | | | |
| Electronic Equipment, Instruments & Components (5.08%) | | | | | | | | |
| Avnet, Inc. | | | 74,899 | | | | 3,383,188 | |
| Littelfuse, Inc. | | | 6,438 | | | | 1,586,967 | |
| National Instruments Corp. | | | 73,109 | | | | 2,998,931 | |
| Vishay Intertechnology, Inc. | | | 55,242 | | | | 1,272,776 | |
| Total Electronic Equipment, Instruments & Components | | | | | | | 9,241,862 | |
| | | | | | | | | |
| Food & Staples Retailing (0.45%) | | | | | | | | |
| Casey's General Stores, Inc. | | | 2,282 | | | | 554,572 | |
| Weis Markets, Inc. | | | 3,039 | | | | 265,031 | |
| Total Food & Staples Retailing | | | | | | | 819,603 | |
| | | | | | | | | |
| Food Products (4.34%) | | | | | | | | |
| Cal-Maine Foods, Inc. | | | 14,756 | | | | 859,980 | |
| Flowers Foods, Inc. | | | 76,971 | | | | 2,312,978 | |
| Ingredion, Inc. | | | 22,938 | | | | 2,247,236 | |
| J & J Snack Foods Corp. | | | 2,632 | | | | 431,701 | |
| Lamb Weston Holdings, Inc. | | | 4,430 | | | | 384,967 | |
| Lancaster Colony Corp. | | | 6,431 | | | | 1,332,117 | |
| Tootsie Roll Industries, Inc. | | | 7,236 | | | | 325,258 | |
| Total Food Products | | | | | | | 7,894,237 | |
| | | | | | | | | |
| Gas Utilities (1.48%) | | | | | | | | |
| Chesapeake Utilities Corp. | | | 772 | | | | 92,432 | |
| National Fuel Gas Co. | | | 12,702 | | | | 841,253 | |
| New Jersey Resources Corp. | | | 4,266 | | | | 212,234 | |
| Spire, Inc. | | | 2,625 | | | | 194,513 | |
| UGI Corp. | | | 35,202 | | | | 1,360,556 | |
| Total Gas Utilities | | | | | | | 2,700,988 | |
| | | | | | | | | |
| Health Care Equipment & Supplies (1.31%) | | | | | | | | |
| DENTSPLY SIRONA, Inc. | | | 78,547 | | | | 2,376,832 | |
| | | | | | | | | |
| Health Care Providers & Services (4.95%) | | | | | | | | |
| Encompass Health Corp. | | | 67,693 | | | | 3,958,688 | |
| National HealthCare Corp. | | | 28,727 | | | | 1,770,732 | |
| Premier, Inc., Class A | | | 98,564 | | | | 3,287,109 | |
| Total Health Care Providers & Services | | | | | | | 9,016,529 | |
19 | November 30, 2022
| ALPS | O’Shares U.S. Small-Cap Quality Dividend ETF | |
| Schedule of Investments | November 30, 2022 |
| Security Description | | Shares | | | Value | |
| Hotels, Restaurants & Leisure (3.59%) | | | | | | |
| Choice Hotels International, Inc. | | | 6,992 | | | $ | 861,554 | |
| Cracker Barrel Old Country Store, Inc. | | | 4,689 | | | | 538,297 | |
| Texas Roadhouse, Inc. | | | 15,099 | | | | 1,499,633 | |
| Vail Resorts, Inc. | | | 12,087 | | | | 3,112,887 | |
| Wyndham Hotels & Resorts, Inc. | | | 7,265 | | | | 532,670 | |
| Total Hotels, Restaurants & Leisure | | | | | | | 6,545,041 | |
| | | | | | | | | |
| Household Durables (1.28%) | | | | | | | | |
| Leggett & Platt, Inc. | | | 34,863 | | | | 1,241,471 | |
| Whirlpool Corp. | | | 7,364 | | | | 1,079,047 | |
| Total Household Durables | | | | | | | 2,320,518 | |
| | | | | | | | | |
| Household Products (0.57%) | | | | | | | | |
| Reynolds Consumer Products, Inc. | | | 20,503 | | | | 655,275 | |
| WD-40 Co. | | | 2,237 | | | | 374,698 | |
| Total Household Products | | | | | | | 1,029,973 | |
| | | | | | | | | |
| Independent Power and Renewable Electricity Producers (0.15%) | | | | | | | | |
| Clearway Energy, Inc. | | | 7,681 | | | | 272,215 | |
| | | | | | | | | |
| Insurance (7.66%) | | | | | | | | |
| Erie Indemnity Co., Class A | | | 15,433 | | | | 4,358,125 | |
| First American Financial Corp. | | | 64,905 | | | | 3,547,058 | |
| Old Republic International Corp. | | | 156,335 | | | | 3,830,208 | |
| RLI Corp. | | | 9,677 | | | | 1,258,687 | |
| Stewart Information Services Corp. | | | 21,131 | | | | 935,258 | |
| Total Insurance | | | | | | | 13,929,336 | |
| | | | | | | | | |
| IT Services (9.71%) | | | | | | | | |
| Amdocs, Ltd. | | | 41,520 | | | | 3,689,467 | |
| CSG Systems International, Inc. | | | 19,305 | | | | 1,193,821 | |
| Genpact, Ltd. | | | 61,962 | | | | 2,857,068 | |
| Jack Henry & Associates, Inc. | | | 17,601 | | | | 3,332,749 | |
| Maximus, Inc. | | | 44,475 | | | | 3,126,593 | |
| Western Union Co. | | | 235,928 | | | | 3,458,704 | |
| Total IT Services | | | | | | | 17,658,402 | |
| | | | | | | | | |
| Leisure Products (0.78%) | | | | | | | | |
| Brunswick Corp. | | | 6,849 | | | | 508,196 | |
| Sturm Ruger & Co., Inc. | | | 16,574 | | | | 910,410 | |
| Total Leisure Products | | | | | | | 1,418,606 | |
| | | | | | | | | |
| Machinery (11.53%) | | | | | | | | |
| Crane Holdings Co. | | | 15,009 | | | | 1,590,053 | |
| Donaldson Co., Inc. | | | 64,488 | | | | 3,928,608 | |
| Franklin Electric Co., Inc. | | | 11,812 | | | | 983,940 | |
| Graco, Inc. | | | 53,030 | | | | 3,710,509 | |
| ITT, Inc. | | | 16,095 | | | | 1,360,349 | |
| Lincoln Electric Holdings, Inc. | | | 25,079 | | | | 3,708,683 | |
| Security Description | | Shares | | | Value | |
| Machinery (continued) | | | | | | |
| Mueller Industries, Inc. | | | 10,583 | | | $ | 727,793 | |
| Snap-on, Inc. | | | 15,631 | | | | 3,760,819 | |
| Watts Water Technologies, Inc., Class A | | | 7,691 | | | | 1,218,639 | |
| Total Machinery | | | | | | | 20,989,393 | |
| | | | | | | | | |
| Media (3.85%) | | | | | | | | |
| Cable One, Inc. | | | 441 | | | | 319,412 | |
| Interpublic Group of Cos., Inc. | | | 115,250 | | | | 3,959,989 | |
| John Wiley & Sons, Inc., Class A | | | 15,094 | | | | 715,607 | |
| New York Times Co., Class A | | | 16,655 | | | | 610,406 | |
| News Corp., Class A | | | 49,397 | | | | 945,953 | |
| TEGNA, Inc. | | | 22,360 | | | | 441,386 | |
| Total Media | | | | | | | 6,992,753 | |
| | | | | | | | | |
| Multi-Utilities (0.59%) | | | | | | | | |
| Avista Corp. | | | 3,025 | | | | 124,872 | |
| Black Hills Corp. | | | 2,405 | | | | 172,270 | |
| NiSource, Inc. | | | 21,372 | | | | 597,134 | |
| NorthWestern Corp. | | | 3,025 | | | | 176,690 | |
| Total Multi-Utilities | | | | | | | 1,070,966 | |
| | | | | | | | | |
| Pharmaceuticals (1.69%) | | | | | | | | |
| Organon & Co. | | | 118,366 | | | | 3,079,883 | |
| | | | | | | | | |
| Professional Services (2.85%) | | | | | | | | |
| Exponent, Inc. | | | 16,243 | | | | 1,679,689 | |
| Robert Half International, Inc. | | | 44,510 | | | | 3,506,497 | |
| Total Professional Services | | | | | | | 5,186,186 | |
| | | | | | | | | |
| Road & Rail (2.12%) | | | | | | | | |
| Landstar System, Inc. | | | 11,584 | | | | 2,003,800 | |
| Schneider National, Inc., Class B | | | 71,726 | | | | 1,847,662 | |
| Total Road & Rail | | | | | | | 3,851,462 | |
| | | | | | | | | |
| Semiconductors & Semiconductor Equipment (0.74%) | | | | | | | | |
| Power Integrations, Inc. | | | 16,741 | | | | 1,347,316 | |
| | | | | | | | | |
| Software (2.45%) | | | | | | | | |
| Dolby Laboratories, Inc., Class A | | | 47,004 | | | | 3,519,189 | |
| InterDigital, Inc. | | | 18,763 | | | | 941,340 | |
| Total Software | | | | | | | 4,460,529 | |
| | | | | | | | | |
| Textiles, Apparel & Luxury Goods (2.19%) | | | | | | | | |
| Carter's, Inc. | | | 16,132 | | | | 1,178,281 | |
| Columbia Sportswear Co. | | | 13,321 | | | | 1,193,428 | |
| Ralph Lauren Corp. | | | 8,190 | | | | 926,453 | |
| Steven Madden, Ltd. | | | 19,718 | | | | 681,060 | |
| Total Textiles, Apparel & Luxury Goods | | | | | | | 3,979,222 | |
| | | | | | | | | |
| Thrifts & Mortgage Finance (0.74%) | | | | | | | | |
| Essent Group, Ltd. | | | 14,490 | | | | 580,904 | |
20 | November 30, 2022
| ALPS | O’Shares U.S. Small-Cap Quality Dividend ETF | |
| Schedule of Investments | November 30, 2022 |
| Security Description | | Shares | | | Value | |
| Thrifts & Mortgage Finance (continued) | | | | | | |
| Radian Group, Inc. | | | 38,734 | | | $ | 758,024 | |
| Total Thrifts & Mortgage Finance | | | | | | | 1,338,928 | |
| | | | | | | | | |
| Trading Companies & Distributors (1.80%) | | | | | | | | |
| Watsco, Inc. | | | 12,167 | | | | 3,272,680 | |
| | | | | | | | | |
| Water Utilities (0.31%) | | | | | | | | |
| American States Water Co. | | | 2,183 | | | | 213,912 | |
| Essential Utilities, Inc. | | | 7,401 | | | | 357,024 | |
| Total Water Utilities | | | | | | | 570,936 | |
| | | | | | | | | |
| TOTAL COMMON STOCKS | | | | | | | | |
| (Cost $162,735,624) | | | | | | | 181,730,527 | |
| | | 7 Day Yield | | | Shares | | | Value | |
| SHORT TERM INVESTMENTS (0.09%) | | | | | | | | | |
| Money Market Fund (0.09%) | | | | | | | | | |
| State Street Institutional Treasury Plus Money Market Fund (Premier Class) | | | 3.69 | % | | | 161,958 | | | | 161,958 | |
| | | | | | | | | | | | | |
| TOTAL SHORT TERM INVESTMENTS | | | | | | | | | | | | |
| (Cost $161,958) | | | | | | | | | | | 161,958 | |
| | | | | | | | | | | | | |
| TOTAL INVESTMENTS (99.97%) | | | | | | | | | | | | |
| (Cost $162,897,582) | | | | | | | | | | $ | 181,892,485 | |
| OTHER ASSETS IN EXCESS OF LIABILITIES (0.03%) | | | | | | | | | | | 51,429 | |
| NET ASSETS - 100.00% | | | | | | | | | | $ | 181,943,914 | |
See Notes to Financial Statements.
21 | November 30, 2022
| ALPS | O’Shares Global Internet Giants ETF | |
| Schedule of Investments | November 30, 2022 |
| Security Description | | Shares | | | Value | |
| COMMON STOCKS (99.93%) | | | | | | |
| Entertainment (9.07%) | | | | | | |
| Activision Blizzard, Inc. | | | 14,645 | | | $ | 1,082,998 | |
| Bilibili, Inc., ADR(a) | | | 89,474 | | | | 1,553,269 | |
| Electronic Arts, Inc. | | | 5,528 | | | | 722,952 | |
| Live Nation Entertainment, Inc.(a) | | | 16,400 | | | | 1,193,264 | |
| NetEase, Inc. | | | 39,068 | | | | 546,685 | |
| Netflix, Inc.(a) | | | 3,751 | | | | 1,146,043 | |
| Nexon Co., Ltd. | | | 38,000 | | | | 796,379 | |
| ROBLOX Corp., Class A(a) | | | 44,181 | | | | 1,403,630 | |
| Roku, Inc.(a) | | | 16,441 | | | | 976,102 | |
| Sea, Ltd., ADR(a) | | | 28,155 | | | | 1,643,407 | |
| Spotify Technology SA(a) | | | 6,544 | | | | 519,724 | |
| Take-Two Interactive Software, Inc.(a) | | | 21,303 | | | | 2,251,515 | |
| Total Entertainment | | | | | | | 13,835,968 | |
| | | | | | | | | |
| Interactive Media & Services (13.46%) | | | | | | | | |
| Alphabet, Inc., Class A(a) | | | 89,622 | | | | 9,050,926 | |
| Baidu, Inc., Sponsored ADR(a) | | | 5,244 | | | | 569,498 | |
| Kanzhun, Ltd., ADR(a) | | | 99,873 | | | | 1,879,610 | |
| Kuaishou Technology(a)(b)(c) | | | 146,000 | | | | 1,057,016 | |
| Match Group, Inc.(a) | | | 10,472 | | | | 529,464 | |
| Meta Platforms, Inc., Class A(a) | | | 15,649 | | | | 1,848,147 | |
| Pinterest, Inc., Class A(a) | | | 41,903 | | | | 1,065,174 | |
| Snap, Inc., Class A(a) | | | 88,021 | | | | 907,497 | |
| Tencent Holdings, Ltd. | | | 57,117 | | | | 2,100,129 | |
| ZoomInfo Technologies, Inc.(a) | | | 53,283 | | | | 1,523,894 | |
| Total Interactive Media & Services | | | | | | | 20,531,355 | |
| | | | | | | | | |
| Internet & Direct Marketing Retail (17.89%) | | | | | | | | |
| Alibaba Group Holding, Ltd., | | | | | | | | |
| Sponsored ADR(a) | | | 17,950 | | | | 1,571,702 | |
| Allegro.eu SA(a)(b)(c) | | | 372,124 | | | | 1,853,032 | |
| Amazon.com, Inc.(a) | | | 81,924 | | | | 7,908,944 | |
| Chewy, Inc., Class A(a) | | | 21,463 | | | | 925,699 | |
| Delivery Hero SE(a)(b)(c) | | | 44,998 | | | | 1,918,425 | |
| DoorDash, Inc., Class A(a) | | | 30,335 | | | | 1,767,014 | |
| Etsy, Inc.(a) | | | 6,894 | | | | 910,628 | |
| JD.com, Inc., Class A | | | 50,846 | | | | 1,424,296 | |
| Meituan, Class B(a)(b)(c) | | | 167,366 | | | | 3,505,473 | |
| MercadoLibre, Inc.(a) | | | 2,861 | | | | 2,663,548 | |
| Pinduoduo, Inc., ADR(a) | | | 34,537 | | | | 2,833,415 | |
| Total Internet & Direct Marketing Retail | | | | | | | 27,282,176 | |
| | | | | | | | | |
| IT Services (9.08%) | | | | | | | | |
| Cloudflare, Inc., Class A(a) | | | 39,513 | | | | 1,941,669 | |
| DigitalOcean Holdings, Inc.(a) | | | 47,344 | | | | 1,412,272 | |
| MongoDB, Inc.(a) | | | 8,586 | | | | 1,310,996 | |
| Okta, Inc.(a) | | | 32,594 | | | | 1,737,912 | |
| Shopify, Inc., Class A(a) | | | 67,619 | | | | 2,764,264 | |
| Snowflake, Inc., Class A(a) | | | 18,913 | | | | 2,702,668 | |
| Twilio, Inc., Class A(a) | | | 28,941 | | | | 1,418,688 | |
| VeriSign, Inc.(a) | | | 2,825 | | | | 564,463 | |
| Total IT Services | | | | | | | 13,852,932 | |
| Security Description | | Shares | | | Value | |
| Software (50.43%) | | | | | | |
| Adobe, Inc.(a) | | | 5,895 | | | $ | 2,033,362 | |
| AppLovin Corp., Class A(a) | | | 39,811 | | | | 573,677 | |
| Asana, Inc., Class A(a) | | | 91,122 | | | | 1,654,776 | |
| Atlassian Corp., Class A(a) | | | 12,600 | | | | 1,657,530 | |
| Bill.com Holdings, Inc.(a) | | | 15,422 | | | | 1,857,117 | |
| Ceridian HCM Holding, Inc.(a) | | | 18,235 | | | | 1,248,003 | |
| Confluent, Inc., Class A(a) | | | 82,399 | | | | 1,897,649 | |
| Crowdstrike Holdings, Inc., Class A(a) | | | 16,490 | | | | 1,940,049 | |
| Datadog, Inc., Class A(a) | | | 28,435 | | | | 2,154,804 | |
| DocuSign, Inc.(a) | | | 14,557 | | | | 685,198 | |
| Dynatrace, Inc.(a) | | | 37,677 | | | | 1,459,984 | |
| Elastic NV(a) | | | 22,495 | | | | 1,376,469 | |
| Five9, Inc.(a) | | | 17,849 | | | | 1,144,299 | |
| Fortinet, Inc.(a) | | | 41,478 | | | | 2,204,970 | |
| Gitlab, Inc., Class A(a) | | | 41,820 | | | | 1,653,981 | |
| HashiCorp, Inc., Class A(a) | | | 63,764 | | | | 1,740,757 | |
| HubSpot, Inc.(a) | | | 5,793 | | | | 1,755,453 | |
| Intuit, Inc. | | | 3,912 | | | | 1,594,492 | |
| Kingdee International Software Group Co., Ltd.(a) | | | 934,215 | | | | 1,540,490 | |
| Microsoft Corp. | | | 41,144 | | | | 10,497,480 | |
| Monday.com, Ltd.(a) | | | 17,416 | | | | 1,872,220 | |
| Nice, Ltd., ADR(a) | | | 3,660 | | | | 710,662 | |
| Oracle Corp. | | | 25,795 | | | | 2,141,759 | |
| Palantir Technologies, Inc., Class A(a) | | | 228,160 | | | | 1,711,200 | |
| Palo Alto Networks, Inc.(a) | | | 11,783 | | | | 2,001,932 | |
| Paycom Software, Inc.(a) | | | 4,895 | | | | 1,659,895 | |
| Paylocity Holding Corp.(a) | | | 7,098 | | | | 1,546,157 | |
| Qualtrics International, Inc., Class A(a) | | | 117,644 | | | | 1,207,027 | |
| Salesforce, Inc.(a) | | | 13,084 | | | | 2,096,711 | |
| Samsara, Inc., Class A(a) | | | 165,937 | | | | 1,581,380 | |
| SAP SE | | | 6,319 | | | | 686,885 | |
| SentinelOne, Inc., Class A(a) | | | 86,006 | | | | 1,247,087 | |
| ServiceNow, Inc.(a) | | | 6,427 | | | | 2,675,560 | |
| Smartsheet, Inc., Class A(a) | | | 56,827 | | | | 1,746,862 | |
| Splunk, Inc.(a) | | | 16,482 | | | | 1,280,322 | |
| Trade Desk, Inc., Class A(a) | | | 34,990 | | | | 1,824,379 | |
| Tyler Technologies, Inc.(a) | | | 1,438 | | | | 492,860 | |
| UiPath, Inc., Class A(a) | | | 143,923 | | | | 1,794,720 | |
| Unity Software, Inc.(a) | | | 47,786 | | | | 1,888,025 | |
| VMware, Inc., Class A(a) | | | 4,842 | | | | 588,255 | |
| Workday, Inc., Class A(a) | | | 9,589 | | | | 1,609,993 | |
| Xero, Ltd.(a) | | | 22,899 | | | | 1,097,933 | |
| Zoom Video Communications, Inc., Class A(a) | | | 6,937 | | | | 523,258 | |
| Zscaler, Inc.(a) | | | 16,853 | | | | 2,249,033 | |
| Total Software | | | | | | | 76,904,655 | |
| | | | | | | | | |
| TOTAL COMMON STOCKS | | | | | | | | |
| (Cost $244,205,523) | | | | | | | 152,407,086 | |
22 | November 30, 2022
| ALPS | O’Shares Global Internet Giants ETF | |
| Schedule of Investments | November 30, 2022 |
| | | 7 Day Yield | | | Shares | | | Value | |
| SHORT TERM INVESTMENTS (0.09%) | | | | | | | | | |
| Money Market Fund (0.09%) | | | | | | | | | |
| State Street Institutional Treasury Plus Money Market Fund (Premier Class) | | | 3.69 | % | | | 132,849 | | | $ | 132,849 | |
| | | | | | | | | | | | | |
| TOTAL SHORT TERM INVESTMENTS | | | | | | | | | | | | |
| (Cost $132,849) | | | | | | | | | | | 132,849 | |
| | | | | | | | | | | | | |
| TOTAL INVESTMENTS (100.02%) | | | | | | | | | | | | |
| (Cost $244,338,372) | | | | | | | | | | $ | 152,539,935 | |
| LIABILITIES IN EXCESS OF OTHER ASSETS (-0.02%) | | | | | | | | | | | (26,828 | ) |
| NET ASSETS - 100.00% | | | | | | | | | | $ | 152,513,107 | |
| (a) | Non-income producing security. |
| (b) | Securities exempt from registration under Rule 144A of the Securities Act of 1933. These securities may be sold in the ordinary course of business in transactions exempt from registration, normally to qualified institutional buyers. At period end, the aggregate market value of those securities was $8,333,946, representing 5.46% of net assets. |
| (c) | Securities were purchased pursuant to Regulation S under the Securities Act of 1933, which exempts securities offered and sold outside of the United States from registration. Such securities cannot be sold in the United States without either an effective registration statement filed pursuant to the Securities Act of 1933, or pursuant to an exemption from registration. As of November 30, 2022, the market value of those securities was $8,333,946 representing 5.46% of net assets. |
See Notes to Financial Statements.
23 | November 30, 2022
| ALPS | O’Shares Europe Quality Dividend ETF | |
| Schedule of Investments | November 30, 2022 |
| Security Description | | Shares | | | Value | |
| COMMON STOCKS (99.55%) | | | | | | |
| Air Freight & Logistics (2.14%) | | | | | | |
| Deutsche Post AG | | | 19,409 | | | $ | 764,056 | |
| | | | | | | | | |
| Auto Components (1.17%) | | | | | | | | |
| Cie Generale des Etablissements Michelin SCA | | | 14,961 | | | | 416,068 | |
| | | | | | | | | |
| Automobiles (3.86%) | | | | | | | | |
| Bayerische Motoren Werke AG | | | 10,653 | | | | 956,795 | |
| Stellantis NV | | | 27,146 | | | | 420,673 | |
| Total Automobiles | | | | | | | 1,377,468 | |
| | | | | | | | | |
| Beverages (3.04%) | | | | | | | | |
| Carlsberg A/s(a) | | | 1,873 | | | | 234,127 | |
| Diageo PLC | | | 12,496 | | | | 573,518 | |
| Heineken NV | | | 1,536 | | | | 141,104 | |
| Pernod Ricard SA | | | 672 | | | | 132,130 | |
| Total Beverages | | | | | | | 1,080,879 | |
| | | | | | | | | |
| Building Products (2.33%) | | | | | | | | |
| Assa Abloy AB, Class B | | | 25,896 | | | | 587,612 | |
| Geberit AG | | | 515 | | | | 243,173 | |
| Total Building Products | | | | | | | 830,785 | |
| | | | | | | | | |
| Capital Markets (5.10%) | | | | | | | | |
| 3i Group PLC | | | 59,441 | | | | 966,086 | |
| Partners Group Holding AG | | | 876 | | | | 856,328 | |
| Total Capital Markets | | | | | | | 1,822,414 | |
| | | | | | | | | |
| Communications Equipment (2.18%) | | | | | | | | |
| Telefonaktiebolaget LM Ericsson | | | 125,246 | | | | 776,627 | |
| | | | | | | | | |
| Diversified Telecommunication Services (1.52%) | | | | | | | | |
| Elisa Oyj | | | 10,459 | | | | 541,572 | |
| | | | | | | | | |
| Electric Utilities (4.70%) | | | | | | | | |
| Iberdrola SA | | | 78,190 | | | | 877,113 | |
| SSE PLC | | | 38,764 | | | | 798,220 | |
| Total Electric Utilities | | | | | | | 1,675,333 | |
| | | | | | | | | |
| Electrical Equipment (6.39%) | | | | | | | | |
| ABB, Ltd. | | | 22,951 | | | | 712,118 | |
| Legrand SA | | | 4,453 | | | | 359,028 | |
| Schneider Electric SE | | | 8,354 | | | | 1,207,660 | |
| Total Electrical Equipment | | | | | | | 2,278,806 | |
| | | | | | | | | |
| Electronic Equipment, Instruments & Components (2.28%) | | | | | | | | |
| Hexagon AB, Class B | | | 72,435 | | | | 814,923 | |
| | | | | | | | | |
| Food & Staples Retailing (0.94%) | | | | | | | | |
| Koninklijke Ahold Delhaize NV | | | 11,629 | | | | 336,595 | |
| Security Description | | Shares | | | Value | |
| Food Products (4.89%) | | | | | | |
| Chocoladefabriken Lindt & Spruengli AG | | | 6 | | | $ | 62,901 | |
| Nestle SA | | | 14,142 | | | | 1,678,956 | |
| Total Food Products | | | | | | | 1,741,857 | |
| | | | | | | | | |
| Health Care Equipment & Supplies (0.29%) | | | | | | | | |
| Coloplast A/S, Class B | | | 894 | | | | 104,271 | |
| | | | | | | | | |
| Household Products (1.50%) | | | | | | | | |
| Reckitt Benckiser Group PLC | | | 7,450 | | | | 534,080 | |
| | | | | | | | | |
| Insurance (0.70%) | | | | | | | | |
| Zurich Insurance Group AG | | | 524 | | | | 250,800 | |
| | | | | | | | | |
| Machinery (4.19%) | | | | | | | | |
| Atlas Copco AB | | | 55,318 | | | | 680,344 | |
| Kone Oyj, Class B | | | 13,741 | | | | 679,343 | |
| Schindler Holding AG(a) | | | 733 | | | | 137,227 | |
| Total Machinery | | | | | | | 1,496,914 | |
| | | | | | | | | |
| Marine (2.70%) | | | | | | | | |
| A P Moller-Maersk A/S(a) | | | 193 | | | | 414,508 | |
| Kuehne + Nagel International AG | | | 2,280 | | | | 550,814 | |
| Total Marine | | | | | | | 965,322 | |
| | | | | | | | | |
| Multi-Utilities (1.84%) | | | | | | | | |
| E.ON SE | | | 69,127 | | | | 656,325 | |
| | | | | | | | | |
| Personal Products (4.50%) | | | | | | | | |
| L'Oreal SA | | | 1,847 | | | | 681,924 | |
| Unilever PLC | | | 18,514 | | | | 924,696 | |
| Total Personal Products | | | | | | | 1,606,620 | |
| | | | | | | | | |
| Pharmaceuticals (15.33%) | | | | | | | | |
| GSK PLC | | | 8,671 | | | | 147,021 | |
| Merck KGaA | | | 1,297 | | | | 234,572 | |
| Novartis AG | | | 19,762 | | | | 1,746,991 | |
| Novo Nordisk A/S, Class B | | | 13,247 | | | | 1,638,463 | |
| Roche Holding AG | | | 4,292 | | | | 1,396,119 | |
| Sanofi | | | 3,347 | | | | 301,201 | |
| Total Pharmaceuticals | | | | | | | 5,464,367 | |
| | | | | | | | | |
| Professional Services (6.69%) | | | | | | | | |
| Experian PLC | | | 13,868 | | | | 485,556 | |
| RELX PLC | | | 30,034 | | | | 836,912 | |
| SGS SA | | | 55 | | | | 127,873 | |
| Wolters Kluwer NV | | | 8,541 | | | | 934,997 | |
| Total Professional Services | | | | | | | 2,385,338 | |
| | | | | | | | | |
| Semiconductors & Semiconductor Equipment (5.47%) | | | | | | | | |
| ASML Holding NV | | | 3,341 | | | | 1,950,753 | |
24 | November 30, 2022
| ALPS | O’Shares Europe Quality Dividend ETF | |
| Schedule of Investments | November 30, 2022 |
| Security Description | | Shares | | | Value | |
| Software (5.65%) | | | | | | |
| SAP SE | | | 18,531 | | | $ | 2,014,347 | |
| | | | | | | | | |
| Textiles, Apparel & Luxury Goods (9.84%) | | | | | | | | |
| Hermes International | | | 371 | | | | 595,504 | |
| Kering SA | | | 1,691 | | | | 998,432 | |
| LVMH Moet Hennessy Louis Vuitton SE | | | 2,492 | | | | 1,911,957 | |
| Total Textiles, Apparel & Luxury Goods | | | | | | | 3,505,893 | |
| | | | | | | | | |
| Tobacco (0.31%) | | | | | | | | |
| British American Tobacco PLC | | | 2,666 | | | | 108,960 | |
| | | | | | | | | |
| TOTAL COMMON STOCKS | | | | | | | | |
| (Cost $38,001,595) | | | | | | | 35,501,373 | |
| | | 7 Day Yield | | | Shares | | | Value | |
| SHORT TERM INVESTMENTS (0.05%) | | | | | | | | | |
| Money Market Fund (0.05%) | | | | | | | | | |
| State Street Institutional Treasury Plus Money Market Fund (Premier Class) | | | 3.69 | % | | | 18,888 | | | | 18,888 | |
| | | | | | | | | | | | | |
| TOTAL SHORT TERM INVESTMENTS | | | | | | | | | | | | |
| (Cost $18,888) | | | | | | | | | | | 18,888 | |
| | | | | | | | | | | | | |
| TOTAL INVESTMENTS (99.60%) | | | | | | | | | | | | |
| (Cost $38,020,483) | | | | | | | | | | $ | 35,520,261 | |
| OTHER ASSETS IN EXCESS OF LIABILITIES (0.40%) | | | | | | | | | | | 143,827 | |
| NET ASSETS - 100.00% | | | | | | | | | | $ | 35,664,088 | |
| (a) | Non-income producing security. |
See Notes to Financial Statements.
25 | November 30, 2022
| ALPS ETF Trust | |
| Statements of Assets and Liabilities | November 30, 2022 |
| | | ALPS | O'Shares U.S. Quality Dividend ETF | | | ALPS | O'Shares U.S. Small-Cap Quality Dividend ETF | | | ALPS | O'Shares Global Internet Giants ETF | | | ALPS | O'Shares Europe Quality Dividend ETF | |
| ASSETS: | | | | | | | | | | | | |
| Investments, at value | | $ | 748,071,917 | | | $ | 181,892,485 | | | $ | 152,539,935 | | | $ | 35,520,261 | |
| Foreign Currency, at value (Cost $–, $–, $– and $326) | | | – | | | | – | | | | – | | | | 329 | |
| Dividends and foreign tax reclaims receivable | | | 1,690,850 | | | | 457,429 | | | | 33,016 | | | | 218,611 | |
| Receivable for shares sold | | | – | | | | 1,728,531 | | | | – | | | | – | |
| Total Assets | | | 749,762,767 | | | | 184,078,445 | | | | 152,572,951 | | | | 35,739,201 | |
| | | | | | | | | | | | | | | | | |
| LIABILITIES: | | | | | | | | | | | | | | | | |
| Payable to adviser | | | 282,523 | | | | 66,916 | | | | 59,844 | | | | 13,413 | |
| Payable for investments purchased | | | – | | | | 1,727,842 | | | | – | | | | – | |
| Distribution payable | | | 1,358,742 | | | | 339,773 | | | | – | | | | 61,700 | |
| Total Liabilities | | | 1,641,265 | | | | 2,134,531 | | | | 59,844 | | | | 75,113 | |
| NET ASSETS | | $ | 748,121,502 | | | $ | 181,943,914 | | | $ | 152,513,107 | | | $ | 35,664,088 | |
| | | | | | | | | | | | | | | | | |
| NET ASSETS CONSIST OF: | | | | | | | | | | | | | | | | |
| Paid-in capital | | $ | 711,649,987 | | | $ | 176,154,800 | | | $ | 388,523,703 | | | $ | 47,807,829 | |
| Total distributable earnings/(accumulated losses) | | | 36,471,515 | | | | 5,789,114 | | | | (236,010,596 | ) | | | (12,143,741 | ) |
| NET ASSETS | | $ | 748,121,502 | | | $ | 181,943,914 | | | $ | 152,513,107 | | | $ | 35,664,088 | |
| | | | | | | | | | | | | | | | | |
| INVESTMENTS, AT COST | | $ | 655,872,001 | | | $ | 162,897,582 | | | $ | 244,338,372 | | | $ | 38,020,483 | |
| | | | | | | | | | | | | | | | | |
| PRICING OF SHARES | | | | | | | | | | | | | | | | |
| Net Assets | | $ | 748,121,502 | | | $ | 181,943,914 | | | $ | 152,513,107 | | | $ | 35,664,088 | |
| Shares of beneficial interest outstanding (Unlimited number of shares authorized, par value $0.01 per share) | | | 17,300,000 | | | | 5,154,000 | | | | 6,075,000 | | | | 1,475,000 | |
| Net Asset Value, offering and redemption price per share | | $ | 43.24 | | | $ | 35.30 | | | $ | 25.11 | | | $ | 24.18 | |
See Notes to Financial Statements.
26 | November 30, 2022
| ALPS ETF Trust |
| Statements of Operations |
| | | ALPS | O'Shares U.S. Quality Dividend ETF(a) | | | ALPS | O'Shares U.S. Small-Cap Quality Dividend ETF(a) | |
| | | For the Period Ended November 30, 2022 | | | For the Year Ended June 30, 2022 | | | For the Period Ended November 30, 2022 | | | For the Year Ended June 30, 2022 | |
| INVESTMENT INCOME: | | | | | | | | | | | | | | | | |
| Dividends* | | $ | 7,811,756 | | | $ | 17,213,528 | | | $ | 1,857,374 | | | $ | 3,386,138 | |
| Total Investment Income | | | 7,811,756 | | | | 17,213,528 | | | | 1,857,374 | | | | 3,386,138 | |
| | | | | | | | | | | | | | | | | |
| EXPENSES: | | | | | | | | | | | | | | | | |
| Investment adviser fees | | | 1,448,088 | | | | 3,652,468 | | | | 323,006 | | | | 749,085 | |
| Total Expenses | | | 1,448,088 | | | | 3,652,468 | | | | 323,006 | | | | 749,085 | |
| NET INVESTMENT INCOME | | | 6,363,668 | | | | 13,561,060 | | | | 1,534,368 | | | | 2,637,053 | |
| | | | | | | | | | | | | | | | | |
| REALIZED AND UNREALIZED GAIN/LOSS | | | | | | | | | | | | | | | | |
| Net realized gain on investments(b) | | | 3,499,404 | | | | 43,405,783 | | | | 669,930 | | | | 14,022,562 | |
| Total net realized gain | | | 3,499,404 | | | | 43,405,783 | | | | 669,930 | | | | 14,022,562 | |
| Net change in unrealized appreciation/(depreciation) on investments | | | 47,553,595 | | | | (83,029,339 | ) | | | 17,488,042 | | | | (29,865,443 | ) |
| Total net change in unrealized appreciation/(depreciation) | | | 47,553,595 | | | | (83,029,339 | ) | | | 17,488,042 | | | | (29,865,443 | ) |
| NET REALIZED AND UNREALIZED GAIN/(LOSS) ON INVESTMENTS | | | 51,052,999 | | | | (39,623,556 | ) | | | 18,157,972 | | | | (15,842,881 | ) |
| NET INCREASE/(DECREASE) IN NET ASSETS RESULTING FROM OPERATIONS | | $ | 57,416,667 | | | $ | (26,062,496 | ) | | $ | 19,692,340 | | | $ | (13,205,828 | ) |
| *Net of foreign tax withholding. | | $ | – | | | $ | – | | | $ | – | | | $ | – | |
| (a) | Effective November 30, 2022, the Board approved changing the fiscal year-end of the Fund from June 30 to November 30. |
| (b) | Includes realized gain or loss as a result of in-kind transactions (See Note 4 in Notes to Financial Statements). |
See Notes to Financial Statements.
27 | November 30, 2022
| ALPS ETF Trust |
| Statements of Operations |
| | | ALPS | O'Shares Global Internet Giants ETF(a) | | | ALPS | O'Shares Europe Quality Dividend ETF(a) | |
| | | For the Period Ended November 30, 2022 | | | For the Year Ended June 30, 2022 | | | For the Period Ended November 30, 2022 | | | For the Year Ended June 30, 2022 | |
| INVESTMENT INCOME: | | | | | | | | | | | | |
| Dividends* | | $ | 89,176 | | | $ | 521,381 | | | $ | 117,298 | | | $ | 1,137,271 | |
| Income from non-cash dividends | | | – | | | | 223,794 | | | | – | | | | 45,145 | |
| Total Investment Income | | | 89,176 | | | | 745,175 | | | | 117,298 | | | | 1,182,416 | |
| | | | | | | | | | | | | | | | | |
| EXPENSES: | | | | | | | | | | | | | | | | |
| Investment adviser fees | | | 395,612 | | | | 2,219,431 | | | | 73,655 | | | | 211,895 | |
| Total Expenses | | | 395,612 | | | | 2,219,431 | | | | 73,655 | | | | 211,895 | |
| NET INVESTMENT INCOME/(LOSS) | | | (306,436 | ) | | | (1,474,256 | ) | | | 43,643 | | | | 970,521 | |
| | | | | | | | | | | | | | | | | |
| REALIZED AND UNREALIZED GAIN/LOSS | | | | | | | | | | | | | | | | |
| Net realized gain/(loss) on investments(b) | | | (48,523,377 | ) | | | (38,672,396 | ) | | | (4,894,756 | ) | | | 3,229,389 | |
| Net realized loss on foreign currency transactions | | | (28,528 | ) | | | (4,792 | ) | | | (3,093 | ) | | | (32,845 | ) |
| Total net realized gain/(loss) | | | (48,551,905 | ) | | | (38,677,188 | ) | | | (4,897,849 | ) | | | 3,196,544 | |
| Net change in unrealized appreciation/(depreciation) on investments | | | 34,370,466 | | | | (244,942,759 | ) | | | 6,973,714 | | | | (14,648,951 | ) |
| Net change in unrealized appreciation/(depreciation) on translation of assets and liabilities denominated in foreign currencies | | | 89 | | | | (128 | ) | | | 2,078 | | | | (11,589 | ) |
| Total net change in unrealized appreciation/(depreciation) | | | 34,370,555 | | | | (244,942,887 | ) | | | 6,975,792 | | | | (14,660,540 | ) |
| NET REALIZED AND UNREALIZED GAIN/(LOSS) ON INVESTMENTS | | | (14,181,350 | ) | | | (283,620,075 | ) | | | 2,077,943 | | | | (11,463,996 | ) |
| NET INCREASE/(DECREASE) IN NET ASSETS RESULTING FROM OPERATIONS | | $ | (14,487,786 | ) | | $ | (285,094,331 | ) | | $ | 2,121,586 | | | $ | (10,493,475 | ) |
| *Net of foreign tax withholding. | | $ | – | | | $ | 8,960 | | | $ | 6,733 | | | $ | 159,771 | |
| (a) | Effective November 30, 2022, the Board approved changing the fiscal year-end of the Fund from June 30 to November 30. |
| (b) | Includes realized gain or loss as a result of in-kind transactions (See Note 4 in Notes to Financial Statements). |
See Notes to Financial Statements.
28 | November 30, 2022
| ALPS | O’Shares U.S. Quality Dividend ETF |
| Statements of Changes in Net Assets |
| | | For the Period July 1, 2022 to November 30, 2022(a) | | | For the Year Ended June 30, 2022 | | | For the Year Ended June 30, 2021 | |
| OPERATIONS: | | | | | | | | | |
| Net investment income | | $ | 6,363,668 | | | $ | 13,561,060 | | | $ | 10,746,630 | |
| Net realized gain | | | 3,499,404 | | | | 43,405,783 | | | | 32,907,730 | |
| Net change in unrealized appreciation/depreciation | | | 47,553,595 | | | | (83,029,339 | ) | | | 102,443,817 | |
| Net increase/(decrease) in net assets resulting from operations | | | 57,416,667 | | | | (26,062,496 | ) | | | 146,098,177 | |
| | | | | | | | | | | | | |
| DISTRIBUTIONS TO SHAREHOLDERS: | | | | | | | | | | | | |
| From distributable earnings | | | (6,308,456 | ) | | | (13,415,408 | ) | | | (10,300,014 | ) |
| Total distributions | | | (6,308,456 | ) | | | (13,415,408 | ) | | | (10,300,014 | ) |
| | | | | | | | | | | | | |
| CAPITAL SHARE TRANSACTIONS: | | | | | | | | | | | | |
| Proceeds from sale of shares | | | 6,268,102 | | | | 230,032,035 | | | | 193,214,199 | |
| Cost of shares redeemed | | | (46,483,693 | ) | | | (142,045,551 | ) | | | (119,413,177 | ) |
| Net increase/(decrease) from capital share transactions | | | (40,215,591 | ) | | | 87,986,484 | | | | 73,801,022 | |
| Net increase in net assets | | | 10,892,620 | | | | 48,508,580 | | | | 209,599,185 | |
| | | | | | | | | | | | | |
| NET ASSETS: | | | | | | | | | | | | |
| Beginning of period | | | 737,228,882 | | | | 688,720,302 | | | | 479,121,117 | |
| End of period | | $ | 748,121,502 | | | $ | 737,228,882 | | | $ | 688,720,302 | |
| | | | | | | | | | | | | |
| OTHER INFORMATION: | | | | | | | | | | | | |
| CAPITAL SHARE TRANSACTIONS: | | | | | | | | | | | | |
| Beginning shares | | | 18,300,000 | | | | 16,400,000 | | | | 14,450,000 | |
| Shares sold | | | 150,000 | | | | 5,200,000 | | | | 5,150,000 | |
| Shares redeemed | | | (1,150,000 | ) | | | (3,300,000 | ) | | | (3,200,000 | ) |
| Shares outstanding, end of period | | | 17,300,000 | | | | 18,300,000 | | | | 16,400,000 | |
| (a) | Effective November 30, 2022, the Board approved changing the fiscal year-end of the Fund from June 30 to November 30. |
See Notes to Financial Statements.
29 | November 30, 2022
| ALPS | O’Shares U.S. Small-Cap Quality Dividend ETF |
| Statements of Changes in Net Assets |
| | | For the Period July 1, 2022 to November 30, 2022(a) | | | For the Year Ended June 30, 2022 | | | For the Year Ended June 30, 2021 | |
| OPERATIONS: | | | | | | | | | |
| Net investment income | | $ | 1,534,368 | | | $ | 2,637,053 | | | $ | 2,556,369 | |
| Net realized gain | | | 669,930 | | | | 14,022,562 | | | | 4,938,284 | |
| Net change in unrealized appreciation/depreciation | | | 17,488,042 | | | | (29,865,443 | ) | | | 34,458,826 | |
| Net increase/(decrease) in net assets resulting from operations | | | 19,692,340 | | | | (13,205,828 | ) | | | 41,953,479 | |
| | | | | | | | | | | | | |
| DISTRIBUTIONS TO SHAREHOLDERS: | | | | | | | | | | | | |
| From distributable earnings | | | (1,333,102 | ) | | | (2,765,428 | ) | | | (2,128,261 | ) |
| Total distributions | | | (1,333,102 | ) | | | (2,765,428 | ) | | | (2,128,261 | ) |
| | | | | | | | | | | | | |
| CAPITAL SHARE TRANSACTIONS: | | | | | | | | | | | | |
| Proceeds from sale of shares | | | 13,889,462 | | | | 78,553,967 | | | | 18,805,699 | |
| Cost of shares redeemed | | | (5,623,137 | ) | | | (56,478,862 | ) | | | (3,228,094 | ) |
| Net increase from capital share transactions | | | 8,266,325 | | | | 22,075,105 | | | | 15,577,605 | |
| Net increase in net assets | | | 26,625,563 | | | | 6,103,849 | | | | 55,402,823 | |
| | | | | | | | | | | | | |
| NET ASSETS: | | | | | | | | | | | | |
| Beginning of period | | | 155,318,351 | | | | 149,214,502 | | | | 93,811,679 | |
| End of period | | $ | 181,943,914 | | | $ | 155,318,351 | | | $ | 149,214,502 | |
| | | | | | | | | | | | | |
| OTHER INFORMATION: | | | | | | | | | | | | |
| CAPITAL SHARE TRANSACTIONS: | | | | | | | | | | | | |
| Beginning shares | | | 4,904,000 | | | | 4,254,000 | | | | 3,754,000 | |
| Shares sold | | | 425,000 | | | | 2,250,000 | | | | 600,000 | |
| Shares redeemed | | | (175,000 | ) | | | (1,600,000 | ) | | | (100,000 | ) |
| Shares outstanding, end of period | | | 5,154,000 | | | | 4,904,000 | | | | 4,254,000 | |
| (a) | Effective November 30, 2022, the Board approved changing the fiscal year-end of the Fund from June 30 to November 30. |
See Notes to Financial Statements.
30 | November 30, 2022
| ALPS | O’Shares Global Internet Giants ETF |
| Statements of Changes in Net Assets |
| | | For the Period July 1, 2022 to November 30, 2022(a) | | | For the Year Ended June 30, 2022 | | | For the Year Ended June 30, 2021 | |
| OPERATIONS: | | | | | | | | | |
| Net investment loss | | $ | (306,436 | ) | | $ | (1,474,256 | ) | | $ | (2,450,867 | ) |
| Net realized gain/(loss) | | | (48,551,905 | ) | | | (38,677,188 | ) | | | 108,500,737 | |
| Net change in unrealized appreciation/depreciation | | | 34,370,555 | | | | (244,942,887 | ) | | | 77,354,082 | |
| Net increase/(decrease) in net assets resulting from operations | | | (14,487,786 | ) | | | (285,094,331 | ) | | | 183,403,952 | |
| | | | | | | | | | | | | |
| CAPITAL SHARE TRANSACTIONS: | | | | | | | | | | | | |
| Proceeds from sale of shares | | | – | | | | 5,994,386 | | | | 558,000,546 | |
| Cost of shares redeemed | | | (42,866,222 | ) | | | (229,798,933 | ) | | | (295,150,967 | ) |
| Net increase/(decrease) from capital share transactions | | | (42,866,222 | ) | | | (223,804,547 | ) | | | 262,849,579 | |
| Net increase/(decrease) in net assets | | | (57,354,008 | ) | | | (508,898,878 | ) | | | 446,253,531 | |
| | | | | | | | | | | | | |
| NET ASSETS: | | | | | | | | | | | | |
| Beginning of period | | | 209,867,115 | | | | 718,765,993 | | | | 272,512,462 | |
| End of period | | $ | 152,513,107 | | | $ | 209,867,115 | | | $ | 718,765,993 | |
| | | | | | | | | | | | | |
| OTHER INFORMATION: | | | | | | | | | | | | |
| CAPITAL SHARE TRANSACTIONS: | | | | | | | | | | | | |
| Beginning shares | | | 7,750,000 | | | | 12,600,000 | | | | 7,200,000 | |
| Shares sold | | | – | | | | 150,000 | | | | 11,100,000 | |
| Shares redeemed | | | (1,675,000 | ) | | | (5,000,000 | ) | | | (5,700,000 | ) |
| Shares outstanding, end of period | | | 6,075,000 | | | | 7,750,000 | | | | 12,600,000 | |
| (a) | Effective November 30, 2022, the Board approved changing the fiscal year-end of the Fund from June 30 to November 30. |
See Notes to Financial Statements.
31 | November 30, 2022
| ALPS | O’Shares Europe Quality Dividend ETF |
| Statements of Changes in Net Assets |
| | | For the Period July 1, 2022 to November 30, 2022(a) | | | For the Year Ended June 30, 2022 | | | For the Year Ended June 30, 2021 | |
| OPERATIONS: | | | | | | | | | |
| Net investment income | | $ | 43,643 | | | $ | 970,521 | | | $ | 458,122 | |
| Net realized gain/(loss) | | | (4,897,849 | ) | | | 3,196,544 | | | | 747,430 | |
| Net change in unrealized appreciation/depreciation | | | 6,975,792 | | | | (14,660,540 | ) | | | 4,207,028 | |
| Net increase/(decrease) in net assets resulting from operations | | | 2,121,586 | | | | (10,493,475 | ) | | | 5,412,580 | |
| | | | | | | | | | | | | |
| DISTRIBUTIONS TO SHAREHOLDERS: | | | | | | | | | | | | |
| From distributable earnings | | | (284,255 | ) | | | (1,031,977 | ) | | | (682,515 | ) |
| Total distributions | | | (284,255 | ) | | | (1,031,977 | ) | | | (682,515 | ) |
| | | | | | | | | | | | | |
| CAPITAL SHARE TRANSACTIONS: | | | | | | | | | | | | |
| Proceeds from sale of shares | | | – | | | | 43,521,283 | | | | 4,045,935 | |
| Cost of shares redeemed | | | (6,889,121 | ) | | | (17,876,858 | ) | | | – | |
| Net increase/(decrease) from capital share transactions | | | (6,889,121 | ) | | | 25,644,425 | | | | 4,045,935 | |
| Net increase/(decrease) in net assets | | | (5,051,790 | ) | | | 14,118,973 | | | | 8,776,000 | |
| | | | | | | | | | | | | |
| NET ASSETS: | | | | | | | | | | | | |
| Beginning of period | | | 40,715,878 | | | | 26,596,905 | | | | 17,820,905 | |
| End of period | | $ | 35,664,088 | | | $ | 40,715,878 | | | $ | 26,596,905 | |
| | | | | | | | | | | | | |
| OTHER INFORMATION: | | | | | | | | | | | | |
| CAPITAL SHARE TRANSACTIONS: | | | | | | | | | | | | |
| Beginning shares | | | 1,800,000 | | | | 950,000 | | | | 800,000 | |
| Shares sold | | | – | | | | 1,550,000 | | | | 150,000 | |
| Shares redeemed | | | (325,000 | ) | | | (700,000 | ) | | | – | |
| Shares outstanding, end of period | | | 1,475,000 | | | | 1,800,000 | | | | 950,000 | |
| (a) | Effective November 30, 2022, the Board approved changing the fiscal year-end of the Fund from June 30 to November 30. |
See Notes to Financial Statements.
32 | November 30, 2022
| ALPS | O’Shares U.S. Quality Dividend ETF |
| Financial Highlights | For a Share Outstanding Throughout the Periods Presented |
| | | For the Period July 1, 2022 to November 30, 2022(a) | | | For the Year Ended June 30, 2022 | | | For the Year Ended June 30, 2021 | | | For the Year Ended June 30, 2020 | | | For the Year Ended June 30, 2019 | | | For the Year Ended June 30, 2018 | |
| NET ASSET VALUE, BEGINNING OF PERIOD | | $ | 40.29 | | | $ | 42.00 | | | $ | 33.16 | | | $ | 34.13 | | | $ | 30.69 | | | $ | 29.25 | |
| | | | | | | | | | | | | | | | | | | | | | | | | |
| INCOME FROM OPERATIONS: | | | | | | | | | | | | | | | | | | | | | | | | |
| Net investment income(b) | | | 0.36 | | | | 0.77 | | | | 0.69 | (c) | | | 0.93 | | | | 0.89 | (c) | | | 0.78 | |
| Net realized and unrealized gain/(loss) | | | 2.95 | | | | (1.72 | ) | | | 8.81 | | | | (0.96 | ) | | | 3.44 | | | | 1.46 | |
| Total from investment operations | | | 3.31 | | | | (0.95 | ) | | | 9.50 | | | | (0.03 | ) | | | 4.33 | | | | 2.24 | |
| | | | | | | | | | | | | | | | | | | | | | | | | |
| DISTRIBUTIONS: | | | | | | | | | | | | | | | | | | | | | | | | |
| From net investment income | | | (0.36 | ) | | | (0.76 | ) | | | (0.66 | ) | | | (0.94 | ) | | | (0.89 | ) | | | (0.80 | ) |
| Total distributions | | | (0.36 | ) | | | (0.76 | ) | | | (0.66 | ) | | | (0.94 | ) | | | (0.89 | ) | | | (0.80 | ) |
| | | | | | | | | | | | | | | | | | | | | | | | | |
| NET INCREASE/(DECREASE) IN NET ASSET VALUE | | | 2.95 | | | | (1.71 | ) | | | 8.84 | | | | (0.97 | ) | | | 3.44 | | | | 1.44 | |
| NET ASSET VALUE, END OF PERIOD | | $ | 43.24 | | | $ | 40.29 | | | $ | 42.00 | | | $ | 33.16 | | | $ | 34.13 | | | $ | 30.69 | |
| TOTAL RETURN(d) | | | 8.27 | % | | | (2.38 | )% | | | 28.84 | % | | | (0.12 | )% | | | 14.31 | % | | | 7.67 | % |
| | | | | | | | | | | | | | | | | | | | | | | | | |
| RATIOS/SUPPLEMENTAL DATA: | | | | | | | | | | | | | | | | | | | | | | | | |
| Net assets, end of period (in 000s) | | $ | 748,122 | | | $ | 737,229 | | | $ | 688,720 | | | $ | 479,121 | | | $ | 496,574 | | | $ | 411,269 | |
| | | | | | | | | | | | | | | | | | | | | | | | | |
| Ratio of expenses to average net assets | | | 0.48 | %(e) | | | 0.48 | % | | | 0.48 | % | | | 0.48 | % | | | 0.48 | % | | | 0.48 | %(f) |
| Ratio of expenses including waiver/reimbursement to average net assets | | | 0.48 | %(e) | | | 0.48 | % | | | 0.48 | % | | | 0.48 | % | | | 0.48 | % | | | 0.48 | %(f) |
| Ratio of net investment income excluding waiver/reimbursement to average net assets | | | 2.11 | %(e) | | | 1.78 | % | | | 1.81 | % | | | 2.71 | % | | | 2.76 | % | | | 2.53 | % |
| Ratio of net investment income including waiver/reimbursement to average net assets | | | 2.11 | %(e) | | | 1.78 | % | | | 1.81 | %(g) | | | 2.71 | % | | | 2.76 | %(g) | | | 2.54 | % |
| Portfolio turnover rate(h) | | | 25 | % | | | 15 | % | | | 26 | % | | | 64 | %(i) | | | 15 | % | | | 18 | % |
| (a) | Effective November 30, 2022, the Board approved changing the fiscal year-end of the Fund from June 30 to November 30. |
| (b) | Based on average shares outstanding during the period. |
| (c) | The net investment income per share excluding the impact of large, non-recurring dividends (special dividends) was $0.67 during the year ended June 30, 2021 and $0.88 during the year ended June 30, 2019. |
| (d) | Total return is calculated assuming an initial investment made at the net asset value at the beginning of the period and redemption at the net asset value on the last day of the period and assuming all distributions are reinvested at the reinvestment prices. Total return calculated for a period of less than one year is not annualized. |
| (f) | Prior to June 28, 2018, the unitary management fee was 0.48% and the former investment advisor to the Fund agreed to contractually waive its fees and reimburse expenses so that the total annual fund operating expenses were limited to 0.48%. |
| (g) | The ratio of net investment income, including waiver/reimbursement and excluding the impact of large, non-recurring dividends (special dividends) was 1.77% during the year ended June 30, 2021 and 2.71% during the year ended June 30, 2019. |
| (h) | Portfolio turnover for periods less than one year are not annualized and does not include securities received or delivered from processing creations or redemptions in-kind. |
| (i) | Increase in the Portfolio turnover was a result of the Index change that was effective on June 1, 2020. |
See Notes to Financial Statements.
33 | November 30, 2022
| ALPS | O’Shares U.S. Small-Cap Quality Dividend ETF |
| Financial Highlights | For a Share Outstanding Throughout the Periods Presented |
| | | For the Period July 1, 2022 to November 30, 2022(a) | | | For the Year Ended June 30, 2022 | | | For the Year Ended June 30, 2021 | | | For the Year Ended June 30, 2020 | | | For the Year Ended June 30, 2019 | | | For the Year Ended June 30, 2018 | |
| NET ASSET VALUE, BEGINNING OF PERIOD | | $ | 31.67 | | | $ | 35.08 | | | $ | 24.99 | | | $ | 27.45 | | | $ | 27.07 | | | $ | 25.41 | |
| | | | | | | | | | | | | | | | | | | | | | | | | |
| INCOME/(LOSS) FROM OPERATIONS: | | | | | | | | | | | | | | | | | | | | | | | | |
| Net investment income(b) | | | 0.31 | | | | 0.59 | | | | 0.64 | (c) | | | 0.64 | (c) | | | 0.58 | (c) | | | 0.66 | |
| Net realized and unrealized gain/(loss) | | | 3.59 | | | | (3.38 | ) | | | 9.98 | | | | (2.48 | ) | | | 0.38 | (d) | | | 1.70 | |
| Total from investment operations | | | 3.90 | | | | (2.79 | ) | | | 10.62 | | | | (1.84 | ) | | �� | 0.96 | | | | 2.36 | |
| | | | | | | | | | | | | | | | | | | | | | | | | |
| DISTRIBUTIONS: | | | | | | | | | | | | | | | | | | | | | | | | |
| From net investment income | | | (0.27 | ) | | | (0.62 | ) | | | (0.53 | ) | | | (0.57 | ) | | | (0.58 | ) | | | (0.66 | ) |
| From net realized gain/loss | | | – | | | | – | | | | – | | | | – | | | | – | | | | – | (e) |
| From tax return of capital | | | – | | | | – | | | | – | | | | (0.05 | ) | | | – | | | | (0.04 | ) |
| Total distributions | | | (0.27 | ) | | | (0.62 | ) | | | (0.53 | ) | | | (0.62 | ) | | | (0.58 | ) | | | (0.70 | ) |
| | | | | | | | | | | | | | | | | | | | | | | | | |
| NET INCREASE/(DECREASE) IN NET ASSET VALUE | | | 3.63 | | | | (3.41 | ) | | | 10.09 | | | | (2.46 | ) | | | 0.38 | | | | 1.66 | |
| NET ASSET VALUE, END OF PERIOD | | $ | 35.30 | | | $ | 31.67 | | | $ | 35.08 | | | $ | 24.99 | | | $ | 27.45 | | | $ | 27.07 | |
| TOTAL RETURN(f) | | | 12.39 | % | | | (8.12 | )% | | | 42.79 | % | | | (6.82 | )% | | | 3.65 | % | | | 9.39 | % |
| | | | | | | | | | | | | | | | | | | | | | | | | |
| RATIOS/SUPPLEMENTAL DATA: | | | | | | | | | | | | | | | | | | | | | | | | |
| Net assets, end of period (in 000s) | | $ | 181,944 | | | $ | 155,318 | | | $ | 149,215 | | | $ | 93,812 | | | $ | 97,570 | | | $ | 136,802 | |
| | | | | | | | | | | | | | | | | | | | | | | | | |
| Ratio of expenses to average net assets | | | 0.48 | %(g) | | | 0.48 | % | | | 0.48 | % | | | 0.48 | % | | | 0.48 | % | | | 0.48 | % |
| Ratio of net investment income to average net assets | | | 2.28 | %(g) | | | 1.69 | % | | | 2.08 | %(h) | | | 2.38 | %(h) | | | 2.16 | %(h) | | | 2.51 | % |
| Portfolio turnover rate(i) | | | 34 | % | | | 34 | % | | | 60 | % | | | 101 | %(j) | | | 52 | % | | | 64 | % |
| (a) | Effective November 30, 2022, the Board approved changing the fiscal year-end of the Fund from June 30 to November 30. |
| (b) | Based on average shares outstanding during the period. |
| (c) | The net investment income per share excluding the impact of large, non-recurring dividends (special dividends) was $0.57 during the year ended June 30, 2021, $0.62 during the year ended June 30, 2020 and $0.54 during the year ended June 30, 2019. |
| (d) | The amount shown for a share outstanding throughout the period is not in accordance with the aggregate net realized and unrealized gain (loss) for that period because of the timing of sales and repurchases of the Fund shares in relation to fluctuating market value of the investments in the Fund. |
| (e) | Per share amount is less than $0.01. |
| (f) | Total return is calculated assuming an initial investment made at the net asset value at the beginning of the period and redemption at the net asset value on the last day of the period and assuming all distributions are reinvested at the reinvestment prices. Total return calculated for a period of less than one year is not annualized. |
(g) Annualized.
| (h) | The ratio of net investment income, including waiver/reimbursement and excluding the impact of large, non-recurring dividends (special dividends) was 1.84% during the year ended June 30, 2021, 2.30% during the year ended June 30, 2020 and 2.03% during the year ended June 30, 2019. |
| (i) | Portfolio turnover for periods less than one year are not annualized and does not include securities received or delivered from processing creations or redemptions in-kind. |
| (j) | Increase in the Portfolio turnover was a result of the Index change that was effective on June 1, 2020. |
See Notes to Financial Statements.
34 | November 30, 2022
| ALPS | O’Shares Global Internet Giants ETF |
| Financial Highlights | For a Share Outstanding Throughout the Periods Presented |
| | |
| | | For the Period July 1, 2022 to November 30, 2022(a) | | | For the Year Ended June 30, 2022 | | | For the Year Ended June 30, 2021 | | | For the Year Ended June 30, 2020 | | | For the Year Ended June 30, 2019 | | | For the Period June 5, 2018 (Commencement of operations) to June 30, 2018 | |
| NET ASSET VALUE, BEGINNING OF PERIOD | | $ | 27.08 | | | $ | 57.04 | | | $ | 37.85 | | | $ | 25.04 | | | $ | 24.06 | | | $ | 25.00 | |
| | | | | | | | | | | | | | | | | | | | | | | | | |
| INCOME/(LOSS) FROM OPERATIONS: | | | | | | | | | | | | | | | | | | | | | | | | |
| Net investment loss(b) | | | (0.04 | ) | | | (0.15 | ) | | | (0.21 | ) | | | (0.10 | ) | | | (0.06 | )(c) | | | (0.01 | ) |
| Net realized and unrealized gain/(loss) | | | (1.93 | ) | | | (29.81 | ) | | | 19.40 | | | | 12.91 | | | | 1.04 | | | | (0.93 | ) |
| Total from investment operations | | | (1.97 | ) | | | (29.96 | ) | | | 19.19 | | | | 12.81 | | | | 0.98 | | | | (0.94 | ) |
| | | | | | | | | | | | | | | | | | | | | | | | | |
| NET INCREASE/(DECREASE) IN NET ASSET VALUE | | | (1.97 | ) | | | (29.96 | ) | | | 19.19 | | | | 12.81 | | | | 0.98 | | | | (0.94 | ) |
| NET ASSET VALUE, END OF PERIOD | | $ | 25.11 | | | $ | 27.08 | | | $ | 57.04 | | | $ | 37.85 | | | $ | 25.04 | | | $ | 24.06 | |
| TOTAL RETURN(d) | | | (7.27 | )% | | | (52.52 | )% | | | 50.70 | % | | | 51.16 | % | | | 4.07 | % | | | (3.76 | )% |
| | | | | | | | | | | | | | | | | | | | | | | | | |
| RATIOS/SUPPLEMENTAL DATA: | | | | | | | | | | | | | | | | | | | | | | | | |
| Net assets, end of period (in 000s) | | $ | 152,513 | | | $ | 209,867 | | | $ | 718,766 | | | $ | 272,512 | | | $ | 48,834 | | | $ | 51,735 | |
| | | | | | | | | | | | | | | | | | | | | | | | | |
| Ratio of expenses to average net assets | | | 0.48 | %(e) | | | 0.48 | % | | | 0.48 | % | | | 0.48 | % | | | 0.48 | % | | | 0.48 | %(e) |
| Ratio of net investment loss to average net assets | | | (0.37 | )%(e) | | | (0.32 | )% | | | (0.40 | )% | | | (0.34 | )% | | | (0.28 | )%(f) | | | (0.48 | )%(e) |
| Portfolio turnover rate(g) | | | 22 | % | | | 51 | % | | | 48 | % | | | 38 | % | | | 55 | % | | | 8 | % |
| (a) | Effective November 30, 2022, the Board approved changing the fiscal year-end of the Fund from June 30 to November 30. |
| (b) | Based on average shares outstanding during the period. |
| (c) | The net investment loss per share excluding the impact of large, non-recurring dividends (special dividends) was $(0.07) during the year ended June 30, 2019. |
| (d) | Total return is calculated assuming an initial investment made at the net asset value at the beginning of the period and redemption at the net asset value on the last day of the period and assuming all distributions are reinvested at the reinvestment prices. Total return calculated for a period of less than one year is not annualized. |
| (f) | The ratio of net investment loss, including waiver/reimbursement and excluding the impact of large, non-recurring dividends (special dividends) was (0.31)% during the year ended June 30, 2019. |
| (g) | Portfolio turnover for periods less than one year are not annualized and does not include securities received or delivered from processing creations or redemptions in-kind. |
See Notes to Financial Statements.
35 | November 30, 2022
| ALPS | O’Shares Europe Quality Dividend ETF |
| Financial Highlights | For a Share Outstanding Throughout the Periods Presented |
| | | For the Period July 1, 2022 to November 30, 2022(a) | | | For the Year Ended June 30, 2022 | | | For the Year Ended June 30, 2021 | | | For the Year Ended June 30, 2020 | | | For the Year Ended June 30, 2019 | | | For the Year Ended June 30, 2018 | |
| NET ASSET VALUE, BEGINNING OF PERIOD | | $ | 22.62 | | | $ | 28.00 | | | $ | 22.28 | | | $ | 24.28 | | | $ | 23.94 | | | $ | 24.69 | |
| | | | | | | | | | | | | | | | | | | | | | | | | |
| INCOME/(LOSS) FROM OPERATIONS: | | | | | | | | | | | | | | | | | | | | | | | | |
| Net investment income(b) | | | 0.03 | | | | 0.58 | | | | 0.55 | (c) | | | 0.64 | (c) | | | 0.76 | (c) | | | 0.69 | |
| Net realized and unrealized gain/(loss) | | | 1.71 | | | | (5.33 | ) | | | 5.97 | | | | (1.95 | ) | | | 0.44 | | | | (0.55 | ) |
| Total from investment operations | | | 1.74 | | | | (4.75 | ) | | | 6.52 | | | | (1.31 | ) | | | 1.20 | | | | 0.14 | |
| | | | | | | | | | | | | | | | | | | | | | | | | |
| DISTRIBUTIONS: | | | | | | | | | | | | | | | | | | | | | | | | |
| From net investment income | | | (0.18 | ) | | | (0.63 | ) | | | (0.80 | ) | | | (0.69 | ) | | | (0.86 | ) | | | (0.89 | ) |
| Total distributions | | | (0.18 | ) | | | (0.63 | ) | | | (0.80 | ) | | | (0.69 | ) | | | (0.86 | ) | | | (0.89 | ) |
| | | | | | | | | | | | | | | | | | | | | | | | | |
| NET INCREASE/(DECREASE) IN NET ASSET VALUE | | | 1.56 | | | | (5.38 | ) | | | 5.72 | | | | (2.00 | ) | | | 0.34 | | | | (0.75 | ) |
| NET ASSET VALUE, END OF PERIOD | | $ | 24.18 | | | $ | 22.62 | | | $ | 28.00 | | | $ | 22.28 | | | $ | 24.28 | | | $ | 23.94 | |
| TOTAL RETURN(d) | | | 7.78 | % | | | (17.29 | )% | | | 29.72 | % | | | (5.44 | )% | | | 5.16 | % | | | 0.53 | % |
| | | | | | | | | | | | | | | | | | | | | | | | | |
| RATIOS/SUPPLEMENTAL DATA: | | | | | | | | | | | | | | | | | | | | | | | | |
| Net assets, end of period (in 000s) | | $ | 35,664 | | | $ | 40,716 | | | $ | 26,597 | | | $ | 17,821 | | | $ | 25,498 | | | $ | 40,698 | |
| | | | | | | | | | | | | | | | | | | | | | | | | |
| Ratio of expenses to average net assets | | | 0.48 | %(e) | | | 0.48 | % | | | 0.48 | % | | | 0.48 | % | | | 0.48 | % | | | 0.60 | %(f) |
| Ratio of expenses including waiver/reimbursement to average net assets | | | 0.48 | %(e) | | | 0.48 | % | | | 0.48 | % | | | 0.48 | % | | | 0.48 | % | | | 0.58 | %(f) |
| Ratio of net investment income to average net assets | | | 0.29 | %(e) | | | 2.20 | % | | | 2.18 | % | | | 2.72 | % | | | 3.23 | % | | | 2.75 | % |
| Ratio of net investment income including waiver/reimbursement to average net assets | | | 0.29 | %(e) | | | 2.20 | % | | | 2.18 | %(g) | | | 2.72 | %(g) | | | 3.23 | %(g) | | | 2.77 | %(g) |
| Portfolio turnover rate(h) | | | 38 | % | | | 22 | % | | | 42 | % | | | 72 | %(i) | | | 35 | % | | | 30 | % |
| (a) | Effective November 30, 2022, the Board approved changing the fiscal year-end of the Fund from June 30 to November 30. |
| (b) | Based on average shares outstanding during the period. |
| (c) | The net investment income per share excluding the impact of large, non-recurring dividends (special dividends) was $0.54 during the year ended June 30, 2021, $0.63 during the year ended June 30, 2020 and $0.74 during the year ended June 30, 2019. |
| (d) | Total return is calculated assuming an initial investment made at the net asset value at the beginning of the period and redemption at the net asset value on the last day of the period and assuming all distributions are reinvested at the reinvestment prices. Total return calculated for a period of less than one year is not annualized. |
| (f) | Prior to June 28, 2018, the unitary management fee was 0.58% and the former investment advisor to the Fund agreed to contractually waive its fees and reimburse expenses so that the total annual fund operating expenses were limited to 0.58%. |
| (g) | The ratio of net investment income, including waiver/reimbursement and excluding the impact of large, non-recurring dividends (special dividends) was 2.15% during the year ended June 30, 2021, 2.70% during the year ended June 30, 2020 and 3.15% during the year ended June 30, 2019 and 2.76% during the year ended June 30, 2018. |
| (h) | Portfolio turnover for periods less than one year are not annualized and does not include securities received or delivered from processing creations or redemptions in-kind. |
| (i) | Increase in the Portfolio turnover was a result of the Index change that was effective on June 1, 2020. |
See Notes to Financial Statements.
36 | November 30, 2022
| ALPS ETF Trust | |
| Notes to Financial Statements | November 30, 2022 |
1. ORGANIZATION
ALPS ETF Trust (the ‘‘Trust’’), a Delaware statutory trust, is an open-end management investment company registered under the Investment Company Act of 1940, as amended (the ‘‘1940 Act’’). As of November 30, 2022, the Trust consisted of twenty-three separate portfolios. Each portfolio represents a separate series of the Trust. This report pertains to the ALPS | O’Shares U.S. Quality Dividend ETF, the ALPS | O’Shares U.S. Small-Cap Quality Dividend ETF, the ALPS | O’Shares Global Internet Giants ETF and the ALPS | O’Shares Europe Quality Dividend ETF (each a “Fund” and collectively, the “Funds”). Effective November 30, 2022, the Trust's Board of Trustees (the "Board") approved changing the fiscal year-end of the Funds from June 30 to November 30.
The investment objective of the ALPS | O’Shares U.S. Quality Dividend ETF is to seek investment results that track the performance (before fees and expenses) of the O’Shares U.S. Quality Dividend Index. The investment objective of the ALPS | O’Shares U.S. Small-Cap Quality Dividend ETF is to seek investment results that track the performance (before fees and expenses) of the O’Shares U.S. Small-Cap Quality Dividend Index. The investment objective of the ALPS | O’Shares Global Internet Giants ETF is to seek investment results that track the performance (before fees and expenses) of the O’Shares Global Internet Giants Index. The investment objective of the ALPS | O’Shares Europe Quality Dividend ETF is to seek investment results that track the performance (before fees and expenses) of the O’Shares Europe Quality Dividend Index.
ALPS | O’Shares Global Internet Giants ETF is considered non-diversified and may invest a greater portion of assets in securities of individual issuers than a diversified fund. As a result, changes in the market value of a single investment could cause greater fluctuations in share price than would occur in a diversified fund. ALPS | O’Shares U.S. Quality Dividend ETF, ALPS | O’Shares U.S. Small-Cap Quality Dividend ETF and ALPS | O’Shares Europe Quality Dividend ETF have each elected to qualify as a diversified series of the Trust under the 1940 Act The Funds, previously part of another investment company, OSI ETF Trust, reorganized effective after the close of business on June 17, 2022. See Note 7 for further discussion on the reorganizations.
Each Fund’s Shares (“Shares”) are listed on the Cboe BZX Exchange, Inc. (the “Cboe BZX”). Each Fund issues and redeems Shares, at net asset value (“NAV”) in blocks of 25,000 Shares, each of which is called a “Creation Unit”. Creation Units are issued and redeemed principally in-kind for securities included in the Underlying Index. Except when aggregated in Creation Units, Shares are not redeemable securities of the Fund.
Pursuant to the Trust’s organizational documents, its Officers and Trustees are indemnified against certain liability arising out of the performance of their duties to the Trust. Additionally, in the normal course of business, the Trust enters into contracts with service providers that contain general indemnification clauses. The Trust’s maximum exposure under these arrangements is unknown, as this would involve future claims that may be made against the Trust that have not yet occurred.
2. SIGNIFICANT ACCOUNTING POLICIES
The following is a summary of significant accounting policies consistently followed by the Funds in the preparation of the financial statements. The accompanying financial statements were prepared in accordance with accounting principles generally accepted in the United States of America (“U.S. GAAP”). The preparation of financial statements in conformity with U.S. GAAP requires management to make certain estimates and assumptions that affect the reported amounts of assets and liabilities and disclosures of contingent assets and liabilities at the date of the financial statements and the reported amounts of revenue and expenses during the period. Actual results could differ from those estimates. Each Fund is considered an investment company under U.S. GAAP and follows the accounting and reporting guidance applicable to investment companies in the Financial Accounting Standards Board (“FASB”) Accounting Standards Codification Topic 946.
A. Portfolio Valuation
Each Fund’s NAV is determined daily, as of the close of regular trading on the New York Stock Exchange (the “NYSE”), normally 4:00 p.m. Eastern Time, on each day the NYSE is open for trading. The NAV is computed by dividing the value of all assets of each Fund (including accrued interest and dividends), less all liabilities (including accrued expenses and dividends declared but unpaid), by the total number of shares outstanding.
Portfolio securities listed on any exchange other than the NASDAQ Stock Market LLC (“NASDAQ”) are valued at the last sale price on the business day as of which such value is being determined. If there has been no sale on such day, the securities are valued at the mean of the most recent bid and ask prices on such day. Securities traded on the NASDAQ are valued at the NASDAQ Official Closing Price as determined by NASDAQ. Portfolio securities traded on more than one securities exchange are valued at the last sale price on the business day as of which such value is being determined at the close of the exchange representing the principal market for such securities. Portfolio securities traded in the over-the-counter market, but excluding securities traded on the NASDAQ, are valued at the last quoted sale price in such market.
37 | November 30, 2022
| ALPS ETF Trust | |
| Notes to Financial Statements | November 30, 2022 |
The Funds’ investments are valued at market value or, in the absence of market value with respect to any portfolio securities, at fair value according to procedures adopted by the Trust’s Board. Pursuant to Rule 2a-5 under the 1940 Act, the Board designated ALPS Advisors, Inc. (the "Adviser") as the valuation designee ("Valuation Designee") for each Fund to perform the fair value determinations relating to Fund investments. The Adviser may carry out its designated responsibilities as Valuation Designee through various teams and committees. When market quotations are not readily available or when events occur that make established valuation methods unreliable, securities of the Funds may be valued in good faith by the Valuation Designee. These securities generally include, but are not limited to, restricted securities (securities which may not be publicly sold without registration under the Securities Act of 1933) for which a pricing service is unable to provide a market price; securities whose trading has been formally suspended; a security whose market price is not available from a pre-established primary pricing source or the pricing source is not willing to provide a price; a security with respect to which an event has occurred that is most likely to materially affect the value of the security after the market has closed but before the calculation of a Fund’s NAV or make it difficult or impossible to obtain a reliable market quotation; or a security whose price, as provided by the pricing service, does not reflect the security’s “fair value” due to the security being de-listed from a national exchange or the security’s primary trading market is temporarily closed at a time when, under normal conditions, it would be open. As a general principle, the current “fair value” of a security would be the amount which the owner might reasonably expect to receive from the sale on the applicable exchange or principal market. A variety of factors may be considered in determining the fair value of such securities.
B. Fair Value Measurements
Each Fund discloses the classification of its fair value measurements following a three-tier hierarchy based on the inputs used to measure fair value. Inputs refer broadly to the assumptions that market participants would use in pricing the asset or liability, including assumptions about risk. Inputs may be observable or unobservable. Observable inputs reflect the assumptions market participants would use in pricing the asset or liability that are developed based on market data obtained from sources independent of the reporting entity. Unobservable inputs reflect the reporting entity’s own assumptions about the assumptions market participants would use in pricing the asset or liability that are developed based on the best information available.
Valuation techniques used to value the Funds’ investments by major category are as follows:
Equity securities, including restricted securities, for which market quotations are readily available, are valued at the last reported sale price or official closing price as reported by a third party pricing vendor on the primary market or exchange on which they are traded and are categorized as Level 1 in the hierarchy. In the event there were no sales during the day or closing prices are not available, securities are valued at the mean of the most recent quoted bid and ask prices on such day and are generally categorized as Level 2 in the hierarchy. Investments in open-end mutual funds are valued at their closing NAV each business day and are categorized as Level 1 in the hierarchy.
Changes in valuation techniques may result in transfers in or out of an assigned level within the disclosure hierarchy.
Various inputs are used in determining the value of each Fund’s investments as of the end of the reporting period. When inputs used fall into different levels of the fair value hierarchy, the level in the hierarchy within which the fair value measurement falls is determined based on the lowest level input that is significant to the fair value measurement in its entirety. The designated input levels are not necessarily an indication of the risk or liquidity associated with these investments.
These inputs are categorized in the following hierarchy under applicable financial accounting standards:
| Level 1 – | Unadjusted quoted prices in active markets for identical investments, unrestricted assets or liabilities that a Fund has the ability to access at the measurement date; |
| Level 2 – | Quoted prices which are not active, quoted prices for similar assets or liabilities in active markets or inputs other than quoted prices that are observable (either directly or indirectly) for substantially the full term of the asset or liability; and |
| Level 3 – | Significant unobservable prices or inputs (including the Fund’s own assumptions in determining the fair value of investments) where there is little or no market activity for the asset or liability at the measurement date. |
38 | November 30, 2022
| ALPS ETF Trust | |
| Notes to Financial Statements | November 30, 2022 |
The following is a summary of the inputs used to value the Funds’ investments as of November 30, 2022:
ALPS | O’Shares U.S. Quality Dividend ETF
| Investments in Securities at Value | | Level 1 - Quoted and Unadjusted Prices | | | Level 2 - Other Significant Observable Inputs | | | Level 3 - Significant Unobservable Inputs | | | Total | |
| Common Stocks* | | $ | 747,146,790 | | | $ | – | | | $ | – | | | $ | 747,146,790 | |
| Short Term Investments | | | 925,127 | | | | – | | | | – | | | | 925,127 | |
| Total | | $ | 748,071,917 | | | $ | – | | | $ | – | | | $ | 748,071,917 | |
ALPS | O’Shares U.S. Small-Cap Quality Dividend ETF
| Investments in Securities at Value | | Level 1 - Quoted and Unadjusted Prices | | | Level 2 - Other Significant Observable Inputs | | | Level 3 - Significant Unobservable Inputs | | | Total | |
| Common Stocks* | | $ | 181,730,527 | | | $ | – | | | $ | – | | | $ | 181,730,527 | |
| Short Term Investments | | | 161,958 | | | | – | | | | – | | | | 161,958 | |
| Total | | $ | 181,892,485 | | | $ | – | | | $ | – | | | $ | 181,892,485 | |
ALPS | O’Shares Global Internet Giants ETF
| Investments in Securities at Value | | Level 1 - Quoted and Unadjusted Prices | | | Level 2 - Other Significant Observable Inputs | | | Level 3 - Significant Unobservable Inputs | | | Total | |
| Common Stocks* | | $ | 152,407,086 | | | $ | – | | | $ | – | | | $ | 152,407,086 | |
| Short Term Investments | | | 132,849 | | | | – | | | | – | | | | 132,849 | |
| Total | | $ | 152,539,935 | | | $ | – | | | $ | – | | | $ | 152,539,935 | |
ALPS | O’Shares Europe Quality Dividend ETF
| Investments in Securities at Value | | Level 1 - Quoted and Unadjusted Prices | | | Level 2 - Other Significant Observable Inputs | | | Level 3 - Significant Unobservable Inputs | | | Total | |
| Common Stocks* | | $ | 35,501,373 | | | $ | – | | | $ | – | | | $ | 35,501,373 | |
| Short Term Investments | | | 18,888 | | | | – | | | | – | | | | 18,888 | |
| Total | | $ | 35,520,261 | | | $ | – | | | $ | – | | | $ | 35,520,261 | |
| * | For a detailed sector breakdown, see the accompanying Schedule of Investments. |
The Funds did not have any securities that used significant unobservable inputs (Level 3) in determining fair value and there were no transfers into or out of Level 3 during the period ended November 30, 2022.
C. Foreign Investment Risk
The ALPS | O’Shares Global Internet Giants ETF and the ALPS | O’Shares Europe Quality Dividend ETF may directly purchase securities of foreign issuers. Investments in non-U.S. issuers may involve unique risks compared to investing in securities of U.S. issuers, including, among others, less liquidity generally, greater market volatility than U.S. securities and less complete financial information than for U.S. issuers. In addition, adverse political, economic or social developments could undermine the value of the Fund’s investments or prevent the Fund from realizing the full value of its investments. Financial reporting standards for companies based in foreign markets differ from those in the United States. Finally, the value of the currency of the country in which the Fund has invested could decline relative to the value of the U.S. dollar, which may affect the value of the investment to U.S. investors.
Countries with emerging markets may have relatively unstable governments and may present the risks of nationalization of businesses, restrictions on foreign ownership and prohibitions on the repatriation of assets. The economies of emerging markets countries also may be based on only a few industries, making them more vulnerable to changes in local or global trade conditions and more sensitive to debt burdens, inflation rates or adverse news and events.
Because foreign markets may be open on different days than the days during which investors may purchase the shares of each Fund, the value of each Fund's securities may change on the days when investors are not able to purchase the shares of the Funds. The value of securities denominated in foreign currencies is converted into U.S. dollars using exchange rates determined daily as of the close of regular trading on the NYSE or NASDAQ. Any use of a different rate from the rates used by the Index may adversely affect a Fund's ability to track its Index.
39 | November 30, 2022
| ALPS ETF Trust | |
| Notes to Financial Statements | November 30, 2022 |
D. Foreign Currency Translation
The books and records of the Funds are maintained in U.S. dollars. Investment valuations and other assets and liabilities initially expressed in foreign currencies are converted each business day into U.S. dollars based upon current exchange rates. The portion of realized and unrealized gains or losses on investments due to fluctuations in foreign currency exchange rates is not separately disclosed and is included in realized and unrealized gains or losses on investments, when applicable.
E. Securities Transactions and Investment Income
Securities transactions are recorded as of the trade date. Realized gains and losses from securities transactions are recorded on the specific identification in accordance with GAAP. Dividend income and capital gains distributions, if any, are recorded on the ex-dividend date, net of any foreign taxes withheld. Non-cash dividends, if any, are recorded at the fair market value of the asset received. Interest income, if any, is recorded on the accrual basis, including amortization of premiums and accretion of discounts.
F. Dividends and Distributions to Shareholders
Dividends from net investment income for each Fund, if any, are declared and paid monthly or as the Board may determine from time to time. Distributions of net realized capital gains earned by the Funds, if any, are distributed at least annually.
G. Federal Tax and Tax Basis Information
The timing and character of income and capital gain distributions are determined in accordance with income tax regulations, which may differ from U.S. GAAP. Reclassifications are made to the Funds’ capital accounts for permanent tax differences to reflect income and gains available for distribution (or available capital loss carryforwards) under income tax regulations.
For the fiscal period ended November 30, 2022, the following reclassifications, which had no impact on results of operations or net assets, were recorded to reflect permanent tax differences resulting primarily from in-kind transactions:
| Fund | | Paid-in Capital | | | Total Distributable Earnings/ (Accumulated Losses) | |
| ALPS | O'Shares U.S. Quality Dividend ETF | | $ | 9,788,871 | | | $ | (9,788,871 | ) |
| ALPS | O'Shares U.S. Small-Cap Quality Dividend ETF | | | 812,536 | | | | (812,536 | ) |
| ALPS | O'Shares Global Internet Giants ETF | | | (4,466,480 | ) | | | 4,466,480 | |
| ALPS | O'Shares Europe Quality Dividend ETF | | | (514,928 | ) | | | 514,928 | |
The tax character of the distributions paid for the fiscal period ended November 30, 2022, and fiscal years ended June 30, 2022 and June 30, 2021 were as follows:
| | | Ordinary Income | | | Long-Term Capital Gain | | | Return of Capital | |
| November 30, 2022 | | | | | | | | | | | | |
| ALPS | O'Shares U.S. Quality Dividend ETF | | $ | 6,308,456 | | | $ | – | | | $ | – | |
| ALPS | O'Shares U.S. Small-Cap Quality Dividend ETF | | | 1,333,102 | | | | – | | | | – | |
| ALPS | O'Shares Global Internet Giants ETF | | | – | | | | – | | | | – | |
| ALPS | O'Shares Europe Quality Dividend ETF | | | 284,255 | | | | – | | | | – | |
| | | Ordinary Income | | | Long-Term Capital Gain | | | Return of Capital | |
| June 30, 2022 | | | | | | | | | |
| ALPS | O’Shares U.S. Quality Dividend ETF | | $ | 13,415,408 | | | $ | – | | | $ | – | |
| ALPS | O’Shares U.S. Small-Cap Quality Dividend ETF | | | 2,765,428 | | | | – | | | | – | |
| ALPS | O’Shares Global Internet Giants ETF | | | – | | | | – | | | | – | |
| ALPS | O’Shares Europe Quality Dividend ETF | | | 1,031,977 | | | | – | | | | – | |
| | | Ordinary Income | | | Long-Term Capital Gain | | | Return of Capital | |
| June 30, 2021 | | | | | | | | | | | | |
| ALPS | O'Shares U.S. Quality Dividend ETF | | $ | 10,300,014 | | | $ | – | | | $ | – | |
| ALPS | O'Shares U.S. Small-Cap Quality Dividend ETF | | | 2,128,261 | | | | – | | | | – | |
| ALPS | O'Shares Global Internet Giants ETF | | | – | | | | – | | | | – | |
| ALPS | O'Shares Europe Quality Dividend ETF | | | 682,515 | | | | – | | | | – | |
40 | November 30, 2022
| ALPS ETF Trust | |
| Notes to Financial Statements | November 30, 2022 |
The character of distributions made during the period may differ from its ultimate characterization for federal income tax purposes.
As of November 30, 2022, the components of distributable earnings on a tax basis for each Fund were as follows:
| | | Accumulated net investment income | | | Accumulated net realized gain/(loss) on investments | | | Other accumulated gains | | | Net unrealized appreciation/ (depreciation) on investments | | | Total | |
| ALPS | O’Shares U.S. Quality Dividend ETF | | $ | 679,101 | | | $ | (56,166,401 | ) | | $ | – | | | $ | 91,958,815 | | | $ | 36,471,515 | |
| ALPS | O’Shares U.S. Small-Cap Quality Dividend | | | | | | | | | | | | | | | | | | | | |
| ETF | | | 332,539 | | | | (13,374,787 | ) | | | – | | | | 18,831,362 | | | | 5,789,114 | |
| ALPS | O’Shares Global Internet Giants ETF | | | – | | | | (141,909,794 | ) | | | – | | | | (94,100,802 | ) | | | (236,010,596 | ) |
| ALPS | O’Shares Europe Quality Dividend ETF | | | 107,853 | | | | (9,590,888 | ) | | | – | | | | (2,660,706 | ) | | | (12,143,741 | ) |
Under current law, capital losses maintain their character as short-term or long-term and are carried forward to the next tax year without expiration. As of November 30, 2022, the following amounts are available as carry forwards to the next tax year:
| Fund | | Short-Term | | | Long-Term | |
| ALPS | O'Shares U.S. Quality Dividend ETF | | $ | 19,082,389 | | | $ | 37,084,012 | |
| ALPS | O'Shares U.S. Small-Cap Quality Dividend ETF | | | 4,402,596 | | | | 8,972,191 | |
| ALPS | O'Shares Global Internet Giants ETF | | | 91,621,464 | | | | 50,288,330 | |
| ALPS | O'Shares Europe Quality Dividend ETF | | | 2,867,763 | | | | 6,723,125 | |
As of November 30, 2022, the cost of investments for federal income tax purposes and accumulated net unrealized appreciation/(depreciation) on investments were as follows:
| | | ALPS | O’Shares U.S. Quality Dividend ETF | | | ALPS | O’Shares U.S. Small-Cap Quality Dividend ETF | | | ALPS| O’Shares Global Internet Giants ETF | | | ALPS| O’Shares Europe Quality Dividend ETF | |
| Gross appreciation (excess of value over tax cost) | | $ | 124,003,662 | | | $ | 23,994,061 | | | $ | 2,549,861 | | | $ | 1,656,634 | |
| Gross depreciation (excess of tax cost over value) | | | (32,044,847 | ) | | | (5,162,699 | ) | | | (96,650,478 | ) | | | (4,308,785 | ) |
| Net depreciation of foreign currency | | | – | | | | – | | | | (185 | ) | | | (8,555 | ) |
| Net unrealized appreciation (depreciation) | | $ | 91,958,815 | | | $ | 18,831,362 | | | $ | (94,100,802 | ) | | $ | (2,660,706 | ) |
| Cost of investments for income tax purposes | | $ | 656,113,102 | | | $ | 163,061,123 | | | $ | 246,640,552 | | | $ | 38,172,412 | |
The differences between book-basis and tax basis are primarily due to the deferral of losses from wash sales, investments in partnerships and investments in passive foreign investment companies.
H. Income Taxes
No provision for income taxes is included in the accompanying financial statements, as each Fund intends to distribute to shareholders all taxable investment income and realized gains and otherwise comply with Subchapter M of the Internal Revenue Code of 1986, as amended, applicable to regulated investment companies. Each Fund evaluates tax positions taken (or expected to be taken) in the course of preparing the Funds’ tax returns to determine whether these positions meet a “more-likely-than-not” standard that, based on the technical merits, have a more than fifty percent likelihood of being sustained by a taxing authority upon examination. A tax position that meets the “more-likely-than-not” recognition threshold is measured to determine the amount of benefit to recognize in the financial statements.
As of and during the fiscal period ended November 30, 2022, each Fund did not have a liability for any unrecognized tax benefits. Each Fund files U.S. federal, state, and local tax returns as required. Each Fund’s tax returns are subject to examination by the relevant tax authorities until expiration of the applicable statute of limitations, which is generally three years after the filing of the tax return, but may extend to four years in certain jurisdictions. Each Fund’s tax returns for open years have incorporated no uncertain tax positions that require a provision for income taxes.
I. Lending of Portfolio Securities
Effective June 20, 2022, the Funds have entered into a securities lending agreement with State Street Bank & Trust Co. (“SSB”), the Funds’ lending agent. Each Fund may lend its portfolio securities only to borrowers that are approved by SSB. Each Fund will limit such lending to not more than 33 1/3% of the value of its total assets. The Funds' securities held at SSB as custodian shall be available to be lent except those securities the Funds or ALPS Advisors, Inc. specifically identifies in writing as not being available for lending. The borrower pledges and maintains with the Funds collateral consisting of cash (U.S. Dollars only), securities issued or guaranteed by the U.S. government or its agencies or instrumentalities, and cash equivalents (including irrevocable bank letters of credit) issued by a person other than the borrower or an affiliate of the borrower. The initial collateral received by the Fund is required to have a value of no less than 102% of the market value of the loaned securities for U.S equity securities and a value of no less than 105% of the market value for non-U.S. equity securities. The collateral is maintained thereafter, at a market value equal to not less than 102% of the current value of the U.S. equity securities on loan and not less than 105% of the current value of the non-U.S. equity securities on loan. The market value of the loaned securities is determined at the close of each business day and any additional required collateral is delivered to the Fund on the next business day. During the term of the loan, each Fund is entitled to all distributions made on or in respect of the loaned securities. Loans of securities are terminable at any time and the borrower, after notice, is required to return borrowed securities within the customary time period for settlement of securities transactions.
41 | November 30, 2022
| ALPS ETF Trust | |
| Notes to Financial Statements | November 30, 2022 |
Any cash collateral received is reinvested in a money market fund managed by SSB as disclosed in the Fund’s Schedule of Investments and is reflected in the Statements of Assets and Liabilities as a payable for collateral upon return of securities loaned. Non-cash collateral, in the form of securities issued or guaranteed by the U.S. government or its agencies or instrumentalities, is not disclosed in the Funds' Statements of Assets and Liabilities as it is held by the lending agent on behalf of the Funds, and the Funds do not have the ability to re-hypothecate these securities. Income earned by the Fund from securities lending activity is disclosed in the Statement of Operations. The Funds did not participate in any securities lending during the fiscal period ended November 30, 2022.
3. INVESTMENT ADVISORY FEE AND OTHER AFFILIATED TRANSACTIONS
ALPS Advisors, Inc. serves as the Funds’ investment adviser pursuant to an Investment Advisory Agreement with the Trust on behalf of each Fund (the “Advisory Agreement”). Pursuant to the Advisory Agreement, each Fund pays the Adviser an annual management fee for the services and facilities it provides, payable on a monthly basis as a percentage of the relevant Fund’s average daily net assets as set out below. From time to time, the Adviser may waive all or a portion of its fee.
| Fund | Advisory Fee | |
| ALPS | O’Shares U.S. Quality Dividend ETF | Average net assets up to and including $2 billion | 0.48% |
| | Average net assets greater than $2 billion up to and including $3 billion | 0.44% |
| | Average net assets greater than $3 billion up to and including $4 billion | 0.40% |
| | Average net assets greater than $4 billion up to and including $5 billion | 0.36% |
| | Average net assets greater than $5 billion | 0.32% |
| ALPS | O’Shares U.S. Small-Cap Quality Dividend ETF | Average net assets up to and including $2 billion | 0.48% |
| | Average net assets greater than $2 billion up to and including $3 billion | 0.44% |
| | Average net assets greater than $3 billion up to and including $4 billion | 0.40% |
| | Average net assets greater than $4 billion up to and including $5 billion | 0.36% |
| | Average net assets greater than $5 billion | 0.32% |
| ALPS | O’Shares Global Internet Giants ETF | | 0.48% |
| ALPS | O’Shares Europe Quality Dividend ETF | | 0.48% |
Out of the unitary management fee, the Adviser pays substantially all expenses of each Fund, including licensing fees to the Underlying Index provider, the cost of transfer agency, custody, fund administration, legal, audit, trustees and other services, except for interest expenses, distribution fees or expenses, brokerage expenses, taxes and extraordinary expenses not incurred in the ordinary course of each Fund’s business. The Adviser’s unitary management fee is designed to pay substantially all of each Fund’s expenses and to compensate the Adviser for providing services for each Fund.
Prior to June 17, 2022, O’Shares Investment Advisers, LLC (“OSI”) served as each predecessor fund’s investment adviser pursuant to an Investment Advisory Agreement with the Trust on behalf of each Fund (the “O’Shares Advisory Agreement”). Under the O’Shares Advisory Agreement, the Funds paid OSI a unitary management fee for its services payable on a monthly basis at an annual rate of 0.48%, based on the average daily net assets of each Fund. Under the O’Shares Advisory Agreement, OSI was responsible for all of the ordinary operating expenses of the Funds, except for (i) the management fee, (ii) payments under the Funds’ Rule 12b-1 plan, (iii) brokerage expenses (including any costs incidental to transactions in portfolio securities or instruments), (iv) acquired fund fees and expenses, (v) taxes, interest (including borrowing costs and dividend expenses on securities sold short and overdraft charges), litigation expenses (including litigation to which the Trust or a Fund may be a party and indemnification of the Trustees and officers with respect thereto) and (viii) other extraordinary or non-routine expenses. See Note 7.
ALPS Fund Services, Inc., an affiliate of the Adviser, is the administrator of the Funds.
42 | November 30, 2022
| ALPS ETF Trust | |
| Notes to Financial Statements | November 30, 2022 |
Each Trustee receives (1) a quarterly retainer of $20,000, (2) a per meeting fee of $10,000, (3) $2,500 for any special meeting held outside of a regularly scheduled board meeting, and (4) reimbursement for all reasonable out-of-pocket expenses relating to attendance at meetings. In addition, the Chairman of the Board receives a quarterly retainer of $5,000, the Chairman of the Audit Committee receives a quarterly retainer of $3,000, and the Chairman of the Nominating & Governance Committee receives a quarterly retainer of $2,000, each in connection with their respective roles.
4. PURCHASES AND SALES OF SECURITIES
For the fiscal period ended November 30, 2022, the cost of purchases and proceeds from sales of investment securities, excluding short-term investments and in-kind transactions, were as follows:
| Fund | | Purchases | | | Sales | |
| ALPS | O’Shares U.S. Quality Dividend ETF | | $ | 181,119,740 | | | $ | 180,985,168 | |
| ALPS | O’Shares U.S. Small-Cap Quality Dividend ETF | | | 55,297,037 | | | | 54,999,215 | |
| ALPS | O’Shares Global Internet Giants ETF | | | 40,921,794 | | | | 41,055,178 | |
| ALPS | O’Shares Europe Quality Dividend ETF | | | 13,962,835 | | | | 14,289,311 | |
For the fiscal period ended November 30, 2022, the cost of in-kind purchases and proceeds from in-kind sales were as follows:
| Fund | | Purchases | | | Sales | |
| ALPS | O’Shares U.S. Quality Dividend ETF | | $ | 6,268,529 | | | $ | 46,486,259 | |
| ALPS | O’Shares U.S. Small-Cap Quality Dividend ETF | | | 13,888,458 | | | | 5,623,875 | |
| ALPS | O’Shares Global Internet Giants ETF | | | – | | | | 42,711,841 | |
| ALPS | O’Shares Europe Quality Dividend ETF | | | – | | | | 6,725,222 | |
For the fiscal period ended November 30, 2022, the in-kind net realized gain/(losses) were as follows:
| Fund | | Net Realized Gain/(Loss) | |
| ALPS | O’Shares U.S. Quality Dividend ETF | | $ | 9,870,025 | |
| ALPS | O’Shares U.S. Small-Cap Quality Dividend ETF | | | 871,499 | |
| ALPS | O’Shares Global Internet Giants ETF | | | (3,711,503 | ) |
| ALPS | O’Shares Europe Quality Dividend ETF | | | (503,647 | ) |
For the year ended June 30, 2022, the cost of securities purchased and proceeds from sales of securities, excluding short-term investments and in-kind transactions, were as follows:
| Fund | | Purchases | | | Sales | |
| ALPS | O'Shares U.S. Quality Dividend ETF | | $ | 109,264,630 | | | $ | 109,957,756 | |
| ALPS | O'Shares U.S. Small-Cap Quality Dividend ETF | | | 53,519,409 | | | | 53,090,491 | |
| ALPS | O'Shares Global Internet Giants ETF | | | 236,257,402 | | | | 237,418,829 | |
| ALPS | O'Shares Europe Quality Dividend ETF | | | 9,670,617 | | | | 9,819,223 | |
For the year ended June 30, 2022, the cost of in-kind purchases and proceeds from in-kind sales were as follows:
| Fund | | Purchases | | | Sales | |
| ALPS | O'Shares U.S. Quality Dividend ETF | | $ | 229,540,202 | | | $ | 141,453,935 | |
| ALPS | O'Shares U.S. Small-Cap Quality Dividend ETF | | | 78,377,800 | | | | 56,738,062 | |
| ALPS | O'Shares Global Internet Giants ETF | | | 5,604,311 | | | | 229,266,171 | |
| ALPS | O'Shares Europe Quality Dividend ETF | | | 43,374,326 | | | | 15,564,732 | |
43 | November 30, 2022
| ALPS ETF Trust | |
| Notes to Financial Statements | November 30, 2022 |
For the year ended June 30, 2022, the in-kind net realized gain/(losses) were as follows:
| Fund | | Net Realized Gain/(Loss) | |
| ALPS | O'Shares U.S. Quality Dividend ETF | | $ | 47,018,417 | |
| ALPS | O'Shares U.S. Small-Cap Quality Dividend ETF | | | 15,086,636 | |
| ALPS | O'Shares Global Internet Giants ETF | | | 36,553,162 | |
| ALPS | O'Shares Europe Quality Dividend ETF | | | 2,867,757 | |
Gains on in-kind transactions are not considered taxable for federal income tax purposes and losses on in-kind transactions are also not deductible for tax purposes.
5. CAPITAL SHARE TRANSACTIONS
Shares are created and redeemed by each Fund only in Creation Unit size aggregations of 25,000 Shares. Only broker-dealers or large institutional investors with creation and redemption agreements called Authorized Participants (“AP”) are permitted to purchase or redeem Creation Units from the Funds. Such transactions are generally permitted on an in-kind basis, with a balancing cash component to equate the transaction to the NAV per unit of each Fund on the transaction date. Cash may be substituted equivalent to the value of certain securities generally when they are not available in sufficient quantity for delivery, not eligible for trading by the AP or as a result of other market circumstances.
6. MARKET RISK
The Funds are subject to investment and operational risks associated with financial, economic and other global market developments and disruptions, including the recent spread of an infectious respiratory illness caused by a novel strain of coronavirus (known as COVID-19), which can negatively impact the securities markets and cause each Fund to lose value. Securities in each Fund’s portfolio may underperform in comparison to securities in general financial markets, a particular financial market or other asset classes due to a number of factors, including inflation (or expectations for inflation), deflation (or expectations for deflation), interest rates, global demand for particular products or resources, market instability, debt crises and downgrades, embargoes, tariffs, sanctions and other trade barriers, regulatory events, other governmental trade or market control programs and related geopolitical events. In addition, the value of the Fund’s investments may be negatively affected by the occurrence of global events such as war, terrorism, environmental disasters, natural disasters or events, country instability, and infectious disease epidemics or pandemics.
The spread of COVID-19 has caused volatility, severe market dislocations and liquidity constraints in many markets, including markets for the securities each Fund holds, and may adversely affect each Fund’s investments and operations. The transmission of COVID-19 and efforts to contain its spread have resulted in travel restrictions and disruptions, closed international borders, enhanced health screenings at ports of entry and elsewhere, disruption of and delays in healthcare service preparation and delivery, quarantines, event and service cancellations or interruptions, disruptions to business operations and supply chains, and a reduction in consumer and business spending, as well as general concern and uncertainty that has negatively affected the economy. These disruptions have led to instability in the market place and the jobs market. The impact of COVID-19 could adversely affect the economies of many nations or the entire global economy, the financial well-being and performance of individual issuers, borrowers and sectors and the health of the markets generally in potentially significant and unforeseen ways.
The foregoing could lead to a significant economic downturn or recession, increased market volatility, a greater number of market closures, higher default rates and adverse effects on the values and liquidity of each Fund’s securities or other assets. Such impacts may adversely affect the performance of the Funds.
44 | November 30, 2022
| ALPS ETF Trust | |
| Notes to Financial Statements | November 30, 2022 |
7. FUND REORGANIZATIONS
On February 23, 2022, the Board of Trustees of OSI ETF Trust (the “OSI ETF Board”) approved an Agreement and Plan of Reorganization with the Trust (the “Plan”) to reorganize each Predecessor Fund listed below with and into its corresponding Acquiring Fund, each a newly created series of the Trust. Shareholders of the O’Shares U.S. Quality Dividend ETF and O’Shares U.S. Small-Cap Quality Dividend ETF approved the Plan on May 18, 2022. Shareholders of the O’Shares Global Internet Giants ETF approved the Plan on June 15, 2022 and shareholders of the O’Shares Europe Quality Dividend ETF approved the Plan on June 8, 2022. The Trust acquired all of the assets of the corresponding Predecessor Funds, each a series of OSI ETF Trust, in exchange for shares of the Acquiring Fund and the assumption by the Acquiring Fund of the liabilities of the Predecessor Fund (the “Reorganizations”). The Reorganizations were completed after the close of business on June 17, 2022 in a tax-free exchange in which each shareholder of the Acquiring Funds received the same aggregate share and net asset value.
| Acquiring Fund | Predecessor Fund |
| ALPS | O’Shares U.S. Quality Dividend ETF | O’Shares U.S. Quality Dividend ETF |
| ALPS | O’Shares U.S. Small-Cap Quality Dividend ETF | O’Shares U.S. Small-Cap Quality Dividend ETF |
| ALPS | O’Shares Global Internet Giants ETF | O’Shares Global Internet Giants ETF |
| ALPS | O’Shares Europe Quality Dividend ETF | O’Shares Europe Quality Dividend ETF |
At the time of the reorganizations, each Acquiring Fund had the same ticker symbol and underlying index as its respective Predecessor Fund, was managed in accordance with the same investment objective and was subject to substantially the same investment strategies, policies and risks as the Predecessor Fund. Each Acquiring Fund is the accounting successor of the corresponding Predecessor Fund and assumed the performance and accounting history of the Predecessor Fund. As a result, the financial statements and financial highlights reflect the operations of the Predecessor Funds for periods prior to June 17, 2022.
Prior to the Reorganizations, the Acquiring Funds did not have any assets or liabilities. For financial reporting purposes, assets received and shares issued by the Acquiring Funds were recorded at fair value; however, the cost basis of the investments received from the Predecessor Funds were carried forward to align ongoing reporting of the Acquiring Funds realized and unrealized gains and losses with amounts distributable to shareholders for tax purposes.
8. SUBSEQUENT EVENTS
Effective January 3, 2023, dividends from net investment income, if any for the ALPS | O’Shares Europe Quality Dividend ETF are declared and paid quarterly.
45 | November 30, 2022
| ALPS ETF Trust | |
| Additional Information | November 30, 2022 (Unaudited) |
PROXY VOTING RECORDS, POLICIES AND PROCEDURES
Information regarding how each Fund voted proxies relating to portfolio securities during the most recent 12-month period ended June 30 and a description of the Fund’s proxy voting policies and procedures used in determining how to vote for proxies are available without charge on the SEC’s website at www.sec.gov and upon request, by calling (toll-free) 1-866-759-5679.
PORTFOLIO HOLDINGS
The Funds file a complete schedule of portfolio holdings with the U.S. Securities and Exchange Commission (“SEC”) for the first and third quarters of each fiscal year on Form N-PORT within 60 days after the end of the period. Copies of the Fund’s Form N-PORT are available without a charge, upon request, by contacting the Fund at 1-866-759-5679 and on the SEC’s website at https://www.sec.gov.
TAX INFORMATION
The Funds designate the following as a percentage of taxable ordinary income distributions, or up to the maximum amount allowable, for the calendar year ended December 31, 2021:
| | Qualified Dividend Income | Dividend Received Deduction |
| ALPS | O’Shares U.S. Quality Dividend ETF | 100% | 100% |
| ALPS | O’Shares U.S. Small-Cap Quality Dividend ETF | 100% | 100% |
| ALPS | O’Shares Global Internet Giants ETF | 0% | 0% |
| ALPS | O’Shares Europe Quality Dividend ETF | 87.61% | 0% |
In early 2022, if applicable, shareholders of record received this information for the distributions paid to them by the Funds during the calendar year 2021 via Form 1099. The Funds will notify shareholders in early 2023 of amounts paid to them by the Funds, if any, during the calendar year 2022.
Pursuant to Section 853(c) of the Internal Revenue Code, the following Funds designated the following for the calendar year ended December 31, 2022:
| | | Foreign Taxes Paid | | | Foreign Source Income | |
| ALPS | O'Shares Europe Quality Dividend ETF | | $ | 166,881 | | | $ | 1,499,181 | |
LICENSING AGREEMENTS
O’Shares Investment Advisers, LLC ( “O’Shares”) has entered into an index licensing agreement with ALPS Advisors Inc. (the “Adviser”) with respect to each of ALPS | O’Shares U.S. Quality Dividend ETF, ALPS | O’Shares U.S. Small-Cap Quality Dividend ETF, ALPS | O’Shares Global Internet Giants ETF, and ALPS | O’Shares Europe Quality Dividend ETF (each, a “Fund”), to allow the Adviser’s use of the O'Shares U.S. Quality Dividend Index, the O'Shares U.S. Small-Cap Quality Dividend Index, the O'Shares Global Internet Giants Index, and the O'Shares Europe Quality Dividend Index (each, an “Underlying Index”). The following disclosure relates to O’Shares.
The Funds are not sponsored, endorsed, sold or promoted by O’Shares or its third party licensors. Neither O’Shares nor its third party licensors make any representation or warranty, express or implied, to shareholders of a Fund or any member of the public regarding the advisability of investing in securities generally or in a Fund particularly or the ability of the Underlying Index to track general stock market performance. O’Shares’ and its third party licensor’s only relationship to the Adviser and each Fund is the licensing of certain trademarks, service marks and trade names of O’Shares and/or its third party licensors and for the providing the Underlying Index. Neither O’Shares nor its third party licensors is responsible for and has not participated in the determination of the prices and amount of a Fund or the timing of the issuance or sale of a Fund or in the determination or calculation of the equation by which a Fund is to be converted into cash. O’Shares has no obligation or liability in connection with the administration, marketing or trading of the Funds.
NEITHER O’SHARES, ITS AFFILIATES NOR THEIR THIRD PARTY LICENSORS GUARANTEE THE ADEQUACY, ACCURACY, TIMELINESS OR COMPLETENESS OF THE INDEX OR ANY DATA INCLUDED THEREIN OR ANY COMMUNICATIONS, INCLUDING BUT NOT LIMITED TO, ORAL OR WRITTEN COMMUNICATIONS (INCLUDING ELECTRONIC COMMUNICATIONS) WITH RESPECT THERETO. O’SHARES, ITS AFFILIATES AND THEIR THIRD PARTY LICENSORS SHALL NOT BE SUBJECT TO ANY DAMAGES OR LIABILITY FOR ANY ERRORS, OMISSIONS OR DELAYS THEREIN. O’SHARES MAKES NO EXPRESS OR IMPLIED WARRANTIES, AND EXPRESSLY DISCLAIMS ALL WARRANTIES OF MERCHANTABILITY OR FITNESS FOR A PARTICULAR PURPOSE OR USE WITH RESPECT TO ITS TRADEMARKS, THE INDEX OR ANY DATA INCLUDED THEREIN. WITHOUT LIMITING ANY OF THE FOREGOING, IN NO EVENT WHATSOEVER SHALL O’SHARES, ITS AFFILIATES OR THEIR THIRD PARTY LICENSORS BE LIABLE FOR ANY INDIRECT, SPECIAL, INCIDENTAL, PUNITIVE OR CONSEQUENTIAL DAMAGES, INCLUDING BUT NOT LIMITED TO, LOSS OF PROFITS, TRADING LOSSES, LOST TIME OR GOODWILL, EVEN IF THEY HAVE BEEN ADVISED OF THE POSSIBILITY OF SUCH DAMAGES, WHETHER IN CONTRACT, TORT, STRICT LIABILITY OR OTHERWISE.
46 | November 30, 2022
| ALPS ETF Trust | |
| Additional Information | November 30, 2022 (Unaudited) |
O’Shares Investments is a registered trademark and registered service mark of O’Shares Investment, Inc. and has been licensed for use by the Adviser and the Funds.
The Funds are not sponsored, endorsed, sold or promoted by O’Shares, its affiliates or their third party licensors and neither O’Shares, its affiliates nor its third party licensors make any representation regarding the advisability of investing in the Funds.
O’Shares has entered into an agreement with S-Network Global Indexes Inc. (“S-Network”) pursuant to which S-Network calculates each Underlying Index. The following disclosure relates to O’Shares.
The Funds are not sponsored, endorsed, sold or promoted by or its third party licensors. Neither S-Network nor its third party licensors make any representation or warranty, express or implied, to the owners of a Fund or any member of the public regarding the advisability of investing in securities generally or in a Fund particularly or the ability of the Underlying Index to track general stock market performance. S-Network's and its third party licensor’s only relationship to the Adviser is the licensing of certain trademarks, service marks and trade names of S-Network Global Indexes, Inc. and/or its third party licensors and for the providing of calculation and maintenance services related to the Underlying Index. Neither S-Network nor its third party licensors is responsible for and has not participated in the determination of the prices and amount of a Fund or the timing of the issuance or sale of a Fund or in the determination or calculation of the equation by which a Fund is to be converted into cash. S-Network has no obligation or liability in connection with the administration, marketing or trading of the Funds.
NEITHER S-NETWORK GLOBAL INDEXES, INC. (“S-Network”), ITS AFFILIATES NOR THEIR THIRD PARTY LICENSORS GUARANTEE THE ADEQUACY, ACCURACY, TIMELINESS OR COMPLETENESS OF THE CUSTOM INDEX OR ANY DATA INCLUDED THEREIN OR ANY COMMUNICATIONS, INCLUDING BUT NOT LIMITED TO, ORAL OR WRITTEN COMMUNICATIONS (INCLUDING ELECTRONIC COMMUNICATIONS) WITH RESPECT THERETO. S-NETWORK, ITS AFFILIATES AND THEIR THIRD PARTY LICENSORS SHALL NOT BE SUBJECT TO ANY DAMAGES OR LIABILITY FOR ANY ERRORS, OMISSIONS OR DELAYS THEREIN. S-NETWORK MAKES NO EXPRESS OR IMPLIED WARRANTIES, AND EXPRESSLY DISCLAIMS ALL WARRANTIES OF MERCHANTABILITY OR FITNESS FOR A PARTICULAR PURPOSE OR USE WITH RESPECT TO ITS TRADEMARKS, THE CUSTOM INDEX OR ANY DATA INCLUDED THEREIN. WITHOUT LIMITING ANY OF THE FOREGOING, IN NO EVENT WHATSOEVER SHALL S-NETWORK, ITS AFFILIATES OR THEIR THIRD PARTY LICENSORS BE LIABLE FOR ANY INDIRECT, SPECIAL, INCIDENTAL, PUNITIVE OR CONSEQUENTIAL DAMAGES, INCLUDING BUT NOT LIMITED TO, LOSS OF PROFITS, TRADING LOSSES, LOST TIME OR GOODWILL, EVEN IF THEY HAVE BEEN ADVISED OF THE POSSIBILITY OF SUCH DAMAGES, WHETHER IN CONTRACT, TORT, STRICT LIABILITY OR OTHERWISE.
S-Network Global Indexes, Inc.SM, and SNGISM are registered trademarks and registered service marks of S-Network Global Indexes, Inc. “Calculated by S-Network Global Indexes, Inc.” and its related stylized mark are service marks of S-Network Global Indexes, Inc.SM, and have been licensed for use by the Adviser.
The Funds are not sponsored, endorsed, sold or promoted by SNGI, its affiliates or their third party licensors and neither SNGI, its affiliates nor their its third party licensors make any representation regarding the advisability of investing in a Fund.
47 | November 30, 2022
| ALPS ETF Trust | |
| Trustees & Officers | November 30, 2022 (Unaudited) |
The general supervision of the duties performed by the Adviser for the Fund under the Investment Advisory Agreement is the responsibility of the Board of Trustees. The Trust currently has four Trustees, each of whom have no affiliation or business connection with the Adviser or any of its affiliated persons and do not own any stock or other securities issued by the Adviser. These are the “non-interested” or “independent” Trustees (“Independent Trustees”).
The Independent Trustees of the Trust, their term of office and length of time served, their principal business occupations during the past five years, the number of portfolios in the Fund Complex overseen by each Independent Trustee, and other directorships, if any, held by the Trustee are shown below.
INDEPENDENT TRUSTEES
| Name, Address & Year of Birth* | Position(s) Held with Trust | Term of Office and Length of Time Served** | Principal Occupation(s) During Past 5 Years | Number of Portfolios in Fund Complex Overseen by Trustees*** | Other Directorships Held by Trustees |
Mary K. Anstine, 1940 | Trustee | Since March 2008 | Ms. Anstine is Trustee/Director of AV Hunter Trust and Colorado Uplift Board. | 38 | Ms. Anstine is a Trustee of ALPS Variable Investment Trust (7 funds); Financial Investors Trust (29 funds); and Reaves Utility Income Fund. |
Jeremy W. Deems, 1976 | Trustee | Since March 2008 | Mr. Deems is the Co-Founder and Chief Financial Officer of Green Alpha Advisors, LLC, a registered investment advisor, and Co-Portfolio Manager of the Shelton Green Alpha Fund. | 38 | Mr. Deems is a Trustee of ALPS Variable Investment Trust (7 funds); Financial Investors Trust (29 funds); and Reaves Utility Income Fund; and Clough Funds Trust (1 fund). |
Rick A. Pederson, 1952 | Trustee | Since March 2008 | Mr. Pederson is Partner, Bow River Capital Partners (private equity management), 2003 - present; Board Member, Prosci Inc. (private business services) 2013-2016; Advisory Board Member, Citywide Banks (Colorado community bank) 2014- 2017; Board Member, Strong-Bridge Consulting, 2015- 2019; Board Member, IRI/ODMS Holdings LLC, 2017 – 2019; Director, National Western Stock Show (not for profit) 2010 - present; Director, History Colorado (not for profit) 2015- present; Director, Citywide Bank Advisory Board 2017-present; Trustee, Boettcher Foundation, 2018 - present. | 24 | Mr. Pederson is Trustee of Segall Bryant & Hamill Trust (14 funds), Principal Real Estate Income Fund (1 fund). |
48 | November 30, 2022
| ALPS ETF Trust | |
| Trustees & Officers | November 30, 2022 (Unaudited) |
| Name, Address & Year of Birth* | Position(s) Held with Trust | Term of Office and Length of Time Served** | Principal Occupation(s) During Past 5 Years | Number of Portfolios in Fund Complex Overseen by Trustees*** | Other Directorships Held by Trustees |
Edmund J. Burke, 1961 | Trustee | Since December 2017 | Mr. Burke joined ALPS in 1991 and served as the President and Director of ALPS Holdings, Inc., and ALPS Advisors, Inc., and Director of ALPS Distributors, Inc., ALPS Fund Services, Inc. (“ALPS”), and ALPS Portfolio Solutions Distributor, Inc. (collectively, the “ALPS Companies”). Mr. Burke retired from the ALPS Companies in June 2019. Mr. Burke is currently a partner at ETF Action, a web- based system that provides data and analytics to registered investment advisers, (since 2020) and a Director of Alliance Bioenergy Plus, Inc., a technology company focused on emerging technologies in the renewable energy, biofuels, and bioplastics technology sectors (since 2020). | 33 | Mr. Burke is a Trustee of Clough Global Dividend and Income Fund (1 fund); Clough Global Equity Fund (1 fund); Clough Global Opportunities Fund (1 fund); Clough Funds Trust (1 fund); Liberty All-Star Equity Fund (1 fund); Director of the Liberty All- Star Growth Fund, Inc. (1 fund) and Financial Investors Trust (29 funds). |
| * | The business address of the Trustee is c/o ALPS Advisors, Inc., 1290 Broadway, Suite 1000, Denver, Colorado 80203. |
| ** | This is the period for which the Trustee began serving the Trust. Each Trustee serves an indefinite term, until his or her successor is elected. |
| *** | The Fund Complex includes all series of the Trust and any other investment companies for which ALPS Advisors, Inc. provides investment advisory services. |
49 | November 30, 2022
| ALPS ETF Trust | |
| Trustees & Officers | November 30, 2022 (Unaudited) |
OFFICERS:
| Name, Address and Year of Birth of Officer* | Position(s) Held with Trust | Length of Time Served** | Principal Occupation(s) During Past 5 Years |
Laton Spahr, 1975 | President | Since June 2021 | Mr. Spahr joined ALPS in 2019 and currently serves as President and Portfolio Manager of AAI. Prior to his current role, Mr. Spahr was a Senior Vice President and Strategy Leader of the Value & Income Team for Oppenheimer Funds from 2013 to 2019. |
Matthew Sutula, 1985 | Chief Compliance Officer (“CCO”) | Since December 2019 | Mr. Sutula joined ALPS in 2012 and currently serves as Chief Compliance Officer of AAI. Prior to his current role, Mr. Sutula served as interim Compliance Officer of the Trust (September 2019 to December 2019). Compliance Manager and Senior Compliance Analyst for AAI, as well as Compliance Analyst for AFS. Prior to joining ALPS, he spent seven years at Morningstar, Inc. in various analyst roles supporting the registered investment company databases. Mr. Sutula is also Chief Compliance Officer of Principal Real Estate Income Fund, ALPS Variable Investment Trust, Liberty All-Star Equity Fund and Liberty All-Star Growth Fund, Inc. From September 2019 to September 2022 he served as Chief Compliance Officer of RiverNorth Opportunities Fund, Inc. |
Kathryn Burns, 1976 | Treasurer | Since September 2018 | Ms. Burns serves as Vice President, Director of Fund Operations of AAI since 2018. From 2013 to 2018, she served as Vice President and Fund Controller at AFS. Prior to joining ALPS, she worked at Old Mutual Capital where she served as Vice President and Chief Compliance Officer (2010 – 2012) and Regulatory Reporting Manager and Assistant Treasurer to the Old Mutual Funds Trusts (2006 – 2012). She also served as a CPA for PricewaterhouseCoopers LLP. Ms. Burns also serves as President of ALPS Variable Investment Trust and Principal Real Estate Income Fund. From June 2019 to September 2022 she served as President of RiverNorth Opportunities Fund, Inc. and from June 2018 to November 2021 she served as Treasurer of Boulder Growth & Income Fund, Inc. |
Michael P. Lawlor, 1969 | Secretary | Since December 2022 | Mr. Lawlor joined ALPS in January 2022, and is currently Vice President and Principal Legal Counsel. Prior to joining ALPS, Mr. Lawlor was Lead Fund Counsel at Brighthouse Financial (insurance company) (January 2007-April 2021). Mr. Lawlor also serves as Secretary of Financial Investors Trust and ALPS Variable Investment Trust. |
| * | The business address of each Officer is c/o ALPS Advisors, Inc., 1290 Broadway, Suite 1000, Denver, Colorado 80203. Each Officer is deemed an affiliate of the Trust as defined under the 1940 Act. |
| ** | This is the period for which the Officer began serving the Trust. Each Officer serves an indefinite term, until his or her successor is elected. |
The Statement of Additional Information includes additional information about the Funds' Trustees and is available, without charge, upon request by calling (toll-free) 1-866-759-5679.
50 | November 30, 2022
Intentionally Left Blank

| Performance Overview | 1 |
| Disclosure of Fund Expenses | 7 |
| Report of Independent Registered Public Accounting Firm | 8 |
| Schedule of Investments | 9 |
| Statement of Assets and Liabilities | 14 |
| Statement of Operations | 15 |
| Statements of Changes in Net Assets | 16 |
| Financial Highlights | 17 |
| Notes to Financial Statements | 18 |
| Additional Information | 24 |
| Board Considerations Regarding Approval of Investment Advisory Agreement | 26 |
| Trustees & Officers | 27 |
| Barron’s 400SM ETF | |
| Performance Overview | November 30, 2022 (Unaudited) |
Investment Objective
The Barron’s 400SM ETF (the “Fund” or “BFOR”) seeks investment results that correspond generally, before fees and expenses, to the performance of the Barron’s 400 IndexSM (the “Underlying Index” or “B400T”). The Underlying Index is a rules-based index intended to give investors a means of tracking the overall performance of high performing equity securities of U.S. companies. The Fund will invest at least 80% of its total assets in the equity securities which comprise the Underlying Index.
The Underlying Index generally consists of 400 stocks. The Underlying Index’s stocks are constituents of the MarketGrader U.S. Coverage Universe. In compiling the Underlying Index, MarketGrader Capital, LLC (the “Index Provider”) selects the 400 stocks from the MarketGrader U.S. Coverage Universe by using a methodology that selects components based on the strength of their fundamentals in growth, value, profitability and cash flow and then screens such potential Underlying Index components for certain criteria regarding concentration, market capitalization, and liquidity. The eligible stocks that are selected for inclusion in the Underlying Index’s portfolio are equally weighted. The Underlying Index is rebalanced by the Index Provider semiannually, on the third Friday of March and September each year.
Performance Overview
The Barron’s 400 ETF declined 6.2% between November 30, 2021, and November 30, 2022, its worst fiscal year return since the Fund was launched in June 2013. However, in a very challenging year for U.S. equities and for asset prices in general due to rapidly rising interest rates, BFOR showed resilience. The Dow Jones U.S. Total Stock Market Index, the broadest U.S. benchmark equity benchmark, lost 11.3% on a total return basis during the Fund’s fiscal year. Meanwhile, BFOR’s benchmark, the Barron’s 400 Index (B400T), fell by less than half the broad market’s decline, losing 5.5%, on a total return basis. Figure 1 represents the fiscal year returns for BFOR and B400T since the Fund’s inception on June 3, 2013.
Figure 1. Fiscal Year Returns for the Barron’s 400 ETF (BFOR) and its Benchmark, the Barron’s 400 Index (B400T) Since Inception on June 3, 2013.
| Fiscal Year | Barron’s 400 ETF (BFOR) | Barron’s 400 Index (B400T) |
| 2013* | 17.2% | 18.4% |
| 2014 | 8.1% | 9.0% |
| 2015 | 1.0% | 1.8% |
| 2016 | 9.1% | 9.9% |
| 2017 | 21.9% | 22.6% |
| 2018 | -2.1% | -1.5% |
| 2019 | 5.0% | 5.6% |
| 2020 | 13.3% | 14.1% |
| 2021 | 33.2% | 34.1% |
| 2022 | -6.2% | -5.5% |
| * | Fiscal year 2013 is measured from the Fund’s inception on June 3, 2013, through November 30, 2013. BFOR returns are based on the Fund’s last market price at each fiscal year’s end date. B400T figures reflect total returns. Source: Bloomberg. |
Strategy Helps the Barron’s 400 Index Sidestep the Worst of the Market’s Decline
The most recent fiscal year was particularly challenging for growth stocks, especially when compared to their value counterparts, reversing years of large cap performance. The Russell 3000 Growth Index declined by -21.6% in the 12 months ending November 30th, trailing the Russell 3000 Value Index, which was up 1.9%, by a spread of over 23 percentage points. Meanwhile, the Barron’s 400 Index (B400T), which selects its constituents according to MarketGrader’s Growth at a Reasonable Price (GARP) methodology, was able to sidestep much of the growth benchmark’s decline, falling a mere 5.5%, which means the B400T outperformed the growth benchmark by more than 16 percentage points1.
Besides the Index’s GARP selection methodology, readers should remember that B400T equally weights its constituents at its semi-annual rebalances that take place every March and September. This also served it well during the most recent fiscal year as it helped the Index avoid an overconcentration in large cap growth stocks, which suffered larger declines than the overall market. This may be seen in the -21.6% return for the Russell 1000 Growth Index, well below the -10.7% return for the Russell 1000 Index. Additionally, the Index’s all-cap methodology served it well in outperforming both the large cap and small cap benchmarks, with B400T beating the Russell 1000 Index by 520 basis points and the Russell 2000 Index by 750 basis points. It also outperformed the S&P 500 Index, a widely followed large cap benchmark, by 370 basis points2. Figure 2 shows the fiscal year performance for both BFOR and B400T relative to various broad market benchmarks.
| 2 | All figures cited above are based on total returns; source: Bloomberg. |
1 | November 30, 2022
| Barron’s 400SM ETF | |
| Performance Overview | November 30, 2022 (Unaudited) |
Figure 2. Fiscal Year 2022 Performance for the Barron’s 400 ETF (BFOR) and the Barron’s 400 Index (B400T) vs. Select Broad, Size, and Style U.S. Equity Benchmarks
| | Fiscal Year Return |
| | 11/30/2021 – 11/30/2022 |
| Barron’s 400 ETF (BFOR) | -6.2% |
| Barron’s 400 Index (B400T) | -5.5% |
| Dow Jones US Total Stock Market Index | -11.3% |
| S&P 500 Index | -9.2% |
| Russell 1000 Index | -10.7% |
| Russell 1000 Growth Index | -21.6% |
| Russell 2000 Index | -13.0% |
| Russell 2000 Value Index | -4.7% |
| Russell 3000 Index | -10.8% |
| Russell 3000 Growth Index | -21.6% |
| Russell 3000 Value Index | 1.9% |
All figures are based on total returns. Source: Bloomberg
A Drill-Down Into the Barron’s 400 Companies
The Barron’s 400 Index, as its name implies, tracks 400 companies that are selected based on the quality of their GARP rating, as calculated by MarketGrader. However, over the course of BFOR’s fiscal year, which runs from November 30 of one year to November 30 of the following year, both the Index (B400T) and the Fund (BFOR) hold three different sets of 400 companies, given that B400T is reconstituted and rebalanced every March and September. The first portfolio of 400 companies is the one with which it starts the fiscal year (which was reconstituted in September of the previous fiscal year), and this is held through the March rebalance. When the B400T is reconstituted in March, this essentially determines the second portfolio of 400 companies that BFOR holds. Finally, when B400T reconstitutes in September, the third portfolio of Barron’s 400 companies that BFOR holds is determined. Each portfolio of companies is not, of course, completely different from the others as there is plenty of overlap across all three of them, as explained below.
During the fiscal year ended November 30, 2022, B400T and BFOR held a total of 714 stocks. Figure 3 shows how these holdings were broken down across all three holding periods. Among these 714 stocks, it is worth highlighting the 127 stocks that were selected to B400T across all three holding periods, or the entire fiscal year of BFOR. The average price return for these 127 stocks was -2.3%, outperforming the Index itself by 491 basis points. Figure 4 shows how these companies were broken down by sector along with each category’s average return.
Figure 3. Companies Selected to Barron’s 400 Index by Holding Period
| Period | # of Companies |
| Sept. 2021 to March 2022 Only | 147 |
| March 2022 to Sept. 2022 Only | 72 |
| Sept. 2022 to Present Only (in current portfolio) | 136 |
| Sept. 2021 to March 2022 & March 2022 to Sept. 2022 | 95 |
| Sept. 2021 to March 2022 & Sept. 2022 to Present | 31 |
| March 2022 to Sept. 2022 & Sept. 2022 to Present (in current portfolio) | 106 |
| Entire Period: Sept. 2021 to Present (in current portfolio) | 127 |
| Total Holdings from Sept. 2021 to Present | 714 |
Source: MarketGrader Research
2 | November 30, 2022
| Barron’s 400SM ETF | |
| Performance Overview | November 30, 2022 (Unaudited) |
Figure 4. Size & Sector Composition of Companies Selected to Barron’s 400 Index Across All Holding Periods During Fiscal Year 2022
| Market Cap Breakdown | Count | Average Market Cap in USD Millions | Average Return |
| Large Caps | 74 | 151,632 | -5.2% |
| Small Caps | 53 | 4,582 | 1.8% |
| Total | 127 | 90,265 | -2.3% |
| | | | |
| Sector Breakdown | | | |
| Consumer Discretionary | 20 | 9,460 | -13.9% |
| Consumer Staples | 5 | 70,656 | 20.2% |
| Energy | 6 | 15,073 | 42.8% |
| Financials | 16 | 9,091 | -5.3% |
| Health Care | 14 | 95,855 | 5.1% |
| Industrials | 26 | 28,880 | -10.8% |
| Materials | 13 | 17,631 | 9.2% |
| Technology | 27 | 309,749 | -7.2% |
Market Cap breakdown is based on MarketGrader’s annual categorization of the U.S. equity universe by size. All companies in the top 85% of aggregate market capitalization are considered large caps and the remaining companies are considered small caps. Sources: MarketGrader Research, FactSet.
3 | November 30, 2022
| Barron’s 400SM ETF | |
| Performance Overview | November 30, 2022 (Unaudited) |
Lastly, Figure 5 shows the 30 best performing stocks in B400T during fiscal year 2022, across all holding periods. Some, like top performer Catalyst Pharmaceuticals (CPRX), achieved some of the year’s best returns because they were held for the entire period. Others, like San Juan Basin Royalty Trust (SJT), were held over two holding periods, starting with the March 2022 rebalance. And, remarkably, six of the top 30 made the list after only two months as members of B400T, having been selected in September 2022.
Figure 5. Top 30 Performing Stocks in the Barron’s 400 Index During the 2022 Fiscal Year*
| Symbol | Company Name | Market Cap** (in USD Millions) | Sector | Start Date | End Date | Return (%) |
| CPRX | Catalyst Pharmaceuticals, Inc. | 522 | Health Care | 11/30/21 | 11/30/22 | 139.6 |
| TPL | Texas Pacific Land Corp. | 10,267 | Energy | 11/30/21 | 11/30/22 | 114.5 |
| CLFD | Clearfield, Inc. | 524 | Technology | 11/30/21 | 11/30/22 | 103.3 |
| BDSI | BioDelivery Sciences Intl. | 360 | Health Care | 11/30/21 | 3/18/22 | 100.7 |
| STLD | Steel Dynamics, Inc. | 13,038 | Materials | 11/30/21 | 11/30/22 | 73.8 |
| SJT | San Juan Basin Royalty Trust | 324 | Energy | 3/21/22 | 11/30/22 | 73.7 |
| VRTX | Vertex Pharmaceuticals Inc. | 51,351 | Health Care | 11/30/21 | 11/30/22 | 69.3 |
| CCRN | Cross Country Healthcare, Inc. | 768 | Health Care | 3/21/22 | 11/30/22 | 64.8 |
| EOG | EOG Resources, Inc. | 39,777 | Energy | 11/30/21 | 11/30/22 | 63.1 |
| HALO | Halozyme Therapeutics, Inc. | 5,985 | Health Care | 11/30/21 | 3/18/22 | 58.8 |
| | Archer-Daniels-Midland | | | | | |
| ADM | Company | 33,493 | Consumer Staples | 11/30/21 | 11/30/22 | 56.7 |
| MUSA | Murphy USA, Inc. | 4,103 | Consumer Discretionary | 3/21/22 | 11/30/22 | 54.3 |
| BTU | Peabody Energy Corporation | 3,463 | Energy | 9/19/22 | 11/30/22 | 50.5 |
| MOS | Mosaic Company | 11,173 | Materials | 11/30/21 | 11/30/22 | 49.9 |
| CHRD | Chord Energy Corporation | 2,313 | Energy | 9/19/22 | 11/30/22 | 48.9 |
| CAT | Caterpillar Inc. | 115,671 | Industrials | 11/30/21 | 3/18/22 | 48.3 |
| DE | Deere & Company | 108,228 | Industrials | 11/30/21 | 3/18/22 | 45.4 |
| ATEN | A10 Networks, Inc. | 934 | Technology | 9/19/22 | 11/30/22 | 45.2 |
| MNRL | Brigham Minerals, Inc. Class A | 1,002 | Energy | 3/21/22 | 11/30/22 | 43.4 |
| MGPI | MGP Ingredients, Inc. | 881 | Consumer Staples | 11/30/21 | 9/16/22 | 43.2 |
| HDSN | Hudson Technologies, Inc. | 326 | Industrials | 9/19/22 | 11/30/22 | 42.7 |
| FHN | First Horizon Corporation | 8,601 | Financials | 11/30/21 | 3/18/22 | 42.7 |
| NUE | Nucor Corporation | 33,678 | Materials | 11/30/21 | 11/30/22 | 41.1 |
| PBF | PBF Energy, Inc. Class A | 3,679 | Energy | 9/19/22 | 11/30/22 | 40.6 |
| LSCC | Lattice Semiconductor Corp. | 7,438 | Technology | 9/19/22 | 11/30/22 | 40.3 |
| ABBV | AbbVie, Inc. | 197,618 | Health Care | 11/30/21 | 11/30/22 | 39.8 |
| MRK | Merck & Co., Inc. | 192,673 | Health Care | 3/21/22 | 11/30/22 | 39.3 |
| NOC | Northrop Grumman Corp. | 58,867 | Industrials | 11/30/21 | 9/16/22 | 39.1 |
| HES | Hess Corporation | 28,224 | Energy | 3/21/22 | 11/30/22 | 38.6 |
| MGY | Magnolia Oil & Gas Corp. Cl A | 3,143 | Energy | 11/30/21 | 11/30/22 | 37.5 |
| * | Regardless of holding period. |
| ** | Market Capitalizations are from the first date each company was first selected to the Index across the three holding periods in fiscal year 2022. All returns are price-only. Sources: MarketGrader Research, FactSet. |
4 | November 30, 2022
| Barron’s 400SM ETF | |
| Performance Overview | November 30, 2022 (Unaudited) |
Performance (as of November 30, 2022)
| | 1 Year | 5 Year | Since Inception^ |
| Barron’s 400SM ETF – NAV | -6.18% | 7.79% | 10.04% |
| Barron’s 400SM ETF – Market Price* | -6.21% | 7.79% | 10.04% |
| Barron’s 400 IndexSM | -5.52% | 8.51% | 10.77% |
Total Expense Ratio (per the current prospectus) is 0.65%
Performance data quoted represents past performance. Past performance does not guarantee future results. Total return figures assume reinvestment of dividends and capital gains distributions, if any. The table does not reflect the deduction of taxes that a shareholder would pay on Fund distributions or the redemption of Fund shares. Investment return and principal value of an investment will fluctuate so that an investor’s shares, when sold or redeemed, may be worth more or less than the original cost. Current performance data may be higher or lower than actual data quoted. For the most current month-end performance data please visit www.alpsfunds.com or call 1.866.759.5679.
Net Asset Value (NAV) is an exchange-traded fund’s per-share value. The per-share dollar amount of the Fund is derived by dividing the total value of all the securities in its portfolio, less any liabilities, by the number of Fund shares outstanding. Market Price is the price at which a share can currently be traded in the market. Information detailing the number of days the Market Price of the Fund was greater than the Fund’s NAV and the number of days it was less than the Fund’s NAV can be obtained at www.alpsfunds.com.
| ^ | | The Fund commenced Investment Operations on June 4, 2013. |
| * | Market Price means the official closing price of a share or, if it more accurately reflects the market value of a share at the time as of which the Fund calculates current net asset value per share, the price that is the midpoint of the bid-ask spread as of that time. It does not represent the returns an investor would receive if shares were traded at other times. |
The Barron’s 400 IndexSM, calculated by NYSE Arca or its affiliates, measures the performance of a diversified group of U.S. companies selected in part based on fundamentals-related rules-based criteria. The index includes companies that have scored highest according to fundamentals-related rankings calculated by MarketGrader Capital, LLC. Additional rules-based screening provides for sector and market cap diversification. The Underlying Index has been licensed by MarketGrader for use with the Barron’s 400SM ETF.
The index is not actively managed and does not reflect any deductions for fees, expenses or taxes. One cannot invest directly in an index. Index performance does not reflect Fund performance.
Funds that emphasize investments in small/mid cap companies will generally experience greater price volatility.
Barron’s 400SM ETF shares are not individually redeemable. Investors buy and sell shares of the Barron’s 400SM ETF on a secondary market. Only market makers or “authorized participants” may trade directly with the Fund, typically in blocks of 25,000 shares.
The Barron’s 400SM ETF is not suitable for all investors. Investments in the Fund are subject to investment risks, including possible loss of the principal amount invested.
ALPS Portfolio Solutions Distributor, Inc., a FINRA member, is the distributor for the Fund.
5 | November 30, 2022
| Barron’s 400SM ETF | |
| Performance Overview | November 30, 2022 (Unaudited) |
Top 10 Holdings*^ (as of November 30, 2022)
| Amkor Technology, Inc. | 0.35% |
| Texas Pacific Land Corp. | 0.34% |
| Atkore, Inc. | 0.34% |
| Hudson Technologies, Inc. | 0.34% |
| Peabody Energy Corp. | 0.33% |
| Netflix, Inc. | 0.33% |
| Lattice Semiconductor Corp. | 0.33% |
| A10 Networks, Inc. | 0.33% |
| Halozyme Therapeutics, Inc. | 0.32% |
| Medpace Holdings, Inc. | 0.32% |
| Total % of Top 10 Holdings | 3.33% |
| * | % of Total Investments (excluding investments purchased with collateral from securities loaned). |
| ^ | | Excludes Money Market Fund |
Sector Allocation* (as of November 30, 2022)
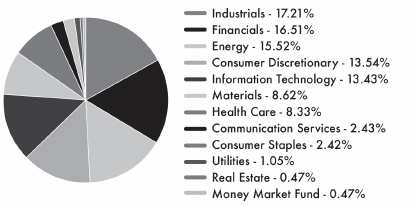
Future holdings are subject to change.
Growth of $10,000 (as of November 30, 2022)
Comparison of change in value of a $10,000 investment in the Fund and the Underlying Index
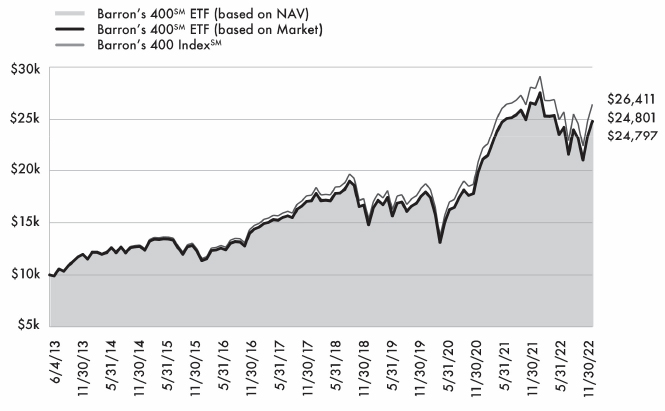
The chart above compares historical performance of a hypothetical investment of $10,000 in the Fund since inception with the performance of the Fund’s benchmark index. Results include the reinvestment of all dividends and capital gains distributions. Past performance does not guarantee future results. The chart does not reflect the deduction of taxes that a shareholder would pay on Fund distributions or the redemption of Fund shares.
6 | November 30, 2022
| Barron’s 400SM ETF | |
| Disclosure of Fund Expenses | November 30, 2022 (Unaudited) |
Shareholder Expense Example: As a shareholder of the Fund, you incur certain ongoing costs, including management fees and other Fund expenses. These examples are intended to help you understand your ongoing costs (in dollars) of investing in the Fund and to compare these costs with the ongoing costs of investing in other funds. It is based on an investment of $1,000 invested at the beginning of the six month period and held through November 30, 2022.
Actual Return: The first line of the table provides information about actual account values and actual expenses. You may use the information in this line, together with the amount you invested, to estimate the expenses that you incurred over the period. Simply divide your account value by $1,000 (for example, an $8,600 account value divided by $1,000 = 8.6), then multiply the result by the number in the first line under the heading entitled “Expenses Paid During Period” to estimate the expenses attributable to your investment during this period.
Hypothetical 5% Return: The second line of the table provides information about hypothetical account values and hypothetical expenses based on the Fund’s actual expense ratio and an assumed rate of return of 5% per year before expenses, which is not the Fund’s actual return. The hypothetical account values and expenses may not be used to estimate the actual ending account balance or expenses you paid for the period. You may use this information to compare ongoing costs of investing in the Fund and other funds. To do so, compare this 5% hypothetical example with the 5% hypothetical examples that appear in the shareholder reports of other funds.
The expenses shown in the table are meant to highlight ongoing Fund costs only and do not reflect any transaction costs, such as brokerage commissions and other fees to financial intermediaries. Therefore, the second line is useful in comparing ongoing costs only, and will not help you determine the relative total costs of owning different funds. In addition, if these costs were included, your costs would have been higher.
| | Beginning Account Value 6/1/22 | Ending Account Value 11/30/22 | Expense Ratio(a) | Expenses Paid During Period 6/1/22 - 11/30/22(b) |
| Barron's 400 SM ETF | | | | |
| Actual | $1,000.00 | $1,024.40 | 0.65% | $3.30 |
| Hypothetical (5% return before expenses) | $1,000.00 | $1,021.81 | 0.65% | $3.29 |
| (a) | Annualized, based on the Fund's most recent fiscal half year expenses. |
| (b) | Expenses are equal to the Fund's annualized expense ratio multiplied by the average account value over the period, multiplied by the number of days in the most recent fiscal half year (183), divided by 365. |
7 | November 30, 2022
| Barron’s 400SM ETF |
| Report of Independent Registered Public Accounting Firm |
To the Board of Trustees of ALPS ETF Trust and the shareholders of Barron’s 400SM ETF
Opinion on the Financial Statements
We have audited the accompanying statement of assets and liabilities of Barron’s 400SM ETF, a series of shares of beneficial interest in ALPS ETF Trust (the “Fund”), including the schedule of investments, as of November 30, 2022, and the related statements of operations and changes in net assets and the financial highlights for the year then ended, and the related notes (collectively referred to as the “financial statements”). In our opinion, the financial statements present fairly, in all material respects, the financial position of the Fund as of November 30, 2022, and the results of its operations, the changes in its net assets, and its financial highlights for the year then ended, in conformity with accounting principles generally accepted in the United States of America. The statement of changes in net assets for the year ended November 30, 2021 and the financial highlights for each of the years in the four-year period then ended were audited by other auditors whose report dated January 26, 2022, expressed an unqualified opinion on those financial statements and financial highlights.
Basis for Opinion
These financial statements are the responsibility of the Fund’s management. Our responsibility is to express an opinion on the Fund's financial statements based on our audit. We are a public accounting firm registered with the Public Company Accounting Oversight Board (United States) (“PCAOB”) and are required to be independent with respect to the Fund in accordance with the U.S. federal securities law and the applicable rules and regulations of the Securities and Exchange Commission and the PCAOB.
We conducted our audit in accordance with the standards of the PCAOB. Those standards require that we plan and perform the audit to obtain reasonable assurance about whether the financial statements are free of material misstatement, whether due to error or fraud. The Fund is not required to have, nor were we engaged to perform, an audit of its internal control over financial reporting. As part of our audit we are required to obtain an understanding of internal control over financial reporting but not for the purpose of expressing an opinion on the effectiveness of the Fund’s internal control over financial reporting. Accordingly, we express no such opinion.
Our audit included performing procedures to assess the risk of material misstatement of the financial statements, whether due to error or fraud, and performing procedures that respond to those risks. Such procedures included examining, on a test basis, evidence regarding the amounts and disclosures in the financial statements. Our procedures included confirmation of securities owned as of November 30, 2022 by correspondence with the custodian. Our audit also included evaluating the accounting principles used and significant estimates made by management, as well as evaluating the overall presentation of the financial statements. We believe that our audit provides a reasonable basis for our opinion.
BBD, LLP
We have served as the auditor of one or more of the Funds in the ALPS ETF Trust since 2022.
Philadelphia, Pennsylvania
January 27, 2023
8 | November 30, 2022
| Barron’s 400SM ETF | |
| Schedule of Investments | November 30, 2022 |
| Security Description | | Shares | | | Value | |
| COMMON STOCKS (97.29%) | | | | | | |
| Communication Services (2.43%) | | | | | | |
| Alphabet, Inc., Class A(a) | | | 3,083 | | | $ | 311,352 | |
| Charter Communications, Inc., Class A(a) | | | 830 | | | | 324,771 | |
| Electronic Arts, Inc. | | | 2,522 | | | | 329,827 | |
| Liberty Media Corp.-Liberty SiriusXM, Class C(a) | | | 7,783 | | | | 341,129 | |
| Meta Platforms, Inc., Class A(a) | | | 2,100 | | | | 248,010 | |
| Netflix, Inc.(a) | | | 1,482 | | | | 452,796 | |
| Nexstar Media Group, Inc., Class A | | | 1,660 | | | | 314,670 | |
| PubMatic, Inc., Class A(a)(b) | | | 17,984 | | | | 281,809 | |
| Warner Music Group Corp., Class A | | | 11,611 | | | | 397,909 | |
| World Wrestling Entertainment, Inc., Class A | | | 4,706 | | | | 375,915 | |
| Total Communication Services | | | | | | | 3,378,188 | |
| | | | | | | | | |
| Consumer Discretionary (13.53%) | | | | | | | | |
| Airbnb, Inc., Class A(a) | | | 2,644 | | | | 270,058 | |
| Asbury Automotive Group, Inc.(a) | | | 1,991 | | | | 373,551 | |
| Best Buy Co., Inc. | | | 4,350 | | | | 371,055 | |
| Booking Holdings, Inc.(a) | | | 167 | | | | 347,268 | |
| Buckle, Inc. | | | 9,797 | | | | 430,578 | |
| Cavco Industries, Inc.(a) | | | 1,524 | | | | 349,956 | |
| Chipotle Mexican Grill, Inc.(a) | | | 190 | | | | 309,122 | |
| Crocs, Inc.(a) | | | 4,264 | | | | 430,664 | |
| Darden Restaurants, Inc. | | | 2,495 | | | | 366,740 | |
| Dave & Buster's Entertainment, Inc.(a) | | | 8,872 | | | | 351,864 | |
| Deckers Outdoor Corp.(a) | | | 960 | | | | 382,925 | |
| Destination XL Group, Inc.(a) | | | 53,762 | | | | 358,055 | |
| Dillard's, Inc., Class A(b) | | | 1,091 | | | | 392,433 | |
| Dollar Tree, Inc.(a) | | | 2,318 | | | | 348,372 | |
| DR Horton, Inc. | | | 4,626 | | | | 397,836 | |
| Ethan Allen Interiors, Inc. | | | 13,575 | | | | 386,209 | |
| Ford Motor Co. | | | 21,731 | | | | 302,061 | |
| Fox Factory Holding Corp.(a) | | | 3,642 | | | | 386,416 | |
| Genuine Parts Co. | | | 2,030 | | | | 372,160 | |
| Green Brick Partners, Inc.(a) | | | 14,192 | | | | 343,163 | |
| H&R Block, Inc. | | | 7,164 | | | | 313,138 | |
| Hasbro, Inc. | | | 4,010 | | | | 251,908 | |
| Home Depot, Inc. | | | 1,154 | | | | 373,885 | |
| Installed Building Products, Inc. | | | 3,650 | | | | 309,995 | |
| Kontoor Brands, Inc.(b) | | | 8,805 | | | | 382,577 | |
| LCI Industries | | | 2,770 | | | | 273,842 | |
| Lennar Corp., Class B | | | 5,440 | | | | 394,998 | |
| LKQ Corp. | | | 6,345 | | | | 344,724 | |
| Malibu Boats, Inc., Class A(a) | | | 5,892 | | | | 340,027 | |
| MarineMax, Inc.(a) | | | 9,926 | | | | 327,856 | |
| Marriott International, Inc., Class A | | | 2,056 | | | | 339,960 | |
| Meritage Homes Corp.(a) | | | 4,330 | | | | 374,155 | |
| MGM Resorts International | | | 9,450 | | | | 348,327 | |
| Murphy USA, Inc. | | | 1,132 | | | | 334,857 | |
| NIKE, Inc., Class B | | | 3,030 | | | | 332,361 | |
| Security Description | | Shares | | | Value | |
| Consumer Discretionary (continued) | | | | | | |
| NVR, Inc.(a) | | | 80 | | | $ | 371,121 | |
| OneWater Marine, Inc., Class A(a) | | | 9,264 | | | | 302,840 | |
| Oxford Industries, Inc. | | | 3,713 | | | | 419,049 | |
| Patrick Industries, Inc. | | | 6,636 | | | | 371,152 | |
| Pool Corp. | | | 959 | | | | 315,904 | |
| PulteGroup, Inc. | | | 8,173 | | | | 365,987 | |
| RCI Hospitality Holdings, Inc. | | | 4,708 | | | | 428,522 | |
| RH(a) | | | 1,226 | | | | 351,654 | |
| Shoe Carnival, Inc. | | | 13,892 | | | | 366,888 | |
| Skyline Champion Corp.(a) | | | 5,979 | | | | 310,848 | |
| Steven Madden, Ltd. | | | 11,060 | | | | 382,012 | |
| Taylor Morrison Home Corp., Class A(a) | | | 13,636 | | | | 414,398 | |
| Tesla, Inc.(a) | | | 1,096 | | | | 213,391 | |
| TopBuild Corp.(a) | | | 1,835 | | | | 282,737 | |
| Tractor Supply Co. | | | 1,658 | | | | 375,222 | |
| Ulta Beauty, Inc.(a) | | | 747 | | | | 347,236 | |
| Vista Outdoor, Inc.(a)(b) | | | 11,401 | | | | 318,886 | |
| Williams-Sonoma, Inc. | | | 2,237 | | | | 261,505 | |
| Winnebago Industries, Inc.(b) | | | 5,534 | | | | 324,237 | |
| Total Consumer Discretionary | | | | | | | 18,836,685 | |
| | | | | | | | | |
| Consumer Staples (2.41%) | | | | | | | | |
| Archer-Daniels-Midland Co. | | | 3,720 | | | | 362,700 | |
| Brown-Forman Corp., Class A | | | 4,436 | | | | 323,783 | |
| Cal-Maine Foods, Inc. | | | 5,675 | | | | 330,739 | |
| Campbell Soup Co. | | | 6,798 | | | | 364,849 | |
| Coca-Cola Co. | | | 5,320 | | | | 338,405 | |
| Costco Wholesale Corp. | | | 631 | | | | 340,267 | |
| Darling Ingredients, Inc.(a) | | | 4,218 | | | | 302,979 | |
| General Mills, Inc. | | | 4,310 | | | | 367,643 | |
| Hershey Co. | | | 1,441 | | | | 338,880 | |
| Tyson Foods, Inc., Class A | | | 4,369 | | | | 289,577 | |
| Total Consumer Staples | | | | | | | 3,359,822 | |
| | | | | | | | | |
| Energy (13.83%) | | | | | | | | |
| Antero Resources Corp.(a) | | | 8,030 | | | | 293,496 | |
| APA Corp. | | | 8,184 | | | | 383,420 | |
| Arch Resources, Inc., Class A | | | 2,442 | | | | 377,899 | |
| Brigham Minerals, Inc., Class A | | | 11,619 | | | | 411,661 | |
| California Resources Corp. | | | 7,409 | | | | 336,220 | |
| Callon Petroleum Co.(a) | | | 7,623 | | | | 319,556 | |
| Chesapeake Energy Corp. | | | 3,163 | | | | 327,370 | |
| Chevron Corp. | | | 2,012 | | | | 368,820 | |
| Chord Energy Corp. | | | 2,297 | | | | 350,361 | |
| Civitas Resources, Inc. | | | 5,119 | | | | 344,816 | |
| Comstock Resources, Inc. | | | 16,353 | | | | 300,078 | |
| ConocoPhillips | | | 2,917 | | | | 360,279 | |
| CONSOL Energy, Inc. | | | 4,820 | | | | 373,309 | |
| Coterra Energy, Inc. | | | 10,661 | | | | 297,549 | |
| Denbury, Inc.(a) | | | 3,756 | | | | 337,139 | |
| Devon Energy Corp. | | | 4,640 | | | | 317,933 | |
| Diamondback Energy, Inc. | | | 2,377 | | | | 351,844 | |
| Earthstone Energy, Inc., Class A(a) | | | 21,381 | | | | 338,675 | |
| EOG Resources, Inc. | | | 2,642 | | | | 374,979 | |
| EQT Corp. | | | 6,680 | | | | 283,299 | |
9 | November 30, 2022
| Barron’s 400SM ETF | |
| Schedule of Investments | November 30, 2022 |
| Security Description | | Shares | | | Value | |
| Energy (continued) | | | | | | |
| Exxon Mobil Corp. | | | 3,368 | | | $ | 374,993 | |
| Halliburton Co. | | | 10,989 | | | | 416,373 | |
| Hess Corp. | | | 2,587 | | | | 372,295 | |
| HF Sinclair Corp. | | | 6,228 | | | | 388,254 | |
| Kinder Morgan, Inc. | | | 17,621 | | | | 336,914 | |
| Kosmos Energy, Ltd.(a) | | | 49,801 | | | | 331,177 | |
| Laredo Petroleum, Inc.(a) | | | 4,469 | | | | 285,256 | |
| Magnolia Oil & Gas Corp., Class A | | | 13,969 | | | | 364,312 | |
| Marathon Oil Corp. | | | 12,094 | | | | 370,439 | |
| Marathon Petroleum Corp. | | | 3,292 | | | | 400,999 | |
| Matador Resources Co. | | | 5,489 | | | | 364,250 | |
| Murphy Oil Corp. | | | 8,081 | | | | 381,423 | |
| Northern Oil and Gas, Inc.(b) | | | 10,118 | | | | 368,194 | |
| Occidental Petroleum Corp. | | | 4,898 | | | | 340,362 | |
| ONEOK, Inc. | | | 5,191 | | | | 347,382 | |
| Ovintiv, Inc. | | | 6,212 | | | | 346,381 | |
| PBF Energy, Inc., Class A | | | 10,375 | | | | 412,614 | |
| PDC Energy, Inc. | | | 4,908 | | | | 364,763 | |
| Peabody Energy Corp.(a)(b) | | | 14,295 | | | | 456,582 | |
| Permian Resources Corp. | | | 41,000 | | | | 416,560 | |
| Phillips 66 | | | 3,720 | | | | 403,397 | |
| Pioneer Natural Resources Co. | | | 1,328 | | | | 313,395 | |
| Range Resources Corp. | | | 10,181 | | | | 293,925 | |
| Ranger Oil Corp.(a) | | | 8,373 | | | | 364,812 | |
| Sabine Royalty Trust(b) | | | 3,928 | | | | 314,672 | |
| San Juan Basin Royalty Trust | | | 27,707 | | | | 322,509 | |
| SandRidge Energy, Inc.(a) | | | 17,408 | | | | 355,123 | |
| Schlumberger Ltd. | | | 8,320 | | | | 428,896 | |
| SilverBow Resources, Inc.(a) | | | 8,841 | | | | 308,639 | |
| SM Energy Co. | | | 7,150 | | | | 308,236 | |
| Targa Resources Corp. | | | 4,641 | | | | 345,244 | |
| Texas Pacific Land Corp. | | | 184 | | | | 477,027 | |
| VAALCO Energy, Inc. | | | 68,868 | | | | 356,736 | |
| Valero Energy Corp. | | | 2,880 | | | | 384,826 | |
| Total Energy | | | | | | | 19,265,663 | |
| | | | | | | | | |
| Financials (16.49%) | | | | | | | | |
| Ally Financial, Inc. | | | 10,011 | | | | 270,397 | |
| Amalgamated Financial Corp. | | | 14,086 | | | | 375,674 | |
| American Equity Investment Life Holding Co. | | | 8,639 | | | | 349,966 | |
| American Express Co. | | | 2,065 | | | | 325,423 | |
| American International Group, Inc. | | | 5,911 | | | | 373,043 | |
| Ameriprise Financial, Inc. | | | 1,154 | | | | 383,070 | |
| Ameris Bancorp | | | 6,835 | | | | 361,435 | |
| Bank of America Corp. | | | 9,459 | | | | 358,023 | |
| Bank OZK | | | 7,845 | | | | 362,047 | |
| Blackstone, Inc. | | | 3,395 | | | | 310,744 | |
| Capital One Financial Corp. | | | 3,179 | | | | 328,200 | |
| Cathay General Bancorp | | | 7,794 | | | | 362,187 | |
| Charles Schwab Corp. | | | 4,406 | | | | 363,671 | |
| Comerica, Inc. | | | 3,914 | | | | 280,790 | |
| ConnectOne Bancorp, Inc. | | | 12,925 | | | | 339,152 | |
| Dime Community Bancshares, Inc. | | | 10,388 | | | | 370,540 | |
| Discover Financial Services | | | 3,258 | | | | 353,037 | |
| Security Description | | Shares | | | Value | |
| Financials (continued) | | | | | | |
| East West Bancorp, Inc. | | | 4,386 | | | $ | 307,941 | |
| Enterprise Financial Services Corp. | | | 6,930 | | | | 362,716 | |
| Equitable Holdings, Inc. | | | 10,743 | | | | 340,983 | |
| FactSet Research Systems, Inc. | | | 718 | | | | 331,206 | |
| Farmers & Merchants Bancorp, Inc./Archbold OH | | | 11,770 | | | | 337,564 | |
| Fidelity National Financial, Inc., Class A | | | 7,899 | | | | 318,804 | |
| Fifth Third Bancorp | | | 9,154 | | | | 332,840 | |
| First BanCorp | | | 22,565 | | | | 347,050 | |
| First Citizens BancShares, Inc., Class A | | | 380 | | | | 310,255 | |
| First Commonwealth Financial Corp. | | | 24,303 | | | | 357,740 | |
| First Financial Bankshares, Inc. | | | 7,654 | | | | 282,815 | |
| First Foundation, Inc. | | | 16,812 | | | | 235,536 | |
| First Republic Bank | | | 2,120 | | | | 270,533 | |
| Hamilton Lane, Inc., Class A | | | 4,534 | | | | 334,972 | |
| Hancock Whitney Corp. | | | 6,535 | | | | 358,379 | |
| Hanmi Financial Corp. | | | 13,399 | | | | 362,443 | |
| Horizon Bancorp, Inc. | | | 17,229 | | | | 280,144 | |
| Huntington Bancshares, Inc. | | | 22,840 | | | | 353,563 | |
| Jackson Financial, Inc., Class A | | | 9,925 | | | | 370,699 | |
| JPMorgan Chase & Co. | | | 2,762 | | | | 381,653 | |
| KeyCorp | | | 17,847 | | | | 335,702 | |
| Lakeland Bancorp, Inc. | | | 19,661 | | | | 367,268 | |
| Marsh & McLennan Cos., Inc. | | | 2,000 | | | | 346,360 | |
| Metropolitan Bank Holding Corp.(a) | | | 4,576 | | | | 290,759 | |
| Mr Cooper Group, Inc.(a) | | | 7,381 | | | | 333,326 | |
| Northern Trust Corp. | | | 3,370 | | | | 313,781 | |
| OFG Bancorp | | | 12,046 | | | | 348,973 | |
| Origin Bancorp, Inc. | | | 7,937 | | | | 324,782 | |
| Pacific Premier Bancorp, Inc. | | | 10,045 | | | | 371,163 | |
| Patria Investments, Ltd., Class A | | | 23,516 | | | | 320,993 | |
| Pinnacle Financial Partners, Inc. | | | 3,972 | | | | 333,211 | |
| PNC Financial Services Group, Inc. | | | 2,000 | | | | 336,520 | |
| Preferred Bank | | | 4,781 | | | | 361,396 | |
| Premier Financial Corp. | | | 12,507 | | | | 364,954 | |
| Principal Financial Group, Inc. | | | 4,140 | | | | 371,275 | |
| Regions Financial Corp. | | | 14,776 | | | | 342,951 | |
| Sandy Spring Bancorp, Inc. | | | 8,469 | | | | 294,891 | |
| ServisFirst Bancshares, Inc. | | | 3,876 | | | | 293,878 | |
| Signature Bank/New York NY | | | 1,801 | | | | 251,240 | |
| Silvergate Capital Corp., Class A(a)(b) | | | 3,605 | | | | 98,885 | |
| South State Corp. | | | 4,018 | | | | 352,981 | |
| Southside Bancshares, Inc. | | | 8,684 | | | | 315,577 | |
| Synchrony Financial | | | 10,130 | | | | 380,685 | |
| Synovus Financial Corp. | | | 7,985 | | | | 336,408 | |
| The Hartford Financial Services Group, Inc. | | | 4,844 | | | | 369,936 | |
| Truist Financial Corp. | | | 6,800 | | | | 318,308 | |
| TrustCo Bank Corp. | | | 9,738 | | | | 378,224 | |
10 | November 30, 2022
| Barron’s 400SM ETF | |
| Schedule of Investments | November 30, 2022 |
| Security Description | | Shares | | | Value | |
| Financials (continued) | | | | | | |
| UMB Financial Corp. | | | 3,650 | | | $ | 312,148 | |
| US Bancorp | | | 7,093 | | | | 321,951 | |
| Washington Federal, Inc. | | | 10,336 | | | | 364,551 | |
| Western Alliance Bancorp | | | 4,282 | | | | 293,488 | |
| WR Berkley Corp. | | | 4,819 | | | | 367,593 | |
| Total Financials | | | | | | | 22,959,393 | |
| | | | | | | | | |
| Health Care (8.32%) | | | | | | | | |
| Abbott Laboratories | | | 3,038 | | | | 326,828 | |
| AbbVie, Inc. | | | 2,315 | | | | 373,132 | |
| Agilent Technologies, Inc. | | | 2,404 | | | | 372,572 | |
| Amgen, Inc. | | | 1,415 | | | | 405,256 | |
| AMN Healthcare Services, Inc.(a) | | | 3,111 | | | | 384,831 | |
| Amphastar Pharmaceuticals, Inc.(a) | | | 11,127 | | | | 328,135 | |
| Bristol-Myers Squibb Co. | | | 4,536 | | | | 364,150 | |
| Catalyst Pharmaceuticals, Inc.(a) | | | 20,996 | | | | 352,103 | |
| Charles River Laboratories International, Inc.(a) | | | 1,511 | | | | 345,369 | |
| Cross Country Healthcare, Inc.(a) | | | 12,144 | | | | 434,512 | |
| Danaher Corp. | | | 1,140 | | | | 311,687 | |
| Doximity, Inc., Class A(a)(b) | | | 9,684 | | | | 329,159 | |
| Dynavax Technologies Corp.(a)(b) | | | 28,518 | | | | 353,908 | |
| Halozyme Therapeutics, Inc.(a) | | | 7,779 | | | | 445,426 | |
| Harmony Biosciences Holdings, Inc.(a)(b) | | | 7,003 | | | | 418,569 | |
| Hologic, Inc.(a) | | | 4,728 | | | | 360,085 | |
| IQVIA Holdings, Inc.(a) | | | 1,510 | | | | 329,210 | |
| iTeos Therapeutics, Inc.(a) | | | 15,898 | | | | 320,345 | |
| Laboratory Corp. of America Holdings | | | 1,405 | | | | 338,184 | |
| Medpace Holdings, Inc.(a) | | | 2,105 | | | | 441,818 | |
| Merck & Co., Inc. | | | 3,722 | | | | 409,867 | |
| Mettler-Toledo International, Inc.(a) | | | 257 | | | | 377,677 | |
| Moderna, Inc.(a) | | | 2,442 | | | | 429,572 | |
| QuidelOrtho Corp.(a) | | | 3,836 | | | | 336,072 | |
| Repligen Corp.(a)(b) | | | 1,440 | | | | 257,530 | |
| ResMed, Inc. | | | 1,370 | | | | 315,374 | |
| Shockwave Medical, Inc.(a) | | | 1,115 | | | | 282,764 | |
| SIGA Technologies, Inc. | | | 24,090 | | | | 221,146 | |
| Thermo Fisher Scientific, Inc. | | | 574 | | | | 321,566 | |
| Vertex Pharmaceuticals, Inc.(a) | | | 1,144 | | | | 361,962 | |
| Waters Corp.(a) | | | 1,075 | | | | 372,595 | |
| West Pharmaceutical Services, Inc. | | | 1,096 | | | | 257,187 | |
| Zoetis, Inc. | | | 1,997 | | | | 307,818 | |
| Total Health Care | | | | | | | 11,586,409 | |
| | | | | | | | | |
| Industrials (17.19%) | | | | | | | | |
| Advanced Drainage Systems, Inc.(b) | | | 2,370 | | | | 230,506 | |
| AerSale Corp.(a) | | | 15,790 | | | | 250,271 | |
| AMETEK, Inc. | | | 2,606 | | | | 371,146 | |
| Security Description | | Shares | | | Value | |
| Industrials (continued) | | | | | | |
| Applied Industrial Technologies, Inc. | | | 3,073 | | | $ | 407,142 | |
| ArcBest Corp. | | | 4,284 | | | | 354,587 | |
| Atkore, Inc.(a) | | | 3,904 | | | | 476,874 | |
| Boise Cascade Co. | | | 5,421 | | | | 401,371 | |
| Builders FirstSource, Inc.(a) | | | 5,652 | | | | 361,332 | |
| Carlisle Cos., Inc. | | | 1,064 | | | | 279,949 | |
| Caterpillar, Inc. | | | 1,740 | | | | 411,353 | |
| CH Robinson Worldwide, Inc. | | | 2,918 | | | | 292,442 | |
| Cintas Corp. | | | 787 | | | | 363,421 | |
| Comfort Systems USA, Inc. | | | 3,150 | | | | 399,294 | |
| Copart, Inc.(a) | | | 5,833 | | | | 388,244 | |
| Covenant Logistics Group, Inc. | | | 11,317 | | | | 434,460 | |
| CSX Corp. | | | 10,174 | | | | 332,588 | |
| Deere & Co. | | | 884 | | | | 389,844 | |
| Dover Corp. | | | 2,528 | | | | 358,850 | |
| Eagle Bulk Shipping, Inc.(b) | | | 6,861 | | | | 352,998 | |
| Emerson Electric Co. | | | 3,893 | | | | 372,833 | |
| Encore Wire Corp. | | | 2,723 | | | | 397,857 | |
| Expeditors International of Washington, Inc. | | | 3,217 | | | | 373,365 | |
| Fastenal Co. | | | 6,684 | | | | 344,293 | |
| Forward Air Corp. | | | 3,272 | | | | 367,675 | |
| Genco Shipping & Trading, Ltd. | | | 22,721 | | | | 336,952 | |
| Generac Holdings, Inc.(a) | | | 1,511 | | | | 159,441 | |
| GMS, Inc.(a) | | | 7,468 | | | | 366,679 | |
| Golden Ocean Group, Ltd.(b) | | | 34,843 | | | | 294,075 | |
| Graco, Inc. | | | 4,968 | | | | 347,611 | |
| Herc Holdings, Inc. | | | 2,780 | | | | 356,313 | |
| Heritage-Crystal Clean, Inc.(a) | | | 10,296 | | | | 325,354 | |
| Hertz Global Holdings, Inc.(a)(b) | | | 16,810 | | | | 289,132 | |
| Hub Group, Inc., Class A(a) | | | 4,187 | | | | 352,336 | |
| Hubbell, Inc. | | | 1,467 | | | | 372,706 | |
| Hudson Technologies, Inc.(a) | | | 41,921 | | | | 473,288 | |
| IDEX Corp. | | | 1,548 | | | | 367,634 | |
| Insteel Industries, Inc. | | | 11,513 | | | | 339,518 | |
| JB Hunt Transport Services, Inc. | | | 1,879 | | | | 345,529 | |
| Knight-Swift Transportation Holdings, Inc. | | | 6,462 | | | | 358,189 | |
| Korn Ferry | | | 6,190 | | | | 353,016 | |
| Landstar System, Inc. | | | 2,213 | | | | 382,805 | |
| Marten Transport, Ltd. | | | 16,411 | | | | 349,718 | |
| Matson, Inc. | | | 4,453 | | | | 283,923 | |
| Mueller Industries, Inc. | | | 5,247 | | | | 360,836 | |
| Nordson Corp. | | | 1,413 | | | | 334,160 | |
| Old Dominion Freight Line, Inc. | | | 1,235 | | | | 373,723 | |
| Owens Corning | | | 3,776 | | | | 335,460 | |
| PACCAR, Inc. | | | 3,735 | | | | 395,574 | |
| Quanex Building Products Corp. | | | 16,108 | | | | 382,887 | |
| Republic Services, Inc. | | | 2,193 | | | | 305,463 | |
| Resources Connection, Inc. | | | 16,928 | | | | 326,710 | |
| Robert Half International, Inc. | | | 4,094 | | | | 322,525 | |
| Ryder System, Inc. | | | 4,212 | | | | 393,780 | |
| Saia, Inc.(a) | | | 1,632 | | | | 397,539 | |
| Schneider National, Inc., Class B | | | 14,459 | | | | 372,464 | |
11 | November 30, 2022
| Barron’s 400SM ETF | |
| Schedule of Investments | November 30, 2022 |
| Security Description | | Shares | | | Value | |
| Industrials (continued) | | | | | | |
| Simpson Manufacturing Co., Inc. | | | 3,782 | | | $ | 351,915 | |
| Snap-on, Inc. | | | 1,476 | | | | 355,126 | |
| Trex Co., Inc.(a) | | | 6,800 | | | | 312,052 | |
| Triton International, Ltd. | | | 5,346 | | | | 360,695 | |
| UFP Industries, Inc. | | | 4,359 | | | | 356,828 | |
| United Parcel Service, Inc., Class B | | | 1,664 | | | | 315,711 | |
| United Rentals, Inc.(a) | | | 1,088 | | | | 384,097 | |
| Verisk Analytics, Inc. | | | 1,728 | | | | 317,451 | |
| Waste Management, Inc. | | | 1,879 | | | | 315,146 | |
| Watsco, Inc. | | | 1,176 | | | | 316,320 | |
| Watts Water Technologies, Inc., Class A | | | 2,412 | | | | 382,181 | |
| Werner Enterprises, Inc. | | | 8,122 | | | | 357,206 | |
| WW Grainger, Inc. | | | 576 | | | | 347,363 | |
| Total Industrials | | | | | | | 23,940,126 | |
| | | | | | | | | |
| Information Technology (13.41%) | | | | | | | | |
| A10 Networks, Inc. | | | 24,169 | | | | 452,202 | |
| Adobe, Inc.(a) | | | 872 | | | | 300,779 | |
| Advanced Micro Devices, Inc.(a) | | | 4,178 | | | | 324,338 | |
| Amkor Technology, Inc. | | | 17,567 | | | | 492,227 | |
| Amphenol Corp., Class A | | | 4,329 | | | | 348,181 | |
| Analog Devices, Inc. | | | 2,168 | | | | 372,701 | |
| Apple, Inc. | | | 2,088 | | | | 309,087 | |
| Applied Materials, Inc. | | | 3,545 | | | | 388,532 | |
| Arista Networks, Inc.(a) | | | 2,680 | | | | 373,324 | |
| Automatic Data Processing, Inc. | | | 1,367 | | | | 361,079 | |
| Axcelis Technologies, Inc.(a) | | | 5,119 | | | | 408,803 | |
| Black Knight, Inc.(a) | | | 4,721 | | | | 292,655 | |
| Broadcom, Inc. | | | 638 | | | | 351,557 | |
| Cadence Design Systems, Inc.(a) | | | 1,925 | | | | 331,177 | |
| CDW Corp. | | | 1,860 | | | | 350,870 | |
| Cirrus Logic, Inc.(a) | | | 4,372 | | | | 326,632 | |
| Cisco Systems, Inc. | | | 7,291 | | | | 362,509 | |
| Clearfield, Inc.(a) | | | 3,198 | | | | 420,921 | |
| Corning, Inc. | | | 9,769 | | | | 333,416 | |
| Diodes, Inc.(a) | | | 4,770 | | | | 439,937 | |
| Enphase Energy, Inc.(a) | | | 1,050 | | | | 336,619 | |
| Entegris, Inc. | | | 3,360 | | | | 259,694 | |
| FleetCor Technologies, Inc.(a) | | | 1,516 | | | | 297,439 | |
| GLOBALFOUNDRIES, Inc.(a)(b) | | | 5,630 | | | | 362,291 | |
| Jack Henry & Associates, Inc. | | | 1,652 | | | | 312,806 | |
| Keysight Technologies, Inc.(a) | | | 1,902 | | | | 344,053 | |
| KLA Corp. | | | 941 | | | | 369,954 | |
| Lam Research Corp. | | | 763 | | | | 360,426 | |
| Lattice Semiconductor Corp.(a) | | | 6,212 | | | | 452,420 | |
| Littelfuse, Inc. | | | 1,430 | | | | 352,495 | |
| Mastercard, Inc., Class A | | | 988 | | | | 352,123 | |
| MaxLinear, Inc.(a) | | | 9,218 | | | | 337,379 | |
| Microchip Technology, Inc. | | | 5,084 | | | | 402,602 | |
| Micron Technology, Inc. | | | 5,978 | | | | 344,632 | |
| Microsoft Corp. | | | 1,274 | | | | 325,048 | |
| Monolithic Power Systems, Inc. | | | 759 | | | | 289,908 | |
| NetApp, Inc. | | | 4,504 | | | | 304,515 | |
| Security Description | | Shares | | | Value | |
| Information Technology (continued) | | | | | | |
| ON Semiconductor Corp.(a) | | | 5,013 | | | $ | 376,978 | |
| Onto Innovation, Inc.(a) | | | 4,553 | | | | 364,012 | |
| Paychex, Inc. | | | 2,632 | | | | 326,447 | |
| Paycom Software, Inc.(a) | | | 890 | | | | 301,799 | |
| Photronics, Inc.(a) | | | 20,405 | | | | 383,614 | |
| Power Integrations, Inc. | | | 4,798 | | | | 386,143 | |
| Progress Software Corp. | | | 7,083 | | | | 377,666 | |
| PTC, Inc.(a) | | | 2,743 | | | | 348,937 | |
| QUALCOMM, Inc. | | | 2,565 | | | | 324,447 | |
| Skyworks Solutions, Inc. | | | 3,283 | | | | 313,920 | |
| Synopsys, Inc.(a) | | | 994 | | | | 337,503 | |
| Teradyne, Inc. | | | 3,850 | | | | 359,783 | |
| Texas Instruments, Inc. | | | 1,995 | | | | 360,018 | |
| Verra Mobility Corp.(a) | | | 19,623 | | | | 311,025 | |
| Visa, Inc., Class A, Class A | | | 1,606 | | | | 348,502 | |
| Zoom Video Communications, Inc., Class A(a) | | | 4,061 | | | | 306,321 | |
| Total Information Technology | | | | | | | 18,672,446 | |
| | | | | | | | | |
| Materials (8.38%) | | | | | | | | |
| AdvanSix, Inc. | | | 9,180 | | | | 377,849 | |
| Air Products and Chemicals, Inc. | | | 1,256 | | | | 389,561 | |
| Alcoa Corp. | | | 6,401 | | | | 320,882 | |
| Alpha Metallurgical Resources, Inc. | | | 2,348 | | | | 402,048 | |
| Avery Dennison Corp. | | | 1,738 | | | | 336,008 | |
| Celanese Corp. | | | 2,935 | | | | 314,926 | |
| CF Industries Holdings, Inc. | | | 3,199 | | | | 346,100 | |
| Chemours Co. | | | 9,215 | | | | 286,126 | |
| Cliffs Natural Resources, Inc.(a)(b) | | | 19,088 | | | | 295,482 | |
| Commercial Metals Co. | | | 8,052 | | | | 396,319 | |
| Dow Chemical Co. | | | 6,691 | | | | 341,040 | |
| Eagle Materials, Inc. | | | 2,749 | | | | 374,799 | |
| Eastman Chemical Co. | | | 3,810 | | | | 330,022 | |
| Freeport-McMoRan, Inc. | | | 10,318 | | | | 410,656 | |
| Huntsman Corp. | | | 12,194 | | | | 338,749 | |
| International Paper Co. | | | 7,910 | | | | 293,619 | |
| Intrepid Potash, Inc.(a) | | | 7,411 | | | | 267,167 | |
| Louisiana-Pacific Corp. | | | 6,043 | | | | 385,543 | |
| Martin Marietta Materials, Inc. | | | 946 | | | | 346,690 | |
| Mosaic Co. | | | 6,112 | | | | 313,546 | |
| MP Materials Corp.(a)(b) | | | 9,891 | | | | 328,876 | |
| Myers Industries, Inc. | | | 17,721 | | | | 413,608 | |
| Nucor Corp.(b) | | | 2,366 | | | | 354,782 | |
| Olin Corp. | | | 6,245 | | | | 355,840 | |
| Olympic Steel, Inc. | | | 12,291 | | | | 431,291 | |
| Packaging Corp. of America | | | 2,335 | | | | 317,303 | |
| Reliance Steel & Aluminum Co. | | | 1,711 | | | | 361,517 | |
| Ryerson Holding Corp. | | | 11,259 | | | | 332,028 | |
| Steel Dynamics, Inc. | | | 3,914 | | | | 406,782 | |
| TimkenSteel Corp.(a) | | | 19,648 | | | | 367,418 | |
| United States Steel Corp. | | | 14,393 | | | | 378,392 | |
| Warrior Met Coal, Inc. | | | 10,676 | | | | 393,090 | |
| Westlake Corp. | | | 3,408 | | | | 366,871 | |
| Total Materials | | | | | | | 11,674,930 | |
12 | November 30, 2022
| Barron’s 400SM ETF | |
| Schedule of Investments | November 30, 2022 |
| Security Description | | Shares | | | Value | |
| Real Estate (0.47%) | | | | | | |
| CBRE Group, Inc., Class A(a) | | | 4,094 | | | $ | 325,882 | |
| Marcus & Millichap, Inc. | | | 8,671 | | | | 322,908 | |
| Total Real Estate | | | | | | | 648,790 | |
| | | | | | | | | |
| Utilities (0.83%) | | | | | | | | |
| Brookfield Renewable Corp. | | | 8,081 | | | | 263,521 | |
| National Fuel Gas Co. | | | 4,620 | | | | 305,983 | |
| Otter Tail Corp. | | | 4,380 | | | | 261,179 | |
| UGI Corp. | | | 8,321 | | | | 321,607 | |
| Total Utilities | | | | | | | 1,152,290 | |
| | | | | | | | | |
| TOTAL COMMON STOCKS | | | | | | | | |
| (Cost $120,888,734) | | | | | | | 135,474,742 | |
| Security Description | | Shares | | | Value | |
| LIMITED PARTNERSHIPS (2.13%) | | | | | | |
| Energy (1.67%) | | | | | | | | |
| Black Stone Minerals LP | | | 20,011 | | | | 375,206 | |
| Dorchester Minerals LP | | | 11,295 | | | | 341,674 | |
| Enterprise Products Partners LP | | | 12,094 | | | | 300,052 | |
| Kimbell Royalty Partners LP | | | 18,550 | | | | 320,359 | |
| Magellan Midstream Partners LP | | | 6,288 | | | | 331,378 | |
| MPLX LP | | | 9,772 | | | | 332,150 | |
| Western Midstream Partners LP | | | 11,601 | | | | 324,596 | |
| Total Energy | | | | | | | 2,325,415 | |
| | | | | | | | | |
| Materials (0.23%) | | | | | | | | |
| CVR Partners LP | | | 2,447 | | | | 314,195 | |
| | | | | | | | | |
| Utilities (0.22%) | | | | | | | | |
| Suburban Propane Partners LP | | | 19,081 | | | | 314,073 | |
| | | | | | | | | |
| TOTAL LIMITED PARTNERSHIPS | | | | | | | | |
| (Cost $2,737,810) | | | | | | | 2,953,683 | |
| | | 7 Day Yield | | | Shares | | | Value | |
| SHORT TERM INVESTMENTS (1.81%) | | | | | | | | | |
| Money Market Fund (0.46%) | | | | | | | | | |
| State Street Institutional Treasury Plus Money Market Fund (Premier Class) | | | | | | | | | |
| (Cost $646,709) | | | 3.69 | % | | | 646,709 | | | $ | 646,709 | |
| | | | | | | | | | | | | |
| Investments Purchased with Collateral from Securities Loaned (1.35%) | | | | | | | | | | | | |
| State Street Navigator Securities Lending Government Money Market Portfolio, 3.86% | | | | | | | | | | | | |
| (Cost $1,877,149) | | | | | | | 1,877,149 | | | | 1,877,149 | |
| TOTAL SHORT TERM INVESTMENTS | | | | | | | | | | | | |
| (Cost $2,523,858) | | | | | | | | | | | 2,523,858 | |
| | | | | | | | | | | | | |
| TOTAL INVESTMENTS (101.22%) | | | | | | | | | | | | |
| (Cost $126,150,402) | | | | | | | | | | $ | 140,952,283 | |
| LIABILITIES IN EXCESS OF OTHER ASSETS (-1.22%) | | | | | | | | | | | (1,704,687 | ) |
| NET ASSETS - 100.00% | | | | | | | | | | $ | 139,247,596 | |
| (a) | Non-income producing security. |
| (b) | Security, or a portion of the security position is currently on loan. The total market value of securities on loan is $4,395,851. |
See Notes to Financial Statements.
13 | November 30, 2022
| Barron’s 400SM ETF | |
| Statement of Assets and Liabilities | November 30, 2022 |
| ASSETS: | | | |
| Investments, at value* | | $ | 140,952,283 | |
| Dividends receivable | | | 243,665 | |
| Total Assets | | | 141,195,948 | |
| | | | | |
| LIABILITIES: | | | | |
| Payable to adviser | | | 71,203 | |
| Payable for collateral upon return of securities loaned | | | 1,877,149 | |
| Total Liabilities | | | 1,948,352 | |
| NET ASSETS | | $ | 139,247,596 | |
| | | | | |
| NET ASSETS CONSIST OF: | | | | |
| Paid-in capital | | $ | 175,223,529 | |
| Total distributable earnings/(accumulated losses) | | | (35,975,933 | ) |
| NET ASSETS | | $ | 139,247,596 | |
| | | | | |
| INVESTMENTS, AT COST | | $ | 126,150,402 | |
| | | | | |
| PRICING OF SHARES | | | | |
| Net Assets | | $ | 139,247,596 | |
| Shares of beneficial interest outstanding (Unlimited number of shares authorized, par value $0.01 per share) | | | 2,400,000 | |
| Net Asset Value, offering and redemption price per share | | $ | 58.02 | |
| * | Includes $4,395,851 of securities on loan. |
See Notes to Financial Statements.
14 | November 30, 2022
| Barron’s 400SM ETF | |
| Statement of Operations | For the Year Ended November 30, 2022 |
| INVESTMENT INCOME: | | | |
| Dividends* | | $ | 2,692,048 | |
| Securities Lending Income | | | 14,940 | |
| Total Investment Income | | | 2,706,988 | |
| | | | | |
| EXPENSES: | | | | |
| Investment adviser fees | | | 893,164 | |
| Net Expenses | | | 893,164 | |
| NET INVESTMENT INCOME | | | 1,813,824 | |
| | | | | |
| REALIZED AND UNREALIZED GAIN/(LOSS): | | | | |
| Net realized gain on investments(a) | | | 4,441,694 | |
| Net change in unrealized appreciation/(depreciation) on investments | | | (15,691,208 | ) |
| NET REALIZED AND UNREALIZED LOSS ON INVESTMENTS | | | (11,249,514 | ) |
| NET DECREASE IN NET ASSETS RESULTING FROM OPERATIONS | | $ | (9,435,690 | ) |
| * | | Net of foreign tax withholding of $3,402. |
| (a) | Includes realized gain or loss as a result of in-kind transactions (See Note 4 in Notes to Financial Statements). |
See Notes to Financial Statements.
15 | November 30, 2022
| Barron’s 400SM ETF | |
| Statements of Changes in Net Assets | |
| | | For the Year Ended November 30, 2022 | | | For the Year Ended November 30, 2021 | |
| OPERATIONS: | | | | | | |
| Net investment income | | $ | 1,813,824 | | | $ | 1,264,631 | |
| Net realized gain | | | 4,441,694 | | | | 35,081,287 | |
| Net change in unrealized appreciation/(depreciation) | | | (15,691,208 | ) | | | 2,133,972 | |
| Net increase/(decrease) in net assets resulting from operations | | | (9,435,690 | ) | | | 38,479,890 | |
| | | | | | | | | |
| DISTRIBUTIONS TO SHAREHOLDERS: | | | | | | | | |
| From distributable earnings | | | (1,433,725 | ) | | | (1,258,708 | ) |
| Total distributions | | | (1,433,725 | ) | | | (1,258,708 | ) |
| | | | | | | | | |
| CAPITAL SHARE TRANSACTIONS: | | | | | | | | |
| Proceeds from sale of shares | | | 1,408,837 | | | | 94,843,165 | |
| Cost of shares redeemed | | | (7,260,095 | ) | | | (94,389,197 | ) |
| Net increase/(decrease) from capital share transactions | | | (5,851,258 | ) | | | 453,968 | |
| Net increase/(decrease) in net assets | | | (16,720,673 | ) | | | 37,675,150 | |
| | | | | | | | | |
| NET ASSETS: | | | | | | | | |
| Beginning of year | | | 155,968,269 | | | | 118,293,119 | |
| End of year | | $ | 139,247,596 | | | $ | 155,968,269 | |
| | | | | | | | | |
| OTHER INFORMATION: | | | | | | | | |
| CAPITAL SHARE TRANSACTIONS: | | | | | | | | |
| Beginning shares | | | 2,500,000 | | | | 2,500,000 | |
| Shares sold | | | 25,000 | | | | 1,650,000 | |
| Shares redeemed | | | (125,000 | ) | | | (1,650,000 | ) |
| Shares outstanding, end of year | | | 2,400,000 | | | | 2,500,000 | |
See Notes to Financial Statements.
16 | November 30, 2022
| Barron’s 400SM ETF | |
| Financial Highlights | For a Share Outstanding Throughout the Periods Presented |
| | | For the Year Ended November 30, 2022 | | | For the Year Ended November 30, 2021 | | | For the Year Ended November 30, 2020 | | | For the Year Ended November 30, 2019 | | | For the Year Ended November 30, 2018 | |
| NET ASSET VALUE, BEGINNING OF PERIOD | | $ | 62.39 | | | $ | 47.32 | | | $ | 42.04 | | | $ | 40.42 | | | $ | 41.54 | |
| | | | | | | | | | | | | | | | | | | | | |
| INCOME FROM OPERATIONS: | | | | | | | | | | | | | | | | | | | | |
| Net investment income(a) | | | 0.75 | | | | 0.52 | | | | 0.43 | | | | 0.44 | | | | 0.40 | |
| Net realized and unrealized gain/(loss) | | | (4.55 | ) | | | 15.05 | | | | 5.14 | | | | 1.51 | | | | (1.27 | ) |
| Total from investment operations | | | (3.80 | ) | | | 15.57 | | | | 5.57 | | | | 1.95 | | | | (0.87 | ) |
| | | | | | | | | | | | | | | | | | | | | |
| DISTRIBUTIONS: | | | | | | | | | | | | | | | | | | | | |
| From net investment income | | | (0.57 | ) | | | (0.50 | ) | | | (0.29 | ) | | | (0.33 | ) | | | (0.25 | ) |
| Total distributions | | | (0.57 | ) | | | (0.50 | ) | | | (0.29 | ) | | | (0.33 | ) | | | (0.25 | ) |
| | | | | | | | | | | | | | | | | | | | | |
| NET INCREASE/(DECREASE) IN NET ASSET VALUE | | | (4.37 | ) | | | 15.07 | | | | 5.28 | | | | 1.62 | | | | (1.12 | ) |
| NET ASSET VALUE, END OF PERIOD | | $ | 58.02 | | | $ | 62.39 | | | $ | 47.32 | | | $ | 42.04 | | | $ | 40.42 | |
| TOTAL RETURN(b) | | | (6.18 | )% | | | 33.18 | % | | | 13.33 | % | | | 5.00 | % | | | (2.12 | )% |
| | | | | | | | | | | | | | | | | | | | | |
| RATIOS/SUPPLEMENTAL DATA: | | | | | | | | | | | | | | | | | | | | |
| Net assets, end of year (in 000s) | | $ | 139,248 | | | $ | 155,968 | | | $ | 118,293 | | | $ | 147,150 | | | $ | 163,708 | |
| | | | | | | | | | | | | | | | | | | | | |
| Ratio of expenses to average net assets | | | 0.65 | % | | | 0.65 | % | | | 0.65 | % | | | 0.65 | % | | | 0.65 | % |
| Ratio of net investment income to average net assets | | | 1.32 | % | | | 0.90 | % | | | 1.08 | % | | | 1.10 | % | | | 0.93 | % |
| Portfolio turnover rate(c) | | | 94 | % | | | 91 | % | | | 83 | % | | | 109 | % | | | 88 | % |
| (a) | Based on average shares outstanding during the period. |
| (b) | Total return is calculated assuming an initial investment made at the net asset value at the beginning of the year and redemption at the net asset value on the last day of the year and assuming all distributions are reinvested at the reinvestment prices. Total return calculated for a period of less than one year is not annualized. |
| (c) | Portfolio turnover for periods less than one year are not annualized and does not include securities received or delivered from processing creations or redemptions in-kind. |
See Notes to Financial Statements.
17 | November 30, 2022
| Barron’s 400SM ETF | |
| Notes to Financial Statements | November 30, 2022 |
1. ORGANIZATION
ALPS ETF Trust (the “Trust”), a Delaware statutory trust, is an open-end management investment company registered under the Investment Company Act of 1940, as amended (the “1940 Act”). As of November 30, 2022, the Trust consisted of twenty-three separate portfolios. Each portfolio represents a separate series of the Trust. This report pertains solely to the Barron’s 400SM ETF (the “Fund”). The investment objective of the Fund is to seek investment results that correspond generally, before fees and expenses, to the performance of the Barron’s 400 IndexSM (the “Underlying Index”). The Fund has elected to qualify as a diversified series of the Trust under the 1940 Act.
The Fund’s Shares (“Shares”) are listed on the NYSE Arca, Inc. (the “NYSE Arca”). The Fund issues and redeems Shares, at net asset value (“NAV”) in blocks of 25,000 Shares, each of which is called a “Creation Unit”. Creation Units are issued and redeemed principally in-kind for securities included in the Underlying Index. Except when aggregated in Creation Units, Shares are not redeemable securities of the Fund.
Pursuant to the Trust’s organizational documents, its Officers and Trustees are indemnified against certain liability arising out of the performance of their duties to the Trust. Additionally, in the normal course of business, the Trust enters into contracts with service providers that contain general indemnification clauses. The Trust’s maximum exposure under these arrangements is unknown, as this would involve future claims that may be made against the Trust that have not yet occurred.
2. SIGNIFICANT ACCOUNTING POLICIES
The following is a summary of significant accounting policies consistently followed by the Fund in the preparation of the financial statements. The accompanying financial statements were prepared in accordance with accounting principles generally accepted in the United States of America (“U.S. GAAP”). The preparation of financial statements in conformity with U.S. GAAP requires management to make certain estimates and assumptions that affect the reported amounts of assets and liabilities and disclosures of contingent assets and liabilities at the date of the financial statements and the reported amounts of revenue and expenses during the period. Actual results could differ from those estimates. The Fund is considered an investment company under U.S. GAAP and follows the accounting and reporting guidance applicable to investment companies in the Financial Accounting Standards Board (“FASB”) Accounting Standards Codification Topic 946.
A. Portfolio Valuation
The Fund’s NAV is determined daily, as of the close of regular trading on the New York Stock Exchange (the “NYSE”), normally 4:00 p.m. Eastern time, on each day the NYSE is open for trading. The NAV is computed by dividing the value of all assets of the Fund (including accrued interest and dividends), less all liabilities (including accrued expenses and dividends declared but unpaid), by the total number of shares outstanding.
Portfolio securities listed on any exchange other than the NASDAQ Stock Market LLC (“NASDAQ”) are valued at the last sale price on the business day as of which such value is being determined. If there has been no sale on such day, the securities are valued at the mean of the most recent bid and ask prices on such day. Securities traded on the NASDAQ are valued at the NASDAQ Official Closing Price as determined by NASDAQ. Portfolio securities traded on more than one securities exchange are valued at the last sale price on the business day as of which such value is being determined at the close of the exchange representing the principal market for such securities. Portfolio securities traded in the over-the-counter market, but excluding securities traded on the NASDAQ, are valued at the last quoted sale price in such market.
The Fund’s investments are valued at market value or, in the absence of market value with respect to any portfolio securities, at fair value according to procedures adopted by the Trust’s Board of Trustees (the “Board”). Pursuant to Rule 2a-5 under the 1940 Act, the Board designated ALPS Advisors, Inc. (the "Adviser") as the valuation designee ("Valuation Designee") for the Fund to perform the fair value determinations relating to Fund investments. The Adviser may carry out its designated responsibilities as Valuation Designee through various teams and committees. When market quotations are not readily available or when events occur that make established valuation methods unreliable, securities of the Fund may be valued in good faith by the Valuation Designee. These securities generally include, but are not limited to, restricted securities (securities which may not be publicly sold without registration under the Securities Act of 1933) for which a pricing service is unable to provide a market price; securities whose trading has been formally suspended; a security whose market price is not available from a pre-established primary pricing source or the pricing source is not willing to provide a price; a security with respect to which an event has occurred that is most likely to materially affect the value of the security after the market has closed but before the calculation of the Fund’s NAV or make it difficult or impossible to obtain a reliable market quotation; or a security whose price, as provided by the pricing service, does not reflect the security’s “fair value” due to the security being de-listed from a national exchange or the security’s primary trading market is temporarily closed at a time when, under normal conditions, it would be open. As a general principle, the current “fair value” of a security would be the amount which the owner might reasonably expect to receive from the sale on the applicable exchange or principal market. A variety of factors may be considered in determining the fair value of such securities.
18 | November 30, 2022
| Barron’s 400SM ETF | |
| Notes to Financial Statements | November 30, 2022 |
B. Fair Value Measurements
The Fund discloses the classification of its fair value measurements following a three-tier hierarchy based on the inputs used to measure fair value. Inputs refer broadly to the assumptions that market participants would use in pricing the asset or liability; including assumptions about risk. Inputs may be observable or unobservable. Observable inputs reflect the assumptions market participants would use in pricing the asset or liability that are developed based on market data obtained from sources independent of the reporting entity. Unobservable inputs reflect the reporting entity’s own assumptions about the assumptions market participants would use in pricing the asset or liability that are developed based on the best information available.
Valuation techniques used to value the Fund's investments by major category are as follows:
Equity securities and Limited Partnerships, including restricted securities, for which market quotations are readily available, are valued at the last reported sale price or official closing price as reported by a third party pricing vendor on the primary market or exchange on which they are traded and are categorized as Level 1 in the hierarchy. In the event there were no sales during the day or closing prices are not available, securities are valued at the mean of the most recent quoted bid and ask prices on such day and are generally categorized as Level 2 in the hierarchy. Investments in open-end mutual funds are valued at their closing NAV each business day and are categorized as Level 1 in the hierarchy.
Changes in valuation techniques may result in transfers in or out of an assigned level within the disclosure hierarchy.
Various inputs are used in determining the value of the Fund’s investments as of the end of the reporting period. When inputs used fall into different levels of the fair value hierarchy, the level in the hierarchy within which the fair value measurement falls is determined based on the lowest level input that is significant to the fair value measurement in its entirety. The designated input levels are not necessarily an indication of the risk or liquidity associated with these investments.
These inputs are categorized in the following hierarchy under applicable financial accounting standards:
| Level 1 – | | Unadjusted quoted prices in active markets for identical investments, unrestricted assets or liabilities that a Fund has the ability to access at the measurement date; |
| Level 2 – | | Quoted prices which are not active, quoted prices for similar assets or liabilities in active markets or inputs other than quoted prices that are observable (either directly or indirectly) for substantially the full term of the asset or liability; and |
| Level 3 – | | Significant unobservable prices or inputs (including the Fund’s own assumptions in determining the fair value of investments) where there is little or no market activity for the asset or liability at the measurement date. |
The following is a summary of the inputs used to value the Fund’s investments as of November 30, 2022:
| Barron's 400 SM ETF | | | | | | | | | | | | |
| Investments in Securities at Value | | Level 1 - Quoted and Unadjusted Prices | | | Level 2 - Other Significant Observable Inputs | | | Level 3 - Significant Unobservable Inputs | | | Total | |
| Common Stocks* | | $ | 135,474,742 | | | $ | – | | | $ | – | | | $ | 135,474,742 | |
| Limited Partnerships* | | | 2,953,683 | | | | – | | | | – | | | | 2,953,683 | |
| Short Term Investments | | | 2,523,858 | | | | – | | | | – | | | | 2,523,858 | |
| Total | | $ | 140,952,283 | | | $ | – | | | $ | – | | | $ | 140,952,283 | |
| * | | For a detailed sector breakdown, see the accompanying Schedule of Investments. |
The Fund did not have any securities that used significant unobservable inputs (Level 3) in determining fair value and there were no transfers into or out of Level 3 during the year ended November 30, 2022.
C. Securities Transactions and Investment Income
Securities transactions are recorded as of the trade date. Realized gains and losses from securities transactions are recorded on the specific identification in accordance with GAAP. Dividend income and capital gains distributions, if any, are recorded on the ex-dividend date. Interest income, if any, is recorded on the accrual basis.
19 | November 30, 2022
| Barron’s 400SM ETF | |
| Notes to Financial Statements | November 30, 2022 |
D. Dividends and Distributions to Shareholders
Dividends from net investment income of the Fund, if any, are declared and paid annually or as the Board may determine from time to time. Distributions of net realized capital gains earned by the Fund, if any, are distributed at least annually.
E. Federal Tax and Tax Basis Information
The timing and character of income and capital gain distributions are determined in accordance with income tax regulations, which may differ from U.S. GAAP. Reclassifications are made to the Fund’s capital accounts for permanent tax differences to reflect income and gains available for distribution (or available capital loss carryforwards) under income tax regulations.
For the year ended November 30, 2022, the following reclassifications, which had no impact on results of operations or net assets, were recorded to reflect permanent tax differences resulting primarily from in-kind transactions:
| Fund | | Paid-in Capital | | | Total Distributable Earnings/ (Accumulated Losses) | |
| Barron’s 400 SM ETF | | $ | 1,166,701 | | | $ | (1,166,701 | ) |
The tax character of the distributions paid during the fiscal years ended November 30, 2022 and November 30, 2021 was as follows:
| Fund | | Ordinary Income | | | Long-Term Capital Gain | | | Return of Capital | |
| November 30, 2022 | | | | | | | | | |
| Barron’s 400 SM ETF | | $ | 1,433,725 | | | $ | – | | | $ | – | |
| | | Ordinary Income | | | Long-Term Capital Gain | | | Return of Capital | |
| November 30, 2021 | | | | | | | | | |
| Barron’s 400 SM ETF | | $ | 1,258,708 | | | $ | – | | | $ | – | |
The character of distributions made during the year may differ from its ultimate characterization for federal income tax purposes.
Under current law, capital losses maintain their character as short-term or long-term and are carried forward to the next tax year without expiration. As of November 30, 2022, the following amounts are available as carry forwards to the next tax year:
| Fund | | Short-Term | | | Long-Term | |
| Barron’s 400 SM ETF | | $ | 43,473,433 | | | $ | 8,875,623 | |
During the year ended November 30, 2022, the Fund used capital loss carryovers in the amount of $3,312,792.
As of November 30, 2022, the components of distributable earnings/(accumulated losses) on a tax basis were as follows:
| Fund | | Accumulated Net Investment Income | | | Accumulated Net Realized Gain/(Loss) on Investments | | | Other Accumulated Gains | | | Net Unrealized Appreciation/(Depreciation) on Investments | | | Total | |
| Barron's 400 SM ETF | | $ | 1,569,830 | | | $ | (52,349,056 | ) | | $ | – | | | $ | 14,803,293 | | | $ | (35,975,933 | ) |
As of November 30, 2022, the cost of investments for federal income tax purposes and accumulated net unrealized appreciation/(depreciation) on investments were as follows:
| | | Barron’s 400SM ETF | |
| Gross appreciation (excess of value over tax cost) | | $ | 21,162,212 | |
| Gross depreciation (excess of tax cost over value) | | | (6,358,919 | ) |
| Net unrealized appreciation/(depreciation) | | $ | 14,803,293 | |
| Cost of investments for income tax purposes | | $ | 126,148,990 | |
20 | November 30, 2022
| Barron’s 400SM ETF | |
| Notes to Financial Statements | November 30, 2022 |
The differences between book-basis and tax-basis are primarily due to the deferral of losses from wash sales and investments in partnerships and grantor trusts.
F. Income Taxes
No provision for income taxes is included in the accompanying financial statements, as the Fund intends to distribute to shareholders all taxable investment income and realized gains and otherwise comply with Subchapter M of the Internal Revenue Code of 1986, as amended, applicable to regulated investment companies. The Fund evaluates tax positions taken (or expected to be taken) in the course of preparing the Fund’s tax returns to determine whether these positions meet a “more-likely-than-not” standard that, based on the technical merits, have a more than fifty percent likelihood of being sustained by a taxing authority upon examination. A tax position that meets the “more-likely-than-not” recognition threshold is measured to determine the amount of benefit to recognize in the financial statements.
As of and during the year ended November 30, 2022, the Fund did not have a liability for any unrecognized tax benefits. The Fund files U.S. federal, state, and local tax returns as required. The Fund’s tax returns are subject to examination by the relevant tax authorities until expiration of the applicable statute of limitations, which is generally three years after the filing of the tax return, but may extend to four years in certain jurisdictions. Tax returns for open years have incorporated no uncertain tax positions that require a provision for income taxes.
G. Lending of Portfolio Securities
The Fund has entered into a securities lending agreement with State Street Bank & Trust Co. (“SSB”), the Fund’s lending agent. The Fund may lend its portfolio securities only to borrowers that are approved by SSB. The Fund will limit such lending to not more than 33 1/3% of the value of its total assets. The Fund’s securities held at SSB as custodian shall be available to be lent except those securities the Fund or ALPS Advisors, Inc. specifically identifies in writing as not being available for lending. The borrower pledges and maintains with the Fund collateral consisting of cash (U.S. Dollars only), securities issued or guaranteed by the U.S. government or its agencies or instrumentalities, and cash equivalents (including irrevocable bank letters of credit) issued by a person other than the borrower or an affiliate of the borrower. The initial collateral received by the Fund is required to have a value of no less than 102% of the market value of the loaned securities for U.S equity securities and a value of no less than 105% of the market value for non-U.S. equity securities. The collateral is maintained thereafter, at a market value equal to not less than 102% of the current value of the U.S. equity securities on loan and not less than 105% of the current value of the non-U.S. equity securities on loan. The market value of the loaned securities is determined at the close of each business day and any additional required collateral is delivered to the Fund on the next business day. During the term of the loan, the Fund is entitled to all distributions made on or in respect of the loaned securities. Loans of securities are terminable at any time and the borrower, after notice, is required to return borrowed securities within the customary time period for settlement of securities transactions.
Any cash collateral received is reinvested in a money market fund managed by SSB as disclosed in the Fund’s Schedule of Investments and is reflected in the Statement of Assets and Liabilities as a payable for collateral upon return of securities loaned. Non-cash collateral, in the form of securities issued or guaranteed by the U.S. government or its agencies or instrumentalities, is not disclosed in the Fund’s Statement of Assets and Liabilities as it is held by the lending agent on behalf of the Fund, and the Fund does not have the ability to re-hypothecate these securities. Income earned by the Fund from securities lending activity is disclosed in the Statement of Operations.
The following is a summary of the Fund's securities lending agreement and related cash and non-cash collateral received as of November 30, 2022:
| | | Market Value of Securities on Loan | | | Cash Collateral Received | | | Non-Cash Collateral Received | | | Total Collateral Received | |
| Barron's 400 SM ETF | | $ | 4,395,851 | | | $ | 1,877,149 | | | $ | 2,523,490 | | | $ | 4,400,639 | |
The risks of securities lending include the risk that the borrower may not provide additional collateral when required or may not return the securities when due. To mitigate these risks, the Fund benefits from a borrower default indemnity provided by SSB. SSB’s indemnity allows for full replacement of securities lent wherein SSB will purchase the unreturned loaned securities on the open market by applying the proceeds of the collateral, or to the extent such proceeds are insufficient or the collateral is unavailable, SSB will purchase the unreturned loan securities at SSB’s expense. However, the Fund could suffer a loss if the value of the investments purchased with cash collateral falls below the value of the cash collateral received.
21 | November 30, 2022
| Barron’s 400SM ETF | |
| Notes to Financial Statements | November 30, 2022 |
The following table reflects a breakdown of transactions accounted for as secured borrowings, the gross obligation by the type of collateral pledged or securities loaned, and the remaining contractual maturity of those transactions as of November 30, 2022:
| Barron's 400 SM ETF | | | | | Remaining contractual maturity of the agreements | | | |
| | | | | | | | | |
| Securities Lending Transactions | | Overnight & Continuous | | | Up to 30 Days | | 30-90 Days | | | Greater than 90 Days | | | Total | |
| Common Stocks | | $ | 1,877,149 | | | $– | | $ | – | | | $ | – | | | $ | 1,877,149 | |
| Total Borrowings | | | | | | | | | | | | | | | | | 1,877,149 | |
| Gross amount of recognized liabilities for securities lending (collateral received) | | | | | | | | | | | | | | | | $ | 1,877,149 | |
3. INVESTMENT ADVISORY FEE AND OTHER AFFILIATED TRANSACTIONS
ALPS Advisors, Inc. serves as the Fund’s investment adviser pursuant to an Investment Advisory Agreement with the Trust on behalf of the Fund (the “Advisory Agreement”). Pursuant to the Advisory Agreement, the Fund pays the Adviser an annual management fee for the services and facilities it provides, payable on a monthly basis at the annual rate of 0.65% of the Fund’s average daily net assets. From time to time, the Adviser may waive all or a portion of its fee.
Out of the unitary management fees, the Adviser pays substantially all expenses of the Fund, including the cost of transfer agency, custody, fund administration, legal, audit, trustees and other services, except for interest expenses, distribution fees or expenses, brokerage expenses, taxes and extraordinary expenses not incurred in the ordinary course of the Fund's business. The Adviser’s unitary management fee is designed to pay substantially all of the Fund’s expenses and to compensate the Adviser for providing services to the Fund.
ALPS Fund Services, Inc., an affiliate of the Adviser, is the administrator of the Fund.
Effective February 16, 2022, each Trustee receives (1) a quarterly retainer of $20,000, (2) a per meeting fee of $10,000, (3) $2,500 for any special meeting held outside of a regularly scheduled board meeting, and (4) reimbursement for all reasonable out-of-pocket expenses relating to attendance at meetings. In addition, the Chairman of the Board receives a quarterly retainer of $5,000, the Chairman of the Audit Committee receives a quarterly retainer of $3,000, and the Chairman of the Nominating & Governance Committee receives a quarterly retainer of $2,000, each in connection with their respective roles. Prior to February 16, 2022, each Trustee received (1) a quarterly retainer of $10,000, (2) a per meeting fee of $5,000, (3) $1,500 for any special meeting held outside of a regularly scheduled board meeting, and (4) reimbursement for all reasonable out-of-pocket expenses relating to attendance at meetings. In addition, the Chairman of the Board and Chairman of the Audit Committee each received a quarterly retainer of $2,000, in connection with their respective roles.
4. PURCHASES AND SALES OF SECURITIES
For the year ended November 30, 2022 the cost of purchases and proceeds from sales of investment securities, excluding in-kind transactions and short-term investments, were as follows:
| Fund | | Purchases | | | Sales | |
| Barron's 400 SM ETF | | $ | 127,933,150 | | | $ | 127,790,167 | |
For the year ended November 30, 2022, the cost of in-kind purchases and proceeds from in-kind sales were as follows:
| Fund | | Purchases | | | Sales | |
| Barron's 400 SM ETF | | $ | 1,410,856 | | | $ | 7,257,626 | |
For the year ended November 30, 2022 the Fund had in-kind net realized gains of $1,180,917.
Gains on in-kind transactions are not considered taxable for federal income tax purposes and losses on in-kind transactions are also not deductible for tax purposes.
22 | November 30, 2022
| Barron’s 400SM ETF | |
| Notes to Financial Statements | November 30, 2022 |
5. CAPITAL SHARE TRANSACTIONS
Shares are created and redeemed by the Fund only in Creation Unit size aggregations of 25,000 Shares. Only broker-dealers or large institutional investors with creation and redemption agreements called Authorized Participants (“AP”) are permitted to purchase or redeem Creation Units from the Fund. Such transactions are generally permitted on an in-kind basis, with a balancing cash component to equate the transaction to the NAV per unit of the Fund on the transaction date. Cash may be substituted equivalent to the value of certain securities generally when they are not available in sufficient quantity for delivery, not eligible for trading by the AP or as a result of other market circumstances.
6. RELATED PARTY TRANSACTIONS
The Fund engaged in cross trades between other funds in the Trust during the year ended November 30, 2022 pursuant to Rule 17a-7 under the 1940 Act. Cross trading is the buying or selling of portfolio securities between funds to which the Adviser serves as the investment adviser. The Board previously adopted procedures that apply to transactions between the Funds of the Trust pursuant to Rule 17a-7. These transactions related to cross trades during the period complied with the requirements set forth by Rule 17a-7 and the Trust’s procedures.
Transactions related to cross trades during the year ended November 30, 2022, were as follows:
| Fund | | Purchase Cost Paid | | | Sale Proceeds Received | | | Realized Gain/(Loss) on Sales | |
| Barron's 400 SM ETF | | $ | 4,037,990 | | | $ | 2,874,105 | | | $ | (207,521 | ) |
7. MARKET RISK
The Fund is subject to investment and operational risks associated with financial, economic and other global market developments and disruptions, including the recent spread of an infectious respiratory illness caused by a novel strain of coronavirus (known as COVID-19), which can negatively impact the securities markets and cause the Fund to lose value. Securities in the Fund’s portfolio may underperform in comparison to securities in general financial markets, a particular financial market or other asset classes due to a number of factors, including inflation (or expectations for inflation), deflation (or expectations for deflation), interest rates, global demand for particular products or resources, market instability, debt crises and downgrades, embargoes, tariffs, sanctions and other trade barriers, regulatory events, other governmental trade or market control programs and related geopolitical events. In addition, the value of the Fund’s investments may be negatively affected by the occurrence of global events such as war, terrorism, environmental disasters, natural disasters or events, country instability, and infectious disease epidemics or pandemics.
The spread of COVID-19 has caused volatility, severe market dislocations and liquidity constraints in many markets, including markets for the securities the Fund holds, and may adversely affect the Fund’s investments and operations. The transmission of COVID-19 and efforts to contain its spread have resulted in travel restrictions and disruptions, closed international borders, enhanced health screenings at ports of entry and elsewhere, disruption of and delays in healthcare service preparation and delivery, quarantines, event and service cancellations or interruptions, disruptions to business operations and supply chains, and a reduction in consumer and business spending, as well as general concern and uncertainty that has negatively affected the economy. These disruptions have led to instability in the market place and the jobs market. The impact of COVID-19 could adversely affect the economies of many nations or the entire global economy, the financial well-being and performance of individual issuers, borrowers and sectors and the health of the markets generally in potentially significant and unforeseen ways.
The foregoing could lead to a significant economic downturn or recession, increased market volatility, a greater number of market closures, higher default rates and adverse effects on the values and liquidity of the Fund’s securities or other assets. Such impacts may adversely affect the performance of the Fund.
8. SUBSEQUENT EVENTS
Subsequent events, if any, after the date of the Statements of Assets and Liabilities have been evaluated through the date the financial statements were issued. Management has determined that there were no subsequent events to report through the issuance of these financial statements.
23 | November 30, 2022
| Barron’s 400SM ETF | |
| Additional Information | November 30, 2022 (Unaudited) |
PROXY VOTING RECORDS, POLICIES AND PROCEDURES
Information regarding how the Fund voted proxies relating to portfolio securities during the most recent 12-month period ended June 30 and a description of the Fund’s proxy voting policies and procedures used in determining how to vote for proxies are available without charge on the SEC’s website at www.sec.gov and upon request, by calling (toll-free) 1-866-759-5679.
PORTFOLIO HOLDINGS
The Fund files a complete schedule of portfolio holdings with the U.S. Securities and Exchange Commission (“SEC”) for the first and third quarters of each fiscal year on Form N-PORT within 60 days after the end of the period. Copies of the Fund’s Form N-PORT are available without a charge, upon request, by contacting the Fund at 1-866-759-5679 and on the SEC’s website at https://www.sec.gov.
TAX INFORMATION
The Barron’s 400SM ETF designates the following as a percentage of taxable ordinary income distributions, or up to the maximum amount allowable, for the calendar year ended December 31, 2021:
| | Qualified Dividend Income | Dividend Received Deduction |
| Barron's 400SM ETF | 100.00% | 100.00% |
In early 2022, if applicable, shareholders of record received this information for the distributions paid to them by the Fund during the calendar year 2021 via Form 1099. The Fund will notify shareholders in early 2023 of amounts paid to them by the Fund, if any, during the calendar year 2022.
LICENSING AGREEMENT
MarketGrader Capital, LLC (the “Index Provider”) has entered into a license agreement with Dow Jones & Company to use the “Barron’s” name and certain related intellectual property in connection with the Underlying Index. The Index Provider also has entered into a license and services agreement with its parent company, MarketGrader.com, to use the methodology for constructing the Underlying Index. The Index Provider in turn has entered into the Sublicense Agreement with the Adviser to use the Underlying Index. The following disclosure relates to such licensing agreements:
The Barron’s 400SM ETF (the “Fund”) is not sponsored, managed or advised by the Index Provider. The Index Provider makes no representation or warranty, express or implied, to the owners of the Fund or any member of the public regarding the advisability of investing in securities generally or in the Fund particularly or the ability of the Underlying Index to track the performance of a market or sector. The Index Provider’s only relationship to the Adviser or the Fund is the licensing of certain service marks and trade names of the Index Provider and of the Underlying Index that is determined, composed and calculated by the Index Provider without regard to the Adviser or the Fund. The Index Provider has no obligation to take the needs of the Adviser or the Fund or the owners of the Fund into consideration in determining, composing or calculating the Underlying Index.
THE INDEX PROVIDER DOES NOT GUARANTEE THE ACCURACY AND/OR THE COMPLETENESS OF THE UNDERLYING INDEX OR ANY DATA INCLUDED THEREIN AND THE INDEX PROVIDER SHALL HAVE NO LIABILITY FOR ANY ERRORS, OMISSIONS, OR INTERRUPTIONS THEREIN. THE INDEX PROVIDER MAKES NO WARRANTY, EXPRESS OR IMPLIED, AS TO RESULTS TO BE OBTAINED BY THE ADVISER, THE FUND, OWNERS OF THE FUND, OR ANY OTHER PERSON OR ENTITY FROM THE USE OF THE UNDERLYING INDEX OR ANY DATA INCLUDED THEREIN. THE INDEX PROVIDER MAKES NO EXPRESS OR IMPLIED WARRANTIES, AND EXPRESSLY DISCLAIMS ALL WARRANTIES OF MERCHANTABILITY OR FITNESS FOR A PARTICULAR PURPOSE OR USE WITH RESPECT TO THE UNDERLYING INDEX OR ANY DATA INCLUDED THEREIN. WITHOUT LIMITING ANY OF THE FOREGOING, IN NO EVENT SHALL THE INDEX PROVIDER HAVE ANY LIABILITY FOR ANY SPECIAL, PUNITIVE, INDIRECT, OR CONSEQUENTIAL DAMAGES (INCLUDING LOST PROFITS), EVEN IF NOTIFIED OF THE POSSIBILITY OF SUCH DAMAGES.
“The Barron’s 400SM Index ” is calculated and published by the Index Provider. “Barron’s,” “Barron’s 400” and “Barron’s 400 Index” are trademarks or service marks of DJC & Company, Inc. (“DJC”) or its affiliates and have been licensed to the Index Provider and sublicensed for certain purposes by Barron’s 400 Exchange Traded Fund, a sub-fund of that certain ALPS ETF Trust, a Delaware Statutory Trust (the “Sub-Licensee”). The Barron’s 400SM ETF (the “Product”) is not sponsored or advised by DJC or its affiliates. DJC and its affiliates make no representation or warranty, express or implied, to the Licensee or to the owners of the Product(s) or any member of the public regarding the advisability of trading in the Product. DJC and its affiliates’ only relationship to the Licensee is the licensing of certain trademarks and trade names of DJC. The Barron's 400SM Index is determined, composed and calculated by the Index Provider without regard to DJC. DJC has no obligation to take the needs of the Licensee or the owners of the Product into consideration in connection with its licensing of the Barron’s 400 Index to the Index Provider or the sublicense to Licensee. DJC and its affiliates are not responsible for and have not participated in the calculation of the Barron's 400SM Index or in the determination of the timing of, prices at, or quantities of the Fund to be sold or in the determination or calculation of the equation by which the Product are to be converted into cash. DJC and its affiliates have no obligation or liability in connection with the administration, marketing or trading of the Barron’s 400 Index or the Product.
24 | November 30, 2022
| Barron’s 400SM ETF | |
| Additional Information | November 30, 2022 (Unaudited) |
DOW JONES DOES NOT GUARANTEE THE ACCURACY AND/OR THE COMPLETENESS OF THE BARRON’S 400 INDEX OR ANY DATA INCLUDED THEREIN AND DOW JONES AND ITS AFFILIATES SHALL HAVE NO LIABILITY FOR ANY ERRORS, OMISSIONS, OR INTERRUPTIONS THEREIN. DOW JONESAND ITS AFFILIATES MAKE NO WARRANTY, EXPRESS OR IMPLIED, AS TO RESULTS TO BE OBTAINED BY THE LICENSEE, OWNERS OF THE FUND, OR ANY OTHER PERSON OR ENTITY FROM THE USE OF THE BARRON’S 400 INDEX OR ANY DATA INCLUDED THEREIN. DOW JONES AND ITS AFFILIATES MAKE NO EXPRESS OR IMPLIED WARRANTIES. AND EXPRESSLY DISCLAIM ALL WARRANTIES, OF MERCHANTABILITY OR FITNESS FOR A PARTICULAR PURPOSE OR USE WITH RESPECT TO THE BARRON’S 400 INDEX OR ANY DATA INCLUDED THEREIN. WITHOUT LIMITING ANY OF THE FOREGOING, IN NO EVENT SHALL DOW JONES AND ITS AFFILIATES HAVE ANY LIABILITY FOR ANY LOST PROFITS OR INDIRECT, PUNITIVE, SPECIAL OR CONSEQUENTIAL DAMAGES OR LOSSES, EVEN IF NOTIFIED OF THE POSSIBILITY OF SUCH DAMAGES. THERE ARE NO THIRD PARTY BENEFICIARIES OF ANY AGREEMENTS OR ARRANGEMENTS BETWEEN DJC AND THE LICENSEE, OTHER THAN THE LICENSORS OF MARKETGRADER.
The Adviser does not guarantee the accuracy and/or the completeness of the Underlying Index or any data included therein, and the Adviser shall have no liability for any errors, omissions or interruptions therein. The Adviser makes no warranty, express or implied, as to results to be obtained by the Fund, owners of the Shares of the Fund or any other person or entity from the use of the Underlying Index or any data included therein. The Adviser makes no express or implied warranties, and expressly disclaims all warranties of merchantability or fitness for a particular purpose or use with respect to the Underlying Index or any data included therein. Without limiting any of the foregoing, in no event shall the Adviser have any liability for any special, punitive, direct, indirect or consequential damages (including lost profits) arising out of matters relating to the use of the Underlying Index, even if notified of the possibility of such damages.
25 | November 30, 2022
| Barron’s 400SM ETF | |
| Board Considerations Regarding Approval | November 30, 2022 (Unaudited) |
| of Investment Advisory Agreement | |
At a meeting held on June 21, 2022 via electronic means (video-conference), the Board of Trustees of the Trust (the “Board” or the “Trustees”), including the Trustees who are not “interested persons” of the Trust within the meaning of the Investment Company Act of 1940, as amended (the “Independent Trustees”), evaluated a proposal to approve the continuance of the Investment Advisory Agreement between the Trust and ALPS Advisors, Inc. (the “Adviser” or “AAI”) with respect to the Barron’s 400 ETF (“BFOR” or the “Fund”). The Independent Trustees also met separately to consider the Investment Advisory Agreement.
In evaluating the Investment Advisory Agreement with respect to the Fund, including the Independent Trustees, the Board considered various factors, including (i) the nature, extent and quality of the services provided by AAI with respect to the Fund under the Investment Advisory Agreement; (ii) the advisory fees and other expenses paid by the Fund compared to those of similar funds managed by other investment advisers; (iii) the costs of the services provided to the Fund by AAI and the profits realized by AAI and its affiliates from its relationship to the Fund; (iv) the extent to which economies of scale have been or would be realized if and as the assets of the Fund grow and whether fees reflect the economies of scale for the benefit of shareholders; and (v) any additional benefits and other considerations.
With respect to the nature, extent and quality of the services provided by AAI under the Investment Advisory Agreement, the Board considered and reviewed information concerning the services provided under the Investment Advisory Agreement, the investment parameters of the index of the Fund, financial information regarding AAI and its parent company, information describing AAI’s current organization and the background and experience of the persons responsible for the day-to-day management of the Fund. The Board reviewed information on the performance of the Fund and its benchmark. The Board also evaluated the correlation and tracking error between the underlying index and the Fund’s performance.
Based on this review, the Board, including the Independent Trustees, found that the nature and extent of services provided to the Fund under the Investment Advisory Agreement was appropriate and that the quality was satisfactory.
The Board noted that the advisory fee for the Fund was a unitary fee pursuant to which AAI assumes all expenses of the Fund (including the cost of transfer agency, custody, fund administration, legal, audit and other services) other than the payments under the Advisory Agreement, brokerage expenses, taxes, interest, litigation expenses and other extraordinary expenses.
With respect to advisory fee rates, the Board, including the Independent Trustees, noted the following:
The gross management fee rate for the Fund is higher than the median of its FUSE expense group. The Fund’s net expense ratio is higher than the median of its FUSE expense group. With respect to the Fund, the Board took into account, among other things, the unique features and performance of the Fund’s underlying index and the costs and benefits of linkage to the Barron’s name.
Based on the foregoing, and the other information available to them, the Board, including the Independent Trustees concluded that the advisory fee rate for the Fund was reasonable under the circumstances and in light of the quality of the services provided.
The Board, including the Independent Trustees considered other benefits available to AAI because of its relationship with the Fund and concluded that the advisory fees were reasonable taking into account any such benefits.
The Board, including the Independent Trustees also considered with respect to the Fund the information provided by AAI about the costs and profitability of AAI with respect to the Fund, including the asset levels and other factors that influence the profitability and financial viability of the Fund. The Board, including the Independent Trustees reviewed and noted the relatively small size of the Fund and concluded that AAI was not realizing any economies of scale. The Independent Trustees determined that AAI should continue to keep the Board informed on an ongoing basis of any significant developments (e.g., material increases in asset levels) so as to facilitate the Independent Trustees’ evaluation of whether further economies of scale have been achieved.
In voting to renew the Investment Advisory Agreement, the Board, including the Independent Trustees concluded that the terms of the Investment Advisory Agreement are reasonable and fair in light of the services to be performed, the fees paid by certain other funds, expenses to be incurred and such other matters as the members of the Board, including the Independent Trustees, considered relevant in the exercise of their reasonable business judgment. The Independent Trustees did not identify any single factor or group of factors as all important or controlling and considered all factors together.
26 | November 30, 2022
| Barron’s 400SM ETF | |
| Trustees & Officers | November 30, 2022 (Unaudited) |
The general supervision of the duties performed by the Adviser for the Fund under the Investment Advisory Agreement is the responsibility of the Board of Trustees. The Trust currently has four Trustees, each of whom have no affiliation or business connection with the Adviser or any of its affiliated persons and do not own any stock or other securities issued by the Adviser. These are the “non-interested” or “independent” Trustees (“Independent Trustees”).
The Independent Trustees of the Trust, their term of office and length of time served, their principal business occupations during the past five years, the number of portfolios in the Fund Complex overseen by each Independent Trustee, and other directorships, if any, held by the Trustee are shown below.
| INDEPENDENT TRUSTEES |
| Name, Address & Year of Birth* | Position(s) Held with Trust | Term of Office and Length of Time Served** | Principal Occupation(s) During Past 5 Years | Number of Portfolios in Fund Complex Overseen by Trustees*** | Other Directorships Held by Trustees |
Mary K. Anstine, 1940 | Trustee | Since March 2008 | Ms. Anstine is Trustee/Director of AV Hunter Trust and Colorado Uplift Board. | 38 | Ms. Anstine is a Trustee of ALPS Variable Investment Trust (7 funds); Financial Investors Trust (29 funds); and Reaves Utility Income Fund. |
| Jeremy W. Deems, 1976 | Trustee | Since March 2008 | Mr. Deems is the Co-Founder and Chief Financial Officer of Green Alpha Advisors, LLC, a registered investment advisor, and Co-Portfolio Manager of the Shelton Green Alpha Fund. | 38 | Mr. Deems is a Trustee of ALPS Variable Investment Trust (7 funds); Financial Investors Trust (29 funds); and Reaves Utility Income Fund; and Clough Funds Trust (1 fund). |
| Rick A. Pederson, 1952 | Trustee | Since March 2008 | Mr. Pederson is Partner, Bow River Capital Partners (private equity management), 2003 - present; Board Member, Prosci Inc. (private business services) 2013-2016; Advisory Board Member, Citywide Banks (Colorado community bank) 2014- 2017; Board Member, Strong-Bridge Consulting, 2015- 2019; Board Member, IRI/ODMS Holdings LLC, 2017 – 2019; Director, National Western Stock Show (not for profit) 2010 - present; Director, History Colorado (not for profit) 2015- present; Director, Citywide Bank Advisory Board 2017-present; Trustee, Boettcher Foundation, 2018 -present. | 24 | Mr. Pederson is Trustee of Segall Bryant & Hamill Trust (14 funds), Principal Real Estate Income Fund (1 fund). |
| * | The business address of the Trustee is c/o ALPS Advisors, Inc., 1290 Broadway, Suite 1000, Denver, Colorado 80203. |
| ** | This is the period for which the Trustee began serving the Trust. Each Trustee serves an indefinite term, until his or her successor is elected. |
| *** | The Fund Complex includes all series of the Trust and any other investment companies for which ALPS Advisors, Inc. provides investment advisory services. |
27 | November 30, 2022
| Barron’s 400SM ETF | |
| Trustees & Officers | November 30, 2022 (Unaudited) |
| Name, Address & Year of Birth* | Position(s) Held with Trust | Term of Office and Length of Time Served** | Principal Occupation(s) During Past 5 Years | Number of Portfolios in Fund Complex Overseen by Trustees*** | Other Directorships Held by Trustees |
| Edmund J. Burke, 1961 | Trustee | Since December 2017 | Mr. Burke joined ALPS in 1991 and served as the President and Director of ALPS Holdings, Inc., and ALPS Advisors, Inc., and Director of ALPS Distributors, Inc., ALPS Fund Services, Inc. (“ALPS”), and ALPS Portfolio Solutions Distributor, Inc. (collectively, the “ALPS Companies”). Mr. Burke retired from the ALPS Companies in June 2019. Mr. Burke is currently a partner at ETF Action, a web-based system that provides data and analytics to registered investment advisers, (since 2020) and a Director of Alliance Bioenergy Plus, Inc., a technology company focused on emerging technologies in the renewable energy, biofuels, and bioplastics technology sectors (since 2020). | 33 | Mr. Burke is a Trustee of Clough Global Dividend and Income Fund (1 fund); Clough Global Equity Fund (1 fund); Clough Global Opportunities Fund (1 fund); Clough Funds Trust (1 fund); Liberty All-Star Equity Fund (1 fund); Director of the Liberty All- Star Growth Fund, Inc. (1 fund) and Financial Investors Trust (29 funds). |
| * | The business address of the Trustee is c/o ALPS Advisors, Inc., 1290 Broadway, Suite 1000, Denver, Colorado 80203. |
| ** | This is the period for which the Trustee began serving the Trust. Each Trustee serves an indefinite term, until his or her successor is elected. |
| *** | The Fund Complex includes all series of the Trust and any other investment companies for which ALPS Advisors, Inc. provides investment advisory services. |
28 | November 30, 2022
| Barron’s 400SM ETF | |
| Trustees & Officers | November 30, 2022 (Unaudited) |
| OFFICERS: | | | |
| Name, Address and Year of Birth of Officer* | Position(s) Held with Trust | Length of Time Served** | Principal Occupation(s) During Past 5 Years |
Laton Spahr, 1975 | President | Since June 2021 | Mr. Spahr joined ALPS in 2019 and currently serves as President and Portfolio Manager of AAI. Prior to his current role, Mr. Spahr was a Senior Vice President and Strategy Leader of the Value & Income Team for Oppenheimer Funds from 2013 to 2019. |
Matthew Sutula, 1985 | Chief Compliance Officer (“CCO”) | Since December 2019 | Mr. Sutula joined ALPS in 2012 and currently serves as Chief Compliance Officer of AAI. Prior to his current role, Mr. Sutula served as interim Compliance Officer of the Trust (September 2019 to December 2019). Compliance Manager and Senior Compliance Analyst for AAI, as well as Compliance Analyst for AFS. Prior to joining ALPS, he spent seven years at Morningstar, Inc. in various analyst roles supporting the registered investment company databases. Mr. Sutula is also Chief Compliance Officer of Principal Real Estate Income Fund, ALPS Variable Investment Trust, Liberty All-Star Equity Fund and Liberty All-Star Growth Fund, Inc. From September 2019 to September 2022 he served as Chief Compliance Officer of RiverNorth Opportunities Fund, Inc. |
Kathryn Burns, 1976 | Treasurer | Since September 2018 | Ms. Burns serves as Vice President, Director of Fund Operations of AAI since 2018. From 2013 to 2018, she served as Vice President and Fund Controller at AFS. Prior to joining ALPS, she worked at Old Mutual Capital where she served as Vice President and Chief Compliance Officer (2010 – 2012) and Regulatory Reporting Manager and Assistant Treasurer to the Old Mutual Funds Trusts (2006 – 2012). She also served as a CPA for PricewaterhouseCoopers LLP. Ms. Burns also serves as President of ALPS Variable Investment Trust and Principal Real Estate Income Fund. From June 2019 to September 2022 she served as President of RiverNorth Opportunities Fund, Inc. and from June 2018 to November 2021 she served as Treasurer of Boulder Growth & Income Fund, Inc. |
Michael P. Lawlor, 1969 | Secretary | Since December 2022 | Mr. Lawlor joined ALPS in January 2022, and is currently Vice President and Principal Legal Counsel. Prior to joining ALPS, Mr. Lawlor was Lead Fund Counsel at Brighthouse Financial (insurance company) (January 2007-April 2021). Mr. Lawlor also serves as Secretary of Financial Investors Trust and ALPS Variable Investment Trust. |
| * | The business address of each Officer is c/o ALPS Advisors, Inc., 1290 Broadway, Suite 1000, Denver, Colorado 80203. Each Officer is deemed an affiliate of the Trust as defined under the 1940 Act. |
| ** | This is the period for which the Officer began serving the Trust. Each Officer serves an indefinite term, until his or her successor is elected. |
The Statement of Additional Information includes additional information about the Fund’s Trustees and is available, without charge, upon request by calling (toll-free) 1-866-759-5679.
29 | November 30, 2022

Table of Contents
| Performance Overview | |
| RiverFront Dynamic Core Income ETF | 1 |
| RiverFront Dynamic US Dividend Advantage ETF | 3 |
| RiverFront Dynamic US Flex-Cap ETF | 6 |
| RiverFront Strategic Income Fund | 9 |
| Disclosure of Fund Expenses | 11 |
| Report of Independent Registered Public Accounting Firm | 12 |
| Financial Statements | |
| Schedules of Investments | |
| RiverFront Dynamic Core Income ETF | 13 |
| RiverFront Dynamic US Dividend Advantage ETF | 16 |
| RiverFront Dynamic US Flex-Cap ETF | 18 |
| RiverFront Strategic Income Fund | 20 |
| Statements of Assets and Liabilities | 23 |
| Statements of Operations | 24 |
| Statements of Changes in Net Assets | |
| RiverFront Dynamic Core Income ETF | 25 |
| RiverFront Dynamic US Dividend Advantage ETF | 26 |
| RiverFront Dynamic US Flex-Cap ETF | 27 |
| RiverFront Strategic Income Fund | 28 |
| Financial Highlights | 29 |
| Notes to Financial Statements | 33 |
| Additional Information | 41 |
| Board Considerations Regarding Approval of Investment Advisory Agreement and Investment Sub-Advisory Agreements | 42 |
| Trustees & Officers | 44 |
alpsfunds.com
| RiverFront Dynamic Core Income ETF | |
| Performance Overview | November 30, 2022 (Unaudited) |
Investment Objective
RiverFront Dynamic Core Income ETF (the “Fund” or "RFCI") seeks total return, with an emphasis on income as the source of that total return. The Fund seeks to achieve its investment objective by investing in a global portfolio of fixed income securities of various maturities, ratings and currency denominations.
Market Recap
Over the Fund's last calendar year, fixed income markets were extremely volatile as yields on the 10-year Treasury ranged from 1.51% to closing as high as 4.25% on October 24th. The move up in interest rates was attributed to rising inflation prompting the Federal Reserve (Fed) to change its monetary policy from Quantitative Easing (QE) to Quantitative Tightening (QT). Since March, the Fed has attempted to tighten financial conditions to fight inflation through rate increases and balance sheet reduction in the form of QT. The Fed chose to front-load rate hikes to avoid a repeat of the late 1970s and early 1980s, when inflation appeared to peak only to rear its head and climb higher. Over the last six meetings, the Fed incrementally raised the Fed funds target range from 0% to 4%.
Fund-Level Attribution
RFCI navigated this environment over the last year by investing in investment grade and high yield companies at the front-end of the curve with maturities inside of 5 years and maintaining a short duration relative to the Bloomberg Aggregate Bond Index. The Fund limited its Treasury exposure mostly to the long-end of the curve to serve as a shock-absorber during periods of risk-off.
Outlook
Given the monetary backdrop and recent interest rate hikes going into 2023, RiverFront anticipates that the Fund will continue to have a shorter duration relative to the Bloomberg U.S. Aggregate Bond Index. However, as interest rates rise and the Fed nears the end of its rate hiking cycle in 2023, the Fund will opportunistically look to close the duration gap. Additionally, RiverFront anticipates the Fund will continue to focus primarily on adding credit risk over taking on interest rate risk given that the bond market has priced in recession for early 2023, which RiverFront believes is premature. RiverFront believes that the Fed’s terminal Fed funds rate range will be between 5.00% - 5.25%, and the 10-year Treasury could rise to between 4.50%- 4.75%, hence the Fund’s expected focus on credit over interest rate risk in the first half of 2023.
Performance (as of November 30, 2022)
| | 1 Year | 5 Year | Since Inception^ |
| RiverFront Dynamic Core Income ETF – NAV | -9.02% | 0.56% | 0.64% |
| RiverFront Dynamic Core Income ETF – Market Price* | -8.78% | 0.58% | 0.67% |
| Bloomberg U.S. Aggregate Bond Total Return Index | -12.84% | 0.21% | 0.34% |
Total Expense Ratio (per the current prospectus) is 0.51%.
Performance data quoted represents past performance. Past performance does not guarantee future results. Total return figures assume reinvestment of dividends and capital gains distributions, if any. The table does not reflect the deduction of taxes that a shareholder would pay on Fund distributions or the redemption of Fund shares. Investment return and principal value of an investment will fluctuate so that an investor’s shares, when sold or redeemed, may be worth more or less than the original cost. Current performance data may be higher or lower than actual data quoted. For the most current month-end performance data please visit www.alpsfunds.com or call 1.866.759.5679.
Net Asset Value (NAV) is an exchange-traded fund’s per-share value. The per-share dollar amount of the fund is derived by dividing the total value of all the securities in its portfolio, less any liabilities, by the number of fund shares outstanding. Market Price is the price at which a share can currently be traded in the market. Information detailing the number of days the Market Price of the Fund was greater than the Fund’s NAV and the number of days it was less than the Fund’s NAV can be obtained at www.alpsfunds.com.
| ^ | The Fund commenced operations on June 14, 2016. |
| * | Market Price means the official closing price of a share or, if it more accurately reflects the market value of a share at the time as of which the Fund calculates current net asset value per share, the price that is the midpoint of the bid-ask spread as of that time. It does not represent the returns an investor would receive if shares were traded at other times. |
Bloomberg U.S. Aggregate Bond Total Return Index is a broad-based benchmark that measures the investment grade, U.S. dollar-denominated, fixed-rate taxable bond market, including Treasuries, government-related and corporate securities, MBS (agency fixed-rate and hybrid ARM pass-throughs), ABS, and CMBS (agency and non-agency). The index is reported on a total return basis, which assumes reinvestment of any dividends and distributions realized during a given time period. The index is not actively managed and does not reflect any deductions for fees, expenses or taxes. One cannot invest directly in an index. Index performance does not reflect fund performance.
The RiverFront Dynamic Core Income ETF is not suitable for all investors. Investments in the Fund are subject to investment risks, including possible loss of the principal amount invested.
The Fund’s shares are not individually redeemable. Investors buy and sell shares of the Fund on a secondary market. Only market makers or “authorized participants” may trade directly with the Fund, typically in blocks of 25,000 shares.
ALPS Portfolio Solutions Distributor, Inc., a FINRA member, is the Distributor for the RiverFront Dynamic Core Income ETF.
1 | November 30, 2022
| RiverFront Dynamic Core Income ETF | |
| Performance Overview | November 30, 2022 (Unaudited) |
Top 10 Holdings*^ (as of November 30, 2022)
| U.S. Treasury Bond 5/15/2032 2.875% | 6.89% |
| U.S. Treasury Bond 5/15/2042 3.25% | 6.59% |
| United States Treasury Bond 2/15/2028 2.75% | 6.25% |
| United States Treasury Note 10/31/2025 3.00% | 3.12% |
| Ford Motor Credit Co. LLC 11/4/2027 7.35% | 2.54% |
| Public Service Enterprise Group, Inc. 11/15/2027 5.85% | 2.51% |
| Goldman Sachs Group, Inc. 11/1/2024 5.7% | 2.47% |
| Royal Bank of Canada 11/1/2027 6.00% | 2.40% |
| Morgan Stanley 11/24/2025 5.00% | 2.31% |
| FNB Corp. 8/25/2025 5.15% | 2.21% |
| Total % of Top 10 Holdings | 37.29% |
| ^ | Excludes Money Market Fund. |
Asset Allocation* (as of November 30, 2022)

Future holdings are subject to change.
Growth of $10,000 (as of November 30, 2022)
Comparison of Change in Value of $10,000 Investment in the Fund and the Fund’s benchmark
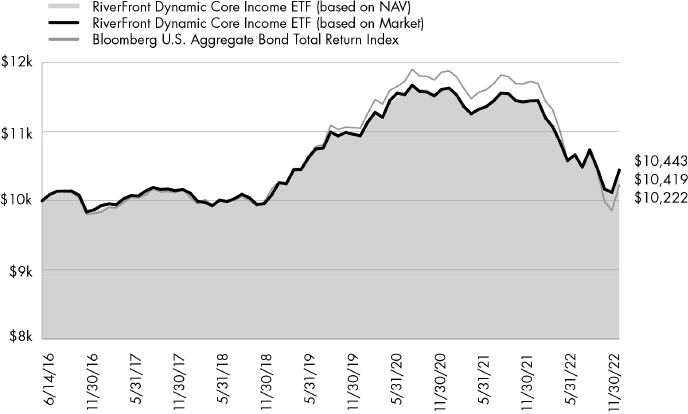
The chart above compares historical performance of a hypothetical investment of $10,000 in the Fund since inception with the performance of the Fund’s benchmark index. Results include the reinvestment of all dividends and capital gains distributions. Past performance does not guarantee future results. The graph does not reflect the deduction of taxes that a shareholder would pay on Fund distributions or the redemption of Fund shares.
2 | November 30, 2022
| RiverFront Dynamic US Dividend Advantage ETF |
| Performance Overview | November 30, 2022 (Unaudited) |
Investment Objective
RiverFront Dynamic US Dividend Advantage ETF (the “Fund” or "RFDA") seeks to provide capital appreciation and dividend income. Under normal market conditions, the Fund seeks to achieve its investment objective by investing at least 65% of its net assets in a portfolio of equity securities of publicly traded U.S. companies with the potential for dividend income. Equity securities include common stocks and common or preferred shares of real estate investment trusts (“REITs”).
Market Recap
The 12-month period from November 30, 2021 to November 30, 2022 was one defined by uncertainty in the market. Early on in the fiscal year, markets began to feel the effects of high inflation and the raising of rates to counteract these higher prices. As such, the S&P 500® Total Return Index (S&P 500) produced a total return of -9.21% over the same 12-month period, well below its return from the previous year. Additionally, the changing economic background caused leadership within factor investing to flip. S&P 500® Value Index actually saw a 3.21% gain, while S&P 500® Growth Index had a total return of -22.41% over the same 12-month period from November 30, 2021 to November 30, 2022. Sector leadership had similar themes. The energy sector was the performing sector, while communication services and consumer discretionary stocks were the worst two performing sectors.
Fund-Level Attribution
RFDA posted NAV returns and market returns above the S&P 500 during the fiscal year. For the last year, the Fund has been heavily invested in value-oriented cyclical dividend payers and defensive dividend payers, with less emphasis on growth-oriented themes. This positioning benefited the portfolio throughout most of 2022, and should rates continue to increase into 2023, RiverFront believes it will continue to be beneficial. Offsetting this was the Fund’s allocation into large technology-oriented companies, which detracted from the Fund’s performance for most of 2022.
Outlook
While RiverFront expects a further slowdown into 2023, RiverFront believes that the elevated levels of inflation will fuel growth more than expected, which will benefit all equities, but particularly cyclicals and growth companies. As Federal Reserve (Fed) rate increases peak (likely in late Q1 2023, in RiverFront’s view), we will seek to opportunistically add to growth-oriented dividend stocks and potentially large cap Technology / Communications Services companies. RiverFront believes that macro challenges associated with rate increases for these large companies are real, but that the market has over-reacted in 2022 to the challenges posed by higher rates, and has underestimated the earnings power of these large companies. Following a year that was defined by economic, geopolitical and market upheaval, RiverFront believes 2023 will be a year of transitions in the following key themes:
Transition from a Bear to a Possible Bull market
History suggests strong forward returns after large drawdowns. While the market may have yet to bottom, once it does, the reset in valuations provides an investment opportunity, in our view.
Transition from Inflation worries to Recession worries
As inflation shows signs of peaking, a policy pause later in 2023 seems likely to RiverFront. While the economic ramifications of the Fed’s actions is likely to cause a recession, RiverFront believes that the recession is likely to be mild.
Transition from ‘T.I.N.A’ (‘There is No Alternative’) to ‘P.A.T.T.Y’ (‘Pay Attention to the Yield’)
On the equity side, RiverFront believes dividends will be an increasingly important return driver for stocks.
Transition from Pandemic concerns to ongoing Geopolitical fears
RiverFront believes U.S. equities are still advantaged from a geopolitical, commodity, and geographic perspective relative to Europe and Asia. RiverFront believes that, with the U.S. and China continuing to drift further apart, reshoring to the U.S. will continue.
Given all of the above, RiverFront believes there is modest upside for stocks for 2023. Within the U.S., RiverFront prefers cyclical sectors, small-cap and traditional ‘value’ plays, such as financials and energy.
3 | November 30, 2022
| RiverFront Dynamic US Dividend Advantage ETF |
| Performance Overview | November 30, 2022 (Unaudited) |
Performance (as of November 30, 2022)
| | 1 Year | 5 Year | Since Inception^ |
| RiverFront Dynamic US Dividend Advantage ETF – NAV | 2.86% | 9.67% | 11.61% |
| RiverFront Dynamic US Dividend Advantage ETF – Market Price* | 2.84% | 9.68% | 11.61% |
| S&P 500® Total Return Index | -9.21% | 10.98% | 12.76% |
Total Expense Ratio (per the current prospectus) is 0.52%.
Performance data quoted represents past performance. Past performance does not guarantee future results. Total return figures assume reinvestment of dividends and capital gains distributions, if any. The table does not reflect the deduction of taxes that a shareholder would pay on Fund distributions or the redemption of Fund shares. Investment return and principal value of an investment will fluctuate so that an investor’s shares, when sold or redeemed, may be worth more or less than the original cost. Current performance data may be higher or lower than actual data quoted. For the most current month-end performance data please visit www.alpsfunds.com or call 1.866.759.5679.
Net Asset Value (NAV) is an exchange-traded fund’s per-share value. The per-share dollar amount of the fund is derived by dividing the total value of all the securities in its portfolio, less any liabilities, by the number of fund shares outstanding. Market Price is the price at which a share can currently be traded in the market. Information detailing the number of days the Market Price of the Fund was greater than the Fund’s NAV and the number of days it was less than the Fund’s NAV can be obtained at www.alpsfunds.com.
| ^ | The Fund commenced operations on June 7, 2016. |
| * | Market Price means the official closing price of a share or, if it more accurately reflects the market value of a share at the time as of which the Fund calculates current net asset value per share, the price that is the midpoint of the bid-ask spread as of that time. It does not represent the returns an investor would receive if shares were traded at other times. |
S&P 500® Total Return Index is the Standard & Poor’s composite index of 500 stocks, a widely recognized, unmanaged index of common stock prices. The index is reported on a total return basis, which assumes reinvestment of any dividends and distributions realized during a given time period. The index is not actively managed and does not reflect any deductions for fees, expenses or taxes. One cannot invest directly in an index. Index performance does not reflect fund performance.
The RiverFront Dynamic US Dividend Advantage ETF is not suitable for all investors. Investments in the Fund are subject to investment risks, including possible loss of the principal amount invested.
The Fund’s shares are not individually redeemable. Investors buy and sell shares of the Fund on a secondary market. Only market makers or “authorized participants” may trade directly with the Fund, typically in blocks of 25,000 shares.
ALPS Portfolio Solutions Distributor, Inc., a FINRA member, is the Distributor for the RiverFront Dynamic US Dividend Advantage ETF.
4 | November 30, 2022
| RiverFront Dynamic US Dividend Advantage ETF |
| Performance Overview | November 30, 2022 (Unaudited) |
Top 10 Holdings* (as of November 30, 2022)
| Microsoft Corp. | 6.61% |
| Apple, Inc. | 6.14% |
| Merck & Co., Inc. | 4.32% |
| Exxon Mobil Corp. | 3.77% |
| Hewlett Packard Enterprise Co. | 2.96% |
| Amazon.com, Inc. | 2.82% |
| Duke Energy Corp. | 2.78% |
| Texas Instruments, Inc. | 2.74% |
| MDU Resources Group, Inc. | 2.73% |
| Cisco Systems, Inc. | 2.71% |
| Total % of Top 10 Holdings | 37.58% |
| * | % of Total Investments (excluding investments purchased with collateral from securities loaned) |
Future holdings are subject to change.
Asset Allocation* (as of November 30, 2022)

Growth of $10,000 (as of November 30, 2022)
Comparison of Change in Value of $10,000 Investment in the Fund and the Fund’s benchmark
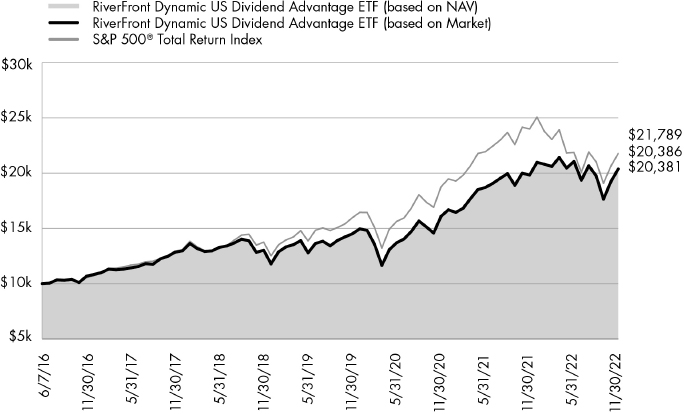
The chart above compares historical performance of a hypothetical investment of $10,000 in the Fund since inception with the performance of the Fund’s benchmark index. Results include the reinvestment of all dividends and capital gains distributions. Past performance does not guarantee future results. The graph does not reflect the deduction of taxes that a shareholder would pay on Fund distributions or the redemption of Fund shares.
5 | November 30, 2022
| RiverFront Dynamic US Flex-Cap ETF |
| Performance Overview | November 30, 2022 (Unaudited) |
Investment Objective
RiverFront Dynamic US Flex-Cap ETF (the “Fund” or "RFFC") seeks to provide capital appreciation. Under normal market conditions, the Fund seeks to achieve its investment objective by investing at least 65% of its net assets in a portfolio of equity securities of publicly traded U.S. companies. Equity securities include common stocks and common or preferred shares of real estate investment trusts (“REITs”).
Market Recap
The 12-month period from November 30, 2021 to November 30, 2022 was one defined by uncertainty in the market. Early on in the fiscal year, markets began to feel the effects of high inflation and the raising of rates to counteract these higher prices. As such, the S&P 500® Total Return Index (S&P 500) produced a total return of -9.21% over the same 12-month period, well below its return from the previous year. Additionally, the changing economic background caused leadership within factor investing to flip. The S&P 500® Value Index actually saw a 3.21% gain, while the S&P 500® Growth Index had a total return of -22.41% over the same 12-month period from November 30, 2021 to November 30, 2022. Sector leadership had similar themes. The energy sector was the performing sector, while communication services and consumer discretionary stocks were the worst two performing sectors.
Fund-Level Attribution
RFFC posted NAV returns and market returns above the S&P Composite 1500® Total Return Index during the fiscal year. For the last year, the Fund has been heavily invested in value-oriented cyclical dividend payers and defensive dividend payers, with less emphasis on growth-oriented themes. This positioning benefited the portfolio throughout most of 2022, and should rates continue to increase into 2023, RiverFront believes it will continue to be beneficial. Offsetting this was the Fund’s allocation into large technology-oriented companies, which detracted from the Fund’s performance for most of 2022.
Outlook
While RiverFront expects a further slowdown into 2023, RiverFront believes that the elevated levels of inflation will fuel growth more than expected, which will benefit all equities, but particularly cyclicals and growth companies. As Federal Reserve (Fed) rate increases peak (likely in late Q1 2023, in RiverFront’s view), we will seek to opportunistically add to growth-oriented dividend stocks and potentially large cap Technology / Communications Services companies. RiverFront believes that macro challenges associated with rate increases for these large companies are real, but that the market has over-reacted in 2022 to the challenges posed by higher rates, and has underestimated the earnings power of these large companies. Following a year that was defined by economic, geopolitical and market upheaval, RiverFront believes 2023 will be a year of transitions in the following key themes:
Transition from a Bear to a Possible Bull market
History suggests strong forward returns after large drawdowns. While the market may have yet to bottom, once it does, the reset in valuations provides an investment opportunity, in our view.
Transition from Inflation worries to Recession worries
As inflation shows signs of peaking, a policy pause later in 2023 seems likely to RiverFront. While the economic ramifications of the Fed’s actions is likely to cause a recession, RiverFront believes that the recession is likely to be mild.
Transition from ‘T.I.N.A’ (‘There is No Alternative’) to ‘P.A.T.T.Y’ (‘Pay Attention to the Yield’)
On the equity side, RiverFront believes dividends will be an increasingly important return driver for stocks.
Transition from Pandemic concerns to ongoing Geopolitical fears
RiverFront believes U.S. equities are still advantaged from a geopolitical, commodity, and geographic perspective relative to Europe and Asia. RiverFront believes that, with the U.S. and China continuing to drift further apart, reshoring to the U.S. will continue.
Given all of the above, RIverFront believes there is modest upside for stocks for 2023. Within the U.S., RiverFront prefers cyclical sectors, small-cap and traditional ‘value’ plays, such as financials and energy.
6 | November 30, 2022
| RiverFront Dynamic US Flex-Cap ETF |
| Performance Overview | November 30, 2022 (Unaudited) |
Performance (as of November 30, 2022)
| | 1 Year | 5 Year | Since Inception^ |
| RiverFront Dynamic US Flex-Cap ETF – NAV | -5.98% | 6.98% | 9.84% |
| RiverFront Dynamic US Flex-Cap ETF – Market Price* | -6.02% | 6.96% | 9.83% |
| S&P Composite 1500® Total Return Index | -8.80% | 10.68% | 12.54% |
Total Expense Ratio (per the current prospectus) is 0.52%.
Performance data quoted represents past performance. Past performance does not guarantee future results. Total return figures assume reinvestment of dividends and capital gains distributions, if any. The table does not reflect the deduction of taxes that a shareholder would pay on Fund distributions or the redemption of Fund shares. Investment return and principal value of an investment will fluctuate so that an investor’s shares, when sold or redeemed, may be worth more or less than the original cost. Current performance data may be higher or lower than actual data quoted. For the most current month-end performance data please visit www.alpsfunds.com or call 1.866.759.5679.
Net Asset Value (NAV) is an exchange-traded fund’s per-share value. The per-share dollar amount of the fund is derived by dividing the total value of all the securities in its portfolio, less any liabilities, by the number of fund shares outstanding. Market Price is the price at which a share can currently be traded in the market. Information detailing the number of days the Market Price of the Fund was greater than the Fund’s NAV and the number of days it was less than the Fund’s NAV can be obtained at www.alpsfunds.com.
| ^ | The Fund commenced operations on June 7, 2016. |
| * | Market Price means the official closing price of a share or, if it more accurately reflects the market value of a share at the time as of which the Fund calculates current net asset value per share, the price that is the midpoint of the bid-ask spread as of that time. It does not represent the returns an investor would receive if shares were traded at other times. |
S&P Composite 1500® Total Return Index is the Standard & Poor’s broad-based unmanaged capitalization-weighted index comprising 1,500 stocks of Large-cap, Mid-cap, and Small-cap U.S. companies. The index is reported on a total return basis, which assumes reinvestment of any dividends and distributions realized during a given time period. The index is not actively managed and does not reflect any deductions for fees, expenses or taxes. One cannot invest directly in an index. Index performance does not reflect fund performance.
The RiverFront Dynamic US Flex-Cap ETF is not suitable for all investors. Investments in the Fund are subject to investment risks, including possible loss of the principal amount invested.
The Fund’s shares are not individually redeemable. Investors buy and sell shares of the Fund on a secondary market. Only market makers or “authorized participants” may trade directly with the Fund, typically in blocks of 25,000 shares.
ALPS Portfolio Solutions Distributor, Inc., a FINRA member, is the Distributor for the RiverFront Dynamic US Flex-Cap ETF.
7 | November 30, 2022
| RiverFront Dynamic US Flex-Cap ETF |
| Performance Overview | November 30, 2022 (Unaudited) |
Top 10 Holdings* (as of November 30, 2022)
| Apple, Inc. | 5.86% |
| Microsoft Corp. | 4.50% |
| Amazon.com, Inc. | 2.40% |
| Exxon Mobil Corp. | 2.12% |
| UnitedHealth Group, Inc. | 2.05% |
| Johnson & Johnson | 1.62% |
| Visa, Inc. | 1.60% |
| Cisco Systems, Inc. | 1.57% |
| AbbVie, Inc. | 1.51% |
| Pfizer, Inc. | 1.48% |
| Total % of Top 10 Holdings | 24.71% |
| * | % of Total Investments (excluding investments purchased with collateral from securities loaned) |
Future holdings are subject to change.
Asset Allocation* (as of November 30, 2022)
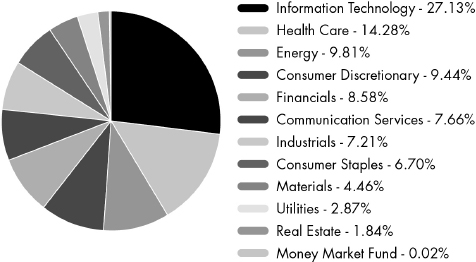
Growth of $10,000 (as of November 30, 2022)
Comparison of Change in Value of $10,000 Investment in the Fund and the Fund’s benchmark
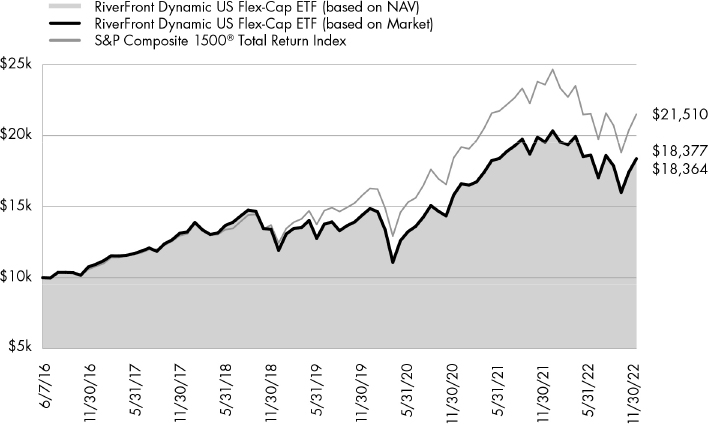
The chart above compares historical performance of a hypothetical investment of $10,000 in the Fund since inception with the performance of the Fund’s benchmark index. Results include the reinvestment of all dividends and capital gains distributions. Past performance does not guarantee future results. The graph does not reflect the deduction of taxes that a shareholder would pay on Fund distributions or the redemption of Fund shares.
8 | November 30, 2022
| RiverFront Strategic Income Fund |
| Performance Overview | November 30, 2022 (Unaudited) |
Investment Objective
The RiverFront Strategic Income Fund (the “Fund” or "RIGS") seeks total return, with an emphasis on income as the source of that total return. The Fund seeks to achieve its investment objective by investing in a global portfolio of fixed income securities of various maturities, ratings and currency denominations. The Fund utilizes various investment strategies in a broad array of fixed income sectors.
Market Recap
Over the Fund's last calendar year, fixed income markets were extremely volatile as yields on the 10-year Treasury ranged from 1.51% to closing as high as 4.25% on October 24th. The move up in interest rates was attributed to rising inflation prompting the Federal Reserve (Fed) to change its monetary policy from Quantitative Easing (QE) to Quantitative Tightening (QT). Since March, the Fed has attempted to tighten financial conditions to fight inflation through rate increases and balance sheet reduction in the form of QT. The Fed chose to front-load rate hikes to avoid a repeat of the late 1970s and early 1980s, when inflation appeared to peak only to rear its head and climb higher. Over the last six meetings, the Fed incrementally raised the Fed funds target range from 0% to 4%.
Fund-Level Attribution
RIGS navigated this environment over the last year by investing in investment grade and high yield companies at the front-end of the curve with maturities inside of 5 years and maintaining a short duration relative to the Bloomberg Aggregate Bond Index. The Fund limited its Treasury exposure mostly to the long-end of the curve to serve as a shock-absorber during periods of risk-off.
Outlook
Given the monetary backdrop and recent interest rate spikes going into 2023, RiverFront anticipates that the Fund will continue to have a shorter duration relative to the Bloomberg U.S. Aggregate Bond Index. However, as interest rates rise and the Fed nears the end of its rate hiking cycle in 2023, the Fund will opportunistically look to close the duration gap. Additionally, the Fund will continue to focus primarily on adding credit risk over taking on interest rate risk given that the bond market has priced in recession for early 2023, which RiverFront believes is premature. RiverFront believes that the Fed’s terminal Fed funds rate range will be between 5.00% - 5.25%, and the 10-year Treasury could rise to between 4.50%- 4.75%, hence the Fund’s expected focus on credit over interest rate risk in the first half of 2023.
Performance (as of November 30, 2022)
| | 1 Year | 5 Year | Since Inception^ |
| RiverFront Strategic Income Fund – NAV | -5.20% | 1.29% | 2.81% |
| RiverFront Strategic Income Fund – Market Price* | -4.88% | 1.31% | 2.84% |
| Bloomberg U.S. Aggregate Bond Total Return Index | -12.84% | 0.21% | 1.42% |
Total Expense Ratio (per the current prospectus) is 0.46%. The Fund’s management fees consist of a fee of 0.11% paid to the Fund’s investment adviser and a fee of 0.35% paid to the Fund’s sub-adviser.
Performance data quoted represents past performance. Past performance does not guarantee future results. Total return figures assume reinvestment of dividends and capital gains distributions, if any. The table does not reflect the deduction of taxes that a shareholder would pay on Fund distributions or the redemption of Fund shares. Investment return and principal value of an investment will fluctuate so that an investor’s shares, when sold or redeemed, may be worth more or less than the original cost. Current performance data may be higher or lower than actual data quoted. For most current month-end performance data please visit www.alpsfunds.com or call 1.866.759.5679.
Net Asset Value (NAV) is an exchange-traded fund’s per-share value. The per-share dollar amount of the Fund is derived by dividing the total value of all the securities in its portfolio, less any liabilities, by the number of Fund shares outstanding. Market Price is the price at which a share can currently be traded in the market. Information detailing the number of days the Market Price of the Fund was greater than the Fund’s NAV and the number of days it was less than the Fund’s NAV can be obtained at www.alpsfunds.com.
| ^ | | The Fund commenced Investment Operations on October 8, 2013. |
| * | Market Price means the official closing price of a share or, if it more accurately reflects the market value of a share at the time as of which the Fund calculates current net asset value per share, the price that is the midpoint of the bid-ask spread as of that time. It does not represent the returns an investor would receive if shares were traded at other times. |
Duration is a measure of the sensitivity of the price (the value of principal) of a fixed-income investment to a change in interest rates. Duration is expressed as a number of years. The duration number is a calculation involving present value, yield, coupon, final maturity and call features. The bigger the duration number, the greater the interest-rate risk or reward for bond prices. Rising interest rates mean falling bond prices, while declining interest rates mean rising bond prices.
Bloomberg U.S. Aggregate Bond Total Return Index is a broad-based benchmark that measures the investment grade, U.S. dollar-denominated, fixed-rate taxable bond market, including Treasuries, government-related and corporate securities, MBS (agency fixed-rate and hybrid ARM pass-throughs), ABS, and CMBS (agency and non-agency). The index is reported on a total return basis, which assumes reinvestment of any dividends and distributions realized during a given time period. The index is not actively managed and does not reflect any deductions for fees, expenses or taxes. One cannot invest directly in an index. Index performance does not reflect fund performance.
The RiverFront Strategic Income Fund is not suitable for all investors. Investments in the Fund are subject to investment risks, including possible loss of the principal amount invested.
The Fund's shares are not individually redeemable. Investors buy and sell shares of the fund on a secondary market. Only market makers or "authorized participants" may trade directly with the Fund, typically in blocks of 25,000 shares.
ALPS Portfolio Solutions Distributor, Inc., a FINRA member, is the distributor for the RiverFront Strategic Income Fund.
9 | November 30, 2022
| RiverFront Strategic Income Fund |
| Performance Overview | November 30, 2022 (Unaudited) |
Top 10 Holdings*^ (as of November 30, 2022)
| U.S. Treasury Bond 5/15/2042 3.25% | 5.39% |
| U.S. Treasury Note 6/30/2029 3.25% | 4.18% |
| U.S. Treasury Note 5/31/2024 2.50% | 4.08% |
| U.S. Treasury Note 6/15/2025 2.875% | 4.07% |
| Morgan Stanley 4/24/2024 3M US L + 0.847% | 1.67% |
| Wells Fargo & Co. 9/9/2024 3.30% | 1.64% |
| T-Mobile USA, Inc. 4/15/2026 2.625% | 1.45% |
| Vistra Operations Co. LLC 7/15/2024 3.55% | 1.31% |
| Goldman Sachs Group, Inc. 10/21/2025 4.25% | 1.30% |
| Bank of America Corp. 10/22/2026 4.25% | 1.30% |
| Total % of Top 10 Holdings | 26.39% |
| ^ | Excludes Money Market Fund |
Future holdings are subject to change.
Asset Allocation* (as of November 30, 2022)
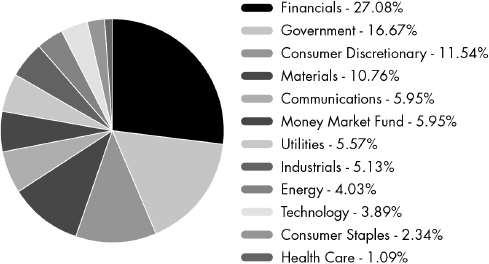
Growth of $10,000 (as of November 30, 2022)
Comparison of Change in Value of $10,000 Investment in the Fund and the Fund’s benchmark

The chart above compares historical performance of a hypothetical investment of $10,000 in the Fund since inception with the performance of the Fund’s benchmark index. Results include the reinvestment of all dividends and capital gains distributions. Past performance does not guarantee future results. The graph does not reflect the deduction of taxes that a shareholder would pay on Fund distributions or the redemption of Fund shares.
10 | November 30, 2022
| RiverFront ETFs | |
| Disclosure of Fund Expenses | November 30, 2022 (Unaudited) |
Shareholder Expense Example: As a shareholder of a Fund, you incur certain ongoing costs, including management fees and other Fund expenses. These examples are intended to help you understand your ongoing costs (in dollars) of investing in a Fund and to compare these costs with the ongoing costs of investing in other funds. It is based on an investment of $1,000 invested at the beginning of the six month period and held through November 30, 2022.
Actual Return: The first line of the table provides information about actual account values and actual expenses. You may use the information in this line, together with the amount you invested, to estimate the expenses that you incurred over the period. Simply divide your account value by $1,000 (for example, an $8,600 account value divided by $1,000 = 8.6), then multiply the result by the number in the first line under the heading entitled “Expenses Paid During Period” to estimate the expenses attributable to your investment during this period.
Hypothetical 5% Return: The second line of the table provides information about hypothetical account values and hypothetical expenses based on the Fund’s actual expense ratio and an assumed rate of return of 5% per year before expenses, which is not the Fund’s actual return. The hypothetical account values and expenses may not be used to estimate the actual ending account balance or expenses you paid for the period. You may use this information to compare ongoing costs of investing in the Fund and other funds. To do so, compare this 5% hypothetical example with the 5% hypothetical examples that appear in the shareholder reports of other funds.
The expenses shown in the table are meant to highlight ongoing Fund costs only and do not reflect any transaction costs, such as brokerage commissions and other fees to financial intermediaries. Therefore, the second line is useful in comparing ongoing costs only, and will not help you determine the relative total costs of owning different funds. In addition, if these costs were included, your costs would have been higher.
| | Beginning Account Value 6/1/22 | Ending Account Value 11/30/22 | Expense Ratio(a) | Expenses Paid During Period 6/1/22 - 11/30/22(b) |
| RiverFront Dynamic Core Income ETF | | | | |
| Actual | $1,000.00 | $977.30 | 0.51% | $2.53 |
| Hypothetical (5% return before expenses) | $1,000.00 | $1,022.51 | 0.51% | $2.59 |
| RiverFront Dynamic US Dividend Advantage ETF | | | |
| Actual | $1,000.00 | $966.90 | 0.52% | $2.56 |
| Hypothetical (5% return before expenses) | $1,000.00 | $1,022.46 | 0.52% | $2.64 |
| RiverFront Dynamic US Flex-Cap ETF | | | | |
| Actual | $1,000.00 | $986.90 | 0.52% | $2.59 |
| Hypothetical (5% return before expenses) | $1,000.00 | $1,022.46 | 0.52% | $2.64 |
| RiverFront Strategic Income Fund | | | | |
| Actual | $1,000.00 | $984.80 | 0.46% | $2.29 |
| Hypothetical (5% return before expenses) | $1,000.00 | $1,022.76 | 0.46% | $2.33 |
| (a) | Annualized, based on the Fund's most recent fiscal half year expenses. |
| (b) | Expenses are equal to the Fund's annualized expense ratio multiplied by the average account value over the period, multiplied by the number of days in the most recent fiscal half year (183), divided by 365. |
11 | November 30, 2022
| RiverFront ETFs |
| Report of Independent Registered Public Accounting Firm |
To the Board of Trustees of ALPS ETF Trust and the Shareholders of RiverFront Dynamic Core Income ETF, RiverFront Dynamic US Dividend Advantage ETF, RiverFront Dynamic US Flex-Cap ETF, and RiverFront Strategic Income Fund
Opinion on the Financial Statements
We have audited the accompanying statements of assets and liabilities of RiverFront Dynamic Core Income ETF, RiverFront Dynamic US Dividend Advantage ETF, RiverFront Dynamic US Flex-Cap ETF, and RiverFront Strategic Income Fund, each a series of shares of beneficial interest in ALPS ETF Trust (the “Funds”), including the schedules of investments, as of November 30, 2022, and the related statements of operations and changes in net assets and the financial highlights for the year then ended, and the related notes (collectively referred to as the “financial statements”). In our opinion, the financial statements present fairly, in all material respects, the financial position of the Funds as of November 30, 2022, and the results of their operations, the changes in their net assets, and their financial highlights for the year then ended, in conformity with accounting principles generally accepted in the United States of America. The statements of changes in net assets for the year ended November 30, 2021 and the financial highlights for each of the years in the four-year period then ended were audited by other auditors whose report dated January 26, 2022, expressed an unqualified opinion on those financial statements and financial highlights.
Basis for Opinion
These financial statements are the responsibility of the Funds' management. Our responsibility is to express an opinion on the Funds’ financial statements based on our audits. We are a public accounting firm registered with the Public Company Accounting Oversight Board (United States) (“PCAOB”) and are required to be independent with respect to the Funds in accordance with the U.S. federal securities law and the applicable rules and regulations of the Securities and Exchange Commission and the PCAOB.
We conducted our audits in accordance with the standards of the PCAOB. Those standards require that we plan and perform the audits to obtain reasonable assurance about whether the financial statements are free of material misstatement, whether due to error or fraud. The Funds are not required to have, nor were we engaged to perform, an audit of their internal control over financial reporting. As part of our audits we are required to obtain an understanding of internal control over financial reporting but not for the purpose of expressing an opinion on the effectiveness of the Funds’ internal control over financial reporting. Accordingly, we express no such opinion.
Our audits included performing procedures to assess the risk of material misstatement of the financial statements, whether due to error or fraud, and performing procedures that respond to those risks. Such procedures included examining, on a test basis, evidence regarding the amounts and disclosures in the financial statements. Our procedures included confirmation of securities owned as of November 30, 2022 by correspondence with the custodian and brokers or by other appropriate procedures where replies were not received. Our audits also included evaluating the accounting principles used and significant estimates made by management, as well as evaluating the overall presentation of the financial statements. We believe that our audits provide a reasonable basis for our opinion.

BBD, LLP
We have served as the auditor of one or more of the Funds in the ALPS ETF Trust since 2022.
Philadelphia, Pennsylvania
January 27, 2023
12 | November 30, 2022
| RiverFront Dynamic Core Income ETF |
| Schedule of Investments | November 30, 2022 |
| Security Description | | Principal Amount | | | Value | |
| CORPORATE BONDS (68.11%) | | | | | | |
| Communications (7.55%) | | | | | | |
| AT&T, Inc. | | | | | | |
| 2.55%, 12/01/2033 | | $ | 751,000 | | | $ | 587,211 | |
| Charter Communications | | | | | | | | |
| Operating LLC / Charter Communications Operating Capital | | | | | | | | |
| 4.91%, 07/23/2025 | | | 430,000 | | | | 423,067 | |
| Comcast Corp. | | | | | | | | |
| 4.15%, 10/15/2028 | | | 424,000 | | | | 411,004 | |
| Discovery Communications LLC | | | | | | | | |
| 3.95%, 03/20/2028 | | | 754,000 | | | | 676,418 | |
| Sirius XM Radio, Inc. | | | | | | | | |
| 3.13%, 09/01/2026(a) | | | 477,000 | | | | 431,227 | |
| Verizon Communications, Inc. | | | | | | | | |
| 2.36%, 03/15/2032 | | | 423,000 | | | | 339,848 | |
| Walt Disney Co. | | | | | | | | |
| 2.00%, 09/01/2029 | | | 477,000 | | | | 403,115 | |
| Total Communications | | | | | | | 3,271,890 | |
| | | | | | | | | |
| Consumer Discretionary (8.52%) | | | | | | | | |
| Alibaba Group Holding, Ltd. | | | | | | | | |
| 3.60%, 11/28/2024 | | | 104,000 | | | | 100,404 | |
| 3.40%, 12/06/2027 | | | 89,000 | | | | 81,702 | |
| CoreCivic, Inc. | | | | | | | | |
| 4.63%, 05/01/2023 | | | 97,000 | | | | 96,710 | |
| Ford Motor Co. | | | | | | | | |
| 9.63%, 04/22/2030 | | | 599,000 | | | | 693,486 | |
| Ford Motor Credit Co. LLC | | | | | | | | |
| 7.35%, 11/04/2027 | | | 961,000 | | | | 999,815 | |
| General Motors Financial Co., Inc. | | | | | | | | |
| 3.70%, 05/09/2023 | | | 134,000 | | | | 133,163 | |
| 3.60%, 06/21/2030 | | | 419,000 | | | | 358,411 | |
| Goodyear Tire & Rubber Co. | | | | | | | | |
| 4.88%, 03/15/2027 | | | 430,000 | | | | 399,112 | |
| Marriott International, Inc. | | | | | | | | |
| 4.00%, 04/15/2028(b) | | | 77,000 | | | | 71,577 | |
| Toyota Motor Credit Corp. | | | | | | | | |
| 3.95%, 06/30/2025 | | | 771,000 | | | | 757,572 | |
| Total Consumer Discretionary | | | | | | | 3,691,952 | |
| | | | | | | | | |
| Consumer Staples (2.91%) | | | | | | | | |
| Anheuser-Busch InBev | | | | | | | | |
| Worldwide, Inc. | | | | | | | | |
| 4.00%, 04/13/2028 | | | 491,000 | | | | 474,876 | |
| Dollar Tree, Inc. | | | | | | | | |
| 4.00%, 05/15/2025 | | | 805,000 | | | | 788,546 | |
| Total Consumer Staples | | | | | | | 1,263,422 | |
| | | | | | | | | |
| Energy (6.69%) | | | | | | | | |
| Continental Resources, Inc. | | | | | | | | |
| 3.80%, 06/01/2024 | | | 89,000 | | | | 86,590 | |
| Enterprise Products Operating LLC | | | | | | | | |
| 3.35%, 03/15/2023 | | | 134,000 | | | | 133,389 | |
| Security Description | | Principal Amount | | | Value | |
| Energy (continued) | | | | | | |
| Hess Midstream Operations LP | | | | | | |
| 4.25%, 02/15/2030(a) | | $ | 430,000 | | | $ | 368,194 | |
| Kinder Morgan Energy Partners LP | | | | | | | | |
| 4.25%, 09/01/2024 | | | 89,000 | | | | 87,667 | |
| Marathon Oil Corp. | | | | | | | | |
| 4.40%, 07/15/2027 | | | 801,000 | | | | 773,722 | |
| Sabine Pass Liquefaction LLC | | | | | | | | |
| 5.75%, 05/15/2024 | | | 754,000 | | | | 755,111 | |
| Schlumberger Investment SA | | | | | | | | |
| 3.65%, 12/01/2023 | | | 220,000 | | | | 217,275 | |
| Shell International Finance BV | | | | | | | | |
| 2.75%, 04/06/2030 | | | 430,000 | | | | 380,774 | |
| Williams Cos., Inc. | | | | | | | | |
| 3.90%, 01/15/2025 | | | 98,000 | | | | 95,695 | |
| Total Energy | | | | | | | 2,898,417 | |
| | | | | | | | | |
| Financials (28.80%) | | | | | | | | |
| Bank of America Corp. | | | | | | | | |
| 4.25%, 10/22/2026 | | | 612,000 | | | | 598,700 | |
| Blackstone Private Credit Fund | | | | | | | | |
| 3.25%, 03/15/2027 | | | 465,000 | | | | 400,397 | |
| Chubb INA Holdings, Inc. | | | | | | | | |
| 3.35%, 05/03/2026 | | | 123,000 | | | | 118,738 | |
| Citigroup, Inc. | | | | | | | | |
| 4.45%, 09/29/2027 | | | 787,000 | | | | 757,325 | |
| 6.63%, 06/15/2032 | | | 260,000 | | | | 274,199 | |
| CubeSmart LP | | | | | | | | |
| 2.25%, 12/15/2028 | | | 870,000 | | | | 717,588 | |
| Discover Bank | | | | | | | | |
| 4.65%, 09/13/2028 | | | 77,000 | | | | 71,737 | |
| FNB Corp. | | | | | | | | |
| 5.15%, 08/25/2025 | | | 879,000 | | | | 871,204 | |
| FS KKR Capital Corp. | | | | | | | | |
| 4.25%, 02/14/2025(a) | | | 809,000 | | | | 760,551 | |
| Goldman Sachs Group, Inc. | | | | | | | | |
| 5.70%, 11/01/2024 | | | 961,000 | | | | 972,417 | |
| Host Hotels & Resorts LP | | | | | | | | |
| 4.00%, 06/15/2025 | | | 551,000 | | | | 527,432 | |
| HSBC Holdings PLC | | | | | | | | |
| 4.30%, 03/08/2026 | | | 77,000 | | | | 74,748 | |
| 3.90%, 05/25/2026 | | | 104,000 | | | | 98,858 | |
| 4.38%, 11/23/2026 | | | 787,000 | | | | 754,781 | |
| Iron Mountain, Inc. | | | | | | | | |
| 4.88%, 09/15/2027(a) | | | 833,000 | | | | 784,311 | |
| JPMorgan Chase & Co. | | | | | | | | |
| 4.25%, 10/01/2027 | | | 507,000 | | | | 494,434 | |
| Lincoln National Corp. | | | | | | | | |
| 3.35%, 03/09/2025 | | | 104,000 | | | | 100,203 | |
| M&T Bank Corp. | | | | | | | | |
| 3M US L + 0.68%, 07/26/2023(c) | | | 134,000 | | | | 134,085 | |
| Mitsubishi UFJ Financial Group, Inc. | | | | | | | | |
| 3.85%, 03/01/2026 | | | 104,000 | | | | 99,854 | |
See Notes to Financial Statements.
13 | November 30, 2022
| RiverFront Dynamic Core Income ETF |
| Schedule of Investments | November 30, 2022 |
| Security Description | | Principal Amount | | | Value | |
| Financials (continued) | | | | | | |
| Mizuho Financial Group, Inc. | | | | | | |
| 3M US L + 1.00%, 09/11/2024(c) | | $ | 253,000 | | | $ | 252,374 | |
| Morgan Stanley | | | | | | | | |
| 5.00%, 11/24/2025 | | | 909,000 | | | | 910,534 | |
| 3.63%, 01/20/2027 | | | 199,000 | | | | 188,932 | |
| NatWest Markets PLC | | | | | | | | |
| 3.48%, 03/22/2025(a) | | | 501,000 | | | | 479,894 | |
| PNC Financial Services Group, Inc. | | | | | | | | |
| 3.15%, 05/19/2027 | | | 104,000 | | | | 96,359 | |
| 3.45%, 04/23/2029 | | | 419,000 | | | | 384,331 | |
| Royal Bank of Canada | | | | | | | | |
| 6.00%, 11/01/2027 | | | 909,000 | | | | 944,856 | |
| Truist Bank | | | | | | | | |
| 3.30%, 05/15/2026 | | | 104,000 | | | | 97,452 | |
| Wells Fargo & Co. | | | | | | | | |
| 3.00%, 04/22/2026 | | | 548,000 | | | | 514,308 | |
| Total Financials | | | | | | | 12,480,602 | |
| | | | | | | | | |
| Health Care (3.34%) | | | | | | | | |
| AbbVie, Inc. | | | | | | | | |
| 3.20%, 11/21/2029 | | | 430,000 | | | | 391,585 | |
| Cigna Corp. | | | | | | | | |
| 3.00%, 07/15/2023 | | | 124,000 | | | | 122,418 | |
| CVS Health Corp. | | | | | | | | |
| 4.30%, 03/25/2028 | | | 162,000 | | | | 157,555 | |
| HCA, Inc. | | | | | | | | |
| 5.38%, 09/01/2026 | | | 430,000 | | | | 427,888 | |
| Merck & Co., Inc. | | | | | | | | |
| 2.80%, 05/18/2023 | | | 249,000 | | | | 246,724 | |
| UnitedHealth Group, Inc. | | | | | | | | |
| 3.75%, 07/15/2025 | | | 104,000 | | | | 102,094 | |
| Total Health Care | | | | | | | 1,448,264 | |
| | | | | | | | | |
| Industrials (2.69%) | | | | | | | | |
| 3M Co. | | | | | | | | |
| 3.25%, 02/14/2024 | | | 220,000 | | | | 216,243 | |
| Boeing Co. | | | | | | | | |
| 4.88%, 05/01/2025 | | | 785,000 | | | | 777,301 | |
| CNH Industrial NV | | | | | | | | |
| 4.50%, 08/15/2023 | | | 104,000 | | | | 103,277 | |
| Textron, Inc. | | | | | | | | |
| 3.65%, 03/15/2027 | | | 77,000 | | | | 72,090 | |
| Total Industrials | | | | | | | 1,168,911 | |
| | | | | | | | | |
| Materials (2.82%) | | | | | | | | |
| Ball Corp. | | | | | | | | |
| 4.00%, 11/15/2023 | | | 812,000 | | | | 795,923 | |
| DuPont de Nemours, Inc. | | | | | | | | |
| 4.73%, 11/15/2028 | | | 430,000 | | | | 428,157 | |
| Total Materials | | | | | | | 1,224,080 | |
| | | | | | | | | |
| Technology (2.03%) | | | | | | | | |
| Apple, Inc. | | | | | | | | |
| 3.20%, 05/11/2027 | | | 430,000 | | | | 412,511 | |
| Security Description | | Principal Amount | | | Value | |
| Technology (continued) | | | | | | |
| Flex, Ltd. | | | | | | |
| 5.00%, 02/15/2023 | | $ | 104,000 | | | $ | 103,905 | |
| Oracle Corp. | | | | | | | | |
| 3.25%, 11/15/2027 | | | 395,000 | | | | 363,344 | |
| Total Technology | | | | | | | 879,760 | |
| | | | | | | | | |
| Utilities (2.76%) | | | | | | | | |
| Dominion Energy, Inc. | | | | | | | | |
| 4.25%, 06/01/2028 | | | 77,000 | | | | 73,711 | |
| Public Service Enterprise Group, Inc. | | | | | | | | |
| 5.85%, 11/15/2027 | | | 961,000 | | | | 988,757 | |
| Southern Co. | | | | | | | | |
| 2.95%, 07/01/2023 | | | 134,000 | | | | 132,527 | |
| Total Utilities | | | | | | | 1,194,995 | |
| | | | | | | | | |
| TOTAL CORPORATE BONDS | | | | | | | | |
| (Cost $32,256,508) | | | | | | | 29,522,293 | |
| | | | | | | | | |
| GOVERNMENT BONDS (22.78%) | | | | | | | | |
| United States Treasury Bond | | | | | | | | |
| 2.75%, 02/15/2028 | | | 2,602,000 | | | | 2,464,176 | |
| 2.88%, 05/15/2032 | | | 2,908,000 | | | | 2,715,799 | |
| 3.25%, 05/15/2042 | | | 2,908,000 | | | | 2,597,889 | |
| United States Treasury Inflation Indexed Bonds | | | | | | | | |
| 2.13%, 02/15/2040(d) | | | 110,949 | | | | 119,071 | |
| United States Treasury Note | | | | | | | | |
| 2.88%, 10/31/2023 | | | 758,000 | | | | 745,656 | |
| 3.00%, 10/31/2025 | | | 1,270,000 | | | | 1,231,057 | |
| TOTAL GOVERNMENT BONDS | | | | | | | | |
| (Cost $10,714,590) | | | | | | | 9,873,648 | |
| | | 7 Day Yield | | | Shares | | | Value | |
| SHORT TERM INVESTMENTS (8.49%) | | | | | | | | | |
| Money Market Fund (8.49%) | | | | | | | | | |
| State Street Institutional Treasury Plus Money Market Fund (Premier Class) | | | 3.69 | % | | | 3,677,839 | | | | 3,677,839 | |
| | | | | | | | | | | | | |
| TOTAL SHORT TERM INVESTMENTS | | | | | | | | | | | | |
| (Cost $3,677,839) | | | | | | | | | | | 3,677,839 | |
| | | | | | | | | | | | | |
| TOTAL INVESTMENTS (99.38%) | | | | | | | | | | | | |
| (Cost $46,648,937) | | | | | | | | | | $ | 43,073,780 | |
| OTHER ASSETS IN EXCESS OF LIABILITIES (0.62%) | | | | | | | | | | | 267,402 | |
| NET ASSETS - 100.00% | | | | | | | | | | $ | 43,341,182 | |
Investment Abbreviations:
LIBOR - London Interbank Offered Rate
See Notes to Financial Statements.
14 | November 30, 2022
| RiverFront Dynamic Core Income ETF |
| Schedule of Investments | November 30, 2022 |
Reference Rates:
3M US L - 3 Month LIBOR as of November 30, 2022 was 4.76%
| (a) | Securities exempt from registration under Rule 144A of the Securities Act of 1933. These securities may be sold in the ordinary course of business in transactions exempt from registration, normally to qualified institutional buyers. At period end, the aggregate market value of those securities was $2,824,177, representing 6.52% of net assets. |
| (b) | Securities were purchased pursuant to Regulation S under the Securities Act of 1933, which exempts securities offered and sold outside of the United States from registration. Such securities cannot be sold in the United States without either an effective registration statement filed pursuant to the Securities Act of 1933, or pursuant to an exemption from registration. As of November 30, 2022, the market value of those securities was$71,577 representing 0.17% of net assets. |
| (c) | Floating or variable rate security. Interest rate resets periodically on specific dates. The rate shown represents the coupon or interest rate in effect as of November 30, 2022. Security description includes the reference rate and spread if published and available. |
| (d) | Principal amount of security is adjusted for inflation. |
See Notes to Financial Statements.
15 | November 30, 2022
| RiverFront Dynamic US Dividend Advantage ETF |
| Schedule of Investments | November 30, 2022 |
| Security Description | | Shares | | | Value | |
| COMMON STOCKS (99.76%) | | | | | | |
| Communication Services (6.16%) | | | | | | |
| Alphabet, Inc., Class C(a) | | | 16,522 | | | $ | 1,676,157 | |
| AT&T, Inc. | | | 74,662 | | | | 1,439,483 | |
| John Wiley & Sons, Inc., Class A | | | 21,225 | | | | 1,006,277 | |
| Lumen Technologies, Inc. | | | 152,009 | | | | 831,489 | |
| Verizon Communications, Inc. | | | 19,624 | | | | 764,944 | |
| Total Communication Services | | | | | | | 5,718,350 | |
| | | | | | | | | |
| Consumer Discretionary (3.70%) | | | | | | | | |
| Amazon.com, Inc.(a) | | | 27,090 | | | | 2,615,268 | |
| PetMed Express, Inc.(b) | | | 41,696 | | | | 825,581 | |
| Total Consumer Discretionary | | | | | | | 3,440,849 | |
| | | | | | | | | |
| Consumer Staples (5.71%) | | | | | | | | |
| Altria Group, Inc. | | | 17,737 | | | | 826,189 | |
| Coca-Cola Co. | | | 22,482 | | | | 1,430,080 | |
| Colgate-Palmolive Co. | | | 15,000 | | | | 1,162,200 | |
| Philip Morris International, Inc. | | | 4,070 | | | | 405,657 | |
| Vector Group, Ltd. | | | 133,697 | | | | 1,484,037 | |
| Total Consumer Staples | | | | | | | 5,308,163 | |
| | | | | | | | | |
| Energy (11.23%) | | | | | | | | |
| Antero Midstream Corp. | | | 135,087 | | | | 1,530,536 | |
| Devon Energy Corp. | | | 13,542 | | | | 927,898 | |
| Equitrans Midstream Corp. | | | 196,398 | | | | 1,647,779 | |
| Exxon Mobil Corp. | | | 31,386 | | | | 3,494,517 | |
| Kinder Morgan, Inc. | | | 67,319 | | | | 1,287,140 | |
| ONEOK, Inc. | | | 23,072 | | | | 1,543,978 | |
| Total Energy | | | | | | | 10,431,848 | |
| | | | | | | | | |
| Financials (15.07%) | | | | | | | | |
| AllianceBernstein Holding LP | | | 51,829 | | | | 2,091,300 | |
| Annaly Capital Management, Inc.(b) | | | 31,748 | | | | 687,979 | |
| Artisan Partners Asset | | | | | | | | |
| Management, Inc., Class A | | | 32,245 | | | | 1,118,579 | |
| Bank of America Corp. | | | 28,814 | | | | 1,090,610 | |
| Dynex Capital, Inc.(b) | | | 36,623 | | | | 479,761 | |
| Ellington Financial, Inc.(b) | | | 29,166 | | | | 397,824 | |
| FNB Corp. | | | 47,177 | | | | 665,196 | |
| Fulton Financial Corp. | | | 44,107 | | | | 819,949 | |
| Navient Corp. | | | 30,287 | | | | 501,856 | |
| New York Community Bancorp, Inc.(b) | | | 76,774 | | | | 717,837 | |
| OneMain Holdings, Inc. | | | 18,243 | | | | 718,045 | |
| Ready Capital Corp.(b) | | | 62,380 | | | | 835,892 | |
| Rithm Capital Corp. | | | 139,568 | | | | 1,263,090 | |
| Starwood Property Trust, Inc. | | | 25,750 | | | | 551,308 | |
| US Bancorp | | | 45,373 | | | | 2,059,480 | |
| Total Financials | | | | | | | 13,998,706 | |
| | | | | | | | | |
| Health Care (11.34%) | | | | | | | | |
| AbbVie, Inc. | | | 11,974 | | | | 1,929,969 | |
| Bristol-Myers Squibb Co. | | | 24,218 | | | | 1,944,221 | |
| Johnson & Johnson | | | 10,564 | | | | 1,880,392 | |
| Merck & Co., Inc. | | | 36,349 | | | | 4,002,752 | |
| Security Description | | Shares | | | Value | |
| Health Care (continued) | | | | | | |
| Pfizer, Inc. | | | 15,423 | | | $ | 773,155 | |
| Total Health Care | | | | | | | 10,530,489 | |
| | | | | | | | | |
| Industrials (5.83%) | | | | | | | | |
| 3M Co. | | | 3,217 | | | | 405,246 | |
| Fastenal Co. | | | 23,740 | | | | 1,222,847 | |
| MDU Resources Group, Inc. | | | 80,307 | | | | 2,528,868 | |
| United Parcel Service, Inc., Class B | | | 6,621 | | | | 1,256,202 | |
| Total Industrials | | | | | | | 5,413,163 | |
| | | | | | | | | |
| Information Technology (25.31%) | | | | | | | | |
| Apple, Inc. | | | 38,471 | | | | 5,694,862 | |
| Broadcom, Inc. | | | 1,792 | | | | 987,446 | |
| Cisco Systems, Inc. | | | 50,469 | | | | 2,509,319 | |
| Hewlett Packard Enterprise Co. | | | 163,624 | | | | 2,745,611 | |
| Intel Corp. | | | 24,474 | | | | 735,933 | |
| Microsoft Corp. | | | 24,040 | | | | 6,133,564 | |
| NVIDIA Corp. | | | 7,186 | | | | 1,216,087 | |
| Texas Instruments, Inc. | | | 14,087 | | | | 2,542,140 | |
| Western Union Co. | | | 64,167 | | | | 940,688 | |
| Total Information Technology | | | | | | | 23,505,650 | |
| | | | | | | | | |
| Materials (0.94%) | | | | | | | | |
| Newmont Mining Corp. | | | 18,374 | | | | 872,214 | |
| | | | | | | | | |
| Real Estate (5.71%) | | | | | | | | |
| American Assets Trust, Inc. | | | 18,072 | | | | 529,329 | |
| Iron Mountain, Inc. | | | 24,221 | | | | 1,315,927 | |
| Medical Properties Trust, Inc.(b) | | | 52,842 | | | | 693,287 | |
| Piedmont Office Realty Trust, Inc., Class A | | | 53,258 | | | | 554,416 | |
| SITE Centers Corp. | | | 32,786 | | | | 445,562 | |
| Universal Health Realty Income Trust | | | 33,668 | | | | 1,767,233 | |
| Total Real Estate | | | | | | | 5,305,754 | |
| | | | | | | | | |
| Utilities (8.76%) | | | | | | | | |
| Clearway Energy, Inc., Class C | | | 43,009 | | | | 1,524,239 | |
| Duke Energy Corp. | | | 25,774 | | | | 2,575,596 | |
| Entergy Corp. | | | 10,620 | | | | 1,234,787 | |
| Evergy, Inc. | | | 10,478 | | | | 620,402 | |
| NRG Energy, Inc. | | | 16,688 | | | | 708,406 | |
| OGE Energy Corp. | | | 17,205 | | | | 696,114 | |
| UGI Corp. | | | 19,998 | | | | 772,923 | |
| Total Utilities | | | | | | | 8,132,467 | |
| | | | | | | | | |
| TOTAL COMMON STOCKS | | | | | | | | |
| (Cost $90,055,041) | | | | | | | 92,657,653 | |
See Notes to Financial Statements.
16 | November 30, 2022
| RiverFront Dynamic US Dividend Advantage ETF |
| Schedule of Investments | November 30, 2022 |
| | | 7 Day Yield | | | Shares | | | Value | |
| SHORT TERM INVESTMENTS (1.24%) | | | | | | | | | |
| Money Market Fund (0.08%) | | | | | | | | | |
| State Street Institutional Treasury Plus Money Market Fund (Premier Class) | | | | | | | | | | | | |
| (Cost $79,627) | | | 3.69 | % | | | 79,627 | | | $ | 79,627 | |
| | | | | | | | | | | | | |
| Investments Purchased with Collateral from Securities Loaned (1.16%) | | | | | | | | | | | | |
| State Street Navigator Securities Lending Government Money Market Portfolio, 3.86% | | | | | | | | | | | | |
| (Cost $1,074,218) | | | | | | | 1,074,218 | | | | 1,074,218 | |
| TOTAL SHORT TERM INVESTMENTS | | | | | | | | | | | | |
| (Cost $1,153,845) | | | | | | | | | | | 1,153,845 | |
| | | | | | | | | | | | | |
| TOTAL INVESTMENTS (101.00%) | | | | | | | | | | | | |
| (Cost $91,208,886) | | | | | | | | | | $ | 93,811,498 | |
| LIABILITIES IN EXCESS OF OTHER ASSETS (-1.00%) | | | | | | | | | | | (930,375 | ) |
| NET ASSETS - 100.00% | | | | | | | | | | $ | 92,881,123 | |
| (a) | Non-income producing security. |
| (b) | Security, or a portion of the security position is currently on loan. The total market value of securities on loan is $4,152,810. |
See Notes to Financial Statements.
17 | November 30, 2022
| RiverFront Dynamic US Flex-Cap ETF |
| Schedule of Investments | November 30, 2022 |
| Security Description | | Shares | | | Value | |
| COMMON STOCKS (99.85%) | | | | | | |
| Communication Services (7.65%) | | | | | | |
| Alphabet, Inc., Class A(a) | | | 3,676 | | | $ | 371,239 | |
| Alphabet, Inc., Class C(a) | | | 1,747 | | | | 177,233 | |
| Comcast Corp., Class A | | | 9,507 | | | | 348,337 | |
| EverQuote, Inc., Class A(a) | | | 12,761 | | | | 137,819 | |
| Interpublic Group of Cos., Inc. | | | 5,298 | | | | 182,039 | |
| Lumen Technologies, Inc. | | | 33,730 | | | | 184,503 | |
| Magnite, Inc.(a) | | | 3,880 | | | | 43,107 | |
| Meta Platforms, Inc., Class A(a) | | | 1,716 | | | | 202,660 | |
| New York Times Co., Class A | | | 2,657 | | | | 97,379 | |
| Nexstar Media Group, Inc. | | | 1,493 | | | | 283,013 | |
| Sirius XM Holdings, Inc.(b) | | | 26,939 | | | | 174,834 | |
| Total Communication Services | | | | | | | 2,202,163 | |
| | | | | | | | | |
| Consumer Discretionary (9.43%) | | | | | | | | |
| ADT, Inc. | | | 31,212 | | | | 291,520 | |
| Amazon.com, Inc.(a) | | | 7,156 | | | | 690,840 | |
| Choice Hotels International, Inc. | | | 640 | | | | 78,861 | |
| Clarus Corp.(b) | | | 3,918 | | | | 32,598 | |
| Ford Motor Co. | | | 24,106 | | | | 335,073 | |
| H&R Block, Inc. | | | 6,171 | | | | 269,734 | |
| Home Depot, Inc. | | | 1,028 | | | | 333,062 | |
| NIKE, Inc., Class B | | | 1,858 | | | | 203,804 | |
| Tapestry, Inc. | | | 9,054 | | | | 341,970 | |
| Tesla, Inc.(a) | | | 710 | | | | 138,237 | |
| Total Consumer Discretionary | | | | | | | 2,715,699 | |
| | | | | | | | | |
| Consumer Staples (6.69%) | | | | | | | | |
| Altria Group, Inc. | | | 2,158 | | | | 100,520 | |
| Archer-Daniels-Midland Co. | | | 3,042 | | | | 296,595 | |
| Coca-Cola Co. | | | 6,319 | | | | 401,952 | |
| Colgate-Palmolive Co. | | | 2,705 | | | | 209,583 | |
| Mondelez International, Inc., Class A | | | 4,239 | | | | 286,599 | |
| Procter & Gamble Co. | | | 1,958 | | | | 292,055 | |
| Sprouts Farmers Market, Inc.(a) | | | 4,821 | | | | 165,505 | |
| Walgreens Boots Alliance, Inc. | | | 4,204 | | | | 174,466 | |
| Total Consumer Staples | | | | | | | 1,927,275 | |
| | | | | | | | | |
| Energy (9.80%) | | | | | | | | |
| Alto Ingredients, Inc.(a) | | | 55,408 | | | | 193,374 | |
| Archrock, Inc. | | | 15,851 | | | | 138,062 | |
| Coterra Energy, Inc. | | | 7,597 | | | | 212,032 | |
| Exxon Mobil Corp. | | | 5,464 | | | | 608,362 | |
| Kinder Morgan, Inc. | | | 16,820 | | | | 321,598 | |
| Marathon Oil Corp. | | | 12,738 | | | | 390,165 | |
| New Fortress Energy, Inc.(b) | | | 6,357 | | | | 323,571 | |
| ONEOK, Inc. | | | 2,789 | | | | 186,640 | |
| Transocean, Ltd.(a)(b) | | | 46,178 | | | | 196,257 | |
| Williams Cos., Inc. | | | 7,284 | | | | 252,755 | |
| Total Energy | | | | | | | 2,822,816 | |
| | | | | | | | | |
| Financials (8.56%) | | | | | | | | |
| Arbor Realty Trust, Inc. | | | 6,477 | | | | 96,378 | |
| Bank of America Corp. | | | 7,046 | | | | 266,691 | |
| Security Description | | Shares | | | Value | |
| Financials (continued) | | | | | | |
| Berkshire Hathaway, Inc., Class B(a) | | | 239 | | | $ | 76,145 | |
| Citigroup, Inc. | | | 7,376 | | | | 357,072 | |
| First Commonwealth Financial Corp. | | | 7,352 | | | | 108,221 | |
| Hope Bancorp, Inc. | | | 7,915 | | | | 107,802 | |
| JPMorgan Chase & Co. | | | 3,050 | | | | 421,449 | |
| Kearny Financial Corp. | | | 8,425 | | | | 81,470 | |
| KeyCorp | | | 8,355 | | | | 157,158 | |
| Radian Group, Inc. | | | 8,366 | | | | 163,723 | |
| Regions Financial Corp. | | | 8,211 | | | | 190,577 | |
| Travelers Cos., Inc. | | | 1,317 | | | | 249,980 | |
| US Bancorp | | | 4,032 | | | | 183,013 | |
| Willis Towers Watson PLC | | | 28 | | | | 6,892 | |
| Total Financials | | | | | | | 2,466,571 | |
| | | | | | | | | |
| Health Care (14.26%) | | | | | | | | |
| Abbott Laboratories | | | 2,409 | | | | 259,160 | |
| AbbVie, Inc. | | | 2,686 | | | | 432,930 | |
| Cigna Corp. | | | 731 | | | | 240,419 | |
| CVS Health Corp. | | | 2,670 | | | | 272,020 | |
| Johnson & Johnson | | | 2,610 | | | | 464,580 | |
| Merck & Co., Inc. | | | 3,640 | | | | 400,837 | |
| Pacific Biosciences of | | | | | | | | |
| California, Inc.(a)(b) | | | 5,224 | | | | 56,158 | |
| Pfizer, Inc. | | | 8,516 | | | | 426,907 | |
| Quest Diagnostics, Inc. | | | 1,117 | | | | 169,594 | |
| Regeneron Pharmaceuticals, Inc.(a) | | | 240 | | | | 180,408 | |
| UnitedHealth Group, Inc. | | | 1,075 | | | | 588,842 | |
| Vertex Pharmaceuticals, Inc.(a) | | | 740 | | | | 234,136 | |
| Zoetis, Inc. | | | 1,381 | | | | 212,867 | |
| Zynex, Inc.(b) | | | 12,331 | | | | 169,181 | |
| Total Health Care | | | | | | | 4,108,039 | |
| | | | | | | | | |
| Industrials (7.20%) | | | | | | | | |
| ACCO Brands Corp. | | | 14,061 | | | | 78,320 | |
| BWX Technologies, Inc. | | | 1,992 | | | | 121,293 | |
| CACI International, Inc., Class A(a) | | | 497 | | | | 155,213 | |
| Casella Waste Systems, Inc., | | | | | | | | |
| Class A(a) | | | 2,030 | | | | 174,763 | |
| Cintas Corp. | | | 446 | | | | 205,954 | |
| CoreCivic, Inc.(a) | | | 10,732 | | | | 142,521 | |
| CSX Corp. | | | 10,884 | | | | 355,798 | |
| General Dynamics Corp. | | | 1,313 | | | | 331,388 | |
| Heidrick & Struggles | | | | | | | | |
| International, Inc. | | | 3,041 | | | | 90,318 | |
| Snap-on, Inc. | | | 121 | | | | 29,112 | |
| United Parcel Service, Inc., Class B | | | 2,046 | | | | 388,187 | |
| Total Industrials | | | | | | | 2,072,867 | |
| | | | | | | | | |
| Information Technology (27.09%) | | | | | | | | |
| Adeia, Inc. | | | 6,102 | | | | 67,427 | |
| Adobe, Inc.(a) | | | 48 | | | | 16,557 | |
| Advanced Micro Devices, Inc.(a) | | | 2,757 | | | | 214,026 | |
See Notes to Financial Statements.
18 | November 30, 2022
| RiverFront Dynamic US Flex-Cap ETF |
| Schedule of Investments | November 30, 2022 |
| Security Description | | Shares | | | Value | |
| Information Technology (continued) | | | | | | |
| Amdocs, Ltd. | | | 2,422 | | | $ | 215,219 | |
| Apple, Inc. | | | 11,383 | | | | 1,685,024 | |
| Block, Inc., Class A(a) | | | 1,257 | | | | 85,187 | |
| Broadcom, Inc. | | | 614 | | | | 338,332 | |
| Cisco Systems, Inc. | | | 9,055 | | | | 450,215 | |
| Cloudflare, Inc., Class A(a) | | | 2,459 | | | | 120,835 | |
| Crowdstrike Holdings, Inc., Class A(a) | | | 1,118 | | | | 131,533 | |
| Ebix, Inc.(b) | | | 2,308 | | | | 43,829 | |
| Enphase Energy, Inc.(a) | | | 675 | | | | 216,398 | |
| Gen Digital, Inc. | | | 12,520 | | | | 287,459 | |
| Identiv, Inc.(a) | | | 13,488 | | | | 112,625 | |
| Mastercard, Inc., Class A | | | 1,186 | | | | 422,690 | |
| Maximus, Inc. | | | 1,509 | | | | 106,083 | |
| Microsoft Corp. | | | 5,072 | | | | 1,294,070 | |
| NCR Corp.(a) | | | 3,979 | | | | 94,979 | |
| NVIDIA Corp. | | | 1,015 | | | | 171,768 | |
| QUALCOMM, Inc. | | | 1,652 | | | | 208,961 | |
| Salesforce.com, Inc.(a) | | | 1,505 | | | | 241,176 | |
| Seagate Technology PLC | | | 4,703 | | | | 249,118 | |
| SolarEdge Technologies, Inc.(a) | | | 1,012 | | | | 302,446 | |
| Texas Instruments, Inc. | | | 1,475 | | | | 266,179 | |
| Visa, Inc., Class A | | | 2,116 | | | | 459,172 | |
| Total Information Technology | | | | | | | 7,801,308 | |
| | | | | | | | | |
| Materials (4.46%) | | | | | | | | |
| American Vanguard Corp. | | | 7,566 | | | | 174,018 | |
| FMC Corp. | | | 1,680 | | | | 219,475 | |
| Glatfelter Corp. | | | 7,864 | | | | 27,288 | |
| Mosaic Co. | | | 4,245 | | | | 217,769 | |
| Nucor Corp.(b) | | | 1,702 | | | | 255,215 | |
| O-I, Inc.(a) | | | 13,794 | | | | 226,360 | |
| Sealed Air Corp. | | | 254 | | | | 13,520 | |
| SunCoke Energy, Inc. | | | 17,724 | | | | 149,945 | |
| Total Materials | | | | | | | 1,283,590 | |
| | | | | | | | | |
| Real Estate (1.84%) | | | | | | | | |
| Highwoods Properties, Inc. | | | 2,826 | | | | 84,215 | |
| Kimco Realty Corp. | | | 8,136 | | | | 186,477 | |
| Prologis, Inc. | | | 1,562 | | | | 183,988 | |
| SL Green Realty Corp. | | | 1,778 | | | | 74,605 | |
| Total Real Estate | | | | | | | 529,285 | |
| | | | | | | | | |
| Utilities (2.87%) | | | | | | | | |
| Duke Energy Corp. | | | 1,079 | | | | 107,824 | |
| National Fuel Gas Co. | | | 2,109 | | | | 139,679 | |
| OGE Energy Corp. | | | 6,461 | | | | 261,412 | |
| UGI Corp. | | | 8,186 | | | | 316,389 | |
| Total Utilities | | | | | | | 825,304 | |
| | | | | | | | | |
| TOTAL COMMON STOCKS | | | | | | | | |
| (Cost $26,992,838) | | | | | | | 28,754,917 | |
| | | 7 Day Yield | | | Shares | | | Value | |
| SHORT TERM INVESTMENTS (1.02%) | | | | | | |
| Money Market Fund (0.02%) | | | | | | | | | |
| State Street Institutional Treasury Plus Money Market Fund (Premier Class) | | | | | | | | | | | | |
| (Cost $5,505) | | | 3.69 | % | | | 5,505 | | | $ | 5,505 | |
| | | | | | | | | | | | | |
| Investments Purchased with Collateral | | | | | | | | | | | | |
| from Securities Loaned (1.00%) | | | | | | | | | | | | |
| State Street Navigator Securities Lending Government Money Market Portfolio, 3.86% | | | | | | | | | | | | |
| (Cost $289,041) | | | | | | | 289,041 | | | | 289,041 | |
| TOTAL SHORT TERM INVESTMENTS | | | | | | | | | | | | |
| (Cost $294,546) | | | | | | | | | | | 294,546 | |
| | | | | | | | | | | | | |
| TOTAL INVESTMENTS (100.87%) | | | | | | | | | | | | |
| (Cost $27,287,384) | | | | | | | | | | $ | 29,049,463 | |
| LIABILITIES IN EXCESS OF OTHER ASSETS (-0.87%) | | | | | | | | | | | (250,879 | ) |
| NET ASSETS - 100.00% | | | | | | | | | | $ | 28,798,584 | |
| (a) | Non-income producing security. |
| (b) | Security, or a portion of the security position is currently on loan. The total market value of securities on loan is $909,227. |
See Notes to Financial Statements.
19 | November 30, 2022
| RiverFront Strategic Income Fund | |
| Schedule of Investments | November 30, 2022 |
| Security Description | | Principal Amount | | | Value | |
| CORPORATE BONDS (76.60%) | | | | | | |
| Communications (5.89%) | | | | | | |
| AMC Networks, Inc. | | | | | | |
| 5.00%, 04/01/2024 | | $ | 324,000 | | | $ | 309,728 | |
| 4.75%, 08/01/2025 | | | 404,000 | | | | 358,536 | |
| CCO Holdings LLC / CCO Holdings Capital Corp. | | | | | | | | |
| 5.50%, 05/01/2026(a) | | | 428,000 | | | | 417,707 | |
| CSC Holdings LLC | | | | | | | | |
| 5.50%, 04/15/2027(a) | | | 835,000 | | | | 766,104 | |
| Level 3 Financing, Inc. | | | | | | | | |
| 3.75%, 07/15/2029(a) | | | 980,000 | | | | 709,230 | |
| Netflix, Inc. | | | | | | | | |
| 4.38%, 11/15/2026 | | | 803,000 | | | | 776,295 | |
| Sirius XM Radio, Inc. | | | | | | | | |
| 3.13%, 09/01/2026(a) | | | 805,000 | | | | 727,752 | |
| T-Mobile USA, Inc. | | | | | | | | |
| 2.63%, 04/15/2026 | | | 1,542,000 | | | | 1,415,742 | |
| WMG Acquisition Corp. | | | | | | | | |
| 3.75%, 12/01/2029(a) | | | 803,000 | | | | 694,041 | |
| Total Communications | | | | | | | 6,175,135 | |
| | | | | | | | | |
| Consumer Discretionary (11.42%) | | | | | | | | |
| Air Canada | | | | | | | | |
| 3.88%, 08/15/2026(a) | | | 858,000 | | | | 786,153 | |
| Aramark Services, Inc. | | | | | | | | |
| 6.38%, 05/01/2025(a) | | | 858,000 | | | | 852,788 | |
| Caesars Entertainment, Inc. | | | | | | | | |
| 6.25%, 07/01/2025(a) | | | 1,012,000 | | | | 1,001,052 | |
| Ford Motor Credit Co. LLC | | | | | | | | |
| 2.30%, 02/10/2025 | | | 1,183,000 | | | | 1,086,716 | |
| Goodyear Tire & Rubber Co. | | | | | | | | |
| 5.00%, 05/31/2026 | | | 1,034,000 | | | | 1,003,512 | |
| Hilton Domestic Operating Co., Inc. | | | | | | | | |
| 3.75%, 05/01/2029(a) | | | 950,000 | | | | 836,309 | |
| International Game Technology PLC | | | | | | | | |
| 6.50%, 02/15/2025(a) | | | 286,000 | | | | 287,798 | |
| Las Vegas Sands Corp. | | | | | | | | |
| 3.20%, 08/08/2024 | | | 766,000 | | | | 731,989 | |
| Lennar Corp. | | | | | | | | |
| 4.75%, 11/29/2027 | | | 950,000 | | | | 908,571 | |
| MGM Resorts International | | | | | | | | |
| 6.00%, 03/15/2023 | | | 1,012,000 | | | | 1,011,645 | |
| Newell Brands, Inc. | | | | | | | | |
| 4.45%, 04/01/2026 | | | 803,000 | | | | 759,044 | |
| Nissan Motor Co., Ltd. | | | | | | | | |
| 3.52%, 09/17/2025(a) | | | 950,000 | | | | 879,609 | |
| PulteGroup, Inc. | | | | | | | | |
| 5.50%, 03/01/2026 | | | 1,260,000 | | | | 1,265,664 | |
| Six Flags Entertainment Corp. | | | | | | | | |
| 4.88%, 07/31/2024(a) | | | 573,000 | | | | 551,463 | |
| Total Consumer Discretionary | | | | | | | 11,962,313 | |
| Security Description | | Principal Amount | | | Value | |
| Consumer Staples (2.31%) | | | | | | |
| Anheuser-Busch InBev Worldwide, Inc. | | | | | | |
| 4.75%, 01/23/2029 | | $ | 858,000 | | | $ | 856,303 | |
| JBS USA LUX SA / JBS USA Food Co. / JBS USA Finance, Inc. | | | | | | | | |
| 2.50%, 01/15/2027(a) | | | 803,000 | | | | 701,388 | |
| Spectrum Brands, Inc. | | | | | | | | |
| 5.75%, 07/15/2025 | | | 30,000 | | | | 29,533 | |
| US Foods, Inc. | | | | | | | | |
| 6.25%, 04/15/2025(a) | | | 835,000 | | | | 836,065 | |
| Total Consumer Staples | | | | | | | 2,423,289 | |
| | | | | | | | | |
| Energy (3.99%) | | | | | | | | |
| Cheniere Corpus Christi Holdings LLC | | | | | | | | |
| 7.00%, 06/30/2024 | | | 983,000 | | | | 996,663 | |
| DCP Midstream Operating LP | | | | | | | | |
| 5.38%, 07/15/2025 | | | 805,000 | | | | 795,567 | |
| Petroleos Mexicanos | | | | | | | | |
| 4.88%, 01/18/2024 | | | 825,000 | | | | 807,828 | |
| Reliance Industries, Ltd. | | | | | | | | |
| 4.13%, 01/28/2025(a) | | | 793,000 | | | | 768,258 | |
| Schlumberger Holdings Corp. | | | | | | | | |
| 3.90%, 05/17/2028(a) | | | 858,000 | | | | 809,506 | |
| Total Energy | | | | | | | 4,177,822 | |
| | | | | | | | | |
| Financials (26.81%) | | | | | | | | |
| Air Lease Corp. | | | | | | | | |
| 4.25%, 02/01/2024 | | | 805,000 | | | | 790,672 | |
| American Express Co. | | | | | | | | |
| 5.85%, 11/05/2027 | | | 1,048,000 | | | | 1,087,213 | |
| Ares Capital Corp. | | | | | | | | |
| 3.50%, 02/10/2023 | | | 967,000 | | | | 963,229 | |
| Avolon Holdings Funding, Ltd. | | | | | | | | |
| 2.53%, 11/18/2027(a) | | | 890,000 | | | | 719,207 | |
| Bank of America Corp. | | | | | | | | |
| 4.25%, 10/22/2026 | | | 1,294,000 | | | | 1,265,879 | |
| Blackstone Secured Lending Fund | | | | | | | | |
| 3.63%, 01/15/2026 | | | 942,000 | | | | 876,328 | |
| Capital One Financial Corp. | | | | | | | | |
| 4.20%, 10/29/2025 | | | 858,000 | | | | 831,638 | |
| Citigroup, Inc. | | | | | | | | |
| 4.45%, 09/29/2027 | | | 1,294,000 | | | | 1,245,208 | |
| EPR Properties | | | | | | | | |
| 4.75%, 12/15/2026 | | | 805,000 | | | | 717,343 | |
| FS KKR Capital Corp. | | | | | | | | |
| 3.40%, 01/15/2026 | | | 950,000 | | | | 863,873 | |
| | | | | | | | | |
| GLP Capital LP / GLP Financing II,Inc. | | | | | | | | |
| 3.35%, 09/01/2024 | | | 766,000 | | | | 731,660 | |
| Goldman Sachs Group, Inc. | | | | | | | | |
| 4.25%, 10/21/2025 | | | 1,294,000 | | | | 1,268,392 | |
| HAT Holdings I LLC / HAT Holdings II LLC | | | | | | | | |
| 3.38%, 06/15/2026(a) | | | 879,000 | | | | 757,351 | |
See Notes to Financial Statements.
20 | November 30, 2022
| RiverFront Strategic Income Fund | |
| Schedule of Investments | November 30, 2022 |
| Security Description | | Principal Amount | | | Value | |
| Financials (continued) | | | | | | |
| Icahn Enterprises LP / Icahn Enterprises Finance Corp. | | | | | | |
| 4.75%, 09/15/2024 | | $ | 1,013,000 | | | $ | 974,224 | |
| Iron Mountain, Inc. | | | | | | | | |
| 4.88%, 09/15/2027(a) | | | 904,000 | | | | 851,161 | |
| iStar, Inc. | | | | | | | | |
| 4.75%, 10/01/2024 | | | 1,065,000 | | | | 1,048,699 | |
| JPMorgan Chase & Co. | | | | | | | | |
| 4.25%, 10/01/2027 | | | 1,294,000 | | | | 1,261,930 | |
| Morgan Stanley | | | | | | | | |
| 3M US L + 0.85%, 04/24/2024(b) | | | 1,639,000 | | | | 1,627,637 | |
| MPT Operating Partnership LP / MPT Finance Corp. | | | | | | | | |
| 5.25%, 08/01/2026 | | | 766,000 | | | | 686,455 | |
| NatWest Markets PLC | | | | | | | | |
| 3.48%, 03/22/2025(a) | | | 802,000 | | | | 768,213 | |
| Newmark Group, Inc. | | | | | | | | |
| 6.13%, 11/15/2023 | | | 993,000 | | | | 991,719 | |
| Omega Healthcare Investors, Inc. | | | | | | | | |
| 4.38%, 08/01/2023 | | | 271,000 | | | | 267,512 | |
| 5.25%, 01/15/2026 | | | 525,000 | | | | 512,364 | |
| OneMain Finance Corp. | | | | | | | | |
| 6.13%, 03/15/2024 | | | 1,012,000 | | | | 988,269 | |
| Royal Bank of Canada | | | | | | | | |
| 6.00%, 11/01/2027 | | | 1,048,000 | | | | 1,089,339 | |
| Santander Holdings USA, Inc. | | | | | | | | |
| 3.50%, 06/07/2024 | | | 400,000 | | | | 388,132 | |
| SBA Communications Corp. | | | | | | | | |
| 3.88%, 02/15/2027 | | | 1,202,000 | | | | 1,099,477 | |
| Starwood Property Trust, Inc. | | | | | | | | |
| 4.75%, 03/15/2025 | | | 803,000 | | | | 770,248 | |
| VICI Properties LP / VICI Note Co., Inc. | | | | | | | | |
| 4.25%, 12/01/2026(a) | | | 1,123,000 | | | | 1,044,994 | |
| Wells Fargo & Co. | | | | | | | | |
| 3.30%, 09/09/2024 | | | 1,639,000 | | | | 1,595,998 | |
| Total Financials | | | | | | | 28,084,364 | |
| | | | | | | | | |
| Health Care (1.08%) | | | | | | | | |
| DaVita, Inc. | | | | | | | | |
| 4.63%, 06/01/2030(a) | | | 904,000 | | | | 725,641 | |
| HCA, Inc. | | | | | | | | |
| 5.38%, 02/01/2025 | | | 404,000 | | | | 403,203 | |
| Total Health Care | | | | | | | 1,128,844 | |
| | | | | | | | | |
| Industrials (5.08%) | | | | | | | | |
| Boeing Co. | | | | | | | | |
| 4.88%, 05/01/2025 | | | 950,000 | | | | 940,682 | |
| MasTec, Inc. | | | | | | | | |
| 4.50%, 08/15/2028(a) | | | 874,000 | | | | 788,661 | |
| Sensata Technologies BV | | | | | | | | |
| 5.00%, 10/01/2025(a) | | | 803,000 | | | | 791,714 | |
| Stericycle, Inc. | | | | | | | | |
| 5.38%, 07/15/2024(a) | | | 806,000 | | | | 797,537 | |
| Security Description | | Principal Amount | | | Value | |
| Industrials (continued) | | | | | | |
| TransDigm, Inc. | | | | | | |
| 6.25%, 03/15/2026(a) | | $ | 835,000 | | | $ | 823,600 | |
| WESCO Distribution, Inc. | | | | | | | | |
| 7.13%, 06/15/2025(a) | | | 1,164,000 | | | | 1,180,022 | |
| Total Industrials | | | | | | | 5,322,216 | |
| | | | | | | | | |
| Materials (10.65%) | | | | | | | | |
| Alcoa Nederland Holding BV | | | | | | | | |
| 4.13%, 03/31/2029(a) | | | 1,057,000 | | | | 928,257 | |
| ArcelorMittal SA | | | | | | | | |
| 3.60%, 07/16/2024 | | | 881,000 | | | | 855,468 | |
| Arconic Corp. | | | | | | | | |
| 6.00%, 05/15/2025(a) | | | 858,000 | | | | 846,970 | |
| Ardagh Packaging Finance PLC / | | | | | | | | |
| Ardagh Holdings USA, Inc. | | | | | | | | |
| 5.25%, 04/30/2025(a) | | | 1,030,000 | | | | 995,830 | |
| Ball Corp. | | | | | | | | |
| 5.25%, 07/01/2025 | | | 642,000 | | | | 640,716 | |
| 4.88%, 03/15/2026 | | | 404,000 | | | | 391,452 | |
| Berry Global, Inc. | | | | | | | | |
| 4.88%, 07/15/2026(a) | | | 908,000 | | | | 872,388 | |
| Braskem Finance, Ltd. | | | | | | | | |
| 6.45%, 02/03/2024 | | | 371,000 | | | | 371,937 | |
| Freeport-McMoRan, Inc. | | | | | | | | |
| 3.88%, 03/15/2023 | | | 881,000 | | | | 878,388 | |
| 5.00%, 09/01/2027 | | | 449,000 | | | | 437,052 | |
| Mauser Packaging Solutions Holding Co. | | | | | | | | |
| 5.50%, 04/15/2024(a) | | | 338,000 | | | | 332,533 | |
| Methanex Corp. | | | | | | | | |
| 5.13%, 10/15/2027 | | | 835,000 | | | | 767,085 | |
| NOVA Chemicals Corp. | | | | | | | | |
| 4.88%, 06/01/2024(a) | | | 1,012,000 | | | | 986,057 | |
| Novelis Corp. | | | | | | | | |
| 3.25%, 11/15/2026(a) | | | 805,000 | | | | 720,380 | |
| Sasol Financing USA LLC | | | | | | | | |
| 4.38%, 09/18/2026 | | | 525,000 | | | | 477,026 | |
| Standard Industries, Inc. | | | | | | | | |
| 3.38%, 01/15/2031(a) | | | 858,000 | | | | 659,641 | |
| Total Materials | | | | | | | 11,161,180 | |
| | | | | | | | | |
| Technology (3.85%) | | | | | | | | |
| CDW LLC / CDW Finance Corp. | | | | | | | | |
| 3.57%, 12/01/2031 | | | 803,000 | | | | 656,154 | |
| Flex, Ltd. | | | | | | | | |
| 5.00%, 02/15/2023 | | | 1,033,000 | | | | 1,032,057 | |
| Gen Digital, Inc. | | | | | | | | |
| 5.00%, 04/15/2025(a) | | | 667,000 | | | | 647,807 | |
| Microchip Technology, Inc. | | | | | | | | |
| 4.25%, 09/01/2025 | | | 874,000 | | | | 850,010 | |
| Seagate HDD Cayman | | | | | | | | |
| 4.75%, 06/01/2023 | | | 858,000 | | | | 848,865 | |
| Total Technology | | | | | | | 4,034,893 | |
See Notes to Financial Statements.
21 | November 30, 2022
| RiverFront Strategic Income Fund | |
| Schedule of Investments | November 30, 2022 |
| Security Description | | Principal Amount | | | Value | |
| Utilities (5.52%) | | | | | | |
| American Electric Power Co., Inc. | | | | | | |
| 5.75%, 11/01/2027 | | $ | 1,048,000 | $ | | | 1,074,964 | |
| AmeriGas Partners LP / AmeriGas Finance Corp. | | | | | | | | |
| 5.88%, 08/20/2026 | | | 879,000 | | | | 838,408 | |
| Calpine Corp. | | | | | | | | |
| 5.25%, 06/01/2026(a) | | | 428,000 | | | | 410,501 | |
| NextEra Energy Operating Partners LP | | | | | | | | |
| 4.25%, 07/15/2024(a) | | | 1,160,000 | | | | 1,119,500 | |
| NRG Energy, Inc. | | | | | | | | |
| 3.75%, 06/15/2024(a) | | | 803,000 | | | | 776,077 | |
| 6.63%, 01/15/2027 | | | 278,000 | | | | 280,462 | |
| Vistra Operations Co. LLC | | | | | | | | |
| 3.55%, 07/15/2024(a) | | | 1,333,000 | | | | 1,278,062 | |
| Total Utilities | | | | | | | 5,777,974 | |
| | | | | | | | | |
| TOTAL CORPORATE BONDS | | | | | | | | |
| (Cost $86,460,226) | | | | | | | 80,248,030 | |
| | | | | | | | | |
| GOVERNMENT BONDS (16.50%) | | | | | | | | |
| U.S. Treasury Note | | | | | | | | |
| 2.50%, 05/31/2024 | | | 4,102,000 | | | | 3,977,016 | |
| 2.88%, 06/15/2025 | | | 4,102,000 | | | | 3,972,371 | |
| 3.25%, 06/30/2029 | | | 4,216,000 | | | | 4,076,180 | |
| United States Treasury Bond | | | | | | | | |
| 3.25%, 05/15/2042 | | | 5,887,000 | | | | 5,259,208 | |
| TOTAL GOVERNMENT BONDS | | | | | | | | |
| (Cost $18,064,161) | | | | | | | 17,284,775 | |
| | | 7 Day Yield | | | Shares | | | Value | |
| SHORT TERM INVESTMENTS (5.89%) | | | | | | | | | |
| Money Market Fund (5.89%) | | | | | | | | | |
| State Street Institutional Treasury Plus Money Market Fund (Premier Class) | | | 3.69 | % | | | 6,170,456 | | | | 6,170,456 | |
| | | | | | | | | | | | | |
| TOTAL SHORT TERM INVESTMENTS | | | | | | | | | | | | |
| (Cost $6,170,456) | | | | | | | | | | | 6,170,456 | |
| | | | | | | | | | | | | |
| TOTAL INVESTMENTS (98.99%) | | | | | | | | | | | | |
| (Cost $110,694,843) | | | | | | | | | | $ | 103,703,261 | |
| OTHER ASSETS IN EXCESS OF LIABILITIES (1.01%) | | | | | | | | | | | 1,056,057 | |
| NET ASSETS - 100.00% | | | | | | | | | | $ | 104,759,318 | |
| (a) | Securities exempt from registration under Rule 144A of the Securities Act of 1933. These securities may be sold in the ordinary course of business in transactions exempt from registration, normally to qualified institutional buyers. At period end, the aggregate market value of those securities was $31,447,329, representing 30.02% of net assets. |
| (b) | Floating or variable rate security. Interest rate resets periodically on specific dates. The rate shown represents the coupon or interest rate in effect as of November 30, 2022. Security description includes the reference rate and spread if published and available. |
Investment Abbreviations:
LIBOR - London Interbank Offered Rate
Reference Rates:
3M US L - 3 Month LIBOR as of November 30, 2022 was 4.76%
See Notes to Financial Statements.
22 | November 30, 2022
| RiverFront ETFs | |
| Statements of Assets and Liabilities | November 30, 2022 |
| | | RiverFront Dynamic Core Income ETF | | | RiverFront Dynamic US Dividend Advantage ETF | | | RiverFront Dynamic US Flex-Cap ETF | | | RiverFront Strategic Income Fund | |
| ASSETS: | | | | | | | | | | | | |
| Investments, at value | | $ | 43,073,780 | | | $ | 93,811,498 | (a) | | $ | 29,049,463 | (b) | | $ | 103,703,261 | |
| Dividend receivable | | | 12,316 | | | | 182,427 | | | | 49,976 | | | | 16,969 | |
| Interest receivable | | | 273,789 | | | | – | | | | – | | | | 1,076,069 | |
| Receivable for investments sold | | | 570,552 | | | | – | | | | – | | | | – | |
| Due from Authorized Participant | | | – | | | | – | | | | – | | | | 33,730 | |
| Total Assets | | | 43,930,437 | | | | 93,993,925 | | | | 29,099,439 | | | | 104,830,029 | |
| | | | | | | | | | | | | | | | | |
| LIABILITIES: | | | | | | | | | | | | | | | | |
| Payable to adviser | | | 18,703 | | | | 38,584 | | | | 11,814 | | | | 36,981 | |
| Payable for investments purchased | | | – | | | | – | | | | – | | | | 33,730 | |
| Payable for collateral upon return of securities loaned | | | – | | | | 1,074,218 | | | | 289,041 | | | | – | |
| Due to Authorized Participant | | | 570,552 | | | | – | | | | – | | | | – | |
| Total Liabilities | | | 589,255 | | | | 1,112,802 | | | | 300,855 | | | | 70,711 | |
| NET ASSETS | | $ | 43,341,182 | | | $ | 92,881,123 | | | $ | 28,798,584 | | | $ | 104,759,318 | |
| | | | | | | | | | | | | | | | | |
| NET ASSETS CONSIST OF: | | | | | | | | | | | | | | | | |
| Paid-in capital | | $ | 48,545,109 | | | $ | 96,311,958 | | | $ | 48,937,448 | | | $ | 123,079,439 | |
| Total distributable earnings/(accumulated losses) | | | (5,203,927 | ) | | | (3,430,835 | ) | | | (20,138,864 | ) | | | (18,320,121 | ) |
| NET ASSETS | | $ | 43,341,182 | | | $ | 92,881,123 | | | $ | 28,798,584 | | | $ | 104,759,318 | |
| | | | | | | | | | | | | | | | | |
| INVESTMENTS, AT COST | | $ | 46,648,937 | | | $ | 91,208,886 | | | $ | 27,287,384 | | | $ | 110,694,843 | |
| | | | | | | | | | | | | | | | | |
| PRICING OF SHARES | | | | | | | | | | | | | | | | |
| Net Assets | | $ | 43,341,182 | | | $ | 92,881,123 | | | $ | 28,798,584 | | | $ | 104,759,318 | |
| Shares of beneficial interest outstanding (Unlimited number of shares authorized, par value $0.01 per share) | | | 1,950,000 | | | | 2,075,002 | | | | 675,002 | | | | 4,625,000 | |
| Net Asset Value, offering and redemption price per share | | $ | 22.23 | | | $ | 44.76 | | | $ | 42.66 | | | $ | 22.65 | |
| (a) | Includes $4,152,810 of securities on loan. |
| (b) | Includes $909,227 of securities on loan. |
See Notes to Financial Statements.
23 | November 30, 2022
| RiverFront ETFs | |
| Statements of Operations | For the Year Ended November 30, 2022 |
| | | RiverFront Dynamic Core Income ETF | | | RiverFront Dynamic US Dividend Advantage ETF | | | RiverFront Dynamic US Flex-Cap ETF | | | RiverFront Strategic Income Fund | |
| INVESTMENT INCOME: | | | | | | | | | | | | |
| Interest | | $ | 1,896,767 | | | $ | – | | | $ | – | | | $ | 3,453,211 | |
| Dividends(a) | | | 93,851 | | | | 3,993,514 | | | | 541,663 | | | | 94,389 | |
| Securities Lending Income | | | – | | | | 28,442 | | | | 10,601 | | | | – | |
| Total Investment Income | | | 1,990,618 | | | | 4,021,956 | | | | 552,264 | | | | 3,547,600 | |
| | | | | | | | | | | | | | | | | |
| EXPENSES: | | | | | | | | | | | | | | | | |
| Investment adviser and sub-adviser fees (Note 3) | | | 400,166 | | | | 558,334 | | | | 177,734 | | | | 580,732 | |
| Total Expenses | | | 400,166 | | | | 558,334 | | | | 177,734 | | | | 580,732 | |
| NET INVESTMENT INCOME | | | 1,590,452 | | | | 3,463,622 | | | | 374,530 | | | | 2,966,868 | |
| | | | | | | | | | | | | | | | | |
| REALIZED AND UNREALIZED GAIN/(LOSS) | | | | | | | | | | | | | | | | |
| Net realized gain/(loss) on investments(b) | | | (4,980,857 | ) | | | 35,036,588 | | | | 10,867,396 | | | | (3,575,790 | ) |
| NET REALIZED GAIN/(LOSS) | | | (4,980,857 | ) | | | 35,036,588 | | | | 10,867,396 | | | | (3,575,790 | ) |
| Net change in unrealized depreciation on investments | | | (5,468,905 | ) | | | (36,235,123 | ) | | | (13,757,793 | ) | | | (6,970,220 | ) |
| NET CHANGE IN UNREALIZED APPRECIATION/(DEPRECIATION) | | | (5,468,905 | ) | | | (36,235,123 | ) | | | (13,757,793 | ) | | | (6,970,220 | ) |
| NET REALIZED AND UNREALIZED LOSS ON INVESTMENTS | | | (10,449,762 | ) | | | (1,198,535 | ) | | | (2,890,397 | ) | | | (10,546,010 | ) |
| NET INCREASE/(DECREASE) IN NET ASSETS RESULTING FROM OPERATIONS | | $ | (8,859,310 | ) | | $ | 2,265,087 | | | $ | (2,515,867 | ) | | $ | (7,579,142 | ) |
| (a) | Net of foreign tax withholding in the amounts of $–, $–, $– and $189, respectively. |
| (b) | Includes realized gain or loss as a result of in-kind transactions (See Note 4 in Notes to Financial Statements). |
See Notes to Financial Statements.
24 | November 30, 2022
RiverFront Dynamic Core Income ETF
Statements of Changes in Net Assets
| | | For the Year Ended November 30, 2022 | | | For the Year Ended November 30, 2021 | |
| OPERATIONS: | | | | | | |
| Net investment income | | $ | 1,590,452 | | | $ | 1,990,198 | |
| Net realized gain/(loss) | | | (4,980,857 | ) | | | 2,564,824 | |
| Net change in unrealized depreciation | | | (5,468,905 | ) | | | (6,289,006 | ) |
| Net decrease in net assets resulting from operations | | | (8,859,310 | ) | | | (1,733,984 | ) |
| | | | | | | | | |
| DISTRIBUTIONS TO SHAREHOLDERS: | | | | | | | | |
| From distributable earnings | | | (3,382,868 | ) | | | (1,962,506 | ) |
| Total distributions | | | (3,382,868 | ) | | | (1,962,506 | ) |
| | | | | | | | | |
| CAPITAL SHARE TRANSACTIONS: | | | | | | | | |
| Proceeds from sale of shares | | | 4,002,594 | | | | 17,914,173 | |
| Shares redeemed | | | (66,292,105 | ) | | | (9,068,318 | ) |
| Net increase/(decrease) from share transactions | | | (62,289,511 | ) | | | 8,845,855 | |
| | | | | | | | | |
| Net increase/(decrease) in net assets | | | (74,531,689 | ) | | | 5,149,365 | |
| | | | | | | | | |
| NET ASSETS: | | | | | | | | |
| Beginning of year | | | 117,872,871 | | | | 112,723,506 | |
| End of year | | $ | 43,341,182 | | | $ | 117,872,871 | |
| | | | | | | | | |
| OTHER INFORMATION: | | | | | | | | |
| CAPITAL SHARE TRANSACTIONS: | | | | | | | | |
| Beginning shares | | | 4,650,000 | | | | 4,300,000 | |
| Shares sold | | | 175,000 | | | | 700,000 | |
| Shares redeemed | | | (2,875,000 | ) | | | (350,000 | ) |
| Shares outstanding, end of year | | | 1,950,000 | | | | 4,650,000 | |
See Notes to Financial Statements.
25 | November 30, 2022
| RiverFront Dynamic US Dividend Advantage ETF |
| Statements of Changes in Net Assets |
| | | For the Year Ended November 30, 2022 | | | For the Year Ended November 30, 2021 | |
| OPERATIONS: | | | | | | |
| Net investment income | | $ | 3,463,622 | | | $ | 1,902,769 | |
| Net realized gain | | | 35,036,588 | | | | 8,733,483 | |
| Net change in unrealized appreciation/(depreciation) | | | (36,235,123 | ) | | | 15,974,138 | |
| Net increase in net assets resulting from operations | | | 2,265,087 | | | | 26,610,390 | |
| | | | | | | | | |
| DISTRIBUTIONS TO SHAREHOLDERS: | | | | | | | | |
| From distributable earnings | | | (3,342,217 | ) | | | (1,936,954 | ) |
| Total distributions | | | (3,342,217 | ) | | | (1,936,954 | ) |
| | | | | | | | | |
| CAPITAL SHARE TRANSACTIONS: | | | | | | | | |
| Proceeds from sale of shares | | | 54,331,616 | | | | 4,577,634 | |
| Shares redeemed | | | (92,897,556 | ) | | | (30,021,042 | ) |
| Net decrease from share transactions | | | (38,565,940 | ) | | | (25,443,408 | ) |
| | | | | | | | | |
| Net decrease in net assets | | | (39,643,070 | ) | | | (769,972 | ) |
| | | | | | | | | |
| NET ASSETS: | | | | | | | | |
| Beginning of year | | | 132,524,193 | | | | 133,294,165 | |
| End of year | | $ | 92,881,123 | | | $ | 132,524,193 | |
| | | | | | | | | |
| OTHER INFORMATION: | | | | | | | | |
| CAPITAL SHARE TRANSACTIONS: | | | | | | | | |
| Beginning shares | | | 2,950,002 | | | | 3,600,002 | |
| Shares sold | | | 1,200,000 | | | | 100,000 | |
| Shares redeemed | | | (2,075,000 | ) | | | (750,000 | ) |
| Shares outstanding, end of year | | | 2,075,002 | | | | 2,950,002 | |
See Notes to Financial Statements.
26 | November 30, 2022
| RiverFront Dynamic US Flex-Cap ETF |
| Statements of Changes in Net Assets |
| | | For the Year Ended November 30, 2022 | | | For the Year Ended November 30, 2021 | |
| OPERATIONS: | | | | | | |
| Net investment income | | $ | 374,530 | | | $ | 604,208 | |
| Net realized gain | | | 10,867,396 | | | | 10,365,533 | |
| Net change in unrealized appreciation/(depreciation) | | | (13,757,793 | ) | | | 2,789,216 | |
| Net increase/(decrease) in net assets resulting from operations | | | (2,515,867 | ) | | | 13,758,957 | |
| | | | | | | | | |
| DISTRIBUTIONS TO SHAREHOLDERS: | | | | | | | | |
| From distributable earnings | | | (438,679 | ) | | | (679,274 | ) |
| From return of capital | | | (8,648 | ) | | | – | |
| Total distributions | | | (447,327 | ) | | | (679,274 | ) |
| | | | | | | | | |
| CAPITAL SHARE TRANSACTIONS: | | | | | | | | |
| Proceeds from sale of shares | | | 15,524,015 | | | | – | |
| Shares redeemed | | | (35,496,905 | ) | | | (32,744,774 | ) |
| Net decrease from share transactions | | | (19,972,890 | ) | | | (32,744,774 | ) |
| | | | | | | | | |
| Net decrease in net assets | | | (22,936,084 | ) | | | (19,665,091 | ) |
| | | | | | | | | |
| NET ASSETS: | | | | | | | | |
| Beginning of year | | | 51,734,668 | | | | 71,399,759 | |
| End of year | | $ | 28,798,584 | | | $ | 51,734,668 | |
| | | | | | | | | |
| OTHER INFORMATION: | | | | | | | | |
| CAPITAL SHARE TRANSACTIONS: | | | | | | | | |
| Beginning shares | | | 1,125,002 | | | | 1,900,002 | |
| Shares sold | | | 350,000 | | | | – | |
| Shares redeemed | | | (800,000 | ) | | | (775,000 | ) |
| Shares outstanding, end of year | | | 675,002 | | | | 1,125,002 | |
See Notes to Financial Statements.
27 | November 30, 2022
| RiverFront Strategic Income Fund |
| Statements of Changes in Net Assets |
| | | For the Year Ended November 30, 2022 | | | For the Year Ended November 30, 2021 | |
| OPERATIONS: | | | | | | |
| Net investment income | | $ | 2,966,868 | | | $ | 2,793,818 | |
| Net realized gain/(loss) | | | (3,575,790 | ) | | | 491,816 | |
| Net change in unrealized depreciation | | | (6,970,220 | ) | | | (1,547,122 | ) |
| Net increase/(decrease) in net assets resulting from operations | | | (7,579,142 | ) | | | 1,738,512 | |
| | | | | | | | | |
| DISTRIBUTIONS TO SHAREHOLDERS: | | | | | | | | |
| From distributable earnings | | | (3,248,534 | ) | | | (3,171,669 | ) |
| Total distributions | | | (3,248,534 | ) | | | (3,171,669 | ) |
| | | | | | | | | |
| CAPITAL SHARE TRANSACTIONS: | | | | | | | | |
| Proceeds from sale of shares | | | 9,753,437 | | | | 43,888,656 | |
| Shares redeemed | | | (37,059,629 | ) | | | (18,545,978 | ) |
| Net increase/(decrease) from share transactions | | | (27,306,192 | ) | | | 25,342,678 | |
| | | | | | | | | |
| Net increase/(decrease) in net assets | | | (38,133,868 | ) | | | 23,909,521 | |
| | | | | | | | | |
| NET ASSETS: | | | | | | | | |
| Beginning of year | | | 142,893,186 | | | | 118,983,665 | |
| End of year | | $ | 104,759,318 | | | $ | 142,893,186 | |
| | | | | | | | | |
| OTHER INFORMATION: | | | | | | | | |
| CAPITAL SHARE TRANSACTIONS: | | | | | | | | |
| Beginning shares | | | 5,825,000 | | | | 4,800,000 | |
| Shares sold | | | 425,000 | | | | 1,775,000 | |
| Shares redeemed | | | (1,625,000 | ) | | | (750,000 | ) |
| Shares outstanding, end of year | | | 4,625,000 | | | | 5,825,000 | |
See Notes to Financial Statements.
28 | November 30, 2022
| RiverFront Dynamic Core Income ETF |
| Financial Highlights | For a Share Outstanding Throughout the Periods Presented |
| | | For the Year Ended November 30, 2022 | | | For the Year Ended November 30, 2021 | | | For the Year Ended November 30, 2020 | | | For the Year Ended November 30, 2019 | | | For the Year Ended November 30, 2018 | |
| NET ASSET VALUE, BEGINNING OF PERIOD | | $ | 25.35 | | | $ | 26.21 | | | $ | 25.22 | | | $ | 23.52 | | | $ | 24.60 | |
| | | | | | | | | | | | | | | | | | | | | |
| INCOME/(LOSS) FROM INVESTMENT OPERATIONS: | | | | | | | | | | | | | | | | | | | | |
| Net investment income(a) | | | 0.47 | | | | 0.47 | | | | 0.50 | | | | 0.68 | | | | 0.68 | |
| Net realized and unrealized gain/(loss) | | | (2.71 | ) | | | (0.87 | ) | | | 0.99 | | | | 1.70 | | | | (1.10 | ) |
| Total from investment operations | | | (2.24 | ) | | | (0.40 | ) | | | 1.49 | | | | 2.38 | | | | (0.42 | ) |
| | | | | | | | | | | | | | | | | | | | | |
| DISTRIBUTIONS: | | | | | | | | | | | | | | | | | | | | |
| From net investment income | | | (0.50 | ) | | | (0.46 | ) | | | (0.50 | ) | | | (0.68 | ) | | | (0.66 | ) |
| From net realized gains | | | (0.38 | ) | | | – | | | | – | | | | – | | | | – | |
| Total distributions | | | (0.88 | ) | | | (0.46 | ) | | | (0.50 | ) | | | (0.68 | ) | | | (0.66 | ) |
| | | | | | | | | | | | | | | | | | | | | |
| NET INCREASE/(DECREASE) IN NET ASSET VALUE | | | (3.12 | ) | | | (0.86 | ) | | | 0.99 | | | | 1.70 | | | | (1.08 | ) |
| NET ASSET VALUE, END OF PERIOD | | $ | 22.23 | | | $ | 25.35 | | | $ | 26.21 | | | $ | 25.22 | | | $ | 23.52 | |
| TOTAL RETURN(b) | | | (9.02 | )% | | | (1.51 | )% | | | 5.97 | % | | | 10.22 | % | | | (1.74 | )% |
| | | | | | | | | | | | | | | | | | | | | |
| RATIOS/SUPPLEMENTAL DATA: | | | | | | | | | | | | | | | | | | | | |
| Net assets, end of period (000s) | | $ | 43,341 | | | $ | 117,873 | | | $ | 112,724 | | | $ | 134,951 | | | $ | 150,527 | |
| Ratio of expenses to average net assets | | | 0.51 | % | | | 0.51 | % | | | 0.51 | % | | | 0.51 | % | | | 0.51 | % |
| Ratio of net investment income to average net assets | | | 2.03 | % | | | 1.83 | % | | | 1.94 | % | | | 2.74 | % | | | 2.83 | % |
| Portfolio turnover rate(c) | | | 50 | % | | | 45 | % | | | 11 | % | | | 6 | % | | | 15 | % |
| (a) | Based on average shares outstanding during the period. |
| (b) | Total return is calculated assuming an initial investment made at the net asset value at the beginning of the period and the redemption at the net asset value on the last day of the period and assuming all distributions are reinvested at the actual reinvestment prices. Total return calculated for a period of less than one year is not annualized. |
| (c) | Portfolio turnover for periods less than one year are not annualized and does not include securities received or delivered from processing creations or redemptions in-kind. |
See Notes to Financial Statements.
29 | November 30, 2022
| RiverFront Dynamic US Dividend Advantage ETF |
| Financial Highlights | For a Share Outstanding Throughout the Periods Presented |
| | | For the Year Ended November 30, 2022 | | | For the Year Ended November 30, 2021 | | | For the Year Ended November 30, 2020 | | | For the Year Ended November 30, 2019 | | | For the Year Ended November 30, 2018 | |
| NET ASSET VALUE, BEGINNING OF PERIOD | | $ | 44.92 | | | $ | 37.03 | | | $ | 33.98 | | | $ | 31.19 | | | $ | 31.39 | |
| | | | | | | | | | | | | | | | | | | | | |
| INCOME/(LOSS) FROM INVESTMENT OPERATIONS: | | | | | | | | | | | | | | | | | | | | |
| Net investment income(a) | | | 1.46 | | | | 0.62 | | | | 0.56 | | | | 0.65 | | | | 0.73 | |
| Net realized and unrealized gain/(loss) | | | (0.21 | ) | | | 7.90 | | | | 3.08 | | | | 2.81 | | | | (0.26 | ) |
| Total from investment operations | | | 1.25 | | | | 8.52 | | | | 3.64 | | | | 3.46 | | | | 0.47 | |
| | | | | | | | | | | | | | | | | | | | | |
| DISTRIBUTIONS: | | | | | | | | | | | | | | | | | | | | |
| From net investment income | | | (1.41 | ) | | | (0.63 | ) | | | (0.59 | ) | | | (0.67 | ) | | | (0.67 | ) |
| Total distributions | | | (1.41 | ) | | | (0.63 | ) | | | (0.59 | ) | | | (0.67 | ) | | | (0.67 | ) |
| | | | | | | | | | | | | | | | | | | | | |
| NET INCREASE/(DECREASE) IN NET ASSET VALUE | | | (0.16 | ) | | | 7.89 | | | | 3.05 | | | | 2.79 | | | | (0.20 | ) |
| NET ASSET VALUE, END OF PERIOD | | $ | 44.76 | | | $ | 44.92 | | | $ | 37.03 | | | $ | 33.98 | | | $ | 31.19 | |
| TOTAL RETURN(b) | | | 2.86 | % | | | 23.13 | % | | | 10.92 | % | | | 11.29 | % | | | 1.45 | % |
| | | | | | | | | | | | | | | | | | | | | |
| RATIOS/SUPPLEMENTAL DATA: | | | | | | | | | | | | | | | | | | | | |
| Net assets, end of period (000s) | | $ | 92,881 | | | $ | 132,524 | | | $ | 133,294 | | | $ | 130,828 | | | $ | 151,293 | |
| Ratio of expenses to average net assets | | | 0.52 | % | | | 0.52 | % | | | 0.52 | % | | | 0.52 | % | | | 0.52 | % |
| Ratio of net investment income to average net assets | | | 3.23 | % | | | 1.47 | % | | | 1.68 | % | | | 2.05 | % | | | 2.27 | % |
| Portfolio turnover rate(c) | | | 104 | % | | | 0 | % | | | 75 | % | | | 64 | % | | | 96 | % |
| (a) | Based on average shares outstanding during the period. |
| (b) | Total return is calculated assuming an initial investment made at the net asset value at the beginning of the period and the redemption at the net asset value on the last day of the period and assuming all distributions are reinvested at the actual reinvestment prices. Total return calculated for a period of less than one year is not annualized. |
| (c) | Portfolio turnover for periods less than one year are not annualized and does not include securities received or delivered from processing creations or redemptions in-kind. |
See Notes to Financial Statements.
30 | November 30, 2022
| RiverFront Dynamic US Flex-Cap ETF |
| Financial Highlights | For a Share Outstanding Throughout the Periods Presented |
| | | For the Year Ended November 30, 2022 | | | For the Year Ended November 30, 2021 | | | For the Year Ended November 30, 2020 | | | For the Year Ended November 30, 2019 | | | For the Year Ended November 30, 2018 | |
| NET ASSET VALUE, BEGINNING OF PERIOD | | $ | 45.99 | | | $ | 37.58 | | | $ | 34.70 | | | $ | 32.79 | | | $ | 32.46 | |
| | | | | | | | | | | | | | | | | | | | | |
| INCOME/(LOSS) FROM INVESTMENT OPERATIONS: | | | | | | | | | | | | | | | | | | | | |
| Net investment income(a) | | | 0.48 | | | | 0.42 | | | | 0.45 | | | | 0.48 | | | | 0.44 | |
| Net realized and unrealized gain/(loss) | | | (3.23 | ) | | | 8.43 | | | | 2.87 | (b) | | | 1.93 | | | | 0.27 | (b) |
| Total from investment operations | | | (2.75 | ) | | | 8.85 | | | | 3.32 | | | | 2.41 | | | | 0.71 | |
| | | | | | | | | | | | | | | | | | | | | |
| DISTRIBUTIONS: | | | | | | | | | | | | | | | | | | | | |
| From net investment income | | | (0.57 | ) | | | (0.44 | ) | | | (0.44 | ) | | | (0.50 | ) | | | (0.38 | ) |
| Tax return of capital | | | (0.01 | ) | | | – | | | | – | | | | – | | | | – | |
| Total distributions | | | (0.58 | ) | | | (0.44 | ) | | | (0.44 | ) | | | (0.50 | ) | | | (0.38 | ) |
| | | | | | | | | | | | | | | | | | | | | |
| NET INCREASE/(DECREASE) IN NET ASSET VALUE | | | (3.33 | ) | | | 8.41 | | | | 2.88 | | | | 1.91 | | | | 0.33 | |
| NET ASSET VALUE, END OF PERIOD | | $ | 42.66 | | | $ | 45.99 | | | $ | 37.58 | | | $ | 34.70 | | | $ | 32.79 | |
| TOTAL RETURN(c) | | | (5.98 | )% | | | 23.65 | % | | | 9.75 | % | | | 7.49 | % | | | 2.16 | % |
| | | | | | | | | | | | | | | | | | | | | |
| RATIOS/SUPPLEMENTAL DATA: | | | | | | | | | | | | | | | | | | | | |
| Net assets, end of period (000s) | | $ | 28,799 | | | $ | 51,735 | | | $ | 71,400 | | | $ | 126,662 | | | $ | 152,464 | |
| Ratio of expenses to average net assets | | | 0.52 | % | | | 0.52 | % | | | 0.52 | % | | | 0.52 | % | | | 0.52 | % |
| Ratio of net investment income to average net assets | | | 1.10 | % | | | 0.97 | % | | | 1.34 | % | | | 1.46 | % | | | 1.30 | % |
| Portfolio turnover rate(d) | | | 113 | % | | | 5 | % | | | 99 | % | | | 98 | % | | | 152 | % |
| (a) | Based on average shares outstanding during the period. |
| (b) | Net realized and unrealized gain on investments per share does not correlate to the aggregate of the net realized and unrealized gain/(loss) in the Statements of Operations for the period(s) presented, primarily due to the timing of the sales and repurchases of the Fund's shares in relation to the fluctuating market values for the Fund's portfolio. |
| (c) | Total return is calculated assuming an initial investment made at the net asset value at the beginning of the period and the redemption at the net asset value on the last day of the period and assuming all distributions are reinvested at the actual reinvestment prices. Total return calculated for a period of less than one year is not annualized. |
| (d) | Portfolio turnover for periods less than one year are not annualized and does not include securities received or delivered from processing creations or redemptions in-kind. |
See Notes to Financial Statements.
31 | November 30, 2022
| RiverFront Strategic Income Fund |
| Financial Highlights | For a Share Outstanding Throughout the Periods Presented |
| | | For the Year Ended November 30, 2022 | | | For the Year Ended November 30, 2021 | | | For the Year Ended November 30, 2020 | | | For the Year Ended November 30, 2019 | | | For the Year Ended November 30, 2018 | |
| NET ASSET VALUE, BEGINNING OF PERIOD | | $ | 24.53 | | | $ | 24.79 | | | $ | 24.69 | | | $ | 24.27 | | | $ | 25.21 | |
| | | | | | | | | | | | | | | | | | | | | |
| INCOME/(LOSS) FROM INVESTMENT OPERATIONS: | | | | | | | | | | | | | | | | | | | | |
| Net investment income(a) | | | 0.55 | | | | 0.55 | | | | 0.81 | | | | 0.94 | | | | 1.06 | |
| Net realized and unrealized gain/(loss) | | | (1.82 | ) | | | (0.18 | ) | | | 0.13 | (b) | | | 0.48 | | | | (0.92 | ) |
| Total from investment operations | | | (1.27 | ) | | | 0.37 | | | | 0.94 | | | | 1.42 | | | | 0.14 | |
| | | | | | | | | | | | | | | | | | | | | |
| DISTRIBUTIONS: | | | | | | | | | | | | | | | | | | | | |
| From net investment income | | | (0.61 | ) | | | (0.63 | ) | | | (0.84 | ) | | | (1.00 | ) | | | (1.08 | ) |
| Total distributions | | | (0.61 | ) | | | (0.63 | ) | | | (0.84 | ) | | | (1.00 | ) | | | (1.08 | ) |
| | | | | | | | | | | | | | | | | | | | | |
| | | | | | | | | | | | | | | | | | | | | |
| NET INCREASE/(DECREASE) IN NET ASSET VALUE | | | (1.88 | ) | | | (0.26 | ) | | | 0.10 | | | | 0.42 | | | | (0.94 | ) |
| NET ASSET VALUE, END OF PERIOD | | $ | 22.65 | | | $ | 24.53 | | | $ | 24.79 | | | $ | 24.69 | | | $ | 24.27 | |
| TOTAL RETURN(c) | | | (5.20 | )% | | | 1.52 | % | | | 3.95 | % | | | 5.96 | % | | | 0.57 | % |
| | | | | | | | | | | | | | | | | | | | | |
| RATIOS/SUPPLEMENTAL DATA: | | | | | | | | | | | | | | | | | | | | |
| Net assets, end of period (000s) | | $ | 104,759 | | | $ | 142,893 | | | $ | 118,984 | | | $ | 167,889 | | | $ | 152,880 | |
| | | | | | | | | | | | | | | | | | | | | |
| Ratio of expenses excluding waiver/reimbursement to average net assets | | | 0.46 | % | | | 0.46 | % | | | 0.46 | % | | | 0.46 | % | | | 0.46 | % |
| Ratio of expenses including waiver/reimbursement to average net assets | | | 0.46 | % | | | 0.46 | % | | | 0.46 | % | | | 0.46 | % | | | 0.17 | %(d) |
| Ratio of net investment income including expenses waiver/reimbursement to average net assets | | | 2.35 | % | | | 2.23 | % | | | 3.32 | % | | | 3.83 | % | | | 4.31 | % |
| Portfolio turnover rate(e) | | | 24 | % | | | 50 | % | | | 54 | % | | | 44 | % | | | 35 | % |
| (a) | Based on average shares outstanding during the period. |
| (b) | Net realized and unrealized gain on investments per share does not correlate to the aggregate of the net realized and unrealized gain/(loss) in the Statements of Operations for the period(s) presented, primarily due to the timing of the sales and repurchases of the Fund's shares in relation to the fluctuating market values for the Fund's portfolio. |
| (c) | Total return is calculated assuming an initial investment made at the net asset value at the beginning of the period and the redemption at the net asset value on the last day of the period and assuming all distributions are reinvested at the actual reinvestment prices. Total return calculated for a period of less than one year is not annualized. |
| (d) | Effective November 1, 2018, the Fund’s management fee consists of a fee of 0.11% paid to the Fund’s investment adviser and a fee of 0.35% paid to the Fund’s sub-adviser. The Fund’s sub-adviser ceased its voluntary waiver effective November 1, 2018. |
| (e) | Portfolio turnover for periods less than one year are not annualized and does not include securities received or delivered from processing creations or redemptions in-kind. |
See Notes to Financial Statements.
32 | November 30, 2022
| RiverFront ETFs | |
| Notes to Financial Statements | November 30, 2022 |
1. ORGANIZATION
ALPS ETF Trust (the “Trust”), a Delaware statutory trust, is an open-end management investment company registered under the Investment Company Act of 1940, as amended (the “1940 Act”). As of November 30, 2022, the Trust consisted of twenty-three separate portfolios. Each portfolio represents a separate series of the Trust. This report pertains solely to the RiverFront Dynamic Core Income ETF, the RiverFront Dynamic US Dividend Advantage ETF, the RiverFront Dynamic US Flex-Cap ETF, and the RiverFront Strategic Income Fund (each a “Fund” and collectively, the “Funds”).
The investment objective of the RiverFront Dynamic Core Income ETF Fund is to seek total return, with an emphasis on income as the source of that total return. The investment objective of the RiverFront Dynamic US Dividend Advantage ETF Fund is to seek to provide capital appreciation and dividend income. The investment objective of the RiverFront Dynamic US Flex-Cap ETF Fund is to seek to provide capital appreciation. The investment objective of the RiverFront Strategic Income Fund is to seek total return, with an emphasis on income as the source of that total return. Each Fund has elected to qualify as a diversified series of the Trust under the 1940 Act
Each Fund’s Shares (“Shares”) are listed on the NYSE Arca, Inc. (the “NYSE Arca”). Each Fund issues and redeems Shares, at net asset value (“NAV”) in blocks of 25,000 Shares, each of which is called a “Creation Unit”. Creation Units are issued and redeemed principally in-kind for securities and/or cash. Except when aggregated in Creation Units, Shares are not redeemable securities of a Fund.
Pursuant to the Trust’s organizational documents, its Officers and Trustees are indemnified against certain liability arising out of the performance of their duties to the Trust. Additionally, in the normal course of business, the Trust enters into contracts with service providers that contain general indemnification clauses. The Trust’s maximum exposure under these arrangements is unknown, as this would involve future claims that may be made against the Trust that have not yet occurred.
2. SIGNIFICANT ACCOUNTING POLICIES
The following is a summary of significant accounting policies consistently followed by the Funds in the preparation of the financial statements. The accompanying financial statements were prepared in accordance with accounting principles generally accepted in the United States of America (“U.S. GAAP”). The preparation of financial statements in conformity with U.S. GAAP requires management to make certain estimates and assumptions that affect the reported amounts of assets and liabilities and disclosures of contingent assets and liabilities at the date of the financial statements and the reported amounts of revenue and expenses during the period. Actual results could differ from those estimates. Each Fund is considered an investment company under U.S. GAAP and follows the accounting and reporting guidance applicable to investment companies in the Financial Accounting Standards Board (“FASB”) Accounting Standards Codification Topic 946.
A. Portfolio Valuation
Each Fund’s NAV is determined daily, as of the close of regular trading on the New York Stock Exchange (the “NYSE”), normally 4:00 p.m. Eastern Time, on each day the NYSE is open for trading. The NAV is computed by dividing the value of all assets of each Fund (including accrued interest and dividends), less all liabilities (including accrued expenses and dividends declared but unpaid), by the total number of shares outstanding.
Portfolio securities listed on any exchange other than the NASDAQ Stock Market LLC (“NASDAQ”) are valued at the last sale price on the business day as of which such value is being determined. If there has been no sale on such day, the securities are valued at the mean of the most recent bid and ask prices on such day. Securities traded on the NASDAQ are valued at the NASDAQ Official Closing Price as determined by NASDAQ. Portfolio securities traded on more than one securities exchange are valued at the last sale price on the business day as of which such value is being determined at the close of the exchange representing the principal market for such securities. Portfolio securities traded in the over-the-counter market, but excluding securities traded on the NASDAQ, are valued at the last quoted sale price in such market.
Corporate bonds and United States government bonds are typically valued at the mean between the evaluated bid and ask prices formulated by an independent pricing service.
Each Fund’s investments are valued at market value or, in the absence of market value with respect to any portfolio securities, at fair value according to procedures adopted by the Trust’s Board of Trustees (the “Board”). Pursuant to Rule 2a-5 under the 1940 Act, the Board designated ALPS Advisors, Inc. (the "Adviser") as the valuation designee ("Valuation Designee") for each Fund to perform the fair value determinations relating to Fund investments. The Adviser may carry out its designated responsibilities as Valuation Designee through various teams and committees. When market quotations are not readily available or when events occur that make established valuation methods unreliable, securities of the Funds may be valued in good faith by the Valuation Designee. These securities generally include, but are not limited to, restricted securities (securities which may not be publicly sold without registration under the Securities Act of 1933) for which a pricing service is unable to provide a market price; securities whose trading has been formally suspended; a security whose market price is not available from a pre-established primary pricing source or the pricing source is not willing to provide a price; a security with respect to which an event has occurred that is most likely to materially affect the value of the security after the market has closed but before the calculation of a Fund’s NAV or make it difficult or impossible to obtain a reliable market quotation; or a security whose price, as provided by the pricing service, does not reflect the security’s “fair value” due to the security being de-listed from a national exchange or the security’s primary trading market is temporarily closed at a time when, under normal conditions, it would be open. As a general principle, the current “fair value” of a security would be the amount which the owner might reasonably expect to receive from the sale on the applicable exchange or principal market. A variety of factors may be considered in determining the fair value of such securities.
33 | November 30, 2022
| RiverFront ETFs | |
| Notes to Financial Statements | November 30, 2022 |
B. Fair Value Measurements
Each Fund discloses the classification of its fair value measurements following a three-tier hierarchy based on the inputs used to measure fair value. Inputs refer broadly to the assumptions that market participants would use in pricing the asset or liability, including assumptions about risk. Inputs may be observable or unobservable. Observable inputs reflect the assumptions market participants would use in pricing the asset or liability that are developed based on market data obtained from sources independent of the reporting entity. Unobservable inputs reflect the reporting entity’s own assumptions about the assumptions market participants would use in pricing the asset or liability that are developed based on the best information available.
Valuation techniques used to value the Funds’ investments by major category are as follows:
Equity securities, including restricted securities, for which market quotations are readily available, are valued at the last reported sale price or official closing price as reported by a third party pricing vendor on the primary market or exchange on which they are traded and are categorized as Level 1 in the hierarchy. In the event there were no sales during the day or closing prices are not available, securities are valued at the mean of the most recent quoted bid and ask prices on such day and are generally categorized as Level 2 in the hierarchy. Investments in open-end mutual funds are valued at their closing NAV each business day and are categorized as Level 1 in the hierarchy.
Debt securities, including restricted securities, are valued based on evaluated prices received from third party pricing vendors or from brokers who make markets in such securities. For corporate bonds, pricing vendors utilize matrix pricing which considers yield or price of bonds of comparable quality, coupon, maturity and type as well as broker-supplied prices. When independent prices are unavailable or unreliable, debt securities may be valued utilizing pricing methodologies which consider similar factors that would be used by third party pricing vendors. Debt securities are generally categorized as Level 2 in the hierarchy but may be Level 3 depending on the circumstances. The RiverFront Dynamic Core Income ETF and the RiverFront Strategic Income Fund may invest a significant portion of their assets in below investment grade securities. The value of these securities can be more volatile due to changes in the credit quality of the issuer and is sensitive to changes in economic, market and regulatory conditions.
Changes in valuation techniques may result in transfers in or out of an assigned level within the disclosure hierarchy.
Various inputs are used in determining the value of each Fund’s investments as of the end of the reporting period. When inputs used fall into different levels of the fair value hierarchy, the level in the hierarchy within which the fair value measurement falls is determined based on the lowest level input that is significant to the fair value measurement in its entirety. The designated input levels are not necessarily an indication of the risk or liquidity associated with these investments.
These inputs are categorized in the following hierarchy under applicable financial accounting standards:
| Level 1 – | Unadjusted quoted prices in active markets for identical investments, unrestricted assets or liabilities that a Fund has the ability to access at the measurement date; |
| | |
| Level 2 – | Quoted prices which are not active, quoted prices for similar assets or liabilities in active markets or inputs other than quoted prices that are observable (either directly or indirectly) for substantially the full term of the asset or liability; and |
| | |
| Level 3 – | Significant unobservable prices or inputs (including the Fund’s own assumptions in determining the fair value of investments) where there is little or no market activity for the asset or liability at the measurement date. |
34 | November 30, 2022
| RiverFront ETFs | |
| Notes to Financial Statements | November 30, 2022 |
The following is a summary of the inputs used to value the Funds’ investments as of November 30, 2022:
RiverFront Dynamic Core Income ETF
| Investments in Securities at Value | | Level 1 - Quoted and Unadjusted Prices | | | Level 2 - Other Significant Observable Inputs | | | Level 3 - Significant Unobservable Inputs | | | Total | |
| Corporate Bonds* | | $ | – | | | $ | 29,522,293 | | | $ | – | | | $ | 29,522,293 | |
| Government Bonds | | | – | | | | 9,873,648 | | | | – | | | | 9,873,648 | |
| Short Term Investments | | | 3,677,839 | | | | – | | | | – | | | | 3,677,839 | |
| Total | | $ | 3,677,839 | | | $ | 39,395,941 | | | $ | – | | | $ | 43,073,780 | |
RiverFront Dynamic US Dividend Advantage ETF
| Investments in Securities at Value | | Level 1 - Quoted and Unadjusted Prices | | | Level 2 - Other Significant Observable Inputs | | | Level 3 - Significant Unobservable Inputs | | | Total | |
| Common Stocks* | | $ | 92,657,653 | | | $ | – | | | $ | – | | | $ | 92,657,653 | |
| Short Term Investments | | | 1,153,845 | | | | – | | | | – | | | | 1,153,845 | |
| Total | | $ | 93,811,498 | | | $ | – | | | $ | – | | | $ | 93,811,498 | |
RiverFront Dynamic US Flex-Cap ETF
| Investments in Securities at Value | | Level 1 - Quoted and Unadjusted Prices | | | Level 2 - Other Significant Observable Inputs | | | Level 3 - Significant Unobservable Inputs | | | Total | |
| Common Stocks* | | $ | 28,754,917 | | | $ | – | | | $ | – | | | $ | 28,754,917 | |
| Short Term Investments | | | 294,546 | | | | – | | | | – | | | | 294,546 | |
| Total | | $ | 29,049,463 | | | $ | – | | | $ | – | | | $ | 29,049,463 | |
RiverFront Strategic Income Fund
| | | | | | | | | | | | | |
| Investments in Securities at Value | | Level 1 - Quoted and Unadjusted Prices | | | Level 2 - Other Significant Observable Inputs | | | Level 3 - Significant Unobservable Inputs | | | Total | |
| Corporate Bonds* | | $ | – | | | $ | 80,248,030 | | | $ | – | | | $ | 80,248,030 | |
| Government Bonds | | | – | | | | 17,284,775 | | | | – | | | | 17,284,775 | |
| Short Term Investments | | | 6,170,456 | | | | – | | | | – | | | | 6,170,456 | |
| Total | | $ | 6,170,456 | | | $ | 97,532,805 | | | $ | – | | | $ | 103,703,261 | |
| * | | For a detailed sector breakdown, see the accompanying Schedule of Investments. |
The Funds did not have any securities that used significant unobservable inputs (Level 3) in determining fair value and there were no transfers into or out of Level 3 during the year ended November 30, 2022.
C. Securities Transactions and Investment Income
Securities transactions are recorded as of the trade date. Realized gains and losses from securities transactions are recorded on the specific identification in accordance with GAAP. Dividend income and capital gains distributions, if any, are recorded on the ex-dividend date. Interest income, if any, is recorded on the accrual basis, including amortization of premiums and accretion of discounts.
D. Dividends and Distributions to Shareholders
Dividends from net investment income for each Fund, if any, are declared and paid monthly or as the Board may determine from time to time. Distributions of net realized capital gains earned by the Funds, if any, are distributed at least annually.
35 | November 30, 2022
| RiverFront ETFs | |
| Notes to Financial Statements | November 30, 2022 |
E. Federal Tax and Tax Basis Information
The timing and character of income and capital gain distributions are determined in accordance with income tax regulations, which may differ from U.S. GAAP. Reclassifications are made to the Funds’ capital accounts for permanent tax differences to reflect income and gains available for distribution (or available capital loss carryforwards) under income tax regulations.
For the year ended November 30, 2022, the following reclassifications, which had no impact on results of operations or net assets, were recorded to reflect permanent tax differences resulting primarily from in-kind transactions:
| Fund | | Paid-in Capital | | | Total Distributable Earnings/(Accumulated Losses) | |
| RiverFront Dynamic Core Income ETF | | $ | (3,424,267 | ) | | $ | 3,424,267 | |
| RiverFront Dynamic US Dividend Advantage ETF | | | 24,004,192 | | | | (24,004,192 | ) |
| RiverFront Dynamic US Flex-Cap ETF | | | 8,537,767 | | | | (8,537,767 | ) |
| RiverFront Strategic Income Fund | | | (2,595,715 | ) | | | 2,595,715 | |
The tax character of the distributions paid during the fiscal years ended November 30, 2022 and November 30, 2021 was as follows:
| Fund | | Ordinary Income | | | Long-Term Capital Gain | | | Return of Capital | |
| November 30, 2022 | | | | | | | | | |
| RiverFront Dynamic Core Income ETF | | $ | 1,672,309 | | | $ | 1,710,559 | | | $ | – | |
| RiverFront Dynamic US Dividend Advantage ETF | | | 3,342,217 | | | | – | | | | – | |
| RiverFront Dynamic US Flex-Cap ETF | | | 438,679 | | | | – | | | | 8,648 | |
| RiverFront Strategic Income Fund | | | 3,248,534 | | | | – | | | | – | |
| Fund | | Ordinary Income | | | Long-Term Capital Gain | | | Return of Capital | |
| November 30, 2021 | | | | | | | | | |
| RiverFront Dynamic Core Income ETF | | $ | 1,962,506 | | | $ | – | | | $ | – | |
| RiverFront Dynamic US Dividend Advantage ETF | | | 1,936,954 | | | | – | | | | – | |
| RiverFront Dynamic US Flex-Cap ETF | | | 679,274 | | | | – | | | | – | |
| RiverFront Strategic Income Fund | | | 3,171,669 | | | | – | | | | – | |
The character of distributions made during the year may differ from its ultimate characterization for federal income tax purposes.
Under current law, capital losses maintain their character as short-term or long-term and are carried forward to the next tax year without expiration.
As of November 30, 2022, the following amounts are available as carry forwards to the next tax year:
| Fund | | Short-Term | | | Long-Term | |
| RiverFront Dynamic Core Income ETF | | $ | 1,548,757 | | | $ | 61,907 | |
| RiverFront Dynamic US Dividend Advantage ETF | | | 6,171,196 | | | | – | |
| RiverFront Dynamic US Flex-Cap ETF | | | 13,271,258 | | | | 8,624,493 | |
| RiverFront Strategic Income Fund | | | 7,632,679 | | | | 3,389,052 | |
During the year ended November 30, 2022, the Funds utilized the following capital loss carryovers:
| Fund | | | |
| RiverFront Dynamic Core Income ETF | | $ | – | |
| RiverFront Dynamic US Dividend Advantage ETF | | | 11,032,391 | |
| RiverFront Dynamic US Flex-Cap ETF | | | 2,275,780 | |
| RiverFront Strategic Income Fund | | | – | |
36 | November 30, 2022
| RiverFront ETFs | |
| Notes to Financial Statements | November 30, 2022 |
As of November 30, 2022, the components of distributable earnings/(accumulated losses) on a tax basis for each Fund were as follows:
| Fund | | Undistributed Net Investment Income | | | Accumulated Net Realized Gain on Investments | | | Net Unrealized Appreciation on Investments | | | Total | |
| RiverFront Dynamic Core Income ETF | | | 5,306 | | | $ | (1,610,664 | ) | | $ | (3,598,569 | ) | | $ | (5,203,927 | ) |
| RiverFront Dynamic US Dividend Advantage ETF | | | 17,848 | | | | (6,171,196 | ) | | | 2,722,513 | | | | (3,430,835 | ) |
| RiverFront Dynamic US Flex-Cap ETF | | | – | | | | (21,895,751 | ) | | | 1,756,887 | | | | (20,138,864 | ) |
| RiverFront Strategic Income Fund | | | 1,801 | | | | (11,021,731 | ) | | | (7,300,191 | ) | | | (18,320,121 | ) |
As of November 30, 2022, the cost of investments for federal income tax purposes and accumulated net unrealized appreciation/(depreciation) on investments were as follows:
| Fund | | RiverFront Dynamic Core Income ETF | | | RiverFront Dynamic US Dividend Advantage ETF | | | RiverFront Dynamic US Flex- Cap ETF | | | RiverFront Strategic Income Fund | |
| Gross appreciation (excess of value over tax cost) | | $ | 105,061 | | | $ | 9,306,674 | | | $ | 4,260,950 | | | $ | (195,572 | ) |
| Gross depreciation (excess of tax cost over value) | | | (3,703,630 | ) | | | (6,584,161 | ) | | | (2,504,063 | ) | | | (7,104,619 | ) |
| Net unrealized appreciation/(depreciation) | | | (3,598,569 | ) | | | 2,722,513 | | | | 1,756,887 | | | | (7,300,191 | ) |
| Cost of investments for income tax purposes | | $ | 46,672,349 | | | $ | 91,088,985 | | | $ | 27,292,576 | | | $ | 111,003,452 | |
The differences between book-basis and tax-basis are primarily due to the deferral of losses from wash sales and difference between premium amortization due to Accounting Standards Update 2017-08 and adjustments from partnership basis.
F. Income Taxes
No provision for income taxes is included in the accompanying financial statements, as each Fund intends to distribute to shareholders all taxable investment income and realized gains and otherwise comply with Subchapter M of the Internal Revenue Code of 1986, as amended, applicable to regulated investment companies. Each Fund evaluates tax positions taken (or expected to be taken) in the course of preparing the Funds’ tax returns to determine whether these positions meet a “more-likely-than-not” standard that, based on the technical merits, have a more than fifty percent likelihood of being sustained by a taxing authority upon examination. A tax position that meets the “more-likely-than-not” recognition threshold is measured to determine the amount of benefit to recognize in the financial statements.
As of and during the year ended November 30, 2022, each Fund did not have a liability for any unrecognized tax benefits. Each Fund files U.S. federal, state, and local tax returns as required. Each Fund’s tax returns are subject to examination by the relevant tax authorities until expiration of the applicable statute of limitations, which is generally three years after the filing of the tax return, but may extend to four years in certain jurisdictions. Each Fund’s tax returns for open years have incorporated no uncertain tax positions that require a provision for income taxes.
G. Lending of Portfolio Securities
The RiverFront Dynamic US Dividend Advantage ETF and the RiverFront Dynamic US Flex-Cap ETF have entered into a securities lending agreement with State Street Bank & Trust Co. (“SSB”), the Funds’ lending agent. Each Fund may lend its portfolio securities only to borrowers that are approved by SSB. Each Fund will limit such lending to not more than 33 1/3% of the value of its total assets. Each Fund’s securities held at SSB as custodian shall be available to be lent except those securities the Fund or ALPS Advisors, Inc. specifically identifies in writing as not being available for lending. The borrower pledges and maintains with the Fund collateral consisting of cash (U.S. Dollars only), securities issued or guaranteed by the U.S. government or its agencies or instrumentalities, and cash equivalents (including irrevocable bank letters of credit) issued by a person other than the borrower or an affiliate of the borrower. The initial collateral received by each Fund is required to have a value of no less than 102% of the market value of the loaned securities for U.S equity securities and a value of no less than 105% of the market value for non-U.S. equity securities. The collateral is maintained thereafter, at a market value equal to not less than 102% of the current value of the U.S. equity securities on loan and not less than 105% of the current value of the non-U.S. equity securities on loan. The market value of the loaned securities is determined at the close of each business day and any additional required collateral is delivered to each Fund on the next business day. During the term of the loan, each Fund is entitled to all distributions made on or in respect of the loaned securities. Loans of securities are terminable at any time and the borrower, after notice, is required to return borrowed securities within the customary time period for settlement of securities transactions.
Any cash collateral received is reinvested in a money market fund managed by SSB as disclosed in the Fund’s Schedule of Investments and is reflected in the Statements of Assets and Liabilities as a payable for collateral upon return of securities loaned. Non-cash collateral, in the form of securities issued or guaranteed by the U.S. government or its agencies or instrumentalities, is not disclosed in the Fund’s Statements of Assets and Liabilities as it is held by the lending agent on behalf of the Fund, and the Fund does not have the ability to re-hypothecate these securities. Income earned by the Fund from securities lending activity is disclosed in the Statement of Operations.
37 | November 30, 2022
| RiverFront ETFs | |
| Notes to Financial Statements | November 30, 2022 |
The following is a summary of the Funds' securities lending agreement and related cash and non-cash collateral received as of November 30, 2022:
| Fund | | Market Value of Securities on Loan | | | Cash Collateral Received | | | Non-Cash Collateral Received | | | Total Collateral Received | |
| RiverFront Dynamic US Dividend Advantage ETF | | $ | 4,152,810 | | | $ | 1,074,218 | | | $ | 3,112,750 | | | $ | 4,186,968 | |
| RiverFront Dynamic US Flex-Cap ETF | | | 909,227 | | | | 289,041 | | | | 613,651 | | | | 902,692 | |
The risks of securities lending include the risk that the borrower may not provide additional collateral when required or may not return the securities when due. To mitigate these risks, the Funds benefit from a borrower default indemnity provided by SSB. SSB’s indemnity allows for full replacement of securities lent wherein SSB will purchase the unreturned loaned securities on the open market by applying the proceeds of the collateral, or to the extent such proceeds are insufficient or the collateral is unavailable, SSB will purchase the unreturned loan securities at SSB’s expense. However, the Funds could suffer a loss if the value of the investments purchased with cash collateral falls below the value of the cash collateral received. As of November 30, 2022, Riverfront Dynamic Core Income Fund ETF and the Riverfront Strategic Income Fund did not have any securities on loan.
The following table reflects a breakdown of transactions accounted for as secured borrowings, the gross obligation by the type of collateral pledged or securities loaned, and the remaining contractual maturity of those transactions as of November 30, 2022:
| RiverFront Dynamic US Dividend Advantage ETF | | Remaining Contractual Maturity of the Agreements | |
| Securities Lending Transactions | | Overnight & Continuous | | | Up to 30 Days | | | 30-90 Days | | | Greater than 90 Days | | | Total | |
| Common Stocks | | $ | 1,074,218 | | | $ | – | | | $ | – | | | $ | – | | | $ | 1,074,218 | |
| Total Borrowings | | | | | | | | | | | | | | | | | | | 1,074,218 | |
| Gross amount of recognized liabilities for securities lending (collateral received) | | | | | | | | | | | | | | | $ | 1,074,218 | |
| RiverFront Dynamic US Flex-Cap ETF | | Remaining Contractual Maturity of the Agreements | |
| Securities Lending Transactions | | Overnight & Continuous | | | Up to 30 Days | | | 30-90 Days | | | Greater than 90 Days | | | Total | |
| Common Stocks | | $ | 289,041 | | | $ | – | | | $ | – | | | $ | – | | | $ | 289,041 | |
| Total Borrowings | | | | | | | | | | | | | | | | | | | 289,041 | |
| Gross amount of recognized liabilities for securities lending (collateral received) | | | | | | | | | | | | | | | $ | 289,041 | |
3. INVESTMENT ADVISORY FEE AND OTHER AFFILIATED TRANSACTIONS
ALPS Advisors, Inc. serves as the Funds’ investment adviser pursuant to an Investment Advisory Agreement with the Trust on behalf of each Fund (the “Advisory Agreement”). Pursuant to the Advisory Agreement, each Fund pays the Adviser an annual management fee for the services and facilities it provides, payable on a monthly basis as a percentage of the relevant Fund’s average daily net assets as set out below:
| Fund | Advisory Fee |
| RiverFront Dynamic Core Income ETF | 0.51%(a) |
| RiverFront Dynamic US Dividend Advantage ETF | 0.52%(b) |
| RiverFront Dynamic US Flex-Cap ETF | 0.52%(b) |
| RiverFront Strategic Income Fund | 0.11% |
| (a) | The unitary advisory fee as a percentage of net assets is subject to the following breakpoints: (i) 0.51% for average net assets up to $600 million, (ii) 0.48% for average net assets equal to or greater than $600 million. |
| (b) | The unitary advisory fee as a percentage of net assets is subject to the following breakpoints: (i) 0.52% for average net assets up to $600 million, (ii) 0.49% for average net assets equal to or greater than $600 million. |
Out of the unitary management fee, the Adviser pays substantially all expenses of each Fund, including the cost of transfer agency, custody, fund administration, legal, audit, trustees and other services, except for interest expenses, distribution fees or expenses, brokerage expenses, taxes and extraordinary expenses not incurred in the ordinary course of each Fund's business. The Adviser’s unitary management fee is designed to pay substantially all of each Fund's expenses and to compensate the Adviser for providing services for each Fund.
ALPS Fund Services, Inc., an affiliate of the Adviser, is the administrator for the Funds.
38 | November 30, 2022
| RiverFront ETFs | |
| Notes to Financial Statements | November 30, 2022 |
RiverFront Investment Group, LLC (the “Sub-Adviser”) serves as each Fund’s sub-adviser pursuant to a sub-advisory agreement with the Trust (the ‘‘Sub-Advisory Agreement’’). Pursuant to the Sub-Advisory Agreement, the Adviser pays the Sub-Adviser a sub-advisory fee out of the Adviser’s advisory fee for the services it provides besides RiverFront Strategic Income Fund, in which the Fund directly pays the Sub-Adviser. The fee is payable on a monthly basis at the annual rate of the relevant Fund’s average daily net assets as set out below:
| Fund | Sub-Advisory Fee |
| RiverFront Dynamic Core Income ETF | 0.35% |
| RiverFront Dynamic US Dividend Advantage ETF | 0.35% |
| RiverFront Dynamic US Flex-Cap ETF | 0.35% |
| RiverFront Strategic Income Fund | 0.35% |
Effective February 16, 2022, each Trustee receives (1) a quarterly retainer of $20,000, (2) a per meeting fee of $10,000, (3) $2,500 for any special meeting held outside of a regularly scheduled board meeting, and (4) reimbursement for all reasonable out-of-pocket expenses relating to attendance at meetings. In addition, the Chairman of the Board receives a quarterly retainer of $5,000, the Chairman of the Audit Committee receives a quarterly retainer of $3,000, and the Chairman of the Nominating & Governance Committee receives a quarterly retainer of $2,000, each in connection with their respective roles. Prior to February 16, 2022, each Trustee received (1) a quarterly retainer of $10,000, (2) a per meeting fee of $5,000, (3) $1,500 for any special meeting held outside of a regularly scheduled board meeting, and (4) reimbursement for all reasonable out-of-pocket expenses relating to attendance at meetings. In addition, the Chairman of the Board and Chairman of the Audit Committee each received a quarterly retainer of $2,000, in connection with their respective roles.
4. PURCHASES AND SALES OF SECURITIES
For the year ended November 30, 2022, the cost of purchases and proceeds from sales of investment securities, excluding in-kind transactions and short-term investments, were as follows:
| Fund | | Purchases | | | Sales | |
| RiverFront Dynamic Core Income ETF | | $ | 41,714,979 | | | $ | 34,068,075 | |
| RiverFront Dynamic US Dividend Advantage ETF | | | 111,744,295 | | | | 112,246,757 | |
| RiverFront Dynamic US Flex-Cap ETF | | | 39,116,515 | | | | 39,008,134 | |
| RiverFront Strategic Income Fund | | | 38,193,103 | | | | 27,401,437 | |
For the year ended November 30, 2022, the cost of U.S. Government security purchases and proceeds from U.S. Government security sales were as follows:
| Fund | | Purchases | | | Sales | |
| RiverFront Dynamic Core Income ETF | | $ | 9,814,483 | | | $ | 12,702,749 | |
| RiverFront Strategic Income Fund | | | 23,601,598 | | | | 9,054,157 | |
For the year ended November 30, 2022, the cost of in-kind purchases and proceeds from in-kind sales were as follows:
| Fund | | Purchases | | | Sales | |
| RiverFront Dynamic Core Income ETF | | $ | 3,825,373 | | | $ | 64,850,217 | |
| RiverFront Dynamic US Dividend Advantage ETF | | | 54,302,542 | | | | 91,491,711 | |
| RiverFront Dynamic US Flex-Cap ETF | | | 15,496,108 | | | | 35,436,731 | |
| RiverFront Strategic Income Fund | | | 9,687,437 | | | | 36,708,306 | |
For the year ended November 30, 2022, the in-kind net realized gains/(losses) were as follows:
| Fund | | Net Realized Gain/(Loss) | |
| RiverFront Dynamic Core Income ETF | | $ | (3,379,697 | ) |
| RiverFront Dynamic US Dividend Advantage ETF | | | 23,881,797 | |
| RiverFront Dynamic US Flex-Cap ETF | | | 8,589,304 | |
| RiverFront Strategic Income Fund | | | (2,502,238 | ) |
Gains on in-kind transactions are not considered taxable for federal income tax purposes and losses on in-kind transactions are also not deductible for tax purposes.
39 | November 30, 2022
| RiverFront ETFs | |
| Notes to Financial Statements | November 30, 2022 |
5. CAPITAL SHARE TRANSACTIONS
Shares are created and redeemed by each Fund only in Creation Unit size aggregations of 25,000 Shares. Only broker-dealers or large institutional investors with creation and redemption agreements called Authorized Participants (“AP”) are permitted to purchase or redeem Creation Units from each Fund. Such transactions are generally permitted on an in-kind basis, with a balancing cash component to equate the transaction to the NAV per unit of each Fund on the transaction date. Cash may be substituted equivalent to the value of certain securities generally when they are not available in sufficient quantity for delivery, not eligible for trading by the AP or as a result of other market circumstances.
6. RELATED PARTY TRANSACTIONS
The Riverfront Dynamic US Dividend Advantage ETF and the Riverfront Dynamic US Flex-Cap ETF engaged in cross trades between other funds in the Trust during the year ended November 30, 2022 pursuant to Rule 17a-7 under the 1940 Act. Cross trading is the buying or selling of portfolio securities between funds to which the Adviser serves as the investment adviser. The Board previously adopted procedures that apply to transactions between the Funds of the Trust pursuant to Rule 17a-7. These transactions related to cross trades during the period complied with the requirements set forth by Rule 17a- 7 and the Trust’s procedures. Transactions related to cross trades during the year ended November 30, 2022, were as follows:
| Fund | | Purchase Cost Paid | | | Sale Proceeds Received | | | Realized Gain/(Loss)on Sales | |
| RiverFront Dynamic US Dividend Advantage ETF | | $ | – | | | $ | 1,092,313 | | | $ | 47,817 | |
| RiverFront Dynamic US Flex-Cap ETF | | | 1,092,313 | | | | – | | | | – | |
7. MARKET RISK
The Funds are subject to investment and operational risks associated with financial, economic and other global market developments and disruptions, including the recent spread of an infectious respiratory illness caused by a novel strain of coronavirus (known as COVID-19), which can negatively impact the securities markets and cause each Fund to lose value. Securities in the Fund’s portfolio may underperform in comparison to securities in general financial markets, a particular financial market or other asset classes due to a number of factors, including inflation (or expectations for inflation), deflation (or expectations for deflation), interest rates, global demand for particular products or resources, market instability, debt crises and downgrades, embargoes, tariffs, sanctions and other trade barriers, regulatory events, other governmental trade or market control programs and related geopolitical events. In addition, the value of the Fund’s investments may be negatively affected by the occurrence of global events such as war, terrorism, environmental disasters, natural disasters or events, country instability, and infectious disease epidemics or pandemics.
The spread of COVID-19 has caused volatility, severe market dislocations and liquidity constraints in many markets, including markets for the securities each Fund holds, and may adversely affect each Fund’s investments and operations. The transmission of COVID-19 and efforts to contain its spread have resulted in travel restrictions and disruptions, closed international borders, enhanced health screenings at ports of entry and elsewhere, disruption of and delays in healthcare service preparation and delivery, quarantines, event and service cancellations or interruptions, disruptions to business operations and supply chains, and a reduction in consumer and business spending, as well as general concern and uncertainty that has negatively affected the economy. These disruptions have led to instability in the market place and the jobs market. The impact of COVID-19 could adversely affect the economies of many nations or the entire global economy, the financial well-being and performance of individual issuers, borrowers and sectors and the health of the markets generally in potentially significant and unforeseen ways.
The foregoing could lead to a significant economic downturn or recession, increased market volatility, a greater number of market closures, higher default rates and adverse effects on the values and liquidity of each Fund’s securities or other assets. Such impacts may adversely affect the performance of the Funds.
8. SUBSEQUENT EVENTS
Subsequent events, if any, after the date of the Statements of Assets and Liabilities have been evaluated through the date the financial statements were issued. Management has determined that there were no subsequent events to report through the issuance of these financial statements.
40 | November 30, 2022
| RiverFront ETFs | |
| Additional Information | November 30, 2022 (Unaudited) |
PROXY VOTING RECORDS, POLICIES AND PROCEDURES
Information regarding how each Fund voted proxies relating to portfolio securities during the most recent 12-month period ended June 30 and a description of the Funds’ proxy voting policies and procedures used in determining how to vote for proxies are available without charge on the SEC’s website at www.sec.gov and upon request, by calling (toll-free) 1-866-759-5679.
PORTFOLIO HOLDINGS
The Fund files a complete schedule of portfolio holdings with the U.S. Securities and Exchange Commission (“SEC”) for the first and third quarters of each fiscal year on Form N-PORT within 60 days after the end of the period. Copies of the Fund’s Form N-PORT are available without a charge, upon request, by contacting the Fund at 1-866-759-5679 and on the SEC’s website at https://www.sec.gov.
TAX INFORMATION
The Funds designate the following as a percentage of taxable ordinary income distributions, or up to the maximum amount allowable, for the calendar year ended December 31, 2021:
| | Qualified Dividend Income | Dividend Received Deduction |
| RiverFront Dynamic Core Income ETF | 0.00% | 0.00% |
| RiverFront Dynamic US Dividend Advantage ETF | 100.00% | 97.31% |
| RiverFront Dynamic US Flex-Cap ETF | 100.00% | 100.00% |
| RiverFront Strategic Income Fund | 0.00% | 0.00% |
In early 2022, if applicable, shareholders of record received this information for the distributions paid to them by the Funds during the calendar year 2021 via Form 1099. The Funds will notify shareholders in early 2023 of amounts paid to them by the Funds, if any, during the calendar year 2022.
41 | November 30, 2022
| RiverFront ETFs | |
| Board Considerations Regarding Approval of Investment Advisory Agreement and Investment Sub-Advisory Agreements | November 30, 2022 (Unaudited) |
At a meeting held on June 21, 2022 via electronic means (video-conference), the Board of Trustees of the Trust (the “Board” or the “Trustees”), including the Trustees who are not “interested persons” of the Trust within the meaning of the Investment Company Act of 1940, as amended (the “Independent Trustees”), evaluated a proposal to approve the continuance of (i) the Investment Advisory Agreement between the Trust and ALPS Advisors, Inc. (the “Adviser” or “AAI”) with respect to the RiverFront Strategic Income Fund (“RIGS”), RiverFront Dynamic Core Income ETF (“RFCI”), RiverFront Dynamic US Dividend Advantage ETF (“RFDA”) and RiverFront Dynamic US Flex-Cap ETF (“RFFC”) (each “a Fund” and collectively the “Funds”) and (ii) the Investment Sub-Advisory Agreements between the Trust or RiverFront Investment Group, LLC (the “Sub-Adviser” or “RiverFront”) with respect to the Funds (the “RiverFront Sub-Advisory Agreements”). The Independent Trustees also met separately to consider the Investment Advisory Agreement and Investment Sub-Advisory Agreements.
In evaluating the Investment Advisory Agreement with respect to each Fund, the Board, including the Independent Trustees, considered various factors, including (i)the nature, extent and quality of the services provided by AAI with respect to the applicable Fund under the Investment Advisory Agreement; (ii) the advisory fees and other expenses paid by the Fund compared to those of similar funds managed by other investment advisers; (iii) the costs of the services provided to the Fund by AAI and the profits realized by AAI and its affiliates from its relationship to the Fund; (iv) the extent to which economies of scale have been or would be realized if and as the assets of the Fund grow and whether fees reflect the economies of scale for the benefit of shareholders; and (v) any additional benefits and other considerations.
With respect to the nature, extent and quality of the services provided by AAI under the Investment Advisory Agreement, the Board considered and reviewed information concerning the services provided under the Investment Advisory Agreements, financial information regarding AAI and its parent company, information describing AAI’s current organization and the background and experience of the persons responsible for the day-to-day management of the Funds.
The Board reviewed information on the performance of each Fund and its applicable benchmark, and with respect to each Fund, the FUSE performance group. Based on this review, the Board, including the Independent Trustees, found that the nature and extent of services provided to each Fund under the Investment Advisory Agreement was appropriate and that the quality was satisfactory.
The Board noted that the advisory fees for each Fund were unitary fees pursuant to which AAI assumes all expenses of the Funds (including the cost of transfer agency, custody, fund administration, legal, audit and other services) other than the payments under the Advisory Agreement, brokerage expenses, taxes, interest, litigation expenses and other extraordinary expenses.
With respect to advisory fee rates, the Board, including the Independent Trustees, noted the following:
The gross management fee rate for RFCI is higher than the median of its FUSE expense group. RFCI’s net expense ratio is slightly above the median of its respective FUSE expense group.
The gross management fee rate of each of RIGS, RFFC and RFDA is lower than the median of their respective FUSE expense groups. These Funds’ respective net expense ratios are also below the median of their respective FUSE expense groups.
Based on the foregoing, and the other information available to them, the Board, including the Independent Trustees, concluded that the advisory fee rate for each of the Funds were reasonable under the circumstances and in light of the quality of the services provided.
The Board, including the Independent Trustees, considered other benefits available to AAI because of its relationship with the Funds and concluded that the advisory fees were reasonable taking into account any such benefits.
The Board, including the Independent Trustees, also considered with respect to each Fund the information provided by AAI about the costs and profitability of AAI with respect to each of the Funds, including the asset levels and other factors that influence the profitability and financial viability of the Funds. The Board, including the Independent Trustees, reviewed and noted the relatively small sizes of the Funds and concluded that AAI was not realizing any economies of scale. The Independent Trustees determined that AAI should continue to keep the Board informed on an ongoing basis of any significant developments (e.g., material increases in asset levels) so as to facilitate the Independent Trustees’ evaluation of whether further economies of scale have been achieved.
In voting to renew the Investment Advisory Agreement, the Board, including the Independent Trustees, concluded that the terms of the Investment Advisory Agreement are reasonable and fair in light of the services to be performed, the fees paid by certain other funds, expenses to be incurred and such other matters as the members of the Board, including the Independent Trustees, considered relevant in the exercise of their reasonable business judgment. The Independent Trustees did not identify any single factor or group of factors as all important or controlling and considered all factors together.
42 | November 30, 2022
| RiverFront ETFs | |
| Board Considerations Regarding Approval of Investment Advisory Agreement and Investment Sub-Advisory Agreements | November 30, 2022 (Unaudited) |
RiverFront Sub-Advisory Agreements
The Board, including the Independent Trustees, discussed the RiverFront Sub-Advisory Agreements.
In evaluating the RiverFront Sub-Advisory Agreements, the Board, including the Independent Trustees, considered various factors, including (i) the nature, extent and quality of the services provided by RiverFront with respect to the Funds under the RiverFront Sub-Advisory Agreements; (ii) the advisory fees and other expenses paid by the Funds compared to those of similar funds managed by other investment advisers; (iii) the profitability to RiverFront of its sub-advisory relationship with the Funds and the reasonableness of compensation to RiverFront; (iv) the extent to which economies of scale would be realized if, and as, the Funds’ assets increase, and whether the fee level in the RiverFront Sub-Advisory Agreements reflects these economies of scale; and (v) any additional benefits and other considerations.
With respect to the nature, extent and quality of the services provided by RiverFront under the RiverFront Sub-Advisory Agreements, the Board, including the Independent Trustees, considered and reviewed information concerning the services provided under the RiverFront Sub-Advisory Agreements, the Funds’ respective performance, financial information regarding RiverFront, information describing RiverFront’s current organization and the background and experience of the persons responsible for the day-to-day management of the Funds. Based upon their review, the Board, including the Independent Trustees, concluded that RiverFront was qualified to oversee the portfolio management of the Funds and that the services provided by RiverFront to the Funds are satisfactory. The Board, including the Independent Trustees, considered that the contractual sub-advisory fee to be paid to RiverFront from RIGS was 0.35% of RIGS’ average daily net assets out of a total management fee of 0.46% of RIGS’ average daily net assets. The Board, including the Independent Trustees, considered that the contractual sub-advisory fee to be paid to RiverFront with respect to each of RFCI, RFDA and RFFC was 0.35% of each Fund’s average daily net assets out of a total management fee of 0.51% with respect to RFCI’s average daily net assets, and 0.52% with respect to each of RFDA’s and RFFC’s average daily net assets, respectively. Based on the consideration of all factors deemed relevant by them, the Board, including the Independent Trustees, concluded that the sub-advisory fees received by RiverFront under the RiverFront Sub-Advisory Agreements were reasonable under the circumstances and in light of the quality of services provided.
With respect to the costs of services provided and profits realized by RiverFront, the Board, including the Independent Trustees, considered the resources involved in managing the Funds. Based on their review of the profitability of each of the Funds to RiverFront, the Board, including the Independent Trustees, concluded that the profitability of each Fund to RiverFront was not unreasonable.
The Board, including the Independent Trustees, also considered other benefits that have been and may be realized by RiverFront from its relationships with each Fund and concluded that the sub-advisory fees with respect to each Fund were reasonable taking into account such benefits.
The Board, including the Independent Trustees, noted that RIGS had increased in assets over the prior year. The Board, including the Independent Trustees, considered the extent to which economies of scale may be realized if RIGS’ assets continue to grow in size and whether fee levels reflect a reasonable sharing of such economies of scale for the benefit of the Fund’s investors. They also noted that RIGS has experienced fluctuations in assets, which makes it difficult to quantify the potential variability in net assets and thus determine the sustainability of any potential economies of scale which may exist. The Board, including the Independent Trustees, also noted that RFCI and RFDA are only beginning to reach scale in terms of assets and that RFFC had a significant decline in assets over the prior year. The Independent Trustees determined that AAI should continue to keep the Board informed on an ongoing basis of any significant developments (e.g., material increases in asset levels) so as to facilitate the Independent Trustees’ evaluation of whether further economies of scale have been achieved with respect to each Fund.
In voting to approve each of the RiverFront Sub-Advisory Agreements, the Board, including the Independent Trustees, concluded that the terms of each RiverFront Sub-Advisory Agreement are reasonable and fair in light of the services performed, expenses incurred and such other matters as the Board, including the Independent Trustees, considered relevant in the exercise of their reasonable business judgment. The Independent Trustees did not identify any single factor or group of factors as all important or controlling and considered all factors together.
43 | November 30, 2022
| RiverFront ETFs | |
| Trustees & Officers | November 30, 2022 (Unaudited) |
The general supervision of the duties performed by the Adviser for the Fund under the Investment Advisory Agreement is the responsibility of the Board of Trustees. The Trust currently has four Trustees, each of whom have no affiliation or business connection with the Adviser or any of its affiliated persons and do not own any stock or other securities issued by the Adviser. These are the “non-interested” or “independent” Trustees (“Independent Trustees”).
The Independent Trustees of the Trust, their term of office and length of time served, their principal business occupations during the past five years, the number of portfolios in the Fund Complex overseen by each Independent Trustee, and other directorships, if any, held by the Trustee are shown below.
| INDEPENDENT TRUSTEES | | | | |
| Name, Address & Year of Birth* | Position(s) Held with Trust | Term of Office and Length of Time Served** | Principal Occupation(s) During Past 5 Years | Number of Portfolios in Fund Complex Overseen by Trustees*** | Other Directorships Held by Trustees |
Mary K. Anstine, 1940 | Trustee | Since March 2008 | Ms. Anstine is Trustee/Director of AV Hunter Trust and Colorado Uplift Board. | 38 | Ms. Anstine is a Trustee of ALPS Variable Investment Trust (7 funds); Financial Investors Trust (29 funds); and Reaves Utility Income Fund. |
Jeremy W. Deems, 1976 | Trustee | Since March 2008 | Mr. Deems is the Co-Founder and Chief Financial Officer of Green Alpha Advisors, LLC, a registered investment advisor, and Co-Portfolio Manager of the Shelton Green Alpha Fund. | 38 | Mr. Deems is a Trustee of ALPS Variable Investment Trust (7 funds); Financial Investors Trust (29 funds); and Reaves Utility Income Fund; and Clough Funds Trust (1 fund). |
Rick A. Pederson, 1952 | Trustee | Since March 2008 | Mr. Pederson is Partner, Bow River Capital Partners (private equity management), 2003 - present; Board Member, Prosci Inc. (private business services) 2013-2016; Advisory Board Member, Citywide Banks (Colorado community bank) 2014-2017; Board Member, Strong-Bridge Consulting, 2015-2019; Board Member, IRI/ODMS Holdings LLC, 2017 - 2019; Director, National Western Stock Show (not for profit) 2010 - present; Director, History Colorado (not for profit) 2015- present; Director, Citywide Bank Advisory Board 2017-present; Trustee, Boettcher Foundation, 2018 -present. | 24 | Mr. Pederson is Trustee of Segall Bryant & Hamill Trust (14 funds), Principal Real Estate Income Fund (1 fund). |
| * | The business address of the Trustee is c/o ALPS Advisors, Inc., 1290 Broadway, Suite 1000, Denver, Colorado 80203. |
| ** | This is the period for which the Trustee began serving the Trust. Each Trustee serves an indefinite term, until his or her successor is elected. |
| *** | The Fund Complex includes all series of the Trust and any other investment companies for which ALPS Advisors, Inc. provides investment advisory services. |
44 | November 30, 2022
| RiverFront ETFs | |
| Trustees & Officers | November 30, 2022 (Unaudited) |
| Name, Address & Year of Birth* | Position(s) Held with Trust | Term of Office and Length of Time Served** | Principal Occupation(s) During Past 5 Years | Number of Portfolios in Fund Complex Overseen by Trustees*** | Other Directorships Held by Trustees |
Edmund J. Burke, 1961 | Trustee | Since December 2017 | Mr. Burke joined ALPS in 1991 and served as the President and Director of ALPS Holdings, Inc., and ALPS Advisors, Inc., and Director of ALPS Distributors, Inc., ALPS Fund Services, Inc. (“ALPS”), and ALPS Portfolio Solutions Distributor, Inc. (collectively, the “ALPS Companies”). Mr. Burke retired from the ALPS Companies in June 2019. Mr. Burke is currently a partner at ETF Action, a webbased system that provides data and analytics to registered investment advisers, (since 2020) and a Director of Alliance Bioenergy Plus, Inc., a technology company focused on emerging technologies in the renewable energy, biofuels, and bioplastics technology sectors (since 2020). | 33 | Mr. Burke is a Trustee of Clough Global Dividend and Income Fund (1 fund); Clough Global Equity Fund (1 fund); Clough Global Opportunities Fund (1 fund); Clough Funds Trust (1 fund); Liberty All-Star Equity Fund (1 fund); Director of the Liberty All-Star Growth Fund, Inc. (1 fund) and Financial Investors Trust (29 funds). |
| * | The business address of the Trustee is c/o ALPS Advisors, Inc., 1290 Broadway, Suite 1000, Denver, Colorado 80203. |
| ** | This is the period for which the Trustee began serving the Trust. Each Trustee serves an indefinite term, until his or her successor is elected. |
| *** | The Fund Complex includes all series of the Trust and any other investment companies for which ALPS Advisors, Inc. provides investment advisory services. |
45 | November 30, 2022
| RiverFront ETFs | |
| Trustees & Officers | November 30, 2022 (Unaudited) |
| OFFICERS: | | | |
| Name, Address and Year of Birth of Officer* | Position(s) Held with Trust | Length of Time Served** | Principal Occupation(s) During Past 5 Years |
Laton Spahr, 1975 | President | Since June 2021 | Mr. Spahr joined ALPS in 2019 and currently serves as President and Portfolio Manager of AAI. Prior to his current role, Mr. Spahr was a Senior Vice President and Strategy Leader of the Value & Income Team for Oppenheimer Funds from 2013 to 2019. |
Matthew Sutula, 1985 | Chief Compliance Officer (“CCO”) | Since December 2019 | Mr. Sutula joined ALPS in 2012 and currently serves as Chief Compliance Officer of AAI. Prior to his current role, Mr. Sutula served as interim Compliance Officer of the Trust (September 2019 to December 2019). Compliance Manager and Senior Compliance Analyst for AAI, as well as Compliance Analyst for AFS. Prior to joining ALPS, he spent seven years at Morningstar, Inc. in various analyst roles supporting the registered investment company databases. Mr. Sutula is also Chief Compliance Officer of Principal Real Estate Income Fund, ALPS Variable Investment Trust, Liberty All-Star Equity Fund and Liberty All-Star Growth Fund, Inc. From September 2019 to September 2022 he served as Chief Compliance Officer of RiverNorth Opportunities Fund, Inc. |
Kathryn Burns, 1976 | Treasurer | Since September 2018 | Ms. Burns serves as Vice President, Director of Fund Operations of AAI since 2018. From 2013 to 2018, she served as Vice President and Fund Controller at AFS. Prior to joining ALPS, she worked at Old Mutual Capital where she served as Vice President and Chief Compliance Officer (2010 – 2012) and Regulatory Reporting Manager and Assistant Treasurer to the Old Mutual Funds Trusts (2006 – 2012). She also served as a CPA for PricewaterhouseCoopers LLP. Ms. Burns also serves as President of ALPS Variable Investment Trust and Principal Real Estate Income Fund. From June 2019 to September 2022 she served as President of RiverNorth Opportunities Fund, Inc. and from June 2018 to November 2021 she served as Treasurer of Boulder Growth & Income Fund, Inc. |
Michael P. Lawlor, 1969 | Secretary | Since December 2022 | Mr. Lawlor joined ALPS in January 2022, and is currently Vice President and Principal Legal Counsel. Prior to joining ALPS, Mr. Lawlor was Lead Fund Counsel at Brighthouse Financial (insurance company) (January 2007-April 2021). Mr. Lawlor also serves as Secretary of Financial Investors Trust and ALPS Variable Investment Trust. |
| * | The business address of each Officer is c/o ALPS Advisors, Inc., 1290 Broadway, Suite 1000, Denver, Colorado 80203. Each Officer is deemed an affiliate of the Trust as defined under the 1940 Act. |
| ** | This is the period for which the Officer began serving the Trust. Each Officer serves an indefinite term, until his or her successor is elected. |
The Statement of Additional Information includes additional information about the Funds' Trustees and is available, without charge, upon request by calling (toll-free) 1-866-759-5679.
46 | November 30, 2022
Intentionally Left Blank

| (a) | The Registrant, as of the end of the period covered by this report, has adopted a code of ethics that applies to the Registrant's principal executive officer, principal financial officer, principal accounting officer or controller or any persons performing similar functions on behalf of the Registrant. |
| (c) | During the period covered by this report, no amendments to the provisions of the code of ethics adopted in 2(a) above were made. |
| (d) | During the period covered by this report, no implicit or explicit waivers to the provisions of the code of ethics adopted in 2(a) above were granted. |
| (f) | The Registrant's Code of Ethics is attached as an Exhibit hereto. |
| Item 3. | Audit Committee Financial Expert. |
The Board of Trustees of the Registrant has determined that the Registrant has at least one Audit Committee Financial Expert serving on its audit committee. The Board of Trustees of the Registrant has designated Jeremy W. Deems as the Registrant’s “Audit Committee Financial Expert”. Mr. Deems is “independent” as defined in paragraph (a)(2) of Item 3 to Form N-CSR.
| Item 4. | Principal Accountant Fees and Services. |
| (a) | Audit Fees: For the Registrant’s fiscal years ended November 30, 2022 and November 30, 2021, the aggregate fees billed for professional services rendered by the principal accountant for the audit of the Registrant’s annual financial statements were $368,500 and $353,415, respectively. |
| (b) | Audit-Related Fees: For the Registrant’s fiscal years ended November 30, 2022 and November 30, 2021, the aggregate fees billed for professional services rendered by the principal accountant that are reasonably related to the performance of the audit of the Registrant's financial statements and are not reported under paragraph (a) of this Item were $0 and $0, respectively. |
| (c) | Tax Fees: For the Registrant’s fiscal years ended November 30, 2022 and November 30, 2021, the aggregate fees billed for professional services rendered by the principal accountant for tax compliance, tax advice and tax planning were $96,000 and $121,080, respectively. The fiscal year 2022 and 2021 tax fees were for services pertaining to federal and state income tax return review, review of year end dividend distributions and excise tax preparation. |
| (d) | All Other Fees: For the Registrant’s fiscal years ended November 30, 2022 and November 30, 2021, aggregate fees billed to the Registrant by the principal accountant for services provided by the principal accountant other than the services reported in paragraphs (a) through (c) of this Item 4 were $0 and $0, respectively. |
| (1) | Audit Committee Pre-Approval Policies and Procedures: All services to be performed by the Registrant's principal accountant must be pre-approved by the Registrant's audit committee. |
| (2) | No services described in paragraphs (b) through (d) of this Item were approved by the Registrant’s audit committee pursuant to paragraph (c)(7)(i)(C) of Rule 2-01 of Regulation S-X. |
| (g) | The aggregate non-audit fees billed by the Registrant’s accountant for the fiscal years ended November 30, 2022 and November 30, 2021 of the Registrant were $96,000 and $121,080, respectively. These fees consisted of non-audit fees billed to (i) the Registrant of $96,000 and $121,080, respectively as described in response to paragraph (c) above. |
| (h) | The Registrant’s audit committee has considered whether the provision of non- audit services that were rendered to the Registrant’s investment adviser (not including any sub-adviser whose role is primarily portfolio management and is subcontracted with or overseen by another investment adviser), and any entity controlling, controlled by, or under common control with the investment adviser that provides ongoing services to the Registrant that were not pre-approved pursuant to paragraph (c)(7)(ii) of Rule 2-01 of Regulation S-X, is compatible with maintaining the principal accountant’s independence. The Registrant’s audit committee determined that the provision of such non-audit services is compatible with maintaining the principal accountant’s independence. |
| Item 5. | Audit Committee of Listed Registrants. |
Not applicable to the Registrant.
| (a) | Schedule of Investments is included as part of the Report to Stockholders filed under Item 1 of this Form N-CSR. |
| Item 7. | Disclosure of Proxy Voting Policies and Procedures for Closed-End Management Investment Companies. |
Not applicable to Registrant.
| Item 8. | Portfolio Managers of Closed-End Management Investment Companies. |
Not applicable to Registrant.
| Item 9. | Purchases of Equity Securities by Closed-End Management Investment Company and Affiliated Purchasers. |
Not applicable to Registrant.
| Item 10. | Submission of Matters to a Vote of Security Holders. |
No material changes to the procedures by which the shareholders may recommend nominees to the Registrant’s Board of Trustees have been implemented after the Registrant’s last provided disclosure in response to the requirements of Item 407(c)(2)(iv) of Regulation S-K (17 CFR 229.407) (as required by Item 22(b)(15) of Schedule 14A (17 CFR 240.14a-101)), or this Item.
| Item 11. | Controls and Procedures. |
| (a) | The Registrant’s principal executive officer and principal financial officer have concluded that the Registrant’s disclosure controls and procedures (as defined in Rule 30a-3(c) under the Investment Company Act of 1940, as amended) are effective based on their evaluation of these controls and procedures as of a date within 90 days of the filing date of this report. |
| (b) | There was no change in the Registrant's internal control over financial reporting (as defined in Rule 30a-3(d) under the Investment Company Act of 1940, as amended) during the period covered by this report that has materially affected, or is reasonably likely to materially affect, the Registrant's internal control over financial reporting. |
| Item 12. | Disclosure of Securities Lending Activities for Closed-End Management Investment Companies. |
Not applicable.
SIGNATURES
Pursuant to the requirements of the Securities Exchange Act of 1934 and the Investment Company Act of 1940, the Registrant has duly caused this report to be signed on its behalf by the undersigned, thereunto duly authorized.
| ALPS ETF TRUST | |
| | | |
| By: | /s/Laton Spahr | |
| | Laton Spahr (Principal Executive Officer) | |
| | President | |
| | | |
| Date: | February 7, 2023 | |
Pursuant to the requirements of the Securities Exchange Act of 1934 and the Investment Company Act of 1940, this report has been signed below by the following persons on behalf of the Registrant and in the capacities and on the dates indicated.
| By: | /s/Laton Spahr | |
| | Laton Spahr (Principal Executive Officer) | |
| | President | |
| | | |
| Date: | February 7, 2023 | |
| | | |
| By: | /s/Kathryn Burns | |
| | Kathryn Burns (Principal Financial Officer) | |
| | Treasurer | |
| | | |
| Date: | February 7, 2023 | |