UNITED STATES
SECURITIES AND EXCHANGE COMMISSION
Washington, D.C. 20549
FORM N-CSR
CERTIFIED SHAREHOLDER REPORT OF REGISTERED
MANAGEMENT INVESTMENT COMPANIES
Investment Company Act file number:
811-22175
ALPS ETF TRUST
(Exact name of registrant as specified in charter)
1290 Broadway, Suite 1000, Denver, Colorado 80203
(Address of principal executive offices) (Zip code)
Brendan Hamill, Esq., Secretary
ALPS ETF Trust
1290 Broadway, Suite 1000
Denver, Colorado 80203
(Name and address of agent for service)
Registrant’s Telephone Number, including Area Code: 877-398-8461
Date of fiscal year end: June 30
Date of reporting period: July 1, 2021 – June 30, 2022
| Item 1. | Report to Stockholders. |

Table of Contents
| Performance Overview | 1 |
| Disclosure of Fund Expenses | 14 |
| Report of Independent Registered Public Accounting Firm | 15 |
| Financial Statements | |
| Schedule of Investments | 16 |
| Statements of Assets and Liabilities | 26 |
| Statements of Operations | 27 |
| Statements of Changes in Net Assets | 28 |
| Financial Highlights | 32 |
| Notes to Financial Statements | 36 |
| Additional Information | 44 |
| Board Considerations Regarding Approval of Investment Advisory Agreement | 46 |
| Trustees & Officers | 48 |
alpsfunds.com
| ALPS | O’Shares U.S. Quality Dividend ETF | |
| Performance Overview | June 30, 2022 (Unaudited) |
Performance Objective
The ALPS|O’Shares U.S. Quality Dividend ETF (the "Fund") seeks investment results that track the performance, before fees and expenses, of the O'Shares U.S. Quality Dividend Index (the "Underlying Index").
The Underlying Index is designed to measure the performance of publicly-listed large-capitalization and mid-capitalization dividend-paying issuers in the United States that meet certain market capitalization, liquidity, high quality, low volatility and dividend yield thresholds, as determined by O'Shares Investment Advisers, LLC. The high quality and low volatility requirements are designed to reduce exposure to high dividend equities that have experienced large price declines. The constituents of the Underlying Index are selected from the S-Network U.S. Equity Large-Cap 500 Index.
Performance Overview
The ALPS|O’Shares U.S. Quality Dividend ETF generated a total return of -2.38% for the trailing twelve-month period ended June 30, 2022, slightly underperforming the Fund’s Underlying Index, which returned -1.90%. The Fund outperformed both the S&P 500® Index (“S&P 500®”) and the Russell 1000® Value Index, which returned -10.62% and -6.82%, respectively for the same period.
The trailing twelve-month yield for the Fund’s underlying constituents as of June 30, 2022 was 1.88% vs. 1.70% for the S&P 500®.
The S&P 500® returned -10.62% for the trailing twelve-month (TTM) period ended June 30, 2022, in clear correction territory from its all-time high at the beginning of 2022. Persistent inflation with U.S. Consumer Price Index (CPI) surging to 9.1% in June, the war in Ukraine, and slowing global growth caused U.S. equity multiples and prices to contract, with growth-heavy sectors and companies falling the hardest. The Federal Reserve began to raise interest rates and tighten monetary policy early in January, which conceded a sharp rise in U.S. government bond yields where the U.S. government 10-year yield broke above 3.5%, both serving as a catalyst for equities to retreat. Main macroeconomic talking points throughout the TTM period centered on inflation no longer being transitory (i.e. persistent inflation), commodity prices surging, weakening consumer spending, along with GDP forecasts pointing towards a recession. Pro-cyclical sectors proved to be a safe haven amidst inflationary pressures, with energy benefitting from sustained higher oil and gas prices. Although the Federal Reserve looks to implement a soft-landing where monetary tightening won’t cause a severe recession, they will have their work cut out for them as the total assets of the Federal Reserve currently sit near peak levels following years of quantitative easing (QE). As earnings season approaches for Q2 2022, U.S. stocks have come to a fork in the road, where the positive scenario of sustained profits and earnings growth could lead to a bottom in equity prices. On the other hand, reduced margins and negative revisions to the earnings picture could lead to yet another round of sell-offs. Despite the uncertainty and recession fears heading into the second half of 2022, global travel has surpassed 2019 numbers in many metrics, commodity prices and oil have pulled back to more reasonable levels, and U.S. equity prices have reached bear market territory from their highs, leading to attractive valuations across sectors where much of the negative forecasts and fiscal tightening has been baked in.
When compared to the S&P 500®, the relative outperformance for the Fund was largely driven by an overweighting of +9.53% in Consumer Staples, which contributed +1.68% to the outperformance. However, the negative allocation effect was mainly attributed to the relative underweight of - 3.34% in Energy, which detracted -1.49% from performance. The Fund saw a positive impact (+7.24%) from security selection compared to the S&P 500®. The Fund’s Health Care positions exhibited the strongest positive contribution (+2.17%) to security selection (selection effect) for the year compared to the S&P 500®, with names in Financials detracting from the overall security selection effect (-0.35%).
The best performing stocks in the Fund for the period were Eli Lilly and Co. (LLY), which increased +43.26%, and AbbVie Inc. (ABBV), which gained +42.23%. Other top performers included Pfizer Inc. (PFE), which rose +38.42%, and Northrop Grumman Corp. (NOC), which climbed 33.83%. The largest detractors were T. Rowe Price Group (TROW), which decreased by -40.84%, Target Corp. (TGT), which fell -40.67%, and eBay Inc. (EBAY), losing -39.83%.
Looking forward we believe the Fund’s methodology of selecting large-cap and mid-cap companies in the U.S. with fundamental determinates including quality, low volatility and dividend growth, provides a cost-efficient core investment holding.
Performance (as of June 30, 2022)
| | 1 Year | 5 Year | Since Inception^ |
| ALPS | O'Shares U.S. Quality Dividend ETF – NAV | -2.38% | 9.11% | 9.60% |
| ALPS | O'Shares U.S. Quality Dividend ETF – Market Price* | -2.33% | 9.11% | 9.60% |
| O'Shares U.S. Quality Dividend Index** | -1.90% | 9.66% | 10.15% |
| Russell 1000® Value Index | -6.82% | 7.17% | 7.56% |
Total Expense Ratio (per the current prospectus) is 0.48%.
Performance data quoted represents past performance. The Fund adopted the historical performance of the O'Shares U.S. Quality Dividend ETF (the "Predecessor Fund") as the result of a reorganization in which the Fund acquired all of the assets, subject to liabilities, of the Predecessor Fund on June 17, 2022. The returns presented for the Fund for periods prior to June 17, 2022 reflect the performance of the Predecessor Fund. At the time of the reorganization, the investment objectives of the Fund and the Predecessor Fund were identical and the investment strategies of the Fund and the Predecessor Fund were substantially the same. Previously, the Predecessor Fund had adopted the historical performance of the O’Shares FTSE U.S. Quality Dividend ETF (the “Previous Predecessor Fund”), a series of FQF Trust, as the result of a reorganization in which the Predecessor Fund acquired all of the assets, subject to liabilities, of the Previous Predecessor Fund on June 28, 2018. The returns presented for the Predecessor Fund for periods prior to June 28, 2018 reflect the performance of the Previous Predecessor Fund. At the time of the reorganization, the investment objectives of the Previous Predecessor Fund and the Predecessor Fund were identical and the investment strategies of the Previous Predecessor Fund and the Predecessor Fund were substantially the same. Effective June 1, 2020, the Predecessor Fund’s underlying index was changed to the Underlying Index from the FTSE USA Qual/Vol/Yield Factor 5% Capped Index (the “Former Index”). Thus, Predecessor Fund performance shown through May 31, 2020 reflects the Predecessor Fund seeking to track the performance of the Former Index, and Predecessor Fund performance shown beginning June 1, 2020 reflects the Predecessor Fund seeking to track the performance of the Underlying Index. In addition, the Underlying Index performance shown reflects the blended performance of the Former Index through May 31, 2020 and the Underlying Index thereafter. Past performance does not guarantee future results. Total return figures assume reinvestment of dividends and capital gains distributions, if any. The table does not reflect the deduction of taxes that a shareholder would pay on Fund distributions or the redemption of Fund shares. Investment return and principal value of an investment will fluctuate so that an investor’s shares, when sold or redeemed, may be worth more or less than the original cost. Current performance data may be higher or lower than actual data quoted. For the most current month-end performance data please visit www.alpsfunds.com or call 1.866.675.2639.
1 | June 30, 2022
| ALPS | O’Shares U.S. Quality Dividend ETF | |
| Performance Overview | June 30, 2022 (Unaudited) |
NAV is an exchange-traded fund's per-share value. The per-share dollar amount of the Fund is derived by dividing the total value of all the securities in its portfolio, less any liabilities, by the number of Fund shares outstanding. Market price is the price at which a share can currently be traded in the market. Information detailing the number of days the Market Price of the Fund was greater than the Fund's NAV and the number of days it was less than the Fund's NAV can be obtained at www.alpsfunds.com.
| ^ | The Fund commencement date was July 14, 2015. |
| * | Market Price means the official closing price of a share or, if it more accurately reflects the market value of a share at the time as of which the Fund calculates current net asset value per shares, the price that is the midpoint of the bid-ask spread as of that time. It does not represent the returns an investor would receive if shares were traded at other times. |
| ** | The O’Shares U.S. Quality Dividend Index performance information reflects the blended performance of the FTSE USA Qual/Vol/Yield Factor 5% Capped Index through May 31, 2020 and the O’Shares U.S. Quality Dividend Index thereafter. |
The O’Shares U.S. Quality Dividend Index is designed to measure the performance of publicly-listed large-capitalization and mid-capitalization dividend-paying issuers in the United States that meet certain market capitalization, liquidity, high quality, low volatility and dividend yield thresholds. The high quality and low volatility requirements are designed to reduce exposure to high dividend equities that have experienced large price declines. The index is reported on a total return basis, which assumes reinvestment of any dividends and distributions realized during a given time period.
The Russell 1000® Value Index measures the performance of the large-cap value segment of the U.S. equity universe. It includes those Russell 1000 companies with lower price-to-book ratios and lower expected growth values.
The indexes are not actively managed and do not reflect any deductions for fees, expenses or taxes. One cannot invest directly in an index. Index performance does not reflect fund performance.
The Fund's shares are not individually redeemable. Investors buy and sell shares of the Fund on a secondary market. Only market makers or "authorized participants" may trade directly with the Fund, typically in blocks of 25,000 shares.
The ALPS | O’Shares U.S. Quality Dividend ETF is not suitable for all investors. Investments in the Fund are subject to investment risks, including possible loss of the principal amount invested.
ALPS Portfolio Solutions Distributor, Inc., a FINRA member, is the distributor for the Fund.
2 | June 30, 2022
| ALPS | O’Shares U.S. Quality Dividend ETF | |
| Performance Overview | June 30, 2022 (Unaudited) |
Top 10 Holdings* (as of June 30, 2022)
| Johnson & Johnson | 5.79% |
| Procter & Gamble Co. | 5.06% |
| Verizon Communications, Inc. | 4.60% |
| Microsoft Corp. | 4.30% |
| Pfizer, Inc. | 4.12% |
| Home Depot, Inc. | 3.71% |
| Lockheed Martin Corp. | 3.45% |
| Apple, Inc. | 3.34% |
| McDonald's Corp. | 3.17% |
| UnitedHealth Group, Inc. | 2.83% |
| Total % of Top 10 Holdings | 40.37% |
| * | % of Total Investments (excluding short term investments) Future holdings are subject to change. |
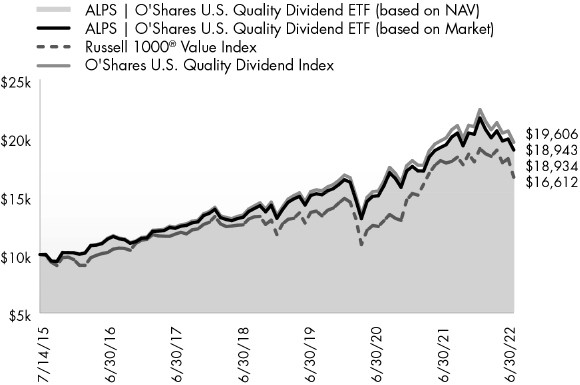
Growth of $10,000 (as of June 30, 2022)
Comparison of Change in Value of $10,000 Investment in the Fund and the Indexes
Sector Allocation* (as of June 30, 2022)
| Consumer, Non-cyclical | 42.39% |
| Industrial | 14.93% |
| Technology | 14.21% |
| Consumer, Cyclical | 13.23% |
| Communications | 8.94% |
| Financial | 6.30% |
| Total | 100.00% |
The chart above compares historical performance of a hypothetical investment of $10,000 in the Fund since inception with the performance of the Fund’s benchmark index. Results include the reinvestment of all dividends and capital gains distributions. Past performance does not guarantee future results. The chart does not reflect the deduction of taxes that a shareholder would pay on Fund distributions or the redemption of Fund shares.
3 | June 30, 2022
| ALPS | O’Shares U.S. Small-Cap Quality Dividend ETF | |
| Performance Overview | June 30, 2022 (Unaudited) |
Performance Objective
The ALPS|O’Shares U.S. Small-Cap Quality Dividend ETF (the "Fund") seeks investment results that track the performance, before fees and expenses, of the O'Shares U.S. Small-Cap Quality Dividend Index (the "Underlying Index").
The Underlying Index is designed to measure the performance of publicly-listed small-capitalization dividend-paying issuers in the United States that meet certain market capitalization, liquidity, high quality, low volatility and dividend yield thresholds, as determined by O'Shares Investment Advisers, LLC. The high quality and low volatility factors are designed to reduce exposure to high dividend equities that have experienced large price declines, as may occur with some dividend investing strategies. The constituents of the Underlying Index are selected from the S-Network U.S. Equity Mid/Small-Cap 2500 Index.
Performance Overview
The ALPS | O’Shares U.S. Small-Cap Quality Dividend ETF, generated a total return of -8.12% for the trailing twelve-month period ended June 30, 2022, relatively in-line with the Fund’s Underlying Index, net of fees, which returned -7.66%. The Fund outperformed the Russell 2000 Value Index, which returned -16.28% for the same period.
The trailing-twelve-month (TTM) yield for the Fund’s underlying constituents as of June 30, 2022 was 1.95% vs. 2.50% for the Russell 2000 Value Index.
The Russell 2000 Value Index returned -16.28% for the trailing twelve-month period ended June 30, 2022, in clear correction territory from its all-time high at the beginning of 2022. Persistent inflation with U.S. Consumer Price Index (CPI) surging to 9.1% in June, the war in Ukraine, and slowing global growth caused U.S. equity multiples and prices to contract, with growth-heavy sectors and companies falling the hardest. The Federal Reserve began to raise interest rates and tighten monetary policy early in January, which conceded a sharp rise in U.S. government bond yields where the U.S. government 10-year yield broke above 3.5%, both serving as a catalyst for equities to retreat. Main macroeconomic talking points throughout the TTM period centered on inflation no longer being transitory (i.e. persistent inflation), commodity prices surging, weakening consumer spending, along with GDP forecasts pointing towards a recession. Pro-cyclical sectors proved to be a safe haven amidst inflationary pressures, with energy benefitting from sustained higher oil and gas prices. Although the Federal Reserve looks to implement a soft-landing where monetary tightening won’t cause a severe recession, they will have their work cut out for them as the total assets of the Federal Reserve currently sit near peak levels following years of quantitative easing (QE). As earnings season approaches for Q2 2022, U.S. stocks have come to a fork in the road, where the positive scenario of sustained profits and earnings growth could lead to a bottom in equity prices. On the other hand, reduced margins and negative revisions to the earnings picture could lead to yet another round of sell-offs. Despite the uncertainty and recession fears heading into the second half of 2022, global travel has surpassed 2019 numbers in many metrics, commodity prices and oil have pulled back to more reasonable levels, and U.S. equity prices have reached bear market territory from their highs, leading to attractive valuations across sectors where much of the negative forecasts and fiscal tightening has been baked in.
Compared to the Russell 2000 value Index, the Fund saw a positive impact of +0.44% from its sector allocation effect for the period. The underperformance in the TTM period was largely driven by relative overweighting to Consumer Discretionary sector (+4.47% overweight), while the Fund’s underweight allocation (-2.36% underweight) to Health Care contributed +0.93% to relative outperformance. The Fund saw a positive impact of +10.06% from its overall security selection, with Consumer Discretionary sector companies exhibiting the strongest positive contribution (+3.85%) to Fund outperformance. Industrials sector securities lagged all other sectors compared to the Russell 2000 Value Index, detracting -0.61% from relative performance.
The best performing stocks in the Fund for the period were Weis Markets Inc. (WMK), which increased +47.21%, and Murphy USA (MUSA), which saw a gain of +44.55%. Other top performers included H&R Block (HRB), rising +44.03%, and Otter Trail Corp. (OTTR), which climbed +41.23%. The largest detractors were Healthcare Services Group (HCSG), which decreased -42.30%, New York Times (NYT), which fell -35.53%, and M.D.C. Holdings (MDC), which lost -33.40%.
Looking forward, we believe the Fund’s methodology of selecting small-cap companies in the U.S. with fundamental determinates including quality, low volatility and dividend growth, provides a cost-efficient core investment holding.
Performance (as of June 30, 2022)
| | 1 Year | 5 Year | Since Inception^ |
| ALPS | O'Shares U.S. Small-Cap Quality Dividend ETF – NAV | -8.12% | 6.75% | 6.59% |
| ALPS | O'Shares U.S. Small-Cap Quality Dividend ETF – Market Price* | -8.18% | 6.71% | 6.59% |
| O'Shares U.S. Small-Cap Quality Dividend Index** | -7.66% | 7.28% | 7.12% |
| Russell 2000® Value Index | -16.28% | 4.89% | 4.45% |
Total Expense Ratio (per the current prospectus) is 0.48%.
Performance data quoted represents past performance. The Fund adopted the historical performance of the O'Shares U.S. Small-Cap Quality Dividend ETF (the "Predecessor Fund") as the result of a reorganization in which the Fund acquired all of the assets, subject to liabilities, of the Predecessor Fund on June 17, 2022. The returns presented for the Fund for periods prior to June 17, 2022 reflect the performance of the Predecessor Fund. At the time of the reorganization, the investment objectives of the Fund and the Predecessor Fund were identical and the investment strategies of the Fund and the Predecessor Fund were substantially the same. Effective May 4, 2018, the Predecessor Fund’s underlying index was changed from the FTSE USA Small Cap Qual/Vol/Yield Factor 3% Capped Index (the “Former Underlying Index 1”) to the FTSE USA Small Cap ex Real Estate 2Qual/Vol/Yield 3% Capped Factor Index (the “Former Underlying Index 2” and together with the Former Underlying Index 1, the “Former Underlying Indexes”). Effective June 1, 2020, the Predecessor Fund’s underlying index was changed from the Former Underlying Index 2 to the Underlying Index. Thus, Predecessor Fund performance shown prior to May 4, 2018 reflects the Predecessor Fund seeking to track the performance of the Former Underlying Index 1, Predecessor Fund performance shown from May 4, 2018 through May 31, 2020 reflects the Predecessor Fund seeking to track the performance of the Former Underlying Index 2, and Predecessor Fund performance shown beginning June 1, 2020 reflects the Predecessor Fund seeking to track the performance of the Underlying Index.
4 | June 30, 2022
| ALPS | O’Shares U.S. Small-Cap Quality Dividend ETF | |
| Performance Overview | June 30, 2022 (Unaudited) |
In addition, the Underlying Index performance shown reflects the blended performance of the Former Underlying Index 1 through May 3, 2018, the Former Underlying Index 2 from May 4, 2018 through May 31, 2020 and the Underlying Index thereafter. Past performance does not guarantee future results. Total return figures assume reinvestment of dividends and capital gains distributions, if any. The table does not reflect the deduction of taxes that a shareholder would pay on Fund distributions or the redemption of Fund shares. Investment return and principal value of an investment will fluctuate so that an investor’s shares, when sold or redeemed, may be worth more or less than the original cost. Current performance data may be higher or lower than actual data quoted. For the most current month-end performance data please visit www.alpsfunds.com or call 1.866.675.2639.
NAV is an exchange-traded fund's per-share value. The per-share dollar amount of the Fund is derived by dividing the total value of all the securities in its portfolio, less any liabilities, by the number of Fund shares outstanding. Market price is the price at which a share can currently be traded in the market. Information detailing the number of days the Market Price of the Fund was greater than the Fund's NAV and the number of days it was less than the Fund's NAV can be obtained at www.alpsfunds.com.
| ^ | The Fund commencement date was December 30, 2016. |
| * | Market Price means the official closing price of a share or, if it more accurately reflects the market value of a share at the time as of which the Fund calculates current net asset value per shares, the price that is the midpoint of the bid-ask spread as of that time. It does not represent the returns an investor would receive if shares were traded at other times. |
| ** | The O’Shares U.S. Small-Cap Quality Dividend Index performance information reflects the blended performance of the FTSE USA Small Cap Qual/Vol/Yield 3% Capped Factor Index through May 3, 2018, the FTSE USA Small Cap ex Real Estate 2Qual/Vol/Yield 3% Capped Factor Index from May 4, 2018 through May 31, 2020 and the O’Shares U.S. Small-Cap Quality Dividend Index thereafter. |
The O’Shares U.S. Small-Cap Quality Dividend Index is designed to reflect the performance of publicly-listed small-capitalization dividend paying issuers in the United States that meet certain market capitalization, liquidity, high quality, low volatility and dividend yield thresholds. The quality and low volatility requirements are designed to reduce exposure to high dividend equities that have experienced large price declines. The index is reported on a total return basis, which assumes reinvestment of any dividends and distributions realized during a given time period.
The Russell 2000® Value Index measures the performance of the small capitalization value sector of the U.S. equity market.
The indexes are not actively managed and do not reflect any deductions for fees, expenses or taxes. One cannot invest directly in an index. Index performance does not reflect fund performance.
The Fund's shares are not individually redeemable. Investors buy and sell shares of the Fund on a secondary market. Only market makers or "authorized participants" may trade directly with the Fund, typically in blocks of 25,000 shares.
The ALPS | O’Shares U.S. Small-Cap Quality Dividend ETF is not suitable for all investors. Investments in the Fund are subject to investment risks, including possible loss of the principal amount invested.
ALPS Portfolio Solutions Distributor, Inc., a FINRA member, is the distributor for the Fund.
5 | June 30, 2022
| ALPS | O’Shares U.S. Small-Cap Quality Dividend ETF | |
| Performance Overview | June 30, 2022 (Unaudited) |
Top 10 Holdings* (as of June 30, 2022)
| Service Corp. International | 2.52% |
| Erie Indemnity Co. | 2.51% |
| Amdocs, Ltd. | 2.44% |
| Bunge, Ltd. | 2.40% |
| Jack Henry & Associates, Inc. | 2.39% |
| Juniper Networks, Inc. | 2.32% |
| Premier, Inc. | 2.09% |
| Cboe Global Markets, Inc. | 2.07% |
| SEI Investments Co. | 2.04% |
| Gentex Corp. | 2.04% |
| Total % of Top 10 Holdings | 22.82% |
| * | % of Total Investments (excluding short term investments) Future holdings are subject to change. |
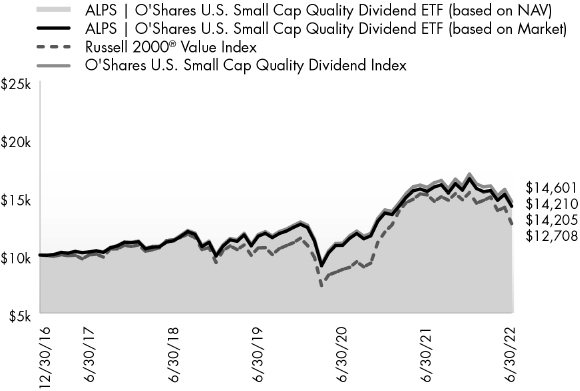
Growth of $10,000 (as of June 30, 2022)
Comparison of Change in Value of $10,000 Investment in the Fund and the Indexes
Sector Allocation* (as of June 30, 2022)
| Consumer, Non-cyclical | 24.04% |
| Financial | 22.87% |
| Industrial | 17.95% |
| Consumer, Cyclical | 11.97% |
| Technology | 11.09% |
| Utilities | 6.81% |
| Communications | 5.27% |
| Total | 100.00% |
The chart above compares historical performance of a hypothetical investment of $10,000 in the Fund since inception with the performance of the Fund’s benchmark index. Results include the reinvestment of all dividends and capital gains distributions. Past performance does not guarantee future results. The chart does not reflect the deduction of taxes that a shareholder would pay on Fund distributions or the redemption of Fund shares.
6 | June 30, 2022
| ALPS | O’Shares Global Internet Giants ETF | |
| Performance Overview | June 30, 2022 (Unaudited) |
Performance Objective
The ALPS|O’Shares Global Internet Giants ETF (the "Fund") seeks investment results that track the performance, before fees and expenses, of the O'Shares Global Internet Giants Index (the "Underlying Index").
The Underlying Index is a rules-based index intended to give investors a means of tracking stocks exhibiting quality and growth characteristics in the "internet sector", as defined by O'Shares Investment Advisers, LLC.
Performance Overview
The ALPS|O’Shares Global Internet Giants ETF generated a total return of -52.52% for the twelve-month period ended June 30, 2022, in-line with the Fund’s Underlying Index, net of fees, which returned -52.36%. The Fund underperformed the NASDAQ 100 Index, which returned -20.38% for the same period.
The NASDAQ 100 Index returned -20.38% for the trailing twelve-month (TTM) period ended June 30, 2022, in clear correction territory from its all-time high at the beginning of 2022. Persistent inflation with U.S. Consumer Price Index (CPI) surging to 9.1% in June, the war in Ukraine, and slowing global growth caused global equity multiples and prices to contract, with growth-heavy sectors and companies falling the hardest. The Federal Reserve began to raise interest rates and tighten monetary policy early in January, which conceded a sharp rise in U.S. government bond yields where the U.S. government 10-year yield broke above 3.5%, both serving as a catalyst for equities to retreat. Main macroeconomic talking points throughout the TTM period centered on inflation no longer being transitory (i.e. persistent inflation), commodity prices surging, weakening consumer spending, along with GDP forecasts pointing towards a recession. Pro-cyclical sectors proved to be a safe haven amidst inflationary pressures, with energy benefitting from sustained higher oil and gas prices. Although the Federal Reserve looks to implement a soft-landing where monetary tightening won’t cause a severe recession, they will have their work cut out for them as the total assets of the Federal Reserve currently sit near peak levels following years of quantitative easing (QE). As earnings season approaches for Q2 2022, U.S. stocks have come to a fork in the road, where the positive scenario of sustained profits and earnings growth could lead to a bottom in equity prices. On the other hand, reduced margins and negative revisions to the earnings picture could lead to yet another round of sell-offs. Despite the uncertainty and recession fears heading into the second half of 2022, global travel has surpassed 2019 numbers in many metrics, commodity prices and oil have pulled back to more reasonable levels, and U.S. equity prices have reached bear market territory from their highs, leading to attractive valuations across sectors where much of the negative forecasts and fiscal tightening has been baked in.
The Fund underperformed the NASDAQ 100 Index, which returned -20.38% for the trailing twelve-month period ended June 30, 2022. The Fund holds roughly 73% U.S. equities and 27% foreign equities, with the majority of foreign holdings domiciled in China. The U.S. Dollar created a headwind for global equities, strengthening relative to global currencies and cementing its status as the global reserve currency, causing ex-U.S. markets to underperform. Global markets and economic activity were directly impacted by Russia’s invasion of Ukraine, as well as the combined impact of regulatory crackdowns and the zero COVID mandate in China pressuring supply chains. For emerging economies, higher energy prices and inflation was uncontrollable, disproportionately impacting yields and output compared to developed economies. Energy and natural gas shortages stemming from Russia have exacerbated inflation, adding to currency devaluation across ex-U.S. countries. Value outperformed growth equities in global markets for the trailing twelve-month period, with cyclical sectors leading due to company pricing power amidst higher prices. Although global growth prospects remain murky, quantitative tightening is well on its way, with China ahead of the pack and beginning to stimulate its economy through easing monetary policies.
The best performing stocks in the Fund for the period were Palo Alto Networks (PANW US), which increased by +33.12%, and Kuaishou Technology (1024 HK), which saw a gain of +21.38%. Other top performers included Fortinet (FTNT US), which rose +18.77%, and JD.com (9618 HK), which climbed +8.08%. The largest detractors were THG PLC (THG LN), which decreased -86.06%, Asana Inc. (ASAN US), which fell -85.21%, and Kingsoft Cloud Holdings Ltd (KC US), which lost -83.38%.
Looking forward, we believe the Fund’s rules-based approach of investing in some of the largest global companies that derive most of their revenue from the internet technology and e-commerce business segments with above-average growth potential provides a quality and differentiated investment holding.
Performance (as of June 30, 2022)
| | 1 Year | Since Inception^ |
| ALPS | O'Shares Global Internet Giants ETF – NAV | -52.52% | 1.98% |
| ALPS | O'Shares Global Internet Giants ETF – Market Price* | -52.48% | 2.01% |
| O'Shares Global Internet Giants Index | -52.36% | 2.49% |
| NASDAQ 100 Index | -20.38% | 13.43% |
Total Expense Ratio (per the current prospectus) is 0.48%.
Performance data quoted represents past performance. The Fund adopted the historical performance of the O'Shares Global Internet Giants ETF (the "Predecessor Fund") as the result of a reorganization in which the Fund acquired all of the assets, subject to liabilities, of the Predecessor Fund on June 17, 2022. The returns presented for the Fund for periods prior to June 17, 2022 reflect the performance of the Predecessor Fund. At the time of the reorganization, the investment objectives of the Fund and the Predecessor Fund were identical and the investment strategies of the Fund and the Predecessor Fund were substantially the same. Past performance does not guarantee future results. Total return figures assume reinvestment of dividends and capital gains distributions, if any. The table does not reflect the deduction of taxes that a shareholder would pay on Fund distributions or the redemption of Fund shares. Investment return and principal value of an investment will fluctuate so that an investor’s shares, when sold or redeemed, may be worth more or less than the original cost. Current performance data may be higher or lower than actual data quoted. For the most current month-end performance data please visit www.alpsfunds.com or call 1.866.675.2639.
7 | June 30, 2022
| ALPS | O’Shares Global Internet Giants ETF | |
| Performance Overview | June 30, 2022 (Unaudited) |
NAV is an exchange-traded fund's per-share value. The per-share dollar amount of the Fund is derived by dividing the total value of all the securities in its portfolio, less any liabilities, by the number of Fund shares outstanding. Market price is the price at which a share can currently be traded in the market. Information detailing the number of days the Market Price of the Fund was greater than the Fund's NAV and the number of days it was less than the Fund's NAV can be obtained at www.alpsfunds.com.
| ^ | The Fund commencement date was June 5, 2018. |
| * | Market Price means the official closing price of a share or, if it more accurately reflects the market value of a share at the time as of which the Fund calculates current net asset value per shares, the price that is the midpoint of the bid-ask spread as of that time. It does not represent the returns an investor would receive if shares were traded at other times. |
The O’Shares Global Internet Giants Index is a rules-based index intended to give investors a means of tracking stocks exhibiting quality and growth characteristics in the internet technology and e-commerce business segments and pass screens for gross margin and cash burn sustainability. Companies included in the Underlying Index derive at least 50% of their revenues from a) internet technology companies whose principal business is to provide the technologies that support internet commerce; and b) internet commerce companies whose principal business is to sell products and services via the internet. The index is reported on a total return basis, which assumes reinvestment of any dividends and distributions realized during a given time period.
The NASDAQ 100 Index includes 100 of the largest domestic and international non-financial companies listed on the Nasdaq Stock Market based on market capitalization.
The indexes are not actively managed and do not reflect any deductions for fees, expenses or taxes. One cannot invest directly in an index. Index performance does not reflect fund performance.
The Fund's shares are not individually redeemable. Investors buy and sell shares of the Fund on a secondary market. Only market makers or "authorized participants" may trade directly with the Fund, typically in blocks of 25,000 shares.
The ALPS | O’Shares Global Internet Giants ETF is not suitable for all investors. Investments in the Fund are subject to investment risks, including possible loss of the principal amount invested.
ALPS Portfolio Solutions Distributor, Inc., a FINRA member, is the distributor for the Fund.
Top 10 Holdings* (as of June 30, 2022)
| Microsoft Corp. | 6.31% |
| Alphabet, Inc. | 6.17% |
| Amazon.com, Inc. | 4.77% |
| Meituan | 2.60% |
| Tencent Holdings, Ltd. | 2.46% |
| Snowflake, Inc. | 1.94% |
| Meta Platforms, Inc. | 1.91% |
| Pinduoduo, Inc. | 1.77% |
| Sea, Ltd. | 1.56% |
| Alibaba Group Holding, Ltd. | 1.55% |
| Total % of Top 10 Holdings | 31.04% |
Country Exposure* (as of June 30, 2022)
| United States | 70.36% |
| China | 14.02% |
| Israel | 3.51% |
| Germany | 2.81% |
| Singapore | 1.56% |
| Sweden | 1.18% |
| Canada | 1.13% |
| Norway | 1.08% |
| Argentina | 1.08% |
| Australia | 0.93% |
| Netherlands | 0.93% |
| New Zealand | 0.73% |
| Japan | 0.68% |
| Total | 100.00% |
| * | % of Total Investments (excluding short term investments) |
Future holdings are subject to change.
8 | June 30, 2022
| ALPS | O’Shares Global Internet Giants ETF | |
| Performance Overview | June 30, 2022 (Unaudited) |
Growth of $10,000 (as of June 30, 2022)
Comparison of Change in Value of $10,000 Investment in the Fund and the Indexes
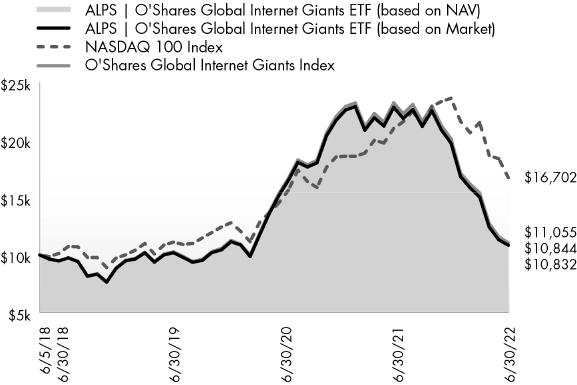
The chart above compares historical performance of a hypothetical investment of $10,000 in the Fund since inception with the performance of the Fund’s benchmark index. Results include the reinvestment of all dividends and capital gains distributions. Past performance does not guarantee future results. The chart does not reflect the deduction of taxes that a shareholder would pay on Fund distributions or the redemption of Fund shares.
9 | June 30, 2022
| ALPS | O’Shares Europe Quality Dividend ETF | |
| Performance Overview | June 30, 2022 (Unaudited) |
Performance Objective
The ALPS|O’Shares Europe Quality Dividend ETF (the "Fund") seeks investment results that track the performance, before fees and expenses, of the O'Shares Europe Quality Dividend Index (the "Underlying Index").
The Underlying Index is designed to measure the performance of publicly-listed large-capitalization and mid-capitalization dividend-paying issuers in Europe that meet certain market capitalization, liquidity, high quality, low volatility and dividend yield thresholds, as determined by O'Shares Investment Advisers, LLC. The high quality and low volatility requirements are designed to reduce exposure to high dividend equities that have experienced large price declines. The constituents of the Underlying Index are selected from the S-Network Europe Equity 500 Index.
Performance Overview
The ALPS|O’Shares Europe Quality Dividend ETF generated a total return of -17.29% for the trailing twelve-month (TTM) period ended June 30, 2022, relatively in-line with the Fund’s Underlying Index, net of fees, which returned -17.18%. The Fund outperformed both the Morningstar Developed Markets ex-North America Index (MSDINUS Index) and the Euro Stoxx 50 Net Return USD Index, which returned -18.72% and -23.13%, respectively for the same period.
The TTM yield for the Fund’s constituents as of 06/30/2022 was 2.78% vs. 3.51% for the MSDINUS Index.
European stocks, as represented by the Euro Stoxx 50 Net Return USD Index, returned -23.13% for the TTM period ended June 30, 2022. The U.S. Dollar created a headwind for international equities, strengthening relative to the Euro, causing ex-U.S. markets to underperform.
Eurozone markets and European economic activity were directly impacted by Russia’s invasion of Ukraine, which remains a key risk in the second half of 2022. Energy and natural gas shortages stemming from Russia have exacerbated inflation and kept energy prices high, with Eurozone Consumer Price Index (CPI) remaining above 5.4% through June of 2022. Value outperformed growth equities in international developed markets for the trailing twelve-month period, with cyclical sectors including Energy and Utilities outperforming due to company pricing power amidst higher prices. The ECB echoed the Fed’s hawkish tone in European markets, stating it would plan to enact the first rate hike in 11 years, with more aggressive hikes to follow as long as inflation stays elevated. Future growth prospects will remain predicated on central bank policies and a resolution to the war in Ukraine. Despite the uncertainty and recession fears heading into the second half of 2022, global travel has surpassed 2019 numbers in many metrics, valuations have normalized to attractive levels, and the potential resolution in Ukraine are positive catalysts to help spur economic activity in developed markets.
Compared to the Morningstar Developed Markets ex-North America Index, the Fund saw a slightly negative impact of -0.29% from its sector allocation where a relative overweight of +11.99% in Health Care contributed +0.87% to Fund outperformance. The Fund’s underweight of -9.66% in the Financials sector was the largest detractor compared to the MSDINUS Index. The Fund received a boost from security selection compared to the MSDINUS Index, with +2.38% of positive performance attributed to its selection effect.
From a geographical perspective, the highest contribution to return was attributed to holdings based in Denmark, which contributed -0.06% towards overall Fund performance. The Fund’s performance was adversely impacted by holdings based in Switzerland, which detracted -4.09% from the Fund.
The best performing stocks for the trailing twelve-month period were Novo Nordisk A/S (NOVOB DC), which increased +33.53%, Swedish Match AB (SWMA SS), which returned +20.61%, and Experian PLC (EXPN LN), which gained +17.57%. The worst performing stocks were Deutsche Post AG (DPW GR), losing -43.06%, Kone Oyj (KNEBV FH), which fell -40.03%, and Schindler Holding AG (SCHP SW), which decreased by -39.84%.
Looking forward, we believe the Fund’s methodology of selecting large-cap and mid-cap companies in Europe with fundamental determinates including quality, low volatility and dividend growth, provides a cost-efficient core investment holding.
Performance (as of June 30, 2022)
| | 1 Year | 5 Year | Since Inception^ |
| ALPS | O'Shares Europe Quality Dividend ETF – NAV | -17.29% | 1.41% | 1.55% |
| ALPS | O'Shares Europe Quality Dividend ETF – Market Price* | -17.59% | 1.31% | 1.57% |
| O'Shares Europe Quality Dividend Index** | -17.18% | 1.88% | 1.98% |
| EURO STOXX 50 Net Return USD Index | -23.13% | 0.71% | 1.56% |
Total Expense Ratio (per the current prospectus) is 0.48%.
Performance data quoted represents past performance. The Fund adopted the historical performance of the O'Shares Europe Quality Dividend ETF (the "Predecessor Fund") as the result of a reorganization in which the Fund acquired all of the assets, subject to liabilities, of the Predecessor Fund on June 17, 2022. The returns presented for the Fund for periods prior to June 17, 2022 reflect the performance of the Predecessor Fund. At the time of the reorganization, the investment objectives of the Fund and the Predecessor Fund were identical and the investment strategies of the Fund and the Predecessor Fund were substantially the same. Previously, the Predecessor Fund had adopted the historical performance of the O’Shares FTSE Europe Quality Dividend ETF (the “Previous Predecessor Fund”), a series of FQF Trust, as the result of a reorganization in which the Predecessor Fund acquired all of the assets, subject to liabilities, of the Previous Predecessor Fund on June 28, 2018. The returns presented for the Predecessor Fund for periods prior to June 28, 2018 reflect the performance of the Previous Predecessor Fund. At the time of the reorganization, the investment objectives of the Previous Predecessor Fund and the Predecessor Fund were identical and the investment strategies of the Previous Predecessor Fund and the Predecessor Fund were substantially the same.
10 | June 30, 2022
| ALPS | O’Shares Europe Quality Dividend ETF | |
| Performance Overview | June 30, 2022 (Unaudited) |
Effective June 1, 2020, the Predecessor Fund’s underlying index was changed to the Underlying Index from the FTSE Developed Europe Qual/Vol/Yield 5% Capped Factor Index (the “Former Index”). Thus, Predecessor Fund performance shown through May 31, 2020 reflects the Predecessor Fund seeking to track the performance of the Former Index, and Predecessor Fund performance shown beginning June 1, 2020 reflects the Predecessor Fund seeking to track the performance of the Underlying Index. In addition, the Underlying Index performance shown reflects the blended performance of the Former Index through May 31, 2020 and the Underlying Index thereafter. Past performance does not guarantee future results. Total return figures assume reinvestment of dividends and capital gains distributions, if any. The table does not reflect the deduction of taxes that a shareholder would pay on Fund distributions or the redemption of Fund shares. Investment return and principal value of an investment will fluctuate so that an investor’s shares, when sold or redeemed, may be worth more or less than the original cost. Current performance data may be higher or lower than actual data quoted. For the most current month-end performance data please visit www.alpsfunds.com or call 1.866.675.2639.
NAV is an exchange-traded fund's per-share value. The per-share dollar amount of the Fund is derived by dividing the total value of all the securities in its portfolio, less any liabilities, by the number of Fund shares outstanding. Market price is the price at which a share can currently be traded in the market. Information detailing the number of days the Market Price of the Fund was greater than the Fund's NAV and the number of days it was less than the Fund's NAV can be obtained at www.alpsfunds.com.
| ^ | The Fund commencement date was August 19, 2015. |
| * | Market Price means the official closing price of a share or, if it more accurately reflects the market value of a share at the time as of which the Fund calculates current net asset value per shares, the price that is the midpoint of the bid-ask spread as of that time. It does not represent the returns an investor would receive if shares were traded at other times. |
| ** | The O’Shares Europe Quality Dividend Index performance information reflects the blended performance of the FTSE Developed Europe Qual/Vol/Yield 5% Capped Factor Index through May 31, 2020 and the O’Shares Europe Quality Dividend Index thereafter. |
The O’Shares Europe Quality Dividend Index is designed to reflect the performance of publicly-listed large-capitalization and mid-capitalization dividend paying issuers in Europe that meet certain market capitalization, liquidity, high quality, low volatility and high dividend yield thresholds. The quality and low volatility requirements are designed to reduce exposure to high dividend equities that have experienced large price declines. The index is reported on a Net Total Return basis which assumes reinvestment of any dividends and distributions realized during a given time period (net of any amounts of withholding tax).
The EURO STOXX 50 Net Return USD Index represents the performance of the 50 largest companies among the 20 supersectors in terms of free-float market cap in Eurozone countries.
The indexes are not actively managed and do not reflect any deductions for fees, expenses or taxes. One cannot invest directly in an index. Index performance does not reflect fund performance.
The Fund's shares are not individually redeemable. Investors buy and sell shares of the Fund on a secondary market. Only market makers or "authorized participants" may trade directly with the Fund, typically in blocks of 25,000 shares.
The ALPS | O’Shares Europe Quality Dividend ETF is not suitable for all investors. Investments in the Fund are subject to investment risks, including possible loss of the principal amount invested.
ALPS Portfolio Solutions Distributor, Inc., a FINRA member, is the distributor for the Fund.
11 | June 30, 2022
| ALPS | O’Shares Europe Quality Dividend ETF | |
| Performance Overview | June 30, 2022 (Unaudited) |
Top 10 Holdings* (as of June 30, 2022)
| Nestle SA | 5.92% |
| Roche Holding AG | 5.70% |
| Novo Nordisk A/S | 5.50% |
| LVMH Moet Hennessy Louis Vuitton SE | 3.75% |
| AstraZeneca PLC | 3.42% |
| Unilever PLC | 3.38% |
| Novartis AG | 3.31% |
| L'Oreal SA | 2.82% |
| SAP SE | 2.69% |
| GSK PLC | 2.62% |
| Total % of Top 10 Holdings | 39.11% |
Country Exposure* (as of June 30, 2022)
| Switzerland | 24.03% |
| France | 19.37% |
| Great Britain | 17.56% |
| Germany | 10.43% |
| Sweden | 9.63% |
| Denmark | 9.45% |
| Netherlands | 4.54% |
| Spain | 3.18% |
| Finland | 1.81% |
| Total | 100.00% |
Sector Allocation* (as of June 30, 2022)
| Consumer, Non-cyclical | 54.37% |
| Industrial | 16.65% |
| Consumer, Cyclical | 10.87% |
| Financial | 5.91% |
| Technology | 4.76% |
| Communications | 4.19% |
| Utilities | 3.25% |
| Total | 100.00% |
| * | % of Total Investments (excluding short term investments) |
Future holdings are subject to change.
12 | June 30, 2022
| ALPS | O’Shares Europe Quality Dividend ETF | |
| Performance Overview | June 30, 2022 (Unaudited) |
Growth of $10,000 (as of June 30, 2022)
Comparison of Change in Value of $10,000 Investment in the Fund and the Indexes
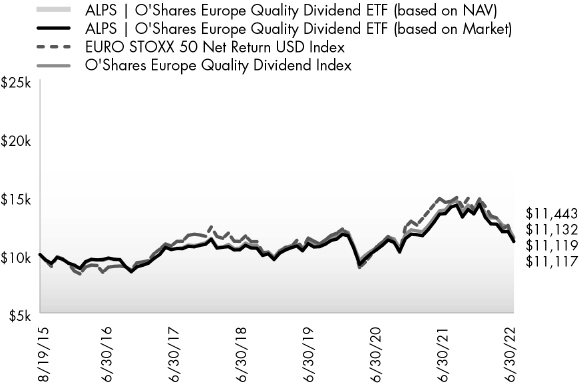
The chart above compares historical performance of a hypothetical investment of $10,000 in the Fund since inception with the performance of the Fund’s benchmark index. Results include the reinvestment of all dividends and capital gains distributions. Past performance does not guarantee future results. The chart does not reflect the deduction of taxes that a shareholder would pay on Fund distributions or the redemption of Fund shares.
13 | June 30, 2022
| ALPS ETF Trust | |
| Disclosure of Fund Expenses | June 30, 2022 (Unaudited) |
Shareholder Expense Example: As a shareholder of a Fund, you incur certain ongoing costs, including management fees and other Fund expenses. These examples are intended to help you understand your ongoing costs (in dollars) of investing in the Fund and to compare these costs with the ongoing costs of investing in other funds. It is based on an investment of $1,000 invested at the beginning of the six month period and held through June 30, 2022.
Actual Return: The first line of the table provides information about actual account values and actual expenses. You may use the information in this line, together with the amount you invested, to estimate the expenses that you incurred over the period. Simply divide your account value by $1,000 (for example, an $8,600 account value divided by $1,000 = 8.6), then multiply the result by the number in the first line under the heading entitled “Expenses Paid During Period” to estimate the expenses attributable to your investment during this period.
Hypothetical 5% Return: The second line of the table provides information about hypothetical account values and hypothetical expenses based on the Fund’s actual expense ratio and an assumed rate of return of 5% per year before expenses, which is not the Fund’s actual return. The hypothetical account values and expenses may not be used to estimate the actual ending account balance or expenses you paid for the period. You may use this information to compare ongoing costs of investing in the Fund and other funds. To do so, compare this 5% hypothetical example with the 5% hypothetical examples that appear in the shareholder reports of other funds.
The expenses shown in the table are meant to highlight ongoing Fund costs only and do not reflect any transaction costs, such as brokerage commissions and other fees to financial intermediaries. Therefore, the second line is useful in comparing ongoing costs only, and will not help you determine the relative total costs of owning different funds. In addition, if these costs were included, your costs would have been higher.
| | Beginning Account Value 1/1/22 | | | Ending Account Value 6/30/22(a) | | | Expense Ratio(a) | | | Expenses Paid During Period 1/1/22 - 6/30/22(b)(d) | |
| ALPS | O’Shares U.S. Quality Dividend ETF | | | | | | | | | | | | | | | | |
| Actual | | $ | 1,000.00 | | | $ | 873.00 | | | | 0.48 | % | | $ | 2.23 | |
| Hypothetical (5% return before expenses) | | $ | 1,000.00 | | | $ | 1,022.41 | | | | 0.48 | % | | $ | 2.41 | |
| | | | | | | | | | | | | | | | | |
| ALPS | O’Shares U.S. Small-Cap Quality Dividend ETF | | | | | | | | | | | | | | | | |
| Actual | | $ | 1,000.00 | | | $ | 858.60 | | | | 0.48 | % | | $ | 2.21 | |
| Hypothetical (5% return before expenses) | | $ | 1,000.00 | | | $ | 1,022.41 | | | | 0.48 | % | | $ | 2.41 | |
| | | | | | | | | | | | | | | | | |
| ALPS | O’Shares Global Internet Giants ETF | | | | | | | | | | | | | | | | |
| Actual | | $ | 1,000.00 | | | $ | 548.70 | | | | 0.48 | % | | $ | 1.84 | |
| Hypothetical (5% return before expenses) | | $ | 1,000.00 | | | $ | 1,022.41 | | | | 0.48 | % | | $ | 2.41 | |
| | | | | | | | | | | | | | | | | |
| ALPS | O’Shares Europe Quality Dividend ETF | | | | | | | | | | | | | | | | |
| Actual | | $ | 1,000.00 | | | $ | 776.30 | | | | 0.48 | % | | $ | 2.11 | |
| Hypothetical (5% return before expenses) | | $ | 1,000.00 | | | $ | 1,022.41 | | | | 0.48 | % | | $ | 2.41 | |
| (a) | The actual return for the Fund prior to June 17, 2022 reflects the actual return of the respective Predecessor Fund. |
| (b) | Annualized based on the Fund's most recent fiscal half-year expenses. |
| (c) | Expenses are equal to the Fund's annualized expense ratio multiplied by the average account value over the period, multiplied by the number of days in the most recent fiscal half year (181), divided by 365. |
| (d) | Expenses paid for the Fund prior to June 17, 2022 reflect the expenses of the respective Predecessor Fund. |
14 | June 30, 2022
| ALPS ETF Trust |
| Report of Independent Registered Public Accounting Firm |
To the Board of Trustees of ALPS ETF Trust and the Shareholders of ALPS | O’Shares U.S. Quality Dividend ETF, ALPS | O’Shares U.S. Small-Cap Quality Dividend ETF, ALPS | O’Shares Global Internet Giants ETF, and ALPS | O’Shares Europe Quality Dividend ETF
Opinion on the Financial Statements
We have audited the accompanying statements of assets and liabilities of ALPS | O’Shares U.S. Quality Dividend ETF (previously, O’Shares U.S. Quality Dividend ETF), ALPS | O’Shares U.S. Small-Cap Quality Dividend ETF (previously, O’Shares U.S. Small-Cap Quality Dividend ETF), ALPS | O’Shares Global Internet Giants ETF (previously, O’Shares Global Internet Giants ETF), and ALPS | O’Shares Europe Quality Dividend ETF (previously, O’Shares Europe Quality Dividend ETF), each a series of shares of beneficial interest in ALPS ETF Trust (the “Funds”), including the schedules of investments, as of June 30, 2022, and the related statements of operations for the year then ended, the statements of changes in net assets for each of the years in the two-year period then ended, the financial highlights as noted in the table below, and the related notes (collectively referred to as the “financial statements”). In our opinion, the financial statements present fairly, in all material respects, the financial position of the Funds as of June 30, 2022, and the results of their operations for the year then ended, the changes in their net assets for each of the years in the two-year period then ended and their financial highlights for each of the periods noted in the table below, in conformity with accounting principles generally accepted in the United States of America.
| Fund | Financial Highlights Presented |
| ALPS | O’Shares U.S. Quality Dividend ETF | For each of the years in the five-year period ended June 30, 2022 |
| ALPS | O’Shares U.S. Small-Cap Quality Dividend ETF | For each of the years in the five-year period ended June 30, 2022 |
| ALPS | O’Shares Global Internet Giants ETF | For each of the years in the four-year period ended June 30, 2022 and for the period from June 5, 2018 (commencement of operations) to June 30, 2018 |
| ALPS | O’Shares Europe Quality Dividend ETF | For each of the years in the five-year period ended June 30, 2022 |
Basis for Opinion
These financial statements are the responsibility of the Funds' management. Our responsibility is to express an opinion on the Funds’ financial statements based on our audits. We are a public accounting firm registered with the Public Company Accounting Oversight Board (United States) (“PCAOB”) and are required to be independent with respect to the Funds in accordance with the U.S. federal securities law and the applicable rules and regulations of the Securities and Exchange Commission and the PCAOB.
We conducted our audits in accordance with the standards of the PCAOB. Those standards require that we plan and perform the audits to obtain reasonable assurance about whether the financial statements are free of material misstatement, whether due to error or fraud. The Funds are not required to have, nor were we engaged to perform, an audit of their internal control over financial reporting. As part of our audits we are required to obtain an understanding of internal control over financial reporting but not for the purpose of expressing an opinion on the effectiveness of the Funds’ internal control over financial reporting. Accordingly, we express no such opinion.
Our audits included performing procedures to assess the risk of material misstatement of the financial statements, whether due to error or fraud, and performing procedures that respond to those risks. Such procedures included examining, on a test basis, evidence regarding the amounts and disclosures in the financial statements. Our procedures included confirmation of securities owned as of June 30, 2022 by correspondence with the custodian. Our audits also included evaluating the accounting principles used and significant estimates made by management, as well as evaluating the overall presentation of the financial statements. We believe that our audits provide a reasonable basis for our opinion.

BBD, LLP
We have served as the auditor of one or more of the Funds in the ALPS ETF Trust and the former OSI ETF Trust since 2017.
Philadelphia, Pennsylvania
August 24, 2022
15 | June 30, 2022
| ALPS | O’Shares U.S. Quality Dividend ETF | |
| Schedule of Investments | June 30, 2022 |
| Security Description | | Shares | | | Value | |
| COMMON STOCKS (99.86%) | | | | | | |
| Aerospace & Defense (5.50%) | | | | | | |
| General Dynamics Corp. | | | 11,185 | | | $ | 2,474,681 | |
| L3Harris Technologies, Inc. | | | 11,648 | | | | 2,815,322 | |
| Lockheed Martin Corp. | | | 59,025 | | | | 25,378,389 | |
| Northrop Grumman Corp. | | | 20,706 | | | | 9,909,270 | |
| Total Aerospace & Defense | | | | | | | 40,577,662 | |
| | | | | | | | | |
| Air Freight & Logistics (1.60%) | | | | | | | | |
| Expeditors International of Washington, Inc. | | | 21,426 | | | | 2,088,178 | |
| United Parcel Service, Inc., | | | | | | | | |
| Class B | | | 52,719 | | | | 9,623,326 | |
| Total Air Freight & Logistics | | | | | | | 11,711,504 | |
| | | | | | | | | |
| Banks (0.25%) | | | | | | | | |
| JPMorgan Chase & Co. | | | 16,449 | | | | 1,852,322 | |
| | | | | | | | | |
| Beverages (3.76%) | | | | | | | | |
| Coca-Cola Co. | | | 231,977 | | | | 14,593,673 | |
| PepsiCo, Inc. | | | 78,583 | | | | 13,096,643 | |
| Total Beverages | | | | | | | 27,690,316 | |
| | | | | | | | | |
| Biotechnology (4.12%) | | | | | | | | |
| AbbVie, Inc. | | | 51,904 | | | | 7,949,617 | |
| Amgen, Inc. | | | 62,021 | | | | 15,089,709 | |
| Gilead Sciences, Inc. | | | 119,036 | | | | 7,357,615 | |
| Total Biotechnology | | | | | | | 30,396,941 | |
| | | | | | | | | |
| Building Products (0.23%) | | | | | | | | |
| Trane Technologies PLC | | | 12,891 | | | | 1,674,154 | |
| | | | | | | | | |
| Capital Markets (3.84%) | | | | | | | | |
| BlackRock, Inc. | | | 1,952 | | | | 1,188,846 | |
| Blackstone, Inc. | | | 107,101 | | | | 9,770,824 | |
| Moody's Corp. | | | 8,057 | | | | 2,191,262 | |
| MSCI, Inc. | | | 2,299 | | | | 947,533 | |
| S&P Global, Inc. | | | 24,454 | | | | 8,242,466 | |
| T Rowe Price Group, Inc. | | | 52,826 | | | | 6,001,562 | |
| Total Capital Markets | | | | | | | 28,342,493 | |
| | | | | | | | | |
| Commercial Services & Supplies (0.90%) | | | | | | | | |
| Cintas Corp. | | | 9,221 | | | | 3,444,320 | |
| Waste Management, Inc. | | | 20,841 | | | | 3,188,256 | |
| Total Commercial Services & Supplies | | | | | | | 6,632,576 | |
| | | | | | | | | |
| Communications Equipment (2.05%) | | | | | | | | |
| Cisco Systems, Inc. | | | 329,299 | | | | 14,041,309 | |
| Motorola Solutions, Inc. | | | 5,275 | | | | 1,105,640 | |
| Total Communications Equipment | | | | | | | 15,146,949 | |
| | | | | | | | | |
| Diversified Telecommunication Services (4.60%) | | | | | | | | |
| Verizon Communications, Inc. | | | 667,021 | | | | 33,851,316 | |
| | | | | | | | | |
| Electrical Equipment (0.40%) | | | | | | | | |
| Emerson Electric Co. | | | 21,675 | | | | 1,724,030 | |
| Security Description | | Shares | | | Value | |
| Electrical Equipment (continued) | | | | | | | | |
| Rockwell Automation, Inc. | | | 6,309 | | | $ | 1,257,447 | |
| Total Electrical Equipment | | | | | | | 2,981,477 | |
| | | | | | | | | |
| Electronic Equipment, Instruments & Components (0.22%) | | | | | | | | |
| Amphenol Corp., Class A | | | 13,755 | | | | 885,547 | |
| TE Connectivity, Ltd. | | | 6,359 | | | | 719,521 | |
| Total Electronic Equipment, Instruments & Components | | | | | | | 1,605,068 | |
| | | | | | | | | |
| Entertainment (0.43%) | | | | | | | | |
| Activision Blizzard, Inc. | | | 41,099 | | | | 3,199,968 | |
| | | | | | | | | |
| Food & Staples Retailing (1.70%) | | | | | | | | |
| Costco Wholesale Corp. | | | 16,839 | | | | 8,070,596 | |
| Walmart, Inc. | | | 37,012 | | | | 4,499,919 | |
| Total Food & Staples Retailing | | | | | | | 12,570,515 | |
| | | | | | | | | |
| Food Products (1.76%) | | | | | | | | |
| Archer-Daniels-Midland Co. | | | 13,683 | | | | 1,061,801 | |
| General Mills, Inc. | | | 29,915 | | | | 2,257,087 | |
| Hershey Co. | | | 14,054 | | | | 3,023,859 | |
| Hormel Foods Corp. | | | 38,496 | | | | 1,823,171 | |
| Mondelez International, Inc., | | | | | | | | |
| Class A | | | 77,663 | | | | 4,822,095 | |
| Total Food Products | | | | | | | 12,988,013 | |
| | | | | | | | | |
| Health Care Equipment & Supplies (2.90%) | | | | | | | | |
| Abbott Laboratories | | | 133,086 | | | | 14,459,793 | |
| Baxter International, Inc. | | | 15,159 | | | | 973,663 | |
| Becton Dickinson and Co. | | | 4,661 | | | | 1,149,076 | |
| Medtronic PLC | | | 42,925 | | | | 3,852,518 | |
| Stryker Corp. | | | 4,691 | | | | 933,181 | |
| Total Health Care Equipment & Supplies | | | | | | | 21,368,231 | |
| | | | | | | | | |
| Health Care Providers & Services (3.10%) | | | | | | | | |
| Quest Diagnostics, Inc. | | | 15,231 | | | | 2,025,418 | |
| UnitedHealth Group, Inc. | | | 40,537 | | | | 20,821,020 | |
| Total Health Care Providers & Services | | | | | | | 22,846,438 | |
| | | | | | | | | |
| Hotels, Restaurants & Leisure (4.53%) | | | | | | | | |
| McDonald's Corp. | | | 94,451 | | | | 23,318,063 | |
| Starbucks Corp. | | | 94,731 | | | | 7,236,501 | |
| Yum! Brands, Inc. | | | 25,487 | | | | 2,893,029 | |
| Total Hotels, Restaurants & Leisure | | | | | | | 33,447,593 | |
| | | | | | | | | |
| Household Durables (0.26%) | | | | | | | | |
| Garmin, Ltd. | | | 19,394 | | | | 1,905,461 | |
| | | | | | | | | |
| Household Products (7.04%) | | | | | | | | |
| Church & Dwight Co., Inc. | | | 16,730 | | | | 1,550,202 | |
| Clorox Co. | | | 11,833 | | | | 1,668,216 | |
| Colgate-Palmolive Co. | | | 95,273 | | | | 7,635,178 | |
| Kimberly-Clark Corp. | | | 28,246 | | | | 3,817,447 | |
| | | | | | | | | |
16 | June 30, 2022
| ALPS | O’Shares U.S. Quality Dividend ETF | |
| Schedule of Investments | June 30, 2022 |
| Security Description | | Shares | | | Value | |
| Household Products (continued) | | | | | | |
| Procter & Gamble Co. | | | 258,897 | | | $ | 37,226,799 | |
| Total Household Products | | | | | | | 51,897,842 | |
| | | | | | | | | |
| Industrial Conglomerates (2.89%) | | | | | | | | |
| 3M Co. | | | 96,880 | | | | 12,537,241 | |
| Honeywell International, Inc. | | | 50,450 | | | | 8,768,714 | |
| Total Industrial Conglomerates | | | | | | | 21,305,955 | |
| | | | | | | | | |
| Insurance (1.93%) | | | | | | | | |
| Allstate Corp. | | | 40,016 | | | | 5,071,227 | |
| Aon PLC, Class A | | | 6,952 | | | | 1,874,815 | |
| Chubb, Ltd. | | | 14,534 | | | | 2,857,094 | |
| Marsh & McLennan Cos., Inc. | | | 28,338 | | | | 4,399,475 | |
| Total Insurance | | | | | | | 14,202,611 | |
| | | | | | | | | |
| Internet & Direct Marketing Retail (0.13%) | | | | | | | | |
| eBay, Inc. | | | 23,728 | | | | 988,746 | |
| | | | | | | | | |
| IT Services (4.06%) | | | | | | | | |
| Accenture PLC, Class A | | | 36,190 | | | | 10,048,154 | |
| Automatic Data Processing, Inc. | | | 9,057 | | | | 1,902,332 | |
| Broadridge Financial Solutions, Inc. | | | 3,344 | | | | 476,687 | |
| Cognizant Technology | | | | | | | | |
| Solutions Corp., Class A | | | 16,966 | | | | 1,145,035 | |
| International Business | | | | | | | | |
| Machines Corp. | | | 8,560 | | | | 1,208,586 | |
| Mastercard, Inc., Class A | | | 10,514 | | | | 3,316,957 | |
| Paychex, Inc. | | | 16,068 | | | | 1,829,663 | |
| Visa, Inc., Class A | | | 50,843 | | | | 10,010,478 | |
| Total IT Services | | | | | | | 29,937,892 | |
| | | | | | | | | |
| Life Sciences Tools & Services (0.34%) | | | | | | | | |
| Agilent Technologies, Inc. | | | 6,837 | | | | 812,030 | |
| Thermo Fisher Scientific, Inc. | | | 3,152 | | | | 1,712,419 | |
| Total Life Sciences Tools & Services | | | | | | | 2,524,449 | |
| | | | | | | | | |
| Machinery (1.69%) | | | | | | | | |
| Cummins, Inc. | | | 9,925 | | | | 1,920,785 | |
| Illinois Tool Works, Inc. | | | 57,768 | | | | 10,528,218 | |
| Total Machinery | | | | | | | 12,449,003 | |
| | | | | | | | | |
| Media (2.14%) | | | | | | | | |
| Comcast Corp., Class A | | | 402,918 | | | | 15,810,502 | |
| | | | | | | | | |
| Multiline Retail (0.89%) | | | | | | | | |
| Dollar General Corp. | | | 13,763 | | | | 3,377,991 | |
| Target Corp. | | | 22,565 | | | | 3,186,855 | |
| Total Multiline Retail | | | | | | | 6,564,846 | |
| | | | | | | | | |
| Personal Products (0.29%) | | | | | | | | |
| Estee Lauder Cos., Inc., Class A | | | 8,392 | | | | 2,137,191 | |
| | | | | | | | | |
| Pharmaceuticals (14.98%) | | | | | | | | |
| Eli Lilly & Co. | | | 61,558 | | | | 19,958,950 | |
| Security Description | | Shares | | | Value | |
| Pharmaceuticals (continued) | | | | | | |
| Johnson & Johnson | | | 240,181 | | | $ | 42,634,528 | |
| Merck & Co., Inc. | | | 168,992 | | | | 15,407,001 | |
| Pfizer, Inc. | | | 578,290 | | | | 30,319,745 | |
| Zoetis, Inc. | | | 12,213 | | | | 2,099,293 | |
| Total Pharmaceuticals | | | | | | | 110,419,517 | |
| | | | | | | | | |
| Road & Rail (1.84%) | | | | | | | | |
| CSX Corp. | | | 63,665 | | | | 1,850,105 | |
| Norfolk Southern Corp. | | | 10,165 | | | | 2,310,403 | |
| Union Pacific Corp. | | | 44,345 | | | | 9,457,902 | |
| Total Road & Rail | | | | | | | 13,618,410 | |
| | | | | | | | | |
| Semiconductors & Semiconductor Equipment (2.85%) | | | | | | | | |
| Analog Devices, Inc. | | | 8,764 | | | | 1,280,333 | |
| Broadcom, Inc. | | | 1,915 | | | | 930,326 | |
| Intel Corp. | | | 92,364 | | | | 3,455,337 | |
| QUALCOMM, Inc. | | | 5,642 | | | | 720,709 | |
| Texas Instruments, Inc. | | | 95,094 | | | | 14,611,193 | |
| Total Semiconductors & Semiconductor Equipment | | | | | | | 20,997,898 | |
| | | | | | | | | |
| Software (5.45%) | | | | | | | | |
| Intuit, Inc. | | | 1,844 | | | | 710,751 | |
| Microsoft Corp. | | | 123,135 | | | | 31,624,763 | |
| Oracle Corp. | | | 112,751 | | | | 7,877,913 | |
| Total Software | | | | | | | 40,213,427 | |
| | | | | | | | | |
| Specialty Retail (4.78%) | | | | | | | | |
| Home Depot, Inc. | | | 99,678 | | | | 27,338,685 | |
| Lowe's Cos., Inc. | | | 30,131 | | | | 5,262,982 | |
| TJX Cos., Inc. | | | 45,686 | | | | 2,551,563 | |
| Total Specialty Retail | | | | | | | 35,153,230 | |
| | | | | | | | | |
| Technology Hardware, Storage & Peripherals (3.34%) | | | | | | | | |
| Apple, Inc. | | | 179,753 | | | | 24,575,830 | |
| | | | | | | | | |
| Textiles, Apparel & Luxury Goods (0.57%) | | | | | | | | |
| NIKE, Inc., Class B | | | 40,981 | | | | 4,188,258 | |
| | | | | | | | | |
| Tobacco (2.02%) | | | | | | | | |
| Altria Group, Inc. | | | 105,123 | | | | 4,390,988 | |
| Philip Morris International, Inc. | | | 105,865 | | | | 10,453,110 | |
| Total Tobacco | | | | | | | 14,844,098 | |
| | | | | | | | | |
| Trading Companies & Distributors (0.48%) | | | | | | | | |
| Fastenal Co. | | | 71,279 | | | | 3,558,248 | |
| | | | | | | | | |
| TOTAL COMMON STOCKS | | | | | | | | |
| (Cost $691,530,629) | | | | | | | 736,176,950 | |
17 | June 30, 2022
| ALPS | O’Shares U.S. Quality Dividend ETF | |
| Schedule of Investments | June 30, 2022 |
| | | 7 Day Yield | | | Shares | | | Value | |
| SHORT TERM INVESTMENTS (0.18%) | | | | | |
| Money Market Fund | | | | | | | | | |
| State Street Institutional Treasury Plus Money Market Fund | | | 1.45 | % | | | 1,342,751 | | | $ | 1,342,751 | |
| | | | | | | | | | | | | |
| TOTAL SHORT TERM INVESTMENTS | | | | | | | | | | | | |
| (Cost $1,342,751) | | | | | | | | | | | 1,342,751 | |
| | | | | | | | | | | | | |
| TOTAL INVESTMENTS (100.04%) | | | | | | | | | | | | |
| (Cost $692,873,380) | | | | | | | | | | $ | 737,519,701 | |
| LIABILITIES IN EXCESS OF OTHER ASSETS (-0.04%) | | | | | | | | | | | (290,819 | ) |
| NET ASSETS - 100.00% | | | | | | | | | | $ | 737,228,882 | |
See Notes to Financial Statements.
18 | June 30, 2022
| ALPS | O’Shares U.S. Small-Cap Quality Dividend ETF | |
| Schedule of Investments | June 30, 2022 |
| Security Description | | Shares | | | Value | |
| COMMON STOCKS (99.81%) | | | | | | |
| Auto Components (3.71%) | | | | | | |
| BorgWarner, Inc. | | | 43,043 | | | $ | 1,436,345 | |
| Gentex Corp. | | | 113,016 | | | | 3,161,059 | |
| Lear Corp. | | | 3,500 | | | | 440,615 | |
| Standard Motor Products, Inc. | | | 16,488 | | | | 741,795 | |
| Total Auto Components | | | | | | | 5,779,814 | |
| | | | | | | | | |
| Building Products (2.12%) | | | | | | | | |
| A O Smith Corp. | | | 49,898 | | | | 2,728,423 | |
| Simpson Manufacturing Co., Inc. | | | 5,380 | | | | 541,282 | |
| Total Building Products | | | | | | | 3,269,705 | |
| | | | | | | | | |
| Capital Markets (13.11%) | | | | | | | | |
| Artisan Partners Asset | | | | | | | | |
| Management, Inc., Class A | | | 32,949 | | | | 1,171,996 | |
| Carlyle Group, Inc. | | | 71,805 | | | | 2,273,346 | |
| Cboe Global Markets, Inc. | | | 28,374 | | | | 3,211,653 | |
| Cohen & Steers, Inc. | | | 11,299 | | | | 718,503 | |
| Evercore, Inc., Class A | | | 11,410 | | | | 1,068,090 | |
| Hamilton Lane, Inc., Class A | | | 10,118 | | | | 679,727 | |
| Houlihan Lokey, Inc. | | | 39,263 | | | | 3,099,029 | |
| Lazard, Ltd., Class A | | | 49,800 | | | | 1,614,018 | |
| LPL Financial Holdings, Inc. | | | 3,750 | | | | 691,800 | |
| Moelis & Co., Class A | | | 38,474 | | | | 1,513,952 | |
| Morningstar, Inc. | | | 4,742 | | | | 1,146,758 | |
| SEI Investments Co. | | | 58,647 | | | | 3,168,111 | |
| Total Capital Markets | | | | | | | 20,356,983 | |
| | | | | | | | | |
| Commercial Services & Supplies (1.45%) | | | | | | | | |
| Brady Corp., Class A | | | 24,916 | | | | 1,177,031 | |
| Ennis, Inc. | | | 22,065 | | | | 446,375 | |
| Healthcare Services Group, Inc. | | | 14,925 | | | | 259,844 | |
| UniFirst Corp. | | | 2,069 | | | | 356,240 | |
| Total Commercial Services & Supplies | | | | | | | 2,239,490 | |
| | | | | | | | | |
| Communications Equipment (2.31%) | | | | | | | | |
| Juniper Networks, Inc. | | | 126,115 | | | | 3,594,278 | |
| | | | | | | | | |
| Construction & Engineering (0.56%) | | | | | | | | |
| MDU Resources Group, Inc. | | | 32,262 | | | | 870,751 | |
| | | | | | | | | |
| Consumer Finance (0.22%) | | | | | | | | |
| OneMain Holdings, Inc. | | | 9,003 | | | | 336,532 | |
| | | | | | | | | |
| Diversified Consumer Services (4.81%) | | | | | | | | |
| Graham Holdings Co., Class B | | | 1,441 | | | | 816,816 | |
| H&R Block, Inc. | | | 77,471 | | | | 2,736,276 | |
| Service Corp. International | | | 56,570 | | | | 3,910,117 | |
| Total Diversified Consumer Services | | | | | | | 7,463,209 | |
| | | | | | | | | |
| Electric Utilities (2.99%) | | | | | | | | |
| ALLETE, Inc. | | | 5,396 | | | | 317,177 | |
| Hawaiian Electric Industries, Inc. | | | 8,948 | | | | 365,973 | |
| IDACORP, Inc. | | | 6,990 | | | | 740,381 | |
| Security Description | | Shares | | | Value | |
| Electric Utilities (continued) | | | | | | |
| MGE Energy, Inc. | | | 5,274 | | | $ | 410,475 | |
| NRG Energy, Inc. | | | 10,031 | | | | 382,883 | |
| OGE Energy Corp. | | | 21,677 | | | | 835,865 | |
| Otter Tail Corp. | | | 6,116 | | | | 410,567 | |
| Pinnacle West Capital Corp. | | | 12,564 | | | | 918,680 | |
| PNM Resources, Inc. | | | 5,683 | | | | 271,534 | |
| Total Electric Utilities | | | | | | | 4,653,535 | |
| | | | | | | | | |
| Electronic Equipment, Instruments & Components (2.37%) | | | | | | | | |
| Avnet, Inc. | | | 26,945 | | | | 1,155,402 | |
| Littelfuse, Inc. | | | 3,722 | | | | 945,537 | |
| National Instruments Corp. | | | 30,955 | | | | 966,725 | |
| Vishay Intertechnology, Inc. | | | 34,789 | | | | 619,940 | |
| Total Electronic Equipment, Instruments & Components | | | | | | | 3,687,604 | |
| | | | | | | | | |
| Food & Staples Retailing (0.79%) | | | | | | | | |
| Casey's General Stores, Inc. | | | 3,937 | | | | 728,266 | |
| Weis Markets, Inc. | | | 6,599 | | | | 491,889 | |
| Total Food & Staples Retailing | | | | | | | 1,220,155 | |
| | | | | | | | | |
| Food Products (7.55%) | | | | | | | | |
| Bunge, Ltd. | | | 41,021 | | | | 3,720,194 | |
| Flowers Foods, Inc. | | | 93,245 | | | | 2,454,208 | |
| Ingredion, Inc. | | | 21,478 | | | | 1,893,500 | |
| J & J Snack Foods Corp. | | | 2,590 | | | | 361,719 | |
| Lamb Weston Holdings, Inc. | | | 16,886 | | | | 1,206,674 | |
| Lancaster Colony Corp. | | | 11,979 | | | | 1,542,656 | |
| Tootsie Roll Industries, Inc. | | | 15,860 | | | | 560,651 | |
| Total Food Products | | | | | | | 11,739,602 | |
| | | | | | | | | |
| Gas Utilities (2.79%) | | | | | | | | |
| National Fuel Gas Co. | | | 9,987 | | | | 659,641 | |
| New Jersey Resources Corp. | | | 7,860 | | | | 350,006 | |
| ONE Gas, Inc. | | | 5,389 | | | | 437,533 | |
| Southwest Gas Holdings, Inc. | | | 4,830 | | | | 420,596 | |
| Spire, Inc. | | | 6,009 | | | | 446,889 | |
| UGI Corp. | | | 52,235 | | | | 2,016,794 | |
| Total Gas Utilities | | | | | | | 4,331,459 | |
| | | | | | | | | |
| Health Care Providers & Services (6.35%) | | | | | | | | |
| Chemed Corp. | | | 3,402 | | | | 1,596,865 | |
| Encompass Health Corp. | | | 44,158 | | | | 2,475,056 | |
| National HealthCare Corp. | | | 36,295 | | | | 2,537,020 | |
| Premier, Inc., Class A | | | 90,892 | | | | 3,243,027 | |
| Total Health Care Providers & Services | | | | | | | 9,851,968 | |
| | | | | | | | | |
| Household Durables (1.90%) | | | | | | | | |
| Leggett & Platt, Inc. | | | 33,039 | | | | 1,142,489 | |
| MDC Holdings, Inc. | | | 10,806 | | | | 349,142 | |
| Whirlpool Corp. | | | 9,473 | | | | 1,467,084 | |
| Total Household Durables | | | | | | | 2,958,715 | |
19 | June 30, 2022
| ALPS | O’Shares U.S. Small-Cap Quality Dividend ETF | |
| Schedule of Investments | June 30, 2022 |
| Security Description | | Shares | | | Value | |
| Household Products (0.98%) | | | | | | |
| Reynolds Consumer Products, Inc. | | | 29,685 | | | $ | 809,510 | |
| WD-40 Co. | | | 3,571 | | | | 719,057 | |
| Total Household Products | | | | | | | 1,528,567 | |
| | | | | | | | | |
| Insurance (8.21%) | | | | | | | | |
| Erie Indemnity Co., Class A | | | 20,205 | | | | 3,883,199 | |
| Mercury General Corp. | | | 27,799 | | | | 1,231,496 | |
| Old Republic International Corp. | | | 139,140 | | | | 3,111,170 | |
| RLI Corp. | | | 15,095 | | | | 1,759,926 | |
| Safety Insurance Group, Inc. | | | 20,318 | | | | 1,972,878 | |
| Stewart Information Services Corp. | | | 16,021 | | | | 797,045 | |
| Total Insurance | | | | | | | 12,755,714 | |
| | | | | | | | | |
| IT Services (9.96%) | | | | | | | | |
| Amdocs, Ltd. | | | 45,384 | | | | 3,780,942 | |
| CSG Systems International, Inc. | | | 17,207 | | | | 1,026,914 | |
| Genpact, Ltd. | | | 37,463 | | | | 1,586,933 | |
| Jack Henry & Associates, Inc. | | | 20,607 | | | | 3,709,672 | |
| Maximus, Inc. | | | 41,899 | | | | 2,619,106 | |
| Western Union Co. | | | 165,631 | | | | 2,727,943 | |
| Total IT Services | | | | | | | 15,451,510 | |
| | | | | | | | | |
| Leisure Products (1.15%) | | | | | | | | |
| Acushnet Holdings Corp. | | | 12,167 | | | | 507,121 | |
| Polaris, Inc. | | | 5,492 | | | | 545,245 | |
| Sturm Ruger & Co., Inc. | | | 11,571 | | | | 736,494 | |
| Total Leisure Products | | | | | | | 1,788,860 | |
| | | | | | | | | |
| Life Sciences Tools & Services (0.52%) | | | | | | | | |
| Bio-Techne Corp. | | | 2,340 | | | | 811,138 | |
| | | | | | | | | |
| Machinery (9.49%) | | | | | | | | |
| Donaldson Co., Inc. | | | 40,427 | | | | 1,946,156 | |
| Franklin Electric Co., Inc. | | | 8,566 | | | | 627,545 | |
| Graco, Inc. | | | 45,680 | | | | 2,713,848 | |
| ITT, Inc. | | | 6,964 | | | | 468,259 | |
| Lincoln Electric Holdings, Inc. | | | 22,890 | | | | 2,823,710 | |
| Oshkosh Corp. | | | 6,261 | | | | 514,279 | |
| Snap-on, Inc. | | | 16,012 | | | | 3,154,845 | |
| Toro Co. | | | 32,992 | | | | 2,500,464 | |
| Total Machinery | | | | | | | 14,749,106 | |
| | | | | | | | | |
| Media (3.55%) | | | | | | | | |
| Cable One, Inc. | | | 544 | | | | 701,390 | |
| Interpublic Group of Cos., Inc. | | | 95,821 | | | | 2,637,952 | |
| John Wiley & Sons, Inc., Class A | | | 19,496 | | | | 931,129 | |
| New York Times Co., Class A | | | 11,081 | | | | 309,160 | |
| News Corp., Class A | | | 59,462 | | | | 926,418 | |
| Total Media | | | | | | | 5,506,049 | |
| | | | | | | | | |
| Multi-Utilities (0.40%) | | | | | | | | |
| Black Hills Corp. | | | 4,448 | | | | 323,681 | |
| Security Description | | Shares | | | Value | |
| Multi-Utilities (continued) | | | | | | |
| NorthWestern Corp. | | | 5,045 | | | $ | 297,302 | |
| Total Multi-Utilities | | | | | | | 620,983 | |
| | | | | | | | | |
| Professional Services (2.21%) | | | | | | | | |
| Exponent, Inc. | | | 10,608 | | | | 970,314 | |
| Robert Half International, Inc. | | | 33,036 | | | | 2,474,066 | |
| Total Professional Services | | | | | | | 3,444,380 | |
| | | | | | | | | |
| Road & Rail (1.52%) | | | | | | | | |
| Landstar System, Inc. | | | 6,869 | | | | 998,890 | |
| Schneider National, Inc., Class B | | | 38,279 | | | | 856,684 | |
| Werner Enterprises, Inc. | | | 13,124 | | | | 505,799 | |
| Total Road & Rail | | | | | | | 2,361,373 | |
| | | | | | | | | |
| Semiconductors & Semiconductor | | | | | | | | |
| Equipment (1.22%) | | | | | | | | |
| Monolithic Power Systems, Inc. | | | 3,857 | | | | 1,481,242 | |
| Power Integrations, Inc. | | | 5,590 | | | | 419,306 | |
| Total Semiconductors & Semiconductor Equipment | | | | | | | 1,900,548 | |
| | | | | | | | | |
| Software (3.37%) | | | | | | | | |
| CDK Global, Inc. | | | 35,799 | | | | 1,960,711 | |
| Dolby Laboratories, Inc., Class A | | | 37,270 | | | | 2,667,040 | |
| Progress Software Corp. | | | 13,401 | | | | 607,065 | |
| Total Software | | | | | | | 5,234,816 | |
| | | | | | | | | |
| Specialty Retail (0.52%) | | | | | | | | |
| Murphy USA, Inc. | | | 3,462 | | | | 806,196 | |
| | | | | | | | | |
| Textiles, Apparel & Luxury Goods (0.61%) | | | | | | | | |
| Carter's, Inc. | | | 7,094 | | | | 499,985 | |
| Columbia Sportswear Co. | | | 6,250 | | | | 447,375 | |
| Total Textiles, Apparel & Luxury Goods | | | | | | | 947,360 | |
| | | | | | | | | |
| Thrifts & Mortgage Finance (0.27%) | | | | | | | | |
| MGIC Investment Corp. | | | 33,542 | | | | 422,629 | |
| | | | | | | | | |
| Tobacco (0.24%) | | | | | | | | |
| Vector Group, Ltd. | | | 34,815 | | | | 365,558 | |
| | | | | | | | | |
| Trading Companies & Distributors (1.94%) | | | | | | | | |
| Watsco, Inc. | | | 12,585 | | | | 3,005,550 | |
| | | | | | | | | |
| Water Utilities (0.62%) | | | | | | | | |
| American States Water Co. | | | 4,449 | | | | 362,638 | |
| Essential Utilities, Inc. | | | 12,942 | | | | 593,391 | |
| Total Water Utilities | | | | | | | 956,029 | |
| | | | | | | | | |
| TOTAL COMMON STOCKS | | | | | | | | |
| (Cost $153,503,305) | | | | | | | 155,010,166 | |
20 | June 30, 2022
| ALPS | O’Shares U.S. Small-Cap Quality Dividend ETF | |
| Schedule of Investments | June 30, 2022 |
| | | 7 Day Yield | | | Shares | | | Value | |
| SHORT TERM INVESTMENTS (0.19%) | | | | | |
| Money Market Fund | | | | | | | | | |
| State Street Institutional Treasury Plus Money Market Fund | | | 1.45 | % | | | 410,826 | | | $ | 301,297 | |
| | | | | | | | | | | | | |
| TOTAL SHORT TERM INVESTMENTS | | | | | | | | | | | | |
| (Cost $301,297) | | | | | | | | | | | 301,297 | |
| | | | | | | | | | | | | |
| TOTAL INVESTMENTS (100.00%) | | | | | | | | | | | | |
| (Cost $153,804,602) | | | | | | | | | | $ | 155,311,463 | |
| OTHER ASSETS IN EXCESS OF LIABILITIES (0.00%)(a) | | | | | | | | | | | 6,888 | |
| NET ASSETS - 100.00% | | | | | | | | | | $ | 155,318,351 | |
(a) Less than 0.005%.
See Notes to Financial Statements.
21 | June 30, 2022
| ALPS | O’Shares Global Internet Giants ETF | |
| Schedule of Investments | June 30, 2022 |
| Security Description | | Shares | | | Value | |
| COMMON STOCKS (99.78%) | | | | | | |
| Entertainment (10.84%) | | | | | | |
| Activision Blizzard, Inc. | | | 8,695 | | | $ | 676,993 | |
| Bilibili, Inc., ADR(a) | | | 109,712 | | | | 2,808,627 | |
| CTS Eventim AG & Co. KGaA(a) | | | 46,069 | | | | 2,413,911 | |
| Electronic Arts, Inc. | | | 7,214 | | | | 877,583 | |
| Live Nation Entertainment, Inc.(a) | | | 34,021 | | | | 2,809,454 | |
| NetEase, Inc. | | | 57,468 | | | | 1,055,352 | |
| Netflix, Inc.(a) | | | 6,236 | | | | 1,090,489 | |
| Nexon Co., Ltd. | | | 42,100 | | | | 861,983 | |
| ROBLOX Corp., Class A(a) | | | 84,958 | | | | 2,791,720 | |
| Roku, Inc.(a) | | | 22,442 | | | | 1,843,386 | |
| Sea, Ltd., ADR(a) | | | 48,732 | | | | 3,258,222 | |
| Spotify Technology SA(a) | | | 9,093 | | | | 853,196 | |
| Take-Two Interactive Software, Inc.(a) | | | 11,534 | | | | 1,413,261 | |
| Total Entertainment | | | | | | | 22,754,177 | |
| | | | | | | | | |
| Interactive Media & Services (17.93%) | | | | | | | | |
| Adevinta ASA(a) | | | 313,995 | | | | 2,268,165 | |
| Alphabet, Inc., Class A(a) | | | 5,929 | | | | 12,920,832 | |
| Baidu, Inc., Sponsored ADR(a) | | | 2,638 | | | | 392,350 | |
| IAC/InterActiveCorp(a) | | | 20,380 | | | | 1,548,269 | |
| Kuaishou Technology(a)(b)(c) | | | 226,000 | | | | 2,517,255 | |
| Match Group, Inc.(a) | | | 14,338 | | | | 999,215 | |
| Meta Platforms, Inc., Class A(a) | | | 24,762 | | | | 3,992,873 | |
| Pinterest, Inc., Class A(a) | | | 74,304 | | | | 1,349,361 | |
| Snap, Inc., Class A(a) | | | 199,695 | | | | 2,621,995 | |
| Tencent Holdings, Ltd. | | | 114,117 | | | | 5,154,083 | |
| Twitter, Inc.(a) | | | 34,545 | | | | 1,291,638 | |
| Z Holdings Corp. | | | 193,477 | | | | 565,259 | |
| ZoomInfo Technologies, Inc.(a) | | | 60,236 | | | | 2,002,245 | |
| Total Interactive Media & Services | | | | | | | 37,623,540 | |
| | | | | | | | | |
| Internet & Direct Marketing Retail (18.34%) | | | | | | | | |
| Alibaba Group Holding, Ltd., | | | | | | | | |
| Sponsored ADR(a) | | | 28,548 | | | | 3,245,337 | |
| Amazon.com, Inc.(a) | | | 94,013 | | | | 9,985,120 | |
| Chewy, Inc., Class A(a) | | | 39,539 | | | | 1,372,794 | |
| Delivery Hero SE(a)(b)(c) | | | 72,689 | | | | 2,724,771 | |
| DoorDash, Inc., Class A(a) | | | 22,405 | | | | 1,437,729 | |
| Etsy, Inc.(a) | | | 14,285 | | | | 1,045,805 | |
| Global-e Online, Ltd.(a) | | | 130,845 | | | | 2,639,144 | |
| JD.com, Inc. | | | 83,896 | | | | 2,702,874 | |
| Just Eat Takeaway.com NV(a)(b)(c) | | | 123,115 | | | | 1,943,799 | |
| Meituan, Class B(a)(b)(c) | | | 220,266 | | | | 5,451,350 | |
| MercadoLibre, Inc., Sponsored ADR(a) | | | 3,540 | | | | 2,254,520 | |
| Pinduoduo, Inc., ADR(a) | | | 59,821 | | | | 3,696,938 | |
| Total Internet & Direct Marketing Retail | | | | | | | 38,500,181 | |
| | | | | | | | | |
| IT Services (9.30%) | | | | | | | | |
| Cloudflare, Inc., Class A(a) | | | 50,584 | | | | 2,213,050 | |
| DigitalOcean Holdings, Inc.(a) | | | 43,059 | | | | 1,780,920 | |
| MongoDB, Inc.(a) | | | 9,371 | | | | 2,431,775 | |
| Security Description | | Shares | | | Value | |
| IT Services (continued) | | | | | | |
| Okta, Inc.(a) | | | 28,342 | | | $ | 2,562,117 | |
| Shopify, Inc., Class A(a) | | | 75,660 | | | | 2,363,618 | |
| Sinch AB(a) | | | 498,527 | | | | 1,622,567 | |
| Snowflake, Inc., Class A(a) | | | 29,229 | | | | 4,064,585 | |
| Twilio, Inc., Class A(a) | | | 22,954 | | | | 1,923,775 | |
| VeriSign, Inc.(a) | | | 3,304 | | | | 552,858 | |
| Total IT Services | | | | | | | 19,515,265 | |
| | | | | | | | | |
| Software (43.37%) | | | | | | | | |
| Adobe, Inc.(a) | | | 5,423 | | | | 1,985,143 | |
| AppLovin Corp., Class A(a) | | | 43,969 | | | | 1,514,292 | |
| Asana, Inc., Class A(a) | | | 110,208 | | | | 1,937,457 | |
| Atlassian Corp. PLC, Class A(a) | | | 10,374 | | | | 1,944,088 | |
| Bill.com Holdings, Inc.(a) | | | 22,983 | | | | 2,526,751 | |
| Confluent, Inc., Class A(a) | | | 106,682 | | | | 2,479,290 | |
| Coupa Software, Inc.(a) | | | 20,254 | | | | 1,156,503 | |
| Crowdstrike Holdings, Inc., | | | | | | | | |
| Class A(a) | | | 19,146 | | | | 3,227,249 | |
| Datadog, Inc., Class A(a) | | | 31,154 | | | | 2,967,107 | |
| Digital Turbine, Inc.(a) | | | 129,677 | | | | 2,265,457 | |
| DocuSign, Inc.(a) | | | 24,140 | | | | 1,385,153 | |
| Dynatrace, Inc.(a) | | | 36,052 | | | | 1,421,891 | |
| Elastic NV(a) | | | 23,746 | | | | 1,606,892 | |
| Fortinet, Inc.(a) | | | 32,315 | | | | 1,828,383 | |
| Gitlab, Inc., Class A(a) | | | 51,384 | | | | 2,730,546 | |
| HubSpot, Inc.(a) | | | 5,626 | | | | 1,691,457 | |
| Intuit, Inc. | | | 4,164 | | | | 1,604,972 | |
| ironSource, Ltd., Class A(a) | | | 937,293 | | | | 2,230,757 | |
| Kingdee International Software | | | | | | | | |
| Group Co., Ltd.(a) | | | 1,000,215 | | | | 2,345,409 | |
| Microsoft Corp. | | | 51,412 | | | | 13,204,144 | |
| Monday.com, Ltd.(a) | | | 23,945 | | | | 2,470,166 | |
| Oracle Corp. | | | 14,647 | | | | 1,023,386 | |
| Palantir Technologies, Inc., | | | | | | | | |
| Class A(a) | | | 228,159 | | | | 2,069,402 | |
| Palo Alto Networks, Inc.(a) | | | 3,530 | | | | 1,743,608 | |
| Paycom Software, Inc.(a) | | | 5,125 | | | | 1,435,615 | |
| Paylocity Holding Corp.(a) | | | 7,756 | | | | 1,352,802 | |
| Qualtrics International, Inc., | | | | | | | | |
| Class A(a) | | | 111,682 | | | | 1,397,142 | |
| RingCentral, Inc., Class A(a) | | | 25,232 | | | | 1,318,624 | |
| Salesforce, Inc.(a) | | | 17,562 | | | | 2,898,432 | |
| SAP SE | | | 8,146 | | | | 742,090 | |
| SentinelOne, Inc., Class A(a) | | | 118,589 | | | | 2,766,681 | |
| ServiceNow, Inc.(a) | | | 5,669 | | | | 2,695,723 | |
| Smartsheet, Inc., Class A(a) | | | 63,195 | | | | 1,986,219 | |
| Splunk, Inc.(a) | | | 12,333 | | | | 1,090,977 | |
| Trade Desk, Inc., Class A(a) | | | 39,273 | | | | 1,645,146 | |
| UiPath, Inc., Class A(a) | | | 117,913 | | | | 2,144,837 | |
| Unity Software, Inc.(a) | | | 49,205 | | | | 1,811,728 | |
| VMware, Inc., Class A | | | 5,267 | | | | 600,333 | |
| Workday, Inc., Class A(a) | | | 8,810 | | | | 1,229,700 | |
| Xero, Ltd.(a) | | | 28,762 | | | | 1,527,885 | |
| Zendesk, Inc.(a) | | | 22,410 | | | | 1,659,909 | |
| Zoom Video Communications, Inc., Class A(a) | | | 8,855 | | | | 956,074 | |
22 | June 30, 2022
| ALPS | O’Shares Global Internet Giants ETF | |
| Schedule of Investments | June 30, 2022 |
| Security Description | | | | | Shares | | | Value | |
| Software (continued) | | | | | | | | | |
| Zscaler, Inc.(a) | | | | | | | 16,001 | | | $ | 2,392,310 | |
| Total Software | | | | | | | | | | | 91,011,730 | |
| | | | | | | | | | | | | |
| TOTAL COMMON STOCKS | | | | | | | | | | | | |
| (Cost $335,573,796) | | | | | | | | | | | 209,404,893 | |
| | | | | | | | | | | | | |
| | | | 7 Day Yield | | | | Shares | | | | Value | |
| SHORT TERM INVESTMENTS (0.23%) | | | | | | | | | | | | |
| Money Market Fund | | | | | | | | | | | | |
| State Street Institutional Treasury Plus Money Market Fund | | | 1.45 | % | | | 492,873 | | | | 492,873 | |
| | | | | | | | | | | | | |
| TOTAL SHORT TERM INVESTMENTS | | | | | | | | | | | | |
| (Cost $492,873) | | | | | | | | | | | 492,873 | |
| | | | | | | | | | | | | |
| TOTAL INVESTMENTS (100.01%) | | | | | | | | | | | | |
| (Cost $336,066,669) | | | | | | | | | | $ | 209,897,766 | |
| LIABILITIES IN EXCESS OF OTHER ASSETS (-0.01%) | | | | | | | | | | | (30,651 | ) |
| NET ASSETS - 100.00% | | | | | | | | | | $ | 209,867,115 | |
| (a) | Non-income producing security. |
| (b) | Securities exempt from registration under Rule 144A of the Securities Act of 1933. These securities may be sold in the ordinary course of business in transactions exempt from registration, normally to qualified institutional buyers. At period end, the aggregate market value of those securities was $12,637,175, representing 6.02% of net assets. |
| (c) | Securities were purchased pursuant to Regulation S under the Securities Act of 1933, which exempts securities offered and sold outside of the United States from registration. Such securities cannot be sold in the United States without either an effective registration statement filed pursuant to the Securities Act of 1933, or pursuant to an exemption from registration. As of June 30, 2022, the market value of those securities was $12,637,175 representing 6.02% of net assets. |
See Notes to Financial Statements.
23 | June 30, 2022
| ALPS | O’Shares Europe Quality Dividend ETF | |
| Schedule of Investments | June 30, 2022 |
| Security Description | | Shares | | | Value | |
| COMMON STOCKS (99.40%) | | | | | | |
| Air Freight & Logistics (1.79%) | | | | | | |
| Deutsche Post AG | | | 19,446 | | | $ | 728,328 | |
| | | | | | | | | |
| Auto Components (1.27%) | | | | | | | | |
| Cie Generale des | | | | | | | | |
| Etablissements Michelin | | | | | | | | |
| SCA | | | 18,972 | | | | 516,430 | |
| | | | | | | | | |
| Beverages (3.54%) | | | | | | | | |
| Carlsberg A/s | | | 4,424 | | | | 563,476 | |
| Diageo PLC | | | 20,462 | | | | 879,391 | |
| Total Beverages | | | | | | | 1,442,867 | |
| | | | | | | | | |
| Building Products (2.37%) | | | | | | | | |
| Assa Abloy AB, Class B | | | 24,409 | | | | 518,495 | |
| Geberit AG | | | 933 | | | | 448,395 | |
| Total Building Products | | | | | | | 966,890 | |
| | | | | | | | | |
| Capital Markets (2.41%) | | | | | | | | |
| 3i Group PLC | | | 41,299 | | | | 557,279 | |
| Partners Group Holding AG | | | 468 | | | | 421,698 | |
| Total Capital Markets | | | | | | | 978,977 | |
| | | | | | | | | |
| Diversified Financial Services (2.47%) | | | | | | | | |
| Industrivarden AB, Class C | | | 21,712 | | | | 482,854 | |
| Investor AB, Class B | | | 31,459 | | | | 517,195 | |
| Total Diversified Financial Services | | | | | | | 1,000,049 | |
| | | | | | | | | |
| Diversified Telecommunication Services (1.71%) | | | | | | | | |
| Swisscom AG | | | 1,259 | | | | 695,539 | |
| | | | | | | | | |
| Electric Utilities (3.22%) | | | | | | | | |
| Iberdrola SA | | | 73,840 | | | | 765,762 | |
| Orsted AS(a)(b) | | | 5,230 | | | | 546,687 | |
| Total Electric Utilities | | | | | | | 1,312,449 | |
| | | | | | | | | |
| Electrical Equipment (4.39%) | | | | | | | | |
| ABB, Ltd. | | | 23,813 | | | | 635,080 | |
| Legrand SA | | | 6,856 | | | | 506,239 | |
| Schneider Electric SE | | | 5,460 | | | | 645,995 | |
| Total Electrical Equipment | | | | | | | 1,787,314 | |
| | | | | | | | | |
| Electronic Equipment, Instruments & | | | | | | | | |
| Components (1.17%) | | | | | | | | |
| Hexagon AB, Class B | | | 46,100 | | | | 478,812 | |
| | | | | | | | | |
| Food Products (7.48%) | | | | | | | | |
| Danone SA | | | 11,681 | | | | 651,964 | |
| Nestle SA | | | 20,513 | | | | 2,394,562 | |
| Total Food Products | | | | | | | 3,046,526 | |
| | | | | | | | | |
| Health Care Equipment & Supplies (2.59%) | | | | | | | | |
| Coloplast A/S, Class B | | | 4,311 | | | | 491,016 | |
| Security Description | | Shares | | | Value | |
| Health Care Equipment & Supplies | | | | | | |
| (continued) | | | | | | |
| Siemens Healthineers AG(a)(b) | | | 11,049 | | | $ | 561,458 | |
| Total Health Care Equipment & Supplies | | | | | | | 1,052,474 | |
| | | | | | | | | |
| Household Products (2.80%) | | | | | | | | |
| Essity AB, Class B | | | 23,723 | | | | 619,410 | |
| Henkel AG & Co. KGaA | | | 8,502 | | | | 520,327 | |
| Total Household Products | | | | | | | 1,139,737 | |
| | | | | | | | | |
| Industrial Conglomerates (1.56%) | | | | | | | | |
| Siemens AG | | | 6,254 | | | | 636,319 | |
| | | | | | | | | |
| Insurance (1.01%) | | | | | | | | |
| Admiral Group PLC | | | 15,077 | | | | 411,847 | |
| | | | | | | | | |
| Machinery (4.10%) | | | | | | | | |
| Atlas Copco AB | | | 50,914 | | | | 475,657 | |
| Kone Oyj, Class B | | | 15,423 | | | | 733,136 | |
| Schindler Holding AG | | | 2,522 | | | | 459,938 | |
| Total Machinery | | | | | | | 1,668,731 | |
| | | | | | | | | |
| Marine (1.16%) | | | | | | | | |
| Kuehne + Nagel International AG | | | 2,003 | | | | 474,182 | |
| | | | | | | | | |
| Personal Products (6.16%) | | | | | | | | |
| L'Oreal SA | | | 3,304 | | | | 1,140,182 | |
| Unilever PLC | | | 30,185 | | | | 1,367,252 | |
| Total Personal Products | | | | | | | 2,507,434 | |
| | | | | | | | | |
| Pharmaceuticals (24.68%) | | | | | | | | |
| AstraZeneca PLC | | | 10,525 | | | | 1,383,705 | |
| GSK PLC | | | 49,306 | | | | 1,059,717 | |
| Merck KGaA | | | 4,058 | | | | 684,668 | |
| Novartis AG | | | 15,800 | | | | 1,338,113 | |
| Novo Nordisk A/S, Class B | | | 20,057 | | | | 2,224,552 | |
| Roche Holding AG | | | 6,914 | | | | 2,307,081 | |
| Sanofi | | | 10,370 | | | | 1,046,954 | |
| Total Pharmaceuticals | | | | | | | 10,044,790 | |
| | | | | | | | | |
| Professional Services (5.70%) | | | | | | | | |
| RELX PLC | | | 28,474 | | | | 771,563 | |
| SGS SA | | | 242 | | | | 553,889 | |
| Wolters Kluwer NV | | | 10,288 | | | | 997,922 | |
| Total Professional Services | | | | | | | 2,323,374 | |
| | | | | | | | | |
| Semiconductors & Semiconductor | | | | | | | | |
| Equipment (2.06%) | | | | | | | | |
| ASML Holding NV | | | 1,755 | | | | 838,381 | |
| | | | | | | | | |
| Software (2.67%) | | | | | | | | |
| SAP SE | | | 11,949 | | | | 1,088,539 | |
| | | | | | | | | |
| Specialty Retail (1.28%) | | | | | | | | |
| Industria de Diseno Textil SA | | | 23,069 | | | | 521,944 | |
24 | June 30, 2022
| ALPS | O’Shares Europe Quality Dividend ETF | |
| Schedule of Investments | June 30, 2022 |
| Security Description | | | | | Shares | | | Value | |
| Textiles, Apparel & Luxury Goods (8.18%) | | | | | |
| EssilorLuxottica SA | | | | | 4,321 | | | $ | 647,081 | |
| Hermes International | | | | | | | 556 | | | | 621,701 | |
| Kering SA | | | | | | | 1,057 | | | | 542,878 | |
| LVMH Moet Hennessy Louis | | | | | | | | | | | | |
| Vuitton SE | | | | | | | 2,491 | | | | 1,518,501 | |
| Total Textiles, Apparel & Luxury Goods | | | | | | | | | | | 3,330,161 | |
| | | | | | | | | | | | | |
| Tobacco (1.97%) | | | | | | | | | | | | |
| Swedish Match AB | | | | | | | 78,846 | | | | 803,124 | |
| | | | | | | | | | | | | |
| Trading Companies & Distributors (1.66%) | | | | | | | | | | | | |
| Bunzl PLC | | | | | | | 20,460 | | | | 677,193 | |
| | | | | | | | | | | | | |
| TOTAL COMMON STOCKS | | | | | | | | | | | | |
| (Cost $49,946,347) | | | | | | | | | | | 40,472,411 | |
| | | | | | | | | | | | | |
| | | | 7 Day Yield | | | | Shares | | | | Value | |
| SHORT TERM INVESTMENTS (0.10%) | | | | | | | | |
| Money Market Fund | | | | | | | | | | | | |
| State Street Institutional Treasury Plus Money Market Fund | | | 1.45 | % | | | 39,059 | | | | 39,059 | |
| | | | | | | | | | | | | |
| TOTAL SHORT TERM INVESTMENTS | | | | | | | | | | | | |
| (Cost $39,059) | | | | | | | | | | | 39,059 | |
| | | | | | | | | | | | | |
| TOTAL INVESTMENTS (99.50%) | | | | | | | | | | | | |
| (Cost $49,985,406) | | | | | | | | | | $ | 40,511,470 | |
| OTHER ASSETS IN EXCESS OF LIABILITIES (0.50%) | | | | | | | | | | | 204,408 | |
| NET ASSETS - 100.00% | | | | | | | | | | $ | 40,715,878 | |
| (a) | Securities exempt from registration under Rule 144A of the Securities Act of 1933. These securities may be sold in the ordinary course of business in transactions exempt from registration, normally to qualified institutional buyers. At period end, the aggregate market value of those securities was $1,108,145, representing 2.72% of net assets. |
| (b) | Securities were purchased pursuant to Regulation S under the Securities Act of 1933, which exempts securities offered and sold outside of the United States from registration. Such securities cannot be sold in the United States without either an effective registration statement filed pursuant to the Securities Act of 1933, or pursuant to an exemption from registration. As of June 30, 2022, the market value of those securities was $1,108,145 representing 2.72% of net assets. |
See Notes to Financial Statements.
25 | June 30, 2022
| ALPS ETF Trust | |
| Statements of Assets and Liabilities | June 30, 2022 |
| | ALPS | O’Shares U.S. Quality Dividend ETF | | | ALPS | O’Shares U.S. Small-Cap Quality Dividend ETF | | | ALPS | O’Shares Global Internet Giants ETF | | | ALPS | O’Shares Europe Quality Dividend ETF | |
| ASSETS: | | | | | | | | | | | | |
| Investments, at value | | $ | 737,519,701 | | | $ | 155,311,463 | | | $ | 209,897,766 | | | $ | 40,511,470 | |
| Cash | | | 395,682 | | | | 109,529 | | | | – | | | | – | |
| Dividends and foreign tax reclaims receivable | | | 709,733 | | | | 161,722 | | | | 3,966 | | | | 250,948 | |
| Receivable for investments sold | | | – | | | | – | | | | – | | | | 2,262,298 | |
| Total Assets | | | 738,625,116 | | | | 155,582,714 | | | | 209,901,732 | | | | 43,024,716 | |
| | | | | | | | | | | | | | | | | |
| LIABILITIES: | | | | | | | | | | | | | | | | |
| Payable to adviser | | | 122,255 | | | | 25,528 | | | | 34,617 | | | | 7,021 | |
| Payable for capital shares redeemed | | | – | | | | – | | | | – | | | | 2,261,993 | |
| Distribution payable | | | 1,273,979 | | | | 238,835 | | | | – | | | | 39,824 | |
| Total Liabilities | | | 1,396,234 | | | | 264,363 | | | | 34,617 | | | | 2,308,838 | |
| NET ASSETS | | $ | 737,228,882 | | | $ | 155,318,351 | | | $ | 209,867,115 | | | $ | 40,715,878 | |
| | | | | | | | | | | | | | | | | |
| NET ASSETS CONSIST OF: | | | | | | | | | | | | | | | | |
| Paid-in capital | | $ | 742,076,707 | | | $ | 167,075,939 | | | $ | 435,856,405 | | | $ | 55,211,878 | |
| Total distributable earnings | | | (4,847,825 | ) | | | (11,757,588 | ) | | | (225,989,290 | ) | | | (14,496,000 | ) |
| NET ASSETS | | $ | 737,228,882 | | | $ | 155,318,351 | | | $ | 209,867,115 | | | $ | 40,715,878 | |
| | | | | | | | | | | | | | | | | |
| INVESTMENTS, AT COST | | $ | 692,873,380 | | | $ | 153,804,602 | | | $ | 336,066,669 | | | $ | 49,985,406 | |
| | | | | | | | | | | | | | | | | |
| PRICING OF SHARES | | | | | | | | | | | | | | | | |
| Net Assets | | $ | 737,228,882 | | | $ | 155,318,351 | | | $ | 209,867,115 | | | $ | 40,715,878 | |
| Shares of beneficial interest outstanding (Unlimited number of shares authorized, par value $0.01 per share) | | | 18,300,000 | | | | 4,904,000 | | | | 7,750,000 | | | | 1,800,000 | |
| Net Asset Value, offering and redemption price per share | | $ | 40.29 | | | $ | 31.67 | | | $ | 27.08 | | | $ | 22.62 | |
See Notes to Financial Statements.
26 | June 30, 2022
| ALPS ETF Trust | |
| Statements of Operations | For the Year Ended June 30, 2022 |
| | | ALPS | O’Shares U.S. Quality Dividend ETF | | | ALPS | O’Shares U.S. Small-Cap Quality Dividend ETF | | | ALPS | O’Shares Global Internet Giants ETF | | | ALPS | O’Shares Europe Quality Dividend ETF | |
| INVESTMENT INCOME: | | | | | | | | | | | | |
| Dividends* | | $ | 17,213,528 | | | $ | 3,386,138 | | | $ | 521,381 | | | $ | 1,137,271 | |
| Income from non-cash dividends | | | – | | | | – | | | | 223,794 | | | | 45,145 | |
| Total Investment Income | | | 17,213,528 | | | | 3,386,138 | | | | 745,175 | | | | 1,182,416 | |
| | | | | | | | | | | | | | | | | |
| EXPENSES: | | | | | | | | | | | | | | | | |
| Investment adviser fees | | | 3,652,468 | | | | 749,085 | | | | 2,219,431 | | | | 211,895 | |
| Total Expenses | | | 3,652,468 | | | | 749,085 | | | | 2,219,431 | | | | 211,895 | |
| NET INVESTMENT INCOME/(LOSS) | | | 13,561,060 | | | | 2,637,053 | | | | (1,474,256 | ) | | | 970,521 | |
| | | | | | | | | | | | | | | | | |
| REALIZED AND UNREALIZED GAIN/LOSS | | | | | | | | | | | | | | | | |
| Net realized gain/(loss) on investments(a) | | | 43,405,783 | | | | 14,022,562 | | | | (38,672,396 | ) | | | 3,229,389 | |
| Net realized loss on foreign currency transactions | | | – | | | | – | | | | (4,792 | ) | | | (32,845 | ) |
| Total net realized gain/(loss) | | | 43,405,783 | | | | 14,022,562 | | | | (38,677,188 | ) | | | 3,196,544 | |
| Net change in unrealized depreciation on investments | | | (83,029,339 | ) | | | (29,865,443 | ) | | | (244,942,759 | ) | | | (14,648,951 | ) |
| Net change in unrealized depreciation on translation of assets and liabilities denominated in foreign currencies | | | – | | | | – | | | | (128 | ) | | | (11,589 | ) |
| Total net change in unrealized depreciation | | | (83,029,339 | ) | | | (29,865,443 | ) | | | (244,942,887 | ) | | | (14,660,540 | ) |
| NET REALIZED AND UNREALIZED LOSS ON INVESTMENTS | | | (39,623,556 | ) | | | (15,842,881 | ) | | | (283,620,075 | ) | | | (11,463,996 | ) |
| NET DECREASE IN NET ASSETS RESULTING FROM OPERATIONS | | $ | (26,062,496 | ) | | $ | (13,205,828 | ) | | $ | (285,094,331 | ) | | $ | (10,493,475 | ) |
| *Net of foreign tax withholding. | | $ | – | | | $ | – | | | $ | (8,960 | ) | | $ | (159,771 | ) |
| (a) | Includes realized gain or loss as a result of in-kind transactions (See Note 4 in Notes to Financial Statements). |
See Notes to Financial Statements.
27 | June 30, 2022
| ALPS | O’Shares U.S. Quality Dividend ETF |
| Statements of Changes in Net Assets |
| | | For the Year Ended June 30, 2022 | | | For the Year Ended June 30, 2021 | |
| OPERATIONS: | | | | | | |
| Net investment income | | $ | 13,561,060 | | | $ | 10,746,630 | |
| Net realized gain | | | 43,405,783 | | | | 32,907,730 | |
| Net change in unrealized appreciation/depreciation | | | (83,029,339 | ) | | | 102,443,817 | |
| Net increase/(decrease) in net assets resulting from operations | | | (26,062,496 | ) | | | 146,098,177 | |
| | | | | | | | | |
| DISTRIBUTIONS TO SHAREHOLDERS: | | | | | | | | |
| From distributable earnings | | | (13,415,408 | ) | | | (10,300,014 | ) |
| Total distributions | | | (13,415,408 | ) | | | (10,300,014 | ) |
| | | | | | | | | |
| CAPITAL SHARE TRANSACTIONS: | | | | | | | | |
| Proceeds from sale of shares | | | 230,032,035 | | | | 193,214,199 | |
| Cost of shares redeemed | | | (142,045,551 | ) | | | (119,413,177 | ) |
| Net increase from capital share transactions | | | 87,986,484 | | | | 73,801,022 | |
| Net increase in net assets | | | 48,508,580 | | | | 209,599,185 | |
| | | | | | | | | |
| NET ASSETS: | | | | | | | | |
| Beginning of year | | | 688,720,302 | | | | 479,121,117 | |
| End of year | | $ | 737,228,882 | | | $ | 688,720,302 | |
| | | | | | | | | |
| OTHER INFORMATION: | | | | | | | | |
| CAPITAL SHARE TRANSACTIONS: | | | | | | | | |
| Beginning shares | | | 16,400,000 | | | | 14,450,000 | |
| Shares sold | | | 5,200,000 | | | | 5,150,000 | |
| Shares redeemed | | | (3,300,000 | ) | | | (3,200,000 | ) |
| Shares outstanding, end of year | | | 18,300,000 | | | | 16,400,000 | |
See Notes to Financial Statements.
28 | June 30, 2022
| ALPS | O’Shares U.S. Small-Cap Quality Dividend ETF |
| Statements of Changes in Net Assets |
| | | For the Year Ended June 30, 2022 | | | For the Year Ended June 30, 2021 | |
| OPERATIONS: | | | | | | |
| Net investment income | | $ | 2,637,053 | | | $ | 2,556,369 | |
| Net realized gain | | | 14,022,562 | | | | 4,938,284 | |
| Net change in unrealized appreciation/depreciation | | | (29,865,443 | ) | | | 34,458,826 | |
| Net increase/(decrease) in net assets resulting from operations | | | (13,205,828 | ) | | | 41,953,479 | |
| | | | | | | | | |
| DISTRIBUTIONS TO SHAREHOLDERS: | | | | | | | | |
| From distributable earnings | | | (2,765,428 | ) | | | (2,128,261 | ) |
| Total distributions | | | (2,765,428 | ) | | | (2,128,261 | ) |
| | | | | | | | | |
| CAPITAL SHARE TRANSACTIONS: | | | | | | | | |
| Proceeds from sale of shares | | | 78,553,967 | | | | 18,805,699 | |
| Cost of shares redeemed | | | (56,478,862 | ) | | | (3,228,094 | ) |
| Net increase from capital share transactions | | | 22,075,105 | | | | 15,577,605 | |
| Net increase in net assets | | | 6,103,849 | | | | 55,402,823 | |
| | | | | | | | | |
| NET ASSETS: | | | | | | | | |
| Beginning of year | | | 149,214,502 | | | | 93,811,679 | |
| End of year | | $ | 155,318,351 | | | $ | 149,214,502 | |
| | | | | | | | | |
| OTHER INFORMATION: | | | | | | | | |
| CAPITAL SHARE TRANSACTIONS: | | | | | | | | |
| Beginning shares | | | 4,254,000 | | | | 3,754,000 | |
| Shares sold | | | 2,250,000 | | | | 600,000 | |
| Shares redeemed | | | (1,600,000 | ) | | | (100,000 | ) |
| Shares outstanding, end of year | | | 4,904,000 | | | | 4,254,000 | |
See Notes to Financial Statements.
29 | June 30, 2022
| ALPS | O’Shares Global Internet Giants ETF |
| Statements of Changes in Net Assets |
| | | For the Year Ended June 30, 2022 | | | For the Year Ended June 30, 2021 | |
| OPERATIONS: | | | | | | |
| Net investment loss | | $ | (1,474,256 | ) | | $ | (2,450,867 | ) |
| Net realized gain/(loss) | | | (38,677,188 | ) | | | 108,500,737 | |
| Net change in unrealized appreciation/depreciation | | | (244,942,887 | ) | | | 77,354,082 | |
| Net increase/(decrease) in net assets resulting from operations | | | (285,094,331 | ) | | | 183,403,952 | |
| | | | | | | | | |
| DISTRIBUTIONS TO SHAREHOLDERS: | | | | | | | | |
| From distributable earnings | | | – | | | | – | |
| Total distributions | | | – | | | | – | |
| | | | | | | | | |
| CAPITAL SHARE TRANSACTIONS: | | | | | | | | |
| Proceeds from sale of shares | | | 5,994,386 | | | | 558,000,546 | |
| Cost of shares redeemed | | | (229,798,933 | ) | | | (295,150,967 | ) |
| Net increase/(decrease) from capital share transactions | | | (223,804,547 | ) | | | 262,849,579 | |
| Net increase/(decrease) in net assets | | | (508,898,878 | ) | | | 446,253,531 | |
| | | | | | | | | |
| NET ASSETS: | | | | | | | | |
| Beginning of year | | | 718,765,993 | | | | 272,512,462 | |
| End of year | | $ | 209,867,115 | | | $ | 718,765,993 | |
| | | | | | | | | |
| OTHER INFORMATION: | | | | | | | | |
| CAPITAL SHARE TRANSACTIONS: | | | | | | | | |
| Beginning shares | | | 12,600,000 | | | | 7,200,000 | |
| Shares sold | | | 150,000 | | | | 11,100,000 | |
| Shares redeemed | | | (5,000,000 | ) | | | (5,700,000 | ) |
| Shares outstanding, end of year | | | 7,750,000 | | | | 12,600,000 | |
See Notes to Financial Statements.
30 | June 30, 2022
| ALPS | O’Shares Europe Quality Dividend ETF |
| Statements of Changes in Net Assets |
| | | For the Year Ended June 30, 2022 | | | For the Year Ended June 30, 2021 | |
| OPERATIONS: | | | | | | |
| Net investment income | | $ | 970,521 | | | $ | 458,122 | |
| Net realized gain | | | 3,196,544 | | | | 747,430 | |
| Net change in unrealized appreciation/depreciation | | | (14,660,540 | ) | | | 4,207,028 | |
| Net increase/(decrease) in net assets resulting from operations | | | (10,493,475 | ) | | | 5,412,580 | |
| | | | | | | | | |
| DISTRIBUTIONS TO SHAREHOLDERS: | | | | | | | | |
| From distributable earnings | | | (1,031,977 | ) | | | (682,515 | ) |
| Total distributions | | | (1,031,977 | ) | | | (682,515 | ) |
| | | | | | | | | |
| CAPITAL SHARE TRANSACTIONS: | | | | | | | | |
| Proceeds from sale of shares | | | 43,521,283 | | | | 4,045,935 | |
| Cost of shares redeemed | | | (17,876,858 | ) | | | – | |
| Net increase from capital share transactions | | | 25,644,425 | | | | 4,045,935 | |
| Net increase in net assets | | | 14,118,973 | | | | 8,776,000 | |
| | | | | | | | | |
| NET ASSETS: | | | | | | | | |
| Beginning of year | | | 26,596,905 | | | | 17,820,905 | |
| End of year | | $ | 40,715,878 | | | $ | 26,596,905 | |
| | | | | | | | | |
| OTHER INFORMATION: | | | | | | | | |
| CAPITAL SHARE TRANSACTIONS: | | | | | | | | |
| Beginning shares | | | 950,000 | | | | 800,000 | |
| Shares sold | | | 1,550,000 | | | | 150,000 | |
| Shares redeemed | | | (700,000 | ) | | | – | |
| Shares outstanding, end of year | | | 1,800,000 | | | | 950,000 | |
See Notes to Financial Statements.
31 | June 30, 2022
| ALPS | O’Shares U.S. Quality Dividend ETF |
| Financial Highlights | For a Share Outstanding Throughout the Periods Presented |
|
| For the Year Ended
June 30, 2022 |
|
| For the Year Ended
June 30, 2021 |
|
| For the Year Ended
June 30, 2020 |
|
| For the Year Ended
June 30, 2019 |
|
| For the Year Ended
June 30, 2018 |
|
| NET ASSET VALUE, BEGINNING OF PERIOD | | $ | 42.00 | | | $ | 33.16 | | | $ | 34.13 | | | $ | 30.69 | | | $ | 29.25 | |
| | | | | | | | | | | | | | | | | | | | | |
| INCOME/(LOSS) FROM INVESTMENT OPERATIONS: | | | | | | | | | | | | | | | | | | | | |
| Net investment income(a) | | | 0.77 | | | | 0.69 | (b) | | | 0.93 | | | | 0.89 | (b) | | | 0.78 | |
| Net realized and unrealized gain/(loss) | | | (1.72 | ) | | | 8.81 | | | | (0.96 | ) | | | 3.44 | | | | 1.46 | |
| Total from investment operations | | | (0.95 | ) | | | 9.50 | | | | (0.03 | ) | | | 4.33 | | | | 2.24 | |
| | | | | | | | | | | | | | | | | | | | | |
| DISTRIBUTIONS: | | | | | | | | | | | | | | | | | | | | |
| From net investment income | | | (0.76 | ) | | | (0.66 | ) | | | (0.94 | ) | | | (0.89 | ) | | | (0.80 | ) |
| Total distributions | | | (0.76 | ) | | | (0.66 | ) | | | (0.94 | ) | | | (0.89 | ) | | | (0.80 | ) |
| | | | | | | | | | | | | | | | | | | | | |
| NET INCREASE/(DECREASE) IN NET ASSET VALUE | | | (1.71 | ) | | | 8.84 | | | | (0.97 | ) | | | 3.44 | | | | 1.44 | |
| NET ASSET VALUE, END OF PERIOD | | $ | 40.29 | | | $ | 42.00 | | | $ | 33.16 | | | $ | 34.13 | | | $ | 30.69 | |
| TOTAL RETURN(c) | | | (2.38 | )% | | | 28.84 | % | | | (0.12 | )% | | | 14.31 | % | | | 7.67 | % |
| | | | | | | | | | | | | | | | | | | | | |
| RATIOS/SUPPLEMENTAL DATA: | | | | | | | | | | | | | | | | | | | | |
| Net assets, end of period (in 000s) | | $ | 737,229 | | | $ | 688,720 | | | $ | 479,121 | | | $ | 496,574 | | | $ | 411,269 | |
| | | | | | | | | | | | | | | | | | | | | |
| Ratio of expenses to average net assets | | | 0.48 | % | | | 0.48 | % | | | 0.48 | % | | | 0.48 | % | | | 0.48 | %(d) |
Ratio of expenses including waiver/reimbursement to average net assets | | | 0.48 | % | | | 0.48 | % | | | 0.48 | % | | | 0.48 | % | | | 0.48 | %(d) |
Ratio of net investment income excluding waiver/reimbursement to average net assets | | | 1.78 | % | | | 1.81 | % | | | 2.71 | % | | | 2.76 | % | | | 2.53 | % |
Ratio of net investment income including waiver/reimbursement to average net assets | | | 1.78 | % | | | 1.81 | %(e) | | | 2.71 | % | | | 2.76 | %(e) | | | 2.54 | % |
| Portfolio turnover rate(f) | | | 15 | % | | | 26 | % | | | 64 | %(g) | | | 15 | % | | | 18 | % |
| (a) | Based on average shares outstanding during the period. |
| (b) | The net investment income per share excluding the impact of large, non-recurring dividends (special dividends) was $0.67 during the year ended June 30, 2021 and $0.88 during the year ended June 30, 2019. |
| (c) | Total return is calculated assuming an initial investment made at the net asset value at the beginning of the period and redemption at the net asset value on the last day of the period and assuming all distributions are reinvested at the reinvestment prices. Total return calculated for a period of less than one year is not annualized. |
| (d) | Prior to June 28, 2018, the unitary management fee was 0.48% and the former investment advisor to the Fund agreed to contractually waive its fees and reimburse expenses so that the total annual fund operating expenses were limited to 0.48%. |
| (e) | The ratio of net investment income, including waiver/reimbursement and excluding the impact of large, non-recurring dividends (special dividends) was 1.77% during the year ended June 30, 2021 and 2.71% during the year ended June 30, 2019. |
| (f) | Portfolio turnover for periods less than one year are not annualized and does not include securities received or delivered from processing creations or redemptions in-kind. |
| (g) | Increase in the portfolio turnover was a result of the Index change that was effective on June 1, 2020. |
See Notes to Financial Statements.
32 | June 30, 2022
| ALPS | O’Shares U.S. Small-Cap Quality Dividend ETF |
| Financial Highlights | For a Share Outstanding Throughout the Periods Presented |
| | | For the Year Ended June 30, 2022 | | | For the Year Ended June 30, 2021 | | | For the Year Ended June 30, 2020 | | | For the Year Ended June 30, 2019 | | | For the Year Ended June 30, 2018 | |
| NET ASSET VALUE, BEGINNING OF PERIOD | | $ | 35.08 | | | $ | 24.99 | | | $ | 27.45 | | | $ | 27.07 | | | $ | 25.41 | |
| | | | | | | | | | | | | | | | | | | | | |
| INCOME/(LOSS) FROM INVESTMENT OPERATIONS: | | | | | | | | | | | | | | | | | | | | |
| Net investment income(a) | | | 0.59 | | | | 0.64 | (b) | | | 0.64 | (b) | | | 0.58 | (b) | | | 0.66 | |
| Net realized and unrealized gain/(loss) | | | (3.38 | ) | | | 9.98 | | | | (2.48 | ) | | | 0.38 | (c) | | | 1.70 | |
| Total from investment operations | | | (2.79 | ) | | | 10.62 | | | | (1.84 | ) | | | 0.96 | | | | 2.36 | |
| | | | | | | | | | | | | | | | | | | | | |
| DISTRIBUTIONS: | | | | | | | | | | | | | | | | | | | | |
| From net investment income | | | (0.62 | ) | | | (0.53 | ) | | | (0.57 | ) | | | (0.58 | ) | | | (0.66 | ) |
| From net realized gains/loss | | | – | | | | – | | | | – | | | | – | | | | – | (d) |
| From tax return of capital | | | – | | | | – | | | | (0.05 | ) | | | – | | | | (0.04 | ) |
| Total distributions | | | (0.62 | ) | | | (0.53 | ) | | | (0.62 | ) | | | (0.58 | ) | | | (0.70 | ) |
| | | | | | | | | | | | | | | | | | | | | |
| NET INCREASE/(DECREASE) IN NET ASSET VALUE | | | (3.41 | ) | | | 10.09 | | | | (2.46 | ) | | | 0.38 | | | | 1.66 | |
| NET ASSET VALUE, END OF PERIOD | | $ | 31.67 | | | $ | 35.08 | | | $ | 24.99 | | | $ | 27.45 | | | $ | 27.07 | |
| TOTAL RETURN(e) | | | (8.12 | )% | | | 42.79 | % | | | (6.82 | )% | | | 3.65 | % | | | 9.39 | % |
| | | | | | | | | | | | | | | | | | | | | |
| RATIOS/SUPPLEMENTAL DATA: | | | | | | | | | | | | | | | | | | | | |
| Net assets, end of period (in 000s) | | $ | 155,318 | | | $ | 149,215 | | | $ | 93,812 | | | $ | 97,570 | | | $ | 136,802 | |
| | | | | | | | | | | | | | | | | | | | | |
| Ratio of expenses to average net assets | | | 0.48 | % | | | 0.48 | % | | | 0.48 | % | | | 0.48 | % | | | 0.48 | % |
| Ratio of net investment income to average net assets | | | 1.69 | % | | | 2.08 | %(f) | | | 2.38 | %(f) | | | 2.16 | %(f) | | | 2.51 | % |
| Portfolio turnover rate(g) | | | 34 | % | | | 60 | % | | | 101 | %(h) | | | 52 | % | | | 64 | % |
| (a) | Based on average shares outstanding during the period. |
| (b) | The net investment income per share excluding the impact of large, non-recurring dividends (special dividends) was $0.57 during the year ended June 30, 2021, $0.62 during the year ended June 30, 2020 and $0.54 during the year ended June 30, 2019. (c) The amount shown for a share outstanding throughout the period is not in accordance with the aggregate net realized and unrealized gain (loss) for that period because of the timing of sales and repurchases of the Fund shares in relation to fluctuating market value of the investments in the Fund. |
| (d) | Per share amount is less than $0.01. |
| (e) | Total return is calculated assuming an initial investment made at the net asset value at the beginning of the period and redemption at the net asset value on the last day of the period and assuming all distributions are reinvested at the reinvestment prices. Total return calculated for a period of less than one year is not annualized. |
| (f) | The ratio of net investment income, including waiver/reimbursement and excluding the impact of large, non-recurring dividends (special dividends) was 1.84% during the year ended June 30, 2021, 2.30% during the year ended June 30, 2020 and 2.03% during the year ended June 30, 2019. |
| (g) | Portfolio turnover for periods less than one year are not annualized and does not include securities received or delivered from processing creations or redemptions in-kind. |
| (h) | Increase in the portfolio turnover was a result of the Index change that was effective on June 1, 2020. |
See Notes to Financial Statements.
33 | June 30, 2022
| ALPS | O’Shares Global Internet Giants ETF |
| Financial Highlights | For a Share Outstanding Throughout the Periods Presented |
| | | For the Year Ended June 30, 2022 | | | For the Year Ended June 30, 2021 | | | For the Year Ended June 30, 2020 | | | For the Year Ended June 30, 2019 | | | For the Period June 5, 2018 (Commencement of operations) to June 30, 2018 | |
| NET ASSET VALUE, BEGINNING OF PERIOD | | $ | 57.04 | | | $ | 37.85 | | | $ | 25.04 | | | $ | 24.06 | | | $ | 25.00 | |
| | | | | | | | | | | | | | | | | | | | | |
| INCOME/(LOSS) FROM INVESTMENT OPERATIONS: | | | | | | | | | | | | | | | | | | | | |
| Net investment loss(a) | | | (0.15 | ) | | | (0.21 | ) | | | (0.10 | ) | | | (0.06 | )(b) | | | (0.01 | ) |
| Net realized and unrealized gain/(loss) | | | (29.81 | ) | | | 19.40 | | | | 12.91 | | | | 1.04 | | | | (0.93 | ) |
| Total from investment operations | | | (29.96 | ) | | | 19.19 | | | | 12.81 | | | | 0.98 | | | | (0.94 | ) |
| | | | | | | | | | | | | | | | | | | | | |
| NET INCREASE/(DECREASE) IN NET ASSET VALUE | | | (29.96 | ) | | | 19.19 | | | | 12.81 | | | | 0.98 | | | | (0.94 | ) |
| NET ASSET VALUE, END OF PERIOD | | $ | 27.08 | | | $ | 57.04 | | | $ | 37.85 | | | $ | 25.04 | | | $ | 24.06 | |
| TOTAL RETURN(c) | | | (52.52 | )% | | | 50.70 | % | | | 51.16 | % | | | 4.07 | % | | | (3.76 | )% |
| | | | | | | | | | | | | | | | | | | | | |
| RATIOS/SUPPLEMENTAL DATA: | | | | | | | | | | | | | | | | | | | | |
| Net assets, end of period (in 000s) | | $ | 209,867 | | | $ | 718,766 | | | $ | 272,512 | | | $ | 48,834 | | | $ | 51,735 | |
| | | | | | | | | | | | | | | | | | | | | |
| Ratio of expenses to average net assets | | | 0.48 | % | | | 0.48 | % | | | 0.48 | % | | | 0.48 | % | | | 0.48 | %(d) |
| Ratio of net investment loss to average net assets | | | (0.32 | )% | | | (0.40 | )% | | | (0.34 | )% | | | (0.28 | )%(e) | | | (0.48 | )%(d) |
| Portfolio turnover rate(f) | | | 51 | % | | | 48 | % | | | 38 | % | | | 55 | % | | | 8 | % |
| (a) | Based on average shares outstanding during the period. |
| (b) | The net investment loss per share excluding the impact of large, non-recurring dividends (special dividends) was $(0.07) during the year ended June 30, 2019. |
| (c) | Total return is calculated assuming an initial investment made at the net asset value at the beginning of the period and redemption at the net asset value on the last day of the period and assuming all distributions are reinvested at the reinvestment prices. Total return calculated for a period of less than one year is not annualized. |
| (e) | The ratio of net investment loss, including waiver/reimbursement and excluding the impact of large, non-recurring dividends (special dividends) was (0.31)% during the year ended June 30, 2019. |
| (f) | Portfolio turnover for periods less than one year are not annualized and does not include securities received or delivered from processing creations or redemptions in-kind. |
See Notes to Financial Statements.
34 | June 30, 2022
| ALPS | O’Shares Europe Quality Dividend ETF |
| Financial Highlights | For a Share Outstanding Throughout the Periods Presented |
| | | For the Year Ended June 30, 2022 | | | For the Year Ended June 30, 2021 | | | For the Year Ended June 30, 2020 | | | For the Year Ended June 30, 2019 | | | For the Year Ended June 30, 2018 | |
| NET ASSET VALUE, BEGINNING OF PERIOD | | $ | 28.00 | | | $ | 22.28 | | | $ | 24.28 | | | $ | 23.94 | | | $ | 24.69 | |
| | | | | | | | | | | | | | | | | | | | | |
| INCOME/(LOSS) FROM INVESTMENT OPERATIONS: | | | | | | | | | | | | | | | | | | | | |
| Net investment income(a) | | | 0.58 | | | | 0.55 | (b) | | | 0.64 | (b) | | | 0.76 | (b) | | | 0.69 | |
| Net realized and unrealized gain/(loss) | | | (5.33 | ) | | | 5.97 | | | | (1.95 | ) | | | 0.44 | | | | (0.55 | ) |
| Total from investment operations | | | (4.75 | ) | | | 6.52 | | | | (1.31 | ) | | | 1.20 | | | | 0.14 | |
| | | | | | | | | | | | | | | | | | | | | |
| DISTRIBUTIONS: | | | | | | | | | | | | | | | | | | | | |
| From net investment income | | | (0.63 | ) | | | (0.80 | ) | | | (0.69 | ) | | | (0.86 | ) | | | (0.89 | ) |
| Total distributions | | | (0.63 | ) | | | (0.80 | ) | | | (0.69 | ) | | | (0.86 | ) | | | (0.89 | ) |
| | | | | | | | | | | | | | | | | | | | | |
| NET INCREASE/(DECREASE) IN NET ASSET VALUE | | | (5.38 | ) | | | 5.72 | | | | (2.00 | ) | | | 0.34 | | | | (0.75 | ) |
| NET ASSET VALUE, END OF PERIOD | | $ | 22.62 | | | $ | 28.00 | | | $ | 22.28 | | | $ | 24.28 | | | $ | 23.94 | |
| TOTAL RETURN(c) | | | (17.29 | )% | | | 29.72 | % | | | (5.44 | )% | | | 5.16 | % | | | 0.53 | % |
| | | | | | | | | | | | | | | | | | | | | |
| RATIOS/SUPPLEMENTAL DATA: | | | | | | | | | | | | | | | | | | | | |
| Net assets, end of period (in 000s) | | $ | 40,716 | | | $ | 26,597 | | | $ | 17,821 | | | $ | 25,498 | | | $ | 40,698 | |
| | | | | | | | | | | | | | | | | | | | | |
| Ratio of expenses to average net assets | | | 0.48 | % | | | 0.48 | % | | | 0.48 | % | | | 0.48 | % | | | 0.60 | %(d) |
| Ratio of expenses including waiver/reimbursement to average net assets | | | 0.48 | % | | | 0.48 | % | | | 0.48 | % | | | 0.48 | % | | | 0.58 | %(d) |
| Ratio of net investment income to average net assets | | | 2.20 | % | | | 2.18 | % | | | 2.72 | % | | | 3.23 | % | | | 2.75 | % |
| Ratio of net investment income including waiver/reimbursement to average net assets | | | 2.20 | % | | | 2.18 | %(e) | | | 2.72 | %(e) | | | 3.23 | %(e) | | | 2.77 | %(e) |
| Portfolio turnover rate(f) | | | 22 | % | | | 42 | % | | | 72 | %(g) | | | 35 | % | | | 30 | % |
| (a) | Based on average shares outstanding during the period. |
| (b) | The net investment income per share excluding the impact of large, non-recurring dividends (special dividends) was $0.54 during the year ended June 30, 2021, $0.63 during the year ended June 30, 2020 and $0.74 during the year ended June 30, 2019. (c) Total return is calculated assuming an initial investment made at the net asset value at the beginning of the period and redemption at the net asset value on the last day of the period and assuming all distributions are reinvested at the reinvestment prices. Total return calculated for a period of less than one year is not annualized. |
| (d) | Prior to June 28, 2018, the unitary management fee was 0.58% and the former investment advisor to the Fund agreed to contractually waive its fees and reimburse expenses so that the total annual fund operating expenses were limited to 0.58%. |
| (e) | The ratio of net investment income, including waiver/reimbursement and excluding the impact of large, non-recurring dividends (special dividends) was 2.15% during the year ended June 30, 2021, 2.70% during the year ended June 30, 2020, 3.15% during the year ended June 30, 2019 and 2.76% during the year ended June 30, 2018. |
| (f) | Portfolio turnover for periods less than one year are not annualized and does not include securities received or delivered from processing creations or redemptions in-kind. |
| (g) | Increase in the portfolio turnover was a result of the Index change that was effective on June 1, 2020. |
See Notes to Financial Statements.
35 | June 30, 2022
| ALPS ETF Trust | |
| Notes to Financial Statements | June 30, 2022 |
1. ORGANIZATION
ALPS ETF Trust (the ‘‘Trust’’), a Delaware statutory trust, is an open-end management investment company registered under the Investment Company Act of 1940, as amended (the ‘‘1940 Act’’). As of June 30, 2022, the Trust consisted of twenty-three separate portfolios. Each portfolio represents a separate series of the Trust. This report pertains to the ALPS | O’Shares U.S. Quality Dividend ETF, the ALPS | O’Shares U.S. Small-Cap Quality Dividend ETF, the ALPS | O’Shares Global Internet Giants ETF and the ALPS | O’Shares Europe Quality Dividend ETF (each a “Fund” and collectively, the “Funds”). ALPS | O’Shares Global Internet Giants ETF is considered non-diversified and may invest a greater portion of assets in securities of individual issuers than a diversified fund. As a result, changes in the market value of a single investment could cause greater fluctuations in share price than would occur in a diversified fund. ALPS | O’Shares U.S. Quality Dividend ETF, ALPS | O’Shares U.S. Small-Cap Quality Dividend ETF and ALPS | O’Shares Europe Quality Dividend ETF have each elected to qualify as a diversified series of the Trust under the 1940 Act The Funds, previously part of another investment company, OSI ETF Trust, reorganized effective after the close of business on June 17, 2022. See Note 7 for further discussion on the reorganizations.
The investment objective of the ALPS | O’Shares U.S. Quality Dividend ETF is to seek investment results that track the performance (before fees and expenses) of the O’Shares U.S. Quality Dividend Index. The investment objective of the ALPS | O’Shares U.S. Small-Cap Quality Dividend ETF is to seek investment results that track the performance (before fees and expenses) of the O’Shares U.S. Small-Cap Quality Dividend Index. The investment objective of the ALPS | O’Shares Global Internet Giants ETF is to seek investment results that track the performance (before fees and expenses) of the O’Shares Global Internet Giants Index. The investment objective of the ALPS | O’Shares Europe Quality Dividend ETF is to seek investment results that track the performance (before fees and expenses) of the O’Shares Europe Quality Dividend Index.
Each Fund’s shares are listed on the Cboe BZX Exchange, Inc. (the “Cboe BZX”). Each Fund issues and redeems Shares, at net asset value (“NAV”) in blocks of 25,000 Shares, each of which is called a “Creation Unit”. Creation Units are issued and redeemed principally in-kind for securities included in the Underlying Index. Except when aggregated in Creation Units, Shares are not redeemable securities of the Fund.
Pursuant to the Trust’s organizational documents, its Officers and Trustees are indemnified against certain liability arising out of the performance of their duties to the Trust. Additionally, in the normal course of business, the Trust enters into contracts with service providers that contain general indemnification clauses. The Trust’s maximum exposure under these arrangements is unknown, as this would involve future claims that may be made against the Trust that have not yet occurred.
2. SIGNIFICANT ACCOUNTING POLICIES
The following is a summary of significant accounting policies consistently followed by the Funds in the preparation of the financial statements. The accompanying financial statements were prepared in accordance with accounting principles generally accepted in the United States of America (“U.S. GAAP”). The preparation of financial statements in conformity with U.S. GAAP requires management to make certain estimates and assumptions that affect the reported amounts of assets and liabilities and disclosures of contingent assets and liabilities at the date of the financial statements and the reported amounts of revenue and expenses during the period. Actual results could differ from those estimates. Each Fund is considered an investment company under U.S. GAAP and follows the accounting and reporting guidance applicable to investment companies in the Financial Accounting Standards Board (“FASB”) Accounting Standards Codification Topic 946.
A. Portfolio Valuation
Each Fund’s NAV is determined daily, as of the close of regular trading on the New York Stock Exchange (the “NYSE”), normally 4:00 p.m. Eastern Time, on each day the NYSE is open for trading. The NAV is computed by dividing the value of all assets of each Fund (including accrued interest and dividends), less all liabilities (including accrued expenses and dividends declared but unpaid), by the total number of shares outstanding.
Portfolio securities listed on any exchange other than the NASDAQ Stock Market LLC (“NASDAQ”) are valued at the last sale price on the business day as of which such value is being determined. If there has been no sale on such day, the securities are valued at the mean of the most recent bid and ask prices on such day. Securities traded on the NASDAQ are valued at the NASDAQ Official Closing Price as determined by NASDAQ. Portfolio securities traded on more than one securities exchange are valued at the last sale price on the business day as of which such value is being determined at the close of the exchange representing the principal market for such securities. Portfolio securities traded in the over-the-counter market, but excluding securities traded on the NASDAQ, are valued at the last quoted sale price in such market.
The Funds’ investments are valued at market value or, in the absence of market value with respect to any portfolio securities, at fair value according to procedures adopted by the Trust’s Board of Trustees (the “Board”). When market quotations are not readily available or when events occur that make established valuation methods unreliable, securities of the Funds may be valued in good faith by or under the direction of the Board. These securities generally include, but are not limited to, restricted securities (securities which may not be publicly sold without registration under the Securities Act of 1933) for which a pricing service is unable to provide a market price; securities whose trading has been formally suspended; a security whose market price is not available from a pre-established primary pricing source or the pricing source is not willing to provide a price; a security with respect to which an event has occurred that is most likely to materially affect the value of the security after the market has closed but before the calculation of a Fund’s NAV or make it difficult or impossible to obtain a reliable market quotation; or a security whose price, as provided by the pricing service, does not reflect the security’s “fair value” due to the security being de-listed from a national exchange or the security’s primary trading market is temporarily closed at a time when, under normal conditions, it would be open. As a general principle, the current “fair value” of a security would be the amount which the owner might reasonably expect to receive from the sale on the applicable exchange or principal market. A variety of factors may be considered in determining the fair value of such securities.
36 | June 30, 2022
| ALPS ETF Trust | |
| Notes to Financial Statements | June 30, 2022 |
B. Fair Value Measurements
Each Fund discloses the classification of its fair value measurements following a three-tier hierarchy based on the inputs used to measure fair value. Inputs refer broadly to the assumptions that market participants would use in pricing the asset or liability, including assumptions about risk. Inputs may be observable or unobservable. Observable inputs reflect the assumptions market participants would use in pricing the asset or liability that are developed based on market data obtained from sources independent of the reporting entity. Unobservable inputs reflect the reporting entity’s own assumptions about the assumptions market participants would use in pricing the asset or liability that are developed based on the best information available.
Valuation techniques used to value the Funds’ investments by major category are as follows:
Equity securities, including restricted securities, for which market quotations are readily available, are valued at the last reported sale price or official closing price as reported by a third party pricing vendor on the primary market or exchange on which they are traded and are categorized as Level 1 in the hierarchy. In the event there were no sales during the day or closing prices are not available, securities are valued at the mean of the most recent quoted bid and ask prices on such day and are generally categorized as Level 2 in the hierarchy. Investments in open-end mutual funds are valued at their closing NAV each business day and are categorized as Level 1 in the hierarchy.
Changes in valuation techniques may result in transfers in or out of an assigned level within the disclosure hierarchy.
Various inputs are used in determining the value of each Fund’s investments as of the end of the reporting period. When inputs used fall into different levels of the fair value hierarchy, the level in the hierarchy within which the fair value measurement falls is determined based on the lowest level input that is significant to the fair value measurement in its entirety. The designated input levels are not necessarily an indication of the risk or liquidity associated with these investments.
These inputs are categorized in the following hierarchy under applicable financial accounting standards:
| Level 1 – | Unadjusted quoted prices in active markets for identical investments, unrestricted assets or liabilities that a Fund has the ability to access at the measurement date; |
| Level 2 – | Quoted prices which are not active, quoted prices for similar assets or liabilities in active markets or inputs other than quoted prices that are observable (either directly or indirectly) for substantially the full term of the asset or liability; and |
| Level 3 – | Significant unobservable prices or inputs (including the Fund’s own assumptions in determining the fair value of investments) where there is little or no market activity for the asset or liability at the measurement date. |
37 | June 30, 2022
| ALPS ETF Trust | |
| Notes to Financial Statements | June 30, 2022 |
The following is a summary of the inputs used to value the Funds’ investments as of June 30, 2022:
ALPS | O’Shares U.S. Quality Dividend ETF
| Investments in Securities at Value | | Level 1 - Quoted and Unadjusted Prices | | | Level 2 - Other Significant Observable Inputs | | | Level 3 - Significant Unobservable Inputs | | | Total | |
| Common Stocks* | | $ | 736,176,950 | | | $ | – | | | $ | – | | | $ | 736,176,950 | |
| Short Term Investments | | | 1,342,751 | | | | – | | | | – | | | | 1,342,751 | |
| Total | | $ | 737,519,701 | | | $ | – | | | $ | – | | | $ | 737,519,701 | |
ALPS | O’Shares U.S. Small-Cap Quality Dividend ETF
| Investments in Securities at Value | | Level 1 - Quoted and Unadjusted Prices | | | Level 2 - Other Significant Observable Inputs | | | Level 3 - Significant Unobservable Inputs | | | Total | |
| Common Stocks* | | $ | 155,010,166 | | | $ | – | | | $ | – | | | $ | 155,010,166 | |
| Short Term Investments | | | 301,297 | | | | – | | | | – | | | | 301,297 | |
| Total | | $ | 155,311,463 | | | $ | – | | | $ | – | | | $ | 155,311,463 | |
ALPS | O’Shares Global Internet Giants ETF
| Investments in Securities at Value | | Level 1 - Quoted and Unadjusted Prices | | | Level 2 - Other Significant Observable Inputs | | | Level 3 - Significant Unobservable Inputs | | | Total | |
| Common Stocks* | | $ | 209,404,893 | | | $ | – | | | $ | – | | | $ | 209,404,893 | |
| Short Term Investments | | | 492,873 | | | | – | | | | – | | | | 492,873 | |
| Total | | $ | 209,897,766 | | | $ | – | | | $ | – | | | $ | 209,897,766 | |
ALPS | O’Shares Europe Quality Dividend ETF
| Investments in Securities at Value | | Level 1 - Quoted and Unadjusted Prices | | | Level 2 - Other Significant Observable Inputs | | | Level 3 - Significant Unobservable Inputs | | | Total | |
| Common Stocks* | | $ | 40,472,411 | | | $ | – | | | $ | – | | | $ | 40,472,411 | |
| Short Term Investments | | | 39,059 | | | | – | | | | – | | | | 39,059 | |
| Total | | $ | 40,511,470 | | | $ | – | | | $ | – | | | $ | 40,511,470 | |
| * | For a detailed sector breakdown, see the accompanying Schedule of Investments. |
The Funds did not have any securities that used significant unobservable inputs (Level 3) in determining fair value and there were no transfers into or out of Level 3 during the year ended June 30, 2022.
C. Foreign Securities
The ALPS | O’Shares Global Internet Giants ETF and the ALPS | O’Shares Europe Quality Dividend ETF may directly purchase securities of foreign issuers. Investments in non-U.S. issuers may involve unique risks compared to investing in securities of U.S. issuers, including, among others, less liquidity generally, greater market volatility than U.S. securities and less complete financial information than for U.S. issuers. In addition, adverse political, economic or social developments could undermine the value of the Fund’s investments or prevent the Fund from realizing the full value of its investments. Financial reporting standards for companies based in foreign markets differ from those in the United States. Finally, the value of the currency of the country in which the Fund has invested could decline relative to the value of the U.S. dollar, which may affect the value of the investment to U.S. investors.
Because foreign markets may be open on different days than the days during which investors may purchase the shares of each Fund, the value of each Fund's securities may change on the days when investors are not able to purchase the shares of the Funds. The value of securities denominated in foreign currencies is converted into U.S. dollars using exchange rates determined daily as of the close of regular trading on the NYSE or NASDAQ. Any use of a different rate from the rates used by the Index may adversely affect a Fund's ability to track its Index.
D. Foreign Currency Translation
The books and records of the Funds are maintained in U.S. dollars. Investment valuations and other assets and liabilities initially expressed in foreign currencies are converted each business day into U.S. dollars based upon currency exchange rates. The portion of realized and unrealized gains or losses on investments due to fluctuations in foreign currency exchange rates is not separately disclosed and is included in realized and unrealized gains or losses on investments, when applicable.
38 | June 30, 2022
| ALPS ETF Trust | |
| Notes to Financial Statements | June 30, 2022 |
E. Securities Transactions and Investment Income
Securities transactions are recorded as of the trade date. Realized gains and losses from securities transactions are recorded on the specific identification basis in accordance with GAAP. Dividend income and capital gains distributions, if any, are recorded on the ex-dividend date, net of any foreign taxes withheld. Non-cash dividends, if any, are recorded at the fair market value of the asset received. Interest income, if any, is recorded on the accrual basis, including amortization of premiums and accretion of discounts.
F. Dividends and Distributions to Shareholders
Dividends from net investment income for each Fund, if any, are declared and paid monthly or as the Board may determine from time to time. Distributions of net realized capital gains earned by the Funds, if any, are distributed at least annually.
G. Federal Tax and Tax Basis Information
The timing and character of income and capital gain distributions are determined in accordance with income tax regulations, which may differ from U.S. GAAP. Reclassifications are made to the Funds’ capital accounts for permanent tax differences to reflect income and gains available for distribution (or available capital loss carryforwards) under income tax regulations.
For the year ended June 30, 2022, the following reclassifications, which had no impact on results of operations or net assets, were recorded to reflect permanent tax differences resulting primarily from in-kind transactions:
| Fund | | Paid-in Capital | | | Total Distributable Earnings | |
| ALPS | O’Shares U.S. Quality Dividend ETF | | $ | 46,988,932 | | | $ | (46,988,932 | ) |
| ALPS | O’Shares U.S. Small-Cap Quality Dividend ETF | | | 15,146,817 | | | | (15,146,817 | ) |
| ALPS | O’Shares Global Internet Giants ETF | | | 32,720,357 | | | | (32,720,357 | ) |
| ALPS | O’Shares Europe Quality Dividend ETF | | | 2,569,850 | | | | (2,569,850 | ) |
The tax character of the distributions paid for the fiscal years ended June 30, 2022 and June 30, 2021 were as follows:
| | | Ordinary Income | | | Long-Term Capital Gain | | | Return of Capital | |
| June 30, 2022 | | | | | | | | | | | | |
| ALPS | O’Shares U.S. Quality Dividend ETF | | $ | 13,415,408 | | | $ | – | | | $ | – | |
| ALPS | O’Shares U.S. Small-Cap Quality Dividend ETF | | | 2,765,428 | | | | – | | | | – | |
| ALPS | O’Shares Global Internet Giants ETF | | | – | | | | – | | | | – | |
| ALPS | O’Shares Europe Quality Dividend ETF | | | 1,031,977 | | | | – | | | | – | |
| | | Ordinary Income | | | Long-Term Capital Gain | | | Return of Capital | |
| June 30, 2021 | | | | | | | | | |
| ALPS | O’Shares U.S. Quality Dividend ETF | | $ | 10,300,014 | | | $ | – | | | $ | – | |
| ALPS | O’Shares U.S. Small-Cap Quality Dividend ETF | | | 2,128,261 | | | | – | | | | – | |
| ALPS | O’Shares Global Internet Giants ETF | | | – | | | | – | | | | – | |
| ALPS | O’Shares Europe Quality Dividend ETF | | | 682,515 | | | | – | | | | – | |
The character of distributions made during the year may differ from its ultimate characterization for federal income tax purposes.
As of June 30, 2022, the components of distributable earnings on a tax basis for each Fund were as follows:
| | | Accumulated net investment income | | | Accumulated net realized gain/(loss) on investments | | | Other accumulated gains/(losses) | | | Net unrealized appreciation/(depreciation) on investments | | | Total | |
| ALPS | O’Shares U.S. Quality Dividend ETF | | | 623,889 | | | $ | (49,934,782 | ) | | $ | – | | | $ | 44,463,068 | | | $ | (4,847,825 | ) |
| ALPS | O’Shares U.S. Small-Cap Quality Dividend ETF | | | 184,371 | | | | (13,359,776 | ) | | | – | | | | 1,417,817 | | | | (11,757,588 | ) |
| ALPS | O’Shares Global Internet Giants ETF | | | – | | | | (97,244,512 | ) | | | (267,981 | ) | | | (128,476,797 | ) | | | (225,989,290 | ) |
| ALPS | O’Shares Europe Quality Dividend ETF | | | 283,061 | | | | (5,287,374 | ) | | | – | | | | (9,491,687 | ) | | | (14,496,000 | ) |
39 | June 30, 2022
| ALPS ETF Trust | |
| Notes to Financial Statements | June 30, 2022 |
Under current tax rules, Regulated Investment Companies can elect to treat certain late-year ordinary losses incurred and post-October capital losses (capital losses realized after October 31) as arising on the first day of the following taxable year. As of June 30, 2022, the Funds will elect to treat the following losses as arising on July 1, 2022:
ALPS | O’Shares Europe Quality Dividend ETF elects to defer to the period ending June 30, 2023, capital losses recognized during the period from November 1, 2021 to June 30, 2022 in the amount of $3,536.
ALPS | O’Shares Global Internet Giants ETF elects to defer to the period ending June 30, 2023, late year ordinary losses in the amount of $267,981.
Under current law, capital losses maintain their character as short-term or long-term and are carried forward to the next tax year without expiration. As of June 30, 2022, the following amounts are available as carry forwards to the next tax year:
| Fund | | Short-Term | | | Long-Term | |
| ALPS | O’Shares U.S. Quality Dividend ETF | | $ | 11,961,436 | | | $ | 37,973,346 | |
| ALPS | O’Shares U.S. Small-Cap Quality Dividend ETF | | | 2,950,628 | | | | 10,409,148 | |
| ALPS | O’Shares Global Internet Giants ETF | | | 77,960,333 | | | | 19,284,179 | |
| ALPS | O’Shares Europe Quality Dividend ETF | | | 70,094 | | | | 5,213,744 | |
As of June 30, 2022, the cost of investments for federal income tax purposes and accumulated net unrealized appreciation/(depreciation) on investments were as follows:
| | | ALPS | O’Shares U.S. Quality Dividend ETF | | | ALPS | O’Shares U.S. Small-Cap Quality Dividend ETF | | | ALPS | O’Shares Global Internet Giants ETF | | | ALPS | O’Shares Europe Quality Dividend ETF | |
| Gross appreciation (excess of value over tax cost) | | $ | 97,622,206 | | | $ | 13,632,081 | | | $ | 7,545,119 | | | $ | 813,465 | |
| Gross depreciation (excess of tax cost over value) | | | (53,159,138 | ) | | | (12,214,264 | ) | | | (136,021,642 | ) | | | (10,294,520 | ) |
| Net depreciation of foreign currency | | | – | | | | – | | | | (274 | ) | | | (10,632 | ) |
| Net unrealized appreciation (depreciation) | | $ | 44,463,068 | | | $ | 1,417,817 | | | $ | (128,476,797 | ) | | $ | (9,491,687 | ) |
| Cost of investments for income tax purposes | | $ | 693,056,633 | | | $ | 153,893,646 | | | $ | 338,374,289 | | | $ | 49,992,525 | |
The differences between book-basis and tax basis are primarily due to the deferral of losses from wash sales, investments in partnerships and investments in passive foreign investment companies.
Capital loss carryovers used during the period ended June 30, 2022, for ALPS | O'Shares Europe Quaility Dividend ETF were $378,184.
H. Income Taxes
No provision for income taxes is included in the accompanying financial statements, as each Fund intends to distribute to shareholders all taxable investment income and realized gains and otherwise comply with Subchapter M of the Internal Revenue Code of 1986, as amended, applicable to regulated investment companies. Each Fund evaluates tax positions taken (or expected to be taken) in the course of preparing the Funds’ tax returns to determine whether these positions meet a “more-likely-than-not” standard that, based on the technical merits, have a more than fifty percent likelihood of being sustained by a taxing authority upon examination. A tax position that meets the “more-likely-than-not” recognition threshold is measured to determine the amount of benefit to recognize in the financial statements.
As of and during the year ended June 30, 2022, each Funds did not have a liability for any unrecognized tax benefits. Each Fund files U.S. federal, state, and local tax returns as required. Each Fund’s tax returns are subject to examination by the relevant tax authorities until expiration of the applicable statute of limitations, which is generally three years after the filing of the tax return, but may extend to four years in certain jurisdictions. Tax returns for open years have incorporated no uncertain tax positions that require a provision for income taxes.
I. Lending of Portfolio Securities
Effective June 20, 2022, the Funds have entered into a securities lending agreement with State Street Bank & Trust Co. (“SSB”), the Funds’ lending agent. Each Fund may lend its portfolio securities only to borrowers that are approved by SSB. Each Fund will limit such lending to not more than 33 1/3% of the value of its total assets. The Funds' securities held at SSB as custodian shall be available to be lent except those securities the Funds or ALPS Advisors, Inc. specifically identifies in writing as not being available for lending. The borrower pledges and maintains with the Funds collateral consisting of cash (U.S. Dollars only), securities issued or guaranteed by the U.S. government or its agencies or instrumentalities, and cash equivalents (including irrevocable bank letters of credit) issued by a person other than the borrower or an affiliate of the borrower. The initial collateral received by the Fund is required to have a value of no less than 102% of the market value of the loaned securities for U.S equity securities and a value of no less than 105% of the market value for non-U.S. equity securities. The collateral is maintained thereafter, at a market value equal to not less than 102% of the current value of the U.S. equity securities on loan and not less than 105% of the current value of the non-U.S. equity securities on loan. The market value of the loaned securities is determined at the close of each business day and any additional required collateral is delivered to the Fund on the next business day. During the term of the loan, each Fund is entitled to all distributions made on or in respect of the loaned securities. Loans of securities are terminable at any time and the borrower, after notice, is required to return borrowed securities within the customary time period for settlement of securities transactions.
40 | June 30, 2022
| ALPS ETF Trust | |
| Notes to Financial Statements | June 30, 2022 |
Any cash collateral received is reinvested in a money market fund managed by SSB as disclosed in the Fund’s Schedule of Investments and is reflected in the Statements of Assets and Liabilities as a payable for collateral upon return of securities loaned. Non-cash collateral, in the form of securities issued or guaranteed by the U.S. government or its agencies or instrumentalities, is not disclosed in the Funds' Statements of Assets and Liabilities as it is held by the lending agent on behalf of the Funds, and the Funds do not have the ability to re-hypothecate these securities. Income earned by the Fund from securities lending activity is disclosed in the Statement of Operations. The Funds did not participate in any securities lending during the year ended June 30, 2022.
3. INVESTMENT ADVISORY FEE AND OTHER AFFILIATED TRANSACTIONS
ALPS Advisors, Inc. (the “Adviser”) serves as the Funds’ investment adviser to the Funds pursuant to an Investment Advisory Agreement with the Trust on behalf of each Fund (the “Advisory Agreement”). Pursuant to the Advisory Agreement, each Fund pays the Adviser an annual management fee for the services and facilities it provides, payable on a monthly basis as a percentage of the relevant Fund’s average daily net assets as set out below. From time to time, the Adviser may waive all or a portion of its fee.
| Fund | Advisory Fee | |
| ALPS | O’Shares U.S. Quality Dividend ETF | Average net assets up to and including $2 billion | 0.48% |
| | Average net assets greater than $2 billion up to and including $3 billion | 0.44% |
| | Average net assets greater than $3 billion up to and including $4 billion | 0.40% |
| | Average net assets greater than $4 billion up to and including $5 billion | 0.36% |
| | Average net assets greater than $5 billion | 0.32% |
| ALPS | O’Shares U.S. Small-Cap Quality Dividend ETF | Average net assets up to and including $2 billion | 0.48% |
| | Average net assets greater than $2 billion up to and including $3 billion | 0.44% |
| | Average net assets greater than $3 billion up to and including $4 billion | 0.40% |
| | Average net assets greater than $4 billion up to and including $5 billion | 0.36% |
| | Average net assets greater than $5 billion | 0.32% |
| ALPS | O’Shares Global Internet Giants ETF | | 0.48% |
| ALPS | O’Shares Europe Quality Dividend ETF | | 0.48% |
Out of the unitary management fee, the Adviser pays substantially all expense of each Fund, including licensing fees to the Underlying Index provider, the cost of transfer agency, custody, fund administration, legal, audit, trustees and other services, except for interest expenses, distribution fees or expenses, brokerage expenses, taxes and extraordinary expenses not incurred in the ordinary course of each Fund’s business. The Adviser’s unitary management fee is designed to pay substantially all of each Fund’s expenses and to compensate the Adviser for providing services for each Fund.
Prior to June 17, 2022, O’Shares Investment Advisers, LLC (“OSI”) served as each predecessor fund’s investment adviser pursuant to an Investment Advisory Agreement with the Trust on behalf of each Fund (the “O’Shares Advisory Agreement”). Under the O’Shares Advisory Agreement, the Funds paid OSI a unitary management fee for its services payable on a monthly basis at an annual rate of 0.48%, based on the average daily net assets of each Fund. Under the O’Shares Advisory Agreement, OSI was responsible for all of the ordinary operating expenses of the Funds, except for (i) the management fee, (ii) payments under the Funds’ Rule 12b-1 plan, (iii) brokerage expenses (including any costs incidental to transactions in portfolio securities or instruments), (iv) acquired fund fees and expenses, (v) taxes, interest (including borrowing costs and dividend expenses on securities sold short and overdraft charges), litigation expenses (including litigation to which the Trust or a Fund may be a party and indemnification of the Trustees and officers with respect thereto) and (viii) other extraordinary or non-routine expenses. See Note 7.
ALPS Fund Services, Inc., an affiliate of the Adviser, is the administrator of the Funds.
Each Trustee of the Board receives (1) a quarterly retainer of $20,000, (2) a per meeting fee of $10,000, (3) $2,500 for any special meeting held outside of a regularly scheduled board meeting, and (4) reimbursement for all reasonable out-of-pocket expenses relating to attendance at meetings.
41 | June 30, 2022
| ALPS ETF Trust | |
| Notes to Financial Statements | June 30, 2022 |
In addition, the Chairman of the Board receives a quarterly retainer of $5,000, the Chairman of the Audit Committee receives a quarterly retainer of $3,000, and the Chairman of the Nominating & Governance Committee receives a quarterly retainer of $2,000, each in connection with their respective roles.
4. PURCHASES AND SALES OF SECURITIES
For the year ended June 30, 2022, the cost of securities purchased and proceeds from sales of securities, excluding short-term investments and in-kind transactions, were as follows:
| Fund | | Purchases | | | Sales | |
| ALPS | O’Shares U.S. Quality Dividend ETF | | $ | 109,264,630 | | | $ | 109,957,756 | |
| ALPS | O’Shares U.S. Small-Cap Quality Dividend ETF | | | 53,519,409 | | | | 53,090,491 | |
| ALPS | O’Shares Global Internet Giants ETF | | | 236,257,402 | | | | 237,418,829 | |
| ALPS | O’Shares Europe Quality Dividend ETF | | | 9,670,617 | | | | 9,819,223 | |
For the year ended June 30, 2022, the cost of in-kind purchases and proceeds from in-kind sales were as follows:
| Fund | | Purchases | | | Sales | |
| ALPS | O’Shares U.S. Quality Dividend ETF | | $ | 229,540,202 | | | $ | 141,453,935 | |
| ALPS | O’Shares U.S. Small-Cap Quality Dividend ETF | | | 78,377,800 | | | | 56,738,062 | |
| ALPS | O’Shares Global Internet Giants ETF | | | 5,604,311 | | | | 229,266,171 | |
| ALPS | O’Shares Europe Quality Dividend ETF | | | 43,374,326 | | | | 15,564,732 | |
For the year ended June 30, 2022, the in-kind net realized gain/(losses) were as follows:
| Fund | | Net Realized Gain/(Loss) | |
| ALPS | O’Shares U.S. Quality Dividend ETF | | $ | 47,018,417 | |
| ALPS | O’Shares U.S. Small-Cap Quality Dividend ETF | | | 15,086,636 | |
| ALPS | O’Shares Global Internet Giants ETF | | | 36,553,162 | |
| ALPS | O’Shares Europe Quality Dividend ETF | | | 2,867,757 | |
Gains on in-kind transactions are not considered taxable for federal income tax purposes and losses on in-kind transactions are also not deductible for tax purposes.
5. CAPITAL SHARE TRANSACTIONS
Shares are created and redeemed by each Fund only in Creation Unit size aggregations of 25,000 Shares. Only broker-dealers or large institutional investors with creation and redemption agreements called Authorized Participants (“AP”) are permitted to purchase or redeem Creation Units from the Funds. Such transactions are generally permitted on an in-kind basis, with a balancing cash component to equate the transaction to the NAV per unit of each Fund on the transaction date. Cash may be substituted equivalent to the value of certain securities generally when they are not available in sufficient quantity for delivery, not eligible for trading by the AP or as a result of other market circumstances.
6. MARKET RISK
The Funds are subject to investment and operational risks associated with financial, economic and other global market developments and disruptions, including the recent spread of an infectious respiratory illness caused by a novel strain of coronavirus (known as COVID-19), which can negatively impact the securities markets and cause each Fund to lose value. Securities in each Fund’s portfolio may underperform in comparison to securities in general financial markets, a particular financial market or other asset classes due to a number of factors, including inflation (or expectations for inflation), deflation (or expectations for deflation), interest rates, global demand for particular products or resources, market instability, debt crises and downgrades, embargoes, tariffs, sanctions and other trade barriers, regulatory events, other governmental trade or market control programs and related geopolitical events. In addition, the value of the Fund’s investments may be negatively affected by the occurrence of global events such as war, terrorism, environmental disasters, natural disasters or events, country instability, and infectious disease epidemics or pandemics.
42 | June 30, 2022
| ALPS ETF Trust | |
| Notes to Financial Statements | June 30, 2022 |
The spread of COVID-19 has caused volatility, severe market dislocations and liquidity constraints in many markets, including markets for the securities each Fund holds, and may adversely affect each Fund’s investments and operations. The transmission of COVID-19 and efforts to contain its spread have resulted in travel restrictions and disruptions, closed international borders, enhanced health screenings at ports of entry and elsewhere, disruption of and delays in healthcare service preparation and delivery, quarantines, event and service cancellations or interruptions, disruptions to business operations and supply chains, and a reduction in consumer and business spending, as well as general concern and uncertainty that has negatively affected the economy. These disruptions have led to instability in the market place and the jobs market. The impact of COVID-19 could adversely affect the economies of many nations or the entire global economy, the financial well-being and performance of individual issuers, borrowers and sectors and the health of the markets generally in potentially significant and unforeseen ways.
The foregoing could lead to a significant economic downturn or recession, increased market volatility, a greater number of market closures, higher default rates and adverse effects on the values and liquidity of each Fund’s securities or other assets. Such impacts may adversely affect the performance of the Funds.
7. FUND REORGANIZATIONS
On February 23, 2022, the Board of Trustees of OSI ETF Trust (the “OSI ETF Board”) approved an Agreement and Plan of Reorganization with the Trust (the “Plan”) to reorganize each Predecessor Fund listed below with and into its corresponding Acquiring Fund, each a newly created series of the Trust. Shareholders of the O’Shares U.S. Quality Dividend ETF and O’Shares U.S. Small-Cap Quality Dividend ETF approved the Plan on May 18, 2022. Shareholders of the O’Shares Global Internet Giants ETF approved the Plan on June 15, 2022 and shareholders of the O’Shares Europe Quality Dividend ETF approved the Plan on June 8, 2022. The Trust acquired all of the assets of the corresponding Predecessor Funds, each a series of OSI ETF Trust, in exchange for shares of the Acquiring Fund and the assumption by the Acquiring Fund of the liabilities of the Predecessor Fund (the “Reorganizations”). The Reorganizations were completed after the close of business on June 17, 2022 in a tax-free exchange in which each shareholder of the Acquiring Funds received the same aggregate share and net asset value.
| Acquiring Fund | Predecessor Fund |
| ALPS | O’Shares U.S. Quality Dividend ETF | O’Shares U.S. Quality Dividend ETF |
| ALPS | O’Shares U.S. Small-Cap Quality Dividend ETF | O’Shares U.S. Small-Cap Quality Dividend ETF |
| ALPS | O’Shares Global Internet Giants ETF | O’Shares Global Internet Giants ETF |
| ALPS | O’Shares Europe Quality Dividend ETF | O’Shares Europe Quality Dividend ETF |
At the time of the reorganizations, each Acquiring Fund had the same ticker symbol and underlying index as its respective Predecessor Fund, was managed in accordance with the same investment objective and was subject to substantially the same investment strategies, policies and risks as the Predecessor Fund. Each Acquiring Fund is the accounting successor of the corresponding Predecessor Fund and assumed the performance and accounting history of the Predecessor Fund. As a result, the financial statements and financial highlights reflect the operations of the Predecessor Funds for periods prior to June 17, 2022.
Prior to the Reorganizations, the Acquiring Funds did not have any assets or liabilities. For financial reporting purposes, assets received and shares issued by the Acquiring Funds were recorded at fair value; however, the cost basis of the investments received from the Predecessor Funds were carried forward to align ongoing reporting of the Acquiring Funds realized and unrealized gains and losses with amounts distributable to shareholders for tax purposes.
8. SUBSEQUENT EVENTS
Subsequent events, if any, after the date of the Statements of Assets and Liabilities have been evaluated through the date the financial statements were issued. Management has determined that there were no subsequent events to report through the issuance of these financial statements.
43 | June 30, 2022
| ALPS ETF Trust | |
| Additional Information | June 30, 2022 (Unaudited) |
PROXY VOTING RECORDS, POLICIES AND PROCEDURES
Information regarding how the Fund voted proxies relating to portfolio securities during the most recent 12-month period ended June 30 and a description of the Fund’s proxy voting policies and procedures used in determining how to vote for proxies are available without charge on the SEC’s website at www.sec.gov and upon request, by calling (toll-free) 1-866-759-5679.
PORTFOLIO HOLDINGS
The Funds file a complete schedule of portfolio holdings with the U.S. Securities and Exchange Commission (“SEC”) for the first and third quarters of each fiscal year on Form N-PORT within 60 days after the end of the period. Copies of the Fund’s Form N-PORT are available without a charge, upon request, by contacting the Fund at 1-866-759-5679 and on the SEC’s website at https://www.sec.gov.
TAX INFORMATION
The Funds designate the following as a percentage of taxable ordinary income distributions, or up to the maximum amount allowable, for the calendar year ended December 31, 2021:
| | Qualified Dividend Income | Dividend Received Deduction |
| ALPS | O’Shares U.S. Quality Dividend ETF | 100% | 100% |
| ALPS | O’Shares U.S. Small-Cap Quality Dividend ETF | 100% | 100% |
| ALPS | O’Shares Global Internet Giants ETF | 0% | 0% |
| ALPS | O’Shares Europe Quality Dividend ETF | 87.61% | 0% |
For the year ended December 31, 2021, the ALPS | O’Shares Europe Quality Dividend ETF designated foreign taxes paid in the amount of $59,502 and foreign source income in the amount of $618,953, respectively. In early 2022, if applicable, shareholders of record received this information for the distributions paid to them by the Funds during the calendar year 2021 via Form 1099. The Funds will notify shareholders in early 2023 of amounts paid to them by the Funds, if any, during the calendar year 2022.
LICENSING AGREEMENTS
O’Shares Investment Advisers, LLC ( “O’Shares”) has entered into an index licensing agreement with ALPS Advisors Inc. (the “Adviser”) with respect to each of ALPS | O’Shares U.S. Quality Dividend ETF, ALPS | O’Shares U.S. Small-Cap Quality Dividend ETF, ALPS | O’Shares Global Internet Giants ETF, and ALPS | O’Shares Europe Quality Dividend ETF (each, a “Fund”), to allow the Adviser’s use of the O'Shares U.S. Quality Dividend Index, the O'Shares U.S. Small-Cap Quality Dividend Index, the O'Shares Global Internet Giants Index, and the O'Shares Europe Quality Dividend Index (each, an “Underlying Index”). The following disclosure relates to O’Shares.
The Funds are not sponsored, endorsed, sold or promoted by O’Shares or its third party licensors. Neither O’Shares nor its third party licensors make any representation or warranty, express or implied, to shareholders of a Fund or any member of the public regarding the advisability of investing in securities generally or in a Fund particularly or the ability of the Underlying Index to track general stock market performance. O’Shares’ and its third party licensor’s only relationship to the Adviser and each Fund is the licensing of certain trademarks, service marks and trade names of O’Shares and/or its third party licensors and for the providing the Underlying Index. Neither O’Shares nor its third party licensors is responsible for and has not participated in the determination of the prices and amount of a Fund or the timing of the issuance or sale of a Fund or in the determination or calculation of the equation by which a Fund is to be converted into cash. O’Shares has no obligation or liability in connection with the administration, marketing or trading of the Funds.
NEITHER O’SHARES, ITS AFFILIATES NOR THEIR THIRD PARTY LICENSORS GUARANTEE THE ADEQUACY, ACCURACY, TIMELINESS OR COMPLETENESS OF THE INDEX OR ANY DATA INCLUDED THEREIN OR ANY COMMUNICATIONS, INCLUDING BUT NOT LIMITED TO, ORAL OR WRITTEN COMMUNICATIONS (INCLUDING ELECTRONIC COMMUNICATIONS) WITH RESPECT THERETO. O’SHARES, ITS AFFILIATES AND THEIR THIRD PARTY LICENSORS SHALL NOT BE SUBJECT TO ANY DAMAGES OR LIABILITY FOR ANY ERRORS, OMISSIONS OR DELAYS THEREIN. O’SHARES MAKES NO EXPRESS OR IMPLIED WARRANTIES, AND EXPRESSLY DISCLAIMS ALL WARRANTIES OF MERCHANTABILITY OR FITNESS FOR A PARTICULAR PURPOSE OR USE WITH RESPECT TO ITS TRADEMARKS, THE INDEX OR ANY DATA INCLUDED THEREIN. WITHOUT LIMITING ANY OF THE FOREGOING, IN NO EVENT WHATSOEVER SHALL O’SHARES, ITS AFFILIATES OR THEIR THIRD PARTY LICENSORS BE LIABLE FOR ANY INDIRECT, SPECIAL, INCIDENTAL, PUNITIVE OR CONSEQUENTIAL DAMAGES, INCLUDING BUT NOT LIMITED TO, LOSS OF PROFITS, TRADING LOSSES, LOST TIME OR GOODWILL, EVEN IF THEY HAVE BEEN ADVISED OF THE POSSIBILITY OF SUCH DAMAGES, WHETHER IN CONTRACT, TORT, STRICT LIABILITY OR OTHERWISE.
44 | June 30, 2022
| ALPS ETF Trust | |
| Additional Information | June 30, 2022 (Unaudited) |
O’Shares Investments is a registered trademark and registered service mark of O’Shares Investment, Inc. and has been licensed for use by the Adviser and the Funds.
The Funds are not sponsored, endorsed, sold or promoted by O’Shares, its affiliates or their third party licensors and neither O’Shares, its affiliates nor its third party licensors make any representation regarding the advisability of investing in the Funds.
O’Shares has entered into an agreement with S-Network Global Indexes Inc. (“S-Network”) pursuant to which S-Network calculates each Underlying Index. The following disclosure relates to O’Shares.
The Funds are not sponsored, endorsed, sold or promoted by or its third party licensors. Neither S-Network nor its third party licensors make any representation or warranty, express or implied, to the owners of a Fund or any member of the public regarding the advisability of investing in securities generally or in a Fund particularly or the ability of the Underlying Index to track general stock market performance. S-Network's and its third party licensor’s only relationship to the Adviser is the licensing of certain trademarks, service marks and trade names of S-Network Global Indexes, Inc. and/or its third party licensors and for the providing of calculation and maintenance services related to the Underlying Index. Neither S-Network nor its third party licensors is responsible for and has not participated in the determination of the prices and amount of a Fund or the timing of the issuance or sale of a Fund or in the determination or calculation of the equation by which a Fund is to be converted into cash. S-Network has no obligation or liability in connection with the administration, marketing or trading of the Funds.
NEITHER S-NETWORK GLOBAL INDEXES, INC. (“S-Network”), ITS AFFILIATES NOR THEIR THIRD PARTY LICENSORS GUARANTEE THE ADEQUACY, ACCURACY, TIMELINESS OR COMPLETENESS OF THE CUSTOM INDEX OR ANY DATA INCLUDED THEREIN OR ANY COMMUNICATIONS, INCLUDING BUT NOT LIMITED TO, ORAL OR WRITTEN COMMUNICATIONS (INCLUDING ELECTRONIC COMMUNICATIONS) WITH RESPECT THERETO. S-NETWORK, ITS AFFILIATES AND THEIR THIRD PARTY LICENSORS SHALL NOT BE SUBJECT TO ANY DAMAGES OR LIABILITY FOR ANY ERRORS, OMISSIONS OR DELAYS THEREIN. S-NETWORK MAKES NO EXPRESS OR IMPLIED WARRANTIES, AND EXPRESSLY DISCLAIMS ALL WARRANTIES OF MERCHANTABILITY OR FITNESS FOR A PARTICULAR PURPOSE OR USE WITH RESPECT TO ITS TRADEMARKS, THE CUSTOM INDEX OR ANY DATA INCLUDED THEREIN. WITHOUT LIMITING ANY OF THE FOREGOING, IN NO EVENT WHATSOEVER SHALL S-NETWORK, ITS AFFILIATES OR THEIR THIRD PARTY LICENSORS BE LIABLE FOR ANY INDIRECT, SPECIAL, INCIDENTAL, PUNITIVE OR CONSEQUENTIAL DAMAGES, INCLUDING BUT NOT LIMITED TO, LOSS OF PROFITS, TRADING LOSSES, LOST TIME OR GOODWILL, EVEN IF THEY HAVE BEEN ADVISED OF THE POSSIBILITY OF SUCH DAMAGES, WHETHER IN CONTRACT, TORT, STRICT LIABILITY OR OTHERWISE.
S-Network Global Indexes, Inc.SM, and SNGISM are registered trademarks and registered service marks of S-Network Global Indexes, Inc. “Calculated by S-Network Global Indexes, Inc.” and its related stylized mark are service marks of S-Network Global Indexes, Inc.SM, and have been licensed for use by the Adviser.
The Funds are not sponsored, endorsed, sold or promoted by SNGI, its affiliates or their third party licensors and neither SNGI, its affiliates nor their its third party licensors make any representation regarding the advisability of investing in a Fund.
45 | June 30, 2022
| ALPS ETF Trust | |
| Board Considerations Regarding Approval of Investment Advisory Agreement | June 30, 2022 (Unaudited) |
At a meeting held on February 16, 2022 via electronic means (video-conference), the Board of Trustees of the Trust (the “Board” or the “Trustees”), including the Trustees who are not “interested persons” of the Trust within the meaning of the Investment Company Act of 1940, as amended (the “Independent Trustees”), evaluated a proposal to approve the Investment Advisory Agreement (the "Advisory Agreement") between the Trust and ALPS | O’Shares U.S. Quality Dividend ETF, ALPS | O’Shares U.S. Small-Cap Quality Dividend ETF, ALPS | O’Shares Global Internet Giants ETF and ALPS | O’Shares Europe Quality Dividend ETF (each a “New Fund” and, collectively, the “New Funds”), each a new series of the Trust.
In evaluating the New Funds’ Advisory Agreement, the Board, including the Independent Trustees, considered various factors, including (i) the nature, extent and quality of the services expected to be provided by the Adviser to the New Funds under the New Funds’ Advisory Agreement; (ii) the advisory fees and other expenses proposed to be paid by the New Funds compared to those of similar funds managed by other investment advisers; (iii) the expected costs of the services to be provided to the New Funds and the projected profitability to be realized by the Adviser and its affiliates from the Adviser’s relationship with the New Funds; (iv) the extent to which economies of scale would be realized if and as the New Funds’ assets increase and whether the fee levels in the New Funds’ Advisory Agreement reflects these economies of scale for the benefit of shareholders; and (v) any additional benefits and other considerations.
With respect to the nature, extent and quality of the services to be provided by the Adviser under the New Funds’ Advisory Agreement, the Board, including the Independent Trustees, considered and reviewed information concerning the services proposed to be provided under the New Funds’ Advisory Agreement, the proposed investment strategies, financial information regarding the Adviser and its parent company, information describing the Adviser’s current organization and the background and experience of the persons who would be responsible for the day-to-day management of the New Funds, the anticipated financial support of the New Funds, and the nature and quality of services provided to other ETFs, open-end and closed-end funds sponsored by the Adviser. Based upon their review, the Board, including the Independent Trustees, concluded that the Adviser was qualified to oversee the services to be provided by other service providers and that the services to be provided by the Adviser to the New Funds are expected to be satisfactory.
With respect to the costs of services to be provided and profits to be realized by the Adviser, the Board, including the Independent Trustees, considered the resources involved in managing the New Funds as well as the fact that the Adviser agreed to pay all of the New Funds’ expenses (except for interest expenses, distribution fees or expenses, brokerage expenses, taxes and extraordinary expenses such as litigation and other expenses not incurred in the ordinary course of the New Funds’ business) out of the unitary advisory fee. Based on their review, the Board, including the Independent Trustees, concluded that the expected profitability of the New Funds to the Adviser was not unreasonable.
The Board, including the Independent Trustees, also reviewed comparative fee and expense data provided by FUSE regarding each of the New Funds. The Trustees noted the proposed advisory fee for services to be provided to each New Fund by the Adviser was 0.48% of each New Fund’s average daily net assets, and that advisory fee breakpoints will apply to ALPS | O’Shares U.S. Quality Dividend ETF and ALPS | O’Shares U.S. Small-Cap Quality Dividend ETF as asset levels increase. The Trustees also considered that each advisory fee with respect to each New Fund was a unitary one and that, as set forth above, the Adviser had agreed to pay all of the New Funds’ expenses (except for interest expenses, marketing fees, distribution fees or expenses, brokerage expenses, taxes and extraordinary expenses such as litigation and other expenses not incurred in the ordinary course of the New Funds’ business) out of the unitary fee. The Board, including the Independent Trustees, considered that, taking into account the impact of each New Funds’ unitary advisory fees, the ALPS | O’Shares U.S. Quality Dividend ETF and ALPS | O’Shares U.S. Small-Cap Quality Dividend ETF expense ratios were above the median of their respective FUSE gross advisory fees peer group and FUSE total net expenses peer group, that the ALPS | O’Shares Europe Quality Dividend ETF expense ratio was above the median of its respective FUSE gross advisory fees peer group but comparable to the median of its FUSE total net expenses peer group, and that the ALPS | O’Shares Global Internet Giants ETF expense ratio was generally comparable to the median of its FUSE gross advisory fees peer group and FUSE total net expenses group. Based on the foregoing and the other information available to them, the Board, including the Independent Trustees, concluded that the advisory fees for the New Funds were reasonable under the circumstances and in light of the quality of services to be provided.
The Board, including the Independent Trustees, also considered other benefits that may be realized by the Adviser from its relationship with the New Funds and concluded that the advisory fees were reasonable taking into account such benefits.
The Board, including the Independent Trustees, considered the extent to which economies of scale would be realized as the New Funds grow and whether fee levels reflect a reasonable sharing of such economies of scale for the benefit of the New Fund investors. In this regard, the Trustees noted the advisory fee breakpoints proposed for each of ALPS | O’Shares U.S. Quality Dividend ETF and ALPS | O’Shares U.S. Small-Cap Quality Dividend ETF. The Trustees reviewed the New Funds’ proposed unitary advisory fees, as well as the proposed breakpoints for ALPS | O’Shares U.S. Quality Dividend ETF and ALPS | O’Shares U.S. Small-Cap Quality Dividend ETF, and anticipated expenses and determined to continue to review economies of scale in the future.
46 | June 30, 2022
| ALPS ETF Trust | |
| Board Considerations Regarding Approval of Investment Advisory Agreement | June 30, 2022 (Unaudited) |
In voting to approve the New Funds’ Advisory Agreement, the Board, including the Independent Trustees, concluded that the terms of the New Funds’ Advisory Agreement are reasonable and fair in light of the services to be performed, the fees paid by certain other funds, expenses to be incurred and such other matters as the Board, including the Independent Trustees, considered relevant in the exercise of their reasonable business judgment. The Board, including the Independent Trustees, did not identify any single factor or group of factors as all important or controlling and considered all factors together.
47 | June 30, 2022
| ALPS ETF Trust | |
| Trustees & Officers | June 30, 2022 (Unaudited) |
The general supervision of the duties performed by the Adviser for the Fund under the Investment Advisory Agreement is the responsibility of the Board of Trustees. The Trust currently has four Trustees, each of whom have no affiliation or business connection with the Adviser or any of its affiliated persons and do not own any stock or other securities issued by the Adviser. These are the “non-interested” or “independent” Trustees (“Independent Trustees”).
The Independent Trustees of the Trust, their term of office and length of time served, their principal business occupations during the past five years, the number of portfolios in the Fund Complex overseen by each Independent Trustee, and other directorships, if any, held by the Trustee are shown below.
| INDEPENDENT TRUSTEES |
| Name, Address & Year of Birth* | Position(s) Held with Trust | Term of Office and Length of Time Served** | Principal Occupation(s) During Past 5 Years | Number of Portfolios in Fund Complex Overseen by Trustees*** | Other Directorships Held by Trustees |
Mary K. Anstine, 1940 | Trustee | Since March 2008 | Ms. Anstine is Trustee/Director of AV Hunter Trust and Colorado Uplift Board. | 38 | Ms. Anstine is a Trustee of ALPS Variable Investment Trust (7 funds); Financial Investors Trust (30 funds); and Reaves Utility Income Fund. |
Edmund J. Burke, 1961 | Trustee | Since December 2017. | Mr. Burke joined ALPS in 1991 and served as the President and Director of ALPS Holdings, Inc., and ALPS Advisors, Inc., and Director of ALPS Distributors, Inc., ALPS Fund Services, Inc. (“ALPS”), and ALPS Portfolio Solutions Distributor, Inc. (collectively, the “ALPS Companies”). Mr. Burke retired from the ALPS Companies in June 2019. Mr. Burke is currently a partner at ETF Action, a web-based system that provides data and analytics to registered investment advisers, (since 2020) and a Director of Alliance Bioenergy Plus, Inc., a technology company focused on emerging technologies in the renewable energy, biofuels, and bioplastics technology sectors (since 2020). | 33 | Mr. Burke is a Trustee of Clough Global Dividend and Income Fund (1 fund); Clough Global Equity Fund (1 fund); Clough Global Opportunities Fund (1 fund); Clough Funds Trust (1 fund); Liberty All-Star Equity Fund (1 fund); Director of the Liberty All-Star Growth Fund, Inc. (1 fund) and Financial Investors Trust (30 funds). |
Jeremy W. Deems, 1976 | Trustee | Since March 2008 | Mr. Deems is the Co-Founder and Chief Financial Officer of Green Alpha Advisors, LLC, a registered investment advisor, and Co-Portfolio Manager of the Shelton Green Alpha Fund. | 38 | Mr. Deems is a Trustee of ALPS Variable Investment Trust (7 funds); Financial Investors Trust (30 funds); and Reaves Utility Income Fund; and Clough Funds Trust (1 fund). |
48 | June 30, 2022
| ALPS ETF Trust | |
| Trustees & Officers | June 30, 2022 (Unaudited) |
| Name, Address & Year of Birth* | Position(s) Held with Trust | Term of Office and Length of Time Served** | Principal Occupation(s) During Past 5 Years | Number of Portfolios in Fund Complex Overseen by Trustees*** | Other Directorships Held by Trustees |
Rick A. Pederson, 1952 | Trustee | Since March 2008 | Mr. Pederson is Chief Strategy Officer, Bow River Capital Partners, 2003 - present; Advisory Board Member, Citywide Banks (HTLF) 2017 -- present; Board Member, Strong-Bridge Consulting, 2015 -- 2019; Board Member, IRI/ODMS Holdings LLC, 2017 – 2019; Board Member, Kivu Consulting, 2019- 2022; Director, National Western Stock Show (not for profit) 2010 -- present; Director, History Colorado (not for profit) 2015-2020; Trustee, Boettcher Foundation, 2018 -- present. | 24 | Mr. Pederson is Trustee of Segall Bryant & Hamill Trust (14 funds) and Principal Real Estate Income Fund (1 fund). |
| * | The business address of the Trustee is c/o ALPS Advisors, Inc., 1290 Broadway, Suite 1000, Denver, Colorado 80203. |
| ** | This is the period for which the Trustee began serving the Trust. Each Trustee serves an indefinite term, until his or her successor is elected. *** The Fund Complex includes all series of the Trust and any other investment companies for which ALPS Advisors, Inc. provides investment advisory services. |
49 | June 30, 2022
| ALPS ETF Trust | |
| Trustees & Officers | June 30, 2022 (Unaudited) |
| OFFICERS |
| Name, Address and Year of Birth of Officer | Position(s) Held with Trust | Length of Time Served* | Principal Occupation(s) During Past 5 Years |
Laton Spahr, 1975 | President | Since June 2021 | Mr. Spahr joined ALPS in 2019 and currently serves as President and Portfolio Manager of AAI. Prior to his current role, Mr. Spahr was a Senior Vice President and Strategy Leader of the Value & Income Team for Oppenheimer Funds from 2013 to 2019. |
Matthew Sutula, 1985 | Chief Compliance Officer (“CCO”) | Since December 2019 | Mr. Sutula joined ALPS in 2012 and currently serves as Chief Compliance Officer of AAI. Prior to his current role, Mr. Sutula served as interim Compliance Officer of the Trust (September 2019 to December 2019). Compliance Manager and Senior Compliance Analyst for AAI, as well as Compliance Analyst for AFS. Prior to joining ALPS, he spent seven years at Morningstar, Inc. in various analyst roles supporting the registered investment company databases. Mr. Sutula is also Chief Compliance Officer of Principal Real Estate Income Fund, ALPS Variable Investment Trust, RiverNorth Opportunities Fund, Inc., Liberty All-Star Equity Fund and Liberty All-Star Growth Fund, Inc. |
Kathryn Burns, 1976 | Treasurer | Since September 2018 | Ms. Burns serves as Vice President, Director of Fund Operations of AAI since 2018. From 2013 to 2018, she served as Vice President and Fund Controller at AFS. Prior to joining ALPS, she worked at Old Mutual Capital where she served as Vice President and Chief Compliance Officer (2010 – 2012) and Regulatory Reporting Manager and Assistant Treasurer to the Old Mutual Funds Trusts (2006 – 2012). She also served as a CPA for PricewaterhouseCoopers LLP. Ms. Burns also serves as President of ALPS Variable Investment Trust, Principal Real Estate Income Fund and RiverNorth Opportunities Fund, Inc. From June 2018 to November 2021 she also served as Treasurer of Boulder Growth & Income Fund, Inc. |
Brendan Hamill, 1986 | Secretary | Since September 2021 | Mr. Hamill joined ALPS in August 2021, and is currently Vice President and Principal Legal Counsel. Prior to joining ALPS, Mr. Hamill was an attorney at Lewis Brisbois Bisgaard & Smith, LLP (law firm) (December 2018-August 2021) and Vedder Price, P.C. (law firm) (August 2015-December 2018). Mr. Hamill also serves as Secretary of Financial Investors Trust, Secretary of ALPS Variable Investment Trust, Secretary of Principal Real Estate Income Fund, and Assistant Secretary of James Advantage Funds. In September 2021, he also served as Vice President and Secretary of Boulder Growth & Income Fund, Inc. |
| * | The business address of each Officer is c/o ALPS Advisors, Inc., 1290 Broadway, Suite 1000, Denver, Colorado 80203. Each Officer is deemed an affiliate of the Trust as defined under the 1940 Act. |
| ** | This is the period for which the Officer began serving the Trust. Each Officer serves an indefinite term, until his/her successor is elected. |
The Statement of Additional Information includes additional information about the Funds' Trustees and is available, without charge, upon request by calling (toll-free) 1-866-759-5679.
50 | June 30, 2022
Intentionally Left Blank

| (a) | The Registrant, as of the end of the period covered by this report, has adopted a code of ethics that applies to the Registrant's principal executive officer, principal financial officer, principal accounting officer or controller or any persons performing similar functions on behalf of the Registrant. |
| (c) | During the period covered by this report, no amendments to the provisions of the code of ethics adopted in 2(a) above were made. |
| (d) | During the period covered by this report, no implicit or explicit waivers to the provisions of the code of ethics adopted in 2(a) above were granted. |
| (f) | The Registrant's Code of Ethics is attached as an Exhibit hereto. |
| Item 3. | Audit Committee Financial Expert. |
The Board of Trustees of the Registrant has determined that the Registrant has at least one Audit Committee Financial Expert serving on its audit committee. The Board of Trustees of the Registrant has designated Jeremy W. Deems as the Registrant’s “Audit Committee Financial Expert.” Mr. Deems is “independent” as defined in paragraph (a)(2) of Item 3 to Form N-CSR.
| Item 4. | Principal Accountant Fees and Services. |
| (a) | Audit Fees: |
| | | |
| | | For the Registrant’s fiscal year ended June 30, 2022, the aggregate fees billed for professional services rendered by the principal accountant for the audit of the Registrant’s annual financial statements were $49,500. |
| (b) | Audit-Related Fees: For the Registrant’s fiscal year ended June 30, 2022, the aggregate fees billed for professional services rendered by the principal accountant that are reasonably related to the performance of the audit of the Registrant's financial statements and are not reported under paragraph (a) of this Item were $0. |
| (c) | Tax Fees: For the Registrant’s fiscal year ended June 30, 2022, the aggregate fees billed for professional services rendered by the principal accountant for tax compliance, tax advice and tax planning were $12,000. The fiscal year 2022 tax fees were for services pertaining to federal and state income tax return review, review of year-end dividend distributions and excise tax preparation. |
| (d) | All Other Fees: For the Registrant’s fiscal year ended June 30, 2022, aggregate fees billed to the Registrant by the principal accountant for services provided by the principal accountant other than the services reported in paragraphs (a) through (c) of this Item 4 were $0. |
| (1) | Audit Committee Pre-Approval Policies and Procedures: All services to be performed by the Registrant's principal accountant must be pre-approved by the Registrant's audit committee. |
| (2) | No services described in paragraphs (b) through (d) of this Item were approved by the Registrant’s audit committee pursuant to paragraph (c)(7)(i)(C) of Rule 2-01 of Regulation S-X. |
| (g) | The aggregate non-audit fees billed by the Registrant’s accountant for the fiscal year ended June 30, 2022, of the Registrant were $12,000. These fees consisted of non-audit fees billed to the Registrant of $12,000, as described in response to paragraph (c) above. |
| (h) | The Registrant’s audit committee has considered whether the provision of non- audit services that were rendered to the Registrant’s investment adviser (not including any sub-adviser whose role is primarily portfolio management and is subcontracted with or overseen by another investment adviser), and any entity controlling, controlled by, or under common control with the investment adviser that provides ongoing services to the Registrant that were not pre-approved pursuant to paragraph (c)(7)(ii) of Rule 2-01 of Regulation S-X, is compatible with maintaining the principal accountant’s independence. The Registrant’s audit committee determined that the provision of such non-audit services is compatible with maintaining the principal accountant’s independence. |
| Item 5. | Audit Committee of Listed Registrants. |
Not applicable to the Registrant.
| (a) | Schedule of Investments is included as part of the Report to Stockholders filed under Item 1 of this Form N-CSR. |
| Item 7. | Disclosure of Proxy Voting Policies and Procedures for Closed-End Management Investment Companies. |
Not applicable to Registrant.
| Item 8. | Portfolio Managers of Closed-End Management Investment Companies. |
Not applicable to Registrant.
| Item 9. | Purchases of Equity Securities by Closed-End Management Investment Company and Affiliated Purchasers. |
Not applicable to Registrant.
| Item 10. | Submission of Matters to a Vote of Security Holders. |
No material changes to the procedures by which the shareholders may recommend nominees to the Registrant’s Board of Trustees have been implemented after the Registrant’s last provided disclosure in response to the requirements of Item 407(c)(2)(iv) of Regulation S-K (17 CFR 229.407) (as required by Item 22(b)(15) of Schedule 14A (17 CFR 240.14a-101)), or this Item.
| Item 11. | Controls and Procedures. |
| (a) | The Registrant’s principal executive officer and principal financial officer have concluded that the Registrant’s disclosure controls and procedures (as defined in Rule 30a-3(c) under the Investment Company Act of 1940, as amended) are effective based on their evaluation of these controls and procedures as of a date within 90 days of the filing date of this report. |
| (b) | There was no change in the Registrant's internal control over financial reporting (as defined in Rule 30a-3(d) under the Investment Company Act of 1940, as amended) during the period covered by this report that has materially affected, or is reasonably likely to materially affect, the Registrant's internal control over financial reporting. |
| Item 12. | Disclosure of Securities Lending Activities for Closed-End Management Investment Companies. |
Not applicable.
SIGNATURES
Pursuant to the requirements of the Securities Exchange Act of 1934 and the Investment Company Act of 1940, the Registrant has duly caused this report to be signed on its behalf by the undersigned, thereunto duly authorized.
| ALPS ETF TRUST | |
| | | |
| By: | /s/ Laton Spahr | |
| | Laton Spahr (Principal Executive Officer) | |
| | President | |
| | | |
| Date: | September 2, 2022 | |
Pursuant to the requirements of the Securities Exchange Act of 1934 and the Investment Company Act of 1940, this report has been signed below by the following persons on behalf of the Registrant and in the capacities and on the dates indicated.
| By: | /s/ Laton Spahr | |
| | Laton Spahr (Principal Executive Officer) | |
| | President | |
| | | |
| Date: | September 2, 2022 | |
| | | |
| By: | /s/ Kathryn Burns | |
| | Kathryn Burns (Principal Financial Officer) | |
| | Treasurer | |
| | | |
| Date: | September 2, 2022 | |