UNITED STATES
SECURITIES AND EXCHANGE COMMISSION
Washington, D.C. 20549
FORM N-CSR
CERTIFIED SHAREHOLDER REPORT OF REGISTERED
MANAGEMENT INVESTMENT COMPANIES
Investment Company Act file number:
811-22175
ALPS ETF TRUST
(Exact name of registrant as specified in charter)
1290 Broadway, Suite 1000, Denver, Colorado 80203
(Address of principal executive offices) (Zip code)
Michael Lawlor, Esq., Secretary
ALPS ETF Trust
1290 Broadway, Suite 1000
Denver, Colorado 80203
(Name and address of agent for service)
Registrant’s Telephone Number, including Area Code: 877-398-8461
Date of fiscal year end: November 30
Date of reporting period: December 1, 2022 – November 30, 2023
| Item 1. | Report to Stockholders. |
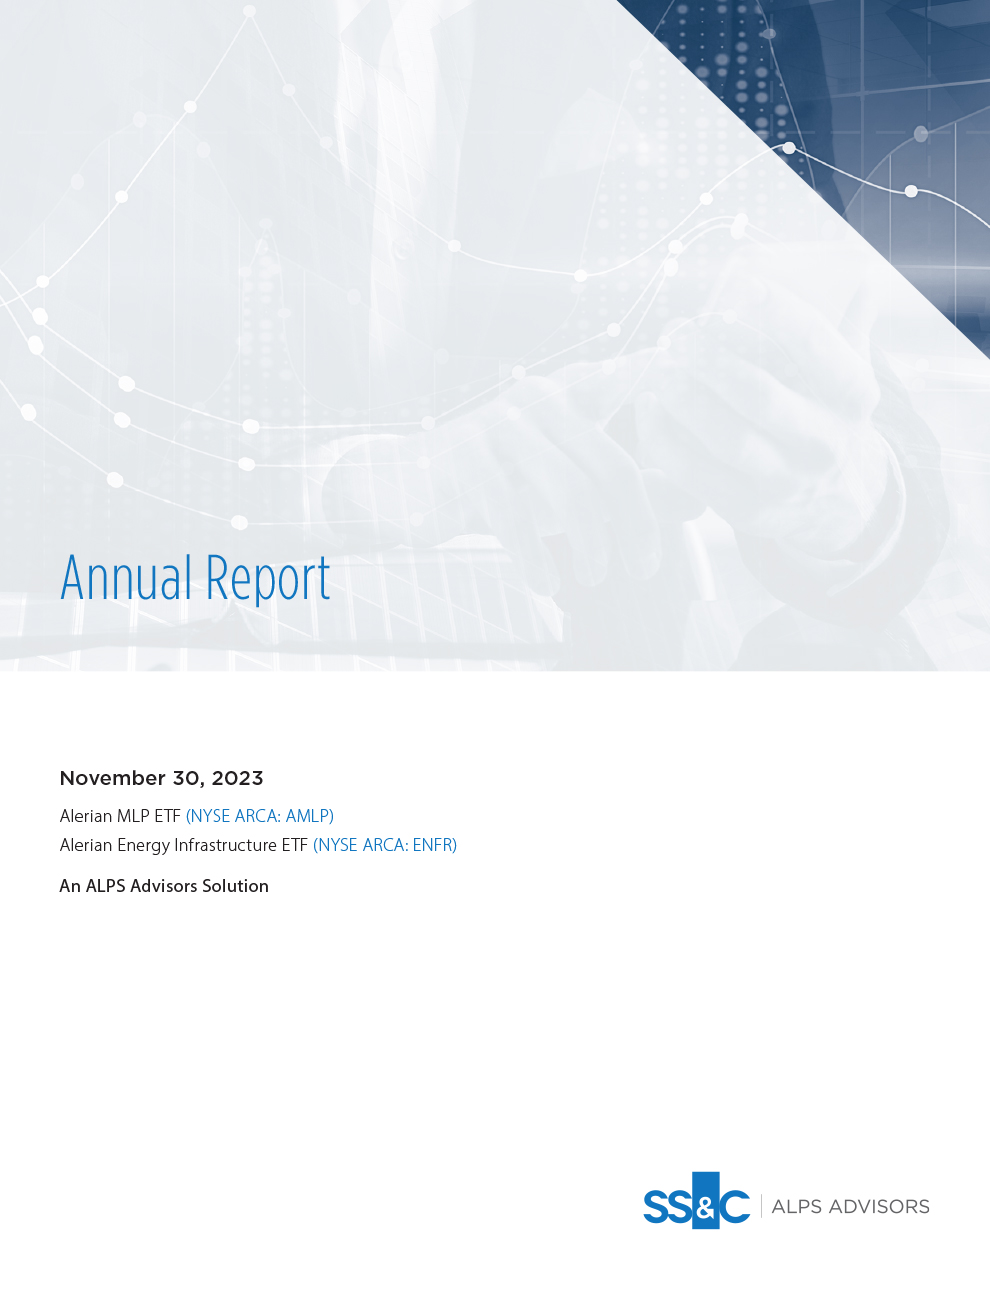
Table of Contents
| Performance Overview | |
| Alerian MLP ETF | 1 |
| Alerian Energy Infrastructure ETF | 4 |
| Disclosure of Fund Expenses | 7 |
| Report of Independent Registered Public Accounting Firm | 8 |
| Financial Statements | |
| Alerian MLP ETF | |
| Schedule of Investments | 9 |
| Statement of Assets and Liabilities | 10 |
| Statement of Operations | 11 |
| Statements of Changes in Net Assets | 12 |
| Financial Highlights | 13 |
| Alerian Energy Infrastructure ETF | |
| Schedule of Investments | 14 |
| Statement of Assets and Liabilities | 16 |
| Statement of Operations | 17 |
| Statements of Changes in Net Assets | 18 |
| Financial Highlights | 19 |
| Notes to Financial Statements | 20 |
| Additional Information | 31 |
| Board Considerations Regarding Approval of Investment Advisory Agreement | 33 |
| Trustees & Officers | 35 |
alpsfunds.com
Alerian MLP ETF
| Performance Overview | November 30, 2023 (Unaudited) |
INVESTMENT OBJECTIVE
The Alerian MLP ETF (the “Fund” or “AMLP”) seeks investment results that correspond (before fees and expenses) generally to the price and yield performance of its underlying index, the Alerian MLP Infrastructure Index (the “Underlying Index” or “AMZI”). The shares of the Fund are listed and trade on the NYSE Arca, Inc. (“NYSE”) under the ticker symbol AMLP. The Fund will normally invest at least 90% of its total assets in securities that comprise the Underlying Index.
The Underlying Index is a rules based, modified capitalization weighted, float-adjusted index intended to give investors a means of tracking the overall performance of the United States energy infrastructure Master Limited Partnership (“MLP”) asset class. The Underlying Index is comprised of energy infrastructure MLPs that earn a majority of their cash flow from the transportation, storage, and processing of energy commodities.
PERFORMANCE OVERVIEW
During the twelve-month period from December 1, 2022, to November 30, 2023, the Fund delivered a total return of 19.47% (19.82% NAV). This compares to the Fund’s Underlying Index, which increased 12.72% on a price-return basis and 22.18% on a total-return basis. The difference in performance between the AMZI and AMLP is primarily attributable to the Fund’s operating expenses and the tax impact of the Fund’s C-Corporation structure, including the accrual of approximately $121.6 million in income tax expense during the 12-month period.
During the period, the Fund paid four distributions:
| · | $0.7700 per share on February 14, 2023 |
| · | $0.8600 per share on May 16, 2023 |
| · | $0.8300 per share on August 15, 2023 |
| · | $0.8800 per share on November 14, 2023 |
The growing payouts from the Fund from February to November reflected strong distribution trends for AMZI constituents, with most names increasing their payouts during the year. Notably, there have been nine consecutive quarters without a distribution cut for an AMZI constituent. Comparing the latest distribution announcements for the third calendar quarter of 2023 (paid in the fourth calendar quarter in 2023) with the payouts from the same quarter in 2022, 86.31% of the Underlying Index by weighting grew their distributions and 13.69% maintained their payouts based on weightings through November 30, 2023.
In March 2023, the methodology for the Underlying Index was updated. Specifically, the maximum weight for individual constituents was raised from 10% to 12% to better reflect the market capitalization of constituents. The change was applied during the March quarterly rebalancing. Concurrently, DCP Midstream (DCP) was removed from the Underlying Index ahead of its acquisition by another entity, which reduced turnover resulting from the raised cap.
During the Fund's fiscal year, Magellan Midstream Partners (MMP), Crestwood Equity Partners (CEQP), and Holly Energy Partners (HEP) were also removed from the Underlying Index in relation to their acquisition by another entity.
Energy infrastructure MLPs outperformed both the S&P 500® and the broad energy sector as represented by the Energy Select Sector Index (IXE) during the Fund's fiscal year. Positive distribution trends, supported by ongoing free cash flow generation, enhanced appealing yields and served as tailwinds for the space. Additionally, the announced acquisition of Magellan Midstream Partners (MMP) by ONEOK (OKE) at a 22% premium in May 2023 was supportive for Fund performance. MMP was a large weighting in AMZI, and other constituents traded higher with the transaction news.
The fee-based business models of MLPs helped insulate companies from weaker commodity prices in 2023. Given an uncertain macroeconomic outlook, Alerian believes MLPs’ defensive qualities and generous yields could be supportive into 2024. Fee-based businesses drive stable cash flows, which in Alerian’s opinion should allow MLPs to generate free cash flow regardless of the commodity price environment. Alerian expects excess cash flow to support continued distribution growth and opportunistic buybacks in 2024 and beyond.
1 | November 30, 2023
Alerian MLP ETF
| Performance Overview | November 30, 2023 (Unaudited) |
Performance (as of November 30, 2023)
| | 1 Year | 5 Year | 10 Year | Since Inception^ |
| Alerian MLP ETF – NAV | 19.82% | 7.57% | 1.28% | 3.77% |
| Alerian MLP ETF – Market Price* | 19.47% | 7.57% | 1.27% | 3.77% |
| Alerian MLP Infrastructure Index | 22.18% | 9.72% | 2.04% | 6.09% |
| Alerian MLP Index | 23.29% | 10.33% | 2.29% | 5.99% |
Total Expense Ratio (per the current prospectus) is 0.85%.
Performance data quoted represents past performance. Past performance does not guarantee future results. Total return figures assume reinvestment of dividends, if any. The table does not reflect the deduction of taxes that a shareholder would pay on Fund distributions or the redemption of Fund shares. Investment return and principal value of an investment will fluctuate so that an investor’s shares, when sold or redeemed, may be worth more or less than the original cost. Current performance data may be higher or lower than actual data quoted. For the most current month-end performance data please visit www.alpsfunds.com or call 1.866.759.5679. The Fund accrues deferred income taxes for future tax liabilities associated with the portion of MLP distributions considered to be a tax-deferred return of capital and for any net operating gains as well as capital appreciation of its investment. This deferred tax liability is reflected in the daily Net Asset Value (NAV) and as a result the fund's after-tax performance could differ significantly from the underlying assets even if the pre-tax performance is closely tracked.
NAV is an exchange-traded fund’s per-share value. The per-share dollar amount of the Fund is derived by dividing the total value of all the securities in its portfolio, less any liabilities, by the number of Fund shares outstanding. Market Price is the price at which a share can currently be traded in the market. Information detailing the number of days the Market Price of the Fund was greater than the Fund’s NAV and the number of days it was less than the Fund’s NAV can be obtained at www.alpsfunds.com.
| ^ | The Fund commenced Investment Operations on August 24, 2010 with an Inception Date, the first day of trading on the NYSE ARCA, of August 25, 2010. |
| * | Market Price means the official closing price of a share or, if it more accurately reflects the market value of a share at the time as of which the Fund calculates current net asset value per share, the price that is the midpoint of the bid-ask spread as of that time. It does not represent the returns an investor would receive if shares were traded at other times. |
The Alerian MLP Infrastructure Index is comprised of 11 midstream energy Master Limited Partnerships and provides investors with an unbiased benchmark for the infrastructure component of this emerging asset class. Total return assumes reinvestment of any dividends and distributions realized during a given time period.
The Alerian MLP Index is recognized as a leading gauge of energy infrastructure Master Limited Partnerships (MLPs). The capped, float-adjusted, capitalization-weighted index, whose constituents earn the majority of their cash flow from midstream activities involving energy commodities, is reported on a total-return basis (AMZX), which assumes reinvestment of any dividends and distributions realized during a given period.
The indexes are not actively managed and do not reflect any deductions for fees, expenses or taxes. One cannot invest directly in an index. Index performance does not reflect fund performance.
The Fund’s shares are not individually redeemable. Investors buy and sell shares of the Fund on a secondary market. Only market makers or “authorized participants” may trade directly with the Fund, typically in blocks of 25,000 shares.
The Alerian MLP ETF is not suitable for all investors. Investments in the Fund are subject to investment risks, including possible loss of the principal amount invested.
ALPS Portfolio Solutions Distributor, Inc., a FINRA member, is the distributor for the Fund.
2 | November 30, 2023
Alerian MLP ETF
| Performance Overview | November 30, 2023 (Unaudited) |
Top 10 Holdings* (as of November 30, 2023)
| Energy Transfer LP | 18.90% |
| Plains All American Pipeline LP | 13.99% |
| MPLX LP | 13.69% |
| Enterprise Products Partners LP | 13.10% |
| Western Midstream Partners LP | 13.09% |
| EnLink Midstream LLC | 7.51% |
| Cheniere Energy Partners LP | 5.64% |
| Hess Midstream LP | 4.96% |
| NuStar Energy LP | 4.95% |
| Genesis Energy LP | 3.09% |
| Total % of Top 10 Holdings | 98.92% |
Future holdings are subject to change.
Growth of $10,000 (as of November 30, 2023)
Comparison of change in value of a $10,000 investment in the Fund and the Indexes
The chart above compares historical performance of a hypothetical investment of $10,000 in the Fund over the past ten years with the performance of the Fund’s benchmark index. Results include the reinvestment of all dividends and capital gains distributions. Past performance does not guarantee future results. The chart does not reflect the deduction of taxes that a shareholder would pay on Fund distributions or the redemption of Fund shares.
3 | November 30, 2023
Alerian Energy Infrastructure ETF
| Performance Overview | November 30, 2023 (Unaudited) |
INVESTMENT OBJECTIVE
The Alerian Energy Infrastructure ETF (the “Fund” or “ENFR”) seeks investment results that correspond (before fees and expenses) generally to the price and yield performance of its underlying index, the Alerian Midstream Energy Select Index (the “Underlying Index” or “AMEI”). As a secondary objective, the Fund seeks to provide total return through income and capital appreciation. The Shares of the Fund are listed and trade on the NYSE Arca, Inc. (“NYSE”) under the ticker symbol ENFR. The Fund will normally invest at least 90% of its total assets in securities that comprise the Underlying Index.
The Underlying Index is a composite of North American energy infrastructure companies engaged in midstream activities involving energy commodities, including gathering and processing, liquefaction, pipeline transportation, rail terminaling, and storage (also known as “midstream energy businesses”). Midstream energy companies include midstream Master Limited Partnerships ("MLPs") and midstream corporations, either based in the United States or Canada. The Underlying Index has a 25% limit for companies taxed as pass-through entities.
PERFORMANCE OVERVIEW
During the twelve-month period from December 1, 2022, to November 30, 2023, the Fund delivered a total return of 8.48% (8.63% NAV). This compares to the Fund’s Underlying Index, which increased 2.50% on a price-return basis and 9.23% on a total-return basis.
During the period, the Fund paid four quarterly distributions:
| · | $0.31493 per share on February 14, 2023 |
| · | $0.30782 per share on May 16, 2023 |
| · | $0.32030 per share on August 15, 2023 |
| · | $0.32156 per share on November 14, 2023 |
AMEI constituents largely increased their dividends during the fiscal year. It has been nine consecutive quarters since there was a dividend cut from an AMEI constituent. Comparing the latest dividend announcements for the third calendar quarter of 2023 (paid in the fourth calendar quarter of 2023) with the payouts from the same period in 2022, 90.62% of the Underlying Index by weighting grew their dividends and 8.66% maintained their payouts based on weightings through November 30, 2023. Constituents that do not pay a dividend accounted for 0.72% of the Underlying Index.
During the fiscal year, Delek Logistics (DKL) was removed from the Underlying Index during a quarterly rebalancing. Magellan Midstream Partners (MMP), Crestwood Equity Partners (CEQP), and Holly Energy Partners (HEP) were also removed from the Underlying Index in relation to their acquisition by another entity. There were no material changes to the methodology for the Underlying Index during the Fund's fiscal year.
Energy infrastructure outperformed the broad energy sector as represented by the Energy Select Sector Index (IXE) during the Fund's fiscal year as fee-based business models and more generous yields were supportive for AMEI’s performance amid weaker oil and natural gas prices. Energy infrastructure also generally outperformed other income investments that may have been more challenged by rising interest rates, including REITs, utilities, and the corporate bond benchmark. Returns among AMEI constituents were mixed as MLPs generally led and Canadian corporations largely lagged.
Looking ahead, Alerian believes the vast majority of AMEI constituents are well positioned to continue generating free cash flow regardless of the commodity price environment. Alerian expects excess cash flow to support ongoing dividend growth and share repurchases in 2024 and beyond. AMEI constituents continue to opportunistically invest in clean energy solutions, including carbon capture, hydrogen, and renewable fuels. While the macro outlook may be clouded with uncertainty, Alerian believes that energy infrastructure’s fee-based business models and more defensive qualities should help the space through periods of market volatility.
4 | November 30, 2023
Alerian Energy Infrastructure ETF
| Performance Overview | November 30, 2023 (Unaudited) |
Performance (as of November 30, 2023)
| | 1 Year | 5 Year | 10 Year | Since Inception^ |
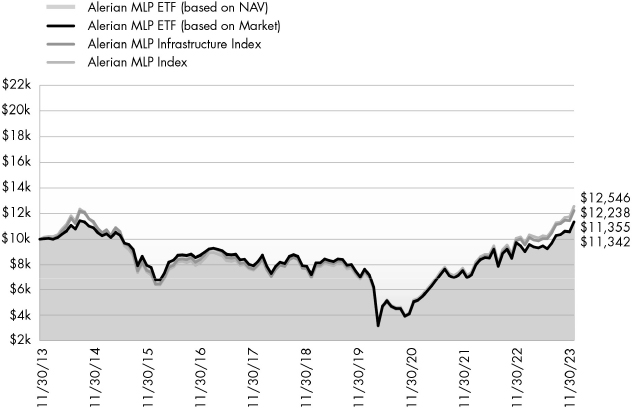
| Alerian Energy Infrastructure ETF - NAV | 8.63% | 9.69% | 4.11% | 4.02% |
| Alerian Energy Infrastructure ETF - Market Price* | 8.48% | 9.72% | 4.10% | 4.02% |
| Alerian Midstream Energy Select Index | 9.23% | 10.60% | 4.97% | 4.89% |
| Alerian MLP Index | 23.29% | 10.33% | 2.29% | 2.36% |
Total Expense Ratio (per the current prospectus) is 0.35%.
Performance data quoted represents past performance. Past performance does not guarantee future results. Total return figures assume reinvestment of dividends and capital gains distributions, if any. The table does not reflect the deduction of taxes that a shareholder would pay on Fund distributions or the redemption of Fund shares. Investment return and principal value of an investment will fluctuate so that an investor’s shares, when sold or redeemed, may be worth more or less than the original cost. Current performance data may be higher or lower than actual data quoted. For most current month-end performance data please visit www.alpsfunds.com or call 1.866.759.5679.
Net Asset Value (NAV) is an exchange-traded fund’s per-share value. The per-share dollar amount of the Fund is derived by dividing the total value of all the securities in its portfolio, less any liabilities, by the number of Fund shares outstanding. Market Price is the price at which a share can currently be traded in the market. Information detailing the number of days the Market Price of the Fund was greater than the Fund’s NAV and the number of days it was less than the Fund’s NAV can be obtained at www.alpsfunds.com.
| ^ | The Fund commenced Investment Operations on November 1, 2013. |
| * | Market Price means the official closing price of a share or, if it more accurately reflects the market value of a share at the time as of which the Fund calculates current net asset value per share, the price that is the midpoint of the bid-ask spread as of that time. It does not represent the returns an investor would receive if shares were traded at other times. |
The Alerian Midstream Energy Select Index is comprised of 25 equity securities of issuers headquartered or incorporated in the United States and Canada that engage in the transportation, storage, and processing of energy commodities. Total return assumes reinvestment of any dividends and distributions realized during a given time period.
The Alerian MLP Index is recognized as a leading gauge of energy infrastructure Master Limited Partnerships (MLPs). The capped, float-adjusted, capitalization-weighted index, whose constituents earn the majority of their cash flow from midstream activities involving energy commodities, is reported on a total-return basis (AMZX), which assumes reinvestment of any dividends and distributions realized during a given period.
The indexes are not actively managed and do not reflect any deductions for fees, expenses or taxes. One cannot invest directly in an index. Index performance does not reflect fund performance.
The Fund’s shares are not individually redeemable. Investors buy and sell shares of the Fund on a secondary market. Only market makers or “authorized participants” may trade directly with the Fund, typically in blocks of 25,000 shares.
The Alerian Energy Infrastructure ETF is not suitable for all investors. Investments in the Fund are subject to investment risks, including possible loss of the principal amount invested.
ALPS Portfolio Solutions Distributor, Inc., a FINRA member, is the distributor for the Fund.
5 | November 30, 2023
Alerian Energy Infrastructure ETF
| Performance Overview | November 30, 2023 (Unaudited) |
Top 10 Holdings* (as of November 30, 2023)
| Enbridge, Inc. | 8.99% |
| Energy Transfer LP | 8.62% |
| Enterprise Products Partners LP | 8.10% |
| ONEOK, Inc. | 8.07% |
| Cheniere Energy, Inc. | 5.86% |
| The Williams Cos., Inc. | 5.69% |
| Targa Resources Corp. | 4.87% |
| Keyera Corp. | 4.86% |
| Pembina Pipeline Corp. | 4.84% |
| TC Energy Corp. | 4.84% |
| Total % of Top 10 Holdings | 64.74% |
Future holdings are subject to change.
Growth of $10,000 (as of November 30, 2023)
Comparison of change in value of a $10,000 investment in the Fund and the Indexes
The chart above compares historical performance of a hypothetical investment of $10,000 in the Fund over the past ten years with the performance of the Fund’s benchmark index. Results include the reinvestment of all dividends and capital gains distributions. Past performance does not guarantee future results. The chart does not reflect the deduction of taxes that a shareholder would pay on Fund distributions or the redemption of Fund shares.
6 | November 30, 2023
Alerian Exchange Traded Funds
| Disclosure of Fund Expenses | November 30, 2023 (Unaudited) |
Shareholder Expense Example: As a shareholder of a Fund, you incur certain ongoing costs, including management fees and other Fund expenses. These examples are intended to help you understand your ongoing costs (in dollars) of investing in the Fund and to compare these costs with the ongoing costs of investing in other funds. It is based on an investment of $1,000 invested at the beginning of the six month period and held through November 30, 2023.
Actual Return: The first line of the table provides information about actual account values and actual expenses. You may use the information in this line, together with the amount you invested, to estimate the expenses that you incurred over the period. Simply divide your account value by $1,000 (for example, an $8,600 account value divided by $1,000 = 8.6), then multiply the result by the number in the first line under the heading entitled “Expenses Paid During Period” to estimate the expenses attributable to your investment during this period.
Hypothetical 5% Return: The second line of the table provides information about hypothetical account values and hypothetical expenses based on the Fund’s actual expense ratio and an assumed rate of return of 5% per year before expenses, which is not the Fund’s actual return. The hypothetical account values and expenses may not be used to estimate the actual ending account balance or expenses you paid for the period. You may use this information to compare ongoing costs of investing in the Fund and other funds. To do so, compare this 5% hypothetical example with the 5% hypothetical examples that appear in the shareholder reports of other funds.
The expenses shown in the table are meant to highlight ongoing Fund costs only and do not reflect any transaction costs, such as brokerage commissions and other fees to financial intermediaries. Therefore, the second line is useful in comparing ongoing costs only, and will not help you determine the relative total costs of owning different funds. In addition, if these costs were included, your costs would have been higher.
| | Beginning Account Value 6/1/23 | Ending Account Value 11/30/23 | Expense Ratio(a) | Expenses Paid During Period 6/1/23 - 11/30/23 (b) |
| Alerian MLP ETF(c) | | | | |
| Actual | $1,000.00 | $1,228.60 | 0.85% | $4.75 |
| Hypothetical (5% return before expenses) | $1,000.00 | $1,020.81 | 0.85% | $4.31 |
| Alerian Energy Infrastructure ETF | | | | |
| Actual | $1,000.00 | $1,172.70 | 0.35% | $1.91 |
| Hypothetical (5% return before expenses) | $1,000.00 | $1,023.31 | 0.35% | $1.78 |
| (a) | Annualized, based on the Fund's most recent fiscal half-year expenses. |
| (b) | Expenses are equal to the Fund's annualized expense ratio multiplied by the average account value over the period, multiplied by the number of days in the most recent fiscal half year (183), divided by 365. |
| (c) | Expenses for Alerian MLP ETF are calculated using the Fund's annualized net expense ratio, which represents the ongoing expenses of the Fund. Current and deferred tax benefit (expense) is not included in the ratio calculation. |
7 | November 30, 2023
Alerian Exchange Traded Funds
Report of Independent Registered Public Accounting Firm
To the Shareholders of Alerian MLP ETF and Alerian Energy Infrastructure ETF and Board of Trustees of ALPS ETF Trust
Opinion on the Financial Statements
We have audited the accompanying statements of assets and liabilities, including the schedules of investments, of Alerian MLP ETF and Alerian Energy Infrastructure ETF (the “Funds”), each a series of ALPS ETF Trust, as of November 30, 2023, the related statements of operations and changes in net assets, the related notes, and the financial highlights for the year then ended (collectively referred to as the “financial statements”). In our opinion, the financial statements present fairly, in all material respects, the financial position of each of the Funds as of November 30, 2023, the results of their operations, the changes in net assets, and the financial highlights for the year then ended, in conformity with accounting principles generally accepted in the United States of America.
The Funds’ financial statements and financial highlights for the years ended November 30, 2022, and prior, were audited by other auditors whose report dated January 27, 2023, expressed an unqualified opinion on those financial statements and financial highlights.
Basis for Opinion
These financial statements are the responsibility of the Funds’ management. Our responsibility is to express an opinion on the Funds’ financial statements based on our audits. We are a public accounting firm registered with the Public Company Accounting Oversight Board (United States) (“PCAOB”) and are required to be independent with respect to the Funds in accordance with the U.S. federal securities laws and the applicable rules and regulations of the Securities and Exchange Commission and the PCAOB.
We conducted our audits in accordance with the standards of the PCAOB. Those standards require that we plan and perform the audit to obtain reasonable assurance about whether the financial statements are free of material misstatement whether due to error or fraud.
Our audits included performing procedures to assess the risks of material misstatement of the financial statements, whether due to error or fraud, and performing procedures that respond to those risks. Such procedures included examining, on a test basis, evidence regarding the amounts and disclosures in the financial statements. Our procedures included confirmation of securities owned as of November 30, 2023, by correspondence with the custodian and brokers; when replies were not received from brokers, we performed other auditing procedures. Our audits also included evaluating the accounting principles used and significant estimates made by management, as well as evaluating the overall presentation of the financial statements. We believe that our audits provide a reasonable basis for our opinion.
We have served as the auditor of one or more investment companies advised by ALPS Advisors, Inc. since 2013.

COHEN & COMPANY, LTD.
Philadelphia, Pennsylvania
January 29, 2024
8 | November 30, 2023
Alerian MLP ETF
| Schedule of Investments | November 30, 2023 |
| Security Description | | Shares | | | Value | |
| MASTER LIMITED PARTNERSHIPS (104.28%) | | | | | | | | |
| Gathering + Processing (26.66%) | | | | | | | | |
| EnLink Midstream LLC(a) | | | 42,966,669 | | | $ | 587,354,365 | |
| Hess Midstream LP, Class A | | | 11,918,456 | | | | 387,826,559 | |
| Western Midstream Partners LP(a) | | | 34,352,132 | | | | 1,024,380,576 | |
| Total Gathering + Processing | | | | | | | 1,999,561,500 | |
| | | | | | | | | |
| Liquefaction (5.89%) | | | | | | | | |
| Cheniere Energy Partners LP | | | 7,149,938 | | | | 441,437,172 | |
| | | | | | | | | |
| Pipeline Transportation | Natural Gas (33.38%) | | | | | | | | |
| Energy Transfer LP | | | 106,447,715 | | | | 1,478,558,761 | |
| Enterprise Products Partners LP | | | 38,261,519 | | | | 1,024,643,479 | |
| Total Pipeline Transportation | Natural Gas | | | | | | | 2,503,202,240 | |
| | | | | | | | | |
| Pipeline Transportation | Petroleum (38.35%) | | | | | | | | |
| Delek Logistics Partners LP | | | 1,577,055 | | | | 80,682,134 | |
| Genesis Energy LP(a) | | | 19,258,907 | | | | 241,891,872 | |
| MPLX LP | | | 29,386,910 | | | | 1,071,446,738 | |
| NuStar Energy LP(a) | | | 20,352,065 | | | | 387,503,318 | |
| Plains All American Pipeline LP(a) | | | 68,927,828 | | | | 1,094,573,909 | |
| Total Pipeline Transportation | Petroleum | | | | | | | 2,876,097,971 | |
| | | | | | | | | |
| TOTAL MASTER LIMITED PARTNERSHIPS | | | | | | | | |
| (Cost $4,126,266,441) | | | | | | | 7,820,298,883 | |
| | | 7 Day Yield | | | Shares | | | Value | |
| SHORT TERM INVESTMENTS (0.05%) | | | | | | | | | | | | |
| Money Market Fund (0.05%) | | | | | | | | | | | | |
| State Street Institutional Treasury Plus Money Market Fund - Premier Class | | | 5.31 | % | | | 4,014,921 | | | | 4,014,921 | |
| | | | | | | | | | | | | |
| TOTAL SHORT TERM INVESTMENTS | | | | | | | | | | | | |
| (Cost $4,014,921) | | | | | | | | | | | 4,014,921 | |
| | | | | | | | | | | | | |
| TOTAL INVESTMENTS (104.33%) | | | | | | | | | | | | |
| (Cost $4,130,281,362) | | | | | | | | | | $ | 7,824,313,804 | |
| LIABILITIES IN EXCESS OF OTHER ASSETS (-4.33%) | | | | | | | | | | | (324,504,558 | ) |
| NET ASSETS - 100.00% | | | | | | | | | | $ | 7,499,809,246 | |
| (a) | Affiliated Company. See Note 8 in Notes to Financial Statement. |
See Notes to Financial Statements.
9 | November 30, 2023
Alerian MLP ETF
| Statement of Assets and Liabilities | November 30, 2023 |
| ASSETS: | | | |
| Investments, at value | | $ | 4,488,609,764 | |
| Investments in affiliates, at value | | | 3,335,704,040 | |
| Receivable for investments sold | | | 161,622,270 | |
| Receivable for shares sold | | | 16,402,778 | |
| Franchise tax receivable | | | 316,704 | |
| Total Assets | | | 8,002,655,556 | |
| | | | | |
| LIABILITIES: | | | | |
| Payable for investments purchased | | | 179,600,417 | |
| Income tax payable | | | 64,528,918 | |
| Deferred tax liability (Note 2) | | | 253,677,464 | |
| Payable to adviser | | | 5,039,511 | |
| Total Liabilities | | | 502,846,310 | |
| NET ASSETS | | $ | 7,499,809,246 | |
| | | | | |
| NET ASSETS CONSIST OF: | | | | |
| Paid-in capital | | $ | 8,309,052,387 | |
| Distributable earnings/(accumulated losses) | | | (809,243,141 | ) |
| NET ASSETS | | $ | 7,499,809,246 | |
| | | | | |
| INVESTMENTS, AT COST | | $ | 2,548,589,686 | |
| INVESTMENTS IN AFFILIATES, AT COST | | | 1,581,691,676 | |
| | | | | |
| PRICING OF SHARES | | | | |
| Net Assets | | $ | 7,499,809,246 | |
| Shares of beneficial interest outstanding (Unlimited number of shares authorized, par value $0.01 per share) | | | 169,807,420 | |
| Net Asset Value, offering and redemption price per share | | $ | 44.17 | |
See Notes to Financial Statements.
10 | November 30, 2023
Alerian MLP ETF
| Statement of Operations | For the Year Ended November 30, 2023 |
| INVESTMENT INCOME: | | | |
| Distributions from master limited partnerships | | $ | 566,931,504 | |
| Less return of capital distributions | | | (553,790,971 | ) |
| Total Investment Income | | | 13,140,533 | |
| | | | | |
| EXPENSES: | | | | |
| Investment adviser fee | | | 56,321,212 | |
| Total Expenses | | | 56,321,212 | |
| NET INVESTMENT LOSS, BEFORE INCOME TAXES | | | (43,180,679 | ) |
| Current income tax benefit/(expense) | | | 3,827,390 | |
| NET INVESTMENT LOSS | | | (39,353,289 | ) |
| | | | | |
| REALIZED AND UNREALIZED GAIN/(LOSS): | | | | |
| Net realized loss on investments, before income taxes | | | (7,937,034 | ) |
| Net realized gain on affiliated investments, before income taxes | | | 1,071,129,432 | |
| Current income tax benefit/(expense) | | | (94,214,313 | ) |
| Net realized gain | | | 968,978,085 | |
| Net change in unrealized appreciation on investments, before income taxes | | | 639,433,193 | |
| Net change in unrealized depreciation on affiliated investments, before income taxes | | | (286,982,580 | ) |
| Deferred income tax benefit/(expense) | | | (31,263,528 | ) |
| Net change in unrealized appreciation | | | 321,187,085 | |
| NET REALIZED AND UNREALIZED GAIN ON INVESTMENTS | | | 1,290,165,170 | |
| NET INCREASE IN NET ASSETS RESULTING FROM OPERATIONS | | $ | 1,250,811,881 | |
See Notes to Financial Statements.
11 | November 30, 2023
Alerian MLP ETF
Statements of Changes in Net Assets
| | | For the Year Ended November 30, 2023 | | | For the Year Ended November 30, 2022 | |
| OPERATIONS: | | | | | | |
| Net investment loss | | $ | (39,353,289 | ) | | $ | (46,268,407 | ) |
| Net realized gain | | | 968,978,085 | | | | 48,112,230 | |
| Net change in unrealized appreciation | | | 321,187,085 | | | | 1,771,005,372 | |
| Net increase in net assets resulting from operations | | | 1,250,811,881 | | | | 1,772,849,195 | |
| | | | | | | | | |
| DISTRIBUTIONS TO SHAREHOLDERS: | | | | | | | | |
| From distributable earnings | | | (559,281,783 | ) | | | – | |
| From tax return of capital | | | – | | | | (491,866,741 | ) |
| Total distributions | | | (559,281,783 | ) | | | (491,866,741 | ) |
| | | | | | | | | |
| CAPITAL SHARE TRANSACTIONS: | | | | | | | | |
| Proceeds from sale of shares | | | 1,459,261,841 | | | | 2,448,152,574 | |
| Cost of shares redeemed | | | (1,330,182,900 | ) | | | (2,030,110,111 | ) |
| Net increase from share transactions | | | 129,078,941 | | | | 418,042,463 | |
| | | | | | | | | |
| Net increase in net assets | | | 820,609,039 | | | | 1,699,024,917 | |
| | | | | | | | | |
| NET ASSETS: | | | | | | | | |
| Beginning of year | | | 6,679,200,207 | | | | 4,980,175,290 | |
| End of year | | $ | 7,499,809,246 | | | $ | 6,679,200,207 | |
| | | | | | | | | |
| OTHER INFORMATION: | | | | | | | | |
| SHARE TRANSACTIONS: | | | | | | | | |
| Beginning shares | | | 166,932,420 | | | | 157,457,420 | |
| Shares sold | | | 36,325,000 | | | | 64,300,000 | |
| Shares redeemed | | | (33,450,000 | ) | | | (54,825,000 | ) |
| Shares outstanding, end of year | | | 169,807,420 | | | | 166,932,420 | |
See Notes to Financial Statements.
12 | November 30, 2023
Alerian MLP ETF
| Financial Highlights | For a Share Outstanding Throughout the Periods Presented |
| | | For the Year
Ended
November 30,
2023 (a) | | | For the Year
Ended
November 30, 2022 | | | For the Year
Ended
November 30, 2021 | | | For the Year
Ended
November 30, 2020 (a) | | | For the
Year Ended
November 30, 2019 (a) | |
| NET ASSET VALUE, BEGINNING OF PERIOD | | $ | 40.01 | | | $ | 31.63 | | | $ | 25.02 | | | $ | 39.15 | | | $ | 47.75 | |
| | | | | | | | | | | | | | | | | | | | | |
| INCOME/(LOSS) FROM OPERATIONS: | | | | | | | | | | | | | | | | | | | | |
| Net investment loss(b) | | | (0.24 | ) | | | (0.28 | ) | | | (0.27 | ) | | | (0.24 | ) | | | (0.35 | ) |
| Net realized and unrealized gain/(loss) on investments | | | 7.74 | | | | 11.59 | | | | 9.68 | | | | (10.73 | ) | | | (4.35 | ) |
| Total from investment operations | | | 7.50 | | | | 11.31 | | | | 9.41 | | | | (10.97 | ) | | | (4.70 | ) |
| | | | | | | | | | | | | | | | | | | | | |
| DISTRIBUTIONS: | | | | | | | | | | | | | | | | | | | | |
| Distributions from Income | | | (3.34 | ) | | | – | | | | – | | | | – | | | | – | |
| From tax return of capital | | | – | | | | (2.93 | ) | | | (2.80 | ) | | | (3.16 | ) | | | (3.90 | ) |
| Total distributions | | | (3.34 | ) | | | (2.93 | ) | | | (2.80 | ) | | | (3.16 | ) | | | (3.90 | ) |
| | | | | | | | | | | | | | | | | | | | | |
| NET INCREASE/(DECREASE) IN NET ASSET VALUE | | | 4.16 | | | | 8.38 | | | | 6.61 | | | | (14.13 | ) | | | (8.60 | ) |
| NET ASSET VALUE, END OF PERIOD | | $ | 44.17 | | | $ | 40.01 | | | $ | 31.63 | | | $ | 25.02 | | | $ | 39.15 | |
| TOTAL RETURN(c) | | | 19.82 | % | | | 36.31 | % | | | 37.97 | % | | | (28.36 | )% | | | (10.79 | )% |
| | | | | | | | | | | | | | | | | | | | | |
| RATIOS/SUPPLEMENTAL DATA: | | | | | | | | | | | | | | | | | | | | |
| Net assets, end of period (000s) | | $ | 7,499,809 | | | $ | 6,679,200 | | | $ | 4,980,175 | | | $ | 3,880,137 | | | $ | 7,249,005 | |
| | | | | | | | | | | | | | | | | | | | | |
| RATIO TO AVERAGE NET ASSETS: | | | | | | | | | | | | | | | | | | | | |
| Expenses (excluding net current and deferred tax expenses/benefits and franchise tax expense) | | | 0.85 | % | | | 0.85 | % | | | 0.85 | % | | | 0.85 | % | | | 0.85 | % |
| Expenses (including current and deferred tax expenses/benefits)(d) | | | 0.79 | % | | | 0.74 | % | | | 0.85 | % | | | 0.85 | % | | | 0.85 | % |
| Expenses (including net current and deferred tax expenses/benefits)(e) | | | 2.67 | % | | | 5.03 | % | | | 0.87 | % | | | 0.90 | % | | | 0.87 | % |
| Net investment loss (excluding deferred tax expenses/benefits and franchise tax expense) | | | (0.65 | )% | | | (0.85 | )% | | | (0.85 | )% | | | (0.85 | )% | | | (0.77 | )% |
| Net investment loss (including deferred tax expenses/benefits)(d) | | | (0.59 | )% | | | (0.74 | )% | | | (0.85 | )% | | | (0.85 | )% | | | (0.77 | )% |
| PORTFOLIO TURNOVER RATE(f) | | | 40 | % | | | 26 | % | | | 20 | % | | | 23 | % | | | 34 | % |
| (a) | On May 18, 2020, the Alerian MLP ETF underwent a one for five reverse stock split. The capital share activity presented here has been retroactively adjusted to reflect this reverse split. |
| (b) | Based on average shares outstanding during the period. |
| (c) | Total return is calculated assuming an initial investment made at the net assets value at the beginning of the period and redemption at the net asset value on the last day of the period and assuming all distributions are reinvested at actual reinvestment prices. Total return calculated for a period of less than one year is not annualized. |
| (d) | Includes amount of current and deferred tax benefit associated with net investment income/(loss). |
| (e) | Includes amount of current and deferred taxes/benefits for all components of the Statement of Operations. |
| (f) | Portfolio turnover for periods less than one year is not annualized and does not include securities received or delivered from processing creations or redemptions in-kind. |
See Notes to Financial Statements.
13 | November 30, 2023
Alerian Energy Infrastructure ETF
| Schedule of Investments | November 30, 2023 |
| Security Description | | Shares | | | Value | |
| CANADIAN ENERGY INFRASTRUCTURE COMPANIES (25.58%) | | | | | | | | |
| Gathering + Processing (4.86%) | | | | | | | | |
| Keyera Corp. | | | 255,451 | | | $ | 6,432,633 | |
| | | | | | | | | |
| Pipeline Transportation | Natural Gas (4.84%) | | | | | | | | |
| TC Energy Corp.(a) | | | 170,697 | | | | 6,401,688 | |
| | | | | | | | | |
| Pipeline Transportation | Petroleum (13.83%) | | | | | | | | |
| Enbridge, Inc. | | | 340,568 | | | | 11,891,456 | |
| Pembina Pipeline Corp. | | | 191,503 | | | | 6,405,779 | |
| Total Pipeline Transportation | Petroleum | | | | | | | 18,297,235 | |
| | | | | | | | | |
| Storage (2.05%) | | | | | | | | |
| Gibson Energy, Inc.(a) | | | 179,410 | | | | 2,707,776 | |
| | | | | | | | | |
| TOTAL CANADIAN ENERGY INFRASTRUCTURE COMPANIES | | | | | | | | |
| (Cost $34,984,145) | | | | | | | 33,839,332 | |
| Security Description | | Shares | | | Value | |
| EXCHANGE TRADED FUND (1.04%) | | | | | | | | |
| Exchange Traded Fund (1.04%) | | | | | | | | |
| Energy Select Sector SPDR Fund | | | 16,220 | | | | 1,371,888 | |
| | | | | | | | | |
| TOTAL EXCHANGE TRADED FUND | | | | | | | | |
| (Cost $1,372,009) | | | | | | | 1,371,888 | |
| Security Description | | Shares | | | Value | |
| U.S. ENERGY INFRASTRUCTURE COMPANIES (33.14%) | | | | | | | | |
| Gathering + Processing (13.38%) | | | | | | | | |
| Kinetik Holdings, Inc. | | | 16,022 | | | | 582,560 | |
| ONEOK, Inc. | | | 155,023 | | | | 10,673,333 | |
| Targa Resources Corp. | | | 71,184 | | | | 6,438,593 | |
| Total Gathering + Processing | | | | | | | 17,694,486 | |
| | | | | | | | | |
| Liquefaction (6.57%) | | | | | | | | |
| Cheniere Energy, Inc. | | | 42,589 | | | | 7,757,586 | |
| NextDecade Corp.(a)(b) | | | 114,052 | | | | 569,120 | |
| Tellurian, Inc.(a)(b) | | | 610,629 | | | | 371,873 | |
| Total Liquefaction | | | | | | | 8,698,579 | |
| | | | | | | | | |
| Pipeline Transportation | Natural Gas (13.19%) | | | | | | | | |
| DT Midstream, Inc. | | | 108,448 | | | | 6,212,986 | |
| Equitrans Midstream Corp. | | | 516,335 | | | | 4,843,222 | |
| Kinder Morgan, Inc. | | | 363,949 | | | | 6,394,584 | |
| Total Pipeline Transportation | Natural Gas | | | | | | | 17,450,792 | |
| | | | | | | | | |
| TOTAL U.S. ENERGY INFRASTRUCTURE COMPANIES | | | | | | | | |
| (Cost $37,577,001) | | | | | | | 43,843,857 | |
| Security Description | | Shares | | | Value | |
| U.S. ENERGY INFRASTRUCTURE MLPS (23.14%) | | | | | | | | |
| Gathering + Processing (5.69%) | | | | | | | | |
| Hess Midstream LP, Class A | | | 75,089 | | | $ | 2,443,396 | |
| MPLX LP | | | 96,165 | | | | 3,506,176 | |
| Western Midstream Partners LP | | | 52,796 | | | | 1,574,377 | |
| Total Gathering + Processing | | | | | | | 7,523,949 | |
| | | | | | | | | |
| Pipeline Transportation | Natural Gas (16.72%) | | | | | | | | |
| Energy Transfer LP | | | 820,803 | | | | 11,400,953 | |
| Enterprise Products Partners LP | | | 400,101 | | | | 10,714,705 | |
| Total Pipeline Transportation | Natural Gas | | | | | | | 22,115,658 | |
| | | | | | | | | |
| Pipeline Transportation | Petroleum (0.73%) | | | | | | | | |
| Genesis Energy LP | | | 29,567 | | | | 371,361 | |
| NuStar Energy LP | | | 31,316 | | | | 596,257 | |
| Total Pipeline Transportation | Petroleum | | | | | | | 967,618 | |
| | | | | | | | | |
| TOTAL U.S. ENERGY INFRASTRUCTURE MLPS | | | | | | | | |
| (Cost $26,820,584) | | | | | | | 30,607,225 | |
| Security Description | | Shares | | | Value | |
| U.S. GENERAL PARTNERS (17.12%) | | | | | | | | |
| Gathering + Processing (12.30%) | | | | | | | | |
| Antero Midstream Corp. | | | 377,592 | | | | 5,029,525 | |
| EnLink Midstream LLC | | | 271,389 | | | | 3,709,888 | |
| The Williams Cos., Inc. | | | 204,542 | | | | 7,525,100 | |
| Total Gathering + Processing | | | | | | | 16,264,513 | |
| | | | | | | | | |
| Pipeline Transportation | Petroleum (4.82%) | | | | | | | | |
| Plains GP Holdings LP, Class A | | | 394,836 | | | | 6,380,550 | |
| TOTAL U.S. GENERAL PARTNERS | | | | | | | | |
| (Cost $16,839,645) | | | | | | | 22,645,063 | |
See Notes to Financial Statements.
14 | November 30, 2023
Alerian Energy Infrastructure ETF
| Schedule of Investments | November 30, 2023 |
| | | 7 Day Yield | | | Shares | | | Value | |
| SHORT TERM INVESTMENTS (1.65%) | | | | | | | | | | | | |
| Money Market Fund (0.02%) | | | | | | | | | | | | |
| State Street Institutional Treasury Plus Money Market Fund (Premier Class) | | | | | | | | | | | | |
| (Cost $23,088) | | | 5.31 | % | | | 23,088 | | | $ | 23,088 | |
| | | | | | | | | | | | | |
| Investments Purchased with Collateral from Securities Loaned (1.63%) | | | | | | | | | | | | |
| State Street Navigator Securities Lending Government Money Market Portfolio, 5.37% | | | | | | | | | | | | |
| (Cost $2,154,762) | | | | | | | 2,154,762 | | | $ | 2,154,762 | |
| TOTAL SHORT TERM INVESTMENTS | | | | | | | | | | | | |
| (Cost $2,177,850) | | | | | | | | | | | 2,177,850 | |
| | | | | | | | | | | | | |
| TOTAL INVESTMENTS (101.67%) | | | | | | | | | | | | |
| (Cost $119,771,234) | | | | | | | | | | $ | 134,485,215 | |
| LIABILITIES IN EXCESS OF OTHER ASSETS (-1.67%) | | | | | | | | | | | (2,211,014 | ) |
| NET ASSETS - 100.00% | | | | | | | | | | $ | 132,274,201 | |
| (a) | Security, or a portion of the security position is currently on loan. The total market value of securities on loan is $2,518,665. |
| (b) | Non-income producing security. |
See Notes to Financial Statements.
15 | November 30, 2023
Alerian Energy Infrastructure ETF
| Statement of Assets and Liabilities | November 30, 2023 |
| ASSETS: | | | |
| Investments, at value* | | $ | 134,485,215 | |
| Receivable for investments sold | | | 1,359,137 | |
| Receivable for shares sold | | | 1,142,626 | |
| Dividends receivable | | | 186,476 | |
| Total Assets | | | 137,173,454 | |
| | | | | |
| LIABILITIES: | | | | |
| Payable for investments purchased | | | 2,708,255 | |
| Payable to adviser | | | 36,236 | |
| Payable for collateral upon return of securities loaned | | | 2,154,762 | |
| Total Liabilities | | | 4,899,253 | |
| NET ASSETS | | $ | 132,274,201 | |
| | | | | |
| NET ASSETS CONSIST OF: | | | | |
| Paid-in capital | | $ | 119,835,434 | |
| Distributable earnings | | | 12,438,767 | |
| NET ASSETS | | $ | 132,274,201 | |
| | | | | |
| INVESTMENTS, AT COST | | $ | 119,771,234 | |
| | | | | |
| PRICING OF SHARES | | | | |
| Net Assets | | $ | 132,274,201 | |
| Shares of beneficial interest outstanding (Unlimited number of shares authorized, par value $0.01 per share) | | | 5,700,000 | |
| Net Asset Value, offering and redemption price per share | | $ | 23.21 | |
| * | Includes $2,518,665 of securities on loan. |
See Notes to Financial Statements.
16 | November 30, 2023
Alerian Energy Infrastructure ETF
| Statement of Operations | For the Year Ended November 30, 2023 |
| INVESTMENT INCOME: | | | |
| Dividends* | | $ | 5,982,955 | |
| Securities lending income | | | 18,051 | |
| Total Investment Income | | | 6,001,006 | |
| | | | | |
| EXPENSES: | | | | |
| Investment adviser fees | | | 437,057 | |
| Total Expenses | | | 437,057 | |
| NET INVESTMENT INCOME | | | 5,563,949 | |
| | | | | |
| REALIZED AND UNREALIZED GAIN/(LOSS): | | | | |
| Net realized gain on investments(a) | | | 4,010,651 | |
| Net realized loss on foreign currency transactions | | | (5,038 | ) |
| Net realized gain | | | 4,005,613 | |
| Net change in unrealized depreciation on investments | | | (96,931 | ) |
| Net change in unrealized appreciation on translation of assets and liabilities denominated in foreign currencies | | | 3,763 | |
| Net change in unrealized depreciation | | | (93,168 | ) |
| NET REALIZED AND UNREALIZED GAIN ON INVESTMENTS AND FOREIGN CURRENCIES | | | 3,912,445 | |
| NET INCREASE IN NET ASSETS RESULTING FROM OPERATIONS | | $ | 9,476,394 | |
| * Net of foreign tax withholding. | | $ | 316,136 | |
| (a) | Includes realized gain or loss as a result of in-kind transactions (See Note 4 in Notes to Financial Statements). |
See Notes to Financial Statements.
17 | November 30, 2023
Alerian Energy Infrastructure ETF
Statements of Changes in Net Assets
| | | For the Year Ended November 30, 2023 | | | For the Year Ended November 30, 2022 | |
| OPERATIONS: | | | | | | | | |
| Net investment income | | $ | 5,563,949 | | | $ | 2,947,799 | |
| Net realized gain | | | 4,005,613 | | | | 803,934 | |
| Net change in unrealized appreciation/(depreciation) | | | (93,168 | ) | | | 17,050,272 | |
| Net increase in net assets resulting from operations | | | 9,476,394 | | | | 20,802,005 | |
| | | | | | | | | |
| DISTRIBUTIONS: | | | | | | | | |
| From distributable earnings | | | (1,902,116 | ) | | | (1,089,790 | ) |
| From tax return of capital | | | (5,303,713 | ) | | | (4,610,796 | ) |
| Total distributions | | | (7,205,829 | ) | | | (5,700,586 | ) |
| | | | | | | | | |
| CAPITAL SHARE TRANSACTIONS: | | | | | | | | |
| Proceeds from sale of shares | | | 8,337,471 | | | | 79,527,083 | |
| Cost of shares redeemed | | | (20,419,761 | ) | | | (12,029,422 | ) |
| Net increase/(decrease) from share transactions | | | (12,082,290 | ) | | | 67,497,661 | |
| Net increase/(decrease) in net assets | | | (9,811,725 | ) | | | 82,599,080 | |
| | | | | | | | | |
| NET ASSETS: | | | | | | | | |
| Beginning of year | | | 142,085,926 | | | | 59,486,846 | |
| End of year | | $ | 132,274,201 | | | $ | 142,085,926 | |
| | | | | | | | | |
| OTHER INFORMATION: | | | | | | | | |
| CAPITAL SHARE TRANSACTIONS: | | | | | | | | |
| Beginning shares | | | 6,275,000 | | | | 3,200,000 | |
| Shares sold | | | 375,000 | | | | 3,650,000 | |
| Shares redeemed | | | (950,000 | ) | | | (575,000 | ) |
| Shares outstanding, end of year | | | 5,700,000 | | | | 6,275,000 | |
See Notes to Financial Statements.
18 | November 30, 2023
Alerian Energy Infrastructure ETF
| Financial Highlights | For a Share Outstanding Throughout the Periods Presented |
| | | For the Year
Ended
November 30, 2023 | | | For the Year
Ended
November 30, 2022 | | | For the Year
Ended
November 30, 2021 | | | For the Year
Ended
November 30, 2020 | | | For the Year
Ended
November 30, 2019 | |
| NET ASSET VALUE, BEGINNING OF PERIOD | | $ | 22.64 | | | $ | 18.59 | | | $ | 14.51 | | | $ | 19.19 | | | $ | 20.34 | |
| | | | | | | | | | | | | | | | | | | | | |
| INCOME/(LOSS) FROM INVESTMENT OPERATIONS: | | | | | | | | | | | | | | | | | | | | |
| Net investment income(a) | | | 0.97 | | | | 0.61 | | | | 1.08 | | | | 0.90 | | | | 0.88 | |
| Net realized and unrealized gain/(loss) on investments | | | 0.86 | | | | 4.57 | | | | 4.49 | | | | (4.50 | ) | | | (0.64 | ) |
| Total from investment operations | | | 1.83 | | | | 5.18 | | | | 5.57 | | | | (3.60 | ) | | | 0.24 | |
| | | | | | | | | | | | | | | | | | | | | |
| DISTRIBUTIONS: | | | | | | | | | | | | | | | | | | | | |
| From net investment income | | | (0.33 | ) | | | (0.21 | ) | | | (0.74 | ) | | | (0.45 | ) | | | (0.50 | ) |
| Tax return of capital | | | (0.93 | ) | | | (0.92 | ) | | | (0.75 | ) | | | (0.63 | ) | | | (0.89 | ) |
| Total distributions | | | (1.26 | ) | | | (1.13 | ) | | | (1.49 | ) | | | (1.08 | ) | | | (1.39 | ) |
| | | | | | | | | | | | | | | | | | | | | |
| NET INCREASE/(DECREASE) IN NET ASSET VALUE | | | 0.57 | | | | 4.05 | | | | 4.08 | | | | (4.68 | ) | | | (1.15 | ) |
| NET ASSET VALUE, END OF PERIOD | | $ | 23.21 | | | $ | 22.64 | | | $ | 18.59 | | | $ | 14.51 | | | $ | 19.19 | |
| TOTAL RETURN(b) | | | 8.63 | % | | | 28.21 | % | | | 38.93 | % | | | (18.82 | )% | | | 1.09 | % |
| | | | | | | | | | | | | | | | | | | | | |
| RATIOS/SUPPLEMENTAL DATA: | | | | | | | | | | | | | | | | | | | | |
| Net assets, end of period (000s) | | $ | 132,274 | | | $ | 142,086 | | | $ | 59,487 | | | $ | 36,988 | | | $ | 51,809 | |
| Ratio of expenses to average net assets | | | 0.35 | % | | | 0.35 | % | | | 0.51 | %(c) | | | 0.65 | % | | | 0.65 | % |
| Ratio of net investment income to average net assets | | | 4.46 | % | | | 2.84 | % | | | 5.84 | % | | | 5.91 | % | | | 4.23 | % |
| PORTFOLIO TURNOVER RATE(d) | | | 28 | % | | | 26 | % | | | 34 | % | | | 34 | % | | | 26 | % |
| (a) | Based on average shares outstanding during the period. |
| (b) | Total return is calculated assuming an initial investment made at the net assets value at the beginning of the period and redemption at the net asset value on the last day of the period and assuming all distributions are reinvested at actual reinvestment prices. Total return calculated for a period of less than one year is not annualized. |
| (c) | Effective July 1, 2021, the Fund's Advisory Fee changed from 0.65% to 0.35%. |
| (d) | Portfolio turnover for periods less than one year is not annualized and does not include securities received or delivered from processing creations or redemptions in-kind. |
See Notes to Financial Statements.
19 | November 30, 2023
Alerian Exchange Traded Funds
| Notes to Financial Statements | November 30, 2023 |
1. ORGANIZATION
ALPS ETF Trust (the “Trust”), a Delaware statutory trust, is an open-end management investment company registered under the Investment Company Act of 1940, as amended (the “1940 Act”). As of November 30, 2023, the Trust consisted of twenty-three separate portfolios. Each portfolio represents a separate series of the Trust. This report pertains to the Alerian MLP ETF and the Alerian Energy Infrastructure ETF (each a “Fund” and collectively, the “Funds”).
The investment objective of the Alerian MLP ETF is to seek investment results that correspond (before fees and expenses) generally to the price and yield performance of its underlying index, the Alerian MLP Infrastructure Index. The investment objective of the Alerian Energy Infrastructure ETF is to seek investment results that correspond (before fees and expenses) generally to the price and yield performance of its underlying index, the Alerian Midstream Energy Select Index. The investment advisor uses a “passive management” or indexing investment approach to try to achieve each Fund’s investment objective. Each Fund is considered non-diversified and may invest a greater portion of assets in securities of individual issuers than a diversified fund. As a result, changes in the market value of a single investment could cause greater fluctuations in share price than would occur in a diversified fund.
Each Fund’s Shares (“Shares”) are listed on the NYSE Arca, Inc. (the “NYSE Arca”). Each Fund issues and redeems Shares, at net asset value (“NAV”), in blocks of 25,000 Shares, each of which is called a “Creation Unit”. Creation Units are issued and redeemed principally in-kind for securities included in the Underlying Index. Except when aggregated in Creation Units, Shares are not redeemable securities of the Fund.
Pursuant to the Trust’s organizational documents, its Officers and Trustees are indemnified against certain liability arising out of the performance of their duties to the Trust. Additionally, in the normal course of business, the Trust enters into contracts with service providers that contain general indemnification clauses. The Trust’s maximum exposure under these arrangements is unknown, as this would involve future claims that may be made against the Trust that have not yet occurred.
2. SIGNIFICANT ACCOUNTING POLICIES
The following is a summary of significant accounting policies consistently followed by the Funds in the preparation of the financial statements. The accompanying financial statements were prepared in accordance with accounting principles generally accepted in the United States of America (“U.S. GAAP”). The preparation of financial statements in conformity with U.S. GAAP requires management to make certain estimates and assumptions that affect the reported amounts of assets and liabilities and disclosures of contingent assets and liabilities at the date of the financial statements and the reported amounts of revenue and expenses during the period. Actual results could differ from those estimates. Each Fund is considered an investment company under U.S. GAAP and follows the accounting and reporting guidance applicable to investment companies in the Financial Accounting Standards Board (“FASB”) Accounting Standards Codification Topic 946.
A. Portfolio Valuation
Each Fund’s NAV is determined daily, as of the close of regular trading on the New York Stock Exchange (“NYSE”), normally 4:00 p.m. Eastern Time, on each day the NYSE is open for trading. The NAV is computed by dividing the value of all assets of the Fund (including accrued interest and dividends), less all liabilities (including accrued expenses and dividends declared but unpaid), by the total number of shares outstanding.
Portfolio securities listed on any exchange other than the NASDAQ Stock Market LLC (“NASDAQ”) are valued at the last sale price on the business day as of which such value is being determined. If there has been no sale on such day, the securities are valued at the mean of the most recent bid and ask prices on such day. Securities traded on the NASDAQ are valued at the NASDAQ Official Closing Price as determined by NASDAQ. Portfolio securities traded on more than one securities exchange are valued at the last sale price on the business day as of which such value is being determined at the close of the exchange representing the principal market for such securities. Portfolio securities traded in the over-the-counter market, but excluding securities traded on the NASDAQ, are valued at the last quoted sale price in such market.
The Funds’ investments are valued at market value or, in the absence of market value with respect to any portfolio securities, at fair value according to procedures adopted by the Trust’s Board of Trustees (the “Board”). Pursuant to Rule 2a-5 under the 1940 Act, the Board designated ALPS Advisors, Inc. (the "Adviser") as the valuation designee ("Valuation Designee") for each Fund to perform the fair value determinations relating to Fund investments. The Adviser may carry out its designated responsibilities as Valuation Designee through various teams and committees. When market quotations are not readily available or when events occur that make established valuation methods unreliable, securities of the Funds may be valued in good faith by the Valuation Designee. These securities generally include, but are not limited to, restricted securities (securities which may not be publicly sold without registration under the Securities Act of 1933) for which a pricing service is unable to provide a market price; securities whose trading has been formally suspended; a security whose market price is not available from a pre-established primary pricing source or the pricing source is not willing to provide a price; a security with respect to which an event has occurred that is most likely to materially affect the value of the
20 | November 30, 2023
Alerian Exchange Traded Funds
| Notes to Financial Statements | November 30, 2023 |
security after the market has closed but before the calculation of the Funds’ NAV or make it difficult or impossible to obtain a reliable market quotation; or a security whose price, as provided by the pricing service, does not reflect the security’s “fair value” due to the security being de-listed from a national exchange or the security’s primary trading market is temporarily closed at a time when, under normal conditions, it would be open. As a general principle, the current “fair value” of a security would be the amount which the owner might reasonably expect to receive from the sale on the applicable exchange or principal market. A variety of factors may be considered in determining the fair value of such securities.
B. Fair Value Measurements
Each Fund discloses the classification of its fair value measurements following a three-tier hierarchy based on the inputs used to measure fair value. Inputs refer broadly to the assumptions that market participants would use in pricing the asset or liability, including assumptions about risk. Inputs may be observable or unobservable. Observable inputs reflect the assumptions market participants would use in pricing the asset or liability that are developed based on market data obtained from sources independent of the reporting entity. Unobservable inputs reflect the reporting entity’s own assumptions about the assumptions market participants would use in pricing the asset or liability that are developed based on the best information available.
Valuation techniques used to value the Funds’ investments by major category are as follows:
Equity securities, including restricted securities, and Limited Partnerships for which market quotations are readily available, are valued at the last reported sale price or official closing price as reported by a third party pricing vendor on the primary market or exchange on which they are traded and are categorized as Level 1 in the hierarchy. In the event there were no sales during the day or closing prices are not available, securities are valued at the mean of the most recent quoted bid and ask prices on such day and are generally categorized as Level 2 in the hierarchy. Investments in open-end mutual funds are valued at their closing NAV each business day and are categorized as Level 1 in the hierarchy.
Changes in valuation techniques may result in transfers in or out of an assigned level within the disclosure hierarchy.
Various inputs are used in determining the value of the Funds’ investments as of the end of the reporting period. When inputs used fall into different levels of the fair value hierarchy, the level in the hierarchy within which the fair value measurement falls is determined based on the lowest level input that is significant to the fair value measurement in its entirety. The designated input levels are not necessarily an indication of the risk or liquidity associated with these investments.
These inputs are categorized in the following hierarchy under applicable financial accounting standards:
| Level 1 – | Unadjusted quoted prices in active markets for identical investments, unrestricted assets or liabilities that a Fund has the ability to access at the measurement date; |
| Level 2 – | Quoted prices which are not active, quoted prices for similar assets or liabilities in active markets or inputs other than quoted prices that are observable (either directly or indirectly) for substantially the full term of the asset or liability; and |
| Level 3 – | Significant unobservable prices or inputs (including the Fund’s own assumptions in determining the fair value of investments) where there is little or no market activity for the asset or liability at the measurement date. |
The following is a summary of the inputs used to value each Fund’s investments as of November 30, 2023:
Alerian MLP ETF
| Investments in Securities at Value | | Level 1 - Quoted and Unadjusted Prices | | | Level 2 - Other Significant Observable Inputs | | | Level 3 – Significant Unobservable Inputs | | | Total | |
| Master Limited Partnerships* | | $ | 7,820,298,883 | | | $ | – | | | $ | – | | | $ | 7,820,298,883 | |
| Short Term Investments | | | 4,014,921 | | | | – | | | | – | | | | 4,014,921 | |
| Total | | $ | 7,824,313,804 | | | $ | – | | | $ | – | | | $ | 7,824,313,804 | |
21 | November 30, 2023
Alerian Exchange Traded Funds
| Notes to Financial Statements | November 30, 2023 |
Alerian Energy Infrastructure ETF
| Investments in Securities at Value | | Level 1 - Quoted and Unadjusted Prices | | | Level 2 - Other Significant Observable Inputs | | | Level 3 – Significant Unobservable Inputs | | | Total | |
| Canadian Energy Infrastructure Companies* | | $ | 33,839,332 | | | $ | – | | | $ | – | | | $ | 33,839,332 | |
| Exchange Traded Fund | | | 1,371,888 | | | | – | | | | – | | | | 1,371,888 | |
| U.S. Energy Infrastructure Companies* | | | 43,843,857 | | | | – | | | | – | | | | 43,843,857 | |
| U.S. Energy Infrastructure MLPs* | | | 30,607,225 | | | | – | | | | – | | | | 30,607,225 | |
| U.S. General Partners* | | | 22,645,063 | | | | – | | | | – | | | | 22,645,063 | |
| Short Term Investments | | | 2,177,850 | | | | – | | | | – | | | | 2,177,850 | |
| Total | | $ | 134,485,215 | | | $ | – | | | $ | – | | | $ | 134,485,215 | |
| * | For a detailed breakdown of sectors, see the accompanying Schedule of Investments. |
The Funds did not have any securities that used significant unobservable inputs (Level 3) in determining fair value and there were no transfers into or out of Level 3 during the year ended November 30, 2023.
C. Foreign Currency Translation
The books and records of the Funds are maintained in U.S. dollars. Investment valuations and other assets and liabilities initially expressed in foreign currencies are converted each business day into U.S. dollars based upon current exchange rates. The portion of realized and unrealized gains or losses on investments due to fluctuations in foreign currency exchange rates is not separately disclosed and is included in realized and unrealized gains or losses on investments, when applicable.
D. Securities Transactions and Investment Income
Securities transactions are recorded as of the trade date. Realized gains and losses from securities transactions are recorded on the specific identification in accordance with GAAP. Dividend income and capital gains distributions, if any, are recorded on the ex-dividend date, net of any foreign taxes withheld. Interest income, if any, is recorded on the accrual basis, including amortization of premiums and accretion of discounts.
E. Dividends and Distributions to Shareholders
Each Fund intends to declare and make quarterly distributions, or as the Board may determine from time to time. Distributions of net realized capital gains earned by the Alerian Energy Infrastructure ETF, if any, are distributed at least annually. Distributions from net investment income and capital gains are determined in accordance with income tax regulations, which may differ from U.S. GAAP. These differences are primarily due to differing treatments of income and gains on various investment securities held by the Funds, timing differences and differing characterization of distributions made by the Funds.
Distributions received from each Fund’s investments in Master Limited Partnerships (“MLPs”) may be comprised of both income and return of capital. Each Fund records investment income and return of capital based on estimates made at the time such distributions are received. Such estimates are based on historical information available from each MLP and other industry sources. These estimates may subsequently be revised based on information received from MLPs after their tax reporting periods are concluded.
The Funds each expect a portion of its distributions to shareholders might be comprised of tax deferred return of capital. Return of capital distributions are not taxable income to the shareholder, but reduce the investor’s tax basis in the investor’s Fund Shares. Such a reduction in tax basis will result in larger taxable gains and/or lower tax losses on a subsequent sale of Fund Shares. Shareholders who periodically receive the payment of dividends or other distributions consisting of a return of capital may be under the impression that they are receiving net profits from the Funds when, in fact, they are not. Shareholders should not assume that the source of the distributions is from the net profits of the Funds.
F. Federal Income Taxation and Tax Basis Information
Alerian MLP ETF
The Fund is taxed as a regular C-corporation for federal income tax purposes and as such is obligated to pay federal and state income tax. This treatment differs from most investment companies, which elect to be treated as “regulated investment companies” under the Internal Revenue Code of 1986, as amended (the “Code”) in order to avoid paying entity level income taxes. Under current law, the Fund is not eligible to elect treatment as a regulated investment company due to its investments primarily in MLPs invested in energy assets. The Fund expects that substantially all of the distributions it receives from MLPs may be treated as a tax-deferred return of capital, thus reducing the Fund’s current tax liability. However, the amount of taxes paid by the Fund will vary depending on the amount of income and gains derived from investments and/or sales of MLP interests and such taxes will reduce your return from an investment in the Fund.
22 | November 30, 2023
Alerian Exchange Traded Funds
| Notes to Financial Statements | November 30, 2023 |
Since the Fund will be subject to taxation on its taxable income, the NAV of the Fund shares will also be reduced by the accrual of any deferred tax liabilities. The Underlying Index however is calculated without any deductions for taxes. As a result, the Fund's after tax performance could differ significantly from the Underlying Index even if the pretax performance of the Fund and the performance of Underlying Index are closely related.
Cash distributions from MLPs to the Fund that exceed the Fund’s allocable share of such MLP’s net taxable income are considered a tax deferred return of capital that will reduce the Fund’s adjusted tax basis in the equity securities of the MLP. These reductions in the Fund’s adjusted tax basis in the MLP equity securities will increase the amount of any taxable gain (or decrease the amount of any tax loss) recognized by the Fund on a subsequent sale of the securities. A portion of any gain or loss recognized by the Fund on a sale of an MLP equity security (or by an MLP on a sale of an underlying asset) may be separately computed and treated as ordinary income or loss under the Code to the extent attributable to assets of the MLP that give rise to depreciation recapture, intangible drilling and development cost recapture, or other "unrealized receivables" or "inventory items" under the Code. Any such gain may exceed net taxable gain realized on the sale and will be recognized even if there is a net taxable loss on the sale. The Fund's net capital losses may only be used to offset capital gains and therefore cannot be used to offset gains that are treated as ordinary income. Thus, the Fund could recognize both gain that is treated as ordinary income and a capital loss on a sale of an MLP equity security (or on an MLP's sale of an underlying asset) and would not be able to use the capital loss to offset that gain. The Fund will accrue deferred income taxes for any future tax liability associated with (i) that portion of MLP distributions considered to be a tax-deferred return of capital as well as (ii) capital appreciation of its investments. Upon the sale of an MLP security, the Fund may be liable for previously deferred taxes. The Fund will rely to some extent on information provided by the MLPs, which is not necessarily timely, to estimate the deferred tax liability for purposes of financial statement reporting and determining the Fund’s NAV. From time to time, the Adviser will modify the estimates or assumptions related to the Fund’s deferred tax liability as new information becomes available and may consider, among other matters, the duration of statutory carryforward periods, shareholder transactions, underlying index constituent changes and market conditions. The Fund will generally compute deferred income taxes based on the federal income tax rate applicable to corporations and an assumed rate attributable to state taxes.
The Fund’s income tax expense/(benefit) consists of the following:
| Alerian MLP ETF | | Year ended November 30, 2023 | |
| | | Current | | | Deferred | | | Total | |
| Federal | | $ | 97,635,529 | | | $ | 186,084,970 | | | $ | 283,720,499 | |
| State | | | 6,017,270 | | | | (322,957 | ) | | | 5,694,313 | |
| Valuation Allowance | | | – | | | | (167,764,361 | ) | | | (167,764,361 | ) |
| Total tax expense/(benefit) | | $ | 103,652,799 | | | $ | 17,997,652 | | | $ | 121,650,451 | |
Deferred income taxes reflect the net tax effect of temporary differences between the carrying amount of assets and liabilities for financial reporting and tax purposes.
Components of the Fund’s deferred tax assets and liabilities are as follows:
| Alerian MLP ETF | | As of November 30, 2023 | | | As of November 30, 2022 | |
| Deferred tax assets: | | | | | | | | |
| Capital loss carryforward | | $ | 524,032,603 | | | $ | 752,720,954 | |
| Net operating loss carryforward | | | 24,884,154 | | | | 14,189,498 | |
| Income recognized from MLP investments | | | 1,632,443,967 | | | | 1,503,943,492 | |
| Other deferred tax assets | | | 9,788,597 | | | | - | |
| Valuation allowance | | | (91,895,116 | ) | | | (259,659,477 | ) |
| Less Deferred tax liabilities: | | | | | | | | |
| Net unrealized gain on investment securities | | | (2,352,863,780 | ) | | | (2,246,799,456 | ) |
| Other deferred tax liabilities | | | (67,889 | ) | | | (74,823 | ) |
| Net Deferred Tax Asset/(Liability) | | $ | (253,677,464 | ) | | $ | (235,679,812 | ) |
Due to the activities of the MLPs that the Fund is invested in, the Fund is required to pay franchise tax in certain states. Generally speaking, franchise tax expense is a tax on equity of a corporation, or base minimum fees, imposed by various jurisdictions. The amounts of the tax are estimated throughout the year based upon the Fund's estimate of underlying activities conducted in the states and reconciled to actual amounts paid upon the filing of the tax returns for the states. These taxes are paid as either estimated tax payments, extension payments, or with the tax return filings of the various states.
23 | November 30, 2023
Alerian Exchange Traded Funds
| Notes to Financial Statements | November 30, 2023 |
The capital loss carryforward is available to offset future taxable income. The capital loss can be carried forward for 5 years and, accordingly, would begin to expire as of November 30, 2025. The Fund has net capital loss carryforwards for federal income tax purposes as follows:
| Alerian MLP ETF | | Period-Ended | | Amount | | | Expiration |
| Federal | | 11/30/2020 | | $ | 873,745,966 | | | 11/30/2025 |
| Federal | | 11/30/2021 | | | 673,784,686 | | | 11/30/2026 |
| Federal | | 11/30/2022 | | | 818,305,025 | | | 11/30/2027 |
| Total | | | | $ | 2,365,835,677 | | | |
The net operating loss carryforward is available to offset future taxable income. The Fund has no net operating loss carryforwards for federal income tax purposes and has state tax net operating loss carryforwards of various amounts per state. The Deferred Tax Assets associated with these state tax net operating losses are as follows:
| Alerian MLP ETF | | Period-Ended | | Amount | | | Expiration |
| State | | 11/30/2012 | | $ | 348,319 | | | Varies by State |
| State | | 11/30/2013 | | | 1,709,988 | | | Varies by State |
| State | | 11/30/2014 | | | 666,282 | | | Varies by State |
| State | | 11/30/2015 | | | 3,032,279 | | | Varies by State |
| State | | 11/30/2016 | | | 6,027,665 | | | Varies by State |
| State | | 11/30/2017 | | | 5,100,371 | | | Varies by State |
| State | | 11/30/2018 | | | 1,729,340 | | | Varies by State |
| State | | 11/30/2019 | | | 1,535,401 | | | Varies by State |
| State | | 11/30/2020 | | | 1,768,627 | | | Varies by State |
| State | | 11/30/2021 | | | 2,599,259 | | | Varies by State |
| State | | 11/30/2022 | | | 366,623 | | | Varies by State |
| Total | | | | $ | 24,884,154 | | | |
The Fund reviews the recoverability of its deferred tax assets based upon the weight of available evidence. When assessing the recoverability of its deferred tax assets, significant weight was given to the effects of potential future realized and unrealized gains on investments and the period over which these deferred tax assets can be realized. Currently, any capital losses that may be generated by the Fund are eligible to be carried back up to three years and can be carried forward for five years to offset capital gains recognized by the Fund in those years.
Based upon the Fund’s assessment, it has determined that it is “more-likely-than-not” that a portion of its deferred tax assets will not be realized through future taxable income of the appropriate character. Accordingly, a valuation allowance has been established for a portion of the Fund's capital loss carryforward asset not expected to be utilized. The Fund will continue to assess the need for a valuation allowance in the future. Significant increases in the fair value of its portfolio of investments may change the Fund’s assessment of the recoverability of these assets and may result in the removal of the valuation allowance against all or a portion of the Fund’s gross deferred tax assets.
Total income tax expense/(benefit) (current and deferred) differs from the amount computed by applying the federal statutory income tax rate of 21% to net investment income and realized and unrealized gain/(losses) on investment before taxes as follows:
| Alerian MLP ETF | | As of November 30, 2023 | |
| Income tax expense at statutory rate | | $ | 288,217,090 | |
| State income taxes (net of federal benefit) | | | 15,783,317 | |
| Permanent differences, net | | | (19,500,558 | ) |
| Effect of tax rate change (state level) | | | 4,914,963 | |
| Valuation allowance | | | (167,764,361 | ) |
| Net income tax expense | | $ | 121,650,451 | |
The Fund recognizes interest accrued related to unrecognized tax benefits and penalties as income tax expense. For the year ended November 30, 2023, the Fund had no penalties or interest.
The Fund recognizes the tax benefits of uncertain tax positions only where the position is “more-likely-than-not” to be sustained assuming examination by tax authorities. Management has analyzed the Fund’s tax positions, and has concluded that no liability for unrecognized tax benefits
24 | November 30, 2023
Alerian Exchange Traded Funds
| Notes to Financial Statements | November 30, 2023 |
should be recorded related to uncertain tax positions taken on U.S. tax returns and state tax returns filed since inception of the Fund. Tax periods ended November 30, 2020 through November 30, 2022 remain subject to examination by tax authorities in the United States. Due to the nature of the Fund’s investments, the Fund may be required to file income tax returns in several states. The Fund is not aware of any tax positions for which it is reasonably possible that the total amounts of unrecognized tax benefits will change materially in the next 12 months.
A federal excise tax on stock repurchases is expected to apply to the Fund with respect to share redemptions occurring on or after January 1, 2023 in accordance with the provisions of the Inflation Reduction Act of 2022. The excise tax is one percent (1%) of the fair market value of Fund share redemptions less the fair market value of Fund share issuances (in excess of $1 million of fair market value) annually on a taxable year basis. For the year ended November 30, 2023, the Fund had no excise tax accrued.
Alerian Energy Infrastructure ETF
The timing and character of income and capital gain distributions are determined in accordance with income tax regulations, which may differ from U.S. GAAP. Reclassifications are made to the Fund’s capital accounts for permanent tax differences to reflect income and gains available for distribution (or available capital loss carryforwards) under income tax regulations.
No provision for income taxes is included in the accompanying financial statements, as the Alerian Energy Infrastructure ETF intends to distribute to shareholders all taxable investment income and realized gains and otherwise comply with Subchapter M of the Internal Revenue Code of 1986, as amended, applicable to regulated investment companies. The Alerian Energy Infrastructure ETF evaluates tax positions taken (or expected to be taken) in the course of preparing the Fund’s tax returns to determine whether these positions meet a “more-likely-than-not” standard that, based on the technical merits, have a more than fifty percent likelihood of being sustained by a taxing authority upon examination. A tax position that meets the “more-likely-than-not” recognition threshold is measured to determine the amount of benefit to recognize in the financial statements.
As of and during the year ended November 30, 2023, the Alerian Energy Infrastructure ETF did not have a liability for any unrecognized tax benefits. The Alerian Energy Infrastructure ETF files U.S. federal, state, and local tax returns as required. The Fund’s tax returns are subject to examination by the relevant tax authorities until expiration of the applicable statute of limitations, which is generally three years after the filing of the tax return, but may extend to four years in certain jurisdictions. The Fund’s tax returns for open years have incorporated no uncertain tax positions that require a provision for income taxes.
For the year ended November 30, 2023, permanent book and tax differences resulting primarily from differing treatment of investments in partnerships and redemptions in kind were identified and reclassified among components of the Fund’s net assets as follows:
| Fund | | Paid-in Capital | | Total Distributable Earnings |
| Alerian Energy Infrastructure ETF | | $ | 4,889,074 | | | $ | (4,889,074 | ) |
The tax character of the distributions paid during the fiscal years ended November 30, 2023 and November 30, 2022 was as follows:
| | | Ordinary Income | | | Long-Term Capital Gain | | | Return of Capital | |
| November 30, 2023 | | | | | | | | | | | | |
| Alerian Energy Infrastructure ETF | | $ | 1,902,116 | | | $ | – | | | $ | 5,303,713 | |
| | | Ordinary Income | | | Long-Term Capital Gain | | | Return of Capital | |
| November 30, 2022 | | | | | | | | | | | | |
| Alerian Energy Infrastructure ETF | | $ | 1,089,790 | | | $ | – | | | $ | 4,610,796 | |
Under current law, capital losses maintain their character as short-term or long-term and are carried forward to the next tax year without expiration. As of November 30, 2023, the following amounts are available as carry forwards to the next tax year:
| | | Short-Term | | | Long-Term | |
| Alerian Energy Infrastructure ETF | | $ | – | | | $ | 1,304,632 | |
During the year ended November 30, 2023, Alerian Energy Infrastructure ETF utilized $1,960,361 in capital loss carryovers.
25 | November 30, 2023
Alerian Exchange Traded Funds
| Notes to Financial Statements | November 30, 2023 |
As of November 30, 2023, the components of distributable earnings on a tax basis were as follows:
| | | Alerian Energy Infrastructure ETF | |
| Accumulated net realized loss on investments | | $ | (1,304,632 | ) |
| Net unrealized appreciation on investments | | | 13,743,399 | |
| Total | | $ | 12,438,767 | |
As of November 30, 2023, the costs of investments for federal income tax purposes and accumulated net unrealized appreciation/(depreciation) on investments were as follows:
| | | Alerian MLP ETF | | | Alerian Energy Infrastructure ETF | |
| Cost of investments for income tax purposes | | $ | 4,571,953,552 | | | $ | 120,740,988 | |
| Gross appreciation (excess of value over tax cost) | | $ | 3,409,104,063 | | | $ | 20,199,740 | |
| Gross depreciation (excess of tax cost over value) | | | (156,743,811 | ) | | | (6,455,513 | ) |
| Net appreciation (depreciation) of foreign currency | | | – | | | | (828 | ) |
| Net unrealized appreciation/(depreciation) | | $ | 3,252,360,252 | | | $ | 13,743,399 | |
The difference between cost amounts for financial statement purposes is due primarily to the recognition of pass-through income from a Fund’s investments in master limited partnerships and wash sales.
G. Lending of Portfolio Securities
The Alerian Energy Infrastructure ETF has entered into a securities lending agreement with State Street Bank & Trust Co. (“SSB”), the Fund’s lending agent. The Fund may lend its portfolio securities only to borrowers that are approved by SSB. The Fund will limit such lending to not more than 33 1/3% of the value of its total assets. The Fund’s securities held at SSB as custodian shall be available to be lent except those securities the Fund or ALPS Advisors, Inc. specifically identifies in writing as not being available for lending. The borrower pledges and maintains with the Fund collateral consisting of cash (U.S. Dollars only), securities issued or guaranteed by the U.S. government or its agencies or instrumentalities, and cash equivalents (including irrevocable bank letters of credit) issued by a person other than the borrower or an affiliate of the borrower. The initial collateral received by the Fund is required to have a value of no less than 102% of the market value of the loaned securities for U.S equity securities and a value of no less than 105% of the market value for non-U.S. equity securities. The collateral is maintained thereafter, at a market value equal to not less than 102% of the current value of the U.S. equity securities on loan and not less than 105% of the current value of the non-U.S. equity securities on loan. The market value of the loaned securities is determined at the close of each business day and any additional required collateral is delivered to the Fund on the next business day. During the term of the loan, the Fund is entitled to all distributions made on or in respect of the loaned securities. Loans of securities are terminable at any time and the borrower, after notice, is required to return borrowed securities within the customary time period for settlement of securities transactions.
Any cash collateral received is reinvested in a money market fund managed by SSB as disclosed in the Fund's Schedule of Investments and is reflected in the Statement of Assets and Liabilities as a payable for collateral upon return of securities loaned. Non-cash collateral, in the form of securities issued or guaranteed by the U.S. government or its agencies or instrumentalities, is not disclosed in the Fund's Statement of Assets and Liabilities or the contractual maturity table below as it is held by the lending agent on behalf of the Fund, and the Fund does not have the ability to re-hypothecate these securities. Income earned by the Fund from securities lending activity is disclosed in the Statement of Operations.
The following is a summary of the Fund's securities lending agreement and related cash and non-cash collateral received as of November 30, 2023:
| Fund | | Market Value of Securities on Loan | | | Cash Collateral Received | | | Non-Cash Collateral Received | | | Total Collateral Received | |
| Alerian Energy Infrastructure ETF | | $ | 2,518,665 | | | $ | 2,154,762 | | | $ | 495,836 | | | $ | 2,650,598 | |
The risks of securities lending include the risk that the borrower may not provide additional collateral when required or may not return the securities when due. To mitigate these risks, the Fund benefits from a borrower default indemnity provided by SSB. SSB’s indemnity allows for full replacement of securities lent wherein SSB will purchase the unreturned loaned securities on the open market by applying the proceeds of the collateral, or to the extent such proceeds are insufficient or the collateral is unavailable, SSB will purchase the unreturned loan securities at SSB’s expense. However, the Fund could suffer a loss if the value of the investments purchased with cash collateral falls below the value of the cash collateral received.
26 | November 30, 2023
Alerian Exchange Traded Funds
| Notes to Financial Statements | November 30, 2023 |
The following table reflects a breakdown of transactions accounted for as secured borrowings, the gross obligation by the type of collateral pledged or securities loaned, and the remaining contractual maturity of those transactions as of November 30, 2023:
| Alerian Energy Infrastructure ETF | | Remaining contractual maturity of the agreements | |
| Securities Lending Transactions | | Overnight & Continuous | | | Up to 30 Days | | | 30-90 Days | | | Greater than 90 Days | | | Total | |
| Common Stocks | | $ | 2,154,762 | | | $ | – | | | $ | – | | | $ | – | | | $ | 2,154,762 | |
| Total Borrowings | | | | | | | | | | | | | | | | | | | 2,154,762 | |
| Gross amount of recognized liabilities for securities lending (collateral received) | | | | | | | | $ | 2,154,762 | |
3. INVESTMENT ADVISORY FEE AND OTHER AFFILIATED TRANSACTIONS
ALPS Advisors, Inc. serves as the Funds’ investment adviser pursuant to an Investment Advisory Agreement with the Trust on behalf of each Fund (the “Advisory Agreement”). Pursuant to the Advisory Agreement, each Fund pays the Adviser an annual management fee for the services and facilities it provides, payable on a monthly basis as a percentage of the relevant Fund’s average daily net assets as set out below.
| Fund | Advisory Fee |
| Alerian MLP ETF | 0.85% | Average net assets up to and including $7 billion |
| | 0.825% | Average net assets greater than $7 billion up to and including $8.5 billion |
| | 0.80% | Average net assets greater than $8.5 billion up to and including $10.5 billion |
| | 0.75% | Average net assets greater than $10.5 billion up to and including $12.5 billion |
| | 0.70% | Average net assets greater than $12.5 billion up to and including $14.5 billion |
| | 0.65% | Average net assets greater than $14.5 billion up to and including $16.5 billion |
| | 0.60% | Average net assets greater than $16.5 billion up to and including $18.5 billion |
| | 0.55% | Average net assets greater than $18.5 billion up to and including $20.5 billion |
| | 0.50% | Average net assets greater than $20.5 billion up to and including $22.5 billion |
| | 0.45% | Average net assets greater than $22.5 billion up to and including $25 billion |
| | 0.40% | Average net assets greater than $25 billion |
| Fund | | Advisory Fee |
| Alerian Energy Infrastructure ETF | 0.35% | |
Out of the unitary management fees, the Adviser pays substantially all expenses of each Fund, including the cost of transfer agency, custody, fund administration, legal, audit, trustees and other services, except for interest expenses, distribution fees or expenses, brokerage expenses, taxes and extraordinary expenses not incurred in the ordinary course of each Fund's business. The Adviser’s unitary management fee is designed to pay substantially all of each Fund’s expenses and to compensate the Adviser for providing services for each Fund.
ALPS Fund Services, Inc., an affiliate of the Adviser, is the administrator of the Funds.
Effective July 1, 2023, each Trustee receives (1) a quarterly retainer of $25,000, (2) a per meeting fee of $15,000, (3) $2,500 for any special meeting held outside of a regularly scheduled board meeting, and (4) reimbursement for all reasonable out-of-pocket expenses relating to attendance at meetings. In addition, the Chairman of the Board receives a quarterly retainer of $5,000, the Chairman of the Audit Committee receives a quarterly retainer of $3,000, and the Chairman of the Nominating & Governance Committee receives a quarterly retainer of $2,000, each in connection with their respective roles. Prior to July 1, 2023, each Trustee received (1) a quarterly retainer of $20,000, (2) a per meeting fee of $10,000, (3) $2,500 for any special meeting held outside of a regularly scheduled board meeting, and (4) reimbursement for all reasonable out-of-pocket expenses relating to attendance at meetings. In addition, the Chairman of the Board received a quarterly retainer of $5,000, the Chairman of the Audit Committee received a quarterly retainer of $3,000, and the Chairman of the Nominating & Governance Committee received a quarterly retainer of $2,000, each in connection with their respective roles.
27 | November 30, 2023
Alerian Exchange Traded Funds
| Notes to Financial Statements | November 30, 2023 |
4. PURCHASES AND SALES OF SECURITIES
For the year ended November 30, 2023, the cost of purchases and proceeds from sales of investment securities, excluding short-term investments and in-kind transactions, were as follows:
| Fund | | Purchases | | | Sales | |
| Alerian MLP ETF | | $ | 2,765,863,668 | | | $ | 4,202,206,393 | |
| Alerian Energy Infrastructure ETF | | | 34,788,423 | | | | 35,495,401 | |
For the year ended November 30, 2023, the cost of in-kind purchases and proceeds from in-kind sales were as follows:
| Fund | | Purchases | | | Sales | |
| Alerian MLP ETF | | $ | 1,458,409,014 | | | $ | – | |
| Alerian Energy Infrastructure ETF | | | 8,335,266 | | | | 19,407,554 | |
For the year ended November 30, 2023, the in-kind net realized gains/(losses) were as follows:
| Fund | | Net Realized Gain/(Loss) | |
| Alerian Energy Infrastructure ETF | | $ | 4,189,256 | |
Gains on in-kind transactions are not considered taxable for federal income tax purposes and losses on in-kind transactions are also not deductible for tax purposes.
5. MASTER LIMITED PARTNERSHIPS
MLPs are publicly traded partnerships engaged in, among other things, the transportation, storage and processing of minerals and natural resources, and are treated as partnerships for U.S. federal income tax purposes. By confining their operations to these specific activities, their interests, or units, are able to trade on public securities exchanges exactly like the shares of a corporation, without entity level taxation. To qualify as a MLP and to not be taxed as a corporation, a partnership must receive at least 90% of its income from qualifying sources as set forth in Section 7704(d) of the Code. These qualifying sources include, among other things, natural resource-based activities such as the processing, transportation and storage of mineral or natural resources. MLPs generally have two classes of owners, the general partner and limited partners. The general partner of an MLP is typically owned by a major energy company, an investment fund, the direct management of the MLP, or is an entity owned by one or more of such parties. The general partner may be structured as a private or publicly traded corporation or other entity. The general partner typically controls the operations and management of the MLP through an up to 2% equity interest in the MLP plus, in many cases, ownership of common units and subordinated units. Limited partners typically own the remainder of the partnership, through ownership of common units, and have a limited role in the partnership’s operations and management.
MLPs are typically structured such that common units and general partner interests have first priority to receive quarterly cash distributions up to an established minimum amount (“minimum quarterly distributions” or “MQD”). Common and general partner interests also accrue arrearages in distributions to the extent the MQD is not paid. Once common and general partner interests have been paid, subordinated units receive distributions of up to the MQD; however, subordinated units do not accrue arrearages. Distributable cash in excess of the MQD is distributed to both common and subordinated units and generally on a pro rata basis. The general partner is also eligible to receive incentive distributions if the general partner operates the business in a manner which results in distributions paid per common unit surpassing specified target levels. As the general partner increases cash distributions to the limited partners, the general partner receives an increasingly higher percentage of the incremental cash distributions.
6. CAPITAL SHARE TRANSACTIONS
Shares are created and redeemed by each Fund only in Creation Unit size aggregations of 25,000 Shares. Only broker-dealers or large institutional investors with creation and redemption agreements called Authorized Participants (“AP”) are permitted to purchase or redeem Creation Units from the Funds. Such transactions are generally permitted on an in-kind basis, with a balancing cash component to equate the transaction to the NAV per unit of each Fund on the transaction date. Cash may be substituted equivalent to the value of certain securities generally when they are not available in sufficient quantity for delivery, not eligible for trading by the AP or as a result of other market circumstances.
28 | November 30, 2023
Alerian Exchange Traded Funds
| Notes to Financial Statements | November 30, 2023 |
7. RELATED PARTY TRANSACTIONS
The Funds engaged in cross trades between other funds in the Trust during the year ended November 30, 2023 pursuant to Rule 17a-7 under the 1940 Act. Cross trading is the buying or selling of portfolio securities between funds to which the Adviser serves as the investment adviser. The Board previously adopted procedures that apply to transactions between the Funds of the Trust pursuant to Rule 17a-7. These transactions related to cross trades during the period complied with the requirements set forth by Rule 17a-7 and the Trust’s procedures.
Transactions related to cross trades during the year ended November 30, 2023, were as follows:
| Fund | | Purchase Cost Paid | | | Sale Proceeds Received | | | Realized Gain/(Loss) on Sales | |
| Alerian MLP ETF | | $ | 3,145,121 | | | $ | 1,755,700 | | | $ | 123,708 | |
| Alerian Energy Infrastructure ETF | | | 1,587,454 | | | | 3,283,758 | | | | (79,899 | ) |
8. AFFILIATED COMPANIES
As defined by the Investment Company Act of 1940, an affiliated person, including an affiliated company, is one in which a Fund owns 5% or more of the outstanding voting securities, or a company which is under common ownership or control with the Fund.
For the year ended November 30, 2023, the Alerian MLP ETF held shares in the following affiliates, as defined by the Investment Company Act of 1940.
| Security Name | | Share Balance as of November 30, 2023 | | | Market Value as of November 30, 2022 | | | Purchases | | | Purchases In-Kind | | | Sales | | | Market Value as of November 30, 2023 | | | Dividends* | | | Change in Unrealized Appreciation/ Depreciation | | | Realized Gain/(Loss) | |
| Crestwood Equity Partners LP | | | – | | | $ | 315,563,335 | | | $ | 138,518,288 | | | $ | 68,015,394 | | | $ | (78,108,806 | ) | | $ | – | | | $ | – | | | $ | (124,606,223 | ) | | $ | (2,118,509 | ) |
| DCP Midstream LP | | | – | | | | 533,370,461 | | | | – | | | | 43,160,215 | | | | (604,598,346 | ) | | | – | | | | – | | | | (316,653,802 | ) | | | 350,530,033 | |
| EnLink Midstream LLC | | | 42,966,669 | | | | 617,327,942 | | | | 77,881,666 | | | | 107,045,782 | | | | (226,022,518 | ) | | | 587,354,365 | | | | – | | | | (3,781,299 | ) | | | 36,717,424 | |
| Genesis Energy LP | | | 19,258,907 | | | | 172,328,904 | | | | 36,633,921 | | | | 37,166,970 | | | | (43,131,452 | ) | | | 241,891,872 | | | | – | | | | 51,912,590 | | | | (2,814,588 | ) |
| Holly Energy Partners LP | | | – | | | | 127,775,101 | | | | 27,921,495 | | | | 28,764,113 | | | | (194,929,793 | ) | | | – | | | | – | | | | (54,855,497 | ) | | | 75,318,058 | |
| Magellan Midstream Partners LP | | | – | | | | 722,152,632 | | | | 124,052,505 | | | | 134,768,103 | | | | (1,211,035,933 | ) | | | – | | | | – | | | | (327,592,008 | ) | | | 604,460,287 | |
| NuStar Energy LP | | | 20,352,065 | | | | 243,096,953 | | | | 98,317,436 | | | | 56,004,775 | | | | (57,009,846 | ) | | | 387,503,318 | | | | – | | | | 73,416,662 | | | | (304,493 | ) |
| Plains All American Pipeline LP | | | 68,927,828 | | | | 733,362,659 | | | | 247,035,941 | | | | 172,878,001 | | | | (268,172,690 | ) | | | 1,094,573,909 | | | | – | | | | 264,663,749 | | | | 10,341,871 | |
| Western Midstream Partners LP | | | 34,352,132 | | | | 692,848,231 | | | | 280,274,018 | | | | 161,455,562 | | | | (186,107,362 | ) | | | 1,024,380,576 | | | | – | | | | 150,513,248 | | | | (1,000,651 | ) |
| | | | | | | | | | | | | | | | | | | | | | | $ | 3,335,704,040 | | | $ | – | | | $ | (286,982,580 | ) | | $ | 1,071,129,432 | |
| * | 100% of the income received was estimated as Return of Capital. |
9. MARKET RISK
The Funds are subject to investment and operational risks associated with financial, economic and other global market developments and disruptions, including including those arising from war, terrorism, market manipulation, government interventions, defaults and shutdowns, political changes or diplomatic developments, public health emergencies (such as the spread of infectious diseases, pandemics and epidemics) and natural/environmental disasters, which can negatively impact the securities markets and cause each Fund to lose value. Securities in each Fund’s portfolio may underperform in comparison to securities in general financial markets, a particular financial market or other asset classes due to a number of factors, including inflation (or expectations for inflation), deflation (or expectations for deflation), interest rates, global demand for particular products or resources, market instability, debt crises and downgrades, embargoes, tariffs, sanctions and other trade barriers, regulatory events, other governmental trade or market control programs and related geopolitical events. In addition, the value of the Fund’s investments may be negatively affected by the occurrence of global events such as war, terrorism, environmental disasters, natural disasters or events, country instability, and infectious disease epidemics or pandemics.
29 | November 30, 2023
Alerian Exchange Traded Funds
| Notes to Financial Statements | November 30, 2023 |
10. REGULATORY UPDATE
The SEC adopted rule and form amendments that will change the format and content of the Funds' annual and semi-annual reports. Certain information, including the financial statements, will not appear in the Funds' new tailored shareholder reports but will be available online, delivered free of charge upon request, and filed on a semi-annual basis on Form N-CSR. The rule and form amendments have a compliance date of July 24, 2024. At this time, the Trust is evaluating the impact of these rule and form amendment changes.
11. SUBSEQUENT EVENTS
Subsequent events, if any, after the date of the Statements of Assets and Liabilities have been evaluated through the date the financial statements were issued. Management has determined that there were no subsequent events to report through the issuance of these financial statements.
30 | November 30, 2023
Alerian Exchange Traded Funds
| Additional Information | November 30, 2023 (Unaudited) |
PROXY VOTING RECORDS, POLICIES AND PROCEDURES
Information regarding how each Fund voted proxies relating to portfolio securities during the most recent 12-month period ended June 30 and a description of the Funds’ proxy voting policies and procedures used in determining how to vote for proxies are available without charge on the SEC’s website at www.sec.gov and upon request, by calling (toll-free) 1-866-759-5679.
PORTFOLIO HOLDINGS
Each Fund files a complete schedule of portfolio holdings with the U.S. Securities and Exchange Commission (“SEC”) for the first and third quarters of each fiscal year on Form N-PORT within 60 days after the end of the period. Copies of each Fund’s Form N-PORT are available without a charge, upon request, by contacting the Fund at 1-866-759-5679 and on the SEC’s website at https://www.sec.gov.
TAX INFORMATION
The Alerian Energy Infrastructure ETF designates the following as a percentage of taxable ordinary income distributions, or up to the maximum amount allowable, for the calendar year ended December 31, 2022:
| | Qualified Dividend Income | Dividend Received Deduction |
| Alerian Energy Infrastructure ETF | 100.00% | 45.84% |
In early 2023, if applicable, shareholders of record received this information for the distributions paid to them by the Funds during the calendar year 2022 via Form 1099. The Funds will notify shareholders in early 2024 of amounts paid to them by the Funds, if any, during the calendar year 2023.
LICENSING AGREEMENTS
Alerian (the “Licensor”) has entered into an index licensing agreement with ALPS Advisors Inc. (the “Adviser”) with respect to each of the Alerian MLP ETF and the Alerian Energy Infrastructure ETF, to allow the Adviser’s use of AMZI and AMEI. The following disclosure relates to the Licensor:
Alerian is the designer of the construction and methodology for the underlying index (each an “Underlying Index”) for each of the Alerian MLP ETF and the Alerian Energy Infrastructure ETF (each a “Fund” and collectively, the “Funds”). “Alerian,” “Alerian MLP Infrastructure Index,” “Alerian Energy Infrastructure Index,” “Alerian Index Series” and “AMZI” are service marks or trademarks of Alerian. Alerian acts as brand licensor for each Underlying Index. Alerian is not responsible for the descriptions of either Underlying Index or the Funds that appear herein. Alerian is not affiliated with the Trust, the Adviser or the Distributor.
Neither Fund is issued, sponsored, endorsed, sold or promoted by Alerian (“Licensor”) or its affiliates. Licensor makes no representation or warranty, express or implied, to the owners of the Fund or any member of the public regarding the advisability of investing in securities generally or in the Fund particularly or the ability of the Alerian MLP Infrastructure Index (“Index”) to track general market performance. Licensor’s only relationship to the Licensee is the licensing of the Index which is determined, composed and calculated by Licensor without regard to the Licensee or the Fund. Licensor has no obligation to take the needs of the Licensee or the owners of the Fund into consideration in determining, composing or calculating the Index. Licensor is not responsible for and has not participated in the determination of the timing of, prices at, or quantities of the Fund to be issued or in the determination or calculation of the equation by which the Fund is to be converted into cash. Licensor has no obligation or liability in connection with the issuance, administration, marketing or trading of either Fund and is not responsible for and has not participated in the determination of pricing or the timing of the issuance or sale of the Shares of either Fund or in the determination or calculation of the NAV of the relevant Fund. Alerian MLP Infrastructure Index, Alerian MLP Infrastructure Total Return Index, AMZI and AMZIX are trademarks of GKD Index Partners, LLC and their general use is granted under a license from GKD Index Partners, LLC.
LICENSOR DOES NOT GUARANTEE THE QUALITY, ACCURACY AND/OR THE COMPLETENESS OF THE INDEX OR ANY DATA INCLUDED THEREIN AND SHALL HAVE NO LIABILITY FOR ERRORS OR OMISSIONS OF ANY KIND RELATED TO THE INDEX OR DATA. LICENSOR MAKES NO WARRANTY, EXPRESS OR IMPLIED, AS TO RESULTS TO BE OBTAINED BY LICENSEE, OWNERS OF THE FUND, OR ANY OTHER PERSON OR ENTITY FROM THE USE OF THE INDEX OR ANY DATA INCLUDED THEREIN IN CONNECTION WITH THE RIGHTS LICENSED TO LICENSEE OR FOR ANY OTHER USE. LICENSOR MAKES NO EXPRESS OR IMPLIED WARRANTIES, AND HEREBY EXPRESSLY DISCLAIMS ALL WARRANTIES OF MERCHANTABILITY OR FITNESS FOR A PARTICULAR PURPOSE OR USE WITH RESPECT TO THE INDEX OR ANY DATA INCLUDED THEREIN. WITHOUT LIMITING ANY OF THE FOREGOING, IN NO EVENT SHALL LICENSOR
31 | November 30, 2023
Alerian Exchange Traded Funds
| Additional Information | November 30, 2023 (Unaudited) |
HAVE ANY LIABILITY FOR ANY SPECIAL, PUNITIVE, INDIRECT, OR CONSEQUENTIAL DAMAGES (INCLUDING LOST PROFITS), EVEN IF NOTIFIED OF THE POSSIBILITY OF SUCH DAMAGES.
The Adviser does not guarantee the accuracy and/or the completeness of either Underlying Index or any data included therein, and the Adviser shall have no liability for any errors, omissions or interruptions therein. The Adviser makes no warranty, express or implied, as to results to be obtained by either Fund, owners of the Shares of the relevant Fund or any other person or entity from the use of either Underlying Index or any data included therein. The Adviser makes no express or implied warranties, and expressly disclaims all warranties of merchantability or fitness for a particular purpose or use with respect to either Underlying Index or any data included therein. Without limiting any of the foregoing, in no event shall the Adviser have any liability for any special, punitive, direct, indirect, or consequential damages (including lost profits) arising out of matters relating to the use of either Underlying Index, even if notified of the possibility of such damages.
(Applicable to the Alerian Energy Infrastructure ETF only)
The Underlying Index is the exclusive property of GKD Index Partners LLC d/b/a Alerian, which has contracted with S&P Opco, LLC (a subsidiary of S&P Dow Jones Indices LLC) (“S&P Dow Jones Indices”) to calculate and maintain the Underlying Index. S&P® is a registered trademark of Standard & Poor’s Financial Services LLC (“SPFS”); Dow Jones® is a registered trademark of Dow Jones Trademark Holdings LLC (“Dow Jones”); and these trademarks have been licensed to S&P Dow Jones Indices. “Calculated by S&P Dow Jones Indices” and its related stylized mark(s) have been licensed for use by Alerian.
The Fund is not sponsored, endorsed, sold or promoted by S&P Dow Jones Indices, SPFS, Dow Jones or any of their affiliates (collectively, “S&P Dow Jones Indices Entities”). S&P Dow Jones Indices Entities do not make any representation or warranty, express or implied, to the owners of the Fund or any member of the public regarding the advisability of investing in securities generally or in the Fund particularly or the ability of the Underlying Index to track general market performance. S&P Dow Jones Indices Entities only relationship to Alerian with respect to the Underlying Index is the licensing of certain trademarks, service marks and trade names of S&P Dow Jones Indices Entities and for the providing of calculation and maintenance services related to the Underlying Index. S&P Dow Jones Indices Entities are not responsible for and have not participated in the determination of the prices and amount of the Fund or the timing of the issuance or sale of the Fund or in the determination or calculation of the equation by which the Fund is to be converted into cash. S&P Dow Jones Indices Entities have no obligation or liability in connection with the administration, marketing or trading of the Fund. S&P Dow Jones Indices LLC is not an investment advisor. Inclusion of a security within the Underlying Index is not a recommendation by S&P Dow Jones Indices Entities to buy, sell, or hold such security, nor is it considered to be investment advice.
S&P DOW JONES INDICES ENTITIES DO NOT GUARANTEE THE ADEQUACY, ACCURACY, TIMELINESS AND/OR THE COMPLETENESS OF THE UNDERLYING INDEX OR ANY DATA RELATED THERETO OR ANY COMMUNICATION, INCLUDING BUT NOT LIMITED TO, ORAL OR WRITTEN COMMUNICATION (INCLUDING ELECTRONIC COMMUNICATIONS) WITH RESPECT THERETO. S&P DOW JONES INDICES ENTITIES SHALL NOT BE SUBJECT TO ANY DAMAGES OR LIABILITY FOR ANY ERRORS, OMISSIONS, OR DELAYS THEREIN. S&P DOW JONES INDICES ENTITIES MAKE NO EXPRESS OR IMPLIED WARRANTIES, AND EXPRESSLY DISCLAIMS ALL WARRANTIES, OF MERCHANTABILITY OR FITNESS FOR A PARTICULAR PURPOSE OR USE OR AS TO RESULTS TO BE OBTAINED BY ALERIAN, OWNERS OF THE FUND, OR ANY OTHER PERSON OR ENTITY FROM THE USE OF THE UNDERLYING INDEX OR WITH RESPECT TO ANY DATA RELATED THERETO. WITHOUT LIMITING ANY OF THE FOREGOING, IN NO EVENT WHATSOEVER SHALL S&P DOW JONES INDICES ENTITIES BE LIABLE FOR ANY INDIRECT, SPECIAL, INCIDENTAL, PUNITIVE, OR CONSEQUENTIAL DAMAGES INCLUDING BUT NOT LIMITED TO, LOSS OF PROFITS, TRADING LOSSES, LOST TIME OR GOODWILL, EVEN IF THEY HAVE BEEN ADVISED OF THE POSSIBILITY OF SUCH DAMAGES, WHETHER IN CONTRACT, TORT, STRICT LIABILITY, OR OTHERWISE.
32 | November 30, 2023
Alerian Exchange Traded Funds
| Board Considerations Regarding Approval of Investment Advisory Agreement | November 30, 2023 (Unaudited) |
At its meetings held on June 5, 2023 and June 20, 2023, the Board of Trustees of the Trust (the “Board” or the “Trustees”), where each Trustee is not an "interested person" of the Trust within the meaning of the Investment Company Act of 1940, as amended (the “Independent Trustees”), evaluated a proposal to approve the continuance of the Investment Advisory Agreement between the Trust and ALPS Advisors, Inc. (the “Adviser” or “AAI”) with respect to the Alerian MLP ETF ("AMLP") and Alerian Energy Infrastructure ETF ("ENFR") (each a “Fund” and collectively “the Funds”). In evaluating the renewal of the Investment Advisory Agreement with respect to each Fund, the Board, including the Independent Trustees, considered various factors, including (i) the nature, extent and quality of the services provided by AAI with respect to the applicable Fund under the Investment Advisory Agreement; (ii) the advisory fees and other expenses paid by the Fund compared to those of similar funds managed by other investment advisers; (iii) the costs of the services provided to the Fund by AAI and the profits realized by AAI and its affiliates from its relationship to the Fund; (iv) the extent to which economies of scale have been or would be realized if and as the assets of the Fund grow and whether fees reflect the economies of scale for the benefit of shareholders; and (v) any additional benefits and other considerations.
With respect to the nature, extent and quality of the services provided by AAI under the Investment Advisory Agreement, the Board considered and reviewed information concerning the services provided under the Investment Advisory Agreement, the investment parameters of the index of each Fund, financial information regarding AAI and its parent company, information describing AAI’s current organization and the background and experience of the persons responsible for the day-to-day management of the Funds.
The Board reviewed information on the performance of each Fund and its applicable benchmark for the 1-, 3-, and 5-year periods, as applicable. The Board also evaluated the correlation and tracking error between each underlying index and its corresponding Fund’s performance. Based on this review, the Board, including the Independent Trustees, found that the nature and extent of services provided to each Fund under the Investment Advisory Agreement was appropriate and that the quality of such services was satisfactory.
The Board noted that the advisory fees for each Fund were unitary fees pursuant to which AAI assumes all expenses of the Funds (including the cost of transfer agency, custody, fund administration, legal, audit and other services) other than the payments under the Advisory Agreement, brokerage expenses, taxes, interest, litigation expenses and other extraordinary expenses.
Based on the information available to them, including the Fund-specific summaries set forth below, the Board, including the Independent Trustees, concluded that the advisory fee rate for each of the Funds was reasonable under the circumstances and in light of the quality of the services provided.
The Board, including the Independent Trustees, considered other benefits available to AAI because of its relationship with the Funds and concluded that the advisory fees were reasonable taking into account any such benefits.
The Board, including the Independent Trustees, also considered with respect to each Fund the information provided by AAI about the costs and profitability of AAI with respect to each of the Funds, including the asset levels and other factors that influence the profitability and financial viability of the Funds. The Board, including the Independent Trustees, reviewed and noted the relatively small sizes of the Funds (other than AMLP) and the analysis AAI had conducted to support AAI’s assertion that it was not realizing any economies of scale with respect to such Funds. The Independent Trustees determined that AAI should continue to keep the Board informed on an ongoing basis of any significant developments (e.g., material increases in asset levels) so as to facilitate the Independent Trustees’ evaluation of whether further economies of scale have been achieved.
The Board, including the Independent Trustees, also considered other potential benefits available to AAI because of its relationship with the Funds, known as fall-out benefits.
With respect to each Fund, the Board, including the Independent Trustees, noted the following:
(i) AMLP
The gross management fee rate for AMLP is higher than the median of its FUSE expense group. AMLP’s net expense ratio is higher than the median of its FUSE expense group. The Board took into account, among other things, supplemental information provided by the Adviser showing AMLP’s total expenses were in line with the total expenses of peer groups deemed by the Adviser to be more comparable, including peer groups comprised of (i) the master limited partnership (“MLP”) asset class as a whole; and (ii) exchange-traded products focused solely on MLP investments. The Board also considered the brand recognition of AMLP’s index provider and the fees charged by the index provider for licensing its indexes, the additional costs and expenses incurred by AAI in managing and administering AMLP and that AMLP’s investment advisory fee schedule included breakpoints, which have been periodically adjusted for the benefit of AMLP shareholders.
With respect to AAI profitability from AMLP, the Independent Trustees noted that AMLP’s asset levels have not recovered to their historic high and that it has breakpoints in its management fee. The Board considered, among other things, the brand recognition of AMLP’s index provider as well as the trading volumes of the Fund and the narrow trading spreads. The Board considered the breakpoint schedule previously adopted and whether
33 | November 30, 2023
Alerian Exchange Traded Funds
| Board Considerations Regarding Approval of Investment Advisory Agreement | November 30, 2023 (Unaudited) |
breakpoints would benefit shareholders and appropriately reflect economies of scale achieved by AAI with respect to AMLP should AMLP’s assets increase, noting that AMLP’s assets were still below historical highs, but increasing. Upon discussion, the Board, including the Independent Trustees, determined that the advisory fee rate for AMLP, inclusive of the existing breakpoint schedule, reflects an appropriate sharing of economies of scale.
(ii) ENFR
The gross management fee rate for ENFR is lower than the median of its FUSE expense group. ENFR’s net expense ratio is lower than the median of its FUSE expense group.
The Board, including the Independent Trustees, reviewed and noted the relatively small size of ENFR and the analysis AAI had conducted to support AAI’s assertion that it was not realizing any economies of scale with respect to ENFR.
In voting to renew the Investment Advisory Agreement with AAI, the Board, including the Independent Trustees, concluded that the terms of the Investment Advisory Agreement are reasonable and fair in light of the services to be performed, the fees paid by certain other funds, expenses to be incurred and such other matters as the members of the Board, including the Independent Trustees, considered relevant in the exercise of their reasonable business judgment. The Independent Trustees did not identify any single factor or group of factors as all important or controlling and considered all factors together.
34 | November 30, 2023
Alerian Exchange Traded Funds
| Trustees & Officers | November 30, 2023 (Unaudited) |
The general supervision of the duties performed by the Adviser for the Fund under the Investment Advisory Agreement is the responsibility of the Board of Trustees. The Trust currently has four Trustees, each of whom have no affiliation or business connection with the Adviser or any of its affiliated persons and do not own any stock or other securities issued by the Adviser. These are the “non-interested” or “independent” Trustees (“Independent Trustees”).
The Independent Trustees of the Trust, their term of office and length of time served, their principal business occupations during the past five years, the number of portfolios in the Fund Complex overseen by each Independent Trustee, and other directorships, if any, held by the Trustee are shown below.
INDEPENDENT TRUSTEES
Name, Address & Year of Birth of Officer* | Position(s) Held with Trust | Length of Time Served** | Principal Occupation(s) During Past 5 Years | Number of Portfolios in Fund Complex Overseen by Trustees*** | Other Directorships Held by Trustees |
Mary K. Anstine, 1940 | Trustee | Since March 2008 | Ms. Anstine is Trustee/Director of AV Hunter Trust and Colorado Uplift Board. | 38 | Ms. Anstine is a Trustee of ALPS Variable Investment Trust (7 funds); Financial Investors Trust (29 funds); and Reaves Utility Income Fund. |
Jeremy W. Deems, 1976 | Trustee | Since March 2008 | Mr. Deems is the Co-Founder and Chief Financial Officer of Green Alpha Advisors, LLC, a registered investment advisor, and Co-Portfolio Manager of the AXS Green Alpha ETF. | 38 | Mr. Deems is a Trustee of ALPS Variable Investment Trust (7 funds); Financial Investors Trust (29 funds); and Reaves Utility Income Fund; and Clough Funds Trust (1 fund). |
Rick A. Pederson, 1952 | Trustee | Since March 2008 | Mr. Pederson is Partner, Bow River Capital Partners (private equity management), 2003 - present; Board Member, Prosci Inc. (private business services) 2013-2016; Advisory Board Member, Citywide Banks (Colorado community bank) 2014- 2017; Board Member, Strong-Bridge Consulting, 2015- 2019; Board Member, IRI/ODMS Holdings LLC, 2017 – 2019; Director, National Western Stock Show (not for profit) 2010 - present; Director, History Colorado (not for profit) 2015- present; Director, Citywide Bank Advisory Board 2017-present; Trustee, Boettcher Foundation, 2018 -present. | 24 | Mr. Pederson is Trustee of Segall Bryant & Hamill Trust (14 funds) and Principal Real Estate Income Fund (1 fund). |
| * | The business address of the Trustee is c/o ALPS Advisors, Inc., 1290 Broadway, Suite 1000, Denver, Colorado 80203. |
| ** | This is the period for which the Trustee began serving the Trust. Each Trustee serves an indefinite term, until his or her successor is elected. |
| *** | The Fund Complex includes all series of the Trust and any other investment companies for which ALPS Advisors, Inc. provides investment advisory services. |
35 | November 30, 2023
Alerian Exchange Traded Funds
| Trustees & Officers | November 30, 2023 (Unaudited) |
Name, Address & Year of Birth of Officer* | Position(s) Held with Trust | Length of Time Served** | Principal Occupation(s) During Past 5 Years | Number of Portfolios in Fund Complex Overseen by Trustees*** | Other Directorships Held by Trustees |
Edmund J. Burke, 1961 | Trustee | Since December 2017 | Mr. Burke joined ALPS in 1991 and served as the President and Director of ALPS Holdings, Inc., and ALPS Advisors, Inc., and Director of ALPS Distributors, Inc., ALPS Fund Services, Inc. (“ALPS”), and ALPS Portfolio Solutions Distributor, Inc. (collectively, the “ALPS Companies”). Mr. Burke retired from the ALPS Companies in June 2019. Mr. Burke is currently a partner at ETF Action, a web-based system that provides data and analytics to registered investment advisers, (since 2020) and a Director of Alliance Bioenergy Plus, Inc., a technology company focused on emerging technologies in the renewable energy, biofuels, and bioplastics technology sectors (since 2020). | 33 | Mr. Burke is a Trustee of Clough Global Dividend and Income Fund (1 fund); Clough Global Equity Fund (1 fund); Clough Global Opportunities Fund (1 fund); Clough Funds Trust (1 fund); Liberty All-Star Equity Fund (1 fund); Director of the Liberty All-Star Growth Fund, Inc. (1 fund) and Financial Investors Trust (29 funds). |
| * | The business address of the Trustee is c/o ALPS Advisors, Inc., 1290 Broadway, Suite 1000, Denver, Colorado 80203. |
| ** | This is the period for which the Trustee began serving the Trust. Each Trustee serves an indefinite term, until his or her successor is elected. |
| *** | The Fund Complex includes all series of the Trust and any other investment companies for which ALPS Advisors, Inc. provides investment advisory services. |
36 | November 30, 2023
Alerian Exchange Traded Funds
| Trustees & Officers | November 30, 2023 (Unaudited) |
OFFICERS:
Name, Address and Year of Birth of Officer* | Position(s) Held with Trust | Length of Time Served** | Principal Occupation(s) During Past 5 Years |
Laton Spahr, 1975 | President | Since June 2021 | Mr. Spahr joined ALPS in 2019 and currently serves as President and Portfolio Manager of AAI. Prior to his current role, Mr. Spahr was a Senior Vice President and Strategy Leader of the Value & Income Team for Oppenheimer Funds from 2013 to 2019. |
Matthew Sutula, 1985 | Chief Compliance Officer (“CCO”) | Since December 2019 | Mr. Sutula joined ALPS in 2012 and currently serves as Chief Compliance Officer of AAI. Prior to his current role, Mr. Sutula served as interim Compliance Officer of the Trust (September 2019 to December 2019). Compliance Manager and Senior Compliance Analyst for AAI, as well as Compliance Analyst for AFS. Prior to joining ALPS, he spent seven years at Morningstar, Inc. in various analyst roles supporting the registered investment company databases. Mr. Sutula is also Chief Compliance Officer of Principal Real Estate Income Fund, ALPS Variable Investment Trust, Liberty All-Star Equity Fund and Liberty All-Star Growth Fund, Inc. From September 2019 to September 2022 he served as Chief Compliance Officer of RiverNorth Opportunities Fund, Inc. |
Erich Rettinger, 1985 | Treasurer | Since September 2023 | Mr. Rettinger is Vice President of AAI (since 2021) and serves as Treasurer of Principal Real Estate Income Fund, Liberty All-Star Equity Fund, LibertyAll-Star Growth Fund, Inc., and ALPS Variable Investment Trust. From December 2021 to October 2022 he also served as Treasurer of RiverNorth Opportunities Fund, Inc. Because of his position with AAI, Mr. Rettinger is deemed an affiliate of the Fund as defined under the 1940 Act. From 2013-2021, he served as Vice President and Fund Controller of ALPS Fund Services. |
Michael P. Lawlor, 1969 | Secretary | Since December 2022 | Mr. Lawlor joined ALPS in January 2022, and is currently Vice President and Principal Legal Counsel. Prior to joining ALPS, Mr. Lawlor was Lead Fund Counsel at Brighthouse Financial (insurance company) (January 2007-April 2021). Mr. Lawlor also serves as Secretary of Financial Investors Trust and ALPS Variable Investment Trust. |
Susan M. Cannon, 1974 | Assistant Secretary | Since May 2023 | Ms. Cannon joined ALPS in September 2022, and is currently a Senior Paralegal of ALPS Fund Services, Inc. Prior to joining ALPS, Ms. Cannon worked for World Premier Private Partnership, Brown Brothers Harriman & Co. |
| * | The business address of each Officer is c/o ALPS Advisors, Inc., 1290 Broadway, Suite 1000, Denver, Colorado 80203. Each Officer is deemed an affiliate of the Trust as defined under the 1940 Act. |
| ** | This is the period for which the Officer began serving the Trust. Each Officer serves an indefinite term, until his or her successor is elected. |
The Statement of Additional Information includes additional information about the Fund’s Trustees and is available, without charge, upon request by calling (toll-free) 1-866-759-5679.
37 | November 30, 2023


Table of Contents
| Performance Overview | 1 |
| Disclosure of Fund Expenses | 4 |
| Report of Independent Registered Public Accounting Firm | 5 |
| Financial Statements | |
| Schedule of Investments | 6 |
| Statement of Assets and Liabilities | 8 |
| Statement of Operations | 9 |
| Statements of Changes in Net Assets | 10 |
| Financial Highlights | 11 |
| Notes to Financial Statements | 12 |
| Additional Information | 19 |
| Board Considerations Regarding Approval of Investment Advisory Agreement | 20 |
| Trustees & Officers | 21 |
alpsfunds.com
ALPS Active Equity Opportunity ETF
| Performance Overview | November 30, 2023 (Unaudited) |
Investment Objective
ALPS Active Equity Opportunity ETF (the “Fund” or "RFFC") seeks to provide capital appreciation. Under normal market conditions, the Fund will seek to achieve its investment objective by investing at least 80% of its net assets in a portfolio of equity securities. Equity securities include common stocks and common or preferred shares of real estate investment trusts (“REITs”).
Market Review
Following an end of year 2022 selloff, equities began 2023 with a strong rally in growth and quality stocks before selling off in the third quarter. These losses were fully regained in October and November of 2023 as equities rallied going into year end 2023. The S&P 500® Index ("the S&P") concluded the fiscal year ended November 30, 2023 with a gain of 13.84% from the prior fiscal year. The theme for most of 2023 was a reversal of 2022, as the Growth style outperformed Value. On a sector level, Communication Services, Industrials, Information Technology, and Energy outperformed the S&P. Traditionally defensive sectors such as Utilities, Consumer Staples, and Healthcare underperformed the S&P.
Fund Review
The Fund experienced a Portfolio Manager change on June 1, 2023 with ALPS Advisors, Inc ("ALPS") naming Laton Spahr and Eric Hewitt as co-managers of the Fund. The portfolio will consist mainly of those stocks that have attractive or improving return on invested capital ("ROIC"), which the portfolio managers believe is the primary driver of equity returns. During the fiscal year ended November 30, 2023, the Fund returned 7.81%, underperforming the S&P Composite 1500® Index (“the Index”) by approximately 5%. From an allocation standpoint, contributors included Fund holdings in the Financials, Industrials, and Utilities sectors. Detractors included fund holdings in the Consumer Discretionary, Information Technology, and Healthcare sectors.
Outlook
Moving forward, ALPS anticipates one of two potential scenarios unfolding:
| 1) | In the event that inflation persists above the Federal Reserve Bank's target and interest rates maintain an elevated status for an extended period, cash-rich companies are poised to consistently outshine their more leveraged counterparts. This reflationary scenario is, in our view, likely to favor high-quality cyclicals, industrials, and large-cap sectors. |
| 2) | If the delayed impacts of tightening lead to a credit cycle and subsequent recession, a defensive quality strategy is expected to outperform. |
A shared element in these scenarios is the emphasis on a quality, dividend-centric foundation, irrespective of the sector. ALPS perceives this positioning akin to a call option on growth; if growth remains robust or accelerates, these stocks stand to benefit. However, in the face of downside risks materializing, ALPS believes these stocks could prove defensive in nature.
1 | November 30, 2023
ALPS Active Equity Opportunity ETF
| Performance Overview | November 30, 2023 (Unaudited) |
Performance (as of November 30, 2023)
| | 1 Year | 3 Year | 5 Year | Since Inception^ |
| ALPS Active Equity Opportunity ETF - NAV | 7.81% | 7.82% | 8.14% | 9.57% |
| ALPS Active Equity Opportunity ETF - Market Price* | 7.82% | 7.78% | 8.11% | 9.56% |
| S&P Composite 1500® Index | 12.62% | 9.53% | 12.07% | 12.55% |
Total Expense Ratio (per the current prospectus, as supplemented June 1, 2023) is 0.48%.
Performance data quoted represents past performance. Past performance does not guarantee future results. Total return figures assume reinvestment of dividends and capital gains distributions, if any. The table does not reflect the deduction of taxes that a shareholder would pay on Fund distributions or the redemption of Fund shares. Investment return and principal value of an investment will fluctuate so that an investor’s shares, when sold or redeemed, may be worth more or less than the original cost. Current performance data may be higher or lower than actual data quoted. For the most current month-end performance data please visit www.alpsfunds.com or call 1.866.759.5679.
Net Asset Value (NAV) is an exchange-traded fund’s per-share value. The per-share dollar amount of the fund is derived by dividing the total value of all the securities in its portfolio, less any liabilities, by the number of fund shares outstanding. Market Price is the price at which a share can currently be traded in the market. Information detailing the number of days the Market Price of the Fund was greater than the Fund’s NAV and the number of days it was less than the Fund’s NAV can be obtained at www.alpsfunds.com.
| ^ | The Fund commenced operations on June 7, 2016. Effective June 1, 2023, RiverFront Investment Group, LLC ceased to serve as the Sub- Adviser to the RiverFront Dynamic US Flex-Cap ETF and ALPS Advisors, Inc. assumed all responsibility for selecting the investments of the Fund. In addition, the Fund changed its name from RiverFront Dynamic US Flex-Cap ETF to ALPS Active Equity Opportunity ETF. Performance figures shown above for periods before June 1, 2023 represent performance of the Fund during the times when the Fund’s investments were selected by RiverFront Investment Group, LLC. Effective June 1, 2023, ALPS Advisors, Inc. agreed to limit expenses to 0.48% of average nets assets. Prior to June 1, 2023, ALPS Advisors, Inc. agreed to limit expenses to 0.52% of average net assets up to $600 million and 0.49% for average net asset of $600 million and over. |
| * | Market Price means the official closing price of a share or, if it more accurately reflects the market value of a share at the time as of which the Fund calculates current net asset value per share, the price that is the midpoint of the bid-ask spread as of that time. It does not represent the returns an investor would receive if shares were traded at other times. |
S&P Composite 1500® Index is the Standard & Poor’s broad-based unmanaged capitalization-weighted index comprising 1,500 stocks of Large-cap, Mid-cap, and Small-cap U.S. companies. The index is reported on a total return basis, which assumes reinvestment of any dividends and distributions realized during a given time period. The index is not actively managed and does not reflect any deductions for fees, expenses or taxes. One cannot invest directly in an index. Index performance does not reflect fund performance.
The ALPS Active Equity Opportunity ETF is not suitable for all investors. Investments in the Fund are subject to investment risks, including possible loss of the principal amount invested.
The Fund’s shares are not individually redeemable. Investors buy and sell shares of the Fund on a secondary market. Only market makers or “authorized participants” may trade directly with the Fund, typically in blocks of 25,000 shares.
ALPS Portfolio Solutions Distributor, Inc., a FINRA member, is the Distributor for the ALPS Active Equity Opportunity ETF.
2 | November 30, 2023
ALPS Active Equity Opportunity ETF
| Performance Overview | November 30, 2023 (Unaudited) |
Top Ten Holdings^* (as of November 30, 2023)
| Microsoft Corp. | 5.10% |
| JPMorgan Chase & Co. | 3.41% |
| Apple, Inc. | 3.40% |
| Alphabet, Inc. | 2.95% |
| NVIDIA Corp. | 2.94% |
| UnitedHealth Group, Inc. | 2.92% |
| ConocoPhillips | 2.56% |
| Amazon.com, Inc. | 2.50% |
| Meta Platforms, Inc. | 2.46% |
| Adobe, Inc. | 2.34% |
| Total % of Top 10 Holdings | 30.58% |
Sector Allocation* (as of November 30, 2023)
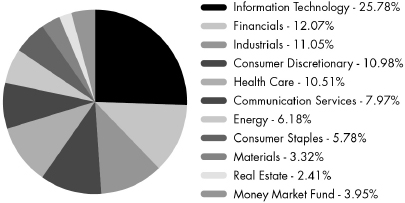
| ^ | Excludes Money Market Fund. |
Future holdings are subject to change.
Growth of $10,000 (as of November 30, 2023)
Comparison of Change in Value of $10,000 Investment in the Fund and the Index

The chart above compares historical performance of a hypothetical investment of $10,000 in the Fund since inception with the performance of the Fund’s benchmark index. Results include the reinvestment of all dividends and capital gains distributions. Past performance does not guarantee future results. The chart does not reflect the deduction of taxes that a shareholder would pay on Fund distributions or the redemption of Fund shares.
3 | November 30, 2023
ALPS Active Equity Opportunity ETF
| Disclosure of Fund Expenses | November 30, 2023 (Unaudited) |
Shareholder Expense Example: As a shareholder of the Fund, you incur certain ongoing costs, including management fees and other Fund expenses. These examples are intended to help you understand your ongoing costs (in dollars) of investing in the Fund and to compare these costs with the ongoing costs of investing in other funds. The example is based on an investment of $1,000 invested at the beginning of the six month period and held through November 30, 2023.
Actual Return: The first line of the table provides information about actual account values and actual expenses. You may use the information in this line, together with the amount you invested, to estimate the expenses that you incurred over the period. Simply divide your account value by
$1,000 (for example, an $8,600 account value divided by $1,000 = 8.6), then multiply the result by the number in the first line under the heading entitled “Expenses Paid During Period” to estimate the expenses attributable to your investment during this period.
Hypothetical 5% Return: The second line of the table provides information about hypothetical account values and hypothetical expenses based on the Fund’s actual expense ratio and an assumed rate of return of 5% per year before expenses, which is not the Fund’s actual return. The hypothetical account values and expenses may not be used to estimate the actual ending account balance or expenses you paid for the period. You may use this information to compare ongoing costs of investing in the Fund and other funds. To do so, compare this 5% hypothetical example with the 5% hypothetical examples that appear in the shareholder reports of other funds.
The expenses shown in the table are meant to highlight ongoing Fund costs only and do not reflect any transaction costs, such as brokerage commissions and other fees to financial intermediaries. Therefore, the second line of the table is useful in comparing ongoing costs only, and will not help you determine the relative total costs of owning different funds. In addition, if these costs were included, your costs would have been higher.
| | Beginning Account
Value
6/1/23 | Ending Account
Value
11/30/23 | Expense
Ratio(a) | Expenses Paid
During Period
6/1/23 - 11/30/23(b) |
| ALPS Active Equity Opportunity ETF | | | | |
| Actual | $1,000.00 | $1,088.90 | 0.50% | $2.51 |
| Hypothetical (5% return before expenses) | $1,000.00 | $1,022.66 | 0.50% | $2.43 |
| (a) | Annualized, based on the Fund's most recent fiscal half year expenses. |
| (b) | Expenses are equal to the Fund's annualized expense ratio multiplied by the average account value over the period, multiplied by the number of days in the most recent fiscal half year (183), divided by 365. |
4 | November 30, 2023
ALPS Active Equity Opportunity ETF
| Report of Independent Registered Public Accounting Firm |
To the Shareholders of ALPS Active Equity Opportunity ETF (formerly, RiverFront Dynamic US Flex-Cap ETF)
and Board of Trustees of ALPS ETF Trust
Opinion on the Financial Statements
We have audited the accompanying statement of assets and liabilities, including the schedule of investments, of ALPS Active Equity Opportunity ETF (formerly, RiverFront Dynamic US Flex-Cap ETF) (the “Fund”), a series of ALPS ETF Trust, as of November 30, 2023, the related statements of operations and changes in net assets, the related notes, and the financial highlights for the year then ended (collectively referred to as the “financial statements”). In our opinion, the financial statements present fairly, in all material respects, the financial position of the Fund as of November 30, 2023, the results of its operations, the changes in net assets, and the financial highlights for the year then ended, in conformity with accounting principles generally accepted in the United States of America.
The Fund’s financial statements and financial highlights for the years ended November 30, 2022, and prior, were audited by other auditors whose report dated January 27, 2023, expressed an unqualified opinion on those financial statements and financial highlights.
Basis for Opinion
These financial statements are the responsibility of the Fund’s management. Our responsibility is to express an opinion on the Fund’s financial statements based on our audit. We are a public accounting firm registered with the Public Company Accounting Oversight Board (United States) (“PCAOB”) and are required to be independent with respect to the Fund in accordance with the U.S. federal securities laws and the applicable rules and regulations of the Securities and Exchange Commission and the PCAOB.
We conducted our audit in accordance with the standards of the PCAOB. Those standards require that we plan and perform the audit to obtain reasonable assurance about whether the financial statements are free of material misstatement whether due to error or fraud.
Our audit included performing procedures to assess the risks of material misstatement of the financial statements, whether due to error or fraud, and performing procedures that respond to those risks. Such procedures included examining, on a test basis, evidence regarding the amounts and disclosures in the financial statements. Our procedures included confirmation of securities owned as of November 30, 2023, by correspondence with the custodian and brokers; when replies were not received from brokers, we performed other auditing procedures. Our audit also included evaluating the accounting principles used and significant estimates made by management, as well as evaluating the overall presentation of the financial statements. We believe that our audit provides a reasonable basis for our opinion.
We have served as the auditor of one or more investment companies advised by ALPS Advisors, Inc. since 2013.

COHEN & COMPANY, LTD.
Philadelphia, Pennsylvania
January 29, 2024
5 | November 30, 2023
ALPS Active Equity Opportunity ETF
| Schedule of Investments | November 30, 2023 |
| Security Description | | Shares | | | Value | |
| COMMON STOCKS (96.16%) | | | | | | |
| Communication Services (7.98%) | | | | | | |
| Alphabet, Inc., Class A(a) | | | 5,291 | | | $ | 701,216 | |
| AT&T, Inc. | | | 14,894 | | | | 246,794 | |
| Meta Platforms, Inc., Class A(a) | | | 1,791 | | | | 585,926 | |
| Walt Disney Co. | | | 3,915 | | | | 362,881 | |
| Total Communication Services | | | | | | | 1,896,817 | |
| | | | | | | | | |
| Consumer Discretionary (11.00%) | | | | | | | | |
| Amazon.com, Inc.(a) | | | 4,081 | | | | 596,193 | |
| DraftKings, Inc., Class A(a) | | | 2,925 | | | | 111,852 | |
| Lowe's Cos., Inc. | | | 2,028 | | | | 403,227 | |
| Marriott International, Inc., Class A | | | 2,125 | | | | 430,737 | |
| McDonald's Corp. | | | 1,555 | | | | 438,261 | |
| NIKE, Inc., Class B | | | 3,280 | | | | 361,686 | |
| O'Reilly Automotive, Inc.(a) | | | 278 | | | | 273,102 | |
| Total Consumer Discretionary | | | | | | | 2,615,058 | |
| | | | | | | | | |
| Consumer Staples (5.78%) | | | | | | | | |
| Campbell Soup Co. | | | 3,770 | | | | 151,479 | |
| Costco Wholesale Corp. | | | 829 | | | | 491,381 | |
| Estee Lauder Cos., Inc., Class A | | | 619 | | | | 79,040 | |
| Target Corp. | | | 1,405 | | | | 188,003 | |
| Walmart, Inc. | | | 2,990 | | | | 465,513 | |
| Total Consumer Staples | | | | | | | 1,375,416 | |
| | | | | | | | | |
| Energy (6.19%) | | | | | | | | |
| Baker Hughes Co. | | | 6,306 | | | | 212,827 | |
| BP PLC, Sponsored ADR | | | 6,747 | | | | 244,849 | |
| ConocoPhillips | | | 5,280 | | | | 610,210 | |
| Enbridge, Inc.(b) | | | 11,600 | | | | 404,492 | |
| Total Energy | | | | | | | 1,472,378 | |
| | | | | | | | | |
| Financials (12.09%) | | | | | | | | |
| American Express Co. | | | 2,584 | | | | 441,270 | |
| Intercontinental Exchange, Inc. | | | 3,575 | | | | 406,978 | |
| JPMorgan Chase & Co. | | | 5,196 | | | | 810,992 | |
| Mastercard, Inc., Class A | | | 1,277 | | | | 528,461 | |
| UBS Group AG | | | 6,485 | | | | 183,201 | |
| Wells Fargo & Co. | | | 11,280 | | | | 502,975 | |
| Total Financials | | | | | | | 2,873,877 | |
| | | | | | | | | |
| Health Care (10.52%) | | | | | | | | |
| Boston Scientific Corp.(a) | | | 6,063 | | | | 338,861 | |
| HCA Healthcare, Inc. | | | 1,195 | | | | 299,324 | |
| IQVIA Holdings, Inc.(a) | | | 1,414 | | | | 302,737 | |
| Pfizer, Inc. | | | 5,164 | | | | 157,347 | |
| Thermo Fisher Scientific, Inc. | | | 801 | | | | 397,104 | |
| UnitedHealth Group, Inc. | | | 1,256 | | | | 694,530 | |
| Vertex Pharmaceuticals, Inc.(a) | | | 879 | | | | 311,878 | |
| Total Health Care | | | | | | | 2,501,781 | |
| | | | | | | | | |
| Industrials (11.07%) | | | | | | | | |
| Caterpillar, Inc. | | | 1,565 | | | | 392,377 | |
| Deere & Co. | | | 1,000 | | | | 364,410 | |
| Lockheed Martin Corp. | | | 937 | | | | 419,560 | |
| Security Description | | Shares | | | Value | |
| Industrials (continued) | | | | | | | | |
| Old Dominion Freight Line, Inc. | | | 800 | | | $ | 311,248 | |
| Schneider Electric SE, ADR(b) | | | 10,370 | | | | 381,409 | |
| Trane Technologies PLC | | | 1,675 | | | | 377,562 | |
| Waste Management, Inc. | | | 2,250 | | | | 384,727 | |
| Total Industrials | | | | | | | 2,631,293 | |
| | | | | | | | | |
| Information Technology (25.80%) | | | | | | | | |
| Adobe, Inc.(a) | | | 911 | | | | 556,630 | |
| Apple, Inc. | | | 4,257 | | | | 808,617 | |
| DocuSign, Inc.(a) | | | 3,783 | | | | 163,047 | |
| International Business Machines Corp. | | | 2,010 | | | | 318,706 | |
| Lam Research Corp. | | | 325 | | | | 232,674 | |
| Microsoft Corp. | | | 3,207 | | | | 1,215,164 | |
| Motorola Solutions, Inc. | | | 1,050 | | | | 339,013 | |
| Nice, Ltd., ADR(a)(b) | | | 1,113 | | | | 211,192 | |
| NVIDIA Corp. | | | 1,495 | | | | 699,212 | |
| Synopsys, Inc.(a) | | | 955 | | | | 518,785 | |
| Taiwan Semiconductor Manufacturing Co., Ltd., ADR | | | 4,145 | | | | 403,350 | |
| TE Connectivity, Ltd. | | | 2,430 | | | | 318,330 | |
| Texas Instruments, Inc. | | | 2,301 | | | | 351,386 | |
| Total Information Technology | | | | | | | 6,136,106 | |
| | | | | | | | | |
| Materials (3.32%) | | | | | | | | |
| Anglo American PLC, ADR | | | 9,895 | | | | 133,642 | |
| Freeport-McMoRan, Inc. | | | 5,105 | | | | 190,519 | |
| Linde PLC | | | 815 | | | | 337,223 | |
| Norsk Hydro ASA, ADR | | | 22,150 | | | | 128,248 | |
| Total Materials | | | | | | | 789,632 | |
| | | | | | | | | |
| Real Estate (2.41%) | | | | | | | | |
| Equity LifeStyle Properties, Inc. | | | 4,179 | | | | 297,127 | |
| Prologis, Inc. | | | 2,410 | | | | 276,981 | |
| Total Real Estate | | | | | | | 574,108 | |
| | | | | | | | | |
| TOTAL COMMON STOCKS | | | | | | | | |
| (Cost $20,248,170) | | | | | | | 22,866,466 | |
| | | 7 Day Yield | | | Shares | | | Value | |
| SHORT TERM INVESTMENTS (4.12%) | | | | | | | | | | | | |
| Money Market Fund (3.95%) | | | | | | | | | | | | |
| State Street Institutional Treasury Plus Money Market Fund (Premier Class) | | | | | | | | | | | | |
| (Cost $939,829) | | | 5.31 | % | | | 939,829 | | | $ | 939,829 | |
6 | November 30, 2023
ALPS Active Equity Opportunity ETF
| Schedule of Investments | November 30, 2023 |
| | | Shares | | | Value | |
| Investments Purchased with Collateral from Securities Loaned (0.17%) | | | | | | | | |
| State Street Navigator Securities Lending Government Money Market Portfolio, 5.37% | | | | | | | | |
| (Cost $41,114) | | | 41,114 | | | $ | 41,114 | |
| | | | | | | | | |
| TOTAL SHORT TERM INVESTMENTS | | | | | | | | |
| (Cost $980,943) | | | | | | | 980,943 | |
| | | | | | | | | |
| TOTAL INVESTMENTS (100.28%) | | | | | | | | |
| (Cost $21,229,113) | | | | | | $ | 23,847,409 | |
| LIABILITIES IN EXCESS OF OTHER ASSETS (-0.28%) | | | | | | | (67,553 | ) |
| NET ASSETS - 100.00% | | | | | | $ | 23,779,856 | |
| (a) | Non-income producing security. |
| (b) | Security, or a portion of the security position is currently on loan. The total market value of securities on loan is $284,453. |
See Notes to Financial Statements.
7 | November 30, 2023
ALPS Active Equity Opportunity ETF
| Statement of Assets and Liabilities | November 30, 2023 |
| ASSETS: | | | |
| Investments, at value(a) | | $ | 23,847,409 | |
| Receivable for investments sold | | | 120,035 | |
| Dividends receivable | | | 40,738 | |
| Total Assets | | | 24,008,182 | |
| | | | | |
| LIABILITIES: | | | | |
| Payable for investments purchased | | | 178,063 | |
| Payable to adviser | | | 9,149 | |
| Payable for collateral upon return of securities loaned | | | 41,114 | |
| Total Liabilities | | | 228,326 | |
| NET ASSETS | | $ | 23,779,856 | |
| | | | | |
| NET ASSETS CONSIST OF: | | | | |
| Paid-in capital | | $ | 43,708,610 | |
| Total distributable earnings/(accumulated losses) | | | (19,928,754 | ) |
| NET ASSETS | | $ | 23,779,856 | |
| | | | | |
| INVESTMENTS, AT COST | | $ | 21,229,113 | |
| | | | | |
| PRICING OF SHARES | | | | |
| Net Assets | | $ | 23,779,856 | |
| Shares of beneficial interest outstanding (Unlimited number of shares authorized, par value $0.01 per share) | | | 525,002 | |
| Net Asset Value, offering and redemption price per share | | $ | 45.29 | |
| (a) | Includes $284,453 of securities on loan. |
See Notes to Financial Statements.
8 | November 30, 2023
ALPS Active Equity Opportunity ETF
| Statement of Operations | For the Year Ended November 30, 2023 |
| INVESTMENT INCOME: | | | |
| Dividend Income* | | $ | 468,080 | |
| Securities Lending Income | | | 5,765 | |
| Total Investment Income | | | 473,845 | |
EXPENSES: | | | | |
| Investment adviser fees | | | 115,840 | |
| Net Expenses | | | 115,840 | |
| NET INVESTMENT INCOME | | | 358,005 | |
| | | | | |
REALIZED AND UNREALIZED GAIN/(LOSS): | | | | |
| Net realized gain on investments(a) | | | 311,923 | |
| Net realized loss on foreign currency transactions | | | (48 | ) |
| Total Net realized gain | | | 311,875 | |
| Net change in unrealized appreciation on investments | | | 856,217 | |
| Net change in unrealized appreciation on translation of assets and liabilities denominated in foreign currencies | | | 58 | |
| Total net change in unrealized appreciation | | | 856,275 | |
| NET REALIZED AND UNREALIZED GAIN ON INVESTMENTS | | | 1,168,150 | |
| NET INCREASE IN NET ASSETS RESULTING FROM OPERATIONS | | $ | 1,526,155 | |
| * | Net of foreign tax withholding of $3,004. |
| (a) | Includes realized gain or loss as a result of in-kind transactions (See Note 4 in Notes to Financial Statements). |
See Notes to Financial Statements.
9 | November 30, 2023
ALPS Active Equity Opportunity ETF
| Statements of Changes in Net Assets |
| | | For the Year Ended November 30, 2023 | | | For the Year Ended November 30, 2022 | |
| OPERATIONS: | | | | | | |
| Net investment income | | $ | 358,005 | | | $ | 374,530 | |
| Net realized gain | | | 311,875 | | | | 10,867,396 | |
| Net change in unrealized appreciation/(depreciation) | | | 856,275 | | | | (13,757,793 | ) |
| Net increase/(decrease) in net assets resulting from operations | | | 1,526,155 | | | | (2,515,867 | ) |
| | | | | | | | | |
| DISTRIBUTIONS TO SHAREHOLDERS: | | | | | | | | |
| From distributable earnings | | | (350,422 | ) | | | (438,679 | ) |
| Dividends to shareholders from tax return of capital | | | – | | | | (8,648 | ) |
| Total distributions | | | (350,422 | ) | | | (447,327 | ) |
| | | | | | | | | |
| CAPITAL SHARE TRANSACTIONS: | | | | | | | | |
| Proceeds from sale of shares | | | 1,129,999 | | | | 15,524,015 | |
| Cost of shares redeemed | | | (7,324,460 | ) | | | (35,496,905 | ) |
| Net decrease from capital share transactions | | | (6,194,461 | ) | | | (19,972,890 | ) |
| Net decrease in net assets | | | (5,018,728 | ) | | | (22,936,084 | ) |
| | | | | | | | | |
| NET ASSETS: | | | | | | | | |
| Beginning of year | | | 28,798,584 | | | | 51,734,668 | |
| End of year | | $ | 23,779,856 | | | $ | 28,798,584 | |
| | | | | | | | | |
| OTHER INFORMATION: | | | | | | | | |
| CAPITAL SHARE TRANSACTIONS: | | | | | | | | |
| Beginning shares | | | 675,002 | | | | 1,125,002 | |
| Shares sold | | | 25,000 | | | | 350,000 | |
| Shares redeemed | | | (175,000 | ) | | | (800,000 | ) |
| Shares outstanding, end of period | | | 525,002 | | | | 675,002 | |
See Notes to Financial Statements.
10 | November 30, 2023
ALPS Active Equity Opportunity ETF
| Financial Highlights | For a Share Outstanding Throughout the Periods Presented |
| | | For the Year Ended November 30, 2023 | | | For the Year Ended November 30, 2022 | | | For the Year Ended November 30, 2021 | | | For the Year Ended November 30, 2020 | | | For the Year Ended November 30, 2019 | |
| NET ASSET VALUE, BEGINNING OF PERIOD | | $ | 42.66 | | | $ | 45.99 | | | $ | 37.58 | | | $ | 34.70 | | | $ | 32.79 | |
| | | | | | | | | | | | | | | | | | | | | |
| INCOME FROM OPERATIONS: | | | | | | | | | | | | | | | | | | | | |
| Net investment income(a) | | | 0.66 | | | | 0.48 | | | | 0.42 | | | | 0.45 | | | | 0.48 | |
| Net realized and unrealized gain/(loss) | | | 2.62 | | | | (3.23 | ) | | | 8.43 | | | | 2.87 | (b) | | | 1.93 | |
| Total from investment operations | | | 3.28 | | | | (2.75 | ) | | | 8.85 | | | | 3.32 | | | | 2.41 | |
| | | | | | | | | | | | | | | | | | | | | |
| DISTRIBUTIONS: | | | | | | | | | | | | | | | | | | | | |
| From net investment income | | | (0.65 | ) | | | (0.57 | ) | | | (0.44 | ) | | | (0.44 | ) | | | (0.50 | ) |
| From tax return of capital | | | – | | | | (0.01 | ) | | | – | | | | – | | | | – | |
| Total distributions | | | (0.65 | ) | | | (0.58 | ) | | | (0.44 | ) | | | (0.44 | ) | | | (0.50 | ) |
| | | | | | | | | | | | | | | | | | | | | |
| NET INCREASE/(DECREASE) IN NET ASSET VALUE | | | 2.63 | | | | (3.33 | ) | | | 8.41 | | | | 2.88 | | | | 1.91 | |
| NET ASSET VALUE, END OF PERIOD | | $ | 45.29 | | | $ | 42.66 | | | $ | 45.99 | | | $ | 37.58 | | | $ | 34.70 | |
| TOTAL RETURN(c) | | | 7.81 | % | | | (5.98 | )% | | | 23.65 | % | | | 9.75 | % | | | 7.49 | % |
| | | | | | | | | | | | | | | | | | | | | |
| RATIOS/SUPPLEMENTAL DATA: | | | | | | | | | | | | | | | | | | | | |
| Net assets, end of period (in 000s) | | $ | 23,780 | | | $ | 28,799 | | | $ | 51,735 | | | $ | 71,400 | | | $ | 126,662 | |
| | | | | | | | | | | | | | | | | | | | | |
| Ratio of expenses to average net assets | | | 0.50 | %(e) | | | 0.52 | % | | | 0.52 | % | | | 0.52 | % | | | 0.52 | % |
| Ratio of net investment income to average net assets | | | 1.55 | % | | | 1.10 | % | | | 0.97 | % | | | 1.34 | % | | | 1.46 | % |
| Portfolio turnover rate(d) | | | 129 | % | | | 113 | % | | | 5 | % | | | 99 | % | | | 98 | % |
| (a) | Based on average shares outstanding during the period. |
| (b) | Net realized and unrealized gain on investments per share does not correlate to the aggregate of the net realized and unrealized gain/(loss) in the Statements of Operations for the period(s) presented, primarily due to the timing of the sales and repurchases of the Fund's shares in relation to the fluctuating market values for the Fund's portfolio. |
| (c) | Total return is calculated assuming an initial investment made at the net asset value at the beginning of the year and redemption at the net asset value on the last day of the year and assuming all distributions are reinvested at the reinvestment prices. Total return calculated for a period of less than one year is not annualized. |
| (d) | Portfolio turnover for periods less than one year are not annualized and does not include securities received or delivered from processing creations or redemptions in-kind. |
| (e) | Effective June 1, 2023, the investment adviser fee changed from 0.52% to 0.48%. |
See Notes to Financial Statements.
11 | November 30, 2023
ALPS Active Equity Opportunity ETF
| Notes to Financial Statements | November 30, 2023 |
1. ORGANIZATION
ALPS ETF Trust (the “Trust”), a Delaware statutory trust, is an open-end management investment company registered under the Investment Company Act of 1940, as amended (the “1940 Act”). As of November 30, 2023, the Trust consisted of twenty-three separate portfolios. Each portfolio represents a separate series of the Trust. This report pertains solely to the ALPS Active Equity Opportunity (formerly, Riverfront Dynamic US Flex-Cap ETF) (the “Fund”).
The investment objective of the ALPS Active Equity Opportunity Fund is to seek to provide capital appreciation. The Fund has elected to qualify as a diversified series of the Trust under the 1940 Act.
The Fund’s Shares (“Shares”) are listed on the NYSE Arca, Inc. (the “NYSE Arca”). The Fund issues and redeems Shares, at net asset value (“NAV”) in blocks of 25,000 Shares, each of which is called a “Creation Unit”. Creation Units are issued and redeemed principally in-kind for securities and/or cash. Except when aggregated in Creation Units, Shares are not redeemable securities of a Fund.
Pursuant to the Trust’s organizational documents, its Officers and Trustees are indemnified against certain liability arising out of the performance of their duties to the Trust. Additionally, in the normal course of business, the Trust enters into contracts with service providers that contain general indemnification clauses. The Trust’s maximum exposure under these arrangements is unknown, as this would involve future claims that may be made against the Trust that have not yet occurred.
2. SIGNIFICANT ACCOUNTING POLICIES
The following is a summary of significant accounting policies consistently followed by the Fund in the preparation of the financial statements. The accompanying financial statements were prepared in accordance with accounting principles generally accepted in the United States of America (“U.S. GAAP”). The preparation of financial statements in conformity with U.S. GAAP requires management to make certain estimates and assumptions that affect the reported amounts of assets and liabilities and disclosures of contingent assets and liabilities at the date of the financial statements and the reported amounts of revenue and expenses during the period. Actual results could differ from those estimates. The Fund is considered an investment company under U.S. GAAP and follows the accounting and reporting guidance applicable to investment companies in the Financial Accounting Standards Board (“FASB”) Accounting Standards Codification Topic 946.
A. Portfolio Valuation
The Fund’s NAV is determined daily, as of the close of regular trading on the New York Stock Exchange (the “NYSE”), normally 4:00 p.m. Eastern Time, on each day the NYSE is open for trading. The NAV is computed by dividing the value of all assets of the Fund (including accrued interest and dividends), less all liabilities (including accrued expenses and dividends declared but unpaid), by the total number of shares outstanding.
Portfolio securities listed on any exchange other than the NASDAQ Stock Market LLC (“NASDAQ”) are valued at the last sale price on the business day as of which such value is being determined. If there has been no sale on such day, the securities are valued at the mean of the most recent bid and ask prices on such day. Securities traded on the NASDAQ are valued at the NASDAQ Official Closing Price as determined by NASDAQ. Portfolio securities traded on more than one securities exchange are valued at the last sale price on the business day as of which such value is being determined at the close of the exchange representing the principal market for such securities. Portfolio securities traded in the over-the-counter market, but excluding securities traded on the NASDAQ, are valued at the last quoted sale price in such market.
The Fund’s investments are valued at market value or, in the absence of market value with respect to any portfolio securities, at fair value according to procedures adopted by the Trust’s Board of Trustees (the “Board”). Pursuant to Rule 2a-5 under the 1940 Act, the Board designated ALPS Advisors, Inc. (the "Adviser") as the valuation designee ("Valuation Designee") for the Fund to perform the fair value determinations relating to Fund investments. The Adviser may carry out its designated responsibilities as Valuation Designee through various teams and committees. When market quotations are not readily available or when events occur that make established valuation methods unreliable, securities of the Fund may be valued in good faith by the Valuation Designee. These securities generally include, but are not limited to, restricted securities (securities which may not be publicly sold without registration under the Securities Act of 1933) for which a pricing service is unable to provide a market price; securities whose trading has been formally suspended; a security whose market price is not available from a pre-established primary pricing source or the pricing source is not willing to provide a price; a security with respect to which an event has occurred that is most likely to materially affect the value of the security after the market has closed but before the calculation of a Fund’s NAV or make it difficult or impossible to obtain a reliable market quotation; or a security whose price, as provided by the pricing service, does not reflect the security’s “fair value” due to the security being de-listed from a national exchange or the security’s primary trading market is temporarily closed at a time when, under normal conditions, it would be open. As a general principle, the current “fair value” of a security would be the amount which the owner might reasonably expect to receive from the sale on the applicable exchange or principal market. A variety of factors may be considered in determining the fair value of such securities.
12 | November 30, 2023
ALPS Active Equity Opportunity ETF
| Notes to Financial Statements | November 30, 2023 |
B. Fair Value Measurements
The Fund discloses the classification of its fair value measurements following a three-tier hierarchy based on the inputs used to measure fair value. Inputs refer broadly to the assumptions that market participants would use in pricing the asset or liability, including assumptions about risk. Inputs may be observable or unobservable. Observable inputs reflect the assumptions market participants would use in pricing the asset or liability that are developed based on market data obtained from sources independent of the reporting entity. Unobservable inputs reflect the reporting entity’s own assumptions about the assumptions market participants would use in pricing the asset or liability that are developed based on the best information available.
Valuation techniques used to value the Fund’s investments by major category are as follows:
Equity securities, including restricted securities, for which market quotations are readily available, are valued at the last reported sale price or official closing price as reported by a third party pricing vendor on the primary market or exchange on which they are traded and are categorized as Level 1 in the hierarchy. In the event there were no sales during the day or closing prices are not available, securities are valued at the mean of the most recent quoted bid and ask prices on such day and are generally categorized as Level 2 in the hierarchy. Investments in open-end mutual funds are valued at their closing NAV each business day and are categorized as Level 1 in the hierarchy.
Changes in valuation techniques may result in transfers in or out of an assigned level within the disclosure hierarchy.
Various inputs are used in determining the value of the Fund’s investments as of the end of the reporting period. When inputs used fall into different levels of the fair value hierarchy, the level in the hierarchy within which the fair value measurement falls is determined based on the lowest level input that is significant to the fair value measurement in its entirety. The designated input levels are not necessarily an indication of the risk or liquidity associated with these investments.
These inputs are categorized in the following hierarchy under applicable financial accounting standards:
| Level 1 – | Unadjusted quoted prices in active markets for identical investments, unrestricted assets or liabilities that a Fund has the ability to access at the measurement date; |
| | |
| Level 2 – | Quoted prices which are not active, quoted prices for similar assets or liabilities in active markets or inputs other than quoted prices that are observable (either directly or indirectly) for substantially the full term of the asset or liability; and |
| | |
| Level 3 – | Significant unobservable prices or inputs (including the Fund’s own assumptions in determining the fair value of investments) where there is little or no market activity for the asset or liability at the measurement date. |
The following is a summary of the inputs used to value the Fund’s investments as of November 30, 2023:
ALPS Active Equity Opportunity ETF
| Investments in Securities at Value | | | Level 1 - Quoted and Unadjusted Prices | | | | Level 2 - Other Significant Observable Inputs | | | | Level 3 - Significant Unobservable Inputs | | | | Total | |
| Common Stocks* | | $ | 22,866,466 | | | $ | – | | | $ | – | | | $ | 22,866,466 | |
| Short Term Investments | | | 980,943 | | | | – | | | | – | | | | 980,943 | |
| Total | | $ | 23,847,409 | | | $ | – | | | $ | – | | | $ | 23,847,409 | |
| * | For a detailed sector breakdown, see the accompanying Schedule of Investments. |
The Fund did not have any securities that used significant unobservable inputs (Level 3) in determining fair value and there were no transfers into or out of Level 3 during the year ended November 30, 2023.
C. Securities Transactions and Investment Income
Securities transactions are recorded as of the trade date. Realized gains and losses from securities transactions are recorded on the specific identification in accordance with GAAP. Dividend income and capital gains distributions, if any, are recorded on the ex-dividend date. Interest income, if any, is recorded on the accrual basis, including amortization of premiums and accretion of discounts.
13 | November 30, 2023
ALPS Active Equity Opportunity ETF
| Notes to Financial Statements | November 30, 2023 |
D. Dividends and Distributions to Shareholders
Dividends from net investment income for the Fund, if any, are declared and paid monthly or as the Board may determine from time to time. Distributions of net realized capital gains earned by the Fund, if any, are distributed at least annually.
E. Federal Tax and Tax Basis Information
The timing and character of income and capital gain distributions are determined in accordance with income tax regulations, which may differ from U.S. GAAP. Reclassifications are made to the Fund’s capital accounts for permanent tax differences to reflect income and gains available for distribution (or available capital loss carryforwards) under income tax regulations.
For the year ended November 30, 2023, the following reclassifications, which had no impact on results of operations or net assets, were recorded to reflect permanent tax differences resulting primarily from in-kind transactions and prior year tax return true-ups:
| Fund | | Paid-in Capital | | | Total Distributable
Earnings/(Accumulated
Losses) | |
| ALPS Active Equity Opportunity ETF | | $ | 965,623 | | | $ | (965,623 | ) |
The tax character of the distributions paid during the fiscal years ended November 30, 2023 and November 30, 2022 was as follows:
| Fund | | Ordinary Income | | | Long-Term Capital Gain | | | Return of Capital | |
| November 30, 2023 | | | | | | | | | | | | |
| ALPS Active Equity Opportunity ETF | | $ | 350,422 | | | $ | – | | | $ | – | |
| Fund | | Ordinary Income | | | Long-Term Capital Gain | | | Return of Capital | |
| November 30, 2022 | | | | | | | | | | | | |
| ALPS Active Equity Opportunity ETF | | $ | 438,679 | | | $ | – | | | $ | 8,648 | |
The character of distributions made during the year may differ from its ultimate characterization for federal income tax purposes.
Under current law, capital losses maintain their character as short-term or long-term and are carried forward to the next tax year without expiration.
As of November 30, 2023, the following amounts are available as carry forwards to the next tax year:
| Fund | | Short-Term | | | Long-Term | |
| ALPS Active Equity Opportunity ETF | | $ | 13,634,546 | | | $ | 8,888,635 | |
During the year ended November 30, 2023, the Fund did not utilize any capital loss carryovers.
As of November 30, 2023, the components of distributable earnings/(accumulated losses) on a tax basis for each Fund were as follows:
| | | ALPS Active Equity
Opportunity ETF | |
| Accumulated net investment income | | $ | 1,838 | |
| Accumulated net realized loss on investments | | | (22,523,181 | ) |
| Net unrealized appreciation on investments | | | 2,592,589 | |
| Total | | $ | (19,928,754 | ) |
14 | November 30, 2023
ALPS Active Equity Opportunity ETF
| Notes to Financial Statements | November 30, 2023 |
As of November 30, 2023, the cost of investments for federal income tax purposes and accumulated net unrealized appreciation/(depreciation) on investments were as follows:
| Fund | | ALPS Active Equity
Opportunity ETF | |
| Gross appreciation (excess of value over tax cost) | | $ | 2,973,548 | |
| Gross depreciation (excess of tax cost over value) | | | (380,969 | ) |
| Net appreciation/(depreciation) of foreign currency | | | 10 | |
| Net unrealized appreciation/(depreciation) | | | 2,592,589 | |
| Cost of investments for income tax purposes | | $ | 21,254,830 | |
The differences between book-basis and tax-basis are primarily due to the deferral of losses from wash sales.
F. Income Taxes
No provision for income taxes is included in the accompanying financial statements, as the Fund intends to distribute to shareholders all taxable investment income and realized gains and otherwise comply with Subchapter M of the Internal Revenue Code of 1986, as amended, applicable to regulated investment companies. The Fund evaluates tax positions taken (or expected to be taken) in the course of preparing the Fund’s tax returns to determine whether these positions meet a “more-likely-than-not” standard that, based on the technical merits, have a more than fifty percent likelihood of being sustained by a taxing authority upon examination. A tax position that meets the “more-likely-than-not” recognition threshold is measured to determine the amount of benefit to recognize in the financial statements.
As of and during the year ended November 30, 2023, the Fund did not have a liability for any unrecognized tax benefits. The Fund files U.S. federal, state, and local tax returns as required. The Fund’s tax returns are subject to examination by the relevant tax authorities until expiration of the applicable statute of limitations, which is generally three years after the filing of the tax return, but may extend to four years in certain jurisdictions. The Fund’s tax returns for open years have incorporated no uncertain tax positions that require a provision for income taxes.
G. Lending of Portfolio Securities
The Fund has entered into a securities lending agreement with State Street Bank & Trust Co. (“SSB”), the Fund’s lending agent. The Fund may lend its portfolio securities only to borrowers that are approved by SSB. The Fund will limit such lending to not more than 33 1/3% of the value of its total assets. The Fund’s securities held at SSB as custodian shall be available to be lent except those securities the Fund or ALPS Advisors, Inc. specifically identifies in writing as not being available for lending. The borrower pledges and maintains with the Fund collateral consisting of cash (U.S. Dollars only), securities issued or guaranteed by the U.S. government or its agencies or instrumentalities, and cash equivalents (including irrevocable bank letters of credit) issued by a person other than the borrower or an affiliate of the borrower. The initial collateral received by the Fund is required to have a value of no less than 102% of the market value of the loaned securities for U.S equity securities and a value of no less than 105% of the market value for non-U.S. equity securities. The collateral is maintained thereafter, at a market value equal to not less than 102% of the current value of the U.S. equity securities on loan and not less than 105% of the current value of the non-U.S. equity securities on loan. The market value of the loaned securities is determined at the close of each business day and any additional required collateral is delivered to the Fund on the next business day. During the term of the loan, the Fund is entitled to all distributions made on or in respect of the loaned securities. Loans of securities are terminable at any time and the borrower, after notice, is required to return borrowed securities within the customary time period for settlement of securities transactions.
Any cash collateral received is reinvested in a money market fund managed by SSB as disclosed in the Fund’s Schedule of Investments and is reflected in the Statement of Assets and Liabilities as a payable for collateral upon return of securities loaned. Non-cash collateral, in the form of securities issued or guaranteed by the U.S. government or its agencies or instrumentalities, is not disclosed in the Fund’s Statement of Assets and Liabilities or the contractual maturity table below as it is held by the lending agent on behalf of the Fund, and the Fund does not have the ability to re-hypothecate these securities. Income earned by the Fund from securities lending activity is disclosed in the Statement of Operations.
The following is a summary of the Fund’s securities lending agreement and related cash and non-cash collateral received as of November 30, 2023:
| Fund | | Market Value of
Securities on Loan | | | Cash Collateral
Received | | | Non-Cash Collateral
Received | | | Total Collateral
Received | |
| ALPS Active Equity Opportunity ETF | | $ | 284,453 | | | $ | 41,114 | | | $ | 252,981 | | | $ | 294,095 | |
The risks of securities lending include the risk that the borrower may not provide additional collateral when required or may not return the securities when due. To mitigate these risks, the Fund benefits from a borrower default indemnity provided by SSB. SSB’s indemnity allows for full replacement of securities lent wherein SSB will purchase the unreturned loaned securities on the open market by applying the proceeds of the collateral, or to the
15 | November 30, 2023
ALPS Active Equity Opportunity ETF
| Notes to Financial Statements | November 30, 2023 |
extent such proceeds are insufficient or the collateral is unavailable, SSB will purchase the unreturned loan securities at SSB’s expense. However, the Fund could suffer a loss if the value of the investments purchased with cash collateral falls below the value of the cash collateral received.
The following table reflects a breakdown of transactions accounted for as secured borrowings, the gross obligation by the type of collateral pledged or securities loaned, and the remaining contractual maturity of those transactions as of November 30, 2023:
| ALPS Active Equity Opportunity | | Remaining Contractual Maturity of the Agreements |
| Securities Lending Transactions | | Overnight & Continuous | | Up to 30 Days | | | 30-90 Days | | | Greater than 90 Days | | | Total | |
| Common Stocks | | $41,114 | | $ | – | | | $ | – | | | $ | – | | | $ | 41,114 | |
| Total Borrowings | | | | | | | | | | | | | | | | | 41,114 | |
| Gross amount of recognized liabilities for securities lending (collateral received) | | $ | 41,114 | |
3. INVESTMENT ADVISORY FEE AND OTHER AFFILIATED TRANSACTIONS
ALPS Advisors, Inc. serves as the Fund’s investment adviser pursuant to an Investment Advisory Agreement with the Trust on behalf of the Fund (the “Advisory Agreement”). RiverFront Investment Group, LLC (the “Sub-Adviser”) served as the Fund’s sub-adviser pursuant to a sub-advisory agreement with the Trust (the ‘‘Sub-Advisory Agreement’’) until May 31, 2023. Effective June 1, 2023, RiverFront Investment Group, LLC ("RiverFront") ceased to serve as the Sub-Adviser to the Fund and the Adviser assumed all responsibility for selecting the investments of the Fund.
Pursuant to the Advisory Agreement, the Fund pays the Adviser an annual management fee for the services and facilities it provides, payable on a monthly basis as a percentage of the relevant Fund’s average daily net assets as set out below. The Advisory fee was reduced at the time of the removal of RiverFront as the Sub-Adviser.
| Fund | Advisory Fee |
| December 1, 2022 to May 31, 2023 | 0.52%(a) |
| June 1, 2023 to November 30, 2023 | 0.48% |
| (a) | The unitary advisory fee as a percentage of net assets was subject to the following breakpoints: (i) 0.52% for average net assets up to $600 million, (ii) 0.49% for average net assets equal to or greater than $600 million. |
Pursuant to the Sub-Advisory Agreement, the Adviser paid the Sub-Adviser a sub-advisory fee out of the Adviser’s advisory fee for the services it provided to the Fund. The fee was payable on a monthly basis at the annual rate of 0.35% of the Fund’s average daily net assets until May 31, 2023 when RiverFront ceased to serve as Sub-Adviser to the Fund.
Out of the unitary management fee, the Adviser pays substantially all expenses of the Fund, including the cost of transfer agency, custody, fund administration, legal, audit, trustees and other services, except for interest expenses, distribution fees or expenses, brokerage expenses, taxes and extraordinary expenses not incurred in the ordinary course of the Fund's business. The Adviser’s unitary management fee is designed to pay substantially all of the Fund's expenses and to compensate the Adviser for providing services for the Fund.
ALPS Fund Services, Inc., an affiliate of the Adviser, is the administrator for the Fund.
Effective July 1, 2023, each Trustee receives (1) a quarterly retainer of $25,000, (2) a per meeting fee of $15,000, (3) $2,500 for any special meeting held outside of a regularly scheduled board meeting, and (4) reimbursement for all reasonable out-of-pocket expenses relating to attendance at meetings. In addition, the Chairman of the Board receives a quarterly retainer of $5,000, the Chairman of the Audit Committee receives a quarterly retainer of $3,000, and the Chairman of the Nominating & Governance Committee receives a quarterly retainer of $2,000, each in connection with their respective roles. Prior to July 1, 2023, each Trustee received (1) a quarterly retainer of $20,000, (2) a per meeting fee of $10,000, (3) $2,500 for any special meeting held outside of a regularly scheduled board meeting, and (4) reimbursement for all reasonable out-of-pocket expenses relating to attendance at meetings. In addition, the Chairman of the Board received a quarterly retainer of $5,000, the Chairman of the Audit Committee received a quarterly retainer of $3,000, and the Chairman of the Nominating & Governance Committee received a quarterly retainer of $2,000, each in connection with their respective roles.
16 | November 30, 2023
ALPS Active Equity Opportunity ETF
| Notes to Financial Statements | November 30, 2023 |
4. PURCHASES AND SALES OF SECURITIES
For the year ended November 30, 2023, the cost of purchases and proceeds from sales of investment securities, excluding in-kind transactions and short-term investments, were as follows:
| Fund | | Purchases | | | Sales | |
| ALPS Active Equity Opportunity ETF | | $ | 29,636,042 | | | $ | 30,426,790 | |
For the year ended November 30, 2023, the cost of in-kind purchases and proceeds from in-kind sales were as follows:
| Fund | | Purchases | | | Sales | |
| ALPS Active Equity Opportunity ETF | | $ | 1,080,709 | | | $ | 7,309,116 | |
For the year ended November 30, 2023, the in-kind net realized gains/(losses) were as follows:
| Fund | | Net Realized Gain/(Loss) | |
| ALPS Active Equity Opportunity ETF | | $ | 947,412 | |
Gains on in-kind transactions are not considered taxable for federal income tax purposes and losses on in-kind transactions are also not deductible for tax purposes.
5. CAPITAL SHARE TRANSACTIONS
Shares are created and redeemed by the Fund only in Creation Unit size aggregations of 25,000 Shares. Only broker-dealers or large institutional investors with creation and redemption agreements called Authorized Participants (“AP”) are permitted to purchase or redeem Creation Units from the Fund. Such transactions are generally permitted on an in-kind basis, with a balancing cash component to equate the transaction to the NAV per unit of the Fund on the transaction date. Cash may be substituted equivalent to the value of certain securities generally when they are not available in sufficient quantity for delivery, not eligible for trading by the AP or as a result of other market circumstances.
6. RELATED PARTY TRANSACTIONS
The Fund engaged in cross trades with other funds in the Trust during the year ended November 30, 2023 pursuant to Rule 17a-7 under the 1940 Act. Cross trading is the buying or selling of portfolio securities between funds to which the Adviser serves as the investment adviser. The Board previously adopted procedures that apply to transactions between the Funds of the Trust pursuant to Rule 17a-7. These transactions related to cross trades during the period complied with the requirements set forth by Rule 17a-7 and the Trust’s procedures.
Transactions related to cross trades during the year ended November 30, 2023, were as follows:
| Fund | | Purchase Cost Paid | | | Sale Proceeds Received | | | Realized Gain/(Loss) on Sales | |
| ALPS Active Equity Opportunity ETF | | $ | 100,527 | | | $ | 77,187 | | | $ | (5,713 | ) |
7. MARKET RISK
The Fund is subject to investment and operational risks associated with financial, economic and other global market developments and disruptions, including those arising from war, terrorism, market manipulation, government interventions, defaults and shutdowns, political changes or diplomatic developments, public health emergencies (such as the spread of infectious diseases, pandemics and epidemics) and natural/environmental disasters, which can negatively impact the securities markets and cause the Fund to lose value. Securities in the Fund’s portfolio may underperform in comparison to securities in general financial markets, a particular financial market or other asset classes due to a number of factors, including inflation (or expectations for inflation), deflation (or expectations for deflation), interest rates, global demand for particular products or resources, market instability, debt crises and downgrades, embargoes, tariffs, sanctions and other trade barriers, regulatory events, other governmental trade or market control programs and related geopolitical events. In addition, the value of the Fund’s investments may be negatively affected by the occurrence of global events such as war, terrorism, environmental disasters, natural disasters or events, country instability, and infectious disease epidemics or pandemics.
17 | November 30, 2023
ALPS Active Equity Opportunity ETF
| Notes to Financial Statements | November 30, 2023 |
8. REGULATORY UPDATE
The SEC adopted rule and form amendments that will change the format and content of the Fund's annual and semi-annual reports. Certain information, including the financial statements, will not appear in the Fund's new tailored shareholder reports but will be available online, delivered free of charge upon request, and filed on a semi-annual basis on Form N-CSR. The rule and form amendments have a compliance date of July 24, 2024. At this time, the Trust is evaluating the impact of these rule and form amendment changes.
9. SUBSEQUENT EVENTS
Subsequent events, if any, after the date of the Statement of Assets and Liabilities have been evaluated through the date the financial statements were issued. Effective January 1, 2024, dividends from net investment income for the Fund, if any, are declared and paid quarterly or as the Board may determine from time to time.
18 | November 30, 2023
ALPS Active Equity Opportunity ETF
| Additional Information | November 30, 2023 (Unaudited) |
PROXY VOTING RECORDS, POLICIES AND PROCEDURES
Information regarding how each Fund voted proxies relating to portfolio securities during the most recent 12-month period ended June 30 and a description of the Fund’s proxy voting policies and procedures used in determining how to vote for proxies are available without charge on the SEC’s website at www.sec.gov and upon request, by calling (toll-free) 1-866-759-5679.
PORTFOLIO HOLDINGS
The Fund files a complete schedule of portfolio holdings with the U.S. Securities and Exchange Commission (“SEC”) for the first and third quarters of each fiscal year on Form N-PORT within 60 days after the end of the period. Copies of the Fund’s Form N-PORT are available without a charge, upon request, by contacting the Fund at 1-866-759-5679 and on the SEC’s website at https://www.sec.gov.
TAX INFORMATION
The Fund designates the following as a percentage of taxable ordinary income distributions, or up to the maximum amount allowable, for the calendar year ended December 31, 2022:
| | Qualified Dividend Income | Dividend Received Deduction |
| ALPS Active Equity Opportunity ETF | 100.00% | 100.00% |
In early 2023, if applicable, shareholders of record received this information for the distributions paid to them by the Fund during the calendar year 2022 via Form 1099. The Fund will notify shareholders in early 2024 of amounts paid to them by the Fund, if any, during the calendar year 2023.
19 | November 30, 2023
ALPS Active Equity Opportunity ETF
| Board Considerations Regarding Approval of Investment Advisory Agreement | November 30, 2023 (Unaudited) |
At its meetings held on June 5, 2023 and June 20, 2023, the Board of Trustees of the Trust (the “Board” or the “Trustees”), where each Trustee is not an "interested person" of the Trust within the meaning of the Investment Company Act of 1940, as amended (the “Independent Trustees”), evaluated a proposal to approve the continuance of the Investment Advisory Agreement between the Trust and ALPS Advisors, Inc. (the “Adviser” or “AAI”) with respect to the ALPS Active Equity Opportunity ETF ("RFFC" or the "Fund"). In evaluating the renewal of the Investment Advisory Agreement with respect to the Fund, the Board, including the Independent Trustees, considered various factors, including (i) the nature, extent and quality of the services provided by AAI with respect to the Fund under the Investment Advisory Agreement; (ii) the advisory fees and other expenses paid by the Fund compared to those of similar funds managed by other investment advisers; (iii) the costs of the services provided to the Fund by AAI and the profits realized by AAI and its affiliates from its relationship to the Fund; (iv) the extent to which economies of scale have been or would be realized if and as the assets of the Fund grow and whether fees reflect the economies of scale for the benefit of shareholders; and (v) any additional benefits and other considerations.
With respect to the nature, extent and quality of the services provided by AAI under the Investment Advisory Agreement, the Board considered and reviewed information concerning the services provided under the Investment Advisory Agreement, financial information regarding AAI and its parent company, information describing AAI’s current organization and the background and experience of the persons responsible for the day-to-day management of the Fund.
The Board reviewed information on the performance of the Fund and its applicable benchmark for the 1-, 3-, and 5-year periods, as applicable, and against the appropriate FUSE performance universe. Based on this review, the Board, including the Independent Trustees found that the nature and extent of services provided to the Fund under the Investment Advisory Agreement was appropriate and that the quality of such services was satisfactory.
The Board noted that the advisory fees for the Fund were unitary fees pursuant to which AAI assumes all expenses of the Fund (including the cost of transfer agency, custody, fund administration, legal, audit and other services) other than the payments under the Advisory Agreement, brokerage expenses, taxes, interest, litigation expenses and other extraordinary expenses.
Based on the information available to them, including the Fund-specific summary set forth below, the Board, including the Independent Trustees, concluded that the advisory fee rate for the Fund was reasonable under the circumstances and in light of the quality of the services provided.
The Board, including the Independent Trustees, considered other benefits available to AAI because of its relationship with the Fund and concluded that the advisory fees were reasonable taking into account any such benefits.
The Board, including the Independent Trustees, also considered with respect to the Fund the information provided by AAI about the costs and profitability of AAI with respect to the Fund, including the asset levels and other factors that influence the profitability and financial viability of the Fund. The Board, including the Independent Trustees, reviewed and noted the relatively small size of the Fund and the analysis AAI had conducted to support AAI’s assertion that it was not realizing any economies of scale with respect to such Fund. The Independent Trustees determined that AAI should continue to keep the Board informed on an ongoing basis of any significant developments (e.g., material increases in asset levels) so as to facilitate the Independent Trustees’ evaluation of whether further economies of scale have been achieved.
The Board, including the Independent Trustees, also considered other potential benefits available to AAI because of its relationship with the Fund, known as fall-out benefits.
With respect to the Fund, the Board, including the Independent Trustees, noted the following:
The gross management fee rate for RFFC is lower than the median of its FUSE expense group. RFFC’s net expense ratio is lower than the median of its FUSE expense group.
The Board, including the Independent Trustees, reviewed and noted the relatively small size of RFFC and the analysis AAI had conducted to support AAI’s assertion that it was not realizing any economies of scale with respect to RFFC.
In voting to renew the Investment Advisory Agreement with AAI, the Board, including the Independent Trustees, concluded that the terms of the Investment Advisory Agreement are reasonable and fair in light of the services to be performed, the fees paid by certain other funds, expenses to be incurred and such other matters as the members of the Board, including the Independent Trustees, considered relevant in the exercise of their reasonable business judgment. The Independent Trustees did not identify any single factor or group of factors as all important or controlling and considered all factors together.
20 | November 30, 2023
ALPS Active Equity Opportunity ETF
| Trustees & Officers | November 30, 2023 (Unaudited) |
The general supervision of the duties performed by the Adviser for the Fund under the Investment Advisory Agreement is the responsibility of the Board of Trustees. The Trust currently has four Trustees, each of whom have no affiliation or business connection with the Adviser or any of its affiliated persons and do not own any stock or other securities issued by the Adviser. These are the “non-interested” or “independent” Trustees (��Independent Trustees”).
The Independent Trustees of the Trust, their term of office and length of time served, their principal business occupations during the past five years, the number of portfolios in the Fund Complex overseen by each Independent Trustee, and other directorships, if any, held by the Trustee are shown below.
INDEPENDENT TRUSTEES
Name, Address and
Year of Birth of Officer* | Position(s) Held with Trust | Term of Office and Length of Time Served** | Principal Occupation(s) During Past 5 Years | Number of Portfolios in Fund Complex Overseen by Trustees*** | Other Directorships Held by Trustees |
Mary K. Anstine, 1940 | Trustee | Since March 2008 | Ms. Anstine is Trustee/Director of AV Hunter Trust and Colorado Uplift Board. | 38 | Ms. Anstine is a Trustee of ALPS Variable Investment Trust (7 funds); Financial Investors Trust (29 funds); and Reaves Utility Income Fund. |
Jeremy W. Deems, 1976 | Trustee | Since March 2008 | Mr. Deems is the Co-Founder and Chief Financial Officer of Green Alpha Advisors, LLC, a registered investment advisor, and Co-Portfolio Manager of the AXS Green Alpha ETF. | 38 | Mr. Deems is a Trustee of ALPS Variable Investment Trust (7 funds); Financial Investors Trust (29 funds); and Reaves Utility Income Fund; and Clough Funds Trust (1 fund). |
Rick A. Pederson, 1952 | Trustee | Since March 2008 | Mr. Pederson is Partner, Bow River Capital Partners (private equity management), 2003 - present; Board Member, Prosci Inc. (private business services) 2013-2016; Advisory Board Member, Citywide Banks (Colorado community bank) 2014- 2017; Board Member, Strong-Bridge Consulting, 2015- 2019; Board Member, IRI/ODMS Holdings LLC, 2017 – 2019; Director, National Western Stock Show (not for profit) 2010 - present; Director, History Colorado (not for profit) 2015- present; Director, Citywide Bank Advisory Board 2017-present; Trustee, Boettcher Foundation, 2018 -present. | 24 | Mr. Pederson is Trustee of Segall Bryant & Hamill Trust (14 funds) and Principal Real Estate Income Fund (1 fund). |
| * | The business address of the Trustee is c/o ALPS Advisors, Inc., 1290 Broadway, Suite 1000, Denver, Colorado 80203. |
| ** | This is the period for which the Trustee began serving the Trust. Each Trustee serves an indefinite term, until his or her successor is elected. |
| *** | The Fund Complex includes all series of the Trust and any other investment companies for which ALPS Advisors, Inc. provides investment advisory services. |
21 | November 30, 2023
ALPS Active Equity Opportunity ETF
| Trustees & Officers | November 30, 2023 (Unaudited) |
Name, Address and
Year of Birth of Officer* | Position(s) Held with Trust | Term of Office and Length of Time Served** | Principal Occupation(s) During Past 5 Years | Number of Portfolios in Fund Complex Overseen by Trustees*** | Other Directorships Held by Trustees |
Edmund J. Burke, 1961 | Trustee | Since December 2017 | Mr. Burke joined ALPS in 1991 and served as the President and Director of ALPS Holdings, Inc., and ALPS Advisors, Inc., and Director of ALPS Distributors, Inc., ALPS Fund Services, Inc. (“ALPS”), and ALPS Portfolio Solutions Distributor, Inc. (collectively, the “ALPS Companies”). Mr. Burke retired from the ALPS Companies in June 2019. Mr. Burke is currently a partner at ETF Action, a web-based system that provides data and analytics to registered investment advisers, (since 2020) and a Director of Alliance Bioenergy Plus, Inc., a technology company focused on emerging technologies in the renewable energy, biofuels, and bioplastics technology sectors (since 2020). | 33 | Mr. Burke is a Trustee of Clough Global Dividend and Income Fund (1 fund); Clough Global Equity Fund (1 fund); Clough Global Opportunities Fund (1 fund); Clough Funds Trust (1 fund); Liberty All-Star Equity Fund (1 fund); Director of the Liberty All-Star Growth Fund, Inc. (1 fund) and Financial Investors Trust (29 funds). |
| * | The business address of the Trustee is c/o ALPS Advisors, Inc., 1290 Broadway, Suite 1000, Denver, Colorado 80203. |
| ** | This is the period for which the Trustee began serving the Trust. Each Trustee serves an indefinite term, until his or her successor is elected. |
| *** | The Fund Complex includes all series of the Trust and any other investment companies for which ALPS Advisors, Inc. provides investment advisory services. |
22 | November 30, 2023
ALPS Active Equity Opportunity ETF
| Trustees & Officers | November 30, 2023 (Unaudited) |
OFFICERS
Name, Address and Year of Birth of Officer* | Position(s) Held with Trust | Length of Time Served** | Principal Occupation(s) During Past 5 Years |
Laton Spahr, 1975 | President | Since June 2021 | Mr. Spahr joined ALPS in 2019 and currently serves as President and Portfolio Manager of AAI. Prior to his current role, Mr. Spahr was a Senior Vice President and Strategy Leader of the Value & Income Team for Oppenheimer Funds from 2013 to 2019. |
Matthew Sutula, 1985 | Chief Compliance Officer (“CCO”) | Since December 2019 | Mr. Sutula joined ALPS in 2012 and currently serves as Chief Compliance Officer of AAI. Prior to his current role, Mr. Sutula served as interim Compliance Officer of the Trust (September 2019 to December 2019). Compliance Manager and Senior Compliance Analyst for AAI, as well as Compliance Analyst for AFS. Prior to joining ALPS, he spent seven years at Morningstar, Inc. in various analyst roles supporting the registered investment company databases. Mr. Sutula is also Chief Compliance Officer of Principal Real Estate Income Fund, ALPS Variable Investment Trust, Liberty All-Star Equity Fund and Liberty All-Star Growth Fund, Inc. From September 2019 to September 2022 he served as Chief Compliance Officer of RiverNorth Opportunities Fund, Inc. |
Erich Rettinger, 1985 | Treasurer | Since September 2023 | Mr. Rettinger is Vice President of AAI (since 2021) and serves as Treasurer of Principal Real Estate Income Fund, Liberty All-Star Equity Fund, LibertyAll-Star Growth Fund, Inc., and ALPS Variable Investment Trust. From December 2021 to October 2022 he also served as Treasurer of RiverNorth Opportunities Fund, Inc. Because of his position with AAI, Mr. Rettinger is deemed an affiliate of the Fund as defined under the 1940 Act. From 2013-2021, he served as Vice President and Fund Controller of ALPS Fund Services. |
Michael P. Lawlor, 1969 | Secretary | Since December 2022 | Mr. Lawlor joined ALPS in January 2022, and is currently Vice President and Principal Legal Counsel. Prior to joining ALPS, Mr. Lawlor was Lead Fund Counsel at Brighthouse Financial (insurance company) (January 2007-April 2021). Mr. Lawlor also serves as Secretary of Financial Investors Trust and ALPS Variable Investment Trust. |
Susan M. Cannon, 1974 | Assistant Secretary | Since May 2023 | Ms. Cannon joined ALPS in September 2022, and is currently a Senior Paralegal of ALPS Fund Services, Inc. Prior to joining ALPS, Ms. Cannon worked for World Premier Private Partnership, Brown Brothers Harriman & Co. |
| * | The business address of each Officer is c/o ALPS Advisors, Inc., 1290 Broadway, Suite 1000, Denver, Colorado 80203. Each Officer is deemed an affiliate of the Trust as defined under the 1940 Act. |
| ** | This is the period for which the Officer began serving the Trust. Each Officer serves an indefinite term, until his or her successor is elected. |
The Statement of Additional Information includes additional information about the Fund’s Trustees and is available, without charge, upon request by calling (toll-free) 1-866-759-5679.
23 | November 30, 2023

Table of Contents
| Performance Overview | 1 |
| Disclosure of Fund Expenses | 4 |
| Report of Independent Registered Public Accounting Firm | 5 |
| Financial Statements | |
| Schedule of Investments | 6 |
| Statement of Assets and Liabilities | 7 |
| Statement of Operations | 8 |
| Statements of Changes in Net Assets | 9 |
| Financial Highlights | 10 |
| Notes to Financial Statements | 11 |
| Additional Information | 17 |
| Board Considerations Regarding Approval of Investment Advisory Agreement and Investment Sub-Advisory Agreement | 18 |
| Trustees & Officers | 20 |
alpsfunds.com
ALPS Active REIT ETF
| Performance Overview | November 30, 2023 (Unaudited) |
Investment Objective
The ALPS Active REIT ETF (the "Fund") seeks total return through dividends and capital appreciation. The Fund will, under normal circumstances, seek to achieve its investment objective by investing at least 80% of its net assets in publicly traded equity securities of real estate investment trusts (“REITs”).
Performance Overview
For the year ended November 30, 2023, the listed REIT market has been characterized by significant volatility of returns primarily driven by changes in economic data and market views regarding inflation, interest rates, and discount rates. On the heels of a favorable second calendar quarter, renewed anxiety over higher long-term interest rates led to a decline in REIT prices in the third quarter. These concerns were exacerbated by geopolitical activity and conflicts in Eastern Europe and the Middle East and concerns over the potential for government monetary and fiscal policy errors which could further damage capital markets and the economy. More recent economic data resulted in a more favorable view regarding interest rates and inflation expectations causing a quick revaluation of REITs and positive returns of 10.4% for the S&P United States REIT Index in the month of November.
These general economic conditions have persisted throughout the Fund's fiscal year resulting in a choppy market, with the S&P United States REIT Index returning -1.75% for the twelve months ended November 30, 2023. For this same period, the Fund was able to slightly outperform its benchmark, producing returns of -1.54%, net of all fees and expenses.
Although the Fund’s sub-adviser believes REIT valuations have been discounted to attractive levels, capital markets remain jittery and susceptible to macroeconomic shocks and other exogenous events, as well as investor emotions. As of November 30, 2023, listed REITs were trading at an implied cap rate of 7.4% (net operating income/market value of total capitalization) and an average discount to net asset value of 11%. History suggests and the sub-adviser believes that investing at these valuation levels bodes well for future return prospects. Notwithstanding the data and performance during prior cycles, it is possible the markets will remain choppy until there is more clarity on interest rates, inflation rates, the peak and timing of this severe tightening cycle, and the impact on broader economic conditions in the United States.
Notwithstanding the recovery in REIT prices in November 2023, some negative sentiment weighing on REIT valuations and prices continues, including worries about rising interest rates and tightening conditions for real estate financing, deteriorating demand in the office property sector due to work-from-home concerns, and declines in rental rate growth across other sectors. While the cost of debt capital has increased for all real estate owners, the sub-adviser believes that there are very few companies in the public market that are facing real distress. The public REITs in the Fund generally employ low leverage, enjoy little near-term refinancing risk, and have ample liquidity. Net leverage in the Fund is currently less than 30%, with more than 80% of this debt at fixed rates with limited near-term maturities.
The office market remains challenged; however, the sector represents only 6% of the public market and continues to trade at a very large discount to the estimated private market value of their portfolios. As of November 30, 2023, the office property sector was trading at an implied cap rate of 9.0% and an average 29% discount to its net asset value. Most companies in the sector are down approximately 70% from their recent peak valuations. While major challenges remain and some office property owners and operators may not make it through this cycle, the sub-adviser believes there is significant negativity priced into the listed office sector and there is certainly the potential for some of these companies to rebound. The sub-adviser believes the negativity surrounding the office property sector, in many cases, has been unfairly extended to all property types. The sub-adviser believes this is particularly relevant in the public market, which is overweight non-core property types, with a very small office sector weight.
Over the years, the public market has done an excellent job of seeding, growing and cultivating niche real estate businesses into outstanding business models while generating excellent investment returns in the process. Great examples of this have historically included companies in the self-storage, student housing, single family rental and data center property types. This has resulted in the creation of dominant companies in certain sectors where the individual properties are relatively small, operational scale enhances margins, and where size results in a significant cost of capital advantage and improves access to capital. Property fundamentals and the outlook for these sectors are attractive with little of the difficulties and potential distress that is present in the office sector.
For the Fund's last fiscal year, the best performing property sectors included data centers, senior housing and shopping malls. Data centers benefited from stronger than expected leasing demand combined with attractive valuations as a number of short sellers had incorrectly focused on the sector as an opportunity. Regional malls and factory outlet centers are benefiting from better-than-expected leasing accompanied by discounted valuations. The worst performing sectors included office, net leased property, and sunbelt apartments.
Within the residential property sector, the single-family rental subsector has been a big outperformer during the Fund's last fiscal year. It represents a meaningful overweight in the Fund and the 19% discount to net asset value offers an excellent opportunity in a property type where the outlook is favorable. The Fund has been underweight apartment companies with Sunbelt market exposure as there is a significant amount of new supply being delivered in these markets which was not adequately reflected in valuations. Apartment companies with exposure to those markets underperformed and the underweight added value for the Fund.
1 | November 30, 2023
ALPS Active REIT ETF
| Performance Overview | November 30, 2023 (Unaudited) |
In the healthcare area, senior housing has been recovering nicely while medical office buildings and hospitals have materially lagged. The Fund's overweight to senior housing and underweight to medical office produced excess returns for the Fund. Lastly, the net lease sector has been a meaningful laggard as its sensitivity to interest rates has hurt its relative performance for the year. The underweight in this sector produced relative outperformance for the Fund.
Excess returns from sector and subsector allocations for the year have been partially offset by mixed performance results from stock selection, as a handful of larger positions in the Fund underperformed. These individual securities all fall into the category of “value” names in which the sub-adviser believes valuations are overly discounted and their ultimate recovery should result in outperformance for the Fund. The timing of relative valuation recovery is always difficult to precisely call, but the sub-adviser remains confident in these Fund positions.
The sub-adviser believes publicly traded real estate securities offer attractive total return potential and good portfolio diversification. In addition to the longstanding, traditional benefits of investment in listed REITs, short-term considerations are also favorable for the asset class. With few exceptions, the sub-adviser believes that property fundamentals are stable with strong occupancies and reasonable growth in net operating income. Most sectors should also benefit from a meaningfully lower level of development/new supply caused by the more restrictive financing conditions that exist today. Meanwhile, with the inflation rate coming down, it appears that the Federal Reserve is near the end of its tightening cycle. While the cost of debt capital has increased for all real estate owners, the sub-adviser believes that there are very few companies in the public market that are facing real distress. The public REITs in the portfolio employ low leverage, enjoy little near-term refinancing risk and have ample liquidity.
Fund Performance (as of November 30, 2023)
| | 1 Year | Since Inception^ |
| ALPS Active REIT ETF - NAV | -1.54% | 2.80% |
| ALPS Active REIT ETF - Market Price* | -1.57% | 2.81% |
| S&P United States REIT Index | -1.75% | 2.18% |
Total Expense Ratio (per the current prospectus) is 0.68%.
Performance data quoted represents past performance. Past performance does not guarantee future results. Total return figures assume reinvestment of dividends and capital gains distributions, if any. The table does not reflect the deduction of taxes that a shareholder would pay on Fund distributions or the redemption of Fund shares. Investment return and principal value of an investment will fluctuate so that an investor’s shares, when sold or redeemed, may be worth more or less than the original cost. Current performance data may be higher or lower than actual data quoted. For the most current month-end performance data please visit www.alpsfunds.com or call 1.866.759.5679.
Net Asset Value (NAV) is an exchange-traded fund’s per-share value. The per-share dollar amount of the fund is derived by dividing the total value of all the securities in its portfolio, less any liabilities, by the number of fund shares outstanding. Market Price is the price at which a share can currently be traded in the market. Information detailing the number of days the Market Price of the Fund was greater than the Fund’s NAV and the number of days it was less than the Fund’s NAV can be obtained at www.alpsfunds.com.
| ^ | The Fund commenced operations on February 25, 2021, with the first day of trading on the exchange of February 26, 2021. |
| * | Market Price means the official closing price of a share or, if it more accurately reflects the market value of a share at the time as of which the Fund calculates current net asset value per share, the price that is the midpoint of the bid-ask spread as of that time. It does not represent the returns an investor would receive if shares were traded at other times. |
The S&P United States REIT Index defines and measures the investable universe of publicly traded real estate investment trusts domiciled in the United States.
One cannot invest directly in an index. Index performance does not reflect fund performance.
The Fund’s shares are not individually redeemable. Investors buy and sell shares of the Fund on a secondary market. Only market makers or “authorized participants” may trade directly with the Fund, typically in blocks of 5,000 shares.
The ALPS Active REIT ETF is not suitable for all investors. Investments in the Fund are subject to investment risks, including possible loss of the principal amount invested.
ALPS Portfolio Solutions Distributor, Inc., a FINRA member, is the Distributor for the ALPS Active REIT ETF.
2 | November 30, 2023
ALPS Active REIT ETF
| Performance Overview | November 30, 2023 (Unaudited) |
Top Ten Holdings* (as of November 30, 2023)
| Simon Property Group, Inc. | 7.12% |
| Equinix, Inc. | 6.24% |
| Digital Realty Trust, Inc. | 6.13% |
| Realty Income Corp. | 5.90% |
| Rexford Industrial Realty, Inc. | 5.82% |
| Public Storage | 5.73% |
| Prologis, Inc. | 5.05% |
| VICI Properties, Inc. | 5.01% |
| Invitation Homes, Inc. | 4.79% |
| AvalonBay Communities, Inc. | 4.75% |
| Total % of Top 10 Holdings | 56.54% |
Sector Allocation* (as of November 30, 2023)
| Specialized REITs | 26.82% |
| Residential REITs | 17.91% |
| Retail REITs | 16.75% |
| Industrial REITs | 15.45% |
| Health Care REITs | 10.67% |
| Office REITs | 5.12% |
| Hotel & Resort REITs | 3.95% |
| Diversified REITs | 2.22% |
| Money Market Fund | 1.11% |
| Total | 100.00% |
Future holdings are subject to change.
Growth of $10,000 (as of November 30, 2023)
Comparison of change in value of a $10,000 investment in the Fund and the Index
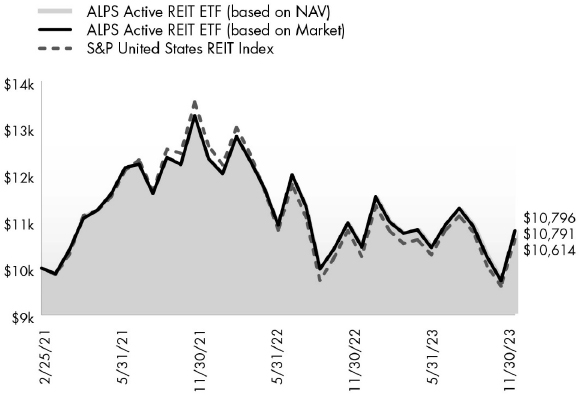
The chart above compares historical performance of a hypothetical investment of $10,000 in the Fund since inception with the performance of the Fund’s benchmark index. Results include the reinvestment of all dividends and capital gains distributions. Past performance does not guarantee future results. The chart does not reflect the deduction of taxes that a shareholder would pay on Fund distributions or the redemption of Fund shares.
3 | November 30, 2023
ALPS Active REIT ETF
| Disclosure of Fund Expenses | November 30, 2023 (Unaudited) |
Shareholder Expense Example: As a shareholder of a Fund, you incur certain ongoing costs, including management fees and other Fund expenses. These examples are intended to help you understand your ongoing costs (in dollars) of investing in the Fund and to compare these costs with the ongoing costs of investing in other funds. The example is based on an investment of $1,000 invested at the beginning of the six month period and held through November 30, 2023.
Actual Return: The first line of the table provides information about actual account values and actual expenses. You may use the information in this line, together with the amount you invested, to estimate the expenses that you incurred over the period. Simply divide your account value by $1,000 (for example, an $8,600 account value divided by $1,000 = 8.6), then multiply the result by the number in the first line under the heading entitled “Expenses Paid During Period” to estimate the expenses attributable to your investment during this period.
Hypothetical 5% Return: The second line of the table provides information about hypothetical account values and hypothetical expenses based on the Fund’s actual expense ratio and an assumed rate of return of 5% per year before expenses, which is not the Fund’s actual return. The hypothetical account values and expenses may not be used to estimate the actual ending account balance or expenses you paid for the period. You may use this information to compare ongoing costs of investing in the Fund and other funds. To do so, compare this 5% hypothetical example with the 5% hypothetical examples that appear in the shareholder reports of other funds.
The expenses shown in the table are meant to highlight ongoing Fund costs only and do not reflect any transaction costs, such as brokerage commissions and other fees to financial intermediaries. Therefore, the second line of the table is useful in comparing ongoing costs only, and will not help you determine the relative total costs of owning different funds. In addition, if these costs were included, your costs would have been higher.
| | Beginning Account Value 6/1/23 | Ending Account Value 11/30/23 | Expense Ratio(a) | Expenses Paid During Period 6/1/23 - 11/30/23(b) |
| ALPS Active REIT ETF | | | | |
| Actual | $1,000.00 | $1,033.70 | 0.68% | $3.47 |
| Hypothetical (5% return before expenses) | $1,000.00 | $1,021.66 | 0.68% | $3.45 |
| (a) | Annualized, based on the Fund's most recent fiscal half year expenses. |
| (b) | Expenses are equal to the Fund's annualized expense ratio multiplied by the average account value over the period, multiplied by the number of days in the most recent fiscal half year (183), divided by 365. |
4 | November 30, 2023
ALPS Active REIT ETF
Report of Independent Registered Public Accounting Firm
To the Shareholders of ALPS Active REIT ETF and Board of Trustees of ALPS ETF Trust
Opinion on the Financial Statements
We have audited the accompanying statement of assets and liabilities, including the schedule of investments, of ALPS Active REIT ETF (the “Fund”), a series of ALPS ETF Trust, as of November 30, 2023, the related statements of operations and changes in net assets, the related notes, and the financial highlights for the year then ended (collectively referred to as the “financial statements”). In our opinion, the financial statements present fairly, in all material respects, the financial position of the Fund as of November 30, 2023, the results of its operations, the changes in net assets, and the financial highlights for the year then ended, in conformity with accounting principles generally accepted in the United States of America.
The Fund’s financial statements and financial highlights for the years ended November 30, 2022, and prior, were audited by other auditors whose report dated January 27, 2023, expressed an unqualified opinion on those financial statements and financial highlights.
Basis for Opinion
These financial statements are the responsibility of the Fund’s management. Our responsibility is to express an opinion on the Fund’s financial statements based on our audit. We are a public accounting firm registered with the Public Company Accounting Oversight Board (United States) (“PCAOB”) and are required to be independent with respect to the Fund in accordance with the U.S. federal securities laws and the applicable rules and regulations of the Securities and Exchange Commission and the PCAOB.
We conducted our audit in accordance with the standards of the PCAOB. Those standards require that we plan and perform the audit to obtain reasonable assurance about whether the financial statements are free of material misstatement whether due to error or fraud.
Our audit included performing procedures to assess the risks of material misstatement of the financial statements, whether due to error or fraud, and performing procedures that respond to those risks. Such procedures included examining, on a test basis, evidence regarding the amounts and disclosures in the financial statements. Our procedures included confirmation of securities owned as of November 30, 2023, by correspondence with the custodian and brokers. Our audit also included evaluating the accounting principles used and significant estimates made by management, as well as evaluating the overall presentation of the financial statements. We believe that our audit provides a reasonable basis for our opinion.
We have served as the auditor of one or more investment companies advised by ALPS Advisors, Inc. since 2013.

COHEN & COMPANY, LTD.
Philadelphia, Pennsylvania
January 29, 2024
5 | November 30, 2023
ALPS Active REIT ETF
| Schedule of Investments | November 30, 2023 |
| Security Description | | Shares | | | Value | |
| COMMON STOCKS (98.86%) | | | | | | | | |
| Diversified REITs (2.22%) | | | | | | | | |
| Broadstone Net Lease, Inc. | | | 24,945 | | | $ | 399,120 | |
| | | | | | | | | |
| Health Care REITs (10.66%) | | | | | | | | |
| Healthpeak Properties, Inc. | | | 46,369 | | | | 803,111 | |
| Sabra Health Care REIT, Inc. | | | 18,167 | | | | 265,238 | |
| Ventas, Inc. | | | 18,615 | | | | 853,312 | |
| Total Health Care REITs | | | | | | | 1,921,661 | |
| | | | | | | | | |
| Hotel & Resort REITs (3.95%) | | | | | | | | |
| Host Hotels & Resorts, Inc. | | | 23,958 | | | | 418,547 | |
| Park Hotels & Resorts, Inc. | | | 19,728 | | | | 292,566 | |
| Total Hotel & Resort REITs | | | | | | | 711,113 | |
| | | | | | | | | |
| Industrial REITs (15.44%) | | | | | | | | |
| First Industrial Realty Trust, Inc. | | | 17,493 | | | | 823,046 | |
| Prologis, Inc. | | | 7,916 | | | | 909,786 | |
| Rexford Industrial Realty, Inc. | | | 21,309 | | | | 1,048,829 | |
| Total Industrial REITs | | | | | | | 2,781,661 | |
| | | | | | | | | |
| Office REITs (5.12%) | | | | | | | | |
| Alexandria Real Estate Equities, Inc. | | | 2,600 | | | | 284,440 | |
| Boston Properties, Inc. | | | 6,196 | | | | 352,738 | |
| Highwoods Properties, Inc. | | | 15,030 | | | | 284,819 | |
| Total Office REITs | | | | | | | 921,997 | |
| | | | | | | | | |
| Residential REITs (17.91%) | | | | | | | | |
| AvalonBay Communities, Inc. | | | 4,949 | | | | 855,880 | |
| Equity Residential | | | 9,919 | | | | 563,796 | |
| Essex Property Trust, Inc. | | | 2,017 | | | | 430,549 | |
| Invitation Homes, Inc. | | | 25,858 | | | | 862,623 | |
| Sun Communities, Inc. | | | 3,968 | | | | 513,221 | |
| Total Residential REITs | | | | | | | 3,226,069 | |
| | | | | | | | | |
| Retail REITs (16.75%) | | | | | | | | |
| InvenTrust Properties Corp. | | | 15,441 | | | | 372,437 | |
| Realty Income Corp. | | | 19,686 | | | | 1,062,257 | |
| Retail Opportunity Investments Corp. | | | 23,261 | | | | 299,369 | |
| Simon Property Group, Inc. | | | 10,271 | | | | 1,282,745 | |
| Total Retail REITs | | | | | | | 3,016,808 | |
| | | | | | | | | |
| Specialized REITs (26.81%) | | | | | | | | |
| Digital Realty Trust, Inc. | | | 7,951 | | | | 1,103,439 | |
| Equinix, Inc. | | | 1,378 | | | | 1,123,083 | |
| Extra Space Storage, Inc. | | | 2,889 | | | | 376,061 | |
| Security Description | | Shares | | | Value | |
| Specialized REITs (continued) | | | | | | | | |
| Public Storage | | | 3,989 | | | $ | 1,032,194 | |
| SBA Communications Corp. | | | 1,192 | | | | 294,376 | |
| VICI Properties, Inc. | | | 30,162 | | | | 901,542 | |
| Total Specialized REITs | | | | | | | 4,830,695 | |
| | | | | | | | | |
| TOTAL COMMON STOCKS | | | | | | | | |
| (Cost $18,206,322) | | | | | | | 17,809,124 | |
| | | 7 Day Yield | | | Shares | | | Value | |
| SHORT TERM INVESTMENTS (1.11%) | | | | | | | | | | | | |
| State Street Institutional Treasury Plus Money Market Fund (Premier Class) | | | 5.31 | % | | | 200,784 | | | | 200,784 | |
| | | | | | | | | | | | | |
| TOTAL SHORT TERM INVESTMENTS | | | | | | | | | | | | |
| | | | | | | | | | | | | |
| (Cost $200,784) | | | | | | | | | | | 200,784 | |
| | | | | | | | | | | | | |
| TOTAL INVESTMENTS (99.97%) | | | | | | | | | | | | |
| (Cost $18,407,106) | | | | | | | | | | $ | 18,009,908 | |
| OTHER ASSETS IN EXCESS OF LIABILITIES (0.03%) | | | | | | | | | | | 4,873 | |
| NET ASSETS - 100.00% | | | | | | | | | | $ | 18,014,781 | |
See Notes to Financial Statements.
6 | November 30, 2023
ALPS Active REIT ETF
| Statement of Assets and Liabilities | November 30, 2023 |
| ASSETS: | | | |
| Investments, at value | | $ | 18,009,908 | |
| Receivable for investments sold | | | 820,422 | |
| Dividends receivable | | | 21,366 | |
| Total Assets | | | 18,851,696 | |
| | | | | |
| LIABILITIES: | | | | |
| Payable for investments purchased | | | 827,298 | |
| Payable to adviser | | | 9,617 | |
| Total Liabilities | | | 836,915 | |
| NET ASSETS | | $ | 18,014,781 | |
| | | | | |
| NET ASSETS CONSIST OF: | | | | |
| Paid-in capital | | $ | 20,242,921 | |
| Total distributable earnings/(accumulated losses) | | | (2,228,140 | ) |
| NET ASSETS | | $ | 18,014,781 | |
| | | | | |
| INVESTMENTS, AT COST | | $ | 18,407,106 | |
| | | | | |
| PRICING OF SHARES | | | | |
| Net Assets | | $ | 18,014,781 | |
| Shares of beneficial interest outstanding (Unlimited number of shares authorized, par value $0.01 per share) | | | 750,002 | |
| Net Asset Value, offering and redemption price per share | | $ | 24.02 | |
See Notes to Financial Statements.
7 | November 30, 2023
ALPS Active REIT ETF
| Statement of Operations | For the Year Ended November 30, 2023 |
| INVESTMENT INCOME: | | | |
| Dividend Income | | $ | 665,170 | |
| Total Investment Income | | | 665,170 | |
| | | | | |
| EXPENSES: | | | | |
| Investment adviser and sub-adviser fees | | | 121,455 | �� |
| Total Expenses | | | 121,455 | |
| NET INVESTMENT INCOME | | | 543,715 | |
| | | | | |
| REALIZED AND UNREALIZED GAIN/(LOSS): | | | | |
| Net realized loss on investments(a) | | | (839,274 | ) |
| Net change in unrealized appreciation on investments | | | 9,646 | |
| NET REALIZED AND UNREALIZED LOSS ON INVESTMENTS | | | (829,628 | ) |
| NET DECREASE IN NET ASSETS RESULTING FROM OPERATIONS | | $ | (285,913 | ) |
| (a) | Includes realized gain or loss as a result of in-kind transactions (See Note 4 in Notes to Financial Statements). |
See Notes to Financial Statements.
8 | November 30, 2023
ALPS Active REIT ETF
Statements of Changes in Net Assets
| | | For the Year Ended November 30, 2023 | | | For the Year Ended November 30, 2022 | |
| OPERATIONS: | | | | | | | | |
| Net investment income | | $ | 543,715 | | | $ | 386,469 | |
| Net realized gain/(loss) | | | (839,274 | ) | | | 76,312 | |
| Net change in unrealized appreciation/(depreciation) | | | 9,646 | | | | (2,499,595 | ) |
| Net decrease in net assets resulting from operations | | | (285,913 | ) | | | (2,036,814 | ) |
| | | | | | | | | |
| DISTRIBUTIONS TO SHAREHOLDERS: | | | | | | | | |
| From distributable earnings | | | (519,658 | ) | | | (1,095,528 | ) |
| Dividends to shareholders from tax return of capital | | | (65,789 | ) | | | (83,271 | ) |
| Total distributions | | | (585,447 | ) | | | (1,178,799 | ) |
| | | | | | | | | |
| CAPITAL SHARE TRANSACTIONS: | | | | | | | | |
| Proceeds from sale of shares | | | 1,702,242 | | | | 4,984,526 | |
| Cost of shares redeemed | | | (856,387 | ) | | | (7,966,498 | ) |
| Net increase/(decrease) from capital share transactions | | | 845,855 | | | | (2,981,972 | ) |
| Net decrease in net assets | | | (25,505 | ) | | | (6,197,585 | ) |
| | | | | | | | | |
| NET ASSETS: | | | | | | | | |
| Beginning of year | | | 18,040,286 | | | | 24,237,871 | |
| End of year | | $ | 18,014,781 | | | $ | 18,040,286 | |
| | | | | | | | | |
| OTHER INFORMATION: | | | | | | | | |
| CAPITAL SHARE TRANSACTIONS: | | | | | | | | |
| Beginning shares | | | 715,002 | | | | 820,002 | |
| Shares sold | | | 70,000 | | | | 175,000 | |
| Shares redeemed | | | (35,000 | ) | | | (280,000 | ) |
| Shares outstanding, end of year | | | 750,002 | | | | 715,002 | |
See Notes to Financial Statements.
9 | November 30, 2023
ALPS Active REIT ETF
| Financial Highlights | For a Share Outstanding Throughout the Periods Presented |
| | | For the Year Ended November 30, 2023 | | | For the Year Ended November 30, 2022 | | | For the Period February 25, 2021 (Commencement of Operations) to November 30, 2021 | |
| NET ASSET VALUE, BEGINNING OF PERIOD | | $ | 25.23 | | | $ | 29.56 | | | $ | 24.62 | |
| | | | | | | | | | | | | |
| INCOME FROM OPERATIONS: | | | | | | | | | | | | |
| Net investment income(a) | | | 0.74 | | | | 0.54 | | | | 0.37 | |
| Net realized and unrealized gain/(loss) | | | (1.16 | ) | | | (3.39 | ) | | | 5.01 | |
| Total from investment operations | | | (0.42 | ) | | | (2.85 | ) | | | 5.38 | |
| | | | | | | | | | | | | |
| DISTRIBUTIONS: | | | | | | | | | | | | |
| From net investment income | | | (0.70 | ) | | | (0.53 | ) | | | (0.38 | ) |
| From net realized gains | | | – | | | | (0.83 | ) | | | (0.06 | ) |
| From tax return of capital | | | (0.09 | ) | | | (0.12 | ) | | | – | |
| Total distributions | | | (0.79 | ) | | | (1.48 | ) | | | (0.44 | ) |
| | | | | | | | | | | | | |
| NET INCREASE/(DECREASE) IN NET ASSET VALUE | | | (1.21 | ) | | | (4.33 | ) | | | 4.94 | |
| NET ASSET VALUE, END OF PERIOD | | $ | 24.02 | | | $ | 25.23 | | | $ | 29.56 | |
| TOTAL RETURN(b) | | | (1.54 | )% | | | (10.17 | )% | | | 22.01 | % |
| | | | | | | | | | | | | |
| RATIOS/SUPPLEMENTAL DATA: | | | | | | | | | | | | |
| Net assets, end of period (in 000s) | | $ | 18,015 | | | $ | 18,040 | | | $ | 24,238 | |
| | | | | | | | | | | | | |
| RATIOS TO AVERAGE NET ASSETS | | | | | | | | | | | | |
| Ratio of expenses to average net assets | | | 0.68 | % | | | 0.68 | % | | | 0.68 | %(c) |
| Ratio of net investment income to average net assets | | | 3.04 | % | | | 1.96 | % | | | 1.69 | %(c) |
| Portfolio turnover rate(d) | | | 68 | % | | | 120 | % | | | 92 | % |
| (a) | Based on average shares outstanding during the period. |
| (b) | Total return is calculated assuming an initial investment made at the net asset value at the beginning of the year and redemption at the net asset value on the last day of the year and assuming all distributions are reinvested at the reinvestment prices. Total return calculated for a period of less than one year is not annualized. |
| (c) | Annualized. |
| (d) | Portfolio turnover for periods less than one year are not annualized and does not include securities received or delivered from processing creations or redemptions in-kind. |
See Notes to Financial Statements.
10 | November 30, 2023
ALPS Active REIT ETF
| Notes to Financial Statements | November 30, 2023 |
1. ORGANIZATION
ALPS ETF Trust (the “Trust”), a Delaware statutory trust, is an open-end management investment company registered under the Investment Company Act of 1940, as amended (the “1940 Act”). As of November 30, 2023, the Trust consisted of twenty-three separate portfolios. Each portfolio represents a separate series of the Trust. This report pertains solely to the ALPS Active REIT ETF (the “Fund”). The investment objective of the Fund is to seek total return through dividends and capital appreciation. The Fund is considered non-diversified and may invest a greater portion of assets in securities of individual issuers than a diversified fund. As a result, changes in the market value of a single investment could cause greater fluctuations in share price than would occur in a diversified fund.
The Fund’s Shares (“Shares”) are listed on the Nasdaq Stock Market LLC (“Nasdaq Exchange”). The Fund issues and redeems Shares, at net asset value (“NAV”) in blocks of 5,000 Shares, each of which is called a “Creation Unit”. Creation Units are issued and redeemed principally in-kind for securities. Except when aggregated in Creation Units, Shares are not redeemable securities of the Fund.
Pursuant to the Trust’s organizational documents, its Officers and Trustees are indemnified against certain liability arising out of the performance of their duties to the Trust. Additionally, in the normal course of business, the Trust enters into contracts with service providers that contain general indemnification clauses. The Trust’s maximum exposure under these arrangements is unknown, as this would involve future claims that may be made against the Trust that have not yet occurred.
2. SIGNIFICANT ACCOUNTING POLICIES
The following is a summary of significant accounting policies consistently followed by the Fund in the preparation of the financial statements. The accompanying financial statements were prepared in accordance with accounting principles generally accepted in the United States of America (“U.S. GAAP”). The preparation of financial statements in conformity with U.S. GAAP requires management to make certain estimates and assumptions that affect the reported amounts of assets and liabilities and disclosures of contingent assets and liabilities at the date of the financial statements and the reported amounts of revenue and expenses during the period. Actual results could differ from those estimates. The Fund is considered an investment company under U.S. GAAP and follows the accounting and reporting guidance applicable to investment companies in the Financial Accounting Standards Board (“FASB”) Accounting Standards Codification Topic 946.
A. Portfolio Valuation
The Fund’s NAV is determined daily, as of the close of regular trading on the New York Stock Exchange ("NYSE"), normally 4:00 p.m. Eastern Time, on each day the NYSE is open for trading. The NAV is computed by dividing the value of all assets of the Fund (including accrued interest and dividends), less all liabilities (including accrued expenses and dividends declared but unpaid), by the total number of shares outstanding.
Portfolio securities listed on any exchange other than the NASDAQ Stock Market LLC (“NASDAQ”) are valued at the last sale price on the business day as of which such value is being determined. If there has been no sale on such day, the securities are valued at the mean of the most recent bid and ask prices on such day. Securities traded on the NASDAQ are valued at the NASDAQ Official Closing Price as determined by NASDAQ. Portfolio securities traded on more than one securities exchange are valued at the last sale price on the business day as of which such value is being determined at the close of the exchange representing the principal market for such securities. Portfolio securities traded in the over-the-counter market, but excluding securities traded on the NASDAQ, are valued at the last quoted sale price in such market.
The Fund’s investments are valued at market value or, in the absence of market value with respect to any portfolio securities, at fair value according to procedures adopted by the Trust’s Board of Trustees (the “Board”). Pursuant to Rule 2a-5 under the 1940 Act, the Board designated ALPS Advisors, Inc. (the "Adviser") as the valuation designee ("Valuation Designee") for the Fund to perform the fair value determinations relating to Fund investments. The Adviser may carry out its designated responsibilities as Valuation Designee through various teams and committees. When market quotations are not readily available or when events occur that make established valuation methods unreliable, securities of the Fund may be valued in good faith by the Valuation Designee. These securities generally include, but are not limited to, restricted securities (securities which may not be publicly sold without registration under the Securities Act of 1933) for which a pricing service is unable to provide a market price; securities whose trading has been formally suspended; a security whose market price is not available from a pre-established primary pricing source or the pricing source is not willing to provide a price; a security with respect to which an event has occurred that is most likely to materially affect the value of the security after the market has closed but before the calculation of the Fund’s NAV or make it difficult or impossible to obtain a reliable market quotation; or a security whose price, as provided by the pricing service, does not reflect the security’s “fair value” due to the security being de-listed from a national exchange or the security’s primary trading market is temporarily closed at a time when, under normal conditions, it would be open. As a general principle, the current “fair value” of a security would be the amount which the owner might reasonably expect to receive from the sale on the applicable exchange or principal market. A variety of factors may be considered in determining the fair value of such securities.
11 | November 30, 2023
ALPS Active REIT ETF
| Notes to Financial Statements | November 30, 2023 |
B. Fair Value Measurements
The Fund discloses the classification of its fair value measurements following a three-tier hierarchy based on the inputs used to measure fair value. Inputs refer broadly to the assumptions that market participants would use in pricing the asset or liability, including assumptions about risk. Inputs may be observable or unobservable. Observable inputs reflect the assumptions market participants would use in pricing the asset or liability that are developed based on market data obtained from sources independent of the reporting entity. Unobservable inputs reflect the reporting entity’s own assumptions about the assumptions market participants would use in pricing the asset or liability that are developed based on the best information available.
Valuation techniques used to value the Fund’s investments by major category are as follows:
Equity securities, including restricted securities, for which market quotations are readily available, are valued at the last reported sale price or official closing price as reported by a third party pricing vendor on the primary market or exchange on which they are traded and are categorized as Level 1 in the hierarchy. In the event there were no sales during the day or closing prices are not available, securities are valued at the mean of the most recent quoted bid and ask prices on such day and are generally categorized as Level 2 in the hierarchy. Investments in open-end mutual funds are valued at their closing NAV each business day and are categorized as Level 1 in the hierarchy.
Changes in valuation techniques may result in transfers in or out of an assigned level within the disclosure hierarchy.
Various inputs are used in determining the value of the Fund’s investments as of the end of the reporting period. When inputs used fall into different levels of the fair value hierarchy, the level in the hierarchy within which the fair value measurement falls is determined based on the lowest level input that is significant to the fair value measurement in its entirety. The designated input levels are not necessarily an indication of the risk or liquidity associated with these investments.
These inputs are categorized in the following hierarchy under applicable financial accounting standards:
| Level 1 | – | Unadjusted quoted prices in active markets for identical investments, unrestricted assets or liabilities that a Fund has the ability to access at the measurement date; |
| Level 2 | – | Quoted prices which are not active, quoted prices for similar assets or liabilities in active markets or inputs other than quoted prices that are observable (either directly or indirectly) for substantially the full term of the asset or liability; and |
| Level 3 | – | Significant unobservable prices or inputs (including the Fund’s own assumptions in determining the fair value of investments) where there is little or no market activity for the asset or liability at the measurement date. |
The following is a summary of the inputs used to value the Fund’s investments as of November 30, 2023:
ALPS Active REIT ETF
| Investments in Securities at Value | | Level 1 - Quoted and Unadjusted Prices | | | Level 2 - Other Significant Observable Inputs | | | Level 3 – Significant Unobservable Inputs | | | Total | |
| Common Stocks* | | $ | 17,809,124 | | | $ | – | | | $ | – | | | $ | 17,809,124 | |
| Short Term Investments | | | 200,784 | | | | – | | | | – | | | | 200,784 | |
| Total | | $ | 18,009,908 | | | $ | – | | | $ | – | | | $ | 18,009,908 | |
| * | For a detailed breakdown of sectors, see the accompanying Schedule of Investments. |
The Fund did not have any securities that used significant unobservable inputs (Level 3) in determining fair value and there were no transfers into or out of Level 3 during the year ended November 30, 2023.
C. Securities Transactions and Investment Income
Securities transactions are recorded as of the trade date. Realized gains and losses from securities transactions are recorded on the specific identification in accordance with GAAP. Dividend income and capital gains distributions, if any, are recorded on the ex-dividend date. Interest income, if any, is recorded on the accrual basis.
D. Dividends and Distributions to Shareholders
Dividends from net investment income of the Fund, if any, are declared and paid quarterly or as the Board may determine from time to time. Distributions of net realized capital gains earned by the Fund, if any, are distributed at least annually.
12 | November 30, 2023
ALPS Active REIT ETF
| Notes to Financial Statements | November 30, 2023 |
E. Federal Tax and Tax Basis Information
The timing and character of income and capital gain distributions are determined in accordance with income tax regulations, which may differ from U.S. GAAP. Reclassifications are made to the Fund’s capital accounts for permanent tax differences to reflect income and gains available for distribution (or available capital loss carryforwards) under income tax regulations.
For the year ended November 30, 2023, the following reclassifications, which had no impact on results of operations or net assets, were recorded to reflect permanent tax differences resulting primarily from in-kind transactions and prior year tax return true-up:
| Fund | | Paid-in Capital | | | Total Distributable Earnings/(Accumulated Losses) | |
| ALPS Active REIT ETF | | $ | 108,170 | | | $ | (108,170 | ) |
The tax character of the distributions paid during the fiscal years ended November 30, 2023 and November 30, 2022 was as follows:
| Fund | | Ordinary Income | | | Long-Term Capital Gain | | | Return of Capital | |
| November 30, 2023 | | | | | | | | | | | | |
| ALPS Active REIT ETF | | $ | 519,658 | | | $ | – | | | $ | 65,789 | |
| Fund | | Ordinary Income | | | Long-Term Capital Gain | | | Return of Capital | |
| November 30, 2022 | | | | | | | | | | | | |
| ALPS Active REIT ETF | | $ | 1,070,973 | | | $ | 24,555 | | | $ | 83,271 | |
Under current law, capital losses maintain their character as short-term or long-term and are carried forward to the next tax year without expiration. As of November 30, 2023, the following amounts are available as carry forwards to the next tax year:
| Fund | | Short-Term | | | Long-Term | |
| ALPS Active REIT ETF | | $ | 1,096,952 | | | $ | 678,704 | |
As of November 30, 2023, the components of distributable earnings/(accumulated losses) on a tax basis were as follows:
| Fund | | Accumulated Net Investment Income | | | Accumulated Net Realized Gain/(Loss) on Investments | | | Other Accumulated Gains | | | Net Unrealized Appreciation/(Depreciation) on Investments | | | Total | |
| ALPS Active REIT ETF | | $ | – | | | $ | (1,775,656 | ) | | $ | – | | | $ | (452,484 | ) | | $ | (2,228,140 | ) |
As of November 30, 2023, the cost of investments for federal income tax purposes and accumulated net unrealized appreciation/(depreciation) on investments were as follows:
| | | ALPS Active REIT ETF | |
| Gross appreciation (excess of value over tax cost) | | $ | 990,490 | |
| Gross depreciation (excess of tax cost over value) | | | (1,442,974 | ) |
| Net unrealized appreciation/(depreciation) | | $ | (452,484 | ) |
| Cost of investments for income tax purposes | | $ | 18,462,392 | |
The differences between book-basis and tax-basis are primarily due to the deferral of losses from wash sales.
F. Real Estate Investment Trusts (“REITs”)
As part of its investments in real estate related securities, the Fund will invest in REITs and is subject to certain risks associated with direct investment in REITs. REITs possess certain risks which differ from an investment in common stocks. REITs are financial vehicles that pool investors’ capital to acquire, develop and/or finance real estate and provide services to their tenants. REITs may concentrate their investments in specific geographic areas or in specific property types, e.g., regional malls, shopping centers, office buildings, apartment buildings and industrial warehouses. REITs may be affected by changes in the value of their underlying properties and by defaults by borrowers or tenants. REITs depend generally on their ability to generate cash flow to make distributions to shareowners, and certain REITs have self-liquidation provisions by which mortgages held may be paid in full and distributions of capital returns may be made at any time.
13 | November 30, 2023
ALPS Active REIT ETF
| Notes to Financial Statements | November 30, 2023 |
As REITs generally pay a higher rate of dividends than most other operating companies, to the extent application of the Fund's investment strategy results in the Fund investing in REIT shares, the percentage of the Fund's dividend income received from REIT shares will likely exceed the percentage of the Fund's portfolio that is comprised of REIT shares. Distributions received by the Fund from REITs may consist of dividends, capital gains and/or return of capital.
Dividend income from REITs is recognized on the ex-dividend date. The calendar year-end amounts of ordinary income, capital gains, and return of capital included in distributions received from the Fund's investments in REITs are reported to the Fund after the end of the calendar year; accordingly, the Fund estimates these amounts for accounting purposes until the characterization of REIT distributions is reported to the Fund after the end of the calendar year. Estimates are based on the most recent REIT distribution information available.
The performance of a REIT may be affected by its failure to qualify for tax-free pass-through of income under the Internal Revenue Code of 1986, as amended (the “Code”), or its failure to maintain exemption from registration under the 1940 Act. Due to the Fund's investments in REITs, the Fund may also make distributions in excess of the Fund's earnings and capital gains. Distributions, if any, in excess of the Fund's earnings and profits will first reduce the adjusted tax basis of a holder's shares and, after that basis has been reduced to zero, will constitute capital gains to the shareholder.
G. Income Taxes
No provision for income taxes is included in the accompanying financial statements, as the Fund intends to distribute to shareholders all taxable investment income and realized gains and otherwise comply with Subchapter M of the Code applicable to regulated investment companies. The Fund evaluates tax positions taken (or expected to be taken) in the course of preparing the Fund’s tax returns to determine whether these positions meet a “more-likely-than-not” standard that, based on the technical merits, have a more than fifty percent likelihood of being sustained by a taxing authority upon examination. A tax position that meets the “more-likely-than-not” recognition threshold is measured to determine the amount of benefit to recognize in the financial statements.
As of and during the year ended November 30, 2023, the Fund did not have a liability for any unrecognized tax benefits. The Fund files U.S. federal, state, and local tax returns as required. The Fund’s tax returns are subject to examination by the relevant tax authorities until expiration of the applicable statute of limitations, which is generally three years after the filing of the tax return, but may extend to four years in certain jurisdictions. Tax returns for open years have incorporated no uncertain tax positions that require a provision for income taxes.
H. Lending of Portfolio Securities
The Fund has entered into a securities lending agreement with State Street Bank & Trust Co. (“SSB”), the Fund’s lending agent. The Fund may lend its portfolio securities only to borrowers that are approved by SSB. The Fund will limit such lending to not more than 33 1/3% of the value of its total assets. The Fund’s securities held at SSB as custodian shall be available to be lent except those securities the Fund or ALPS Advisors, Inc. specifically identifies in writing as not being available for lending. The borrower pledges and maintains with the Fund collateral consisting of cash (U.S. Dollars only), securities issued or guaranteed by the U.S. government or its agencies or instrumentalities, and cash equivalents (including irrevocable bank letters of credit) issued by a person other than the borrower or an affiliate of the borrower. The initial collateral received by the Fund is required to have a value of no less than 102% of the market value of the loaned securities for U.S equity securities and a value of no less than 105% of the market value for non-U.S. equity securities. The collateral is maintained thereafter, at a market value equal to not less than 102% of the current value of the U.S. equity securities on loan and not less than 105% of the current value of the non-U.S. equity securities on loan. The market value of the loaned securities is determined at the close of each business day and any additional required collateral is delivered to the Fund on the next business day. During the term of the loan, the Fund is entitled to all distributions made on or in respect of the loaned securities. Loans of securities are terminable at any time and the borrower, after notice, is required to return borrowed securities within the customary time period for settlement of securities transactions.
Any cash collateral received is reinvested in a money market fund managed by SSB as disclosed in the Fund’s Schedule of Investments and is reflected in the Statement of Assets and Liabilities as a payable for collateral upon return of securities loaned. Non-cash collateral, in the form of securities issued or guaranteed by the U.S. government or its agencies or instrumentalities, is not disclosed in the Fund’s Statement of Assets and Liabilities as it is held by the lending agent on behalf of the Fund, and the Fund does not have the ability to re-hypothecate these securities. Income earned by the Fund from securities lending activity is disclosed in the Statement of Operations. During the year ended November 30, 2023, the Fund did not have any securities on loan.
14 | November 30, 2023
ALPS Active REIT ETF
| Notes to Financial Statements | November 30, 2023 |
3. INVESTMENT ADVISORY FEE AND OTHER AFFILIATED TRANSACTIONS
ALPS Advisors, Inc. serves as the Fund’s investment adviser pursuant to an Investment Advisory Agreement with the Trust on behalf of the Fund (the “Advisory Agreement”). Pursuant to the Advisory Agreement, the Fund pays the Adviser an annual management fee for the services and facilities it provides, payable on a monthly basis at the annual rate of 0.68% of the Fund’s average daily net assets.
Out of the unitary management fee, the Adviser pays substantially all expenses of the Fund, including the cost of sub-advisory, transfer agency, custody, fund administration, legal, audit, trustees and other services, except for acquired fund fees and expenses, interest expenses, distribution fees or expenses, brokerage expenses, taxes and extraordinary expenses not incurred in the ordinary course of the Fund's business. The Adviser’s unitary management fee is designed to pay substantially all of the Fund’s expenses and to compensate the Adviser for providing services to the Fund.
GSI Capital Advisors LLC (the “Sub-Adviser”) serves as the Fund's sub-adviser pursuant to a sub-advisory agreement with the Trust (the ‘‘Sub-Advisory Agreement’’). Pursuant to the Sub-Advisory Agreement, the Adviser pays the Sub-Adviser a sub-advisory fee out of the Adviser’s advisory fee for the services it provides. The fee is payable on a monthly basis at the annual rate of 0.35% of the Fund's average daily net assets.
ALPS Fund Services, Inc., an affiliate of the Adviser, is the administrator of the Fund.
Effective July 1, 2023, each Trustee receives (1) a quarterly retainer of $25,000, (2) a per meeting fee of $15,000, (3) $2,500 for any special meeting held outside of a regularly scheduled board meeting, and (4) reimbursement for all reasonable out-of-pocket expenses relating to attendance at meetings. In addition, the Chairman of the Board receives a quarterly retainer of $5,000, the Chairman of the Audit Committee receives a quarterly retainer of $3,000, and the Chairman of the Nominating & Governance Committee receives a quarterly retainer of $2,000, each in connection with their respective roles. Prior to July 1, 2023, each Trustee received (1) a quarterly retainer of $20,000, (2) a per meeting fee of $10,000, (3) $2,500 for any special meeting held outside of a regularly scheduled board meeting, and (4) reimbursement for all reasonable out-of-pocket expenses relating to attendance at meetings. In addition, the Chairman of the Board received a quarterly retainer of $5,000, the Chairman of the Audit Committee received a quarterly retainer of $3,000, and the Chairman of the Nominating & Governance Committee received a quarterly retainer of $2,000, each in connection with their respective roles.
4. PURCHASES AND SALES OF SECURITIES
For the year ended November 30, 2023, the cost of purchases and proceeds from sales of investment securities, excluding short-term investments and in-kind transactions, were as follows:
| Fund | | Purchases | | | Sales | |
| ALPS Active REIT ETF | | $ | 12,213,069 | | | $ | 12,002,451 | |
For the year ended November 30, 2023, the cost of in-kind purchases and proceeds from in-kind sales were as follows:
| Fund | | Purchases | | | Sales | |
| ALPS Active REIT ETF | | $ | 1,666,279 | | | $ | 833,592 | |
For the year ended November 30, 2023, the ALPS Active REIT ETF had in-kind net realized gain of $68,420.
Gains on in-kind transactions are not considered taxable for federal income tax purposes and losses on in-kind transactions are also not deductible for tax purposes.
5. CAPITAL SHARE TRANSACTIONS
Shares are created and redeemed by the Fund only in Creation Unit size aggregations of 5,000 Shares. Only broker-dealers or large institutional investors with creation and redemption agreements called Authorized Participants (“AP”) are permitted to purchase or redeem Creation Units from the Fund. Such transactions are generally permitted on an in-kind basis, with a balancing cash component to equate the transaction to the NAV per unit of the Fund on the transaction date. Cash may be substituted equivalent to the value of certain securities generally when they are not available in sufficient quantity for delivery, not eligible for trading by the AP or as a result of other market circumstances.
15 | November 30, 2023
ALPS Active REIT ETF
| Notes to Financial Statements | November 30, 2023 |
6. MARKET RISK
The Fund is subject to investment and operational risks associated with financial, economic and other global market developments and disruptions, including those arising from war, terrorism, market manipulation, government interventions, defaults and shutdowns, political changes or diplomatic developments, public health emergencies (such as the spread of infectious diseases, pandemics and epidemics) and natural/environmental disasters, which can negatively impact the securities markets and cause the Fund to lose value. Securities in the Fund’s portfolio may underperform in comparison to securities in general financial markets, a particular financial market or other asset classes due to a number of factors, including inflation (or expectations for inflation), deflation (or expectations for deflation), interest rates, global demand for particular products or resources, market instability, debt crises and downgrades, embargoes, tariffs, sanctions and other trade barriers, regulatory events, other governmental trade or market control programs and related geopolitical events. In addition, the value of the Fund’s investments may be negatively affected by the occurrence of global events such as war, terrorism, environmental disasters, natural disasters or events, country instability, and infectious disease epidemics or pandemics.
7. REGULATORY UPDATE
The U.S. Securities and Exchange Commission ("SEC") adopted rule and form amendments that will change the format and content of the Fund's annual and semi-annual reports. Certain information, including the financial statements, will not appear in the Fund's new tailored shareholder reports but will be available online, delivered free of charge upon request, and filed on a semi-annual basis on Form N-CSR. The rule and form amendments have a compliance date of July 24, 2024. At this time, the Trust is evaluating the impact of these rule and form amendment changes.
8. SUBSEQUENT EVENTS
Subsequent events, if any, after the date of the Statement of Assets and Liabilities have been evaluated through the date the financial statements were issued. Management has determined that there were no subsequent events to report through the issuance of these financial statements.
16 | November 30, 2023
ALPS Active REIT ETF
| Additional Information | November 30, 2023 (Unaudited) |
PROXY VOTING RECORDS, POLICIES AND PROCEDURES
Information regarding how the Fund voted proxies relating to portfolio securities during the most recent 12-month period ended June 30 and a description of the Fund’s proxy voting policies and procedures used in determining how to vote for proxies are available without charge on the SEC’s website at www.sec.gov and upon request, by calling (toll-free) 1-866-759-5679.
PORTFOLIO HOLDINGS
The Fund files a complete schedule of portfolio holdings with the U.S. Securities and Exchange Commission (“SEC”) for the first and third quarters of each fiscal year on Form N-PORT within 60 days after the end of the period. Copies of the Fund’s Form N-PORT are available without a charge, upon request, by contacting the Fund at 1-866-759-5679 and on the SEC’s website at https://www.sec.gov.
TAX INFORMATION
The ALPS Active REIT ETF designates the following as a percentage of taxable ordinary income distributions, or up to the maximum amount allowable, for the calendar year ended December 31, 2022:
| | Qualified Dividend Income | Dividend Received Deduction | 199A |
| ALPS Active REIT ETF | 0.00% | 0.00% | 99.21% |
In early 2023, if applicable, shareholders of record received this information for the distributions paid to them by the Fund during the calendar year 2022 via Form 1099. The Fund will notify shareholders in early 2024 of amounts paid to them by the Fund, if any, during the calendar year 2023.
17 | November 30, 2023
ALPS Active REIT ETF
| Board Considerations Regarding Approval of Investment Advisory Agreement and Investment Sub-Advisory Agreement | November 30, 2023 (Unaudited) |
At its meetings held on June 5, 2023 and June 20, 2023, the Board of Trustees of the Trust (the “Board” or the “Trustees”), where each Trustee is not an “interested person” of the Trust within the meaning of the Investment Company Act of 1940, as amended (the “Independent Trustees”), evaluated a proposal to approve the continuance of the Investment Advisory Agreement between the Trust and ALPS Advisors, Inc. (the “Adviser” or “AAI”) with respect to the ALPS Active REIT ETF ("REIT" or the "Fund") and the Investment Sub-Advisory Agreement between AAI and GSI Capital Advisors LLC (the “Sub-Adviser” or “GSI”) with respect to REIT (the “GSI Sub-Advisory Agreement”). In evaluating the renewal of the Investment Advisory Agreement with respect to the Fund, the Board, including the Independent Trustees, considered various factors, including (i) the nature, extent and quality of the services provided by AAI with respect to the Fund under the Investment Advisory Agreement; (ii) the advisory fees and other expenses paid by the Fund compared to those of similar funds managed by other investment advisers; (iii) the costs of the services provided to the Fund by AAI and the profits realized by AAI and its affiliates from its relationship to the Fund; (iv) the extent to which economies of scale have been or would be realized if and as the assets of the Fund grow and whether fees reflect the economies of scale for the benefit of shareholders; and (v) any additional benefits and other considerations.
With respect to the nature, extent and quality of the services provided by AAI under the Investment Advisory Agreement, the Board considered and reviewed information concerning the services provided under the Investment Advisory Agreement, financial information regarding AAI and its parent company, information describing AAI’s current organization and the background and experience of the persons responsible for the day-to-day management of the Fund.
The Board reviewed information on the performance of the Fund and its applicable benchmark for the 1-, 3-, and 5-year periods, as applicable, and against the appropriate FUSE performance universe. Based on this review, the Board, including the Independent Trustees found that the nature and extent of services provided to the Fund under the Investment Advisory Agreement was appropriate and that the quality of such services was satisfactory.
The Board noted that the advisory fees for the Fund were unitary fees pursuant to which AAI assumes all expenses of the Fund (including the cost of transfer agency, custody, fund administration, legal, audit and other services) other than the payments under the Advisory Agreement, brokerage expenses, taxes, interest, litigation expenses and other extraordinary expenses.
Based on the information available to them, including the Fund-specific summary set forth below, the Board, including the Independent Trustees, concluded that the advisory fee rate for the Fund was reasonable under the circumstances and in light of the quality of the services provided.
The Board, including the Independent Trustees, considered other benefits available to AAI because of its relationship with the Fund and concluded that the advisory fees were reasonable taking into account any such benefits.
The Board, including the Independent Trustees, also considered with respect to the Fund the information provided by AAI about the costs and profitability of AAI with respect to the Fund, including the asset levels and other factors that influence the profitability and financial viability of the Fund. The Board, including the Independent Trustees, reviewed and noted the relatively small size of the Fund and the analysis AAI had conducted to support AAI’s assertion that it was not realizing any economies of scale with respect to such Fund. The Independent Trustees determined that AAI should continue to keep the Board informed on an ongoing basis of any significant developments (e.g., material increases in asset levels) so as to facilitate the Independent Trustees’ evaluation of whether further economies of scale have been achieved.
The Board, including the Independent Trustees, also considered other potential benefits available to AAI because of its relationship with the Fund, known as fall-out benefits.
With respect to the Fund, the Board, including the Independent Trustees, noted the following:
The gross management fee rate for REIT is higher than the median of its FUSE expense group. REIT’s net expense ratio is higher than the median of its FUSE expense group.
The Board took into account, among other things, supplemental information provided by the Adviser showing REIT’s total expenses were in line with the total expenses of peer groups deemed by the Adviser to be more comparable, including peer groups comprised of a broad group of funds that invest in the real estate investment trust asset class, including comparable ETFs and mutual funds. The Board also considered the comparatively strong performance of the Fund relative to peers over the 1-year period and the Adviser’s assertion that, given the Fund’s current assets, any economies of scale were not yet a material benefit as REIT seeks further growth.
The Board, including the Independent Trustees, reviewed and noted the relatively small size of REIT and the analysis AAI had conducted to support AAI’s assertion that it was not realizing any economies of scale with respect to REIT.
18 | November 30, 2023
ALPS Active REIT ETF
| Board Considerations Regarding Approval of Investment Advisory Agreement and Investment Sub-Advisory Agreement | November 30, 2023 (Unaudited) |
In voting to renew the Investment Advisory Agreement with AAI, the Board, including the Independent Trustees, concluded that the terms of the Investment Advisory Agreement are reasonable and fair in light of the services to be performed, the fees paid by certain other funds, expenses to be incurred and such other matters as the members of the Board, including the Independent Trustees, considered relevant in the exercise of their reasonable business judgment. The Independent Trustees did not identify any single factor or group of factors as all important or controlling and considered all factors together.
GSI Sub-Advisory Agreement
The Board, including the Independent Trustees, discussed the GSI Sub-Advisory Agreement.
In evaluating the GSI Sub-Advisory Agreement, the Board, including the Independent Trustees, considered various factors, including (i) the nature, extent and quality of the services provided by GSI with respect to REIT under the GSI Sub-Advisory Agreement; (ii) the advisory fees and other expenses paid by REIT compared to those of similar funds managed by other investment advisers; (iii) the profitability to GSI of its sub-advisory relationship with REIT and the reasonableness of compensation to GSI; (iv) the extent to which economies of scale would be realized if, and as, REIT’s assets increase, and whether the fee level in the GSI Sub-Advisory Agreement reflects these economies of scale; and (v) any additional benefits and other considerations.
With respect to the nature, extent and quality of the services provided by GSI under the GSI Sub-Advisory Agreement, the Board, including the Independent Trustees, considered and reviewed information concerning the services provided under the GSI Sub-Advisory Agreement, REIT’s performance, financial information regarding GSI, information describing GSI’s current organization and the background and experience of the persons responsible for the day-to-day management of REIT. Based upon their review, the Board, including the Independent Trustees, concluded that GSI was qualified to oversee the portfolio management of REIT and that the services provided by GSI to REIT are satisfactory. The Board, including the Independent Trustees, considered that the contractual sub-advisory fee to be paid to GSI with respect to REIT was 0.35% of REIT’s average daily net assets out of a total management fee of 0.68% of REIT’s average daily net assets.
In reviewing REIT’s profitability with respect to GSI, the Board, including the Independent Trustees, considered the costs and resources required to manage REIT.
The Board, including the Independent Trustees, also considered any other benefits that have been and may be realized by GSI from its relationship with REIT, known as fall-out benefits.
The Board, including the Independent Trustees, considered the extent to which economies of scale may be realized if REIT’s assets continue to grow in size and whether fee levels reflect a reasonable sharing of such economies of scale for the benefit of the Fund’s investors. The Board, including the Independent Trustees, noted that REIT launched in February 2021 and had not yet achieved economies of scale in terms of assets. The Independent Trustees determined that AAI should continue to keep the Board informed on an ongoing basis of any significant developments (e.g., material increases in asset levels) so as to facilitate the Independent Trustees’ evaluation of whether further economies of scale have been achieved with respect to REIT.
In voting to approve the GSI Sub-Advisory Agreement, the Board, including the Independent Trustees, concluded that the terms of the GSI Sub- Advisory Agreement are reasonable and fair in light of the services performed, expenses incurred and such other matters as the Board, including the Independent Trustees, considered relevant in the exercise of their reasonable business judgment. The Board, including the Independent Trustees, did not identify any single factor or group of factors as all important or controlling and considered all factors together.
19 | November 30, 2023
ALPS Active REIT ETF
| Trustees & Officers | November 30, 2023 (Unaudited) |
The general supervision of the duties performed by the Adviser for the Fund under the Investment Advisory Agreement is the responsibility of the Board of Trustees. The Trust currently has four Trustees, each of whom have no affiliation or business connection with the Adviser or any of its affiliated persons and do not own any stock or other securities issued by the Adviser. These are the “non-interested” or “independent” Trustees (“Independent Trustees”).
The Independent Trustees of the Trust, their term of office and length of time served, their principal business occupations during the past five years, the number of portfolios in the Fund Complex overseen by each Independent Trustee, and other directorships, if any, held by the Trustee are shown below.
INDEPENDENT TRUSTEES
Name, Address and Year of Birth of Officer* | Position(s) Held with Trust | Length of Time Served** | Principal Occupation(s) During Past 5 Years | Number of Portfolios in Fund Complex Overseen by Trustees*** | Other Directorships Held by Trustees |
Mary K. Anstine, 1940 | Trustee | Since March 2008 | Ms. Anstine is Trustee/Director of AV Hunter Trust and Colorado Uplift Board. | 38 | Ms. Anstine is a Trustee of ALPS Variable Investment Trust (7 funds); Financial Investors Trust (29 funds); and Reaves Utility Income Fund. |
Jeremy W. Deems, 1976 | Trustee | Since March 2008 | Mr. Deems is the Co-Founder and Chief Financial Officer of Green Alpha Advisors, LLC, a registered investment advisor, and Co-Portfolio Manager of the AXS Green Alpha ETF. | 38 | Mr. Deems is a Trustee of ALPS Variable Investment Trust (7 funds); Financial Investors Trust (29 funds); and Reaves Utility Income Fund; and Clough Funds Trust (1 fund). |
Rick A. Pederson, 1952 | Trustee | Since March 2008 | Mr. Pederson is Partner, Bow River Capital Partners (private equity management), 2003 - present; Board Member, Prosci Inc. (private business services) 2013-2016; Advisory Board Member, Citywide Banks (Colorado community bank) 2014- 2017; Board Member, Strong-Bridge Consulting, 2015- 2019; Board Member, IRI/ODMS Holdings LLC, 2017 – 2019; Director, National Western Stock Show (not for profit) 2010 - present; Director, History Colorado (not for profit) 2015- present; Director, Citywide Bank Advisory Board 2017-present; Trustee, Boettcher Foundation, 2018 -present. | 24 | Mr. Pederson is Trustee of Segall Bryant & Hamill Trust (14 funds) and Principal Real Estate Income Fund (1 fund). |
| * | The business address of the Trustee is c/o ALPS Advisors, Inc., 1290 Broadway, Suite 1000, Denver, Colorado 80203. |
| ** | This is the period for which the Trustee began serving the Trust. Each Trustee serves an indefinite term, until his or her successor is elected. |
| *** | The Fund Complex includes all series of the Trust and any other investment companies for which ALPS Advisors, Inc. provides investment advisory services. |
20 | November 30, 2023
ALPS Active REIT ETF
| Trustees & Officers | November 30, 2023 (Unaudited) |
Name, Address and Year of Birth of Officer* | Position(s) Held with Trust | Length of Time Served** | Principal Occupation(s) During Past 5 Years | Number of Portfolios in Fund Complex Overseen by Trustees*** | Other Directorships Held by Trustees |
Edmund J. Burke, 1961 | Trustee | Since December 2017 | Mr. Burke joined ALPS in 1991 and served as the President and Director of ALPS Holdings, Inc., and ALPS Advisors, Inc., and Director of ALPS Distributors, Inc., ALPS Fund Services, Inc. (“ALPS”), and ALPS Portfolio Solutions Distributor, Inc. (collectively, the “ALPS Companies”). Mr. Burke retired from the ALPS Companies in June 2019. Mr. Burke is currently a partner at ETF Action, a web-based system that provides data and analytics to registered investment advisers, (since 2020) and a Director of Alliance Bioenergy Plus, Inc., a technology company focused on emerging technologies in the renewable energy, biofuels, and bioplastics technology sectors (since 2020). | 33 | Mr. Burke is a Trustee of Clough Global Dividend and Income Fund (1 fund); Clough Global Equity Fund (1 fund); Clough Global Opportunities Fund (1 fund); Clough Funds Trust (1 fund); Liberty All-Star Equity Fund (1 fund); Director of the Liberty All-Star Growth Fund, Inc. (1 fund) and Financial Investors Trust (29 funds). |
| * | The business address of the Trustee is c/o ALPS Advisors, Inc., 1290 Broadway, Suite 1000, Denver, Colorado 80203. |
| ** | This is the period for which the Trustee began serving the Trust. Each Trustee serves an indefinite term, until his or her successor is elected. |
| *** | The Fund Complex includes all series of the Trust and any other investment companies for which ALPS Advisors, Inc. provides investment advisory services. |
21 | November 30, 2023
ALPS Active REIT ETF
| Trustees & Officers | November 30, 2023 (Unaudited) |
| OFFICERS: | |
Name, Address and Year of Birth of Officer* | Position(s) Held with Trust | Length of Time Served** | Principal Occupation(s) During Past 5 Years |
Laton Spahr, 1975 | President | Since June 2021 | Mr. Spahr joined ALPS in 2019 and currently serves as President and Portfolio Manager of AAI. Prior to his current role, Mr. Spahr was a Senior Vice President and Strategy Leader of the Value & Income Team for Oppenheimer Funds from 2013 to 2019. |
Matthew Sutula, 1985 | Chief Compliance Officer (“CCO”) | Since December 2019 | Mr. Sutula joined ALPS in 2012 and currently serves as Chief Compliance Officer of AAI. Prior to his current role, Mr. Sutula served as interim Compliance Officer of the Trust (September 2019 to December 2019). Compliance Manager and Senior Compliance Analyst for AAI, as well as Compliance Analyst for AFS. Prior to joining ALPS, he spent seven years at Morningstar, Inc. in various analyst roles supporting the registered investment company databases. Mr. Sutula is also Chief Compliance Officer of Principal Real Estate Income Fund, ALPS Variable Investment Trust, Liberty All-Star Equity Fund and Liberty All-Star Growth Fund, Inc. From September 2019 to September 2022 he served as Chief Compliance Officer of RiverNorth Opportunities Fund, Inc. |
Erich Rettinger, 1985 | Treasurer | Since September 2023 | Mr. Rettinger is Vice President of AAI (since 2021) and serves as Treasurer of Principal Real Estate Income Fund, Liberty All-Star Equity Fund, LibertyAll-Star Growth Fund, Inc., and ALPS Variable Investment Trust. From December 2021 to October 2022 he also served as Treasurer of RiverNorth Opportunities Fund, Inc. Because of his position with AAI, Mr. Rettinger is deemed an affiliate of the Fund as defined under the 1940 Act. From 2013-2021, he served as Vice President and Fund Controller of ALPS Fund Services. |
Michael P. Lawlor, 1969 | Secretary | Since December 2022 | Mr. Lawlor joined ALPS in January 2022, and is currently Vice President and Principal Legal Counsel. Prior to joining ALPS, Mr. Lawlor was Lead Fund Counsel at Brighthouse Financial (insurance company) (January 2007-April 2021). Mr. Lawlor also serves as Secretary of Financial Investors Trust and ALPS Variable Investment Trust. |
Susan M. Cannon, 1974 | Assistant Secretary | Since May 2023 | Ms. Cannon joined ALPS in September 2022, and is currently a Senior Paralegal of ALPS Fund Services, Inc. Prior to joining ALPS, Ms. Cannon worked for World Premier Private Partnership, Brown Brothers Harriman & Co. |
| * | The business address of each Officer is c/o ALPS Advisors, Inc., 1290 Broadway, Suite 1000, Denver, Colorado 80203. Each Officer is deemed an affiliate of the Trust as defined under the 1940 Act. |
| ** | This is the period for which the Officer began serving the Trust. Each Officer serves an indefinite term, until his or her successor is elected. |
The Statement of Additional Information includes additional information about the Fund’s Trustees and is available, without charge, upon request by calling (toll-free) 1-866-759-5679.
22 | November 30, 2023
Intentionally Left Blank


Table of Contents
| Performance Overview | 1 |
| Disclosure of Fund Expenses | 4 |
| Report of Independent Registered Public Accounting Firm | 5 |
| Financial Statements | |
| Schedule of Investments | 6 |
| Statement of Assets and Liabilities | 7 |
| Statement of Operations | 8 |
| Statements of Changes in Net Assets | 9 |
| Financial Highlights | 10 |
| Notes to Financial Statements | 11 |
| Additional Information | 17 |
| Board Considerations Regarding Approval of Investment Advisory Agreement | 18 |
| Trustees & Officers | 19 |
alpsfunds.com
ALPS Equal Sector Weight ETF
| Performance Overview | November 30, 2023 (Unaudited) |
Investment Objective
The ALPS Equal Sector Weight ETF (the “Fund”) seeks investment results that replicate as closely as possible, before fees and expenses, the performance of the NYSE Select Sector Equal Weight IndexSM (the “Underlying Index”).
The Underlying Index is an index of exchange-traded funds ("ETFs”) comprised of all active Select Sector SPDR® ETFs in an equal-weighted portfolio. These are the Communication Services Select Sector SPDR® Fund, Consumer Discretionary Select Sector SPDR® Fund, Consumer Staples Select Sector SPDR® Fund, Materials Select Sector SPDR® Fund, Energy Select Sector SPDR® Fund, Technology Select Sector SPDR® Fund, Utilities Select Sector SPDR® Fund, Financial Select Sector SPDR® Fund, Industrial Select Sector SPDR® Fund, Health Care Select Sector SPDR® Fund and Real Estate Select Sector SPDR® Fund (each, an “Underlying Sector ETF” and collectively, the “Underlying Sector ETFs”). In order to track the Underlying Index, the Fund will use a “fund of funds” approach, and seek to achieve its investment objective by investing at least 90% of its total assets in the shares of the Underlying Sector ETFs.
The Underlying Index is designed to track performance of the equally weighted Underlying Sector ETFs. Accordingly, the Underlying Index is rebalanced to an equal weighting quarterly during the months of March, June, September, and December.
Each Underlying Sector ETF is an index fund that invests in the equity securities of companies in a particular sector or group of industries. The objective of each Underlying Sector ETF is to track its respective underlying sector index by replicating the securities in the underlying sector index. Together, the Underlying Sector ETFs represent the Underlying Index as a whole.
Performance Overview
The Fund, for the Fund's fiscal year ended November 30, 2023, generated a total return of 6.43%, generally in-line with the Fund’s Underlying Index, net of fees, which returned 6.55% for the same period. The Fund underperformed the S&P 500® Index (the “S&P 500”), which returned 13.84% for the same period.
The S&P 500 returned 13.84% for the Fund's fiscal year ended November 30, 2023, as fiscal year 2023 saw markets rebound from 2022 lows. The Federal Reserve Bank (FED) continued its path of quantitative tightening in 2023 to combat inflation, reaching its target of peak rates with expectations of rate cuts into 2024 as Consumer Price Index (CPI), energy prices and yields trended towards more acceptable levels. US markets rallied substantially off the secondary effects of the FED’s actions, which ALPS Advisors believes will lead to better odds of a soft landing, with expectations of rate cuts driving growth and equity multiples higher into the next year. Main macroeconomic talking points throughout 2023 centered on the path of future interest rates driven by monetary policy, and inflation trending towards the FED's 2% inflation target. Inflation significantly declined throughout 2023, with November 2023 numbers showing year-over-year CPI around 3.1%. Despite persistent recession calls, ALPS Advisors believes a gradual reduction in interest rates is likely to lead to an earnings recovery in the US, easing financial conditions for both US and global equities. With the recent recovery in sentiment and price for US markets, the S&P 500 Index Price-to-Earnings (P/E) ratio of 22.2x is slightly above its 10-year average of 20.6x. Looking forward, ALPS Advisors believes markets will be data-dependent on job growth, CPI, spending and manufacturing data to justify the recent recovery in valuations.
The best performing fund holdings for the period ended November 30, 2023 were the Technology Select Sector SPDR® (XLK), which saw a gain of 37.46%, the Communication Services Select Sector SPDR® (XLC), which increased 36.72% and the Consumer Discretionary Sector SPDR® (XLY), rising 16.58%. The worst performing fund holdings for the period were the Utilities Select Sector SPDR® (XLU) which lost 9.31% and the Consumer Staples Select Sector SPDR® (XLP) which fell 6.07%.
Looking forward, ALPS Advisors believes the Fund’s strategy of holding each of the eleven sectors in the S&P 500 via the Underlying Sector ETFs can result in a diversified core holding and potential for market participation in all economic cycles through equal sector weighting.
1 | November 30, 2023
ALPS Equal Sector Weight ETF
| Performance Overview | November 30, 2023 (Unaudited) |
Performance (as of November 30, 2023)
| | 1 Year | 5 Year | 10 Year | Since Inception^ |
| ALPS Equal Sector Weight ETF - NAV | 6.43% | 10.85% | 10.10% | 12.81% |
| ALPS Equal Sector Weight ETF - Market Price* | 6.38% | 10.88% | 10.10% | 12.83% |
| NYSE® Equal Sector Weight Index™ | 6.55% | 11.02% | 10.29% | 13.07% |
| S&P 500® Index | 13.84% | 12.51% | 11.82% | 14.17% |
Total Expense Ratio (per the current Prospectus) is 0.47%. Net Expense Ratio (per the current Prospectus) is 0.26%. Net expense ratio reflects the reimbursement of distribution fees for underlying sector ETFs. In addition, the Adviser has contractually agreed, through March 31, 2024, to reduce its advisory fee by 0.19%. This fee waiver may only be terminated by the Fund’s Board of Trustees (and not by the Adviser) prior to such date. Please see the prospectus for additional information.
Performance data quoted represents past performance. Past performance does not guarantee future results. Total return figures assume reinvestment of dividends and capital gains distributions, if any. The table does not reflect the deduction of taxes that a shareholder would pay on Fund distributions or the redemption of Fund shares. Investment return and principal value of an investment will fluctuate so that an investor’s shares, when sold or redeemed, may be worth more or less than the original cost. Current performance data may be higher or lower than actual data quoted. For the most current month-end performance data please visit www.alpsfunds.com or call 1.866.759.5679.
Net Asset Value (NAV) is an exchange-traded fund’s per-share value. The per-share dollar amount of the Fund is derived by dividing the total value of all the securities in its portfolio, less any liabilities, by the number of Fund shares outstanding. Market Price is the price at which a share can currently be traded in the market. Information detailing the number of days the Market Price of the Fund was greater than the Fund’s NAV and the number of days it was less than the Fund’s NAV can be obtained at www.alpsfunds.com.
| ^ | The Fund commenced Investment Operations on July 6, 2009 with an Inception Date, the first day of trading on the Exchange, of July 7, 2009. |
| * | Market Price means the official closing price of a share or, if it more accurately reflects the market value of a share at the time as of which the Fund calculates current net asset value per share, the price that is the midpoint of the bid-ask spread as of that time. It does not represent the returns an investor would receive if shares were traded at other times. |
The NYSE® Equal Sector Weight Index™ consists of a strategy that holds all active Select Sector SPDR® ETFs in an equal-weighted portfolio. Total return assumes reinvestment of any dividends and distributions realized during a given time period.
S&P 500® Index: the Standard & Poor’s composite index of 500 stocks, a widely recognized, unmanaged index of common stock prices. Total return assumes reinvestment of any dividends and distributions realized during a given time period.
The indexes are not actively managed and do not reflect any deductions for fees, expenses or taxes. The indexes are reported on a total return basis, which assumes reinvestment of any dividends and distributions realized during a given time period. One cannot invest directly in an index. Index performance does not reflect fund performance.
The Fund’s shares are not individually redeemable. Investors buy and sell shares of the Fund on a secondary market. Only market makers or “authorized participants” may trade directly with the Fund, typically in blocks of 25,000 shares.
The ALPS Equal Sector Weight ETF is not suitable for all investors. Investments in the Fund are subject to investment risks, including possible loss of the principal amount invested.
ALPS Portfolio Solutions Distributor, Inc., a FINRA member, is the distributor for the Fund.
2 | November 30, 2023
ALPS Equal Sector Weight ETF
| Performance Overview | November 30, 2023 (Unaudited) |
The following table shows the sector weights of both the Fund and the S&P 500® Index as of November 30, 2023:
Sector Weighting Comparison (as of November 30, 2023)
| | EQL* | S&P 500® | +/- |
| Technology | 9.93% | 29.19% | -19.26% |
| Communication Services | 9.36% | 8.60% | 0.76% |
| Financials | 9.33% | 12.93% | -3.60% |
| Industrials | 9.23% | 8.27% | 0.96% |
| Real Estate | 9.16% | 2.43% | 6.73% |
| Materials | 9.13% | 2.43% | 6.70% |
| Healthcare | 9.00% | 12.67% | -3.67% |
| Consumer Discretionary | 8.90% | 10.70% | -1.80% |
| Consumer Staples | 8.88% | 6.29% | 2.59% |
| Utilities | 8.75% | 2.39% | 6.36% |
| Energy | 8.33% | 4.10% | 4.23% |
| Money Market Fund | 0.00% | –– | 0.00% |
| Total | 100.00% | 100.00% | |
Source: S&P 500®
| * | % of Total Investments (excluding investments purchased with collateral from securities loaned). |
Future holdings are subject to change.
Growth of $10,000 (as of November 30, 2023)
Comparison of Change in Value of $10,000 Investment in the Fund and the Indexes
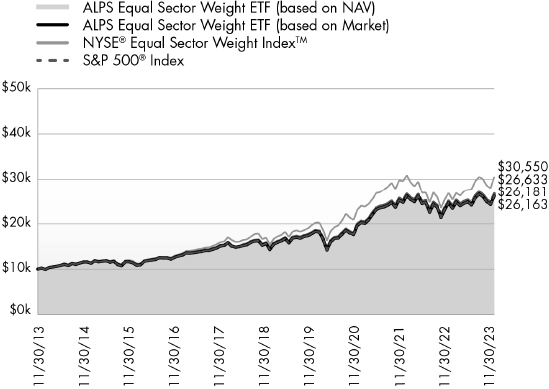
The chart above compares historical performance of a hypothetical investment of $10,000 in the Fund over the past ten years including dividend reinvestment with the performance of the Fund’s benchmark index. Results include the reinvestment of all dividends and capital gain distributions. Past performance does not guarantee future results. The chart does not reflect the deduction of taxes that a shareholder would pay on Fund distributions or the redemption of Fund shares.
3 | November 30, 2023
ALPS Equal Sector Weight ETF
| Disclosure of Fund Expenses | November 30, 2023 (Unaudited) |
Shareholder Expense Example: As a shareholder of the Fund, you incur certain ongoing costs, including management fees and other Fund expenses. These examples are intended to help you understand your ongoing costs (in dollars) of investing in the Fund and to compare these costs with the ongoing costs of investing in other funds. The example is based on an investment of $1,000 invested at the beginning of the six month period and held through November 30, 2023.
Actual Return: The first line of the table provides information about actual account values and actual expenses. You may use the information in this line, together with the amount you invested, to estimate the expenses that you incurred over the period. Simply divide your account value by
$1,000 (for example, an $8,600 account value divided by $1,000 = 8.6), then multiply the result by the number in the first line under the heading entitled “Expenses Paid During Period” to estimate the expenses attributable to your investment during this period.
Hypothetical 5% Return: The second line of the table provides information about hypothetical account values and hypothetical expenses based on the Fund’s actual expense ratio and an assumed rate of return of 5% per year before expenses, which is not the Fund’s actual return. The hypothetical account values and expenses may not be used to estimate the actual ending account balance or expenses you paid for the period. You may use this information to compare ongoing costs of investing in the Fund and other funds. To do so, compare this 5% hypothetical example with the 5% hypothetical examples that appear in the shareholder reports of other funds.
The expenses shown in the table are meant to highlight ongoing Fund costs only and do not reflect any transaction costs, such as brokerage commissions and other fees to financial intermediaries. Therefore, the second line of the table is useful in comparing ongoing costs only, and will not help you determine the relative total costs of owning different funds. In addition, if these costs were included, your costs would have been higher.
| | Beginning Account Value 6/1/23 | Ending Account Value 11/30/23 | Expense Ratio(a) | Expenses Paid During Period 6/1/23 - 11/30/23(b) |
| ALPS Equal Sector Weight ETF | | | | |
| Actual | $1,000.00 | $1,000.00 | 0.16% | $0.80 |
| Hypothetical (5% return before expenses) | $1,000.00 | $1,024.27 | 0.16% | $0.81 |
| (a) | Annualized, based on the Fund's most recent fiscal half year expenses. |
| (b) | Expenses are equal to the Fund's annualized expense ratio multiplied by the average account value over the period, multiplied by the number of days in the most recent fiscal half year (183), divided by 365. |
4 | November 30, 2023
ALPS Equal Sector Weight ETF
| Report of Independent Registered Public Accounting Firm |
To the Shareholders of ALPS Equal Sector Weight ETF and Board of Trustees of ALPS ETF Trust
Opinion on the Financial Statements
We have audited the accompanying statement of assets and liabilities, including the schedule of investments, of ALPS Equal Sector Weight ETF (the “Fund”), a series of ALPS ETF Trust, as of November 30, 2023, the related statements of operations and changes in net assets, the related notes, and the financial highlights for the year then ended (collectively referred to as the “financial statements”). In our opinion, the financial statements present fairly, in all material respects, the financial position of the Fund as of November 30, 2023, the results of its operations, the changes in net assets, and the financial highlights for the year then ended, in conformity with accounting principles generally accepted in the United States of America.
The Fund’s financial statements and financial highlights for the years ended November 30, 2022, and prior, were audited by other auditors whose report dated January 27, 2023, expressed an unqualified opinion on those financial statements and financial highlights.
Basis for Opinion
These financial statements are the responsibility of the Fund’s management. Our responsibility is to express an opinion on the Fund’s financial statements based on our audit. We are a public accounting firm registered with the Public Company Accounting Oversight Board (United States) (“PCAOB”) and are required to be independent with respect to the Fund in accordance with the U.S. federal securities laws and the applicable rules and regulations of the Securities and Exchange Commission and the PCAOB.
We conducted our audit in accordance with the standards of the PCAOB. Those standards require that we plan and perform the audit to obtain reasonable assurance about whether the financial statements are free of material misstatement whether due to error or fraud.
Our audit included performing procedures to assess the risks of material misstatement of the financial statements, whether due to error or fraud, and performing procedures that respond to those risks. Such procedures included examining, on a test basis, evidence regarding the amounts and disclosures in the financial statements. Our procedures included confirmation of securities owned as of November 30, 2023 by correspondence with the custodian and brokers; when replies were not received from brokers, we performed other auditing procedures. Our audit also included evaluating the accounting principles used and significant estimates made by management, as well as evaluating the overall presentation of the financial statements. We believe that our audit provides a reasonable basis for our opinion.
We have served as the auditor of one or more investment companies advised by ALPS Advisors, Inc. since 2013.

COHEN & COMPANY, LTD.
Philadelphia, Pennsylvania
January 29, 2024
5 | November 30, 2023
ALPS Equal Sector Weight ETF
| Schedule of Investments | November 30, 2023 |
| Security Description | | Shares | | | Value | |
| EXCHANGE TRADED FUNDS (100.01%)(a) | | | | | | |
| Communication Services (9.36%) | | | | | | |
| Communication Services Select Sector SPDR Fund(b) | | | 434,986 | | | $ | 30,348,973 | |
| | | | | | | | | |
| Consumer Discretionary (8.90%) | | | | | | | | |
| Consumer Discretionary Select Sector SPDR Fund(b) | | | 170,951 | | | | 28,853,110 | |
| | | | | | | | | |
| Consumer Staples (8.88%) | | | | | | | | |
| Consumer Staples Select Sector SPDR Fund(b) | | | 407,582 | | | | 28,799,744 | |
| | | | | | | | | |
| Energy (8.33%) | | | | | | | | |
| Energy Select Sector SPDR Fund | | | 319,161 | | | | 26,994,637 | |
| | | | | | | | | |
| Financials (9.34%) | | | | | | | | |
| Financial Select Sector SPDR Fund | | | 843,159 | | | | 30,269,408 | |
| | | | | | | | | |
| Healthcare (9.00%) | | | | | | | | |
| Health Care Select Sector SPDR Fund(b) | | | 222,149 | | | | 29,170,385 | |
| | | | | | | | | |
| Industrials (9.23%) | | | | | | | | |
| Industrial Select Sector SPDR Fund(b) | | | 279,652 | | | | 29,936,747 | |
| | | | | | | | | |
| Materials (9.13%) | | | | | | | | |
| Materials Select Sector SPDR Fund(b) | | | 359,392 | | | | 29,617,495 | |
| | | | | | | | | |
| Real Estate (9.16%) | | | | | | | | |
| Real Estate Select Sector SPDR Fund | | | 798,212 | | | | 29,717,433 | |
| | | | | | | | | |
| Technology (9.93%) | | | | | | | | |
| Technology Select Sector SPDR Fund(b) | | | 173,864 | | | | 32,192,658 | |
| | | | | | | | | |
| Utilities (8.75%) | | | | | | | | |
| Utilities Select Sector SPDR Fund(b) | | | 452,189 | | | | 28,379,382 | |
| | | | | | | | | |
| TOTAL EXCHANGE TRADED FUNDS | | | | | | | | |
| (Cost $305,100,581) | | | | | | | 324,279,972 | |
| | | 7 Day Yield | | | Shares | | | Value | |
| SHORT TERM INVESTMENTS (14.42%) | | | | | | | | | |
| Money Market Fund (0.00%)(c) | | | | | | | | | | | | |
| State Street Institutional Treasury Plus Money Market Fund (Premier Class) | | | | | | | | | | | | |
| (Cost $14,598) | | | 5.31 | % | | | 14,598 | | | $ | 14,598 | |
| | | | | | | | | | | | | |
| Investments Purchased with Collateral from Securities Loaned (14.42%) | | | | | | | | | | | | |
| State Street Navigator Securities Lending Government Money Market Portfolio, 5.37% | | | | | | | | | | | | |
| (Cost $46,760,169) | | | | | | | 46,760,169 | | | | 46,760,169 | |
| TOTAL SHORT TERM INVESTMENTS | | | | | | | | | | | | |
| (Cost $46,774,767) | | | | | | | | | | | 46,774,767 | |
| | | | | | | | | | | | | |
| TOTAL INVESTMENTS (114.43%) | | | | | | | | | | | | |
| (Cost $351,875,348) | | | | | | | | | | $ | 371,054,739 | |
| LIABILITIES IN EXCESS OF OTHER ASSETS (-14.43%) | | | | | | | | | | | (46,790,615 | ) |
| NET ASSETS - 100.00% | | | | | | | | | | $ | 324,264,124 | |
| (a) | The financial statements of the Underlying Sector ETFs, including the portfolio of investments, are included in The Select Sector SPDR Trust's N-CSR filing dated September 30, 2023, available at www.sec.gov or can be found at www.ssga.com and should be read in conjunction with the Fund's financial statements. |
| (b) | Security, or a portion of the security position is currently on loan. The total market value of securities on loan is $74,713,526. |
Common Abbreviations:
SPDR® - Standard & Poor's Depositary Receipts
See Notes to Financial Statements.
6 | November 30, 2023
ALPS Equal Sector Weight ETF
| Statement of Assets and Liabilities | November 30, 2023 |
| ASSETS: | | | |
| Investments, at value(a) | | $ | 371,054,739 | |
| Receivable for investments sold | | | 2,620,253 | |
| Dividends receivable | | | 10,347 | |
| Total Assets | | | 373,685,339 | |
| | | | | |
| LIABILITIES: | | | | |
| Payable for capital shares redeemed | | | 2,620,302 | |
| Payable to adviser | | | 40,744 | |
| Payable for collateral upon return of securities loaned | | | 46,760,169 | |
| Total Liabilities | | | 49,421,215 | |
| NET ASSETS | | $ | 324,264,124 | |
| | | | | |
| NET ASSETS CONSIST OF: | | | | |
| Paid-in capital | | $ | 312,385,532 | |
| Total distributable earnings/(accumulated losses) | | | 11,878,592 | |
| NET ASSETS | | $ | 324,264,124 | |
| | | | | |
| INVESTMENTS, AT COST | | $ | 351,875,348 | |
| | | | | |
| PRICING OF SHARES | | | | |
| Net Assets | | $ | 324,264,124 | |
| Shares of beneficial interest outstanding (Unlimited number of shares authorized, par value $0.01 per share) | | | 3,075,000 | |
| Net Asset Value, offering and redemption price per share | | $ | 105.45 | |
| (a) | Includes $74,713,526 of securities on loan. |
See Notes to Financial Statements.
7 | November 30, 2023
ALPS Equal Sector Weight ETF
| Statement of Operations | For the Year Ended November 30, 2023 |
| INVESTMENT INCOME: | | | |
| Dividend Income | | $ | 6,768,105 | |
| Securities Lending Income | | | 140,024 | |
| Total Investment Income | | | 6,908,129 | |
| | | | | |
| EXPENSES: | | | | |
| Investment adviser fees | | | 1,119,803 | |
| Total Expenses before waiver/reimbursement | | | 1,119,803 | |
| Less fee waiver/reimbursement by investment adviser | | | (635,564 | ) |
| Net Expenses | | | 484,239 | |
| NET INVESTMENT INCOME | | | 6,423,890 | |
| | | | | |
| REALIZED AND UNREALIZED GAIN/(LOSS): | | | | |
| Net realized gain on investments(b) | | | 51,178,678 | |
| Net change in unrealized appreciation/(depreciation) on investments | | | (43,178,294 | ) |
| NET REALIZED AND UNREALIZED GAIN ON INVESTMENTS | | | 8,000,384 | |
| NET INCREASE IN NET ASSETS RESULTING FROM OPERATIONS | | $ | 14,424,274 | |
| (b) | Includes realized gain or loss as a result of in-kind transactions (See Note 4 in Notes to Financial Statements). |
See Notes to Financial Statements.
8 | November 30, 2023
ALPS Equal Sector Weight ETF
| Statements of Changes in Net Assets | |
| | | For the Year Ended November 30, 2023 | | | For the Year Ended November 30, 2022 | |
| OPERATIONS: | | | | | | |
| Net investment income | | $ | 6,423,890 | | | $ | 4,589,894 | |
| Net realized gain | | | 51,178,678 | | | | 5,922,093 | |
| Net change in unrealized appreciation/(depreciation) | | | (43,178,294 | ) | | | (9,615,305 | ) |
| Net increase in net assets resulting from operations | | | 14,424,274 | | | | 896,682 | |
| | | | | | | | | |
| DISTRIBUTIONS TO SHAREHOLDERS: | | | | | | | | |
| From distributable earnings | | | (6,423,890 | ) | | | (4,607,523 | ) |
| From tax return of capital | | | (82,622 | ) | | | | |
| Total distributions | | | (6,506,512 | ) | | | (4,607,523 | ) |
| | | | | | | | | |
| CAPITAL SHARE TRANSACTIONS: | | | | | | | | |
| Proceeds from sale of shares | | | 159,340,355 | | | | 153,184,146 | |
| Cost of shares redeemed | | | (185,092,827 | ) | | | (15,270,895 | ) |
| Net increase/(decrease) from capital share transactions | | | (25,752,472 | ) | | | 137,913,251 | |
| Net increase/(decrease) in net assets | | | (17,834,710 | ) | | | 134,202,410 | |
| | | | | | | | | |
| NET ASSETS: | | | | | | | | |
| Beginning of year | | | 342,098,834 | | | | 207,896,424 | |
| End of year | | $ | 324,264,124 | | | $ | 342,098,834 | |
| | | | | | | | | |
| OTHER INFORMATION: | | | | | | | | |
| CAPITAL SHARE TRANSACTIONS: | | | | | | | | |
| Beginning shares | | | 3,375,000 | | | | 2,000,000 | |
| Shares sold | | | 1,600,000 | | | | 1,525,000 | |
| Shares redeemed | | | (1,900,000 | ) | | | (150,000 | ) |
| Shares outstanding, end of year | | | 3,075,000 | | | | 3,375,000 | |
See Notes to Financial Statements.
9 | November 30, 2023
ALPS Equal Sector Weight ETF
| Financial Highlights | For a Share Outstanding Throughout the Periods Presented |
| | | For the Year Ended November 30, 2023 | | | For the Year Ended November 30, 2022 | | | For the Year Ended November 30, 2021 | | | For the Year Ended November 30, 2020 | | | For the Year Ended November 30, 2019 | |
| NET ASSET VALUE, BEGINNING OF PERIOD | | $ | 101.36 | | | $ | 103.95 | | | $ | 84.17 | | | $ | 78.33 | | | $ | 70.34 | |
| | | | | | | | | | | | | | | | | | | | | |
| INCOME FROM OPERATIONS: | | | | | | | | | | | | | | | | | | | | |
| Net investment income(a) | | | 2.14 | | | | 1.89 | | | | 1.76 | | | | 1.91 | | | | 1.53 | |
| Net realized and unrealized gain/(loss) | | | 4.20 | | | | (2.55 | ) | | | 19.82 | | | | 5.84 | | | | 8.03 | |
| Total from investment operations | | | 6.34 | | | | (0.66 | ) | | | 21.58 | | | | 7.75 | | | | 9.56 | |
| | | | | | | | | | | | | | | | | | | | | |
| DISTRIBUTIONS: | | | | | | | | | | | | | | | | | | | | |
| From net investment income | | | (2.22 | ) | | | (1.93 | ) | | | (1.78 | ) | | | (1.90 | ) | | | (1.57 | ) |
| From tax return of capital | | | (0.03 | ) | | | – | | | | (0.02 | ) | | | (0.01 | ) | | | – | |
| Total distributions | | | (2.25 | ) | | | (1.93 | ) | | | (1.80 | ) | | | (1.91 | ) | | | (1.57 | ) |
| | | | | | | | | | | | | | | | | | | | | |
| NET INCREASE/(DECREASE) IN NET ASSET VALUE | | | 4.09 | | | | (2.59 | ) | | | 19.78 | | | | 5.84 | | | | 7.99 | |
| NET ASSET VALUE, END OF PERIOD | | $ | 105.45 | | | $ | 101.36 | | | $ | 103.95 | | | $ | 84.17 | | | $ | 78.33 | |
| TOTAL RETURN(b) | | | 6.43 | % | | | (0.59 | )% | | | 25.89 | % | | | 10.37 | % | | | 13.86 | % |
| | | | | | | | | | | | | | | | | | | | | |
| RATIOS/SUPPLEMENTAL DATA: | | | | | | | | | | | | | | | | | | | | |
| Net assets, end of year (in 000s) | | $ | 324,264 | | | $ | 342,099 | | | $ | 207,896 | | | $ | 164,141 | | | $ | 168,407 | |
| | | | | | | | | | | | | | | | | | | | | |
| Ratio of expenses excluding waiver/reimbursement to average net assets | | | 0.37 | % | | | 0.37 | % | | | 0.37 | % | | | 0.37 | % | | | 0.37 | % |
| Ratio of expenses including waiver/reimbursement to average net assets | | | 0.16 | % | | | 0.16 | % | | | 0.15 | % | | | 0.15 | % | | | 0.15 | % |
| Ratio of net investment income excluding waiver/reimbursement to average net assets | | | 1.91 | % | | | 1.68 | % | | | 1.59 | % | | | 2.31 | % | | | 1.89 | % |
| Ratio of net investment income including waiver/reimbursement to average net assets | | | 2.12 | % | | | 1.89 | % | | | 1.81 | % | | | 2.53 | % | | | 2.11 | % |
| Portfolio turnover rate(c) | | | 14 | % | | | 12 | % | | | 8 | % | | | 11 | % | | | 4 | % |
| (a) | Based on average shares outstanding during the period. |
| (b) | Total return is calculated assuming an initial investment made at the net asset value at the beginning of the year and redemption at the net asset value on the last day of the year and assuming all distributions are reinvested at the reinvestment prices. Total return calculated for a period of less than one year is not annualized. |
| (c) | Portfolio turnover for periods less than one year are not annualized and does not include securities received or delivered from processing creations or redemptions in-kind. |
See Notes to Financial Statements.
10 | November 30, 2023
ALPS Equal Sector Weight ETF
| Notes to Financial Statements | November 30, 2023 |
1. ORGANIZATION
ALPS ETF Trust (the “Trust”), a Delaware statutory trust, is an open-end management investment company registered under the Investment Company Act of 1940, as amended (the “1940 Act”). As of November 30, 2023, the Trust consisted of twenty-three separate portfolios. Each portfolio represents a separate series of the Trust. This report pertains solely to the ALPS Equal Sector Weight ETF (the “Fund”). The investment objective of the Fund is to seek investment results that replicate as closely as possible, before fees and expenses, the performance of the NYSE® Equal Sector Weight Index (the “Underlying Index”). The Fund is considered non-diversified and may invest a greater portion of assets in securities of individual issuers than a diversified fund. As a result, changes in the market value of a single investment could cause greater fluctuations in share price than would occur in a diversified fund.
The Fund’s Shares (“Shares”) are listed on the NYSE Arca, Inc (the “NYSE Arca”). The Fund issues and redeems Shares, at net asset value (“NAV”) in blocks of 25,000 Shares, each of which is called a “Creation Unit”. Creation Units are issued and redeemed principally in-kind for securities included in the Underlying Index. Except when aggregated in Creation Units, Shares are not redeemable securities of the Fund.
Pursuant to the Trust’s organizational documents, its Officers and Trustees are indemnified against certain liability arising out of the performance of their duties to the Trust. Additionally, in the normal course of business, the Trust enters into contracts with service providers that contain general indemnification clauses. The Trust’s maximum exposure under these arrangements is unknown, as this would involve future claims that may be made against the Trust that have not yet occurred.
2. SIGNIFICANT ACCOUNTING POLICIES
The following is a summary of significant accounting policies consistently followed by the Fund in the preparation of the financial statements. The accompanying financial statements were prepared in accordance with accounting principles generally accepted in the United States of America (“U.S. GAAP”). The preparation of financial statements in conformity with U.S. GAAP requires management to make certain estimates and assumptions that affect the reported amounts of assets and liabilities and disclosures of contingent assets and liabilities at the date of the financial statements and the reported amounts of revenue and expenses during the period. Actual results could differ from those estimates. The Fund is considered an investment company under U.S. GAAP and follows the accounting and reporting guidance applicable to investment companies in the Financial Accounting Standards Board (“FASB”) Accounting Standards Codification Topic 946.
A. Portfolio Valuation
The Fund’s NAV is determined daily, as of the close of regular trading on the New York Stock Exchange (the “NYSE”), normally 4:00 p.m. Eastern Time, on each day the NYSE is open for trading. The NAV is computed by dividing the value of all assets of the Fund (including accrued interest and dividends), less all liabilities (including accrued expenses and dividends declared but unpaid), by the total number of shares outstanding.
Portfolio securities listed on any exchange other than the NASDAQ Stock Market LLC (“NASDAQ”) are valued at the last sale price on the business day as of which such value is being determined. If there has been no sale on such day, the securities are valued at the mean of the most recent bid and ask prices on such day. Securities traded on the NASDAQ are valued at the NASDAQ Official Closing Price as determined by NASDAQ. Portfolio securities traded on more than one securities exchange are valued at the last sale price on the business day as of which such value is being determined at the close of the exchange representing the principal market for such securities. Portfolio securities traded in the over-the-counter market, but excluding securities traded on the NASDAQ, are valued at the last quoted sale price in such market.
The Fund’s investments are valued at market value or, in the absence of market value with respect to any portfolio securities, at fair value according to procedures adopted by the Trust’s Board of Trustees (the “Board”). Pursuant to Rule 2a-5 under the 1940 Act, the Board designated ALPS Advisors, Inc. (the "Adviser") as the valuation designee ("Valuation Designee") for each Fund to perform the fair value determinations relating to Fund investments. The Adviser may carry out its designated responsibilities as Valuation Designee through various teams and committees. When market quotations are not readily available or when events occur that make established valuation methods unreliable, securities of the Fund may be valued in good faith by the Valuation Designee. These securities generally include, but are not limited to, restricted securities (securities which may not be publicly sold without registration under the Securities Act of 1933) for which a pricing service is unable to provide a market price; securities whose trading has been formally suspended; a security whose market price is not available from a pre-established primary pricing source or the pricing source is not willing to provide a price; a security with respect to which an event has occurred that is most likely to materially affect the value of the security after the market has closed but before the calculation of the Fund’s NAV or make it difficult or impossible to obtain a reliable market quotation; or a security whose price, as provided by the pricing service, does not reflect the security’s “fair value” due to the security being de-listed from a national exchange or the security’s primary trading market is temporarily closed at a time when, under normal conditions, it would be open. As a general principle, the current “fair value” of a security would be the amount which the owner might reasonably expect to receive from the sale on the applicable exchange or principal market. A variety of factors may be considered in determining the fair value of such securities.
11 | November 30, 2023
ALPS Equal Sector Weight ETF
| Notes to Financial Statements | November 30, 2023 |
B. Fair Value Measurements
The Fund discloses the classification of its fair value measurements following a three-tier hierarchy based on the inputs used to measure fair value. Inputs refer broadly to the assumptions that market participants would use in pricing the asset or liability, including assumptions about risk. Inputs may be observable or unobservable. Observable inputs reflect the assumptions market participants would use in pricing the asset or liability that are developed based on market data obtained from sources independent of the reporting entity. Unobservable inputs reflect the reporting entity’s own assumptions about the assumptions market participants would use in pricing the asset or liability that are developed based on the best information available.
Valuation techniques used to value the Fund’s investments by major category are as follows:
Exchange Traded Funds, for which market quotations are readily available, are valued at the last reported sale price or official closing price as reported by a third party pricing vendor on the primary market or exchange on which they are traded and are categorized as Level 1 in the hierarchy. In the event there were no sales during the day or closing prices are not available, securities are valued at the mean of the most recent quoted bid and ask prices on such day and are generally categorized as Level 2 in the hierarchy. Investments in open-end mutual funds are valued at their closing NAV each business day and are categorized as Level 1 in the hierarchy.
Changes in valuation techniques may result in transfers in or out of an assigned level within the disclosure hierarchy.
Various inputs are used in determining the value of the Fund’s investments as of the end of the reporting period. When inputs used fall into different levels of the fair value hierarchy, the level in the hierarchy within which the fair value measurement falls is determined based on the lowest level input that is significant to the fair value measurement in its entirety. The designated input levels are not necessarily an indication of the risk or liquidity associated with these investments.
These inputs are categorized in the following hierarchy under applicable financial accounting standards:
| Level 1 – | Unadjusted quoted prices in active markets for identical investments, unrestricted assets or liabilities that a Fund has the ability to access at the measurement date; |
| Level 2 – | Quoted prices which are not active, quoted prices for similar assets or liabilities in active markets or inputs other than quoted prices that are observable (either directly or indirectly) for substantially the full term of the asset or liability; and |
| Level 3 – | Significant unobservable prices or inputs (including the Fund’s own assumptions in determining the fair value of investments) where there is little or no market activity for the asset or liability at the measurement date. |
The following is a summary of the inputs used to value the Fund’s investments as of November 30, 2023:
| ALPS Equal Sector Weight ETF | | | | | | | | | |
| Investments in Securities at Value | | Level 1 - Quoted and Unadjusted Prices | | | Level 2 - Other Significant Observable Inputs | | | Level 3 - Significant Unobservable Inputs | | | Total | |
| Exchange Traded Funds* | | $ | 324,279,972 | | | $ | – | | | $ | – | | | $ | 324,279,972 | |
| Short Term Investments | | | 46,774,767 | | | | – | | | | – | | | | 46,774,767 | |
| Total | | $ | 371,054,739 | | | $ | – | | | $ | – | | | $ | 371,054,739 | |
| * | For a detailed breakdown of sectors, see the accompanying Schedule of Investments. |
The Fund did not have any securities that used significant unobservable inputs (Level 3) in determining fair value and there were no transfers into or out of Level 3 during the-year ended November 30, 2023
C. Securities Transactions and Investment Income
Securities transactions are recorded as of the trade date. Realized gains and losses from securities transactions are recorded on the specific identification in accordance with GAAP. Dividend income and capital gains distributions, if any, are recorded on the ex-dividend date. Interest income, if any, is recorded on the accrual basis.
D. Dividends and Distributions to Shareholders
Dividends from net investment income of the Fund, if any, are declared and paid quarterly or as the Board may determine from time to time. Distributions of net realized capital gains earned by the Fund, if any, are distributed at least annually.
12 | November 30, 2023
ALPS Equal Sector Weight ETF
| Notes to Financial Statements | November 30, 2023 |
E. Federal Tax and Tax Basis Information
The timing and character of income and capital gain distributions are determined in accordance with income tax regulations, which may differ from U.S. GAAP. Reclassifications are made to the Fund’s capital accounts for permanent tax differences to reflect income and gains available for distribution (or available capital loss carryforwards) under income tax regulations.
For the year ended November 30, 2023, the following reclassifications, which had no impact on results of operations or net assets, were recorded to reflect permanent tax differences resulting primarily from in-kind transactions:
| Fund | | Paid-in Capital | | | Total Distributable Earnings/(Accumulated Losses) | |
| ALPS Equal Sector Weight ETF | | $ | 53,641,446 | | | $ | (53,641,446 | ) |
The tax character of the distributions paid during the fiscal years ended November 30, 2023 and November 30, 2022 was as follows:
| Fund | | Ordinary Income | | | Long-Term Capital Gain | | | Return of Capital | |
| November 30, 2023 | | | | | | | | | |
| ALPS Equal Sector Weight ETF | | $ | 6,423,890 | | | $ | – | | | $ | 82,622 | |
| Fund | | Ordinary Income | | | Long-Term Capital Gain | | | Return of Capital | |
| November 30, 2022 | | | | | | | | | |
| ALPS Equal Sector Weight ETF | | $ | 4,607,523 | | | $ | – | | | $ | – | |
The character of distributions made during the year may differ from its ultimate characterization for federal income tax purposes.
Under current law, capital losses maintain their character as short-term or long-term and are carried forward to the next tax year without expiration. As of November 30, 2023, the following amounts are available as carry forwards to the next tax year:
| Fund | | Short-Term | | | Long-Term | |
| ALPS Equal Sector Weight ETF | | $ | 1,936,190 | | | $ | 4,358,230 | |
As of November 30, 2023, the components of distributable earnings/(accumulated losses) on a tax basis were as follows:
| | | ALPS Equal Sector Weight ETF | |
| Accumulated net realized loss on investments | | | (6,294,420 | ) |
| Net unrealized appreciation on investments | | | 18,173,012 | |
| Total | | $ | 11,878,592 | |
As of November 30, 2023, the cost of investments for federal income tax purposes and accumulated net unrealized appreciation/(depreciation) on investments were as follows:
| | | ALPS Equal Sector Weight ETF | |
| Gross appreciation (excess of value over tax cost) | | $ | 24,211,601 | |
| Gross depreciation (excess of tax cost over value) | | | (6,038,589 | ) |
| Net unrealized appreciation/(depreciation) | | $ | 18,173,012 | |
| Cost of investments for income tax purposes | | $ | 352,881,727 | |
The differences between book-basis and tax-basis are primarily due to the deferral of losses from wash sales.
F. Income Taxes
No provision for income taxes is included in the accompanying financial statements, as the Fund intends to distribute to shareholders all taxable investment income and realized gains and otherwise comply with Subchapter M of the Internal Revenue Code of 1986, as amended, applicable to regulated investment companies. The Fund evaluates tax positions taken (or expected to be taken) in the course of preparing the Fund’s tax returns to determine whether these positions meet a “more-likely-than-not” standard that, based on the technical merits, have a more than fifty percent likelihood of being sustained by a taxing authority upon examination. A tax position that meets the “more-likely-than-not” recognition threshold is measured to determine the amount of benefit to recognize in the financial statements.
13 | November 30, 2023
ALPS Equal Sector Weight ETF
| Notes to Financial Statements | November 30, 2023 |
As of and during the year ended November 30, 2023, the Fund did not have a liability for any unrecognized tax benefits. The Fund files U.S. federal, state, and local tax returns as required. The Fund’s tax returns are subject to examination by the relevant tax authorities until expiration of the applicable statute of limitations, which is generally three years after the filing of the tax return, but may extend to four years in certain jurisdictions. Tax returns for open years have incorporated no uncertain tax positions that require a provision for income taxes.
G. Lending of Portfolio Securities
The Fund has entered into a securities lending agreement with State Street Bank & Trust Co. (“SSB”), the Fund’s lending agent. The Fund may lend its portfolio securities only to borrowers that are approved by SSB. The Fund will limit such lending to not more than 33 1/3% of the value of its total assets. The Fund’s securities held at SSB as custodian shall be available to be lent except those securities the Fund or ALPS Advisors, Inc. specifically identifies in writing as not being available for lending. The borrower pledges and maintains with the Fund collateral consisting of cash (U.S. Dollars only), securities issued or guaranteed by the U.S. government or its agencies or instrumentalities, and cash equivalents (including irrevocable bank letters of credit) issued by a person other than the borrower or an affiliate of the borrower. The initial collateral received by the Fund is required to have a value of no less than 102% of the market value of the loaned securities for U.S equity securities and a value of no less than 105% of the market value for non-U.S. equity securities. The collateral is maintained thereafter, at a market value equal to not less than 102% of the current value of the U.S. equity securities on loan and not less than 105% of the current value of the non-U.S. equity securities on loan. The market value of the loaned securities is determined at the close of each business day and any additional required collateral is delivered to the Fund on the next business day. During the term of the loan, the Fund is entitled to all distributions made on or in respect of the loaned securities. Loans of securities are terminable at any time and the borrower, after notice, is required to return borrowed securities within the customary time period for settlement of securities transactions.
Any cash collateral received is reinvested in a money market fund managed by SSB as disclosed in the Fund’s Schedule of Investments and is reflected in the Statement of Assets and Liabilities as a payable for collateral upon return of securities loaned. Non-cash collateral, in the form of securities issued or guaranteed by the U.S. government or its agencies or instrumentalities, is not disclosed in the Fund’s Statement of Assets and Liabilities or the contractual maturity table below as it is held by the lending agent on behalf of the Fund, and the Fund does not have the ability to re-hypothecate these securities. Income earned by the Fund from securities lending activity is disclosed in the Statement of Operations.
The following is a summary of the Fund's securities lending agreement and related cash and non-cash collateral received as of November 30, 2023:
| | | Market Value of Securities on Loan | | | Cash Collateral Received | | | Non-Cash Collateral Received | | | Total Collateral Received | |
| ALPS Equal Sector Weight ETF | | $ | 74,713,526 | | | $ | 46,760,169 | | | $ | 28,924,241 | | | $ | 75,684,410 | |
The risks of securities lending include the risk that the borrower may not provide additional collateral when required or may not return the securities when due. To mitigate these risks, the Fund benefits from a borrower default indemnity provided by SSB. SSB’s indemnity allows for full replacement of securities lent wherein SSB will purchase the unreturned loaned securities on the open market by applying the proceeds of the collateral, or to the extent such proceeds are insufficient or the collateral is unavailable, SSB will purchase the unreturned loan securities at SSB’s expense. However, the Fund could suffer a loss if the value of the investments purchased with cash collateral falls below the value of the cash collateral received.
The following table reflects a breakdown of transactions accounted for as secured borrowings, the gross obligation by the type of collateral pledged or securities loaned, and the remaining contractual maturity of those transactions as of November 30, 2023:
| ALPS Equal Sector Weight ETF | | Remaining contractual maturity of the agreements | |
| | | | | | | | | | | | | | | | |
| Securities Lending Transactions | | Overnight & Continuous | | | Up to 30 Days | | | 30-90 Days | | | Greater than 90 Days | | | Total | |
| Common Stocks | | $ | 46,760,169 | | | $ | – | | | $ | – | | | $ | – | | | $ | 46,760,169 | |
| Total Borrowings | | | | | | | | | | | | | | | | | | | 46,760,169 | |
| Gross amount of recognized liabilities for securities lending (collateral received) | | | | | | | $ | 46,760,169 | |
14 | November 30, 2023
ALPS Equal Sector Weight ETF
| Notes to Financial Statements | November 30, 2023 |
3. INVESTMENT ADVISORY FEE AND OTHER AFFILIATED TRANSACTIONS
ALPS Advisors, Inc. serves as the Fund’s investment adviser pursuant to an Investment Advisory Agreement with the Trust on behalf of the Fund (the “Advisory Agreement”). Pursuant to the Advisory Agreement, the Fund pays the Adviser an annual management fee for the services and facilities it provides, payable on a monthly basis at the annual rate of 0.37% of the Fund’s average daily net assets.
The Adviser has contractually agreed to waive 0.19% of its annual unitary fee payable by the Fund until at least March 31, 2024. The waiver may only be terminated by the Fund's Board of Trustees prior to such date.
ALPS Portfolio Solutions Distributor, Inc. (“APSD”) is both the distributor for the Fund as well as the Select Sector SPDR exchange traded funds (“Underlying Sector ETFs”) that the Fund invests in. As required by exemptive relief obtained by the Underlying Sector ETFs, the Adviser will reimburse the Fund an amount equal to the distribution fee received by APSD from the Underlying Sector ETFs attributable to the Fund’s investment in the Underlying Sector ETFs, for so long as APSD acts as the distributor to the Fund and the Underlying Sector ETFs. Such reimbursement is generally expected to be approximately 0.02% - 0.03% annually.
Out of the unitary management fees, the Adviser pays substantially all expenses of the Fund, including licensing fees to the Underlying Index provider, the cost of transfer agency, custody, fund administration, legal, audit, trustees and other services, except for acquired fund fees and expenses, interest expenses, distribution fees or expenses, brokerage expenses, taxes and extraordinary expenses not incurred in the ordinary course of the Fund's business. The Adviser’s unitary management fee is designed to pay substantially all of the Fund’s expenses and to compensate the Adviser for providing services to the Fund.
ALPS Fund Services, Inc., an affiliate of the Adviser, is the administrator of the Fund.
Effective July 1, 2023, each Trustee receives (1) a quarterly retainer of $25,000, (2) a per meeting fee of $15,000, (3) $2,500 for any special meeting held outside of a regularly scheduled board meeting, and (4) reimbursement for all reasonable out-of-pocket expenses relating to attendance at meetings. In addition, the Chairman of the Board receives a quarterly retainer of $5,000, the Chairman of the Audit Committee receives a quarterly retainer of $3,000, and the Chairman of the Nominating & Governance Committee receives a quarterly retainer of $2,000, each in connection with their respective roles. Prior to July 1, 2023, each Trustee received (1) a quarterly retainer of $20,000, (2) a per meeting fee of $10,000, (3) $2,500 for any special meeting held outside of a regularly scheduled board meeting, and (4) reimbursement for all reasonable out-of-pocket expenses relating to attendance at meetings. In addition, the Chairman of the Board received a quarterly retainer of $5,000, the Chairman of the Audit Committee received a quarterly retainer of $3,000, and the Chairman of the Nominating & Governance Committee received a quarterly retainer of $2,000, each in connection with their respective roles.
4. PURCHASES AND SALES OF SECURITIES
For the year ended November 30, 2023 the cost of purchases and proceeds from sales of investment securities, excluding short-term investments and in-kind transactions, were as follows:
| Fund | | Purchases | | | Sales | |
| ALPS Equal Sector Weight ETF | | $ | 41,377,428 | | | $ | 42,102,088 | |
For the year ended November 30, 2023, the cost of in-kind purchases and proceeds from in-kind sales were as follows:
| Fund | | Purchases | | | Sales | |
| ALPS Equal Sector Weight ETF | | $ | 159,341,183 | | | $ | 184,389,368 | |
For the year ended November 30, 2023, the ALPS Equal Sector Weight ETF had in-kind net realized gain of $53,816,374.
Gains on in-kind transactions are not considered taxable for federal income tax purposes and losses on in-kind transactions are also not deductible for tax purposes.
5. CAPITAL SHARE TRANSACTIONS
Shares are created and redeemed by the Fund only in Creation Unit size aggregations of 25,000 Shares. Only broker-dealers or large institutional investors with creation and redemption agreements called Authorized Participants (“AP”) are permitted to purchase or redeem Creation Units from the Fund. Such transactions are generally permitted on an in-kind basis, with a balancing cash component to equate the transaction to the NAV per unit of the Fund on the transaction date. Cash may be substituted equivalent to the value of certain securities generally when they are not available in sufficient quantity for delivery, not eligible for trading by the AP or as a result of other market circumstances.
15 | November 30, 2023
ALPS Equal Sector Weight ETF
| Notes to Financial Statements | November 30, 2023 |
6. MARKET RISK
The Fund is subject to investment and operational risks associated with financial, economic and other global market developments and disruptions, including those arising from war, terrorism, market manipulation, government interventions, defaults and shutdowns, political changes or diplomatic developments, public health emergencies (such as the spread of infectious diseases, pandemics and epidemics) and natural/environmental disasters, which can negatively impact the securities markets and cause the Fund to lose value. Securities in the Fund’s portfolio may underperform in comparison to securities in general financial markets, a particular financial market or other asset classes due to a number of factors, including inflation (or expectations for inflation), deflation (or expectations for deflation), interest rates, global demand for particular products or resources, market instability, debt crises and downgrades, embargoes, tariffs, sanctions and other trade barriers, regulatory events, other governmental trade or market control programs and related geopolitical events. In addition, the value of the Fund’s investments may be negatively affected by the occurrence of global events such as war, terrorism, environmental disasters, natural disasters or events, country instability, and infectious disease epidemics or pandemics.
7. REGULATORY UPDATE
The U.S. Securities and Exchange Commission ("SEC") adopted rule and form amendments that will change the format and content of the Fund's annual and semi-annual reports. Certain information, including the financial statements, will not appear in the Fund's new tailored shareholder reports but will be available online, delivered free of charge upon request, and filed on a semi-annual basis on Form N-CSR. The rule and form amendments have a compliance date of July 24, 2024. At this time, the Trust is evaluating the impact of these rule and form amendment changes.
8. SUBSEQUENT EVENTS
Subsequent events, if any, after the date of the Statement of Assets and Liabilities have been evaluated through the date the financial statements were issued. Management has determined that there were no subsequent events to report through the issuance of these financial statements.
16 | November 30, 2023
ALPS Equal Sector Weight ETF
| Additional Information | November 30, 2023 (Unaudited) |
PROXY VOTING RECORDS, POLICIES AND PROCEDURES
Information regarding how the Fund voted proxies relating to portfolio securities during the most recent 12-month period ended June 30 and a description of the Fund’s proxy voting policies and procedures used in determining how to vote for proxies are available without charge on the SEC’s website at www.sec.gov and upon request, by calling (toll-free) 1-866-759-5679.
PORTFOLIO HOLDINGS
The Fund files a complete schedule of portfolio holdings with the U.S. Securities and Exchange Commission (“SEC”) for the first and third quarters of each fiscal year on Form N-PORT within 60 days after the end of the period. Copies of the Fund’s Form N-PORT are available without a charge, upon request, by contacting the Fund at 1-866-759-5679 and on the SEC’s website at https://www.sec.gov.
TAX INFORMATION
The ALPS Equal Sector Weight ETF designates the following as a percentage of taxable ordinary income distributions, or up to the maximum amount allowable, for the calendar year ended December 31, 2022:
| | Qualified Dividend Income | Dividend Received Deduction |
| ALPS Equal Sector Weight ETF | 85.67% | 85.08% |
In early 2023, if applicable, shareholders of record received this information for the distributions paid to them by the Fund during the calendar year 2022 via Form 1099. The Fund will notify shareholders in early 2024 of amounts paid to them by the Fund, if any, during the calendar year 2023.
LICENSING AGREEMENT
ICE Data Indices, LLC (the “Index Provider”) is not affiliated with the ALPS Equal Sector Weight ETF (the “Fund”) or ALPS Advisors, Inc. (the “Adviser”). The Fund is entitled to use the Underlying Index pursuant to a licensing agreement with the Index Provider and the Adviser. The Adviser pays a licensing fee to the Index Provider out of the management fee.
The only relationship that the Index Provider has with the Fund, the Adviser or Distributor of the Fund in connection with the Fund is that the Index Provider has licensed certain of its intellectual property, including the determination of the component stocks of the Underlying Index and the name of the Underlying Index. The Underlying Index is selected and calculated without regard to the Adviser, Distributor or owners of the Fund. The Index Provider has no obligation to take the specific needs of the Adviser, Distributor or owners of the Fund into consideration in the determination and calculation of the Underlying Index. The Index Provider is not responsible for and has not participated in the determination of pricing or the timing of the issuance or sale of the Shares of the Fund or in the determination or calculation of the net asset value of the Fund. The Index Provider has no obligation or liability in connection with the administration or trading of the Fund.
NYSE® Equal Sector Weight Index is a service mark of ICE Data Indices, LLC or its affiliates (“ICE Data”) and has been licensed for use by the Adviser in connection with the Fund. Neither the Trust nor the Fund is sponsored, endorsed, sold or promoted by ICE Data. ICE Data makes no representations or warranties regarding the Adviser or the Fund or the ability of the NYSE® Equal Sector Weight Index to track general stock market performance.
ICE DATA MAKES NO EXPRESS OR IMPLIED WARRANTIES, AND HEREBY EXPRESSLY DISCLAIMS ALL WARRANTIES OF MERCHANTABILITY OR FITNESS FOR A PARTICULAR PURPOSE WITH RESPECT TO THE NYSE® EQUAL SECTOR WEIGHT INDEX OR ANY DATA INCLUDED THEREIN. IN NO EVENT SHALL ICE DATA HAVE ANY LIABILITY FOR ANY SPECIAL, PUNITIVE, INDIRECT, OR CONSEQUENTIAL DAMAGES (INCLUDING LOST PROFITS), EVEN IF NOTIFIED OF THE POSSIBILITY OF SUCH DAMAGES.
The Adviser does not guarantee the accuracy and/or the completeness of the Underlying Index or any data included therein, and the Adviser shall have no liability for any errors, omissions or interruptions therein. The Adviser makes no warranty, express or implied, as to results to be obtained by the Fund, owners of the Shares of the Fund or any other person or entity from the use of the Underlying Index or any data included therein. The Adviser makes no express or implied warranties, and expressly disclaims all warranties of merchantability or fitness for a particular purpose or use with respect to the Underlying Index or any data included therein. Without limiting any of the foregoing, in no event shall the Adviser have any liability for any special, punitive, direct, indirect or consequential damages (including lost profits) arising out of matters relating to the use of the Underlying Index even if notified of the possibility of such damages.
17 | November 30, 2023
ALPS Equal Sector Weight ETF
Board Considerations Regarding Approval of
Investment Advisory Agreement | November 30, 2023 (Unaudited) |
At its meetings held on June 5, 2023 and June 20, 2023, the Board of Trustees of the Trust (the “Board” or the “Trustees”), where each Trustee is not an “interested person” of the Trust within the meaning of the Investment Company Act of 1940, as amended (the “Independent Trustees”), evaluated a proposal to approve the continuance of the Investment Advisory Agreement between the Trust and ALPS Advisors, Inc. (the “Adviser” or “AAI”) with respect to the ALPS Equal Sector Weight ETF (the "Fund" or “EQL”). In evaluating the renewal of the Investment Advisory Agreement with respect to the Fund, the Board, including the Independent Trustees, considered various factors, including (i) the nature, extent and quality of the services provided by AAI with respect to the Fund under the Investment Advisory Agreement; (ii) the advisory fees and other expenses paid by the Fund compared to those of similar funds managed by other investment advisers; (iii) the costs of the services provided to the Fund by AAI and the profits realized by AAI and its affiliates from its relationship to the Fund; (iv) the extent to which economies of scale have been or would be realized if and as the assets of the Fund grow and whether fees reflect the economies of scale for the benefit of shareholders; and (v) any additional benefits and other considerations.
With respect to the nature, extent and quality of the services provided by AAI under the Investment Advisory Agreement, the Board considered and reviewed information concerning the services provided under the Investment Advisory Agreement, the investment parameters of the index of the Fund, financial information regarding AAI and its parent company, information describing AAI’s current organization and the background and experience of the persons responsible for the day-to-day management of the Fund.
The Board reviewed information on the performance of the Fund and its applicable benchmark for the 1-, 3-, and 5-year periods, as applicable. The Board also evaluated the correlation and tracking error between the underlying index and the Fund’s performance. Based on this review, the Board, including the Independent Trustees, found that the nature and extent of services provided to the Fund under the Investment Advisory Agreements was appropriate and that the quality of such services was satisfactory.
The Board noted that the advisory fees for the Fund were unitary fees pursuant to which AAI assumes all expenses of the Fund (including the cost of transfer agency, custody, fund administration, legal, audit and other services) other than the payments under the Advisory Agreement, brokerage expenses, taxes, interest, litigation expenses and other extraordinary expenses.
Based on the information available to them, including the Fund-specific summary set forth below, the Board, including the Independent Trustees, concluded that the advisory fee rate for the Fund was reasonable under the circumstances and in light of the quality of the services provided.
The Board, including the Independent Trustees, considered other benefits available to AAI because of its relationship with the Fund and concluded that the advisory fee was reasonable taking into account any such benefits.
The Board, including the Independent Trustees, also considered with respect to the Fund the information provided by AAI about the costs and profitability of AAI with respect to the Fund, including the asset levels and other factors that influence the profitability and financial viability of the Fund. The Board, including the Independent Trustees, reviewed and noted the relatively small size of the Fund and the analysis AAI had conducted to support AAI’s assertion that it was not realizing any economies of scale with respect to the Fund. The Independent Trustees determined that AAI should continue to keep the Board informed on an ongoing basis of any significant developments (e.g., material increases in asset levels) so as to facilitate the Independent Trustees’ evaluation of whether further economies of scale have been achieved.
The Board, including the Independent Trustees, also considered other potential benefits available to AAI because of its relationship with the Fund, known as fall-out benefits.
With respect to the Fund, the Board, including the Independent Trustees, noted the following:
The gross management fee rate for EQL is higher than the median of its FUSE expense group. EQL’s net expense ratio is lower than the median of its FUSE expense group.
The Board, including the Independent Trustees, reviewed and noted the relatively small size of EQL and the analysis AAI had conducted to support AAI’s assertion that it was not realizing any economies of scale with respect to EQL.
In voting to renew the Investment Advisory Agreement, the Board, including the Independent Trustees concluded that the terms of the Investment Advisory Agreement are reasonable and fair in light of the services to be performed, the fees paid by certain other funds, expenses to be incurred and such other matters as the members of the Board, including the Independent Trustees, considered relevant in the exercise of their reasonable business judgment. The Board, including the Independent Trustees did not identify any single factor or group of factors as all important or controlling and considered all factors together.
18 | November 30, 2023
ALPS Equal Sector Weight ETF
| Trustees & Officers | November 30, 2023 (Unaudited) |
The general supervision of the duties performed by the Adviser for the Fund under the Investment Advisory Agreement is the responsibility of the Board of Trustees. The Trust currently has four Trustees, each of whom have no affiliation or business connection with the Adviser or any of its affiliated persons and do not own any stock or other securities issued by the Adviser. These are the “non-interested” or “independent” Trustees (“Independent Trustees”).
The Independent Trustees of the Trust, their term of office and length of time served, their principal business occupations during the past five years, the number of portfolios in the Fund Complex overseen by each Independent Trustee, and other directorships, if any, held by the Trustee are shown below.
INDEPENDENT TRUSTEES
Name, Address and Year of Birth of Officer* | Position(s) Held with Trust | Length of Time Served** | Principal Occupation(s) During Past 5 Years | Number of Portfolios in Fund Complex Overseen by Trustees*** | Other Directorships Held by Trustees |
Mary K. Anstine, 1940 | Trustee | Since March 2008 | Ms. Anstine is Trustee/Director of AV Hunter Trust and Colorado Uplift Board. | 38 | Ms. Anstine is a Trustee of ALPS Variable Investment Trust (7 funds); Financial Investors Trust (29 funds); and Reaves Utility Income Fund. |
Jeremy W. Deems, 1976 | Trustee | Since March 2008 | Mr. Deems is the Co-Founder and Chief Financial Officer of Green Alpha Advisors, LLC, a registered investment advisor, and Co- Portfolio Manager of the AXS Green Alpha ETF. | 38 | Mr. Deems is a Trustee of ALPS Variable Investment Trust (7 funds); Financial Investors Trust (29 funds); and Reaves Utility Income Fund; and Clough Funds Trust (1 fund). |
Rick A. Pederson, 1952 | Trustee | Since March 2008 | Mr. Pederson is Partner, Bow River Capital Partners (private equity management), 2003 - present; Board Member, Prosci Inc. (private business services) 2013-2016; Advisory Board Member, Citywide Banks (Colorado community bank) 2014- 2017; Board Member, Strong- Bridge Consulting, 2015-2019; Board Member, IRI/ODMS Holdings LLC, 2017 – 2019; Director, National Western Stock Show (not for profit) 2010 - present; Director, History Colorado (not for profit) 2015- present; Director, Citywide Bank Advisory Board 2017-present; Trustee, Boettcher Foundation, 2018 -present. | 24 | Mr. Pederson is Trustee of Segall Bryant & Hamill Trust (14 funds) and Principal Real Estate Income Fund (1 fund). |
| * | The business address of the Trustee is c/o ALPS Advisors, Inc., 1290 Broadway, Suite 1000, Denver, Colorado 80203. |
| ** | This is the period for which the Trustee began serving the Trust. Each Trustee serves an indefinite term, until his or her successor is elected. |
| *** | The Fund Complex includes all series of the Trust and any other investment companies for which ALPS Advisors, Inc. provides investment advisory services. |
19 | November 30, 2023
ALPS Equal Sector Weight ETF
| Trustees & Officers | November 30, 2023 (Unaudited) |
Name, Address and Year of Birth of Officer* | Position(s) Held with Trust | Length of Time Served** | Principal Occupation(s) During Past 5 Years | Number of Portfolios in Fund Complex Overseen by Trustees*** | Other Directorships Held by Trustees |
Edmund J. Burke,
1961 | Trustee | Since December 2017 | Mr. Burke joined ALPS in 1991 and served as the President and Director of ALPS Holdings, Inc., and ALPS Advisors, Inc., and Director of ALPS Distributors, Inc., ALPS Fund Services, Inc. (“ALPS”), and ALPS Portfolio Solutions Distributor, Inc. (collectively, the “ALPS Companies”). Mr. Burke retired from the ALPS Companies in June 2019. Mr. Burke is currently a partner at ETF Action, a web-based system that provides data and analytics to registered investment advisers, (since 2020) and a Director of Alliance Bioenergy Plus, Inc., a technology company focused on emerging technologies in the renewable energy, biofuels, and bioplastics technology sectors (since 2020). | 33 | Mr. Burke is a Trustee of Clough Global Dividend and Income Fund (1 fund); Clough Global Equity Fund (1 fund); Clough Global Opportunities Fund (1 fund); Clough Funds Trust (1 fund); Liberty All-Star Equity Fund (1 fund); Director of the Liberty All-Star Growth Fund, Inc. (1 fund) and Financial Investors Trust (29 funds). |
| * | The business address of the Trustee is c/o ALPS Advisors, Inc., 1290 Broadway, Suite 1000, Denver, Colorado 80203. |
| ** | This is the period for which the Trustee began serving the Trust. Each Trustee serves an indefinite term, until his or her successor is elected. |
| *** | The Fund Complex includes all series of the Trust and any other investment companies for which ALPS Advisors, Inc. provides investment advisory services. |
20 | November 30, 2023
ALPS Equal Sector Weight ETF
| Trustees & Officers | November 30, 2023 (Unaudited) |
OFFICERS:
Name, Address and Year of Birth of Officer* | Position(s) Held with Trust | Length of Time Served** | Principal Occupation(s) During Past 5 Years |
Laton Spahr, 1975 | President | Since June 2021 | Mr. Spahr joined ALPS in 2019 and currently serves as President and Portfolio Manager of AAI. Prior to his current role, Mr. Spahr was a Senior Vice President and Strategy Leader of the Value & Income Team for Oppenheimer Funds from 2013 to 2019. |
Matthew Sutula, 1985 | Chief Compliance Officer ("CCO") | Since December 2019 | Mr. Sutula joined ALPS in 2012 and currently serves as Chief Compliance Officer of AAI. Prior to his current role, Mr. Sutula served as interim Compliance Officer of the Trust (September 2019 to December 2019). Compliance Manager and Senior Compliance Analyst for AAI, as well as Compliance Analyst for AFS. Prior to joining ALPS, he spent seven years at Morningstar, Inc. in various analyst roles supporting the registered investment company databases. Mr. Sutula is also Chief Compliance Officer of Principal Real Estate Income Fund, ALPS Variable Investment Trust, Liberty All-Star Equity Fund and Liberty All-Star Growth Fund, Inc. From September 2019 to September 2022 he served as Chief Compliance Officer of RiverNorth Opportunities Fund, Inc. |
Erich Rettinger, 1985 | Treasurer | Since September 2023 | Mr. Rettinger is Vice President of AAI (since 2021) and serves as Treasurer of Principal Real Estate Income Fund, Liberty All- Star Equity Fund, Liberty All-Star Growth Fund, Inc., and ALPS Variable Investment Trust. From December 2021 to October 2022 he also served as Treasurer of RiverNorth Opportunities Fund, Inc. Because of his position with AAI, Mr. Rettinger is deemed an affiliate of the Fund as defined under the 1940 Act. From 2013- 2021, he served as Vice President and Fund Controller of ALPS Fund Services. |
Michael P. Lawlor, 1969 | Secretary | Since December 2022 | Mr. Lawlor joined ALPS in January 2022, and is currently Vice President and Principal Legal Counsel. Prior to joining ALPS, Mr. Lawlor was Lead Fund Counsel at Brighthouse Financial (insurance company) (January 2007-April 2021). Mr. Lawlor also serves as Secretary of Financial Investors Trust and ALPS Variable Investment Trust. |
Susan M. Cannon, 1974 | Assistant Secretary | Since May 2023 | Ms. Cannon joined ALPS in September 2022, and is currently a Senior Paralegal of ALPS Fund Services, Inc. Prior to joining ALPS, Ms. Cannon worked for World Premier Private Partnership, Brown Brothers Harriman & Co. |
| * | The business address of each Officer is c/o ALPS Advisors, Inc., 1290 Broadway, Suite 1000, Denver, Colorado 80203. Each Officer is deemed an affiliate of the Trust as defined under the 1940 Act. |
| ** | This is the period for which the Officer began serving the Trust. Each Officer serves an indefinite term, until his or her successor is elected. |
The Statement of Additional Information includes additional information about the Funds' Trustees and is available, without charge, upon request by calling (toll-free) 1-866-759-5679.
21 | November 30, 2023


Table of Contents
| Performance Overview | 1 |
| Disclosure of Fund Expenses | 4 |
| Report of Independent Registered Public Accounting Firm | 5 |
| Financial Statements | |
| Schedule of Investments | 6 |
| Statement of Assets and Liabilities | 10 |
| Statement of Operations | 11 |
| Statements of Changes in Net Assets | 12 |
| Financial Highlights | 13 |
| Notes to Financial Statements | 14 |
| Additional Information | 19 |
| Board Considerations Regarding Approval of Investment Advisory Agreement and Sub-Advisory Agreement | 20 |
| Trustees & Officers | 22 |
alpsfunds.com
ALPS Intermediate Municipal Bond ETF
| Performance Overview | November 30, 2023 (Unaudited) |
Investment Objective
ALPS Intermediate Municipal Bond ETF (the “Fund") seeks to protect investor's capital and generate attractive risk-adjusted returns. The Fund seeks to actively achieve its investment objective by applying bottom-up fundamental analysis and investing in a long-term, tax-aware manner. Under normal circumstances, the Fund will invest at least 80% of its net assets in municipal bonds that pay interest that is generally excludable from gross income for federal income tax purposes (except that the interest paid by certain municipal securities may be includable in taxable income for purposes of the federal alternative minimum tax).
Performance Overview
The Fund produced a total return of 4.27%, based on its market price and 4.85%, based on its NAV for the Fund's fiscal year ended November 30, 2023, as compared to its benchmark, Bloomberg Municipal Bond 1-15 Year Blend Index, which had a return of 3.79% over the same period. Throughout the Fund's 2023 fiscal year, swings in investor expectations regarding inflation and monetary policy drove significant market volatility.
The objective of the Fund is to protect investors’ capital and generate attractive risk-adjusted returns. The Fund seeks to achieve this objective by investing in a limited number of durable credits that provide attractive yields or return potential. Year-over year, the Fund’s net assets remained stable, ending November 2023 at approximately $31 million.
In the Municipal market, valuations are often disconnected from their underlying fundamentals, particularly during periods of heightened market volatility. The Fund entered the 2023 fiscal year holding securities with very attractive valuations that ALPS Advisors believes resulted from the Federal Reserve Bank's (FED) most aggressive policy tightening in forty years, along with record outflows from industry funds. Throughout the 2023 fiscal year, the Fund enjoyed a broad opportunity set from higher base rates, wide credit spreads, and healthy compensation for off-the-run structures. Elevated market volatility also enhanced the Fund’s sub-adviser’s opportunity set. One notable weak spot was the second consecutive year of very light issuance, which helped drive strong competition for bonds in the primary market.
Belying the intra-period volatility, intermediate maturity interest rates ended November 2023 nearly unchanged from the prior fiscal year, while short maturity yields climbed 0.30%. The credit-sensitive portions of the Municipal market recovered significantly, with BBB-rated and Municipal High Yield, each outperforming AAA-rated by over 2% points during the 2023 fiscal year. Despite the Fund’s low exposure to BBB-rated bonds and no high-yield positions, it still performed strongly relative to the Bloomberg Municipal Bond 1-15 Year Blend Index and its peers. A core element of the Fund’s strategy is to focus on niches of the Municipal market that fall outside the comfort zone of household investors. This has allowed the sub-adviser to enhance the Fund's risk-adjusted return. To preserve Fund liquidity, the Fund’s sub-adviser focuses on high quality securities in these areas.
The Fund’s sub-adviser invests the Fund’s portfolio from the bottom-up and has continued to identify more opportunities in Revenue Bonds than in General Obligation (GO) issues. As of November 30, 2023, the Fund held approximately 85% of its net assets in Revenue Bonds and the balance in GOs. Within the Revenue sector, the Fund’s largest exposure remained to State Housing Finance Authority sector, which comprised approximately 24% of net assets. The Fund also held significant exposures to the Airport and Prepaid Natural Gas sectors, which represented approximately 15% and 13% of net assets, respectively. Also of note was the significant variability in money market valuations. Throughout 2023, the Fund’s sub-adviser traded actively between Variable Rate Demand Notes (VRDNs) and Treasury Bills to maximize the after-tax yield on the Fund’s cash balances. Consequently, portfolio turnover for the fiscal year was elevated.
The Fund continued to hold large exposures to bonds with non-standard structures, such as zero-coupon bonds and floating-rate notes. As of November 30, 2023, these two types of bonds comprised roughly 17% and 11% of the Fund’s net assets, respectively. Beyond these positions, the Fund’s sub-adviser also accumulated many longer maturity holdings that the sub-adviser believes will lock in their yields, help bridge over the yield curve inversion, and keep the Fund’s duration relatively in-line with its benchmark.
The Fund's 2023 fiscal year ended with a historic rally in municipal bonds, and the Fund’s sub-adviser continues to look patiently for opportunities. The Fund’s sub-adviser believes the Fund is well-positioned going forward with its holdings of high-quality credits that are providing attractive yields.
1 | November 30, 2023
ALPS Intermediate Municipal Bond ETF
| Performance Overview | November 30, 2023 (Unaudited) |
Fund Performance (as of November 30, 2023)
| | 1 Year | Since Inception^ |
| ALPS Intermediate Municipal Bond ETF - NAV | 4.85% | 4.73% |
| ALPS Intermediate Municipal Bond ETF - Market* | 4.27% | 4.89% |
| Bloomberg Municipal Bond 1-15 Year Blend Index | 3.79% | 3.80% |
Total Expense Ratio (per the current prospectus) is 0.50%.
Performance data quoted represents past performance. Past performance does not guarantee future results. Total return figures assume reinvestment of dividends and capital gains distributions, if any. The table does not reflect the deduction of taxes that a shareholder would pay on Fund distributions or the redemption of Fund shares. Investment return and principal value of an investment will fluctuate so that an investor’s shares, when sold or redeemed, may be worth more or less than the original cost. Current performance data may be higher or lower than actual data quoted. For the most current month-end performance data please visit www.alpsfunds.com or call 1.866.759.5679.
Net Asset Value (NAV) is an exchange-traded fund’s per-share value. The per-share dollar amount of the Fund is derived by dividing the total value of all the securities in its portfolio, less any liabilities, by the number of Fund shares outstanding. Market Price is the price at which a share can currently be traded in the market. Information detailing the number of days the Market Price of the Fund was greater than the Fund’s NAV and the number of days it was less than the Fund’s NAV can be obtained at www.alpsfunds.com.
| ^ | The Fund commenced operations on May 19, 2022, with the first day of trading on the exchange of May 20, 2022. |
| * | Market Price means the official closing price of a share or, if it more accurately reflects the market value of a share at the time as of which the Fund calculates current net asset value per share, the price that is the midpoint of the bid-ask spread as of that time. It does not represent the returns an investor would receive if shares were traded at other times. |
Bloomberg Municipal Bond 1-15 Year Blend Index is an unmanaged index comprised of fixed-rate, investment-grade tax-exempt bonds with remaining maturities between 1 and 17 years. One cannot invest directly in an index. Index performance does not reflect fund performance.
The Fund is new with limited operating history.
ALPS Intermediate Municipal Bond ETF's shares are not individually redeemable. Investors buy and sell shares of the Fund on a secondary market. Only market makers or “authorized participants” may trade directly with the Fund, typically in blocks of 25,000 shares.
ALPS Intermediate Municipal Bond ETF is not suitable for all investors. Investments in the Fund are subject to investment risks, including possible loss of the principal amount invested.
ALPS Portfolio Solutions Distributor, Inc., a FINRA member, is the distributor for the Fund.
2 | November 30, 2023
ALPS Intermediate Municipal Bond ETF
| Performance Overview | November 30, 2023 (Unaudited) |
Top Ten Holdings* (as of November 30, 2023)
| United States Treasury Bill | 6.33% |
| Salt Verde Financial Corp. | 3.78% |
| Port Authority of New York & New Jersey | 3.75% |
| South Dakota Housing Development Authority | 3.67% |
| New Jersey Transportation Trust Fund Authority | 3.27% |
| Tennessee Housing Development Agency | 3.24% |
| Connecticut State Health & Educational Facilities Authority | 3.15% |
| Ohio Housing Finance Agency | 3.14% |
| North Carolina Housing Finance Agency | 2.59% |
| Central Plains Energy Project | 2.37% |
| Total % of Top 10 Holdings | 35.29% |
Future holdings are subject to change.
Sector Allocation* (as of November 30, 2023)
| Revenue Bonds | 80.70% |
| General Obligation Bonds | 12.75% |
| Government Bonds | 6.33% |
| Money Market Fund | 0.22% |
| Total | 100.00% |
Growth of $10,000 (as of November 30, 2023)
Comparison of Change in Value of $10,000 Investment in the Fund and the Indexes
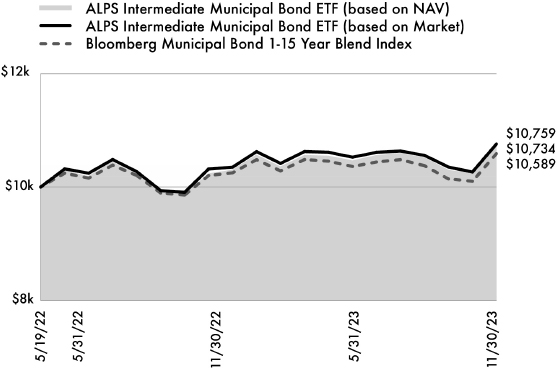
The chart above compares historical performance of a hypothetical investment of $10,000 in the Fund since inception with the performance of the Fund’s benchmark index. Results include the reinvestment of all dividends and capital gains distributions. Past performance does not guarantee future results. The chart does not reflect the deduction of taxes that a shareholder would pay on Fund distributions or the redemption of Fund shares.
3 | November 30, 2023
ALPS Intermediate Municipal Bond ETF
| Disclosure of Fund Expenses | November 30, 2023 (Unaudited) |
Shareholder Expense Example: As a shareholder of the Fund, you incur certain ongoing costs, including management fees and other Fund expenses. These examples are intended to help you understand your ongoing costs (in dollars) of investing in the Fund and to compare these costs with the ongoing costs of investing in other funds. The example is based on an investment of $1,000 invested at the beginning of the six month period and held through November 30, 2023.
Actual Return: The first line of the table provides information about actual account values and actual expenses. You may use the information in this line, together with the amount you invested, to estimate the expenses that you incurred over the period. Simply divide your account value by
$1,000 (for example, an $8,600 account value divided by $1,000 = 8.6), then multiply the result by the number in the first line under the heading entitled “Expenses Paid During Period” to estimate the expenses attributable to your investment during this period.
Hypothetical 5% Return: The second line of the table provides information about hypothetical account values and hypothetical expenses based on the Fund’s actual expense ratio and an assumed rate of return of 5% per year before expenses, which is not the Fund’s actual return. The hypothetical account values and expenses may not be used to estimate the actual ending account balance or expenses you paid for the period. You may use this information to compare ongoing costs of investing in the Fund and other funds. To do so, compare this 5% hypothetical example with the 5% hypothetical examples that appear in the shareholder reports of other funds.
The expenses shown in the table are meant to highlight ongoing Fund costs only and do not reflect any transaction costs, such as brokerage commissions and other fees to financial intermediaries. Therefore, the second line of the table is useful in comparing ongoing costs only, and will not help you determine the relative total costs of owning different funds. In addition, if these costs were included, your costs would have been higher.
| | Beginning Account
Value 6/1/23 | Ending Account
Value 11/30/23 | Expense
Ratio(a) | Expenses Paid
During Period
6/1/23 - 11/30/23(b) |
| ALPS Intermediate Municipal Bond ETF | | | | |
| Actual | $1,000.00 | $1,025.50 | 0.50% | $2.54 |
| Hypothetical (5% return before expenses) | $1,000.00 | $1,022.56 | 0.50% | $2.54 |
| (a) | Annualized, based on the Fund's most recent fiscal half year expenses. |
| (b) | Expenses are equal to the Fund's annualized expense ratio multiplied by the average account value over the period, multiplied by the number of days in the most recent fiscal half year (183), divided by 365. |
4 | November 30, 2023
ALPS Intermediate Municipal Bond ETF
| Report of Independent Registered Public Accounting Firm |
To the Shareholders of ALPS Intermediate Municipal Bond ETF and Board of Trustees of ALPS ETF Trust
Opinion on the Financial Statements
We have audited the accompanying statement of assets and liabilities, including the schedule of investments, of ALPS Intermediate Municipal Bond ETF (the “Fund”), a series of ALPS ETF Trust, as of November 30, 2023, the related statements of operations and changes in net assets, the related notes, and the financial highlights for the year then ended (collectively referred to as the “financial statements”). In our opinion, the financial statements present fairly, in all material respects, the financial position of the Fund as of November 30, 2023, the results of its operations, the changes in net assets, and the financial highlights for the year then ended, in conformity with accounting principles generally accepted in the United States of America.
The Fund’s financial statements and financial highlights for the period ended November 30, 2022, were audited by other auditors whose report dated January 27, 2023, expressed an unqualified opinion on those financial statements and financial highlights.
Basis for Opinion
These financial statements are the responsibility of the Fund’s management. Our responsibility is to express an opinion on the Fund’s financial statements based on our audit. We are a public accounting firm registered with the Public Company Accounting Oversight Board (United States) (“PCAOB”) and are required to be independent with respect to the Fund in accordance with the U.S. federal securities laws and the applicable rules and regulations of the Securities and Exchange Commission and the PCAOB.
We conducted our audit in accordance with the standards of the PCAOB. Those standards require that we plan and perform the audit to obtain reasonable assurance about whether the financial statements are free of material misstatement whether due to error or fraud.
Our audit included performing procedures to assess the risks of material misstatement of the financial statements, whether due to error or fraud, and performing procedures that respond to those risks. Such procedures included examining, on a test basis, evidence regarding the amounts and disclosures in the financial statements. Our procedures included confirmation of securities owned as of November 30, 2023 by correspondence with the custodian and brokers; when replies were not received from brokers, we performed other auditing procedures. Our audit also included evaluating the accounting principles used and significant estimates made by management, as well as evaluating the overall presentation of the financial statements. We believe that our audit provides a reasonable basis for our opinion.
We have served as the auditor of one or more investment companies advised by ALPS Advisors, Inc. since 2013.

COHEN & COMPANY, LTD.
Philadelphia, Pennsylvania
January 29, 2024
5 | November 30, 2023
ALPS Intermediate Municipal Bond ETF
| Schedule of Investments | November 30, 2023 |
| Security Description | | Principal Amount | | | Value | |
| GOVERNMENT BONDS (6.41%) | | | | | | |
| United States Treasury Bill | | | | | | |
| 5.50%, 12/05/2023(a) | | $ | 1,200,000 | | | $ | 1,199,298 | |
| 5.48%, 12/26/2023(a) | | | 800,000 | | | | 797,070 | |
| | | | | | | | | |
| Total | | | | | | | 1,996,368 | |
| | | | | | | | | |
| TOTAL GOVERNMENT BONDS | | | | | | | | |
| (Cost $1,996,361) | | | | | | | 1,996,368 | |
| Security Description | | Principal Amount | | | Value | |
| MUNICIPAL BONDS (94.70%) | | | | | | |
| General Obligation Limited (2.30%) | | | | | | |
| Pennsylvania (2.30%) | | | | | | |
| School District of Philadelphia | | | | | | |
| 5.00%, 09/01/2034 | | | 500,000 | | | | 515,640 | |
| 4.00%, 09/01/2036 | | | 200,000 | | | | 201,630 | |
| Total Pennsylvania | | | | | | | 717,270 | |
| | | | | | | | | |
| Total General Obligation Limited | | | | | | | 717,270 | |
| | | | | | | | | |
| General Obligation Unlimited (10.62%) | | | | | | | | |
| California (5.38%) | | | | | | | | |
| Allan Hancock Joint Community College District | | | | | | | | |
| 0.00%, 08/01/2042(a) | | | 350,000 | | | | 282,622 | |
| Chaffey Joint Union High School District | | | | | | | | |
| 0.00%, 08/01/2044(a) | | | 250,000 | | | | 95,856 | |
| Chino Valley Unified School District | | | | | | | | |
| 0.00%, 08/01/2035(a) | | | 135,000 | | | | 87,450 | |
| Lake Tahoe Unified School District | | | | | | | | |
| 0.00%, 08/01/2045(a) | | | 150,000 | | | | 118,181 | |
| Mount San Antonio Community College District | | | | | | | | |
| 0.00%, 08/01/2043(a) | | | 275,000 | | | | 261,830 | |
| Rio Hondo Community College District | | | | | | | | |
| 0.00%, 08/01/2036(a) | | | 300,000 | | | | 184,041 | |
| 0.00%, 08/01/2044(a) | | | 150,000 | | | | 56,060 | |
| San Mateo County Community College District | | | | | | | | |
| 0.00%, 09/01/2035(a) | | | 110,000 | | | | 73,389 | |
| San Mateo Union High School District | | | | | | | | |
| 0.00%, 09/01/2041(a) | | | 520,000 | | | | 516,118 | |
| Total California | | | | | | | 1,675,547 | |
| | | | | | | | | |
| Oregon (3.93%) | | | | | | | | |
| Clackamas & Washington Counties School District No 3 | | | | | | | | |
| 0.00%, 06/15/2036(a) | | | 600,000 | | | | 347,448 | |
| Security Description | | Principal Amount | | | Value | |
| General Obligation Unlimited (continued) | | | | | | |
| Multnomah County School District No 40 | | | | | | |
| 0.00%, 06/15/2043(a) | | $ | 1,000,000 | | | $ | 382,320 | |
| Multnomah County School District No 7 Reynolds | | | | | | | | |
| 0.00%, 06/15/2035(a) | | | 500,000 | | | | 298,117 | |
| Washington & Multnomah Counties School District No 48J Beaverton | | | | | | | | |
| 0.00%, 06/15/2034(a) | | | 200,000 | | | | 131,224 | |
| 0.00%, 06/15/2041(a) | | | 150,000 | | | | 66,825 | |
| Total Oregon | | | | | | | 1,225,934 | |
| | | | | | | | | |
| Washington (1.31%) | | | | | | | | |
| Washington Clackamas & Yamhill Counties School District No 88J | | | | | | | | |
| 0.00%, 06/15/2037(a) | | | 150,000 | | | | 81,422 | |
| 0.00%, 06/15/2039(a) | | | 255,000 | | | | 123,633 | |
| 0.00%, 06/15/2040(a) | | | 200,000 | | | | 91,975 | |
| 0.00%, 06/15/2041(a) | | | 250,000 | | | | 109,014 | |
| Total Washington | | | | | | | 406,044 | |
| | | | | | | | | |
| Total General Obligation Unlimited | | | | | | | 3,307,525 | |
| | | | | | | | | |
| Revenue Bonds (81.78%) | | | | | | | | |
| Alabama (0.21%) | | | | | | | | |
| Industrial Development Board of the City of Mobile Alabama | | | | | | | | |
| 3.92%, 06/01/2034(b) | | | 65,000 | | | | 65,446 | |
| Total Alabama | | | | | | | 65,446 | |
| | | | | | | | | |
| Arizona (4.40%) | | | | | | | | |
| Chandler Industrial Development Authority | | | | | | | | |
| 4.10%, 12/01/2037(b) | | | 175,000 | | | | 176,176 | |
| Salt Verde Financial Corp. | | | | | | | | |
| 5.00%, 12/01/2032 | | | 675,000 | | | | 715,837 | |
| 5.00%, 12/01/2037 | | | 450,000 | | | | 477,790 | |
| Total Arizona | | | | | | | 1,369,803 | |
| | | | | | | | | |
| California (3.94%) | | | | | | | | |
| Anaheim Public Financing Authority | | | | | | | | |
| 0.00%, 09/01/2030(a) | | | 275,000 | | | | 216,260 | |
| Long Beach Bond Finance Authority 3M US SOFR + 1.45%, | | | | | | | | |
| 11/15/2027(b) | | | 430,000 | | | | 428,362 | |
| Modesto Irrigation District 3M US SOFR + 0.63%, | | | | | | | | |
| 09/01/2037(b) | | | 200,000 | | | | 187,465 | |
| Northern California Gas Authority No 1 3M US SOFR + 0.72%, | | | | | | | | |
| 07/01/2027(b) | | | 230,000 | | | | 226,918 | |
6 | November 30, 2023
ALPS Intermediate Municipal Bond ETF
| Schedule of Investments | November 30, 2023 |
| Security Description | | Principal Amount | | | Value | |
| Revenue Bonds (continued) | | | | | | |
| San Diego County Regional Airport Authority | | | | | | |
| 5.25%, 07/01/2036 | | $ | 150,000 | | | $ | 168,160 | |
| Total California | | | | | | | 1,227,165 | |
| | | | | | | | | |
| Colorado (2.59%) | | | | | | | | |
| City & County of Denver Co. Airport System Revenue | | | | | | | | |
| 5.25%, 11/15/2035 | | | 250,000 | | | | 283,301 | |
| 5.75%, 11/15/2036 | | | 250,000 | | | | 302,588 | |
| E-470 Public Highway Authority | | | | | | | | |
| 0.00%, 09/01/2035(a) | | | 300,000 | | | | 172,376 | |
| 1D US SOFR + 0.35%, 09/01/2039(b) | | | 50,000 | | | | 49,842 | |
| Total Colorado | | | | | | | 808,107 | |
| | | | | | | | | |
| Connecticut (4.20%) | | | | | | | | |
| Connecticut Housing Finance Authority | | | | | | | | |
| 4.00%, 11/15/2047 | | | 315,000 | | | | 313,208 | |
| Connecticut State Health & Educational Facilities Authority | | | | | | | | |
| 0.25%, 07/01/2037(b) | | | 1,000,000 | | | | 993,470 | |
| Total Connecticut | | | | | | | 1,306,678 | |
| | | | | | | | | |
| District of Columbia (2.33%) | | | | | | | | |
| Metropolitan Washington Airports Authority Aviation Revenue | | | | | | | | |
| 5.00%, 10/01/2030 | | | 200,000 | | | | 200,846 | |
| 5.00%, 10/01/2031 | | | 245,000 | | | | 251,277 | |
| 5.00%, 10/01/2037 | | | 250,000 | | | | 269,971 | |
| Total District of Columbia | | | | | | | 722,094 | |
| | | | | | | | | |
| Florida (3.21%) | | | | | | | | |
| City Of South Miami Health Facilities Authority, Inc. | | | | | | | | |
| 5.00%, 08/15/2042 | | | 300,000 | | | | 305,636 | |
| County of Broward FL Airport System Revenue | | | | | | | | |
| 5.00%, 10/01/2031 | | | 200,000 | | | | 215,355 | |
| Florida Housing Finance Corp. | | | | | | | | |
| 5.50%, 01/01/2054 | | | 150,000 | | | | 157,109 | |
| Greater Orlando Aviation Authority | | | | | | | | |
| 5.00%, 10/01/2033 | | | 300,000 | | | | 322,526 | |
| Total Florida | | | | | | | 1,000,626 | |
| | | | | | | | | |
| Georgia (5.42%) | | | | | | | | |
| Development Authority of Burke County | | | | | | | | |
| 1.50%, 01/01/2040(b) | | | 255,000 | | | | 243,654 | |
| 1.70%, 12/01/2049(b) | | | 650,000 | | | | 634,441 | |
| Security Description | | Principal Amount | | | Value | |
| Revenue Bonds (continued) | | | | | | |
| Main Street Natural Gas, Inc. | | | | | | |
| 4.00%, 08/01/2049(b) | | $ | 500,000 | | �� | $ | 498,970 | |
| 5.00%, 12/01/2053(b) | | | 300,000 | | | | 314,666 | |
| Total Georgia | | | | | | | 1,691,731 | |
| | | | | | | | | |
| Illinois (2.68%) | | | | | | | | |
| Illinois Finance Authority | | | | | | | | |
| 5.00%, 08/15/2035 | | | 225,000 | | | | 246,335 | |
| 5.00%, 02/15/2036 | | | 370,000 | | | | 381,571 | |
| Illinois Housing Development Authority | | | | | | | | |
| 6.25%, 04/01/2054 | | | 190,000 | | | | 206,628 | |
| Total Illinois | | | | | | | 834,534 | |
| | | | | | | | | |
| Indiana (0.50%) | | | | | | | | |
| Indiana Finance Authority | | | | | | | | |
| 5.00%, 11/01/2043 | | | 150,000 | | | | 154,720 | |
| Total Indiana | | | | | | | 154,720 | |
| | | | | | | | | |
| Kentucky (3.07%) | | | | | | | | |
| County of Trimble KY | | | | | | | | |
| 4.70%, 06/01/2054(b)(c) | | | 300,000 | | | | 301,698 | |
| Kentucky Public Energy Authority | | | | | | | | |
| 4.00%, 12/01/2049(b) | | | 210,000 | | | | 209,088 | |
| 1D US SOFR + 1.20%, 08/01/2052(b) | | | 460,000 | | | | 445,094 | |
| Total Kentucky | | | | | | | 955,880 | |
| | | | | | | | | |
| Massachusetts (0.50%) | | | | | | | | |
| Massachusetts Housing Finance Agency | | | | | | | | |
| 3.00%, 12/01/2050 | | | 160,000 | | | | 155,458 | |
| Total Massachusetts | | | | | | | 155,458 | |
| | | | | | | | | |
| Minnesota (0.36%) | | | | | | | | |
| Minnesota Housing Finance Agency | | | | | | | | |
| 2.47%, 01/01/2050 | | | 128,851 | | | | 111,730 | |
| Total Minnesota | | | | | | | 111,730 | |
| | | | | | | | | |
| Missouri (0.75%) | | | | | | | | |
| Missouri Housing Development Commission | | | | | | | | |
| 4.00%, 05/01/2050 | | | 235,000 | | | | 233,308 | |
| Total Missouri | | | | | | | 233,308 | |
| | | | | | | | | |
| Nebraska (3.05%) | | | | | | | | |
| Central Plains Energy Project | | | | | | | | |
| 5.00%, 05/01/2053(b) | | | 725,000 | | | | 746,408 | |
| Nebraska Investment Finance Authority | | | | | | |
| 3.50%, 09/01/2046 | | | 205,000 | | | | 202,365 | |
| Total Nebraska | | | | | | | 948,773 | |
7 | November 30, 2023
ALPS Intermediate Municipal Bond ETF
| Schedule of Investments | November 30, 2023 |
| Security Description | | Principal Amount | | | Value | |
| Revenue Bonds (continued) | | | | | | |
| New Jersey (4.93%) | | | | | | |
| New Jersey Economic Development Authority | | | | | | |
| 5.00%, 06/15/2034(c) | | $ | 250,000 | | | $ | 276,413 | |
| New Jersey Health Care Facilities Financing Authority | | | | | | | | |
| 5.00%, 07/01/2045(b) | | | 220,000 | | | | 228,237 | |
| New Jersey Transportation Trust Fund Authority | | | | | | | | |
| 0.00%, 12/15/2031(a) | | | 1,375,000 | | | | 1,033,064 | |
| Total New Jersey | | | | | | | 1,537,714 | |
| | | | | | | | | |
| New Mexico (1.94%) | | | | | | | | |
| City of Farmington NM | | | | | | | | |
| 1.80%, 04/01/2029 | | | 375,000 | | | | 317,993 | |
| New Mexico Mortgage Finance Authority | | | | | | | | |
| 5.25%, 03/01/2053 | | | 275,000 | | | | 287,060 | |
| Total New Mexico | | | | | | | 605,053 | |
| | | | | | | | | |
| New York (8.81%) | | | | | | | | |
| Metropolitan Transportation Authority | | | | | | | | |
| 1D US SOFR + 0.43%, 11/01/2026(b) | | | 65,000 | | | | 64,300 | |
| 1D US SOFR + 0.80%, 11/01/2032(b) | | | 460,000 | | | | 457,985 | |
| 1D US SOFR + 0.33%, 11/01/2035(b) | | | 445,000 | | | | 444,386 | |
| New York State Dormitory Authority | | | | | | | | |
| 4.00%, 07/01/2038 | | | 100,000 | | | | 102,507 | |
| Port Authority of New York & New Jersey | | | | | | | | |
| 5.00%, 11/01/2030 | | | 1,100,000 | | | | 1,183,341 | |
| Triborough Bridge & Tunnel Authority | | | | | | | | |
| 0.00%, 11/15/2039(a) | | | 1,000,000 | | | | 490,565 | |
| Total New York | | | | | | | 2,743,084 | |
| | | | | | | | | |
| North Carolina (2.63%) | | | | | | | | |
| North Carolina Housing Finance Agency | | | | | | | | |
| 6.25%, 01/01/2055 | | | 750,000 | | | | 818,528 | |
| Total North Carolina | | | | | | | 818,528 | |
| | | | | | | | | |
| North Dakota (2.27%) | | | | | | | | |
| North Dakota Housing Finance Agency | | | | | | | | |
| 4.25%, 01/01/2049 | | | 390,000 | | | | 389,624 | |
| 5.75%, 07/01/2053 | | | 300,000 | | | | 317,696 | |
| Total North Dakota | | | | | | | 707,320 | |
| Security Description | | Principal Amount | | | Value | |
| Revenue Bonds (continued) | | | | | | |
| Ohio (3.18%) | | | | | | |
| Ohio Housing Finance Agency | | | | | | |
| 5.00%, 03/01/2052 | | $ | 965,000 | | | $ | 990,688 | |
| Total Ohio | | | | | | | 990,688 | |
| | | | | | | | | |
| Oklahoma (1.63%) | | | | | | | | |
| Oklahoma Housing Finance Agency | | | | | | | | |
| 5.00%, 03/01/2052 | | | 495,000 | | | | 508,657 | |
| Total Oklahoma | | | | | | | 508,657 | |
| | | | | | | | | |
| Oregon (0.71%) | | | | | | | | |
| Port of Portland OR Airport Revenue | | | | | | | | |
| 5.00%, 07/01/2036 | | | 200,000 | | | | 220,219 | |
| Total Oregon | | | | | | | 220,219 | |
| | | | | | | | | |
| South Carolina (0.52%) | | | | | | | | |
| South Carolina State Housing Finance & Development Authority | | | | | | | | |
| 5.75%, 01/01/2054 | | | 150,000 | | | | 161,702 | |
| Total South Carolina | | | | | | | 161,702 | |
| | | | | | | | | |
| South Dakota (3.72%) | | | | | | | | |
| South Dakota Housing Development Authority | | | | | | | | |
| 5.00%, 05/01/2053 | | | 970,000 | | | | 996,248 | |
| 6.00%, 05/01/2054 | | | 150,000 | | | | 160,211 | |
| Total South Dakota | | | | | | | 1,156,459 | |
| | | | | | | | | |
| Tennessee (4.00%) | | | | | | | | |
| New Memphis Arena Public Building Authority | | | | | | | | |
| 0.00%, 04/01/2030(a) | | | 240,000 | | | | 216,464 | |
| Tennessee Housing Development Agency | | | | | | | | |
| 5.00%, 01/01/2053 | | | 1,000,000 | | | | 1,023,600 | |
| Total Tennessee | | | | | | | 1,240,064 | |
| | | | | | | | | |
| Texas (6.06%) | | | | | | | | |
| City of Austin TX Airport System Revenue | | | | | | | | |
| 5.00%, 11/15/2036 | | | 200,000 | | | | 216,615 | |
| City of Houston TX Airport System Revenue | | | | | | | | |
| 5.00%, 07/01/2036 | | | 135,000 | | | | 147,059 | |
| Texas Department of Housing & Community Affairs | | | | | | | | |
| 3.50%, 07/01/2052 | | | 330,000 | | | | 321,593 | |
| Texas Municipal Gas Acquisition and Supply Corp. I | | | | | | | | |
| 3M US SOFR + 0.70%, 12/15/2026(b) | | | 620,000 | | | | 615,182 | |
| 6.25%, 12/15/2026 | | | 45,000 | | | | 46,497 | |
8 | November 30, 2023
ALPS Intermediate Municipal Bond ETF
| Schedule of Investments | November 30, 2023 |
| Security Description | | Principal Amount | | | Value | |
| Revenue Bonds (continued) | | | | | | |
| Texas Municipal Gas Acquisition and Supply Corp. II | | | | | | |
| 3M US SOFR + 1.06%, 09/15/2027(b) | | $ | 415,000 | | | $ | 410,186 | |
| 3M US SOFR + 0.86%, 09/15/2027(b) | | | 130,000 | | | | 127,910 | |
| Total Texas | | | | | | | 1,885,042 | |
| | | | | | | | | |
| Virginia (0.96%) | | | | | | | | |
| York County Economic Development Authority | | | | | | | | |
| 3.65%, 05/01/2033(b) | | | 300,000 | | | | 298,652 | |
| Total Virginia | | | | | | | 298,652 | |
| | | | | | | | | |
| Washington (1.70%) | | | | | | | | |
| District of Columbia | | | | | | | | |
| 5.00%, 07/15/2040 | | | 200,000 | | | | 202,150 | |
| Port of Seattle WA | | | | | | | | |
| 5.00%, 04/01/2027 | | | 250,000 | | | | 252,415 | |
| Washington Health Care Facilities Authority | | | | | | | | |
| 4.00%, 10/01/2042(b) | | | 75,000 | | | | 74,534 | |
| Total Washington | | | | | | | 529,099 | |
| | | | | | | | | |
| Wisconsin (1.51%) | | | | | | | | |
| County of Milwaukee WI Airport Revenue | | | | | | | | |
| 5.00%, 12/01/2030 | | | 125,000 | | | | 128,253 | |
| Public Finance Authority | | | | | | | | |
| 3.70%, 10/01/2046(b) | | | 150,000 | | | | 151,034 | |
| Wisconsin Health & Educational Facilities Authority | | | | | | | | |
| 4.00%, 11/15/2043 | | | 200,000 | | | | 191,152 | |
| Total Wisconsin | | | | | | | 470,439 | |
| | | | | | | | | |
| Total Revenue Bonds | | | | | | | 25,458,773 | |
| | | | | | | | | |
| TOTAL MUNICIPAL BONDS | | | | | | | | |
| (Cost $29,296,138) | | | | | | | 29,483,568 | |
| | | 7 Day Yield | | | Shares | | | Value | |
| SHORT TERM INVESTMENTS (0.21%) | | | |
| Money Market Fund | | | | | | |
| State Street Institutional US Government Money Market Fund (Premier Class) | | | 5.31 | % | | | 65,911 | | | | 65,911 | |
| | | | | | | | | | | | | |
| TOTAL SHORT TERM INVESTMENTS | | | | | |
| (Cost $65,911) | | | | | | | 65,911 | |
| | | | | | | | | | | | | |
| TOTAL INVESTMENTS (101.32%) | | | | | |
| (Cost $31,358,410) | | | | | | $ | 31,545,847 | |
| LIABILITIES IN EXCESS OF OTHER ASSETS (-1.32%) | | | | (411,246 | ) |
| NET ASSETS - 100.00% | | | | | | $ | 31,134,601 | |
Investment Abbreviations:
SOFR - Secured Overnight Financing Rate
Reference Rates:
1D US SOFR - 1 Day SOFR as of November 30, 2023 was 5.33%
3M US SOFR - 3 Month SOFR as of November 30, 2023 was 5.37%
| (b) | Floating or variable rate security. Interest rate resets periodically on specific dates. The rate shown represents the coupon or interest rate in effect as of November 30, 2023. Security description includes the reference rate and spread if published and available. |
| (c) | Represents a security purchased on a when-issued basis. |
See Notes to Financial Statements.
9 | November 30, 2023
ALPS Intermediate Municipal Bond ETF
| Statement of Assets and Liabilities | November 30, 2023 |
| ASSETS: | | | |
| Investments, at value | | $ | 31,545,847 | |
| Receivable for investments sold | | | 126,555 | |
| Interest receivable | | | 233,984 | |
| Total Assets | | | 31,906,386 | |
| | | | | |
| LIABILITIES: | | | | |
| Payable for investments purchased | | | 759,253 | |
| Payable to adviser | | | 12,532 | |
| Total Liabilities | | | 771,785 | |
| NET ASSETS | | $ | 31,134,601 | |
| | | | | |
| NET ASSETS CONSIST OF: | | | | |
| Paid-in capital | | $ | 30,876,770 | |
| Total distributable earnings/(accumulated losses) | | | 257,831 | |
| NET ASSETS | | $ | 31,134,601 | |
| | | | | |
| INVESTMENTS, AT COST | | $ | 31,358,410 | |
| | | | | |
| PRICING OF SHARES | | | | |
| Net Assets | | $ | 31,134,601 | |
| Shares of beneficial interest outstanding (Unlimited number of shares authorized, par value $0.01 per share) | | | 1,225,002 | |
| Net Asset Value, offering and redemption price per share | | $ | 25.42 | |
See Notes to Financial Statements.
10 | November 30, 2023
ALPS Intermediate Municipal Bond ETF
| Statement of Operations | For the Year Ended November 30, 2023 |
| INVESTMENT INCOME: | | | |
| Interest | | $ | 1,164,943 | |
| Dividends | | | 6,040 | |
| Total Investment Income | | | 1,170,983 | |
| | | | | |
| EXPENSES: | | | | |
| Investment adviser fees | | | 154,687 | |
| Net Expenses | | | 154,687 | |
| NET INVESTMENT INCOME | | | 1,016,296 | |
| | | | | |
| REALIZED AND UNREALIZED GAIN/(LOSS): | | | | |
| Net realized gain on investments | | | 68,236 | |
| Net change in unrealized appreciation on investments | | | 375,330 | |
| NET REALIZED AND UNREALIZED GAIN ON INVESTMENTS | | | 443,566 | |
| NET INCREASE IN NET ASSETS RESULTING FROM OPERATIONS | | $ | 1,459,862 | |
See Notes to Financial Statements.
11 | November 30, 2023
ALPS Intermediate Municipal Bond ETF
| Statements of Changes in Net Assets |
| | | For the
Year Ended
November 30,
2023 | | | For the Period
May 19, 2022
(Commencement
of Operations)
to November 30,
2022 | |
| OPERATIONS: | | | | | | |
| Net investment income | | $ | 1,016,296 | | | $ | 433,446 | |
| Net realized gain | | | 68,236 | | | | 225,977 | |
| Net change in unrealized appreciation/(depreciation) | | | 375,330 | | | | (187,893 | ) |
| Net increase in net assets resulting from operations | | | 1,459,862 | | | | 471,530 | |
| | | | | | | | | |
| DISTRIBUTIONS TO SHAREHOLDERS: | | | | | | | | |
| From distributable earnings | | | (1,244,614 | ) | | | (428,947 | ) |
| Total distributions | | | (1,244,614 | ) | | | (428,947 | ) |
| | | | | | | | | |
| CAPITAL SHARE TRANSACTIONS: | | | | | | | | |
| Proceeds from sale of shares | | | – | | | | 30,876,770 | |
| Net increase from capital share transactions | | | – | | | | 30,876,770 | |
| Net increase in net assets | | | 215,248 | | | | 30,919,353 | |
| | | | | | | | | |
| NET ASSETS: | | | | | | | | |
| Beginning of period | | | 30,919,353 | | | | – | |
| End of year | | $ | 31,134,601 | | | $ | 30,919,353 | |
| | | | | | | | | |
| OTHER INFORMATION: | | | | | | | | |
| CAPITAL SHARE TRANSACTIONS: | | | | | | | | |
| Beginning shares | | | 1,225,002 | | | | – | |
| Shares sold | | | – | | | | 1,225,002 | |
| Shares outstanding, end of period | | | 1,225,002 | | | | 1,225,002 | |
See Notes to Financial Statements.
12 | November 30, 2023
ALPS Intermediate Municipal Bond ETF
| Financial Highlights | For a Share Outstanding Throughout the Periods Presented |
| | | For the Year Ended November 30, 2023 | | | For the Period May 19, 2022 (Commencement of Operations) to November 30, 2022 | |
| NET ASSET VALUE, BEGINNING OF PERIOD | | $ | 25.24 | | | $ | 25.00 | |
| | | | | | | | | |
| INCOME FROM OPERATIONS: | | | | | | | | |
| Net investment income(a) | | | 0.85 | | | | 0.36 | |
| Net realized and unrealized gain | | | 0.34 | | | | 0.23 | |
| Total from investment operations | | | 1.19 | | | | 0.59 | |
| | | | | | | | | |
| DISTRIBUTIONS: | | | | | | | | |
| From net investment income | | | (1.01 | ) | | | (0.35 | ) |
| Total distributions | | | (1.01 | ) | | | (0.35 | ) |
| | | | | | | | | |
| NET INCREASE IN NET ASSET VALUE | | | 0.18 | | | | 0.24 | |
| NET ASSET VALUE, END OF PERIOD | | $ | 25.42 | | | $ | 25.24 | |
| TOTAL RETURN(b) | | | 4.85 | % | | | 2.38 | % |
| | | | | | | | | |
| RATIOS/SUPPLEMENTAL DATA: | | | | | | | | |
| Net assets, end of period (in 000s) | | $ | 31,135 | | | $ | 30,919 | |
| | | | | | | | | |
| RATIOS TO AVERAGE NET ASSETS | | | | | | | | |
| Ratio of expenses to average net assets | | | 0.50 | % | | | 0.50 | %(c) |
| Ratio of net investment income to average net assets | | | 3.28 | % | | | 2.67 | %(c) |
| Portfolio turnover rate(d) | | | 129 | %(e) | | | 75 | % |
| (a) | Based on average shares outstanding during the period. |
| (b) | Total return is calculated assuming an initial investment made at the net asset value at the beginning of the period and redemption at the net asset value on the last day of the period and assuming all distributions are reinvested at the reinvestment prices. Total return calculated for a period of less than one year is not annualized. |
| (d) | Portfolio turnover for periods less than one year are not annualized and does not include securities received or delivered from processing creations or redemptions in-kind. |
| (e) | The portfolio turnover rate excluding variable rate demand notes was 50%. |
See Notes to Financial Statements.
13 | November 30, 2023
ALPS Intermediate Municipal Bond ETF
| Notes to Financial Statements | November 30, 2023 |
1. ORGANIZATION
ALPS ETF Trust (the “Trust”), a Delaware statutory trust, is an open-end management investment company registered under the Investment Company Act of 1940, as amended (the “1940 Act”). As of November 30, 2023, the Trust consisted of twenty-three separate portfolios. Each portfolio represents a separate series of the Trust. This report pertains solely to the ALPS Intermediate Municipal Bond ETF (the “Fund”). The investment objective of the Fund is to protect investor’s capital and generate attractive risk-adjusted returns. The Fund has elected to qualify as a diversified series of the Trust under the 1940 Act.
The Fund’s Shares (“Shares”) are listed on the NYSE Arca, Inc. (the “NYSE Arca”). The Fund issues and redeems Shares, at net asset value (“NAV”) in blocks of 25,000 Shares, each of which is called a “Creation Unit”. Creation Units are issued and redeemed principally in-kind for securities. Except when aggregated in Creation Units, Shares are not redeemable securities of the Fund.
Pursuant to the Trust’s organizational documents, its Officers and Trustees are indemnified against certain liability arising out of the performance of their duties to the Trust. Additionally, in the normal course of business, the Trust enters into contracts with service providers that contain general indemnification clauses. The Trust’s maximum exposure under these arrangements is unknown, as this would involve future claims that may be made against the Trust that have not yet occurred.
2. SIGNIFICANT ACCOUNTING POLICIES
The following is a summary of significant accounting policies consistently followed by the Fund in the preparation of the financial statements. The accompanying financial statements were prepared in accordance with accounting principles generally accepted in the United States of America (“U.S. GAAP”). The preparation of financial statements in conformity with U.S. GAAP requires management to make certain estimates and assumptions that affect the reported amounts of assets and liabilities and disclosures of contingent assets and liabilities at the date of the financial statements and the reported amounts of revenue and expenses during the period. Actual results could differ from those estimates. The Fund is considered an investment company under U.S. GAAP and follows the accounting and reporting guidance applicable to investment companies in the Financial Accounting Standards Board (“FASB”) Accounting Standards Codification Topic 946.
A. Portfolio Valuation
The Fund’s NAV is determined daily, as of the close of regular trading on the New York Stock Exchange (the "NYSE"), normally 4:00 p.m. Eastern Time, on each day the NYSE is open for trading. The NAV is computed by dividing the value of all assets of the Fund (including accrued interest and dividends), less all liabilities (including accrued expenses and dividends declared but unpaid), by the total number of shares outstanding.
Portfolio securities listed on any exchange other than the NASDAQ Stock Market LLC (“NASDAQ”) are valued at the last sale price on the business day as of which such value is being determined. If there has been no sale on such day, the securities are valued at the mean of the most recent bid and ask prices on such day. Securities traded on the NASDAQ are valued at the NASDAQ Official Closing Price as determined by NASDAQ. Portfolio securities traded on more than one securities exchange are valued at the last sale price on the business day as of which such value is being determined at the close of the exchange representing the principal market for such securities. Portfolio securities traded in the over-the-counter market, but excluding securities traded on the NASDAQ, are valued at the last quoted sale price in such market.
The market price for debt securities is generally the evaluated price supplied by an independent third-party pricing service approved by the Board, which references a combination of transactions and quotations for the same or other securities believed to be comparable in quality, coupon, maturity, type of issue, call provisions, trading characteristics and other features deemed to be relevant. To the extent the Fund’s debt securities are valued based on price quotations or other equivalent indications of value provided by a third-party pricing service, any such third-party pricing service may use a variety of methodologies to value some or all of the Fund’s debt securities to determine the market price.
The Fund’s investments are valued at market value or, in the absence of market value with respect to any portfolio securities, at fair value according to procedures adopted by the Trust’s Board. Pursuant to Rule 2a-5 under the 1940 Act, the Board of Trustees designated ALPS Advisors, Inc. (the “Adviser”) as the valuation designee ("Valuation Designee") for the Fund to perform the fair value determinations relating to all Fund investments. The Adviser may carry out its designated responsibilities as Valuation Designee through various teams and committees. When market quotations are not readily available or when events occur that make established valuation methods unreliable, securities of the Fund may be valued in good faith by the Valuation Designee. These securities generally include, but are not limited to, restricted securities (securities which may not be publicly sold without registration under the Securities Act of 1933) for which a pricing service is unable to provide a market price; securities whose trading has been formally suspended; a security whose market price is not available from a pre-established primary pricing source or the pricing source is not willing to provide a price; a security with respect to which an event has occurred that is most likely to materially affect the value of the security after the market has closed but before the calculation of the Fund’s NAV or make it difficult or impossible to obtain a reliable market quotation; or a security whose price, as provided by the pricing service, does not reflect the security’s “fair value” due to the security being de-listed from a national exchange or the security’s primary trading market is temporarily closed at a time when, under normal conditions, it would be open. As a general principle, the current “fair value” of a security would be the amount which the owner might reasonably expect to receive from the sale on the applicable exchange or principal market. A variety of factors may be considered in determining the fair value of such securities.
14 | November 30, 2023
ALPS Intermediate Municipal Bond ETF
| Notes to Financial Statements | November 30, 2023 |
B. Fair Value Measurements
The Fund discloses the classification of its fair value measurements following a three-tier hierarchy based on the inputs used to measure fair value. Inputs refer broadly to the assumptions that market participants would use in pricing the asset or liability, including assumptions about risk. Inputs may be observable or unobservable. Observable inputs reflect the assumptions market participants would use in pricing the asset or liability that are developed based on market data obtained from sources independent of the reporting entity. Unobservable inputs reflect the reporting entity’s own assumptions about the assumptions market participants would use in pricing the asset or liability that are developed based on the best information available.
Valuation techniques used to value the Fund’s investments by major category are as follows:
Equity securities, including restricted securities, for which market quotations are readily available, are valued at the last reported sale price or official closing price as reported by a third party pricing vendor on the primary market or exchange on which they are traded and are categorized as Level 1 in the hierarchy. In the event there were no sales during the day or closing prices are not available, securities are valued at the mean of the most recent quoted bid and ask prices on such day and are generally categorized as Level 2 in the hierarchy. Investments in open-end mutual funds are valued at their closing NAV each business day and are categorized as Level 1 in the hierarchy.
Debt securities, including restricted securities, are valued based on evaluated prices received from third party pricing vendors or from brokers who make markets in such securities. For municipal bonds, pricing vendors utilize matrix pricing which considers yield or price of bonds of comparable quality, coupon, maturity and type as well as broker-supplied prices. When independent prices are unavailable or unreliable, debt securities may be valued utilizing pricing methodologies which consider similar factors that would be used by third party pricing vendors. Debt securities are generally categorized as Level 2 in the hierarchy but may be Level 3 depending on the circumstances.
Changes in valuation techniques may result in transfers in or out of an assigned level within the disclosure hierarchy.
Various inputs are used in determining the value of the Fund’s investments as of the end of the reporting period. When inputs used fall into different levels of the fair value hierarchy, the level in the hierarchy within which the fair value measurement falls is determined based on the lowest level input that is significant to the fair value measurement in its entirety. The designated input levels are not necessarily an indication of the risk or liquidity associated with these investments.
These inputs are categorized in the following hierarchy under applicable financial accounting standards:
| Level 1 – | Unadjusted quoted prices in active markets for identical investments, unrestricted assets or liabilities that a Fund has the ability to access at the measurement date; |
| Level 2 – | Quoted prices which are not active, quoted prices for similar assets or liabilities in active markets or inputs other than quoted prices that are observable (either directly or indirectly) for substantially the full term of the asset or liability; and |
| Level 3 – | Significant unobservable prices or inputs (including the Fund’s own assumptions in determining the fair value of investments) where there is little or no market activity for the asset or liability at the measurement date. |
15 | November 30, 2023
ALPS Intermediate Municipal Bond ETF
| Notes to Financial Statements | November 30, 2023 |
The following is a summary of the inputs used to value the Fund’s investments as of November 30, 2023:
ALPS Intermediate Municipal Bond ETF
| Investments in Securities at Value | | Level 1 - Quoted and Unadjusted Prices | | | Level 2 - Other Significant Observable Inputs | | | Level 3 - Significant Unobservable Inputs | | | Total | |
| Government Bonds | | $ | – | | | $ | 1,996,368 | | | $ | – | | | $ | 1,996,368 | |
| Municipal Bonds* | | | – | | | | 29,483,568 | | | | – | | | | 29,483,568 | |
| Short Term Investments | | | 65,911 | | | | – | | | | – | | | | 65,911 | |
| Total | | $ | 65,911 | | | $ | 31,479,936 | | | $ | – | | | $ | 31,545,847 | |
| * | For a detailed breakdown of sectors, see the accompanying Schedule of Investments. |
The Fund did not have any securities that used significant unobservable inputs (Level 3) in determining fair value and there were no transfers into or out of Level 3 during the year ended November 30, 2023.
C. Securities Transactions and Investment Income
Securities transactions are recorded as of the trade date. Realized gains and losses from securities transactions are recorded on the specific identification in accordance with GAAP. Dividend income and capital gains distributions, if any, are recorded on the ex-dividend date. Interest income, if any, is recorded on the accrual basis, including amortization of premiums and accretion of discounts.
D. Dividends and Distributions to Shareholders
Dividends from net investment income of the Fund, if any, are declared and paid monthly or as the Board may determine from time to time. Distributions of net realized capital gains earned by the Fund, if any, are distributed at least annually.
E. Federal Tax and Tax Basis Information
The timing and character of income and capital gain distributions are determined in accordance with income tax regulations, which may differ from U.S. GAAP. Reclassifications are made to the Fund’s capital accounts for permanent tax differences to reflect income and gains available for distribution (or available capital loss carryforwards) under income tax regulations. For the fiscal year ended November 30, 2023, there were no reclassifications between Paid-in-Capital and Total Distributable Earnings.
The tax character of the distributions paid during the fiscal year ended November 30, 2023 and fiscal period ended November 30, 2022 was as follows:
| Fund | | Ordinary Income | | | Tax-Exempt Income | | | Short-Term Capital Gain | | | Long-Term Capital Gain | | | Return
of Capital | |
| November 30, 2023 | | | | | | | | | | | | | | | |
| ALPS Intermediate Municipal Bond ETF | | $ | 446,400 | | | $ | 798,214 | | | $ | – | | | $ | – | | | $ | – | |
| Fund | | Ordinary Income | | | Tax-Exempt Income | | | Short-Term Capital Gain | | | Long-Term Capital Gain | | | Return
of Capital | |
| November 30, 2022 | | | | | | | | | | | | | | | |
| ALPS Intermediate Municipal Bond ETF | | $ | 83,654 | | | $ | 345,293 | | | $ | – | | | $ | – | | | $ | – | |
The character of distributions made during the period may differ from its ultimate characterization for federal income tax purposes.
Under current law, capital losses maintain their character as short-term or long-term and are carried forward to the next tax year without expiration. As of November 30, 2023, the Fund did not have any amounts available to carry forward to the next tax year.
As of November 30, 2023, the components of distributable earnings on a tax basis were as follows.
| Fund | | Undistributed Ordinary
Income | | | Tax -Exempt Undistributed Income | | | Accumulated Net Realized Gain/(Loss) on Investments | | | Net Unrealized Appreciation/(Depreciation) on Investments | | | Total | |
| ALPS Intermediate Municipal Bond ETF | | $ | 68,043 | | | $ | 2,463 | | | $ | – | | | $ | 187,325 | | | $ | 257,831 | |
16 | November 30, 2023
ALPS Intermediate Municipal Bond ETF
| Notes to Financial Statements | November 30, 2023 |
As of November 30, 2023, the cost of investments for federal income tax purposes and accumulated net unrealized appreciation/(depreciation) on investments were as follows:
| | | ALPS Intermediate
Municipal Bond ETF | |
| Gross appreciation (excess of value over tax cost) | | $ | 451,469 | |
| Gross depreciation (excess of tax cost over value) | | | (264,144 | ) |
| Net unrealized appreciation/(depreciation) | | $ | 187,325 | |
| Cost of investments for income tax purposes | | $ | 31,358,522 | |
The differences between book-basis and tax-basis are primarily due to the deferral of losses from wash sales.
G. Income Taxes
No provision for income taxes is included in the accompanying financial statements, as the Fund intends to distribute to shareholders all taxable investment income and realized gains and otherwise comply with Subchapter M of the Internal Revenue Code of 1986, as amended, applicable to regulated investment companies. The Fund evaluates tax positions taken (or expected to be taken) in the course of preparing the Fund’s tax returns to determine whether these positions meet a “more-likely-than-not” standard that, based on the technical merits, have a more than fifty percent likelihood of being sustained by a taxing authority upon examination. A tax position that meets the “more-likely-than-not” recognition threshold is measured to determine the amount of benefit to recognize in the financial statements.
As of and during the year ended November 30, 2023, the Fund did not have a liability for any unrecognized tax benefits. The Fund files U.S. federal, state, and local tax returns as required. The Fund’s tax returns are subject to examination by the relevant tax authorities until expiration of the applicable statute of limitations, which is generally three years after the filing of the tax return, but may extend to four years in certain jurisdictions. Tax returns for open years have incorporated no uncertain tax positions that require a provision for income taxes.
3. INVESTMENT ADVISORY FEE AND OTHER AFFILIATED TRANSACTIONS
ALPS Advisors, Inc. serves as the Fund’s investment adviser pursuant to an Investment Advisory Agreement with the Trust on behalf of the Fund (the “Advisory Agreement”). Pursuant to the Advisory Agreement, the Fund pays the Adviser an annual management fee for the services and facilities it provides, payable on a monthly basis at the annual rate of 0.50% of the Fund’s average daily net assets.
Out of the unitary management fee, the Adviser pays substantially all expenses of the Fund, including the cost of sub-advisory, transfer agency, custody, fund administration, legal, audit, trustees and other services, except for acquired fund fees and expenses, interest expenses, distribution fees or expenses, brokerage expenses, taxes and extraordinary expenses not incurred in the ordinary course of the Fund's business. The Adviser’s unitary management fee is designed to pay substantially all of the Fund’s expenses and to compensate the Adviser for providing services to the Fund.
Brown Brothers Harriman & Co. (the “Sub-Adviser”) serves as the Fund's sub-adviser pursuant to a sub-advisory agreement with the Trust (the ‘‘Sub-Advisory Agreement’’). Pursuant to the Sub-Advisory Agreement, the Adviser pays the Sub-Adviser a sub-advisory fee out of the Adviser's advisory fee for the services it provides. The fee is payable on a monthly basis at the annual rate of 0.25% of the Fund's average daily net assets.
ALPS Fund Services, Inc., an affiliate of the Adviser, is the administrator of the Fund.
Effective July 1, 2023, each Trustee receives (1) a quarterly retainer of $25,000, (2) a per meeting fee of $15,000, (3) $2,500 for any special meeting held outside of a regularly scheduled board meeting, and (4) reimbursement for all reasonable out-of-pocket expenses relating to attendance at meetings. In addition, the Chairman of the Board receives a quarterly retainer of $5,000, the Chairman of the Audit Committee receives a quarterly retainer of $3,000, and the Chairman of the Nominating & Governance Committee receives a quarterly retainer of $2,000, each in connection with their respective roles. Prior to July 1, 2023, each Trustee received (1) a quarterly retainer of $20,000, (2) a per meeting fee of $10,000, (3) $2,500 for any special meeting held outside of a regularly scheduled board meeting, and (4) reimbursement for all reasonable out-of-pocket expenses relating to attendance at meetings. In addition, the Chairman of the Board received a quarterly retainer of $5,000, the Chairman of the Audit Committee received a quarterly retainer of $3,000, and the Chairman of the Nominating & Governance Committee received a quarterly retainer of $2,000, each in connection with their respective roles.
17 | November 30, 2023
ALPS Intermediate Municipal Bond ETF
| Notes to Financial Statements | November 30, 2023 |
4. PURCHASES AND SALES OF SECURITIES
For the year ended November 30, 2023, the cost of purchases and proceeds from sales of investment securities, excluding short-term investments and in-kind transactions, were as follows:
| Fund | | Purchases | | | Sales | |
| ALPS Intermediate Municipal Bond ETF | | $ | 40,139,694 | | | $ | 41,523,858 | |
For the year ended November 30, 2023, there were no in-kind transactions or realized gain/(loss) on in-kind transactions.
5. CAPITAL SHARE TRANSACTIONS
Shares are created and redeemed by the Fund only in Creation Unit size aggregations of 25,000 Shares. Only broker-dealers or large institutional investors with creation and redemption agreements called Authorized Participants (“AP”) are permitted to purchase or redeem Creation Units from the Fund. Such transactions are generally permitted on an in-kind basis, with a balancing cash component to equate the transaction to the NAV per unit of the Fund on the transaction date. Cash may be substituted equivalent to the value of certain securities generally when they are not available in sufficient quantity for delivery, not eligible for trading by the AP or as a result of other market circumstances.
6. MARKET RISK
The Fund is subject to investment and operational risks associated with financial, economic and other global market developments and disruptions, including those arising from war, terrorism, market manipulation, government interventions, defaults and shutdowns, political changes or diplomatic developments, public health emergencies (such as the spread of infectious diseases, pandemics and epidemics) and natural/environmental disasters, which can negatively impact the securities markets and cause the Fund to lose value. Securities in the Fund's portfolio may underperform in comparison to securities in general financial markets, a particular financial market or other asset classes due to a number of factors, including inflation (or expectations for inflation), deflation (or expectations for deflation), interest rates, global demand for particular products or resources, market instability, debt crises and downgrades, embargoes, tariffs, sanctions and other trade barriers, regulatory events, other governmental trade or market control programs and related geopolitical events. In addition, the value of the Fund's investments may be negatively affected by the occurrence of global events such as war, terrorism, environmental disasters, natural disasters or events, country instability, and infectious disease epidemics or pandemics.
7. REGULATORY UPDATE
The U.S. Securities and Exchange Commission ("SEC") adopted rule and form amendments that will change the format and content of the Fund's annual and semi-annual reports. Certain information, including the financial statements, will not appear in the Fund's new tailored shareholder reports but will be available online, delivered free of charge upon request, and filed on a semi-annual basis on Form N-CSR. The rule and form amendments have a compliance date of July 24, 2024. At this time, the Trust is evaluating the impact of these rule and form amendment changes.
8. SUBSEQUENT EVENTS
Subsequent events, if any, after the date of the Statement of Assets and Liabilities have been evaluated through the date the financial statements were issued. Management has determined that there were no subsequent events to report through the issuance of these financial statements.
18 | November 30, 2023
ALPS Intermediate Municipal Bond ETF
| Additional Information | November 30, 2023 (Unaudited) |
PROXY VOTING RECORDS, POLICIES AND PROCEDURES
Information regarding how the Fund voted proxies relating to portfolio securities during the most recent 12-month period ended June 30 and a description of the Fund’s proxy voting policies and procedures used in determining how to vote for proxies are available without charge on the SEC’s website at www.sec.gov and upon request, by calling (toll-free) 1-866-759-5679.
PORTFOLIO HOLDINGS
The Fund files a complete schedule of portfolio holdings with the U.S. Securities and Exchange Commission (“SEC”) for the first and third quarters of each fiscal year on Form N-PORT within 60 days after the end of the period. Copies of the Fund’s Form N-PORT are available without a charge, upon request, by contacting the Fund at 1-866-759-5679 and on the SEC’s website at https://www.sec.gov.
TAX INFORMATION
The ALPS Intermediate Municipal Bond ETF designates the following as a percentage of taxable ordinary income distributions, or up to the maximum amount allowable, for the calendar year ended December 31, 2022:
| | Qualified Dividend Income | Dividend Received Deduction |
| ALPS Intermediate Municipal Bond ETF | 0% | 0% |
In early 2023, if applicable, shareholders of record received this information for the distributions paid to them by the Funds during the calendar year 2022 via Form 1099. The Funds will notify shareholders in early 2024 of amounts paid to them by the Funds, if any, during the calendar year 2023.
19 | November 30, 2023
ALPS Intermediate Municipal Bond ETF
| Board Considerations Regarding Approval of | November 30, 2023 (Unaudited) |
Investment Advisory Agreement and Sub-Advisory Agreement
At its meetings held on June 5, 2023 and June 20, 2023, the Board of Trustees of the Trust (the “Board” or the “Trustees”), where each Trustee is not an “interested person” of the Trust within the meaning of the Investment Company Act of 1940, as amended (the “Independent Trustees”), evaluated a proposal to approve the continuance of the Investment Advisory Agreement between the Trust and ALPS Advisors, Inc. (the “Adviser” or “AAI”) with respect the ALPS Intermediate Municipal Bond ETF (the "Fund" or “MNBD”) and the Investment Sub-Advisory Agreement between AAI and Brown Brothers Harriman & Co. (the “Sub-Adviser” or “BBH”) with respect to MNBD (the “BBH Sub-Advisory Agreement”). In evaluating the renewal of the Investment Advisory Agreement with respect to the Fund, the Board, including the Independent Trustees, considered various factors, including (i) the nature, extent and quality of the services provided by AAI with respect to the Fund under the Investment Advisory Agreement; (ii) the advisory fees and other expenses paid by the Fund compared to those of similar funds managed by other investment advisers; (iii) the costs of the services provided to the Fund by AAI and the profits realized by AAI and its affiliates from its relationship to the Fund; (iv) the extent to which economies of scale have been or would be realized if and as the assets of the Fund grow and whether fees reflect the economies of scale for the benefit of shareholders; and (v) any additional benefits and other considerations.
With respect to the nature, extent and quality of the services provided by AAI under the Investment Advisory Agreement, the Board considered and reviewed information concerning the services provided under the Investment Advisory Agreement, financial information regarding AAI and its parent company, information describing AAI’s current organization and the background and experience of the persons responsible for the day-to-day management of the Fund.
The Board reviewed information on the performance of the Fund and its applicable benchmark for the 1-, 3-, and 5-year periods, as applicable, and against the appropriate FUSE performance universe. Based on this review, the Board, including the Independent Trustees found that the nature and extent of services provided to the Fund under the Investment Advisory Agreement was appropriate and that the quality of such services was satisfactory.
The Board noted that the advisory fees for the Fund were unitary fees pursuant to which AAI assumes all expenses of the Fund (including the cost of transfer agency, custody, fund administration, legal, audit and other services) other than the payments under the Advisory Agreement, brokerage expenses, taxes, interest, litigation expenses and other extraordinary expenses.
Based on the information available to them, including the Fund-specific summary set forth below, the Board, including the Independent Trustees, concluded that the advisory fee rate for the Fund was reasonable under the circumstances and in light of the quality of the services provided.
The Board, including the Independent Trustees, considered other benefits available to AAI because of its relationship with the Fund and concluded that the advisory fees were reasonable taking into account any such benefits.
The Board, including the Independent Trustees, also considered with respect to the Fund the information provided by AAI about the costs and profitability of AAI with respect to the Fund, including the asset levels and other factors that influence the profitability and financial viability of the Fund. The Board, including the Independent Trustees, reviewed and noted the relatively small size of the Fund and the analysis AAI had conducted to support AAI’s assertion that it was not realizing any economies of scale with respect to such Fund. The Independent Trustees determined that AAI should continue to keep the Board informed on an ongoing basis of any significant developments (e.g., material increases in asset levels) so as to facilitate the Independent Trustees’ evaluation of whether further economies of scale have been achieved.
The Board, including the Independent Trustees, also considered other potential benefits available to AAI because of its relationship with the Fund, known as fall-out benefits.
With respect to the Fund, the Board, including the Independent Trustees, noted the following:
The gross management fee rate for MNBD is higher than the median of its FUSE expense group. MNBD’s net expense ratio is higher than the median of its FUSE expense group.
The Board took into account, among other things, the comparatively strong performance of MNBD relative to peers over the since-inception period and the Adviser’s assertions related to the lack of economies of scale given MNBD’s current assets.
The Board, including the Independent Trustees, reviewed and noted the relatively small size of MNBD and the analysis AAI had conducted to support AAI’s assertion that it was not realizing any economies of scale with respect to MNBD.
In voting to renew the Investment Advisory Agreement with AAI, the Board, including the Independent Trustees, concluded that the terms of the Investment Advisory Agreement are reasonable and fair in light of the services to be performed, the fees paid by certain other funds, expenses to be incurred and such other matters as the members of the Board, including the Independent Trustees, considered relevant in the exercise of their reasonable business judgment. The Independent Trustees did not identify any single factor or group of factors as all important or controlling and considered all factors together.
20 | November 30, 2023
ALPS Intermediate Municipal Bond ETF
| Board Considerations Regarding Approval of | November 30, 2023 (Unaudited) |
Investment Advisory Agreement and Sub-Advisory Agreement
BBH Sub-Advisory Agreement
The Board, including the Independent Trustees, discussed the BBH Sub-Advisory Agreement.
In evaluating the BBH Sub-Advisory Agreement, the Board, including the Independent Trustees, considered various factors, including (i) the nature, extent and quality of the services provided by BBH with respect to MNBD under the BBH Sub-Advisory Agreement; (ii) the advisory fees and other expenses paid by MNBD compared to those of similar funds managed by other investment advisers; (iii) the profitability to BBH of its sub-advisory relationship with MNBD and the reasonableness of compensation to BBH; (iv) the extent to which economies of scale would be realized if, and as, MNBD’s assets increase, and whether the fee level in the BBH Sub-Advisory Agreement reflects these economies of scale; and (v) any additional benefits and other considerations.
With respect to the nature, extent and quality of the services provided by BBH under the BBH Sub-Advisory Agreement, the Board, including the Independent Trustees, considered and reviewed information concerning the services provided under the BBH Sub-Advisory Agreement, MNBD’s performance, financial information regarding BBH, information describing BBH’s current organization and the background and experience of the persons responsible for the day-to-day management of MNBD. Based upon their review, the Board, including the Independent Trustees, concluded that BBH was qualified to oversee the portfolio management of BBH and that the services provided by BBH to MNBD are satisfactory. The Board, including the Independent Trustees, considered that the contractual sub-advisory fee to be paid to BBH with respect to MNBD was 0.25% of MNBD’s average daily net assets out of a total management fee of 0.50% of MNBD’s average daily net assets.
In reviewing MNBD’s profitability with respect to BBH, the Board, including the Independent Trustees, considered the resources involved in managing MNBD.
The Board, including the Independent Trustees, also considered other benefits that have been and may be realized by BBH from its relationships with MNBD, known as fall-out benefits.
The Board, including the Independent Trustees, considered the extent to which economies of scale may be realized if MNBD’s assets continue to grow in size and whether fee levels reflect a reasonable sharing of such economies of scale for the benefit of the Fund’s investors. The Board, including the Independent Trustees, noted that MNBD commenced operations on May 19, 2022 and has not yet achieved scale in terms of assets. The Independent Trustees determined that AAI should continue to keep the Board informed on an ongoing basis of any significant developments (e.g., material increases in asset levels) so as to facilitate the Independent Trustees’ evaluation of whether further economies of scale have been achieved with respect to MNBD.
In voting to approve the BBH Sub-Advisory Agreement, the Board, including the Independent Trustees, concluded that the terms of the BBH Sub- Advisory Agreement are reasonable and fair in light of the services performed, expenses incurred and such other matters as the Board, including the Independent Trustees, considered relevant in the exercise of their reasonable business judgment. The Board, including the Independent Trustees, did not identify any single factor or group of factors as all important or controlling and considered all factors together.
21 | November 30, 2023
ALPS Intermediate Municipal Bond ETF
| Trustees & Officers | November 30, 2023 (Unaudited) |
The general supervision of the duties performed by the Adviser for the Fund under the Investment Advisory Agreement is the responsibility of the Board of Trustees. The Trust currently has four Trustees, each of whom have no affiliation or business connection with the Adviser or any of its affiliated persons and do not own any stock or other securities issued by the Adviser. These are the “non-interested” or “independent” Trustees (“Independent Trustees”).
The Independent Trustees of the Trust, their term of office and length of time served, their principal business occupations during the past five years, the number of portfolios in the Fund Complex overseen by each Independent Trustee, and other directorships, if any, held by the Trustee are shown below.
INDEPENDENT TRUSTEES
Name, Address and
Year of Birth
of Officer* | Position(s)
Held with Trust | Length of
Time Served** | Principal Occupation(s)
During Past 5 Years | Number of
Portfolios in Fund
Complex
Overseen by
Trustees*** | Other Directorships
Held by Trustees |
Mary K. Anstine, 1940 | Trustee | Since March 2008 | Ms. Anstine is Trustee/Director of AV Hunter Trust and Colorado Uplift Board. | 38 | Ms. Anstine is a Trustee of ALPS Variable Investment Trust (7 funds); Financial Investors Trust (29 funds); and Reaves Utility Income Fund. |
Jeremy W. Deems, 1976 | Trustee | Since March 2008 | Mr. Deems is the Co-Founder and Chief Financial Officer of Green Alpha Advisors, LLC, a registered investment advisor, and Co- Portfolio Manager of the AXS Green Alpha ETF. | 38 | Mr. Deems is a Trustee of ALPS Variable Investment Trust (7 funds); Financial Investors Trust (29 funds); and Reaves Utility Income Fund; and Clough Funds Trust (1 fund). |
Rick A. Pederson, 1952 | Trustee | Since March 2008 | Mr. Pederson is Partner, Bow River Capital Partners (private equity management), 2003 - present; Board Member, Prosci Inc. (private business services) 2013-2016; Advisory Board Member, Citywide Banks (Colorado community bank) 2014- 2017; Board Member, Strong- Bridge Consulting, 2015-2019; Board Member, IRI/ODMS Holdings LLC, 2017 – 2019; Director, National Western Stock Show (not for profit) 2010 - present; Director, History Colorado (not for profit) 2015- present; Director, Citywide Bank Advisory Board 2017-present; Trustee, Boettcher Foundation, 2018 -present. | 24 | Mr. Pederson is Trustee of Segall Bryant & Hamill Trust (14 funds) and Principal Real Estate Income Fund (1 fund). |
| * | The business address of the Trustee is c/o ALPS Advisors, Inc., 1290 Broadway, Suite 1000, Denver, Colorado 80203. |
| ** | This is the period for which the Trustee began serving the Trust. Each Trustee serves an indefinite term, until his or her successor is elected. |
| *** | The Fund Complex includes all series of the Trust and any other investment companies for which ALPS Advisors, Inc. provides investment advisory services. |
22 | November 30, 2023
ALPS Intermediate Municipal Bond ETF
| Trustees & Officers | November 30, 2023 (Unaudited) |
Name, Address and
Year of Birth
of Officer* | Position(s)
Held with Trust | Length of
Time Served** | Principal Occupation(s)
During Past 5 Years | Number of
Portfolios in Fund
Complex
Overseen by
Trustees*** | Other Directorships
Held by Trustees |
Edmund J. Burke, 1961 | Trustee | Since December 2017 | Mr. Burke joined ALPS in 1991 and served as the President and Director of ALPS Holdings, Inc., and ALPS Advisors, Inc., and Director of ALPS Distributors, Inc., ALPS Fund Services, Inc. (“ALPS”), and ALPS Portfolio Solutions Distributor, Inc. (collectively, the “ALPS Companies”). Mr. Burke retired from the ALPS Companies in June 2019. Mr. Burke is currently a partner at ETF Action, a web-based system that provides data and analytics to registered investment advisers, (since 2020) and a Director of Alliance Bioenergy Plus, Inc., a technology company focused on emerging technologies in the renewable energy, biofuels, and bioplastics technology sectors (since 2020). | 33 | Mr. Burke is a Trustee of Clough Global Dividend and Income Fund (1 fund); Clough Global Equity Fund (1 fund); Clough Global Opportunities Fund (1 fund); Clough Funds Trust (1 fund); Liberty All-Star Equity Fund (1 fund); Director of the Liberty All-Star Growth Fund, Inc. (1 fund) and Financial Investors Trust (29 funds). |
| * | The business address of the Trustee is c/o ALPS Advisors, Inc., 1290 Broadway, Suite 1000, Denver, Colorado 80203. |
| ** | This is the period for which the Trustee began serving the Trust. Each Trustee serves an indefinite term, until his or her successor is elected. |
| *** | The Fund Complex includes all series of the Trust and any other investment companies for which ALPS Advisors, Inc. provides investment advisory services. |
23 | November 30, 2023
ALPS Intermediate Municipal Bond ETF
| Trustees & Officers | November 30, 2023 (Unaudited) |
OFFICERS:
Name, Address and
Year of Birth of Officer* | Position(s)
Held with Trust | Length of
Time Served** | Principal Occupation(s)
During Past 5 Years |
Laton Spahr, 1975 | President | Since June 2021 | Mr. Spahr joined ALPS in 2019 and currently serves as President and Portfolio Manager of AAI. Prior to his current role, Mr. Spahr was a Senior Vice President and Strategy Leader of the Value & Income Team for Oppenheimer Funds from 2013 to 2019. |
Matthew Sutula, 1985 | Chief Compliance Officer ("CCO") | Since December 2019 | Mr. Sutula joined ALPS in 2012 and currently serves as Chief Compliance Officer of AAI. Prior to his current role, Mr. Sutula served as interim Compliance Officer of the Trust (September 2019 to December 2019). Compliance Manager and Senior Compliance Analyst for AAI, as well as Compliance Analyst for AFS. Prior to joining ALPS, he spent seven years at Morningstar, Inc. in various analyst roles supporting the registered investment company databases. Mr. Sutula is also Chief Compliance Officer of Principal Real Estate Income Fund, ALPS Variable Investment Trust, Liberty All-Star Equity Fund and Liberty All-Star Growth Fund, Inc. From September 2019 to September 2022 he served as Chief Compliance Officer of RiverNorth Opportunities Fund, Inc. |
| Erich Rettinger, 1985 | Treasurer | Since September 2023 | Mr. Rettinger is Vice President of AAI (since 2021) and serves as Treasurer of Principal Real Estate Income Fund, Liberty All-Star Equity Fund, Liberty All-Star Growth Fund, Inc., and ALPS Variable Investment Trust. From December 2021 to October 2022 he also served as Treasurer of RiverNorth Opportunities Fund, Inc. Because of his position with AAI, Mr. Rettinger is deemed an affiliate of the Fund as defined under the 1940 Act. From 2013-2021, he served as Vice President and Fund Controller of ALPS Fund Services. |
Michael P. Lawlor, 1969 | Secretary | Since December 2022 | Mr. Lawlor joined ALPS in January 2022, and is currently Vice President and Principal Legal Counsel. Prior to joining ALPS, Mr. Lawlor was Lead Fund Counsel at Brighthouse Financial (insurance company) (January 2007-April 2021). Mr. Lawlor also serves as Secretary of Financial Investors Trust and ALPS Variable Investment Trust. |
Susan M. Cannon, 1974 | Assistant Secretary | Since May 2023 | Ms. Cannon joined ALPS in September 2022, and is currently a Senior Paralegal of ALPS Fund Services, Inc. Prior to joining ALPS, Ms. Cannon worked for World Premier Private Partnership, Brown Brothers Harriman & Co. |
| * | The business address of each Officer is c/o ALPS Advisors, Inc., 1290 Broadway, Suite 1000, Denver, Colorado 80203. Each Officer is deemed an affiliate of the Trust as defined under the 1940 Act. |
| ** | This is the period for which the Officer began serving the Trust. Each Officer serves an indefinite term, until his or her successor is elected. |
The Statement of Additional Information includes additional information about the Funds' Trustees and is available, without charge, upon request by calling (toll-free) 1-866-759-5679.
24 | November 30, 2023


Table of Contents
| Performance Overview | |
| ALPS Clean Energy ETF | 1 |
| ALPS Disruptive Technologies ETF | 4 |
| ALPS Global Travel Beneficiaries ETF | 7 |
| ALPS Medical Breakthroughs ETF | 10 |
| Disclosure of Fund Expenses | 13 |
| Report of Independent Registered Public Accounting Firm | 14 |
| Financial Statements | |
| Schedules of Investments | |
| ALPS Clean Energy ETF | 15 |
| ALPS Disruptive Technologies ETF | 17 |
| ALPS Global Travel Beneficiaries ETF | 19 |
| ALPS Medical Breakthroughs ETF | 21 |
| Statements of Assets and Liabilities | 23 |
| Statements of Operations | 24 |
| Statements of Changes in Net Assets | |
| ALPS Clean Energy ETF | 25 |
| ALPS Disruptive Technologies ETF | 26 |
| ALPS Global Travel Beneficiaries ETF | 27 |
| ALPS Medical Breakthroughs ETF | 28 |
| Financial Highlights | 29 |
| Notes to Financial Statements | 33 |
| Additional Information | 42 |
| Board Considerations Regarding Approval of Investment Advisory Agreement | 46 |
| Trustees & Officers | 48 |
alpsfunds.com
ALPS Clean Energy ETF
| Performance Overview | November 30, 2023 (Unaudited) |
Investment Objective
The ALPS Clean Energy ETF (the “Fund” or “ACES”) seeks investment results that correspond (before fees and expenses) generally to the performance of its underlying index, the CIBC Atlas Clean Energy Index (ticker symbol NACEX) (the “Underlying Index”). The Underlying Index utilizes a rules-based methodology developed by CIBC National Trust Company, which is designed to provide exposure to a diverse set of U.S. and Canadian companies involved in the clean energy sector including renewables and clean technology.
The Fund employs a “passive management” – or indexing – investment approach designed to track the performance of the Underlying Index. The Underlying Index utilizes a rules-based methodology developed by CIBC National Trust Company (the “Index Provider”), which is designed to provide exposure to a diverse set of U.S. and Canadian companies involved in the clean energy sector including renewables and clean technology. The clean energy sector is comprised of companies that provide the products and services that enable the evolution of a more sustainable energy sector. Clean energy business segments include, but are not limited to, the following activities: (i) renewable energy sources, including solar power, wind power, hydroelectricity, geothermal energy, biomass, biofuels, and tidal/wave energy, (ii) clean technologies, including electric vehicles, energy storage, lithium, fuel cell, smart grid, and energy efficiency technologies and (iii) other emerging clean energy activities and technologies. The Underlying Index is compiled by the Index Provider and may be comprised of U.S. or Canadian companies. In order to be eligible for inclusion in the Underlying Index, a company’s stock must be traded on one or more major U.S. or Canadian securities exchanges, be based in the U.S. or in Canada, have a minimum float-adjusted market capitalization and minimum average daily trading value thresholds established by the index rulebook of at least $300 million, and have a minimum median average daily trading liquidity of greater than $3 million over the last 60 trading days prior to the selection date, and the company must derive a majority of its value from clean energy business segments (as defined above). Such eligible companies shall be defined as the “Index Universe.” All equity securities meeting the above criteria are selected for inclusion in the Index Universe. The Underlying Index is reconstituted and rebalanced quarterly on the third Friday in March, June, September and December.
Performance Overview
The Fund, for the twelve-month period ended November 30, 2023, generated a total return of -43.11%. Performance was generally in-line with the Fund’s Underlying Index, net of fees, which returned -43.29%. The Fund underperformed the S&P 1000® Index, which returned -0.41% for the same period.
The S&P 500® Index returned 13.84% for the trailing twelve-month period that ended November 30, 2023, as fiscal year 2023 saw markets rebound from 2022 lows. The Federal Reserve Bank (Fed) continued its path of quantitative tightening in 2023 to combat inflation, reaching its target of peak rates with expectations of rate cuts into 2024 as Consumer Price Index (CPI), energy prices and yields trended towards more acceptable levels. US markets rallied substantially off the secondary effects of the Fed’s actions, which ALPS Advisors believes will lead to better odds of a soft landing, with expectations of rate cuts driving growth and equity multiples higher into the next year. Main macroeconomic talking points throughout 2023 centered on the path of future interest rates driven by monetary policy, and inflation trending towards the Fed’s 2% inflation target. Inflation significantly declined throughout 2023, with November 2023 numbers showing year-over-year CPI around 3.1%. Despite persistent recession calls, ALPS Advisors believes a gradual reduction in interest rates is likely to lead to an earnings recovery in the US, easing financial conditions for both US and global equities. With the recent recovery in sentiment and price for US markets, the S&P 500® Index Price-to-Earnings (P/E) ratio of 22.2x is slightly above its 10-year average of 20.6x. Looking forward, ALPS Advisors believes markets are likely to be data-dependent on job growth, CPI, spending and manufacturing data to justify the recent recovery in valuations.
The clean energy space faced significant headwinds in 2023, with higher interest rates impacting clean energy companies significantly. Many clean energy companies rely on funding and thus have struggled during the period due to higher borrowing costs. Additionally, policymakers have not fully explained what qualifies for the investment tax credits laid out in the Inflation Reduction Act last year. Despite a difficult 2023 for clean energy, ALPS Advisors believes forward-looking ambitious goals are primed to increase investment within the clean energy space to reach Net Zero by 2050. The Biden administration has set forth enormous initiatives to reduce greenhouse gas emissions by 50% by 2030, setting the precedent for further clean infrastructure spending and renewable project initiations. ALPS Advisors believes the $260 billion Inflation Reduction Act, passed in August 2022, continues to be a major catalyst for clean energy names and ACES, setting the path forward to create a 100% carbon pollution-free power sector by 2035.
The best performing stocks in the Fund for the period ended November 30, 2023, were Fluence Energy Inc. (FLNC US), which increased 45.98%, Rex American Resources Corp (REX US), which saw a gain of 32.80%, and Itron Inc. (ITRI US), which rose 26.70%. The largest detractors were Proterra Inc. (PTRAQ US), which decreased 97.86%, Enviva Inc. (EVA US), falling 97.81%, and Li-Cycle Holdings Corp. (LICY US), which lost 86.16%.
ACES' Underlying Index has a differentiated approach to clean energy. First, by narrowing the list of constituents to companies whose primary operations are focused on clean energy, the Underlying Index offers more pure-play exposure to the clean energy sector. Second, constituents are diversified across the sector and offer exposure to the full opportunity set of the transition from fossil fuels to renewable energy. Lastly, focusing on
U.S. and Canadian-based companies helps to further minimize the risk of investing in a global industry by reducing risks related to foreign holdings, including currency exchange rates, financial disclosures, and regulatory and policy changes.
1 | November 30, 2023
ALPS Clean Energy ETF
| Performance Overview | November 30, 2023 (Unaudited) |
Fund Performance (as of November 30, 2023)
| | 1 Year | 5 Year | Since Inception^ |
| ALPS Clean Energy ETF - NAV | -43.11% | 5.84% | 5.44% |
| ALPS Clean Energy ETF - Market Price* | -43.05% | 5.71% | 5.43% |
| S&P 1000® Index | -0.41% | 7.37% | 6.03% |
| CIBC Atlas Clean Energy Index | -43.29% | 6.02% | 5.79% |
Total Expense Ratio (per the current prospectus) is 0.55%.
Performance data quoted represents past performance. Past performance does not guarantee future results. Total return figures assume reinvestment of dividends and capital gains distributions, if any. The table does not reflect the deduction of taxes that a shareholder would pay on Fund distributions or the redemption of Fund shares. Investment return and principal value of an investment will fluctuate so that an investor’s shares, when sold or redeemed, may be worth more or less than the original cost. Current performance data may be higher or lower than actual data quoted. For the most current month-end performance data please visit www.alpsfunds.com or call 1.866.759.5679.
Net Asset Value (NAV) is an exchange-traded fund’s per-share value. The per-share dollar amount of the fund is derived by dividing the total value of all the securities in its portfolio, less any liabilities, by the number of fund shares outstanding. Market Price is the price at which a share can currently be traded in the market. Information detailing the number of days the Market Price of the Fund was greater than the Fund’s NAV and the number of days it was less than the Fund’s NAV can be obtained at www.alpsfunds.com.
| ^ | The Fund commenced operations on June 28, 2018, with the first day of trading on the exchange of June 29, 2018. |
| * | Market Price means the official closing price of a share or, if it more accurately reflects the market value of a share at the time as of which the Fund calculates current net asset value per share, the price that is the midpoint of the bid-ask spread as of that time. It does not represent the returns an investor would receive if shares were traded at other times. |
CIBC Atlas Clean Energy Index is an adjusted market cap weighted index designed to provide exposure to a diverse set of U.S. or Canadian based companies involved in the clean energy sector including renewables and clean technology. The clean energy sector is comprised of companies that provide the products and services which enable the evolution of a more sustainable energy sector. Clean energy business segments include but are not limited to: solar, wind, hydro, geothermal, electric vehicles, LED, biomass, smart grid, energy efficiency and storage. Total return assumes reinvestment of any dividends and distributions realized during a given time period.
The S&P 1000® Index combines the S&P MidCap 400® and the S&P SmallCap 600® to form an investable benchmark for the mid- to small-cap segment of the U.S. equity market. Total return assumes reinvestment of any dividends and distributions realized during a given time period.
One cannot invest directly in an index. Index performance does not reflect fund performance.
The Fund’s shares are not individually redeemable. Investors buy and sell shares of the Fund on a secondary market. Only market makers or “authorized participants” may trade directly with the Fund, typically in blocks of 25,000 shares.
The ALPS Clean Energy ETF is not suitable for all investors. Investments in the Fund are subject to investment risks, including possible loss of the principal amount invested.
ALPS Portfolio Solutions Distributor, Inc., a FINRA member, is the Distributor for the ALPS Clean Energy ETF.
2 | November 30, 2023
ALPS Clean Energy ETF
| Performance Overview | November 30, 2023 (Unaudited) |
Top Ten Holdings* (as of November 30, 2023)
| Brookfield Renewable Partners LP | 6.60% |
| Tesla, Inc. | 6.28% |
| First Solar, Inc. | 5.63% |
| Enphase Energy, Inc. | 5.39% |
| Northland Power, Inc. | 5.25% |
| Rivian Automotive, Inc. | 4.97% |
| Darling Ingredients, Inc. | 4.80% |
| Lucid Group, Inc. | 4.41% |
| Ormat Technologies, Inc. | 4.40% |
| Albemarle Corp. | 4.12% |
| Total % of Top 10 Holdings | 51.85% |
| * | % of Total Investments (excluding investments purchased with collateral from securities loaned) |
Clean Energy Segment Allocation* (as of November 30, 2023)
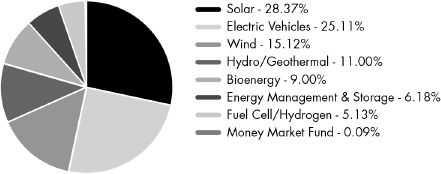
Future holdings are subject to change.
Growth of $10,000 (as of November 30, 2023)
Comparison of change in value of a $10,000 investment in the Fund and the Index
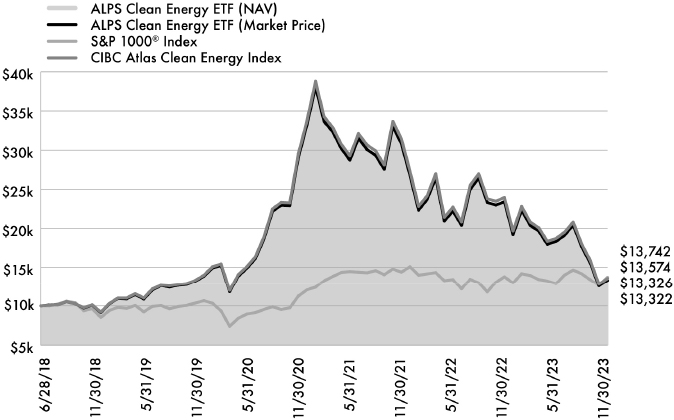
The chart above compares historical performance of a hypothetical investment of $10,000 in the Fund since inception with the performance of the Fund’s benchmark indices. Results include the reinvestment of all dividends and capital gains distributions. Past performance does not guarantee future results. The chart does not reflect the deduction of taxes that a shareholder would pay on Fund distributions or the redemption of Fund shares.
3 | November 30, 2023
ALPS Disruptive Technologies ETF
| Performance Overview | November 30, 2023 (Unaudited) |
Investment Objective
ALPS Disruptive Technologies ETF (the “Fund” or “DTEC”) seeks investment results that correspond (before fees and expenses) generally to the performance of the Indxx Disruptive Technologies Net Index (ticker symbol IDTEC) (the “Underlying Index”). The Fund will invest at least 80% of its net assets in securities that comprise the Underlying Index.
The Fund employs a “passive management” – or indexing – investment approach designed to track the performance of the Underlying Index. The Underlying Index utilizes a rules-based methodology developed by Indxx, LLC (the “Index Provider”), which is designed to identify the companies using disruptive technologies in each of ten thematic areas: Healthcare Innovation, Internet of Things, Clean Energy and Smart Grid, Cloud Computing, Data and Analytics, FinTech, Robotics and Artificial Intelligence, Cybersecurity, 3D Printing, and Mobile Payments (each a “Theme” and together, the “Themes”). Companies using disruptive technologies are those that are entering traditional markets with new digital forms of production and distribution, seek to disrupt an existing market and value network, displace established market-leading firms, products and alliances and increasingly gain market share. The Underlying Index is compiled by the Index Provider and may be comprised of U.S. and non-U.S. companies, including foreign and emerging markets companies. In order to be eligible for inclusion in the Underlying Index’s Index Universe, a company’s stock must be traded on one or more major global securities exchanges, have a minimum market capitalization of at least $500 million, and have a six month minimum average daily trading volume of $2 million, and the company must derive a minimum of 50% of its revenue from a single Theme. All equity securities meeting the above criteria are selected for inclusion in the Index Universe. From the Index Universe, the Underlying Index methodology selects ten stocks in each Theme according to proprietary quantitative and qualitative factors. The eligible stocks that are selected for inclusion in the Underlying Index’s portfolio are equally weighted. The Underlying Index is reconstituted annually on the third Friday of September and rebalanced quarterly.
Performance Overview
The Fund, for the twelve-month period ended November 30, 2023, generated a total return of 10.16%. Performance was generally in-line with the Fund’s Underlying Index, net of fees, which returned 10.91%. The Fund slightly underperformed the Morningstar Global Markets Index, which returned 11.33% for the same period.
The S&P 500® Index returned 13.84% for the trailing twelve-month (TTM) period that ended November 30, 2023, as fiscal year 2023 saw markets rebound from 2022 lows. The Federal Reserve Bank (Fed) continued its path of quantitative tightening in 2023 to combat inflation, reaching its target of peak rates with expectations of rate cuts into 2024 as Consumer Price Index (CPI), energy prices and yields trended towards more acceptable levels. US markets rallied substantially off the secondary effects of the Fed’s actions, which ALPS Advisors believes will lead to better odds of a soft landing, with expectations of rate cuts driving growth and equity multiples higher into the next year. Main macroeconomic talking points throughout 2023 centered on the path of future interest rates driven by monetary policy, and inflation trending towards the Fed’s 2% inflation target. Inflation significantly declined throughout 2023, with November 2023 numbers showing year-over-year CPI around 3.1%. Despite persistent recession calls, ALPS Advisors believes a gradual reduction in interest rates is likely to lead to an earnings recovery in the US, easing financial conditions for both US and global equities. With the recent recovery in sentiment and price for US markets, the S&P 500® Index Price-to- Earnings (P/E) ratio of 22.2x is slightly above its 10-year average of 20.6x. Looking forward, ALPS Advisors believes markets are likely to be data-dependent on job growth, CPI, spending and manufacturing data to justify the recent recovery in valuations.
DTEC slightly underperformed the Morningstar Global Markets Index, which returned 11.33% for the trailing twelve-month period ended November 30, 2023, with DTEC holding roughly 64% U.S. equities and 36% foreign equities at the end of the period. Despite slightly underperforming the Morningstar Global Markets Index, ALPS Advisors believes the Underlying Index's methodology of equally weighting 10 disruptive technology themes is primed for strength in the coming years as advancements in Artificial Intelligence (AI) are set to positively impact disruptive technology companies.
ALPS believes that disruptive technologies pave the way for a brighter future through innovation and fundamentally alter the way industries operate. Furthermore, the potential to capture returns within different disruptive technology themes is compelling and offers the potential to supercharge a portfolio. The Underlying Index employs an equal-weighted strategy to its disruptive themes, resulting in 10 sub-themes (3D Printing, Clean Energy & Smart Grid, Cloud Computing, Cyber Security, Data & Analytics, FinTech, Healthcare Innovation, IoT, Mobile Payments, Robotics & AI), each with a 10% allocation. The Fund picks the top 10 names from its universe that most represent the specific theme. Cybersecurity was the best-performing theme for the year, although all DTEC themes were negative for the TTM period. DTEC’s top performing name for the year was Crowdstrike Holdings Inc. (CRWD US), a cybersecurity company, gaining an impressive 101.44%. In contrast, the worst-performing name for DTEC was Cutera Inc. (CUTR US), a laser system manufacturer, falling 80.33%.
Looking ahead, ALPS Advisors believes that the Fund’s strategy of selecting the top disruptive themes in the market today will provide exposure to areas of the market ALPS Advisors believes will be high-growth relative to the Morningstar Global Markets Index.
4 | November 30, 2023
ALPS Disruptive Technologies ETF
| Performance Overview | November 30, 2023 (Unaudited) |
Fund Performance (as of November 30, 2023)
| | 1 Year | 5 Year | Since Inception^ |
| ALPS Disruptive Technologies ETF - NAV | 10.16%+ | 8.28% | 7.74% |
| ALPS Disruptive Technologies ETF - Market Price* | 9.84% | 8.23% | 7.70% |
| Indxx Disruptive Technologies Index | 10.91% | 8.61% | 8.08% |
| Morningstar® Global Markets Index | 11.33% | 8.65% | 6.71% |
Total Expense Ratio (per the current prospectus) is 0.50%.
Performance data quoted represents past performance. Past performance does not guarantee future results. Total return figures assume reinvestment of dividends and capital gains distributions, if any. The table does not reflect the deduction of taxes that a shareholder would pay on Fund distributions or the redemption of Fund shares. Investment return and principal value of an investment will fluctuate so that an investor’s shares, when sold or redeemed, may be worth more or less than the original cost. Current performance data may be higher or lower than actual data quoted. For the most current month-end performance data please visit www.alpsfunds.com or call 1.866.759.5679.
Net Asset Value (NAV) is an exchange-traded fund’s per-share value. The per-share dollar amount of the fund is derived by dividing the total value of all the securities in its portfolio, less any liabilities, by the number of fund shares outstanding. Market Price is the price at which a share can currently be traded in the market. Information detailing the number of days the Market Price of the Fund was greater than the Fund’s NAV and the number of days it was less than the Fund’s NAV can be obtained at www.alpsfunds.com.
| ^ | The Fund commenced operations on December 28, 2017, with the first day of trading on the exchange of December 29, 2017. |
| * | Market Price means the official closing price of a share or, if it more accurately reflects the market value of a share at the time as of which the Fund calculates current net asset value per share, the price that is the midpoint of the bid-ask spread as of that time. It does not represent the returns an investor would receive if shares were traded at other times. |
| + | Excludes adjustments in accordance with accounting principles generally accepted in the United States of America and as such, the net asset value and total return for shareholder transactions reported to the market may differ from the net asset value for financial reporting purposes. |
Indxx Disruptive Technologies Index (Ticker: IDTEC) is based around companies that enter traditional markets with new digital forms of production and distribution, are likely to disrupt an existing market and value network, displace established market leading firms, products and alliances and increasingly gain market share. Total Return assumes reinvestment of any dividends and distributions realized during a given time period. Net Total Return (NTR) is obtained by reinvesting the net dividend, which is equal to the ordinary gross dividend minus the amount of withholding tax.
The Morningstar® Global Markets Index, measures the performance of the stocks located in the developed and emerging countries across the world. Stocks in the index are weighted by their float capital, which removes corporate cross ownership, government holdings and other locked-in shares.
One cannot invest directly in an index. Index performance does not reflect fund performance.
The Fund’s shares are not individually redeemable. Investors buy and sell shares of the Fund on a secondary market. Only market makers or “authorized participants” may trade directly with the Fund, typically in blocks of 25,000 shares.
The ALPS Disruptive Technologies ETF is not suitable for all investors. Investments in the Fund are subject to investment risks, including possible loss of the principal amount invested.
ALPS Portfolio Solutions Distributor, Inc., a FINRA member, is the Distributor for the ALPS Disruptive Technologies ETF.
5 | November 30, 2023
ALPS Disruptive Technologies ETF
| Performance Overview | November 30, 2023 (Unaudited) |
Top Ten Holdings* (as of November 30, 2023)
| Adyen NV | 1.46% |
| Crowdstrike Holdings, Inc. | 1.43% |
| Nemetschek SE | 1.30% |
| Proto Labs, Inc. | 1.29% |
| Vestas Wind Systems A/S | 1.28% |
| Zscaler, Inc. | 1.22% |
| AeroVironment, Inc. | 1.22% |
| Splunk, Inc. | 1.22% |
| Datadog, Inc. | 1.20% |
| Dassault Systemes SE | 1.20% |
| Total % of Top 10 Holdings | 12.82% |
| * | % of Total Investments (excluding investments purchased with collateral from securities loaned) |
Thematic Allocation* (as of November 30, 2023)
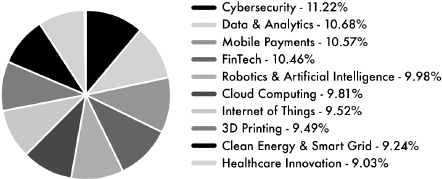
Future holdings are subject to change.
Growth of $10,000 (as of November 30, 2023)
Comparison of change in value of a $10,000 investment in the Fund and the Index
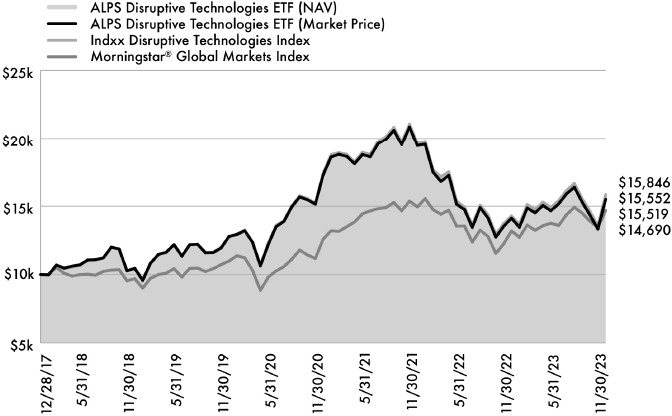
The chart above compares historical performance of a hypothetical investment of $10,000 in the Fund since inception with the performance of the Fund’s benchmark indices. Results include the reinvestment of all dividends and capital gains distributions. Past performance does not guarantee future results. The chart does not reflect the deduction of taxes that a shareholder would pay on Fund distributions or the redemption of Fund shares.
6 | November 30, 2023
ALPS Global Travel Beneficiaries ETF
| Performance Overview | November 30, 2023 (Unaudited) |
Investment Objective
ALPS Global Travel Beneficiaries ETF (the "Fund" or "JRNY") seeks investment results that replicate as closely as possible, before fees and expenses, the performance of the S-Network Global Travel Index (ticker symbol TRAVEL) (the “Underlying Index”).
The Underlying Index uses a rules-based methodology developed by S-Network Global Indexes Inc. (the "Index Provider"), which is designed to identify exchange-traded stocks of companies that are materially engaged in the global travel industry, including four segments: Airlines & Airport Services; Hotels, Casinos, Cruise Lines; Booking & Rental Agencies; and Ancillary Beneficiaries. The Underlying Index is compiled by the Index Provider and may be comprised of U.S. and non-U.S. companies, including foreign and emerging markets companies. In order to be eligible for inclusion in the Underlying Index's Index Universe, a company's stock must be traded on one or more major global securities exchanges and be principally engaged in or derive significant revenue from one of the segments. In addition, a company's stock must have a minimum market capitalization of at least $100 million, a three-month minimum average daily trading volume of $1 million, and a minimum free float factor of 18%. All equity securities meeting the above criteria are selected for inclusion in the Index Universe. From the Index Universe, the Underlying Index methodology selects and weights twenty stocks in each segment, subject to a minimum of one constituent per geographic region (U.S. & Canada, Europe, Pacific (ex-Canada), and Emerging) and a 65% maximum weight per geographic region. The Underlying Index is rebalanced and reconstituted quarterly on the third Friday of the last month in each calendar quarter.
Performance Overview
The Fund, for the twelve-month period ended November 30, 2023, generated a total return of 5.01%, slightly underperforming the Fund’s Underlying Index, net of fees, which returned 5.87%. The Fund underperformed the S&P 500® Index, which returned 13.84% for the same period.
The S&P 500® Index returned 13.84% for the trailing twelve-month (TTM) period that ended November 30, 2023, as fiscal year 2023 saw markets rebound from 2022 lows. The Federal Reserve Bank (Fed) continued its path of quantitative tightening in 2023 to combat inflation, reaching its target of peak rates with expectations of rate cuts into 2024 as Consumer Price Index (CPI), energy prices and yields trended towards more acceptable levels. US markets rallied substantially off the secondary effects of the Fed’s actions, which ALPS Advisors believes will lead to better odds of a soft landing, with expectations of rate cuts driving growth and equity multiples higher into the next year. Main macroeconomic talking points throughout 2023 centered on the path of future interest rates driven by monetary policy, and inflation trending towards the Fed’s 2% inflation target. Inflation significantly declined throughout 2023, with November 2023 numbers showing year-over-year CPI around 3.1%. Despite persistent recession calls, ALPS Advisors believes a gradual reduction in interest rates is likely to lead to an earnings recovery in the US, easing financial conditions for both US and global equities. With the recent recovery in sentiment and price for US markets, the S&P 500® Index Price-to- Earnings (P/E) ratio of 22.2x is slightly above its 10-year average of 20.6x. Looking forward, ALPS Advisors believes markets are likely to be data-dependent on job growth, CPI, spending and manufacturing data to justify the recent recovery in valuations.
In terms of global travel, ALPS Advisors believes travel companies and beneficiaries are poised to benefit from improving economic conditions. ALPS Advisors believes global travel continues to have its pulse on the state of the consumer, with strong travel spending expected to continue its recovery into 2024, and with overseas travel arrivals only 16% below pre-pandemic levels and spending up 1% compared to this time last year, according to the U.S. Travel Association. Travel beneficiaries have so far been able to pass the majority of increased costs related to inflation on to consumers, which has helped to reduce the strain on profit margins.
The best-performing stocks in the Fund for the TTM period were Uber Technologies Inc. (UBER US), which increased 93.48%, and RyanAir Holdings PLC (RYAAY US), which saw a gain of 56.19%. Furthermore, the top-performing JRNY segment was Airlines & Airport Services, returning -2.58%. The largest individual detractors for the TTM period were Sonder Holdings Inc. (SOND US), decreasing 65.44%, and Vacasa Inc. (VCSA US), which lost 57.65%.
Looking ahead, ALPS Advisors believes the Fund’s strategy of identifying companies that are materially engaged in global travel industries, including airlines, hotels, casinos and cruise lines, and companies that support and stand to benefit from those industries, is designed to provide a holistic and more diversified exposure to the secular tailwinds in global travel.
7 | November 30, 2023
ALPS Global Travel Beneficiaries ETF
| Performance Overview | November 30, 2023 (Unaudited) |
Fund Performance (as of November 30, 2023)
| | 1 Year | Since Inception^ |
| ALPS Global Travel Beneficiaries ETF - NAV | 5.01%+ | -5.00% |
| ALPS Global Travel Beneficiaries ETF - Market Price* | 4.76% | -4.96% |
| S-Network Global Travel Index | 5.87% | -4.52% |
| Morningstar® Global Markets Index | 11.33% | -1.82% |
Total Expense Ratio (per the current prospectus) is 0.65%.
Performance data quoted represents past performance. Past performance does not guarantee future results. Total return figures assume reinvestment of dividends and capital gains distributions, if any. The table does not reflect the deduction of taxes that a shareholder would pay on Fund distributions or the redemption of Fund shares. Investment return and principal value of an investment will fluctuate so that an investor’s shares, when sold or redeemed, may be worth more or less than the original cost. Current performance data may be higher or lower than actual data quoted. For the most current month-end performance data please visit www.alpsfunds.com or call 1.866.759.5679.
Net Asset Value (NAV) is an exchange-traded fund’s per-share value. The per-share dollar amount of the fund is derived by dividing the total value of all the securities in its portfolio, less any liabilities, by the number of fund shares outstanding. Market Price is the price at which a share can currently be traded in the market. Information detailing the number of days the Market Price of the Fund was greater than the Fund’s NAV and the number of days it was less than the Fund’s NAV can be obtained at www.alpsfunds.com.
| ^ | The Fund commenced operations on September 8, 2021, with the first day of trading on the exchange of September 9, 2021. |
| * | Market Price means the official closing price of a share or, if it more accurately reflects the market value of a share at the time as of which the Fund calculates current net asset value per share, the price that is the midpoint of the bid-ask spread as of that time. It does not represent the returns an investor would receive if shares were traded at other times. |
+ Excludes adjustments in accordance with accounting principles generally accepted in the United States of America and as such, the net asset value and total return for shareholder transactions reported to the market may differ from the net asset value for financial reporting purposes.
The S-Network Global Travel Index (Ticker: TRAVEL) is an Index of stocks listed on global recognized stock exchanges that are materially engaged in segments of the global travel industry, including Airlines & Airport Services; Hotels, Casinos, and Cruise Lines; Booking & Rental Agencies; and ancillary beneficiaries of global travel. Total Return assumes reinvestment of any dividends and distributions realized during a given time period. Net Total Return (NTR) is obtained by reinvesting the net dividend, which is equal to the ordinary gross dividend minus the amount of withholding tax.
The Morningstar® Global Markets Index, measures the performance of the stocks located in the developed and emerging countries across the world. Stocks in the index are weighted by their float capital, which removes corporate cross ownership, government holdings and other locked-in shares.
One cannot invest directly in an index. Index performance does not reflect fund performance.
The Fund’s shares are not individually redeemable. Investors buy and sell shares of the Fund on a secondary market. Only market makers or “authorized participants” may trade directly with the Fund, typically in blocks of 25,000 shares.
The ALPS Global Travel Beneficiaries ETF is not suitable for all investors. Investments in the Fund are subject to investment risks, including possible loss of the principal amount invested.
ALPS Portfolio Solutions Distributor, Inc., a FINRA member, is the Distributor for the ALPS Global Travel Beneficiaries ETF.
8 | November 30, 2023
ALPS Global Travel Beneficiaries ETF
| Performance Overview | November 30, 2023 (Unaudited) |
Top Ten Holdings* (as of November 30, 2023)
| Uber Technologies, Inc. | 5.51% |
| Walt Disney Co. | 5.21% |
| Hilton Worldwide Holdings, Inc. | 5.11% |
| American Express Co. | 4.93% |
| Marriott International, Inc. | 4.59% |
| Booking Holdings, Inc. | 4.56% |
| LVMH Moet Hennessy Louis Vuitton SE | 4.47% |
| Oriental Land Co., Ltd. | 4.28% |
| Airbnb, Inc. | 3.99% |
| Estee Lauder Cos., Inc. | 3.72% |
| Total % of Top 10 Holdings | 46.37% |
Thematic Allocation* (as of November 30, 2023)
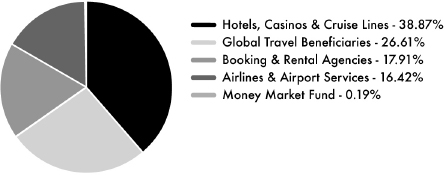
Future holdings are subject to change.
Growth of $10,000 (as of November 30, 2023)
Comparison of change in value of a $10,000 investment in the Fund and the Index
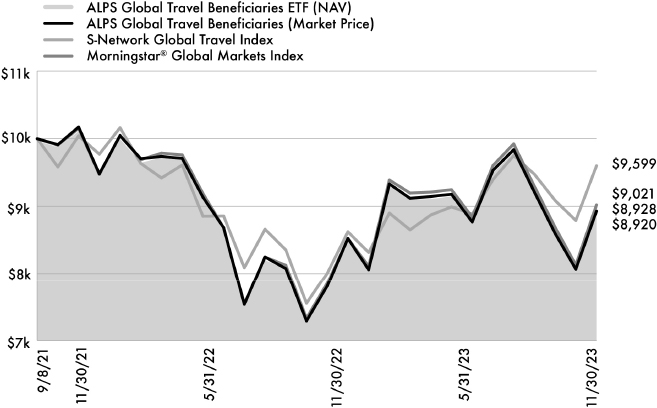
The chart above compares historical performance of a hypothetical investment of $10,000 in the Fund since inception with the performance of the Fund’s benchmark indices. Results include the reinvestment of all dividends and capital gains distributions. Past performance does not guarantee future results. The chart does not reflect the deduction of taxes that a shareholder would pay on Fund distributions or the redemption of Fund shares.
9 | November 30, 2023
ALPS Medical Breakthroughs ETF
| Performance Overview | November 30, 2023 (Unaudited) |
Investment Objective
ALPS Medical Breakthroughs ETF (the “Fund” or “SBIO”) seeks investment results that correspond (before fees and expenses) generally to the performance of the S-Network® Medical Breakthroughs Index (the “Underlying Index”). The Fund will normally invest at least 80% of its net assets in securities that comprise the Underlying Index (or depositary receipts based on such securities).
The Fund employs a “passive management” – or indexing – investment approach designed to track the performance of the Underlying Index. The Underlying Index is comprised of small- and mid-cap stocks of biotechnology companies that have one or more drugs in either Phase II or Phase III of the U.S. Food and Drug Administration ("FDA") clinical trials. In a Phase II trial, the drug is administered to a group of 100-300 people to see if it is effective and to evaluate its safety. In a Phase III trial, the drug is given to a larger group, between 500-3,000 people, to confirm its effectiveness, monitor side effects, compare it to commonly used treatments and collect information that will allow the drug or treatment to be used safely. Stocks selected for inclusion in the Underlying Index must be listed on a U.S. stock exchange. Underlying Index constituents must have a market capitalization of no less than $200 million and no more than $5 billion. Stocks included in the Underlying Index must also sustain an average daily trading volume in excess of $1 million for the 90-day period preceding an Underlying Index reconstitution. Constituents must be able to sustain the monthly rates at which they use shareholder capital ("cash burn rates") for at least 24 months. The Underlying Index is reconstituted semi-annually on the third Fridays of June and December.
Performance Overview
For the twelve-month period ended November 30, 2023, the Fund generated a total return of -15.76%, generally in-line with the Fund’s Underlying Index, net of fees, which returned -15.60%. The Fund underperformed the broad market, as represented by the S&P 500® Index, which returned 13.84% for the period, and also underperformed the NASDAQ Biotechnology Index’s (XNBI Index) return of -10.08%.
The S&P 500® Index returned 13.84% for the trailing twelve-month period that ended November 30, 2023, as fiscal year 2023 saw markets rebound from 2022 lows. The Federal Reserve Bank (Fed) continued its path of quantitative tightening in 2023 to combat inflation, reaching its target of peak rates with expectations of rate cuts into 2024 as Consumer Price Index (CPI), energy prices and yields trended towards more acceptable levels. US markets rallied substantially off the secondary effects of the Fed’s actions, which ALPS Advisors believes will lead to better odds of a soft landing, with expectations of rate cuts driving growth and equity multiples higher into the next year. Main macroeconomic talking points throughout 2023 centered on the path of future interest rates driven by monetary policy, and inflation trending towards the Fed’s 2% inflation target. Inflation significantly declined throughout 2023, with November 2023 numbers showing year-over-year CPI around 3.1%. Despite persistent recession calls, ALPS Advisors believes a gradual reduction in interest rates is likely to lead to an earnings recovery in the US, easing financial conditions for both US and global equities. With the recent recovery in sentiment and price for US markets, the S&P 500® Index Price-to-Earnings (P/E) ratio of 22.2x is slightly above its 10-year average of 20.6x. Looking forward, ALPS Advisors believes markets are likely to be data-dependent on job growth, CPI, spending and manufacturing data to justify the recent recovery in valuations.
ALPS Advisors believes the Fed's rate hike campaign, leaving the US in a higher-for-longer interest rate environment, has significantly impacted capital-intensive businesses, such as those within the biotechnology industry, leading the sector to lag other parts of the market. Despite headwinds caused by tighter financial conditions, large biopharma companies have been on a mergers and acquisition (M&A) spree, with 10 of SBIO’s small and mid-cap names being acquired during the period ended November 30, 2023. On top of the M&A news, numerous companies across SBIO’s 5 treatment focuses reported better-than-expected drug trial results throughout the year. Impressively, there were 59 US biotech M&A deals in 2023, with an average premium paid of +61.65% for the acquired biotech companies, highlighting attractive prices and a positive outlook for US biotech.
The Fund’s volatility during the period ended November 30, 2023 was higher than the S&P 500® Index, which is not unusual for the biotech industry, as the space typically carries a higher beta relative to the broad market. The best-performing stocks in the Fund for the period ended November 30, 2023 were Prometheus Biosciences Inc. (RXDX), Cymabay Therapeutics Inc. (CBAY), and Immunogen Inc. (IMGN), which returned 386.31%, 314.07%, and 255.30%, respectively. In contrast, the worst-performing stocks for the period ended November 30, 2023 were Aclaris Therapeutics Inc. (ACRS), Ventyx Biosciences Inc. (VTYX), and Kezar Life Sciences Inc. (KZR), which declined -94.39%, -93.38%, and -89.28%, respectively.
Due to the high failure rate of companies within the space, the non-traditional metrics used to evaluate biotech companies, and the technical knowledge required to succeed in the space, biotechnology is a difficult industry for stock pickers. ALPS Advisors believes this environment makes a passive strategy attractive, as it provides a diversified, rules-based access vehicle for those looking to gain exposure to the biotechnology space, while mitigating single-stock risk. The Fund and its Underlying Index focus on innovation, seeking to capture research and development opportunities in the biotechnology industry. Looking forward, ALPS Advisors believes the Fund’s strategy of providing exposure to small and mid-cap biotechnology companies that have one or more drugs in either Phase II or Phase III FDA clinical trials can provide potential alpha and pure-play exposure to the biotech space.
10 | November 30, 2023
ALPS Medical Breakthroughs ETF
| Performance Overview | November 30, 2023 (Unaudited) |
Fund Performance (as of November 30, 2023)
| | 1 Year | 5 Year | Since Inception^ |
| ALPS Medical Breakthroughs ETF - NAV | -15.76% | -4.19% | 1.28% |
| ALPS Medical Breakthroughs ETF - Market Price* | -15.74% | -4.21% | 1.27% |
| S-Network Medical Breakthroughs Index | -15.60% | -3.79% | 1.66% |
| NASDAQ Biotechnology Index | -10.08% | 3.19% | 2.81% |
Total Expense Ratio (per the current prospectus) is 0.50%
Performance data quoted represents past performance. Past performance does not guarantee future results. Total return figures assume reinvestment of dividends and capital gains distributions, if any. Investment return and principal value of an investment will fluctuate so that an investor’s shares, when sold or redeemed, may be worth more or less than the original cost. Current performance data may be higher or lower than actual data quoted. For most current month-end performance data please visit www.alpsfunds.com or call 1.866.759.5679.
Net Asset Value (NAV) is an exchange-traded fund’s per-share value. The per-share dollar amount of the fund is derived by dividing the total value of all the securities in its portfolio, less any liabilities, by the number of fund shares outstanding. Market Price is the price at which a share can currently be traded in the market. Information detailing the number of days the Market Price of the Fund was greater than the Fund’s NAV and the number of days it was less than the Fund’s NAV can be obtained at www.alpsfunds.com.
| ^ | The Fund commenced investment operations on December 30, 2014. |
| * | Market Price means the official closing price of a share or, if it more accurately reflects the market value of a share at the time as of which the Fund calculates current net asset value per share, the price that is the midpoint of the bid-ask spread as of that time. It does not represent the returns an investor would receive if shares were traded at other times. |
NASDAQ Biotechnology Index (Ticker: NBI) is a modified market capitalization-weighted index designed to measure the performance of all the NASDAQ stocks in the biotechnology sector. Total return assumes reinvestment of any dividends and distributions realized during a given time period.
S-Network Medical Breakthroughs Index (Ticker: PMBI) is designed to capture research and development opportunities in the biotechnology industry. PMBI consists of small-cap and mid-cap biotechnology stocks listed on U.S. stock exchanges that have one or more drugs in either Phase II or Phase III U.S. FDA clinical trials. Total return assumes reinvestment of any dividends and distributions realized during a given time period.
One cannot invest directly in an index. Index performance does not reflect fund performance.
Companies in the pharmaceuticals and biotechnology industry may be subject to extensive litigation based on product liability and similar claims. Legislation introduced or considered by certain governments on such industries or on the healthcare sector cannot be predicted.
Companies in the pharmaceuticals industry are subject to competitive forces that may make it difficult to raise prices and, in fact, may result in price discounting. The profitability of some companies in the pharmaceuticals industry may be dependent on a relatively limited number of products. In addition, their products can become obsolete due to industry innovation, changes in technologies or other market developments. Many new products in the pharmaceuticals industry are subject to government approvals, regulation and reimbursement rates. The process of obtaining government approvals may be long and costly. Many companies in the pharmaceuticals industry are heavily dependent on patents and intellectual property rights. The loss or impairment of these rights may adversely affect the profitability of these companies.
The development of new drugs generally has a high failure rate, and such failures may negatively impact the stock price of the company developing the failed drug. Biotechnology companies may have persistent losses during a new product’s transition from development to production. In order to fund operations, biotechnology companies may require financing from the capital markets, which may not always be available on satisfactory terms or at all.
The Fund’s shares are not individually redeemable. Investors buy and sell shares of the Fund on a secondary market. Only market makers or “authorized participants” may trade directly with the Fund, typically in blocks of 25,000 shares.
The ALPS Medical Breakthroughs ETF is not suitable for all investors. Investments in the Fund are subject to investment risks, including possible loss of the principal amount invested.
ALPS Portfolio Solutions Distributor, Inc., a FINRA member, is the Distributor for the ALPS Medical Breakthroughs ETF.
ALPS Portfolio Solutions Distributor, Inc. is not affiliated with S-Network Global Indexes, Inc.
11 | November 30, 2023
ALPS Medical Breakthroughs ETF
| Performance Overview | November 30, 2023 (Unaudited) |
Top Ten Holdings* (as of November 30, 2023)
| Immunovant, Inc. | 4.32% |
| Vaxcyte, Inc. | 4.10% |
| Cerevel Therapeutics Holdings, Inc. | 3.45% |
| Alkermes PLC | 3.39% |
| ACADIA Pharmaceuticals, Inc. | 3.08% |
| Insmed, Inc. | 3.04% |
| Axsome Therapeutics, Inc. | 2.69% |
| Amicus Therapeutics, Inc. | 2.67% |
| Krystal Biotech, Inc. | 2.46% |
| Zai Lab, Ltd. | 2.27% |
| Total % of Top 10 Holdings | 31.47% |
| * | % of Total Investments (excluding investments purchased with collateral from securities loaned) |
Sector Allocation* (as of November 30, 2023)
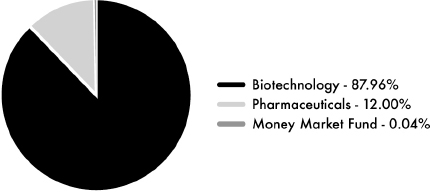
Future holdings are subject to change.
Growth of $10,000 (as of November 30, 2023)
Comparison of change in value of a $10,000 investment in the Fund and the Index
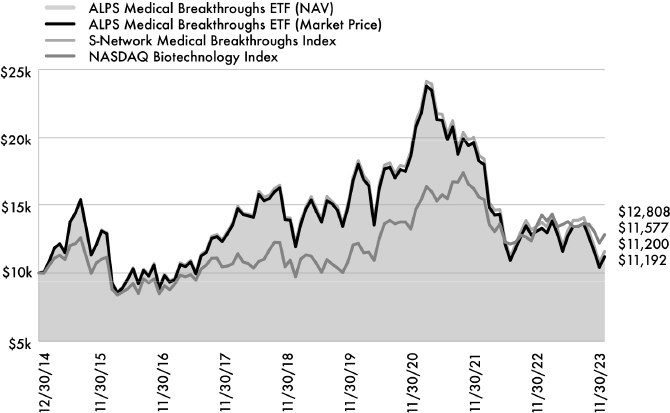
The chart above compares historical performance of a hypothetical investment of $10,000 in the Fund since inception with the performance of the Fund’s benchmark indices. Results include the reinvestment of all dividends and capital gains distributions. Past performance does not guarantee future results. The chart does not reflect the deduction of taxes that a shareholder would pay on Fund distributions or the redemption of Fund shares.
12 | November 30, 2023
ALPS ETF Trust
| Disclosure of Fund Expenses | November 30, 2023 |
Shareholder Expense Example: As a shareholder of a Fund, you incur certain ongoing costs, including management fees and other Fund expenses. These examples are intended to help you understand your ongoing costs (in dollars) of investing in a Fund and to compare these costs with the ongoing costs of investing in other funds. It is based on an investment of $1,000 invested at the beginning of the six month period and held through November 30, 2023.
Actual Return: The first line of the table provides information about actual account values and actual expenses. You may use the information in this line, together with the amount you invested, to estimate the expenses that you incurred over the period. Simply divide your account value by
$1,000 (for example, an $8,600 account value divided by $1,000 = 8.6), then multiply the result by the number in the first line under the heading entitled “Expenses Paid During Period” to estimate the expenses attributable to your investment during this period.
Hypothetical 5% Return: The second line of the table provides information about hypothetical account values and hypothetical expenses based on the Fund’s actual expense ratio and an assumed rate of return of 5% per year before expenses, which is not the Fund’s actual return. The hypothetical account values and expenses may not be used to estimate the actual ending account balance or expenses you paid for the period. You may use this information to compare ongoing costs of investing in the Fund and other funds. To do so, compare this 5% hypothetical example with the 5% hypothetical examples that appear in the shareholder reports of the other funds.
The expenses shown in the table are meant to highlight ongoing Fund costs only and do not reflect any transaction costs, such as brokerage commissions and other fees to financial intermediaries. Therefore, the second line is useful in comparing ongoing costs only, and will not help you determine the relative total costs of owning different funds. In addition, if these costs were included, your costs would have been higher.
| | Beginning Account Value 6/1/23 | Ending Account Value 11/30/23 | Expense Ratio(a) | Expenses Paid During Period 6/1/23 - 11/30/23(b) |
| ALPS Clean Energy ETF | | | | |
| Actual | $1,000.00 | $726.60 | 0.55% | $2.38 |
| Hypothetical (5% return before expenses) | $1,000.00 | $1,022.31 | 0.55% | $2.79 |
| ALPS Disruptive Technologies ETF | | | | |
| Actual | $1,000.00 | $1,026.70 | 0.50% | $2.54 |
| Hypothetical (5% return before expenses) | $1,000.00 | $1,022.56 | 0.50% | $2.54 |
| ALPS Global Travel Beneficiaries ETF | | | | |
| Actual | $1,000.00 | $1,017.90 | 0.65% | $3.29 |
| Hypothetical (5% return before expenses) | $1,000.00 | $1,021.81 | 0.65% | $3.29 |
| ALPS Medical Breakthroughs ETF | | | | |
| Actual | $1,000.00 | $834.70 | 0.50% | $2.30 |
| Hypothetical (5% return before expenses) | $1,000.00 | $1,022.56 | 0.50% | $2.54 |
| (a) | Annualized, based on the Fund's most recent fiscal half year expenses. |
| (b) | Expenses are equal to the Fund's annualized expense ratio multiplied by the average account value over the period, multiplied by the number of days in the most recent fiscal half year (183), divided by 365. |
13 | November 30, 2023
ALPS ETF Trust
| Report of Independent Registered Public Accounting Firm |
To the Shareholders of ALPS Clean Energy ETF, ALPS Disruptive Technologies ETF, ALPS Global Travel Beneficiaries ETF and ALPS Medical Breakthroughs ETF and Board of Trustees of ALPS ETF Trust
Opinion on the Financial Statements
We have audited the accompanying statements of assets and liabilities, including the schedules of investments, of ALPS Clean Energy ETF, ALPS Disruptive Technologies ETF, ALPS Global Travel Beneficiaries ETF and ALPS Medical Breakthroughs ETF (the “Funds”), each a series of ALPS ETF Trust, as of November 30, 2023, the related statements of operations and changes in net assets, the related notes, and the financial highlights for the year then ended (collectively referred to as the “financial statements”). In our opinion, the financial statements present fairly, in all material respects, the financial position of each of the Funds as of November 30, 2023, the results of their operations, the changes in net assets, and the financial highlights for the year then ended, in conformity with accounting principles generally accepted in the United States of America.
The Funds’ financial statements and financial highlights for the years ended November 30, 2022, and prior, were audited by other auditors whose report dated January 27, 2023, expressed an unqualified opinion on those financial statements and financial highlights.
Basis for Opinion
These financial statements are the responsibility of the Funds’ management. Our responsibility is to express an opinion on the Funds’ financial statements based on our audits. We are a public accounting firm registered with the Public Company Accounting Oversight Board (United States) (“PCAOB”) and are required to be independent with respect to the Funds in accordance with the U.S. federal securities laws and the applicable rules and regulations of the Securities and Exchange Commission and the PCAOB.
We conducted our audits in accordance with the standards of the PCAOB. Those standards require that we plan and perform the audit to obtain reasonable assurance about whether the financial statements are free of material misstatement whether due to error or fraud.
Our audits included performing procedures to assess the risks of material misstatement of the financial statements, whether due to error or fraud, and performing procedures that respond to those risks. Such procedures included examining, on a test basis, evidence regarding the amounts and disclosures in the financial statements. Our procedures included confirmation of securities owned as of November 30, 2023, by correspondence with the custodian and brokers; when replies were not received from brokers, we performed other auditing procedures. Our audits also included evaluating the accounting principles used and significant estimates made by management, as well as evaluating the overall presentation of the financial statements. We believe that our audits provide a reasonable basis for our opinion.
We have served as the auditor of one or more investment companies advised by ALPS Advisors, Inc. since 2013.

COHEN & COMPANY, LTD.
Philadelphia, Pennsylvania
January 29, 2024
14 | November 30, 2023
ALPS Clean Energy ETF
| Schedule of Investments | November 30, 2023 |
| Security Description | | Shares | | | Value | |
| COMMON STOCKS (90.38%) | | | | | | | | |
| Consumer Discretionary (16.44%) | | | | | | | | |
| EVgo, Inc.(a) | | | 330,193 | | | $ | 1,030,202 | |
| Fisker, Inc.(a)(b) | | | 706,589 | | | | 1,116,411 | |
| Lucid Group, Inc.(a)(b) | | | 2,795,421 | | | | 11,796,677 | |
| Rivian Automotive, Inc.(a)(b) | | | 794,190 | | | | 13,310,624 | |
| Tesla, Inc.(a) | | | 69,976 | | | | 16,799,838 | |
| Total Consumer Discretionary | | | | | | | 44,053,752 | |
| | | | | | | | | |
| Consumer Staples (4.79%) | | | | | | | | |
| Darling Ingredients, Inc.(a) | | | 292,563 | | | | 12,834,739 | |
| | | | | | | | | |
| Energy (2.98%) | | | | | | | | |
| Clean Energy Fuels Corp.(a)(b) | | | 572,981 | | | | 2,068,461 | |
| Enviva, Inc.(b) | | | 106,962 | | | | 130,494 | |
| Gevo, Inc.(a) | | | 779,117 | | | | 880,402 | |
| Green Plains, Inc.(a) | | | 197,167 | | | | 4,905,515 | |
| Total Energy | | | | | | | 7,984,872 | |
| | | | | | | | | |
| Financials (3.27%) | | | | | | | | |
| Hannon Armstrong Sustainable | | | | | | | | |
| Infrastructure Capital, Inc.(b) | | | 361,959 | | | | 8,763,027 | |
| | | | | | | | | |
| Industrials (22.29%) | | | | | | | | |
| Ameresco, Inc., Class A(a)(b) | | | 108,936 | | | | 3,263,723 | |
| Array Technologies, Inc.(a)(b) | | | 491,033 | | | | 7,596,281 | |
| Ballard Power Systems, Inc.(a)(b) | | | 858,567 | | | | 3,013,570 | |
| Blink Charging Co.(a)(b) | | | 201,242 | | | | 647,999 | |
| ChargePoint Holdings, Inc.(a)(b) | | | 1,077,690 | | | | 2,004,504 | |
| Energy Vault Holdings, Inc.(a)(b) | | | 312,385 | | | | 718,486 | |
| Eos Energy Enterprises, Inc.(a)(b) | | | 434,832 | | | | 478,315 | |
| Fluence Energy, Inc.(a)(b) | | | 141,041 | | | | 3,537,308 | |
| Li-Cycle Holdings Corp.(a)(b) | | | 481,790 | | | | 424,746 | |
| Microvast Holdings, Inc.(a)(b) | | | 561,434 | | | | 656,878 | |
| NEXTracker, Inc.(a) | | | 159,729 | | | | 6,491,387 | |
| Nikola Corp.(a)(b) | | | 2,579,117 | | | | 2,507,933 | |
| Plug Power, Inc.(a)(b) | | | 2,028,786 | | | | 8,196,296 | |
| Shoals Technologies Group, Inc., Class A(a) | | | 574,737 | | | | 7,960,107 | |
| Stem, Inc.(a)(b) | | | 501,914 | | | | 1,440,493 | |
| SunPower Corp.(a)(b) | | | 293,356 | | | | 1,217,427 | |
| Sunrun, Inc.(a)(b) | | | 720,750 | | | | 9,297,675 | |
| TPI Composites, Inc.(a)(b) | | | 136,301 | | | | 287,595 | |
| Total Industrials | | | | | | | 59,740,723 | |
| | | | | | | | | |
| Information Technology (14.87%) | | | | | | | | |
| Enphase Energy, Inc.(a) | | | 142,714 | | | | 14,416,968 | |
| First Solar, Inc.(a) | | | 95,513 | | | | 15,070,041 | |
| Security Description | | Shares | | | Value | |
| Information Technology (continued) | | | | | | | | |
| Itron, Inc.(a) | | | 153,944 | | | $ | 10,372,747 | |
| Total Information Technology | | | | | | | 39,859,756 | |
| | | | | | | | | |
| Materials (7.24%) | | | | | | | | |
| Albemarle Corp.(b) | | | 90,844 | | | | 11,016,652 | |
| Livent Corp.(a)(b) | | | 609,828 | | | | 8,391,233 | |
| Total Materials | | | | | | | 19,407,885 | |
| | | | | | | | | |
| Utilities (18.50%) | | | | | | | | |
| Altus Power, Inc.(a) | | | 178,829 | | | | 894,145 | |
| Boralex, Inc., Class A(b) | | | 348,674 | | | | 7,921,898 | |
| Clearway Energy, Inc., Class C | | | 278,179 | | | | 6,946,130 | |
| Innergex Renewable Energy, Inc.(b) | | | 528,054 | | | | 3,739,710 | |
| Northland Power, Inc.(b) | | | 864,653 | | | | 14,056,704 | |
| Ormat Technologies, Inc. | | | 175,072 | | | | 11,785,847 | |
| Sunnova Energy International, Inc.(a)(b) | | | 363,392 | | | | 4,215,347 | |
| Total Utilities | | | | | | | 49,559,781 | |
| | | | | | | | | |
| TOTAL COMMON STOCKS | | | | | | | | |
| (Cost $506,955,708) | | | | | | | 242,204,535 | |
| Security Description | | | Shares | | | | Value | |
| MASTER LIMITED PARTNERSHIPS (9.38%) | | | | | | | | |
| Utilities (9.38%) | | | | | | | | |
| Brookfield Renewable Partners LP | | | 713,804 | | | | 17,648,494 | |
| NextEra Energy Partners LP | | | 318,331 | | | | 7,493,512 | |
| Total Utilities | | | | | | | 25,142,006 | |
| | | | | | | | | |
| TOTAL MASTER LIMITED PARTNERSHIPS | | | | | | | | |
| (Cost $43,072,929) | | | | | | | 25,142,006 | |
15 | November 30, 2023
ALPS Clean Energy ETF
| Schedule of Investments | November 30, 2023 |
| | | 7 Day Yield | | | Shares | | | Value | |
| SHORT TERM INVESTMENTS (16.76%) | | | | | | | | | | | | |
| Money Market Fund (0.09%) | | | | | | | | | | | | |
| State Street Institutional Treasury Plus Money Market Fund - Premier Class | | | | | | | | | | | | |
| (Cost $230,903) | | | 5.31 | % | | | 230,903 | | | $ | 230,903 | |
| | | | | | | | | | | | | |
| Investments Purchased with Collateral from Securities Loaned (16.67%) | | | | | | | | | | | | |
| State Street Navigator Securities Lending Government Money Market Portfolio, 5.37% | | | | | | | | | | | | |
| (Cost $44,662,743) | | | | | | | 44,662,743 | | | $ | 44,662,743 | |
| TOTAL SHORT TERM INVESTMENTS | | | | | | | | | | | | |
| | | | | | | | | | | | | |
| (Cost $44,893,646) | | | | | | | | | | | 44,893,646 | |
| | | | | | | | | | | | | |
| TOTAL INVESTMENTS (116.52%) | | | | | | | | | | | | |
| (Cost $594,922,283) | | | | | | | | | | $ | 312,240,187 | |
| LIABILITIES IN EXCESS OF OTHER ASSETS (-16.52%) | | | | | | | | | | | (44,263,229 | ) |
| NET ASSETS - 100.00% | | | | | | | | | | $ | 267,976,958 | |
| (a) | Non-income producing security. |
| (b) | Security, or a portion of the security position is currently on loan. The total market value of securities on loan is $75,116,300. |
See Notes to Financial Statements.
16 | November 30, 2023
ALPS Disruptive Technologies ETF
| Schedule of Investments | November 30, 2023 |
| Security Description | | Shares | | | Value | |
| COMMON STOCKS (98.65%) | | | | | | | | |
| Communication Services (1.07%) | | | | | | | | |
| Netflix, Inc.(a) | | | 2,202 | | | $ | 1,043,682 | |
| | | | | | | | | |
| Consumer Discretionary (4.10%) | | | | | | | | |
| ADT, Inc.(b) | | | 166,364 | | | | 976,557 | |
| Garmin, Ltd. | | | 9,420 | | | | 1,151,501 | |
| iRobot Corp.(a) | | | 26,101 | | | | 942,507 | |
| Tesla, Inc.(a) | | | 3,841 | | | | 922,147 | |
| Total Consumer Discretionary | | | | | | | 3,992,712 | |
| | | | | | | | | |
| Financials (16.91%) | | | | | | | | |
| Adyen NV(a)(c)(d) | | | 1,213 | | | | 1,414,089 | |
| American Express Co. | | | 6,175 | | | | 1,054,505 | |
| Block, Inc., Class A(a) | | | 17,271 | | | | 1,095,499 | |
| Fidelity National Information Services, Inc. | | | 17,823 | | | | 1,045,140 | |
| Fiserv, Inc.(a) | | | 7,877 | | | | 1,028,815 | |
| FleetCor Technologies, Inc.(a) | | | 3,567 | | | | 857,864 | |
| Global Payments, Inc. | | | 7,657 | | | | 891,581 | |
| GMO Payment Gateway, Inc. | | | 15,400 | | | | 904,410 | |
| Jack Henry & Associates, Inc. | | | 6,416 | | | | 1,018,155 | |
| Kaspi.KZ JSC, GDR(d) | | | 10,417 | | | | 1,062,534 | |
| Mastercard, Inc., Class A | | | 2,326 | | | | 962,569 | |
| Moody's Corp. | | | 2,822 | | | | 1,029,917 | |
| Pagseguro Digital, Ltd., Class A(a) | | | 113,153 | | | | 1,140,582 | |
| PayPal Holdings, Inc.(a) | | | 15,712 | | | | 905,168 | |
| S&P Global, Inc. | | | 2,455 | | | | 1,020,863 | |
| Visa, Inc., Class A | | | 3,939 | | | | 1,011,063 | |
| Total Financials | | | | | | | 16,442,754 | |
| | | | | | | | | |
| Health Care (10.99%) | | | | | | | | |
| Align Technology, Inc.(a) | | | 2,853 | | | | 609,971 | |
| Boston Scientific Corp.(a) | | | 17,991 | | | | 1,005,517 | |
| Dexcom, Inc.(a) | | | 9,242 | | | | 1,067,636 | |
| DiaSorin SpA | | | 9,676 | | | | 915,676 | |
| HealthEquity, Inc.(a) | | | 13,557 | | | | 908,590 | |
| Insulet Corp.(a) | | | 5,430 | | | | 1,026,759 | |
| Intuitive Surgical, Inc.(a) | | | 3,258 | | | | 1,012,717 | |
| PROCEPT BioRobotics Corp.(a) | | | 27,173 | | | | 1,007,303 | |
| ResMed, Inc. | | | 6,452 | | | | 1,017,674 | |
| Shanghai MicroPort MedBot Group Co., Ltd.(a)(b) | | | 446,500 | | | | 1,146,074 | |
| Smith & Nephew PLC, | | | | | | | | |
| Sponsored ADR | | | 36,701 | | | | 952,391 | |
| Total Health Care | | | | | | | 10,670,308 | |
| | | | | | | | | |
| Industrials (16.75%) | | | | | | | | |
| 3D Systems Corp.(a)(b) | | | 182,989 | | | | 977,161 | |
| Security Description | | Shares | | | Value | |
| Industrials (continued) | | | | | | |
| AeroVironment, Inc.(a) | | | 8,584 | | | $ | 1,181,244 | |
| AutoStore Holdings, Ltd.(a)(b)(c)(d) | | | 584,830 | | | | 969,947 | |
| Experian PLC | | | 28,027 | | | | 1,027,160 | |
| FANUC Corp. | | | 34,243 | | | | 950,194 | |
| Goldwind Science & Technology Co., Ltd., Class H | | | 1,849,400 | | | | 847,599 | |
| Proto Labs, Inc.(a) | | | 34,480 | | | | 1,248,176 | |
| RELX PLC, Sponsored ADR(b) | | | 28,838 | | | | 1,112,570 | |
| Schneider Electric SE | | | 5,769 | | | | 1,058,854 | |
| Sensata Technologies Holding PLC | | | 26,311 | | | | 855,371 | |
| SS&C Technologies Holdings, Inc. | | | 17,527 | | | | 986,069 | |
| Thomson Reuters Corp.(b) | | | 7,537 | | | | 1,052,997 | |
| TransUnion | | | 12,039 | | | | 706,930 | |
| Verisk Analytics, Inc. | | | 3,966 | | | | 957,511 | |
| Vestas Wind Systems A/S | | | 44,975 | | | | 1,244,838 | |
| Wolters Kluwer NV | | | 7,969 | | | | 1,095,553 | |
| Total Industrials | | | | | | | 16,272,174 | |
| | | | | | | | | |
| Information Technology (45.87%) | | | | | | | | |
| Adobe, Inc.(a) | | | 1,738 | | | | 1,061,935 | |
| Alarm.com Holdings, Inc.(a) | | | 16,465 | | | | 897,013 | |
| Allegro MicroSystems, Inc.(a) | | | 27,712 | | | | 754,321 | |
| ANSYS, Inc.(a) | | | 3,037 | | | | 890,934 | |
| Autodesk, Inc.(a) | | | 4,398 | | | | 960,655 | |
| Check Point Software Technologies, Ltd.(a) | | | 7,162 | | | | 1,045,652 | |
| Cognex Corp. | | | 22,067 | | | | 831,926 | |
| Crowdstrike Holdings, Inc., Class A(a) | | | 5,836 | | | | 1,383,075 | |
| CyberArk Software, Ltd.(a) | | | 5,775 | | | | 1,150,783 | |
| Dassault Systemes SE | | | 24,852 | | | | 1,162,257 | |
| Datadog, Inc., Class A(a) | | | 10,020 | | | | 1,168,031 | |
| Dynatrace, Inc.(a) | | | 20,070 | | | | 1,074,749 | |
| First Solar, Inc.(a) | | | 5,380 | | | | 848,856 | |
| Fortinet, Inc.(a) | | | 15,360 | | | | 807,322 | |
| Gen Digital, Inc. | | | 48,500 | | | | 1,070,880 | |
| Guidewire Software, Inc.(a) | | | 11,442 | | | | 1,143,513 | |
| Intuit, Inc. | | | 1,740 | | | | 994,340 | |
| Itron, Inc.(a) | | | 15,058 | | | | 1,014,608 | |
| Keyence Corp. | | | 2,356 | | | | 1,006,695 | |
| Nemetschek SE | | | 14,509 | | | | 1,264,069 | |
| Okta, Inc.(a) | | | 11,079 | | | | 742,847 | |
| Omron Corp. | | | 20,100 | | | | 840,415 | |
| Palo Alto Networks, Inc.(a) | | | 3,937 | | | | 1,161,769 | |
| PTC, Inc.(a) | | | 6,700 | | | | 1,054,312 | |
| Qorvo, Inc.(a) | | | 9,824 | | | | 948,016 | |
17 | November 30, 2023
ALPS Disruptive Technologies ETF
| Schedule of Investments | November 30, 2023 |
| Security Description | | Shares | | | Value | |
| Information Technology (continued) | | | | | | | | |
| Qualys, Inc.(a) | | | 6,265 | | | $ | 1,158,023 | |
| Renishaw PLC | | | 21,936 | | | | 868,456 | |
| Salesforce, Inc.(a) | | | 4,374 | | | | 1,101,811 | |
| Samsara, Inc., Class A(a) | | | 31,406 | | | | 864,921 | |
| SAP SE, Sponsored ADR | | | 6,913 | | | | 1,099,997 | |
| SenseTime Group, Inc.(a)(b)(c)(d) | | | 4,989,000 | | | | 868,619 | |
| ServiceNow, Inc.(a) | | | 1,615 | | | | 1,107,470 | |
| Silicon Laboratories, Inc.(a)(b) | | | 7,627 | | | | 803,657 | |
| Skyworks Solutions, Inc. | | | 9,857 | | | | 955,439 | |
| Snowflake, Inc., Class A(a) | | | 6,065 | | | | 1,138,279 | |
| SolarEdge Technologies, Inc.(a) | | | 6,354 | | | | 504,381 | |
| Splunk, Inc.(a) | | | 7,783 | | | | 1,179,436 | |
| Stratasys, Ltd.(a) | | | 69,990 | | | | 772,690 | |
| Temenos AG | | | 13,083 | | | | 1,105,862 | |
| Trend Micro, Inc. | | | 22,915 | | | | 1,161,361 | |
| Workday, Inc., Class A(a) | | | 3,875 | | | | 1,049,040 | |
| Xero, Ltd.(a) | | | 12,322 | | | | 839,009 | |
| Xinyi Solar Holdings, Ltd. | | | 1,182,000 | | | | 679,423 | |
| Zoom Video Communications, Inc., Class A(a) | | | 13,142 | | | | 891,422 | |
| Zscaler, Inc.(a) | | | 6,014 | | | | 1,187,946 | |
| Total Information Technology | | | | | | | 44,616,215 | |
| | | | | | | | | |
| Real Estate (1.04%) | | | | | | | | |
| Equinix, Inc. | | | 1,242 | | | | 1,012,242 | |
| | | | | | | | | |
| Utilities (1.92%) | | | | | | | | |
| China Longyuan Power Group Corp., Ltd., Class H | | | 1,149,000 | | | | 860,503 | |
| Enlight Renewable Energy, Ltd.(a) | | | 58,368 | | | | 1,008,015 | |
| Total Utilities | | | | | | | 1,868,518 | |
| | | | | | | | | |
| TOTAL COMMON STOCKS | | | | | | | | |
| (Cost $100,571,224) | | | | | | | 95,918,605 | |
| Security Description | | | Shares | | | | Value | |
| MASTER LIMITED PARTNERSHIPS (1.01%) | | | | | | | | |
| Utilities (1.01%) | | | | | | | | |
| Brookfield Renewable Partners LP | | | 39,729 | | | | 982,282 | |
| | | | | | | | | |
| TOTAL MASTER LIMITED PARTNERSHIPS | | | | | | | | |
| (Cost $1,160,797) | | | | | | | 982,282 | |
| | | | | | | | | |
| Security Description | | Shares | | | Value | |
| Utilities (continued) | | | | | | | | |
| SHORT TERM INVESTMENTS (1.23%) | | | | | | | | |
| Investments Purchased with Collateral from Securities Loaned (1.23%) | | | | | | | | |
| State Street Navigator Securities Lending Government Money Market Portfolio, 5.37% | | | | | | | | |
| (Cost $1,192,658) | | | 1,192,658 | | | $ | 1,192,658 | |
| | | | | | | | | |
| TOTAL SHORT TERM INVESTMENTS | | | | | | | | |
| (Cost $1,192,658) | | | | | | | 1,192,658 | |
| | | | | | | | | |
| TOTAL INVESTMENTS (100.88%) | | | | | | | | |
| (Cost $102,924,679) | | | | | | $ | 98,093,545 | |
| LIABILITIES IN EXCESS OF OTHER ASSETS (-0.88%) | | | | | | | (860,230 | ) |
| NET ASSETS - 100.00% | | | | | | $ | 97,233,315 | |
| (a) | Non-income producing security. |
| (b) | Security, or a portion of the security position is currently on loan. The total market value of securities on loan is $6,042,770. |
| (c) | Securities exempt from registration under Rule 144A of the Securities Act of 1933. These securities may be sold in the ordinary course of business in transactions exempt from registration, normally to qualified institutional buyers. At period end, the aggregate market value of those securities was $3,252,655, representing 3.35% of net assets. |
| (d) | Securities were purchased pursuant to Regulation S under the Securities Act of 1933, which exempts securities offered and sold outside of the United States from registration. Such securities cannot be sold in the United States without either an effective registration statement filed pursuant to the Securities Act of 1933, or pursuant to an exemption from registration. As of November 30, 2023, the market value of those securities was $4,315,188, representing 4.44% of net assets. |
See Notes to Financial Statements.
18 | November 30, 2023
ALPS Global Travel Beneficiaries ETF
| Schedule of Investments | November 30, 2023 |
| Security Description | | Shares | | | Value | |
| COMMON STOCKS (99.77%) | | | | | | |
| Communication Services (5.49%) | | | | | | | | |
| TripAdvisor, Inc.(a) | | | 994 | | | $ | 17,723 | |
| Walt Disney Co. | | | 3,425 | | | | 317,463 | |
| Total Communication Services | | | | | | | 335,186 | |
| | | | | | | | | |
| Consumer Discretionary (48.37%) | | | | | | | | |
| Accor SA | | | 430 | | | | 14,889 | |
| Airbnb, Inc., Class A(a) | | | 1,925 | | | | 243,205 | |
| Amadeus IT Group SA | | | 984 | | | | 67,285 | |
| Avolta AG(a) | | | 369 | | | | 12,865 | |
| Booking Holdings, Inc.(a) | | | 89 | | | | 278,188 | |
| Caesars Entertainment, Inc.(a) | | | 1,534 | | | | 68,600 | |
| Churchill Downs, Inc. | | | 534 | | | | 61,821 | |
| Cie Financiere Richemont SA, Class A | | | 944 | | | | 117,717 | |
| Expedia Group, Inc.(a) | | | 1,134 | | | | 154,428 | |
| Flight Centre Travel Group, Ltd. | | | 1,219 | | | | 14,764 | |
| Galaxy Entertainment Group, Ltd. | | | 11,000 | | | | 56,892 | |
| Global Business Travel Group I(a) | | | 2,720 | | | | 16,918 | |
| H World Group, Ltd., ADR | | | 1,475 | | | | 53,956 | |
| Hilton Worldwide Holdings, Inc. | | | 1,859 | | | | 311,420 | |
| InterContinental Hotels Group PLC | | | 293 | | | | 22,623 | |
| Las Vegas Sands Corp. | | | 1,707 | | | | 78,727 | |
| LVMH Moet Hennessy Louis Vuitton SE | | | 356 | | | | 272,299 | |
| Marriott International, Inc., Class A | | | 1,379 | | | | 279,523 | |
| MGM Resorts International | | | 2,010 | | | | 79,274 | |
| Oriental Land Co., Ltd. | | | 7,700 | | | | 260,977 | |
| Royal Caribbean Cruises, Ltd.(a) | | | 457 | | | | 49,109 | |
| Sabre Corp.(a) | | | 2,952 | | | | 10,421 | |
| Samsonite International SA(a)(b)(c) | | | 13,800 | | | | 40,280 | |
| Sega Sammy Holdings, Inc. | | | 1,500 | | | | 21,727 | |
| Tongcheng Travel Holdings, Ltd.(a)(c) | | | 6,800 | | | | 12,518 | |
| Trainline PLC(a)(b)(c) | | | 5,058 | | | | 18,211 | |
| Trip.com Group, Ltd., ADR(a) | | | 3,687 | | | | 129,709 | |
| TUI AG(a) | | | 2,648 | | | | 16,060 | |
| Vail Resorts, Inc. | | | 351 | | | | 76,276 | |
| WH Smith PLC | | | 883 | | | | 14,124 | |
| Wyndham Hotels & Resorts, Inc. | | | 717 | | | | 55,453 | |
| Security Description | | Shares | | | Value | |
| Consumer Discretionary (continued) | | | | | | | | |
| Wynn Resorts, Ltd. | | | 475 | | | $ | 40,100 | |
| Total Consumer Discretionary | | | | | | | 2,950,359 | |
| | | | | | | | | |
| Consumer Staples (8.51%) | | | | | | | | |
| Estee Lauder Cos., Inc., Class A | | | 1,774 | | | | 226,521 | |
| Hormel Foods Corp. | | | 2,315 | | | | 70,816 | |
| Kose Corp. | | | 300 | | | | 21,176 | |
| L'Oreal SA | | | 426 | | | | 199,877 | |
| Total Consumer Staples | | | | | | | 518,390 | |
| | | | | | | | | |
| Financials (5.55%) | | | | | | | | |
| American Express Co. | | | 1,760 | | | | 300,555 | |
| Euronet Worldwide, Inc.(a) | | | 435 | | | | 37,941 | |
| Total Financials | | | | | | | 338,496 | |
| | | | | | | | | |
| Industrials (26.11%) | | | | | | | | |
| Aena SME SA(b)(c) | | | 173 | | | | 29,744 | |
| Air France-KLM(a) | | | 1,500 | | | | 18,992 | |
| Airbus SE | | | 850 | | | | 126,015 | |
| Alaska Air Group, Inc.(a) | | | 955 | | | | 36,109 | |
| American Airlines Group, Inc.(a) | | | 3,968 | | | | 49,322 | |
| ANA Holdings, Inc. | | | 3,100 | | | | 63,815 | |
| Avis Budget Group, Inc.(a) | | | 78 | | | | 14,262 | |
| Dassault Aviation SA | | | 79 | | | | 15,685 | |
| Delta Air Lines, Inc. | | | 5,598 | | | | 206,734 | |
| Deutsche Lufthansa AG(a) | | | 1,768 | | | | 15,357 | |
| Elis SA | | | 838 | | | | 16,127 | |
| Flughafen Zurich AG | | | 76 | | | | 16,082 | |
| Grab Holdings, Ltd.(a) | | | 4,112 | | | | 12,500 | |
| Grupo Aeroportuario del Centro Norte SAB de CV | | | 1,780 | | | | 16,162 | |
| Grupo Aeroportuario del Pacifico SAB de CV | | | 2,156 | | | | 32,840 | |
| Grupo Aeroportuario del Sureste SAB de CV, ADR | | | 141 | | | | 33,199 | |
| Hertz Global Holdings, Inc.(a) | | | 970 | | | | 8,090 | |
| International Consolidated Airlines Group SA(a) | | | 7,881 | | | | 15,232 | |
| Japan Airlines Co., Ltd. | | | 2,600 | | | | 49,296 | |
| Korean Air Lines Co., Ltd. | | | 2,898 | | | | 50,428 | |
| Localiza Rent a Car SA | | | 2,592 | | | | 31,618 | |
| Lyft, Inc., Class A(a) | | | 1,421 | | | | 16,668 | |
| Qantas Airways, Ltd.(a) | | | 17,468 | | | | 61,173 | |
| Ryanair Holdings PLC, ADR(a) | | | 219 | | | | 25,890 | |
| Singapore Airlines, Ltd. | | | 8,000 | | | | 37,916 | |
| Sixt SE | | | 146 | | | | 14,494 | |
| Southwest Airlines Co. | | | 4,540 | | | | 116,088 | |
| Turk Hava Yollari AO(a) | | | 4,301 | | | | 37,387 | |
| Uber Technologies, Inc.(a) | | | 5,957 | | | | 335,856 | |
19 | November 30, 2023
ALPS Global Travel Beneficiaries ETF
| Schedule of Investments | November 30, 2023 |
| Security Description | | Shares | | | Value | |
| Industrials (continued) | | | | | | | | |
| United Airlines Holdings, Inc.(a) | | | 2,272 | | | $ | 89,517 | |
| Total Industrials | | | | | | | 1,592,598 | |
| | | | | | | | | |
| Information Technology (0.83%) | | | | | | | | |
| Agilysys, Inc.(a) | | | 217 | | | | 18,682 | |
| Clear Secure, Inc. | | | 731 | | | | 15,592 | |
| PROS Holdings, Inc.(a) | | | 445 | | | | 16,265 | |
| Total Information Technology | | | | | | | 50,539 | |
| | | | | | | | | |
| Real Estate (4.91%) | | | | | | | | |
| Gaming and Leisure Properties, Inc. | | | 2,743 | | | | 128,180 | |
| Host Hotels & Resorts, Inc. | | | 6,887 | | | | 120,315 | |
| Ryman Hospitality Properties, Inc. | | | 510 | | | | 51,179 | |
| Total Real Estate | | | | | | | 299,674 | |
| | | | | | | | | |
| TOTAL COMMON STOCKS | | | | | | | | |
| (Cost $6,480,772) | | | | | | | 6,085,242 | |
| | | 7 Day Yield | | | Shares | | | Value | |
| SHORT TERM INVESTMENTS (0.18%) | | | | | | | | | | | | |
| Money Market Fund (0.18%) | | | | | | | | | | | | |
| State Street Institutional Treasury Plus Money Market Fund - Premier Class | | | 5.31 | % | | | 11,058 | | | | 11,058 | |
| | | | | | | | | | | | | |
| TOTAL SHORT TERM INVESTMENTS | | | | | | | | | | | | |
| | | | | | | | | | | | | |
| (Cost $11,058) | | | | | | | | | | | 11,058 | |
| | | | | | | | | | | | | |
| TOTAL INVESTMENTS (99.95%) | | | | | | | | | | | | |
| (Cost $6,491,830) | | | | | | | | | | $ | 6,096,300 | |
| OTHER ASSETS IN EXCESS OF LIABILITIES (0.05%) | | | | | | | | | | | 3,089 | |
| NET ASSETS - 100.00% | | | | | | | | | | $ | 6,099,389 | |
| (a) | Non-income producing security. |
| (b) | Securities exempt from registration under Rule 144A of the Securities Act of 1933. These securities may be sold in the ordinary course of business in transactions exempt from registration, normally to qualified institutional buyers. At period end, the aggregate market value of those securities was $88,235, representing 1.45% of net assets. |
| (c) | Securities were purchased pursuant to Regulation S under the Securities Act of 1933, which exempts securities offered and sold outside of the United States from registration. Such securities cannot be sold in the United States without either an effective registration statement filed pursuant to the Securities Act of 1933, or pursuant to an exemption from registration. As of November 30, 2023, the market value of those securities was $100,753, representing 1.65% of net assets. |
See Notes to Financial Statements.
20 | November 30, 2023
ALPS Medical Breakthroughs ETF
| Schedule of Investments | November 30, 2023 |
| Security Description | | Shares | | | Value | |
| COMMON STOCKS (99.96%) | | | | | | | | |
| Biotechnology (87.97%) | | | | | | | | |
| 89bio, Inc.(a)(b) | | | 53,316 | | | $ | 428,661 | |
| Aadi Bioscience, Inc.(a)(b) | | | 17,326 | | | | 91,135 | |
| ACADIA Pharmaceuticals, Inc.(a) | | | 115,654 | | | | 2,576,771 | |
| Aerovate Therapeutics, Inc.(a) | | | 19,528 | | | | 306,785 | |
| Agios Pharmaceuticals, Inc.(a) | | | 39,374 | | | | 875,284 | |
| Akero Therapeutics, Inc.(a) | | | 39,281 | | | | 657,564 | |
| Aldeyra Therapeutics, Inc.(a) | | | 41,392 | | | | 114,656 | |
| Alector, Inc.(a) | | | 59,213 | | | | 320,934 | |
| Alkermes PLC(a) | | | 117,652 | | | | 2,840,120 | |
| Allogene Therapeutics, Inc.(a) | | | 118,409 | | | | 278,261 | |
| Altimmune, Inc.(a)(b) | | | 37,219 | | | | 117,612 | |
| ALX Oncology Holdings, Inc.(a)(b) | | | 29,066 | | | | 227,877 | |
| Ambrx Biopharma Inc(a) | | | 43,621 | | | | 503,386 | |
| Amicus Therapeutics, Inc.(a) | | | 202,813 | | | | 2,234,999 | |
| AnaptysBio, Inc.(a) | | | 18,755 | | | | 265,196 | |
| Anavex Life Sciences Corp.(a)(b) | | | 57,883 | | | | 417,336 | |
| Arcellx, Inc.(a) | | | 34,163 | | | | 1,794,582 | |
| Arcturus Therapeutics Holdings, Inc.(a) | | | 18,784 | | | | 449,689 | |
| Arcus Biosciences, Inc.(a) | | | 52,623 | | | | 792,502 | |
| ARS Pharmaceuticals, Inc.(a)(b) | | | 67,511 | | | | 326,078 | |
| Aura Biosciences, Inc.(a) | | | 26,977 | | | | 216,356 | |
| Aurinia Pharmaceuticals, Inc.(a)(b) | | | 101,307 | | | | 875,292 | |
| Autolus Therapeutics PLC, ADR(a) | | | 122,678 | | | | 525,062 | |
| Avidity Biosciences, Inc.(a)(b) | | | 52,339 | | | | 408,768 | |
| BioCryst Pharmaceuticals, Inc.(a) | | | 133,857 | | | | 787,079 | |
| Catalyst Pharmaceuticals, Inc.(a) | | | 75,286 | | | | 1,086,377 | |
| Celldex Therapeutics, Inc.(a) | | | 33,379 | | | | 1,008,380 | |
| Cerevel Therapeutics Holdings, Inc.(a)(b) | | | 111,250 | | | | 2,884,713 | |
| Compass Therapeutics, Inc.(a)(b) | | | 90,033 | | | | 148,554 | |
| Crinetics Pharmaceuticals, Inc.(a) | | | 38,631 | | | | 1,228,079 | |
| Day One Biopharmaceuticals, Inc.(a)(b) | | | 61,431 | | | | 711,371 | |
| Deciphera Pharmaceuticals, Inc.(a) | | | 55,675 | | | | 702,062 | |
| Denali Therapeutics, Inc.(a) | | | 97,072 | | | | 1,797,773 | |
| Disc Medicine, Inc.(a) | | | 16,164 | | | | 891,929 | |
| Enanta Pharmaceuticals, Inc.(a) | | | 14,871 | | | | 138,895 | |
| Galapagos NV, Sponsored ADR(a) | | | 46,289 | | | | 1,732,597 | |
| Geron Corp.(a) | | | 369,700 | | | | 713,521 | |
| HilleVax, Inc.(a) | | | 27,700 | | | | 379,767 | |
| Security Description | | Shares | | | Value | |
| Biotechnology (continued) | | | | | | | | |
| Ideaya Biosciences, Inc.(a) | | | 40,654 | | | $ | 1,278,568 | |
| I-Mab, ADR(a)(b) | | | 57,854 | | | | 90,252 | |
| Immunocore Holdings PLC, ADR(a) | | | 34,572 | | | | 1,822,982 | |
| Immunovant, Inc.(a) | | | 92,302 | | | | 3,611,776 | |
| InflaRx NV(a) | | | 41,599 | | | | 56,159 | |
| Insmed, Inc.(a) | | | 101,580 | | | | 2,541,532 | |
| Ironwood Pharmaceuticals, Inc.(a) | | | 110,210 | | | | 1,091,079 | |
| iTeos Therapeutics, Inc.(a) | | | 25,279 | | | | 236,611 | |
| KalVista Pharmaceuticals, Inc.(a) | | | 24,200 | | | | 204,248 | |
| Karyopharm Therapeutics, Inc.(a)(b) | | | 80,779 | | | | 62,200 | |
| Keros Therapeutics, Inc.(a)(b) | | | 20,958 | | | | 635,866 | |
| Kezar Life Sciences, Inc.(a) | | | 51,347 | | | | 43,008 | |
| Kiniksa Pharmaceuticals, Ltd., Class A(a) | | | 49,563 | | | | 801,434 | |
| Krystal Biotech, Inc.(a) | | | 19,777 | | | | 2,061,357 | |
| Kura Oncology, Inc.(a)(b) | | | 52,440 | | | | 507,095 | |
| MacroGenics, Inc.(a)(b) | | | 43,756 | | | | 359,237 | |
| MannKind Corp.(a)(b) | | | 189,558 | | | | 686,200 | |
| Mersana Therapeutics, Inc.(a)(b) | | | 85,123 | | | | 140,453 | |
| MiMedx Group, Inc.(a) | | | 82,014 | | | | 637,249 | |
| Mineralys Therapeutics, Inc.(a)(b) | | | 28,862 | | | | 192,221 | |
| Morphic Holding, Inc.(a)(b) | | | 33,855 | | | | 802,363 | |
| PDS Biotechnology Corp.(a) | | | 21,801 | | | | 114,673 | |
| Point Biopharma Global, Inc.(a) | | | 74,707 | | | | 1,016,015 | |
| ProKidney Corp.(a)(b) | | | 166,173 | | | | 279,171 | |
| Protagonist Therapeutics, Inc.(a) | | | 40,634 | | | | 739,945 | |
| Prothena Corp. PLC(a)(b) | | | 37,815 | | | | 1,232,013 | |
| RAPT Therapeutics, Inc.(a)(b) | | | 24,271 | | | | 352,415 | |
| Recursion Pharmaceuticals, Inc.(a)(b) | | | 149,552 | | | | 1,024,431 | |
| Replimune Group, Inc.(a) | | | 41,671 | | | | 465,882 | |
| Rhythm Pharmaceuticals, Inc.(a) | | | 40,197 | | | | 1,343,786 | |
| Sage Therapeutics, Inc.(a) | | | 42,304 | | | | 828,312 | |
| Scholar Rock Holding Corp.(a)(b) | | | 39,721 | | | | 500,087 | |
| SpringWorks Therapeutics, Inc.(a) | | | 44,196 | | | | 1,343,116 | |
| Stoke Therapeutics, Inc.(a)(b) | | | 31,259 | | | | 118,472 | |
| Summit Therapeutics, Inc.(a)(b) | | | 492,828 | | | | 1,000,441 | |
| Syndax Pharmaceuticals, Inc.(a) | | | 49,087 | | | | 817,053 | |
| Travere Therapeutics, Inc.(a) | | | 52,983 | | | | 332,733 | |
| Vanda Pharmaceuticals, Inc.(a) | | | 40,627 | | | | 151,132 | |
| Vaxcyte, Inc.(a)(b) | | | 66,294 | | | | 3,432,040 | |
| Vera Therapeutics, Inc.(a) | | | 31,301 | | | | 424,129 | |
21 | November 30, 2023
ALPS Medical Breakthroughs ETF
| Schedule of Investments | November 30, 2023 |
| Security Description | | Shares | | | Value | |
| Biotechnology (continued) | | | | | | | | |
| Vericel Corp.(a) | | | 33,650 | | | $ | 1,195,921 | |
| Viking Therapeutics, Inc.(a)(b) | | | 70,661 | | | | 863,477 | |
| Vir Biotechnology, Inc.(a) | | | 94,828 | | | | 899,918 | |
| Viridian Therapeutics, Inc.(a)(b) | | | 30,848 | | | | 516,396 | |
| Xencor, Inc.(a) | | | 42,817 | | | | 785,264 | |
| Xenon Pharmaceuticals, Inc.(a) | | | 45,313 | | | | 1,657,550 | |
| Zai Lab, Ltd., ADR(a)(b) | | | 69,735 | | | | 1,903,069 | |
| Zentalis Pharmaceuticals, Inc.(a)(b) | | | 49,876 | | | | 561,105 | |
| Total Biotechnology | | | | | | | 73,616,439 | |
| | | | | | | | | |
| Pharmaceuticals (11.99%) | | | | | | | | |
| Aclaris Therapeutics, Inc.(a) | | | 50,005 | | | | 43,739 | |
| Amylyx Pharmaceuticals, Inc.(a) | | | 47,591 | | | | 673,889 | |
| Arvinas, Inc.(a) | | | 37,784 | | | | 830,114 | |
| Atea Pharmaceuticals, Inc.(a) | | | 58,911 | | | | 176,144 | |
| Axsome Therapeutics, Inc.(a)(b) | | | 33,331 | | | | 2,248,177 | |
| Cassava Sciences, Inc.(a)(b) | | | 29,646 | | | | 617,526 | |
| Corcept Therapeutics, Inc.(a) | | | 72,439 | | | | 1,845,021 | |
| Cymabay Therapeutics, Inc.(a) | | | 69,328 | | | | 1,326,244 | |
| Edgewise Therapeutics, Inc.(a)(b) | | | 44,830 | | | | 272,566 | |
| Pliant Therapeutics, Inc.(a)(b) | | | 42,265 | | | | 587,061 | |
| Tarsus Pharmaceuticals, Inc.(a)(b) | | | 23,041 | | | | 380,868 | |
| Terns Pharmaceuticals, Inc.(a)(b) | | | 43,138 | | | | 191,964 | |
| Ventyx Biosciences, Inc.(a) | | | 41,595 | | | | 89,845 | |
| Verona Pharma PLC, ADR(a)(b) | | | 56,140 | | | | 759,013 | |
| Total Pharmaceuticals | | | | | | | 10,042,171 | |
| | | | | | | | | |
| TOTAL COMMON STOCKS | | | | | | | | |
| (Cost $107,771,200) | | | | | | | 83,658,610 | |
| | | 7 Day Yield | | | Shares | | | Value | |
| SHORT TERM INVESTMENTS (6.82%) | | | | | | | | | | | | |
| State Street Institutional Treasury Plus Money Market Fund - Premier Class | | | | | | | | | | | | |
| (Cost $30,222) | | | 5.31 | % | | | 30,222 | | | $ | 30,222 | |
| | | | | | | | | | | | | |
| Investments Purchased with Collateral from Securities Loaned (6.78%) | | | | | | | | | | | | |
| State Street Navigator Securities Lending Government Money Market Portfolio, 5.37% | | | | | | | | | | | | |
| (Cost $5,675,500) | | | | | | | 5,675,500 | | | $ | 5,675,500 | |
| TOTAL SHORT TERM INVESTMENTS | | | | | | | | | | | | |
| | | | | | | | | | | | | |
| (Cost $5,705,722) | | | | | | | | | | | 5,705,722 | |
| TOTAL INVESTMENTS (106.78%) | | | | | | | | | | | | |
| (Cost $113,476,922) | | | | | | | | | | $ | 89,364,332 | |
| LIABILITIES IN EXCESS OF OTHER ASSETS (-6.78%) | | | | | | | | | | | (5,674,814 | ) |
| NET ASSETS - 100.00% | | | | | | | | | | $ | 83,689,517 | |
| (a) | Non-income producing security. |
| (b) | Security, or a portion of the security position is currently on loan. The total market value of securities on loan is $16,629,975. |
See Notes to Financial Statements
22 | November 30, 2023
ALPS ETF Trust
| Statements of Assets and Liabilities | November 30, 2023 |
| | | ALPS Clean Energy ETF | | | ALPS Disruptive Technologies ETF | | | ALPS Global Travel Beneficiaries ETF | | | ALPS Medical Breakthroughs ETF | |
| ASSETS: | | | | | | | | | | | | |
| Investments, at value(a) | | $ | 312,240,187 | | | $ | 98,093,545 | | | $ | 6,096,300 | | | $ | 89,364,332 | |
| Foreign Currency, at value (Cost $–, $11, $– and $–) | | | – | | | | 11 | | | | – | | | | – | |
| Dividends receivable | | | 632,804 | | | | 271,582 | | | | 6,242 | | | | 33,740 | |
| Receivable for investments sold | | | 779,749 | | | | 748,410 | | | | – | | | | – | |
| Total Assets | | | 313,652,740 | | | | 99,113,548 | | | | 6,102,542 | | | | 89,398,072 | |
| | | | | | | | | | | | | | | | | |
| LIABILITIES: | | | | | | | | | | | | | | | | |
| Payable to adviser | | | 137,820 | | | | 38,183 | | | | 3,153 | | | | 33,055 | |
| Payable for capital shares redeemed | | | 780,623 | | | | – | | | | – | | | | – | |
| Payable for collateral upon return of securities loaned | | | 44,662,743 | | | | 1,192,658 | | | | – | | | | 5,675,500 | |
| Payable to custodian for overdraft | | | – | | | | 649,392 | | | | – | | | | – | |
| Payable to custodian for foreign currency overdraft | | | 94,596 | | | | – | | | | – | | | | – | |
| Total Liabilities | | | 45,675,782 | | | | 1,880,233 | | | | 3,153 | | | | 5,708,555 | |
| NET ASSETS | | $ | 267,976,958 | | | $ | 97,233,315 | | | $ | 6,099,389 | | | $ | 83,689,517 | |
| | | | | | | | | | | | | | | | | |
| NET ASSETS CONSIST OF: | | | | | | | | | | | | | | | | |
| Paid-in capital | | $ | 748,925,059 | | | $ | 129,710,601 | | | $ | 7,529,713 | | | $ | 249,964,564 | |
| Total distributable earnings/(accumulated losses) | | | (480,948,101 | ) | | | (32,477,286 | ) | | | (1,430,324 | ) | | | (166,275,047 | ) |
| NET ASSETS | | $ | 267,976,958 | | | $ | 97,233,315 | | | $ | 6,099,389 | | | $ | 83,689,517 | |
| | | | | | | | | | | | | | | | | |
| INVESTMENTS, AT COST | | $ | 594,922,283 | | | $ | 102,924,679 | | | $ | 6,491,830 | | | $ | 113,476,922 | |
| | | | | | | | | | | | | | | | | |
| PRICING OF SHARES | | | | | | | | | | | | | | | | |
| Net Assets | | $ | 267,976,958 | | | $ | 97,233,315 | | | $ | 6,099,389 | | | $ | 83,689,517 | |
| Shares of beneficial interest outstanding (Unlimited number of shares authorized, par value $0.01 per share) | | | 8,550,002 | | | | 2,525,002 | | | | 275,002 | | | | 3,175,000 | |
| Net Asset Value, offering and redemption price per share | | $ | 31.34 | | | $ | 38.51 | | | $ | 22.18 | | | $ | 26.36 | |
| (a) | Includes $75,116,300, $6,042,770, $– and $16,629,975 of securities on loan. |
See Notes to Financial Statements.
23 | November 30, 2023
ALPS ETF Trust
| Statements of Operations | For the Year Ended November 30, 2023 |
| | | ALPS Clean Energy ETF | | | ALPS Disruptive Technologies ETF | | | ALPS Global Travel Beneficiaries ETF | | | ALPS Medical Breakthroughs ETF | |
| INVESTMENT INCOME: | | | | | | | | | | | | |
| Dividends* | | $ | 3,894,024 | | | $ | 852,026 | | | $ | 67,928 | | | $ | 7,882 | |
| Securities Lending Income | | | 3,961,861 | | | | 144,641 | | | | 202 | | | | 155,503 | |
| Total Investment Income | | | 7,855,885 | | | | 996,667 | | | | 68,130 | | | | 163,385 | |
| | | | | | | | | | | | | | | | | |
| EXPENSES: | | | | | | | | | | | | | | | | |
| Investment adviser fees | | | 2,629,808 | | | | 542,678 | | | | 43,201 | | | | 516,298 | |
| Total Expenses | | | 2,629,808 | | | | 542,678 | | | | 43,201 | | | | 516,298 | |
| NET INVESTMENT INCOME/(LOSS) | | | 5,226,077 | | | | 453,989 | | | | 24,929 | | | | (352,913 | ) |
| | | | | | | | | | | | | | | | | |
| REALIZED AND UNREALIZED GAIN/(LOSS) | | | | | | | | | | | | | | | | |
| Net realized gain/(loss) on investments(a) | | | (93,836,526 | ) | | | (5,173,439 | ) | | | 123,374 | | | | (4,825,859 | ) |
| Net realized loss on foreign currency transactions | | | (30,949 | ) | | | (14,887 | ) | | | (2,196 | ) | | | – | |
| Total net realized gain/(loss) | | | (93,867,475 | ) | | | (5,188,326 | ) | | | 121,178 | | | | (4,825,859 | ) |
| Net change in unrealized appreciation/(depreciation) on investments | | | (179,380,821 | ) | | | 14,918,208 | | | | 322,295 | | | | (11,906,628 | ) |
| Net change in unrealized appreciation/(depreciation) on translation of assets and liabilities denominated in foreign currencies | | | (992 | ) | | | (1,024 | ) | | | 104 | | | | – | |
| Total net change in unrealized appreciation/(depreciation) | | | (179,381,813 | ) | | | 14,917,184 | | | | 322,399 | | | | (11,906,628 | ) |
| NET REALIZED AND UNREALIZED GAIN/(LOSS) ON | | | | | | | | | | | | | | | | |
| INVESTMENTS | | | (273,249,288 | ) | | | 9,728,858 | | | | 443,577 | | | | (16,732,487 | ) |
| NET INCREASE/(DECREASE) IN NET ASSETS RESULTING FROM OPERATIONS | | $ | (268,023,211 | ) | | $ | 10,182,847 | | | $ | 468,506 | | | $ | (17,085,400 | ) |
| *Net of foreign tax withholding. | | $ | 572,666 | | | $ | 49,833 | | | $ | 3,660 | | | $ | – | |
| (a) | Includes realized gain or loss as a result of in-kind transactions (See Note 4 in Notes to Financial Statements). |
See Notes to Financial Statements.
24 | November 30, 2023
ALPS Clean Energy ETF
| Statements of Changes in Net Assets |
| | | For the Year Ended November 30, 2023 | | | For the Year Ended November 30, 2022 | |
| OPERATIONS: | | | | | | |
| Net investment income | | $ | 5,226,077 | | | $ | 5,115,730 | |
| Net realized loss | | | (93,867,475 | ) | | | (19,774,548 | ) |
| Net change in unrealized appreciation/(depreciation) | | | (179,381,813 | ) | | | (235,883,266 | ) |
| Net decrease in net assets resulting from operations | | | (268,023,211 | ) | | | (250,542,084 | ) |
| | | | | | | | | |
| DISTRIBUTIONS TO SHAREHOLDERS: | | | | | | | | |
| From distributable earnings | | | (4,542,388 | ) | | | (2,463,315 | ) |
| From tax return of capital | | | (973,150 | ) | | | (3,378,816 | ) |
| Total distributions | | | (5,515,538 | ) | | | (5,842,131 | ) |
| | | | | | | | | |
| CAPITAL SHARE TRANSACTIONS: | | | | | | | | |
| Proceeds from sale of shares | | | 172,062,512 | | | | 203,438,962 | |
| Cost of shares redeemed | | | (338,457,659 | ) | | | (253,910,852 | ) |
| Net decrease from capital share transactions | | | (166,395,147 | ) | | | (50,471,890 | ) |
| Net decrease in net assets | | | (439,933,896 | ) | | | (306,856,105 | ) |
| | | | | | | | | |
| NET ASSETS: | | | | | | | | |
| Beginning of year | | | 707,910,854 | | | | 1,014,766,959 | |
| End of year | | $ | 267,976,958 | | | $ | 707,910,854 | |
| | | | | | | | | |
| OTHER INFORMATION: | | | | | | | | |
| CAPITAL SHARE TRANSACTIONS: | | | | | | | | |
| Beginning shares | | | 12,700,002 | | | | 13,725,002 | |
| Shares sold | | | 4,250,000 | | | | 3,625,000 | |
| Shares redeemed | | | (8,400,000 | ) | | | (4,650,000 | ) |
| Shares outstanding, end of year | | | 8,550,002 | | | | 12,700,002 | |
See Notes to Financial Statements.
25 | November 30, 2023
ALPS Disruptive Technologies ETF
| Statements of Changes in Net Assets |
| | | For the Year Ended November 30, 2023 | | | For the Year Ended November 30, 2022 | |
| OPERATIONS: | | | | | | |
| Net investment income/(loss) | | $ | 453,989 | | | $ | (74,355 | ) |
| Net realized gain/(loss) | | | (5,188,326 | ) | | | 4,788,241 | |
| Net change in unrealized appreciation/(depreciation) | | | 14,917,184 | | | | (64,939,656 | ) |
| Net increase/(decrease) in net assets resulting from operations | | | 10,182,847 | | | | (60,225,770 | ) |
| | | | | | | | | |
| DISTRIBUTIONS TO SHAREHOLDERS: | | | | | | | | |
| From distributable earnings | | | (25,708 | ) | | | (621,900 | ) |
| Total distributions | | | (25,708 | ) | | | (621,900 | ) |
| | | | | | | | | |
| CAPITAL SHARE TRANSACTIONS: | | | | | | | | |
| Proceeds from sale of shares | | | 1,675,949 | | | | 14,781,795 | |
| Cost of shares redeemed | | | (36,813,357 | ) | | | (69,266,142 | ) |
| Net decrease from capital share transactions | | | (35,137,408 | ) | | | (54,484,347 | ) |
| Net decrease in net assets | | | (24,980,269 | ) | | | (115,332,017 | ) |
| | | | | | | | | |
| NET ASSETS: | | | | | | | | |
| Beginning of year | | | 122,213,584 | | | | 237,545,601 | |
| End of year | | $ | 97,233,315 | | | $ | 122,213,584 | |
| | | | | | | | | |
| OTHER INFORMATION: | | | | | | | | |
| CAPITAL SHARE TRANSACTIONS: | | | | | | | | |
| Beginning shares | | | 3,500,002 | | | | 4,925,002 | |
| Shares sold | | | 50,000 | | | | 325,000 | |
| Shares redeemed | | | (1,025,000 | ) | | | (1,750,000 | ) |
| Shares outstanding, end of year | | | 2,525,002 | | | | 3,500,002 | |
See Notes to Financial Statements.
26 | November 30, 2023
ALPS Global Travel Beneficiaries ETF
| Statements of Changes in Net Assets |
| | | For the Year Ended November 30, 2023 | | | For the Year Ended November 30, 2022 | |
| OPERATIONS: | | | | | | |
| Net investment income/(loss) | | $ | 24,929 | | | $ | (16,209 | ) |
| Net realized gain/(loss) | | | 121,178 | | | | (513,843 | ) |
| Net change in unrealized appreciation/(depreciation) | | | 322,399 | | | | (342,658 | ) |
| Net increase/(decrease) in net assets resulting from operations | | | 468,506 | | | | (872,710 | ) |
| | | | | | | | | |
| DISTRIBUTIONS TO SHAREHOLDERS: | | | | | | | | |
| From distributable earnings | | | (3,090 | ) | | | (12,194 | ) |
| Total distributions | | | (3,090 | ) | | | (12,194 | ) |
| | | | | | | | | |
| CAPITAL SHARE TRANSACTIONS: | | | | | | | | |
| Proceeds from sale of shares | | | 576,398 | | | | 9,593,771 | |
| Cost of shares redeemed | | | (2,863,139 | ) | | | (8,453,163 | ) |
| Net increase/(decrease) from capital share transactions | | | (2,286,741 | ) | | | 1,140,608 | |
| Net increase/(decrease) in net assets | | | (1,821,325 | ) | | | 255,704 | |
| | | | | | | | | |
| NET ASSETS: | | | | | | | | |
| Beginning of year | | | 7,920,714 | | | | 7,665,010 | |
| End of year | | $ | 6,099,389 | | | $ | 7,920,714 | |
| | | | | | | | | |
| OTHER INFORMATION: | | | | | | | | |
| CAPITAL SHARE TRANSACTIONS: | | | | | | | | |
| Beginning shares | | | 375,002 | | | | 325,002 | |
| Shares sold | | | 25,000 | | | | 450,000 | |
| Shares redeemed | | | (125,000 | ) | | | (400,000 | ) |
| Shares outstanding, end of year | | | 275,002 | | | | 375,002 | |
See Notes to Financial Statements.
27 | November 30, 2023
ALPS Medical Breakthroughs ETF
| Statements of Changes in Net Assets |
| | | For the Year Ended November 30, 2023 | | | For the Year Ended November 30, 2022 | |
| | | | | | | |
| OPERATIONS: | | | | | | | | |
| Net investment loss | | $ | (352,913 | ) | | $ | (481,312 | ) |
| Net realized loss | | | (4,825,859 | ) | | | (64,609,014 | ) |
| Net change in unrealized appreciation/(depreciation) | | | (11,906,628 | ) | | | 14,490,450 | |
| Net decrease in net assets resulting from operations | | | (17,085,400 | ) | | | (50,599,876 | ) |
| | | | | | | | | |
| CAPITAL SHARE TRANSACTIONS: | | | | | | | | |
| Proceeds from sale of shares | | | 5,897,730 | | | | 23,693,301 | |
| Cost of shares redeemed | | | (20,131,389 | ) | | | (47,014,164 | ) |
| Net decrease from capital share transactions | | | (14,233,659 | ) | | | (23,320,863 | ) |
| Net decrease in net assets | | | (31,319,059 | ) | | | (73,920,739 | ) |
| | | | | | | | | |
| NET ASSETS: | | | | | | | | |
| Beginning of year | | | 115,008,576 | | | | 188,929,315 | |
| End of year | | $ | 83,689,517 | | | $ | 115,008,576 | |
| | | | | | | | | |
| OTHER INFORMATION: | | | | | | | | |
| CAPITAL SHARE TRANSACTIONS: | | | | | | | | |
| Beginning shares | | | 3,675,000 | | | | 4,400,000 | |
| Shares sold | | | 200,000 | | | | 725,000 | |
| Shares redeemed | | | (700,000 | ) | | | (1,450,000 | ) |
| Shares outstanding, end of year | | | 3,175,000 | | | | 3,675,000 | |
See Notes to Financial Statements.
28 | November 30, 2023
ALPS Clean Energy ETF
| Financial Highlights | For a Share Outstanding Throughout the Periods Presented |
| | | For the Year Ended November 30, 2023 | | | For the Year Ended November 30, 2022 | | | For the Year Ended November 30, 2021 | | | For the Year Ended November 30, 2020 | | | For the Year Ended November 30, 2019 | |
| NET ASSET VALUE, BEGINNING OF PERIOD | | $ | 55.74 | | | $ | 73.94 | | | $ | 70.05 | | | $ | 32.23 | | | $ | 25.03 | |
| | | | | | | | | | | | | | | | | | | | | |
| INCOME/(LOSS) FROM INVESTMENT OPERATIONS: | | | | | | | | | | | | | | | | | | | | |
| Net investment income(a) | | | 0.47 | | | | 0.39 | | | | 0.20 | | | | 0.25 | | | | 0.32 | |
| Net realized and unrealized gain/(loss) | | | (24.38 | ) | | | (18.14 | ) | | | 4.11 | | | | 38.08 | | | | 7.42 | |
| Total from investment operations | | | (23.91 | ) | | | (17.75 | ) | | | 4.31 | | | | 38.33 | | | | 7.74 | |
| DISTRIBUTIONS: | | | | | | | | | | | | | | | | | | | | |
| From net investment income | | | (0.40 | ) | | | (0.19 | ) | | | (0.17 | ) | | | (0.18 | ) | | | (0.23 | ) |
| Tax return of capital | | | (0.09 | ) | | | (0.26 | ) | | | (0.25 | ) | | | (0.33 | ) | | | (0.31 | ) |
| Total distributions | | | (0.49 | ) | | | (0.45 | ) | | | (0.42 | ) | | | (0.51 | ) | | | (0.54 | ) |
| Net increase/(decrease) in net asset value | | | (24.40 | ) | | | (18.20 | ) | | | 3.89 | | | | 37.82 | | | | 7.20 | |
| NET ASSET VALUE, END OF PERIOD | | $ | 31.34 | | | $ | 55.74 | | | $ | 73.94 | | | $ | 70.05 | | | $ | 32.23 | |
| TOTAL RETURN(b) | | | (43.11 | )% | | | (24.00 | )% | | | 6.16 | % | | | 120.45 | % | | | 31.28 | % |
| RATIOS/SUPPLEMENTAL DATA: | | | | | | | | | | | | | | | | | | | | |
| Net assets, end of period (000s) | | $ | 267,977 | | | $ | 707,911 | | | $ | 1,014,767 | | | $ | 609,457 | | | $ | 106,359 | |
| Ratio of expenses to average net assets | | | 0.55 | % | | | 0.55 | % | | | 0.56 | %(c) | | | 0.65 | % | | | 0.65 | % |
| Ratio of net investment income to average net assets | | | 1.09 | % | | | 0.69 | % | | | 0.26 | % | | | 0.57 | % | | | 1.10 | % |
| Portfolio turnover rate(d) | | | 38 | % | | | 44 | % | | | 39 | % | | | 34 | % | | | 15 | % |
| (a) | Based on average shares outstanding during the period. |
| (b) | Total return is calculated assuming an initial investment made at the net asset value at the beginning of the period and redemption at the net asset value on the last day of the period and assuming all distributions are reinvested at reinvestment prices. Total return calculated for a period of less than one year is not annualized. |
| (c) | Effective January 1, 2021, the Fund's Advisory Fee changed from 0.65% to 0.55%. |
| (d) | Portfolio turnover for periods less than one year are not annualized and does not include securities received or delivered from processing creations or redemptions in-kind. |
See Notes to Financial Statements.
29 | November 30, 2023
ALPS Disruptive Technologies ETF
| Financial Highlights | For a Share Outstanding Throughout the Periods Presented |
| | | For the Year Ended November 30, 2023 | | | For the Year Ended November 30, 2022 | | | For the Year Ended November 30, 2021 | | | For the Year Ended November 30, 2020 | | | For the Year Ended November 30, 2019 | |
| NET ASSET VALUE, BEGINNING OF PERIOD | | $ | 34.92 | | | $ | 48.23 | | | $ | 42.99 | | | $ | 31.88 | | | $ | 26.21 | |
| | | | | | | | | | | | | | | | | | | | | |
| INCOME/(LOSS) FROM INVESTMENT OPERATIONS: | | | | | | | | | | | | | | | | | | | | |
| Net investment income/ (loss)(a) | | | 0.15 | | | | (0.02 | ) | | | 0.15 | | | | 0.25 | | | | 0.14 | |
| Net realized and unrealized gain/(loss) | | | 3.45 | | | | (13.17 | ) | | | 5.26 | | | | 11.00 | | | | 5.61 | |
| Total from investment operations | | | 3.60 | | | | (13.19 | ) | | | 5.41 | | | | 11.25 | | | | 5.75 | |
| DISTRIBUTIONS: | | | | | | | | | | | | | | | | | | | | |
| From net investment income | | | (0.01 | ) | | | (0.12 | ) | | | (0.17 | ) | | | (0.14 | ) | | | (0.08 | ) |
| Total distributions | | | (0.01 | ) | | | (0.12 | ) | | | (0.17 | ) | | | (0.14 | ) | | | (0.08 | ) |
| | | | | | | | | | | | | | | | | | | | | |
| Net increase/(decrease) in net asset value | | | 3.59 | | | | (13.31 | ) | | | 5.24 | | | | 11.11 | | | | 5.67 | |
| NET ASSET VALUE, END OF PERIOD | | $ | 38.51 | | | $ | 34.92 | | | $ | 48.23 | | | $ | 42.99 | | | $ | 31.88 | |
| TOTAL RETURN(b) | | | 10.31 | % | | | (27.41 | )% | | | 12.60 | % | | | 35.42 | % | | | 22.04 | % |
| RATIOS/SUPPLEMENTAL DATA: | | | | | | | | | | | | | | | | | | | | |
| Net assets, end of period (000s) | | $ | 97,233 | | | $ | 122,214 | | | $ | 237,546 | | | $ | 150,459 | | | $ | 74,910 | |
| Ratio of expenses to average net assets | | | 0.50 | % | | | 0.50 | % | | | 0.50 | % | | | 0.50 | % | | | 0.50 | % |
| Ratio of net investment income/(loss) to | | | | | | | | | | | | | | | | | | | | |
| average net assets | | | 0.42 | % | | | (0.05 | )% | | | 0.31 | % | | | 0.72 | % | | | 0.48 | % |
| Portfolio turnover rate(c) | | | 34 | % | | | 31 | % | | | 26 | % | | | 38 | % | | | 42 | % |
| (a) | Based on average shares outstanding during the period. |
| (b) | Total return is calculated assuming an initial investment made at the net asset value at the beginning of the period and redemption at the net asset value on the last day of the period and assuming all distributions are reinvested at reinvestment prices. Total return calculated for a period of less than one year is not annualized. |
| (c) | Portfolio turnover for periods less than one year are not annualized and does not include securities received or delivered from processing creations or redemptions in-kind. |
See Notes to Financial Statements.
30 | November 30, 2023
ALPS Global Travel Beneficiaries ETF
| Financial Highlights | For a Share Outstanding Throughout the Periods Presented |
| | | For the Year Ended November 30, 2023 | | | For the Year Ended November 30, 2022 | | | For the Period September 8, 2021 (Commencement of Operations) to November 30, 2021 | |
| NET ASSET VALUE, BEGINNING OF PERIOD | | $ | 21.12 | | | $ | 23.58 | | | $ | 24.91 | |
| | | | | | | | | | | | | |
| INCOME/(LOSS) FROM INVESTMENT OPERATIONS: | | | | | | | | | | | | |
| Net investment income/(loss)(a) | | | 0.08 | | | | (0.04 | ) | | | 0.05 | |
| Net realized and unrealized gain/(loss) | | | 0.99 | | | | (2.39 | ) | | | (1.38 | ) |
| Total from investment operations | | | 1.07 | | | | (2.43 | ) | | | (1.33 | ) |
| | | | | | | | | | | | | |
| DISTRIBUTIONS: | | | | | | | | | | | | |
| From net investment income | | | (0.01 | ) | | | (0.03 | ) | | | – | |
| Total distributions | | | (0.01 | ) | | | (0.03 | ) | | | – | |
| | | | | | | | | | | | | |
| Net increase/(decrease) in net asset value | | | 1.06 | | | | (2.46 | ) | | | (1.33 | ) |
| NET ASSET VALUE, END OF PERIOD | | $ | 22.18 | | | $ | 21.12 | | | $ | 23.58 | |
| TOTAL RETURN(b) | | | 5.06 | % | | | (10.27 | )% | | | (5.34 | )% |
| | | | | | | | | | | | | |
| RATIOS/SUPPLEMENTAL DATA: | | | | | | | | | | | | |
| Net assets, end of period (000s) | | $ | 6,099 | | | $ | 7,921 | | | $ | 7,665 | |
| | | | | | | | | | | | | |
| Ratio of expenses to average net assets | | | 0.65 | % | | | 0.65 | % | | | 0.65 | %(c) |
| Ratio of net investment income/(loss) to average net assets | | | 0.38 | % | | | (0.18 | )% | | | 0.82 | %(c) |
| Portfolio turnover rate(d) | | | 54 | % | | | 57 | % | | | 19 | % |
| (a) | Based on average shares outstanding during the period. |
| (b) | Total return is calculated assuming an initial investment made at the net asset value at the beginning of the period and redemption at the net asset value on the last day of the period and assuming all distributions are reinvested at reinvestment prices. Total return calculated for a period of less than one year is not annualized. |
| (d) | Portfolio turnover for periods less than one year are not annualized and does not include securities received or delivered from processing creations or redemptions in-kind. |
See Notes to Financial Statements.
31 | November 30, 2023
ALPS Medical Breakthroughs ETF
| Financial Highlights | For a Share Outstanding Throughout the Periods Presented |
| | | For the Year Ended November 30, 2023 | | | For the Year Ended November 30, 2022 | | | For the Year Ended November 30, 2021 | | | For the Year Ended November 30, 2020 | | | For the Year Ended November 30, 2019 | |
| NET ASSET VALUE, BEGINNING OF PERIOD | | $ | 31.29 | | | $ | 42.94 | | | $ | 49.00 | | | $ | 39.51 | | | $ | 33.59 | |
| | | | | | | | | | | | | | | | | | | | | |
| INCOME/(LOSS) FROM INVESTMENT OPERATIONS: | | | | | | | | | | | | | | | | | | | | |
| Net investment income/ (loss)(a) | | | (0.10 | ) | | | (0.13 | ) | | | (0.18 | ) | | | (0.13 | ) | | | 0.03 | |
| Net realized and unrealized gain/(loss) | | | (4.83 | ) | | | (11.52 | ) | | | (5.88 | ) | | | 9.64 | | | | 6.67 | |
| Total from investment operations | | | (4.93 | ) | | | (11.65 | ) | | | (6.06 | ) | | | 9.51 | | | | 6.70 | |
| | | | | | | | | | | | | | | | | | | | | |
| DISTRIBUTIONS: | | | | | | | | | | | | | | | | | | | | |
| From net investment income | | | – | | | | – | | | | – | | | | (0.02 | ) | | | (0.78 | ) |
| Total distributions | | | – | | | | – | | | | – | | | | (0.02 | ) | | | (0.78 | ) |
| | | | | | | | | | | | | | | | | | | | | |
| Net increase/(decrease) in net asset value | | | (4.93 | ) | | | (11.65 | ) | | | (6.06 | ) | | | 9.49 | | | | 5.92 | |
| NET ASSET VALUE, END OF PERIOD | | $ | 26.36 | | | $ | 31.29 | | | $ | 42.94 | | | $ | 49.00 | | | $ | 39.51 | |
| TOTAL RETURN(b) | | | (15.76 | )% | | | (27.13 | )% | | | (12.37 | )% | | | 24.07 | % | | | 20.99 | % |
| | | | | | | | | | | | | | | | | | | | | |
| RATIOS/SUPPLEMENTAL DATA: | | | | | | | | | | | | | | | | | | | | |
| Net assets, end of period (000s) | | $ | 83,690 | | | $ | 115,009 | | | $ | 188,929 | | | $ | 242,542 | | | $ | 197,570 | |
| | | | | | | | | | | | | | | | | | | | | |
| Ratio of expenses to average net assets | | | 0.50 | % | | | 0.50 | % | | | 0.50 | % | | | 0.50 | % | | | 0.50 | % |
| Ratio of net investment income/(loss) to | | | | | | | | | | | | | | | | | | | | |
| average net assets | | | (0.34 | )% | | | (0.39 | )% | | | (0.36 | )% | | | (0.33 | )% | | | 0.09 | % |
| Portfolio turnover rate(c) | | | 81 | % | | | 88 | % | | | 81 | % | | | 68 | % | | | 88 | % |
| (a) | Based on average shares outstanding during the period. |
| (b) | Total return is calculated assuming an initial investment made at the net asset value at the beginning of the period and redemption at the net asset value on the last day of the period and assuming all distributions are reinvested at reinvestment prices. Total return calculated for a period of less than one year is not annualized. |
| (c) | Portfolio turnover for periods less than one year are not annualized and does not include securities received or delivered from processing creations or redemptions in-kind. |
32 | November 30, 2023
ALPS ETF Trust
| Notes to Financial Statements | November 30, 2023 |
1. ORGANIZATION
ALPS ETF Trust (the “Trust”), a Delaware statutory trust, is an open-end management investment company registered under the Investment Company Act of 1940, as amended (the “1940 Act”). As of November 30, 2023, the Trust consisted of twenty-three separate portfolios. Each portfolio represents a separate series of the Trust. This report pertains to the ALPS Clean Energy ETF, ALPS Disruptive Technologies ETF, ALPS Global Travel Beneficiaries ETF and the ALPS Medical Breakthroughs ETF (each a “Fund” and collectively, the “Funds”).
The investment objective of the ALPS Clean Energy ETF is to seek investment results that correspond generally, before fees and expenses, to the performance of the CIBC Atlas Clean Energy Index. The investment objective of the ALPS Disruptive Technologies ETF is to seek investment results that correspond generally, before fees and expenses, to the performance of the Indxx Disruptive Technologies Index. The investment objective of the ALPS Global Travel Beneficiaries ETF is to seek investment results that correspond generally, before fees and expenses, to the performance of the S-Network Global Travel Index. The investment objective of the ALPS Medical Breakthroughs ETF is to seek investment results that correspond generally, before fees and expenses, to the performance of the S-Network Medical Breakthroughs Index.
ALPS Clean Energy ETF is considered non-diversified and may invest a greater portion of assets in securities of individual issuers than a diversified fund. As a result, changes in the market value of a single investment could cause greater fluctuations in share price than would occur in a diversified fund. ALPS Disruptive Technologies ETF, ALPS Global Travel Beneficiaries ETF and ALPS Medical Breakthroughs ETF have elected to qualify as a diversified series of the Trust under the 1940 Act.
Each Fund’s Shares (“Shares”) are listed on the NYSE Arca, Inc. (the “NYSE Arca”). Each Fund issues and redeems Shares, at net asset value (“NAV”) in blocks of 25,000 Shares, each of which is called a “Creation Unit”. Creation Units are issued and redeemed principally in-kind for securities included in the Underlying Index. Except when aggregated in Creation Units, Shares are not redeemable securities of the Fund.
Pursuant to the Trust’s organizational documents, its Officers and Trustees are indemnified against certain liability arising out of the performance of their duties to the Trust. Additionally, in the normal course of business, the Trust enters into contracts with service providers that contain general indemnification clauses. The Trust’s maximum exposure under these arrangements is unknown, as this would involve future claims that may be made against the Trust that have not yet occurred.
2. SIGNIFICANT ACCOUNTING POLICIES
The following is a summary of significant accounting policies consistently followed by the Funds in the preparation of the financial statements. The accompanying financial statements were prepared in accordance with accounting principles generally accepted in the United States of America (“U.S. GAAP”). The preparation of financial statements in conformity with U.S. GAAP requires management to make certain estimates and assumptions that affect the reported amounts of assets and liabilities and disclosures of contingent assets and liabilities at the date of the financial statements and the reported amounts of revenue and expenses during the period. Actual results could differ from those estimates. Each Fund is considered an investment company under U.S. GAAP and follows the accounting and reporting guidance applicable to investment companies in the Financial Accounting Standards Board (“FASB”) Accounting Standards Codification Topic 946.
A. Portfolio Valuation
Each Fund’s NAV is determined daily, as of the close of regular trading on the New York Stock Exchange (the “NYSE”), normally 4:00 p.m. Eastern time, on each day the NYSE is open for trading. The NAV is computed by dividing the value of all assets of the Fund (including accrued interest and dividends), less all liabilities (including accrued expenses and dividends declared but unpaid), by the total number of shares outstanding.
Portfolio securities listed on any exchange other than the NASDAQ Stock Market LLC (“NASDAQ”) are valued at the last sale price on the business day as of which such value is being determined. If there has been no sale on such day, the securities are valued at the mean of the most recent bid and ask prices on such day. Securities traded on the NASDAQ are valued at the NASDAQ Official Closing Price as determined by NASDAQ. Portfolio securities traded on more than one securities exchange are valued at the last sale price on the business day as of which such value is being determined at the close of the exchange representing the principal market for such securities. Portfolio securities traded in the over-the-counter market, but excluding securities traded on the NASDAQ, are valued at the last quoted sale price in such market.
The Funds’ investments are valued at market value or, in the absence of market value with respect to any portfolio securities, at fair value according to procedures adopted by the Trust’s Board of Trustees (the “Board”). Pursuant to Rule 2a-5 under the 1940 Act, the Board designated ALPS Advisors, Inc. (the "Adviser") as the valuation designee ("Valuation Designee") for each Fund to perform the fair value determinations relating to Fund investments. The Adviser may carry out its designated responsibilities as Valuation Designee through various teams and committees. When market quotations are not readily available or when events occur that make established valuation methods unreliable, securities of the Funds may be valued
33 | November 30, 2023
ALPS ETF Trust
| Notes to Financial Statements | November 30, 2023 |
in good faith by the Valuation Designee. These securities generally include, but are not limited to, restricted securities (securities which may not be publicly sold without registration under the Securities Act of 1933) for which a pricing service is unable to provide a market price; securities whose trading has been formally suspended; a security whose market price is not available from a pre-established primary pricing source or the pricing source is not willing to provide a price; a security with respect to which an event has occurred that is most likely to materially affect the value of the security after the market has closed but before the calculation of the Funds’ NAV or make it difficult or impossible to obtain a reliable market quotation; or a security whose price, as provided by the pricing service, does not reflect the security’s “fair value” due to the security being de-listed from a national exchange or the security’s primary trading market is temporarily closed at a time when, under normal conditions, it would be open. As a general principle, the current “fair value” of a security would be the amount which the owner might reasonably expect to receive from the sale on the applicable exchange or principal market. A variety of factors may be considered in determining the fair value of such securities.
B. Fair Value Measurements
Each Fund discloses the classification of its fair value measurements following a three-tier hierarchy based on the inputs used to measure fair value. Inputs refer broadly to the assumptions that market participants would use in pricing the asset or liability; including assumptions about risk. Inputs may be observable or unobservable. Observable inputs reflect the assumptions market participants would use in pricing the asset or liability that are developed based on market data obtained from sources independent of the reporting entity. Unobservable inputs reflect the reporting entity’s own assumptions about the assumptions market participants would use in pricing the asset or liability that are developed based on the best information available.
Valuation techniques used to value the Funds’ investments by major category are as follows:
Equity securities, including restricted securities, for which market quotations are readily available, are valued at the last reported sale price or official closing price as reported by a third party pricing vendor on the primary market or exchange on which they are traded and are categorized as Level 1 in the hierarchy. In the event there were no sales during the day or closing prices are not available, securities are valued at the mean of the most recent quoted bid and ask prices on such day and are generally categorized as Level 2 in the hierarchy. Investments in open-end mutual funds are valued at their closing NAV each business day and are categorized as Level 1 in the hierarchy.
Changes in valuation techniques may result in transfers in or out of an assigned level within the disclosure hierarchy.
Various inputs are used in determining the value of each Fund’s investments as of the end of the reporting period. When inputs used fall into different levels of the fair value hierarchy, the level in the hierarchy within which the fair value measurement falls is determined based on the lowest level input that is significant to the fair value measurement in its entirety. The designated input levels are not necessarily an indication of the risk or liquidity associated with these investments.
These inputs are categorized in the following hierarchy under applicable financial accounting standards:
| Level 1 – | Unadjusted quoted prices in active markets for identical investments, unrestricted assets or liabilities that a Fund has the ability to access at the measurement date; |
| Level 2 – | Quoted prices which are not active, quoted prices for similar assets or liabilities in active markets or inputs other than quoted prices that are observable (either directly or indirectly) for substantially the full term of the asset or liability; and |
| Level 3 – | Significant unobservable prices or inputs (including the Fund’s own assumptions in determining the fair value of investments) where there is little or no market activity for the asset or liability at the measurement date. |
34 | November 30, 2023
ALPS ETF Trust
| Notes to Financial Statements | November 30, 2023 |
The following is a summary of the inputs used to value the Funds’ investments as of November 30, 2023:
| ALPS Clean Energy ETF | | | | | | | | | | | | | | | | |
| Investments in Securities at Value | | | Level 1 - Quoted and Unadjusted Prices | | | | Level 2 - Other Significant Observable Inputs | | | | Level 3 - Significant Unobservable Inputs | | | | Total | |
| Common Stocks* | | $ | 242,204,535 | | | $ | – | | | $ | – | | | $ | 242,204,535 | |
| Master Limited Partnerships* | | | 25,142,006 | | | | – | | | | – | | | | 25,142,006 | |
| Short Term Investments | | | 44,893,646 | | | | – | | | | – | | | | 44,893,646 | |
| Total | | $ | 312,240,187 | | | $ | – | | | $ | – | | | $ | 312,240,187 | |
| ALPS Disruptive Technologies ETF |
| Investments in Securities at Value | | Level 1 - Quoted and Unadjusted Prices | | | Level 2 - Other Significant Observable Inputs | | | Level 3 - Significant Unobservable Inputs | | | Total | |
| Common Stocks* | | $ | 95,918,605 | | | $ | – | | | $ | – | | | $ | 95,918,605 | |
| Master Limited Partnerships* | | | 982,282 | | | | – | | | | – | | | | 982,282 | |
| Short Term Investments | | | 1,192,658 | | | | – | | | | – | | | | 1,192,658 | |
| Total | | $ | 98,093,545 | | | $ | – | | | $ | – | | | $ | 98,093,545 | |
| ALPS Global Travel Beneficiaries ETF |
| Investments in Securities at Value | | Level 1 - Quoted and Unadjusted Prices | | | Level 2 - Other Significant Observable Inputs | | | Level 3 - Significant Unobservable Inputs | | | Total | |
| Common Stocks* | | $ | 6,085,242 | | | $ | – | | | $ | – | | | $ | 6,085,242 | |
| Short Term Investments | | | 11,058 | | | | – | | | | – | | | | 11,058 | |
| Total | | $ | 6,096,300 | | | $ | – | | | $ | – | | | $ | 6,096,300 | |
| ALPS Medical Breakthroughs ETF |
| Investments in Securities at Value | | Level 1 - Quoted and Unadjusted Prices | | | Level 2 - Other Significant Observable Inputs | | | Level 3 - Significant Unobservable Inputs | | | Total | |
| Common Stocks* | | $ | 83,658,610 | | | $ | – | | | $ | – | | | $ | 83,658,610 | |
| Short Term Investments | | | 5,705,722 | | | | – | | | | – | | | | 5,705,722 | |
| Total | | $ | 89,364,332 | | | $ | – | | | $ | – | | | $ | 89,364,332 | |
| * | For a detailed sector breakdown, see the accompanying Schedule of Investments. |
The Funds did not have any securities that used significant unobservable inputs (Level 3) in determining fair value and there were no transfers into or out of Level 3 during the year ended November 30, 2023.
C. Foreign Investment Risk
The Funds may directly purchase securities of foreign issuers. Investments in non-U.S. issuers may involve unique risks compared to investing in securities of U.S. issuers, including, among others, less liquidity generally, greater market volatility than U.S. securities and less complete financial information than for U.S. issuers. In addition, adverse political, economic or social developments could undermine the value of the Fund’s investments or prevent the Fund from realizing the full value of its investments. Financial reporting standards for companies based in foreign markets differ from those in the United States. Finally, the value of the currency of the country in which the Fund has invested could decline relative to the value of the
U.S. dollar, which may affect the value of the investment to U.S. investors. The Fund will not enter into transactions to hedge against declines in the value of the Fund’s assets that are denominated in foreign currency.
Countries with emerging markets may have relatively unstable governments and may present the risks of nationalization of businesses, restrictions on foreign ownership and prohibitions on the repatriation of assets. The economies of emerging markets countries also may be based on only a few industries, making them more vulnerable to changes in local or global trade conditions and more sensitive to debt burdens, inflation rates or adverse news and events.
35 | November 30, 2023
ALPS ETF Trust
| Notes to Financial Statements | November 30, 2023 |
Because foreign markets may be open on different days than the days during which investors may purchase the shares of the Fund, the value of the Funds’ securities may change on the days when investors are not able to purchase the shares of the Fund. The value of securities denominated in foreign currencies is converted into U.S. dollars using exchange rates determined daily as of the close of regular trading on the NYSE. Any use of a different rate from the rates used by the Index may adversely affect a Fund's ability to track its Index.
D. Foreign Currency Translation
The books and records of the Funds are maintained in U.S. dollars. Investment valuations and other assets and liabilities initially expressed in foreign currencies are converted each business day into U.S. dollars based upon current exchange rates. The portion of realized and unrealized gains or losses on investments due to fluctuations in foreign currency exchange rates is not separately disclosed and is included in realized and unrealized gains or losses on investments, when applicable.
E. Securities Transactions and Investment Income
Securities transactions are recorded as of the trade date. Realized gains and losses from securities transactions are recorded on the specific identification in accordance with GAAP. Dividend income and capital gains distributions, if any, are recorded on the ex-dividend date, net of any foreign taxes withheld. Interest income, if any, is recorded on the accrual basis.
F. Dividends and Distributions to Shareholders
Dividends from net investment income for the ALPS Disruptive Technologies ETF, the ALPS Global Travel Beneficiaries ETF and the ALPS Medical Breakthroughs ETF, if any, are declared and paid annually or as the Board may determine from time to time. Dividends from net investment income for ALPS Clean Energy ETF, if any, are declared and paid quarterly or as the Board may determine from time to time. Distributions of net realized capital gains earned by the Funds, if any, are distributed at least annually.
G. Federal Tax and Tax Basis Information
The timing and character of income and capital gain distributions are determined in accordance with income tax regulations, which may differ from
U.S. GAAP. Reclassifications are made to the Funds’ capital accounts for permanent tax differences to reflect income and gains available for distribution (or available capital loss carryforwards) under income tax regulations.
For the year ended November 30, 2023, the following reclassifications, which had no impact on results of operations or net assets, were recorded to reflect permanent tax differences resulting primarily from in-kind transactions and prior year tax return true-ups:
| Fund | | Paid-in Capital | | | Total Distributable Earnings/(Accumulated Losses) | |
| ALPS Clean Energy ETF | | $ | (12,373,441 | ) | | $ | 12,373,441 | |
| ALPS Disruptive Technologies ETF | | | 5,520,490 | | | | (5,520,490 | ) |
| ALPS Global Travel Beneficiaries ETF | | | 329,144 | | | | (329,144 | ) |
| ALPS Medical Breakthroughs ETF | | | 3,510,858 | | | | (3,510,858 | ) |
36 | November 30, 2023
ALPS ETF Trust
| Notes to Financial Statements | November 30, 2023 |
The tax character of the distributions paid during the fiscal years ended November 30, 2023 and November 30, 2022 was as follows:
| Fund | | Ordinary Income | | | Long-Term Capital Gain | | | Return of Capital | |
| November 30, 2023 | | | | | | | | | |
| ALPS Clean Energy ETF | | $ | 4,542,388 | | | $ | – | | | $ | 973,150 | |
| ALPS Disruptive Technologies ETF | | | 25,708 | | | | – | | | | – | |
| ALPS Global Travel Beneficiaries ETF | | | 3,090 | | | | – | | | | – | |
| ALPS Medical Breakthroughs ETF | | | – | | | | – | | | | – | |
| Fund | | Ordinary Income | | | Long-Term Capital Gain | | | Return of Capital | |
| November 30, 2022 | | | | | | | | | |
| ALPS Clean Energy ETF | | $ | 2,463,315 | | | $ | – | | | $ | 3,378,816 | |
| ALPS Disruptive Technologies ETF | | | 621,900 | | | | – | | | | – | |
| ALPS Global Travel Beneficiaries ETF | | | 12,194 | | | | – | | | | – | |
| ALPS Medical Breakthroughs ETF | | | – | | | | – | | | | – | |
The character of distributions made during the year may differ from its ultimate characterization for federal income tax purposes.
Under current law, capital losses maintain their character as short-term or long-term and are carried forward to the next tax year without expiration. As of November 30, 2023, the following amounts are available as carry forwards to the next tax year:
| Fund | | Short-Term | | | Long-Term | |
| ALPS Clean Energy ETF | | $ | 109,296,745 | | | $ | 80,552,476 | |
| ALPS Disruptive Technologies ETF | | | 9,947,890 | | | | 16,664,129 | |
| ALPS Global Travel Beneficiaries ETF | | | 847,251 | | | | 204,158 | |
| ALPS Medical Breakthroughs ETF | | | 83,931,519 | | | | 57,387,807 | |
As of November 30, 2023, the components of distributable earnings/(accumulated losses) on a tax basis were as follows:
| Fund | | Accumulated Net Investment Income | | | Accumulated Net Realized Gain/(Loss) on Investments | | | Other Accumulated Losses(a) | | | Net Unrealized Appreciation/(Depreciation) on Investments | | | Total | |
| ALPS Clean Energy ETF | | $ | – | | | $ | (189,849,221 | ) | | $ | – | | | $ | (291,098,880 | ) | | $ | (480,948,101 | ) |
| ALPS Disruptive Technologies ETF | | | 299,241 | | | | (26,612,019 | ) | | | – | | | | (6,164,508 | ) | | | (32,477,286 | ) |
| ALPS Global Travel Beneficiaries ETF | | | 23,059 | | | | (1,051,409 | ) | | | – | | | | (401,974 | ) | | | (1,430,324 | ) |
| ALPS Medical Breakthroughs ETF | | | 98,971 | | | | (141,319,326 | ) | | | (316,388 | ) | | | (24,738,304 | ) | | | (166,275,047 | ) |
| (a) | Other accumulated losses represents late year ordinary losses the Fund elects to defer to the year ending November 30, 2024. |
37 | November 30, 2023
ALPS ETF Trust
| Notes to Financial Statements | November 30, 2023 |
As of November 30, 2023, the cost of investments for federal income tax purposes and accumulated net unrealized appreciation/(depreciation) on investments were as follows:
| Fund | | ALPS Clean Energy ETF | | | ALPS Disruptive Technologies ETF | | | ALPS Global Travel Beneficiaries ETF | | | ALPS Medical Breakthroughs ETF | |
| Gross appreciation (excess of value over tax cost) | | $ | 4,658,497 | | | $ | 13,544,608 | | | $ | 529,049 | | | $ | 9,467,336 | |
| Gross depreciation (excess of tax cost over value) | | | (295,757,537 | ) | | | (19,710,214 | ) | | | (931,108 | ) | | | (34,205,640 | ) |
| Net appreciation/(depreciation) of foreign currency | | | 160 | | | | 1,098 | | | | 85 | | | | – | |
| Net unrealized appreciation/(depreciation) | | $ | (291,098,880 | ) | | $ | (6,164,508 | ) | | $ | (401,974 | ) | | $ | (24,738,304 | ) |
| Cost of investments for income tax purposes | | $ | 603,339,227 | | | $ | 104,259,151 | | | $ | 6,498,359 | | | $ | 114,102,636 | |
The differences between book-basis and tax-basis are primarily due to the deferral of losses from wash sales, C-Corp basis adjustments, investments in passive foreign investment companies (PFICs), and investments in partnerships.
H. Income Taxes
No provision for income taxes is included in the accompanying financial statements, as each Fund intends to distribute to shareholders all taxable investment income and realized gains and otherwise comply with Subchapter M of the Internal Revenue Code of 1986, as amended, applicable to regulated investment companies. Each Fund evaluates tax positions taken (or expected to be taken) in the course of preparing the Fund’s tax returns to determine whether these positions meet a “more-likely-than-not” standard that, based on the technical merits, have a more than fifty percent likelihood of being sustained by a taxing authority upon examination. A tax position that meets the “more-likely-than-not” recognition threshold is measured to determine the amount of benefit to recognize in the financial statements.
As of and during the year ended November 30, 2023, each Fund did not have a liability for any unrecognized tax benefits. Each Fund files U.S. federal, state, and local tax returns as required. Each Fund’s tax returns are subject to examination by the relevant tax authorities until expiration of the applicable statute of limitations, which is generally three years after the filing of the tax return, but may extend to four years in certain jurisdictions. Tax returns for open years have incorporated no uncertain tax positions that require a provision for income taxes.
I. Lending of Portfolio Securities
The Funds have entered into a securities lending agreement with State Street Bank & Trust Co. (“SSB”), the Funds’ lending agent. Each Fund may lend their portfolio securities only to borrowers that are approved by SSB. Each Fund will limit such lending to not more than 33 1/3% of the value of its total assets. Each Funds’ securities held at SSB as custodian shall be available to be lent except those securities the Fund or ALPS Advisors, Inc. specifically identifies in writing as not being available for lending. The borrower pledges and maintains with each Fund collateral consisting of cash (U.S. Dollars only), securities issued or guaranteed by the U.S. government or its agencies or instrumentalities, and cash equivalents (including irrevocable bank letters of credit) issued by a person other than the borrower or an affiliate of the borrower. The initial collateral received by each Fund is required to have a value of no less than 102% of the market value of the loaned securities for U.S equity securities and a value of no less than 105% of the market value for non-U.S. equity securities. The collateral is maintained thereafter, at a market value equal to not less than 102% of the current value of the U.S. equity securities on loan and not less than 105% of the current value of the non-U.S. equity securities on loan. The market value of the loaned securities is determined at the close of each business day and any additional required collateral is delivered to each Fund on the next business day. During the term of the loan, each Fund is entitled to all distributions made on or in respect of the loaned securities. Loans of securities are terminable at any time and the borrower, after notice, is required to return borrowed securities within the customary time period for settlement of securities transactions.
Any cash collateral received is reinvested in a money market fund managed by SSB as disclosed in each Fund’s Schedule of Investments and is reflected in the Statements of Assets and Liabilities as a payable for collateral upon return of securities loaned. Non-cash collateral, in the form of securities issued or guaranteed by the U.S. government or its agencies or instrumentalities, is not disclosed in a Fund’s Statements of Assets and Liabilities or the contractual maturity table below as it is held by the lending agent on behalf of each Fund, and each Fund does not have the ability to re-hypothecate these securities. Income earned by each Fund from securities lending activity is disclosed in the Statement of Operations.
38 | November 30, 2023
ALPS ETF Trust
| Notes to Financial Statements | November 30, 2023 |
The following is a summary of each Fund's securities lending agreement and related cash and non-cash collateral received as of November 30, 2023:
| Fund | | Market Value of Securities on Loan | | | Cash Collateral Received | | | Non-Cash Collateral Received | | | Total Collateral Received | |
| ALPS Clean Energy ETF | | $ | 75,116,300 | | | $ | 44,662,743 | | | $ | 34,076,197 | | | $ | 78,738,940 | |
| ALPS Disruptive Technologies ETF | | | 6,042,770 | | | | 1,192,658 | | | | 5,059,735 | | | | 6,252,393 | |
| ALPS Medical Breakthroughs ETF | | | 16,629,975 | | | | 5,675,500 | | | | 11,160,851 | | | | 16,836,351 | |
The risks of securities lending include the risk that the borrower may not provide additional collateral when required or may not return the securities when due. To mitigate these risks, each Fund benefits from a borrower default indemnity provided by SSB. SSB’s indemnity allows for full replacement of securities lent wherein SSB will purchase the unreturned loaned securities on the open market by applying the proceeds of the collateral or to the extent such proceeds are insufficient or the collateral is unavailable, SSB will purchase the unreturned loan securities at SSB’s expense. However, the Funds could suffer a loss if the value of the investments purchased with cash collateral falls below the value of the cash collateral received.
The following tables reflect a breakdown of transactions accounted for as secured borrowings, the gross obligation by the type of collateral pledged or securities loaned, and the remaining contractual maturity of those transactions as of November 30, 2023:
| ALPS Clean Energy ETF | | Remaining Contractual Maturity of the Agreements | |
| Securities Lending Transactions | | Overnight & Continuous | | | Up to 30 Days | | | 30-90 Days | | | Greater than 90 Days | | | Total | |
| Common Stocks | | $ | 44,662,743 | | | $ | – | | | $ | – | | | $ | – | | | $ | 44,662,743 | |
| Total Borrowings | | | | | | | | | | | | | | | | | | | 44,662,743 | |
| Gross amount of recognized liabilities for securities lending (collateral received) | | | | | | | | | | | $ | 44,662,743 | |
| ALPS Disruptive Technologies ETF | | Remaining Contractual Maturity of the Agreements | |
| Securities Lending Transactions | | Overnight & Continuous | | | Up to 30 Days | | | 30-90 Days | | | Greater than 90 Days | | | Total | |
| Common Stocks | | $ | 1,192,658 | | | $ | – | | | $ | – | | | $ | – | | | $ | 1,192,658 | |
| Total Borrowings | | | | | | | | | | | | | | | | | | | 1,192,658 | |
| Gross amount of recognized liabilities for securities lending (collateral received) | | | | | | | | | | | $ | 1,192,658 | |
| ALPS Medical Breakthroughs ETF | | Remaining Contractual Maturity of the Agreements | |
| Securities Lending Transactions | | Overnight & Continuous | | | Up to 30 Days | | | 30-90 Days | | | Greater than 90 Days | | | Total | |
| Common Stocks | | $ | 5,675,500 | | | $ | – | | | $ | – | | | $ | – | | | $ | 5,675,500 | |
| Total Borrowings | | | | | | | | | | | | | | | | | | | 5,675,500 | |
| Gross amount of recognized liabilities for securities lending (collateral received) | | | | | | | | | | | $ | 5,675,500 | |
3. INVESTMENT ADVISORY FEE AND OTHER AFFILIATED TRANSACTIONS
ALPS Advisors, Inc. serves as the Funds’ investment adviser pursuant to an Investment Advisory Agreement with the Trust on behalf of each Fund (the “Advisory Agreement”). Pursuant to the Advisory Agreement, each Fund pays the Adviser an annual management fee for the services and facilities it provides, payable on a monthly basis as a percentage of the relevant Fund’s average daily net assets as set out below. From time to time, the Adviser may waive all or a portion of its fee.
| Fund | Advisory Fee |
| ALPS Clean Energy ETF | 0.55% |
| ALPS Disruptive Technologies ETF | 0.50% |
| ALPS Global Travel Beneficiaries ETF | 0.65% |
| ALPS Medical Breakthroughs ETF | 0.50% |
Out of the unitary management fee, the Adviser pays substantially all expenses of each Fund, including licensing fees to the Underlying Index provider, the cost of transfer agency, custody, fund administration, legal, audit, trustees and other services, except for interest expenses, distribution fees or
39 | November 30, 2023
ALPS ETF Trust
| Notes to Financial Statements | November 30, 2023 |
expenses, brokerage expenses, taxes and extraordinary expenses not incurred in the ordinary course of each Fund's business. The Adviser’s unitary management fee is designed to pay substantially all of each Fund's expenses and to compensate the Adviser for providing services for each Fund.
ALPS Fund Services, Inc., an affiliate of the Adviser, is the administrator for the Funds.
Effective July 1, 2023, each Trustee receives (1) a quarterly retainer of $25,000, (2) a per meeting fee of $15,000, (3) $2,500 for any special meeting held outside of a regularly scheduled board meeting, and (4) reimbursement for all reasonable out-of-pocket expenses relating to attendance at meetings. In addition, the Chairman of the Board receives a quarterly retainer of $5,000, the Chairman of the Audit Committee receives a quarterly retainer of $3,000, and the Chairman of the Nominating & Governance Committee receives a quarterly retainer of $2,000, each in connection with their respective roles. Prior to July 1, 2023, each Trustee received (1) a quarterly retainer of $20,000, (2) a per meeting fee of $10,000, (3) $2,500 for any special meeting held outside of a regularly scheduled board meeting, and (4) reimbursement for all reasonable out-of-pocket expenses relating to attendance at meetings. In addition, the Chairman of the Board received a quarterly retainer of $5,000, the Chairman of the Audit Committee received a quarterly retainer of $3,000, and the Chairman of the Nominating & Governance Committee received a quarterly retainer of $2,000, each in connection with their respective roles.
4. PURCHASES AND SALES OF SECURITIES
For the year ended November 30, 2023, the cost of purchases and proceeds from sales of investment securities, excluding short-term investments and in-kind transactions, were as follows:
| Fund | | Purchases | | | Sales | |
| ALPS Clean Energy ETF | | $ | 183,393,189 | | | $ | 184,883,289 | |
| ALPS Disruptive Technologies ETF | | | 36,942,689 | | | | 36,861,227 | |
| ALPS Global Travel Beneficiaries ETF | | | 3,566,111 | | | | 3,593,215 | |
| ALPS Medical Breakthroughs ETF | | | 83,490,341 | | | | 83,601,438 | |
For the year ended November 30, 2023, the cost of in-kind purchases and proceeds from in-kind sales were as follows:
| Fund | | Purchases | | | Sales | |
| ALPS Clean Energy ETF | | $ | 170,624,202 | | | $ | 333,836,855 | |
| ALPS Disruptive Technologies ETF | | | 1,631,116 | | | | 36,523,244 | |
| ALPS Global Travel Beneficiaries ETF | | | 567,333 | | | | 2,808,497 | |
| ALPS Medical Breakthroughs ETF | | | 5,897,693 | | | | 20,128,020 | |
For the year ended November 30, 2023, the in-kind net realized gain/(losses) were as follows:
| Fund | | Net Realized Gain/(Loss) | |
| ALPS Clean Energy ETF | | $ | (3,407,073 | ) |
| ALPS Disruptive Technologies ETF | | | 5,756,084 | |
| ALPS Global Travel Beneficiaries ETF | | | 330,611 | |
| ALPS Medical Breakthroughs ETF | | | 3,809,571 | |
Gains on in-kind transactions are not considered taxable for federal income tax purposes and losses on in-kind transactions are also not deductible for tax purposes.
40 | November 30, 2023
ALPS ETF Trust
| Notes to Financial Statements | November 30, 2023 |
5. CAPITAL SHARE TRANSACTIONS
Shares are created and redeemed by each Fund only in Creation Unit size aggregations of 25,000 Shares. Only broker-dealers or large institutional investors with creation and redemption agreements called Authorized Participants (“AP”) are permitted to purchase or redeem Creation Units from the Funds. Such transactions are generally permitted on an in-kind basis, with a balancing cash component to equate the transaction to the NAV per unit of each Fund on the transaction date. Cash may be substituted equivalent to the value of certain securities generally when they are not available in sufficient quantity for delivery, not eligible for trading by the AP or as a result of other market circumstances.
6. RELATED PARTY TRANSACTIONS
The ALPS Clean Energy ETF and ALPS Disruptive Technologies ETF engaged in cross trades between other funds in the Trust during the year ended November 30, 2023 pursuant to Rule 17a-7 under the 1940 Act. Cross trading is the buying or selling of portfolio securities between funds to which the Adviser serves as the investment adviser. The Board previously adopted procedures that apply to transactions between the Funds of the Trust pursuant to Rule 17a-7. These transactions related to cross trades during the period complied with the requirements set forth by Rule 17a-7 and the Trust’s procedures.
Transactions related to cross trades during the year ended November 30, 2023, were as follows:
| | | Purchase cost paid | | | Sale proceeds received | | | Realized gain/(loss) on sales | |
| ALPS Clean Energy ETF | | $ | – | | | $ | 615,624 | | | $ | (82,207 | ) |
| ALPS Disruptive Technologies ETF | | | 2,004,036 | | | | 380,404 | | | | 67,608 | |
7. MARKET RISK
The Funds are subject to investment and operational risks associated with financial, economic and other global market developments and disruptions, including those arising from war, terrorism, market manipulation, government interventions, defaults and shutdowns, political changes or diplomatic developments, public health emergencies (such as the spread of infectious diseases, pandemics and epidemics) and natural/environmental disasters, which can negatively impact the securities markets and cause each Fund to lose value. Securities in each Fund's portfolio may underperform in comparison to securities in general financial markets, a particular financial market or other asset classes due to a number of factors, including inflation (or expectations for inflation), deflation (or expectations for deflation), interest rates, global demand for particular products or resources, market instability, debt crises and downgrades, embargoes, tariffs, sanctions and other trade barriers, regulatory events, other governmental trade or market control programs and related geopolitical events. In addition, the value of the Fund's investments may be negatively affected by the occurrence of global events such as war, terrorism, environmental disasters, natural disasters or events, country instability, and infectious disease epidemics or pandemics.
8. CONCENTRATION RISK
Each Fund seeks to track an underlying index, which itself may have concentration in certain regions, economies, countries, markets, industries or sectors. Underperformance or increased risk in such concentrated areas may result in underperformance or increased risk in the Funds.
9. REGULATORY UPDATE
The SEC adopted rule and form amendments that will change the format and content of the Funds' annual and semi-annual reports. Certain information, including the financial statements, will not appear in the Funds' new tailored shareholder reports but will be available online, delivered free of charge upon request, and filed on a semi-annual basis on Form N-CSR. The rule and form amendments have a compliance date of July 24, 2024. At this time, the Trust is evaluating the impact of these rule and form amendment changes.
10. SUBSEQUENT EVENTS
Subsequent events, if any, after the date of the Statements of Assets and Liabilities have been evaluated through the date the financial statements were issued. Management has determined that there were no subsequent events to report through the issuance of these financial statements.
41 | November 30, 2023
ALPS ETF Trust
| Additional Information | November 30, 2023 (Unaudited) |
PROXY VOTING RECORDS, POLICIES AND PROCEDURES
Information regarding how each Fund voted proxies relating to portfolio securities during the most recent 12-month period ended June 30 and a description of the Funds' proxy voting policies and procedures used in determining how to vote for proxies are available without charge on the SEC’s website at www.sec.gov and upon request, by calling (toll-free) 1-866-759-5679.
PORTFOLIO HOLDINGS
Each Fund files a complete schedule of portfolio holdings with the U.S. Securities and Exchange Commission (“SEC”) for the first and third quarters of each fiscal year on Form N-PORT within 60 days after the end of the period. Copies of each Fund’s Form N-PORT are available without a charge, upon request, by contacting the Fund at 1-866-759-5679 and on the SEC’s website at https://www.sec.gov.
TAX INFORMATION
The Funds designate the following as a percentage of taxable ordinary income distributions, or up to the maximum amount allowable, for the calendar year ended December 31, 2022:
| Fund | Qualified Dividend Income | Dividend Received Deduction |
| ALPS Clean Energy ETF | 84.58% | 13.22% |
| ALPS Disruptive Technologies ETF | 100.00% | 100.00% |
| ALPS Global Travel Beneficiaries ETF | 100.00% | 100.00% |
| ALPS Medical Breakthroughs ETF | 0.00% | 0.00% |
In early 2023, if applicable, shareholders of record received this information for the distributions paid to them by the Funds during the calendar year 2022 via Form 1099. The Funds will notify shareholders in early 2024 of amounts paid to them by the Funds, if any, during the calendar year 2023.
LICENSING AGREEMENT
ALPS Clean Energy ETF
CIBC NTC is the designer of the construction and methodology for the Underlying Index. “CIBC NTC” and “CIBC Atlas Clean Energy Index” are service marks or trademarks of the Index Provider. CIBC NTC acts as brand licensor for the Underlying Index and is not responsible for the descriptions of the Fund that appear herein.
The Fund is not sponsored by CIBC NTC or any of its affiliates. CIBC NTC makes no representation or warranty, express or implied, to the owners of the Fund or any member of the public regarding the advisability of investing in securities or commodities generally or in the Fund particularly. CIBC NTC does not guarantee the quality, accuracy or completeness of the Underlying Index or any Underlying Index data included herein or derived therefrom and assumes no liability in connection with their use. The Underlying Index is determined and composed without regard to the Adviser or the Fund. CIBC NTC has no obligation to take the needs of the Adviser, the Fund or the shareholders of the Fund into consideration in determining, composing or calculating the Underlying Index. CIBC NTC is not responsible for and has not participated in the determination of the timing of, prices at, or quantities of the Fund to be issued or in the determination or calculation of the equation by which the Fund is to be converted into cash. CIBC NTC has no obligation or liability in connection with the administration, marketing or trading of the Fund and is not responsible for and has not participated in the determination of pricing or the timing of the issuance or sale of the Shares of the Fund or in the determination or calculation of the NAV of the Fund.
CIBC NTC has no obligation or liability in connection with the administration, marketing or trading of the Fund. CIBC NTC makes no warranty, express or implied, as to results to be obtained by the Adviser, the Fund, Fund shareholders or any other person or entity from the use of the Underlying Index or any data included therein. CIBC NTC makes no express or implied warranties, and expressly disclaims all warranties of merchantability or fitness for a particular purpose or use with respect to the Underlying Index or any data included therein. Without limiting any of the foregoing, in no event shall CIBC NTC have any liability for any special, punitive, indirect, or consequential damages (including lost profits) arising out of matters relating to the use of the Underlying Index, even if notified of the possibility of such damages.
All intellectual property rights in the Underlying Index vests in CIBC NTC.
42 | November 30, 2023
ALPS ETF Trust
| Additional Information | November 30, 2023 (Unaudited) |
The Underlying Index is the property of CIBC NTC, which has contracted with S&P Opco, LLC (a subsidiary of S&P Dow Jones Indices LLC) to calculate and maintain the Underlying Index. The Underlying Index is not sponsored by S&P Dow Jones Indices or its affiliates or its third party licensors (collectively, “S&P Dow Jones Indices”). S&P Dow Jones Indices will not be liable for any errors or omissions in calculating the Underlying Index. “Calculated by S&P Dow Jones Indices” and the related stylized mark(s) are service marks of S&P Dow Jones Indices and have been licensed for use by CIBC NTC. S&P® is a registered trademark of Standard & Poor’s Financial Services LLC (“SPFS”), and Dow Jones® is a registered trademark of Dow Jones Trademark Holdings LLC (“Dow Jones”).
The Fund is not sponsored, endorsed, sold or promoted by S&P Dow Jones Indices. S&P Dow Jones Indices does not make any representation or warranty, express or implied, to the owners of the Fund or any member of the public regarding the advisability of investing in securities generally or in the Fund particularly or the ability of the Underlying Index to track general market performance. S&P Dow Jones Indices’ only relationship to CIBC NTC with respect to the Underlying Index is the licensing of certain trademarks, service marks and trade names of S&P Dow Jones Indices, and the provision of the calculation services related to the Underlying Index. S&P Dow Jones Indices is not responsible for and has not participated in the determination of the prices and amount of the Fund or the timing of the issuance or sale of the Fund or in the determination or calculation of the equation by which the Fund may be converted into cash or other redemption mechanics. S&P Dow Jones Indices has no obligation or liability in connection with the administration, marketing or trading of the Fund. S&P Dow Jones Indices LLC is not an investment advisor. Inclusion of a security within the Underlying Index is not a recommendation by S&P Dow Jones Indices to buy, sell, or hold such security, nor is it investment advice.
S&P DOW JONES INDICES DOES NOT GUARANTEE THE ADEQUACY, ACCURACY, TIMELINESS AND/OR THE COMPLETENESS OF THE UNDERLYING INDEX OR ANY DATA RELATED THERETO OR ANY COMMUNICATION WITH RESPECT THERETO, INCLUDING, ORAL, WRITTEN, OR ELECTRONIC COMMUNICATIONS. S&P DOW JONES INDICES SHALL NOT BE SUBJECT TO ANY DAMAGES OR LIABILITY FOR ANY ERRORS, OMISSIONS, OR DELAYS THEREIN. S&P DOW JONES INDICES MAKES NO EXPRESS OR IMPLIED WARRANTIES, AND EXPRESSLY DISCLAIMS ALL WARRANTIES, OF MERCHANTABILITY OR FITNESS FOR A PARTICULAR PURPOSE OR USE OR AS TO RESULTS TO BE OBTAINED BY CIBC NTC, OWNERS OF THE FUND, OR ANY OTHER PERSON OR ENTITY FROM THE USE OF THE UNDERLYING INDEX OR WITH RESPECT TO ANY DATA RELATED THERETO. WITHOUT LIMITING ANY OF THE FOREGOING, IN NO EVENT WHATSOEVER SHALL S&P DOW JONES INDICES BE LIABLE FOR ANY INDIRECT, SPECIAL, INCIDENTAL, PUNITIVE, OR CONSEQUENTIAL DAMAGES, INCLUDING BUT NOT LIMITED TO, LOSS OF PROFITS, TRADING LOSSES, LOST TIME, OR GOODWILL, EVEN IF THEY HAVE BEEN ADVISED OF THE POSSIBILITY OF SUCH DAMAGES, WHETHER IN CONTRACT, TORT, STRICT LIABILITY, OR OTHERWISE.
The Index Provider is not affiliated with the Trust, the Adviser or ALPS Portfolio Solutions Distributor, Inc. (the “Distributor”). The Index Provider has entered into a license agreement with the Adviser (the “License Agreement”). The use of the Underlying Index by the Adviser and the Fund is subject to the terms of the License Agreement, which impose certain limitations and conditions on the Fund’s ability to use the Underlying Index.
The Adviser does not guarantee the accuracy and/or the completeness of the Underlying Index or any data included therein, and the Adviser shall have no liability for any errors, omissions or interruptions therein. The Adviser makes no warranty, express or implied, as to results to be obtained by the Fund, owners of the Shares of the Fund or any other person or entity from the use of the Underlying Index or any data included therein. The Adviser makes no express or implied warranties, and expressly disclaims all warranties of merchantability or fitness for a particular purpose or use with respect to the Underlying Index or any data included therein. Without limiting any of the foregoing, in no event shall the Adviser have any liability for any special, punitive, direct, indirect, or consequential damages (including lost profits) arising out of matters relating to the use of the Underlying Index, even if notified of the possibility of such damages.
ALPS Disruptive Technologies ETF
“Indxx” is a service mark of Indxx, LLC (“Indxx” or the “Index Provider”) and has been licensed for use for certain purposes by ALPS Advisors, Inc. (the “Adviser”).
The ALPS Disruptive Technologies ETF is not sponsored, endorsed, sold or promoted by Indxx. Indxx makes no representation or warranty, express or implied, to the owners of the ALPS Disruptive Technologies ETF or any member of the public regarding the advisability of investing in securities generally or in the ALPS Disruptive Technologies ETF particularly. Indxx has no obligation to take the needs of ALPS Advisors, Inc. or the shareholders of ALPS Disruptive Technologies ETF into consideration in determining, composing, or calculating the Underlying Index. Indxx is not responsible for and has not participated in the determination of the timing, amount or pricing of the ALPS Disruptive Technologies ETF shares to be issued or in the determination or calculation of the equation by which the ALPS Disruptive Technologies ETF is to be converted into cash. Indxx has no obligation or liability in connection with the administration, marketing or trading of the ALPS Disruptive Technologies ETF.
INDXX MAKES NO WARRANTY, EXPRESS OR IMPLIED, AS TO THE RESULTS TO BE OBTAINED BY ANY PERSON OR ENTITY FROM THE USE OF THE INDEX(ES), TRADING BASED ON THE INDEX(ES), OR ANY DATA INCLUDED THEREIN IN CONNECTION WITH THE PRODUCTS, OR FOR ANY OTHER USE. INDXX EXPRESSLY DISCLAIMS ALL WARRANTIES AND CONDITIONS, EXPRESS, STATUTORY, OR IMPLIED, EXCEPT AS SET FORTH IN THIS AGREEMENT. EXCEPT AS OTHERWISE SPECIFICALLY SET FORTH IN THIS AGREEMENT, INDXX HEREBY EXPRESSLY DISCLAIMS ALL IMPLIED WARRANTIES AND CONDITIONS OF MERCHANTABILITY, TITLE, OR FITNESS FOR A PARTICULAR PURPOSE OR USE WITH RESPECT TO THE INDEX(ES) OR ANY DATA
43 | November 30, 2023
ALPS ETF Trust
| Additional Information | November 30, 2023 (Unaudited) |
INCLUDED THEREIN. INDXX DOES NOT GUARANTEE THE ACCURACY AND/OR THE COMPLETENESS OF ANY DATA SUPPLIED BY IT OR ANY DATA INCLUDED THEREIN. INDXX MAKES NO WARRANTY, EXPRESS OR IMPLIED, AS TO RESULTS TO BE OBTAINED BY THE FUNDS, ITS SHAREHOLDERS OR AFFILIATES, OR ANY OTHER PERSON OR ENTITY FROM THE USE OF THE DATA SUPPLIED BY INDXX OR ANY DATA INCLUDED THEREIN. INDXX MAKES NO EXPRESS OR IMPLIED WARRANTIES, AND EXPRESSLY DISCLAIMS ALL WARRANTIES OF MERCHANTABILITY OR FITNESS FOR A PARTICULAR PURPOSE OR USE WITH RESPECT TO THE DATA SUPPLIED BY INDXX OR ANY DATA INCLUDED THEREIN. WITHOUT LIMITING ANY OF THE FOREGOING, IN NO EVENT SHALL INDXX HAVE ANY LIABILITY FOR ANY SPECIAL, PUNITIVE, INDIRECT, OR CONSEQUENTIAL DAMAGES (INCLUDING LOST PROFITS), EVEN IF NOTIFIED OF THE POSSIBILITY OF SUCH DAMAGES.
The Adviser does not guarantee the accuracy and/or the completeness of the Underlying Index or any data included therein, and the Adviser shall have no liability for any errors, omissions or interruptions therein. The Adviser makes no warranty, express or implied, as to results to be obtained by the Fund, owners of the Shares of the Fund or any other person or entity from the use of the Underlying Index or any data included therein. Adviser makes no express or implied warranties, and expressly disclaims all warranties of merchantability or fitness for a particular purpose or use with respect to the Underlying Index or any data included therein. Without limiting any of the foregoing, in no event shall the Adviser have any liability for any special, punitive, direct, indirect or consequential damages (including lost profits) arising out of matters relating to the use of the Underlying Index, even if notified of the possibility of such damages.
ALPS Global Travel Beneficiaries ETF
S-Network and S-Network Global Travel Index are service marks of S-Network Global Indexes, Inc. ("S-Network") and have been licensed for use by the ALPS Advisors, Inc. (“ALPS” or the “Adviser”). The Fund is not issued, sponsored, endorsed, sold or promoted by S-Network or its affiliates. S-Network makes no representation or warranty, express or implied, to the purchasers or owners of the Fund or any member of the public regarding the advisability of investing in securities generally or in the Fund particularly or the ability of the Index to track general market performance. S-Network's only relationship to the Fund is the licensing of the service marks and the Index, which is determined, composed and calculated by S-Network without regard to ALPS or the Fund. S-Network is not responsible for and has not participated in the determination of the timing of, prices at, or quantities of the Fund issued by ALPS. S-Network has no obligation or liability in connection with the issuance, administration, marketing or trading of the Fund.
S-NETWORK DOES NOT GUARANTEE THE ACCURACY AND/OR THE COMPLETENESS OF THE S-NETWORK GLOBAL TRAVEL INDEX OR ANY DATA INCLUDED THEREIN AND S-NETWORK SHALL HAVE NO LIABILITY FOR ANY ERRORS, OMISSIONS, OR INTERRUPTIONS THEREIN. S-NETWORK MAKES NO WARRANTY, EXPRESS OR IMPLIED, AS TO RESULTS TO BE OBTAINED BY LICENSEE, OWNERS OF THE FUND, OR ANY OTHER PERSON OR ENTITY FROM THE USE OF THE S-NETWORK GLOBAL TRAVEL INDEX OR ANY DATA INCLUDED THEREIN. S-NETWORK MAKES NO EXPRESS OR IMPLIED WARRANTIES, AND EXPRESSLY DISCLAIMS ALL WARRANTIES OF MERCHANTABILITY OR FITNESS FOR A PARTICULAR PURPOSE OR USE WITH RESPECT TO THE S-NETWORK GLOBAL TRAVEL INDEX OR ANY DATA INCLUDED THEREIN. WITHOUT LIMITING ANY OF THE FOREGOING, UNLESS ARISING AS A RESULT OF S-NETWORK'S (i) GROSS NEGLIGENCE OR WILLFUL MISCONDUCT, (ii) BREACH OF ITS CONFIDENTIALITY OBLIGATIONS: OR (iii) INDEMNIFICATION OBLIGATIONS, S-NETWORK SHALL NOT HAVE ANY LIABILITY FOR ANY SPECIAL, PUNITIVE, INDIRECT, OR CONSEQUENTIAL DAMAGES (INCLUDING LOST PROFITS), EVEN IF NOTIFIED OF THE POSSIBILITY OF SUCH DAMAGES.
The Adviser does not guarantee the accuracy and/or the completeness of the Underlying Index or any data included therein, and the Adviser shall have no liability for any errors, omissions or interruptions therein. The Adviser makes no warranty, express or implied, as to results to be obtained by the Fund, owners of the Shares of the Fund or any other person or entity from the use of the Underlying Index or any data included therein. The Adviser makes no express or implied warranties, and expressly disclaims all warranties of merchantability or fitness for a particular purpose or use with respect to the Underlying Index or any data included therein. Without limiting any of the foregoing, in no event shall the Adviser have any liability for any special, punitive, direct, indirect or consequential damages (including lost profits) arising out of matters relating to the use of the Underlying Index even if notified of the possibility of such damages.
ALPS Medical Breakthroughs ETF
The Fund is not sponsored, endorsed, sold or promoted by S-Network Global Indexes, Inc. (“Licensor”). Licensor makes no representation or warranty, express or implied, to the owners of the Fund or any member of the public regarding the advisability of investing in securities generally or in the Fund particularly or the ability of the Underlying Index to track the performance of the physical commodities market. Licensor’s only relationship to the Licensee is the licensing of certain service marks and trade names of Licensor and of the Underlying Index that is determined, composed and calculated by Licensor without regard to the Licensee or the Fund. Licensor has no obligation to take the needs of the Licensee or the owners of the Fund into consideration in determining, composing or calculating the Underlying Index. Licensor is not responsible for and has not participated in the determination of the timing of, prices at, or quantities of the Fund to be issued or in the determination or calculation of the equation by which the Fund is to be converted into cash. Licensor has no obligation or liability in connection with the administration, marketing or trading of the Fund.
44 | November 30, 2023
ALPS ETF Trust
| Additional Information | November 30, 2023 (Unaudited) |
LICENSOR DOES NOT GUARANTEE THE ACCURACY AND/OR THE COMPLETENESS OF THE UNDERLYING INDEX OR ANY DATA INCLUDED THEREIN AND LICENSOR SHALL HAVE NO LIABILITY FOR ANY ERRORS, OMISSIONS, OR INTERRUPTIONS THEREIN. LICENSOR MAKES NO WARRANTY, EXPRESS OR IMPLIED, AS TO RESULTS TO BE OBTAINED BY LICENSEE, OWNERS OF THE FUND, OR ANY OTHER PERSON OR ENTITY FROM THE USE OF THE UNDERLYING INDEX OR ANY DATA INCLUDED THEREIN. LICENSOR MAKES NO EXPRESS OR IMPLIED WARRANTIES, AND EXPRESSLY DISCLAIMS ALL WARRANTIES OF MERCHANTABILITY OR FITNESS FOR A PARTICULAR PURPOSE OR USE WITH RESPECT TO THE UNDERLYING INDEX OR ANY DATA INCLUDED THEREIN. WITHOUT LIMITING ANY OF THE FOREGOING, IN NO EVENT SHALL LICENSOR HAVE ANY LIABILITY FOR ANY SPECIAL, PUNITIVE, INDIRECT, OR CONSEQUENTIAL DAMAGES (INCLUDING LOST PROFITS), EVEN IF NOTIFIED OF THE POSSIBILITY OF SUCH DAMAGES.
Standard & Poor’s Custom Indexes serves as calculation agent for the Index. The Fund is not sponsored, endorsed, sold or promoted by Standard & Poor’s, a division of The McGraw-Hill Companies, Inc. (“S&P”) or its third party licensors. Neither S&P nor its third party licensors make any representation or warranty, express or implied, to the owners of the Fund or any member of the public regarding the advisability of investing in securities generally or in the Fund particularly or the ability of the Underlying Index to track general stock market performance. S&P’s and its third party licensor’s only relationship to S-Network Global Indexes, Inc. is the licensing of certain trademarks, service marks and trade names of S&P and/or its third party licensors and for the providing of calculation and maintenance services related to the Underlying Index. Neither S&P nor its third party licensors is responsible for and has not participated in the determination of the prices and amount of the Fund or the timing of the issuance or sale of the Fund or in the determination or calculation of the equation by which the Fund is to be converted into cash. S&P has no obligation or liability in connection with the administration, marketing or trading of the Fund.
NEITHER S&P, ITS AFFILIATES NOR THEIR THIRD PARTY LICENSORS GUARANTEE THE ADEQUACY, ACCURACY, TIMELINESS OR COMPLETENESS OF THE UNDERLYING INDEX OR ANY DATA INCLUDED THEREIN OR ANY COMMUNICATIONS, INCLUDING BUT NOT LIMITED TO, ORAL OR WRITTEN COMMUNICATIONS (INCLUDING ELECTRONIC COMMUNICATIONS) WITH RESPECT THERETO. S&P, ITS AFFILIATES AND THEIR THIRD PARTY LICENSORS SHALL NOT BE SUBJECT TO ANY DAMAGES OR LIABILITY FOR ANY ERRORS, OMISSIONS OR DELAYS THEREIN. S&P MAKES NO EXPRESS OR IMPLIED WARRANTIES, AND EXPRESSLY DISCLAIMS ALL WARRANTIES OF MERCHANTABILITY OR FITNESS FOR A PARTICULAR PURPOSE OR USE WITH RESPECT TO ITS TRADEMARKS, THE UNDERLYING INDEX OR ANY DATA INCLUDED THEREIN. WITHOUT LIMITING ANY OF THE FOREGOING, IN NO EVENT WHATSOEVER SHALL S&P, ITS AFFILIATES OR THEIR THIRD PARTY LICENSORS BE LIABLE FOR ANY INDIRECT, SPECIAL, INCIDENTAL, PUNITIVE OR CONSEQUENTIAL DAMAGES, INCLUDING BUT NOT LIMITED TO, LOSS OF PROFITS, TRADING LOSSES, LOST TIME OR GOODWILL, EVEN IF THEY HAVE BEEN ADVISED OF THE POSSIBILITY OF SUCH DAMAGES, WHETHER IN CONTRACT, TORT, STRICT LIABILITY OR OTHERWISE.
Standard & Poor’s®, and S&P® are registered trademarks of The McGraw-Hill Companies, Inc.; “Calculated by S&P Custom Indices” and its related stylized mark are service marks of The McGraw-Hill Companies, Inc. These marks have been licensed for use by S-Network Global Indexes, Inc.
The Adviser does not guarantee the accuracy and/or the completeness of the Underlying Index or any data included therein, and the Adviser shall have no liability for any errors, omissions or interruptions therein. The Adviser makes no warranty, express or implied, as to results to be obtained by the Fund, owners of the Shares of the Fund or any other person or entity from the use of the Underlying Index or any data included therein. The Adviser makes no express or implied warranties, and expressly disclaims all warranties of merchantability or fitness for a particular purpose or use with respect to the Underlying Index or any data included therein. Without limiting any of the foregoing, in no event shall the Adviser have any liability for any special, punitive, direct, indirect, or consequential damages (including lost profits) arising out of matters relating to the use of the Underlying Index, even if notified of the possibility of such damages.
45 | November 30, 2023
ALPS ETF Trust
| Board Considerations Regarding Approval of | November 30, 2023 (Unaudited) |
| Investment Advisory Agreement | |
At its meetings held on June 5, 2023 and June 20, 2023, the Board of Trustees of the Trust (the “Board” or the “Trustees”), where each Trustee is not an "interested person" of the Trust within the meaning of the Investment Company Act of 1940, as amended (the “Independent Trustees”), evaluated a proposal to approve the continuance of the Investment Advisory Agreement between the Trust and ALPS Advisors, Inc. (the “Adviser” or “AAI”) with respect to the ALPS Clean Energy ETF ("ACES"), ALPS Disruptive Technologies ETF ("DTEC"), ALPS Medical Breakthroughs ETF ("SBIO") and ALPS Global Travel Beneficiaries ETF ("JRNY") (each a “Fund” and collectively the "Funds”). In evaluating the renewal of the Investment Advisory Agreement with respect to each Fund, the Board, including the Independent Trustees, considered various factors, including (i) the nature, extent and quality of the services provided by AAI with respect to the applicable Fund under the Investment Advisory Agreement; (ii) the advisory fees and other expenses paid by the Fund compared to those of similar funds managed by other investment advisers; (iii) the costs of the services provided to the Fund by AAI and the profits realized by AAI and its affiliates from its relationship to the Fund; (iv) the extent to which economies of scale have been or would be realized if and as the assets of the Fund grow and whether fees reflect the economies of scale for the benefit of shareholders; and (v) any additional benefits and other considerations.
With respect to the nature, extent and quality of the services provided by AAI under the Investment Advisory Agreement, the Board considered and reviewed information concerning the services provided under the Investment Advisory Agreement, the investment parameters of the index of each Fund, financial information regarding AAI and its parent company, information describing AAI’s current organization and the background and experience of the persons responsible for the day-to-day management of the Funds.
The Board reviewed information on the performance of each Fund and its applicable benchmark for the 1-, 3-, and 5-year periods, as applicable. The Board also evaluated the correlation and tracking error between each underlying index and its corresponding Fund’s performance. Based on this review, the Board, including the Independent Trustees, found that the nature and extent of services provided to each Fund under the Investment Advisory Agreement was appropriate and that the quality of such services was satisfactory.
The Board noted that the advisory fees for each Fund were unitary fees pursuant to which AAI assumes all expenses of the Funds (including the cost of transfer agency, custody, fund administration, legal, audit and other services) other than the payments under the Advisory Agreement, brokerage expenses, taxes, interest, litigation expenses and other extraordinary expenses.
Based on the information available to them, including the Fund-specific summaries set forth below, the Board, including the Independent Trustees, concluded that the advisory fee rate for each of the Funds was reasonable under the circumstances and in light of the quality of the services provided.
The Board, including the Independent Trustees, considered other benefits available to AAI because of its relationship with the Funds and concluded that the advisory fees were reasonable taking into account any such benefits.
The Board, including the Independent Trustees, also considered with respect to each Fund the information provided by AAI about the costs and profitability of AAI with respect to each of the Funds, including the asset levels and other factors that influence the profitability and financial viability of the Funds. The Board, including the Independent Trustees, reviewed and noted the relatively small sizes of the Funds (other than ACES) and the analysis AAI had conducted to support AAI’s assertion that it was not realizing any economies of scale with respect to such Funds. The Independent Trustees determined that AAI should continue to keep the Board informed on an ongoing basis of any significant developments (e.g., material increases in asset levels) so as to facilitate the Independent Trustees’ evaluation of whether further economies of scale have been achieved.
The Board, including the Independent Trustees, also considered other potential benefits available to AAI because of its relationship with the Funds, known as fall-out benefits.
46 | November 30, 2023
ALPS ETF Trust
| Board Considerations Regarding Approval of | November 30, 2023 (Unaudited) |
| Investment Advisory Agreement | |
With respect to each Fund, the Board, including the Independent Trustees, noted the following:
The gross management fee rate for ACES is higher than the median of its FUSE expense group. ACES’ net expense ratio is lower than the median of its FUSE expense group.
With respect to AAI profitability from ACES, the Independent Trustees noted that current profitability levels were not unreasonable.
The gross management fee rate for DTEC is approximately equal to the median of its FUSE expense group. DTEC’s net expense ratio is approximately equal to the median of its FUSE expense group.
The Board, including the Independent Trustees, reviewed and noted the relatively small size of DTEC and the analysis AAI had conducted to support AAI’s assertion that it was not realizing any economies of scale with respect to DTEC.
The gross management fee rate for SBIO is lower than the median of its FUSE expense group. SBIO’s net expense ratio is lower than the median of its FUSE expense group.
The Board, including the Independent Trustees, reviewed and noted the relatively small size of SBIO and the analysis AAI had conducted to support AAI’s assertion that it was not realizing any economies of scale with respect to SBIO.
The gross management fee rate for JRNY is higher than the median of its FUSE expense group. JRNY’s net expense ratio is slightly above the median of its FUSE expense group.
The Board, including the Independent Trustees, reviewed and noted the relatively small size of JRNY and the analysis AAI had conducted to support AAI’s assertion that it was not realizing any economies of scale with respect to JRNY.
In voting to renew the Investment Advisory Agreement with AAI, the Board, including the Independent Trustees, concluded that the terms of the Investment Advisory Agreement are reasonable and fair in light of the services to be performed, the fees paid by certain other funds, expenses to be incurred and such other matters as the members of the Board, including the Independent Trustees, considered relevant in the exercise of their reasonable business judgment. The Independent Trustees did not identify any single factor or group of factors as all important or controlling and considered all factors together.
47 | November 30, 2023
ALPS ETF Trust
| Trustees & Officers | November 30, 2023 (Unaudited) |
The general supervision of the duties performed by the Adviser for the Fund under the Investment Advisory Agreement is the responsibility of the Board of Trustees. The Trust currently has four Trustees, each of whom have no affiliation or business connection with the Adviser or any of its affiliated persons and do not own any stock or other securities issued by the Adviser. These are the “non-interested” or “independent” Trustees (“Independent Trustees”).
The Independent Trustees of the Trust, their term of office and length of time served, their principal business occupations during the past five years, the number of portfolios in the Fund Complex overseen by each Independent Trustee, and other directorships, if any, held by the Trustee are shown below.
INDEPENDENT TRUSTEES
Name, Address and Year of Birth of Officer* | Position(s) Held with Trust | Length of Time Served** | Principal Occupation(s) During Past 5 Years | Number of Portfolios in Fund Complex Overseen by Trustees*** | Other Directorships Held by Trustees |
Mary K. Anstine, 1940 | Trustee | Since March 2008 | Ms. Anstine is Trustee/Director of AV Hunter Trust and Colorado Uplift Board. | 38 | Ms. Anstine is a Trustee of ALPS Variable Investment Trust (7 funds); Financial Investors Trust (29 funds); and Reaves Utility Income Fund. |
Jeremy W. Deems, 1976 | Trustee | Since March 2008 | Mr. Deems is the Co-Founder and Chief Financial Officer of Green Alpha Advisors, LLC, a registered investment advisor, and Co-Portfolio Manager of the AXS Green Alpha ETF. | 38 | Mr. Deems is a Trustee of ALPS Variable Investment Trust (7 funds); Financial Investors Trust (29 funds); and Reaves Utility Income Fund; and Clough Funds Trust (1 fund). |
Rick A. Pederson, 1952 | Trustee | Since March 2008 | Mr. Pederson is Partner, Bow River Capital Partners (private equity management), 2003 - present; Board Member, Prosci Inc. (private business services) 2013-2016; Advisory Board Member, Citywide Banks (Colorado community bank) 2014- 2017; Board Member, Strong-Bridge Consulting, 2015- 2019; Board Member, IRI/ODMS Holdings LLC, 2017 – 2019; Director, National Western Stock Show (not for profit) 2010 - present; Director, History Colorado (not for profit) 2015- present; Director, Citywide Bank Advisory Board 2017-present; Trustee, Boettcher Foundation, 2018 -present. | 24 | Mr. Pederson is Trustee of Segall Bryant & Hamill Trust (14 funds) and Principal Real Estate Income Fund (1 fund). |
| * | The business address of the Trustee is c/o ALPS Advisors, Inc., 1290 Broadway, Suite 1000, Denver, Colorado 80203. |
| ** | This is the period for which the Trustee began serving the Trust. Each Trustee serves an indefinite term, until his or her successor is elected. |
| *** | The Fund Complex includes all series of the Trust and any other investment companies for which ALPS Advisors, Inc. provides investment advisory services. |
48 | November 30, 2023
ALPS ETF Trust
| Trustees & Officers | November 30, 2023 (Unaudited) |
Name, Address and Year of Birth of Officer* | Position(s) Held with Trust | Length of Time Served** | Principal Occupation(s) During Past 5 Years | Number of Portfolios in Fund Complex Overseen by Trustees*** | Other Directorships Held by Trustees |
Edmund J. Burke, 1961 | Trustee | Since December 2017 | Mr. Burke joined ALPS in 1991 and served as the President and Director of ALPS Holdings, Inc., and ALPS Advisors, Inc., and Director of ALPS Distributors, Inc., ALPS Fund Services, Inc. (“ALPS”), and ALPS Portfolio Solutions Distributor, Inc. (collectively, the “ALPS Companies”). Mr. Burke retired from the ALPS Companies in June 2019. Mr. Burke is currently a partner at ETF Action, a web-based system that provides data and analytics to registered investment advisers, (since 2020) and a Director of Alliance Bioenergy Plus, Inc., a technology company focused on emerging technologies in the renewable energy, biofuels, and bioplastics technology sectors (since 2020). | 33 | Mr. Burke is a Trustee of Clough Global Dividend and Income Fund (1 fund); Clough Global Equity Fund (1 fund); Clough Global Opportunities Fund (1 fund); Clough Funds Trust (1 fund); Liberty All-Star Equity Fund (1 fund); Director of the Liberty All-Star Growth Fund, Inc. (1 fund) and Financial Investors Trust (29 funds). |
| * | The business address of the Trustee is c/o ALPS Advisors, Inc., 1290 Broadway, Suite 1000, Denver, Colorado 80203. |
| ** | This is the period for which the Trustee began serving the Trust. Each Trustee serves an indefinite term, until his or her successor is elected. |
| *** | The Fund Complex includes all series of the Trust and any other investment companies for which ALPS Advisors, Inc. provides investment advisory services. |
49 | November 30, 2023
ALPS ETF Trust
| Trustees & Officers | November 30, 2023 (Unaudited) |
OFFICERS:
Name, Address and Year of Birth of Officer* | Position(s) Held with Trust | Length of Time Served** | Principal Occupation(s) During Past 5 Years |
Laton Spahr, 1975 | President | Since June 2021 | Mr. Spahr joined ALPS in 2019 and currently serves as President and Portfolio Manager of AAI. Prior to his current role, Mr. Spahr was a Senior Vice President and Strategy Leader of the Value & Income Team for Oppenheimer Funds from 2013 to 2019. |
Matthew Sutula, 1985 | Chief Compliance Officer (“CCO”) | Since December 2019 | Mr. Sutula joined ALPS in 2012 and currently serves as Chief Compliance Officer of AAI. Prior to his current role, Mr. Sutula served as interim Compliance Officer of the Trust (September 2019 to December 2019). Compliance Manager and Senior Compliance Analyst for AAI, as well as Compliance Analyst for AFS. Prior to joining ALPS, he spent seven years at Morningstar, Inc. in various analyst roles supporting the registered investment company databases. Mr. Sutula is also Chief Compliance Officer of Principal Real Estate Income Fund, ALPS Variable Investment Trust, Liberty All-Star Equity Fund and Liberty All-Star Growth Fund, Inc. From September 2019 to September 2022 he served as Chief Compliance Officer of RiverNorth Opportunities Fund, Inc. |
Erich Rettinger, 1985 | Treasurer | Since September 2023 | Mr. Rettinger is Vice President of AAI (since 2021) and serves as Treasurer of Principal Real Estate Income Fund, Liberty All-Star Equity Fund, LibertyAll-Star Growth Fund, Inc., and ALPS Variable Investment Trust. From December 2021 to October 2022 he also served as Treasurer of RiverNorth Opportunities Fund, Inc. Because of his position with AAI, Mr. Rettinger is deemed an affiliate of the Fund as defined under the 1940 Act. From 2013-2021, he served as Vice President and Fund Controller of ALPS Fund Services. |
Michael P. Lawlor, 1969 | Secretary | Since December 2022 | Mr. Lawlor joined ALPS in January 2022, and is currently Vice President and Principal Legal Counsel. Prior to joining ALPS, Mr. Lawlor was Lead Fund Counsel at Brighthouse Financial (insurance company) (January 2007-April 2021). Mr. Lawlor also serves as Secretary of Financial Investors Trust and ALPS Variable Investment Trust. |
Susan M. Cannon, 1974 | Assistant Secretary | Since May 2023 | Ms. Cannon joined ALPS in September 2022, and is currently a Senior Paralegal of ALPS Fund Services, Inc. Prior to joining ALPS, Ms. Cannon worked for World Premier Private Partnership, Brown Brothers Harriman & Co. |
| * | The business address of each Officer is c/o ALPS Advisors, Inc., 1290 Broadway, Suite 1000, Denver, Colorado 80203. Each Officer is deemed an affiliate of the Trust as defined under the 1940 Act. |
| ** | This is the period for which the Officer began serving the Trust. Each Officer serves an indefinite term, until his or her successor is elected. |
The Statement of Additional Information includes additional information about the Fund’s Trustees and is available, without charge, upon request by calling (toll-free) 1-866-759-5679.
50 | November 30, 2023
Intentionally Left Blank


Table of Contents
| Performance Overview | 1 |
| Disclosure of Fund Expenses | 13 |
| Report of Independent Registered Public Accounting Firm | 14 |
| Financial Statements | |
| Schedule of Investments | 15 |
| Statements of Assets and Liabilities | 21 |
| Statements of Operations | 22 |
| Statements of Changes in Net Assets | 23 |
| Financial Highlights | 27 |
| Notes to Financial Statements | 31 |
| Additional Information | 40 |
| Board Considerations Regarding Approval of Investment Advisory Agreement | 42 |
| Trustees and Officers | 44 |
alpsfunds.com
ALPS Sector Dividend Dogs ETF
| Performance Overview | November 30, 2023 (Unaudited) |
Investment Objective
The ALPS Sector Dividend Dogs ETF (the “Fund” or “SDOG”) seeks investment results that replicate as closely as possible, before fees and expenses, the performance of the S-Network® Sector Dividend Dogs Index (the “Underlying Index”).
The Underlying Index is a rules based index intended to give investors a means of tracking the overall performance of the highest dividend paying stocks (i.e. “Dividend Dogs”) in the S-Network US Equity WR Large-Cap 500 Index (the “S-Net 500”) on a sector-by-sector basis. “Dividend Dogs” refers to the five stocks in each of the Global Industry Classification Standard (“GICS”) sectors, excluding the Real Estate sector, that make up the S-Net 500 which offer the highest dividend yields.
Performance Overview
The Fund, for the twelve-month period ended November 30, 2023, generated a total return of -5.07%, largely in-line with the Fund’s Underlying Index, net of fees, which returned -4.91%. The fund underperformed the S&P 500® Index, which returned 13.84% for the same period.
The trailing twelve-month (TTM) yield for the Fund’s underlying constituents as of November 30, 2023 was 4.37% vs. 1.43% for the S&P 500® Index.
The S&P 500® Index returned 13.84% for the TTM period that ended November 30, 2023, as the fiscal year 2023 saw markets rebound from 2022 lows. The Federal Reserve Bank continued its path of quantitative tightening in 2023 to combat inflation, reaching their target of peak rates with expectations of rate cuts into 2024 as Consumer Price Index (CPI), energy prices and yields trended towards more acceptable levels. US markets rallied substantially off the secondary effects of the Fed’s actions leading to better odds of a soft landing, with expectations of rate cuts driving growth and equity multiples higher into the next year. Main macroeconomic talking points throughout 2023 centered on the path of future interest rates driven by monetary policy, and inflation trending towards the Fed’s 2% inflation target. Inflation significantly declined throughout 2023, with November 2023 numbers showing year-over-year CPI around 3.1%. Despite persistent recession calls, a gradual reduction in interest rates is likely to lead to an earnings recovery in the US, easing financial conditions for both US and global equities. With the recent recovery in sentiment and price for US markets, the S&P 500® Index Price-to-Earnings (P/E) ratio of 22.2x is slightly above its 10-year average of 20.6x. Looking forward, ALPS Advisors believes markets are likely be data-dependent on job growth, CPI, spending and manufacturing data to justify the recent recovery in valuations.
Compared to the S&P 500® Index, the Fund saw a negative impact from security selection (-13.20%) and asset allocation (-5.59%), leading to a 18.87% underperformance relative to the S&P 500® Index. The asset allocation underperformance was largely driven by relative under-weightings to Information Technology, while the security selection underperformance was mainly attributed to SDOG’s selection of high-yielding value securities across all sectors (excluding Real Estate) that lagged core and growth year-to-date. The Fund’s Information Technology, Industrials, and Energy sectors led in terms of contribution to overall return over the TTM period.
The best performing stocks in the Fund for the period were Seagate Technology Holdings (STX), which increased 56.48%, Intel Corp. (INTC), which saw a gain of 52.18%, and Phillips 66 (PSX), rising 33.28%. The largest detractors for the Fund for the period were Organon & Co. (OGN), which decreased 56.13%, Walgreens Boots Alliance Inc. (WBA), which fell 48.49%, and VF Corp. (VFC), which lost 45.75%.
Looking ahead, the Fund’s strategy of annually selecting the five highest-yielding securities in each of the ten sectors (excluding Real Estate) in the S&P 500® Index is intended to provide meaningfully higher yield relative to the S&P 500® Index, the potential for market participation in all economic cycles through equal sector weighting, and a deep value portfolio of securities as identified through high yield relative to sector peers.
1 | November 30, 2023
ALPS Sector Dividend Dogs ETF
| Performance Overview | November 30, 2023 (Unaudited) |
Performance (as of November 30, 2023)
| 1 Year | 5 Year | 10 Years | Since
Inception^ |
| ALPS Sector Dividend Dogs ETF – NAV | -5.07% | 6.07% | 7.68% | 10.03% |
| ALPS Sector Dividend Dogs ETF – Market Price* | -5.09% | 6.08% | 7.67% | 10.03% |
| S-Network® Sector Dividend Dogs Index | -4.91% | 6.45% | 8.13% | 10.50% |
| S&P 500® Index | 13.84% | 12.51% | 11.82% | 13.34% |
Total Expense Ratio (per the current prospectus) 0.36%.
Performance data quoted represents past performance. Past performance does not guarantee future results. Total return figures assume reinvestment of dividends and capital gains distributions, if any. The table does not reflect the deduction of taxes that a shareholder would pay on Fund distributions or the redemption of Fund shares. Investment return and principal value of an investment will fluctuate so that an investor’s shares, when sold or redeemed, may be worth more or less than the original cost. Current performance data may be higher or lower than actual data quoted. For the most current month-end performance data please visit www.alpsfunds.com or call 1.866.675.2639.
Net Asset Value (NAV) is an exchange-traded fund’s per-share value. The per-share dollar amount of the Fund is derived by dividing the total value of all the securities in its portfolio, less any liabilities, by the number of Fund shares outstanding. Market Price is the price at which a share can currently be traded in the market. Information detailing the number of days the Market Price of the Fund was greater than the Fund’s NAV and the number of days it was less than the Fund’s NAV can be obtained at www.alpsfunds.com.
| | ^ | The Fund Commencement Date was June 29, 2012. |
| * | Market Price means the official closing price of a share or, if it more accurately reflects the market value of a share at the time as of which the Fund calculates current net asset value per share, the price that is the midpoint of the bid-ask spread as of that time. It does not represent the returns an investor would receive if shares were traded at other times. |
The S-Network® Sector Dividend Dogs Index is designed to serve as a fair, impartial and transparent measure of the performance of US large cap equities with above average dividend yields. The Underlying Index is a portfolio of fifty stocks derived from the S-Network US Equity WR Large-Cap 500 Index ("S-Net 500"). The index is reported on a total return basis, which assumes reinvestment of any dividends and distributions realized during a given time period.
The S&P 500® Index is an index of 500 stocks chosen for market size, liquidity and industry grouping among other factors. Total return assumes reinvestment of any dividends and distributions realized during a given time period.
The indexes are not actively managed and do not reflect any deductions for fees, expenses or taxes. One cannot invest directly in an index. Index performance does not reflect fund performance.
The Fund’s shares are not individually redeemable. Investors buy and sell shares of the Fund on a secondary market. Only market makers or “authorized participants” may trade directly with the Fund, typically in blocks of 25,000 shares.
The ALPS Sector Dividend Dogs ETF is not suitable for all investors. Investments in the Fund are subject to investment risks, including possible loss of the principal amount invested.
ALPS Portfolio Solutions Distributor, Inc., a FINRA member, is the distributor for the ETF.
2 | November 30, 2023
ALPS Sector Dividend Dogs ETF
| Performance Overview | November 30, 2023 (Unaudited) |
Top 10 Holdings* (as of November 30, 2023)
| Seagate Technology Holdings PLC | 2.45 % |
| Intel Corp. | 2.38 % |
| AT&T, Inc. | 2.33 % |
| Verizon Communications, Inc. | 2.32 % |
| Citigroup, Inc. | 2.30 % |
| Fastenal Co. | 2.22 % |
| Williams Cos., Inc. | 2.20 % |
| Truist Financial Corp. | 2.18 % |
| International Business Machines Corp. | 2.17 % |
| International Paper Co. | 2.16 % |
| Total % of Top 10 Holdings | 22.71 % |
Future holdings are subject to change.
Sector Allocation* (as of November 30, 2023)
| Information Technology | 10.83 | % |
| Communication Services | 10.79 | % |
| Financials | 10.36 | % |
| Energy | 10.31 | % |
| Materials | 10.21 | % |
| Industrials | 10.17 | % |
| Utilities | 10.02 | % |
| Consumer Staples | 9.89 | % |
| Health Care | 8.99 | % |
| Consumer Discretionary | 8.26 | % |
| Money Market Fund | 0.17 | % |
| Total | 100.00 | % |
Growth of $10,000 (as of November 30, 2023)
Comparison of Change in Value of $10,000 Investment in the Fund and the Indexes
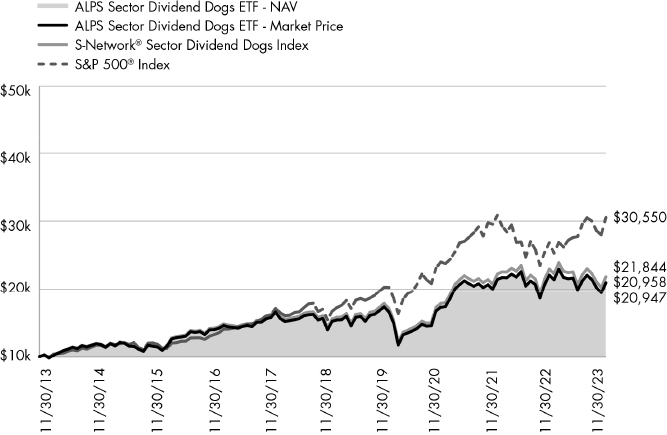
The chart above compares historical performance of a hypothetical investment of $10,000 in the Fund over the past ten years with the performance of the Fund’s benchmark index. Results include the reinvestment of all dividends and capital gains distributions. Past performance does not guarantee future results. The chart does not reflect the deduction of taxes that a shareholder would pay on Fund distributions or the redemption of Fund shares.
3 | November 30, 2023
ALPS International Sector Dividend Dogs ETF
| Performance Overview | November 30, 2023 (Unaudited) |
Investment Objective
The ALPS International Sector Dividend Dogs ETF (the “Fund” or “IDOG”) seeks investment results that replicate as closely as possible, before fees and expenses, the performance of the S-Network® International Sector Dividend Dogs Index (the “Underlying Index”).
The Underlying Index is a rules-based index intended to give investors a means of tracking the overall performance of the highest dividend paying stocks (i.e. “Dividend Dogs”) in the S-Network® Developed International Equity 1000 Index, a universe of mainly large capitalization stocks in international developed markets not located in the Americas (the “S-Net Developed Markets”) on a sector-by-sector basis. “Dividend Dogs” refers to the five stocks in each of the Global Industry Classification Standard (“GICS”) sectors, excluding the Real Estate sector, that make up the S-Net Developed Markets which offer the highest dividend yields.
Performance Overview
The Fund, for the trailing twelve-month period ended November 30, 2023, generated a total return of 16.71%, relatively in-line with the Fund’s Underlying Index, net of fees, which returned 17.21%. The Fund outperformed the Morningstar Developed Markets ex-North America Index (MSDINUS), which returned 11.87% for the same period.
The trailing twelve-month yield for the Fund’s constituents as of November 30, 2023 was 4.76%, compared to the MSDINUS Index yield of 3.17%.
Developed Markets (ex-U.S.), as represented by the MSDINUS Index, returned 11.87% for the trailing twelve-month period ended November 30, 2023 compared to the S&P 500® Index return of 13.84%, as the fiscal year 2023 saw global markets rebound from the 2022 lows. The European Central Bank and the Federal Reserve continued on their path of quantitative tightening in 2023 to combat inflation, with most international developed countries nearing or reaching peak interest rate levels. Inflationary pressures including energy prices fell sharply for most of the developed world, driving prices and equity multiples higher as fears of substantially lower growth abated. Main macroeconomic talking points throughout 2023 centered on the path of future interest rates driven by monetary policy, and inflation trending towards the European Central Bank's (ECB) and Fed’s 2% inflation target. Despite the persistent recession calls in 2023, developed ex-US stocks have shown signs of resiliency, with real GDP so far surprising to the upside in Q3. The latest economic data displays Real GDP year-over-year rising to 5.2% in the US and 2.4% for Developed Economies. While the recent recovery in sentiment and returns has caused ex-US stocks to rally, the MSDINUS Index Price-to-Earnings (P/E) ratio of 13.34x remains below its 10-year average. Looking forward, ALPS Advisors believes markets are likely be data-dependent on job growth, Consumer Price Index (CPI), spending and manufacturing data to justify the recent recovery in valuations.
Compared to the MSDINUS Index, the Fund saw a positive impact from security selection and an insignificant impact from asset allocation, leading to 4.82% outperformance over the Index. The asset allocation saw positive contributions from a relative underweight position to Health Care and Real Estate and overweights to Information Technology and Utilities. The security selection outperformance was mainly attributed to IDOG’s selection of high-yielding value securities across all sectors (excluding Real Estate) that far outperformed core and growth across international developed markets year-to-date.
From a geographical perspective, the highest contribution to return was attributed to holdings based in Japan, while the Fund’s ALPS Advisors believes performance was adversely impacted by holdings based in Israel.
The best-performing stocks for the trailing twelve-month period were NEC Corp. (6701 JP), which increased 64.25%, Koninklijke Philips NV (PHIA NA), which returned 58.25%, and Sage Group Plc. (SGE LN), which gained 56.27%. The worst performing stocks for the trailing twelve-month period were ICL Group Ltd. (ICL IT), losing 28.70%, South32 Ltd. (S32 AU), falling 23.02%; and Ericsson LM-B (ERICB SS), which decreased 14.94%.
Looking ahead, the Fund’s strategy of annually selecting the five highest-yielding securities in each of the ten sectors in the S-Network Developed Markets (Ex N.A.) Index is intended to provide a high yield relative to the MSDINUS Index, the potential for market participation in all economic cycles through equal sector weighting, and a deep value portfolio of securities as identified through high yield relative to their sector peers.
4 | November 30, 2023
ALPS International Sector Dividend Dogs ETF
| Performance Overview | November 30, 2023 (Unaudited) |
Performance (as of November 30, 2023)
| | 1 Year | 5 Year | 10 Year | Since Inception^ |
| ALPS International Sector Dividend Dogs ETF – NAV | 16.71% | 7.41% | 4.11% | 5.58% |
| ALPS International Sector Dividend Dogs ETF – Market Price* | 16.40% | 7.45% | 4.09% | 5.61% |
| S-Network® International Sector Dividend Dogs Index | 17.21% | 7.83% | 4.51% | 5.98% |
| Morningstar® Developed Markets ex-North America Index | 11.87% | 5.65% | 3.86% | 5.22% |
Total Expense Ratio (per the current prospectus) 0.50%.
Performance data quoted represents past performance. Past performance does not guarantee future results. Total return figures assume reinvestment of dividends and capital gains distributions, if any. The table does not reflect the deduction of taxes that a shareholder would pay on Fund distributions or the redemption of Fund shares. Investment return and principal value of an investment will fluctuate so that an investor’s shares, when sold or redeemed, may be worth more or less than the original cost. Current performance data may be higher or lower than actual data quoted. For the most current month-end performance data please visit www.alpsfunds.com or call 1.866.675.2639.
Net Asset Value (NAV) is an exchange-traded fund’s per-share value. The per-share dollar amount of the Fund is derived by dividing the total value of all the securities in its portfolio, less any liabilities, by the number of Fund shares outstanding. Market Price is the price at which a share can currently be traded in the market. Information detailing the number of days the Market Price of the Fund was greater than the Fund’s NAV and the number of days it was less than the Fund’s NAV can be obtained at www.alpsfunds.com.
| | ^ | The Fund Commencement Date was June 28, 2013. |
| * | Market Price means the official closing price of a share or, if it more accurately reflects the market value of a share at the time as of which the Fund calculates current net asset value per share, the price that is the midpoint of the bid-ask spread as of that time. It does not represent the returns an investor would receive if shares were traded at other times. |
The S-Network® International Sector Dividend Dogs Index is designed to serve as a fair, impartial and transparent measure of the performance of international large cap equities with above average dividend yields. The Underlying Index is a portfolio of fifty stocks derived from the S-Network Developed International Equity 1000 Index. Total Return assumes reinvestment of any dividends and distributions realized during a given time period. Net Total Return (NTR) is obtained by reinvesting the net dividend, which is equal to the ordinary gross dividend minus the amount of withholding tax.
Morningstar® Developed Markets ex-North America Index measures the performance of companies in developed markets ex-North America. It covers approximately 97% of the full market capitalization in the Developed Markets ex-North America.
The indexes are not actively managed and do not reflect any deductions for fees, expenses or taxes. One cannot invest directly in an index. Index performance does not reflect fund performance.
The Fund’s shares are not individually redeemable. Investors buy and sell shares of the Fund on a secondary market. Only market makers or “authorized participants” may trade directly with the Fund, typically in blocks of 25,000 shares.
The ALPS International Sector Dividend Dogs ETF is not suitable for all investors. Investments in the Fund are subject to investment risks, including possible loss of the principal amount invested.
ALPS Portfolio Solutions Distributor, Inc., a FINRA member, is the distributor for the ETF.
5 | November 30, 2023
ALPS International Sector Dividend Dogs ETF
| Performance Overview | November 30, 2023 (Unaudited) |
Top 10 Holdings* (as of November 30, 2023)
| Fortescue, Ltd. | | | 2.55 | % |
| Telia Co. AB | | | 2.29 | % |
| Stellantis NV | | | 2.28 | % |
| Swiss Re AG | | | 2.27 | % |
| Erste Group Bank AG | | | 2.25 | % |
| Japan Tobacco, Inc. | | | 2.23 | % |
| The Sage Group Plc | | | 2.15 | % |
| Danone SA | | | 2.14 | % |
| Bouygues SA | | | 2.14 | % |
| Intesa Sanpaolo SpA | | | 2.13 | % |
| Total % of Top 10 Holdings | | | 22.43 | % |
| * | % of Total Investments (excluding investments purchased with collateral from securities loaned). |
Future holdings are subject to change.
Sector Allocation* (as of November 30, 2023)
| Financials | | | 10.82 | % |
| Consumer Staples | | | 10.31 | % |
| Communication Services | | | 10.19 | % |
| Information Technology | | | 10.11 | % |
| Utilities | | | 10.10 | % |
| Materials | | | 10.04 | % |
| Energy | | | 9.58 | % |
| Industrials | | | 9.56 | % |
| Health Care | | | 9.03 | % |
| Consumer Discretionary | | | 7.78 | % |
| Automobiles | | | 2.28 | % |
| Money Market Fund | | | 0.20 | % |
| Total | | | 100.00 | % |
Growth of $10,000 (as of November 30, 2023)
Comparison of Change in Value of $10,000 Investment in the Fund and the Indexes
The chart above compares historical performance of a hypothetical investment of $10,000 in the Fund over the past ten years with the performance of the Fund’s benchmark index. Results include the reinvestment of all dividends and capital gains distributions. Past performance does not guarantee future results. The chart does not reflect the deduction of taxes that a shareholder would pay on Fund distributions or the redemption of Fund shares.
6 | November 30, 2023
ALPS Emerging Sector Dividend Dogs ETF
| Performance Overview | November 30, 2023 (Unaudited) |
Investment Objective
The ALPS Emerging Sector Dividend Dogs ETF (the “Fund” or “EDOG”) seeks investment results that replicate as closely as possible, before fees and expenses, the performance of the S-Network® Emerging Sector Dividend Dogs Index (the “Underlying Index”).
The Underlying Index is a rules-based index intended to give investors a means of tracking the overall performance of the highest dividend paying stocks (i.e. “Dividend Dogs”) in the S-Network® Emerging Markets Liquid 500 Index, a universe of mainly large capitalization stocks domiciled in emerging markets (the “S-Network Emerging Markets”) on a sector-by-sector basis. “Dividend Dogs” refers to the five stocks in each of the Global Industry Classification Standard (“GICS”) sectors, excluding the real estate sector, that make up the S-Network® Emerging Markets which offer the highest dividend yields. Emerging market countries are countries that major international financial institutions, such as the World Bank, generally consider to be less economically mature than developed nations.
Performance Overview
The Fund, for the trailing twelve-month period ended November 30, 2023, generated a total return of 4.88%, in-line with the Fund’s Underlying Index, net of fees, which returned 4.88%. The Fund underperformed the Morningstar Emerging Markets Index (MEMMN), which returned 5.90% for the same period.
The trailing twelve-month yield (TTM) for the fund’s constituents as of November 30, 2023 was 6.76% vs. 2.68% for the MEMMN.
Emerging markets, as represented by the MEMMN gained 5.90% for the TTM period ended November 30, 2023 compared to the S&P 500® Index return of 13.84%, as the fiscal year 2023 saw global markets rebound from the 2022 lows. Developing economies and emerging market stocks as a whole were buoyed by positive catalysts including a weakening US dollar and inexpensive valuations. Emerging markets’ relative underperformance stemmed from inflationary pressures, currency devaluation, higher borrowing costs, and below-consensus growth from China’s economic recovery, which has been underwhelming due to regulatory crackdowns in tech and recent deflationary pressures. Main macroeconomic talking points throughout 2023 centered on the path of future interest rates driven by monetary policy, and inflation trending towards the European Central Bank (ECB) and Fed’s 2% inflation target. While inflation in emerging markets remains elevated relative to developed economies, expectations continue to point to lower levels, which should benefit company margins and manufacturing. The latest economic data displays Real GDP year-over-year rising to 5.2% in the US, 2.4% for Developed Economies, 4.5% for Emerging Economies, and 4.9% for China. In terms of valuations, the MEMMN currently exhibits a (P/E) ratio of 15.4x, slightly above its 10-year average. Looking forward, ALPS Advisors believes markets are likely to be data-dependent on job growth, Consumer Price Index (CPI), spending and manufacturing data to justify the recent recovery in valuations.
Compared to the MEMMN, the Fund saw a negative impact (-0.60%) from the sector allocation effect which was largely driven by the relative underweight in Information Technology (average weight for the period of 9.60% vs. 18.25% in MEMMN) and a relative overweight to Utilities over the one year period (average weight for the period of 10.21% vs. 3.06% in MEMMN), a result of the equal sector weighting strategy. The Fund also saw a positive impact of 0.54% due to the selection effect, as EDOG’s higher-yielding names in Financials and Utilities were outperformers, while constituents in Communication Services and Materials caused relative underperformance relative to MEMMN.
From a geographical perspective, the highest contribution to return was attributed to holdings based in Brazil. The Fund’s performance was adversely impacted by holdings based in South Africa.
The best-performing stocks for the period were Petroleo Brasileiro SA (PETR3 BZ), which increased 124.60%, Ecopetrol SA (EC US), gaining 66.11%, and Cez AS (CEZ CP), which gained 51.67%. The worst-performing stocks for the trailing twelve-month period were Multichoice Group LTD (MCG SJ), losing 48.94%, African Rainbow Minerals LTD (ARI SJ), which fell 35.72%, and Maanshan Iron & Steel (323 HK), decreasing 34.10%.
Looking ahead, the Fund’s strategy of annually selecting the five highest-yielding securities in each of the ten sectors in the S-Net Emerging Markets Index is intended to provide high yield relative to the MEMMN, potential for market participation in all economic cycles through equal sector weighting, and a deep value portfolio of securities as identified through high yield relative to their sector peers.
7 | November 30, 2023
ALPS Emerging Sector Dividend Dogs ETF
| Performance Overview | November 30, 2023 (Unaudited) |
Performance (as of November 30, 2023)
| | 1 Year | 5 Year | Since Inception^ |
| ALPS Emerging Sector Dividend Dogs ETF – NAV | 4.88% | 4.64% | 2.43% |
| ALPS Emerging Sector Dividend Dogs ETF – Market Price* | 4.83% | 4.70% | 2.43% |
| S-Network® Emerging Sector Dividend Dogs Index | 4.88% | 5.29% | 3.18% |
| Morningstar® Emerging Markets Index | 5.90% | 3.69% | 3.47% |
Total Expense Ratio (per the current prospectus) 0.60%.
Performance data quoted represents past performance. Past performance does not guarantee future results. Total return figures assume reinvestment of dividends and capital gains distributions, if any. The table does not reflect the deduction of taxes that a shareholder would pay on Fund distributions or the redemption of Fund shares. Investment return and principal value of an investment will fluctuate so that an investor’s shares, when sold or redeemed, may be worth more or less than the original cost. Current performance data may be higher or lower than actual data quoted. For the most current month-end performance data please visit www.alpsfunds.com or call 1.866.675.2639.
Net Asset Value (NAV) is an exchange-traded fund’s per-share value. The per-share dollar amount of the Fund is derived by dividing the total value of all the securities in its portfolio, less any liabilities, by the number of Fund shares outstanding. Market Price is the price at which a share can currently be traded in the market. Information detailing the number of days the Market Price of the Fund was greater than the Fund’s NAV and the number of days it was less than the Fund’s NAV can be obtained at www.alpsfunds.com.
| | ^ | The Fund Commencement Date was March 28, 2014. |
| * | Market Price means the official closing price of a share or, if it more accurately reflects the market value of a share at the time as of which the Fund calculates current net asset value per share, the price that is the midpoint of the bid-ask spread as of that time. It does not represent the returns an investor would receive if shares were traded at other times. |
The S-Network® Emerging Sector Dividend Dogs Index is a rules-based index intended to give investors a means of tracking the overall performance of the highest dividend paying stocks in the S-Network Emerging Markets Liquid 500 Index, a universe of mainly large capitalization stocks domiciled in emerging markets on a sector-by-sector basis. Emerging market countries are countries that major international financial institutions, such as the World Bank, generally consider to be less economically mature than developed nations. The index is reported on a Net Total Return basis which assumes reinvestment of any dividends and distributions realized during a given time period (net of any amounts of withholding tax).
Morningstar® Emerging Markets Index measures the performance of emerging markets targeting the top 97% of stocks by market capitalization.
The indexes are not actively managed and do not reflect any deductions for fees, expenses or taxes. One cannot invest directly in an index. Index performance does not reflect fund performance.
The Fund’s shares are not individually redeemable. Investors buy and sell shares of the Fund on a secondary market. Only market makers or “authorized participants” may trade directly with the Fund, typically in blocks of 25,000 shares.
The ALPS Emerging Sector Dividend Dogs ETF is not suitable for all investors. Investments in the Fund are subject to investment risks, including possible loss of the principal amount invested.
ALPS Portfolio Solutions Distributor, Inc., a FINRA member, is the distributor for the ETF.
8 | November 30, 2023
ALPS Emerging Sector Dividend Dogs ETF
| Performance Overview | November 30, 2023 (Unaudited) |
Top 10 Holdings* (as of November 30, 2023)
| TOTVS SA | | | 3.06 % |
| Cia Siderurgica Nacional SA | | | 2.81 % |
| Dr Reddy's Laboratories, Ltd. | | | 2.59 % |
| JBS S/A | | | 2.57 % |
| Infosys, Ltd. | | | 2.49 % |
| Bangkok Dusit Medical Services PCL | | | 2.45 % |
| Richter Gedeon Nyrt | | | 2.43 % |
| African Rainbow Minerals, Ltd. | | | 2.37 % |
| Wipro, Ltd. | | | 2.35 % |
| Sime Darby Bhd | | | 2.28 % |
| Total % of Top 10 Holdings | | | 25.40 % |
| * | % of Total Investments (excluding investments purchased with collateral from securities loaned). |
Future holdings are subject to change.
Sector Allocation* (as of November 30, 2023)
| Industrials | 11.52% |
| Materials | 11.07% |
| Financials | 10.71% |
| Consumer Staples | 10.50% |
| Utilities | 10.08% |
| Information Technology | 9.78% |
| Health Care | 9.69% |
| Communication Services | 9.67% |
| Energy | 9.38% |
| Consumer Discretionary | 7.45% |
| Money Market Fund | 0.15% |
| Total | 100.00% |
Growth of $10,000 (as of November 30, 2023)
Comparison of Change in Value of $10,000 Investment in the Fund and the Indexes

The chart above compares historical performance of a hypothetical investment of $10,000 in the Fund since inception with the performance of the Fund’s benchmark index. Results include the reinvestment of all dividends and capital gains distributions. Past performance does not guarantee future results. The chart does not reflect the deduction of taxes that a shareholder would pay on Fund distributions or the redemption of Fund shares.
9 | November 30, 2023
ALPS REIT Dividend Dogs ETF
| Performance Overview | November 30, 2023 (Unaudited) |
Investment Objective
The ALPS REIT Dividend Dogs ETF (the “Fund” or "RDOG") seeks investment results that replicate as closely as possible, before fees and expenses, the performance of the S-Network® REIT Dividend Dogs Index (the “Underlying Index”).
The Underlying Index is a rules-based index intended to give investors a means of tracking the overall performance of the highest dividend paying real estate investment trusts (“REITs”) (i.e. “Dividend Dogs”) in the S-Network® Composite US REIT Index, a universe of mainly REITs listed in the United States (the “S-Net U.S. REIT” or "SNREIT"), on a segment-by-segment basis. “Dividend Dogs” refers to the five REITs in each of the nine segments that make up the S-Net U.S. REIT which offer the highest dividend yields.
Performance Overview
The Fund, for the twelve-month period ended November 30, 2023, generated a total return of -7.16%, largely in line with the Fund’s Underlying Index, net of fees, which returned -6.69%. The Fund underperformed the broader U.S. REIT market, as represented by the S-Network Composite US REIT Index (SNREIT), which returned -2.87% for the same period.
The trailing twelve-month (TTM) yield for the fund as of November 30, 2023 was 7.06% while the SNREIT TTM yield was 4.54% as of November 30, 2023.
The S&P 500® Index returned 13.84% for the TTM period that ended November 30, 2023, as the fiscal year 2023 saw markets rebound from 2022 lows. The Federal Reserve Bank (Fed) continued its path of quantitative tightening in 2023 to combat inflation, reaching their target of peak rates with expectations of rate cuts into 2024 as Consumer Price Index (CPI), energy prices and yields trended towards more acceptable levels. US markets rallied substantially off the secondary effects of the Fed’s actions leading to better odds of a soft landing, with expectations of rate cuts driving growth and equity multiples higher into the next year. Main macroeconomic talking points throughout 2023 centered on the path of future interest rates driven by monetary policy, and inflation trending towards the Fed’s 2% inflation target. Inflation significantly declined throughout 2023, with November 2023 numbers showing year-over-year CPI around 3.1%. Despite persistent recession calls, ALPS Advisors believes a gradual reduction in interest rates is likely to lead to an earnings recovery in the US, easing financial conditions for both US and global equities. With the recent recovery in sentiment and price for US markets, the S&P 500® Index Price-to-Earnings (P/E) ratio of 22.2x is slightly above its 10-year average of 20.6x. Looking forward, ALPS Advisors believes markets are likely to be data-dependent on job growth, CPI, spending and manufacturing data to justify the recent recovery in valuations.
Rising rates and a work-from-home culture negatively impacted Office REITs, as properties became less attractive with higher cap rates and pressure of funds-from-operations (FFO). In contrast, Retail REITs and Technology REITs, provided positive performance for the Fund.
The best-performing stocks in the Fund for the period were Necessity Retail REIT Inc. (RTL), which increased 37.08%, Park Hotels & Resorts Inc. (PK), gaining 33.26%, and Digital Realty Trust (DLR), which rose 28.96%. The largest detractors were Medical Properties Trust Inc. (MPW), falling 58.59%, Office Properties Income Trust (OPI), losing 52.51% and Hudson Pacific Properties Inc. (HPP), which fell 37.04%.
Looking ahead, the Fund’s strategy of annually selecting the five highest-yielding securities in each of the nine segments in the S-Network Composite US REIT Index is intended to provide meaningfully higher yield relative to the S-Network Composite US REIT Index, potential for market participation in all economic cycles through equal segment weighting, and a value portfolio of securities as identified through high yield relative to their segment peers.
10 | November 30, 2023
ALPS REIT Dividend Dogs ETF
| Performance Overview | November 30, 2023 (Unaudited) |
Performance (as of November 30, 2023)
| | 1 Year | 5 Year | 10 Year | Since Inception^ |
| ALPS REIT Dividend Dogs ETF – NAV | -7.16% | 0.76% | 3.19% | 2.09% |
| ALPS REIT Dividend Dogs ETF – Market Price* | -6.87% | 0.76% | 3.15% | 2.08% |
| S-Network® REIT Dividend Dogs Index | -6.69% | — | — | — |
| S-Network® Composite US REIT Index | -2.87% | 3.66% | — | — |
| S-Network® REIT Dividend Dogs Index/S&P United States REIT Index** | -6.69% | 1.09% | 5.29% | 4.78% |
Total Expense Ratio (per the current prospectus) is 0.35%.
Performance data quoted represents past performance. Past performance does not guarantee future results. On January 2, 2020, the Fund changed its Underlying Index and principal investment strategies. Consequently, the Fund's total returns shown above for the periods prior to January 2, 2020 are not necessarily indicative of the performance of the Fund, as it is currently managed. Total return figures assume reinvestment of dividends and capital gains distributions, if any. The table does not reflect the deduction of taxes that a shareholder would pay on Fund distributions or the redemption of Fund shares. Investment return and principal value of an investment will fluctuate so that an investor’s shares, when sold or redeemed, may be worth more or less than the original cost. Current performance data may be higher or lower than actual data quoted. For the most current month-end performance data please visit www.alpsfunds.com or call 1.866.759.5679.
Net Asset Value (NAV) is an exchange-traded fund’s per-share value. The per-share dollar amount of the Fund is derived by dividing the total value of all the securities in its portfolio, less any liabilities, by the number of Fund shares outstanding. Market Price is the price at which a share can currently be traded in the market. Information detailing the number of days the Market Price of the Fund was greater than the Fund’s NAV and the number of days it was less than the Fund’s NAV can be obtained at www.alpsfunds.com.
| | ^ | The Fund Inception Date was May 7, 2008. |
| * | Market Price means the official closing price of a share or, if it more accurately reflects the market value of a share at the time as of which the Fund calculates current net asset value per share, the price that is the midpoint of the bid-ask spread as of that time. It does not represent the returns an investor would receive if shares were traded at other times. |
| ** | The performance shown reflects a combination of the Fund's Underlying Index, and for periods prior to January 2, 2020, the S&P United States REIT Index. Prior to January 2, 2020, the Fund used a different Underlying Index than the S&P United States REIT Index. Therefore, the historical returns shown for the periods prior to January 2, 2020, are not necessarily indicative of the historical strategy of the Fund. |
The S-Network® REIT Dividend Dogs Index, like the S-Net U.S. REIT from which components of the Underlying Index are selected, divides into nine segments, eight of which are based on Global Industry Classification Standard (“GICS”) Sub-Industries (excluding Technology REITs involved in cell towers and/or data centers) and a separate Technology REIT segment based on the research of the Underlying Index provider, S-Network® Global Indexes, Inc. (the “Index Provider”). The Underlying Index generally consists of 45 REITs on each annual reconstitution date. The Underlying Index’s REITs must be constituents of the S-Net U.S. REIT universe, which includes a universe of mainly REITs listed in the United States. The selection criteria for the universe also includes requirements for segment inclusion, primary exchange listing, minimum market capitalization, share price, average daily trading volume and other factors. The Underlying Index is rebalanced quarterly. The index is reported on a total return basis, which assumes reinvestment of any dividends and distributions realized during a given time period. The index commenced operations on October 29, 2019.
The S-Network® Composite US REIT Index (the “S-Net U.S. REIT” or “SNREIT”) is a benchmark index for the Real Estate Investment Trust component of the US stock market. The SNREIT provides the universe of stocks for RDOGX. The selection criteria for SNREIT include requirements for sector inclusion, primary exchange listing, minimum market capitalization, minimum average daily trading volume, and other factors. All constituents of RDOGX must be constituents of SNREIT. The index commenced operations on February 12, 2016.
The S&P United States REIT Index defines and measures the investable universe of publicly traded real estate investment trusts domiciled in the United States.
The indexes are not actively managed and do not reflect any deductions for fees, expenses or taxes. Total return assumes reinvestment of any dividends and distributions realized during a given time period. One cannot invest directly in an index. Index performance does not reflect fund performance.
The Fund’s shares are not individually redeemable. Investors buy and sell shares of the Fund on a secondary market. Only market makers or “authorized participants” may trade directly with the Fund, typically in blocks of 25,000 shares.
The ALPS REIT Dividend Dogs ETF is not suitable for all investors. Investments in the Fund are subject to investment risks, including possible loss of the principal amount invested.
ALPS Portfolio Solutions Distributor, Inc., a FINRA member, is the distributor for the ETF.
11 | November 30, 2023
ALPS REIT Dividend Dogs ETF
| Performance Overview | November 30, 2023 (Unaudited) |
Top 10 Holdings* (as of November 30, 2023)
| Crown Castle, Inc. | 2.67% |
| Uniti Group, Inc. | 2.62% |
| American Tower Corp. | 2.61% |
| Park Hotels & Resorts, Inc. | 2.59% |
| Outfront Media, Inc. | 2.52% |
| Spirit Realty Capital, Inc. | 2.52% |
| Sabra Health Care REIT, Inc. | 2.51% |
| CBL & Associates Properties, Inc. | 2.46% |
| Simon Property Group, Inc. | 2.46% |
| Digital Realty Trust, Inc. | 2.41% |
| Total % of Top 10 Holdings | 25.37% |
Future holdings are subject to change.
REIT Sector Allocation* (as of November 30, 2023)
| Technology REITs | 12.67% |
| Retail REITs | 11.76% |
| Hotel & Resort REITs | 11.31% |
| Specialized REITs | 11.26% |
| Health Care REITs | 10.86% |
| Industrial REITs | 10.71% |
| Diversified REITs | 10.66% |
| Residential REITs | 10.47% |
| Office REITs | 10.12% |
| Money Market Fund | 0.18% |
| Total | 100.00% |
Growth of $10,000 (as of November 30, 2023)
Comparison of Change in Value of $10,000 Investment in the Fund and the Indexes
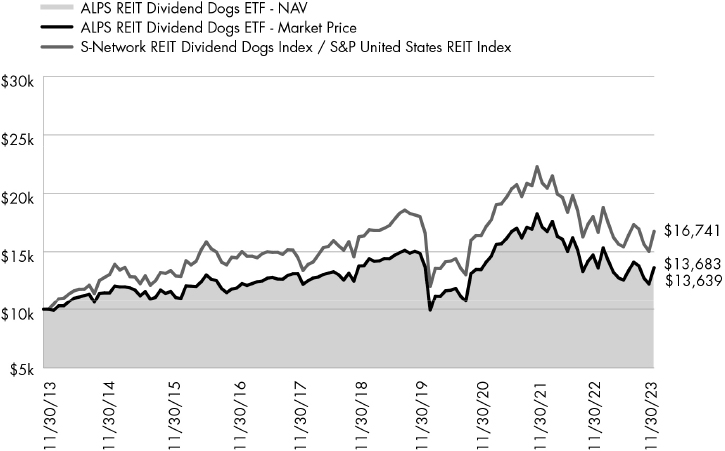
The chart above compares historical performance of a hypothetical investment of $10,000 in the Fund over the past ten years with the performance of the Fund’s benchmark index. Results include the reinvestment of all dividends and capital gains distributions. Past performance does not guarantee future results. The chart does not reflect the deduction of taxes that a shareholder would pay on Fund distributions or the redemption of Fund shares.
12 | November 30, 2023
ALPS ETF Trust
| Disclosure of Fund Expenses | November 30, 2023 (Unaudited) |
Shareholder Expense Example: As a shareholder of a Fund, you incur certain ongoing costs, including management fees and other Fund expenses. These examples are intended to help you understand your ongoing costs (in dollars) of investing in the Fund and to compare these costs with the ongoing costs of investing in other funds. It is based on an investment of $1,000 invested at the beginning of the six month period and held through November 30, 2023.
Actual Return: The first line of the table provides information about actual account values and actual expenses. You may use the information in this line, together with the amount you invested, to estimate the expenses that you incurred over the period. Simply divide your account value by $1,000 (for example, an $8,600 account value divided by $1,000 = 8.6), then multiply the result by the number in the first line under the heading entitled “Expenses Paid During Period” to estimate the expenses attributable to your investment during this period.
Hypothetical 5% Return: The second line of the table provides information about hypothetical account values and hypothetical expenses based on the Fund’s actual expense ratio and an assumed rate of return of 5% per year before expenses, which is not the Fund’s actual return. The hypothetical account values and expenses may not be used to estimate the actual ending account balance or expenses you paid for the period. You may use this information to compare ongoing costs of investing in the Fund and other funds. To do so, compare this 5% hypothetical example with the 5% hypothetical examples that appear in the shareholder reports of other funds.
The expenses shown in the table are meant to highlight ongoing Fund costs only and do not reflect any transaction costs, such as brokerage commissions and other fees to financial intermediaries. Therefore, the second line is useful in comparing ongoing costs only, and will not help you determine the relative total costs of owning different funds. In addition, if these costs were included, your costs would have been higher.
| Beginning Account Value
6/1/23 | Ending Account
Value
11/30/23 | Expense
Ratio(a) | Expenses Paid
During Period
6/1/23 – 11/30/23(b) |
| ALPS Sector Dividend Dogs ETF | | | | |
| Actual | $ 1,000.00 | $ 1,054.50 | 0.36% | $ 1.85 |
| Hypothetical (5% return before expenses) | $ 1,000.00 | $ 1,023.26 | 0.36% | $ 1.83 |
| ALPS International Sector Dividend Dogs ETF | | | | |
| Actual | $ 1,000.00 | $ 1,102.40 | 0.50% | $ 2.64 |
| Hypothetical (5% return before expenses) | $ 1,000.00 | $ 1,022.56 | 0.50% | $ 2.54 |
| ALPS Emerging Sector Dividend Dogs ETF | | | | |
| Actual | $ 1,000.00 | $ 1,056.70 | 0.60% | $ 3.09 |
| Hypothetical (5% return before expenses) | $ 1,000.00 | $ 1,022.06 | 0.60% | $ 3.04 |
| ALPS REIT Dividend Dogs ETF | | | | |
| Actual | $ 1,000.00 | $ 1,087.30 | 0.35% | $ 1.83 |
| Hypothetical (5% return before expenses) | $ 1,000.00 | $ 1,023.31 | 0.35% | $ 1.78 |
| (a) | Annualized based on the Fund's most recent fiscal half-year expenses. |
| (b) | Expenses are equal to the Fund's annualized expense ratio multiplied by the average account value over the period, multiplied by the number of days in the most recent fiscal half year (183), divided by 365. |
13 | November 30, 2023
ALPS ETF Trust
| Report of Independent Registered Public Accounting Firm |
To the Shareholders of ALPS Sector Dividend Dogs ETF, ALPS International Sector Dividend Dogs ETF, ALPS Emerging Sector Dividend Dogs ETF and ALPS REIT Dividend Dogs ETF and Board of Trustees of ALPS ETF Trust
Opinion on the Financial Statements
We have audited the accompanying statements of assets and liabilities, including the schedules of investments, of ALPS Sector Dividend Dogs ETF, ALPS International Sector Dividend Dogs ETF, ALPS Emerging Sector Dividend Dogs ETF and ALPS REIT Dividend Dogs ETF (the “Funds”), each a series of ALPS ETF Trust, as of November 30, 2023, the related statements of operations and changes in net assets, the related notes, and the financial highlights for the year then ended (collectively referred to as the “financial statements”). In our opinion, the financial statements present fairly, in all material respects, the financial position of each of the Funds as of November 30, 2023, the results of their operations, the changes in net assets, and the financial highlights for the year then ended, in conformity with accounting principles generally accepted in the United States of America.
The Funds’ financial statements and financial highlights for the years ended November 30, 2022, and prior, were audited by other auditors whose report dated January 27, 2023, expressed an unqualified opinion on those financial statements and financial highlights.
Basis for Opinion
These financial statements are the responsibility of the Funds’ management. Our responsibility is to express an opinion on the Funds’ financial statements based on our audits. We are a public accounting firm registered with the Public Company Accounting Oversight Board (United States) (“PCAOB”) and are required to be independent with respect to the Funds in accordance with the U.S. federal securities laws and the applicable rules and regulations of the Securities and Exchange Commission and the PCAOB.
We conducted our audits in accordance with the standards of the PCAOB. Those standards require that we plan and perform the audit to obtain reasonable assurance about whether the financial statements are free of material misstatement whether due to error or fraud.
Our audits included performing procedures to assess the risks of material misstatement of the financial statements, whether due to error or fraud, and performing procedures that respond to those risks. Such procedures included examining, on a test basis, evidence regarding the amounts and disclosures in the financial statements. Our procedures included confirmation of securities owned as of November 30, 2023, by correspondence with the custodian and brokers; when replies were not received from brokers, we performed other auditing procedures. Our audits also included evaluating the accounting principles used and significant estimates made by management, as well as evaluating the overall presentation of the financial statements. We believe that our audits provide a reasonable basis for our opinion.
We have served as the auditor of one or more investment companies advised by ALPS Advisors, Inc. since 2013.

COHEN & COMPANY, LTD.
Philadelphia, Pennsylvania
January 29, 2024
14 | November 30, 2023
ALPS Sector Dividend Dogs ETF
| Schedule of Investments | November 30, 2023 |
| Security Description | | Shares | | | Value | |
| COMMON STOCKS (99.48%) | | | | | | | | |
| Communication Services (10.76%) | | | | | | | | |
| AT&T, Inc. | | | 1,531,630 | | | $ | 25,379,109 | |
| Interpublic Group of Cos., Inc. | | | 695,701 | | | | 21,385,849 | |
| Omnicom Group, Inc. | | | 279,841 | | | | 22,563,580 | |
| Paramount Global, Class B | | | 1,614,527 | | | | 23,200,753 | |
| Verizon Communications, Inc. | | | 659,819 | | | | 25,290,862 | |
| Total Communication Services | | | | | | | 117,820,153 | |
| | | | | | | | | |
| Consumer Discretionary (8.23%) | | | | | | | | |
| Best Buy Co., Inc. | | | 301,194 | | | | 21,366,703 | |
| Hasbro, Inc. | | | 315,131 | | | | 14,625,230 | |
| Newell Brands, Inc. | | | 2,216,967 | | | | 16,915,458 | |
| VF Corp. | | | 1,174,563 | | | | 19,650,439 | |
| Whirlpool Corp. | | | 161,488 | | | | 17,586,043 | |
| Total Consumer Discretionary | | | | | | | 90,143,873 | |
| | | | | | | | | |
| Consumer Staples (9.86%) | | | | | | | | |
| Altria Group, Inc. | | | 500,398 | | | | 21,036,732 | |
| Kimberly-Clark Corp. | | | 173,346 | | | | 21,448,101 | |
| Kraft Heinz Co. | | | 670,065 | | | | 23,525,982 | |
| Philip Morris International, | | | | | | | | |
| Inc. | | | 235,570 | | | | 21,992,815 | |
| Walgreens Boots Alliance, | | | | | | | | |
| Inc.(a) | | | 1,002,610 | | | | 19,992,043 | |
| Total Consumer Staples | | | | | | | 107,995,673 | |
| | | | | | | | | |
| Energy (10.28%) | | | | | | | | |
| Devon Energy Corp. | | | 418,180 | | | | 18,805,555 | |
| Kinder Morgan, Inc. | | | 1,312,876 | | | | 23,067,231 | |
| ONEOK, Inc. | | | 340,540 | | | | 23,446,179 | |
| Phillips 66 | | | 180,290 | | | | 23,237,578 | |
| Williams Cos., Inc. | | | 652,564 | | | | 24,007,830 | |
| Total Energy | | | | | | | 112,564,373 | |
| | | | | | | | | |
| Financials (10.32%) | | | | | | | | |
| Citigroup, Inc. | | | 543,431 | | | | 25,052,169 | |
| Franklin Resources, Inc. | | | 849,283 | | | | 21,062,219 | |
| Lincoln National Corp. | | | 859,762 | | | | 20,445,140 | |
| Prudential Financial, Inc. | | | 231,865 | | | | 22,671,760 | |
| Truist Financial Corp. | | | 741,078 | | | | 23,818,247 | |
| Total Financials | | | | | | | 113,049,535 | |
| | | | | | | | | |
| Health Care (8.95%) | | | | | | | | |
| AbbVie, Inc. | | | 147,952 | | | | 21,066,885 | |
| Gilead Sciences, Inc. | | | 290,062 | | | | 22,218,749 | |
| Medtronic PLC | | | 275,736 | | | | 21,857,593 | |
| Organon & Co. | | | 1,138,943 | | | | 12,892,835 | |
| Viatris, Inc. | | | 2,183,031 | | | | 20,040,225 | |
| Total Health Care | | | | | | | 98,076,287 | |
| | | | | | | | | |
| Industrials (10.13%) | | | | | | | | |
| 3M Co. | | | 207,744 | | | | 20,581,198 | |
| Fastenal Co. | | | 404,457 | | | | 24,255,286 | |
| Snap-On, Inc. | | | 84,881 | | | | 23,315,962 | |
| Stanley Black & Decker, Inc. | | | 243,047 | | | | 22,092,972 | |
| Security Description | | Shares | | | Value | |
| Industrials (continued) | | | | | | |
| United Parcel Service, Inc., | | | | | | | | |
| Class B | | | 136,978 | | | $ | 20,767,235 | |
| Total Industrials | | | | | | | 111,012,653 | |
| | | | | | | | | |
| Information Technology (10.80%) | | | | | | | | |
| Corning, Inc. | | | 702,320 | | | | 20,009,097 | |
| HP, Inc. | | | 748,607 | | | | 21,964,129 | |
| Intel Corp. | | | 580,440 | | | | 25,945,668 | |
| International Business | | | | | | | | |
| Machines Corp. | | | 149,117 | | | | 23,643,991 | |
| Seagate Technology Holdings | | | | | | | | |
| PLC | | | 337,376 | | | | 26,686,442 | |
| Total Information Technology | | | | | | | 118,249,327 | |
| | | | | | | | | |
| Materials (10.17%) | | | | | | | | |
| Amcor PLC | | | 2,385,742 | | | | 22,616,834 | |
| International Paper Co. | | | 636,954 | | | | 23,529,081 | |
| LyondellBasell Industries NV, | | | | | | | | |
| Class A | | | 222,027 | | | | 21,114,767 | |
| Newmont Mining Corp. | | | 569,915 | | | | 22,904,884 | |
| The Dow Chemical Co. | | | 410,912 | | | | 21,264,696 | |
| Total Materials | | | | | | | 111,430,262 | |
| | | | | | | | | |
| Utilities (9.98%) | | | | | | | | |
| Dominion Resources, Inc. | | | 468,852 | | | | 21,257,750 | |
| Duke Energy Corp. | | | 241,922 | | | | 22,324,562 | |
| Edison International | | | 315,441 | | | | 21,131,393 | |
| Pinnacle West Capital Corp. | | | 287,774 | | | | 21,565,783 | |
| Southern Co. | | | 324,882 | | | | 23,060,124 | |
| Total Utilities | | | | | | | 109,339,612 | |
| | | | | | | | | |
| TOTAL COMMON STOCKS | | | | | | | | |
| (Cost $1,181,121,238) | | | | | | | 1,089,681,748 | |
| | | 7 Day Yield | | | Shares | | | Value | |
| SHORT TERM INVESTMENTS (0.16%) | | | | | | | | | | | | |
| Money Market Fund (0.16%) | | | | | | | | | | | | |
| State Street Institutional | | | | | | | | | | | | |
| Treasury Plus Money | | | | | | | | | | | | |
| Market Fund (Premier | | | | | | | | | | | | |
| Class) | | | 5.31 | % | | | 1,759,568 | | | | 1,759,568 | |
| | | | | | | | | | | | | |
| TOTAL SHORT TERM INVESTMENTS | | | | | | | | | | | | |
| | | | | | | | | | | | | |
| (Cost $1,759,568) | | | | | | | | | | | 1,759,568 | |
| | | | | | | | | | | | | |
| TOTAL INVESTMENTS (99.64%) | | | | | | | | | | | | |
| (Cost $1,182,880,806) | | | | | | | | | | $ | 1,091,441,316 | |
| OTHER ASSETS IN EXCESS OF LIABILITIES (0.36%) | | | | | | | | | | | 3,936,830 | |
| NET ASSETS - 100.00% | | | | | | | | | | $ | 1,095,378,146 | |
| (a) | Security, or a portion of the security position is currently on loan. The total market value of securities on loan is $17,948,193. |
See Notes to Financial Statements.
15 | November 30, 2023
ALPS International Sector Dividend Dogs ETF
| Schedule of Investments | November 30, 2023 |
| Security Description | | Shares | | | Value | |
| COMMON STOCKS (99.51%) | | | | | | | | |
| Australia (8.12%) | | | | | | | | |
| BHP Group, Ltd. | | | 163,672 | | | $ | 5,007,178 | |
| Fortescue, Ltd.(a) | | | 364,353 | | | | 6,016,255 | |
| South32, Ltd. | | | 2,154,768 | | | | 4,385,195 | |
| Woodside Energy Group, Ltd. | | | 186,056 | | | | 3,811,036 | |
| Total Australia | | | | | | | 19,219,664 | |
| | | | | | | | | |
| Austria (2.25%) | | | | | | | | |
| Erste Group Bank AG | | | 131,605 | | | | 5,316,057 | |
| | | | | | | | | |
| Denmark (1.70%) | | | | | | | | |
| A P Moller-Maersk A/S | | | 2,546 | | | | 4,014,923 | |
| | | | | | | | | |
| Finland (2.04%) | | | | | | | | |
| Fortum Oyj | | | 343,976 | | | | 4,824,351 | |
| | | | | | | | | |
| France (16.23%) | | | | | | | | |
| Amundi SA(b)(c) | | | 79,413 | | | | 4,883,895 | |
| Bouygues SA | | | 132,969 | | | | 5,052,735 | |
| Cie Generale des | | | | | | | | |
| Etablissements Michelin | | | | | | | | |
| SCA | | | 142,922 | | | | 4,793,106 | |
| Credit Agricole SA | | | 378,355 | | | | 4,951,109 | |
| Danone SA | | | 78,845 | | | | 5,060,944 | |
| Engie SA | | | 284,733 | | | | 4,933,471 | |
| Orange SA | | | 391,274 | | | | 4,814,370 | |
| Sanofi SA | | | 42,095 | | | | 3,915,793 | |
| Total France | | | | | | | 38,405,423 | |
| | | | | | | | | |
| Germany (5.52%) | | | | | | | | |
| Bayerische Motoren Werke AG | | | 44,125 | | | | 4,591,171 | |
| Fresenius Medical Care AG | | | 105,534 | | | | 4,322,678 | |
| Mercedes-Benz Group AG | | | 64,134 | | | | 4,159,251 | |
| Total Germany | | | | | | | 13,073,100 | |
| | | | | | | | | |
| Hong Kong (1.86%) | | | | | | | | |
| CITIC, Ltd. | | | 4,664,000 | | | | 4,394,536 | |
| | | | | | | | | |
| Israel (1.65%) | | | | | | | | |
| Israel Chemicals, Ltd. | | | 775,573 | | | | 3,895,795 | |
| | | | | | | | | |
| Italy (6.15%) | | | | | | | | |
| Enel SpA | | | 682,241 | | | | 4,816,605 | |
| Eni SpA | | | 285,337 | | | | 4,710,996 | |
| Intesa Sanpaolo SpA | | | 1,749,399 | | | | 5,029,974 | |
| Total Italy | | | | | | | 14,557,575 | |
| | | | | | | | | |
| Japan (17.68%) | | | | | | | | |
| Canon, Inc.(a) | | | 187,063 | | | | 4,803,378 | |
| ENEOS Holdings, Inc. | | | 1,151,100 | | | | 4,537,318 | |
| Japan Tobacco, Inc. | | | 205,400 | | | | 5,265,921 | |
| Kyocera Corp. | | | 89,820 | | | | 4,961,728 | |
| NEC Corp. | | | 83,300 | | | | 4,629,651 | |
| Nippon Steel Corp. | | | 188,500 | | | | 4,395,282 | |
| Nippon Yusen KK(a) | | | 169,700 | | | | 4,548,683 | |
| Sumitomo Corp. | | | 217,900 | | | | 4,556,118 | |
| Security Description | | Shares | | | Value | |
| Japan (continued) | | | | | | | | |
| Takeda Pharmaceutical Co., | | | | | | | | |
| Ltd. | | | 147,300 | | | $ | 4,138,031 | |
| Total Japan | | | | | | | 41,836,110 | |
| | | | | | | | | |
| Netherlands (4.14%) | | | | | | | | |
| Koninklijke Philips NV | | | 216,373 | | | | 4,420,726 | |
| Stellantis NV | | | 248,293 | | | | 5,378,826 | |
| Total Netherlands | | | | | | | 9,799,552 | |
| | | | | | | | | |
| Norway (3.92%) | | | | | | | | |
| Aker BP ASA | | | 161,785 | | | | 4,636,762 | |
| Telenor ASA | | | 432,232 | | | | 4,645,916 | |
| Total Norway | | | | | | | 9,282,678 | |
| | | | | | | | | |
| Poland (2.07%) | | | | | | | | |
| ORLEN SA | | | 332,626 | | | | 4,908,455 | |
| | | | | | | | | |
| Portugal (2.01%) | | | | | | | | |
| Jeronimo Martins SGPS SA | | | 192,631 | | | | 4,759,686 | |
| | | | | | | | | |
| Spain (5.91%) | | | | | | | | |
| Endesa SA | | | 220,096 | | | | 4,596,214 | |
| Redeia Corp. SA | | | 278,835 | | | | 4,667,990 | |
| Telefonica SA | | | 1,098,135 | | | | 4,726,272 | |
| Total Spain | | | | | | | 13,990,476 | |
| | | | | | | | | |
| Sweden (6.16%) | | | | | | | | |
| H & M Hennes & Mauritz AB, | | | | | | | | |
| Class B | | | 301,322 | | | | 4,816,493 | |
| Telefonaktiebolaget LM | | | | | | | | |
| Ericsson, Class B | | | 885,064 | | | | 4,378,176 | |
| Telia Co. AB | | | 2,274,686 | | | | 5,392,253 | |
| Total Sweden | | | | | | | 14,586,922 | |
| | | | | | | | | |
| Switzerland (2.26%) | | | | | | | | |
| Swiss Re AG | | | 45,386 | | | | 5,351,267 | |
| | | | | | | | | |
| United Kingdom (9.84%) | | | | | | | | |
| British American Tobacco PLC | | | 139,965 | | | | 4,438,678 | |
| GSK PLC | | | 251,263 | | | | 4,502,439 | |
| Imperial Brands PLC | | | 206,505 | | | | 4,813,870 | |
| The Sage Group Plc | | | 355,565 | | | | 5,074,626 | |
| Vodafone Group PLC | | | 4,955,622 | | | | 4,462,569 | |
| Total United Kingdom | | | | | | | 23,292,182 | |
| | | | | | | | | |
| TOTAL COMMON STOCKS | | | | | | | | |
| (Cost $222,762,311) | | | | | | | 235,508,752 | |
16 | November 30, 2023
ALPS International Sector Dividend Dogs ETF
| Schedule of Investments | November 30, 2023 |
| | | 7 Day Yield | | | Shares | | | Value | |
| SHORT TERM INVESTMENTS (2.13%) | | | | | | | | | | | | |
| Money Market Fund (0.20%) | | | | | | | | | | | | |
| State Street Institutional Treasury Plus Money Market Fund (Premier Class) | | | | | | | | | | | | |
| (Cost $473,041) | | | 5.31 | % | | | 473,041 | | | $ | 473,041 | |
| | | | | | | | | | | | | |
| Investments Purchased with Collateral | | | | | | | | | | | | |
| from Securities Loaned (1.93%) | | | | | | | | | | | | |
| State Street Navigator Securities Lending Government Money Market Portfolio, 5.37% | | | | | | | | | | | | |
| (Cost $4,563,243) | | | | | | | 4,563,243 | | | $ | 4,563,243 | |
| | | | | | | | | | | | | |
| TOTAL SHORT TERM INVESTMENTS | | | | | | | | | | | | |
| | | | | | | | | | | | | |
| (Cost $5,036,284) | | | | | | | | | | | 5,036,284 | |
| | | | | | | | | | | | | |
| TOTAL INVESTMENTS (101.64%) | | | | | | | | | | | | |
| (Cost $227,798,595) | | | | | | | | | | $ | 240,545,036 | |
| LIABILITIES IN EXCESS OF OTHER ASSETS (-1.64%) | | | | | | | | | | | (3,879,279 | ) |
| NET ASSETS - 100.00% | | | | | | | | | | $ | 236,665,757 | |
| (a) | Security, or a portion of the security position is currently on loan. The total market value of securities on loan is $4,383,058. |
| (b) | Securities exempt from registration under Rule 144A of the Securities Act of 1933. These securities may be sold in the ordinary course of business in transactions exempt from registration, normally to qualified institutional buyers. At period end, the aggregate market value of those securities was $4,883,895, representing 2.06% of net assets. |
| (c) | Securities were purchased pursuant to Regulation S under the Securities Act of 1933, which exempts securities offered and sold outside of the United States from registration. Such securities cannot be sold in the United States without either an effective registration statement filed pursuant to the Securities Act of 1933, or pursuant to an exemption from registration. As of November 30, 2023, the market value of those securities was $4,883,895, representing 2.06% of net assets. |
See Notes to Financial Statements.
17 | November 30, 2023
ALPS Emerging Sector Dividend Dogs ETF
| Schedule of Investments | November 30, 2023 |
| Security Description | | Shares | | | Value | |
| COMMON STOCKS (99.35%) | | | | | | | | |
| Brazil (12.71%) | | | | | | | | |
| Cia Siderurgica Nacional SA | | | 253,106 | | | $ | 844,364 | |
| Engie Brasil Energia SA | | | 73,000 | | | | 645,158 | |
| JBS S/A | | | 163,800 | | | | 772,401 | |
| Petroleo Brasileiro SA | | | 90,422 | | | | 659,695 | |
| TOTVS SA | | | 136,241 | | | | 922,012 | |
| Total Brazil | | | | | | | 3,843,630 | |
| | | | | | | | | |
| Chile (8.40%) | | | | | | | | |
| Banco Santander Chile, ADR | | | 34,179 | | | | 668,883 | |
| Cia Sud Americana de Vapores SA | | | 9,759,488 | | | | 566,222 | |
| Empresas CMPC SA | | | 353,830 | | | | 684,413 | |
| Falabella SA(a) | | | 265,410 | | | | 619,589 | |
| Total Chile | | | | | | | 2,539,107 | |
| | | | | | | | | |
| China (9.05%) | | | | | | | | |
| BBMG Corp.(b) | | | 5,656,000 | | | | 543,059 | |
| China Petroleum & Chemical Corp. | | | 1,065,200 | | | | 548,194 | |
| COSCO SHIPPING Holdings Co., Ltd. | | | 591,000 | | | | 544,749 | |
| Maanshan Iron & Steel Co., Ltd.(b) | | | 3,468,000 | | | | 546,086 | |
| Sinotrans, Ltd. | | | 1,518,000 | | | | 553,851 | |
| Total China | | | | | | | 2,735,939 | |
| | | | | | | | | |
| Colombia (4.30%) | | | | | | | | |
| Bancolombia SA, ADR | | | 23,886 | | | | 659,015 | |
| Ecopetrol SA, Sponsored ADR, Sponsored ADR | | | 50,954 | | | | 642,530 | |
| Total Colombia | | | | | | | 1,301,545 | |
| | | | | | | | | |
| Czech Republic (4.27%) | | | | | | | | |
| CEZ AS | | | 14,927 | | | | 660,334 | |
| Komercni banka A.S. | | | 20,342 | | | | 629,826 | |
| Total Czech Republic | | | | | | | 1,290,160 | |
| | | | | | | | | |
| Hungary (2.42%) | | | | | | | | |
| Richter Gedeon Nyrt | | | 29,022 | | | | 731,472 | |
| | | | | | | | | |
| India (7.40%) | | | | | | | | |
| Dr Reddy's Laboratories, Ltd., ADR | | | 11,163 | | | | 780,294 | |
| Infosys, Ltd., Sponsored ADR | | | 42,657 | | | | 748,630 | |
| Wipro, Ltd., ADR(b) | | | 145,935 | | | | 707,785 | |
| Total India | | | | | | | 2,236,709 | |
| | | | | | | | | |
| Indonesia (8.35%) | | | | | | | | |
| Astra International Tbk PT | | | 1,450,900 | | | | 505,149 | |
| Bukit Asam Tbk PT | | | 3,169,200 | | | | 494,485 | |
| Indo Tambangraya Megah Tbk PT | | | 302,000 | | | | 478,021 | |
| Indofood Sukses Makmur Tbk PT | | | 1,340,900 | | | | 555,466 | |
| Security Description | | Shares | | | Value | |
| Indonesia (continued) | | | | | | | | |
| Perusahaan Gas Negara Tbk PT | | | 6,853,200 | | | $ | 492,670 | |
| Total Indonesia | | | | | | | 2,525,791 | |
| | | | | | | | | |
| Malaysia (10.26%) | | | | | | | | |
| Maxis Bhd | | | 676,300 | | | | 566,063 | |
| MISC Bhd | | | 396,300 | | | | 611,524 | |
| Petronas Gas Bhd | | | 165,500 | | | | 598,848 | |
| Sime Darby Bhd | | | 1,293,900 | | | | 685,896 | |
| Sime Darby Plantation Bhd | | | 660,500 | | | | 639,308 | |
| Total Malaysia | | | | | | | 3,101,639 | |
| | | | | | | | | |
| Mexico (5.99%) | | | | | | | | |
| Coca-Cola Femsa SAB de CV, ADR | | | 7,411 | | | | 627,341 | |
| El Puerto de Liverpool SAB de CV | | | 106,652 | | | | 621,177 | |
| Kimberly-Clark de Mexico SAB de CV, Class A | | | 278,600 | | | | 563,665 | |
| Total Mexico | | | | | | | 1,812,183 | |
| | | | | | | | | |
| Philippines (4.30%) | | | | | | | | |
| Manila Electric Co. | | | 98,290 | | | | 637,672 | |
| PLDT, Inc. | | | 28,580 | | | | 663,381 | |
| Total Philippines | | | | | | | 1,301,053 | |
| | | | | | | | | |
| Russia (0.00%(c)) | | | | | | | | |
| Mobile TeleSystems PJSC, Sponsored ADR(a)(d) | | | 64,600 | | | | 646 | |
| Novolipetsk Steel PJSC, GDR(a)(d)(e) | | | 17,594 | | | | 176 | |
| Severstal PAO, GDR(a)(d)(e) | | | 23,283 | | | | 233 | |
| X5 Retail Group NV, GDR(a)(d)(e) | | | 17,785 | | | | 178 | |
| Total Russia | | | | | | | 1,233 | |
| | | | | | | | | |
| South Africa (10.15%) | | | | | | | | |
| African Rainbow Minerals, Ltd. | | | 73,912 | | | | 712,488 | |
| MultiChoice Group | | | 153,373 | | | | 550,479 | |
| Nedbank Group, Ltd. | | | 54,962 | | | | 623,347 | |
| Ninety One, Ltd. | | | 294,764 | | | | 642,340 | |
| Vodacom Group, Ltd. | | | 105,399 | | | | 542,335 | |
| Total South Africa | | | | | | | 3,070,989 | |
| | | | | | | | | |
| Thailand (10.20%) | | | | | | | | |
| Bangkok Dusit Medical Services PCL | | | 987,200 | | | | 736,664 | |
| Bumrungrad Hospital Pcl | | | 105,500 | | | | 668,794 | |
| Delta Electronics Thailand PCL | | | 255,000 | | | | 563,606 | |
| Home Product Center PCL | | | 1,582,400 | | | | 530,803 | |
| Intouch Holdings PCL | | | 295,800 | | | | 586,513 | |
| Total Thailand | | | | | | | 3,086,380 | |
18 | November 30, 2023
ALPS Emerging Sector Dividend Dogs ETF
| Schedule of Investments | November 30, 2023 |
| Security Description | | Shares | | | Value | |
| Turkey (1.55%) | | | | | | |
Tofas Turk Otomobil Fabrikasi A.S. | | | 56,838 | | | $ | 469,463 | |
| | | | | | | | | |
| TOTAL COMMON STOCKS | | | | | | | | |
| (Cost $31,288,651) | | | | | | | 30,047,293 | |
| | | 7 Day Yield | | | Shares | | | Value | |
| SHORT TERM INVESTMENTS (0.32%) | | | | | | | | | | | | |
| Money Market Fund (0.15%) | | | | | | | | | | | | |
| State Street Institutional Treasury Plus Money Market Fund (Premier Class) (Cost $46,205) | | | 5.31 | % | | | 46,205 | | | $ | 46,205 | |
| | | | | | | | | | | | | |
| Investments Purchased with Collateral | | | | | | | | | | | | |
| from Securities Loaned (0.17%) | | | | | | | | | | | | |
| State Street Navigator Securities Lending Government Money Market Portfolio, 5.37% (Cost $51,420) | | | | | | | 51,420 | | | | 51,420 | |
| TOTAL SHORT TERM INVESTMENTS | | | | | | | | | | | | |
| | | | | | | | | | | | | |
| (Cost $97,625) | | | | | | | | | | | 97,625 | |
| | | | | | | | | | | | | |
| TOTAL INVESTMENTS (99.67%) | | | | | | | | | | | | |
| (Cost $31,386,276) | | | | | | | | | | $ | 30,144,918 | |
| OTHER ASSETS IN EXCESS OF LIABILITIES (0.33%) | | | | | | | | | | | 98,516 | |
| NET ASSETS - 100.00% | | | | | | | | | | $ | 30,243,434 | |
| (a) | Non-income producing security. |
| (b) | Security, or a portion of the security position is currently on loan. The total market value of securities on loan is $172,750. |
| (d) | As a result of the use of significant unobservable inputs to determine fair value, these investments have been classified as Level 3 securities under the fair value hierarchy. |
| (e) | Securities were purchased pursuant to Regulation S under the Securities Act of 1933, which exempts securities offered and sold outside of the United States from registration. Such securities cannot be sold in the United States without either an effective registration statement filed pursuant to the Securities Act of 1933, or pursuant to an exemption from registration. As of November 30, 2023, the market value of those securities was $587, representing 0.01% of net assets. |
See Notes to Financial Statements.
19 | November 30, 2023
ALPS REIT Dividend Dogs ETF
| Schedule of Investments | November 30, 2023 |
| Security Description | | Shares | | | Value | |
| COMMON STOCKS (99.63%) | | | | | | | | |
| Data Center REITs (2.37%) | | | | | | | | |
| Equinix, Inc. | | | 339 | | | $ | 276,288 | |
| | | | | | | | | |
| Diversified REITs (10.64%) | | | | | | | | |
| Broadstone Net Lease, Inc. | | | 15,906 | | | | 254,496 | |
| CTO Realty Growth, Inc. | | | 15,224 | | | | 257,286 | |
| Gladstone Commercial Corp. | | | 19,775 | | | | 247,187 | |
| Global Net Lease, Inc. | | | 23,301 | | | | 204,583 | |
| One Liberty Properties, Inc. | | | 13,534 | | | | 276,500 | |
| Total Diversified REITs | | | | | | | 1,240,052 | |
| | | | | | | | | |
| Health Care REITs (10.83%) | | | | | | | | |
| Global Medical REIT, Inc. | | | 27,848 | | | | 279,315 | |
| Healthcare Realty Trust, Inc. | | | 15,707 | | | | 239,846 | |
| Medical Properties Trust, Inc. | | | 39,549 | | | | 191,813 | |
| Omega Healthcare Investors, Inc. | | | 8,179 | | | | 259,683 | |
| Sabra Health Care REIT, Inc. | | | 20,030 | | | | 292,438 | |
| Total Health Care REITs | | | | | | | 1,263,095 | |
| | | | | | | | | |
| Hotel & Resort REITs (11.29%) | | | | | | | | |
| Apple Hospitality REIT, Inc. | | | 16,258 | | | | 271,021 | |
| Park Hotels & Resorts, Inc. | | | 20,358 | | | | 301,909 | |
| Pebblebrook Hotel Trust(a) | | | 17,683 | | | | 225,458 | |
| RLJ Lodging Trust | | | 26,002 | | | | 277,961 | |
| Service Properties Trust | | | 33,497 | | | | 239,504 | |
| Total Hotel & Resort REITs | | | | | | | 1,315,853 | |
| | | | | | | | | |
| Industrial REITs (10.69%) | | | | | | | | |
| EastGroup Properties, Inc. | | | 1,471 | | | | 255,586 | |
| Innovative Industrial Properties, Inc. | | | 2,966 | | | | 242,204 | |
| LXP Industrial Trust | | | 27,295 | | | | 239,650 | |
| Plymouth Industrial REIT, Inc. | | | 11,546 | | | | 251,125 | |
| STAG Industrial, Inc. | | | 7,181 | | | | 257,439 | |
| Total Industrial REITs | | | | | | | 1,246,004 | |
| | | | | | | | | |
| Multi-Family Residential REITs (8.29%) | | | | | | | | |
| Apartment Income REIT Corp. | | | 8,098 | | | | 252,010 | |
| BRT Apartments Corp. | | | 14,451 | | | | 263,008 | |
| Centerspace | | | 4,229 | | | | 225,575 | |
| Clipper Realty, Inc. | | | 44,211 | | | | 225,476 | |
| Total Multi-Family Residential REITs | | | | | | | 966,069 | |
| | | | | | | | | |
| Office REITs (10.10%) | | | | | | | | |
| Brandywine Realty Trust | | | 52,946 | | | | 236,139 | |
| Hudson Pacific Properties, Inc. | | | 36,422 | | | | 213,797 | |
| Office Properties Income Trust | | | 44,582 | | | | 248,768 | |
| Piedmont Office Realty Trust, Inc., Class A | | | 38,676 | | | | 240,565 | |
| SL Green Realty Corp. | | | 6,500 | | | | 237,705 | |
| Total Office REITs | | | | | | | 1,176,974 | |
| | | | | | | | | |
| Retail REITs (11.74%) | | | | | | | | |
| Alexander's, Inc. | | | 1,329 | | | | 244,483 | |
| Security Description | | Shares | | | Value | |
| Retail REITs (continued) | | | | | | | | |
| CBL & Associates Properties, Inc. | | | 12,196 | | | $ | 286,606 | |
| Saul Centers, Inc. | | | 6,998 | | | | 258,576 | |
| Simon Property Group, Inc. | | | 2,289 | | | | 285,873 | |
| Spirit Realty Capital, Inc. | | | 7,089 | | | | 292,776 | |
| Total Retail REITs | | | | | | | 1,368,314 | |
| | | | | | | | | |
| Self-Storage REITs (2.20%) | | | | | | | | |
| National Storage Affiliates Trust | | | 7,731 | | | | 256,592 | |
| | | | | | | | | |
| Single-Family Residential REITs (2.16%) | | | | | | | | |
| UMH Properties, Inc. | | | 17,842 | | | | 251,929 | |
| | | | | | | | | |
| Specialized REITs (11.65%) | | | | | | | | |
| EPR Properties | | | 5,940 | | | | 265,043 | |
| Four Corners Property Trust, Inc. | | | 10,654 | | | | 244,935 | |
| Gaming and Leisure Properties, Inc. | | | 5,357 | | | | 250,333 | |
| Outfront Media, Inc. | | | 23,962 | | | | 293,055 | |
| Uniti Group, Inc. | | | 55,053 | | | | 304,443 | |
| Total Specialized REITs | | | | | | | 1,357,809 | |
| | | | | | | | | |
| Technology REITs (5.07%) | | | | | | | | |
| Crown Castle, Inc. | | | 2,644 | | | | 310,088 | |
| Digital Realty Trust, Inc. | | | 2,021 | | | | 280,475 | |
| Total Technology REITs | | | | | | | 590,563 | |
| | | | | | | | | |
| Telecom Tower REITs (2.60%) | | | | | | | | |
| American Tower Corp. | | | 1,453 | | | | 303,357 | |
| | | | | | | | | |
| TOTAL COMMON STOCKS | | | | | | | | |
| (Cost $14,389,611) | | | | | | | 11,612,899 | |
| | | 7 Day Yield | | | Shares | | | Value | |
| SHORT TERM INVESTMENTS (0.19%) | | | | | | | | | | | | |
| Money Market Fund (0.19%) | | | | | | | | | | | | |
| State Street Institutional Treasury Plus Money Market Fund (Premier Class) | | | 5.31 | % | | | 22,561 | | | | 22,561 | |
| | | | | | | | | | | | | |
| TOTAL SHORT TERM INVESTMENTS | | | | | | | | | | | | |
| | | | | | | | | | | | | |
| (Cost $22,561) | | | | | | | | | | | 22,561 | |
| | | | | | | | | | | | | |
| TOTAL INVESTMENTS (99.82%) | | | | | | | | | | | | |
| (Cost $14,412,172) | | | | | | | | | | $ | 11,635,460 | |
| OTHER ASSETS IN EXCESS OF LIABILITIES (0.18%) | | | | | | | | | | | 20,892 | |
| NET ASSETS - 100.00% | | | | | | | | | | $ | 11,656,352 | |
| (a) | Security, or a portion of the security position is currently on loan. The total market value of securities on loan is $202,100. |
See Notes to Financial Statements.
20 | November 30, 2023
ALPS ETF Trust
| Statements of Assets and Liabilities | November 30, 2023 |
| | | ALPS Sector
Dividend Dogs
ETF | | | ALPS
International
Sector Dividend
Dogs ETF | | | ALPS Emerging
Sector Dividend
Dogs ETF | | | ALPS REIT
Dividend Dogs
ETF | |
| ASSETS: | | | | | | | | | | | | |
| Investments, at value* | | $ | 1,091,441,316 | | | $ | 240,545,036 | | | $ | 30,144,918 | | | $ | 11,635,460 | |
| Foreign currency, at value (Cost $–, $82,169, $38,322 and $–) | | | – | | | | 82,171 | | | | 38,195 | | | | – | |
| Foreign tax reclaims | | | – | | | | 635,697 | | | | 6,174 | | | | 1,280 | |
| Dividends receivable | | | 6,461,408 | | | | 794,893 | | | | 120,279 | | | | 22,812 | |
| Receivable for investments sold | | | 1,216,204 | | | | 2,246,772 | | | | 38,128 | | | | – | |
| Receivable for shares sold | | | – | | | | 1,440,309 | | | | – | | | | – | |
| Total Assets | | | 1,099,118,928 | | | | 245,744,878 | | | | 30,347,694 | | | | 11,659,552 | |
| | | | | | | | | | | | | | | | | |
| LIABILITIES: | | | | | | | | | | | | | | | | |
| Payable for investments purchased | | | 2,211,510 | | | | 4,423,007 | | | | 38,196 | | | | – | |
| Payable to adviser | | | 311,326 | | | | 92,871 | | | | 14,644 | | | | 3,200 | |
| Payable for shares redeemed | | | 1,217,946 | | | | – | | | | – | | | | – | |
| Payable for collateral upon return of securities loaned | | | – | | | | 4,563,243 | | | | 51,420 | | | | – | |
| Total Liabilities | | | 3,740,782 | | | | 9,079,121 | | | | 104,260 | | | | 3,200 | |
| NET ASSETS | | $ | 1,095,378,146 | | | $ | 236,665,757 | | | $ | 30,243,434 | | | $ | 11,656,352 | |
| | | | | | | | | | | | | | | | | |
| NET ASSETS CONSIST OF: | | | | | | | | | | | | | | | | |
| Paid-in capital | | $ | 1,359,886,937 | | | $ | 282,926,866 | | | $ | 41,629,458 | | | $ | 23,713,932 | |
| Total Distributable earnings/(accumulated losses) | | | (264,508,791 | ) | | | (46,261,109 | ) | | | (11,386,024 | ) | | | (12,057,580 | ) |
| NET ASSETS | | $ | 1,095,378,146 | | | $ | 236,665,757 | | | $ | 30,243,434 | | | $ | 11,656,352 | |
| | | | | | | | | | | | | | | | | |
| INVESTMENTS, AT COST | | $ | 1,182,880,806 | | | $ | 227,798,595 | | | $ | 31,386,276 | | | $ | 14,412,172 | |
| | | | | | | | | | | | | | | | | |
| PRICING OF SHARES: | | | | | | | | | | | | | | | | |
| Net Assets | | $ | 1,095,378,146 | | | $ | 236,665,757 | | | $ | 30,243,434 | | | $ | 11,656,352 | |
| Shares of beneficial interest outstanding (Unlimited number of shares authorized, par value $0.01 per share) | | | 22,484,141 | | | | 8,250,000 | | | | 1,450,000 | | | | 325,000 | |
| Net Asset Value, offering and redemption price per share | | $ | 48.72 | | | $ | 28.69 | | | $ | 20.86 | | | $ | 35.87 | |
| * | Includes $17,948,193, $4,383,058, $172,750, and $202,100 respectively of securities on loan. |
See Notes to Financial Statements.
21 | November 30, 2023
ALPS ETF Trust
| Statements of Operations | For the Year Ended November 30, 2023 |
| | | ALPS Sector Dividend Dogs ETF | | | ALPS International Sector Dividend Dogs ETF | | | ALPS Emerging Sector Dividend Dogs ETF | | | ALPS REIT Dividend Dogs ETF | |
| INVESTMENT INCOME: | | | | | | | | | | | | |
| Dividends* | | $ | 53,646,353 | | | $ | 11,492,366 | | | $ | 2,107,307 | | | $ | 683,898 | |
| Securities Lending Income | | | 857 | | | | 11,672 | | | | 2,040 | | | | 942 | |
| Total Investment Income | | | 53,647,210 | | | | 11,504,038 | | | | 2,109,347 | | | | 684,840 | |
| | | | | | | | | | | | | | | | | |
| EXPENSES: | | | | | | | | | | | | | | | | |
| Investment adviser fees | | | 4,489,145 | | | | 1,023,339 | | | | 177,374 | | | | 53,940 | |
| Total Expenses | | | 4,489,145 | | | | 1,023,339 | | | | 177,374 | | | | 53,940 | |
| NET INVESTMENT INCOME | | | 49,158,065 | | | | 10,480,699 | | | | 1,931,973 | | | | 630,900 | |
| | | | | | | | | | | | | | | | | |
| REALIZED AND UNREALIZED GAIN/(LOSS) | | | | | | | | | | | | | | | | |
| Net realized gain/(loss) on investments(a) | | | 40,887,629 | | | | (3,440,498 | ) | | | (1,151,239 | ) | | | (3,144,755 | ) |
| Net realized loss on foreign currency transactions | | | – | | | | (53,311 | ) | | | (29,954 | ) | | | – | |
| Total net realized gain/(loss) | | | 40,887,629 | | | | (3,493,809 | ) | | | (1,181,193 | ) | | | (3,144,755 | ) |
| Net change in unrealized appreciation/(depreciation) on investments | | | (159,451,318 | ) | | | 23,994,177 | | | | 562,335 | | | | 955,249 | |
| Net change in unrealized appreciation/(depreciation) on translation of assets and liabilities denominated in foreign currencies | | | – | | | | 13,772 | | | | (1,120 | ) | | | 56 | |
| Total net change in unrealized appreciation/(depreciation) | | | (159,451,318 | ) | | | 24,007,949 | | | | 561,215 | | | | 955,305 | |
| NET REALIZED AND UNREALIZED GAIN/(LOSS) ON INVESTMENTS | | | (118,563,689 | ) | | | 20,514,140 | | | | (619,978 | ) | | | (2,189,450 | ) |
| NET INCREASE/(DECREASE) IN NET ASSETS RESULTING FROM OPERATIONS | | $ | (69,405,624 | ) | | $ | 30,994,839 | | | $ | 1,311,995 | | | $ | (1,558,550 | ) |
| *Net of foreign tax withholding: | | $ | – | | | $ | 1,711,805 | | | $ | 293,384 | | | $ | – | |
| (a) | Includes realized gain or loss as a result of in-kind transactions (See Note 4 in Notes to Financial Statements). |
See Notes to Financial Statements.
22 | November 30, 2023
ALPS Sector Dividend Dogs ETF
| Statements of Changes in Net Assets |
| | | For the
Year Ended
November 30, 2023 | | | For the
Year Ended
November 30, 2022 | |
| OPERATIONS: | | | | | | |
| Net investment income | | $ | 49,158,065 | | | $ | 47,106,686 | |
| Net realized gain | | | 40,887,629 | | | | 79,831,594 | |
| Net change in unrealized appreciation/(depreciation) | | | (159,451,318 | ) | | | (10,173,890 | ) |
| Net increase/(decrease) in net assets resulting from operations | | | (69,405,624 | ) | | | 116,764,390 | |
| | | | | | | | | |
| Net Equalization Credits/(Debits) | | | (2,391,020 | ) | | | 1,492,734 | |
| | | | | | | | | |
| DISTRIBUTIONS TO SHAREHOLDERS: | | | | | | | | |
| From distributable earnings | | | (51,058,930 | ) | | | (46,839,426 | ) |
| Total distributions | | | (51,058,930 | ) | | | (46,839,426 | ) |
| | | | | | | | | |
| CAPITAL SHARE TRANSACTIONS: | | | | | | | | |
| Proceeds from sale of shares | | | 48,739,416 | | | | 142,289,681 | |
| Cost of shares redeemed | | | (135,465,114 | ) | | | (44,389,643 | ) |
| Net income equalization (Note 2) | | | 2,391,020 | | | | (1,492,734 | ) |
| Net increase/(decrease) from share transactions | | | (84,334,678 | ) | | | 96,407,304 | |
| Net increase/(decrease) in net assets | | | (207,190,252 | ) | | | 167,825,002 | |
| | | | | | | | | |
| NET ASSETS: | | | | | | | | |
| Beginning of year | | | 1,302,568,398 | | | | 1,134,743,396 | |
| End of year | | $ | 1,095,378,146 | | | $ | 1,302,568,398 | |
| | | | | | | | | |
| OTHER INFORMATION: | | | | | | | | |
| CAPITAL SHARE TRANSACTIONS: | | | | | | | | |
| Beginning shares | | | 24,309,141 | | | | 22,484,141 | |
| Shares sold | | | 950,000 | | | | 2,700,000 | |
| Shares redeemed | | | (2,775,000 | ) | | | (875,000 | ) |
| Shares outstanding, end of year | | | 22,484,141 | | | | 24,309,141 | |
See Notes to Financial Statements.
23 | November 30, 2023
ALPS International Sector Dividend Dogs ETF
Statements of Changes in Net Assets
| | | For the
Year Ended
November 30, 2023 | | | For the
Year Ended
November 30, 2022 | |
| OPERATIONS: | | | | | | |
| Net investment income | | $ | 10,480,699 | | | $ | 7,271,405 | |
| Net realized gain/(loss) | | | (3,493,809 | ) | | | 12,053 | |
| Net change in unrealized appreciation/(depreciation) | | | 24,007,949 | | | | (5,804,169 | ) |
| Net increase in net assets resulting from operations | | | 30,994,839 | | | | 1,479,289 | |
| | | | | | | | | |
| Net Equalization Credits | | | 1,593,144 | | | | 157,925 | |
| | | | | | | | | |
| DISTRIBUTIONS TO SHAREHOLDERS: | | | | | | | | |
| From distributable earnings | | | (10,066,812 | ) | | | (6,875,035 | ) |
| From tax return of capital | | | – | | | | (104,515 | ) |
| Total distributions | | | (10,066,812 | ) | | | (6,979,550 | ) |
| | | | | | | | | |
| CAPITAL SHARE TRANSACTIONS: | | | | | | | | |
| Proceeds from sale of shares | | | 60,732,845 | | | | 47,390,193 | |
| Cost of shares redeemed | | | (14,945,757 | ) | | | (29,427,911 | ) |
| Net income equalization (Note 2) | | | (1,593,144 | ) | | | (157,925 | ) |
| Net increase from share transactions | | | 44,193,944 | | | | 17,804,357 | |
| Net increase in net assets | | | 66,715,115 | | | | 12,462,021 | |
| | | | | | | | | |
| NET ASSETS: | | | | | | | | |
| Beginning of year | | | 169,950,642 | | | | 157,488,621 | |
| End of year | | $ | 236,665,757 | | | $ | 169,950,642 | |
| | | | | | | | | |
| OTHER INFORMATION: | | | | | | | | |
| CAPITAL SHARE TRANSACTIONS: | | | | | | | | |
| Beginning shares | | | 6,575,000 | | | | 5,950,000 | |
| Shares sold | | | 2,225,000 | | | | 1,775,000 | |
| Shares redeemed | | | (550,000 | ) | | | (1,150,000 | ) |
| Shares outstanding, end of year | | | 8,250,000 | | | | 6,575,000 | |
See Notes to Financial Statements.
24 | November 30, 2023
ALPS Emerging Sector Dividend Dogs ETF
Statements of Changes in Net Assets
| | | For the Year Ended November 30, 2023 | | | For the Year Ended November 30, 2022 | |
| OPERATIONS: | | | | | | |
| Net investment income | | $ | 1,931,973 | | | $ | 1,344,781 | |
| Net realized loss | | | (1,181,193 | ) | | | (97,520 | ) |
| Net change in unrealized appreciation/(depreciation) | | | 561,215 | | | | (2,290,146 | ) |
| Net increase/(decrease) in net assets resulting from operations | | | 1,311,995 | | | | (1,042,885 | ) |
| | | | | | | | | |
| Net Equalization Credits/(Debits) | | | (7,348 | ) | | | 69,251 | |
| | | | | | | | | |
| DISTRIBUTIONS TO SHAREHOLDERS: | | | | | | | | |
| From distributable earnings | | | (1,969,818 | ) | | | (1,199,258 | ) |
| Total distributions | | | (1,969,818 | ) | | | (1,199,258 | ) |
| | | | | | | | | |
| CAPITAL SHARE TRANSACTIONS: | | | | | | | | |
| Proceeds from sale of shares | | | 3,780,259 | | | | 8,949,252 | |
| Cost of shares redeemed | | | (1,060,988 | ) | | | (3,266,629 | ) |
| Net income equalization (Note 2) | | | 7,348 | | | | (69,251 | ) |
| Net increase from share transactions | | | 2,726,619 | | | | 5,613,372 | |
| Net increase in net assets | | | 2,061,448 | | | | 3,440,480 | |
| | | | | | | | | |
| NET ASSETS: | | | | | | | | |
| Beginning of year | | | 28,181,986 | | | | 24,741,506 | |
| End of year | | $ | 30,243,434 | | | $ | 28,181,986 | |
| | | | | | | | | |
| OTHER INFORMATION: | | | | | | | | |
| CAPITAL SHARE TRANSACTIONS: | | | | | | | | |
| Beginning shares | | | 1,325,000 | | | | 1,050,000 | |
| Shares sold | | | 175,000 | | | | 450,000 | |
| Shares redeemed | | | (50,000 | ) | | | (175,000 | ) |
| Shares outstanding, end of year | | | 1,450,000 | | | | 1,325,000 | |
See Notes to Financial Statements.
25 | November 30, 2023
ALPS REIT Dividend Dogs ETF
Statements of Changes in Net Assets
| | | For the Year Ended November 30, 2023 | | | For the Year Ended November 30, 2022 | |
| OPERATIONS: | | | | | | |
| Net investment income | | $ | 630,900 | | | $ | 801,823 | |
| Net realized gain/(loss) | | | (3,144,755 | ) | | | 3,120,128 | |
| Net change in unrealized appreciation/(depreciation) | | | 955,305 | | | | (7,304,705 | ) |
| Net decrease in net assets resulting from operations | | | (1,558,550 | ) | | | (3,382,754 | ) |
| | | | | | | | | |
| DISTRIBUTIONS TO SHAREHOLDERS: | | | | | | | | |
| From distributable earnings | | | (651,314 | ) | | | (825,395 | ) |
| From tax return of capital | | | (442,862 | ) | | | (282,853 | ) |
| Total distributions | | | (1,094,176 | ) | | | (1,108,248 | ) |
| | | | | | | | | |
| CAPITAL SHARE TRANSACTIONS: | | | | | | | | |
| Cost of shares redeemed | | | (6,444,564 | ) | | | (3,444,778 | ) |
| Net decrease from share transactions | | | (6,444,564 | ) | | | (3,444,778 | ) |
| Net decrease in net assets | | | (9,097,290 | ) | | | (7,935,780 | ) |
| | | | | | | | | |
| NET ASSETS: | | | | | | | | |
| Beginning of year | | | 20,753,642 | | | | 28,689,422 | |
| End of year | | $ | 11,656,352 | | | $ | 20,753,642 | |
| | | | | | | | | |
| OTHER INFORMATION: | | | | | | | | |
| CAPITAL SHARE TRANSACTIONS: | | | | | | | | |
| Beginning shares | | | 500,000 | | | | 575,000 | |
| Shares sold | | | – | | | | – | |
| Shares redeemed | | | (175,000 | ) | | | (75,000 | ) |
| Shares outstanding, end of year | | | 325,000 | | | | 500,000 | |
See Notes to Financial Statements.
26 | November 30, 2023
ALPS Sector Dividend Dogs ETF
| Financial Highlights | For a Share Outstanding Throughout the Periods Presented |
| | | For the Year
Ended
November 30,
2023 | | | For the Year
Ended
November 30,
2022 | | | For the Year
Ended
November 30,
2021 | | | For the Year
Ended
November 30,
2020 | | | For the Year
Ended
November 30,
2019 | |
| NET ASSET VALUE, BEGINNING OF PERIOD | | $ | 53.58 | | | $ | 50.47 | | | $ | 43.69 | | | $ | 45.78 | | | $ | 44.26 | |
| | | | | | | | | | | | | | | | | | | | | |
| INCOME/(LOSS) FROM INVESTMENT OPERATIONS: | | | | | | | | | | | | | | | | | | | | |
| Net investment income (a) | | | 2.06 | | | | 2.02 | | | | 1.75 | | | | 1.70 | | | | 1.71 | |
| Net realized and unrealized gain/(loss) | | | (4.79 | ) | | | 3.11 | | | | 6.84 | | | | (2.14 | ) | | | 1.34 | |
| Total from investment operations | | | (2.73 | ) | | | 5.13 | | | | 8.59 | | | | (0.44 | ) | | | 3.05 | |
| | | | | | | | | | | | | | | | | | | | | |
| DISTRIBUTIONS: | | | | | | | | | | | | | | | | | | | | |
| From net investment income | | | (2.13 | ) | | | (2.02 | ) | | | (1.81 | ) | | | (1.65 | ) | | | (1.53 | ) |
| Total distributions | | | (2.13 | ) | | | (2.02 | ) | | | (1.81 | ) | | | (1.65 | ) | | | (1.53 | ) |
| | | | | | | | | | | | | | | | | | | | | |
| Net increase/(decrease) in net asset value | | | (4.86 | ) | | | 3.11 | | | | 6.78 | | | | (2.09 | ) | | | 1.52 | |
| NET ASSET VALUE, END OF PERIOD | | $ | 48.72 | | | $ | 53.58 | | | $ | 50.47 | | | $ | 43.69 | | | $ | 45.78 | |
| TOTAL RETURN(b) | | | (5.07 | )% | | | 10.42 | % | | | 19.77 | % | | | (0.27 | )% | | | 7.26 | % |
| | | | | | | | | | | | | | | | | | | | | |
| RATIOS/SUPPLEMENTAL DATA: | | | | | | | | | | | | | | | | | | | | |
| Net assets, end of period (000s) | | $ | 1,095,378 | | | $ | 1,302,568 | | | $ | 1,134,743 | | | $ | 1,007,514 | | | $ | 1,746,784 | |
| | | | | | | | | | | | | | | | | | | | | |
| Ratio of expenses to average net assets | | | 0.37 | %(c) | | | 0.40 | % | | | 0.40 | % | | | 0.40 | % | | | 0.40 | % |
| Ratio of net investment income to average net assets | | | 4.10 | % | | | 3.84 | % | | | 3.43 | % | | | 4.27 | % | | | 3.97 | % |
| Portfolio turnover rate(d) | | | 51 | % | | | 53 | % | | | 54 | % | | | 77 | % | | | 55 | % |
| Undistributed net investment income included in price of units issued and redeemed(a)(e) | | $ | (0.10 | ) | | $ | 0.06 | | | $ | (0.02 | ) | | $ | 0.12 | | | $ | 0.06 | |
| (a) | Based on average shares outstanding during the period. |
| (b) | Total return is calculated assuming an initial investment made at the net asset value at the beginning of the period and redemption at the net asset value on the last day of the period and assuming all distributions are reinvested at reinvestment prices. Total return calculated for a period of less than one year is not annualized. |
| (c) | Effective April 1, 2023 the Advisory Fee changed from 0.40% to 0.36%. |
| (d) | Portfolio turnover for periods less than one year is not annualized and does not include securities received or delivered from processing creations or redemptions in-kind. |
| (e) | The per share amount of equalization is presented to show the impact of equalization on distributable earnings per share. |
See Notes to Financial Statements.
27 | November 30, 2023
ALPS International Sector Dividend Dogs ETF
| Financial Highlights | For a Share Outstanding Throughout the Periods Presented |
| | | For the
Year
Ended
November 30, 2023 | | | For the
Year
Ended
November 30,
2022 | | | For the
Year
Ended
November 30,
2021 | | | For the
Year
Ended
November 30,
2020 | | | For the
Year
Ended
November 30,
2019 | |
| NET ASSET VALUE, BEGINNING OF PERIOD | | $ | 25.85 | | | $ | 26.47 | | | $ | 24.82 | | | $ | 26.88 | | | $ | 25.14 | |
| | | | | | | | | | | | | | | | | | | | | |
| INCOME/(LOSS) FROM INVESTMENT OPERATIONS: | | | | | | | | | | | | | | | | | | | | |
| Net investment income(a) | | | 1.41 | | | | 1.15 | | | | 1.09 | | | | 0.75 | | | | 1.20 | |
| Net realized and unrealized gain/(loss) | | | 2.80 | | | | (0.68 | ) | | | 1.65 | | | | (1.66 | ) | | | 1.69 | |
| Total from investment operations | | | 4.21 | | | | 0.47 | | | | 2.74 | | | | (0.91 | ) | | | 2.89 | |
| | | | | | | | | | | | | | | | | | | | | |
| DISTRIBUTIONS: | | | | | | | | | | | | | | | | | | | | |
| From net investment income | | | (1.37 | ) | | | (1.07 | ) | | | (1.08 | ) | | | (1.11 | ) | | | (1.15 | ) |
| Tax return of capital | | | – | | | | (0.02 | ) | | | (0.01 | ) | | | (0.04 | ) | | | – | |
| Total distributions | | | (1.37 | ) | | | (1.09 | ) | | | (1.09 | ) | | | (1.15 | ) | | | (1.15 | ) |
| | | | | | | | | | | | | | | | | | | | | |
| Net increase/(decrease) in net asset value | | | 2.84 | | | | (0.62 | ) | | | 1.65 | | | | (2.06 | ) | | | 1.74 | |
| NET ASSET VALUE, END OF PERIOD | | $ | 28.69 | | | $ | 25.85 | | | $ | 26.47 | | | $ | 24.82 | | | $ | 26.88 | |
| TOTAL RETURN(b) | | | 16.71 | % | | | 1.92 | % | | | 10.93 | % | | | (3.08 | )% | | | 11.79 | % |
| | | | | | | | | | | | | | | | | | | | | |
| RATIOS/SUPPLEMENTAL DATA: | | | | | | | | | | | | | | | | | | | | |
| Net assets, end of period (000s) | | $ | 236,666 | | | $ | 169,951 | | | $ | 157,489 | | | $ | 146,431 | | | $ | 221,741 | |
| | | | | | | | | | | | | | | | | | | | | |
| Ratio of expenses to average net assets | | | 0.50 | % | | | 0.50 | % | | | 0.50 | % | | | 0.50 | % | | | 0.50 | % |
| Ratio of net investment income to average net assets | | | 5.12 | % | | | 4.43 | % | | | 3.92 | % | | | 3.22 | % | | | 4.65 | % |
| Portfolio turnover rate(c) | | | 62 | % | | | 54 | % | | | 61 | % | | | 79 | % | | | 58 | % |
| Undistributed net investment income included in price of units issued and redeemed(a)(d) | | $ | 0.21 | | | $ | 0.03 | | | $ | (0.25 | ) | | $ | 0.00 | (e) | | $ | 0.04 | |
| (a) | Based on average shares outstanding during the period. |
| (b) | Total return is calculated assuming an initial investment made at the net asset value at the beginning of the period and redemption at the net asset value on the last day of the period and assuming all distributions are reinvested at reinvestment prices. Total return calculated for a period of less than one year is not annualized. |
| (c) | Portfolio turnover for periods less than one year is not annualized and does not include securities received or delivered from processing creations or redemptions in-kind. |
| (d) | The per share amount of equalization is presented to show the impact of equalization on distributable earnings per share. |
See Notes to Financial Statements.
28 | November 30, 2023
ALPS Emerging Sector Dividend Dogs ETF
| Financial Highlights | For a Share Outstanding Throughout the Periods Presented |
| | | For the
Year Ended
November 30,
2023 | | | For the
Year Ended
November 30,
2022 | | | For the
Year Ended
November 30,
2021 | | | For the
Year Ended
November 30,
2020 | | | For the
Year Ended
November 30,
2019 | |
| NET ASSET VALUE, BEGINNING OF PERIOD | | $ | 21.27 | | | $ | 23.56 | | | $ | 20.96 | | | $ | 20.67 | | | $ | 21.33 | |
| | | | | | | | | | | | | | | | | | | | | |
| INCOME/(LOSS) FROM INVESTMENT OPERATIONS: | | | | | | | | | | | | | | | | | | | | |
| Net investment income(a) | | | 1.39 | | | | 1.11 | | | | 1.04 | | | | 0.56 | | | | 0.89 | |
| Net realized and unrealized gain/(loss) | | | (0.39 | ) | | | (2.41 | ) | | | 2.50 | | | | 0.42 | | | | (0.33 | ) |
| Total from investment operations | | | 1.00 | | | | (1.30 | ) | | | 3.54 | | | | 0.98 | | | | 0.56 | |
| | | | | | | | | | | | | | | | | | | | | |
| DISTRIBUTIONS: | | | | | | | | | | | | | | | | | | | | |
| From net investment income | | | (1.41 | ) | | | (0.99 | ) | | | (0.94 | ) | | | (0.69 | ) | | | (1.22 | ) |
| Total distributions | | | (1.41 | ) | | | (0.99 | ) | | | (0.94 | ) | | | (0.69 | ) | | | (1.22 | ) |
| | | | | | | | | | | | | | | | | | | | | |
| Net increase/(decrease) in net asset value | | | (0.41 | ) | | | (2.29 | ) | | | 2.60 | | | | 0.29 | | | | (0.66 | ) |
| NET ASSET VALUE, END OF PERIOD | | $ | 20.86 | | | $ | 21.27 | | | $ | 23.56 | | | $ | 20.96 | | | $ | 20.67 | |
| TOTAL RETURN(b) | | | 4.88 | % | | | (5.20 | )% | | | 16.81 | % | | | 5.20 | % | | | 2.67 | % |
| | | | | | | | | | | | | | | | | | | | | |
| RATIOS/SUPPLEMENTAL DATA: | | | | | | | | | | | | | | | | | | | | |
| Net assets, end of period (000s) | | $ | 30,243 | | | $ | 28,182 | | | $ | 24,742 | | | $ | 20,958 | | | $ | 28,941 | |
| | | | | | | | | | | | | | | | | | | | | |
| Ratio of expenses to average net assets | | | 0.60 | % | | | 0.60 | % | | | 0.60 | % | | | 0.60 | % | | | 0.60 | % |
| Ratio of net investment income to average net assets | | | 6.54 | % | | | 5.17 | % | | | 4.32 | % | | | 2.92 | % | | | 4.16 | % |
| Portfolio turnover rate(c) | | | 85 | % | | | 90 | % | | | 84 | % | | | 93 | % | | | 83 | % |
| Undistributed net investment income included in price of units issued and redeemed(a)(d) | | $ | (0.01 | ) | | $ | 0.06 | | | $ | 0.02 | | | $ | 0.02 | | | $ | 0.01 | |
| (a) | Based on average shares outstanding during the period. |
| (b) | Total return is calculated assuming an initial investment made at the net asset value at the beginning of the period and redemption at the net asset value on the last day of the period and assuming all distributions are reinvested at reinvestment prices. Total return calculated for a period of less than one year is not annualized. |
| (c) | Portfolio turnover for periods less than one year is not annualized and does not include securities received or delivered from processing creations or redemptions in-kind. |
| (d) | The per share amount of equalization is presented to show the impact of equalization on distributable earnings per share. |
See Notes to Financial Statements.
29 | November 30, 2023
ALPS REIT Dividend Dogs ETF
| Financial Highlights | For a Share Outstanding Throughout the Periods Presented |
| | | For the Year Ended November 30, 2023 | | | For the Year Ended November 30, 2022 | | | For the Year Ended November 30, 2021 | | | For the Year Ended November 30, 2020 (a) | | | For the Year Ended November 30, 2019 | |
| NET ASSET VALUE, BEGINNING OF PERIOD | | $ | 41.51 | | | $ | 49.89 | | | $ | 40.49 | | | $ | 48.42 | | | $ | 44.18 | |
| | | | | | | | | | | | | | | | | | | | | |
| INCOME/(LOSS) FROM INVESTMENT OPERATIONS: | | | | | | | | | | | | | | | | | | | | |
| Net investment income (b) | | | 1.51 | | | | 1.49 | | | | 1.21 | | | | 1.29 | | | | 1.19 | |
| Net realized and unrealized gain/(loss) | | | (4.62 | ) | | | (7.86 | ) | | | 10.25 | | | | (7.26 | ) | | | 4.45 | |
| Total from investment operations | | | (3.11 | ) | | | (6.37 | ) | | | 11.46 | | | | (5.97 | ) | | | 5.64 | |
| | | | | | | | | | | | | | | | | | | | | |
| DISTRIBUTIONS: | | | | | | | | | | | | | | | | | | | | |
| From net investment income | | | (1.46 | ) | | | (1.51 | ) | | | (1.36 | ) | | | (1.57 | ) | | | (1.40 | ) |
| Tax return of capital | | | (1.07 | ) | | | (0.50 | ) | | | (0.70 | ) | | | (0.39 | ) | | | – | |
| Total distributions | | | (2.53 | ) | | | (2.01 | ) | | | (2.06 | ) | | | (1.96 | ) | | | (1.40 | ) |
| | | | | | | | | | | | | | | | | | | | | |
| Net increase/(decrease) in net asset value | | | (5.64 | ) | | | (8.38 | ) | | | 9.40 | | | | (7.93 | ) | | | 4.24 | |
| NET ASSET VALUE, END OF PERIOD | | $ | 35.87 | | | $ | 41.51 | | | $ | 49.89 | | | $ | 40.49 | | | $ | 48.42 | |
| TOTAL RETURN(c) | | | (7.16 | )% | | | (13.06 | )% | | | 29.03 | % | | | (11.77 | )% | | | 13.00 | % |
| | | | | | | | | | | | | | | | | | | | | |
| RATIOS/SUPPLEMENTAL DATA: | | | | | | | | | | | | | | | | | | | | |
| Net assets, end of period (000s) | | $ | 11,656 | | | $ | 20,754 | | | $ | 28,689 | | | $ | 26,320 | | | $ | 53,265 | |
| | | | | | | | | | | | | | | | | | | | | |
| Ratio of expenses to average net assets | | | 0.35 | % | | | 0.35 | % | | | 0.35 | % | | | 0.38 | %(d) | | | 0.55 | % |
| Ratio of net investment income to average net assets | | | 4.09 | % | | | 3.23 | % | | | 2.60 | % | | | 3.26 | % | | | 2.56 | % |
| Portfolio turnover rate(e) | | | 89 | % | | | 85 | % | | | 78 | % | | | 148 | % | | | 10 | % |
| (a) | Prior to January 2, 2020, the ALPS REIT Dividend Dogs ETF was known as the Cohen & Steers Global Realty Majors ETF. |
| (b) | Based on average shares outstanding during the period. |
| (c) | Total return is calculated assuming an initial investment made at the net asset value at the beginning of the period and redemption at the net asset value on the last day of the period and assuming all distributions are reinvested at reinvestment prices. Total return calculated for a period of less than one year is not annualized. |
| (d) | Effective January 2, 2020 the Fund's Advisory Fee changed from 0.55% to 0.35%. |
| (e) | Portfolio turnover for periods less than one year is not annualized and does not include securities received or delivered from processing creations or redemptions in-kind. |
See Notes to Financial Statements.
30 | November 30, 2023
ALPS ETF Trust
| Notes to Financial Statements | November 30, 2023 |
1. ORGANIZATION
ALPS ETF Trust (the “Trust”), a Delaware statutory trust, is an open-end management investment company registered under the Investment Company Act of 1940, as amended (the “1940 Act”). As of November 30, 2023, the Trust consisted of twenty-three separate portfolios. Each portfolio represents a separate series of the Trust. This report pertains to the ALPS Sector Dividend Dogs ETF, the ALPS International Sector Dividend Dogs ETF, the ALPS Emerging Sector Dividend Dogs ETF, and the ALPS REIT Dividend Dogs ETF (each a “Fund” and collectively, the “Funds”).
The investment objective of the ALPS Sector Dividend Dogs ETF is to seek investment results that replicate as closely as possible, before fees and expenses, the performance of the S-Network® Sector Dividend Dogs Index. The investment objective of the ALPS International Sector Dividend Dogs ETF is to seek investment results that replicate as closely as possible, before fees and expenses, the performance of the S-Network® International Sector Dividend Dogs Index. The investment objective of the ALPS Emerging Sector Dividend Dogs ETF is to seek investment results that replicate as closely as possible, before fees and expenses, the performance of the S-Network® Emerging Sector Dividend Dogs Index. The investment objective of the ALPS REIT Dividend Dogs ETF is to seek investment results that replicate as closely as possible, before fees and expenses, the performance of the S-Network® REIT Dividend Dogs Index. Each Fund has elected to qualify as a diversified series of the Trust under the 1940 Act.
Each Fund’s Shares (“Shares”) are listed on the NYSE Arca, Inc. (the “NYSE Arca”). Each Fund issues and redeems Shares, at net asset value (“NAV”) in blocks of 25,000 Shares, each of which is called a “Creation Unit”. Creation Units are issued and redeemed principally in-kind for securities included in the Underlying Index. Except when aggregated in Creation Units, Shares are not redeemable securities of the Fund.
Pursuant to the Trust’s organizational documents, its Officers and Trustees are indemnified against certain liability arising out of the performance of their duties to the Trust. Additionally, in the normal course of business, the Trust enters into contracts with service providers that contain general indemnification clauses. The Trust’s maximum exposure under these arrangements is unknown, as this would involve future claims that may be made against the Trust that have not yet occurred.
2. SIGNIFICANT ACCOUNTING POLICIES
The following is a summary of significant accounting policies consistently followed by the Funds in the preparation of the financial statements. The accompanying financial statements were prepared in accordance with accounting principles generally accepted in the United States of America (“U.S. GAAP”). The preparation of financial statements in conformity with U.S. GAAP requires management to make certain estimates and assumptions that affect the reported amounts of assets and liabilities and disclosures of contingent assets and liabilities at the date of the financial statements and the reported amounts of revenue and expenses during the period. Actual results could differ from those estimates. Each Fund is considered an investment company under U.S. GAAP and follows the accounting and reporting guidance applicable to investment companies in the Financial Accounting Standards Board (“FASB”) Accounting Standards Codification Topic 946.
A. Portfolio Valuation
Each Fund’s NAV is determined daily, as of the close of regular trading on the New York Stock Exchange (“NYSE”), normally 4:00 p.m. Eastern time, on each day the NYSE is open for trading. The NAV is computed by dividing the value of all assets of the Fund (including accrued interest and dividends), less all liabilities (including accrued expenses and dividends declared but unpaid), by the total number of shares outstanding.
Portfolio securities listed on any exchange other than the NASDAQ Stock Market LLC (“NASDAQ”) are valued at the last sale price on the business day as of which such value is being determined. If there has been no sale on such day, the securities are valued at the mean of the most recent bid and ask prices on such day. Securities traded on the NASDAQ are valued at the NASDAQ Official Closing Price as determined by NASDAQ. Portfolio securities traded on more than one securities exchange are valued at the last sale price on the business day as of which such value is being determined at the close of the exchange representing the principal market for such securities. Portfolio securities traded in the over-the-counter market, but excluding securities traded on the NASDAQ, are valued at the last quoted sale price in such market.
The Funds’ investments are valued at market value or, in the absence of market value with respect to any portfolio securities, at fair value according to procedures adopted by the Trust’s Board of Trustees (the “Board”). Pursuant to Rule 2a-5 under the 1940 Act, the Board designated ALPS Advisors, Inc. (the "Adviser") as the valuation designee ("Valuation Designee") for each Fund to perform the fair value determinations relating to Fund investments. The Adviser may carry out its designated responsibilities as Valuation Designee through various teams and committees. When market quotations are not readily available or when events occur that make established valuation methods unreliable, securities of the Funds may be valued in good faith by the Valuation Designee. These securities generally include, but are not limited to, restricted securities (securities which may not be publicly sold without registration under the Securities Act of 1933) for which a pricing service is unable to provide a market price; securities whose trading has been formally suspended; a security whose market price is not available from a pre-established primary pricing source or the pricing source is not willing to provide a price; a security with respect to which an event has occurred that is most likely to materially affect the value of the security after the market has closed but before the calculation of the Fund’s NAV or make it difficult or impossible to obtain a reliable market quotation; or a security whose price, as provided by the pricing service, does not reflect the security’s “fair value” due to the security being de-listed from a national exchange or the security’s primary trading market is temporarily closed at a time when, under normal conditions, it would be open. As a general principle, the current “fair value” of a security would be the amount which the owner might reasonably expect to receive from the sale on the applicable exchange or principal market. A variety of factors may be considered in determining the fair value of such securities.
31 | November 30, 2023
ALPS ETF Trust
| Notes to Financial Statements | November 30, 2023 |
B. Fair Value Measurements
Each Fund discloses the classification of its fair value measurements following a three-tier hierarchy based on the inputs used to measure fair value. Inputs refer broadly to the assumptions that market participants would use in pricing the asset or liability, including assumptions about risk. Inputs may be observable or unobservable. Observable inputs reflect the assumptions market participants would use in pricing the asset or liability that are developed based on market data obtained from sources independent of the reporting entity. Unobservable inputs reflect the reporting entity’s own assumptions about the assumptions market participants would use in pricing the asset or liability that are developed based on the best information available.
Valuation techniques used to value the Funds’ investments by major category are as follows:
Equity securities, including restricted securities, for which market quotations are readily available, are valued at the last reported sale price or official closing price as reported by a third party pricing vendor on the primary market or exchange on which they are traded and are categorized as Level 1 in the hierarchy. In the event there were no sales during the day or closing prices are not available, securities are valued at the mean of the most recent quoted bid and ask prices on such day and are generally categorized as Level 2 in the hierarchy. Investments in open-end mutual funds are valued at their closing NAV each business day and are categorized as Level 1 in the hierarchy.
Changes in valuation techniques may result in transfers in or out of an assigned level within the disclosure hierarchy.
Various inputs are used in determining the value of each Fund’s investments as of the end of the reporting period. When inputs used fall into different levels of the fair value hierarchy, the level in the hierarchy within which the fair value measurement falls is determined based on the lowest level input that is significant to the fair value measurement in its entirety. The designated input levels are not necessarily an indication of the risk or liquidity associated with these investments.
These inputs are categorized in the following hierarchy under applicable financial accounting standards:
| Level 1 | – | Unadjusted quoted prices in active markets for identical investments, unrestricted assets or liabilities that a Fund has the ability to access at the measurement date; |
| Level 2 | – | Quoted prices which are not active, quoted prices for similar assets or liabilities in active markets or inputs other than quoted prices that are observable (either directly or indirectly) for substantially the full term of the asset or liability; and |
| Level 3 | – | Significant unobservable prices or inputs (including the Fund’s own assumptions in determining the fair value of investments) where there is little or no market activity for the asset or liability at the measurement date. |
32 | November 30, 2023
ALPS ETF Trust
| Notes to Financial Statements | November 30, 2023 |
The following is a summary of the inputs used to value the Funds’ investments as of November 30, 2023:
ALPS Sector Dividend Dogs ETF
| Investments in Securities at Value | | Level 1 - Quoted and Unadjusted Prices | | | Level 2 - Other Significant Observable Inputs | | | Level 3 – Significant Unobservable Inputs | | | Total | |
| Common Stocks* | | $ | 1,089,681,748 | | | $ | – | | | $ | – | | | $ | 1,089,681,748 | |
| Short Term Investments | | | 1,759,568 | | | | – | | | | – | | | | 1,759,568 | |
| Total | | $ | 1,091,441,316 | | | $ | – | | | $ | – | | | $ | 1,091,441,316 | |
ALPS International Sector Dividend Dogs ETF
| Investments in Securities at Value | | Level 1 - Quoted and Unadjusted Prices | | | Level 2 - Other Significant Observable Inputs | | | Level 3 – Significant Unobservable Inputs | | | Total | |
| Common Stocks* | | $ | 235,508,752 | | | $ | – | | | $ | – | | | $ | 235,508,752 | |
| Short Term Investments | | | 5,036,284 | | | | – | | | | – | | | | 5,036,284 | |
| Total | | $ | 240,545,036 | | | $ | – | | | $ | – | | | $ | 240,545,036 | |
ALPS Emerging Sector Dividend Dogs ETF
| Investments in Securities at Value | | Level 1 - Quoted and Unadjusted Prices | | | Level 2 - Other Significant Observable Inputs | | | Level 3 – Significant Unobservable Inputs | | | Total | |
| Common Stocks* | | | | | | | | | | | | | | | | |
| Russia | | $ | – | | | $ | – | | | $ | 1,233 | | | $ | 1,233 | |
| Other* | | $ | 30,046,060 | | | | – | | | | – | | | $ | 30,046,060 | |
| Short Term Investments | | | 97,625 | | | | – | | | | – | | | | 97,625 | |
| Total | | $ | 30,143,685 | | | $ | – | | | $ | 1,233 | | | $ | 30,144,918 | |
ALPS REIT Dividend Dogs ETF
| Investments in Securities at Value | | Level 1 - Quoted and Unadjusted Prices | | | Level 2 - Other Significant Observable Inputs | | | Level 3 – Significant Unobservable Inputs | | | Total | |
| Common Stocks* | | $ | 11,612,899 | | | $ | – | | | $ | – | | | $ | 11,612,899 | |
| Short Term Investments | | | 22,561 | | | | – | | | | – | | | | 22,561 | |
| Total | | $ | 11,635,460 | | | $ | – | | | $ | – | | | $ | 11,635,460 | |
| * | For a detailed sector/country breakdown, see the accompanying Schedules of Investments. |
The Funds, except for the ALPS Emerging Sector Dividend Dogs ETF, did not have any securities that used significant unobservable inputs (Level 3) in determining fair value and there were no transfers into or out of Level 3 during the year ended November 30, 2023. The Adviser has determined that the value of Level 3 securities is not material; therefore, a reconciliation of assets of the ALPS Emerging Sector Dividend Dogs ETF for Level 3 investments for which significant unobservable inputs were used to determine fair value is not presented for the year ended November 30, 2023.
C. Foreign Securities
The ALPS International Sector Dividend Dogs ETF, the ALPS Emerging Sector Dividend Dogs ETF, and the ALPS REIT Dividend Dogs ETF may directly purchase securities of foreign issuers. Investments in non-U.S. issuers may involve unique risks compared to investing in securities of U.S. issuers, including, among others, less liquidity generally, greater market volatility than U.S. securities and less complete financial information than for U.S. issuers. In addition, adverse political, economic or social developments could undermine the value of the Fund’s investments or prevent the Fund from realizing the full value of its investments. Financial reporting standards for companies based in foreign markets differ from those in the United States. Finally, the value of the currency of the country in which the Fund has invested could decline relative to the value of the U.S. dollar, which may affect the value of the investment to U.S. investors.
Because foreign markets may be open on different days than the days during which investors may purchase the shares of each Fund, the value of each Fund's securities may change on the days when investors are not able to purchase the shares of the Funds. The value of securities denominated in foreign currencies is converted into U.S. dollars using exchange rates determined daily as of the close of regular trading on the NYSE or NASDAQ. Any use of a different rate from the rates used by the Index may adversely affect a Fund's ability to track its Index.
33 | November 30, 2023
ALPS ETF Trust
| Notes to Financial Statements | November 30, 2023 |
D. Foreign Currency Translation
The books and records of the Funds are maintained in U.S. dollars. Investment valuations and other assets and liabilities initially expressed in foreign currencies are converted each business day into U.S. dollars based upon current exchange rates. The portion of realized and unrealized gains or losses on investments due to fluctuations in foreign currency exchange rates is not separately disclosed and is included in realized and unrealized gains or losses on investments, when applicable.
E. Securities Transactions and Investment Income
Securities transactions are recorded as of the trade date. Realized gains and losses from securities transactions are recorded on the specific identification in accordance with GAAP. Dividend income and capital gains distributions, if any, are recorded on the ex-dividend date, net of any foreign taxes withheld. Interest income, if any, is recorded on the accrual basis, including any amortization of premiums and accretion of discounts. Income received from foreign sources may result in withholding tax. Withholding taxes are accrued at the same time as the related income if the tax rate is fixed and known, unless a tax withheld is reclaimable from the local tax authorities in which case it is recorded as receivable. If the tax rate is not known or estimable, such expense or reclaim receivable is recorded when the net proceeds are received.
F. Dividends and Distributions to Shareholders
Dividends from net investment income for each Fund, if any, are declared and paid quarterly or as the Board may determine from time to time. Distributions of net realized capital gains earned by the Funds, if any, are distributed at least annually.
G. Equalization
The ALPS Sector Dividend Dogs ETF, the ALPS International Sector Dividend Dogs ETF, and the ALPS Emerging Sector Dividend Dogs ETF utilize the accounting practice known as “Equalization” by which a portion of the proceeds from sales and costs of reacquiring the Funds’ shares, equivalent on a per share basis to the amount of distributable net investment income on the date of the transaction, is credited or charged to undistributed net investment income. As a result, undistributed net investment income per share is unaffected by sales or reacquisitions of the Funds’ shares. Amounts related to Equalization can be found on the Statements of Changes in Net Assets.
H. Foreign Taxes
The ALPS International Sector Dividend Dogs ETF, the ALPS Emerging Sector Dividend Dogs ETF, and the ALPS REIT Dividend Dogs ETF may be subject to foreign taxes (a portion of which may be reclaimable) on income, corporate events, foreign currency exchanges and capital gains on investments. All foreign taxes are recorded in accordance with the applicable foreign tax regulations and rates that exist in foreign markets in which the Funds invest. These foreign taxes, if any, are paid by these Funds and are disclosed in each Fund’s Statement of Operations. Foreign taxes accrued as of November 30, 2023, if any, are reflected in each Fund’s Statement of Assets and Liabilities.
I. Real Estate Investment Trusts (“REITs”)
As part of its investments in real estate related securities, the ALPS REIT Dividend Dogs ETF (“RDOG”) will invest in REITs and is subject to certain risks associated with direct investment in REITs. REITs possess certain risks which differ from an investment in common stocks. REITs are financial vehicles that pool investors’ capital to acquire, develop and/or finance real estate and provide services to their tenants. REITs may concentrate their investments in specific geographic areas or in specific property types, e.g., regional malls, shopping centers, office buildings, apartment buildings and industrial warehouses. REITs may be affected by changes in the value of their underlying properties and by defaults by borrowers or tenants. REITs depend generally on their ability to generate cash flow to make distributions to shareowners, and certain REITs have self-liquidation provisions by which mortgages held may be paid in full and distributions of capital returns may be made at any time.
As REITs generally pay a higher rate of dividends than most other operating companies, to the extent application of RDOG’s investment strategy results in RDOG investing in REIT shares, the percentage of RDOG’s dividend income received from REIT shares will likely exceed the percentage of RDOG’s portfolio that is comprised of REIT shares. Distributions received by RDOG from REITs may consist of dividends, capital gains and/or return of capital.
Dividend income from REITs is recognized on the ex-dividend date. The calendar year-end amounts of ordinary income, capital gains, and return of capital included in distributions received from RDOG’s investments in REITs are reported to RDOG after the end of the calendar year; accordingly, RDOG estimates these amounts for accounting purposes until the characterization of REIT distributions is reported to RDOG after the end of the calendar year. Estimates are based on the most recent REIT distribution information available.
The performance of a REIT may be affected by its failure to qualify for tax-free pass-through of income under the Internal Revenue Code of 1986, as amended (the “Code”), or its failure to maintain exemption from registration under the 1940 Act. Due to RDOG’s investments in REITs, RDOG may also make distributions in excess of RDOG’s earnings and capital gains. Distributions, if any, in excess of RDOG’s earnings and profits will first reduce the adjusted tax basis of a holder’s shares and, after that basis has been reduced to zero, will constitute capital gains to the shareholder.
34 | November 30, 2023
ALPS ETF Trust
| Notes to Financial Statements | November 30, 2023 |
J. Federal Tax and Tax Basis Information
The timing and character of income and capital gain distributions are determined in accordance with income tax regulations, which may differ from U.S. GAAP. Reclassifications are made to the Funds’ capital accounts for permanent tax differences to reflect income and gains available for distribution (or available capital loss carryforwards) under income tax regulations.
For the year ended November 30, 2023, the following reclassifications, which had no impact on results of operations or net assets, were recorded to reflect permanent tax differences resulting primarily from in-kind transactions and prior year tax return true-ups:
| Fund | | Paid-in Capital | | | Total Distributable Earnings | |
| ALPS Sector Dividend Dogs ETF | | $ | 8,453,870 | | | $ | (8,453,870 | ) |
| ALPS International Sector Dividend Dogs ETF | | | 1,589,245 | | | | (1,589,245 | ) |
| ALPS Emerging Sector Dividend Dogs ETF | | | 155,716 | | | | (155,716 | ) |
| ALPS REIT Dividend Dogs ETF | | | (404,750 | ) | | | 404,750 | |
The tax character of distributions paid during the fiscal years ended November 30, 2023 and November 30, 2022 was as follows:
| Fund | | Ordinary Income | | | Return of Capital | |
| November 30, 2023 | | | | | | |
| ALPS Sector Dividend Dogs ETF | | $ | 51,058,930 | | | $ | – | |
| ALPS International Sector Dividend Dogs ETF | | | 10,066,812 | | | | – | |
| ALPS Emerging Sector Dividend Dogs ETF | | | 1,969,818 | | | | – | |
| ALPS REIT Dividend Dogs ETF | | | 651,314 | | | | 442,862 | |
| | | | | | | | | |
| Fund | | Ordinary Income | | | Return of Capital | |
| November 30, 2022 | | | | | | | | |
| ALPS Sector Dividend Dogs ETF | | $ | 46,839,426 | | | $ | – | |
| ALPS International Sector Dividend Dogs ETF | | | 6,875,035 | | | | 104,515 | |
| ALPS Emerging Sector Dividend Dogs ETF | | | 1,199,258 | | | | – | |
| ALPS REIT Dividend Dogs ETF | | | 825,395 | | | | 282,853 | |
The character of distributions made during the year may differ from its ultimate characterization for federal income tax purposes.
Under current law, capital losses maintain their character as short-term or long-term and are carried forward to the next tax year without expiration. As of November 30, 2023, the following amounts are available as carry forwards to the next tax year:
| Fund | | Short-Term | | | Long-Term | |
| ALPS Sector Dividend Dogs ETF | | $ | – | | | $ | 168,036,590 | |
| ALPS International Sector Dividend Dogs ETF | | | 6,656,571 | | | | 51,316,726 | |
| ALPS Emerging Sector Dividend Dogs ETF | | | 1,215,909 | | | | 8,786,761 | |
| ALPS REIT Dividend Dogs ETF | | | 7,002,786 | | | | 2,117,277 | |
The ALPS Sector Dividend Dogs ETF used capital loss carryovers during the year ended November 30, 2023 in the amount of $32,556,612.
35 | November 30, 2023
ALPS ETF Trust
| Notes to Financial Statements | November 30, 2023 |
As of November 30, 2023, the components of distributable earnings on a tax basis for each Fund were as follows:
| | | Undistributed net investment income | | | Accumulated net realized loss on investments | | | Net unrealized appreciation/ (depreciation) on investments | | | Total | |
| ALPS Sector Dividend Dogs ETF | | $ | 2,742,205 | | | $ | (168,036,590 | ) | | $ | (99,214,406 | ) | | $ | (264,508,791 | ) |
| ALPS International Sector Dividend Dogs ETF | | | 1,377,587 | | | | (57,973,297 | ) | | | 10,334,601 | | | | (46,261,109 | ) |
| ALPS Emerging Sector Dividend Dogs ETF | | | 160,800 | | | | (10,002,670 | ) | | | (1,544,154 | ) | | | (11,386,024 | ) |
| ALPS REIT Dividend Dogs ETF | | | – | | | | (9,120,063 | ) | | | (2,937,517 | ) | | | (12,057,580 | ) |
As of November 30, 2023, the cost of investments for federal income tax purposes and accumulated net unrealized appreciation/(depreciation) on investments were as follows:
| | | Gross Appreciation (excess of value over tax cost) | | | Gross Depreciation (excess of tax cost over value) | | | Net Appreciation/ (Depreciation) of Foreign Currency | | | Net Unrealized Appreciation/ (Depreciation) | | | Cost of Investments for Income Tax Purposes | |
| ALPS Sector Dividend Dogs ETF | | $ | 90,744,212 | | | $ | (189,958,618 | ) | | $ | – | | | $ | (99,214,406 | ) | | $ | 1,190,655,722 | |
| ALPS International Sector Dividend Dogs ETF | | | 25,925,876 | | | | (15,613,893 | ) | | | 22,618 | | | | 10,334,601 | | | | 230,233,053 | |
| ALPS Emerging Sector Dividend Dogs ETF | | | 3,094,402 | | | | (4,638,954 | ) | | | 398 | | | | (1,544,154 | ) | | | 31,689,470 | |
| ALPS REIT Dividend Dogs ETF | | | 549,714 | | | | (3,487,185 | ) | | | (46 | ) | | | (2,937,517 | ) | | | 14,572,931 | |
The differences between book-basis and tax-basis are primarily due to the deferral of losses from wash sales and investments in passive foreign investment companies.
K. Income Taxes
No provision for income taxes is included in the accompanying financial statements, as each Fund intends to distribute to shareholders all taxable investment income and realized gains and otherwise comply with Subchapter M of the Code, applicable to regulated investment companies. Each Fund evaluates tax positions taken (or expected to be taken) in the course of preparing the Fund’s tax returns to determine whether these positions meet a “more-likely-than-not” standard that, based on the technical merits, have a more than fifty percent likelihood of being sustained by a taxing authority upon examination. A tax position that meets the “more-likely-than-not” recognition threshold is measured to determine the amount of benefit to recognize in the financial statements.
As of and during the year ended November 30, 2023, each Fund did not have a liability for any unrecognized tax benefits. Each Fund files U.S. federal, state, and local tax returns as required. Each Fund’s tax returns are subject to examination by the relevant tax authorities until expiration of the applicable statute of limitations, which is generally three years after the filing of the tax return, but may extend to four years in certain jurisdictions. Each Fund’s tax returns for open years have incorporated no uncertain tax positions that require a provision for income taxes.
L. Lending of Portfolio Securities
The Funds have entered into a securities lending agreement with State Street Bank & Trust Co. (“SSB”), the Funds’ lending agent. Each Fund may lend its portfolio securities only to borrowers that are approved by SSB. Each Fund will limit such lending to not more than 33 1/3% of the value of its total assets. The Fund’s securities held at SSB as custodian shall be available to be lent except those securities the Fund or ALPS Advisors, Inc. specifically identifies in writing as not being available for lending. The borrower pledges and maintains with the Fund collateral consisting of cash (U.S. Dollars only), securities issued or guaranteed by the U.S. government or its agencies or instrumentalities, and cash equivalents (including irrevocable bank letters of credit) issued by a person other than the borrower or an affiliate of the borrower. The initial collateral received by the Fund is required to have a value of no less than 102% of the market value of the loaned securities for U.S equity securities and a value of no less than 105% of the market value for non-U.S. equity securities. The collateral is maintained thereafter, at a market value equal to not less than 102% of the current value of the U.S. equity securities on loan and not less than 105% of the current value of the non-U.S. equity securities on loan. The market value of the loaned securities is determined at the close of each business day and any additional required collateral is delivered to the Fund on the next business day. During the term of the loan, each Fund is entitled to all distributions made on or in respect of the loaned securities. Loans of securities are terminable at any time and the borrower, after notice, is required to return borrowed securities within the customary time period for settlement of securities transactions.
36 | November 30, 2023
ALPS ETF Trust
| Notes to Financial Statements | November 30, 2023 |
Any cash collateral received is reinvested in a money market fund managed by SSB as disclosed in the Fund’s Schedule of Investments and is reflected in the Statements of Assets and Liabilities as a payable for collateral upon return of securities loaned. Non-cash collateral, in the form of securities issued or guaranteed by the U.S. government or its agencies or instrumentalities, is not disclosed in the Fund’s Statement of Assets and Liabilities or the contractual maturity table below as it is held by the lending agent on behalf of the Fund, and the Fund does not have the ability to re-hypothecate these securities. Income earned by the Fund from securities lending activity is disclosed in the Statements of Operations.
The following is a summary of a Fund's securities lending agreement and related cash and non-cash collateral received as of November 30, 2023:
Fund | | Market Value of Securities on Loan | | | Cash Collateral Received | | | Non-Cash Collateral Received | | | Total Collateral Received | |
| ALPS Sector Dividend Dogs ETF | | $ | 17,948,193 | | | $ | – | | | $ | 18,343,890 | | | $ | 18,343,890 | |
| ALPS International Sector Dividend Dogs ETF | | | 4,383,058 | | | | 4,563,243 | | | | – | | | | 4,563,243 | |
| ALPS Emerging Sector Dividend Dogs ETF | | | 172,750 | | | | 51,420 | | | | 129,963 | | | | 181,383 | |
| ALPS REIT Dividend Dogs ETF | | | 202,100 | | | | – | | | | 205,819 | | | | 205,819 | |
The risks of securities lending include the risk that the borrower may not provide additional collateral when required or may not return the securities when due. To mitigate these risks, the Funds benefit from a borrower default indemnity provided by SSB. SSB’s indemnity allows for full replacement of securities lent wherein SSB will purchase the unreturned loaned securities on the open market by applying the proceeds of the collateral, or to the extent such proceeds are insufficient or the collateral is unavailable, SSB will purchase the unreturned loan securities at SSB’s expense. However, the Funds could suffer a loss if the value of the investments purchased with cash collateral falls below the value of the cash collateral received.
The following table reflects a breakdown of transactions accounted for as secured borrowings, the gross obligation by the type of collateral pledged or securities loaned, and the remaining contractual maturity of those transactions as of November 30, 2023:
| ALPS International Sector Dividend Dogs ETF | | Remaining contractual maturity of the agreements |
| | | |
| Securities Lending Transactions | | Overnight & Continuous | | | Up to 30 Days | | | 30-90 Days | | | Greater than 90 Days | | | Total | |
| Common Stocks | | $ | 4,563,243 | | | $ | – | | | $ | – | | | $ | – | | | $ | 4,563,243 | |
| Total Borrowings | | | | | | | | | | | | | | | | | | | 4,563,243 | |
| Gross amount of recognized liabilities for securities lending (collateral received) | | | | | | | $ | 4,563,243 | |
| ALPS Emerging Sector Dividend Dogs ETF | | Remaining contractual maturity of the agreements | |
| | | | |
| Securities Lending Transactions | | Overnight & Continuous | | | Up to 30 Days | | | 30-90 Days | | | Greater than 90 Days | | | Total | |
| Common Stocks | | $ | 51,420 | | | $ | – | | | $ | – | | | $ | – | | | $ | 51,420 | |
| Total Borrowings | | | | | | | | | | | | | | | | | | | 51,420 | |
| Gross amount of recognized liabilities for securities lending (collateral received) | | | | | | | $ | 51,420 | |
3. INVESTMENT ADVISORY FEE AND OTHER AFFILIATED TRANSACTIONS
ALPS Advisors, Inc. serves as the Funds’ investment adviser pursuant to an Investment Advisory Agreement with the Trust on behalf of each Fund (the “Advisory Agreement”). Pursuant to the Advisory Agreement, each Fund pays the Adviser an annual management fee for the services and facilities it provides, payable on a monthly basis as a percentage of the relevant Fund’s average daily net assets as set out below. From time to time, the Adviser may waive all or a portion of its fee.
| Fund | Advisory Fee |
| ALPS Sector Dividend Dogs ETF | 0.36%* |
| ALPS International Sector Dividend Dogs ETF | 0.50% |
| ALPS Emerging Sector Dividend Dogs ETF | 0.60% |
| ALPS REIT Dividend Dogs ETF | 0.35% |
| * | Effective April 1, 2023, the Advisory Fee was reduced from 0.40% to 0.36%. |
37 | November 30, 2023
ALPS ETF Trust
| Notes to Financial Statements | November 30, 2023 |
Out of the unitary management fee, the Adviser pays substantially all expenses of each Fund, including licensing fees to the Underlying Index provider, the cost of transfer agency, custody, fund administration, legal, audit, trustees and other services, except for interest expenses, distribution fees or expenses, brokerage expenses, taxes and extraordinary expenses not incurred in the ordinary course of each Fund's business. The Adviser’s unitary management fee is designed to pay substantially all of each Fund's expenses and to compensate the Adviser for providing services for each Fund.
ALPS Fund Services, Inc., an affiliate of the Adviser, is the administrator of the Funds.
Effective July 1, 2023, each Trustee receives (1) a quarterly retainer of $25,000, (2) a per meeting fee of $15,000, (3) $2,500 for any special meeting held outside of a regularly scheduled board meeting, and (4) reimbursement for all reasonable out-of-pocket expenses relating to attendance at meetings. In addition, the Chairman of the Board receives a quarterly retainer of $5,000, the Chairman of the Audit Committee receives a quarterly retainer of $3,000, and the Chairman of the Nominating & Governance Committee receives a quarterly retainer of $2,000, each in connection with their respective roles. Prior to July 1, 2023, each Trustee received (1) a quarterly retainer of $20,000, (2) a per meeting fee of $10,000, (3) $2,500 for any special meeting held outside of a regularly scheduled board meeting, and (4) reimbursement for all reasonable out-of-pocket expenses relating to attendance at meetings. In addition, the Chairman of the Board received a quarterly retainer of $5,000, the Chairman of the Audit Committee received a quarterly retainer of $3,000, and the Chairman of the Nominating & Governance Committee received a quarterly retainer of $2,000, each in connection with their respective roles.
4. PURCHASES AND SALES OF SECURITIES
For the year ended November 30, 2023, the cost of purchases and proceeds from sales of investment securities, excluding short-term investments and in-kind transactions, were as follows:
| Fund | | Purchases | | | Sales | |
| ALPS Sector Dividend Dogs ETF | | $ | 618,750,897 | | | $ | 615,259,645 | |
| ALPS International Sector Dividend Dogs ETF | | | 127,311,872 | | | | 125,675,978 | |
| ALPS Emerging Sector Dividend Dogs ETF | | | 25,947,741 | | | | 25,067,446 | |
| ALPS REIT Dividend Dogs ETF | | | 12,387,765 | | | | 12,414,217 | |
For the year ended November 30, 2023, the cost of in-kind purchases and proceeds from in-kind sales were as follows:
| Fund | | Purchases | | | Sales | |
| ALPS Sector Dividend Dogs ETF | | $ | 48,713,147 | | | $ | 135,423,516 | |
| ALPS International Sector Dividend Dogs ETF | | | 59,860,870 | | | | 15,035,764 | |
| ALPS Emerging Sector Dividend Dogs ETF | | | 2,503,821 | | | | 764,776 | |
| ALPS REIT Dividend Dogs ETF | | | – | | | | 6,440,803 | |
For the year ended November 30, 2023, the in-kind net realized gains/(losses) were as follows:
| Fund | | Net Realized Gain/ (Loss) | |
| ALPS Sector Dividend Dogs ETF | | $ | 14,085,529 | |
| ALPS International Sector Dividend Dogs ETF | | | 1,730,106 | |
| ALPS Emerging Sector Dividend Dogs ETF | | | 159,363 | |
| ALPS REIT Dividend Dogs ETF | | | (78,289 | ) |
Gains on in-kind transactions are not considered taxable for federal income tax purposes and losses on in-kind transactions are also not deductible for tax purposes.
38 | November 30, 2023
ALPS ETF Trust
| Notes to Financial Statements | November 30, 2023 |
5. CAPITAL SHARE TRANSACTIONS
Shares are created and redeemed by each Fund only in Creation Unit size aggregations of 25,000 shares. Only broker-dealers or large institutional investors with creation and redemption agreements called Authorized Participants (“AP”) are permitted to purchase or redeem Creation Units from the Funds. Such transactions are generally permitted on an in-kind basis, with a balancing cash component to equate the transaction to the NAV per unit of each Fund on the transaction date. Cash may be substituted equivalent to the value of certain securities generally when they are not available in sufficient quantity for delivery, not eligible for trading by the AP or as a result of other market circumstances.
6. RELATED PARTY TRANSACTIONS
The ALPS Sector Dividend Dogs ETF and ALPS International Sector Dividend Dogs ETF engaged in cross trades between other funds in the Trust during the year ended November 30, 2023 pursuant to Rule 17a-7 under the 1940 Act. Cross trading is the buying or selling of portfolio securities between funds to which the Adviser serves as the investment adviser. The Board previously adopted procedures that apply to transactions between the Funds of the Trust pursuant to Rule 17a-7. These transactions related to cross trades during the period complied with the requirements set forth by Rule 17a-7 and the Trust’s procedures.
Transactions related to cross trades during the year ended November 30, 2023, were as follows:
| | | Purchase cost paid | | | Sale proceeds received | | Realized gain/(loss) on sales | |
| ALPS Sector Dividend Dogs ETF | | $ | 8,996,539 | | | $3,140,132 | | $ | (23,542 | ) |
| ALPS International Sector Dividend Dogs ETF | | | 632,509 | | | 607,372 | | | 1,133 | |
7. MARKET RISK
The Funds are subject to investment and operational risks associated with financial, economic and other global market developments and disruptions, including those arising from war, terrorism, market manipulation, government interventions, defaults and shutdowns, political changes or diplomatic developments, public health emergencies (such as the spread of infectious diseases, pandemics and epidemics) and natural/environmental disasters, which can negatively impact the securities markets and cause each Fund to lose value. Securities in each Fund’s portfolio may underperform in comparison to securities in general financial markets, a particular financial market or other asset classes due to a number of factors, including inflation (or expectations for inflation), deflation (or expectations for deflation), interest rates, global demand for particular products or resources, market instability, debt crises and downgrades, embargoes, tariffs, sanctions and other trade barriers, regulatory events, other governmental trade or market control programs and related geopolitical events. In addition, the value of the Fund’s investments may be negatively affected by the occurrence of global events such as war, terrorism, environmental disasters, natural disasters or events, country instability, and infectious disease epidemics or pandemics.
8. REGULATORY UPDATE
The SEC adopted rule and form amendments that will change the format and content of the Funds' annual and semi-annual reports. Certain information, including the financial statements, will not appear in the Funds' new tailored shareholder reports but will be available online, delivered free of charge upon request, and filed on a semi-annual basis on Form N-CSR. The rule and form amendments have a compliance date of July 24, 2024. At this time, the Trust is evaluating the impact of these rule and form amendment changes.
9. SUBSEQUENT EVENTS
Subsequent events, if any, after the date of the Statements of Assets and Liabilities have been evaluated through the date the financial statements were issued. Management has determined that there were no subsequent events to report through the issuance of these financial statements.
39 | November 30, 2023
ALPS ETF Trust
| Additional Information | November 30, 2023 (Unaudited) |
PROXY VOTING RECORDS, POLICIES AND PROCEDURES
Information regarding how each Fund voted proxies relating to portfolio securities during the most recent 12-month period ended June 30 and a description of the Fund’s proxy voting policies and procedures used in determining how to vote for proxies are available without charge on the SEC’s website at www.sec.gov and upon request, by calling (toll-free) 1-866-759-5679.
PORTFOLIO HOLDINGS
Each Fund files a complete schedule of portfolio holdings with the U.S. Securities and Exchange Commission (“SEC”) for the first and third quarters of each fiscal year on Form N-PORT within 60 days after the end of the period. Copies of each Fund’s Form N-PORT are available without a charge, upon request, by contacting the Fund at 1-866-759-5679 and on the SEC’s website at https://www.sec.gov.
TAX INFORMATION
The Funds designate the following as a percentage of taxable ordinary income distributions, or up to the maximum amount allowable, for the calendar year ended December 31, 2022:
| | Qualified Dividend Income | Dividend Received Deduction | 199A |
| ALPS Sector Dividend Dogs ETF | 100.00% | 89.99% | 0.00% |
| ALPS International Sector Dividend Dogs ETF | 100.00% | 0.00% | 0.00% |
| ALPS Emerging Sector Dividend Dogs ETF | 61.13% | 0.00% | 0.00% |
| ALPS REIT Dividend Dogs ETF | 0.64% | 0.00% | 89.84% |
In early 2023, if applicable, shareholders of record received this information for the distributions paid to them by the Funds during the calendar year 2022 via Form 1099. The Funds will notify shareholders in early 2024 of amounts paid to them by the Funds, if any, during the calendar year 2023.
Pursuant to Section 853(c) of the Internal Revenue Code, the following Funds designated the following for the calendar year ended December 31, 2023:
| | | Foreign Taxes Paid | | | Foreign Source Income | |
| ALPS International Sector Dividend Dogs ETF | | $ | 1,676,228 | | | $ | 13,248,627 | |
| ALPS Emerging Sector Dividend Dogs ETF | | $ | 281,432 | | | $ | 2,385,510 | |
LICENSING AGREEMENTS
ALPS Sector Dividend Dogs ETF, ALPS International Sector Dividend Dogs ETF, ALPS Emerging Sector Dividend Dogs ETF, and ALPS REIT Dividend Dogs ETF
The Funds are not sponsored, endorsed, sold or promoted by S-Network Global Indexes, Inc.SM (“Licensor”). Licensor makes no representation or warranty, express or implied, to the owners of the Funds or any member of the public regarding the advisability of investing in securities generally or in the Funds particularly or the ability of the (i) in the case of SDOG, S-Network Sector Dividend DogsSM, (ii) in the case of IDOG, S-Network International Sector Dividend DogsSM, (iii) in the case of EDOG, S-Network Emerging Sector Dividend Dogs IndexSM, and (iv) in the case of RDOG, S-Network REIT Dividend Dogs IndexSM (each an “Underlying Index”) to track the performance of a market or sector. Licensor’s only relationship to the Licensee is the licensing of certain service marks and trade names of Licensor and of the Underlying Index that is determined, composed and calculated by Licensor without regard to the Licensee or the Fund. Licensor has no obligation to take the needs of the Licensee or the owners of the Fund into consideration in determining, composing or calculating the Underlying Index. Licensor is not responsible for and has not participated in the determination of the timing of, prices at, or quantities of the Fund to be issued or in the determination or calculation of the equation by which the Fund is to be converted into cash. Licensor has no obligation or liability in connection with the administration, marketing or trading of the Fund.
LICENSOR DOES NOT GUARANTEE THE ACCURACY AND/OR THE COMPLETENESS OF THE UNDERLYING INDEX OR ANY DATA INCLUDED THEREIN AND LICENSOR SHALL HAVE NO LIABILITY FOR ANY ERRORS, OMISSIONS, OR INTERRUPTIONS THEREIN. LICENSOR MAKES NO WARRANTY, EXPRESS OR IMPLIED, AS TO RESULTS TO BE OBTAINED BY LICENSEE, OWNERS OF THE FUND, OR ANY OTHER PERSON OR ENTITY FROM THE USE OF THE UNDERLYING INDEX OR ANY DATA INCLUDED THEREIN. LICENSOR MAKES NO EXPRESS OR IMPLIED WARRANTIES, AND EXPRESSLY DISCLAIMS ALL WARRANTIES OF MERCHANTABILITY OR FITNESS FOR A PARTICULAR PURPOSE OR USE WITH RESPECT TO THE UNDERLYING INDEX OR ANY DATA
40 | November 30, 2023
ALPS ETF Trust
| Additional Information | November 30, 2023 (Unaudited) |
INCLUDED THEREIN. WITHOUT LIMITING ANY OF THE FOREGOING, IN NO EVENT SHALL LICENSOR HAVE ANY LIABILITY FOR ANY SPECIAL, PUNITIVE, INDIRECT, OR CONSEQUENTIAL DAMAGES (INCLUDING LOST PROFITS), EVEN IF NOTIFIED OF THE POSSIBILITY OF SUCH DAMAGES.
The Funds are not sponsored, endorsed, sold or promoted by Standard & Poor’s, a division of The McGraw-Hill Companies, Inc. (“S&P”) or its third party licensors. Neither S&P nor its third party licensors make any representation or warranty, express or implied, to the owners of each Fund or any member of the public regarding the advisability of investing in securities generally or in each Fund particularly or the ability of each Underlying Index to track general stock market performance. S&P’s and its third party licensor’s only relationship to the Index Provider is the licensing of certain trademarks, service marks and trade names of S&P and/or its third party licensors and for the providing of calculation and maintenance services related to the Underlying Index. Neither S&P nor its third party licensors is responsible for and has not participated in the determination of the prices and amount of each Fund or the timing of the issuance or sale of each Fund or in the determination or calculation of the equation by which each Fund is to be converted into cash. S&P has no obligation or liability in connection with the administration, marketing or trading of each Fund.
NEITHER S&P, ITS AFFILIATES NOR THEIR THIRD PARTY LICENSORS GUARANTEE THE ADEQUACY, ACCURACY, TIMELINESS OR COMPLETENESS OF EACH UNDERLYING INDEX OR ANY DATA INCLUDED THEREIN OR ANY COMMUNICATIONS, INCLUDING BUT NOT LIMITED TO, ORAL OR WRITTEN COMMUNICATIONS (INCLUDING ELECTRONIC COMMUNICATIONS) WITH RESPECT THERETO. S&P, ITS AFFILIATES AND THEIR THIRD PARTY LICENSORS SHALL NOT BE SUBJECT TO ANY DAMAGES OR LIABILITY FOR ANY ERRORS, OMISSIONS OR DELAYS THEREIN. S&P MAKES NO EXPRESS OR IMPLIED WARRANTIES, AND EXPRESSLY DISCLAIMS ALL WARRANTIES OF MERCHANTABILITY OR FITNESS FOR A PARTICULAR PURPOSE OR USE WITH RESPECT TO ITS TRADEMARKS, EACH UNDERLYING INDEX OR ANY DATA INCLUDED THEREIN. WITHOUT LIMITING ANY OF THE FOREGOING, IN NO EVENT WHATSOEVER SHALL S&P, ITS AFFILIATES OR THEIR THIRD PARTY LICENSORS BE LIABLE FOR ANY INDIRECT, SPECIAL, INCIDENTAL, PUNITIVE OR CONSEQUENTIAL DAMAGES, INCLUDING BUT NOT LIMITED TO, LOSS OF PROFITS, TRADING LOSSES, LOST TIME OR GOODWILL, EVEN IF THEY HAVE BEEN ADVISED OF THE POSSIBILITY OF SUCH DAMAGES, WHETHER IN CONTRACT, TORT, STRICT LIABILITY OR OTHERWISE.
Standard & Poor’s® and S&P® are registered trademarks of The McGraw-Hill Companies, Inc.; “Calculated by S&P Custom Indices” and its related stylized mark are service marks of The McGraw-Hill Companies, Inc. These marks have been licensed for use by the Index Provider.
The Adviser does not guarantee the accuracy and/or the completeness of each Underlying Index or any data included therein, and the Adviser shall have no liability for any errors, omissions or interruptions therein. The Adviser makes no warranty, express or implied, as to results to be obtained by each Fund, owners of the Shares of each Fund or any other person or entity from the use of each Underlying Index or any data included therein. The Adviser makes no express or implied warranties, and expressly disclaims all warranties of merchantability or fitness for a particular purpose or use with respect to each Underlying Index or any data included therein. Without limiting any of the foregoing, in no event shall the Adviser have any liability for any special, punitive, direct, indirect or consequential damages (including lost profits) arising out of matters relating to the use of each Underlying Index, even if notified of the possibility of such damages.
41 | November 30, 2023
ALPS ETF Trust
| Board Considerations Regarding Approval of Investment Advisory Agreement | November 30, 2023 (Unaudited) |
At its meetings held on June 5, 2023 and June 20, 2023, the Board of Trustees of the Trust (the "Board" or the "Trustees"), where each Trustee is not an "interested person" of the Trust within the meaning of the Investment Company Act of 1940, as amended (the “Independent Trustees”), evaluated a proposal to approve the continuance of the Investment Advisory Agreement between the Trust and ALPS Advisors, Inc. (the “Adviser” or “AAI”) with respect to the ALPS Sector Dividend Dogs ETF (“SDOG”), the ALPS International Sector Dividend Dogs ETF (“IDOG”), the ALPS Emerging Sector Dividend Dogs ETF (“EDOG”), and the ALPS REIT Dividend Dogs ETF (“RDOG”) (each “a Fund” and collectively the “Funds”). In evaluating the renewal of the Investment Advisory Agreement with respect to each Fund the Board, including the Independent Trustees, considered various factors, including (i) the nature, extent and quality of the services provided by AAI with respect to the applicable Fund under the Investment Advisory Agreement; (ii) the advisory fees and other expenses paid by the Fund compared to those of similar funds managed by other investment advisers; (iii) the costs of the services provided to the Fund by AAI and the profits realized by AAI and its affiliates from its relationship to the Fund; (iv) the extent to which economies of scale have been or would be realized if and as the assets of the Fund grow and whether fees reflect the economies of scale for the benefit of shareholders; and (v) any additional benefits and other considerations.
With respect to the nature, extent and quality of the services provided by AAI under the Investment Advisory Agreement, the Board considered and reviewed information concerning the services provided under the Investment Advisory Agreement, the investment parameters of the index of each Fund, financial information regarding AAI and its parent company, information describing AAI’s current organization and the background and experience of the persons responsible for the day-to-day management of the Funds.
The Board reviewed information on the performance of each Fund and its applicable benchmark for the 1-, 3-, and 5-year periods, as applicable. The Board also evaluated the correlation and tracking error between each underlying index and its corresponding Fund’s performance. Based on this review, the Board, including the Independent Trustees found that the nature and extent of services provided to each Fund under the Investment Advisory Agreement was appropriate and that the quality of such services was satisfactory.
The Board noted that the advisory fees for each Fund were unitary fees pursuant to which AAI assumes all expenses of the Funds (including the cost of transfer agency, custody, fund administration, legal, audit and other services) other than the payments under the Advisory Agreement, brokerage expenses, taxes, interest, litigation expenses and other extraordinary expenses.
Based on the information available to them, including the Fund-specific summaries set forth below, the Board, including the Independent Trustees, concluded that the advisory fee rate for each of the Funds was reasonable under the circumstances and in light of the quality of the services provided.
The Board, including the Independent Trustees, considered other benefits available to AAI because of its relationship with the Funds and concluded that the advisory fees were reasonable taking into account any such benefits.
The Board, including the Independent Trustees, also considered with respect to each Fund the information provided by AAI about the costs and profitability of AAI with respect to each of the Funds, including the asset levels and other factors that influence the profitability and financial viability of the Funds. The Board, including the Independent Trustees, reviewed and noted the relatively small sizes of the Funds (other than SDOG) and the analysis AAI had conducted to support AAI’s assertion that it was not realizing any economies of scale with respect to such Funds. The Independent Trustees determined that AAI should continue to keep the Board informed on an ongoing basis of any significant developments (e.g., material increases in asset levels) so as to facilitate the Independent Trustees’ evaluation of whether further economies of scale have been achieved.
The Board, including the Independent Trustees, also considered other potential benefits available to AAI because of its relationship with the Funds, known as fall-out benefits.
With respect to each Fund, the Board, including the Independent Trustees, noted the following:
The gross management fee rate for RDOG is lower than the median of its FUSE expense group. RDOG’s net expense ratio is lower than the median of its FUSE expense group.
The Board, including the Independent Trustees, reviewed and noted the relatively small size of RDOG and the analysis AAI had conducted to support AAI’s assertion that it was not realizing any economies of scale with respect to RDOG.
The gross management fee rate for SDOG is lower than the median of its FUSE expense group. SDOG’s net expense ratio is lower than the median of its FUSE expense group.
With respect to AAI profitability from SDOG, the Independent Trustees noted SDOG recently reduced its management fee from 0.40% to 0.36%.
The gross management fee rate for IDOG is higher than the median of its FUSE expense group. IDOG’s net expense ratio is lower than the median of its FUSE expense group.
42 | November 30, 2023
ALPS ETF Trust
| Board Considerations Regarding Approval of Investment Advisory Agreement | November 30, 2023 (Unaudited) |
The Board, including the Independent Trustees, reviewed and noted the relatively small size of IDOG and the analysis AAI had conducted to support AAI’s assertion that it was not realizing any economies of scale with respect to IDOG.
The gross management fee rate for EDOG is equal to the median of its FUSE expense group. EDOG’s net expense ratio is equal to the median of its FUSE expense group.
The Board, including the Independent Trustees, reviewed and noted the relatively small size of EDOG and the analysis AAI had conducted to support AAI’s assertion that it was not realizing any economies of scale with respect to EDOG.
In voting to renew the Investment Advisory Agreement with AAI, the Board, including the Independent Trustees, concluded that the terms of the Investment Advisory Agreement are reasonable and fair in light of the services to be performed, the fees paid by certain other funds, expenses to be incurred and such other matters as the members of the Board, including the Independent Trustees, considered relevant in the exercise of their reasonable business judgment. The Independent Trustees did not identify any single factor or group of factors as all important or controlling and considered all factors together.
43 | November 30, 2023
ALPS ETF Trust
| Trustees and Officers | November 30, 2023 (Unaudited) |
The general supervision of the duties performed by the Adviser for the Fund under the Investment Advisory Agreement is the responsibility of the Board of Trustees. The Trust currently has four Trustees, each of whom have no affiliation or business connection with the Adviser or any of its affiliated persons and do not own any stock or other securities issued by the Adviser. These are the “non-interested” or “independent” Trustees (“Independent Trustees”).
The Independent Trustees of the Trust, their term of office and length of time served, their principal business occupations during the past five years, the number of portfolios in the Fund Complex overseen by each Independent Trustee, and other directorships, if any, held by the Trustee are shown below.
INDEPENDENT TRUSTEES
Name, Address and Year of Birth of Officer* | Position(s) Held with Trust | Length of Time Served** | Principal Occupation(s) During Past 5 Years | Number of Portfolios in Fund Complex Overseen by Trustees*** | Other Directorships Held by Trustees |
Mary K. Anstine, 1940 | Trustee | Since March 2008 | Ms. Anstine is Trustee/Director of AV Hunter Trust and Colorado Uplift Board. | 38 | Ms. Anstine is a Trustee of ALPS Variable Investment Trust (7 funds); Financial Investors Trust (29 funds); and Reaves Utility Income Fund. |
Jeremy W. Deems, 1976 | Trustee | Since March 2008 | Mr. Deems is the Co-Founder and Chief Financial Officer of Green Alpha Advisors, LLC, a registered investment advisor, and Co-Portfolio Manager of the AXS Green Alpha ETF. | 38 | Mr. Deems is a Trustee of ALPS Variable Investment Trust (7 funds); Financial Investors Trust (29 funds); and Reaves Utility Income Fund; and Clough Funds Trust (1 fund). |
Rick A. Pederson, 1952 | Trustee | Since March 2008 | Mr. Pederson is Partner, Bow River Capital Partners (private equity management), 2003-present; Board Member, Prosci Inc. (private business services) 2013-2016; Advisory Board Member, Citywide Banks (Colorado community bank) 2014-2017; Board Member, Strong-Bridge Consulting, 2015- 2019; Board Member, IRI/ ODMS Holdings LLC, 2017–2019; Director, National Western Stock Show (not for profit) 2010-present; Director, History Colorado (not for profit) 2015- present; Director, Citywide Bank Advisory Board 2017-present; Trustee, Boettcher Foundation, 2018 -present. | 24 | Mr. Pederson is Trustee of Segall Bryant & Hamill Trust (14 funds) and Principal Real Estate Income Fund (1 fund). |
| * | The business address of the Trustee is c/o ALPS Advisors, Inc., 1290 Broadway, Suite 1000, Denver, Colorado 80203. |
| ** | This is the period for which the Trustee began serving the Trust. Each Trustee serves an indefinite term, until his successor is elected. |
| *** | The Fund Complex includes all series of the Trust and any other investment companies for which ALPS Advisors, Inc. provides investment advisory services. |
44 | November 30, 2023
ALPS ETF Trust
| Trustees and Officers | November 30, 2023 (Unaudited) |
Name, Address and Year of Birth of Officer* | Position(s) Held with Trust | Length of Time Served** | Principal Occupation(s) During Past 5 Years | Number of Portfolios in Fund Complex Overseen by Trustees*** | Other Directorships Held by Trustees |
Edmund J. Burke, 1961 | Trustee | Since December 2017 | Mr. Burke joined ALPS in 1991 and served as the President and Director of ALPS Holdings, Inc., and ALPS Advisors, Inc., and Director of ALPS Distributors, Inc., ALPS Fund Services, Inc. (“ALPS”), and ALPS Portfolio Solutions Distributor, Inc. (collectively, the “ALPS Companies”). Mr. Burke retired from the ALPS Companies in June 2019. Mr. Burke is currently a partner at ETF Action, a web-based system that provides data and analytics to registered investment advisers, (since 2020) and a Director of Alliance Bioenergy Plus, Inc., a technology company focused on emerging technologies in the renewable energy, biofuels, and bioplastics technology sectors (since 2020). | 33 | Mr. Burke is a Trustee of Clough Global Dividend and Income Fund (1 fund); Clough Global Equity Fund (1 fund); Clough Global Opportunities Fund (1 fund); Clough Funds Trust (1 fund); Liberty All-Star Equity Fund (1 fund); Director of the Liberty All-Star Growth Fund, Inc. (1 fund) and Financial Investors Trust (29 funds). |
| * | The business address of the Trustee is c/o ALPS Advisors, Inc., 1290 Broadway, Suite 1000, Denver, Colorado 80203. |
| ** | This is the period for which the Trustee began serving the Trust. Each Trustee serves an indefinite term, until his or her successor is elected. |
| *** | The Fund Complex includes all series of the Trust and any other investment companies for which ALPS Advisors, Inc. provides investment advisory services. |
45 | November 30, 2023
ALPS ETF Trust
| Trustees and Officers | November 30, 2023 (Unaudited) |
| OFFICERS: | | | |
Name, Address and Year of Birth of Officer* | Position(s) Held with Trust | Length of Time Served** | Principal Occupation(s) During Past 5 Years |
Laton Spahr, 1975 | President | Since June 2021 | Mr. Spahr joined ALPS in 2019 and currently serves as President and Portfolio Manager of AAI. Prior to his current role, Mr. Spahr was a Senior Vice President and Strategy Leader of the Value & Income Team for Oppenheimer Funds from 2013 to 2019. |
Matthew Sutula, 1985 | Chief Compliance Officer (“CCO”) | Since December 2019 | Mr. Sutula joined ALPS in 2012 and currently serves as Chief Compliance Officer of AAI. Prior to his current role, Mr. Sutula served as interim Compliance Officer of the Trust (September 2019 to December 2019). Compliance Manager and Senior Compliance Analyst for AAI, as well as Compliance Analyst for AFS. Prior to joining ALPS, he spent seven years at Morningstar, Inc. in various analyst roles supporting the registered investment company databases. Mr. Sutula is also Chief Compliance Officer of Principal Real Estate Income Fund, ALPS Variable Investment Trust, Liberty All-Star Equity Fund and Liberty All-Star Growth Fund, Inc. From September 2019 to September 2022 he served as Chief Compliance Officer of RiverNorth Opportunities Fund, Inc. |
Erich Rettinger, 1985 | Treasurer | Since September 2023 | Mr. Rettinger is Vice President of AAI (since 2021) and serves as Treasurer of Principal Real Estate Income Fund, Liberty All-Star Equity Fund, LibertyAll-Star Growth Fund, Inc., and ALPS Variable Investment Trust. From December 2021 to October 2022 he also served as Treasurer of RiverNorth Opportunities Fund, Inc. Because of his position with AAI, Mr. Rettinger is deemed an affiliate of the Fund as defined under the 1940 Act. From 2013-2021, he served as Vice President and Fund Controller of ALPS Fund Services. |
Michael P. Lawlor, 1969 | Secretary | Since December 2022 | Mr. Lawlor joined ALPS in January 2022, and is currently Vice President and Principal Legal Counsel. Prior to joining ALPS, Mr. Lawlor was Lead Fund Counsel at Brighthouse Financial (insurance company) (January 2007-April 2021). Mr. Lawlor also serves as Secretary of Financial Investors Trust and ALPS Variable Investment Trust. |
Susan M. Cannon, 1974 | Assistant Secretary | Since May 2023 | Ms. Cannon joined ALPS in September 2022, and is currently a Senior Paralegal of ALPS Fund Services, Inc. Prior to joining ALPS, Ms. Cannon worked for World Premier Private Partnership, Brown Brothers Harriman & Co. |
| * | The business address of each Officer is c/o ALPS Advisors, Inc., 1290 Broadway, Suite 1000, Denver, Colorado 80203. Each Officer is deemed an affiliate of the Trust as defined under the 1940 Act. |
| ** | This is the period for which the Officer began serving the Trust. Each Officer serves an indefinite term, until his/her successor is elected. |
The Statement of Additional Information includes additional information about the Fund’s Trustees and is available, without charge, upon request by calling (toll-free) 1-866-759-5679.
46 | November 30, 2023
Intentionally Left Blank


Table of Contents
| Performance Overview | 1 |
| Disclosure of Fund Expenses | 14 |
| Report of Independent Registered Public Accounting Firm | 15 |
| Financial Statements | |
| Schedules of Investments | 16 |
| Statements of Assets and Liabilities | 26 |
| Statements of Operations | 27 |
| Statements of Changes in Net Assets | 28 |
| Financial Highlights | 32 |
| Notes to Financial Statements | 36 |
| Additional Information | 46 |
| Board Considerations Regarding Approval of Investment Advisory Agreement | 48 |
| Trustees & Officers | 50 |
alpsfunds.com
ALPS | O’Shares U.S. Quality Dividend ETF
| Performance Overview | November 30, 2023 (Unaudited) |
Investment Objective
The ALPS|O’Shares U.S. Quality Dividend ETF (the "Fund") seeks investment results that track the performance, before fees and expenses, of the O'Shares U.S. Quality Dividend Index (the "Underlying Index").
The Underlying Index is designed to measure the performance of publicly-listed large-capitalization and mid-capitalization dividend-paying issuers in the United States that meet certain market capitalization, liquidity, high quality, low volatility and dividend yield thresholds, as determined by O'Shares Investment Advisers, LLC. The high quality and low volatility requirements are designed to reduce exposure to high dividend equities that have experienced large price declines. The constituents of the Underlying Index are selected from the S-Network U.S. Equity Large-Cap 500 Index.
Performance Overview
During the Fund's fiscal year ended November 30, 2023, the Fund generated a total return of 4.74%, performing generally in line with the Fund's Underlying Index, net of fees, which returned 5.28%. The Fund outperformed the Russell 1000® Value Index and the Morningstar US Large-Mid Cap Broad Value Index and underperformed the S&P 500® Index, which returned 1.35%, 4.05% and 13.84%, respectively, during the Fund's 2023 fiscal year.
The trailing-twelve-month yield for the Fund's underlying constituents as of November 30, 2023 was 1.87% vs. 2.13% and 2.80% for the Russell 1000® Value Index and Morningstar US Large-Mid Cap Broad Value Index, respectively.
The S&P 500® Index returned 13.84% for the Fund's fiscal year that ended November 30, 2023, as fiscal year 2023 saw markets rebound from 2022 lows. The Federal Reserve Bank (FED) continued its path of quantitative tightening in 2023 to combat inflation, reaching its target of peak rates with expectations of rate cuts into 2024 as the Consumer Price Index (CPI), energy prices and yields trended towards more acceptable levels. U.S. markets rallied substantially off the secondary effects of the FED's actions, which ALPS Advisors believes will lead to better odds of a soft landing, with expectations of rate cuts driving growth and equity multiples higher into the next year. Main macroeconomic talking points throughout 2023 centered on the path of future interest rates driven by monetary policy, and inflation trending towards the FED's 2% inflation target. Inflation significantly declined throughout 2023, with November 2023 numbers showing year-over-year CPI around 3.1%. Despite persistent recession calls, ALPS Advisors believes a gradual reduction in interest rates is likely to lead to an earnings recovery in the U.S., easing financial conditions for both U.S. and global equities. With the recent recovery in sentiment and price for U.S. markets, the S&P 500® Index Price-to-Earnings (P/E) ratio of 22.2x is slightly above its 10-year average of 20.6x. Looking forward, ALPS Advisors believes markets are likely to be data-dependent on job growth, CPI, spending and manufacturing data to justify the recent recovery in valuations.
Compared to the Russell 1000® Value Index, the Fund saw a positive impact from its higher-quality holdings across non-cyclical sectors. The Fund outperformed the Russell 1000® Value Index across Information Technology and Financials sectors, although its slight underweight to Communication Services and security selection of quality names within the Industrials sectors drove the bulk of relative underperformance.
Compared to the Morningstar US Large-Mid Cap Broad Value Index, the Fund saw a positive impact from its higher-quality holdings across non-cyclical sectors. The Fund outperformed the Morningstar US Large-Cap Broad Value Index across Information Technology, Financials, Health Care, Utilities and Consumer Staples sectors, while the Fund’s Communication Services, Industrials and Consumer Discretionary sector exposures drove the bulk of relative underperformance.
The best-performing stocks in the Fund during the Fund's fiscal year ended November 30, 2023, were Broadcom Inc. (AVGO), which increased 67.22%, Eli Lilly & Co (LLY), which saw a gain of 57.18%, and Microsoft Corp. (MSFT), rising 48.22%. The largest detractors for the Fund were Dollar General Corp. (DG), which decreased 48.76%, Pfizer Inc. (PFE), which fell 36.84%, and Bristol-Myers Squibb Co. (BMY), which lost 36.58%.
Looking forward, ALPS Advisors believes the methodology of selecting large-cap and mid-cap companies in the U.S. with fundamental determinates including quality, low volatility, and dividend growth, provides a cost-efficient core investment holding.
Performance (as of November 30, 2023)
| | 1 Year | 5 Year | Since Inception^ |
| ALPS | O'Shares U.S. Quality Dividend ETF – NAV | 4.74% | 8.55% | 9.54% |
| ALPS | O'Shares U.S. Quality Dividend ETF – Market Price* | 4.76% | 8.57% | 9.54% |
| O'Shares U.S. Quality Dividend Index** | 5.28% | 9.09% | 10.10% |
| Morningstar US Large-Mid Cap Broad Value Index*** | 4.05% | 9.37% | 9.59% |
| Russell 1000® Value Index | 1.35% | 7.52% | 7.69% |
Total Expense Ratio (per the current prospectus) is 0.48%.
ALPS | O’Shares U.S. Quality Dividend ETF
| Performance Overview | November 30, 2023 (Unaudited) |
Performance data quoted represents past performance. The Fund adopted the historical performance of the O'Shares U.S. Quality Dividend ETF (the "Predecessor Fund") as the result of a reorganization in which the Fund acquired all of the assets, subject to liabilities, of the Predecessor Fund on June 17, 2022. The returns presented for the Fund for periods prior to June 17, 2022 reflect the performance of the Predecessor Fund. At the time of the reorganization, the investment objectives of the Fund and the Predecessor Fund were identical and the investment strategies of the Fund and the Predecessor Fund were substantially the same. Previously, the Predecessor Fund had adopted the historical performance of the O’Shares FTSE U.S. Quality Dividend ETF (the “Previous Predecessor Fund”), a series of FQF Trust, as the result of a reorganization in which the Predecessor Fund acquired all of the assets, subject to liabilities, of the Previous Predecessor Fund on June 28, 2018. The returns presented for the Predecessor Fund for periods prior to June 28, 2018 reflect the performance of the Previous Predecessor Fund. At the time of the reorganization, the investment objectives of the Previous Predecessor Fund and the Predecessor Fund were identical and the investment strategies of the Previous Predecessor Fund and the Predecessor Fund were substantially the same. Effective June 1, 2020, the Predecessor Fund’s underlying index was changed to the Underlying Index from the FTSE USA Qual/Vol/Yield Factor 5% Capped Index (the “Former Index”). Thus, Predecessor Fund performance shown through May 31, 2020 reflects the Predecessor Fund seeking to track the performance of the Former Index, and Predecessor Fund performance shown beginning June 1, 2020 reflects the Predecessor Fund seeking to track the performance of the Underlying Index. In addition, the Underlying Index performance shown reflects the blended performance of the Former Index through May 31, 2020 and the Underlying Index thereafter. Past performance does not guarantee future results. Total return figures assume reinvestment of dividends and capital gains distributions, if any. The table does not reflect the deduction of taxes that a shareholder would pay on Fund distributions or the redemption of Fund shares. Investment return and principal value of an investment will fluctuate so that an investor’s shares, when sold or redeemed, may be worth more or less than the original cost. Current performance data may be higher or lower than actual data quoted. For the most current month ̶end performance data please visit www.alpsfunds.com or call 1.866.675.2639.
Net Asset Value (NAV) is an exchange-traded fund's per-share value. The per-share dollar amount of the Fund is derived by dividing the total value of all the securities in its portfolio, less any liabilities, by the number of Fund shares outstanding. Market price is the price at which a share can currently be traded in the market. Information detailing the number of days the Market Price of the Fund was greater than the Fund's NAV and the number of days it was less than the Fund's NAV can be obtained at www.alpsfunds.com.
| ^ | The Fund commencement date was July 14, 2015. |
| * | Market Price means the official closing price of a share or, if it more accurately reflects the market value of a share at the time as of which the Fund calculates current net asset value per shares, the price that is the midpoint of the bid-ask spread as of that time. It does not represent the returns an investor would receive if shares were traded at other times. |
| ** | The O’Shares U.S. Quality Dividend Index performance information reflects the blended performance of the FTSE USA Qual/Vol/Yield Factor 5% Capped Index through May 31, 2020 and the O’Shares U.S. Quality Dividend Index thereafter. |
| *** | Effective March 31, 2023 the Morningstar US Large-Mid Cap Broad Value Index replaced the Russell 1000® Value Index as the Fund's secondary benchmark. The Adviser made this recommendation to the Board because the new index closely aligns to the Fund's investment strategies and investment restrictions. Information on both indices will be shown for a one-year transition period. |
The O’Shares U.S. Quality Dividend Index is designed to measure the performance of publicly-listed large-capitalization and mid-capitalization dividend-paying issuers in the United States that meet certain market capitalization, liquidity, high quality, low volatility and dividend yield thresholds. The high quality and low volatility requirements are designed to reduce exposure to high dividend equities that have experienced large price declines. The index is reported on a total return basis, which assumes reinvestment of any dividends and distributions realized during a given time period.
The Morningstar US Large-Mid Cap Broad Value Index is designed to provide comprehensive, consistent representation of the large-mid cap value segment of the US equity market. The index is not actively managed and does not reflect any deductions for fees, expenses or taxes. The index is reported on a total return basis, which assumes reinvestment of any dividends and distributions realized during a given time period. One cannot invest directly in an index. Index performance does not reflect fund performance.
The Russell 1000® Value Index measures the performance of the large-cap value segment of the U.S. equity universe. It includes those Russell 1000 companies with lower price-to-book ratios and lower expected growth values.
The indexes are not actively managed and do not reflect any deductions for fees, expenses or taxes. One cannot invest directly in an index. Index performance does not reflect fund performance.
The Fund's shares are not individually redeemable. Investors buy and sell shares of the Fund on a secondary market. Only market makers or "authorized participants" may trade directly with the Fund, typically in blocks of 25,000 shares.
The ALPS | O’Shares U.S. Quality Dividend ETF is not suitable for all investors. Investments in the Fund are subject to investment risks, including possible loss of the principal amount invested.
ALPS Portfolio Solutions Distributor, Inc., a FINRA member, is the distributor for the Fund.
ALPS | O’Shares U.S. Quality Dividend ETF
| Performance Overview | November 30, 2023 (Unaudited) |
Top 10 Holdings* (as of November 30, 2023)
| Microsoft Corp. | 5.63% |
| Apple, Inc. | 5.25% |
| Verizon Communications, Inc. | 4.42% |
| Comcast Corp. | 4.35% |
| Visa, Inc. | 4.04% |
| JPMorgan Chase & Co. | 3.82% |
| Mastercard, Inc. | 3.27% |
| Home Depot, Inc. | 3.18% |
| UnitedHealth Group, Inc. | 3.02% |
| Broadcom, Inc. | 2.93% |
| Total % of Top 10 Holdings | 39.91% |
Sector Allocation* (as of November 30, 2023)
| Information Technology | 22.69% |
| Health Care | 18.55% |
| Financials | 16.55% |
| Industrials | 12.21% |
| Consumer Discretionary | 10.15% |
| Consumer Staples | 8.98% |
| Communication Services | 8.77% |
| Utilities | 2.07% |
| Money Market Fund | 0.03% |
| Total | 100.00% |
Future holdings are subject to change.
Growth of $10,000 (as of November 30, 2023)
Comparison of Change in Value of $10,000 Investment in the Fund and the Indexes
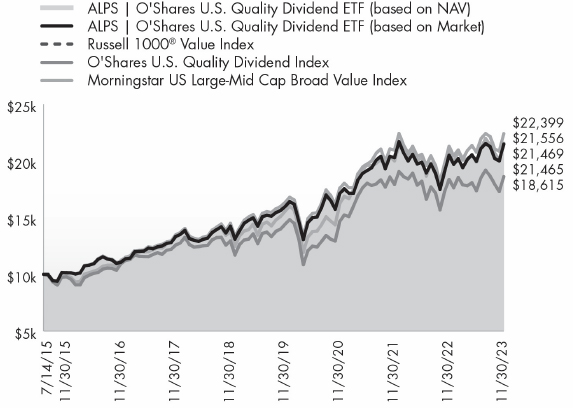
The chart above compares historical performance of a hypothetical investment of $10,000 in the Fund since inception with the performance of the Fund’s benchmark index. Results include the reinvestment of all dividends and capital gains distributions. Past performance does not guarantee future results. The chart does not reflect the deduction of taxes that a shareholder would pay on Fund distributions or the redemption of Fund shares.
ALPS | O’Shares U.S. Small-Cap Quality Dividend ETF
| Performance Overview | November 30, 2023 (Unaudited) |
Investment Objective
The ALPS|O’Shares U.S. Small-Cap Quality Dividend ETF (the "Fund") seeks investment results that track the performance, before fees and expenses, of the O'Shares U.S. Small-Cap Quality Dividend Index (the "Underlying Index").
The Underlying Index is designed to measure the performance of publicly-listed small-capitalization dividend-paying issuers in the United States that meet certain market capitalization, liquidity, high quality, low volatility and dividend yield thresholds, as determined by O'Shares Investment Advisers, LLC. The high quality and low volatility factors are designed to reduce exposure to high dividend equities that have experienced large price declines, as may occur with some dividend investing strategies. The constituents of the Underlying Index are selected from the S-Network
U.S. Equity Mid/Small-Cap 2500 Index.
Performance Overview
During the Fund's fiscal year ended November 30, 2023, the Fund generated a total return of 4.82%, generally in line with the Fund’s Underlying Index, net of fees, which returned 5.27%. The Fund underperformed the S&P 500® Index and outperformed the Russell 2000® Value Index and the Morningstar US Small-Cap Broad Value Extended Index, which returned 13.84%, -4.73% and -2.92%, respectively during the Fund's 2023 fiscal year.
The trailing-twelve-month yield for the Fund's underlying constituents as of November 30, 2023 was 1.93% vs. 2.31% and 3.30% for the Russell 2000 Value Index and the Morningstar US Small-Cap Broad Value Extended Index, respectively.
The S&P 500® Index returned 13.84% for the Fund's fiscal year ended November 30, 2023, as fiscal year 2023 saw markets rebound from 2022 lows. The Federal Reserve Bank (FED) continued its path of quantitative tightening in 2023 to combat inflation, reaching its target of peak rates with expectations of rate cuts into 2024 as Consumer Price Index (CPI), energy prices and yields trended towards more acceptable levels. U.S. markets rallied substantially off the secondary effects of the FED's actions, which ALPS Advisors believes will lead to better odds of a soft landing, with expectations of rate cuts driving growth and equity multiples higher into the next year. Main macroeconomic talking points throughout 2023 centered on the path of future interest rates driven by monetary policy, and inflation trending towards the FED's 2% inflation target. Inflation significantly declined throughout 2023, with November 2023 numbers showing year-over-year CPI around 3.1%. Despite persistent recession calls, ALPS Advisors believes a gradual reduction in interest rates is likely to lead to an earnings recovery in the U.S., easing financial conditions for both U.S. and global equities. With the recent recovery in sentiment and price for U.S. markets, the S&P 500® Index Price-to-Earnings (P/E) ratio of 22.2x is slightly above its 10-year average of 20.6x. Looking forward, ALPS Advisors believes markets are likely to be data-dependent on job growth, CPI, spending and manufacturing data to justify the recent recovery in valuations.
Compared to the Russell 2000® Value Index, the Fund saw a positive impact from its higher-quality holdings across non-cyclical sectors. The Fund outperformed the Russell 2000® Value Index across Financials, Industrials, Information Technology, and Health Care sectors, although its underweight to Energy drove the bulk of relative underperformance.
Compared to the Morningstar US Small-Cap Broad Value Extended Index, the Fund saw a positive impact from its higher-quality holdings across non-cyclical sectors. The Fund outperformed the Morningstar US Small-Cap Broad Value Extended Index across Financials, Industrials, Information Technology, Communication Services, Consumer Discretionary, Utilities and Consumer Staples sectors, while the Fund’s Health Care sector exposure drove the bulk of relative underperformance.
The best-performing stocks in the Fund during the Fund's fiscal year ended November 30, 2023, were Interdigital Inc. (IDCC), which increased 104.08%, Simpson Manufacturing Co Inc. (SSD), which saw a gain of 82.46%, and WD-40 Co. (WDFC), rising 46.91%. The largest detractors for the fund were Organon & Co (OGN), which decreased 53.77%, Cracker Barrel Old Country (CBRL), which fell 38.51%, and Forward Air Corp. (FWRD), which lost 37.34%.
Looking forward, ALPS Advisors believes the methodology of selecting small-cap companies in the U.S. with fundamental determinates including quality, low volatility, and dividend growth, provides a cost-efficient core investment holding.
Performance (as of November 30, 2023)
| | 1 Year | 5 Year | Since Inception^ |
| ALPS | O'Shares U.S. Small-Cap Quality Dividend ETF – NAV | 4.82% | 8.59% | 7.73% |
| ALPS | O'Shares U.S. Small-Cap Quality Dividend ETF – Market Price* | 4.82% | 8.59% | 7.73% |
| O'Shares U.S. Small-Cap Quality Dividend Index** | 5.27% | 9.11% | 8.25% |
| Morningstar US Small-Cap Broad Value Extended Index*** | -2.92% | 6.35% | 5.29% |
| Russell 2000® Value Index | -4.73% | 4.72% | 4.32% |
Total Expense Ratio (per the current prospectus) is 0.48%.
ALPS | O’Shares U.S. Small-Cap Quality Dividend ETF
| Performance Overview | November 30, 2023 (Unaudited) |
Performance data quoted represents past performance. The Fund adopted the historical performance of the O'Shares U.S. Small-Cap Quality Dividend ETF (the "Predecessor Fund") as the result of a reorganization in which the Fund acquired all of the assets, subject to liabilities, of the Predecessor Fund on June 17, 2022. The returns presented for the Fund for periods prior to June 17, 2022 reflect the performance of the Predecessor Fund. At the time of the reorganization, the investment objectives of the Fund and the Predecessor Fund were identical and the investment strategies of the Fund and the Predecessor Fund were substantially the same. Effective May 4, 2018, the Predecessor Fund’s underlying index was changed from the FTSE USA Small Cap Qual/Vol/Yield Factor 3% Capped Index (the “Former Underlying Index 1”) to the FTSE USA Small Cap ex Real Estate 2Qual/Vol/Yield 3% Capped Factor Index (the “Former Underlying Index 2” and together with the Former Underlying Index 1, the “Former Underlying Indexes”). Effective June 1, 2020, the Predecessor Fund’s underlying index was changed from the Former Underlying Index 2 to the Underlying Index. Thus, Predecessor Fund performance shown prior to May 4, 2018 reflects the Predecessor Fund seeking to track the performance of the Former Underlying Index 1, Predecessor Fund performance shown from May 4, 2018 through May 31, 2020 reflects the Predecessor Fund seeking to track the performance of the Former Underlying Index 2, and Predecessor Fund performance shown beginning June 1, 2020 reflects the Predecessor Fund seeking to track the performance of the Underlying Index.
In addition, the Underlying Index performance shown reflects the blended performance of the Former Underlying Index 1 through May 3, 2018, the Former Underlying Index 2 from May 4, 2018 through May 31, 2020 and the Underlying Index thereafter. Past performance does not guarantee future results. Total return figures assume reinvestment of dividends and capital gains distributions, if any. The table does not reflect the deduction of taxes that a shareholder would pay on Fund distributions or the redemption of Fund shares. Investment return and principal value of an investment will fluctuate so that an investor’s shares, when sold or redeemed, may be worth more or less than the original cost. Current performance data may be higher or lower than actual data quoted. For the most current month ̶end performance data please visit www.alpsfunds.com or call 1.866.675.2639.
Net Asset Value (NAV) is an exchange-traded fund's per-share value. The per-share dollar amount of the Fund is derived by dividing the total value of all the securities in its portfolio, less any liabilities, by the number of Fund shares outstanding. Market price is the price at which a share can currently be traded in the market. Information detailing the number of days the Market Price of the Fund was greater than the Fund's NAV and the number of days it was less than the Fund's NAV can be obtained at www.alpsfunds.com.
| ^ | The Fund commencement date was December 30, 2016. |
| * | Market Price means the official closing price of a share or, if it more accurately reflects the market value of a share at the time as of which the Fund calculates current net asset value per shares, the price that is the midpoint of the bid-ask spread as of that time. It does not represent the returns an investor would receive if shares were traded at other times. |
| ** | The O’Shares U.S. Small-Cap Quality Dividend Index performance information reflects the blended performance of the FTSE USA Small Cap Qual/Vol/Yield 3% Capped Factor Index through May 3, 2018, the FTSE USA Small Cap ex Real Estate 2Qual/Vol/Yield 3% Capped Factor Index from May 4, 2018 through May 31, 2020 and the O’Shares U.S. Small-Cap Quality Dividend Index thereafter. |
| *** | Effective March 31, 2023 the Morningstar US Small-Cap Broad Value Extended Index replaced the Russell 2000® Value Index as the Fund's secondary benchmark. The Adviser made this recommendation to the Board because the new index closely aligns to the Fund's investment strategies and investment restrictions. Information on both indices will be shown for a one-year transition period. |
The O’Shares U.S. Small-Cap Quality Dividend Index is designed to reflect the performance of publicly-listed small-capitalization dividend paying issuers in the United States that meet certain market capitalization, liquidity, high quality, low volatility and dividend yield thresholds. The quality and low volatility requirements are designed to reduce exposure to high dividend equities that have experienced large price declines. The index is reported on a total return basis, which assumes reinvestment of any dividends and distributions realized during a given time period.
Morningstar US Small-Cap Broad Value Extended Index is designed to provide comprehensive, consistent representation of the small-cap value segment of the US equity market. The index is not actively managed and does not reflect any deductions for fees, expenses or taxes. The index is reported on a total return basis, which assumes reinvestment of any dividends and distributions realized during a given time period. One cannot invest directly in an index. Index performance does not reflect fund performance.
The Russell 2000® Value Index measures the performance of the small capitalization value sector of the U.S. equity market.
The indexes are not actively managed and do not reflect any deductions for fees, expenses or taxes. One cannot invest directly in an index. Index performance does not reflect fund performance.
The Fund's shares are not individually redeemable. Investors buy and sell shares of the Fund on a secondary market. Only market makers or "authorized participants" may trade directly with the Fund, typically in blocks of 25,000 shares.
The ALPS | O’Shares U.S. Small-Cap Quality Dividend ETF is not suitable for all investors. Investments in the Fund are subject to investment risks, including possible loss of the principal amount invested.
ALPS Portfolio Solutions Distributor, Inc., a FINRA member, is the distributor for the Fund.
ALPS | O’Shares U.S. Small-Cap Quality Dividend ETF
| Performance Overview | November 30, 2023 (Unaudited) |
Top 10 Holdings* (as of November 30, 2023)
| Williams-Sonoma, Inc. | 2.50% |
| Tradeweb Markets, Inc. | 2.24% |
| Chemed Corp. | 2.24% |
| Teleflex, Inc. | 2.16% |
| Lincoln Electric Holdings, Inc. | 2.14% |
| MarketAxess Holdings, Inc. | 2.09% |
| Old Republic International Corp. | 1.98% |
| New York Times Co. | 1.97% |
| Juniper Networks, Inc. | 1.96% |
| Owens Corning | 1.87% |
| Total % of Top 10 Holdings | 21.15% |
| * | % of Total Investments (excluding investments purchased with collateral from securities loaned). |
Sector Allocation* (as of November 30, 2023)
| Financials | 22.47% |
| Industrials | 22.22% |
| Consumer Discretionary | 21.42% |
| Information Technology | 10.50% |
| Health Care | 10.28% |
| Consumer Staples | 5.29% |
| Utilities | 4.27% |
| Communication Services | 3.53% |
| Money Market Fund | 0.02% |
| Total | 100.00% |
Future holdings are subject to change.
Growth of $10,000 (as of November 30, 2023)
Comparison of Change in Value of $10,000 Investment in the Fund and the Indexes
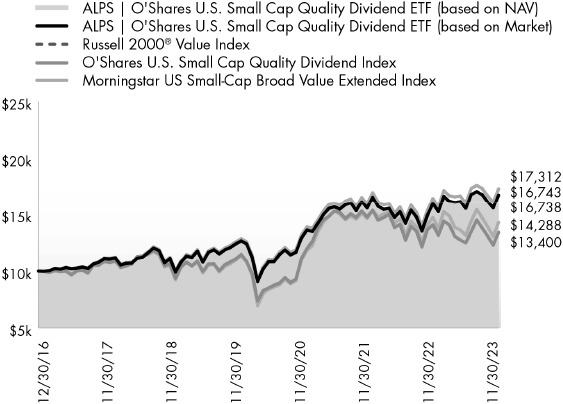
The chart above compares historical performance of a hypothetical investment of $10,000 in the Fund since inception with the performance of the Fund’s benchmark index. Results include the reinvestment of all dividends and capital gains distributions. Past performance does not guarantee future results. The chart does not reflect the deduction of taxes that a shareholder would pay on Fund distributions or the redemption of Fund shares.
ALPS | O’Shares Global Internet Giants ETF
| Performance Overview | November 30, 2023 (Unaudited) |
Investment Objective
The ALPS|O’Shares Global Internet Giants ETF (the "Fund") seeks investment results that track the performance, before fees and expenses, of the O'Shares Global Internet Giants Index (the "Underlying Index").
The Underlying Index is a rules-based index intended to give investors a means of tracking stocks exhibiting quality and growth characteristics in the "internet sector", as defined by O'Shares Investment Advisers, LLC.
Performance Overview
The Fund generated a total return of 37.44% for the Fund's fiscal year ended November 30, 2023, generally in line with the Fund’s Underlying Index, net of fees, which returned 38.23%. The Fund outperformed the NASDAQ 100 Index, which returned 33.73% during the Fund's fiscal year.
The S&P 500® Index returned 13.84% for the Fund's fiscal year ended November 30, 2023, as fiscal year 2023 saw markets rebound from 2022 lows. The Federal Reserve Bank (FED) continued its path of quantitative tightening in 2023 to combat inflation, reaching its target of peak rates with expectations of rate cuts into 2024 as Consumer Price Index (CPI), energy prices and yields trended towards more acceptable levels. U.S. markets rallied substantially off the secondary effects of the FED's actions, which ALPS Advisors believes will lead to better odds of a soft landing, with expectations of rate cuts driving growth and equity multiples higher into the next year. Main macroeconomic talking points throughout 2023 centered on the path of future interest rates driven by monetary policy, and inflation trending towards the FED's 2% inflation target. Inflation significantly declined throughout 2023, with November 2023 numbers showing year-over-year CPI around 3.1%. Despite persistent recession calls, ALPS Advisors believes a gradual reduction in interest rates is likely to lead to an earnings recovery in the U.S., easing financial conditions for both U.S. and global equities. With the recent recovery in sentiment and price for U.S. markets, the S&P 500® Index Price-to-Earnings (P/E) ratio of 22.2x is slightly above its 10-year average of 20.6x. Looking forward, ALPS Advisors believes markets are likely to be data-dependent on job growth, CPI, spending and manufacturing data to justify the recent recovery in valuations.
The Fund outperformed the NASDAQ 100 Index, which returned 33.73% for the Fund's fiscal year ended November 30, 2023. The Fund holds roughly 74% U.S. equities and 26% foreign equities, with the majority of foreign holdings domiciled in China. Artificial Intelligence (AI) has been the buzzword of the year, creating a frenzy within the Information Technology sector as new-age digital transformation and AI beneficiaries have led all other sectors during the Fund's fiscal year ended November 30, 2023. Developing economies and emerging market stocks as a whole were buoyed by positive catalysts, including a weakening US dollar and inexpensive valuations. Emerging markets' relative underperformance stemmed from inflationary pressures, currency devaluation, higher borrowing costs, and below-consensus growth from China’s economic recovery, which has been underwhelming due to regulatory crackdowns in tech and recent deflationary pressures.
The best-performing stocks in the Fund during the Fund's fiscal year ended November 30, 2023, were Meta Platforms Inc. (META US), which increased by 170.61%, and Samsara Inc. (IOT US), which saw a gain of 168.66%. Other top performers included Mongodb Inc. (MDB US), which climbed 160.51%. The largest detractors were Chewy Inc. (CHWY US), which decreased 54.90%, Etsy Inc. (ETSY US), which fell 51.90%, and Bill Holdings Inc. (BILL US) which lost 47.89%.
Looking forward, ALPS Advisors believes the rules-based approach of investing in some of the largest global companies that derive most of their revenue from the internet technology and e-commerce business segments with above-average growth potential provides a quality and differentiated investment holding.
Performance (as of November 30, 2023)
| | 1 Year | 5 Year | Since Inception^ |
| ALPS | O'Shares Global Internet Giants ETF – NAV | 37.44% | 10.56% | 6.05% |
| ALPS | O'Shares Global Internet Giants ETF – Market Price* | 37.20% | 10.63% | 6.05% |
| O'Shares Global Internet Giants Index | 38.23% | 11.14% | 6.60% |
| NASDAQ 100 Index | 33.73% | 19.12% | 16.79% |
Total Expense Ratio (per the current prospectus) is 0.48%.
Performance data quoted represents past performance. The Fund adopted the historical performance of the O'Shares Global Internet Giants ETF (the "Predecessor Fund") as the result of a reorganization in which the Fund acquired all of the assets, subject to liabilities, of the Predecessor Fund on June 17, 2022. The returns presented for the Fund for periods prior to June 17, 2022 reflect the performance of the Predecessor Fund. At the time of the reorganization, the investment objectives of the Fund and the Predecessor Fund were identical and the investment strategies of the Fund and the Predecessor Fund were substantially the same. Past performance does not guarantee future results. Total return figures assume reinvestment of dividends and capital gains distributions, if any. The table does not reflect the deduction of taxes that a shareholder would pay on Fund distributions or the redemption of Fund shares. Investment return and principal value of an investment will fluctuate so that an investor’s shares, when sold or redeemed, may be worth more or less than the original cost. Current performance data may be higher or lower than actual data quoted. For the most current month ̶end performance data please visit www.alpsfunds.com or call 1.866.675.2639.
ALPS | O’Shares Global Internet Giants ETF
| Performance Overview | November 30, 2023 (Unaudited) |
Net Asset Value (NAV) is an exchange-traded fund's per-share value. The per-share dollar amount of the Fund is derived by dividing the total value of all the securities in its portfolio, less any liabilities, by the number of Fund shares outstanding. Market price is the price at which a share can currently be traded in the market. Information detailing the number of days the Market Price of the Fund was greater than the Fund's NAV and the number of days it was less than the Fund's NAV can be obtained at www.alpsfunds.com.
| ^ | The Fund commencement date was June 5, 2018. |
| * | Market Price means the official closing price of a share or, if it more accurately reflects the market value of a share at the time as of which the Fund calculates current net asset value per shares, the price that is the midpoint of the bid-ask spread as of that time. It does not represent the returns an investor would receive if shares were traded at other times. |
The O’Shares Global Internet Giants Index is a rules-based index intended to give investors a means of tracking stocks exhibiting quality and growth characteristics in the internet technology and e-commerce business segments and pass screens for gross margin and cash burn sustainability. Companies included in the Underlying Index derive at least 50% of their revenues from a) internet technology companies whose principal business is to provide the technologies that support internet commerce; and b) internet commerce companies whose principal business is to sell products and services via the internet. The index is reported on a total return basis, which assumes reinvestment of any dividends and distributions realized during a given time period.
The NASDAQ 100 Index includes 100 of the largest domestic and international non-financial companies listed on the Nasdaq Stock Market based on market capitalization.
The indexes are not actively managed and do not reflect any deductions for fees, expenses or taxes. One cannot invest directly in an index. Index performance does not reflect fund performance.
The Fund's shares are not individually redeemable. Investors buy and sell shares of the Fund on a secondary market. Only market makers or "authorized participants" may trade directly with the Fund, typically in blocks of 25,000 shares.
The ALPS | O’Shares Global Internet Giants ETF is not suitable for all investors. Investments in the Fund are subject to investment risks, including possible loss of the principal amount invested.
ALPS Portfolio Solutions Distributor, Inc., a FINRA member, is the distributor for the Fund.
ALPS | O’Shares Global Internet Giants ETF
| Performance Overview | November 30, 2023 (Unaudited) |
Top 10 Holdings* (as of November 30, 2023)
| Microsoft Corp. | 6.73% |
| Amazon.com, Inc. | 6.03% |
| Alphabet, Inc. | 4.44% |
| Meta Platforms, Inc. | 4.37% |
| PDD Holdings, Inc. | 3.47% |
| ServiceNow, Inc. | 2.19% |
| Crowdstrike Holdings, Inc. | 2.05% |
| Snowflake, Inc. | 1.83% |
| Adobe, Inc. | 1.73% |
| MercadoLibre, Inc. | 1.69% |
| Total % of Top 10 Holdings | 34.53% |
| * | % of Total Investments (excluding investments purchased with collateral from securities loaned). |
Sector Allocation* (as of November 30, 2023)
| Information Technology | 51.94% |
| Consumer Discretionary | 21.48% |
| Communication Services | 20.57% |
| Industrials | 5.12% |
| Real Estate | 0.83% |
| Money Market Fund | 0.06% |
| Total | 100.00% |
Future holdings are subject to change.
Growth of $10,000 (as of November 30, 2023)
Comparison of Change in Value of $10,000 Investment in the Fund and the Indexes
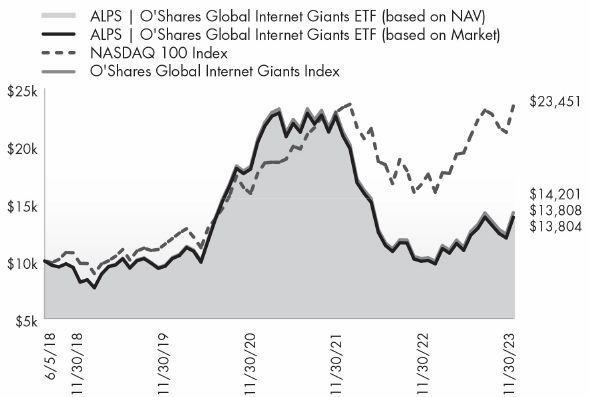
The chart above compares historical performance of a hypothetical investment of $10,000 in the Fund since inception with the performance of the Fund’s benchmark index. Results include the reinvestment of all dividends and capital gains distributions. Past performance does not guarantee future results. The chart does not reflect the deduction of taxes that a shareholder would pay on Fund distributions or the redemption of Fund shares.
ALPS | O’Shares Europe Quality Dividend ETF
| Performance Overview | November 30, 2023 (Unaudited) |
Investment Objective
The ALPS|O’Shares Europe Quality Dividend ETF (the "Fund") seeks investment results that track the performance, before fees and expenses, of the O'Shares Europe Quality Dividend Index (the "Underlying Index").
The Underlying Index is designed to measure the performance of publicly-listed large-capitalization and mid-capitalization dividend-paying issuers in Europe that meet certain market capitalization, liquidity, high quality, low volatility and dividend yield thresholds, as determined by O'Shares Investment Advisers, LLC. The high quality and low volatility requirements are designed to reduce exposure to high dividend equities that have experienced large price declines. The constituents of the Underlying Index are selected from the S-Network Europe Equity 500 Index.
Performance Overview
The Fund generated a total return of 15.99% for the Fund's fiscal year ended November 30, 2023, generally in-line with the Underlying Index, net of fees, which returned 16.45%. The Fund outperformed the Morningstar Developed Markets ex-North America Index (MSDINUS Index) and the Euro Stoxx 50 Net Return USD Index (SX5U Index), which returned 11.87% and 20.14%, respectively, for the same period.
The trailing twelve-month yield for the Fund’s constituents as of November 30, 2023 was 2.36% vs. 3.17% for the MSDINUS Index.
Developed Markets (ex-U.S.), as represented by the MSDINUS Index, returned 11.87% for the Fund's fiscal year ended November 30, 2023, compared to the S&P 500® Index return of 13.84%, as fiscal year 2023 saw global markets rebound from the 2022 lows. The European Central Bank (ECB) and the Federal Reserve Bank (FED) continued on their path of quantitative tightening in 2023 to combat inflation, with most international developed countries nearing or reaching peak interest rate levels. Inflationary pressures, including energy prices, fell sharply for most of the developed world, driving prices, and equity multiples higher as fears of substantially lower growth abated. Main macroeconomic talking points throughout 2023 centered on the path of future interest rates driven by monetary policy, and inflation trending towards the ECB and FED's 2% inflation target. Despite the persistent recession calls in 2023, developed ex-US stocks have shown signs of resiliency, with real GDP so far surprising to the upside in Q3. The latest economic data displays Real GDP year-over-year rising to 5.2% in the US and 2.4% for Developed Economies (those nations with more advanced economies, well-developed infrastructure, more mature capital markets, and higher standards of living). While the recent recovery in sentiment and returns has caused ex- U.S. stocks to rally, the Morningstar Developed Markets ex-North America Index Price-to- Earnings (P/E) ratio of 13.34x remains below its 10-year average. Looking forward, ALPS Advisors believes markets are likely to be data-dependent on job growth, the Consumer Price Index (CPI), and spending and manufacturing data to justify the recent recovery in valuations.
Compared to the SX5U Index, despite the Fund’s underperformance from a total return perspective, the Fund saw a positive impact of 2.87% from its relative overweight to Industrials, while the Fund’s underweight to Financials was the largest detractor (1.87%) from relative performance. From a geographical perspective, the highest contribution to return was attributed to holdings based in Germany, which contributed 5.05% towards overall Fund performance. All regions in the Fund contributed net positive performance during the Fund's 2023 fiscal year.
The best-performing stocks during the Fund's fiscal year ended November 30, 2023, were Novo Nordisk A/S (NOVOB DC), 3I Group PLC which increased 86.62%, (III LN), Sap SE which returned 83.87%, and (SAP GR), which gained 54.43%. The worst performing stocks were Hexagon AB (HEXAB SS), losing 22.21%, Diageo PLC (DGE LN), which fell 21.08%, and British American tobacco PLC (BATS LN), which decreased by 15.35%.
Looking forward, ALPS Advisors believes the methodology of selecting large-cap and mid-cap companies in Europe with fundamental determinates including quality, low volatility and dividend growth, provides a cost-efficient core investment holding.
Performance (as of November 30, 2023)
| | 1 Year | 5 Year | Since Inception^ |
| ALPS | O'Shares Europe Quality Dividend ETF – NAV | 15.99% | 6.66% | 4.05% |
| ALPS | O'Shares Europe Quality Dividend ETF – Market Price* | 14.94% | 6.70% | 4.06% |
| O'Shares Europe Quality Dividend Index** | 16.45% | 7.15% | 4.54% |
| EURO STOXX 50 Net Return USD Index | 20.14% | 8.41% | 5.15% |
Total Expense Ratio (per the current prospectus) is 0.48%.
Performance data quoted represents past performance. The Fund adopted the historical performance of the O'Shares Europe Quality Dividend ETF (the "Predecessor Fund") as the result of a reorganization in which the Fund acquired all of the assets, subject to liabilities, of the Predecessor Fund on June 17, 2022. The returns presented for the Fund for periods prior to June 17, 2022 reflect the performance of the Predecessor Fund. At the time of the reorganization, the investment objectives of the Fund and the Predecessor Fund were identical and the investment strategies of the Fund and the Predecessor Fund were substantially the same. Previously, the Predecessor Fund had adopted the historical performance of the O’Shares FTSE Europe Quality Dividend ETF (the “Previous Predecessor Fund”), a series of FQF Trust, as the result of a reorganization in which the Predecessor Fund acquired all of the assets, subject to liabilities, of the Previous Predecessor Fund on June 28, 2018. The returns presented for the Predecessor Fund for periods prior to June 28, 2018 reflect the performance of the Previous Predecessor Fund. At the time of the reorganization, the investment objectives of the Previous Predecessor Fund and the Predecessor Fund were identical and the investment strategies of the Previous Predecessor Fund and the Predecessor Fund were substantially the same.
ALPS | O’Shares Europe Quality Dividend ETF
| Performance Overview | November 30, 2023 (Unaudited) |
Effective June 1, 2020, the Predecessor Fund’s underlying index was changed to the Underlying Index from the FTSE Developed Europe Qual/Vol/Yield 5% Capped Factor Index (the “Former Index”). Thus, Predecessor Fund performance shown through May 31, 2020 reflects the Predecessor Fund seeking to track the performance of the Former Index, and Predecessor Fund performance shown beginning June 1, 2020 reflects the Predecessor Fund seeking to track the performance of the Underlying Index. In addition, the Underlying Index performance shown reflects the blended performance of the Former Index through May 31, 2020 and the Underlying Index thereafter. Past performance does not guarantee future results. Total return figures assume reinvestment of dividends and capital gains distributions, if any. The table does not reflect the deduction of taxes that a shareholder would pay on Fund distributions or the redemption of Fund shares. Investment return and principal value of an investment will fluctuate so that an investor’s shares, when sold or redeemed, may be worth more or less than the original cost. Current performance data may be higher or lower than actual data quoted. For the most current month end performance data please visit www.alpsfunds.com or call 1.866.675.2639.
Net Asset Value (NAV) is an exchange-traded fund's per-share value. The per-share dollar amount of the Fund is derived by dividing the total value of all the securities in its portfolio, less any liabilities, by the number of Fund shares outstanding. Market price is the price at which a share can currently be traded in the market. Information detailing the number of days the Market Price of the Fund was greater than the Fund's NAV and the number of days it was less than the Fund's NAV can be obtained at www.alpsfunds.com.
| ^ | The Fund commencement date was August 19, 2015. |
| * | Market Price means the official closing price of a share or, if it more accurately reflects the market value of a share at the time as of which the Fund calculates current net asset value per shares, the price that is the midpoint of the bid-ask spread as of that time. It does not represent the returns an investor would receive if shares were traded at other times. |
| ** | The O’Shares Europe Quality Dividend Index performance information reflects the blended performance of the FTSE Developed Europe Qual/Vol/Yield 5% Capped Factor Index through May 31, 2020 and the O’Shares Europe Quality Dividend Index thereafter. |
The O’Shares Europe Quality Dividend Index is designed to reflect the performance of publicly-listed large-capitalization and mid-capitalization dividend paying issuers in Europe that meet certain market capitalization, liquidity, high quality, low volatility and high dividend yield thresholds. The quality and low volatility requirements are designed to reduce exposure to high dividend equities that have experienced large price declines. The index is reported on a Net Total Return basis which assumes reinvestment of any dividends and distributions realized during a given time period (net of any amounts of withholding tax).
The EURO STOXX 50 Net Return USD Index represents the performance of the 50 largest companies among the 20 supersectors in terms of free-float market cap in Eurozone countries.
The indexes are not actively managed and do not reflect any deductions for fees, expenses or taxes. One cannot invest directly in an index. Index performance does not reflect fund performance.
The Fund's shares are not individually redeemable. Investors buy and sell shares of the Fund on a secondary market. Only market makers or "authorized participants" may trade directly with the Fund, typically in blocks of 25,000 shares.
The ALPS | O’Shares Europe Quality Dividend ETF is not suitable for all investors. Investments in the Fund are subject to investment risks, including possible loss of the principal amount invested.
ALPS Portfolio Solutions Distributor, Inc., a FINRA member, is the distributor for the Fund.
ALPS | O’Shares Europe Quality Dividend ETF
| Performance Overview | November 30, 2023 (Unaudited) |
Top 10 Holdings* (as of November 30, 2023)
| Novo Nordisk A/S | 5.03% |
| ASML Holding NV | 4.75% |
| Nestle SA | 4.62% |
| LVMH Moet Hennessy Louis Vuitton SE | 3.86% |
| SAP SE | 3.80% |
| Novartis AG | 3.79% |
| Roche Holding AG | 3.66% |
| Siemens AG | 3.35% |
| Schneider Electric SE | 3.08% |
| Allianz SE | 3.05% |
| Total % of Top 10 Holdings | 38.99% |
Country Exposure* (as of November 30, 2023)
| France | 19.42% |
| Switzerland | 19.12% |
| Great Britain | 18.59% |
| Germany | 15.66% |
| Netherlands | 9.27% |
| Sweden | 5.54% |
| Denmark | 5.26% |
| Spain | 4.40% |
| Ireland | 1.44% |
| Finland | 1.22% |
| Money Market Fund | 0.08% |
| Total | 100.00% |
Future holdings are subject to change.
Sector Allocation* (as of November 30, 2023)
| Industrials | 25.57% |
| Health Care | 16.91% |
| Consumer Staples | 15.65% |
| Consumer Discretionary | 12.95% |
| Financials | 11.80% |
| Information Technology | 8.56% |
| Utilities | 4.50% |
| Communication Services | 3.98% |
| Money Market Fund | 0.08% |
| Total | 100.00% |
ALPS | O’Shares Europe Quality Dividend ETF
| Performance Overview | November 30, 2023 (Unaudited) |
Growth of $10,000 (as of November 30, 2023)
Comparison of Change in Value of $10,000 Investment in the Fund and the Indexes
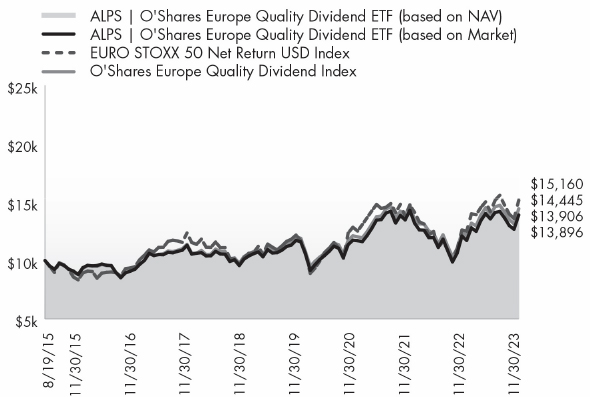
The chart above compares historical performance of a hypothetical investment of $10,000 in the Fund since inception with the performance of the Fund’s benchmark index. Results include the reinvestment of all dividends and capital gains distributions. Past performance does not guarantee future results. The chart does not reflect the deduction of taxes that a shareholder would pay on Fund distributions or the redemption of Fund shares.
ALPS ETF Trust
| Disclosure of Fund Expenses | November 30, 2023 (Unaudited) |
Shareholder Expense Example: As a shareholder of a Fund, you incur certain ongoing costs, including management fees and other Fund expenses. These examples are intended to help you understand your ongoing costs (in dollars) of investing in the Fund and to compare these costs with the ongoing costs of investing in other funds. It is based on an investment of $1,000 invested at the beginning of the six month period and held through November 30, 2023.
Actual Return: The first line of the table provides information about actual account values and actual expenses. You may use the information in this line, together with the amount you invested, to estimate the expenses that you incurred over the period. Simply divide your account value by $1,000 (for example, an $8,600 account value divided by $1,000 = 8.6), then multiply the result by the number in the first line under the heading entitled “Expenses Paid During Period” to estimate the expenses attributable to your investment during this period.
Hypothetical 5% Return: The second line of the table provides information about hypothetical account values and hypothetical expenses based on the Fund’s actual expense ratio and an assumed rate of return of 5% per year before expenses, which is not the Fund’s actual return. The hypothetical account values and expenses may not be used to estimate the actual ending account balance or expenses you paid for the period. You may use this information to compare ongoing costs of investing in the Fund and other funds. To do so, compare this 5% hypothetical example with the 5% hypothetical examples that appear in the shareholder reports of other funds.
The expenses shown in the table are meant to highlight ongoing Fund costs only and do not reflect any transaction costs, such as brokerage commissions and other fees to financial intermediaries. Therefore, the second line is useful in comparing ongoing costs only, and will not help you determine the relative total costs of owning different funds. In addition, if these costs were included, your costs would have been higher.
| | Beginning Account Value 6/1/23 | Ending Account Value 11/30/23 | Expense Ratio(a) | Expenses Paid During Period 6/1/23 - 11/30/23(b) |
| ALPS | O'Shares U.S. Quality Dividend ETF | | | | |
| Actual | $ 1,000.00 | $ 1,075.30 | 0.48% | $ 2.50 |
| Hypothetical (5% return before expenses) | $ 1,000.00 | $ 1,022.66 | 0.48% | $ 2.43 |
| | | | | |
| ALPS | O'Shares U.S. Small-Cap Quality Dividend ETF | | | | |
| Actual | $ 1,000.00 | $ 1,077.00 | 0.48% | $ 2.50 |
| Hypothetical (5% return before expenses) | $ 1,000.00 | $ 1,022.66 | 0.48% | $ 2.43 |
| | | | | |
| ALPS | O'Shares Global Internet Giants ETF | | | | |
| Actual | $ 1,000.00 | $ 1,127.40 | 0.48% | $ 2.56 |
| Hypothetical (5% return before expenses) | $ 1,000.00 | $ 1,022.66 | 0.48% | $ 2.43 |
| | | | | |
| ALPS | O'Shares Europe Quality Dividend ETF | | | | |
| Actual | $ 1,000.00 | $ 1,028.60 | 0.48% | $ 2.44 |
| Hypothetical (5% return before expenses) | $ 1,000.00 | $ 1,022.66 | 0.48% | $ 2.43 |
| (a) | Annualized based on the Fund's most recent fiscal half-year expenses. |
| (b) | Expenses are equal to the Fund's annualized expense ratio multiplied by the average account value over the period, multiplied by the number of days in the most recent fiscal half year (183), divided by 365. |
ALPS ETF Trust
Report of Independent Registered Public Accounting Firm
To the Shareholders of ALPS | O’Shares U.S. Quality Dividend ETF, ALPS | O’Shares U.S. Small-Cap Quality Dividend ETF, ALPS | O’Shares Global Internet Giants ETF and ALPS | O’Shares Europe Quality Dividend ETF and Board of Trustees of ALPS ETF Trust
Opinion on the Financial Statements
We have audited the accompanying statements of assets and liabilities, including the schedules of investments, of ALPS | O’Shares U.S. Quality Dividend ETF, ALPS | O’Shares U.S. Small-Cap Quality Dividend ETF, ALPS | O’Shares Global Internet Giants ETF and ALPS | O’Shares Europe Quality Dividend ETF (the “Funds”), each a series of ALPS ETF Trust, as of November 30, 2023, the related statements of operations and changes in net assets, the related notes, and the financial highlights for the year then ended (collectively referred to as the “financial statements”). In our opinion, the financial statements present fairly, in all material respects, the financial position of each of the Funds as of November 30, 2023, the results of their operations, the changes in net assets, and the financial highlights for the year then ended, in conformity with accounting principles generally accepted in the United States of America.
The Funds’ financial statements and financial highlights for the period ended November 30, 2022, and prior, were audited by other auditors whose report dated January 27, 2023, expressed an unqualified opinion on those financial statements and financial highlights.
Basis for Opinion
These financial statements are the responsibility of the Funds’ management. Our responsibility is to express an opinion on the Funds’ financial statements based on our audits. We are a public accounting firm registered with the Public Company Accounting Oversight Board (United States) (“PCAOB”) and are required to be independent with respect to the Funds in accordance with the U.S. federal securities laws and the applicable rules and regulations of the Securities and Exchange Commission and the PCAOB.
We conducted our audits in accordance with the standards of the PCAOB. Those standards require that we plan and perform the audit to obtain reasonable assurance about whether the financial statements are free of material misstatement whether due to error or fraud.
Our audits included performing procedures to assess the risks of material misstatement of the financial statements, whether due to error or fraud, and performing procedures that respond to those risks. Such procedures included examining, on a test basis, evidence regarding the amounts and disclosures in the financial statements. Our procedures included confirmation of securities owned as of November 30, 2023, by correspondence with the custodian and brokers; when replies were not received from brokers, we performed other auditing procedures. Our audits also included evaluating the accounting principles used and significant estimates made by management, as well as evaluating the overall presentation of the financial statements. We believe that our audits provide a reasonable basis for our opinion.
We have served as the auditor of one or more investment companies advised by ALPS Advisors, Inc. since 2013.

COHEN & COMPANY, LTD.
Philadelphia, Pennsylvania
January 29, 2024
ALPS | O’Shares U.S. Quality Dividend ETF
| Schedule of Investments | November 30, 2023 |
| Security Description | | Shares | | | Value | |
| COMMON STOCKS (99.85%) | | | | | | |
| Aerospace & Defense (1.83%) | | | | | | |
| General Dynamics Corp. | | | 12,208 | | | $ | 3,015,010 | |
| Lockheed Martin Corp. | | | 12,437 | | | | 5,568,915 | |
| Northrop Grumman Corp. | | | 7,220 | | | | 3,430,655 | |
| Total Aerospace & Defense | | | | | | | 12,014,580 | |
| | | | | | | | | |
| Air Freight & Logistics (0.96%) | | | | | | | | |
| Expeditors International of | | | | | | | | |
| Washington, Inc. | | | 6,473 | | | | 778,961 | |
| United Parcel Service, Inc., | | | | | | | | |
| Class B | | | 36,275 | | | | 5,499,653 | |
| Total Air Freight & Logistics | | | | | | | 6,278,614 | |
| Banks (3.82%) | | | | | | | | |
| JPMorgan Chase & Co. | | | 160,495 | | | | | |
| | | | | | | | 25,050,060 | |
| Beverages (2.36%) | | | | | | | | |
| Brown-Forman Corp., Class B | | | 10,232 | | | | 601,028 | |
| Coca-Cola Co. | | | 132,303 | | | | 7,731,787 | |
| PepsiCo, Inc. | | | 42,483 | | | | 7,149,464 | |
| Total Beverages | | | | | | | 15,482,279 | |
| | | | | | | | | |
| Biotechnology (2.86%) | | | | | | | | |
| AbbVie, Inc. | | | 67,999 | | | | 9,682,377 | |
| Amgen, Inc. | | | 20,447 | | | | 5,513,329 | |
| Gilead Sciences, Inc. | | | 46,658 | | | | 3,574,003 | |
| Total Biotechnology | | | | | | | 18,769,709 | |
| | | | | | | | | |
| Building Products (0.58%) | | | | | | | | |
| Johnson Controls International PLC | | | 27,898 | | | | 1,473,014 | |
| Trane Technologies PLC | | | 10,222 | | | | 2,304,141 | |
| Total Building Products | | | | | | | 3,777,155 | |
| | | | | | | | | |
| Capital Markets (3.19%) | | | | | | | | |
| BlackRock, Inc. | | | 7,878 | | | | 5,918,190 | |
| Cboe Global Markets, Inc. | | | 5,640 | | | | 1,027,552 | |
| Moody's Corp. | | | 10,026 | | | | 3,659,089 | |
| MSCI, Inc. | | | 4,019 | | | | 2,093,296 | |
| S&P Global, Inc. | | | 16,797 | | | | 6,984,697 | |
| T Rowe Price Group, Inc. | | | 12,311 | | | | 1,232,700 | |
| Total Capital Markets | | | | | | | 20,915,524 | |
| | | | | | | | | |
| Commercial Services & Supplies (0.82%) | | | | | | | | |
| Cintas Corp. | | | 3,853 | | | | 2,131,672 | |
| Waste Management, Inc. | | | 19,062 | | | | 3,259,412 | |
| Total Commercial Services & Supplies | | | | | | | 5,391,084 | |
| | | | | | | | | |
| Communications Equipment (1.96%) | | | | | | | | |
| Cisco Systems, Inc. | | | 213,255 | | | | 10,317,277 | |
| Motorola Solutions, Inc. | | | 7,856 | | | | 2,536,467 | |
| Total Communications Equipment | | | | | | | 12,853,744 | |
| | | | | | | | | |
| Consumer Staples Distribution & Retail (2.56%) | | | | | | | | |
| Costco Wholesale Corp. | | | 13,327 | | | | 7,899,446 | |
| Security Description | | Shares | | | Value | |
| Consumer Staples Distribution & Retail (continued) | | | | | | |
| Dollar General Corp. | | | 5,581 | | | $ | 731,781 | |
| Target Corp. | | | 12,329 | | | | 1,649,743 | |
| Walmart, Inc. | | | 41,902 | | | | 6,523,722 | |
| Total Consumer Staples Distribution & Retail | | | | | | | 16,804,692 | |
| | | | | | | | | |
| Diversified Telecommunication Services (4.42%) | | | | | | | | |
| Verizon Communications, Inc. | | | 756,309 | | | | 28,989,324 | |
| | | | | | | | | |
| Electric Utilities (1.65%) | | | | | | | | |
| NextEra Energy, Inc. | | | 184,927 | | | | 10,820,079 | |
| | | | | | | | | |
| Electrical Equipment (0.59%) | | | | | | | | |
| Eaton Corp. PLC | | | 17,022 | | | | 3,875,739 | |
| | | | | | | | | |
| Electronic Equipment, Instruments & Components (0.68%) | | | | | | | | |
| Amphenol Corp., Class A | | | 28,316 | | | | 2,576,473 | |
| TE Connectivity, Ltd. | | | 14,588 | | | | 1,911,028 | |
| Total Electronic Equipment, Instruments & Components | | | | | | | 4,487,501 | |
| | | | | | | | | |
| Financial Services (7.29%) | | | | | | | | |
| Mastercard, Inc., Class A | | | 51,816 | | | | 21,443,015 | |
| Visa, Inc., Class A | | | 103,128 | | | | 26,470,894 | |
| Total Financial Services | | | | | | | 47,913,909 | |
| | | | | | | | | |
| Food Products (0.87%) | | | | | | | | |
| Archer-Daniels-Midland Co. | | | 15,126 | | | | 1,115,240 | |
| General Mills, Inc. | | | 16,338 | | | | 1,040,077 | |
| Hershey Co. | | | 4,328 | | | | 813,318 | |
| Mondelez International, Inc., Class A | | | 38,852 | | | | 2,760,823 | |
| Total Food Products | | | | | | | 5,729,458 | |
| | | | | | | | | |
| Ground Transportation (1.78%) | | | | | | | | |
| CSX Corp. | | | 90,859 | | | | 2,934,746 | |
| Norfolk Southern Corp. | | | 9,822 | | | | 2,142,768 | |
| Union Pacific Corp. | | | 29,314 | | | | 6,603,564 | |
| Total Ground Transportation | | | | | | | 11,681,078 | |
| | | | | | | | | |
| Health Care Equipment & Supplies (2.13%) | | | | | | | | |
| Abbott Laboratories | | | 65,127 | | | | 6,792,095 | |
| Medtronic PLC | | | 47,911 | | | | 3,797,905 | |
| Stryker Corp. | | | 11,531 | | | | 3,416,981 | |
| Total Health Care Equipment & Supplies | | | | | | | 14,006,981 | |
| | | | | | | | | |
| Health Care Providers & Services (3.96%) | | | | | | | | |
| Cigna Group | | | 9,394 | | | | 2,469,495 | |
| Elevance Health, Inc. | | | 7,799 | | | | 3,739,543 | |
| UnitedHealth Group, Inc. | | | 35,800 | | | | 19,796,325 | |
| Total Health Care Providers & Services | | | | | | | 26,005,363 | |
ALPS | O’Shares U.S. Quality Dividend ETF
| Schedule of Investments | November 30, 2023 |
| Security Description | | Shares | | | Value | |
| Hotels, Restaurants & Leisure (3.41%) | | | | | | |
| McDonald's Corp. | | | 47,497 | | | $ | 13,386,554 | |
| Starbucks Corp. | | | 69,347 | | | | 6,886,157 | |
| Yum! Brands, Inc. | | | 16,738 | | | | 2,101,456 | |
| Total Hotels, Restaurants & Leisure | | | | | | | 22,374,167 | |
| | | | | | | | | |
| Household Durables (0.17%) | | | | | | | | |
| Garmin, Ltd. | | | 8,977 | | | | 1,097,348 | |
| | | | | | | | | |
| Household Products (2.18%) | | | | | | | | |
| Colgate-Palmolive Co. | | | 23,386 | | | | 1,842,115 | |
| Kimberly-Clark Corp. | | | 9,329 | | | | 1,154,277 | |
| Procter & Gamble Co. | | | 73,521 | | | | 11,286,944 | |
| Total Household Products | | | | | | | 14,283,336 | |
| | | | | | | | | |
| Industrial Conglomerates (0.96%) | | | | | | | | |
| Honeywell International, Inc. | | | 32,234 | | | | 6,315,285 | |
| | | | | | | | | |
| Insurance (2.22%) | | | | | | | | |
| Aon PLC, Class A | | | 10,946 | | | | 3,595,652 | |
| Chubb, Ltd. | | | 21,952 | | | | 5,036,447 | |
| Marsh & McLennan Cos., Inc. | | | 29,723 | | | | 5,927,361 | |
| Total Insurance | | | | | | | 14,559,460 | |
| | | | | | | | | |
| IT Services (2.08%) | | | | | | | | |
| Accenture PLC, Class A | | | 34,578 | | | | 11,519,315 | |
| Amdocs, Ltd. | | | 5,306 | | | | 444,484 | |
| Cognizant Technology Solutions Corp., Class A | | | 24,240 | | | | 1,706,011 | |
| Total IT Services | | | | | | | 13,669,810 | |
| | | | | | | | | |
| Life Sciences Tools & Services (0.97%) | | | | | | | | |
| Agilent Technologies, Inc. | | | 9,320 | | | | 1,191,096 | |
| Danaher Corp. | | | 23,055 | | | | 5,148,412 | |
| Total Life Sciences Tools & Services | | | | | | | 6,339,508 | |
| | | | | | | | | |
| Machinery (3.14%) | | | | | | | | |
| Caterpillar, Inc. | | | 23,356 | | | | 5,855,817 | |
| Cummins, Inc. | | | 6,106 | | | | 1,368,721 | |
| Deere & Co. | | | 11,680 | | | | 4,256,309 | |
| Graco, Inc. | | | 7,158 | | | | 578,223 | |
| IDEX Corp. | | | 3,170 | | | | 639,326 | |
| Illinois Tool Works, Inc. | | | 14,580 | | | | 3,531,422 | |
| Otis Worldwide Corp. | | | 18,871 | | | | 1,618,943 | |
| PACCAR, Inc. | | | 22,976 | | | | 2,109,656 | |
| Snap-on, Inc. | | | 2,286 | | | | 627,941 | |
| Total Machinery | | | | | | | 20,586,358 | |
| | | | | | | | | |
| Media (4.34%) | | | | | | | | |
| Comcast Corp., Class A | | | 680,638 | | | | 28,511,926 | |
| | | | | | | | | |
| Multi-Utilities (0.41%) | | | | | | | | |
| Public Service Enterprise Group, Inc. | | | 43,466 | | | | 2,713,582 | |
| | | | | | | | | |
| Pharmaceuticals (8.62%) | | | | | | | | |
| Bristol-Myers Squibb Co. | | | 79,661 | | | | 3,933,660 | |
| Security Description | | Shares | | | Value | |
| Pharmaceuticals (continued) | | | | | | |
| Eli Lilly & Co. | | | 32,168 | | | $ | 19,012,576 | |
| Johnson & Johnson | | | 92,730 | | | | 14,341,622 | |
| Merck & Co., Inc. | | | 92,990 | | | | 9,529,615 | |
| Pfizer, Inc. | | | 221,711 | | | | 6,755,534 | |
| Zoetis, Inc. | | | 16,424 | | | | 2,901,628 | |
| Total Pharmaceuticals | | | | | | | 56,474,635 | |
| | | | | | | | | |
| Professional Services (0.98%) | | | | | | | | |
| Automatic Data Processing, Inc. | | | 19,871 | | | | 4,568,740 | |
| Paychex, Inc. | | | 15,177 | | | | 1,851,139 | |
| Total Professional Services | | | | | | | 6,419,879 | |
| | | | | | | | | |
| Semiconductors & Semiconductor Equipment (5.72%) | | | | | | | | |
| Analog Devices, Inc. | | | 23,574 | | | | 4,323,000 | |
| Broadcom, Inc. | | | 20,760 | | | | 19,218,154 | |
| QUALCOMM, Inc. | | | 51,334 | | | | 6,624,653 | |
| Texas Instruments, Inc. | | | 47,766 | | | | 7,294,346 | |
| Total Semiconductors & Semiconductor Equipment | | | | | | | 37,460,153 | |
| | | | | | | | | |
| Software (7.00%) | | | | | | | | |
| Microsoft Corp. | | | 97,460 | | | | 36,928,568 | |
| Oracle Corp. | | | 77,196 | | | | 8,970,947 | |
| Total Software | | | | | | | 45,899,515 | |
| | | | | | | | | |
| Specialty Retail (5.39%) | | | | | | | | |
| Home Depot, Inc. | | | 66,526 | | | | 20,855,237 | |
| Lowe's Cos., Inc. | | | 35,997 | | | | 7,157,284 | |
| TJX Cos., Inc. | | | 70,113 | | | | 6,177,656 | |
| Tractor Supply Co. | | | 6,129 | | | | 1,244,248 | |
| Total Specialty Retail | | | | | | | 35,434,425 | |
| | | | | | | | | |
| Technology Hardware, Storage & Peripherals (5.24%) | | | | | | | | |
| Apple, Inc. | | | 181,058 | | | | 34,391,967 | |
| | | | | | | | | |
| Textiles, Apparel & Luxury Goods (1.16%) | | | | | | | | |
| NIKE, Inc., Class B | | | 68,754 | | | | 7,581,504 | |
| | | | | | | | | |
| Tobacco (0.99%) | | | | | | | | |
| Altria Group, Inc. | | | 52,827 | | | | 2,220,847 | |
| Philip Morris International, Inc. | | | 46,093 | | | | 4,303,243 | |
| Total Tobacco | | | | | | | 6,524,090 | |
| | | | | | | | | |
| Trading Companies & Distributors (0.56%) | | | | | | | | |
| Fastenal Co. | | | 26,873 | | | | 1,611,574 | |
| Watsco, Inc. | | | 1,418 | | | | 542,002 | |
| WW Grainger, Inc. | | | 1,972 | | | | 1,550,367 | |
| Total Trading Companies & Distributors | | | | | | | 3,703,943 | |
| | | | | | | | | |
| TOTAL COMMON STOCKS | | | | | | | | |
| (Cost $571,460,008) | | | | | | | 655,187,764 | |
ALPS | O’Shares U.S. Quality Dividend ETF
| Schedule of Investments | November 30, 2023 |
| | | 7 Day Yield | | | Shares | | | Value | |
| SHORT TERM INVESTMENTS (0.02%) | | | | | | | | | |
| State Street Institutional Treasury Plus Money Market Fund (Premier Class) | | | 5.31 | % | | | 161,717 | | | $ | 161,717 | |
| | | | | | | | | | | | | |
| TOTAL SHORT TERM INVESTMENTS | | | | | | | | | | | | |
| | | | | | | | | | | | | |
| (Cost $161,717) | | | | | | | | | | | 161,717 | |
| | | | | | | | | | | | | |
| TOTAL INVESTMENTS (99.87%) | | | | | | | | | | | | |
| (Cost $571,621,725) | | | | | | | | | | $ | 655,349,481 | |
| OTHER ASSETS IN EXCESS OF LIABILITIES (0.13%) | | | | | | | | | | | 863,613 | |
| NET ASSETS - 100.00% | | | | | | | | | | $ | 656,213,094 | |
See Notes to Financial Statements.
ALPS | O’Shares U.S. Small-Cap Quality Dividend ETF
| Schedule of Investments | November 30, 2023 |
| Security Description | | Shares | | | Value | |
| COMMON STOCKS (99.76%) | | | | | | |
| Automobile Components (3.22%) | | | | | | |
| BorgWarner, Inc. | | | 194,399 | | | $ | 6,549,303 | |
| Gentex Corp. | | | 200,006 | | | | 6,082,182 | |
| Total Automobile Components | | | | | | | 12,631,485 | |
| | | | | | | | | |
| Building Products (6.90%) | | | | | | | | |
| A O Smith Corp. | | | 92,127 | | | | 6,942,691 | |
| AAON, Inc. | | | 46,899 | | | | 2,935,877 | |
| Owens Corning | | | 53,995 | | | | 7,320,642 | |
| Simpson Manufacturing Co., Inc. | | | 30,608 | | | | 5,110,618 | |
| UFP Industries, Inc. | | | 43,247 | | | | 4,741,169 | |
| Total Building Products | | | | | | | 27,050,997 | |
| | | | | | | | | |
| Capital Markets (11.12%) | | | | | | | | |
| Artisan Partners Asset Management, Inc., Class A | | | 63,495 | | | | 2,390,587 | |
| Cohen & Steers, Inc. | | | 24,240 | | | | 1,417,798 | |
| Diamond Hill Investment Group, Inc. | | | 2,644 | | | | 424,600 | |
| Evercore, Inc., Class A | | | 33,615 | | | | 4,959,893 | |
| Federated Hermes, Inc. | | | 78,690 | | | | 2,503,916 | |
| Hamilton Lane, Inc., Class A | | | 31,644 | | | | 3,096,365 | |
| Houlihan Lokey, Inc. | | | 51,370 | | | | 5,533,576 | |
| MarketAxess Holdings, Inc. | | | 34,009 | | | | 8,166,241 | |
| SEI Investments Co. | | | 108,790 | | | | 6,382,709 | |
| Tradeweb Markets, Inc. | | | 90,347 | | | | 8,754,625 | |
| Total Capital Markets | | | | | | | 43,630,310 | |
| | | | | | | | | |
| Commercial Services & Supplies (0.56%) | | | | | | |
| Brady Corp., Class A | | | 32,578 | | | | 1,833,164 | |
| Ennis, Inc. | | | 17,764 | | | | 377,130 | |
| Total Commercial Services & Supplies | | | | | | | 2,210,294 | |
| | | | | | | | | |
| Communications Equipment (1.96%) | | | | | | | | |
| Juniper Networks, Inc. | | | 269,633 | | | | 7,671,059 | |
| | | | | | | | | |
| Consumer Finance (1.04%) | | | | | | | | |
| FirstCash Holdings, Inc. | | | 36,215 | | | | 4,056,080 | |
| | | | | | | | | |
| Consumer Staples Distribution & Retail (1.67%) | | | | | | | | |
| Casey's General Stores, Inc. | | | 21,762 | | | | 5,993,255 | |
| Weis Markets, Inc. | | | 9,045 | | | | 545,866 | |
| | | | | | | | | |
| Total Consumer Staples Distribution & Retail | | | | | | | 6,539,121 | |
| | | | | | | | | |
| Diversified Consumer Services (1.43%) | | | | | | | | |
| H&R Block, Inc. | | | 123,436 | | | | 5,606,463 | |
| | | | | | | | | |
| Diversified Telecommunication Services (0.75%) | | | | | | | | |
| Cogent Communications Holdings, Inc. | | | 46,022 | | | | 2,938,965 | |
| Security Description | | Shares | | | Value | |
| Electric Utilities (1.49%) | | | | | | | | |
| ALLETE, Inc. | | | 9,896 | | | $ | 549,030 | |
| IDACORP, Inc. | | | 8,797 | | | | 848,911 | |
| MGE Energy, Inc. | | | 6,186 | | | | 456,218 | |
| OGE Energy Corp. | | | 35,169 | | | | 1,232,673 | |
| Otter Tail Corp.(a) | | | 7,088 | | | | 540,885 | |
| Pinnacle West Capital Corp. | | | 19,880 | | | | 1,489,806 | |
| Portland General Electric Co. | | | 17,478 | | | | 717,647 | |
| Total Electric Utilities | | | | | | | 5,835,170 | |
| | | | | | | | | |
| Electronic Equipment, Instruments & Components (5.02%) | | | | | | |
| Avnet, Inc. | | | 107,729 | | | | 5,037,408 | |
| Badger Meter, Inc. | | | 32,553 | | | | 4,797,336 | |
| Littelfuse, Inc. | | | 28,460 | | | | 6,625,487 | |
| Vishay Intertechnology, Inc. | | | 144,925 | | | | 3,221,683 | |
| Total Electronic Equipment, Instruments & Components | | | | | | | 19,681,914 | |
| | | | | | | | | |
| Financial Services (4.58%) | | | | | | | | |
| Essent Group, Ltd. | | | 99,989 | | | | 4,833,468 | |
| MGIC Investment Corp. | | | 273,337 | | | | 4,807,998 | |
| Radian Group, Inc. | | | 153,615 | | | | 3,949,442 | |
| Western Union Co. | | | 375,318 | | | | 4,364,948 | |
| Total Financial Services | | | | | | | 17,955,856 | |
| | | | | | | | | |
| Food Products (2.74%) | | | | | | | | |
| Cal-Maine Foods, Inc. | | | 24,210 | | | | 1,160,143 | |
| Flowers Foods, Inc. | | | 115,659 | | | | 2,406,864 | |
| Ingredion, Inc. | | | 37,920 | | | | 3,886,420 | |
| J & J Snack Foods Corp. | | | 8,510 | | | | 1,400,321 | |
| Lancaster Colony Corp. | | | 11,259 | | | | 1,867,868 | |
| Total Food Products | | | | | | | 10,721,616 | |
| | | | | | | | | |
| Gas Utilities (0.79%) | | | | | | | | |
| Chesapeake Utilities Corp. | | | 2,903 | | | | 277,527 | |
| National Fuel Gas Co. | | | 15,571 | | | | 790,852 | |
| New Jersey Resources Corp. | | | 16,906 | | | | 713,433 | |
| Northwest Natural Holding Co. | | | 6,004 | | | | 219,866 | |
| ONE Gas, Inc. | | | 9,492 | | | | 547,024 | |
| Spire, Inc. | | | 8,811 | | | | 537,559 | |
| Total Gas Utilities | | | | | | | 3,086,261 | |
| | | | | | | | | |
| Ground Transportation (1.40%) | | | | | | | | |
| Landstar System, Inc. | | | 26,573 | | | | 4,587,828 | |
| Schneider National, Inc., Class B | | | 39,829 | | | | 917,262 | |
| Total Ground Transportation | | | | | | | 5,505,090 | |
| | | | | | | | | |
| Health Care Equipment & Supplies (2.15%) | | | | | | | | |
| Teleflex, Inc. | | | 37,407 | | | | 8,442,386 | |
| | | | | | | | | |
| Health Care Providers & Services (6.96%) | | | | | | | | |
| Chemed Corp. | | | 15,426 | | | | 8,746,541 | |
| Encompass Health Corp. | | | 110,541 | | | | 7,203,957 | |
| Patterson Cos., Inc. | | | 205,472 | | | | 5,221,044 | |
ALPS | O’Shares U.S. Small-Cap Quality Dividend ETF
| Schedule of Investments | November 30, 2023 |
| Security Description | | Shares | | | Value | |
| Health Care Providers & Services (continued) | | | | | | |
| Premier, Inc., Class A | | | 295,463 | | | $ | 6,083,583 | |
| Total Health Care Providers & Services | | | | | | | 27,255,125 | |
| | | | | | | | | |
| Hotels, Restaurants & Leisure (3.63%) | | | | | | | | |
| Choice Hotels International, Inc. | | | 24,787 | | | | 2,733,510 | |
| Texas Roadhouse, Inc. | | | 56,063 | | | | 6,310,451 | |
| Wyndham Hotels & Resorts, Inc. | | | 66,928 | | | | 5,176,212 | |
| Total Hotels, Restaurants & Leisure | | | | | | | 14,220,173 | |
| Household Durables (0.85%) | | | | | | |
| La-Z-Boy, Inc. | | | 33,863 | | | | 1,191,639 | |
| MDC Holdings, Inc. | | | 48,202 | | | | 2,133,420 | |
| Total Household Durables | | | | | | | 3,325,059 | |
| Household Products (0.68%) | | | | | | |
| Reynolds Consumer Products, Inc. | | | 30,909 | | | | 811,052 | |
| WD-40 Co. | | | 7,696 | | | | 1,861,509 | |
| Total Household Products | | | | | | | 2,672,561 | |
| | | | | | | | | |
| Independent Power and Renewable | | | | | | | | |
| Electricity Producers (0.56%) | | | | | | | | |
| Vistra Corp. | | | 62,300 | | | | 2,206,043 | |
| | | | | | | | | |
| Insurance (5.67%) | | | | | | | | |
| AMERISAFE, Inc. | | | 17,889 | | | | 861,534 | |
| Employers Holdings, Inc. | | | 24,176 | | | | 926,183 | |
| Old Republic International | | | | | | | | |
| Corp. | | | 264,350 | | | | 7,748,099 | |
| Primerica, Inc. | | | 34,630 | | | | 7,255,331 | |
| RLI Corp. | | | 40,017 | | | | 5,426,305 | |
| Total Insurance | | | | | | | 22,217,452 | |
| | | | | | | | | |
| Leisure Products (2.52%) | | | | | | | | |
| Acushnet Holdings Corp. | | | 23,855 | | | | 1,347,808 | |
| Brunswick Corp. | | | 54,486 | | | | 4,297,310 | |
| Polaris, Inc. | | | 43,992 | | | | 3,628,020 | |
| Sturm Ruger & Co., Inc. | | | 14,033 | | | | 616,891 | |
| Total Leisure Products | | | | | | | 9,890,029 | |
| | | | | | | | | |
| Machinery (8.73%) | | | | | | | | |
| Donaldson Co., Inc. | | | 90,593 | | | | 5,511,678 | |
| ITT, Inc. | | | 60,875 | | | | 6,590,936 | |
| Lincoln Electric Holdings, Inc. | | | 42,312 | | | | 8,380,314 | |
| Mueller Industries, Inc. | | | 81,596 | | | | 3,388,682 | |
| Toro Co. | | | 78,101 | | | | 6,482,383 | |
| Watts Water Technologies, | | | | | | | | |
| Inc., Class A | | | 19,845 | | | | 3,820,361 | |
| Total Machinery | | | | | | | 34,174,354 | |
| | | | | | | | | |
| Media (2.77%) | | | | | | | | |
| New York Times Co., Class A | | | 163,862 | | | | 7,699,875 | |
| Security Description | | Shares | | | Value | |
| Media (continued) | | | | | | |
| TEGNA, Inc. | | | 206,214 | | | $ | 3,161,261 | |
| Total Media | | | | | | | 10,861,136 | |
| | | | | | | | | |
| Multi-Utilities (0.87%) | | | | | | | | |
| Avista Corp. | | | 12,850 | | | | 436,258 | |
| Black Hills Corp. | | | 11,474 | | | | 591,944 | |
| NiSource, Inc. | | | 72,896 | | | | 1,869,052 | |
| Northwestern Energy Group, Inc. | | | 10,254 | | | | 515,879 | |
| Total Multi-Utilities | | | | | | | 3,413,133 | |
| | | | | | | | | |
| Pharmaceuticals (1.15%) | | | | | | |
| Organon & Co. | | | 396,896 | | | | 4,492,863 | |
| | | | | | | | | |
| Professional Services (2.61%) | | | | | | | | |
| Exponent, Inc. | | | 37,068 | | | | 2,852,753 | |
| Kforce, Inc. | | | 13,341 | | | | 929,868 | |
| Robert Half, Inc. | | | 78,420 | | | | 6,428,872 | |
| Total Professional Services | | | | | | | 10,211,493 | |
| | | | | | | | | |
| Semiconductors & Semiconductor | | | | | | | | |
| Equipment (1.24%) | | | | | | | | |
| Power Integrations, Inc. | | | 63,400 | | | | 4,844,394 | |
| | | | | | | | | |
| Software (2.26%) | | | | | | | | |
| Dolby Laboratories, Inc., Class A | | | 69,764 | | | | 6,008,773 | |
| InterDigital, Inc. | | | 28,627 | | | | 2,860,410 | |
| Total Software | | | | | | | 8,869,183 | |
| | | | | | | | | |
| Specialty Retail (5.56%) | | | | | | | | |
| Dick's Sporting Goods, Inc. | | | 47,186 | | | | 6,138,899 | |
| Murphy USA, Inc. | | | 15,837 | | | | 5,852,563 | |
| Williams-Sonoma, Inc. | | | 52,181 | | | | 9,786,025 | |
| Total Specialty Retail | | | | | | | 21,777,487 | |
| | | | | | | | | |
| Textiles, Apparel & Luxury Goods (4.16%) | | | | | | | | |
| Carter's, Inc. | | | 30,178 | | | | 2,057,838 | |
| Columbia Sportswear Co. | | | 28,781 | | | | 2,254,416 | |
| Ralph Lauren Corp. | | | 31,814 | | | | 4,116,095 | |
| Steven Madden, Ltd. | | | 57,722 | | | | 2,188,818 | |
| Tapestry, Inc. | | | 179,447 | | | | 5,683,087 | |
| Total Textiles, Apparel & Luxury Goods | | | | | | | 16,300,254 | |
| | | | | | | | | |
| Tobacco (0.19%) | | | | | | | | |
| Universal Corp. | | | 13,301 | | | | 748,314 | |
| | | | | | | | | |
| Trading Companies & Distributors (1.98%) | | | | | | |
| Applied Industrial | | | | | | |
| Technologies, Inc. | | | 27,484 | | | | 4,399,364 | |
| MSC Industrial Direct Co., Inc., Class A | | | 34,400 | | | | 3,351,248 | |
| Total Trading Companies & Distributors | | | | | | | 7,750,612 | |
| | | | | | | | | |
| Water Utilities (0.55%) | | | | | | | | |
| American States Water Co. | | | 6,329 | | | | 505,687 | |
ALPS | O’Shares U.S. Small-Cap Quality Dividend ETF
| Schedule of Investments | November 30, 2023 |
| Security Description | | Shares | | | Value | |
| Water Utilities (continued) | | | | | | |
| Essential Utilities, Inc. | | | 46,440 | | | $ | 1,653,729 | |
| Total Water Utilities | | | | | | | 2,159,416 | |
| | | | | | | | | |
| TOTAL COMMON STOCKS | | | | | | | | |
| (Cost $373,723,148) | | | | | | | 390,952,148 | |
| | | 7 Day Yield | | | Shares | | | Value | |
| SHORT TERM INVESTMENTS (0.15%) | | | | | | | | | |
| Money Market Fund (0.03%) | | | | | | | | | |
| State Street Institutional Treasury Plus Money Market Fund (Premier Class) | | | | | | | | | |
| (Cost $123,983) | | | 5.31% | | | | 123,983 | | | $ | 123,983 | |
| | | | | | | | | | | | | |
| Investments Purchased with Collateral from Securities Loaned (0.12%) | | | | | | | | | | | | |
| State Street Navigator Securities Lending Government Money Market Portfolio, 5.37% | | | | | | | | | | | | |
| (Cost $459,406) | | | | | | | 459,406 | | | | 459,406 | |
| TOTAL SHORT TERM INVESTMENTS | | | | | | | | | | | | |
| | | | | | | | | | | | | |
| (Cost $583,389) | | | | | | | | | | | 583,389 | |
| | | | | | | | | | | | | |
| TOTAL INVESTMENTS (99.91%) | | | | | | | | | | | | |
| | | | | | | | | | | | | |
| (Cost $374,306,537) | | | | | | | | | | $ | 391,535,537 | |
| OTHER ASSETS IN EXCESS OF LIABILITIES (0.09%) | | | | | | | | | | | 344,220 | |
| NET ASSETS - 100.00% | | | | | | | | | | $ | 391,879,757 | |
| (a) | Security, or a portion of the security position is currently on loan. The total market value of securities on loan is $459,768. |
See Notes to Financial Statements.
ALPS | O’Shares Global Internet Giants ETF
| Schedule of Investments | November 30, 2023 |
| Security Description | | Shares | | | Value | |
| COMMON STOCKS (99.96%) | | | | | | |
| Broadline Retail (13.32%) | | | | | | |
| Alibaba Group Holding, Ltd., | | | | | | |
| Sponsored ADR | | | 17,043 | | | $ | 1,276,180 | |
| Allegro.eu SA(a)(b)(c) | | | 166,059 | | | | 1,201,167 | |
| Amazon.com, Inc.(a) | | | 56,300 | | | | 8,224,866 | |
| JD.com, Inc., ADR | | | 15,700 | | | | 430,651 | |
| MercadoLibre, Inc.(a) | | | 1,421 | | | | 2,302,674 | |
| PDD Holdings, Inc., ADR(a) | | | 32,049 | | | | 4,725,305 | |
| Total Broadline Retail | | | | | | | 18,160,843 | |
| | | | | | | | | |
| Diversified Consumer Services (1.61%) | | | | | | | | |
| Duolingo, Inc.(a) | | | 10,330 | | | | 2,192,956 | |
| | | | | | | | | |
| Entertainment (7.06%) | | | | | | | | |
| Live Nation Entertainment, Inc.(a) | | | 5,884 | | | | 495,550 | |
| NetEase, Inc., ADR | | | 9,187 | | | | 1,042,541 | |
| Netflix, Inc.(a) | | | 3,726 | | | | 1,766,012 | |
| Nexon Co., Ltd. | | | 46,800 | | | | 1,009,486 | |
| ROBLOX Corp., Class A(a) | | | 26,859 | | | | 1,055,827 | |
| Roku, Inc.(a) | | | 10,925 | | | | 1,138,385 | |
| Spotify Technology SA(a) | | | 7,029 | | | | 1,301,138 | |
| Take-Two Interactive Software, | | | | | | | | |
| Inc.(a) | | | 11,496 | | | | 1,818,668 | |
| Total Entertainment | | | | | | | 9,627,607 | |
| | | | | | | |
| Ground Transportation (2.61%) | | | | | | |
| Full Truck Alliance Co., Ltd., | | | | | | |
| ADR(a) | | | 200,479 | | | | 1,501,588 | |
| Uber Technologies, Inc.(a) | | | 36,662 | | | | 2,067,003 | |
| Total Ground Transportation | | | | | | | 3,568,591 | |
| | | | | | | | | |
| Hotels, Restaurants & Leisure (6.55%) | | | | | | | | |
| Airbnb, Inc., Class A(a) | | | 9,293 | | | | 1,174,078 | |
| Amadeus IT Group SA | | | 12,842 | | | | 878,126 | |
| Booking Holdings, Inc.(a) | | | 411 | | | | 1,284,663 | |
| Delivery Hero SE(a)(b)(c) | | | 33,507 | | | | 1,061,523 | |
| DoorDash, Inc., Class A(a) | | | 15,980 | | | | 1,501,800 | |
| Meituan, Class B(a)(b)(c) | | | 105,317 | | | | 1,221,528 | |
| Trip.com Group, Ltd., ADR(a) | | | 51,465 | | | | 1,810,538 | |
| Total Hotels, Restaurants & Leisure | | | | | | | 8,932,256 | |
| | | | | | | | | |
| Interactive Media & Services (13.51%) | | | | | | | | |
| Adevinta ASA(a) | | | 140,865 | | | | 1,455,525 | |
| Alphabet, Inc., Class A(a) | | | 45,667 | | | | 6,052,248 | |
| Baidu, Inc., Sponsored ADR(a) | | | 5,256 | | | | 623,677 | |
| Kuaishou Technology(a)(b)(c) | | | 73,300 | | | | 541,448 | |
| LY Corp. | | | 176,000 | | | | 511,167 | |
| Match Group, Inc.(a) | | | 14,322 | | | | 463,746 | |
| Meta Platforms, Inc., Class A(a) | | | 18,200 | | | | 5,954,130 | |
| Pinterest, Inc., Class A(a) | | | 32,661 | | | | 1,112,760 | |
| Snap, Inc., Class A(a) | | | 65,913 | | | | 911,577 | |
| Tencent Holdings, Ltd. | | | 18,717 | | | | 783,539 | |
| Total Interactive Media & Services | | | | | | | 18,409,817 | |
| Security Description | | Shares | | | Value | |
| IT Services (7.48%) | | | | | | |
| Cloudflare, Inc., Class A(a) | | | 28,181 | | | $ | 2,174,164 | |
| MongoDB, Inc.(a) | | | 4,647 | | | | 1,931,944 | |
| Obic Co., Ltd. | | | 3,950 | | | | 604,649 | |
| Okta, Inc.(a) | | | 11,986 | | | | 803,661 | |
| Shopify, Inc., Class A(a) | | | 29,987 | | | | 2,183,653 | |
| Snowflake, Inc., Class A(a) | | | 13,288 | | | | 2,493,892 | |
| Total IT Services | | | | | | | 10,191,963 | |
| Media (1.13%) | | | | | | | | |
| Trade Desk, Inc., Class A(a) | | | 21,886 | | | | 1,542,088 | |
| | | | | | | | |
| Professional Services (2.51%) | | | | | | | | |
| Ceridian HCM Holding, Inc.(a) | | | 14,807 | | | | 1,020,202 | |
| Paychex, Inc. | | | 3,686 | | | | 449,581 | |
| Paycom Software, Inc. | | | 5,039 | | | | 915,385 | |
| Paylocity Holding Corp.(a) | | | 6,577 | | | | 1,030,419 | |
| Total Professional Services | | | | | | | 3,415,587 | |
| | | | | | | | |
| Real Estate Management & Development (0.83%) | | | | | | | | |
| CoStar Group, Inc.(a) | | | 13,652 | | | | 1,133,662 | |
| | | | | | | | |
| Software (43.35%) | | | | | | | | |
| Adobe, Inc.(a) | | | 3,867 | | | | 2,362,776 | |
| AppLovin Corp., Class A(a) | | | 21,552 | | | | 807,769 | |
| Atlassian Corp., Class A(a) | | | 9,155 | | | | 1,748,147 | |
| BILL Holdings, Inc.(a) | | | 13,052 | | | | 854,514 | |
| Confluent, Inc., Class A(a) | | | 49,799 | | | | 1,056,735 | |
| Crowdstrike Holdings, Inc., Class A(a) | | | 11,789 | | | | 2,793,875 | |
| CyberArk Software, Ltd.(a) | | | 8,843 | | | | 1,762,145 | |
| Datadog, Inc., Class A(a) | | | 16,928 | | | | 1,973,297 | |
| | | | | | | | |
| DoubleVerify Holdings, Inc.(a) | | | 45,903 | | | | 1,523,980 | |
| Dynatrace, Inc.(a) | | | 27,947 | | | | 1,496,562 | |
| Fortinet, Inc.(a) | | | 22,818 | | | | 1,199,314 | |
| Gitlab, Inc., Class A(a) | | | 31,097 | | | | 1,503,229 | |
| HubSpot, Inc.(a) | | | 2,942 | | | | 1,453,142 | |
| Intuit, Inc. | | | 3,094 | | | | 1,768,097 | |
| Microsoft Corp. | | | 24,207 | | | | 9,172,273 | |
| Monday.com, Ltd.(a) | | | 9,226 | | | | 1,659,204 | |
| Nice, Ltd., ADR(a)(d) | | | 4,047 | | | | 767,918 | |
| Open Text Corp. | | | 27,522 | | | | 1,101,123 | |
| Oracle Corp. | | | 14,142 | | | | 1,643,442 | |
Palantir Technologies, Inc.,
Class A(a) | | | 95,445 | | | | 1,913,672 | |
| Palo Alto Networks, Inc.(a) | | | 7,437 | | | | 2,194,584 | |
| Salesforce, Inc.(a) | | | 6,904 | | | | 1,739,118 | |
| SAP SE | | | 5,226 | | | | 827,559 | |
| SentinelOne, Inc., Class A(a) | | | 94,104 | | | | 1,796,445 | |
| ServiceNow, Inc.(a) | | | 4,355 | | | | 2,986,398 | |
| Smartsheet, Inc., Class A(a) | | | 36,776 | | | | 1,558,567 | |
| Splunk, Inc.(a) | | | 5,153 | | | | 780,886 | |
| Tyler Technologies, Inc.(a) | | | 1,296 | | | | 529,857 | |
| UiPath, Inc., Class A(a) | | | 78,004 | | | | 1,541,359 | |
| Unity Software, Inc.(a)(d) | | | 43,726 | | | | 1,290,354 | |
| Workday, Inc., Class A(a) | | | 6,105 | | | | 1,652,746 | |
| Xero, Ltd.(a) | | | 20,561 | | | | 1,400,006 | |
ALPS | O’Shares Global Internet Giants ETF
| Schedule of Investments | November 30, 2023 |
| Security Description | | Shares | | | Value | |
| Software (continued) | | | | | | |
| Zscaler, Inc.(a) | | | 11,243 | | | $ | 2,220,830 | |
| Total Software | | | | | | | 59,079,923 | |
| | | | | | | | | |
| TOTAL COMMON STOCKS | | | | | | | | |
| (Cost $136,734,398) | | | | | | | 136,255,293 | |
| | | 7 Day Yield | | | Shares | | | Value | |
| SHORT TERM INVESTMENTS (1.47%) | | | | | | | | | |
| Money Market Fund (0.05%) | | | | | | | | | |
| State Street Institutional Treasury Plus Money Market Fund (Premier Class) | | | | | | | | | |
| (Cost $70,408) | | | 5.31% | | | | 70,408 | | | $ | 70,408 | |
| | | | | | | | | | | | | |
| Investments Purchased with Collateral from Securities Loaned (1.42%) | | | | | | | | | | | | |
| State Street Navigator Securities Lending Government Money Market Portfolio, 5.37% | | | | | | | | | | | | |
| (Cost $1,940,148) | | | | | | | 1,940,148 | | | | 1,940,148 | |
| TOTAL SHORT TERM INVESTMENTS | | | | | | | | | | | | |
| | | | | | | | | | | | | |
| (Cost $2,010,556) | | | | | | | | | | | 2,010,556 | |
| | | | | | | | | | | | | |
| TOTAL INVESTMENTS (101.43%) | | | | | | | | | | | | |
| (Cost $138,744,954) | | | | | | | | | | $ | 138,265,849 | |
| LIABILITIES IN EXCESS OF OTHER ASSETS (-1.43%) | | | | | | | | | | | (1,955,560 | ) |
| NET ASSETS - 100.00% | | | | | | | | | | $ | 136,310,289 | |
| (a) | Non-income producing security. |
| (b) | Securities exempt from registration under Rule 144A of the Securities Act of 1933. These securities may be sold in the ordinary course of business in transactions exempt from registration, normally to qualified institutional buyers. At period end, the aggregate market value of those securities was $4,025,666, representing 2.95% of net assets. |
| (c) | Securities were purchased pursuant to Regulation S under the Securities Act of 1933, which exempts securities offered and sold outside of the United States from registration. Such securities cannot be sold in the United States without either an effective registration statement filed pursuant to the Securities Act of 1933, or pursuant to an exemption from registration. As of November 30, 2023, the market value of those securities was $4,025,666, representing 2.95% of net assets. |
| (d) | Security, or a portion of the security position is currently on loan. The total market value of securities on loan is $1,852,377. |
See Notes to Financial Statements.
ALPS | O’Shares Europe Quality Dividend ETF
| Schedule of Investments | November 30, 2023 |
| Security Description | | Shares | | | Value | |
| COMMON STOCKS (99.02%) | | | | | | |
| Aerospace & Defense (1.39%) | | | | | | |
| BAE Systems PLC | | | 38,150 | | | $ | 505,706 | |
| | | | | | | | | |
| Air Freight & Logistics (1.59%) | | | | | | | | |
| Deutsche Post AG | | | 12,331 | | | | 577,693 | |
| | | | | | | | | |
| Automobile Components (0.79%) | | | | | | | | |
| Cie Generale des Etablissements Michelin SCA | | | 8,579 | | | | 287,710 | |
| | | | | | | | | |
| Automobiles (3.75%) | | | | | | | | |
| Bayerische Motoren Werke AG | | | 3,562 | | | | 370,623 | |
| Stellantis NV(a) | | | 45,911 | | | | 994,580 | |
| Total Automobiles | | | | | | | 1,365,203 | |
| | | | | | | | | |
| Banks (2.42%) | | | | | | | | |
| HSBC Holdings PLC | | | 116,400 | | | | 882,168 | |
| | | | | | | | | |
| Beverages (2.69%) | | | | | | | | |
| Carlsberg AS | | | 690 | | | | 85,436 | |
| Diageo PLC | | | 18,079 | | | | 630,737 | |
| Pernod Ricard SA | | | 1,545 | | | | 266,637 | |
| Total Beverages | | | | | | | 982,810 | |
| | | | | | | | | |
| Building Products (0.60%) | | | | | | |
| Geberit AG | | | 393 | | | | 219,635 | |
| | | | | | | | | |
| Capital Markets (1.86%) | | | | | | | | |
| 3i Group PLC | | | 12,332 | | | | 347,490 | |
| Partners Group Holding AG | | | 252 | | | | 331,655 | |
| Total Capital Markets | | | | | | | 679,145 | |
| | | | | | | | | |
| Construction & Engineering (2.04%) | | | | | | | | |
| Vinci SA | | | 6,074 | | | | 742,473 | |
| | | | | | | | |
| Consumer Staples Distribution & Retail (0.59%) | | | | | | | | |
| Koninklijke Ahold Delhaize NV | | | 7,493 | | | | 216,626 | |
| | | | | | | | | |
| Diversified Telecommunication Services (3.29%) | | | | | | | | |
| Deutsche Telekom AG | | | 42,600 | | | | 1,018,978 | |
| Swisscom AG | | | 304 | | | | 177,186 | |
| Total Diversified Telecommunication | | | | | | | | |
| Services | | | | | | | 1,196,164 | |
| | | | | | | | | |
| Electric Utilities (2.74%) | | | | | | | | |
| Iberdrola SA | | | 80,685 | | | | 996,377 | |
| | | | | | | | | |
| Electrical Equipment (6.11%) | | | | | | | | |
| ABB, Ltd. | | | 20,067 | | | | 795,393 | |
| Legrand SA | | | 3,295 | | | | 317,126 | |
| Schneider Electric SE | | | 6,064 | | | | 1,112,999 | |
| Total Electrical Equipment | | | | | | | 2,225,518 | |
| Security Description | | Shares | | | Value | |
| Financial Services (2.06%) | | | | | | |
| Industrivarden AB, Class C | | | 3,680 | | | $ | 110,639 | |
| Investor AB | | | 30,903 | | | | 640,779 | |
| Total Financial Services | | | | | | | 751,418 | |
| | | | | | | | | |
| Food Products (4.58%) | | | | | | | | |
| Nestle SA | | | 14,690 | | | | 1,666,611 | |
| | | | | | | | | |
| Household Products (1.08%) | | | | | | | | |
| Reckitt Benckiser Group PLC | | | 5,745 | | | | 391,505 | |
| | | | | | | | | |
| Industrial Conglomerates (3.32%) | | | | | | | | |
| Siemens AG | | | 7,213 | | | | 1,209,102 | |
| | | | | | | | | |
| Insurance (5.34%) | | | | | | | | |
| Allianz SE | | | 4,387 | | | | 1,101,167 | |
| Zurich Insurance Group AG | | | 1,687 | | | | 843,596 | |
| Total Insurance | | | | | | | 1,944,763 | |
| | | | | | | | | |
| Machinery (4.63%) | | | | | | | | |
| Atlas Copco AB | | | 49,507 | | | | 763,067 | |
| Kone Oyj, Class B | | | 9,880 | | | | 438,669 | |
| Volvo AB | | | 21,006 | | | | 486,458 | |
| Total Machinery | | | | | | | 1,688,194 | |
| | | | | | | | | |
| Marine Transportation (0.49%) | | | | | | | | |
| Kuehne + Nagel International AG | | | 618 | | | | 178,689 | |
| | | | | | | | | |
| Multi-Utilities (1.72%) | | | | | | | | |
| National Grid PLC | | | 48,252 | | | | 625,910 | |
| | | | | | | | | |
| Personal Care Products (5.18%) | | | | | | | | |
| L'Oreal SA | | | 1,918 | | | | 899,917 | |
| Unilever PLC | | | 20,809 | | | | 990,260 | |
| Total Personal Care Products | | | | | | | 1,890,177 | |
| | | | | | | | | |
| Pharmaceuticals (16.77%) | | | | | | | | |
| GSK PLC | | | 36,301 | | | | 650,486 | |
| Novartis AG | | | 14,061 | | | | 1,366,760 | |
| Novo Nordisk A/S, Class B | | | 17,868 | | | | 1,814,546 | |
| Roche Holding AG | | | 4,899 | | | | 1,320,554 | |
| Sanofi SA | | | 10,237 | | | | 952,274 | |
| Total Pharmaceuticals | | | | | | | 6,104,620 | |
| | | | | | | | | |
| Professional Services (5.17%) | | | | | | | | |
| Experian PLC | | | 14,198 | | | | 520,342 | |
| RELX PLC | | | 24,551 | | | | 942,231 | |
| Wolters Kluwer NV | | | 3,035 | | | | 417,242 | |
| Total Professional Services | | | | | | | 1,879,815 | |
| | | | | | | | | |
| Semiconductors & Semiconductor Equipment (4.71%) | | | | | | | | |
| ASML Holding NV | | | 2,530 | | | | 1,715,674 | |
ALPS | O’Shares Europe Quality Dividend ETF
| Schedule of Investments | November 30, 2023 |
| Security Description | | Shares | | | Value | |
| Software (3.77%) | | | | | | |
| SAP SE | | | 8,668 | | | $ | 1,372,614 | |
| | | | | | | | | |
| Specialty Retail (1.62%) | | | | | | | | |
| Industria de Diseno Textil SA | | | 14,322 | | | | 589,748 | |
| | | | | | | | | |
| Textiles, Apparel & Luxury Goods (6.68%) | | | | | | | | |
| Hermes International SCA | | | 322 | | | | 667,413 | |
| Kering SA | | | 865 | | | | 370,687 | |
| LVMH Moet Hennessy Louis Vuitton SE | | | 1,822 | | | | 1,393,622 | |
| Total Textiles, Apparel & Luxury Goods | | | | | | | 2,431,722 | |
| | | | | | | | | |
| Tobacco (1.38%) | | | | | | | | |
| British American Tobacco PLC | | | 15,830 | | | | 502,013 | |
| | | | | | | | | |
| Wireless Telecommunication Services (0.66%) | | | | | | | | |
| Vodafone Group PLC | | | 265,536 | | | | 239,117 | |
| | | | | | | | | |
| TOTAL COMMON STOCKS | | | | | | | | |
| (Cost $34,134,423) | | | | | | | 36,058,920 | |
| | | 7 Day Yield | | | Shares | | | Value | |
| SHORT TERM INVESTMENTS (0.08%) | | | | | | | | | |
| State Street Institutional Treasury Plus Money Market Fund (Premier Class) | | | 5.31% | | | | 28,789 | | | | 28,789 | |
| | | | | | | | | | | | | |
| TOTAL SHORT TERM INVESTMENTS | | | | | | | | | | | | |
| | | | | | | | | | | | | |
| (Cost $28,789) | | | | | | | | | | | 28,789 | |
| | | | | | | | | | |
| TOTAL INVESTMENTS (99.10%) | | | | | | | | | |
| (Cost $34,163,212) | | | | | | | | | | $ | 36,087,709 | |
| OTHER ASSETS IN EXCESS OF LIABILITIES (0.90%) | | | | | | | | | | | 328,128 | |
| NET ASSETS - 100.00% | | | | | | | | | | $ | 36,415,837 | |
| (a) | Non-income producing security. |
See Notes to Financial Statements.
ALPS ETF Trust
| Statements of Assets and Liabilities | November 30, 2023 |
| | | ALPS | O'Shares
U.S. Quality Dividend ETF | | | ALPS | O'Shares
U.S. Small-Cap
Quality Dividend
ETF | | | ALPS | O'Shares
Global Internet
Giants ETF | | | ALPS | O'Shares
Europe Quality
Dividend ETF | |
| ASSETS: | | | | | | | | | | | | |
| Investments, at value(a) | | $ | 655,349,481 | | | $ | 391,535,537 | | | $ | 138,265,849 | | | $ | 36,087,709 | |
| Foreign Currency, at value (Cost $–, $–, $– and $5,631) | | | – | | | | – | | | | – | | | | 5,615 | |
| Dividends and foreign tax reclaims receivable | | | 1,117,291 | | | | 947,595 | | | | 35,998 | | | | 336,373 | |
| Receivable for shares sold | | | – | | | | 4,527,858 | | | | – | | | | – | |
| Total Assets | | | 656,466,772 | | | | 397,010,990 | | | | 138,301,847 | | | | 36,429,697 | |
| | | | | | | | | | | | | | | | | |
| LIABILITIES: | | | | | | | | | | | | | | | | |
| Payable to adviser | | | 253,678 | | | | 146,424 | | | | 51,410 | | | | 13,860 | |
| Payable for investments purchased | | | – | | | | 4,525,403 | | | | – | | | | – | |
| Payable for collateral upon return of securities loaned | | | – | | | | 459,406 | | | | 1,940,148 | | | | – | |
| Total Liabilities | | | 253,678 | | | | 5,131,233 | | | | 1,991,558 | | | | 13,860 | |
| NET ASSETS | | $ | 656,213,094 | | | $ | 391,879,757 | | | $ | 136,310,289 | | | $ | 36,415,837 | |
| | | | | | | | | | | | | | | | | |
| NET ASSETS CONSIST OF: | | | | | | | | | | | | | | | | |
| Paid-in capital | | $ | 630,764,285 | | | $ | 386,759,316 | | | $ | 327,715,799 | | | $ | 44,705,935 | |
| Total distributable earnings/(accumulated losses) | | | 25,448,809 | | | | 5,120,441 | | | | (191,405,510 | ) | | | (8,290,098 | ) |
| NET ASSETS | | $ | 656,213,094 | | | $ | 391,879,757 | | | $ | 136,310,289 | | | $ | 36,415,837 | |
INVESTMENTS, AT COST | | $ | 571,621,725 | | | $ | 374,306,537 | | | $ | 138,744,954 | | | $ | 34,163,212 | |
| | | | | | | | | | | | | | | | | |
| PRICING OF SHARES | | | | | | | | | | | | | | | | |
| Net Assets | | $ | 656,213,094 | | | $ | 391,879,757 | | | $ | 136,310,289 | | | $ | 36,415,837 | |
| Shares of beneficial interest outstanding (Unlimited number of | | | | | | | | | | | | | | | | |
| shares authorized, par value $0.01 per share) | | | 14,775,000 | | | | 10,804,000 | | | | 3,950,000 | | | | 1,325,000 | |
| Net Asset Value, offering and redemption price per share | | $ | 44.41 | | | $ | 36.27 | | | $ | 34.51 | | | $ | 27.48 | |
| (a) | Includes $-, $459,768, $1,852,377 and $- of securities on loan. |
See Notes to Financial Statements.
ALPS ETF Trust
| | | ALPS | O'Shares
U.S. Quality
Dividend ETF | | | ALPS | O'Shares
U.S. Small-Cap
Quality Dividend
ETF | | | ALPS | O'Shares
Global Internet
Giants ETF | | | ALPS | O'Shares
Europe Quality
Dividend ETF | |
| INVESTMENT INCOME: | | | | | | | | | | | | |
| Dividends* | | $ | 16,021,686 | | | $ | 6,767,178 | | | $ | 256,822 | | | $ | 1,220,483 | |
| Securities Lending Income | | | 3 | | | | 913 | | | | 3,966 | | | | 17 | |
| Total Investment Income | | | 16,021,689 | | | | 6,768,091 | | | | 260,788 | | | | 1,220,500 | |
| | | | | | | | | | | | | | | | | |
| EXPENSES: | | | | | | | | | | | | | | | | |
| Investment adviser fees | | | 3,226,683 | | | | 1,284,336 | | | | 668,172 | | | | 185,257 | |
| Total Expenses | | | 3,226,683 | | | | 1,284,336 | | | | 668,172 | | | | 185,257 | |
| NET INVESTMENT INCOME/(LOSS) | | | 12,795,006 | | | | 5,483,755 | | | | (407,384 | ) | | | 1,035,243 | |
| | | | | | | | | | | | | | | | | |
| REALIZED AND UNREALIZED GAIN/LOSS | | | | | | | | | | | | | | | | |
| Net realized gain/(loss) on investments(a) | | | 23,476,172 | | | | 9,694,745 | | | | (47,723,648 | ) | | | (205,862 | ) |
| Net realized gain/(loss) on foreign currency transactions | | | – | | | | – | | | | (9,202 | ) | | | 692 | |
| Total net realized gain/(loss) | | | 23,476,172 | | | | 9,694,745 | | | | (47,732,850 | ) | | | (205,170 | ) |
| Net change in unrealized appreciation/(depreciation) on investments | | | (8,472,160 | ) | | | (1,765,903 | ) | | | 91,319,332 | | | | 4,424,719 | |
| Net change in unrealized appreciation on translation of assets and liabilities denominated in foreign currencies | | | – | | | | – | | | | 109 | | | | 13,925 | |
| Total net change in unrealized appreciation/(depreciation) | | | (8,472,160 | ) | | | (1,765,903 | ) | | | 91,319,441 | | | | 4,438,644 | |
| NET REALIZED AND UNREALIZED GAIN ON INVESTMENTS | | | 15,004,012 | | | | 7,928,842 | | | | 43,586,591 | | | | 4,233,474 | |
| NET INCREASE IN NET ASSETS RESULTING FROM OPERATIONS | | $ | 27,799,018 | | | $ | 13,412,597 | | | $ | 43,179,207 | | | $ | 5,268,717 | |
| * Net of foreign tax withholding. | | $ | – | | | $ | – | | | $ | 8,097 | | | $ | 146,712 | |
| (a) | Includes realized gain or loss as a result of in-kind transactions (See Note 4 in Notes to Financial Statements). |
See Notes to Financial Statements.
ALPS | O’Shares U.S. Quality Dividend ETF
| Statements of Changes in Net Assets | |
| | | For the Year Ended November 30, 2023 | | | For the Period July 1, 2022 to November 30, 2022(a) | | | For the Year Ended June 30, 2022 | |
| OPERATIONS: | | | | | | | | | |
| Net investment income | | $ | 12,795,006 | | | $ | 6,363,668 | | | $ | 13,561,060 | |
| Net realized gain | | | 23,476,172 | | | | 3,499,404 | | | | 43,405,783 | |
| Net change in unrealized appreciation/depreciation | | | (8,472,160 | ) | | | 47,553,595 | | | | (83,029,339 | ) |
| Net increase/(decrease) in net assets resulting from operations | | | 27,799,018 | | | | 57,416,667 | | | | (26,062,496 | ) |
| | | | | | | | | | | | | |
| DISTRIBUTIONS TO SHAREHOLDERS: | | | | | | | | | | | | |
| From distributable earnings | | | (13,050,503 | ) | | | (6,308,456 | ) | | | (13,415,408 | ) |
| Total distributions | | | (13,050,503 | ) | | | (6,308,456 | ) | | | (13,415,408 | ) |
| | | | | | | | | | | | | |
| CAPITAL SHARE TRANSACTIONS: | | | | | | | | | | | | |
| Proceeds from sale of shares | | | 3,278,989 | | | | 6,268,102 | | | | 230,032,035 | |
| Cost of shares redeemed | | | (109,935,912 | ) | | | (46,483,693 | ) | | | (142,045,551 | ) |
| Net increase/(decrease) from capital share transactions | | | (106,656,923 | ) | | | (40,215,591 | ) | | | 87,986,484 | |
| Net increase/(decrease) in net assets | | | (91,908,408 | ) | | | 10,892,620 | | | | 48,508,580 | |
| | | | | | | | | | | | | |
| NET ASSETS: | | | | | | | | | | | | |
| Beginning of period | | | 748,121,502 | | | | 737,228,882 | | | | 688,720,302 | |
| End of period | | $ | 656,213,094 | | | $ | 748,121,502 | | | $ | 737,228,882 | |
| | | | | | | | | | | | | |
| OTHER INFORMATION: | | | | | | | | | | | | |
| CAPITAL SHARE TRANSACTIONS: | | | | | | | | | | | | |
| Beginning shares | | | 17,300,000 | | | | 18,300,000 | | | | 16,400,000 | |
| Shares sold | | | 75,000 | | | | 150,000 | | | | 5,200,000 | |
| Shares redeemed | | | (2,600,000 | ) | | | (1,150,000 | ) | | | (3,300,000 | ) |
| Shares outstanding, end of period | | | 14,775,000 | | | | 17,300,000 | | | | 18,300,000 | |
| (a) | Effective November 30, 2022, the Board approved changing the fiscal year-end of the Fund from June 30 to November 30. |
See Notes to Financial Statements.
ALPS | O’Shares U.S. Small-Cap Quality Dividend ETF
| Statements of Changes in Net Assets | |
| | | For the
Year Ended
November 30, 2023 | | | For the Period
July 1, 2022 to
November 30, 2022(a) | | | For the
Year Ended
June 30, 2022 | |
| OPERATIONS: | | | | | | | | | |
| Net investment income | | $ | 5,483,755 | | | $ | 1,534,368 | | | $ | 2,637,053 | |
| Net realized gain | | | 9,694,745 | | | | 669,930 | | | | 14,022,562 | |
| Net change in unrealized appreciation/depreciation | | | (1,765,903 | ) | | | 17,488,042 | | | | (29,865,443 | ) |
| Net increase/(decrease) in net assets resulting from operations | | | 13,412,597 | | | | 19,692,340 | | | | (13,205,828 | ) |
| | | | | | | | | | | | | |
| DISTRIBUTIONS TO SHAREHOLDERS: | | | | | | | | | | | | |
| From distributable earnings | | | (5,299,690 | ) | | | (1,333,102 | ) | | | (2,765,428 | ) |
| Total distributions | | | (5,299,690 | ) | | | (1,333,102 | ) | | | (2,765,428 | ) |
| | | | | | | | | | | | | |
| CAPITAL SHARE TRANSACTIONS: | | | | | | | | | | | | |
| Proceeds from sale of shares | | | 240,930,245 | | | | 13,889,462 | | | | 78,553,967 | |
| Cost of shares redeemed | | | (39,107,309 | ) | | | (5,623,137 | ) | | | (56,478,862 | ) |
| Net increase from capital share transactions | | | 201,822,936 | | | | 8,266,325 | | | | 22,075,105 | |
| Net increase in net assets | | | 209,935,843 | | | | 26,625,563 | | | | 6,103,849 | |
| | | | | | | | | | | | | |
| NET ASSETS: | | | | | | | | | | | | |
| Beginning of period | | | 181,943,914 | | | | 155,318,351 | | | | 149,214,502 | |
| End of period | | $ | 391,879,757 | | | $ | 181,943,914 | | | $ | 155,318,351 | |
| | | | | | | | | | | | | |
| OTHER INFORMATION: | | | | | | | | | | | | |
| CAPITAL SHARE TRANSACTIONS: | | | | | | | | | | | | |
| Beginning shares | | | 5,154,000 | | | | 4,904,000 | | | | 4,254,000 | |
| Shares sold | | | 6,750,000 | | | | 425,000 | | | | 2,250,000 | |
| Shares redeemed | | | (1,100,000 | ) | | | (175,000 | ) | | | (1,600,000 | ) |
| Shares outstanding, end of period | | | 10,804,000 | | | | 5,154,000 | | | | 4,904,000 | |
| (a) | Effective November 30, 2022, the Board approved changing the fiscal year-end of the Fund from June 30 to November 30. |
See Notes to Financial Statements.
ALPS | O’Shares Global Internet Giants ETF
| Statements of Changes in Net Assets | |
| | | For the
Year Ended
November 30, 2023 | | | For the Period
July 1, 2022 to
November 30, 2022(a) | | | For the
Year Ended
June 30, 2022 | |
| OPERATIONS: | | | | | | | | | |
| Net investment loss | | $ | (407,384 | ) | | $ | (306,436 | ) | | $ | (1,474,256 | ) |
| Net realized loss | | | (47,732,850 | ) | | | (48,551,905 | ) | | | (38,677,188 | ) |
| Net change in unrealized appreciation/depreciation | | | 91,319,441 | | | | 34,370,555 | | | | (244,942,887 | ) |
| Net increase/(decrease) in net assets resulting from operations | | | 43,179,207 | | | | (14,487,786 | ) | | | (285,094,331 | ) |
| | | | | | | | | | | | | |
| CAPITAL SHARE TRANSACTIONS: | | | | | | | | | | | | |
| Proceeds from sale of shares | | | 811,157 | | | | – | | | | 5,994,386 | |
| Cost of shares redeemed | | | (60,193,182 | ) | | | (42,866,222 | ) | | | (229,798,933 | ) |
| Net decrease from capital share transactions | | | (59,382,025 | ) | | | (42,866,222 | ) | | | (223,804,547 | ) |
| Net decrease in net assets | | | (16,202,818 | ) | | | (57,354,008 | ) | | | (508,898,878 | ) |
| | | | | | | | | | | | | |
| NET ASSETS: | | | | | | | | | | | | |
| Beginning of period | | | 152,513,107 | | | | 209,867,115 | | | | 718,765,993 | |
| End of period | | $ | 136,310,289 | | | $ | 152,513,107 | | | $ | 209,867,115 | |
| | | | | | | | | | | | | |
| OTHER INFORMATION: | | | | | | | | | | | | |
| CAPITAL SHARE TRANSACTIONS: | | | | | | | | | | | | |
| Beginning shares | | | 6,075,000 | | | | 7,750,000 | | | | 12,600,000 | |
| Shares sold | | | 25,000 | | | | – | | | | 150,000 | |
| Shares redeemed | | | (2,150,000 | ) | | | (1,675,000 | ) | | | (5,000,000 | ) |
| Shares outstanding, end of period | | | 3,950,000 | | | | 6,075,000 | | | | 7,750,000 | |
| (a) | Effective November 30, 2022, the Board approved changing the fiscal year-end of the Fund from June 30 to November 30. |
See Notes to Financial Statements.
ALPS | O’Shares Europe Quality Dividend ETF
| Statements of Changes in Net Assets | |
| | | For the Year Ended November 30, 2023 | | | For the Period July 1, 2022 to November 30, 2022(a) | | | For the Year Ended June 30, 2022 | |
| OPERATIONS: | | | | | | | | | |
| Net investment income | | $ | 1,035,243 | | | $ | 43,643 | | | $ | 970,521 | |
| Net realized gain/(loss) | | | (205,170 | ) | | | (4,897,849 | ) | | | 3,196,544 | |
| Net change in unrealized appreciation/depreciation | | | 4,438,644 | | | | 6,975,792 | | | | (14,660,540 | ) |
| Net increase/(decrease) in net assets resulting from operations | | | 5,268,717 | | | | 2,121,586 | | | | (10,493,475 | ) |
| | | | | | | | | | | | | |
| DISTRIBUTIONS TO SHAREHOLDERS: | | | | | | | | | | | | |
| From distributable earnings | | | (795,232 | ) | | | (284,255 | ) | | | (1,031,977 | ) |
| Total distributions | | | (795,232 | ) | | | (284,255 | ) | | | (1,031,977 | ) |
| | | | | | | | | | | | | |
| CAPITAL SHARE TRANSACTIONS: | | | | | | | | | | | | |
| Proceeds from sale of shares | | | 3,889,048 | | | | – | | | | 43,521,283 | |
| Cost of shares redeemed | | | (7,610,784 | ) | | | (6,889,121 | ) | | | (17,876,858 | ) |
| Net increase/(decrease) from capital share transactions | | | (3,721,736 | ) | | | (6,889,121 | ) | | | 25,644,425 | |
| Net increase/(decrease) in net assets | | | 751,749 | | | | (5,051,790 | ) | | | 14,118,973 | |
| | | | | | | | | | | | | |
| NET ASSETS: | | | | | | | | | | | | |
| Beginning of period | | | 35,664,088 | | | | 40,715,878 | | | | 26,596,905 | |
| End of period | | $ | 36,415,837 | | | $ | 35,664,088 | | | $ | 40,715,878 | |
| | | | | | | | | | | | | |
| OTHER INFORMATION: | | | | | | | | | | | | |
| CAPITAL SHARE TRANSACTIONS: | | | | | | | | | | | | |
| Beginning shares | | | 1,475,000 | | | | 1,800,000 | | | | 950,000 | |
| Shares sold | | | 150,000 | | | | – | | | | 1,550,000 | |
| Shares redeemed | | | (300,000 | ) | | | (325,000 | ) | | | (700,000 | ) |
| Shares outstanding, end of period | | | 1,325,000 | | | | 1,475,000 | | | | 1,800,000 | |
| (a) | Effective November 30, 2022, the Board approved changing the fiscal year-end of the Fund from June 30 to November 30. |
See Notes to Financial Statements.
ALPS | O’Shares U.S. Quality Dividend ETF
| Financial Highlights | For a Share Outstanding Throughout the Periods Presented |
| | | For the Year Ended November 30, 2023 | | | For the Period July 1, 2022 to November 30, 2022(a) | | | For the Year Ended June 30, 2022 | | | For the Year Ended June 30, 2021 | | | For the Year Ended June 30, 2020 | | | For the Year Ended June 30, 2019 | |
| NET ASSET VALUE, BEGINNING OF PERIOD | | $ | 43.24 | | | $ | 40.29 | | | $ | 42.00 | | | $ | 33.16 | | | $ | 34.13 | | | $ | 30.69 | |
| | | | | | | | | | | | | | | | | | | | | | | | | |
| INCOME FROM OPERATIONS: | | | | | | | | | | | | | | | | | | | | | | | | |
| Net investment income(b) | | | 0.81 | | | | 0.36 | | | | 0.77 | | | | 0.69 | (c) | | | 0.93 | | | | 0.89 | (c) |
| Net realized and unrealized gain/(loss) | | | 1.19 | | | | 2.95 | | | | (1.72 | ) | | | 8.81 | | | | (0.96 | ) | | | 3.44 | |
| Total from investment operations | | | 2.00 | | | | 3.31 | | | | (0.95 | ) | | | 9.50 | | | | (0.03 | ) | | | 4.33 | |
| | | | | | | | | | | | | | | | | | | | | | | | | |
| DISTRIBUTIONS: | | | | | | | | | | | | | | | | | | | | | | | | |
| From net investment income | | | (0.83 | ) | | | (0.36 | ) | | | (0.76 | ) | | | (0.66 | ) | | | (0.94 | ) | | | (0.89 | ) |
| Total distributions | | | (0.83 | ) | | | (0.36 | ) | | | (0.76 | ) | | | (0.66 | ) | | | (0.94 | ) | | | (0.89 | ) |
| | | | | | | | | | | | | | | | | | | | | | | | | |
| NET INCREASE/(DECREASE) IN NET ASSET VALUE | | | 1.17 | | | | 2.95 | | | | (1.71 | ) | | | 8.84 | | | | (0.97 | ) | | | 3.44 | |
| NET ASSET VALUE, END OF PERIOD | | $ | 44.41 | | | $ | 43.24 | | | $ | 40.29 | | | $ | 42.00 | | | $ | 33.16 | | | $ | 34.13 | |
| TOTAL RETURN(d) | | | 4.74 | % | | | 8.27 | % | | | (2.38 | )% | | | 28.84 | % | | | (0.12 | )% | | | 14.31 | % |
| | | | | | | | | | | | | | | | | | | | | | | | | |
| RATIOS/SUPPLEMENTAL DATA: | | | | | | | | | | | | | | | | | | | | | | | | |
| Net assets, end of period (in 000s) | | $ | 656,213 | | | $ | 748,122 | | | $ | 737,229 | | | $ | 688,720 | | | $ | 479,121 | | | $ | 496,574 | |
| Ratio of expenses to average net assets | | | 0.48 | % | | | 0.48 | %(e) | | | 0.48 | % | | | 0.48 | % | | | 0.48 | % | | | 0.48 | % |
Ratio of net investment income to
average net assets | | | 1.90 | % | | | 2.11 | %(e) | | | 1.78 | % | | | 1.81 | % | | | 2.71 | % | | | 2.76 | % |
| Portfolio turnover rate(f) | | | 34 | % | | | 25 | % | | | 15 | % | | | 26 | % | | | 64 | %(g) | | | 15 | % |
| (a) | Effective November 30, 2022, the Board approved changing the fiscal year-end of the Fund from June 30 to November 30. |
| (b) | Based on average shares outstanding during the period. |
| (c) | The net investment income per share excluding the impact of large, non-recurring dividends (special dividends) was $0.67 during the year ended June 30, 2021 and $0.88 during the year ended June 30, 2019. |
| (d) | Total return is calculated assuming an initial investment made at the net asset value at the beginning of the year and redemption at the net asset value on the last day of the year and assuming all distributions are reinvested at the reinvestment prices. Total return calculated for a period of less than one year is not annualized. |
| (f) | Portfolio turnover for periods less than one year are not annualized and does not include securities received or delivered from processing creations or redemptions in-kind. |
| (g) | Increase in the Portfolio turnover was a result of the Index change that was effective on June 1, 2020. |
See Notes to Financial Statements.
ALPS | O’Shares U.S. Small-Cap Quality Dividend ETF
| Financial Highlights | For a Share Outstanding Throughout the Periods Presented |
| | | For the Year Ended November 30, 2023 | | | For the Period July 1, 2022 to November 30, 2022(a) | | | For the Year Ended June 30, 2022 | | | For the Year Ended June 30, 2021 | | | For the Year Ended June 30, 2020 | | | For the Year Ended June 30, 2019 | |
| NET ASSET VALUE, BEGINNING OF PERIOD | | $ | 35.30 | | | $ | 31.67 | | | $ | 35.08 | | | $ | 24.99 | | | $ | 27.45 | | | $ | 27.07 | |
| | | | | | | | | | | | | | | | | | | | | | | | | |
| INCOME/(LOSS) FROM OPERATIONS: | | | | | | | | | | | | | | | | | | | | | | | | |
| Net investment income(b) | | | 0.73 | | | | 0.31 | | | | 0.59 | | | | 0.64 | (c) | | | 0.64 | (c) | | | 0.58 | (c) |
Net realized and unrealized
gain/(loss) | | | 0.94 | | | | 3.59 | | | | (3.38 | ) | | | 9.98 | | | | (2.48 | ) | | | 0.38 | (d) |
Total from investment
operations | | | 1.67 | | | | 3.90 | | | | (2.79 | ) | | | 10.62 | | | | (1.84 | ) | | | 0.96 | |
| | | | | | | | | | | | | | | | | | | | | | | | | |
| DISTRIBUTIONS: | | | | | | | | | | | | | | | | | | | | | | | | |
| From net investment income | | | (0.70 | ) | | | (0.27 | ) | | | (0.62 | ) | | | (0.53 | ) | | | (0.57 | ) | | | (0.58 | ) |
| From tax return of capital | | | – | | | | – | | | | – | | | | – | | | | (0.05 | ) | | | – | |
| Total distributions | | | (0.70 | ) | | | (0.27 | ) | | | (0.62 | ) | | | (0.53 | ) | | | (0.62 | ) | | | (0.58 | ) |
| | | | | | | | | | | | | | | | | | | | | | | | | |
| NET INCREASE/(DECREASE) IN NET ASSET VALUE | | | 0.97 | | | | 3.63 | | | | (3.41 | ) | | | 10.09 | | | | (2.46 | ) | | | 0.38 | |
| NET ASSET VALUE, END OF PERIOD | | $ | 36.27 | | | $ | 35.30 | | | $ | 31.67 | | | $ | 35.08 | | | $ | 24.99 | | | $ | 27.45 | |
| TOTAL RETURN(e) | | | 4.82 | % | | | 12.39 | % | | | (8.12 | )% | | | 42.79 | % | | | (6.82 | )% | | | 3.65 | % |
| RATIOS/SUPPLEMENTAL DATA: | | | | | | | | | | | | | | | | | | | | | | | | |
| Net assets, end of period (in 000s) | | $ | 391,880 | | | $ | 181,944 | | | $ | 155,318 | | | $ | 149,215 | | | $ | 93,812 | | | $ | 97,570 | |
| Ratio of expenses to average net assets | | | 0.48 | % | | | 0.48 | %(f) | | | 0.48 | % | | | 0.48 | % | | | 0.48 | % | | | 0.48 | % |
| Ratio of net investment income to average net assets | | | 2.05 | % | | | 2.28 | %(f) | | | 1.69 | % | | | 2.08 | %(g) | | | 2.38 | %(g) | | | 2.16 | %(g) |
| Portfolio turnover rate(h) | | | 64 | % | | | 34 | % | | | 34 | % | | | 60 | % | | | 101 | %(i) | | | 52 | % |
| (a) | Effective November 30, 2022, the Board approved changing the fiscal year-end of the Fund from June 30 to November 30. |
| (b) | Based on average shares outstanding during the period. |
| (c) | The net investment income per share excluding the impact of large, non-recurring dividends (special dividends) was $0.57 during the year ended June 30, 2021, $0.62 during the year ended June 30, 2020 and $0.54 during the year ended June 30, 2019. |
| (d) | The amount shown for a share outstanding throughout the period is not in accordance with the aggregate net realized and unrealized gain (loss) for that period because of the timing of sales and repurchases of the Fund shares in relation to fluctuating market value of the investments in the Fund. |
| (e) | Total return is calculated assuming an initial investment made at the net asset value at the beginning of the year and redemption at the net asset value on the last day of the year and assuming all distributions are reinvested at the reinvestment prices. Total return calculated for a period of less than one year is not annualized. |
| (g) | The ratio of net investment income, including waiver/reimbursement and excluding the impact of large, non-recurring dividends (special dividends) was 1.84% during the year ended June 30, 2021, 2.30% during the year ended June 30, 2020 and 2.03% during the year ended June 30, 2019. |
| (h) | Portfolio turnover for periods less than one year are not annualized and does not include securities received or delivered from processing creations or redemptions in-kind. |
| (i) | Increase in the Portfolio turnover was a result of the Index change that was effective on June 1, 2020. |
See Notes to Financial Statements.
ALPS | O’Shares Global Internet Giants ETF
| Financial Highlights | For a Share Outstanding Throughout the Periods Presented |
| | | For the Year Ended November 30, 2023 | | | For the Period July 1, 2022 to November 30, 2022(a) | | | For the Year Ended June 30, 2022 | | | For the Year Ended June 30, 2021 | | | For the Year Ended June 30, 2020 | | | For the Year Ended June 30, 2019 | |
| NET ASSET VALUE, BEGINNING OF PERIOD | | $ | 25.11 | | | $ | 27.08 | | | $ | 57.04 | | | $ | 37.85 | | | $ | 25.04 | | | $ | 24.06 | |
| | | | | | | | | | | | | | | | | | | | | | | | | |
| INCOME/(LOSS) FROM OPERATIONS: | | | | | | | | | | | | | | | | | | | | | | | | |
| Net investment loss(b) | | | (0.09 | ) | | | (0.04 | ) | | | (0.15 | ) | | | (0.21 | ) | | | (0.10 | ) | | | (0.06 | )(c) |
| Net realized and unrealized gain/(loss) | | | 9.49 | | | | (1.93 | ) | | | (29.81 | ) | | | 19.40 | | | | 12.91 | | | | 1.04 | |
| Total from investment operations | | | 9.40 | | | | (1.97 | ) | | | (29.96 | ) | | | 19.19 | | | | 12.81 | | | | 0.98 | |
| | | | | | | | | | | | | | | | | | | | | | | | | |
| NET INCREASE/(DECREASE) IN NET ASSET VALUE | | | 9.40 | | | | (1.97 | ) | | | (29.96 | ) | | | 19.19 | | | | 12.81 | | | | 0.98 | |
| NET ASSET VALUE, END OF PERIOD | | $ | 34.51 | | | $ | 25.11 | | | $ | 27.08 | | | $ | 57.04 | | | $ | 37.85 | | | $ | 25.04 | |
| TOTAL RETURN(d) | | | 37.44 | % | | | (7.27 | )% | | | (52.52 | )% | | | 50.70 | % | | | 51.16 | % | | | 4.07 | % |
| | | | | | | | | | | | | | | | | | | | | | | | | |
| RATIOS/SUPPLEMENTAL DATA: | | | | | | | | | | | | | | | | | | | | | | | | |
| Net assets, end of period (in 000s) | | $ | 136,310 | | | $ | 152,513 | | | $ | 209,867 | | | $ | 718,766 | | | $ | 272,512 | | | $ | 48,834 | |
| | | | | | | | | | | | | | | | | | | | | | | | | |
| Ratio of expenses to average net assets | | | 0.48 | % | | | 0.48 | %(e) | | | 0.48 | % | | | 0.48 | % | | | 0.48 | % | | | 0.48 | % |
| Ratio of net investment loss to average net assets | | | (0.29 | )% | | | (0.37 | )%(e) | | | (0.32 | )% | | | (0.40 | )% | | | (0.34 | )% | | | (0.28 | )%(f) |
| Portfolio turnover rate(g) | | | 51 | % | | | 22 | % | | | 51 | % | | | 48 | % | | | 38 | % | | | 55 | % |
| (a) | Effective November 30, 2022, the Board approved changing the fiscal year-end of the Fund from June 30 to November 30. |
(b) Based on average shares outstanding during the period.
| (c) | The net investment loss per share excluding the impact of large, non-recurring dividends (special dividends) was $(0.07) during the year ended June 30, 2019. |
| (d) | Total return is calculated assuming an initial investment made at the net asset value at the beginning of the year and redemption at the net asset value on the last day of the year and assuming all distributions are reinvested at the reinvestment prices. Total return calculated for a period of less than one year is not annualized. |
| (f) | The ratio of net investment loss, including waiver/reimbursement and excluding the impact of large, non-recurring dividends (special dividends) was (0.31)% during the year ended June 30, 2019. |
| (g) | Portfolio turnover for periods less than one year are not annualized and does not include securities received or delivered from processing creations or redemptions in-kind. |
See Notes to Financial Statements.
ALPS | O’Shares Europe Quality Dividend ETF
| Financial Highlights | For a Share Outstanding Throughout the Periods Presented |
| | | For the Year Ended November 30, 2023 | | | For the Period July 1, 2022 to November 30, 2022(a) | | | For the Year Ended June 30, 2022 | | | For the Year Ended June 30, 2021 | | | For the Year Ended June 30, 2020 | | | For the Year Ended June 30, 2019 | |
| NET ASSET VALUE, BEGINNING OF PERIOD | | $ | 24.18 | | | $ | 22.62 | | | $ | 28.00 | | | $ | 22.28 | | | $ | 24.28 | | | $ | 23.94 | |
| | | | | | | | | | | | | | | | | | | | | | | | | |
| INCOME/(LOSS) FROM OPERATIONS: | | | | | | | | | | | | | | | | | | | | | | | | |
| Net investment income(b) | | | 0.71 | | | | 0.03 | | | | 0.58 | | | | 0.55 | (c) | | | 0.64 | (c) | | | 0.76 | (c) |
| Net realized and unrealized gain/(loss) | | | 3.13 | | | | 1.71 | | | | (5.33 | ) | | | 5.97 | | | | (1.95 | ) | | | 0.44 | |
| Total from investment operations | | | 3.84 | | | | 1.74 | | | | (4.75 | ) | | | 6.52 | | | | (1.31 | ) | | | 1.20 | |
| | | | | | | | | | | | | | | | | | | | | | | | | |
| DISTRIBUTIONS: | | | | | | | | | | | | | | | | | | | | | | | | |
| From net investment income | | | (0.54 | ) | | | (0.18 | ) | | | (0.63 | ) | | | (0.80 | ) | | | (0.69 | ) | | | (0.86 | ) |
| Total distributions | | | (0.54 | ) | | | (0.18 | ) | | | (0.63 | ) | | | (0.80 | ) | | | (0.69 | ) | | | (0.86 | ) |
| | | | | | | | | | | | | | | | | | | | | | | | | |
| NET INCREASE/(DECREASE) IN NET | | | | | | | | | | | | | | | | | | | | | | | | |
| ASSET VALUE | | | 3.30 | | | | 1.56 | | | | (5.38 | ) | | | 5.72 | | | | (2.00 | ) | | | 0.34 | |
| NET ASSET VALUE, END OF PERIOD | | $ | 27.48 | | | $ | 24.18 | | | $ | 22.62 | | | $ | 28.00 | | | $ | 22.28 | | | $ | 24.28 | |
| TOTAL RETURN(d) | | | 15.99 | % | | | 7.78 | % | | | (17.29 | )% | | | 29.72 | % | | | (5.44 | )% | | | 5.16 | % |
| | | | | | | | | | | | | | | | | | | | | | | | | |
| RATIOS/SUPPLEMENTAL DATA: | | | | | | | | | | | | | | | | | | | | | | | | |
| Net assets, end of period (in 000s) | | $ | 36,416 | | | $ | 35,664 | | | $ | 40,716 | | | $ | 26,597 | | | $ | 17,821 | | | $ | 25,498 | |
| | | | | | | | | | | | | | | | | | | | | | | | | |
| Ratio of expenses to average net assets | | | 0.48 | % | | | 0.48 | %(e) | | | 0.48 | % | | | 0.48 | % | | | 0.48 | % | | | 0.48 | % |
| Ratio of net investment income to average net assets | | | 2.68 | % | | | 0.29 | %(e) | | | 2.20 | % | | | 2.18 | % | | | 2.72 | % | | | 3.23 | % |
| Portfolio turnover rate(f) | | | 40 | % | | | 38 | % | | | 22 | % | | | 42 | % | | | 72 | %(g) | | | 35 | % |
| (a) | Effective November 30, 2022, the Board approved changing the fiscal year-end of the Fund from June 30 to November 30. |
| (b) | Based on average shares outstanding during the period. |
| (c) | The net investment income per share excluding the impact of large, non-recurring dividends (special dividends) was $0.54 during the year ended June 30, 2021, $0.63 during the year ended June 30, 2020 and $0.74 during the year ended June 30, 2019. |
| (d) | Total return is calculated assuming an initial investment made at the net asset value at the beginning of the year and redemption at the net asset value on the last day of the year and assuming all distributions are reinvested at the reinvestment prices. Total return calculated for a period of less than one year is not annualized. |
| (f) | Portfolio turnover for periods less than one year are not annualized and does not include securities received or delivered from processing creations or redemptions in-kind. |
| (g) | Increase in the Portfolio turnover was a result of the Index change that was effective on June 1, 2020. |
See Notes to Financial Statements.
ALPS ETF Trust
| Notes to Financial Statements | November 30, 2023 |
1. ORGANIZATION
ALPS ETF Trust (the ‘‘Trust’’), a Delaware statutory trust, is an open-end management investment company registered under the Investment Company Act of 1940, as amended (the ‘‘1940 Act’’). As of November 30, 2023, the Trust consisted of twenty-three separate portfolios. Each portfolio represents a separate series of the Trust. This report pertains to the ALPS | O’Shares U.S. Quality Dividend ETF, the ALPS | O’Shares U.S. Small-Cap Quality Dividend ETF, the ALPS | O’Shares Global Internet Giants ETF and the ALPS | O’Shares Europe Quality Dividend ETF (each a “Fund” and collectively, the “Funds”). Effective November 30, 2022, the Trust's Board of Trustees (the "Board") approved changing the fiscal year-end of the Funds from June 30 to November 30.
The investment objective of the ALPS | O’Shares U.S. Quality Dividend ETF is to seek investment results that track the performance (before fees and expenses) of the O’Shares U.S. Quality Dividend Index. The investment objective of the ALPS | O’Shares U.S. Small-Cap Quality Dividend ETF is to seek investment results that track the performance (before fees and expenses) of the O’Shares U.S. Small-Cap Quality Dividend Index. The investment objective of the ALPS | O’Shares Global Internet Giants ETF is to seek investment results that track the performance (before fees and expenses) of the O’Shares Global Internet Giants Index. The investment objective of the ALPS | O’Shares Europe Quality Dividend ETF is to seek investment results that track the performance (before fees and expenses) of the O’Shares Europe Quality Dividend Index.
ALPS | O’Shares Global Internet Giants ETF is considered non-diversified and may invest a greater portion of assets in securities of individual issuers than a diversified fund. As a result, changes in the market value of a single investment could cause greater fluctuations in share price than would occur in a diversified fund. ALPS | O’Shares U.S. Quality Dividend ETF, ALPS | O’Shares U.S. Small-Cap Quality Dividend ETF and ALPS | O’Shares Europe Quality Dividend ETF have each elected to qualify as a diversified series of the Trust under the 1940 Act. The Funds, previously part of another investment company, OSI ETF Trust, reorganized effective after the close of business on June 17, 2022.
Each Fund’s Shares (“Shares”) are listed on the Cboe BZX Exchange, Inc. (the “Cboe BZX”). Each Fund issues and redeems Shares, at net asset value (“NAV”) in blocks of 25,000 Shares, each of which is called a “Creation Unit”. Creation Units are issued and redeemed principally in-kind for securities included in the Underlying Index. Except when aggregated in Creation Units, Shares are not redeemable securities of the Fund.
Pursuant to the Trust’s organizational documents, its Officers and Trustees are indemnified against certain liability arising out of the performance of their duties to the Trust. Additionally, in the normal course of business, the Trust enters into contracts with service providers that contain general indemnification clauses. The Trust’s maximum exposure under these arrangements is unknown, as this would involve future claims that may be made against the Trust that have not yet occurred.
2. SIGNIFICANT ACCOUNTING POLICIES
The following is a summary of significant accounting policies consistently followed by the Funds in the preparation of the financial statements. The accompanying financial statements were prepared in accordance with accounting principles generally accepted in the United States of America (“U.S. GAAP”). The preparation of financial statements in conformity with U.S. GAAP requires management to make certain estimates and assumptions that affect the reported amounts of assets and liabilities and disclosures of contingent assets and liabilities at the date of the financial statements and the reported amounts of revenue and expenses during the period. Actual results could differ from those estimates. Each Fund is considered an investment company under U.S. GAAP and follows the accounting and reporting guidance applicable to investment companies in the Financial Accounting Standards Board (“FASB”) Accounting Standards Codification Topic 946.
A. Portfolio Valuation
Each Fund’s NAV is determined daily, as of the close of regular trading on the New York Stock Exchange (the “NYSE”), normally 4:00 p.m. Eastern Time, on each day the NYSE is open for trading. The NAV is computed by dividing the value of all assets of each Fund (including accrued interest and dividends), less all liabilities (including accrued expenses and dividends declared but unpaid), by the total number of shares outstanding.
Portfolio securities listed on any exchange other than the NASDAQ Stock Market LLC (“NASDAQ”) are valued at the last sale price on the business day as of which such value is being determined. If there has been no sale on such day, the securities are valued at the mean of the most recent bid and ask prices on such day. Securities traded on the NASDAQ are valued at the NASDAQ Official Closing Price as determined by NASDAQ. Portfolio securities traded on more than one securities exchange are valued at the last sale price on the business day as of which such value is being determined at the close of the exchange representing the principal market for such securities. Portfolio securities traded in the over-the-counter market, but excluding securities traded on the NASDAQ, are valued at the last quoted sale price in such market.
The Funds’ investments are valued at market value or, in the absence of market value with respect to any portfolio securities, at fair value according to procedures adopted by the Trust’s Board. Pursuant to Rule 2a-5 under the 1940 Act, the Board designated ALPS Advisors, Inc. (the "Adviser") as the valuation designee ("Valuation Designee") for each Fund to perform the fair value determinations relating to Fund investments. The Adviser may carry out its designated responsibilities as Valuation Designee through various teams and committees. When market quotations are not readily available or when events occur that make established valuation methods unreliable, securities of the Funds may be valued in good faith by the Valuation Designee. These securities generally include, but are not limited to, restricted securities (securities which may not be publicly sold without registration under the Securities Act of 1933) for which a pricing service is unable to provide a market price; securities whose trading has been formally suspended; a security whose market price is not available from a pre-established primary pricing source or the pricing source is not willing to provide a price; a security with respect to which an event has occurred that is most likely to materially affect the value of the security after the market has closed but before the calculation of a Fund’s NAV or make it difficult or impossible to obtain a reliable market quotation; or a security whose price, as provided by the pricing service, does not reflect the security’s “fair value” due to the security being de-listed from a national exchange or the security’s primary trading market is temporarily closed at a time when, under normal conditions, it would be open. As a general principle, the current “fair value” of a security would be the amount which the owner might reasonably expect to receive from the sale on the applicable exchange or principal market. A variety of factors may be considered in determining the fair value of such securities.
ALPS ETF Trust
| Notes to Financial Statements | November 30, 2023 |
B. Fair Value Measurements
Each Fund discloses the classification of its fair value measurements following a three-tier hierarchy based on the inputs used to measure fair value. Inputs refer broadly to the assumptions that market participants would use in pricing the asset or liability, including assumptions about risk. Inputs may be observable or unobservable. Observable inputs reflect the assumptions market participants would use in pricing the asset or liability that are developed based on market data obtained from sources independent of the reporting entity. Unobservable inputs reflect the reporting entity’s own assumptions about the assumptions market participants would use in pricing the asset or liability that are developed based on the best information available.
Valuation techniques used to value the Funds’ investments by major category are as follows:
Equity securities, including restricted securities, for which market quotations are readily available, are valued at the last reported sale price or official closing price as reported by a third party pricing vendor on the primary market or exchange on which they are traded and are categorized as Level 1 in the hierarchy. In the event there were no sales during the day or closing prices are not available, securities are valued at the mean of the most recent quoted bid and ask prices on such day and are generally categorized as Level 2 in the hierarchy. Investments in open-end mutual funds are valued at their closing NAV each business day and are categorized as Level 1 in the hierarchy.
Changes in valuation techniques may result in transfers in or out of an assigned level within the disclosure hierarchy.
Various inputs are used in determining the value of each Fund’s investments as of the end of the reporting period. When inputs used fall into different levels of the fair value hierarchy, the level in the hierarchy within which the fair value measurement falls is determined based on the lowest level input that is significant to the fair value measurement in its entirety. The designated input levels are not necessarily an indication of the risk or liquidity associated with these investments.
These inputs are categorized in the following hierarchy under applicable financial accounting standards:
| Level 1 – | Unadjusted quoted prices in active markets for identical investments, unrestricted assets or liabilities that a Fund has the ability to access at the measurement date; |
| | |
| Level 2 – | Quoted prices which are not active, quoted prices for similar assets or liabilities in active markets or inputs other than quoted prices that are observable (either directly or indirectly) for substantially the full term of the asset or liability; and |
| | |
| Level 3 – | Significant unobservable prices or inputs (including the Fund’s own assumptions in determining the fair value of investments) where there is little or no market activity for the asset or liability at the measurement date. |
ALPS ETF Trust
| Notes to Financial Statements | November 30, 2023 |
The following is a summary of the inputs used to value the Funds’ investments as of November 30, 2023:
ALPS | O'Shares U.S. Quality Dividend ETF
| Investments in Securities at Value | | Level 1 - Quoted and Unadjusted Prices | | | Level 2 - Other Significant Observable Inputs | | | Level 3 - Significant Unobservable Inputs | | | Total | |
| Common Stocks* | | $ | 655,187,764 | | | $ | – | | | $ | – | | | $ | 655,187,764 | |
| Short Term Investments | | | 161,717 | | | | – | | | | – | | | | 161,717 | |
| Total | | $ | 655,349,481 | | | $ | – | | | $ | – | | | $ | 655,349,481 | |
ALPS | O'Shares U.S. Small-Cap Quality Dividend ETF
| Investments in Securities at Value | | Level 1 - Quoted and Unadjusted Prices | | | Level 2 - Other Significant Observable Inputs | | | Level 3 - Significant Unobservable Inputs | | | Total | |
| Common Stocks* | | $ | 390,952,148 | | | $ | – | | | $ | – | | | $ | 390,952,148 | |
| Short Term Investments | | | 583,389 | | | | – | | | | – | | | | 583,389 | |
| Total | | $ | 391,535,537 | | | $ | – | | | $ | – | | | $ | 391,535,537 | |
ALPS | O'Shares Global Internet Giants ETF
| Investments in Securities at Value | | Level 1 - Quoted and Unadjusted Prices | | | Level 2 - Other Significant Observable Inputs | | | Level 3 – Significant Unobservable Inputs | | | Total | |
| Common Stocks* | | $ | 136,255,293 | | | $ | – | | | $ | – | | | $ | 136,255,293 | |
| Short Term Investments | | | 2,010,556 | | | | – | | | | – | | | | 2,010,556 | |
| Total | | $ | 138,265,849 | | | $ | – | | | $ | – | | | $ | 138,265,849 | |
ALPS | O'Shares Europe Quality Dividend ETF
| Investments in Securities at Value | | Level 1 - Quoted and Unadjusted Prices | | | Level 2 - Other Significant Observable Inputs | | | Level 3 - Significant Unobservable Inputs | | | Total | |
| Common Stocks* | | $ | 36,058,920 | | | $ | – | | | $ | – | | | $ | 36,058,920 | |
| Short Term Investments | | | 28,789 | | | | – | | | | – | | | | 28,789 | |
| Total | | $ | 36,087,709 | | | $ | – | | | $ | – | | | $ | 36,087,709 | |
| * | For a detailed sector breakdown, see the accompanying Schedule of Investments. |
The Funds did not have any securities that used significant unobservable inputs (Level 3) in determining fair value and there were no transfers into or out of Level 3 during the year ended November 30, 2023.
C. Foreign Investment Risk
The ALPS | O’Shares Global Internet Giants ETF and the ALPS | O’Shares Europe Quality Dividend ETF may directly purchase securities of foreign issuers. Investments in non-U.S. issuers may involve unique risks compared to investing in securities of U.S. issuers, including, among others, less liquidity generally, greater market volatility than U.S. securities and less complete financial information than for U.S. issuers. In addition, adverse political, economic or social developments could undermine the value of the Fund’s investments or prevent the Fund from realizing the full value of its investments. Financial reporting standards for companies based in foreign markets differ from those in the United States. Finally, the value of the currency of the country in which the Fund has invested could decline relative to the value of the U.S. dollar, which may affect the value of the investment to U.S. investors.
Countries with emerging markets may have relatively unstable governments and may present the risks of nationalization of businesses, restrictions on foreign ownership and prohibitions on the repatriation of assets. The economies of emerging markets countries also may be based on only a few industries, making them more vulnerable to changes in local or global trade conditions and more sensitive to debt burdens, inflation rates or adverse news and events.
Because foreign markets may be open on different days than the days during which investors may purchase the shares of each Fund, the value of each Fund's securities may change on the days when investors are not able to purchase the shares of the Funds. The value of securities denominated in foreign currencies is converted into U.S. dollars using exchange rates determined daily as of the close of regular trading on the NYSE or NASDAQ. Any use of a different rate from the rates used by the Index may adversely affect a Fund's ability to track its Index.
ALPS ETF Trust
| Notes to Financial Statements | November 30, 2023 |
D. Foreign Currency Translation
The books and records of the Funds are maintained in U.S. dollars. Investment valuations and other assets and liabilities initially expressed in foreign currencies are converted each business day into U.S. dollars based upon current exchange rates. The portion of realized and unrealized gains or losses on investments due to fluctuations in foreign currency exchange rates is not separately disclosed and is included in realized and unrealized gains or losses on investments, when applicable.
E. Securities Transactions and Investment Income
Securities transactions are recorded as of the trade date. Realized gains and losses from securities transactions are recorded on the specific identification in accordance with GAAP. Dividend income and capital gains distributions, if any, are recorded on the ex-dividend date, net of any foreign taxes withheld. Non-cash dividends, if any, are recorded at the fair market value of the asset received. Interest income, if any, is recorded on the accrual basis, including amortization of premiums and accretion of discounts. Income received from foreign sources may result in withholding tax. Withholding taxes are accrued at the same time as the related income if the tax rate is fixed and known, unless a tax withheld is reclaimable from the local tax authorities in which case it is recorded as receivable. If the tax rate is not known or estimable, such expense or reclaim receivable is recorded when the net proceeds are received.
F. Dividends and Distributions to Shareholders
Dividends from net investment income, if any, are declared and paid monthly, except for ALPS | O’Shares Europe Quality Dividend ETF, which declares and pays dividends from net investment income quarterly. Distributions of net realized capital gains earned by the Funds, if any, are distributed at least annually.
G. Federal Tax and Tax Basis Information
The timing and character of income and capital gain distributions are determined in accordance with income tax regulations, which may differ from
U.S. GAAP. Reclassifications are made to the Funds’ capital accounts for permanent tax differences to reflect income and gains available for distribution (or available capital loss carryforwards) under income tax regulations.
For the fiscal year ended November 30, 2023, the following reclassifications, which had no impact on results of operations or net assets, were recorded to reflect permanent tax differences resulting primarily from in-kind transactions:
| Fund | | Paid-in Capital | | | Total Distributable Earnings | |
| ALPS | O'Shares U.S. Quality Dividend ETF | | $ | 25,771,221 | | | $ | (25,771,221 | ) |
| ALPS | O'Shares U.S. Small-Cap Quality Dividend ETF | | | 8,781,580 | | | | (8,781,580 | ) |
| ALPS | O'Shares Global Internet Giants ETF | | | (1,425,879 | ) | | | 1,425,879 | |
| ALPS | O'Shares Europe Quality Dividend ETF | | | 619,842 | | | | (619,842 | ) |
ALPS ETF Trust
| Notes to Financial Statements | November 30, 2023 |
The tax character of the distributions paid for the fiscal year ended November 30, 2023, and fiscal years ended November 30, 2022 and June 30, 2022 were as follows:
| | | Ordinary Income | | | Long-Term Capital Gain | | | Return of Capital | |
| November 30, 2023 | | | | | | | | | |
| ALPS | O'Shares U.S. Quality Dividend ETF | | $ | 13,050,503 | | | $ | – | | | $ | – | |
| ALPS | O'Shares U.S. Small-Cap Quality Dividend ETF | | | 5,299,690 | | | | – | | | | – | |
| ALPS | O'Shares Global Internet Giants ETF | | | – | | | | – | | | | – | |
| ALPS | O'Shares Europe Quality Dividend ETF | | | 795,232 | | | | – | | | | – | |
| | | Ordinary Income | | | Long-Term Capital Gain | | | Return of Capital | |
| November 30, 2022 | | | | | | | | | |
| ALPS | O'Shares U.S. Quality Dividend ETF | | $ | 6,308,456 | | | $ | – | | | $ | – | |
| ALPS | O'Shares U.S. Small-Cap Quality Dividend ETF | | | 1,333,102 | | | | – | | | | – | |
| ALPS | O'Shares Global Internet Giants ETF | | | – | | | | – | | | | – | |
| ALPS | O'Shares Europe Quality Dividend ETF | | | 284,255 | | | | – | | | | – | |
| | | Ordinary Income | | | Long-Term Capital Gain | | | Return of Capital | |
| June 30, 2022 | | | | | | | | | |
| ALPS | O'Shares U.S. Quality Dividend ETF | | $ | 13,415,408 | | | $ | – | | | $ | – | |
| ALPS | O'Shares U.S. Small-Cap Quality Dividend ETF | | | 2,765,428 | | | | – | | | | – | |
| ALPS | O'Shares Global Internet Giants ETF | | | – | | | | – | | | | – | |
| ALPS | O'Shares Europe Quality Dividend ETF | | | 1,031,977 | | | | – | | | | – | |
The character of distributions made during the period may differ from its ultimate characterization for federal income tax purposes.
As of November 30, 2023, the components of distributable earnings on a tax basis for each Fund were as follows:
| | | Accumulated net investment income | | | Accumulated net realized gain/(loss) on investments | | | Other accumulated gain/(loss) | | | Net unrealized appreciation/(depreciation) on investments | | | Total | |
| ALPS | O'Shares U.S. Quality Dividend ETF | | $ | 423,604 | | | $ | (58,468,323 | ) | | $ | – | | | $ | 83,493,528 | | | $ | 25,448,809 | |
| ALPS | O'Shares U.S. Small-Cap Quality Dividend ETF | | | 493,282 | | | | (12,565,369 | ) | | | – | | | | 17,192,528 | | | | 5,120,441 | |
| ALPS | O'Shares Global Internet Giants ETF | | | – | | | | (189,046,501 | ) | | | (329,880 | ) | | | (2,029,129 | ) | | | (191,405,510 | ) |
| ALPS | O'Shares Europe Quality Dividend ETF | | | 897,513 | | | | (10,825,529 | ) | | | – | | | | 1,637,918 | | | | (8,290,098 | ) |
Under current law, capital losses maintain their character as short-term or long-term and are carried forward to the next tax year without expiration.
As of November 30, 2023, the following amounts are available as carry forwards to the next tax year:
| Fund | | Short-Term | | | Long-Term | |
| ALPS | O'Shares U.S. Quality Dividend ETF | | $ | 11,045,741 | | | $ | 47,422,582 | |
| ALPS | O'Shares U.S. Small-Cap Quality Dividend ETF | | | 4,866,524 | | | | 7,698,845 | |
| ALPS | O'Shares Global Internet Giants ETF | | | 96,217,310 | | | | 92,829,191 | |
| ALPS | O'Shares Europe Quality Dividend ETF | | | 2,661,501 | | | | 8,164,028 | |
The ALPS O’Shares U.S. Small-Cap Quality Dividend ETF used capital loss carryovers during the year ended November 30, 2023, in the amount of $809,419.
The ALPS O’Shares Global Internet Giants ETF elects to defer to the period ending November 29, 2024, late year ordinary losses in the amount of $329,880.
ALPS ETF Trust
| Notes to Financial Statements | November 30, 2023 |
As of November 30, 2023, the cost of investments for federal income tax purposes and accumulated net unrealized appreciation/(depreciation) on investments were as follows:
| | | ALPS | O'Shares U.S. Quality Dividend ETF | | | ALPS | O'Shares U.S. Small-Cap Quality Dividend ETF | | | ALPS | O'Shares Global Internet Giants ETF | | | ALPS | O'Shares Europe Quality Dividend ETF | |
| Gross appreciation (excess of value over tax cost) | | $ | 105,534,071 | | | $ | 33,328,993 | | | $ | 19,937,945 | | | $ | 3,813,681 | |
| Gross depreciation (excess of tax cost over value) | | | (22,040,543 | ) | | | (16,136,465 | ) | | | (21,966,997 | ) | | | (2,181,134 | ) |
| Net depreciation of foreign currency | | | – | | | | – | | | | (77 | ) | | | 5,371 | |
| Net unrealized appreciation/(depreciation) | | $ | 83,493,528 | | | $ | 17,192,528 | | | $ | (2,029,129 | ) | | $ | 1,637,918 | |
| Cost of investments for income tax purposes | | $ | 571,855,953 | | | $ | 374,343,009 | | | $ | 140,294,901 | | | $ | 34,455,162 | |
The differences between book-basis and tax basis are primarily due to the deferral of losses from wash sales and investments in Passive Foreign Investment Companies (PFICs).
H. Income Taxes
No provision for income taxes is included in the accompanying financial statements, as each Fund intends to distribute to shareholders all taxable investment income and realized gains and otherwise comply with Subchapter M of the Internal Revenue Code of 1986, as amended, applicable to regulated investment companies. Each Fund evaluates tax positions taken (or expected to be taken) in the course of preparing the Funds’ tax returns to determine whether these positions meet a “more-likely-than-not” standard that, based on the technical merits, have a more than fifty percent likelihood of being sustained by a taxing authority upon examination. A tax position that meets the “more-likely-than-not” recognition threshold is measured to determine the amount of benefit to recognize in the financial statements.
As of and during the Funds' fiscal year ended November 30, 2023, each Fund did not have a liability for any unrecognized tax benefits. Each Fund files U.S. federal, state, and local tax returns as required. Each Fund’s tax returns are subject to examination by the relevant tax authorities until expiration of the applicable statute of limitations, which is generally three years after the filing of the tax return, but may extend to four years in certain jurisdictions. Each Fund’s tax returns for open years have incorporated no uncertain tax positions that require a provision for income taxes.
I. Lending of Portfolio Securities
Effective June 20, 2022, the Funds have entered into a securities lending agreement with State Street Bank & Trust Co. (“SSB”), the Funds’ lending agent. Each Fund may lend its portfolio securities only to borrowers that are approved by SSB. Each Fund will limit such lending to not more than 33 1/3% of the value of its total assets. The Funds' securities held at SSB as custodian shall be available to be lent except those securities the Funds or ALPS Advisors, Inc. specifically identifies in writing as not being available for lending. The borrower pledges and maintains with the Funds collateral consisting of cash (U.S. Dollars only), securities issued or guaranteed by the U.S. government or its agencies or instrumentalities, and cash equivalents (including irrevocable bank letters of credit) issued by a person other than the borrower or an affiliate of the borrower. The initial collateral received by the Fund is required to have a value of no less than 102% of the market value of the loaned securities for U.S equity securities and a value of no less than 105% of the market value for non-U.S. equity securities. The collateral is maintained thereafter, at a market value equal to not less than 102% of the current value of the U.S. equity securities on loan and not less than 105% of the current value of the non-U.S. equity securities on loan. The market value of the loaned securities is determined at the close of each business day and any additional required collateral is delivered to the Fund on the next business day. During the term of the loan, each Fund is entitled to all distributions made on or in respect of the loaned securities. Loans of securities are terminable at any time and the borrower, after notice, is required to return borrowed securities within the customary time period for settlement of securities transactions.
Any cash collateral received is reinvested in a money market fund managed by SSB as disclosed in the Fund’s Schedule of Investments and is reflected in the Statements of Assets and Liabilities as a payable for collateral upon return of securities loaned. Non-cash collateral, in the form of securities issued or guaranteed by the U.S. government or its agencies or instrumentalities, is not disclosed in the Funds' Statements of Assets and Liabilities or the contractual maturity table below as it is held by the lending agent on behalf of the Funds, and the Funds do not have the ability to re-hypothecate these securities. Income earned by the Fund from securities lending activity is disclosed in the Statement of Operations.
The following is a summary of the Funds' securities lending agreement and related cash and non-cash collateral received as of November 30, 2023:
| | | Market Value of Securities on Loan | | | Cash Collateral Received | | | Non-Cash Collateral Received | | | Total Collateral Received | |
| ALPS | O'Shares U.S. Small-Cap Quality Dividend ETF | | $ | 459,768 | | | $ | 459,406 | | | $ | – | | | $ | 459,406 | |
| ALPS | O'Shares Global Internet Giants ETF | | $ | 1,852,377 | | | $ | 1,940,149 | | | $ | – | | | $ | 1,940,149 | |
ALPS ETF Trust
| Notes to Financial Statements | November 30, 2023 |
The risks of securities lending include the risk that the borrower may not provide additional collateral when required or may not return the securities when due. To mitigate these risks, the Funds benefit from a borrower default indemnity provided by SSB. SSB’s indemnity allows for full replacement of securities lent wherein SSB will purchase the unreturned loaned securities on the open market by applying the proceeds of the collateral, or to the extent such proceeds are insufficient or the collateral is unavailable, SSB will purchase the unreturned loan securities at SSB’s expense. However, the Funds could suffer a loss if the value of the investments purchased with cash collateral falls below the value of the cash collateral received.
The following table reflects a breakdown of transactions accounted for as secured borrowings, the gross obligation by the type of collateral pledged or securities loaned, and the remaining contractual maturity of those transactions as of November 30, 2023:
| ALPS | O'Shares U.S. Small-Cap Quality Dividend ETF | | Remaining contractual maturity of the agreements | |
| | | | |
| Securities Lending Transactions | | Overnight & Continuous | | | Up to 30 Days | | | 30-90 Days | | | Greater than 90 Days | | | Total | |
| Common Stocks | | $ | 459,406 | | | $ | – | | | $ | – | | | $ | – | | | $ | 459,406 | |
| Total Borrowings | | | | | | | | | | | | | | | | | | | 459,406 | |
| Gross amount of recognized liabilities for securities lending (collateral received) | | | $ | 459,406 | |
| ALPS | O'Shares Global Internet Giants ETF | | Remaining contractual maturity of the agreements | |
| | | | |
| Securities Lending Transactions | | Overnight & Continuous | | | Up to 30 Days | | | 30-90 Days | | | Greater than 90 Days | | | Total | |
| Common Stocks | | $ | 1,940,149 | | | $ | – | | | $ | – | | | $ | – | | | $ | 1,940,149 | |
| Total Borrowings | | | | | | | | | | | | | | | | | | | 1,940,149 | |
| Gross amount of recognized liabilities for securities lending (collateral received) | | | | $ | 1,940,149 | |
3. INVESTMENT ADVISORY FEE AND OTHER AFFILIATED TRANSACTIONS
ALPS Advisors, Inc. serves as the Funds’ investment adviser pursuant to an Investment Advisory Agreement with the Trust on behalf of each Fund (the “Advisory Agreement”). Pursuant to the Advisory Agreement, each Fund pays the Adviser an annual management fee for the services and facilities it provides, payable on a monthly basis as a percentage of the relevant Fund’s average daily net assets as set out below. From time to time, the Adviser may waive all or a portion of its fee.
| Fund | Advisory Fee | |
| ALPS | O’Shares U.S. Quality Dividend ETF | Average net assets up to and including $2 billion | 0.48% |
| | Average net assets greater than $2 billion up to and including $3 billion | 0.44% |
| | Average net assets greater than $3 billion up to and including $4 billion | 0.40% |
| | Average net assets greater than $4 billion up to and including $5 billion | 0.36% |
| | Average net assets greater than $5 billion | 0.32% |
| ALPS | O’Shares U.S. Small-Cap Quality Dividend ETF | Average net assets up to and including $2 billion | 0.48% |
| | Average net assets greater than $2 billion up to and including $3 billion | 0.44% |
| | Average net assets greater than $3 billion up to and including $4 billion | 0.40% |
| | Average net assets greater than $4 billion up to and including $5 billion | 0.36% |
| | Average net assets greater than $5 billion | 0.32% |
| ALPS | O’Shares Global Internet Giants ETF | | 0.48% |
| ALPS | O’Shares Europe Quality Dividend ETF | | 0.48% |
Out of the unitary management fee, the Adviser pays substantially all expenses of each Fund, including licensing fees to the Underlying Index provider, the cost of transfer agency, custody, fund administration, legal, audit, trustees and other services, except for interest expenses, distribution fees or expenses, brokerage expenses, taxes and extraordinary expenses not incurred in the ordinary course of each Fund’s business. The Adviser’s unitary management fee is designed to pay substantially all of each Fund’s expenses and to compensate the Adviser for providing services for each Fund.
Prior to June 17, 2022, O’Shares Investment Advisers, LLC (“OSI”) served as each predecessor fund’s investment adviser pursuant to an Investment Advisory Agreement with the Trust on behalf of each Fund (the “O’Shares Advisory Agreement”). Under the O’Shares Advisory Agreement, the Funds paid OSI a unitary management fee for its services payable on a monthly basis at an annual rate of 0.48%, based on the average daily net assets of each Fund. Under the O’Shares Advisory Agreement, OSI was responsible for all of the ordinary operating expenses of the Funds, except for (i) the management fee, (ii) payments under the Funds’ Rule 12b-1 plan, (iii) brokerage expenses (including any costs incidental to transactions in portfolio securities or instruments), (iv) acquired fund fees and expenses, (v) taxes, interest (including borrowing costs and dividend expenses on securities sold short and overdraft charges), litigation expenses (including litigation to which the Trust or a Fund may be a party and indemnification of the Trustees and officers with respect thereto) and (viii) other extraordinary or non-routine expenses.
ALPS ETF Trust
| Notes to Financial Statements | November 30, 2023 |
ALPS Fund Services, Inc., an affiliate of the Adviser, is the administrator of the Funds.
Effective July 1, 2023, each Trustee receives (1) a quarterly retainer of $25,000, (2) a per meeting fee of $15,000, (3) $2,500 for any special meeting held outside of a regularly scheduled board meeting, and (4) reimbursement for all reasonable out-of-pocket expenses relating to attendance at meetings. In addition, the Chairman of the Board receives a quarterly retainer of $5,000, the Chairman of the Audit Committee receives a quarterly retainer of $3,000, and the Chairman of the Nominating & Governance Committee receives a quarterly retainer of $2,000, each in connection with their respective roles. Prior to July 1, 2023, each Trustee received (1) a quarterly retainer of $20,000, (2) a per meeting fee of $10,000, (3) $2,500 for any special meeting held outside of a regularly scheduled board meeting, and (4) reimbursement for all reasonable out-of-pocket expenses relating to attendance at meetings. In addition, the Chairman of the Board received a quarterly retainer of $5,000, the Chairman of the Audit Committee received a quarterly retainer of $3,000, and the Chairman of the Nominating & Governance Committee received a quarterly retainer of $2,000, each in connection with their respective roles.
4. PURCHASES AND SALES OF SECURITIES
For the fiscal year ended November 30, 2023, the cost of purchases and proceeds from sales of investment securities, excluding short-term investments and in-kind transactions, were as follows:
| Fund | | Purchases | | | Sales | |
| ALPS | O'Shares U.S. Quality Dividend ETF | | $ | 232,021,022 | | | $ | 232,112,300 | |
| ALPS | O'Shares U.S. Small-Cap Quality Dividend ETF | | | 171,350,733 | | | | 171,867,222 | |
| ALPS | O'Shares Global Internet Giants ETF | | | 72,273,719 | | | | 72,898,266 | |
| ALPS | O'Shares Europe Quality Dividend ETF | | | 15,104,930 | | | | 15,094,841 | |
For the fiscal year ended November 30, 2023, the cost of in-kind purchases and proceeds from in-kind sales were as follows:
| Fund | | Purchases | | | Sales | |
| ALPS | O'Shares U.S. Quality Dividend ETF | | $ | 3,279,543 | | | $ | 109,936,301 | |
| ALPS | O'Shares U.S. Small-Cap Quality Dividend ETF | | | 240,958,605 | | | | 38,995,682 | |
| ALPS | O'Shares Global Internet Giants ETF | | | 761,127 | | | | 59,884,172 | |
| ALPS | O'Shares Europe Quality Dividend ETF | | | 3,875,344 | | | | 7,547,006 | |
For the fiscal year ended November 30, 2023, the in-kind net realized gains/(losses) were as follows:
| Fund | | Net Realized Gain/(Loss) | |
| ALPS | O'Shares U.S. Quality Dividend ETF | | $ | 25,816,662 | |
| ALPS | O'Shares U.S. Small-Cap Quality Dividend ETF | | | 8,820,674 | |
| ALPS | O'Shares Global Internet Giants ETF | | | (525,958 | ) |
| ALPS | O'Shares Europe Quality Dividend ETF | | | 715,868 | |
Gains on in-kind transactions are not considered taxable for federal income tax purposes and losses on in-kind transactions are also not deductible for tax purposes.
5. CAPITAL SHARE TRANSACTIONS
Shares are created and redeemed by each Fund only in Creation Unit size aggregations of 25,000 Shares. Only broker-dealers or large institutional investors with creation and redemption agreements called Authorized Participants (“AP”) are permitted to purchase or redeem Creation Units from the Funds. Such transactions are generally permitted on an in-kind basis, with a balancing cash component to equate the transaction to the NAV per unit of each Fund on the transaction date. Cash may be substituted equivalent to the value of certain securities generally when they are not available in sufficient quantity for delivery, not eligible for trading by the AP or as a result of other market circumstances.
ALPS ETF Trust
| Notes to Financial Statements | November 30, 2023 |
6. RELATED PARTY TRANSACTIONS
The Funds engaged in cross trades with other funds in the Trust during the fiscal year ended November 30, 2023 pursuant to Rule 17a-7 under the 1940 Act. Cross trading is the buying or selling of portfolio securities between funds to which the Adviser serves as the investment adviser. The Board previously adopted procedures that apply to transactions between the Funds of the Trust pursuant to Rule 17a-7. These transactions related to cross trades during the period complied with the requirements set forth by Rule 17a-7 and the Trust’s procedures.
Transactions related to cross trades during the year ended November 30, 2023, were as follows:
| Fund | | Purchase Cost Paid | | | Sale Proceeds Received | | | Realized Gain/(Loss) on Sales | |
| ALPS | O'Shares U.S. Quality Dividend ETF | | $ | 2,814,769 | | | $ | 3,392,830 | | | $ | (261,171 | ) |
| ALPS | O'Shares U.S. Small-Cap Quality Dividend ETF | | | 1,485,336 | | | | 8,076,597 | | | | 977,280 | |
| ALPS | O'Shares Global Internet Giants ETF | | | – | | | | 1,217,380 | | | | 558,467 | |
| ALPS | O'Shares Europe Quality Dividend ETF | | | 607,372 | | | | 632,509 | | | | 127,332 | |
7. MARKET RISK
The Funds are subject to investment and operational risks associated with financial, economic and other global market developments and disruptions, including those arising from war, terrorism, market manipulation, government interventions, defaults and shutdowns, political changes or diplomatic developments, public health emergencies (such as the spread of infectious diseases, pandemics and epidemics) and natural/environmental disasters, which can negatively impact the securities markets and cause each Fund to lose value. Securities in each Fund’s portfolio may underperform in comparison to securities in general financial markets, a particular financial market or other asset classes due to a number of factors, including inflation (or expectations for inflation), deflation (or expectations for deflation), interest rates, global demand for particular products or resources, market instability, debt crises and downgrades, embargoes, tariffs, sanctions and other trade barriers, regulatory events, other governmental trade or market control programs and related geopolitical events. In addition, the value of the Fund’s investments may be negatively affected by the occurrence of global events such as war, terrorism, environmental disasters, natural disasters or events, country instability, and infectious disease epidemics or pandemics.
8. FUND REORGANIZATIONS
On February 23, 2022, the Board of Trustees of OSI ETF Trust (the “OSI ETF Board”) approved an Agreement and Plan of Reorganization with the Trust (the “Plan”) to reorganize each Predecessor Fund listed below with and into its corresponding Acquiring Fund, each a newly created series of the Trust. Shareholders of the O’Shares U.S. Quality Dividend ETF and O’Shares U.S. Small-Cap Quality Dividend ETF approved the Plan on May 18, 2022. Shareholders of the O’Shares Global Internet Giants ETF approved the Plan on June 15, 2022 and shareholders of the O’Shares Europe Quality Dividend ETF approved the Plan on June 8, 2022. The Trust acquired all of the assets of the corresponding Predecessor Funds, each a series of OSI ETF Trust, in exchange for shares of the Acquiring Fund and the assumption by the Acquiring Fund of the liabilities of the Predecessor Fund (the “Reorganizations”). The Reorganizations were completed after the close of business on June 17, 2022 in a tax-free exchange in which each shareholder of the Acquiring Funds received the same aggregate share and net asset value.
| Acquiring Fund | Predecessor Fund |
| ALPS | O’Shares U.S. Quality Dividend ETF | O’Shares U.S. Quality Dividend ETF |
| ALPS | O’Shares U.S. Small-Cap Quality Dividend ETF | O’Shares U.S. Small-Cap Quality Dividend ETF |
| ALPS | O’Shares Global Internet Giants ETF | O’Shares Global Internet Giants ETF |
| ALPS | O’Shares Europe Quality Dividend ETF | O’Shares Europe Quality Dividend ETF |
At the time of the reorganizations, each Acquiring Fund had the same ticker symbol and underlying index as its respective Predecessor Fund, was managed in accordance with the same investment objective and was subject to substantially the same investment strategies, policies and risks as the Predecessor Fund. Each Acquiring Fund is the accounting successor of the corresponding Predecessor Fund and assumed the performance and accounting history of the Predecessor Fund. As a result, the financial statements and financial highlights reflect the operations of the Predecessor Funds for periods prior to June 17, 2022.
Prior to the Reorganizations, the Acquiring Funds did not have any assets or liabilities. For financial reporting purposes, assets received and shares issued by the Acquiring Funds were recorded at fair value; however, the cost basis of the investments received from the Predecessor Funds were carried forward to align ongoing reporting of the Acquiring Funds realized and unrealized gains and losses with amounts distributable to shareholders for tax purposes.
ALPS ETF Trust
| Notes to Financial Statements | November 30, 2023 |
9. REGULATORY UPDATE
The U.S. Securities and Exchange Commission ("SEC") adopted rule and form amendments that will change the format and content of the Funds' annual and semi-annual reports. Certain information, including the financial statements, will not appear in the Funds' new tailored shareholder reports but will be available online, delivered free of charge upon request, and filed on a semi-annual basis on Form N-CSR. The rule and form amendments have a compliance date of July 24, 2024. At this time, the Trust is evaluating the impact of these rule and form amendment changes.
10. SUBSEQUENT EVENTS
Subsequent events, if any, after the date of the Statements of Assets and Liabilities have been evaluated through the date the financial statements were issued. Management has determined that there were no subsequent events to report through the issuance of these financial statements.
ALPS ETF Trust
| Additional Information | November 30, 2023 (Unaudited) |
PROXY VOTING RECORDS, POLICIES AND PROCEDURES
Information regarding how each Fund voted proxies relating to portfolio securities during the most recent 12-month period ended June 30 and a description of the Fund’s proxy voting policies and procedures used in determining how to vote for proxies are available without charge on the SEC’s website at www.sec.gov and upon request, by calling (toll-free) 1-866-759-5679.
PORTFOLIO HOLDINGS
Each Fund files a complete schedule of portfolio holdings with the U.S. Securities and Exchange Commission (“SEC”) for the first and third quarters of each fiscal year on Form N-PORT within 60 days after the end of the period. Copies of each Fund’s Form N-PORT are available without a charge, upon request, by contacting the Fund at 1-866-759-5679 and on the SEC’s website at https://www.sec.gov.
TAX INFORMATION
The Funds designate the following as a percentage of taxable ordinary income distributions, or up to the maximum amount allowable, for the calendar year ended December 31, 2022:
| | Qualified Dividend Income | Dividend Received Deduction |
| ALPS | O’Shares U.S. Quality Dividend ETF | 100% | 100% |
| ALPS | O’Shares U.S. Small-Cap Quality Dividend ETF | 100% | 100% |
| ALPS | O’Shares Global Internet Giants ETF | 0% | 0% |
| ALPS | O’Shares Europe Quality Dividend ETF | 100% | 0% |
In early 2023, if applicable, shareholders of record received this information for the distributions paid to them by the Funds during the calendar year 2022 via Form 1099. The Funds will notify shareholders in early 2024 of amounts paid to them by the Funds, if any, during the calendar year 2023.
Pursuant to Section 853 (C ) of the Internal Revenue Code, the following funds designated the following for the calendar year end December 31, 2023:
| | | Foreign Taxes Paid | | | Foreign Source Income | |
| ALPS | O'Shares Europe Quality Dividend ETF | | $ | 145,430 | | | $ | 1,311,246 | |
LICENSING AGREEMENTS
O’Shares Investment Advisers, LLC ( “O’Shares”) has entered into an index licensing agreement with ALPS Advisors Inc. (the “Adviser”) with respect to each of ALPS | O’Shares U.S. Quality Dividend ETF, ALPS | O’Shares U.S. Small-Cap Quality Dividend ETF, ALPS | O’Shares Global Internet Giants ETF, and ALPS | O’Shares Europe Quality Dividend ETF (each, a “Fund”), to allow the Adviser’s use of the O'Shares U.S. Quality Dividend Index, the O'Shares U.S. Small-Cap Quality Dividend Index, the O'Shares Global Internet Giants Index, and the O'Shares Europe Quality Dividend Index (each, an “Underlying Index”). The following disclosure relates to O’Shares.
The Funds are not sponsored, endorsed, sold or promoted by O’Shares or its third party licensors. Neither O’Shares nor its third party licensors make any representation or warranty, express or implied, to shareholders of a Fund or any member of the public regarding the advisability of investing in securities generally or in a Fund particularly or the ability of the Underlying Index to track general stock market performance. O’Shares’ and its third party licensor’s only relationship to the Adviser and each Fund is the licensing of certain trademarks, service marks and trade names of O’Shares and/or its third party licensors and for the providing the Underlying Index. Neither O’Shares nor its third party licensors is responsible for and has not participated in the determination of the prices and amount of a Fund or the timing of the issuance or sale of a Fund or in the determination or calculation of the equation by which a Fund is to be converted into cash. O’Shares has no obligation or liability in connection with the administration, marketing or trading of the Funds.
NEITHER O’SHARES, ITS AFFILIATES NOR THEIR THIRD PARTY LICENSORS GUARANTEE THE ADEQUACY, ACCURACY, TIMELINESS OR COMPLETENESS OF THE INDEX OR ANY DATA INCLUDED THEREIN OR ANY COMMUNICATIONS, INCLUDING BUT NOT LIMITED TO, ORAL OR WRITTEN COMMUNICATIONS (INCLUDING ELECTRONIC COMMUNICATIONS) WITH RESPECT THERETO. O’SHARES, ITS AFFILIATES AND THEIR THIRD PARTY LICENSORS SHALL NOT BE SUBJECT TO ANY DAMAGES OR LIABILITY FOR ANY ERRORS, OMISSIONS OR DELAYS THEREIN. O’SHARES MAKES NO EXPRESS OR IMPLIED WARRANTIES, AND EXPRESSLY DISCLAIMS ALL WARRANTIES OF MERCHANTABILITY OR FITNESS FOR A PARTICULAR PURPOSE OR USE WITH RESPECT TO ITS TRADEMARKS, THE INDEX OR ANY DATA INCLUDED THEREIN. WITHOUT LIMITING ANY OF THE FOREGOING, IN NO EVENT WHATSOEVER SHALL O’SHARES, ITS AFFILIATES OR THEIR THIRD PARTY LICENSORS BE LIABLE FOR ANY INDIRECT, SPECIAL, INCIDENTAL, PUNITIVE OR CONSEQUENTIAL DAMAGES, INCLUDING BUT NOT LIMITED TO, LOSS OF PROFITS, TRADING LOSSES, LOST TIME OR GOODWILL, EVEN IF THEY HAVE BEEN ADVISED OF THE POSSIBILITY OF SUCH DAMAGES, WHETHER IN CONTRACT, TORT, STRICT LIABILITY OR OTHERWISE.
ALPS ETF Trust
| Additional Information | November 30, 2023 (Unaudited) |
O’Shares Investments is a registered trademark and registered service mark of O’Shares Investment, Inc. and has been licensed for use by the Adviser and the Funds.
The Funds are not sponsored, endorsed, sold or promoted by O’Shares, its affiliates or their third party licensors, and neither O’Shares, its affiliates nor its third party licensors make any representation regarding the advisability of investing in the Funds.
O’Shares has entered into an agreement with S-Network Global Indexes Inc. (“S-Network”), pursuant to which S-Network calculates each Underlying Index. The following disclosure relates to O’Shares.
The Funds are not sponsored, endorsed, sold or promoted by or its third party licensors. Neither S-Network nor its third party licensors make any representation or warranty, express or implied, to the owners of a Fund or any member of the public regarding the advisability of investing in securities generally or in a Fund particularly or the ability of the Underlying Index to track general stock market performance. S-Network's and its third party licensor’s only relationship to the Adviser is the licensing of certain trademarks, service marks and trade names of S-Network Global Indexes, Inc. and/or its third party licensors and for the providing of calculation and maintenance services related to the Underlying Index. Neither S-Network nor its third party licensors is responsible for and has not participated in the determination of the prices and amount of a Fund or the timing of the issuance or sale of a Fund or in the determination or calculation of the equation by which a Fund is to be converted into cash. S-Network has no obligation or liability in connection with the administration, marketing or trading of the Funds.
NEITHER S-NETWORK GLOBAL INDEXES, INC. (“S-Network”), ITS AFFILIATES NOR THEIR THIRD PARTY LICENSORS GUARANTEE THE ADEQUACY, ACCURACY, TIMELINESS OR COMPLETENESS OF THE CUSTOM INDEX OR ANY DATA INCLUDED THEREIN OR ANY COMMUNICATIONS, INCLUDING BUT NOT LIMITED TO, ORAL OR WRITTEN COMMUNICATIONS (INCLUDING ELECTRONIC COMMUNICATIONS) WITH RESPECT THERETO. S-NETWORK, ITS AFFILIATES AND THEIR THIRD PARTY LICENSORS SHALL NOT BE SUBJECT TO ANY DAMAGES OR LIABILITY FOR ANY ERRORS, OMISSIONS OR DELAYS THEREIN. S-NETWORK MAKES NO EXPRESS OR IMPLIED WARRANTIES, AND EXPRESSLY DISCLAIMS ALL WARRANTIES OF MERCHANTABILITY OR FITNESS FOR A PARTICULAR PURPOSE OR USE WITH RESPECT TO ITS TRADEMARKS, THE CUSTOM INDEX OR ANY DATA INCLUDED THEREIN. WITHOUT LIMITING ANY OF THE FOREGOING, IN NO EVENT WHATSOEVER SHALL S-NETWORK, ITS AFFILIATES OR THEIR THIRD PARTY LICENSORS BE LIABLE FOR ANY INDIRECT, SPECIAL, INCIDENTAL, PUNITIVE OR CONSEQUENTIAL DAMAGES, INCLUDING BUT NOT LIMITED TO, LOSS OF PROFITS, TRADING LOSSES, LOST TIME OR GOODWILL, EVEN IF THEY HAVE BEEN ADVISED OF THE POSSIBILITY OF SUCH DAMAGES, WHETHER IN CONTRACT, TORT, STRICT LIABILITY OR OTHERWISE.
S-Network Global Indexes, Inc.SM, and SNGISM are registered trademarks and registered service marks of S-Network Global Indexes, Inc. “Calculated by S-Network Global Indexes, Inc.” and its related stylized mark are service marks of S-Network Global Indexes, Inc.SM, and have been licensed for use by the Adviser.
The Funds are not sponsored, endorsed, sold or promoted by SNGI, its affiliates or their third party licensors and neither SNGI, its affiliates nor their its third party licensors make any representation regarding the advisability of investing in a Fund.
ALPS ETF Trust
Board Considerations Regarding Approval of Investment Advisory Agreement | November 30, 2023 (Unaudited) |
At its meetings held on June 5, 2023 and June 20, 2023, the Board of Trustees of the Trust (the “Board” or the “Trustees”), where each Trustee is not an “interested person” of the Trust within the meaning of the Investment Company Act of 1940, as amended (the “Independent Trustees”), evaluated a proposal to approve the continuance of the Investment Advisory Agreement between the Trust and ALPS Advisors, Inc. (the “Adviser” or “AAI”) with respect to the ALPS | O’Shares U.S. Quality Dividend ETF (“OUSA”), ALPS | O’Shares U.S. Small-Cap Quality Dividend ETF (“OUSM”), ALPS | O’Shares Global Internet Giants ETF (“OGIG”), ALPS | O’Shares Europe Quality Dividend ETF (“OEUR”) (each a “Fund” and collectively “the Funds”). In evaluating the renewal of the Investment Advisory Agreement with respect to the Funds, the Board, including the Independent Trustees, considered various factors, including (i) the nature, extent and quality of the services provided by AAI with respect to the applicable Fund under the Investment Advisory Agreement; (ii) the advisory fees and other expenses paid by the Funds compared to those of similar funds managed by other investment advisers; (iii) the costs of the services provided to the Funds by AAI and the profits realized by AAI and its affiliates from its relationship to the Funds; (iv) the extent to which economies of scale have been or would be realized if and as the assets of the Funds grow and whether fees reflect the economies of scale for the benefit of shareholders; and (v) any additional benefits and other considerations.
With respect to the nature, extent and quality of the services provided by AAI under the Investment Advisory Agreement, the Board considered and reviewed information concerning the services provided under the Investment Advisory Agreement, the investment parameters of the index of each Fund, financial information regarding AAI and its parent company, information describing AAI’s current organization and the background and experience of the persons responsible for the day-to-day management of the Funds.
The Board reviewed information on the performance of each Fund and its applicable benchmark for the 1-, 3-, and 5-year periods, as applicable. The Board also evaluated the correlation and tracking error between each underlying index and its corresponding Fund’s performance. Based on this review, the Board, including the Independent Trustees found that the nature and extent of services provided to each Fund under the Investment Advisory Agreement was appropriate and that the quality of such services was satisfactory.
The Board noted that the advisory fees for each Fund were unitary fees pursuant to which AAI assumes all expenses of the Funds (including the cost of transfer agency, custody, fund administration, legal, audit and other services) other than the payments under the Advisory Agreement, brokerage expenses, taxes, interest, litigation expenses and other extraordinary expenses.
Based on the information available to them, including the Fund-specific summaries set forth below, the Board, including the Independent Trustees, concluded that the advisory fee rate for each of the Funds was reasonable under the circumstances and in light of the quality of the services provided.
The Board, including the Independent Trustees, considered other benefits available to AAI because of its relationship with the Funds and concluded that the advisory fees were reasonable taking into account any such benefits.
The Board, including the Independent Trustees, also considered with respect to each Fund the information provided by AAI about the costs and profitability of AAI with respect to each of the Funds, including the asset levels and other factors that influence the profitability and financial viability of the Funds. The Board, including the Independent Trustees, reviewed and noted the relatively small sizes of the Funds (other than OUSA) and the analysis AAI had conducted to support AAI’s assertion that it was not realizing any economies of scale with respect to such Funds. The Independent Trustees determined that AAI should continue to keep the Board informed on an ongoing basis of any significant developments (e.g., material increases in asset levels) so as to facilitate the Independent Trustees’ evaluation of whether further economies of scale have been achieved.
The Board, including the Independent Trustees, also considered other potential benefits available to AAI because of its relationship with the Funds, known as fall-out benefits.
ALPS ETF Trust
Board Considerations Regarding Approval of Investment Advisory Agreement | November 30, 2023 (Unaudited) |
With respect to each Fund, the Board, including the Independent Trustees, noted the following:
The gross management fee rate for OEUR is lower than the median of its FUSE expense group. OEUR’s net expense ratio is lower than the median of its FUSE expense group.
The Board, including the Independent Trustees, reviewed and noted the relatively small size of OEUR and the analysis AAI had conducted to support AAI’s assertion that it was not realizing any economies of scale with respect to OEUR.
The gross management fee rate for OGIG is lower than the median of its FUSE expense group. OGIG’s net expense ratio is lower than the median of its FUSE expense group.
The Board, including the Independent Trustees, reviewed and noted the relatively small size of OGIG and the analysis AAI had conducted to support AAI’s assertion that it was not realizing any economies of scale with respect to OGIG.
The gross management fee rate for OUSA is higher than the median of its FUSE expense group. OUSA’s net expense ratio is higher than the median of its FUSE expense group.
The Board took into account, among other things, the unique features and performance of OUSA’s underlying index, the management fee breakpoints for OUSA, and the costs and benefits of linkage to the O’Shares name.
With respect to AAI profitability from OUSA, the Independent Trustees noted that OUSA’s asset levels have not recovered to their historic high, and OUSA has breakpoints in its management fee.
The gross management fee rate for OUSM is higher than the median of its FUSE expense group. OUSM’s net expense ratio is higher than the median of its FUSE expense group.
The Board took into account, among other things, the unique features and performance of OUSM’s underlying index, the management fee breakpoints for OUSM, and the costs and benefits of linkage to the O’Shares name.
The Board, including the Independent Trustees, reviewed and noted the relatively small size of OUSM and the analysis AAI had conducted to support AAI’s assertion that it was not realizing any economies of scale with respect to OUSM.
In voting to renew the Investment Advisory Agreement with AAI, the Board, including the Independent Trustees, concluded that the terms of the Investment Advisory Agreement are reasonable and fair in light of the services to be performed, the fees paid by certain other funds, expenses to be incurred and such other matters as the members of the Board, including the Independent Trustees, considered relevant in the exercise of their reasonable business judgment. The Independent Trustees did not identify any single factor or group of factors as all important or controlling and considered all factors together.
ALPS ETF Trust
| Trustees & Officers | November 30, 2023 (Unaudited) |
The general supervision of the duties performed by the Adviser for the Fund under the Investment Advisory Agreement is the responsibility of the Board of Trustees. The Trust currently has four Trustees, each of whom have no affiliation or business connection with the Adviser or any of its affiliated persons and do not own any stock or other securities issued by the Adviser. These are the “non-interested” or “independent” Trustees (“Independent Trustees”).
The Independent Trustees of the Trust, their term of office and length of time served, their principal business occupations during the past five years, the number of portfolios in the Fund Complex overseen by each Independent Trustee, and other directorships, if any, held by the Trustee are shown below.
INDEPENDENT TRUSTEES
Name, Address and Year of Birth of Officer* | Position(s) Held with Trust | Length of Time Served** | Principal Occupation(s) During Past 5 Years | Number of Portfolios in Fund Complex Overseen by Trustees*** | Other Directorships Held by Trustees |
| Mary K. Anstine, 1940 | Trustee | Since March 2008 | Ms. Anstine is Trustee/Director of AV Hunter Trust and Colorado Uplift Board. | 38 | Ms. Anstine is a Trustee of ALPS Variable Investment Trust (7 funds); Financial Investors Trust (29 funds); and Reaves Utility Income Fund. |
| Jeremy W. Deems, 1976 | Trustee | Since March 2008 | Mr. Deems is the Co-Founder and Chief Financial Officer of Green Alpha Advisors, LLC, a registered investment advisor, and Co- Portfolio Manager of the AXS Green Alpha ETF. | 38 | Mr. Deems is a Trustee of ALPS Variable Investment Trust (7 funds); Financial Investors Trust (29 funds); and Reaves Utility Income Fund; and Clough Funds Trust (1 fund). |
| Rick A. Pederson, 1952 | Trustee | Since March 2008 | Mr. Pederson is Partner, Bow River Capital Partners (private equity management), 2003 - present; Board Member, Prosci Inc. (private business services) 2013-2016; Advisory Board Member, Citywide Banks (Colorado community bank) 2014- 2017; Board Member, Strong- Bridge Consulting, 2015-2019; Board Member, IRI/ODMS Holdings LLC, 2017 – 2019; Director, National Western Stock Show (not for profit) 2010 - present; Director, History Colorado (not for profit) 2015- present; Director, Citywide Bank Advisory Board 2017-present; Trustee, Boettcher Foundation, 2018 -present. | 24 | Mr. Pederson is Trustee of Segall Bryant & Hamill Trust (14 funds) and Principal Real Estate Income Fund (1 fund). |
| * | The business address of the Trustee is c/o ALPS Advisors, Inc., 1290 Broadway, Suite 1000, Denver, Colorado 80203. |
| ** | This is the period for which the Trustee began serving the Trust. Each Trustee serves an indefinite term, until his or her successor is elected. |
| *** | The Fund Complex includes all series of the Trust and any other investment companies for which ALPS Advisors, Inc. provides investment advisory services. |
ALPS ETF Trust
| Trustees & Officers | November 30, 2023 (Unaudited) |
Name, Address and Year of Birth of Officer* | Position(s) Held with Trust | Length of Time Served** | Principal Occupation(s) During Past 5 Years | Number of Portfolios in Fund Complex Overseen by Trustees*** | Other Directorships Held by Trustees |
| Edmund J. Burke, 1961 | Trustee | Since December 2017 | Mr. Burke joined ALPS in 1991 and served as the President and Director of ALPS Holdings, Inc., and ALPS Advisors, Inc., and Director of ALPS Distributors, Inc., ALPS Fund Services, Inc. (“ALPS”), and ALPS Portfolio Solutions Distributor, Inc. (collectively, the “ALPS Companies”). Mr. Burke retired from the ALPS Companies in June 2019. Mr. Burke is currently a partner at ETF Action, a web-based system that provides data and analytics to registered investment advisers, (since 2020) and a Director of Alliance Bioenergy Plus, Inc., a technology company focused on emerging technologies in the renewable energy, biofuels, and bioplastics technology sectors (since 2020). | 33 | Mr. Burke is a Trustee of Clough Global Dividend and Income Fund (1 fund); Clough Global Equity Fund (1 fund); Clough Global Opportunities Fund (1 fund); Clough Funds Trust (1 fund); Liberty All-Star Equity Fund (1 fund); Director of the Liberty All-Star Growth Fund, Inc. (1 fund) and Financial Investors Trust (29 funds). |
| * | The business address of the Trustee is c/o ALPS Advisors, Inc., 1290 Broadway, Suite 1000, Denver, Colorado 80203. |
| ** | This is the period for which the Trustee began serving the Trust. Each Trustee serves an indefinite term, until his or her successor is elected. |
| *** | The Fund Complex includes all series of the Trust and any other investment companies for which ALPS Advisors, Inc. provides investment advisory services. |
ALPS ETF Trust
| Trustees & Officers | November 30, 2023 (Unaudited) |
OFFICERS:
Name, Address and Year of Birth of Officer* | Position(s) Held with Trust | Length of Time Served** | Principal Occupation(s) During Past 5 Years |
Laton Spahr, 1975 | President | Since June 2021 | Mr. Spahr joined ALPS in 2019 and currently serves as President and Portfolio Manager of AAI. Prior to his current role, Mr. Spahr was a Senior Vice President and Strategy Leader of the Value & Income Team for Oppenheimer Funds from 2013 to 2019. |
Matthew Sutula, 1985 | Chief Compliance Officer ("CCO") | Since December 2019 | Mr. Sutula joined ALPS in 2012 and currently serves as Chief Compliance Officer of AAI. Prior to his current role, Mr. Sutula served as interim Compliance Officer of the Trust (September 2019 to December 2019). Compliance Manager and Senior Compliance Analyst for AAI, as well as Compliance Analyst for AFS. Prior to joining ALPS, he spent seven years at Morningstar, Inc. in various analyst roles supporting the registered investment company databases. Mr. Sutula is also Chief Compliance Officer of Principal Real Estate Income Fund, ALPS Variable Investment Trust, Liberty All-Star Equity Fund and Liberty All-Star Growth Fund, Inc. From September 2019 to September 2022 he served as Chief Compliance Officer of RiverNorth Opportunities Fund, Inc. |
Erich Rettinger, 1985 | Treasurer | Since September 2023 | Mr. Rettinger is Vice President of AAI (since 2021) and serves as Treasurer of Principal Real Estate Income Fund, Liberty All- Star Equity Fund, Liberty All-Star Growth Fund, Inc., and ALPS Variable Investment Trust. From December 2021 to October 2022 he also served as Treasurer of RiverNorth Opportunities Fund, Inc. Because of his position with AAI, Mr. Rettinger is deemed an affiliate of the Fund as defined under the 1940 Act. From 2013- 2021, he served as Vice President and Fund Controller of ALPS Fund Services. |
Michael P. Lawlor, 1969 | Secretary | Since December 2022 | Mr. Lawlor joined ALPS in January 2022, and is currently Vice President and Principal Legal Counsel. Prior to joining ALPS, Mr. Lawlor was Lead Fund Counsel at Brighthouse Financial (insurance company) (January 2007-April 2021). Mr. Lawlor also serves as Secretary of Financial Investors Trust and ALPS Variable Investment Trust. |
Susan M. Cannon, 1974 | Assistant Secretary | Since May 2023 | Ms. Cannon joined ALPS in September 2022, and is currently a Senior Paralegal of ALPS Fund Services, Inc. Prior to joining ALPS, Ms. Cannon worked for World Premier Private Partnership, Brown Brothers Harriman & Co. |
| * | The business address of each Officer is c/o ALPS Advisors, Inc., 1290 Broadway, Suite 1000, Denver, Colorado 80203. Each Officer is deemed an affiliate of the Trust as defined under the 1940 Act. |
| ** | This is the period for which the Officer began serving the Trust. Each Officer serves an indefinite term, until his or her successor is elected. |
The Statement of Additional Information includes additional information about the Funds' Trustees and is available, without charge, upon request by calling (toll-free) 1-866-759-5679.


Table of Contents
| Performance Overview | 1 |
| Disclosure of Fund Expenses | 6 |
| Report of Independent Registered Public Accounting Firm | 7 |
| Financial Statements | |
| Schedule of Investments | 8 |
| Statement of Assets and Liabilities | 13 |
| Statement of Operations | 14 |
| Statements of Changes in Net Assets | 15 |
| Financial Highlights | 16 |
| Notes to Financial Statements | 17 |
| Additional Information | 23 |
| Board Considerations Regarding Approval of Investment Advisory Agreement | 25 |
| Trustees & Officers | 27 |
alpsfunds.com
Barron’s 400SM ETF
| Performance Overview | November 30, 2023 (Unaudited) |
Investment Objective
The Barron’s 400SM ETF (the “Fund” or “BFOR”) seeks investment results that correspond generally, before fees and expenses, to the performance of the Barron’s 400 IndexSM (the “Underlying Index” or “B400T”). The Underlying Index is a rules-based index intended to give investors a means of tracking the overall performance of high performing equity securities of U.S. companies. The Fund will invest at least 80% of its total assets in the equity securities which comprise the Underlying Index.
The Underlying Index generally consists of 400 stocks. The Underlying Index’s stocks are constituents of the MarketGrader U.S. Coverage Universe. In compiling the Underlying Index, MarketGrader Capital, LLC (the “Index Provider”) selects the 400 stocks from MarketGrader's U.S. Coverage Universe by using a methodology that selects components based on the strength of their fundamentals in growth, value, profitability and cash flow and then screens such potential Underlying Index components for certain criteria regarding concentration, market capitalization and liquidity. The eligible stocks that are selected for inclusion in the Underlying Index’s portfolio are equally weighted. The Underlying Index is rebalanced by the Index Provider semiannually, on the third Friday of March and September each year.
Performance Overview
BFOR’s benchmark, the Barron’s 400 IndexSM (B400T), gained 2.2% for the year, trailing the Dow Jones U.S. Total Stock Market Index by 10.4%. The performance of the B400T was much closer to that of the Russell Midcap Index, which Morningstar lists as BFOR’s benchmark and which gained 2.9% for the year ended November 30, 2023. Figure 1 shows how BFOR and B400T performed during the year ended November 30, 2023 in comparison to earlier years, dating back to the Fund’s inception in 2013
Figure 1. Fiscal Year Returns for the Barron’s 400SM ETF (BFOR) and its benchmark, the Barron’s 400 IndexSM (B400T) since Inception on June 3, 2013.
| Fiscal Year | Barron’s 400SM ETF (BFOR) | Barron’s 400 IndexSM (B400T) |
| 2013* | 17.2% | 18.4% |
| 2014 | 8.1% | 9.0% |
| 2015 | 1.0% | 1.8% |
| 2016 | 9.1% | 9.9% |
| 2017 | 21.9% | 22.6% |
| 2018 | -2.1% | -1.5% |
| 2019 | 5.0% | 5.6% |
| 2020 | 13.3% | 14.1% |
| 2021 | 33.2% | 34.1% |
| 2022 | -6.2% | -5.5% |
| 2023 | 1.7% | 2.2% |
| * | Fiscal year 2013 is measured from the Fund’s inception on June 3, 2013, through November 30, 2013. BFOR returns are based on the Fund’s last market price at each fiscal year’s end date. B400T figures reflect total returns. Source: FactSet. |
Growth and Value Factors Reverse Roles Once Again
Readers might recall how during BFOR’s previous fiscal year, which ended on November 30, 2022, value stocks staged a strong comeback from years of underperformance to beat growth stocks by a wide margin. More specifically, during the Fund's previous fiscal year, the Russell 3000 Value Index outperformed the Russell 3000 Growth Index by 23%. B400T, meanwhile, outperformed the Russell 3000 Growth Index by 16% thanks to its equally weighted methodology, which prevented it from overweighting the large cap growth names in its roster, thus avoiding the overconcentration that afflicted most market cap weighted indexes in 2022.
During the Fund's fiscal year ended November 30, 2023, roles reversed, and growth stocks once again outperformed value stocks by almost the same margin by which they had underperformed the previous year. In fact, the Russell 3000 Growth Index gained 24.6% during the 12 months ended on November 30, 2023, 23.6% ahead of the Russell 3000 Value Index. Figure 2 illustrates the role reversal for the style factors in U.S. equities in the 12 months ended on November 30, 2023 compared to the year-earlier period.
1 | November 30, 2023
Barron’s 400SM ETF
| Performance Overview | November 30, 2023 (Unaudited) |
Figure 2. Comparison of Annual Total Returns for U.S. Broad Market and Style Benchmarks During BFOR’s Fiscal Years 2022 and 2023
| | Fiscal Year 2023 Return (Nov. 30, 2022 – Nov. 30, 2023) | Fiscal Year 2022 Return (Nov. 30, 2021 – Nov. 30, 2022) |
| Barron’s 400SM ETF (BFOR) | +1.7% | -6.2% |
| Barron’s 400 IndexSM (B400T) | +2.2% | -5.5% |
| Dow Jones US Total Stock Market Index | +12.6% | -11.3% |
| S&P 500 Index | +13.8% | -9.2% |
| Russell Midcap Index | +2.9% | -9.0% |
| Russell 3000 Index | +12.6% | -10.8% |
| Russell 3000 Growth Index | +24.6% | -21.6% |
| Russell 3000 Value Index | +1.0% | +1.9% |
All Index figures reflect total returns, while BFOR returns are based on the Fund’s last market price at each fiscal year’s end date. Source: FactSet.
A Closer Look at How the Barron’s 400 IndexSM's Constituents Did Across the Index’s Holding Periods
The B400T tracks 400 companies that are selected based on the quality of their GARP rating, as calculated by MarketGrader. However, over the course of BFOR’s fiscal year, which runs from November 30th of one year to November 30th of the following year, both B400T and the Fund hold three different sets of 400 companies, given that B400T is reconstituted and rebalanced every March and September. The first portfolio of 400 companies is the one with which it starts the fiscal year (which was reconstituted in September of the previous fiscal year), and this is held through the March rebalance. When the B400T is reconstituted in March, this essentially determines the second portfolio of 400 companies that BFOR holds. Finally, when B400T reconstituted in September of the most recently completed fiscal year, the third portfolio of Barron’s 400 companies that BFOR holds is determined. Each portfolio of companies is not, of course, completely different from the others as there is overlap across all three, as illustrated below.
During the fiscal year ended November 30, 2023, B400T and BFOR held a total of 708 positions, all of which had an average price return of 0.4% during the period they were held by B400T and the Fund. However, to better understand how B400T and BFOR performed during the Fund’s 2023 fiscal year, it helps to understand how the underlying constituents performed during their individual holding periods. This is illustrated in Figure 3. The worst performing companies during fiscal year 2023 were those held exclusively by the Fund during B400T's first holding period, based on the selections from September 2022. Between November 30, 2022 (the end of BFOR’s prior fiscal year) and March 17, 2023 (the last day of B400T's six-month rebalance period), B400T held 152 positions that it did not hold during any other period. These stocks had an average price return of -16.3%. The best performing stocks during fiscal year 2023 were the 149 constituents that B400T has maintained throughout the entire holding period dating back to the September 2022 selection, which had an average price return of 16.8%.
Figure 3. Average Price Returns of Members of the Barron’s 400 IndexSM by Unique Holding Period During Fiscal Year 2023
| Holding Period | # of Companies | Avg. Price Return (During FY 2023) |
| Sept. 2022 to March 2023 Only | 152 | -16.3% |
| Sept. 2022 to Sept. 2023 Only | 99 | -6.2% |
| Sept. 2022 to Present Only (in current portfolio) | 149 | 16.8% |
| March 2023 to Sept. 2023 | 59 | -3.2% |
| March 2023 to Present | 92 | 11.7% |
| Sept. 2023 to Present | 157 | -0.2% |
| Total Holdings from Sept. 2022 to Present | 708 | 0.4% |
All figures represent price-only returns. Source: FactSet.
Lastly, Figure 4 shows the 30 best performing stocks in B400T during fiscal year 2023 across all holding periods. The three sectors with the highest number of companies represented in this list were Technology, with nine companies, including the top two performers, Super Micro Computer, Inc. (SMCI) and Meta Platforms (META), and Consumer Discretionary and Industrials, with eight companies each. Energy and Health Care were represented by two companies each within the year’s top 30 performers.
2 | November 30, 2023
Barron’s 400SM ETF
| Performance Overview | November 30, 2023 (Unaudited) |
Figure 4. Top 30 Performing Stocks in the Barron’s 400 IndexSM During Fiscal Year 2023
| Symbol | Company Name | Market Cap (in USD Millions) | Sector | Start Date | End Date | Return (%) |
| SMCI | Super Micro Computer, Inc. | 4,572 | Technology | 3/20/23 | 3/15/24 | 177.6 |
| META | Meta Platforms Inc. Class A | 419,332 | Technology | 9/19/22 | 3/15/24 | 177.0 |
| BLDR | Builders FirstSource, Inc. | 9,206 | Consumer Discretionary | 9/19/22 | 3/15/24 | 109.8 |
| LPG | Dorian LPG Ltd. | 738 | Industrials | 3/20/23 | 3/15/24 | 106.7 |
| PHM | PulteGroup, Inc. | 9,417 | Consumer Discretionary | 9/19/22 | 3/15/24 | 97.5 |
| BLD | TopBuild Corp. | 5,928 | Industrials | 9/19/22 | 3/15/24 | 92.0 |
| AMPH | Amphastar Pharmaceuticals, Inc. | 1,124 | Health Care | 9/19/22 | 3/15/24 | 91.0 |
| SSD | Simpson Manufacturing Co., Inc. | 4,047 | Industrials | 9/19/22 | 3/15/24 | 79.4 |
| GRBK | Green Brick Partners, Inc. | 1,085 | Consumer Discretionary | 9/19/22 | 9/15/23 | 77.8 |
| MHO | M/I Homes, Inc. | 1,504 | Consumer Discretionary | 3/20/23 | 3/15/24 | 77.6 |
| IBP | Installed Building Products, Inc. | 2,164 | Industrials | 9/19/22 | 3/15/24 | 77.2 |
| ADBE | Adobe Incorporated | 174,281 | Technology | 9/19/22 | 3/15/24 | 77.1 |
| AVGO | Broadcom Inc. | 199,729 | Technology | 9/19/22 | 3/15/24 | 68.0 |
| WST | West Pharmaceutical Services, Inc. | 21,820 | Health Care | 9/19/22 | 9/15/23 | 68.0 |
| DECK | Deckers Outdoor Corporation | 8,515 | Consumer Discretionary | 9/19/22 | 3/15/24 | 66.5 |
| CNM | Core & Main, Inc. Class A | 1,674 | Industrials | 3/20/23 | 3/15/24 | 65.8 |
| BELFB | Bel Fuse Inc. Class B | 418 | Technology | 3/20/23 | 3/15/24 | 65.4 |
| AMR | Alpha Metallurgical Resources, Inc. | 2,277 | Energy | 9/19/22 | 3/15/24 | 63.9 |
| MTH | Meritage Homes Corporation | 2,852 | Consumer Discretionary | 9/19/22 | 3/15/24 | 63.5 |
| WSM | Williams-Sonoma, Inc. | 10,458 | Consumer Discretionary | 9/19/22 | 3/15/24 | 60.4 |
| SAIA | Saia, Inc. | 5,675 | Industrials | 9/19/22 | 3/15/24 | 60.3 |
| SNPS | Synopsys, Inc. | 52,596 | Technology | 9/19/22 | 3/15/24 | 60.0 |
| CDNS | Cadence Design Systems, Inc. | 47,108 | Technology | 9/19/22 | 3/15/24 | 58.8 |
| ELF | e.l.f. Beauty, Inc. | 3,739 | Consumer Staples | 3/20/23 | 3/15/24 | 58.5 |
| LEN.B | Lennar Corporation Class B | 7,207 | Consumer Discretionary | 9/19/22 | 3/15/24 | 58.0 |
| ANET | Arista Networks, Inc. | 28,430 | Technology | 9/19/22 | 3/15/24 | 57.7 |
| ACLS | Axcelis Technologies, Inc. | 2,160 | Industrials | 9/19/22 | 3/15/24 | 55.6 |
| ONTO | Onto Innovation, Inc. | 3,558 | Technology | 9/19/22 | 9/15/23 | 55.6 |
| LBRT | Liberty Energy, Inc. Class A | 2,457 | Energy | 3/20/23 | 3/15/24 | 54.1 |
| FIX | Comfort Systems USA, Inc. | 3,482 | Industrials | 9/19/22 | 3/15/24 | 52.7 |
Top 30 returns are regardless of holding period. Market cap is from the date each company was first selected to B400T during fiscal year 2023. Sources: MarketGrader & FactSet.
3 | November 30, 2023
Barron’s 400SM ETF
| Performance Overview | November 30, 2023 (Unaudited) |
Performance (as of November 30, 2023)
| | 1 Year | 5 Year | 10 Year | Since Inception^ |
| Barron’s 400SM ETF – NAV | 1.67% | 8.62% | 7.96% | 9.21% |
| Barron’s 400SM ETF – Market Price* | 1.69% | 8.61% | 7.96% | 9.21% |
| Barron’s 400 IndexSM | 2.18% | 9.31% | 8.66% | 9.92% |
Total Expense Ratio (per the current prospectus) is 0.65%
Performance data quoted represents past performance. Past performance does not guarantee future results. Total return figures assume reinvestment of dividends and capital gains distributions, if any. The table does not reflect the deduction of taxes that a shareholder would pay on Fund distributions or the redemption of Fund shares. Investment return and principal value of an investment will fluctuate so that an investor’s shares, when sold or redeemed, may be worth more or less than the original cost. Current performance data may be higher or lower than actual data quoted. For the most current month-end performance data please visit www.alpsfunds.com or call 1.866.759.5679.
Net Asset Value (NAV) is an exchange-traded fund’s per-share value. The per-share dollar amount of the Fund is derived by dividing the total value of all the securities in its portfolio, less any liabilities, by the number of Fund shares outstanding. Market Price is the price at which a share can currently be traded in the market. Information detailing the number of days the Market Price of the Fund was greater than the Fund’s NAV and the number of days it was less than the Fund’s NAV can be obtained at www.alpsfunds.com.
| ^ | The Fund commenced Investment Operations on June 4, 2013. |
| * | Market Price means the official closing price of a share or, if it more accurately reflects the market value of a share at the time as of which the Fund calculates current net asset value per share, the price that is the midpoint of the bid-ask spread as of that time. It does not represent the returns an investor would receive if shares were traded at other times. |
The Barron’s 400 IndexSM, calculated by NYSE Arca or its affiliates, measures the performance of a diversified group of U.S. companies selected in part based on fundamentals-related, rules-based criteria. The index includes companies that have scored highest according to fundamentals-related rankings calculated by MarketGrader Capital, LLC. Additional rules-based screening provides for sector and market cap diversification. The Underlying Index has been licensed by MarketGrader for use with the Barron’s 400SM ETF.
The index is not actively managed and does not reflect any deductions for fees, expenses or taxes. One cannot invest directly in an index. Index performance does not reflect Fund performance.
Funds that emphasize investments in small/mid cap companies will generally experience greater price volatility.
Barron’s 400SM ETF shares are not individually redeemable. Investors buy and sell shares of the Barron’s 400SM ETF on a secondary market. Only market makers or “authorized participants” may trade directly with the Fund, typically in blocks of 25,000 shares.
The Barron’s 400SM ETF is not suitable for all investors. Investments in the Fund are subject to investment risks, including possible loss of the principal amount invested.
ALPS Portfolio Solutions Distributor, Inc., a FINRA member, is the distributor for the Fund.
4 | November 30, 2023
Barron’s 400SM ETF
| Performance Overview | November 30, 2023 (Unaudited) |
Top 10 Holdings*^ (as of November 30, 2023)
| Dorian LPG, Ltd. | 0.38% |
| ONEOK, Inc. | 0.35% |
| Williams-Sonoma, Inc. | 0.34% |
| Alpha Metallurgical Resources, Inc. | 0.33% |
| Gartner, Inc. | 0.32% |
| New Fortress Energy, Inc. | 0.31% |
| Deckers Outdoor Corp. | 0.31% |
| Amalgamated Financial Corp. | 0.30% |
| Grand Canyon Education, Inc. | 0.30% |
| Bel Fuse, Inc. | 0.30% |
| Total % of Top 10 Holdings | 3.24% |
| * | % of Total Investments (excluding investments purchased with collateral from securities loaned). |
| ^ | Excludes Money Market Fund |
Sector Allocation* (as of November 30, 2023)
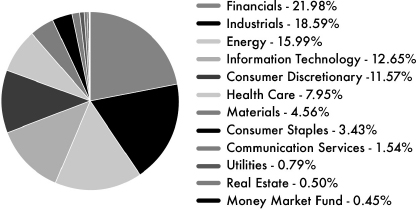
Future holdings are subject to change.
Growth of $10,000 (as of November 30, 2023)
Comparison of change in value of a $10,000 investment in the Fund and the Underlying Index
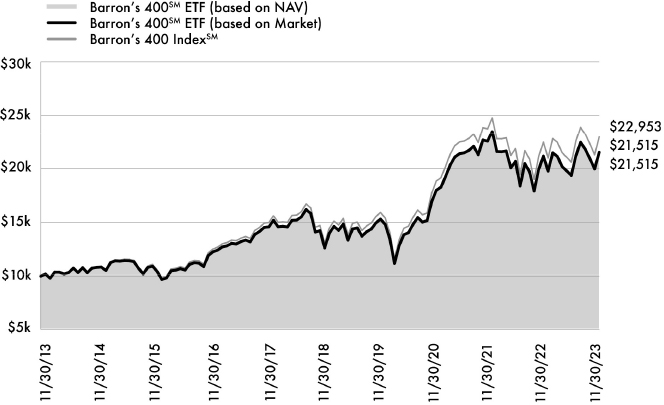
The chart above compares historical performance of a hypothetical investment of $10,000 in the Fund over the past 10 years with the performance of the Fund’s benchmark index. Results include the reinvestment of all dividends and capital gains distributions. Past performance does not guarantee future results. The chart does not reflect the deduction of taxes that a shareholder would pay on Fund distributions or the redemption of Fund shares.
5 | November 30, 2023
Barron’s 400SM ETF
| Disclosure of Fund Expenses | November 30, 2023 (Unaudited) |
Shareholder Expense Example: As a shareholder of the Fund, you incur certain ongoing costs, including management fees and other Fund expenses. These examples are intended to help you understand your ongoing costs (in dollars) of investing in the Fund and to compare these costs with the ongoing costs of investing in other funds. It is based on an investment of $1,000 invested at the beginning of the six month period and held through November 30, 2023.
Actual Return: The first line of the table provides information about actual account values and actual expenses. You may use the information in this line, together with the amount you invested, to estimate the expenses that you incurred over the period. Simply divide your account value by
$1,000 (for example, an $8,600 account value divided by $1,000 = 8.6), then multiply the result by the number in the first line under the heading entitled “Expenses Paid During Period” to estimate the expenses attributable to your investment during this period.
Hypothetical 5% Return: The second line of the table provides information about hypothetical account values and hypothetical expenses based on the Fund’s actual expense ratio and an assumed rate of return of 5% per year before expenses, which is not the Fund’s actual return. The hypothetical account values and expenses may not be used to estimate the actual ending account balance or expenses you paid for the period. You may use this information to compare ongoing costs of investing in the Fund and other funds. To do so, compare this 5% hypothetical example with the 5% hypothetical examples that appear in the shareholder reports of other funds.
The expenses shown in the table are meant to highlight ongoing Fund costs only and do not reflect any transaction costs, such as brokerage commissions and other fees to financial intermediaries. Therefore, the second line is useful in comparing ongoing costs only, and will not help you determine the relative total costs of owning different funds. In addition, if these costs were included, your costs would have been higher.
| | Beginning Account Value 6/1/23 | Ending Account Value 11/30/23 | Expense Ratio(a) | Expenses Paid During Period 6/1/23 - 11/30/23(b) |
| Barron's 400SM ETF | | | | |
| Actual | $1,000.00 | $1,110.90 | 0.65% | $3.44 |
| Hypothetical (5% return before expenses) | $1,000.00 | $1,021.81 | 0.65% | $3.29 |
| (a) | Annualized, based on the Fund's most recent fiscal half year expenses. |
| (b) | Expenses are equal to the Fund's annualized expense ratio multiplied by the average account value over the period, multiplied by the number of days in the most recent fiscal half year (183), divided by 365. |
6 | November 30, 2023
Barron’s 400SM ETF
Report of Independent Registered Public Accounting Firm
To the Shareholders of Barron’s 400SM ETF and Board of Trustees of ALPS ETF Trust
Opinion on the Financial Statements
We have audited the accompanying statement of assets and liabilities, including the schedule of investments, of Barron’s 400SM ETF (the “Fund”), a series of ALPS ETF Trust, as of November 30, 2023, the related statements of operations and changes in net assets, the related notes, and the financial highlights for the year then ended (collectively referred to as the “financial statements”). In our opinion, the financial statements present fairly, in all material respects, the financial position of the Fund as of November 30, 2023, the results of its operations, the changes in net assets, and the financial highlights for the year then ended, in conformity with accounting principles generally accepted in the United States of America.
The Fund’s financial statements and financial highlights for the years ended November 30, 2022, and prior, were audited by other auditors whose report dated January 27, 2023, expressed an unqualified opinion on those financial statements and financial highlights.
Basis for Opinion
These financial statements are the responsibility of the Fund’s management. Our responsibility is to express an opinion on the Fund’s financial statements based on our audit. We are a public accounting firm registered with the Public Company Accounting Oversight Board (United States) (“PCAOB”) and are required to be independent with respect to the Fund in accordance with the U.S. federal securities laws and the applicable rules and regulations of the Securities and Exchange Commission and the PCAOB.
We conducted our audit in accordance with the standards of the PCAOB. Those standards require that we plan and perform the audit to obtain reasonable assurance about whether the financial statements are free of material misstatement whether due to error or fraud.
Our audit included performing procedures to assess the risks of material misstatement of the financial statements, whether due to error or fraud, and performing procedures that respond to those risks. Such procedures included examining, on a test basis, evidence regarding the amounts and disclosures in the financial statements. Our procedures included confirmation of securities owned as of November 30, 2023 by correspondence with the custodian. Our audit also included evaluating the accounting principles used and significant estimates made by management, as well as evaluating the overall presentation of the financial statements. We believe that our audit provides a reasonable basis for our opinion.
We have served as the auditor of one or more investment companies advised by ALPS Advisors, Inc. since 2013.

COHEN & COMPANY, LTD.
Philadelphia, Pennsylvania
January 29, 2024
7 | November 30, 2023
Barron’s 400SM ETF
| Schedule of Investments | November 30, 2023 |
| Security Description | | Shares | | | Value | |
| COMMON STOCKS (97.03%) | | | | | | |
| Communication Services (1.54%) | | | | | | | | |
| Alphabet, Inc., Class A(a) | | | 2,413 | | | $ | 319,795 | |
| Cogent Communications Holdings, Inc.(b) | | | 4,970 | | | | 317,384 | |
| Electronic Arts, Inc. | | | 2,750 | | | | 379,528 | |
| Fox Corp., Class A | | | 10,413 | | | | 307,600 | |
| Meta Platforms, Inc., Class A(a) | | | 1,098 | | | | 359,211 | |
| Warner Music Group Corp., Class A | | | 10,348 | | | | 342,622 | |
| Total Communication Services | | | | | | | 2,026,140 | |
| | | | | | | | | |
| Consumer Discretionary (11.56%) | | | | | | | | |
| Airbnb, Inc., Class A(a) | | | 2,235 | | | | 282,370 | |
| Booking Holdings, Inc.(a) | | | 104 | | | | 325,073 | |
| Boot Barn Holdings, Inc.(a) | | | 3,846 | | | | 281,835 | |
| Build-A-Bear Workshop, Inc. | | | 11,744 | | | | 286,906 | |
| Cavco Industries, Inc.(a) | | | 1,239 | | | | 350,364 | |
| Chipotle Mexican Grill, Inc.(a) | | | 170 | | | | 374,382 | |
| Crocs, Inc.(a) | | | 3,648 | | | | 385,265 | |
| Darden Restaurants, Inc. | | | 2,274 | | | | 355,813 | |
| Deckers Outdoor Corp.(a) | | | 618 | | | | 410,333 | |
| Dillard's, Inc., Class A(b) | | | 1,036 | | | | 359,585 | |
| DR Horton, Inc. | | | 2,796 | | | | 356,965 | |
| Dream Finders Homes, Inc.(a)(b) | | | 11,732 | | | | 285,557 | |
| eBay, Inc. | | | 7,782 | | | | 319,140 | |
| Ethan Allen Interiors, Inc. | | | 11,099 | | | | 297,897 | |
| General Motors Co. | | | 10,120 | | | | 319,792 | |
| Gentex Corp. | | | 10,244 | | | | 311,520 | |
| Grand Canyon Education, Inc.(a) | | | 2,916 | | | | 398,676 | |
| Guess?, Inc. | | | 14,510 | | | | 319,510 | |
| Harley-Davidson, Inc. | | | 10,141 | | | | 304,129 | |
| Hilton Worldwide Holdings, Inc. | | | 2,178 | | | | 364,859 | |
| Home Depot, Inc. | | | 1,006 | | | | 315,371 | |
| Installed Building Products, Inc. | | | 2,401 | | | | 361,374 | |
| KB Home | | | 6,503 | | | | 338,806 | |
| Lennar Corp., Class B(b) | | | 3,078 | | | | 353,170 | |
| M/I Homes, Inc.(a) | | | 3,504 | | | | 369,707 | |
| McDonald's Corp. | | | 1,184 | | | | 333,699 | |
| Meritage Homes Corp. | | | 2,468 | | | | 348,728 | |
| Modine Manufacturing Co.(a) | | | 7,044 | | | | 346,565 | |
| NVR, Inc.(a) | | | 53 | | | | 326,236 | |
| Oxford Industries, Inc. | | | 3,464 | | | | 313,250 | |
| Perdoceo Education Corp. | | | 19,754 | | | | 344,115 | |
| Polaris, Inc. | | | 3,102 | | | | 255,822 | |
| PulteGroup, Inc. | | | 4,039 | | | | 357,128 | |
| Ralph Lauren Corp. | | | 2,838 | | | | 367,180 | |
| Ross Stores, Inc. | | | 2,785 | | | | 363,108 | |
| Royal Caribbean Cruises, Ltd.(a)(b) | | | 3,376 | | | | 362,785 | |
| Skyline Champion Corp.(a)(b) | | | 4,704 | | | | 283,134 | |
| Target Hospitality Corp.(a)(b) | | | 21,459 | | | | 234,118 | |
| Taylor Morrison Home Corp., | | | | | | | | |
| Class A(a) | | | 7,049 | | | | 317,910 | |
| Tesla, Inc.(a) | | | 1,207 | | | | 289,777 | |
| TJX Cos., Inc. | | | 3,679 | | | | 324,157 | |
| Toll Brothers, Inc. | | | 4,028 | | | | 345,965 | |
| Security Description | | Shares | | | Value | |
| Consumer Discretionary (continued) | | | | | | |
| TopBuild Corp.(a) | | | 1,203 | | | $ | 355,823 | |
| Tractor Supply Co. | | | 1,560 | | | | 316,696 | |
| Williams-Sonoma, Inc.(b) | | | 2,358 | | | | 442,219 | |
| XPEL, Inc.(a)(c) | | | 4,442 | | | | 202,999 | |
| Total Consumer Discretionary | | | | | | | 15,259,813 | |
| | | | | | | | | |
| Consumer Staples (3.43%) | | | | | | | | |
| Archer-Daniels-Midland Co. | | | 4,188 | | | | 308,781 | |
| Cal-Maine Foods, Inc. | | | 6,773 | | | | 324,562 | |
| Clorox Co. | | | 2,134 | | | | 305,909 | |
| Coca-Cola Co. | | | 5,733 | | | | 335,037 | |
| Coca-Cola Consolidated, Inc. | | | 489 | | | | 359,180 | |
| Costco Wholesale Corp. | | | 591 | | | | 350,309 | |
| elf Beauty, Inc.(a) | | | 2,502 | | | | 295,461 | |
| Inter Parfums, Inc. | | | 2,524 | | | | 315,904 | |
| Kroger Co. | | | 7,263 | | | | 321,533 | |
| Lamb Weston Holdings, Inc. | | | 3,416 | | | | 341,703 | |
| Monster Beverage Corp.(a) | | | 5,812 | | | | 320,532 | |
| Oil-Dri Corp. of America | | | 5,382 | | | | 305,482 | |
| PepsiCo, Inc. | | | 1,845 | | | | 310,495 | |
| Procter & Gamble Co. | | | 2,134 | | | | 327,612 | |
| Total Consumer Staples | | | | | | | 4,522,500 | |
| | | | | | | | | |
| Energy (13.56%) | | | | | | | | |
| APA Corp. | | | 7,699 | | | | 277,164 | |
| Ardmore Shipping Corp. | | | 26,320 | | | | 357,952 | |
| Baker Hughes Co. | | | 9,192 | | | | 310,230 | |
| Cactus, Inc., Class A | | | 5,998 | | | | 254,855 | |
| Cheniere Energy, Inc. | | | 2,082 | | | | 379,236 | |
| Chesapeake Energy Corp.(b) | | | 3,776 | | | | 303,251 | |
| Chevron Corp. | | | 2,016 | | | | 289,498 | |
| Chord Energy Corp. | | | 2,144 | | | | 347,628 | |
| Civitas Resources, Inc.(b) | | | 4,018 | | | | 275,996 | |
| CNX Resources Corp.(a)(b) | | | 15,154 | | | | 316,112 | |
| ConocoPhillips | | | 2,800 | | | | 323,596 | |
| CONSOL Energy, Inc. | | | 3,612 | | | | 385,292 | |
| Coterra Energy, Inc. | | | 11,898 | | | | 312,322 | |
| Devon Energy Corp. | | | 6,656 | | | | 299,320 | |
| Diamondback Energy, Inc. | | | 2,164 | | | | 334,143 | |
| Dorian LPG, Ltd.(a) | | | 11,755 | | | | 497,942 | |
| EnLink Midstream LLC | | | 27,004 | | | | 369,145 | |
| EOG Resources, Inc. | | | 2,594 | | | | 319,244 | |
| EQT Corp.(b) | | | 7,818 | | | | 312,407 | |
| Evolution Petroleum Corp.(b) | | | 36,750 | | | | 217,928 | |
| Exxon Mobil Corp. | | | 2,893 | | | | 297,227 | |
| Frontline PLC(b) | | | 19,754 | | | | 392,710 | |
| Gulfport Energy Corp.(a) | | | 2,818 | | | | 386,179 | |
| Hallador Energy Co.(a)(b) | | | 29,734 | | | | 375,540 | |
| Halliburton Co. | | | 7,986 | | | | 295,722 | |
| Helmerich & Payne, Inc.(b) | | | 7,514 | | | | 272,232 | |
| Hess Corp. | | | 2,136 | | | | 300,236 | |
| HF Sinclair Corp. | | | 5,397 | | | | 283,235 | |
| International Seaways, Inc. | | | 7,827 | | | | 357,224 | |
| Liberty Energy, Inc., Class A(b) | | | 18,619 | | | | 369,587 | |
| Magnolia Oil & Gas Corp., Class A | | | 14,384 | | | | 309,256 | |
| Marathon Oil Corp. | | | 12,882 | | | | 327,589 | |
| Marathon Petroleum Corp. | | | 2,145 | | | | 320,013 | |
8 | November 30, 2023
Barron’s 400SM ETF
| Schedule of Investments | November 30, 2023 |
| Security Description | | Shares | | | Value | |
| Energy (continued) | | | | | | |
| Murphy Oil Corp. | | | 7,347 | | | $ | 314,231 | |
| New Fortress Energy, Inc.(b) | | | 10,738 | | | | 413,198 | |
| Northern Oil and Gas, Inc.(b) | | | 8,200 | | | | 306,844 | |
| ONEOK, Inc. | | | 6,763 | | | | 465,633 | |
| Par Pacific Holdings, Inc.(a) | | | 9,019 | | | | 309,081 | |
| Patterson-UTI Energy, Inc. | | | 21,918 | | | | 256,660 | |
| PBF Energy, Inc., Class A | | | 6,271 | | | | 278,432 | |
| Phillips 66 | | | 2,763 | | | | 356,123 | |
| Pioneer Natural Resources Co. | | | 1,438 | | | | 333,098 | |
| Range Resources Corp.(b) | | | 10,338 | | | | 335,985 | |
| RPC, Inc.(b) | | | 39,479 | | | | 286,223 | |
| San Juan Basin Royalty Trust(b) | | | 49,776 | | | | 335,988 | |
| Schlumberger Ltd. | | | 5,431 | | | | 282,629 | |
| SilverBow Resources, Inc.(a) | | | 8,052 | | | | 256,134 | |
| SM Energy Co. | | | 8,390 | | | | 314,206 | |
| Solaris Oilfield Infrastructure, Inc., Class A | | | 32,100 | | | | 274,776 | |
| Southwestern Energy Co.(a) | | | 50,624 | | | | 333,612 | |
| Targa Resources Corp. | | | 3,937 | | | | 356,102 | |
| Texas Pacific Land Corp. | | | 191 | | | | 319,342 | |
| Valero Energy Corp. | | | 2,299 | | | | 288,203 | |
| Viper Energy, Inc. | | | 11,557 | | | | 356,187 | |
| Williams Cos., Inc. | | | 9,794 | | | | 360,321 | |
| Total Energy | | | | | | | 17,903,019 | |
| | | | | | | | | |
| Financials (21.96%) | | | | | | | | |
| 1st Source Corp. | | | 7,544 | | | | 364,602 | |
| Amalgamated Financial Corp. | | | 19,060 | | | | 400,260 | |
| American Express Co. | | | 2,091 | | | | 357,080 | |
| Arch Capital Group, Ltd.(a) | | | 4,277 | | | | 357,942 | |
| Axos Financial, Inc.(a) | | | 7,647 | | | | 292,651 | |
| BancFirst Corp. | | | 3,759 | | | | 325,642 | |
| Bancorp, Inc.(a) | | | 9,440 | | | | 368,254 | |
| Bank of America Corp. | | | 11,584 | | | | 353,196 | |
| Bank of NT Butterfield & Son, Ltd. | | | 11,574 | | | | 320,947 | |
| Bank OZK | | | 8,556 | | | | 358,154 | |
| BOK Financial Corp. | | | 4,022 | | | | 288,659 | |
| Brown & Brown, Inc. | | | 4,500 | | | | 336,330 | |
| Byline Bancorp, Inc. | | | 16,010 | | | | 320,040 | |
| Cathay General Bancorp | | | 9,000 | | | | 330,120 | |
| Cincinnati Financial Corp. | | | 3,122 | | | | 320,910 | |
| Citizens Financial Group, Inc. | | | 11,948 | | | | 325,822 | |
| City Holding Co. | | | 3,753 | | | | 361,301 | |
| Comerica, Inc. | | | 7,126 | | | | 322,238 | |
| CVB Financial Corp. | | | 19,168 | | | | 342,724 | |
| Dime Community Bancshares, Inc. | | | 16,242 | | | | 326,464 | |
| East West Bancorp, Inc. | | | 6,175 | | | | 388,531 | |
| Enterprise Financial Services Corp. | | | 8,569 | | | | 335,991 | |
| Everest Group, Ltd. | | | 890 | | | | 365,390 | |
| FactSet Research Systems, Inc. | | | 776 | | | | 351,885 | |
| FB Financial Corp. | | | 11,292 | | | | 378,960 | |
| Fifth Third Bancorp | | | 12,452 | | | | 360,485 | |
| First BanCorp | | | 24,306 | | | | 364,590 | |
| First Bancshares, Inc. | | | 11,848 | | | | 303,901 | |
| Security Description | | Shares | | | Value | |
| Financials (continued) | | | | | | |
| First Citizens BancShares, Inc., Class A | | | 254 | | | $ | 372,844 | |
| First Commonwealth Financial Corp. | | | 26,642 | | | | 356,204 | |
| First Merchants Corp. | | | 11,452 | | | | 351,233 | |
| FleetCor Technologies, Inc.(a) | | | 1,216 | | | | 292,448 | |
| FNB Corp. | | | 29,764 | | | | 356,870 | |
| Fulton Financial Corp. | | | 26,006 | | | | 370,065 | |
| Hancock Whitney Corp. | | | 8,541 | | | | 352,316 | |
| Hanmi Financial Corp. | | | 19,654 | | | | 327,043 | |
| Heritage Commerce Corp. | | | 38,600 | | | | 327,714 | |
| Home BancShares, Inc.(b) | | | 15,078 | | | | 334,430 | |
| Huntington Bancshares, Inc. | | | 30,708 | | | | 345,772 | |
| Independent Bank Corp. | | | 6,242 | | | | 355,919 | |
| Interactive Brokers Group, Inc. | | | 3,497 | | | | 272,207 | |
| International Bancshares Corp. | | | 7,471 | | | | 335,224 | |
| Jack Henry & Associates, Inc. | | | 2,182 | | | | 346,262 | |
| JPMorgan Chase & Co. | | | 2,289 | | | | 357,267 | |
| Kinsale Capital Group, Inc. | | | 812 | | | | 284,281 | |
| LPL Financial Holdings, Inc. | | | 1,375 | | | | 305,663 | |
| M&T Bank Corp. | | | 2,616 | | | | 335,293 | |
| Markel Group, Inc.(a) | | | 226 | | | | 325,234 | |
| Mastercard, Inc., Class A | | | 795 | | | | 328,995 | |
| MSCI, Inc. | | | 620 | | | | 322,927 | |
| National Bank Holdings Corp., Class A | | | 10,842 | | | | 357,894 | |
| New York Community Bancorp, Inc. | | | 27,597 | | | | 259,688 | |
| OceanFirst Financial Corp. | | | 19,744 | | | | 273,652 | |
| OFG Bancorp | | | 11,119 | | | | 373,154 | |
| Old National Bancorp | | | 21,994 | | | | 327,491 | |
| Old Second Bancorp, Inc. | | | 23,180 | | | | 326,606 | |
| Pathward Financial, Inc. | | | 6,902 | | | | 342,270 | |
| Peoples Bancorp, Inc.(b) | | | 13,008 | | | | 382,825 | |
| Pinnacle Financial Partners, Inc. | | | 4,844 | | | | 351,529 | |
| PNC Financial Services Group, Inc. | | | 2,798 | | | | 374,820 | |
| Popular, Inc. | | | 5,108 | | | | 376,919 | |
| Preferred Bank | | | 5,292 | | | | 326,146 | |
| Premier Financial Corp. | | | 17,798 | | | | 355,426 | |
| QCR Holdings, Inc. | | | 6,586 | | | | 327,192 | |
| Regions Financial Corp. | | | 18,372 | | | | 306,445 | |
| S&T Bancorp, Inc. | | | 12,054 | | | | 337,391 | |
| Shift4 Payments, Inc.(a)(b) | | | 5,842 | | | | 384,520 | |
| South State Corp.(b) | | | 4,735 | | | | 350,627 | |
| Southside Bancshares, Inc. | | | 11,380 | | | | 312,153 | |
| Stock Yards Bancorp, Inc. | | | 7,720 | | | | 340,606 | |
| Synchrony Financial | | | 10,407 | | | | 336,771 | |
| Synovus Financial Corp. | | | 10,935 | | | | 336,689 | |
| Texas Capital Bancshares, Inc.(a) | | | 5,492 | | | | 301,401 | |
| Valley National Bancorp | | | 36,428 | | | | 331,495 | |
| Veritex Holdings, Inc. | | | 18,512 | | | | 354,320 | |
| Visa, Inc., Class A, Class A(b) | | | 1,361 | | | | 349,341 | |
| WaFd, Inc. | | | 12,596 | | | | 336,691 | |
| Webster Financial Corp. | | | 7,917 | | | | 355,077 | |
| Wells Fargo & Co. | | | 7,982 | | | | 355,917 | |
9 | November 30, 2023
Barron’s 400SM ETF
| Schedule of Investments | November 30, 2023 |
| Security Description | | Shares | | | Value | |
| Financials (continued) | | | | | | |
| Westamerica BanCorp | | | 7,742 | | | $ | 392,597 | |
| Western Alliance Bancorp | | | 6,877 | | | | 352,240 | |
| Wintrust Financial Corp. | | | 4,464 | | | | 382,431 | |
| WisdomTree, Inc.(b) | | | 46,554 | | | | 303,067 | |
| WR Berkley Corp. | | | 5,309 | | | | 385,168 | |
| WSFS Financial Corp. | | | 8,776 | | | | 338,490 | |
| Total Financials | | | | | | | 28,978,329 | |
| | | | | | | | | |
| Health Care (7.94%) | | | | | | | | |
| AbbVie, Inc. | | | 2,261 | | | | 321,944 | |
| Agilent Technologies, Inc. | | | 2,985 | | | | 381,483 | |
| Amgen, Inc. | | | 1,262 | | | | 340,286 | |
| Amphastar Pharmaceuticals, Inc.(a) | | | 6,424 | | | | 361,800 | |
| Arcturus Therapeutics Holdings, Inc.(a) | | | 10,470 | | | | 250,652 | |
| Assertio Holdings, Inc.(a)(b) | | | 108,210 | | | | 110,374 | |
| Danaher Corp. | | | 1,320 | | | | 294,769 | |
| Dexcom, Inc.(a) | | | 3,166 | | | | 365,736 | |
| Dynavax Technologies Corp.(a)(b) | | | 25,010 | | | | 342,637 | |
| Edwards Lifesciences Corp.(a) | | | 4,526 | | | | 306,455 | |
| Eli Lilly & Co. | | | 558 | | | | 329,800 | |
| Gilead Sciences, Inc. | | | 4,288 | | | | 328,461 | |
| Haemonetics Corp.(a) | | | 3,640 | | | | 294,367 | |
| Halozyme Therapeutics, Inc.(a) | | | 8,806 | | | | 340,000 | |
| Harmony Biosciences Holdings, Inc.(a) | | | 8,678 | | | | 252,183 | |
| Humana, Inc. | | | 714 | | | | 346,190 | |
| IDEXX Laboratories, Inc.(a) | | | 717 | | | | 333,993 | |
| Intuitive Surgical, Inc.(a) | | | 1,096 | | | | 340,681 | |
| Johnson & Johnson | | | 2,076 | | | | 321,074 | |
| Kiniksa Pharmaceuticals, Ltd., Class A(a) | | | 19,442 | | | | 314,377 | |
| Medpace Holdings, Inc.(a) | | | 1,186 | | | | 321,074 | |
| Neurocrine Biosciences, Inc.(a) | | | 3,014 | | | | 351,402 | |
| Pfizer, Inc. | | | 9,726 | | | | 296,351 | |
| Regeneron Pharmaceuticals, Inc.(a) | | | 402 | | | | 331,172 | |
| Stryker Corp. | | | 1,106 | | | | 327,741 | |
| United Therapeutics Corp.(a) | | | 1,493 | | | | 358,320 | |
| UnitedHealth Group, Inc. | | | 694 | | | | 383,761 | |
| Veeva Systems, Inc., Class A(a) | | | 1,467 | | | | 255,713 | |
| Vertex Pharmaceuticals, Inc.(a) | | | 953 | | | | 338,134 | |
| Viatris, Inc. | | | 32,974 | | | | 302,701 | |
| Voyager Therapeutics, Inc.(a) | | | 38,202 | | | | 277,346 | |
| Waters Corp.(a) | | | 1,254 | | | | 351,885 | |
| Zoetis, Inc. | | | 1,774 | | | | 313,412 | |
| Total Health Care | | | | | | | 10,486,274 | |
| | | | | | | | | |
| Industrials (18.57%) | | | | | | | | |
| AAON, Inc. | | | 5,097 | | | | 319,072 | |
| Acuity Brands, Inc. | | | 2,134 | | | | 382,541 | |
| AGCO Corp. | | | 2,749 | | | | 312,094 | |
| Allison Transmission Holdings, Inc. | | | 5,494 | | | | 293,819 | |
| AMETEK, Inc. | | | 2,149 | | | | 333,589 | |
| Apogee Enterprises, Inc. | | | 6,770 | | | | 305,327 | |
| Security Description | | Shares | | | Value | |
| Industrials (continued) | | | | | | |
| | | | | | |
| Applied Industrial Technologies, Inc. | | | 2,089 | | | $ | 334,386 | |
| Array Technologies, Inc.(a)(b) | | | 14,450 | | | | 223,541 | |
| Atkore, Inc.(a) | | | 2,181 | | | | 283,312 | |
| Automatic Data Processing, Inc. | | | 1,333 | | | | 306,483 | |
| Boise Cascade Co. | | | 3,214 | | | | 351,290 | |
| Brady Corp., Class A | | | 5,860 | | | | 329,742 | |
| Broadridge Financial Solutions, Inc. | | | 1,747 | | | | 338,604 | |
| Builders FirstSource, Inc.(a) | | | 2,325 | | | | 311,806 | |
| Carlisle Cos., Inc. | | | 1,187 | | | | 332,847 | |
| Carrier Global Corp. | | | 5,756 | | | | 299,082 | |
| Caterpillar, Inc. | | | 1,168 | | | | 292,841 | |
| Cintas Corp. | | | 659 | | | | 364,592 | |
| Comfort Systems USA, Inc. | | | 1,752 | | | | 339,152 | |
| Copart, Inc.(a) | | | 7,332 | | | | 368,213 | |
| Core & Main, Inc.(a) | | | 10,922 | | | | 382,598 | |
| CSW Industrials, Inc. | | | 1,850 | | | | 328,061 | |
| CSX Corp. | | | 10,937 | | | | 353,265 | |
| Cummins, Inc. | | | 1,439 | | | | 322,566 | |
| Deere & Co. | | | 824 | | | | 300,274 | |
| Delta Air Lines, Inc. | | | 8,082 | | | | 298,468 | |
| EMCOR Group, Inc. | | | 1,488 | | | | 316,230 | |
| Encore Wire Corp. | | | 1,974 | | | | 363,808 | |
| ExlService Holdings, Inc.(a) | | | 11,262 | | | | 319,503 | |
| Fastenal Co. | | | 6,045 | | | | 362,519 | |
| GMS, Inc.(a) | | | 5,051 | | | | 341,650 | |
| Graco, Inc. | | | 4,449 | | | | 359,390 | |
| H&E Equipment Services, Inc. | | | 7,607 | | | | 337,066 | |
| Honeywell International, Inc. | | | 1,770 | | | | 346,778 | |
| Hubbell, Inc. | | | 1,011 | | | | 303,300 | |
| Hudson Technologies, Inc.(a)(b) | | | 27,775 | | | | 343,021 | |
| IDEX Corp. | | | 1,537 | | | | 309,982 | |
| IES Holdings, Inc.(a) | | | 4,658 | | | | 325,920 | |
| Illinois Tool Works, Inc. | | | 1,385 | | | | 335,461 | |
| Ingersoll Rand, Inc. | | | 4,924 | | | | 351,721 | |
| ITT, Inc. | | | 3,268 | | | | 353,826 | |
| Jacobs Solutions, Inc. | | | 2,514 | | | | 319,731 | |
| Janus International Group, Inc.(a) | | | 31,311 | | | | 330,331 | |
| JB Hunt Transport Services, Inc. | | | 1,791 | | | | 331,819 | |
| Lennox International, Inc. | | | 862 | | | | 350,541 | |
| Lincoln Electric Holdings, Inc. | | | 1,820 | | | | 360,469 | |
| MSC Industrial Direct Co., Inc., Class A | | | 3,504 | | | | 341,360 | |
| Mueller Industries, Inc. | | | 9,332 | | | | 387,558 | |
| Nordson Corp. | | | 1,410 | | | | 331,829 | |
| Old Dominion Freight Line, Inc. | | | 776 | | | | 301,911 | |
| Owens Corning | | | 2,366 | | | | 320,782 | |
| PACCAR, Inc. | | | 3,871 | | | | 355,435 | |
| Parker-Hannifin Corp. | | | 812 | | | | 351,742 | |
| Paychex, Inc. | | | 2,756 | | | | 336,149 | |
| Paycom Software, Inc. | | | 1,154 | | | | 209,636 | |
| Powell Industries, Inc. | | | 3,972 | | | | 330,312 | |
| Preformed Line Products Co. | | | 1,938 | | | | 241,494 | |
| Rockwell Automation, Inc. | | | 1,124 | | | | 309,595 | |
10 | November 30, 2023
Barron’s 400SM ETF
| Schedule of Investments | November 30, 2023 |
| Security Description | | Shares | | | Value | |
| Industrials (continued) | | | | | | |
| Rollins, Inc. | | | 9,138 | | | $ | 372,282 | |
| Saia, Inc.(a) | | | 770 | | | | 300,600 | |
| Shoals Technologies Group, Inc., Class A(a) | | | 15,566 | | | | 215,589 | |
| Simpson Manufacturing Co., Inc. | | | 2,084 | | | | 347,965 | |
| Snap-on, Inc. | | | 1,289 | | | | 354,075 | |
| Standex International Corp. | | | 2,260 | | | | 302,433 | |
| Sterling Infrastructure, Inc.(a) | | | 4,266 | | | | 270,934 | |
| Tennant Co. | | | 4,198 | | | | 359,433 | |
| Terex Corp. | | | 5,597 | | | | 277,052 | |
| The Timken Co. | | | 4,570 | | | | 330,868 | |
| Toro Co. | | | 4,036 | | | | 334,988 | |
| United Airlines Holdings, Inc.(a) | | | 6,918 | | | | 272,569 | |
| United Rentals, Inc. | | | 737 | | | | 350,827 | |
| Wabash National Corp. | | | 15,518 | | | | 340,155 | |
| Watsco, Inc. | | | 940 | | | | 359,296 | |
| Watts Water Technologies, Inc., Class A | | | 1,847 | | | | 355,566 | |
| WW Grainger, Inc. | | | 484 | | | | 380,516 | |
| Total Industrials | | | | | | | 24,513,582 | |
| | | | | | | | | |
| Information Technology (12.64%) | | | | | | | | |
| ACM Research, Inc., Class A(a)(b) | | | 18,218 | | | | 303,147 | |
| Adobe, Inc.(a) | | | 592 | | | | 361,718 | |
| Akamai Technologies, Inc.(a) | | | 3,150 | | | | 363,919 | |
| Allegro MicroSystems, Inc.(a) | | | 9,661 | | | | 262,972 | |
| Amdocs, Ltd. | | | 3,779 | | | | 316,567 | |
| Amphenol Corp., Class A | | | 3,816 | | | | 347,218 | |
| Analog Devices, Inc. | | | 1,859 | | | | 340,903 | |
| Apple, Inc. | | | 1,876 | | | | 356,346 | |
| Applied Materials, Inc. | | | 2,306 | | | | 345,393 | |
| Arista Networks, Inc.(a) | | | 1,748 | | | | 384,053 | |
| Autodesk, Inc.(a) | | | 1,544 | | | | 337,256 | |
| Axcelis Technologies, Inc.(a) | | | 1,909 | | | | 237,250 | |
| Badger Meter, Inc. | | | 2,086 | | �� | | 307,414 | |
| Bel Fuse, Inc., Class B | | | 7,293 | | | | 394,551 | |
| Belden, Inc. | | | 3,404 | | | | 226,162 | |
| Broadcom, Inc. | | | 385 | | | | 356,406 | |
| Cadence Design Systems, Inc.(a) | | | 1,358 | | | | 371,101 | |
| Cisco Systems, Inc. | | | 5,802 | | | | 280,701 | |
| Cognizant Technology Solutions Corp., Class A | | | 4,632 | | | | 326,000 | |
| EPAM Systems, Inc.(a) | | | 1,242 | | | | 320,672 | |
| ePlus, Inc.(a) | | | 5,068 | | | | 321,717 | |
| Extreme Networks, Inc.(a) | | | 12,896 | | | | 208,141 | |
| Fabrinet(a) | | | 2,173 | | | | 351,809 | |
| Fortinet, Inc.(a) | | | 5,075 | | | | 266,742 | |
| Gartner, Inc.(a) | | | 959 | | | | 417,012 | |
| Gen Digital, Inc. | | | 17,094 | | | | 377,435 | |
| Intuit, Inc. | | | 617 | | | | 352,591 | |
| Jabil, Inc. | | | 3,071 | | | | 354,148 | |
| KLA Corp. | | | 673 | | | | 366,529 | |
| Lam Research Corp. | | | 505 | | | | 361,540 | |
| Lattice Semiconductor Corp.(a) | | | 3,669 | | | | 214,820 | |
| Manhattan Associates, Inc.(a) | | | 1,664 | | | | 371,155 | |
| Microchip Technology, Inc. | | | 4,249 | | | | 354,537 | |
| Microsoft Corp. | | | 992 | | | | 375,879 | |
| Security Description | | Shares | | | Value | |
| Information Technology (continued) | | | | | | |
| Monolithic Power Systems, Inc. | | | 682 | | | $ | 374,227 | |
| Motorola Solutions, Inc. | | | 1,166 | | | | 376,466 | |
| NetApp, Inc. | | | 4,208 | | | | 384,569 | |
| NVE Corp. | | | 3,831 | | | | 274,568 | |
| NVIDIA Corp. | | | 734 | | | | 343,292 | |
| ON Semiconductor Corp.(a) | | | 3,376 | | | | 240,810 | |
| Oracle Corp. | | | 2,602 | | | | 302,378 | |
| Photronics, Inc.(a) | | | 16,838 | | | | 355,787 | |
| QUALCOMM, Inc. | | | 2,991 | | | | 385,989 | |
| Qualys, Inc.(a) | | | 2,100 | | | | 388,164 | |
| ServiceNow, Inc.(a) | | | 548 | | | | 375,786 | |
| Skyworks Solutions, Inc. | | | 3,361 | | | | 325,782 | |
| Super Micro Computer, Inc.(a)(b) | | | 1,192 | | | | 325,976 | |
| Synopsys, Inc.(a) | | | 718 | | | | 390,039 | |
| Texas Instruments, Inc. | | | 1,995 | | | | 304,656 | |
| Vishay Intertechnology, Inc.(b) | | | 13,507 | | | | 300,261 | |
| Total Information Technology | | | | | | | 16,682,554 | |
| | | | | | | | | |
| Materials (4.55%) | | | | | | | | |
| Albemarle Corp.(b) | | | 1,775 | | | | 215,254 | |
| Alpha Metallurgical Resources, Inc.(b) | | | 1,564 | | | | 438,796 | |
| Cabot Corp. | | | 4,755 | | | | 360,905 | |
| CF Industries Holdings, Inc. | | | 4,032 | | | | 303,005 | |
| Commercial Metals Co. | | | 6,319 | | | | 286,440 | |
| DuPont de Nemours, Inc. | | | 4,374 | | | | 312,916 | |
| Eagle Materials, Inc. | | | 1,812 | | | | 328,063 | |
| Hawkins, Inc. | | | 5,835 | | | | 358,502 | |
| Livent Corp.(a)(b) | | | 16,125 | | | | 221,880 | |
| Martin Marietta Materials, Inc. | | | 755 | | | | 350,765 | |
| NewMarket Corp. | | | 719 | | | | 381,437 | |
| Nucor Corp. | | | 2,022 | | | | 343,679 | |
| Packaging Corp. of America | | | 2,261 | | | | 379,871 | |
| Reliance Steel & Aluminum Co. | | | 1,288 | | | | 354,535 | |
| Sherwin-Williams Co. | | | 1,204 | | | | 335,675 | |
| Steel Dynamics, Inc. | | | 3,287 | | | | 391,580 | |
| United States Lime & Minerals, Inc. | | | 1,506 | | | | 319,287 | |
| Vulcan Materials Co. | | | 1,526 | | | | 325,893 | |
| Total Materials | | | | | | | 6,008,483 | |
| | | | | | | | | |
| Real Estate (0.49%) | | | | | | | | |
| CoStar Group, Inc.(a) | | | 4,002 | | | | 332,326 | |
| RMR Group, Inc., Class A | | | 13,464 | | | | 320,847 | |
| Total Real Estate | | | | | | | 653,173 | |
| | | | | | | | | |
| Utilities (0.79%) | | | | | | | | |
| Otter Tail Corp.(b) | | | 4,489 | | | | 342,555 | |
| Public Service Enterprise Group, Inc. | | | 5,430 | | | | 338,995 | |
| Vistra Corp. | | | 10,024 | | | | 354,950 | |
| Total Utilities | | | | | | | 1,036,500 | |
| | | | | | | | | |
| TOTAL COMMON STOCKS | | | | | | | | |
| (Cost $112,918,337) | | | | | | | 128,070,367 | |
11 | November 30, 2023
Barron’s 400SM ETF
| Schedule of Investments | November 30, 2023 |
| Security Description | | Shares | | | Value | |
| LIMITED PARTNERSHIPS (2.41%) | | | | | | |
| Energy (2.41%) | | | | | | |
| Alliance Resource Partners LP | | | 16,634 | | | $ | 348,981 | |
| Black Stone Minerals LP | | | 18,835 | | | | 330,554 | |
| Cheniere Energy Partners LP | | | 6,382 | | | | 394,025 | |
| Dorchester Minerals LP | | | 11,897 | | | | 346,560 | |
| Energy Transfer LP | | | 24,267 | | | | 337,069 | |
| Enterprise Products Partners LP | | | 12,353 | | | | 330,813 | |
| Hess Midstream LP, Class A | | | 11,184 | | | | 363,927 | |
| MPLX LP | | | 9,510 | | | | 346,734 | |
| Western Midstream Partners LP | | | 12,641 | | | | 376,955 | |
| Total Energy | | | | | | | 3,175,618 | |
| | | | | | | | | |
| TOTAL LIMITED PARTNERSHIPS | | | | | | | | |
| (Cost $2,884,671) | | | | | | | 3,175,618 | |
| | | 7 Day Yield | | | Shares | | | Value | |
| SHORT TERM INVESTMENTS (2.19%) | | | | | | | | | |
| State Street Institutional Treasury Plus Money Market Fund (Premier Class) | | | | | | | | | | | | |
| (Cost $605,798) | | | 5.31 | % | | | 605,798 | | | $ | 605,798 | |
| | | | | | | | | | | | | |
| | | | | | | | | | | | | |
| Investments Purchased with Collateral from Securities Loaned (1.73%) | | | | | | | | | | | | |
| State Street Navigator Securities Lending Government Money Market Portfolio, 5.37% | | | | | | | | | | | | |
| (Cost $2,288,489) | | | | | | | 2,288,489 | | | | 2,288,489 | |
| TOTAL SHORT TERM INVESTMENTS | | | | | | | | | | | | |
| | | | | | | | | | | | | |
| (Cost $2,894,287) | | | | | | | | | | | 2,894,287 | |
| | | | | | | | | | | | | |
| TOTAL INVESTMENTS (101.63%) | | | | | | | | | | | | |
| (Cost $118,697,296) | | | | | | | | | | $ | 134,140,272 | |
| LIABILITIES IN EXCESS OF OTHER ASSETS (-1.63%) | | | | | | | | | | | (2,153,269 | ) |
| NET ASSETS - 100.00% | | | | | | | | | | $ | 131,987,003 | |
| (a) | Non-income producing security. |
| (b) | Security, or a portion of the security position is currently on loan. The total market value of securities on loan is $9,873,049. |
| (c) | Securities were purchased pursuant to Regulation S under the Securities Act of 1933, which exempts securities offered and sold outside of the United States from registration. Such securities cannot be sold in the United States without either an effective registration statement filed pursuant to the Securities Act of 1933, or pursuant to an exemption from registration. As of November 30, 2023, the market value of those securities was $202,999, representing 0.15% of net assets. |
See Notes to Financial Statements.
12 | November 30, 2023
Barron’s 400SM ETF
| Statement of Assets and Liabilities | November 30, 2023 |
| ASSETS: | | | |
| Investments, at value* | | $ | 134,140,272 | |
| Dividends receivable | | | 203,916 | |
| Total Assets | | | 134,344,188 | |
| | | | | |
| LIABILITIES: | | | | |
| Payable to adviser | | | 68,696 | |
| Payable for collateral upon return of securities loaned | | | 2,288,489 | |
| Total Liabilities | | | 2,357,185 | |
| NET ASSETS | | $ | 131,987,003 | |
| | | | | |
| NET ASSETS CONSIST OF: | | | | |
| Paid-in capital | | $ | 169,285,912 | |
| Total distributable earnings/(accumulated losses) | | | (37,298,909 | ) |
| NET ASSETS | | $ | 131,987,003 | |
| | | | | |
| INVESTMENTS, AT COST | | $ | 118,697,296 | |
| | | | | |
| PRICING OF SHARES | | | | |
| Net Assets | | $ | 131,987,003 | |
| Shares of beneficial interest outstanding (Unlimited number of shares authorized, par value $0.01 per share) | | | 2,275,000 | |
| Net Asset Value, offering and redemption price per share | | $ | 58.02 | |
| * | Includes $9,873,049 of securities on loan. |
See Notes to Financial Statements.
13 | November 30, 2023
Barron’s 400SM ETF
| Statement of Operations | For the Year Ended November 30, 2023 |
| INVESTMENT INCOME: | | | |
| Dividend Income* | | $ | 2,917,556 | |
| Securities Lending Income | | | 40,397 | |
| Total Investment Income | | | 2,957,953 | |
| | | | | |
| EXPENSES: | | | | |
| Investment adviser and sub-adviser fees | | | 850,280 | |
| Net Expenses | | | 850,280 | |
| NET INVESTMENT INCOME | | | 2,107,673 | |
| | | | | |
| REALIZED AND UNREALIZED GAIN/(LOSS): | | | | |
| Net realized loss on investments(a) | | | (759,393 | ) |
| Net change in unrealized appreciation/(depreciation) on investments | | | 641,095 | |
| NET REALIZED AND UNREALIZED LOSS ON INVESTMENTS | | | (118,298 | ) |
| NET INCREASE IN NET ASSETS RESULTING FROM OPERATIONS | | $ | 1,989,375 | |
| * | Net of foreign tax withholding of $3,279. |
| (a) | Includes realized gain or loss as a result of in-kind transactions (See Note 4 in Notes to Financial Statements). |
See Notes to Financial Statements.
14 | November 30, 2023
Barron’s 400SM ETF
Statements of Changes in Net Assets
| | | For the Year Ended November 30, 2023 | | | For the Year Ended November 30, 2022 | |
| OPERATIONS: | | | | | | |
| Net investment income | | $ | 2,107,673 | | | $ | 1,813,824 | |
| Net realized gain/(loss) | | | (759,393 | ) | | | 4,441,694 | |
| Net change in unrealized appreciation/(depreciation) | | | 641,095 | | | | (15,691,208 | ) |
| Net increase/(decrease) in net assets resulting from operations | | | 1,989,375 | | | | (9,435,690 | ) |
| | | | | | | | | |
| DISTRIBUTIONS TO SHAREHOLDERS: | | | | | | | | |
| From distributable earnings | | | (2,124,271 | ) | | | (1,433,725 | ) |
| Total distributions | | | (2,124,271 | ) | | | (1,433,725 | ) |
| | | | | | | | | |
| CAPITAL SHARE TRANSACTIONS: | | | | | | | | |
| Proceeds from sale of shares | | | – | | | | 1,408,837 | |
| Cost of shares redeemed | | | (7,125,697 | ) | | | (7,260,095 | ) |
| Net decrease from capital share transactions | | | (7,125,697 | ) | | | (5,851,258 | ) |
| Net decrease in net assets | | | (7,260,593 | ) | | | (16,720,673 | ) |
| | | | | | | | | |
| NET ASSETS: | | | | | | | | |
| Beginning of year | | | 139,247,596 | | | | 155,968,269 | |
| End of year | | $ | 131,987,003 | | | $ | 139,247,596 | |
| | | | | | | | | |
| OTHER INFORMATION: | | | | | | | | |
| CAPITAL SHARE TRANSACTIONS: | | | | | | | | |
| Beginning shares | | | 2,400,000 | | | | 2,500,000 | |
| Shares sold | | | – | | | | 25,000 | |
| Shares redeemed | | | (125,000 | ) | | | (125,000 | ) |
| Shares outstanding, end of year | | | 2,275,000 | | | | 2,400,000 | |
See Notes to Financial Statements.
15 | November 30, 2023
Barron’s 400SM ETF
| Financial Highlights | For a Share Outstanding Throughout the Periods Presented |
| | | For the Year Ended November 30, 2023 | | | For the Year Ended November 30, 2022 | | | For the Year Ended November 30, 2021 | | | For the Year Ended November 30, 2020 | | | For the Year Ended November 30, 2019 | |
| NET ASSET VALUE, BEGINNING OF PERIOD | | $ | 58.02 | | | $ | 62.39 | | | $ | 47.32 | | | $ | 42.04 | | | $ | 40.42 | |
| | | | | | | | | | | | | | | | | | | | | |
| INCOME FROM OPERATIONS: | | | | | | | | | | | | | | | | | | | | |
| Net investment income(a) | | | 0.91 | | | | 0.75 | | | | 0.52 | | | | 0.43 | | | | 0.44 | |
| Net realized and unrealized gain/(loss) | | | (0.02 | ) | | | (4.55 | ) | | | 15.05 | | | | 5.14 | | | | 1.51 | |
| Total from investment operations | | | 0.89 | | | | (3.80 | ) | | | 15.57 | | | | 5.57 | | | | 1.95 | |
| | | | | | | | | | | | | | | | | | | | | |
| DISTRIBUTIONS: | | | | | | | | | | | | | | | | | | | | |
| From net investment income | | | (0.89 | ) | | | (0.57 | ) | | | (0.50 | ) | | | (0.29 | ) | | | (0.33 | ) |
| Total distributions | | | (0.89 | ) | | | (0.57 | ) | | | (0.50 | ) | | | (0.29 | ) | | | (0.33 | ) |
| | | | | | | | | | | | | | | | | | | | | |
| NET INCREASE/(DECREASE) IN NET ASSET VALUE | | | 0.00 | | | | (4.37 | ) | | | 15.07 | | | | 5.28 | | | | 1.62 | |
| NET ASSET VALUE, END OF PERIOD | | $ | 58.02 | | | $ | 58.02 | | | $ | 62.39 | | | $ | 47.32 | | | $ | 42.04 | |
| TOTAL RETURN(b) | | | 1.67 | % | | | (6.18 | )% | | | 33.18 | % | | | 13.33 | % | | | 5.00 | % |
| | | | | | | | | | | | | | | | | | | | | |
| RATIOS/SUPPLEMENTAL DATA: | | | | | | | | | | | | | | | | | | | | |
| Net assets, end of year (in 000s) | | $ | 131,987 | | | $ | 139,248 | | | $ | 155,968 | | | $ | 118,293 | | | $ | 147,150 | |
| | | | | | | | | | | | | | | | | | | | | |
| Ratio of expenses to average net assets | | | 0.65 | % | | | 0.65 | % | | | 0.65 | % | | | 0.65 | % | | | 0.65 | % |
| Ratio of net investment income to average net assets | | | 1.63 | % | | | 1.32 | % | | | 0.90 | % | | | 1.08 | % | | | 1.10 | % |
| Portfolio turnover rate(c) | | | 83 | % | | | 94 | % | | | 91 | % | | | 83 | % | | | 109 | % |
| (a) | Based on average shares outstanding during the period. |
| (b) | Total return is calculated assuming an initial investment made at the net asset value at the beginning of the year and redemption at the net asset value on the last day of the year and assuming all distributions are reinvested at the reinvestment prices. Total return calculated for a period of less than one year is not annualized. |
| (c) | Portfolio turnover for periods less than one year are not annualized and does not include securities received or delivered from processing creations or redemptions in-kind. |
See Notes to Financial Statements.
16 | November 30, 2023
Barron’s 400SM ETF
| Notes to Financial Statements | November 30, 2023 |
1. ORGANIZATION
ALPS ETF Trust (the “Trust”), a Delaware statutory trust, is an open-end management investment company registered under the Investment Company Act of 1940, as amended (the “1940 Act”). As of November 30, 2023, the Trust consisted of twenty-three separate portfolios. Each portfolio represents a separate series of the Trust. This report pertains solely to the Barron’s 400SM ETF (the “Fund”). The investment objective of the Fund is to seek investment results that correspond generally, before fees and expenses, to the performance of the Barron’s 400 IndexSM (the “Underlying Index”). The Fund has elected to qualify as a diversified series of the Trust under the 1940 Act.
The Fund’s Shares (“Shares”) are listed on the NYSE Arca, Inc. (the “NYSE Arca”). The Fund issues and redeems Shares, at net asset value (“NAV”) in blocks of 25,000 Shares, each of which is called a “Creation Unit”. Creation Units are issued and redeemed principally in-kind for securities included in the Underlying Index. Except when aggregated in Creation Units, Shares are not redeemable securities of the Fund.
Pursuant to the Trust’s organizational documents, its Officers and Trustees are indemnified against certain liability arising out of the performance of their duties to the Trust. Additionally, in the normal course of business, the Trust enters into contracts with service providers that contain general indemnification clauses. The Trust’s maximum exposure under these arrangements is unknown, as this would involve future claims that may be made against the Trust that have not yet occurred.
2. SIGNIFICANT ACCOUNTING POLICIES
The following is a summary of significant accounting policies consistently followed by the Fund in the preparation of the financial statements. The accompanying financial statements were prepared in accordance with accounting principles generally accepted in the United States of America (“U.S. GAAP”). The preparation of financial statements in conformity with U.S. GAAP requires management to make certain estimates and assumptions that affect the reported amounts of assets and liabilities and disclosures of contingent assets and liabilities at the date of the financial statements and the reported amounts of revenue and expenses during the period. Actual results could differ from those estimates. The Fund is considered an investment company under U.S. GAAP and follows the accounting and reporting guidance applicable to investment companies in the Financial Accounting Standards Board (“FASB”) Accounting Standards Codification Topic 946.
A. Portfolio Valuation
The Fund’s NAV is determined daily, as of the close of regular trading on the New York Stock Exchange (the “NYSE”), normally 4:00 p.m. Eastern time, on each day the NYSE is open for trading. The NAV is computed by dividing the value of all assets of the Fund (including accrued interest and dividends), less all liabilities (including accrued expenses and dividends declared but unpaid), by the total number of shares outstanding.
Portfolio securities listed on any exchange other than the NASDAQ Stock Market LLC (“NASDAQ”) are valued at the last sale price on the business day as of which such value is being determined. If there has been no sale on such day, the securities are valued at the mean of the most recent bid and ask prices on such day. Securities traded on the NASDAQ are valued at the NASDAQ Official Closing Price as determined by NASDAQ. Portfolio securities traded on more than one securities exchange are valued at the last sale price on the business day as of which such value is being determined at the close of the exchange representing the principal market for such securities. Portfolio securities traded in the over-the-counter market, but excluding securities traded on the NASDAQ, are valued at the last quoted sale price in such market.
The Fund’s investments are valued at market value or, in the absence of market value with respect to any portfolio securities, at fair value according to procedures adopted by the Trust’s Board of Trustees (the “Board”). Pursuant to Rule 2a-5 under the 1940 Act, the Board designated ALPS Advisors, Inc. (the "Adviser") as the valuation designee ("Valuation Designee") for the Fund to perform the fair value determinations relating to Fund investments. The Adviser may carry out its designated responsibilities as Valuation Designee through various teams and committees. When market quotations are not readily available or when events occur that make established valuation methods unreliable, securities of the Fund may be valued in good faith by the Valuation Designee. These securities generally include, but are not limited to, restricted securities (securities which may not be publicly sold without registration under the Securities Act of 1933) for which a pricing service is unable to provide a market price; securities whose trading has been formally suspended; a security whose market price is not available from a pre-established primary pricing source or the pricing source is not willing to provide a price; a security with respect to which an event has occurred that is most likely to materially affect the value of the security after the market has closed but before the calculation of the Fund’s NAV or make it difficult or impossible to obtain a reliable market quotation; or a security whose price, as provided by the pricing service, does not reflect the security’s “fair value” due to the security being de-listed from a national exchange or the security’s primary trading market is temporarily closed at a time when, under normal conditions, it would be open. As a general principle, the current “fair value” of a security would be the amount which the owner might reasonably expect to receive from the sale on the applicable exchange or principal market. A variety of factors may be considered in determining the fair value of such securities.
17 | November 30, 2023
Barron’s 400SM ETF
| Notes to Financial Statements | November 30, 2023 |
B. Fair Value Measurements
The Fund discloses the classification of its fair value measurements following a three-tier hierarchy based on the inputs used to measure fair value. Inputs refer broadly to the assumptions that market participants would use in pricing the asset or liability, including assumptions about risk. Inputs may be observable or unobservable. Observable inputs reflect the assumptions market participants would use in pricing the asset or liability that are developed based on market data obtained from sources independent of the reporting entity. Unobservable inputs reflect the reporting entity’s own assumptions about the assumptions market participants would use in pricing the asset or liability that are developed based on the best information available.
Valuation techniques used to value the Fund's investments by major category are as follows:
Equity securities and Limited Partnerships, including restricted securities, for which market quotations are readily available, are valued at the last reported sale price or official closing price as reported by a third party pricing vendor on the primary market or exchange on which they are traded and are categorized as Level 1 in the hierarchy. In the event there were no sales during the day or closing prices are not available, securities are valued at the mean of the most recent quoted bid and ask prices on such day and are generally categorized as Level 2 in the hierarchy. Investments in open-end mutual funds are valued at their closing NAV each business day and are categorized as Level 1 in the hierarchy.
Changes in valuation techniques may result in transfers in or out of an assigned level within the disclosure hierarchy.
Various inputs are used in determining the value of the Fund’s investments as of the end of the reporting period. When inputs used fall into different levels of the fair value hierarchy, the level in the hierarchy within which the fair value measurement falls is determined based on the lowest level input that is significant to the fair value measurement in its entirety. The designated input levels are not necessarily an indication of the risk or liquidity associated with these investments.
These inputs are categorized in the following hierarchy under applicable financial accounting standards:
| Level 1 – | Unadjusted quoted prices in active markets for identical investments, unrestricted assets or liabilities that a Fund has the ability to access at the measurement date; |
| | |
| Level 2 – | Quoted prices which are not active, quoted prices for similar assets or liabilities in active markets or inputs other than quoted prices that are observable (either directly or indirectly) for substantially the full term of the asset or liability; and |
| | |
| Level 3 – | Significant unobservable prices or inputs (including the Fund’s own assumptions in determining the fair value of investments) where there is little or no market activity for the asset or liability at the measurement date. |
The following is a summary of the inputs used to value the Fund’s investments as of November 30, 2023:
| Barron's 400SM ETF | | | | | | | | | | | | |
| Investments in Securities at Value | | Level 1 - Quoted and Unadjusted Prices | | | Level 2 - Other Significant Observable Inputs | | | Level 3 - Significant Unobservable Inputs | | | Total | |
| Common Stocks* | | $ | 128,070,367 | | | $ | – | | | $ | – | | | $ | 128,070,367 | |
| Limited Partnerships* | | | 3,175,618 | | | | – | | | | – | | | | 3,175,618 | |
| Short Term Investments | | | 2,894,287 | | | | – | | | | – | | | | 2,894,287 | |
| Total | | $ | 134,140,272 | | | $ | – | | | $ | – | | | $ | 134,140,272 | |
| * | For a detailed sector breakdown, see the accompanying Schedule of Investments. |
The Fund did not have any securities that used significant unobservable inputs (Level 3) in determining fair value and there were no transfers into or out of Level 3 during the year ended November 30, 2023.
C. Securities Transactions and Investment Income
Securities transactions are recorded as of the trade date. Realized gains and losses from securities transactions are recorded on the specific identification in accordance with GAAP. Dividend income and capital gains distributions, if any, are recorded on the ex-dividend date. Interest income, if any, is recorded on the accrual basis.
18 | November 30, 2023
Barron’s 400SM ETF
| Notes to Financial Statements | November 30, 2023 |
D. Dividends and Distributions to Shareholders
Dividends from net investment income of the Fund, if any, are declared and paid annually or as the Board may determine from time to time. Distributions of net realized capital gains earned by the Fund, if any, are distributed at least annually.
E. Federal Tax and Tax Basis Information
The timing and character of income and capital gain distributions are determined in accordance with income tax regulations, which may differ from
U.S. GAAP. Reclassifications are made to the Fund’s capital accounts for permanent tax differences to reflect income and gains available for distribution (or available capital loss carryforwards) under income tax regulations.
For the year ended November 30, 2023, the following reclassifications, which had no impact on results of operations or net assets, were recorded to reflect permanent tax differences resulting primarily from in-kind transactions, investment in partnerships, and prior year tax return true-up:
| Fund | | Paid-in Capital | | | Total Distributable Earnings/(Accumulated Losses) | |
| Barron’s 400SM ETF | | $ | 1,188,080 | | | $ | (1,188,080 | ) |
The tax character of the distributions paid during the fiscal years ended November 30, 2023 and November 30, 2022 was as follows:
| Fund | | Ordinary Income | | | Long-Term Capital Gain | | | Return of Capital | |
| November 30, 2023 | | | | | | | | | |
| Barron’s 400SM ETF | | $ | 2,124,271 | | | $ | – | | | $ | – | |
| Fund | | Ordinary Income | | | Long-Term Capital Gain | | | Return of Capital | |
| November 30, 2022 | | | | | | | | | |
| Barron’s 400SM ETF | | $ | 1,433,725 | | | $ | – | | | $ | – | |
The character of distributions made during the year may differ from its ultimate characterization for federal income tax purposes.
Under current law, capital losses maintain their character as short-term or long-term and are carried forward to the next tax year without expiration. As of November 30, 2023, the following amounts are available as carry forwards to the next tax year:
| Fund | | Short-Term | | | Long-Term | |
| Barron’s 400SM ETF | | $ | 46,856,074 | | | $ | 7,255,774 | |
As of November 30, 2023, the components of distributable earnings/(accumulated losses) on a tax basis were as follows:
| | | Barron’s 400℠ ETF | |
| Undistributed net investment income | | $ | 1,157,286 | |
| Accumulated net realized loss on investments | | | (54,111,848 | ) |
| Net unrealized appreciation on investments | | | 15,655,653 | |
| Total | | $ | (37,298,909 | ) |
As of November 30, 2023, the cost of investments for federal income tax purposes and accumulated net unrealized appreciation/(depreciation) on investments were as follows:
| | | Barron’s 400℠ ETF | |
| Gross appreciation (excess of value over tax cost) | | $ | 20,962,349 | |
| Gross depreciation (excess of tax cost over value) | | | (5,306,696 | ) |
| Net unrealized appreciation/(depreciation) | | $ | 15,655,653 | |
| Cost of investments for income tax purposes | | $ | 118,484,619 | |
19 | November 30, 2023
Barron’s 400SM ETF
| Notes to Financial Statements | November 30, 2023 |
The differences between book-basis and tax-basis are primarily due to the deferral of losses from wash sales, investment in partnerships, and grantor trusts.
F. Income Taxes
No provision for income taxes is included in the accompanying financial statements, as the Fund intends to distribute to shareholders all taxable investment income and realized gains and otherwise comply with Subchapter M of the Internal Revenue Code of 1986, as amended, applicable to regulated investment companies. The Fund evaluates tax positions taken (or expected to be taken) in the course of preparing the Fund’s tax returns to determine whether these positions meet a “more-likely-than-not” standard that, based on the technical merits, have a more than fifty percent likelihood of being sustained by a taxing authority upon examination. A tax position that meets the “more-likely-than-not” recognition threshold is measured to determine the amount of benefit to recognize in the financial statements.
As of and during the year ended November 30, 2023, the Fund did not have a liability for any unrecognized tax benefits. The Fund files U.S. federal, state, and local tax returns as required. The Fund’s tax returns are subject to examination by the relevant tax authorities until expiration of the applicable statute of limitations, which is generally three years after the filing of the tax return, but may extend to four years in certain jurisdictions. Tax returns for open years have incorporated no uncertain tax positions that require a provision for income taxes.
G. Lending of Portfolio Securities
The Fund has entered into a securities lending agreement with State Street Bank & Trust Co. (“SSB”), the Fund’s lending agent. The Fund may lend its portfolio securities only to borrowers that are approved by SSB. The Fund will limit such lending to not more than 33 1/3% of the value of its total assets. The Fund’s securities held at SSB as custodian shall be available to be lent except those securities the Fund or ALPS Advisors, Inc. specifically identifies in writing as not being available for lending. The borrower pledges and maintains with the Fund collateral consisting of cash (U.S. Dollars only), securities issued or guaranteed by the U.S. government or its agencies or instrumentalities, and cash equivalents (including irrevocable bank letters of credit) issued by a person other than the borrower or an affiliate of the borrower. The initial collateral received by the Fund is required to have a value of no less than 102% of the market value of the loaned securities for U.S equity securities and a value of no less than 105% of the market value for non-U.S. equity securities. The collateral is maintained thereafter, at a market value equal to not less than 102% of the current value of the U.S. equity securities on loan and not less than 105% of the current value of the non-U.S. equity securities on loan. The market value of the loaned securities is determined at the close of each business day and any additional required collateral is delivered to the Fund on the next business day. During the term of the loan, the Fund is entitled to all distributions made on or in respect of the loaned securities. Loans of securities are terminable at any time and the borrower, after notice, is required to return borrowed securities within the customary time period for settlement of securities transactions.
Any cash collateral received is reinvested in a money market fund managed by SSB as disclosed in the Fund’s Schedule of Investments and is reflected in the Statement of Assets and Liabilities as a payable for collateral upon return of securities loaned. Non-cash collateral, in the form of securities issued or guaranteed by the U.S. government or its agencies or instrumentalities, is not disclosed in the Fund’s Statement of Assets and Liabilities or the contractual maturity table below as it is held by the lending agent on behalf of the Fund, and the Fund does not have the ability to re-hypothecate these securities. Income earned by the Fund from securities lending activity is disclosed in the Statement of Operations.
The following is a summary of the Fund's securities lending agreement and related cash and non-cash collateral received as of November 30, 2023:
| | | Market Value of Securities on Loan | | | Cash Collateral Received | | | Non-Cash Collateral Received | | | Total Collateral Received | |
| Barron's 400 SM ETF | | $ | 9,873,049 | | | $ | 2,288,489 | | | $ | 7,790,419 | | | $ | 10,078,908 | |
The risks of securities lending include the risk that the borrower may not provide additional collateral when required or may not return the securities when due. To mitigate these risks, the Fund benefits from a borrower default indemnity provided by SSB. SSB’s indemnity allows for full replacement of securities lent wherein SSB will purchase the unreturned loaned securities on the open market by applying the proceeds of the collateral, or to the extent such proceeds are insufficient or the collateral is unavailable, SSB will purchase the unreturned loan securities at SSB’s expense. However, the Fund could suffer a loss if the value of the investments purchased with cash collateral falls below the value of the cash collateral received.
20 | November 30, 2023
Barron’s 400SM ETF
| Notes to Financial Statements | November 30, 2023 |
The following table reflects a breakdown of transactions accounted for as secured borrowings, the gross obligation by the type of collateral pledged or securities loaned, and the remaining contractual maturity of those transactions as of November 30, 2023:
| Barron's 400 SM ETF | | Remaining contractual maturity of the agreements | |
| | | | | | | | | | | | | | | | |
| Securities Lending Transactions | | Overnight & Continuous | | | Up to 30 Days | | | 30-90 Days | | | Greater than 90 Days | | | Total | |
| Common Stocks | | $ | 2,288,489 | | | $ | – | | | $ | – | | | $ | – | | | $ | 2,288,489 | |
| Total Borrowings | | | | | | | | | | | | | | | | | | | 2,288,489 | |
| Gross amount of recognized liabilities | | | for securities lending | | | | (collateral received) | | | | | | | | | | | $ | 2,288,489 | |
3. INVESTMENT ADVISORY FEE AND OTHER AFFILIATED TRANSACTIONS
ALPS Advisors, Inc. serves as the Fund’s investment adviser pursuant to an Investment Advisory Agreement with the Trust on behalf of the Fund (the “Advisory Agreement”). Pursuant to the Advisory Agreement, the Fund pays the Adviser an annual management fee for the services and facilities it provides, payable on a monthly basis at the annual rate of 0.65% of the Fund’s average daily net assets. From time to time, the Adviser may waive all or a portion of its fee.
Out of the unitary management fees, the Adviser pays substantially all expenses of the Fund, including the cost of transfer agency, custody, fund administration, legal, audit, trustees and other services, except for interest expenses, distribution fees or expenses, brokerage expenses, taxes and extraordinary expenses not incurred in the ordinary course of the Fund's business. The Adviser’s unitary management fee is designed to pay substantially all of the Fund’s expenses and to compensate the Adviser for providing services to the Fund.
ALPS Fund Services, Inc., an affiliate of the Adviser, is the administrator of the Fund.
Effective July 1, 2023, each Trustee receives (1) a quarterly retainer of $25,000, (2) a per meeting fee of $15,000, (3) $2,500 for any special meeting held outside of a regularly scheduled board meeting, and (4) reimbursement for all reasonable out-of-pocket expenses relating to attendance at meetings. In addition, the Chairman of the Board receives a quarterly retainer of $5,000, the Chairman of the Audit Committee receives a quarterly retainer of $3,000, and the Chairman of the Nominating & Governance Committee receives a quarterly retainer of $2,000, each in connection with their respective roles. Prior to July 1, 2023, each Trustee received (1) a quarterly retainer of $20,000, (2) a per meeting fee of $10,000, (3) $2,500 for any special meeting held outside of a regularly scheduled board meeting, and (4) reimbursement for all reasonable out-of-pocket expenses relating to attendance at meetings. In addition, the Chairman of the Board received a quarterly retainer of $5,000, the Chairman of the Audit Committee received a quarterly retainer of $3,000, and the Chairman of the Nominating & Governance Committee received a quarterly retainer of $2,000, each in connection with their respective roles.
4. PURCHASES AND SALES OF SECURITIES
For the year ended November 30, 2023, the cost of purchases and proceeds from sales of investment securities, excluding in-kind transactions and short-term investments, were as follows:
| Fund | | Purchases | | | Sales | |
| Barron's 400SM ETF | | $ | 109,186,800 | | | $ | 109,041,269 | |
| | | | | | | | | |
For the year ended November 30, 2023, the cost of in-kind purchases and proceeds from in-kind sales were as follows:
| Fund | | Purchases | | | Sales | |
| Barron's 400SM ETF | | $ | – | | | $ | 7,132,884 | |
For the year ended November 30, 2023, the Fund had in-kind net realized gains of $1,167,865.
Gains on in-kind transactions are not considered taxable for federal income tax purposes and losses on in-kind transactions are also not deductible for tax purposes.
21 | November 30, 2023
Barron’s 400SM ETF
| Notes to Financial Statements | November 30, 2023 |
5. CAPITAL SHARE TRANSACTIONS
Shares are created and redeemed by the Fund only in Creation Unit size aggregations of 25,000 Shares. Only broker-dealers or large institutional investors with creation and redemption agreements called Authorized Participants (“AP”) are permitted to purchase or redeem Creation Units from the Fund. Such transactions are generally permitted on an in-kind basis, with a balancing cash component to equate the transaction to the NAV per unit of the Fund on the transaction date. Cash may be substituted equivalent to the value of certain securities generally when they are not available in sufficient quantity for delivery, not eligible for trading by the AP or as a result of other market circumstances.
6. RELATED PARTY TRANSACTIONS
The Fund engaged in cross trades between other funds in the Trust during the year ended November 30, 2023 pursuant to Rule 17a-7 under the 1940 Act. Cross trading is the buying or selling of portfolio securities between funds to which the Adviser serves as the investment adviser. The Board previously adopted procedures that apply to transactions between the Funds of the Trust pursuant to Rule 17a-7. These transactions related to cross trades during the period complied with the requirements set forth by Rule 17a-7 and the Trust’s procedures.
Transactions related to cross trades during the year ended November 30, 2023, were as follows:
| Fund | | Purchase Cost Paid | | | Sale Proceeds Received | | | Realized Gain/(Loss) on Sales | |
| Barron's 400 SM ETF | | $ | 4,030,191 | | | $ | 2,201,023 | | | $ | (271,668 | ) |
7. MARKET RISK
The Fund is subject to investment and operational risks associated with financial, economic and other global market developments and disruptions, including those arising from war, terrorism, market manipulation, government interventions, defaults and shutdowns, political changes or diplomatic developments, public health emergencies (such as the spread of infectious diseases, pandemics and epidemics) and natural/environmental disasters, which can negatively impact the securities markets and cause the Fund to lose value. Securities in the Fund’s portfolio may underperform in comparison to securities in general financial markets, a particular financial market or other asset classes due to a number of factors, including inflation (or expectations for inflation), deflation (or expectations for deflation), interest rates, global demand for particular products or resources, market instability, debt crises and downgrades, embargoes, tariffs, sanctions and other trade barriers, regulatory events, other governmental trade or market control programs and related geopolitical events. In addition, the value of the Fund’s investments may be negatively affected by the occurrence of global events such as war, terrorism, environmental disasters, natural disasters or events, country instability, and infectious disease epidemics or pandemics.
8. REGULATORY UPDATE
The U.S. Securities and Exchange Commission ("SEC") adopted rule and form amendments that will change the format and content of the Fund's annual and semi-annual reports. Certain information, including the financial statements, will not appear in the Fund's new tailored shareholder reports but will be available online, delivered free of charge upon request, and filed on a semi-annual basis on Form N-CSR. The rule and form amendments have a compliance date of July 24, 2024. At this time, the Trust is evaluating the impact of these rule and form amendment changes.
9. SUBSEQUENT EVENTS
Subsequent events, if any, after the date of the Statement of Assets and Liabilities have been evaluated through the date the financial statements were issued. Management has determined that there were no subsequent events to report through the issuance of these financial statements.
22 | November 30, 2023
Barron’s 400SM ETF
| Additional Information | November 30, 2023 (Unaudited) |
PROXY VOTING RECORDS, POLICIES AND PROCEDURES
Information regarding how the Fund voted proxies relating to portfolio securities during the most recent 12-month period ended June 30 and a description of the Fund’s proxy voting policies and procedures used in determining how to vote for proxies are available without charge on the SEC’s website at www.sec.gov and upon request, by calling (toll-free) 1-866-759-5679.
PORTFOLIO HOLDINGS
The Fund files a complete schedule of portfolio holdings with the U.S. Securities and Exchange Commission (“SEC”) for the first and third quarters of each fiscal year on Form N-PORT within 60 days after the end of the period. Copies of the Fund’s Form N-PORT are available without a charge, upon request, by contacting the Fund at 1-866-759-5679 and on the SEC’s website at https://www.sec.gov.
TAX INFORMATION
The Barron’s 400 SM ETF designates the following as a percentage of taxable ordinary income distributions, or up to the maximum amount allowable, for the calendar year ended December 31, 2022:
| | Qualified Dividend Income | Dividend Received Deduction |
| Barron's 400 SM ETF | 97.49% | 96.18% |
In early 2023, if applicable, shareholders of record received this information for the distributions paid to them by the Fund during the calendar year 2022 via Form 1099. The Fund will notify shareholders in early 2024 of amounts paid to them by the Fund, if any, during the calendar year 2023.
LICENSING AGREEMENT
MarketGrader Capital, LLC (the “Index Provider”) has entered into a license agreement with Dow Jones & Company to use the “Barron’s” name and certain related intellectual property in connection with the Underlying Index. The Index Provider also has entered into a license and services agreement with its parent company, MarketGrader.com, to use the methodology for constructing the Underlying Index. The Index Provider in turn has entered into the Sublicense Agreement with the Adviser to use the Underlying Index. The following disclosure relates to such licensing agreements:
The Barron’s 400 SM ETF (the “Fund”) is not sponsored, managed or advised by the Index Provider. The Index Provider makes no representation or warranty, express or implied, to the owners of the Fund or any member of the public regarding the advisability of investing in securities generally or in the Fund particularly or the ability of the Underlying Index to track the performance of a market or sector. The Index Provider’s only relationship to the Adviser or the Fund is the licensing of certain service marks and trade names of the Index Provider and of the Underlying Index that is determined, composed and calculated by the Index Provider without regard to the Adviser or the Fund. The Index Provider has no obligation to take the needs of the Adviser or the Fund or the owners of the Fund into consideration in determining, composing or calculating the Underlying Index.
THE INDEX PROVIDER DOES NOT GUARANTEE THE ACCURACY AND/OR THE COMPLETENESS OF THE UNDERLYING INDEX OR ANY DATA INCLUDED THEREIN AND THE INDEX PROVIDER SHALL HAVE NO LIABILITY FOR ANY ERRORS, OMISSIONS, OR INTERRUPTIONS THEREIN. THE INDEX PROVIDER MAKES NO WARRANTY, EXPRESS OR IMPLIED, AS TO RESULTS TO BE OBTAINED BY THE ADVISER, THE FUND, OWNERS OF THE FUND, OR ANY OTHER PERSON OR ENTITY FROM THE USE OF THE UNDERLYING INDEX OR ANY DATA INCLUDED THEREIN. THE INDEX PROVIDER MAKES NO EXPRESS OR IMPLIED WARRANTIES, AND EXPRESSLY DISCLAIMS ALL WARRANTIES OF MERCHANTABILITY OR FITNESS FOR A PARTICULAR PURPOSE OR USE WITH RESPECT TO THE UNDERLYING INDEX OR ANY DATA INCLUDED THEREIN. WITHOUT LIMITING ANY OF THE FOREGOING, IN NO EVENT SHALL THE INDEX PROVIDER HAVE ANY LIABILITY FOR ANY SPECIAL, PUNITIVE, INDIRECT, OR CONSEQUENTIAL DAMAGES (INCLUDING LOST PROFITS), EVEN IF NOTIFIED OF THE POSSIBILITY OF SUCH DAMAGES.
“The Barron’s 400 IndexSM” is calculated and published by the Index Provider. “Barron’s,” “Barron’s 400” and “Barron’s 400 Index” are trademarks or service marks of DJC & Company, Inc. (“DJC”) or its affiliates and have been licensed to the Index Provider and sublicensed for certain purposes by Barron’s 400 Exchange Traded Fund, a sub-fund of that certain ALPS ETF Trust, a Delaware Statutory Trust (the “Sub-Licensee”). The Barron’s 400SM ETF (the “Product”) is not sponsored or advised by DJC or its affiliates. DJC and its affiliates make no representation or warranty, express or implied, to the Licensee or to the owners of the Product(s) or any member of the public regarding the advisability of trading in the Product. DJC and its affiliates’ only relationship to the Licensee is the licensing of certain trademarks and trade names of DJC. The Barron's 400 IndexSM is determined, composed and calculated by the Index Provider without regard to DJC. DJC has no obligation to take the needs of the Licensee or the owners of the Product into consideration in connection with its licensing of the Barron’s 400 IndexSM to the Index Provider or the Sub-Licensee to Licensee. DJC and its affiliates are not responsible for and have not participated in the calculation of the Barron's 400 IndexSM or in the determination of the timing of, prices at, or quantities of the Fund to be sold or in the determination or calculation of the equation by which the Product are to be converted into cash. DJC and its affiliates have no obligation or liability in connection with the administration, marketing or trading of the Barron’s 400 IndexSM or the Product.
23 | November 30, 2023
Barron’s 400SM ETF
| Additional Information | November 30, 2023 (Unaudited) |
DOW JONES DOES NOT GUARANTEE THE ACCURACY AND/OR THE COMPLETENESS OF THE BARRON’S 400 INDEXSM OR ANY DATA INCLUDED THEREIN AND DOW JONES AND ITS AFFILIATES SHALL HAVE NO LIABILITY FOR ANY ERRORS, OMISSIONS, OR INTERRUPTIONS THEREIN. DOW JONES AND ITS AFFILIATES MAKE NO WARRANTY, EXPRESS OR IMPLIED, AS TO RESULTS TO BE OBTAINED BY THE LICENSEE, OWNERS OF THE FUND, OR ANY OTHER PERSON OR ENTITY FROM THE USE OF THE BARRON’S 400 INDEXSM OR ANY DATA INCLUDED THEREIN. DOW JONES AND ITS AFFILIATES MAKE NO EXPRESS OR IMPLIED WARRANTIES. AND EXPRESSLY DISCLAIM ALL WARRANTIES, OF MERCHANTABILITY OR FITNESS FOR A PARTICULAR PURPOSE OR USE WITH RESPECT TO THE BARRON’S 400 INDEXSM OR ANY DATA INCLUDED THEREIN. WITHOUT LIMITING ANY OF THE FOREGOING, IN NO EVENT SHALL DOW JONES AND ITS AFFILIATES HAVE ANY LIABILITY FOR ANY LOST PROFITS OR INDIRECT, PUNITIVE, SPECIAL OR CONSEQUENTIAL DAMAGES OR LOSSES, EVEN IF NOTIFIED OF THE POSSIBILITY OF SUCH DAMAGES. THERE ARE NO THIRD PARTY BENEFICIARIES OF ANY AGREEMENTS OR ARRANGEMENTS BETWEEN DJC AND THE LICENSEE, OTHER THAN THE LICENSORS OF MARKETGRADER.
The Adviser does not guarantee the accuracy and/or the completeness of the Underlying Index or any data included therein, and the Adviser shall have no liability for any errors, omissions or interruptions therein. The Adviser makes no warranty, express or implied, as to results to be obtained by the Fund, owners of the Shares of the Fund or any other person or entity from the use of the Underlying Index or any data included therein. The Adviser makes no express or implied warranties, and expressly disclaims all warranties of merchantability or fitness for a particular purpose or use with respect to the Underlying Index or any data included therein. Without limiting any of the foregoing, in no event shall the Adviser have any liability for any special, punitive, direct, indirect or consequential damages (including lost profits) arising out of matters relating to the use of the Underlying Index, even if notified of the possibility of such damages.
24 | November 30, 2023
Barron’s 400SM ETF
| Board Considerations Regarding Approval of Investment Advisory Agreement | November 30, 2023 (Unaudited) |
At its meetings held on June 5, 2023 and June 20, 2023, the Board of Trustees of the Trust (the “Board” or the “Trustees”), where each Trustee is not an “interested person” of the Trust within the meaning of the Investment Company Act of 1940, as amended (the “Independent Trustees”), evaluated a proposal to approve the continuance of the Investment Advisory Agreement between the Trust and ALPS Advisors, Inc. (the “Adviser” or “AAI”) with respect to the Barron’s 400 ETF (the “Fund” or “BFOR”). In evaluating the renewal of the Investment Advisory Agreement with respect to the Fund, the Board, including the Independent Trustees, considered various factors, including (i) the nature, extent and quality of the services provided by AAI with respect to the Fund under the Investment Advisory Agreement; (ii) the advisory fees and other expenses paid by the Fund compared to those of similar funds managed by other investment advisers; (iii) the costs of the services provided to the Fund by AAI and the profits realized by AAI and its affiliates from its relationship to the Fund; (iv) the extent to which economies of scale have been or would be realized if and as the assets of the Fund grow and whether fees reflect the economies of scale for the benefit of shareholders; and (v) any additional benefits and other considerations.
With respect to the nature, extent and quality of the services provided by AAI under the Investment Advisory Agreement, the Board considered and reviewed information concerning the services provided under the Investment Advisory Agreement, the investment parameters of the index of the Fund, financial information regarding AAI and its parent company, information describing AAI’s current organization and the background and experience of the persons responsible for the day-to-day management of the Fund.
The Board reviewed information on the performance of the Fund and its applicable benchmark for the 1-, 3-, and 5-year periods, as applicable. The Board also evaluated the correlation and tracking error between the Fund's underlying index and the Fund's performance. Based on this review, the Board, including the Independent Trustees found that the nature and extent of services provided to the Fund under the Investment Advisory Agreement was appropriate and that the quality of such services was satisfactory.
The Board noted that the advisory fees for the Fund were unitary fees pursuant to which AAI assumes all expenses of the Fund (including the cost of transfer agency, custody, fund administration, legal, audit and other services) other than the payments under the Advisory Agreement, brokerage expenses, taxes, interest, litigation expenses and other extraordinary expenses.
Based on the information available to them, including the Fund-specific summary set forth below, the Board, including the Independent Trustees, concluded that the advisory fee rate for the Fund was reasonable under the circumstances and in light of the quality of the services provided.
The Board, including the Independent Trustees, considered other benefits available to AAI because of its relationship with the Fund and concluded that the advisory fees were reasonable taking into account any such benefits.
The Board, including the Independent Trustees, also considered with respect to the Fund the information provided by AAI about the costs and profitability of AAI with respect to the Fund, including the asset levels and other factors that influence the profitability and financial viability of the Fund. The Board, including the Independent Trustees, reviewed and noted the relatively small size of the Fund and the analysis AAI had conducted to support AAI’s assertion that it was not realizing any economies of scale with respect to such Fund. The Independent Trustees determined that AAI should continue to keep the Board informed on an ongoing basis of any significant developments (e.g., material increases in asset levels) so as to facilitate the Independent Trustees’ evaluation of whether further economies of scale have been achieved.
The Board, including the Independent Trustees, also considered other potential benefits available to AAI because of its relationship with the Fund, known as fall-out benefits.
With respect to the Fund, the Board, including the Independent Trustees, noted the following:
The gross management fee rate for BFOR is higher than the median of its FUSE expense group. BFOR’s net expense ratio is higher than the median of its FUSE expense group.
The Board took into account, among other things, the unique features and performance of BFOR’s underlying index and the costs and benefits of linkage to the Barron’s name.
The Board, including the Independent Trustees, reviewed and noted the relatively small size of BFOR and the analysis AAI had conducted to support AAI’s assertion that it was not realizing any economies of scale with respect to BFOR.
25 | November 30, 2023
Barron’s 400SM ETF
| Board Considerations Regarding Approval of Investment Advisory Agreement | November 30, 2023 (Unaudited) |
In voting to renew the Investment Advisory Agreement, the Board, including the Independent Trustees concluded that the terms of the Investment Advisory Agreement are reasonable and fair in light of the services to be performed, the fees paid by certain other funds, expenses to be incurred and such other matters as the members of the Board, including the Independent Trustees, considered relevant in the exercise of their reasonable business judgment. The Board, including the Independent Trustees did not identify any single factor or group of factors as all important or controlling and considered all factors together.
26 | November 30, 2023
Barron’s 400SM ETF
| Trustees & Officers | November 30, 2023 (Unaudited) |
The general supervision of the duties performed by the Adviser for the Fund under the Investment Advisory Agreement is the responsibility of the Board of Trustees. The Trust currently has four Trustees, each of whom have no affiliation or business connection with the Adviser or any of its affiliated persons and do not own any stock or other securities issued by the Adviser. These are the “non-interested” or “independent” Trustees (“Independent Trustees”).
The Independent Trustees of the Trust, their term of office and length of time served, their principal business occupations during the past five years, the number of portfolios in the Fund Complex overseen by each Independent Trustee, and other directorships, if any, held by the Trustee are shown below.
INDEPENDENT TRUSTEES
Name, Address and Year of Birth of
Officer* | Position(s) Held with Trust | Length of Time Served** | Principal Occupation(s) During Past 5 Years | Number of Portfolios in Fund Complex Overseen by Trustees*** | Other Directorships Held by Trustees |
Mary K. Anstine,
1940 | Trustee | Since March 2008 | Ms. Anstine is Trustee/Director of AV Hunter Trust and Colorado Uplift Board. | 38 | Ms. Anstine is a Trustee of ALPS Variable Investment Trust (7 funds); Financial Investors Trust (29 funds); and Reaves Utility Income Fund. |
Jeremy W. Deems,
1976 | Trustee | Since March 2008 | Mr. Deems is the Co-Founder and Chief Financial Officer of Green Alpha Advisors, LLC, a registered investment advisor, and Co-Portfolio Manager of the AXS Green Alpha ETF. | 38 | Mr. Deems is a Trustee of ALPS Variable Investment Trust (7 funds); Financial Investors Trust (29 funds); and Reaves Utility Income Fund; and Clough Funds Trust (1 fund). |
Rick A. Pederson,
1952 | Trustee | Since March 2008 | Mr. Pederson is Partner, Bow River Capital Partners (private equity management), 2003 - present; Board Member, Prosci Inc. (private business services) 2013-2016; Advisory Board Member, Citywide Banks (Colorado community bank) 2014- 2017; Board Member, Strong-Bridge Consulting, 2015-2019; Board Member, IRI/ODMS Holdings LLC, 2017 – 2019; Director, National Western Stock Show (not for profit) 2010 - present; Director, History Colorado (not for profit) 2015-present; Director, Citywide Bank Advisory Board 2017-present; Trustee, Boettcher Foundation, 2018 -present. | 24 | Mr. Pederson is Trustee of Segall Bryant & Hamill Trust (14 funds) and Principal Real Estate Income Fund (1 fund). |
| * | The business address of the Trustee is c/o ALPS Advisors, Inc., 1290 Broadway, Suite 1000, Denver, Colorado 80203. |
| ** | This is the period for which the Trustee began serving the Trust. Each Trustee serves an indefinite term, until his or her successor is elected. |
| *** | The Fund Complex includes all series of the Trust and any other investment companies for which ALPS Advisors, Inc. provides investment advisory services. |
27 | November 30, 2023
Barron’s 400SM ETF
| Trustees & Officers | November 30, 2023 (Unaudited) |
Name, Address and Year of Birth of Officer* | Position(s) Held with Trust | Length of Time Served** | Principal Occupation(s) During Past 5 Years | Number of Portfolios in Fund Complex Overseen by Trustees*** | Other Directorships Held by Trustees |
Edmund J. Burke,
1961 | Trustee | Since December 2017 | Mr. Burke joined ALPS in 1991 and served as the President and Director of ALPS Holdings, Inc., and ALPS Advisors, Inc., and Director of ALPS Distributors, Inc., ALPS Fund Services, Inc. (“ALPS”), and ALPS Portfolio Solutions Distributor, Inc. (collectively, the “ALPS Companies”). Mr. Burke retired from the ALPS Companies in June 2019. Mr. Burke is currently a partner at ETF Action, a web-based system that provides data and analytics to registered investment advisers, (since 2020) and a Director of Alliance Bioenergy Plus, Inc., a technology company focused on emerging technologies in the renewable energy, biofuels, and bioplastics technology sectors (since 2020). | 33 | Mr. Burke is a Trustee of Clough Global Dividend and Income Fund (1 fund); Clough Global Equity Fund (1 fund); Clough Global Opportunities Fund (1 fund); Clough Funds Trust (1 fund); Liberty All-Star Equity Fund (1 fund); Director of the Liberty All-Star Growth Fund, Inc. (1 fund) and Financial Investors Trust (29 funds). |
| * | The business address of the Trustee is c/o ALPS Advisors, Inc., 1290 Broadway, Suite 1000, Denver, Colorado 80203. |
| ** | This is the period for which the Trustee began serving the Trust. Each Trustee serves an indefinite term, until his or her successor is elected. |
| *** | The Fund Complex includes all series of the Trust and any other investment companies for which ALPS Advisors, Inc. provides investment advisory services. |
28 | November 30, 2023
Barron’s 400SM ETF
| Trustees & Officers | November 30, 2023 (Unaudited) |
OFFICERS:
Name, Address and Year of Birth of Officer* | Position(s) Held with Trust | Length of Time Served** | Principal Occupation(s) During Past 5 Years |
Laton Spahr,
1975 | President | Since June 2021 | Mr. Spahr joined ALPS in 2019 and currently serves as President and Portfolio Manager of AAI. Prior to his current role, Mr. Spahr was a Senior Vice President and Strategy Leader of the Value & Income Team for Oppenheimer Funds from 2013 to 2019. |
Matthew Sutula,
1985 | Chief Compliance Officer ("CCO") | Since December 2019 | Mr. Sutula joined ALPS in 2012 and currently serves as Chief Compliance Officer of AAI. Prior to his current role, Mr. Sutula served as interim Compliance Officer of the Trust (September 2019 to December 2019). Compliance Manager and Senior Compliance Analyst for AAI, as well as Compliance Analyst for AFS. Prior to joining ALPS, he spent seven years at Morningstar, Inc. in various analyst roles supporting the registered investment company databases. Mr. Sutula is also Chief Compliance Officer of Principal Real Estate Income Fund, ALPS Variable Investment Trust, Liberty All-Star Equity Fund and Liberty All-Star Growth Fund, Inc. From September 2019 to September 2022 he served as Chief Compliance Officer of RiverNorth Opportunities Fund, Inc. |
Erich Rettinger,
1985 | Treasurer | Since September 2023 | Mr. Rettinger is Vice President of AAI (since 2021) and serves as Treasurer of Principal Real Estate Income Fund, Liberty All-Star Equity Fund, LibertyAll-Star Growth Fund, Inc., and ALPS Variable Investment Trust. From December 2021 to October 2022 he also served as Treasurer of RiverNorth Opportunities Fund, Inc. Because of his position with AAI, Mr. Rettinger is deemed an affiliate of the Fund as defined under the 1940 Act. From 2013-2021, he served as Vice President and Fund Controller of ALPS Fund Services. |
Michael P. Lawlor,
1969 | Secretary | Since December 2022 | Mr. Lawlor joined ALPS in January 2022, and is currently Vice President and Principal Legal Counsel. Prior to joining ALPS, Mr. Lawlor was Lead Fund Counsel at Brighthouse Financial (insurance company) (January 2007-April 2021). Mr. Lawlor also serves as Secretary of Financial Investors Trust and ALPS Variable Investment Trust. |
Susan M. Cannon,
1974 | Assistant Secretary | Since May 2023 | Ms. Cannon joined ALPS in September 2022, and is currently a Senior Paralegal of ALPS Fund Services, Inc. Prior to joining ALPS, Ms. Cannon worked for World Premier Private Partnership, Brown Brothers Harriman & Co. |
| * | The business address of each Officer is c/o ALPS Advisors, Inc., 1290 Broadway, Suite 1000, Denver, Colorado 80203. Each Officer is deemed an affiliate of the Trust as defined under the 1940 Act. |
| ** | This is the period for which the Officer began serving the Trust. Each Officer serves an indefinite term, until his or her successor is elected. |
The Statement of Additional Information includes additional information about the Fund's Trustees and is available, without charge, upon request by calling (toll-free) 1-866-759-5679
29 | November 30, 2023


Table of Contents
| Performance Overview | 1 |
| Disclosure of Fund Expenses | 4 |
| Report of Independent Registered Public Accounting Firm | 5 |
| Financial Statements | |
| Schedule of Investments | 6 |
| Statement of Assets and Liabilities | 7 |
| Statement of Operations | 8 |
| Statement of Changes in Net Assets | 9 |
| Financial Highlights | 10 |
| Notes to Financial Statements | 11 |
| Additional Information | 16 |
| Board Considerations Regarding Approval of Investment Advisory Agreement and Sub-Advisory Agreement | 17 |
| Trustees & Officers | 19 |
alpsfunds.com
Level Four Large Cap Growth Active ETF
| Performance Overview | November 30, 2023 (Unaudited) |
Investment Objective
The Level Four Large Cap Growth Active ETF (the “Fund”) seeks maximum total return and above peer average risk-adjusted return.
Performance Overview
The Level Four Large Cap Growth Active ETF produced a total return of 5.44%, based on its market price and 5.36%, based on its NAV from its inception date of August 22, 2023, through November 30, 2023. The Fund slightly underperformed its benchmark, the Bloomberg US 1000 Growth Index, which returned 5.80% for the same period.
The Level Four Capital Management (“Level Four” or the “Sub-Adviser”) investment strategy centers on identifying undervalued companies relative to their long-term intrinsic value, gauged by the present value of future free cash flows. Level Four prioritizes strategic investments in companies positioned for enduring growth through efficient capital allocation and the cultivation of a sustainable competitive edge. Level Four’s confidence in this approach persists, and Level Four believes it aligns seamlessly with the objectives of long-term investors seeking resilient and fundamentally sound investment opportunities.
U.S. equity markets were challenged by interest rates and inflation, and the conflict between Israel and Hamas further exacerbated these challenges. Despite these headwinds, signs of a potential soft landing for the U.S. economy emerged in late October and early November, with the U.S. Federal Reserve Bank’s Open Market Committee (FOMC) holding the federal funds rate to the range of 5.25% to 5.50% for three consecutive meetings, coupled with continued robust growth and cooling inflation data. We believe investors are becoming more optimistic that the FOMC will begin to cut interest rates as early as March 2024, providing a potential tailwind for U.S. equities.
The Fund benefitted from impressive performance in the Health Care and Industrials sectors. The Communication Services and Financials sectors weighed heavily on relative performance.
The top 5 performers for the period were Uber Technologies Inc. (UBER), Microsoft Corp. (MSFT), Phillips 66 (PSX), UnitedHealth Group Inc. (UNH), and Salesforce Inc. (CRM).
The bottom 5 performers for the period were RH (RH), Alphabet Inc. Class A (GOOGL), Paycom Software Inc. (PAYC), DocuSign Inc. (DOCU), and PayPal Holdings Inc. (PYPL).
The overarching objective of Level Four’s investment process is to strategically invest in fundamentally sound businesses at appealing valuations. Level Four’s investment team remains committed to adhering to this principle for the long-term benefit of the Fund’s investors. Level Four is optimistic about the Fund's positioning, holding investments in companies with sustainable competitive advantages at what it deems to be reasonable prices.
1 | November 30, 2023
Level Four Large Cap Growth Active ETF
| Performance Overview | November 30, 2023 (Unaudited) |
Performance (as of November 30, 2023)
| | 1 Month | 3 Months | Since Inception^ |
| Level Four Large Cap Growth Active ETF - NAV | 11.99% | 1.86% | 5.36% |
| Level Four Large Cap Growth Active ETF - Market Price* | 11.98% | 1.70% | 5.44% |
| Bloomberg US 1000 Growth Index | 10.68% | 2.30% | 5.80% |
Total Expense Ratio (per the current prospectus) is 0.55%. Performance data quoted represents past performance. Past performance does not guarantee future results. Total return figures assume reinvestment of dividends and capital gains distributions, if any. The table does not reflect the deduction of taxes that a shareholder would pay on Fund distributions or the redemption of Fund shares. Investment return and principal value of an investment will fluctuate so that an investor’s shares, when sold or redeemed, may be worth more or less than the original cost. Current performance data may be higher or lower than actual data quoted. For the most current month-end performance data please visit www.alpsfunds.com or call 1.866.759.5679.
Net Asset Value (NAV) is an exchange-traded fund’s per-share value. The per-share dollar amount of the Fund is derived by dividing the total value of all the securities in its portfolio, less any liabilities, by the number of Fund shares outstanding. Market Price is the price at which a share can currently be traded in the market. Information detailing the number of days the Market Price of the Fund was greater than the Fund’s NAV and the number of days it was less than the Fund’s NAV can be obtained at www.alpsfunds.com.
| ^ | The Fund commenced operations on August 22, 2023, with the first day of trading on the exchange of August 23, 2023. |
| | |
| * | Market Price means the official closing price of a share or, if it more accurately reflects the market value of a share at the time as of which the Fund calculates current net asset value per share, the price that is the midpoint of the bid-ask spread as of that time. It does not represent the returns an investor would receive if shares were traded at other times. |
The Bloomberg US 1000 Growth Index provides exposure to companies with superior growth factor scores based on their earnings yield, valuation, dividend yield and growth.
The Fund is new with limited operating history.
One cannot invest directly in an index. Index performance does not reflect fund performance.
The Fund’s shares are not individually redeemable. Investors buy and sell shares of the Fund on a secondary market. Only market makers or “authorized participants” may trade directly with the Fund, typically in blocks of 5,000 shares.
The Level Four Large Cap Growth Active ETF is not suitable for all investors. Investments in the Fund are subject to investment risks, including possible loss of the principal amount invested.
ALPS Portfolio Solutions Distributor, Inc., a FINRA member, is the Distributor for the Level Four Large Cap Growth Active ETF.
2 | November 30, 2023
Level Four Large Cap Growth Active ETF
| Performance Overview | November 30, 2023 (Unaudited) |
Top Ten Holdings* (as of November 30, 2023)
| Apple, Inc. | 7.17% |
| Microsoft Corp. | 5.94% |
| Amazon.com, Inc. | 5.74% |
| Alphabet, Inc. | 5.01% |
| Uber Technologies, Inc. | 3.36% |
| Twilio, Inc. | 3.36% |
| BlackRock, Inc. | 3.25% |
| Lam Research Corp. | 3.23% |
| PayPal Holdings, Inc. | 3.08% |
| Booking Holdings, Inc. | 2.93% |
| Total % of Top 10 Holdings | 43.07% |
Sector Allocation* (as of November 30, 2023)
| Information Technology | 39.06% |
| Consumer Discretionary | 16.14% |
| Financials | 14.63% |
| Industrials | 8.55% |
| Communication Services | 7.92% |
| Health Care | 5.76% |
| Consumer Staples | 2.40% |
| Energy | 1.69% |
| Real Estate | 1.03% |
| Money Market Fund | 2.82% |
| Total | 100.00% |
Future holdings are subject to change.
Growth of $10,000 (as of November 30, 2023)
Comparison of Change in Value of $10,000 Investment in the Fund and the Index
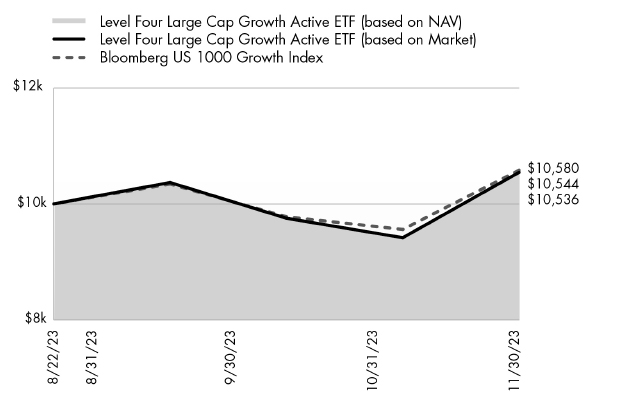
The chart above compares historical performance of a hypothetical investment of $10,000 in the Fund since inception with the performance of the Fund’s benchmark index. Results include the reinvestment of all dividends and capital gain distributions. Past performance does not guarantee future results. The chart does not reflect the deduction of taxes that a shareholder would pay on Fund distributions or the redemption of Fund shares.
3 | November 30, 2023
Level Four Large Cap Growth Active ETF
| Disclosure of Fund Expenses | November 30, 2023 (Unaudited) |
Shareholder Expense Example: As a shareholder of the Fund, you incur certain ongoing costs, including management fees and other Fund expenses. These examples are intended to help you understand your ongoing costs (in dollars) of investing in the Fund and to compare these costs with the ongoing costs of investing in other funds. The example is based on an investment of $1,000 invested at the beginning of the six month period and held through November 30, 2023.
Actual Return: The first line of the table provides information about actual account values and actual expenses. You may use the information in this line, together with the amount you invested, to estimate the expenses that you incurred over the period. Simply divide your account value by $1,000 (for example, an $8,600 account value divided by $1,000 = 8.6), then multiply the result by the number in the first line under the heading entitled “Expenses Paid During Period” to estimate the expenses attributable to your investment during this period.
Hypothetical 5% Return: The second line of the table provides information about hypothetical account values and hypothetical expenses based on the Fund’s actual expense ratio and an assumed rate of return of 5% per year before expenses, which is not the Fund’s actual return. The hypothetical account values and expenses may not be used to estimate the actual ending account balance or expenses you paid for the period. You may use this information to compare ongoing costs of investing in the Fund and other funds. To do so, compare this 5% hypothetical example with the 5% hypothetical examples that appear in the shareholder reports of other funds.
The expenses shown in the table are meant to highlight ongoing Fund costs only and do not reflect any transaction costs, such as brokerage commissions and other fees to financial intermediaries. Therefore, the second line of the table is useful in comparing ongoing costs only, and will not help you determine the relative total costs of owning different funds. In addition, if these costs were included, your costs would have been higher.
| | Beginning Account Value 6/1/23 | Ending Account Value 11/30/23 | Expense Ratio(a) | Expenses Paid During Period 6/1/23 - 11/30/23(b) |
| Level Four Large Cap Growth Active ETF | | | | |
| Actual(c) | $1,000.00 | $1,053.60 | 0.50% | $1.41 |
| Hypothetical (5% return before expenses) | $1,000.00 | $1,022.56 | 0.50% | $2.54 |
| (a) | Annualized, based on the Fund's most recent fiscal half year expenses. |
| (b) | Expenses are equal to the Fund's annualized expense ratio multiplied by the average account value over the period, multiplied by the number of days in the most recent fiscal half year (183), divided by 365. |
| (c) | Level Four Large Cap Growth Active ETF commenced operations on August 22, 2023. Actual expenses on this Fund are equal to the Fund's annualized expense ratio multiplied by the average account value of the period, multiplied by the number of days since the Fund launched (100) divided by 365. |
4 | November 30, 2023
Level Four Large Cap Growth Active ETF
Report of Independent Registered Public Accounting Firm
To the Shareholders of Level Four Large Cap Growth Active ETF and Board of Trustees of ALPS ETF Trust
Opinion on the Financial Statements
We have audited the accompanying statement of assets and liabilities, including the schedule of investments, of Level Four Large Cap Growth Active ETF (the “Fund”), a series of ALPS ETF Trust, as of November 30, 2023, the related statements of operations and changes in net assets, the related notes, and the financial highlights for the period from August 22, 2023 (commencement of operations) through November 30, 2023 (collectively referred to as the “financial statements”). In our opinion, the financial statements present fairly, in all material respects, the financial position of the Fund as of November 30, 2023, the results of its operations, the changes in net assets, and the financial highlights for the period August 22, 2023 through November 30, 2023, in conformity with accounting principles generally accepted in the United States of America.
Basis for Opinion
These financial statements are the responsibility of the Fund’s management. Our responsibility is to express an opinion on the Fund’s financial statements based on our audit. We are a public accounting firm registered with the Public Company Accounting Oversight Board (United States) (“PCAOB”) and are required to be independent with respect to the Fund in accordance with the U.S. federal securities laws and the applicable rules and regulations of the Securities and Exchange Commission and the PCAOB.
We conducted our audit in accordance with the standards of the PCAOB. Those standards require that we plan and perform the audit to obtain reasonable assurance about whether the financial statements are free of material misstatement whether due to error or fraud.
Our audit included performing procedures to assess the risks of material misstatement of the financial statements, whether due to error or fraud, and performing procedures that respond to those risks. Such procedures included examining, on a test basis, evidence regarding the amounts and disclosures in the financial statements. Our procedures included confirmation of securities owned as of November 30, 2023, by correspondence with the custodian and brokers; when replies were not received from brokers, we performed other auditing procedures. Our audit also included evaluating the accounting principles used and significant estimates made by management, as well as evaluating the overall presentation of the financial statements. We believe that our audit provides a reasonable basis for our opinion.
We have served as the auditor of one or more investment companies advised by ALPS Advisors, Inc. since 2013.

COHEN & COMPANY, LTD.
Philadelphia, Pennsylvania
January 29, 2024
5 | November 30, 2023
Level Four Large Cap Growth Active ETF
| Schedule of Investments | November 30, 2023 |
| Security Description | | Shares | | | Value | |
| COMMON STOCKS (93.41%) | | | | | | |
| Communication Services (7.61%) | | | | | | |
| Alphabet, Inc., Class A(a) | | | 23,662 | | | $ | 3,135,925 | |
| Netflix, Inc.(a) | | | 2,468 | | | | 1,169,758 | |
| Walt Disney Co. | | | 7,031 | | | | 651,703 | |
| Total Communication Services | | | | | | | 4,957,386 | |
| | | | | | | | | |
| Consumer Discretionary (15.52%) | | | | | | | | |
| Amazon.com, Inc.(a) | | | 24,583 | | | | 3,591,331 | |
| Booking Holdings, Inc.(a) | | | 587 | | | | 1,834,786 | |
| Etsy, Inc.(a) | | | 9,256 | | | | 701,697 | |
| Home Depot, Inc. | | | 4,150 | | | | 1,300,984 | |
| McDonald's Corp. | | | 2,321 | | | | 654,151 | |
| PulteGroup, Inc. | | | 7,317 | | | | 646,969 | |
| RH(a) | | | 5,105 | | | | 1,378,196 | |
| Total Consumer Discretionary | | | | | | | 10,108,114 | |
| | | | | | | | | |
| Consumer Staples (2.31%) | | | | | | | | |
| Constellation Brands, Inc., Class A | | | 3,248 | | | | 781,112 | |
| Estee Lauder Cos., Inc., Class A | | | 5,661 | | | | 722,853 | |
| Total Consumer Staples | | | | | | | 1,503,965 | |
| | | | | | | | | |
| Energy (1.63%) | | | | | | | | |
| Phillips 66 | | | 8,215 | | | | 1,058,831 | |
| | | | | | | | | |
| Financials (14.06%) | | | | | | | | |
| BlackRock, Inc. | | | 2,712 | | | | 2,037,335 | |
| Fidelity National Information Services, Inc. | | | 11,732 | | | | 687,964 | |
| Mastercard, Inc., Class A | | | 3,165 | | | | 1,309,772 | |
| Morgan Stanley | | | 16,131 | | | | 1,279,834 | |
| MSCI, Inc. | | | 2,431 | | | | 1,266,186 | |
| PayPal Holdings, Inc.(a) | | | 33,441 | | | | 1,926,537 | |
| Visa, Inc., Class A | | | 2,549 | | | | 654,277 | |
| Total Financials | | | | | | | 9,161,905 | |
| | | | | | | | | |
| Health Care (5.54%) | | | | | | | | |
| AbbVie, Inc. | | | 5,216 | | | | 742,707 | |
| Biogen, Inc.(a) | | | 2,775 | | | | 649,572 | |
| UnitedHealth Group, Inc. | | | 2,918 | | | | 1,613,566 | |
| Vertex Pharmaceuticals, Inc.(a) | | | 1,694 | | | | 601,048 | |
| Total Health Care | | | | | | | 3,606,893 | |
| | | | | | | | | |
| Industrials (8.21%) | | | | | | | | |
| Fortive Corp. | | | 9,397 | | | | 648,205 | |
| Lockheed Martin Corp. | | | 1,510 | | | | 676,133 | |
| Paycom Software, Inc. | | | 3,558 | | | | 646,346 | |
| TransDigm Group, Inc. | | | 675 | | | | 649,937 | |
| Uber Technologies, Inc.(a) | | | 37,316 | | | | 2,103,877 | |
| United Rentals, Inc. | | | 1,317 | | | | 626,918 | |
| Total Industrials | | | | | | | 5,351,416 | |
| | | | | | | | | |
| Information Technology (37.54%) | | | | | | | | |
| Akamai Technologies, Inc.(a) | | | 5,644 | | | | 652,051 | |
| Apple, Inc. | | | 23,618 | | | | 4,486,239 | |
| Applied Materials, Inc. | | | 8,508 | | | | 1,274,328 | |
| Security Description | | Shares | | | Value | |
| Information Technology (continued) | | | | | | |
| Broadcom, Inc. | | | 695 | | | $ | 643,382 | |
| Cognizant Technology Solutions Corp., Class A | | | 9,365 | | | | 659,109 | |
| DocuSign, Inc.(a) | | | 29,637 | | | | 1,277,355 | |
| Dropbox, Inc.(a) | | | 46,353 | | | | 1,306,228 | |
| Lam Research Corp. | | | 2,822 | | | | 2,020,327 | |
| Micron Technology, Inc. | | | 19,918 | | | | 1,516,159 | |
| Microsoft Corp. | | | 9,822 | | | | 3,721,653 | |
| Monolithic Power Systems, Inc. | | | 2,431 | | | | 1,333,938 | |
| NVIDIA Corp. | | | 1,359 | | | | 635,604 | |
| Palo Alto Networks, Inc.(a) | | | 2,427 | | | | 716,183 | |
| Salesforce, Inc.(a) | | | 5,740 | | | | 1,445,906 | |
| ServiceNow, Inc.(a) | | | 967 | | | | 663,111 | |
| Twilio, Inc., Class A(a) | | | 32,525 | | | | 2,103,717 | |
| Total Information Technology | | | | | | | 24,455,290 | |
| | | | | | | | | |
| Real Estate (0.99%) | | | | | | | | |
| Zillow Group, Inc.(a) | | | 15,788 | | | | 646,361 | |
| | | | | | | | | |
| TOTAL COMMON STOCKS | | | | | | | | |
| (Cost $56,191,466) | | | | | | | 60,850,161 | |
| | | 7 Day Yield | | | Shares | | | Value | |
| SHORT TERM INVESTMENTS (2.70%) | |
| Money Market Fund (2.70%) | | | | |
| State Street Institutional Treasury Plus Money Market Fund (Premier Class) | | | 5.31 | % | | | 1,760,769 | | | | 1,760,769 | |
| | | | | | | | | | | | | |
| TOTAL SHORT TERM INVESTMENTS | | | | |
| (Cost $1,760,769) | | | | | | | | | | | 1,760,769 | |
| | | | | | | | | | | | | |
| TOTAL INVESTMENTS (96.11%) | | | | |
| (Cost $57,952,235) | | | | | | | | | | $ | 62,610,930 | |
| OTHER ASSETS IN EXCESS OF LIABILITIES (3.89%) | | | 2,532,768 | |
| NET ASSETS - 100.00% | | | | | | | $ | 65,143,698 | |
| (a) | Non-income producing security. |
See Notes to Financial Statements.
6 | November 30, 2023
Level Four Large Cap Growth Active ETF
| Statement of Assets and Liabilities | November 30, 2023 |
| ASSETS: | | | |
| Investments, at value | | $ | 62,610,930 | |
| Receivable for investments sold | | | 2,509,126 | |
| Dividends receivable | | | 53,447 | |
| Receivable for shares sold | | | 1,444,272 | |
| Total Assets | | | 66,617,775 | |
| | | | | |
| LIABILITIES: | | | | |
| Payable for capital shares redeemed | | | 1,448,574 | |
| Payable to adviser | | | 25,503 | |
| Total Liabilities | | | 1,474,077 | |
| NET ASSETS | | $ | 65,143,698 | |
| | | | | |
| NET ASSETS CONSIST OF: | | | | |
| Paid-in capital | | $ | 60,558,990 | |
| Total distributable earnings/(accumulated losses) | | | 4,584,708 | |
| NET ASSETS | | $ | 65,143,698 | |
| | | | | |
| INVESTMENTS, AT COST | | $ | 57,952,235 | |
| | | | | |
| PRICING OF SHARES | | | | |
| Net Assets | | $ | 65,143,698 | |
| Shares of beneficial interest outstanding (Unlimited number of shares authorized, par value $0.01 per share) | | | 2,473,400 | |
| Net Asset Value, offering and redemption price per share | | $ | 26.34 | |
See Notes to Financial Statements.
7 | November 30, 2023
Level Four Large Cap Growth Active ETF
| Statement of Operations | For the Period Ended November 30, 2023 (a) |
| INVESTMENT INCOME: | | | |
| Dividend Income* | | $ | 238,915 | |
| Securities Lending Income | | | 26 | |
| Total Investment Income | | | 238,941 | |
| | | | | |
| EXPENSES: | | | | |
| Investment adviser fees | | | 79,117 | |
| Net Expenses | | | 79,117 | |
| NET INVESTMENT INCOME | | | 159,824 | |
| | | | | |
| REALIZED AND UNREALIZED GAIN/(LOSS): | | | | |
| Net realized gain on investments(b) | | | 9,283,712 | |
| Net realized loss on foreign currency transactions | | | (10 | ) |
| Total Net realized gain | | | 9,283,702 | |
| Net change in unrealized depreciation on investments | | | (5,880,533 | ) |
| Total net change in unrealized depreciation | | | (5,880,533 | ) |
| NET REALIZED AND UNREALIZED GAIN ON INVESTMENTS | | | 3,403,169 | |
| NET INCREASE IN NET ASSETS RESULTING FROM OPERATIONS | | $ | 3,562,993 | |
| * | Net of foreign tax withholding of $458. |
| (a) | The Level Four Large Cap Growth Active ETF commenced operations on August 22, 2023. |
| (b) | Includes realized gain or loss as a result of in-kind transactions (See Note 4 in Notes to Financial Statements). |
See Notes to Financial Statements.
8 | November 30, 2023
Level Four Large Cap Growth Active ETF
Statement of Changes in Net Assets
| | | For the Period August 22, 2023 (Commencement of Operations) to November 30, 2023 | |
| OPERATIONS: | | | | |
| Net investment income | | $ | 159,824 | |
| Net realized gain | | | 9,283,702 | |
| Net change in unrealized appreciation/(depreciation) | | | (5,880,533 | ) |
| Net increase in net assets resulting from operations | | | 3,562,993 | |
| | | | | |
| CAPITAL SHARE TRANSACTIONS: | | | | |
| Proceeds from sale of shares* | | | 79,064,503 | |
| Cost of shares redeemed | | | (17,483,798 | ) |
| Net increase from capital share transactions | | | 61,580,705 | |
| Net increase in net assets | | | 65,143,698 | |
| | | | | |
| NET ASSETS: | | | | |
| Beginning of period | | | – | |
| End of period | | $ | 65,143,698 | |
| | | | | |
| OTHER INFORMATION: | | | | |
| CAPITAL SHARE TRANSACTIONS: | | | | |
| Beginning shares | | | – | |
| Shares sold | | | 3,183,400 | |
| Shares redeemed | | | (710,000 | ) |
| Shares outstanding, end of period | | | 2,473,400 | |
| * | On August 22, 2023, the Fund received securities in connection with an in-kind subscription transaction. The seed shares totaled 883,398 with a NAV of $25. For financial reporting purposes, these transactions were treated as purchases of securities and recognized based on the market value of the securities. The value of the initial in-kind subscription was $22,084,950. |
See Notes to Financial Statements.
9 | November 30, 2023
Level Four Large Cap Growth Active ETF
| Financial Highlights | For a Share Outstanding Throughout the Period Presented |
| | | For the Period August 22, 2023 (Commencement of Operations) to November 30, 2023 | |
| NET ASSET VALUE, BEGINNING OF PERIOD | | $ | 25.00 | |
| | | | | |
| INCOME FROM OPERATIONS: | | | | |
| Net investment income(a) | | | 0.07 | |
| Net realized and unrealized gain | | | 1.27 | |
| Total from investment operations | | | 1.34 | |
| | | | | |
| NET INCREASE IN NET ASSET VALUE | | | 1.34 | |
| NET ASSET VALUE, END OF PERIOD | | $ | 26.34 | |
| TOTAL RETURN(b) | | | 5.36 | % |
| | | | | |
| RATIOS/SUPPLEMENTAL DATA: | | | | |
| Net assets, end of period (in 000s) | | $ | 65,144 | |
| | | | | |
| RATIOS TO AVERAGE NET ASSETS | | | | |
| Ratio of expenses to average net assets | | | 0.50 | %(c) |
| Ratio of net investment income to average net assets | | | 1.01 | %(c) |
| Portfolio turnover rate(d) | | | 0 | % |
| (a) | Based on average shares outstanding during the period. |
| (b) | Total return is calculated assuming an initial investment made at the net asset value at the beginning of the period and redemption at the net asset value on the last day of the period and assuming all distributions are reinvested at the reinvestment prices. Total return calculated for a period of less than one year is not annualized. |
| (c) | Annualized. |
| (d) | Portfolio turnover for periods less than one year are not annualized and does not include securities received or delivered from processing creations or redemptions in-kind. |
See Notes to Financial Statements.
10 | November 30, 2023
Level Four Large Cap Growth Active ETF
| Notes to Financial Statements | November 30, 2023 |
1. ORGANIZATION
ALPS ETF Trust (the “Trust”), a Delaware statutory trust, is an open-end management investment company registered under the Investment Company Act of 1940, as amended (the “1940 Act”). As of November 30, 2023, the Trust consisted of twenty-three separate portfolios. Each portfolio represents a separate series of the Trust. This report pertains solely to the Level Four Large Cap Growth Active ETF (the “Fund”). The investment objective of the Fund is to seek maximum total return and above peer average risk-adjusted return. The Fund has elected to qualify as a diversified series of the Trust under the 1940 Act.
The Fund’s Shares (“Shares”) are listed on the Nasdaq Stock Market LLC (“Nasdaq Exchange”). The Fund issues and redeems Shares, at net asset value (“NAV”) in blocks of 5,000 Shares, each of which is called a “Creation Unit”. Creation Units are issued and redeemed principally in-kind for securities. Except when aggregated in Creation Units, Shares are not redeemable securities of the Fund.
The Sub-Adviser manages multiple separately managed accounts (the “SMAs”) that contributed specific assets to the Fund (the “Contribution”). The Adviser and Sub-Adviser paid all costs surrounding the Contribution. The Contribution was tax free, and the cost basis of the SMAs were carried forward to the Fund for tax and financial reporting purposes. The Contribution resulted in seed shares totaling 883,398 with a Net Asset Value of $25. The details of the Contribution are shown below:
| Net Assets | Market Value of Investments | Cost of Investments | Unrealized Appreciation |
| $ 22,084,950 | $ 22,084,950 | $ 11,545,722 | $ 10,539,228 |
Pursuant to the Trust’s organizational documents, its Officers and Trustees are indemnified against certain liability arising out of the performance of their duties to the Trust. Additionally, in the normal course of business, the Trust enters into contracts with service providers that contain general indemnification clauses. The Trust’s maximum exposure under these arrangements is unknown, as this would involve future claims that may be made against the Trust that have not yet occurred.
2. SIGNIFICANT ACCOUNTING POLICIES
The following is a summary of significant accounting policies consistently followed by the Fund in the preparation of the financial statements. The accompanying financial statements were prepared in accordance with accounting principles generally accepted in the United States of America (“U.S. GAAP”). The preparation of financial statements in conformity with U.S. GAAP requires management to make certain estimates and assumptions that affect the reported amounts of assets and liabilities and disclosures of contingent assets and liabilities at the date of the financial statements and the reported amounts of revenue and expenses during the period. Actual results could differ from those estimates. The Fund is considered an investment company under U.S. GAAP and follows the accounting and reporting guidance applicable to investment companies in the Financial Accounting Standards Board (“FASB”) Accounting Standards Codification Topic 946.
A. Portfolio Valuation
The Fund’s NAV is determined daily, as of the close of regular trading on the New York Stock Exchange (the “NYSE”), normally 4:00 p.m. Eastern Time, on each day the NYSE is open for trading. The NAV is computed by dividing the value of all assets of the Fund (including accrued interest and dividends), less all liabilities (including accrued expenses and dividends declared but unpaid), by the total number of shares outstanding.
Portfolio securities listed on any exchange other than the NASDAQ Stock Market LLC (“NASDAQ”) are valued at the last sale price on the business day as of which such value is being determined. If there has been no sale on such day, the securities are valued at the mean of the most recent bid and ask prices on such day. Securities traded on the NASDAQ are valued at the NASDAQ Official Closing Price as determined by NASDAQ. Portfolio securities traded on more than one securities exchange are valued at the last sale price on the business day as of which such value is being determined at the close of the exchange representing the principal market for such securities. Portfolio securities traded in the over-the-counter market, but excluding securities traded on the NASDAQ, are valued at the last quoted sale price in such market.
The Fund’s investments are valued at market value or, in the absence of market value with respect to any portfolio securities, at fair value according to procedures adopted by the Trust’s Board of Trustees (the “Board”). Pursuant to Rule 2a-5 under the 1940 Act, the Board designated ALPS Advisors, Inc. (the "Adviser") as the valuation designee ("Valuation Designee") for the Fund to perform the fair value determinations relating to Fund investments. The Adviser may carry out its designated responsibilities as Valuation Designee through various teams and committees. When market quotations are not readily available or when events occur that make established valuation methods unreliable, securities of the Fund may be valued in good faith by the Valuation Designee. These securities generally include, but are not limited to, restricted securities (securities which may not be publicly sold without registration under the Securities Act of 1933) for which a pricing service is unable to provide a market price; securities whose trading has been formally suspended; a security whose market price is not available from a pre-established primary pricing source or the pricing source is not willing to provide a price; a security with respect to which an event has occurred that is most likely to materially affect the value of the security after the market has closed but before the calculation of the Fund’s NAV or make it difficult or impossible to obtain a reliable market quotation; or a security whose price, as provided by the pricing service, does not reflect the security’s “fair value” due to the security being de-listed from a national exchange or the security’s primary trading market is temporarily closed at a time when, under normal conditions, it would be open. As a general principle, the current “fair value” of a security would be the amount which the owner might reasonably expect to receive from the sale on the applicable exchange or principal market. A variety of factors may be considered in determining the fair value of such securities.
11 | November 30, 2023
Level Four Large Cap Growth Active ETF
| Notes to Financial Statements | November 30, 2023 |
B. Fair Value Measurements
The Fund discloses the classification of its fair value measurements following a three-tier hierarchy based on the inputs used to measure fair value. Inputs refer broadly to the assumptions that market participants would use in pricing the asset or liability, including assumptions about risk. Inputs may be observable or unobservable. Observable inputs reflect the assumptions market participants would use in pricing the asset or liability that are developed based on market data obtained from sources independent of the reporting entity. Unobservable inputs reflect the reporting entity’s own assumptions about the assumptions market participants would use in pricing the asset or liability that are developed based on the best information available.
Valuation techniques used to value the Fund’s investments by major category are as follows:
Equity securities, including restricted securities, for which market quotations are readily available, are valued at the last reported sale price or official closing price as reported by a third party pricing vendor on the primary market or exchange on which they are traded and are categorized as Level 1 in the hierarchy. In the event there were no sales during the day or closing prices are not available, securities are valued at the mean of the most recent quoted bid and ask prices on such day and are generally categorized as Level 2 in the hierarchy. Investments in open-end mutual funds are valued at their closing NAV each business day and are categorized as Level 1 in the hierarchy.
Changes in valuation techniques may result in transfers in or out of an assigned level within the disclosure hierarchy.
Various inputs are used in determining the value of the Fund’s investments as of the end of the reporting period. When inputs used fall into different levels of the fair value hierarchy, the level in the hierarchy within which the fair value measurement falls is determined based on the lowest level input that is significant to the fair value measurement in its entirety. The designated input levels are not necessarily an indication of the risk or liquidity associated with these investments.
These inputs are categorized in the following hierarchy under applicable financial accounting standards:
| Level 1 | – | Unadjusted quoted prices in active markets for identical investments, unrestricted assets or liabilities that a Fund has the ability to access at the measurement date; |
| Level 2 | – | Quoted prices which are not active, quoted prices for similar assets or liabilities in active markets or inputs other than quoted prices that are observable (either directly or indirectly) for substantially the full term of the asset or liability; and |
| Level 3 | – | Significant unobservable prices or inputs (including the Fund’s own assumptions in determining the fair value of investments) where there is little or no market activity for the asset or liability at the measurement date. |
The following is a summary of the inputs used to value the Fund’s investments as of November 30, 2023:
Level Four Large Cap Growth Active ETF
| Investments in Securities at Value | | Level 1 - Quoted and Unadjusted Prices | | | Level 2 - Other Significant Observable Inputs | | | Level 3 – Significant Unobservable Inputs | | | Total | |
| Common Stocks* | | $ | 60,850,161 | | | $ | – | | | $ | – | | | $ | 60,850,161 | |
| Short Term Investments | | | 1,760,769 | | | | – | | | | – | | | | 1,760,769 | |
| Total | | $ | 62,610,930 | | | $ | – | | | $ | – | | | $ | 62,610,930 | |
| * | For a detailed breakdown of sectors, see the accompanying Schedule of Investments. |
The Fund did not have any securities that used significant unobservable inputs (Level 3) in determining fair value and there were no transfers into or out of Level 3 during the period ended November 30, 2023.
12 | November 30, 2023
Level Four Large Cap Growth Active ETF
| Notes to Financial Statements | November 30, 2023 |
C. Securities Transactions and Investment Income
Securities transactions are recorded as of the trade date. Realized gains and losses from securities transactions are recorded on the specific identification in accordance with GAAP. Dividend income and capital gains distributions, if any, are recorded on the ex-dividend date. Interest income, if any, is recorded on the accrual basis.
D. Dividends and Distributions to Shareholders
Dividends from net investment income of the Fund, if any, are declared and paid quarterly or as the Board may determine from time to time. Distributions of net realized capital gains earned by the Fund, if any, are distributed at least annually.
E. Federal Tax and Tax Basis Information
The timing and character of income and capital gain distributions are determined in accordance with income tax regulations, which may differ from
U.S. GAAP. Reclassifications are made to the Fund’s capital accounts for permanent tax differences to reflect income and gains available for distribution (or available capital loss carryforwards) under income tax regulations.
For the year ended November 30, 2023, the following reclassifications, which had no impact on results of operations or net assets, were recorded to reflect permanent tax differences resulting primarily from in-kind transactions:
| Fund | | Paid-in Capital | | | Total Distributable Earnings/(Accumulated Losses) | |
| Level Four Large Cap Growth Active ETF | | $ | 9,517,513 | | | $ | (9,517,513 | ) |
The character of distributions made during the fiscal year may differ from its ultimate characterization for federal income tax purposes.
Under current law, capital losses maintain their character as short-term or long-term and are carried forward to the next tax year without expiration. As of November 30, 2023, the following amounts are available as carry forwards to the next tax year:
| Fund | | Short-Term | | | Long-Term | |
| Level Four Large Cap Growth Active ETF | | $ | 47,999 | | | $ | 185,802 | |
As of November 30, 2023, the components of distributable earnings/(accumulated losses) on a tax basis were as follows:
| Fund | | Accumulated Net Investment Income | | | Accumulated Net Realized Gain/(Loss) on Investments | | | Other Accumulated Losses | | | Net Unrealized Appreciation/(Depreciation) on Investments | | | Total | |
| Level Four Large Cap Growth Active ETF | | $ | 159,814 | | | $ | (233,801 | ) | | $ | – | | | $ | 4,658,695 | | | $ | 4,584,708 | |
As of November 30, 2023, the cost of investments for federal income tax purposes and accumulated net unrealized appreciation/(depreciation) on investments were as follows:
| | | Level Four Large Cap Growth Active ETF | |
| Gross appreciation (excess of value over tax cost) | | $ | 5,599,625 | |
| Gross depreciation (excess of tax cost over value) | | | (940,930 | ) |
| Net unrealized appreciation/(depreciation) | | $ | 4,658,695 | |
| Cost of investments for income tax purposes | | $ | 57,952,235 | |
The differences between book-basis and tax-basis are primarily due to the deferral of losses from wash sales.
13 | November 30, 2023
Level Four Large Cap Growth Active ETF
| Notes to Financial Statements | November 30, 2023 |
F. Income Taxes
No provision for income taxes is included in the accompanying financial statements, as the Fund intends to distribute to shareholders all taxable investment income and realized gains and otherwise comply with Subchapter M of the Internal Revenue Code of 1986, as amended, applicable to regulated investment companies. The Fund evaluates tax positions taken (or expected to be taken) in the course of preparing the Fund’s tax returns to determine whether these positions meet a “more-likely-than-not” standard that, based on the technical merits, have a more than fifty percent likelihood of being sustained by a taxing authority upon examination. A tax position that meets the “more-likely-than-not” recognition threshold is measured to determine the amount of benefit to recognize in the financial statements.
As of and during the period ended November 30, 2023, the Fund did not have a liability for any unrecognized tax benefits. The Fund files U.S. federal, state, and local tax returns as required. The Fund’s tax returns are subject to examination by the relevant tax authorities until expiration of the applicable statute of limitations, which is generally three years after the filing of the tax return, but may extend to four years in certain jurisdictions. Tax returns for open years have incorporated no uncertain tax positions that require a provision for income taxes.
G. Lending of Portfolio Securities
The Fund has entered into a securities lending agreement with State Street Bank & Trust Co. (“SSB”), the Fund’s lending agent. The Fund may lend its portfolio securities only to borrowers that are approved by SSB. The Fund will limit such lending to not more than 33 1/3% of the value of its total assets. The Fund’s securities held at SSB as custodian shall be available to be lent except those securities the Fund or ALPS Advisors, Inc. specifically identifies in writing as not being available for lending. The borrower pledges and maintains with the Fund collateral consisting of cash (U.S. Dollars only), securities issued or guaranteed by the U.S. government or its agencies or instrumentalities, and cash equivalents (including irrevocable bank letters of credit) issued by a person other than the borrower or an affiliate of the borrower. The initial collateral received by the Fund is required to have a value of no less than 102% of the market value of the loaned securities for U.S equity securities and a value of no less than 105% of the market value for non-U.S. equity securities. The collateral is maintained thereafter, at a market value equal to not less than 102% of the current value of the U.S. equity securities on loan and not less than 105% of the current value of the non-U.S. equity securities on loan. The market value of the loaned securities is determined at the close of each business day and any additional required collateral is delivered to the Fund on the next business day. During the term of the loan, the Fund is entitled to all distributions made on or in respect of the loaned securities. Loans of securities are terminable at any time and the borrower, after notice, is required to return borrowed securities within the customary time period for settlement of securities transactions.
Any cash collateral received is reinvested in a money market fund managed by SSB as disclosed in the Fund’s Schedule of Investments and is reflected in the Statement of Assets and Liabilities as a payable for collateral upon return of securities loaned. Non-cash collateral, in the form of securities issued or guaranteed by the U.S. government or its agencies or instrumentalities, is not disclosed in the Fund’s Statement of Assets and Liabilities or the contractual maturity table below as it is held by the lending agent on behalf of the Fund, and the Fund does not have the ability to re-hypothecate these securities. Income earned by the Fund from securities lending activity is disclosed in the Statement of Operations. As of November 30, 2023, the Fund did not have any securities on loan.
3. INVESTMENT ADVISORY FEE AND OTHER AFFILIATED TRANSACTIONS
ALPS Advisors, Inc. serves as the Fund’s investment adviser pursuant to an Investment Advisory Agreement with the Trust on behalf of the Fund (the “Advisory Agreement”). Pursuant to the Advisory Agreement, the Fund pays the Adviser an annual management fee for the services and facilities it provides, payable on a monthly basis at the annual rate of 0.50% of the Fund’s average daily net assets.
Out of the unitary management fees, the Adviser pays substantially all expenses of the Fund, including licensing fees to the Underlying Index provider, the cost of transfer agency, custody, fund administration, legal, audit, trustees and other services, except for acquired fund fees and expenses, interest expenses, distribution fees or expenses, brokerage expenses, taxes and extraordinary expenses not incurred in the ordinary course of the Fund's business. The Adviser’s unitary management fee is designed to pay substantially all of the Fund’s expenses and to compensate the Adviser for providing services to the Fund.
Level Four Capital Management, LLC (“Level Four” or the “Sub-Adviser”) serves as the Fund's sub-adviser pursuant to a sub-advisory agreement with the Trust (the ‘‘Sub-Advisory Agreement’’). Pursuant to the Sub-Advisory Agreement, the Adviser pays the Sub-Adviser a sub-advisory fee out of the Adviser's advisory fee for the services it provides. The fee is payable on a monthly basis at the annual rate of 0.25% of the Fund's average daily net assets.
ALPS Fund Services, Inc., an affiliate of the Adviser, is the administrator of the Fund.
14 | November 30, 2023
Level Four Large Cap Growth Active ETF
| Notes to Financial Statements | November 30, 2023 |
Each Trustee receives (1) a quarterly retainer of $25,000, (2) a per meeting fee of $15,000, (3) $2,500 for any special meeting held outside of a regularly scheduled board meeting, and (4) reimbursement for all reasonable out-of-pocket expenses relating to attendance at meetings. In addition, the Chairman of the Board receives a quarterly retainer of $5,000, the Chairman of the Audit Committee receives a quarterly retainer of $3,000, and the Chairman of the Nominating & Governance Committee receives a quarterly retainer of $2,000, each in connection with their respective roles.
4. PURCHASES AND SALES OF SECURITIES
For the period ended November 30, 2023 the cost of purchases and proceeds from sales of investment securities, excluding short-term investments and in-kind transactions, were as follows:
| Fund | | Purchases | | | Sales | |
| Level Four Large Cap Growth Active ETF | | $ | 3,494 | | | $ | 1,775,523 | |
For the period ended November 30, 2023, the cost of in-kind purchases and proceeds from in-kind sales were as follows:
| Fund | | Purchases | | | Sales | |
| Level Four Large Cap Growth Active ETF | | $ | 66,035,342 | | | $ | 17,355,111 | |
For the period ended November 30, 2023, the Level Four Large Cap Growth Active ETF had in-kind net realized gain of $9,517,190.
Gains on in-kind transactions are not considered taxable for federal income tax purposes and losses on in-kind transactions are also not deductible for tax purposes.
5. CAPITAL SHARE TRANSACTIONS
Shares are created and redeemed by the Fund only in Creation Unit size aggregations of 5,000 Shares. Only broker-dealers or large institutional investors with creation and redemption agreements called Authorized Participants (“AP”) are permitted to purchase or redeem Creation Units from the Fund. Such transactions are generally permitted on an in-kind basis, with a balancing cash component to equate the transaction to the NAV per unit of the Fund on the transaction date. Cash may be substituted equivalent to the value of certain securities generally when they are not available in sufficient quantity for delivery, not eligible for trading by the AP or as a result of other market circumstances.
6. MARKET RISK
The Fund is subject to investment and operational risks associated with financial, economic and other global market developments and disruptions, including those arising from war, terrorism, market manipulation, government interventions, defaults and shutdowns, political changes or diplomatic developments, public health emergencies (such as the spread of infectious diseases, pandemics and epidemics) and natural/environmental disasters, which can negatively impact the securities markets and cause the Fund to lose value. Securities in the Fund’s portfolio may underperform in comparison to securities in general financial markets, a particular financial market or other asset classes due to a number of factors, including inflation (or expectations for inflation), deflation (or expectations for deflation), interest rates, global demand for particular products or resources, market instability, debt crises and downgrades, embargoes, tariffs, sanctions and other trade barriers, regulatory events, other governmental trade or market control programs and related geopolitical events. In addition, the value of the Fund’s investments may be negatively affected by the occurrence of global events such as war, terrorism, environmental disasters, natural disasters or events, country instability, and infectious disease epidemics or pandemics.
7. REGULATORY UPDATE
The U.S. Securities and Exchange Commission ("SEC") adopted rule and form amendments that will change the format and content of the Fund's annual and semi-annual reports. Certain information, including the financial statements, will not appear in the Fund's new tailored shareholder reports but will be available online, delivered free of charge upon request, and filed on a semi-annual basis on form N-CSR. The rule and form amendments have a compliance date of July 24, 2024. At this time, the Trust is evaluating the impact of these rule and form amendment changes.
8. SUBSEQUENT EVENTS
Subsequent events, if any, after the date of the Statement of Assets and Liabilities have been evaluated through the date the financial statements were issued. Management has determined that there were no subsequent events to report through the issuance of these financial statements.
15 | November 30, 2023
Level Four Large Cap Growth Active ETF
| Additional Information | November 30, 2023 (Unaudited) |
PROXY VOTING RECORDS, POLICIES AND PROCEDURES
Information regarding how the Fund voted proxies relating to portfolio securities during the most recent 12-month period ended June 30 and a description of the Fund’s proxy voting policies and procedures used in determining how to vote for proxies are available without charge on the SEC’s website at www.sec.gov and upon request, by calling (toll-free) 1-866-759-5679.
PORTFOLIO HOLDINGS
The Fund files a complete schedule of portfolio holdings with the U.S. Securities and Exchange Commission (“SEC”) for the first and third quarters of each fiscal year on Form N-PORT within 60 days after the end of the period. Copies of the Fund’s Form N-PORT are available without a charge, upon request, by contacting the Fund at 1-866-759-5679 and on the SEC’s website at https://www.sec.gov.
TAX INFORMATION
The Fund will notify shareholders in early 2024 of amounts paid to them by the Fund, if any, during the calendar year 2023.
16 | November 30, 2023
Level Four Large Cap Growth Active ETF
| Board Considerations Regarding Approval of Investment Advisory Agreement and Sub-Advisory Agreement | November 30, 2023 (Unaudited) |
At a meeting held on March 7, 2023, the Board of Trustees of the Trust (the “Board” or the “Trustees”), where each Trustee is not an “interested person” of the Trust within the meaning of the Investment Company Act of 1940, as amended (the “Independent Trustees”), evaluated a proposal to approve the Investment Advisory Agreement (the "New Fund Advisory Agreement") between the Trust and ALPS Advisors, Inc. (the “Adviser” or “AAI”) with respect to Level Four Large Cap Growth Active ETF (the “New Fund”). In evaluating the New Fund Advisory Agreement, the Board, including the Independent Trustees, considered various factors, including (i) the nature, extent and quality of the services expected to be provided by the Adviser to the New Fund under the New Fund Advisory Agreement; (ii) the advisory fees and other expenses proposed to be paid by the New Fund compared to those of similar funds managed by other investment advisers; (iii) the expected costs of the services to be provided to the New Fund and the projected profitability to be realized by the Adviser and its affiliates from the Adviser’s relationship with the New Fund; (iv) the extent to which economies of scale would be realized if and as the New Fund’s assets increase and whether the fee level in the New Fund Advisory Agreement reflects these economies of scale for the benefit of shareholders; and (v) any additional benefits and other considerations.
With respect to the nature, extent and quality of the services to be provided by the Adviser under the New Fund Advisory Agreement, the Board considered and reviewed information concerning the services proposed to be provided under the New Fund Advisory Agreement, the proposed investment strategy for the New Fund, financial information regarding the Adviser and its parent company, information describing the Adviser’s current organization and the background and experience of the persons who would be responsible for the day-to-day management of the New Fund, the anticipated financial support of the New Fund, and the nature and quality of services provided to other ETFs, open-end and closed-end funds sponsored by the Adviser. Based upon their review, the Board concluded that the Adviser was qualified to oversee the services to be provided by other service providers and that the services to be provided by the Adviser to the New Fund are expected to be satisfactory.
With respect to the costs of services to be provided and profits to be realized by the Adviser, the Board considered the resources involved in managing the New Fund as well as the fact that the Adviser agreed to pay all of the New Fund’s expenses (except for interest expenses, distribution fees or expenses, brokerage expenses, taxes and extraordinary expenses such as litigation and other expenses not incurred in the ordinary course of the New Fund’s business) out of the unitary advisory fee. Based on their review, the Board concluded that the expected profitability of the New Fund to the Adviser was not unreasonable.
The Board, including the Independent Trustees, also reviewed comparative fee and expense data provided by FUSE regarding the New Fund. The Trustees noted the proposed advisory fee for services to be provided to the New Fund by the Adviser was 0.50% of New Fund’s average daily net assets. The Trustees also considered that the advisory fee with respect to the New Fund was a unitary one and that, as set forth above, the Adviser had agreed to pay all of the New Fund’s expenses (except for interest expenses, marketing fees, distribution fees or expenses, brokerage expenses, taxes and extraordinary expenses such as litigation and other expenses not incurred in the ordinary course of the New Fund’s business) out of the unitary fee. The Board considered that, taking into account the impact of the New Fund’s unitary advisory fee, the New Fund’s expense ratio was below the median of both of its FUSE gross advisory fees peer group and total net expenses peer group. Based on the foregoing and the other information available to them, the Board concluded that the advisory fees for the New Fund were reasonable under the circumstances and in light of the quality of services to be provided.
The Board also considered other benefits that may be realized by the Adviser from its relationship with the New Fund and concluded that the advisory fees were reasonable taking into account such benefits.
The Board considered the extent to which economies of scale would be realized as the New Fund grows and whether fee levels reflect a reasonable sharing of such economies of scale for the benefit of the New Fund investors. Because the New Fund is newly organized, the Trustees reviewed the New Fund’s proposed unitary advisory fee and anticipated expenses and determined to review economies of scale in the future when the New Fund had attracted assets.
In voting to approve the New Fund Advisory Agreement, the Board concluded that the terms of the New Fund Advisory Agreement are reasonable and fair in light of the services to be performed, the fees paid by certain other funds, expenses to be incurred and such other matters as the Board considered relevant in the exercise of their reasonable business judgment The Board did not identify any single factor or group of factors as all important or controlling and considered all factors together.
The Board next discussed the New Level Four Fund Sub-Advisory Agreement (the “New Fund Sub-Advisory Agreement”).
In evaluating the New Fund Sub-Advisory Agreement, the Board considered various factors, including (i) the nature, extent and quality of the services expected to be provided by the Sub-Adviser with respect to the New Fund under the New Fund Sub-Advisory Agreement; (ii) the advisory fees and other expenses proposed to be paid by the New Fund compared to those of similar funds managed by other investment advisers; (iii) the projected profitability to the Sub-Adviser of its proposed sub-advisory relationship with the New Fund and the reasonableness of compensation to the Sub- Adviser (iv) the extent to which economies of scale would be realized if, and as, the New Fund’s assets increase, and whether the fee level in the New Fund Sub-Advisory Agreement reflects these economies of scale; and (v) any additional benefits and other considerations.
17 | November 30, 2023
Level Four Large Cap Growth Active ETF
| Board Considerations Regarding Approval of Investment Advisory Agreement and Sub-Advisory Agreement | November 30, 2023 (Unaudited) |
With respect to the nature, extent and quality of the services to be provided by the Sub-Adviser under the New Fund Sub-Advisory Agreement, the Board considered and reviewed information concerning the services to be provided under the New Fund Sub-Advisory Agreement, the proposed investment strategy, financial information regarding the Sub-Adviser, information describing the Sub-Adviser’s current organization and the background and experience of the persons who would be responsible for the day-to-day management of the New Fund. Based upon their review, the Board concluded that the Sub-Adviser was qualified to oversee the portfolio management of the New Fund. The Board considered that the contractual sub-advisory fee to be paid to Level Four is 0.25% of New Fund’s average daily net assets out of a total management fee of 0.50% with respect to New Fund. Based on the consideration of all factors deemed relevant by them, the Board concluded that the sub-advisory fees to be received by the Sub-Adviser under the New Fund Sub-Advisory Agreement are reasonable under the circumstances and in light of the quality of services provided.
With respect to the costs of services provided and profits realized by the Sub-Adviser, the Board considered the resources involved in managing the New Fund. Based on their review of the projected profitability of the New Fund to the Sub-Adviser, the Board concluded that the projected profitability of the New Fund to the Sub-Adviser was not unreasonable.
The Board also considered other benefits that have been and may be realized by the Sub-Adviser from its relationships with the New Fund and concluded that the sub-advisory fees with respect to the New Fund were reasonable taking into account such benefits.
In voting to approve the New Fund Sub-Advisory Agreement, the Board concluded that the terms of the New Fund Sub-Advisory Agreement are reasonable and fair in light of the services to be performed, expenses to be incurred and such other matters as the Board considered relevant in the exercise of their reasonable business judgment. The Board did not identify any single factor or group of factors as all important or controlling and considered all factors together.
18 | November 30, 2023
Level Four Large Cap Growth Active ETF
| Trustees & Officers | November 30, 2023 (Unaudited) |
The general supervision of the duties performed by the Adviser for the Fund under the Investment Advisory Agreement is the responsibility of the Board of Trustees. The Trust currently has four Trustees, each of whom have no affiliation or business connection with the Adviser or any of its affiliated persons and do not own any stock or other securities issued by the Adviser. These are the “non-interested” or “independent” Trustees (“Independent Trustees”).
The Independent Trustees of the Trust, their term of office and length of time served, their principal business occupations during the past five years, the number of portfolios in the Fund Complex overseen by each Independent Trustee, and other directorships, if any, held by the Trustee are shown below.
INDEPENDENT TRUSTEES
Name, Address and Year of Birth of Officer* | Position(s) Held with Trust | Length of Time Served** | Principal Occupation(s) During Past 5 Years | Number of Portfolios in Fund Complex Overseen by Trustees*** | Other Directorships Held by Trustees |
Mary K. Anstine, 1940 | Trustee | Since March 2008 | Ms. Anstine is Trustee/Director of AV Hunter Trust and Colorado Uplift Board. | 38 | Ms. Anstine is a Trustee of ALPS Variable Investment Trust (7 funds); Financial Investors Trust (29 funds); and Reaves Utility Income Fund. |
Jeremy W. Deems, 1976 | Trustee | Since March 2008 | Mr. Deems is the Co-Founder and Chief Financial Officer of Green Alpha Advisors, LLC, a registered investment advisor, and Co-Portfolio Manager of the AXS Green Alpha ETF. | 38 | Mr. Deems is a Trustee of ALPS Variable Investment Trust (7 funds); Financial Investors Trust (29 funds); and Reaves Utility Income Fund; and Clough Funds Trust (1 fund). |
Rick A. Pederson, 1952 | Trustee | Since March 2008 | Mr. Pederson is Partner, Bow River Capital Partners (private equity management), 2003-present; Board Member, Prosci Inc. (private business services) 2013-2016; Advisory Board Member, Citywide Banks (Colorado community bank) 2014-2017; Board Member, Strong-Bridge Consulting, 2015-2019; Board Member, IRI/ODMS Holdings LLC, 2017–2019; Director, National Western Stock Show (not for profit) 2010-present; Director, History Colorado (not for profit) 2015-present; Director, Citywide Bank Advisory Board 2017-present; Trustee, Boettcher Foundation, 2018 -present. | 24 | Mr. Pederson is Trustee of Segall Bryant & Hamill Trust (14 funds), Principal Real Estate Income Fund (1 fund). |
| * | The business address of the Trustee is c/o ALPS Advisors, Inc., 1290 Broadway, Suite 1000, Denver, Colorado 80203. |
| ** | This is the period for which the Trustee began serving the Trust. Each Trustee serves an indefinite term, until his or her successor is elected. |
| *** | The Fund Complex includes all series of the Trust and any other investment companies for which ALPS Advisors, Inc. provides investment advisory services. |
19 | November 30, 2023
Level Four Large Cap Growth Active ETF
| Trustees & Officers | November 30, 2023 (Unaudited) |
Name, Address and Year of Birth of Officer* | Position(s) Held with Trust | Length of Time Served** | Principal Occupation(s) During Past 5 Years | Number of Portfolios in Fund Complex Overseen by Trustees*** | Other Directorships Held by Trustees |
Edmund J. Burke, 1961 | Trustee | Since December 2017 | Mr. Burke joined ALPS in 1991 and served as the President and Director of ALPS Holdings, Inc., and ALPS Advisors, Inc., and Director of ALPS Distributors, Inc., ALPS Fund Services, Inc. (“ALPS”), and ALPS Portfolio Solutions Distributor, Inc. (collectively, the “ALPS Companies”). Mr. Burke retired from the ALPS Companies in June 2019. Mr. Burke is currently a partner at ETF Action, a web-based system that provides data and analytics to registered investment advisers, (since 2020) and a Director of Alliance Bioenergy Plus, Inc., a technology company focused on emerging technologies in the renewable energy, biofuels, and bioplastics technology sectors (since 2020). | 33 | Mr. Burke is a Trustee of Clough Global Dividend and Income Fund (1 fund); Clough Global Equity Fund (1 fund); Clough Global Opportunities Fund (1 fund); Clough Funds Trust (1 fund); Liberty All-Star Equity Fund (1 fund); Director of the Liberty All-Star Growth Fund, Inc. (1 fund) and Financial Investors Trust (29 funds). |
| * | The business address of the Trustee is c/o ALPS Advisors, Inc., 1290 Broadway, Suite 1000, Denver, Colorado 80203. |
| ** | This is the period for which the Trustee began serving the Trust. Each Trustee serves an indefinite term, until his or her successor is elected. |
| *** | The Fund Complex includes all series of the Trust and any other investment companies for which ALPS Advisors, Inc. provides investment advisory services. |
20 | November 30, 2023
Level Four Large Cap Growth Active ETF
| Trustees & Officers | November 30, 2023 (Unaudited) |
| OFFICERS: | |
Name, Address and Year of Birth of Officer* | Position(s) Held with Trust | Length of Time Served** | Principal Occupation(s) During Past 5 Years |
Laton Spahr, 1975 | President | Since June 2021 | Mr. Spahr joined ALPS in 2019 and currently serves as President and Portfolio Manager of AAI. Prior to his current role, Mr. Spahr was a Senior Vice President and Strategy Leader of the Value & Income Team for Oppenheimer Funds from 2013 to 2019. |
Matthew Sutula, 1985 | Chief Compliance Officer (“CCO”) | Since December 2019 | Mr. Sutula joined ALPS in 2012 and currently serves as Chief Compliance Officer of AAI. Prior to his current role, Mr. Sutula served as interim Compliance Officer of the Trust (September 2019 to December 2019). Compliance Manager and Senior Compliance Analyst for AAI, as well as Compliance Analyst for AFS. Prior to joining ALPS, he spent seven years at Morningstar, Inc. in various analyst roles supporting the registered investment company databases. Mr. Sutula is also Chief Compliance Officer of Principal Real Estate Income Fund, ALPS Variable Investment Trust, Liberty All-Star Equity Fund and Liberty All-Star Growth Fund, Inc. From September 2019 to September 2022 he served as Chief Compliance Officer of RiverNorth Opportunities Fund, Inc. |
Erich Rettinger, 1985 | Treasurer | Since September 2023 | Mr. Rettinger is Vice President of AAI (since 2021) and serves as Treasurer of Principal Real Estate Income Fund, Liberty All-Star Equity Fund, LibertyAll-Star Growth Fund, Inc., and ALPS Variable Investment Trust. From December 2021 to October 2022 he also served as Treasurer of RiverNorth Opportunities Fund, Inc. Because of his position with AAI, Mr. Rettinger is deemed an affiliate of the Fund as defined under the 1940 Act. From 2013-2021, he served as Vice President and Fund Controller of ALPS Fund Services. |
Michael P. Lawlor, 1969 | Secretary | Since December 2022 | Mr. Lawlor joined ALPS in January 2022, and is currently Vice President and Principal Legal Counsel. Prior to joining ALPS, Mr. Lawlor was Lead Fund Counsel at Brighthouse Financial (insurance company) (January 2007-April 2021). Mr. Lawlor also serves as Secretary of Financial Investors Trust and ALPS Variable Investment Trust. |
Susan M. Cannon, 1974 | Assistant Secretary | Since May 2023 | Ms. Cannon joined ALPS in September 2022, and is currently a Senior Paralegal of ALPS Fund Services, Inc. Prior to joining ALPS, Ms. Cannon worked for World Premier Private Partnership, Brown Brothers Harriman & Co. |
| * | The business address of each Officer is c/o ALPS Advisors, Inc., 1290 Broadway, Suite 1000, Denver, Colorado 80203. Each Officer is deemed an affiliate of the Trust as defined under the 1940 Act. |
| ** | This is the period for which the Officer began serving the Trust. Each Officer serves an indefinite term, until his or her successor is elected. |
The Statement of Additional Information includes additional information about the Fund’s Trustees and is available, without charge, upon request by calling (toll-free) 1-866-759-5679.
21 | November 30, 2023

Table of Contents
| Performance Overview | |
| RiverFront Dynamic Core Income ETF | 1 |
| RiverFront Dynamic US Dividend Advantage ETF | 3 |
| RiverFront Strategic Income Fund | 6 |
| Disclosure of Fund Expenses | 9 |
| Report of Independent Registered Public Accounting Firm | 10 |
| Financial Statements | |
| Schedules of Investments | |
| RiverFront Dynamic Core Income ETF | 11 |
| RiverFront Dynamic US Dividend Advantage ETF | 13 |
| RiverFront Strategic Income Fund | 15 |
| Statements of Assets and Liabilities | 18 |
| Statements of Operations | 19 |
| Statements of Changes in Net Assets | |
| RiverFront Dynamic Core Income ETF | 20 |
| RiverFront Dynamic US Dividend Advantage ETF | 21 |
| RiverFront Strategic Income Fund | 22 |
| Financial Highlights | 23 |
| Notes to Financial Statements | 26 |
| Additional Information | 34 |
| Board Considerations Regarding Approval of Investment Advisory Agreement and Investment Sub-Advisory Agreements | 35 |
| Trustees & Officers | 37 |
alpsfunds.com
RiverFront Dynamic Core Income ETF
| Performance Overview | November 30, 2023 (Unaudited) |
Investment Objective
RiverFront Dynamic Core Income ETF (the “Fund” or "RFCI") seeks total return, with an emphasis on income as the source of that total return. The Fund seeks to achieve its investment objective by investing in a global portfolio of fixed income securities of various maturities, ratings and currency denominations.
Market Recap
During the Fund's fiscal year ended November 30, 2023, the Federal Reserve raised the fed funds effective rate from 3.83% to 5.33% to fight inflation. The aggressive rate hikes caused longer maturity bonds prices to fall as markets repriced for the new inflationary environment. Given this backdrop, the Fund focused on short maturity corporate bonds as the nucleus of its investment strategy. Short-term corporate bonds with maturities between one and five years were preferred because their prices were not impacted as much by the rising interest rates relative to longer maturity bonds. The Fund used investment grade corporates combined with short maturity high yield bonds to add additional yield relative to the benchmark. High yield bonds enhanced the portfolios’ yield by offering an additional 2%-3% of yield.
Fund-Level Attribution
While the Fund concentrated on corporate bonds, it benefitted from not owning mortgage-backed securities. Mortgage prepayments slowed rapidly as new mortgage rates increased sharply, which caused the duration of mortgage-backed securities to increase in a rising interest rate environment. Mortgages comprise slightly more than a quarter of the Fund’s benchmark, the Bloomberg U.S. Aggregate Bond Index. US Treasuries comprised more than 40% of the Fund’s benchmark, but the Fund held less than half of that exposure, to help fund the overweight to corporate bonds. The Fund mainly allocated to longer maturity Treasuries to provide some protection in case of an economic slowdown or other financial shocks to the markets.
Overall, the Fund benefitted from a duration that was a year to a year and a half shorter than the benchmark during this period of rising yields. Additionally, the use of high yield bonds helped the Fund out-yield the benchmark, which was a positive factor during the period.
Outlook
As Riverfront begins to look at the next twelve months, RiverFront believes that fixed income markets will be driven by the path of interest rate cuts. It is RiverFront’s belief that the ten-year Treasury will move higher from current levels due to a stronger than expected labor market and looser financial conditions that will slow the pace of the inflation fight. Thus, the Fund is expected to continue to focus on managing credit risk, as the risk premium for corporate bonds shrinks. Thus, RiverFront believes the risk of recession is dwindling.
Performance (as of November 30, 2023)
| | 1 Year | 5 Year | Since Inception^ |
| RiverFront Dynamic Core Income ETF – NAV | 2.12% | 1.34% | 0.83% |
| RiverFront Dynamic Core Income ETF – Market Price* | 1.75% | 1.31% | 0.82% |
| Bloomberg U.S. Aggregate Bond Index | 1.18% | 0.71% | 0.45% |
Total Expense Ratio (per the current prospectus) is 0.53%.
Performance data quoted represents past performance. Past performance does not guarantee future results. Total return figures assume reinvestment of dividends and capital gains distributions, if any. The table does not reflect the deduction of taxes that a shareholder would pay on Fund distributions or the redemption of Fund shares. Investment return and principal value of an investment will fluctuate so that an investor’s shares, when sold or redeemed, may be worth more or less than the original cost. Current performance data may be higher or lower than actual data quoted. For the most current month-end performance data please visit www.alpsfunds.com or call 1.866.759.5679.
Net Asset Value (NAV) is an exchange-traded fund’s per-share value. The per-share dollar amount of the fund is derived by dividing the total value of all the securities in its portfolio, less any liabilities, by the number of fund shares outstanding. Market Price is the price at which a share can currently be traded in the market. Information detailing the number of days the Market Price of the Fund was greater than the Fund’s NAV and the number of days it was less than the Fund’s NAV can be obtained at www.alpsfunds.com.
| ^ | The Fund commenced operations on June 14, 2016. |
| * | Market Price means the official closing price of a share or, if it more accurately reflects the market value of a share at the time as of which the Fund calculates current net asset value per share, the price that is the midpoint of the bid-ask spread as of that time. It does not represent the returns an investor would receive if shares were traded at other times. |
Bloomberg U.S. Aggregate Bond Index is a broad-based benchmark that measures the investment grade, U.S. dollar-denominated, fixed-rate taxable bond market, including Treasuries, government-related and corporate securities, MBS (agency fixed-rate and hybrid ARM pass-throughs), ABS, and CMBS (agency and non-agency). The index is reported on a total return basis, which assumes reinvestment of any dividends and distributions realized during a given time period. The index is not actively managed and does not reflect any deductions for fees, expenses or taxes. One cannot invest directly in an index. Index performance does not reflect fund performance.
The RiverFront Dynamic Core Income ETF is not suitable for all investors. Investments in the Fund are subject to investment risks, including possible loss of the principal amount invested.
The Fund’s shares are not individually redeemable. Investors buy and sell shares of the Fund on a secondary market. Only market makers or “authorized participants” may trade directly with the Fund, typically in blocks of 25,000 shares.
ALPS Portfolio Solutions Distributor, Inc., a FINRA member, is the Distributor for the RiverFront Dynamic Core Income ETF.
1 | November 30, 2023
RiverFront Dynamic Core Income ETF
| Performance Overview | November 30, 2023 (Unaudited) |
Top 10 Holdings*^ (as of November 30, 2023)
| U.S. Treasury Bond 02/15/2043 3.88% | 11.38% |
| U.S. Treasury Bond 11/15/2052 4.00% | 4.33% |
| Blue Owl Credit Income Corp. 01/15/2029 7.75% | 4.19% |
| U.S. Treasury Bond 08/15/2029 6.13% | 3.94% |
| General Motors Financial Co., Inc. 01/09/2033 6.40% | 3.73% |
| Ingersoll Rand, Inc. 08/14/2033 5.70% | 3.67% |
| Hyatt Hotels Corp. 04/23/2030 5.75% | 3.65% |
| Concentrix Corp. 08/02/2033 6.85% | 3.56% |
| Bank of America Corp. 12/31/9999 5Y US TI + 3.23% | 2.55% |
| PNC Financial Services Group, Inc. 12/31/9999 5Y US TI + 3.238% | 2.48% |
| Total % of Top 10 Holdings | 43.48% |
Asset Allocation* (as of November 30, 2023)
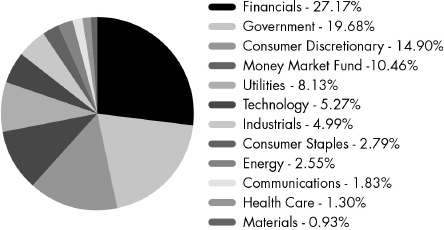
| ^ | Excludes Money Market Fund. |
Future holdings are subject to change.
Growth of $10,000 (as of November 30, 2023)
Comparison of Change in Value of $10,000 Investment in the Fund and the Fund’s benchmark
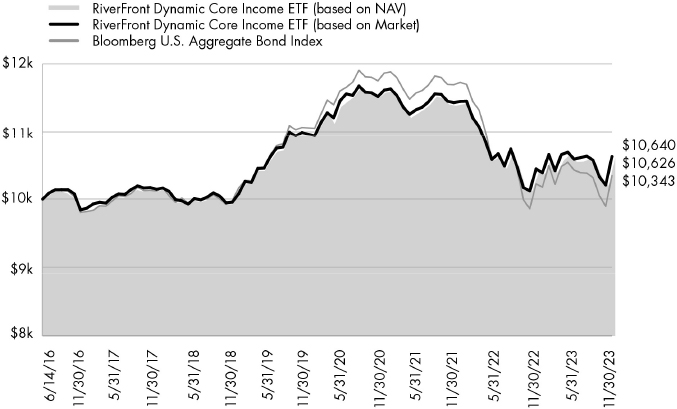
The chart above compares historical performance of a hypothetical investment of $10,000 in the Fund since inception with the performance of the Fund’s benchmark index. Results include the reinvestment of all dividends and capital gains distributions. Past performance does not guarantee future results. The chart does not reflect the deduction of taxes that a shareholder would pay on Fund distributions or the redemption of Fund shares.
2 | November 30, 2023
RiverFront Dynamic US Dividend Advantage ETF
| Performance Overview | November 30, 2023 (Unaudited) |
Investment Objective
RiverFront Dynamic US Dividend Advantage ETF (the “Fund” or "RFDA") seeks to provide capital appreciation and dividend income. Under normal market conditions, the Fund seeks to achieve its investment objective by investing at least 65% of its net assets in a portfolio of equity securities of publicly traded U.S. companies with the potential for dividend income. Equity securities include common stocks and common or preferred shares of real estate investment trusts (“REITs”).
Market Recap
The 12-month period from November 30, 2022 to November 30, 2023 was one defined by a recovery in the market. Markets began to bounce back from a difficult 2022. As such, the S&P 500® Index (S&P 500) produced a total return of 13.84% for the 12-month period ended November 30, 2023, well above its return from the previous year. This performance was led by the Technology and Communication sectors, with a total return of 39.3% and 37.0% respectively. On the other hand, the Utilities sector was the worst performing sector, with a return of -9.3%, with Consumer Staples, Energy, Health Care, and Real Estate all having negative returns as well.
Fund-Level Attribution
RFDA posted NAV returns and market returns below the benchmark during the fiscal year.
Outlook
Moving forward, Riverfront sees markets trending towards a version of our ‘Base’ Case from our 2023 Outlook. As discussed in our 2023 Outlook, RiverFront sees three possible paths forward for the final month of 2023 and moving forward, as described below:
Economic Growth: Slowing, but Positive / Inflation: Moderating, but Persistent (BASE CASE / MOST LIKELY OUTCOME)
In this scenario, interest rates must go higher to combat inflation. If this plays out, RiverFront believes equity investors should expect volatility but directionless markets, an environment where Riverfront believes the P.A.T.T.Y theme (Pay Attention To The Yield: a focus on investments with strong yields and free cash flows to support them) would be the most effective strategy.
Economic Growth: Resilient / Inflation: Under Control (BULL CASE)
Specifically, a recession or significant slowdown quickly emerges, causing inflation pressures to dissipate quickly. In this scenario, central banks would begin to forecast rate cuts and/or monetary stimulus. In this scenario, quality and growth-oriented equities would be the strongest performers, in RiverFront’s view. Additionally, RiverFront believes international stocks would benefit from strong currencies in this scenario.
Economic Growth: Recessionary / Inflation: Strong (BEAR CASE)
The most challenging scenario is if Riverfront sees high inflation and evidence of a recession, which would force central banks to continue to raise rates even in the face of such a recession. In that scenario, RiverFront thinks bonds and stocks would perform poorly, as long interest rates rise and economic and earnings growth fall.
3 | November 30, 2023
RiverFront Dynamic US Dividend Advantage ETF
| Performance Overview | November 30, 2023 (Unaudited) |
Performance (as of November 30, 2023)
| | 1 Year | 5 Year | Since Inception^ |
| RiverFront Dynamic US Dividend Advantage ETF – NAV | 4.96% | 10.41% | 10.69% |
| RiverFront Dynamic US Dividend Advantage ETF – Market Price* | 4.89% | 10.43% | 10.69% |
| S&P 500® Index | 13.84% | 12.51% | 12.90% |
Total Expense Ratio (per the current prospectus) is 0.52%.
Performance data quoted represents past performance. Past performance does not guarantee future results. Total return figures assume reinvestment of dividends and capital gains distributions, if any. The table does not reflect the deduction of taxes that a shareholder would pay on Fund distributions or the redemption of Fund shares. Investment return and principal value of an investment will fluctuate so that an investor’s shares, when sold or redeemed, may be worth more or less than the original cost. Current performance data may be higher or lower than actual data quoted. For the most current month-end performance data please visit www.alpsfunds.com or call 1.866.759.5679.
Net Asset Value (NAV) is an exchange-traded fund’s per-share value. The per-share dollar amount of the fund is derived by dividing the total value of all the securities in its portfolio, less any liabilities, by the number of fund shares outstanding. Market Price is the price at which a share can currently be traded in the market. Information detailing the number of days the Market Price of the Fund was greater than the Fund’s NAV and the number of days it was less than the Fund’s NAV can be obtained at www.alpsfunds.com.
| ^ | The Fund commenced operations on June 7, 2016. |
| * | Market Price means the official closing price of a share or, if it more accurately reflects the market value of a share at the time as of which the Fund calculates current net asset value per share, the price that is the midpoint of the bid-ask spread as of that time. It does not represent the returns an investor would receive if shares were traded at other times. |
S&P 500® Index is the Standard & Poor’s composite index of 500 stocks, a widely recognized, unmanaged index of common stock prices. The index is reported on a total return basis, which assumes reinvestment of any dividends and distributions realized during a given time period. The index is not actively managed and does not reflect any deductions for fees, expenses or taxes. One cannot invest directly in an index. Index performance does not reflect fund performance.
The RiverFront Dynamic US Dividend Advantage ETF is not suitable for all investors. Investments in the Fund are subject to investment risks, including possible loss of the principal amount invested.
The Fund’s shares are not individually redeemable. Investors buy and sell shares of the Fund on a secondary market. Only market makers or “authorized participants” may trade directly with the Fund, typically in blocks of 25,000 shares.
ALPS Portfolio Solutions Distributor, Inc., a FINRA member, is the Distributor for the RiverFront Dynamic US Dividend Advantage ETF.
4 | November 30, 2023
RiverFront Dynamic US Dividend Advantage ETF
| Performance Overview | November 30, 2023 (Unaudited) |
Top 10 Holdings* (as of November 30, 2023)
| Microsoft Corp. | 8.72% |
| Apple, Inc. | 8.42% |
| Amazon.com, Inc. | 3.79% |
| Alphabet, Inc. | 3.02% |
| Exxon Mobil Corp. | 2.45% |
| NVIDIA Corp. | 2.42% |
| Booking Holdings, Inc. | 1.98% |
| Merck & Co., Inc. | 1.96% |
| CVS Health Corp. | 1.88% |
| Cisco Systems, Inc. | 1.86% |
| Total % of Top 10 Holdings | 36.50% |
| * | % of Total Investments (excluding investments purchased with collateral from securities loaned) |
Asset Allocation* (as of November 30, 2023)
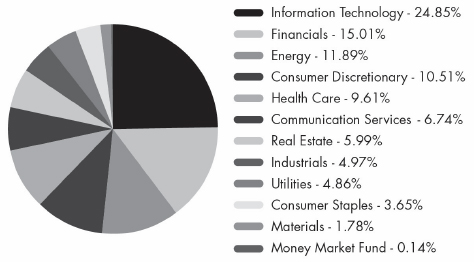
Future holdings are subject to change.
Growth of $10,000 (as of November 30, 2023)
Comparison of Change in Value of $10,000 Investment in the Fund and the Fund’s benchmark
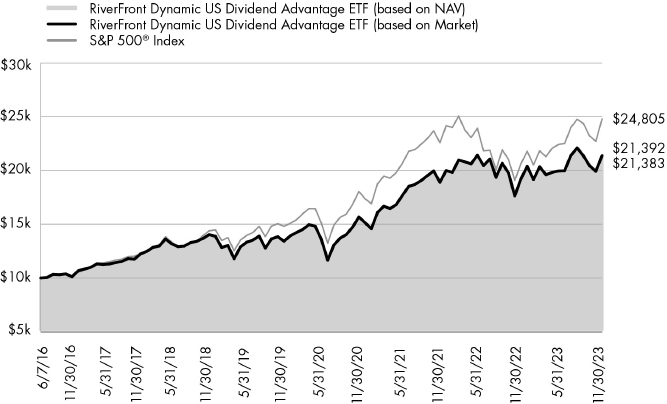
The chart above compares historical performance of a hypothetical investment of $10,000 in the Fund since inception with the performance of the Fund’s benchmark index. Results include the reinvestment of all dividends and capital gains distributions. Past performance does not guarantee future results. The chart does not reflect the deduction of taxes that a shareholder would pay on Fund distributions or the redemption of Fund shares.
5 | November 30, 2023
RiverFront Strategic Income Fund
| Performance Overview | November 30, 2023 (Unaudited) |
Investment Objective
The RiverFront Strategic Income Fund (the “Fund” or "RIGS") seeks total return, with an emphasis on income as the source of that total return. The Fund seeks to achieve its investment objective by investing in a global portfolio of fixed income securities of various maturities, ratings and currency denominations. The Fund utilizes various investment strategies in a broad array of fixed income sectors.
Market Recap
During the Fund's fiscal year ended November 30, 2023, the Federal Reserve raised the fed funds effective rate from 3.83% to 5.33% to fight inflation. The aggressive rate hikes caused longer maturity bonds prices to fall as markets repriced for the new inflationary environment. Given this backdrop, the Fund focused on short maturity corporate bonds as the nucleus of its investment strategy. Short-term corporate bonds with maturities between one and five years were preferred because their prices were not impacted as much by the rising interest rates relative to longer maturity bonds. The Fund used investment grade corporates combined with short maturity high yield bonds to add additional yield relative to the benchmark. High yield bonds enhanced the portfolios’ yield by offering an additional 2%-3% of yield.
Fund-Level Attribution
While the Fund concentrated on corporate bonds, it benefitted from not owning mortgage-backed securities. Mortgage prepayments slowed rapidly as new mortgage rates increased sharply, which caused the duration of mortgage-backed securities to increase in a rising interest rate environment. Mortgages comprise slightly more than a quarter of the Fund’s benchmark, the Bloomberg U.S. Aggregate Bond Index. US Treasuries comprised more than 40% of the Fund’s benchmark, but the Fund held less than half of that exposure, to help fund the overweight to corporate bonds. The Fund mainly allocated to longer maturity Treasuries to provide some protection in case of an economic slowdown or other financial shocks to the markets.
Overall, the Fund benefitted from a duration that was a year to a year and a half shorter than the benchmark during this period of rising yields. Additionally, the use of high yield bonds helped the Fund out-yield the benchmark, which was a positive factor during the period.
Outlook
As Riverfront begins to look at the next twelve months, RiverFront believes that fixed income markets will be driven by the path of interest rate cuts. It is RiverFront’s belief that the ten-year Treasury will move higher from current levels due to a stronger than expected labor market and looser financial conditions that will slow the pace of the inflation fight. Thus, the Fund is expected to continue to focus on managing credit risk, as the risk premium for corporate bonds shrinks. Thus, RiverFront believes the risk of recession is dwindling.
6 | November 30, 2023
RiverFront Strategic Income Fund
| Performance Overview | November 30, 2023 (Unaudited) |
Performance (as of November 30, 2023)
| | 1 Year | 5 Year | 10 Year | Since Inception^ |
| RiverFront Strategic Income Fund – NAV | 2.98% | 1.77% | 2.66% | 2.83% |
| RiverFront Strategic Income Fund – Market Price* | 2.43% | 1.73% | 2.58% | 2.80% |
| Bloomberg U.S. Aggregate Bond Index | 1.18% | 0.71% | 1.37% | 1.39% |
Total Expense Ratio (per the current prospectus) is 0.47%. The Fund’s management fees consist of a fee of 0.11% paid to the Fund’s investment adviser and a fee of 0.35% paid to the Fund’s sub-adviser.
Performance data quoted represents past performance. Past performance does not guarantee future results. Total return figures assume reinvestment of dividends and capital gains distributions, if any. The table does not reflect the deduction of taxes that a shareholder would pay on Fund distributions or the redemption of Fund shares. Investment return and principal value of an investment will fluctuate so that an investor’s shares, when sold or redeemed, may be worth more or less than the original cost. Current performance data may be higher or lower than actual data quoted. For most current month-end performance data please visit www.alpsfunds.com or call 1.866.759.5679.
Net Asset Value (NAV) is an exchange-traded fund’s per-share value. The per-share dollar amount of the Fund is derived by dividing the total value of all the securities in its portfolio, less any liabilities, by the number of Fund shares outstanding. Market Price is the price at which a share can currently be traded in the market. Information detailing the number of days the Market Price of the Fund was greater than the Fund’s NAV and the number of days it was less than the Fund’s NAV can be obtained at www.alpsfunds.com.
| ^ | The Fund commenced Investment Operations on October 8, 2013. |
| * | Market Price means the official closing price of a share or, if it more accurately reflects the market value of a share at the time as of which the Fund calculates current net asset value per share, the price that is the midpoint of the bid-ask spread as of that time. It does not represent the returns an investor would receive if shares were traded at other times. |
Duration is a measure of the sensitivity of the price (the value of principal) of a fixed-income investment to a change in interest rates. Duration is expressed as a number of years. The duration number is a calculation involving present value, yield, coupon, final maturity and call features. The bigger the duration number, the greater the interest-rate risk or reward for bond prices. Rising interest rates mean falling bond prices, while declining interest rates mean rising bond prices.
Bloomberg U.S. Aggregate Bond Index is a broad-based benchmark that measures the investment grade, U.S. dollar-denominated, fixed-rate taxable bond market, including Treasuries, government-related and corporate securities, MBS (agency fixed-rate and hybrid ARM pass-throughs), ABS, and CMBS (agency and non-agency). The index is reported on a total return basis, which assumes reinvestment of any dividends and distributions realized during a given time period. The index is not actively managed and does not reflect any deductions for fees, expenses or taxes. One cannot invest directly in an index. Index performance does not reflect fund performance.
The RiverFront Strategic Income Fund is not suitable for all investors. Investments in the Fund are subject to investment risks, including possible loss of the principal amount invested.
The Fund's shares are not individually redeemable. Investors buy and sell shares of the fund on a secondary market. Only market makers or "authorized participants" may trade directly with the Fund, typically in blocks of 25,000 shares.
ALPS Portfolio Solutions Distributor, Inc., a FINRA member, is the distributor for the RiverFront Strategic Income Fund.
7 | November 30, 2023
RiverFront Strategic Income Fund
| Performance Overview | November 30, 2023 (Unaudited) |
Top 10 Holdings*^ (as of November 30, 2023)
| U.S. Treasury Bond 11/15/2052 4.00% | 7.53% |
| U.S. Treasury Bond 05/15/2042 3.25% | 4.82% |
| U.S. Treasury Bond 02/15/2043 3.88% | 3.32% |
| U.S. Treasury Bond 08/15/2029 6.13% | 2.55% |
| U.S. Treasury Note 07/31/2030 4.00% | 1.96% |
| Concentrix Corp. 08/02/2028 6.60% | 1.41% |
| T-Mobile USA, Inc. 02/01/2028 4.75% | 1.39% |
| PulteGroup, Inc. 03/01/2026 5.50% | 1.26% |
| Goldman Sachs Group, Inc. 10/21/2025 4.25% | 1.26% |
| JPMorgan Chase & Co. 10/01/2027 4.25% | 1.25% |
| Total % of Top 10 Holdings | 26.75% |
| ^ | Excludes Money Market Fund |
Future holdings are subject to change.
Asset Allocation* (as of November 30, 2023)
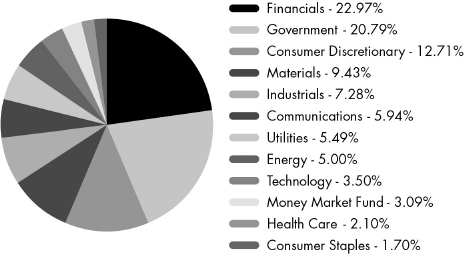
Growth of $10,000 (as of November 30, 2023)
Comparison of Change in Value of $10,000 Investment in the Fund and the Fund’s benchmark
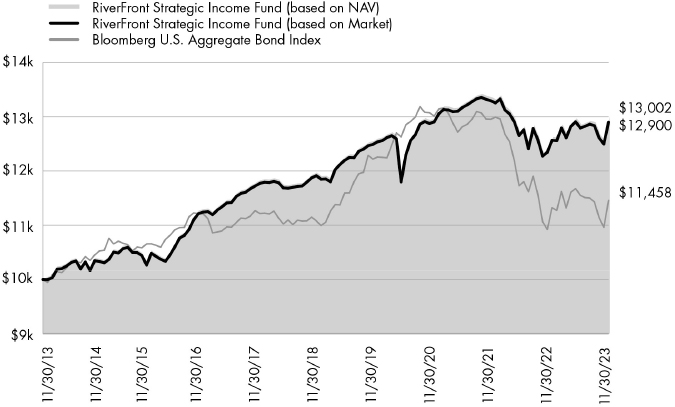
The chart above compares historical performance of a hypothetical investment of $10,000 in the Fund over the past ten years with the performance of the Fund’s benchmark index. Results include the reinvestment of all dividends and capital gains distributions. Past performance does not guarantee future results. The chart does not reflect the deduction of taxes that a shareholder would pay on Fund distributions or the redemption of Fund shares.
8 | November 30, 2023
RiverFront ETFs
| Disclosure of Fund Expenses | November 30, 2023 (Unaudited) |
Shareholder Expense Example: As a shareholder of a Fund, you incur certain ongoing costs, including management fees and other Fund expenses. These examples are intended to help you understand your ongoing costs (in dollars) of investing in a Fund and to compare these costs with the ongoing costs of investing in other funds. It is based on an investment of $1,000 invested at the beginning of the six month period and held through November 30, 2023.
Actual Return: The first line of the table provides information about actual account values and actual expenses. You may use the information in this line, together with the amount you invested, to estimate the expenses that you incurred over the period. Simply divide your account value by
$1,000 (for example, an $8,600 account value divided by $1,000 = 8.6), then multiply the result by the number in the first line under the heading entitled “Expenses Paid During Period” to estimate the expenses attributable to your investment during this period.
Hypothetical 5% Return: The second line of the table provides information about hypothetical account values and hypothetical expenses based on the Fund’s actual expense ratio and an assumed rate of return of 5% per year before expenses, which is not the Fund’s actual return. The hypothetical account values and expenses may not be used to estimate the actual ending account balance or expenses you paid for the period. You may use this information to compare ongoing costs of investing in the Fund and other funds. To do so, compare this 5% hypothetical example with the 5% hypothetical examples that appear in the shareholder reports of other funds.
The expenses shown in the table are meant to highlight ongoing Fund costs only and do not reflect any transaction costs, such as brokerage commissions and other fees to financial intermediaries. Therefore, the second line is useful in comparing ongoing costs only, and will not help you determine the relative total costs of owning different funds. In addition, if these costs were included, your costs would have been higher.
| | Beginning Account Value 6/1/23 | Ending Account Value 11/30/23 | Expense Ratio(a) | Expenses Paid During Period 6/1/23 - 11/30/23(b) |
| RiverFront Dynamic Core Income ETF | | | | |
| Actual | $1,000.00 | $1,005.60 | 0.51% | $2.56 |
| Hypothetical (5% return before expenses) | $1,000.00 | $1,022.51 | 0.51% | $2.59 |
| RiverFront Dynamic US Dividend Advantage ETF | | | | |
| Actual | $1,000.00 | $1,068.60 | 0.52% | $2.70 |
| Hypothetical (5% return before expenses) | $1,000.00 | $1,022.46 | 0.52% | $2.64 |
| RiverFront Strategic Income Fund | | | | |
| Actual | $1,000.00 | $1,011.50 | 0.46% | $2.32 |
| Hypothetical (5% return before expenses) | $1,000.00 | $1,022.76 | 0.46% | $2.33 |
| (a) | Annualized, based on the Fund's most recent fiscal half year expenses. |
| (b) | Expenses are equal to the Fund's annualized expense ratio multiplied by the average account value over the period, multiplied by the number of days in the most recent fiscal half year (183), divided by 365. |
9 | November 30, 2023
RiverFront ETFs
Report of Independent Registered Public Accounting Firm
To the Shareholders of RiverFront Dynamic Core Income ETF, RiverFront Dynamic US Dividend Advantage ETF and RiverFront Strategic Income Fund and Board of Trustees of ALPS ETF Trust
Opinion on the Financial Statements
We have audited the accompanying statements of assets and liabilities, including the schedules of investments, of RiverFront Dynamic Core Income ETF, RiverFront Dynamic US Dividend Advantage ETF and RiverFront Strategic Income Fund (the “Funds”), each a series of ALPS ETF Trust, as of November 30, 2023, the related statements of operations and changes in net assets, the related notes, and the financial highlights for the year then ended (collectively referred to as the “financial statements”). In our opinion, the financial statements present fairly, in all material respects, the financial position of each of the Funds as of November 30, 2023, the results of their operations, the changes in net assets, and the financial highlights for the year then ended, in conformity with accounting principles generally accepted in the United States of America.
The Funds’ financial statements and financial highlights for the years ended November 30, 2022, and prior, were audited by other auditors whose report dated January 27, 2023, expressed an unqualified opinion on those financial statements and financial highlights.
Basis for Opinion
These financial statements are the responsibility of the Funds’ management. Our responsibility is to express an opinion on the Funds’ financial statements based on our audits. We are a public accounting firm registered with the Public Company Accounting Oversight Board (United States) (“PCAOB”) and are required to be independent with respect to the Funds in accordance with the U.S. federal securities laws and the applicable rules and regulations of the Securities and Exchange Commission and the PCAOB.
We conducted our audits in accordance with the standards of the PCAOB. Those standards require that we plan and perform the audit to obtain reasonable assurance about whether the financial statements are free of material misstatement whether due to error or fraud.
Our audits included performing procedures to assess the risks of material misstatement of the financial statements, whether due to error or fraud, and performing procedures that respond to those risks. Such procedures included examining, on a test basis, evidence regarding the amounts and disclosures in the financial statements. Our procedures included confirmation of securities owned as of November 30, 2023, by correspondence with the custodian and brokers; when replies were not received from brokers, we performed other auditing procedures. Our audits also included evaluating the accounting principles used and significant estimates made by management, as well as evaluating the overall presentation of the financial statements. We believe that our audits provide a reasonable basis for our opinion.
We have served as the auditor of one or more investment companies advised by ALPS Advisors, Inc. since 2013.

COHEN & COMPANY, LTD.
Philadelphia, Pennsylvania
January 29, 2024
10 | November 30, 2023
RiverFront Dynamic Core Income ETF
| Schedule of Investments | November 30, 2023 |
| Security Description | | Principal Amount | | | Value | |
| CORPORATE BONDS (71.88%) | | | | | | |
| Communications (1.88%) | | | | | | |
| Charter Communications Operating LLC / Charter Communications Operating Capital | | | | | | |
| 4.91%, 07/23/2025 | | $ | 248,000 | | | $ | 244,005 | |
| Comcast Corp. | | | | | | | | |
| 4.15%, 10/15/2028 | | | 249,000 | | | | 240,870 | |
| Total Communications | | | | | | | 484,875 | |
| | | | | | | | | |
| Consumer Discretionary (15.33%) | | | | | | | | |
| Ford Motor Co. | | | | | | | | |
| 9.63%, 04/22/2030 | | | 351,000 | | | | 402,048 | |
| Ford Motor Credit Co. LLC | | | | | | | | |
| 7.35%, 11/04/2027 | | | 564,000 | | | | 582,080 | |
| General Motors Financial Co., Inc. | | | | | | | | |
| 6.40%, 01/09/2033 | | | 860,000 | | | | 883,972 | |
| Goodyear Tire & Rubber Co. | | | | | | | | |
| 4.88%, 03/15/2027 | | | 248,000 | | | | 234,415 | |
| Hyatt Hotels Corp. | | | | | | | | |
| 5.75%, 04/23/2030 | | | 860,000 | | | | 866,403 | |
| Marriott International, Inc. | | | | | | | | |
| 4.00%, 04/15/2028(a) | | | 577,000 | | | | 544,470 | |
| Toyota Motor Credit Corp. | | | | | | | | |
| 3.95%, 06/30/2025 | | | 441,000 | | | | 432,830 | |
| Total Consumer Discretionary | | | | | | | 3,946,218 | |
| | | | | | | | | |
| Consumer Staples (2.87%) | | | | | | | | |
| Anheuser-Busch InBev Worldwide, Inc. | | | | | | | | |
| 4.00%, 04/13/2028 | | | 285,000 | | | | 276,312 | |
| Dollar Tree, Inc. | | | | | | | | |
| 4.00%, 05/15/2025 | | | 475,000 | | | | 462,641 | |
| Total Consumer Staples | | | | | | | 738,953 | |
| | | | | | | | | |
| Energy (2.62%) | | | | | | | | |
| Hess Midstream Operations LP | | | | | | | | |
| 4.25%, 02/15/2030(b) | | | 248,000 | | | | 222,034 | |
| Marathon Oil Corp. | | | | | | | | |
| 4.40%, 07/15/2027 | | | 471,000 | | | | 452,104 | |
| Total Energy | | | | | | | 674,138 | |
| | | | | | | | | |
| Financials (27.96%) | | | | | | | | |
| Bank of America Corp. | | | | | | | | |
| 4.25%, 10/22/2026 | | | 354,000 | | | | 341,828 | |
| 5Y US TI + 3.23%(c)(d) | | | 621,000 | | | | 605,655 | |
| Blue Owl Credit Income Corp. | | | | | | | | |
| 7.75%, 01/15/2029(b) | | | 1,000,000 | | | | 994,442 | |
| Citigroup, Inc. | | | | | | | | |
| 4.45%, 09/29/2027 | | | 457,000 | | | | 437,240 | |
| 6.63%, 06/15/2032 | | | 147,000 | | | | 154,990 | |
| FNB Corp. | | | | | | | | |
| 5.15%, 08/25/2025 | | | 518,000 | | | | 502,932 | |
| FS KKR Capital Corp. | | | | | | | | |
| 4.25%, 02/14/2025(b) | | | 479,000 | | | | 462,373 | |
| Security Description | | Principal Amount | | | Value | |
| Financials (continued) | | | | | | |
| Goldman Sachs Group, Inc. | | | | | | |
| 5.70%, 11/01/2024 | | $ | 564,000 | | | $ | 563,683 | |
| Host Hotels & Resorts LP | | | | | | | | |
| 4.00%, 06/15/2025 | | | 314,000 | | | | 303,833 | |
| HSBC Holdings PLC | | | | | | | | |
| 4.38%, 11/23/2026 | | | 457,000 | | | | 441,152 | |
| Iron Mountain, Inc. | | | | | | | | |
| 4.88%, 09/15/2027(b) | | | 482,000 | | | | 456,738 | |
| JPMorgan Chase & Co. | | | | | | | | |
| 4.25%, 10/01/2027 | | | 294,000 | | | | 285,839 | |
| Morgan Stanley | | | | | | | | |
| 5.00%, 11/24/2025 | | | 524,000 | | | | 518,312 | |
| PNC Financial Services Group, Inc. | | | | | | | | |
| 5Y US TI + 3.238%(c)(d) | | | 621,000 | | | | 588,854 | |
| Royal Bank of Canada | | | | | | | | |
| 6.00%, 11/01/2027 | | | 524,000 | | | | 538,500 | |
| Total Financials | | | | | | | 7,196,371 | |
| | | | | | | | | |
| Health Care (1.34%) | | | | | | | | |
| CVS Health Corp. | | | | | | | | |
| 4.30%, 03/25/2028 | | | 100,000 | | | | 96,815 | |
| HCA, Inc. | | | | | | | | |
| 5.38%, 09/01/2026 | | | 248,000 | | | | 246,786 | |
| Total Health Care | | | | | | | 343,601 | |
| | | | | | | | | |
| Industrials (5.13%) | | | | | | | | |
| Boeing Co. | | | | | | | | |
| 4.88%, 05/01/2025 | | | 455,000 | | | | 450,276 | |
| Ingersoll Rand, Inc. | | | | | | | | |
| 5.70%, 08/14/2033 | | | 860,000 | | | | 870,568 | |
| Total Industrials | | | | | | | 1,320,844 | |
| | | | | | | | | |
| Materials (0.95%) | | | | | | | | |
| DuPont de Nemours, Inc. | | | | | | | | |
| 4.73%, 11/15/2028 | | | 248,000 | | | | 244,996 | |
| Total Materials | | | | | | | 244,996 | |
| | | | | | | | | |
| Technology (5.43%) | | | | | | | | |
| Concentrix Corp. | | | | | | | | |
| 6.85%, 08/02/2033 | | | 860,000 | | | | 844,098 | |
| Micron Technology, Inc. | | | | | | | | |
| 5.38%, 04/15/2028 | | | 555,000 | | | | 552,144 | |
| Total Technology | | | | | | | 1,396,242 | |
| | | | | | | | | |
| Utilities (8.37%) | | | | | | | | |
| Dominion Energy, Inc. | | | | | | | | |
| 4.25%, 06/01/2028 | | | 577,000 | | | | 551,570 | |
| Public Service Enterprise Group, Inc. | | | | | | | | |
| 5.85%, 11/15/2027 | | | 564,000 | | | | 575,192 | |
| Southern California Gas Co. | | | | | | | | |
| 5.20%, 06/01/2033 | | | 506,000 | | | | 498,492 | |
See Notes to Financial Statements.
11 | November 30, 2023
RiverFront Dynamic Core Income ETF
| Schedule of Investments | November 30, 2023 |
| Security Description | | Principal Amount | | | Value | |
| Utilities (continued) | | | | | | | | |
| Vistra Operations Co. LLC | | | | | | | | |
| 7.75%, 10/15/2031(b) | | $ | 516,000 | | | $ | 528,546 | |
| Total Utilities | | | | | | | 2,153,800 | |
| | | | | | | | | |
| TOTAL CORPORATE BONDS | | | | | | | | |
| (Cost $19,162,753) | | | | | | | 18,500,038 | |
| | | | | | | | | |
| GOVERNMENT BONDS (20.25%) | | | | | | | | |
| United States Treasury Bond | | | | | | | | |
| 6.13%, 08/15/2029 | | | 860,000 | | | | 935,216 | |
| 3.88%, 02/15/2043 | | | 3,026,000 | | | | 2,699,464 | |
| 4.00%, 11/15/2052 | | | 1,123,000 | | | | 1,026,317 | |
| 3.63%, 05/15/2053 | | | 645,000 | | | | 550,719 | |
| TOTAL GOVERNMENT BONDS | | | | | | | | |
| (Cost $5,807,671) | | | | | | | 5,211,716 | |
| | | 7 Day Yield | | | Shares | | | Value | |
| SHORT TERM INVESTMENTS (10.77%) | | | | | | | | | |
| Money Market Fund (10.77%) | | | | | | | | | |
| State Street Institutional Treasury Plus Money Market Fund (Premier Class) | | | 5.31 | % | | | 2,772,904 | | | | 2,772,904 | |
| | | | | | | | | | | | | |
| TOTAL SHORT TERM INVESTMENTS | | | | | | | | | | | | |
| | | | | | | | | | | | | |
| (Cost $2,772,904) | | | | | | | | | | | 2,772,904 | |
| | | | | | | | | | | | | |
| TOTAL INVESTMENTS (102.90%) | | | | | | | | | | | | |
| (Cost $27,743,328) | | | | | | | | | | $ | 26,484,658 | |
| LIABILITIES IN EXCESS OF OTHER ASSETS (-2.90%) | | | | | | | | | | | (746,247 | ) |
| NET ASSETS - 100.00% | | | | | | | | | | $ | 25,738,411 | |
Investment Abbreviations:
LIBOR - London Interbank Offered Rate
TI - Treasury Index
Reference Rates:
5Y US TI - 5 Year US TI as of November 30, 2023 was 4.31%
| (a) | Securities were purchased pursuant to Regulation S under the Securities Act of 1933, which exempts securities offered and sold outside of the United States from registration. Such securities cannot be sold in the United States without either an effective registration statement filed pursuant to the Securities Act of 1933, or pursuant to an exemption from registration. As of November 30, 2023, the market value of those securities was $544,470, representing 2.12% of net assets. |
| (b) | Securities exempt from registration under Rule 144A of the Securities Act of 1933. These securities may be sold in the ordinary course of business in transactions exempt from registration, normally to qualified institutional buyers. At period end, the aggregate market value of those securities was $2,664,133, representing 10.35% of net assets. |
| (c) | Floating or variable rate security. Interest rate resets periodically on specific dates. The rate shown represents the coupon or interest rate in effect as of November 30, 2023. Security description includes the reference rate and spread if published and available. |
| (d) | Securities are perpetual and thus do not have a predetermined maturity date. |
See Notes to Financial Statements.
12 | November 30, 2023
RiverFront Dynamic US Dividend Advantage ETF
| Schedule of Investments | November 30, 2023 |
| Security Description | | Shares | | | Value | |
| COMMON STOCKS (99.69%) | | | | | | |
| Communication Services (6.72%) | | | | | | |
| Alphabet, Inc., Class A(a) | | | 4,262 | | | $ | 564,843 | |
| Alphabet, Inc., Class C(a) | | | 12,249 | | | | 1,640,386 | |
| AT&T, Inc. | | | 43,202 | | | | 715,857 | |
| John Wiley & Sons, Inc., Class A | | | 26,263 | | | | 793,405 | |
| Meta Platforms, Inc., Class A(a) | | | 2,128 | | | | 696,175 | |
| TEGNA, Inc. | | | 32,814 | | | | 503,039 | |
| Total Communication Services | | | | | | | 4,913,705 | |
| | | | | | | | | |
| Consumer Discretionary (10.49%) | | | | | | | | |
| Amazon.com, Inc.(a) | | | 18,945 | | | | 2,767,675 | |
| Booking Holdings, Inc.(a) | | | 462 | | | | 1,444,073 | |
| Ethan Allen Interiors, Inc. | | | 19,150 | | | | 513,986 | |
| H&R Block, Inc. | | | 27,093 | | | | 1,230,564 | |
| Nordstrom, Inc.(b) | | | 33,765 | | | | 527,409 | |
| Perdoceo Education Corp. | | | 39,590 | | | | 689,658 | |
| Upbound Group, Inc. | | | 16,986 | | | | 494,293 | |
| Total Consumer Discretionary | | | | | | | 7,667,658 | |
| | | | | | | | | |
| Consumer Staples (3.65%) | | | | | | | | |
| Altria Group, Inc. | | | 13,699 | | | | 575,906 | |
| Coca-Cola Co. | | | 9,301 | | | | 543,550 | |
| Philip Morris International, Inc. | | | 3,212 | | | | 299,872 | |
| Vector Group, Ltd. | | | 116,398 | | | | 1,246,623 | |
| Total Consumer Staples | | | | | | | 2,665,951 | |
| | | | | | | | | |
| Energy (11.87%) | | | | | | | | |
| Antero Midstream Corp. | | | 100,508 | | | | 1,338,767 | |
| Berry Corp. | | | 88,523 | | | | 635,595 | |
| Coterra Energy, Inc. | | | 20,157 | | | | 529,121 | |
| Devon Energy Corp. | | | 10,001 | | | | 449,745 | |
| EnLink Midstream LLC | | | 76,695 | | | | 1,048,421 | |
| EOG Resources, Inc. | | | 5,269 | | | | 648,456 | |
| Equitrans Midstream Corp. | | | 142,488 | | | | 1,336,537 | |
| Exxon Mobil Corp. | | | 17,376 | | | | 1,785,210 | |
| Kinder Morgan, Inc. | | | 51,378 | | | | 902,712 | |
| Total Energy | | | | | | | 8,674,564 | |
| | | | | | | | | |
| Financials (14.99%) | | | | | | | | |
| Apollo Commercial Real Estate Finance, Inc.(b) | | | 34,536 | | | | 372,298 | |
| Bank of America Corp. | | | 21,681 | | | | 661,054 | |
| Fidelity National Information Services, Inc. | | | 17,296 | | | | 1,014,237 | |
| First Horizon National Corp. | | | 49,018 | | | | 626,940 | |
| FNB Corp. | | | 34,633 | | | | 415,250 | |
| Fulton Financial Corp. | | | 33,152 | | | | 471,753 | |
| Horizon Bancorp, Inc. | | | 53,038 | | | | 577,584 | |
| New York Community Bancorp, Inc. | | | 43,337 | | | | 407,801 | |
| Old Republic International Corp. | | | 41,052 | | | | 1,203,234 | |
| OneMain Holdings, Inc. | | | 13,641 | | | | 577,014 | |
| Ready Capital Corp.(b) | | | 45,773 | | | | 467,800 | |
| Starwood Property Trust, Inc.(b) | | | 18,796 | | | | 373,477 | |
| US Bancorp | | | 30,753 | | | | 1,172,304 | |
| Security Description | | Shares | | | Value | |
| Financials (continued) | | | | | | |
| Valley National Bancorp | | | 65,742 | | | $ | 598,252 | |
| Veritex Holdings, Inc. | | | 23,705 | | | | 453,714 | |
| Visa, Inc., Class A | | | 3,867 | | | | 992,582 | |
| Western Union Co. | | | 48,628 | | | | 565,544 | |
| Total Financials | | | | | | | 10,950,838 | |
| | | | | | | | | |
| Health Care (9.59%) | | | | | | | | |
| AbbVie, Inc. | | | 4,186 | | | | 596,045 | |
| Amgen, Inc. | | | 2,210 | | | | 595,904 | |
| Bristol-Myers Squibb Co. | | | 18,954 | | | | 935,948 | |
| Cigna Group | | | 3,840 | | | | 1,009,459 | |
| CVS Health Corp. | | | 20,223 | | | | 1,374,153 | |
| Merck & Co., Inc. | | | 13,948 | | | | 1,429,391 | |
| Pfizer, Inc. | | | 19,775 | | | | 602,544 | |
| Viatris, Inc. | | | 50,948 | | | | 467,703 | |
| Total Health Care | | | | | | | 7,011,147 | |
| | | | | | | | | |
| Industrials (4.96%) | | | | | | | | |
| 3M Co. | | | 5,327 | | | | 527,746 | |
| ACCO Brands Corp. | | | 80,290 | | | | 431,960 | |
| Eagle Bulk Shipping, Inc. | | | 10,682 | | | | 485,497 | |
| Lockheed Martin Corp. | | | 1,244 | | | | 557,026 | |
| MSC Industrial Direct Co. Inc, Class A, Class A | | | 6,278 | | | | 611,603 | |
| Paychex, Inc. | | | 4,480 | | | | 546,426 | |
| Resources Connection, Inc. | | | 34,339 | | | | 467,010 | |
| Total Industrials | | | | | | | 3,627,268 | |
| | | | | | | | | |
| Information Technology (24.81%) | | | | | | | | |
| Apple, Inc. | | | 32,326 | | | | 6,140,324 | |
| Cisco Systems, Inc. | | | 28,056 | | | | 1,357,349 | |
| Hewlett Packard Enterprise Co. | | | 76,390 | | | | 1,291,755 | |
| International Business Machines Corp. | | | 7,670 | | | | 1,216,155 | |
| Microsoft Corp. | | | 16,779 | | | | 6,357,731 | |
| NVIDIA Corp. | | | 3,780 | | | | 1,767,906 | |
| Total Information Technology | | | | | | | 18,131,220 | |
| | | | | | | | | |
| Materials (1.78%) | | | | | | | | |
| Greif, Inc. | | | 8,011 | | | | 557,966 | |
| Mercer International, Inc. | | | 77,466 | | | | 742,124 | |
| Total Materials | | | | | | | 1,300,090 | |
| | | | | | | | | |
| Real Estate (5.98%) | | | | | | | | |
| Camden Property Trust | | | 4,752 | | | | 428,916 | |
| Invitation Homes, Inc. | | | 16,729 | | | | 558,079 | |
| Medical Properties Trust, Inc.(b) | | | 122,526 | | | | 594,251 | |
| Piedmont Office Realty Trust, Inc., Class A | | | 40,108 | | | | 249,472 | |
| SITE Centers Corp. | | | 51,162 | | | | 674,827 | |
| Tanger, Inc. | | | 33,200 | | | | 828,672 | |
| Universal Health Realty Income Trust | | | 26,005 | | | | 1,036,819 | |
| Total Real Estate | | | | | | | 4,371,036 | |
See Notes to Financial Statements.
13 | November 30, 2023
RiverFront Dynamic US Dividend Advantage ETF
| Schedule of Investments | November 30, 2023 |
| Security Description | | Shares | | | Value | |
| Utilities (4.85%) | | | | | | |
| Clearway Energy, Inc., Class C | | | 48,449 | | | $ | 1,209,771 | |
| Evergy, Inc. | | | 8,452 | | | | 431,390 | |
| Public Service Enterprise Group, Inc. | | | 15,442 | | | | 964,044 | |
| Spire, Inc. | | | 15,358 | | | | 936,992 | |
| Total Utilities | | | | | | | 3,542,197 | |
| | | | | | | | | |
| TOTAL COMMON STOCKS | | | | | | | | |
| (Cost $70,063,938) | | | | | | | 72,855,674 | |
| | | 7 Day Yield | | | Shares | | | Value | |
| SHORT TERM INVESTMENTS (0.59%) | | | | | | | | | |
| Money Market Fund (0.13%) | | | | | | | | | |
| State Street Institutional Treasury Plus Money Market Fund (Premier Class) | | | | | | | | | |
| (Cost $95,381) | | | 5.31 | % | | | 95,381 | | | $ | 95,381 | |
| | | | | | | | | | | | | |
| Investments Purchased with Collateral from Securities Loaned (0.46%) | | | | | | | | | | | | |
| State Street Navigator Securities Lending Government Money Market Portfolio, 5.37% | | | | | | | | | | | | |
| (Cost $332,955) | | | | | | | 332,955 | | | | 332,955 | |
| TOTAL SHORT TERM INVESTMENTS | | | | | | | | | | | | |
| | | | | | | | | | | | | |
| (Cost $428,336) | | | | | | | | | | | 428,336 | |
| | | | | | | | | | | | | |
| TOTAL INVESTMENTS (100.28%) | | | | | | | | | | | | |
| (Cost $70,492,274) | | | | | | | | | | $ | 73,284,010 | |
| LIABILITIES IN EXCESS OF OTHER ASSETS (-0.28%) | | | | | | | | | | | (202,838 | ) |
| NET ASSETS - 100.00% | | | | | | | | | | $ | 73,081,172 | |
| (a) | Non-income producing security. |
| (b) | Security, or a portion of the security position is currently on loan. The total market value of securities on loan is $1,609,885. |
See Notes to Financial Statements.
14 | November 30, 2023
RiverFront Strategic Income Fund
| Schedule of Investments | November 30, 2023 |
| Security Description | | Principal Amount | | | Value | |
| CORPORATE BONDS (75.96%) | | | | | | |
| Communications (5.92%) | | | | | | |
| AMC Networks, Inc. | | | | | | |
| 5.00%, 04/01/2024 | | $ | 352,000 | | | $ | 351,948 | |
| CCO Holdings LLC / CCO Holdings Capital Corp. | | | | | | | | |
| 5.50%, 05/01/2026(a) | | | 456,000 | | | | 446,451 | |
| Charter Communications Operating LLC / Charter Communications Operating Capital | | | | | | | | |
| 6.15%, 11/10/2026 | | | 1,250,000 | | | | 1,265,961 | |
| Netflix, Inc. | | | | | | | | |
| 4.38%, 11/15/2026 | | | 855,000 | | | | 842,505 | |
| Sirius XM Radio, Inc. | | | | | | | | |
| 5.00%, 08/01/2027(a) | | | 1,000,000 | | | | 951,567 | |
| T-Mobile USA, Inc. | | | | | | | | |
| 4.75%, 02/01/2028 | | | 1,524,000 | | | | 1,495,435 | |
| Warnermedia Holdings, Inc. | | | | | | | | |
| 6.41%, 03/15/2026 | | | 503,000 | | | | 503,460 | |
| WMG Acquisition Corp. | | | | | | | | |
| 3.75%, 12/01/2029(a) | | | 855,000 | | | | 748,144 | |
| Total Communications | | | | | | | 6,605,471 | |
| | | | | | | | | |
| Consumer Discretionary (12.69%) | | | | | | | | |
| Air Canada | | | | | | | | |
| 3.88%, 08/15/2026(a) | | | 928,000 | | | | 866,796 | |
| Caesars Entertainment, Inc. | | | | | | | | |
| 6.25%, 07/01/2025(a) | | | 1,096,000 | | | | 1,090,620 | |
| Ford Motor Credit Co. LLC | | | | | | | | |
| 6.95%, 03/06/2026 | | | 1,048,000 | | | | 1,057,830 | |
| General Motors Financial Co., Inc. | | | | | | | | |
| 5.40%, 04/06/2026 | | | 990,000 | | | | 985,644 | |
| Goodyear Tire & Rubber Co. | | | | | | | | |
| 5.00%, 05/31/2026 | | | 1,118,000 | | | | 1,084,090 | |
| Hilton Domestic Operating Co., Inc. | | | | | | | | |
| 5.75%, 05/01/2028(a) | | | 1,250,000 | | | | 1,232,569 | |
| Hyatt Hotels Corp. | | | | | | | | |
| 5.75%, 01/30/2027 | | | 1,015,000 | | | | 1,027,341 | |
| International Game Technology PLC | | | | | | | | |
| 6.50%, 02/15/2025(a) | | | 244,000 | | | | 244,120 | |
| Lennar Corp. | | | | | | | | |
| 4.75%, 11/29/2027 | | | 1,020,000 | | | | 999,777 | |
| Marriott International, Inc. | | | | | | | | |
| 4.90%, 04/15/2029 | | | 990,000 | | | | 969,161 | |
| Newell Brands, Inc. | | | | | | | | |
| 6.38%, 09/15/2027 | | | 1,250,000 | | | | 1,223,560 | |
| Nissan Motor Co., Ltd. | | | | | | | | |
| 3.52%, 09/17/2025(a) | | | 1,020,000 | | | | 972,826 | |
| PulteGroup, Inc. | | | | | | | | |
| 5.50%, 03/01/2026 | | | 1,358,000 | | | | 1,360,402 | |
| Security Description | | Principal Amount | | | Value | |
| Consumer Discretionary (continued) | | | | | | |
| Volkswagen Group of America Finance LLC | | | | | | |
| 6.45%, 11/16/2030(a) | | $ | 1,005,000 | | | $ | 1,029,840 | |
| Total Consumer Discretionary | | | | | | | 14,144,576 | |
| | | | | | | | | |
| Consumer Staples (1.70%) | | | | | | | | |
| Anheuser-Busch InBev Worldwide, Inc. | | | | | | | | |
| 4.75%, 01/23/2029 | | | 928,000 | | | | 925,426 | |
| JBS USA LUX SA / JBS USA Food Co. / JBS USA Finance, Inc. | | | | | | | | |
| 5.13%, 02/01/2028 | | | 1,000,000 | | | | 971,436 | |
| Total Consumer Staples | | | | | | | 1,896,862 | |
| | | | | | | | | |
| Energy (4.99%) | | | | | | | | |
| Columbia Pipelines Holding Co. LLC | | | | | | | | |
| 6.04%, 08/15/2028(a) | | | 1,048,000 | | | | 1,060,368 | |
| DCP Midstream Operating LP | | | | | | | | |
| 5.38%, 07/15/2025 | | | 859,000 | | | | 858,205 | |
| Petroleos Mexicanos | | | | | | | | |
| 4.88%, 01/18/2024 | | | 893,000 | | | | 887,524 | |
| Reliance Industries, Ltd. | | | | | | | | |
| 4.13%, 01/28/2025(a) | | | 840,000 | | | | 824,612 | |
| Schlumberger Holdings Corp. | | | | | | | | |
| 3.90%, 05/17/2028(a) | | | 928,000 | | | | 880,867 | |
| Sunoco LP / Sunoco Finance Corp. | | | | | | | | |
| 7.00%, 09/15/2028(a) | | | 1,048,000 | | | | 1,056,902 | |
| Total Energy | | | | | | | 5,568,478 | |
| | | | | | | | | |
| Financials (22.92%) | | | | | | | | |
| Air Lease Corp. | | | | | | | | |
| 4.25%, 02/01/2024 | | | 859,000 | | | | 855,930 | |
| Aircastle, Ltd. | | | | | | | | |
| 6.50%, 07/18/2028(a) | | | 1,084,000 | | | | 1,082,291 | |
| American Express Co. | | | | | | | | |
| 5.85%, 11/05/2027 | | | 1,132,000 | | | | 1,163,426 | |
| Ares Capital Corp. | | | | | | | | |
| 7.00%, 01/15/2027 | | | 1,000,000 | | | | 1,010,813 | |
| Banco Santander SA | | | | | | | | |
| 5.15%, 08/18/2025 | | | 1,000,000 | | | | 986,336 | |
| Bank of America Corp. | | | | | | | | |
| 4.25%, 10/22/2026 | | | 1,392,000 | | | | 1,344,136 | |
| Blackstone Secured Lending Fund | | | | | | | | |
| 3.63%, 01/15/2026 | | | 1,012,000 | | | | 947,958 | |
| Blue Owl Credit Income Corp. | | | | | | | | |
| 7.75%, 01/15/2029(a) | | | 1,000,000 | | | | 994,442 | |
| Capital One Financial Corp. | | | | | | | | |
| 4.20%, 10/29/2025 | | | 928,000 | | | | 890,838 | |
| Citigroup, Inc. | | | | | | | | |
| 4.45%, 09/29/2027 | | | 1,392,000 | | | | 1,331,813 | |
| EPR Properties | | | | | | | | |
| 4.75%, 12/15/2026 | | | 859,000 | | | | 808,260 | |
| FS KKR Capital Corp. | | | | | | | | |
| 3.40%, 01/15/2026 | | | 1,020,000 | | | | 948,810 | |
See Notes to Financial Statements.
15 | November 30, 2023
RiverFront Strategic Income Fund
| Schedule of Investments | November 30, 2023 |
| Security Description | | Principal Amount | | | Value | |
| Financials (continued) | | | | | | |
| Goldman Sachs Group, Inc. | | | | | | |
| 4.25%, 10/21/2025 | | $ | 1,392,000 | | | $ | 1,356,722 | |
| HAT Holdings I LLC / HAT Holdings II LLC | | | | | | | | |
| 3.38%, 06/15/2026(a) | | | 949,000 | | | | 859,745 | |
| Icahn Enterprises LP / Icahn Enterprises Finance Corp. | | | | | | | | |
| 4.75%, 09/15/2024 | | | 1,097,000 | | | | 1,077,474 | |
| Iron Mountain, Inc. | | | | | | | | |
| 4.88%, 09/15/2027(a) | | | 974,000 | | | | 922,952 | |
| JPMorgan Chase & Co. | | | | | | | | |
| 4.25%, 10/01/2027 | | | 1,392,000 | | | | 1,353,363 | |
| KeyBank NA/Cleveland OH | | | | | | | | |
| 5.85%, 11/15/2027 | | | 1,080,000 | | | | 1,045,136 | |
| Omega Healthcare Investors, Inc. | | | | | | | | |
| 5.25%, 01/15/2026 | | | 567,000 | | | | 552,131 | |
| OneMain Finance Corp. | | | | | | | | |
| 6.13%, 03/15/2024 | | | 566,000 | | | | 565,794 | |
| Penske Truck Leasing Co. Lp / PTL Finance Corp. | | | | | | | | |
| 6.05%, 08/01/2028(a) | | | 1,084,000 | | | | 1,093,650 | |
| Royal Bank of Canada | | | | | | | | |
| 6.00%, 11/01/2027 | | | 1,132,000 | | | | 1,163,324 | |
| SBA Communications Corp. | | | | | | | | |
| 3.88%, 02/15/2027 | | | 1,300,000 | | | | 1,224,429 | |
| Starwood Property Trust, Inc. | | | | | | | | |
| 4.75%, 03/15/2025 | | | 855,000 | | | | 842,320 | |
| VICI Properties LP / VICI Note Co., Inc. | | | | | | | | |
| 4.25%, 12/01/2026(a) | | | 1,207,000 | | | | 1,138,394 | |
| Total Financials | | | | | | | 25,560,487 | |
| | | | | | | | | |
| Health Care (2.09%) | | | | | | | | |
| DaVita, Inc. | | | | | | | | |
| 4.63%, 06/01/2030(a) | | | 974,000 | | | | 824,080 | |
| GE HealthCare Technologies, Inc. | | | | | | | | |
| 5.60%, 11/15/2025 | | | 1,080,000 | | | | 1,081,592 | |
| HCA, Inc. | | | | | | | | |
| 5.38%, 02/01/2025 | | | 432,000 | | | | 429,607 | |
| Total Health Care | | | | | | | 2,335,279 | |
| | | | | | | | | |
| Industrials (7.26%) | | | | | | | | |
| Boeing Co. | | | | | | | | |
| 4.88%, 05/01/2025 | | | 1,020,000 | | | | 1,009,409 | |
| L3Harris Technologies, Inc. | | | | | | | | |
| 5.40%, 07/31/2033 | | | 1,348,000 | | | | 1,343,616 | |
| MasTec, Inc. | | | | | | | | |
| 4.50%, 08/15/2028(a) | | | 944,000 | | | | 851,347 | |
| Sensata Technologies BV | | | | | | | | |
| 5.00%, 10/01/2025(a) | | | 855,000 | | | | 841,896 | |
| Stericycle, Inc. | | | | | | | | |
| 5.38%, 07/15/2024(a) | | | 860,000 | | | | 857,171 | |
| TransDigm, Inc. | | | | | | | | |
| 6.25%, 03/15/2026(a) | | | 905,000 | | | | 899,690 | |
| Security Description | | Principal Amount | | | Value | |
| Industrials (continued) | | | | | | |
| United Rentals North America, Inc. | | | | | | | | |
| 6.00%, 12/15/2029(a) | | $ | 1,048,000 | | | $ | 1,048,089 | |
| WESCO Distribution, Inc. | | | | | �� | | | |
| 7.13%, 06/15/2025(a) | | | 1,246,000 | | | | 1,248,676 | |
| Total Industrials | | | | | | | 8,099,894 | |
| | | | | | | | | |
| Materials (9.41%) | | | | | | | | |
| Alcoa Nederland Holding BV | | | | | | | | |
| 4.13%, 03/31/2029(a) | | | 1,141,000 | | | | 1,018,765 | |
| ArcelorMittal SA | | | | | | | | |
| 6.55%, 11/29/2027 | | | 1,080,000 | | | | 1,115,870 | |
| Ardagh Packaging Finance PLC / Ardagh Holdings USA, Inc. | | | | | | | | |
| 5.25%, 04/30/2025(a) | | | 1,114,000 | | | | 1,086,686 | |
| Ball Corp. | | | | | | | | |
| 5.25%, 07/01/2025 | | | 696,000 | | | | 693,024 | |
| 4.88%, 03/15/2026 | | | 432,000 | | | | 423,642 | |
| Berry Global, Inc. | | | | | | | | |
| 4.88%, 07/15/2026(a) | | | 978,000 | | | | 947,957 | |
| Celanese US Holdings LLC | | | | | | | | |
| 6.55%, 11/15/2030 | | | 1,084,000 | | | | 1,113,294 | |
| Freeport-McMoRan, Inc. | | | | | | | | |
| 5.00%, 09/01/2027 | | | 473,000 | | | | 462,580 | |
| Methanex Corp. | | | | | | | | |
| 5.13%, 10/15/2027 | | | 905,000 | | | | 853,931 | |
| NOVA Chemicals Corp. | | | | | | | | |
| 4.88%, 06/01/2024(a) | | | 515,000 | | | | 509,499 | |
| Novelis Corp. | | | | | | | | |
| 3.25%, 11/15/2026(a) | | | 859,000 | | | | 788,840 | |
| Sasol Financing USA LLC | | | | | | | | |
| 4.38%, 09/18/2026 | | | 567,000 | | | | 515,467 | |
| Standard Industries, Inc. | | | | | | | | |
| 5.00%, 02/15/2027(a) | | | 1,000,000 | | | | 959,550 | |
| Total Materials | | | | | | | 10,489,105 | |
| | | | | | | | | |
| Technology (3.50%) | | | | | | | | |
| CDW LLC / CDW Finance Corp. | | | | | | | | |
| 3.57%, 12/01/2031 | | | 855,000 | | | | 737,057 | |
| Concentrix Corp. | | | | | | | | |
| 6.60%, 08/02/2028 | | | 1,524,000 | | | | 1,523,117 | |
| Gen Digital, Inc. | | | | | | | | |
| 5.00%, 04/15/2025(a) | | | 723,000 | | | | 717,722 | |
| Microchip Technology, Inc. | | | | | | | | |
| 4.25%, 09/01/2025 | | | 944,000 | | | | 920,646 | |
| Total Technology | | | | | | | 3,898,542 | |
| | | | | | | | | |
| Utilities (5.48%) | | | | | | | | |
| American Electric Power Co., Inc. | | | | | | | | |
| 5.75%, 11/01/2027 | | | 1,132,000 | | | | 1,150,502 | |
| AmeriGas Partners LP / AmeriGas Finance Corp. | | | | | | | | |
| 5.88%, 08/20/2026 | | | 949,000 | | | | 927,611 | |
| Calpine Corp. | | | | | | | | |
| 5.25%, 06/01/2026(a) | | | 456,000 | | | | 447,999 | |
See Notes to Financial Statements.
16 | November 30, 2023
RiverFront Strategic Income Fund
| Schedule of Investments | November 30, 2023 |
| Security Description | | Principal Amount | | | Value | |
| Utilities (continued) | | | | | | |
| NextEra Energy Operating Partners LP | | | | | | | | |
| 4.25%, 07/15/2024(a) | | $ | 1,242,000 | | | $ | 1,226,052 | |
| NRG Energy, Inc. | | | | | | | | |
| 6.63%, 01/15/2027 | | | 306,000 | | | | 303,884 | |
| 5.75%, 01/15/2028(b) | | | 1,000,000 | | | | 976,475 | |
| Vistra Operations Co. LLC | | | | | | | | |
| 7.75%, 10/15/2031(a) | | | 1,048,000 | | | | 1,073,480 | |
| Total Utilities | | | | | | | 6,106,003 | |
| | | | | | | | | |
| TOTAL CORPORATE BONDS | | | | | | | | |
| (Cost $87,556,904) | | | | | | | 84,704,697 | |
| | | | | | | | | |
| GOVERNMENT BONDS (20.75%) | | | | | | | | |
| U.S. Treasury Note | | | | | | | | |
| 2.88%, 06/15/2025 | | | 79,000 | | | | 76,656 | |
| 3.25%, 06/30/2029 | | | 107,000 | | | | 101,140 | |
| 4.00%, 07/31/2030 | | | 2,155,000 | | | | 2,109,164 | |
| United States Treasury Bond | | | | | | | | |
| 6.13%, 08/15/2029 | | | 2,529,000 | | | | 2,750,189 | |
| 3.25%, 05/15/2042 | | | 6,345,000 | | | | 5,194,349 | |
| 3.88%, 02/15/2043 | | | 4,013,000 | | | | 3,579,956 | |
| 3.88%, 05/15/2043 | | | 1,348,000 | | | | 1,201,721 | |
| 4.00%, 11/15/2052 | | | 8,889,000 | | | | 8,123,713 | |
| TOTAL GOVERNMENT BONDS | | | | | | | | |
| (Cost $25,822,744) | | | | | | | 23,136,888 | |
| | | 7 Day Yield | | | Shares | | | Value | |
| SHORT TERM INVESTMENTS (3.10%) | | | | | | | | | |
| Money Market Fund (3.10%) | | | | | | | | | |
| State Street Institutional Treasury Plus Money Market Fund (Premier Class) | | | 5.31 | % | | | 3,463,886 | | | | 3,463,886 | |
| | | | | | | | | | | | | |
| TOTAL SHORT TERM INVESTMENTS | | | | | | | | | | | | |
| | | | | | | | | | | | | |
| (Cost $3,463,886) | | | | | | | | | | | 3,463,886 | |
| | | | | | | | | | | | | |
| TOTAL INVESTMENTS (99.81%) | | | | | | | | | | | | |
| (Cost $116,843,534) | | | | | | | | | | $ | 111,305,471 | |
| OTHER ASSETS IN EXCESS OF LIABILITIES (0.19%) | | | | | | | | | | | 207,153 | |
| NET ASSETS - 100.00% | | | | | | | | | | $ | 111,512,624 | |
| (a) | Securities exempt from registration under Rule 144A of the Securities Act of 1933. These securities may be sold in the ordinary course of business in transactions exempt from registration, normally to qualified institutional buyers. At period end, the aggregate market value of those securities was $32,844,656, representing 29.45% of net assets. |
| (b) | Represents a security purchased on a when-issued basis. |
See Notes to Financial Statements.
17 | November 30, 2023
RiverFront ETFs
| Statements of Assets and Liabilities | November 30, 2023 |
| | | RiverFront Dynamic Core Income ETF | | | RiverFront Dynamic US Dividend Advantage ETF | | | RiverFront Strategic Income Fund | |
| ASSETS: | | | | | | | | | | | | |
| Investments, at value(a) | | $ | 26,484,658 | | | $ | 73,284,010 | | | $ | 111,305,471 | |
| Dividend receivable | | | – | | | | 160,362 | | | | – | |
| Interest receivable | | | 263,106 | | | | 812 | | | | 1,246,801 | |
| Total Assets | | | 26,747,764 | | | | 73,445,184 | | | | 112,552,272 | |
| | | | | | | | | | | | | |
| LIABILITIES: | | | | | | | | | | | | |
| Payable to adviser | | | 11,273 | | | | 31,057 | | | | 41,568 | |
| Payable for investments purchased | | | 998,080 | | | | – | | | | 998,080 | |
| Payable for collateral upon return of securities loaned | | | – | | | | 332,955 | | | | – | |
| Total Liabilities | | | 1,009,353 | | | | 364,012 | | | | 1,039,648 | |
| NET ASSETS | | $ | 25,738,411 | | | $ | 73,081,172 | | | $ | 111,512,624 | |
| | | | | | | | | | | | | |
| NET ASSETS CONSIST OF: | | | | | | | | | | | | |
| Paid-in capital | | $ | 30,206,895 | | | $ | 77,058,813 | | | $ | 130,354,717 | |
| Total distributable earnings/(accumulated losses) | | | (4,468,484 | ) | | | (3,977,641 | ) | | | (18,842,093 | ) |
| NET ASSETS | | $ | 25,738,411 | | | $ | 73,081,172 | | | $ | 111,512,624 | |
| | | | | | | | | | | | | |
| INVESTMENTS, AT COST | | $ | 27,743,328 | | | $ | 70,492,274 | | | $ | 116,843,534 | |
| | | | | | | | | | | | | |
| PRICING OF SHARES | | | | | | | | | | | | |
| Net Assets | | $ | 25,738,411 | | | $ | 73,081,172 | | | $ | 111,512,624 | |
| Shares of beneficial interest outstanding (Unlimited number of shares authorized, par value $0.01 per share) | | | 1,175,000 | | | | 1,600,002 | | | | 4,950,000 | |
| Net Asset Value, offering and redemption price per share | | $ | 21.91 | | | $ | 45.68 | | | $ | 22.53 | |
| (a) | Includes $-, $1,609,885, and $-, respectively, of securities on loan. |
See Notes to Financial Statements.
18 | November 30, 2023
RiverFront ETFs
| Statements of Operations | For the Year Ended November 30, 2023 |
| | | RiverFront Dynamic Core Income ETF | | | RiverFront Dynamic US Dividend Advantage ETF | | | RiverFront Strategic Income Fund | |
| INVESTMENT INCOME: | | | | | | | | | |
| Interest | | $ | 1,189,207 | | | $ | – | | | $ | 4,029,171 | |
| Dividends | | | 97,064 | | | | 2,581,845 | | | | 237,786 | |
| Securities Lending Income | | | – | | | | 5,858 | | | | – | |
| Total Investment Income | | | 1,286,271 | | | | 2,587,703 | | | | 4,266,957 | |
| | | | | | | | | | | | | |
| EXPENSES: | | | | | | | | | | | | |
| Investment adviser and sub-adviser fees (Note 3) | | | 167,709 | | | | 400,872 | | | | 498,970 | |
| Total Expenses | | | 167,709 | | | | 400,872 | | | | 498,970 | |
| NET INVESTMENT INCOME | | | 1,118,562 | | | | 2,186,831 | | | | 3,767,987 | |
| | | | | | | | | | | | | |
| REALIZED AND UNREALIZED GAIN/(LOSS) | | | | | | | | | | | | |
| Net realized gain/(loss) on investments(a) | | | (2,678,063 | ) | | | 554,903 | | | | (1,911,709 | ) |
| NET REALIZED GAIN/(LOSS) | | | (2,678,063 | ) | | | 554,903 | | | | (1,911,709 | ) |
| Net change in unrealized appreciation on investments | | | 2,316,487 | | | | 189,124 | | | | 1,453,519 | |
| NET CHANGE IN UNREALIZED APPRECIATION/(DEPRECIATION) | | | 2,316,487 | | | | 189,124 | | | | 1,453,519 | |
| NET REALIZED AND UNREALIZED GAIN/(LOSS) ON INVESTMENTS | | | (361,576 | ) | | | 744,027 | | | | (458,190 | ) |
| NET INCREASE IN NET ASSETS RESULTING FROM OPERATIONS | | $ | 756,986 | | | $ | 2,930,858 | | | $ | 3,309,797 | |
| (a) | Includes realized gain or loss as a result of in-kind transactions (See Note 4 in Notes to Financial Statements). |
See Notes to Financial Statements.
19 | November 30, 2023
RiverFront Dynamic Core Income ETF
| Statements of Changes in Net Assets |
| | | For the Year Ended November 30, 2023 | | | For the Year Ended November 30, 2022 | |
| OPERATIONS: | | | | | | |
| Net investment income | | $ | 1,118,562 | | | $ | 1,590,452 | |
| Net realized loss | | | (2,678,063 | ) | | | (4,980,857 | ) |
| Net change in unrealized appreciation/(depreciation) | | | 2,316,487 | | | | (5,468,905 | ) |
| Net increase/(decrease) in net assets resulting from operations | | | 756,986 | | | | (8,859,310 | ) |
| | | | | | | | | |
| DISTRIBUTIONS TO SHAREHOLDERS: | | | | | | | | |
| From distributable earnings | | | (1,130,961 | ) | | | (3,382,868 | ) |
| Total distributions | | | (1,130,961 | ) | | | (3,382,868 | ) |
| | | | | | | | | |
| CAPITAL SHARE TRANSACTIONS: | | | | | | | | |
| Proceeds from sale of shares | | | – | | | | 4,002,594 | |
| Shares redeemed | | | (17,228,796 | ) | | | (66,292,105 | ) |
| Net decrease from share transactions | | | (17,228,796 | ) | | | (62,289,511 | ) |
| | | | | | | | | |
| Net decrease in net assets | | | (17,602,771 | ) | | | (74,531,689 | ) |
| | | | | | | | | |
| NET ASSETS: | | | | | | | | |
| Beginning of year | | | 43,341,182 | | | | 117,872,871 | |
| End of year | | $ | 25,738,411 | | | $ | 43,341,182 | |
| | | | | | | | | |
| OTHER INFORMATION: | | | | | | | | �� |
| CAPITAL SHARE TRANSACTIONS: | | | | | | | | |
| Beginning shares | | | 1,950,000 | | | | 4,650,000 | |
| Shares sold | | | – | | | | 175,000 | |
| Shares redeemed | | | (775,000 | ) | | | (2,875,000 | ) |
| Shares outstanding, end of year | | | 1,175,000 | | | | 1,950,000 | |
See Notes to Financial Statements.
20 | November 30, 2023
RiverFront Dynamic US Dividend Advantage ETF
| Statements of Changes in Net Assets |
| | | For the Year Ended November 30, 2023 | | | For the Year Ended November 30, 2022 | |
| OPERATIONS: | | | | | | |
| Net investment income | | $ | 2,186,831 | | | $ | 3,463,622 | |
| Net realized gain | | | 554,903 | | | | 35,036,588 | |
| Net change in unrealized appreciation/(depreciation) | | | 189,124 | | | | (36,235,123 | ) |
| Net increase in net assets resulting from operations | | | 2,930,858 | | | | 2,265,087 | |
| | | | | | | | | |
| DISTRIBUTIONS TO SHAREHOLDERS: | | | | | | | | |
| From distributable earnings | | | (2,143,621 | ) | | | (3,342,217 | ) |
| Total distributions | | | (2,143,621 | ) | | | (3,342,217 | ) |
| | | | | | | | | |
| CAPITAL SHARE TRANSACTIONS: | | | | | | | | |
| Proceeds from sale of shares | | | 2,355,358 | | | | 54,331,616 | |
| Shares redeemed | | | (22,942,546 | ) | | | (92,897,556 | ) |
| Net decrease from share transactions | | | (20,587,188 | ) | | | (38,565,940 | ) |
| | | | | | | | | |
| Net decrease in net assets | | | (19,799,951 | ) | | | (39,643,070 | ) |
| | | | | | | | | |
| NET ASSETS: | | | | | | | | |
| Beginning of year | | | 92,881,123 | | | | 132,524,193 | |
| End of year | | $ | 73,081,172 | | | $ | 92,881,123 | |
| | | | | | | | | |
| OTHER INFORMATION: | | | | | | | | |
| CAPITAL SHARE TRANSACTIONS: | | | | | | | | |
| Beginning shares | | | 2,075,002 | | | | 2,950,002 | |
| Shares sold | | | 50,000 | | | | 1,200,000 | |
| Shares redeemed | | | (525,000 | ) | | | (2,075,000 | ) |
| Shares outstanding, end of year | | | 1,600,002 | | | | 2,075,002 | |
See Notes to Financial Statements.
21 | November 30, 2023
RiverFront Strategic Income Fund
| Statements of Changes in Net Assets |
| | | For the Year Ended November 30, 2023 | | | For the Year Ended November 30, 2022 | |
| OPERATIONS: | | | | | | |
| Net investment income | | $ | 3,767,987 | | | $ | 2,966,868 | |
| Net realized loss | | | (1,911,709 | ) | | | (3,575,790 | ) |
| Net change in unrealized appreciation/(depreciation) | | | 1,453,519 | | | | (6,970,220 | ) |
| Net increase/(decrease) in net assets resulting from operations | | | 3,309,797 | | | | (7,579,142 | ) |
| | | | | | | | | |
| DISTRIBUTIONS TO SHAREHOLDERS: | | | | | | | | |
| From distributable earnings | | | (3,786,149 | ) | | | (3,248,534 | ) |
| Total distributions | | | (3,786,149 | ) | | | (3,248,534 | ) |
| | | | | | | | | |
| CAPITAL SHARE TRANSACTIONS: | | | | | | | | |
| Proceeds from sale of shares | | | 23,160,799 | | | | 9,753,437 | |
| Shares redeemed | | | (15,931,141 | ) | | | (37,059,629 | ) |
| Net increase/(decrease) from share transactions | | | 7,229,658 | | | | (27,306,192 | ) |
| | | | | | | | | |
| Net increase/(decrease) in net assets | | | 6,753,306 | | | | (38,133,868 | ) |
| | | | | | | | | |
| NET ASSETS: | | | | | | | | |
| Beginning of year | | | 104,759,318 | | | | 142,893,186 | |
| End of year | | $ | 111,512,624 | | | $ | 104,759,318 | |
| | | | | | | | | |
| OTHER INFORMATION: | | | | | | | | |
| CAPITAL SHARE TRANSACTIONS: | | | | | | | | |
| Beginning shares | | | 4,625,000 | | | | 5,825,000 | |
| Shares sold | | | 1,025,000 | | | | 425,000 | |
| Shares redeemed | | | (700,000 | ) | | | (1,625,000 | ) |
| Shares outstanding, end of year | | | 4,950,000 | | | | 4,625,000 | |
See Notes to Financial Statements.
22 | November 30, 2023
RiverFront Dynamic Core Income ETF
| Financial Highlights | For a Share Outstanding Throughout the Periods Presented |
| | | For the Year Ended November 30, 2023 | | | For the Year Ended November 30, 2022 | | | For the Year Ended November 30, 2021 | | | For the Year Ended November 30, 2020 | | | For the Year Ended November 30, 2019 | |
| NET ASSET VALUE, BEGINNING OF PERIOD | | $ | 22.23 | | | $ | 25.35 | | | $ | 26.21 | | | $ | 25.22 | | | $ | 23.52 | |
| | | | | | | | | | | | | | | | | | | | | |
| INCOME/(LOSS) FROM INVESTMENT OPERATIONS: | | | | | | | | | | | | | | | | | | | | |
| Net investment income(a) | | | 0.75 | | | | 0.47 | | | | 0.47 | | | | 0.50 | | | | 0.68 | |
| Net realized and unrealized gain/(loss) | | | (0.29 | ) | | | (2.71 | ) | | | (0.87 | ) | | | 0.99 | | | | 1.70 | |
| Total from investment operations | | | 0.46 | | | | (2.24 | ) | | | (0.40 | ) | | | 1.49 | | | | 2.38 | |
| | | | | | | | | | | | | | | | | | | | | |
| DISTRIBUTIONS: | | | | | | | | | | | | | | | | | | | | |
| From net investment income | | | (0.78 | ) | | | (0.50 | ) | | | (0.46 | ) | | | (0.50 | ) | | | (0.68 | ) |
| From net realized gains | | | – | | | | (0.38 | ) | | | – | | | | – | | | | – | |
| Total distributions | | | (0.78 | ) | | | (0.88 | ) | | | (0.46 | ) | | | (0.50 | ) | | | (0.68 | ) |
| | | | | | | | | | | | | | | | | | | | | |
| NET INCREASE/(DECREASE) IN NET ASSET VALUE | | | (0.32 | ) | | | (3.12 | ) | | | (0.86 | ) | | | 0.99 | | | | 1.70 | |
| NET ASSET VALUE, END OF PERIOD | | $ | 21.91 | | | $ | 22.23 | | | $ | 25.35 | | | $ | 26.21 | | | $ | 25.22 | |
| TOTAL RETURN(b) | | | 2.12 | % | | | (9.02 | )% | | | (1.51 | )% | | | 5.97 | % | | | 10.22 | % |
| | | | | | | | | | | | | | | | | | | | | |
| RATIOS/SUPPLEMENTAL DATA: | | | | | | | | | | | | | | | | | | | | |
| Net assets, end of period (000s) | | $ | 25,738 | | | $ | 43,341 | | | $ | 117,873 | | | $ | 112,724 | | | $ | 134,951 | |
| | | | | | | | | | | | | | | | | | | | | |
| Ratio of expenses to average net assets | | | 0.51 | % | | | 0.51 | % | | | 0.51 | % | | | 0.51 | % | | | 0.51 | % |
| Ratio of net investment income to average net assets | | | 3.40 | % | | | 2.03 | % | | | 1.83 | % | | | 1.94 | % | | | 2.74 | % |
| Portfolio turnover rate(c) | | | 54 | % | | | 50 | % | | | 45 | % | | | 11 | % | | | 6 | % |
| (a) | Based on average shares outstanding during the period. |
| (b) | Total return is calculated assuming an initial investment made at the net asset value at the beginning of the period and the redemption at the net asset value on the last day of the period and assuming all distributions are reinvested at the actual reinvestment prices. Total return calculated for a period of less than one year is not annualized. |
| (c) | Portfolio turnover for periods less than one year are not annualized and does not include securities received or delivered from processing creations or redemptions in-kind. |
See Notes to Financial Statements.
23 | November 30, 2023
RiverFront Dynamic US Dividend Advantage ETF
| Financial Highlights | For a Share Outstanding Throughout the Periods Presented |
| | | For the Year Ended November 30, 2023 | | | For the Year Ended November 30, 2022 | | | For the Year Ended November 30, 2021 | | | For the Year Ended November 30, 2020 | | | For the Year Ended November 30, 2019 | |
| NET ASSET VALUE, BEGINNING OF PERIOD | | $ | 44.76 | | | $ | 44.92 | | | $ | 37.03 | | | $ | 33.98 | | | $ | 31.19 | |
| | | | | | | | | | | | | | | | | | | | | |
| INCOME/(LOSS) FROM INVESTMENT OPERATIONS: | | | | | | | | | | | | | | | | | | | | |
| Net investment income(a) | | | 1.25 | | | | 1.46 | | | | 0.62 | | | | 0.56 | | | | 0.65 | |
| Net realized and unrealized gain/(loss) | | | 0.89 | | | | (0.21 | ) | | | 7.90 | | | | 3.08 | | | | 2.81 | |
| Total from investment operations | | | 2.14 | | | | 1.25 | | | | 8.52 | | | | 3.64 | | | | 3.46 | |
| | | | | | | | | | | | | | | | | | | | | |
| DISTRIBUTIONS: | | | | | | | | | | | | | | | | | | | | |
| From net investment income | | | (1.22 | ) | | | (1.41 | ) | | | (0.63 | ) | | | (0.59 | ) | | | (0.67 | ) |
| Total distributions | | | (1.22 | ) | | | (1.41 | ) | | | (0.63 | ) | | | (0.59 | ) | | | (0.67 | ) |
| | | | | | | | | | | | | | | | | | | | | |
| NET INCREASE/(DECREASE) IN NET ASSET VALUE | | | 0.92 | | | | (0.16 | ) | | | 7.89 | | | | 3.05 | | | | 2.79 | |
| NET ASSET VALUE, END OF PERIOD | | $ | 45.68 | | | $ | 44.76 | | | $ | 44.92 | | | $ | 37.03 | | | $ | 33.98 | |
| TOTAL RETURN(b) | | | 4.96 | % | | | 2.86 | % | | | 23.13 | % | | | 10.92 | % | | | 11.29 | % |
| | | | | | | | | | | | | | | | | | | | | |
| RATIOS/SUPPLEMENTAL DATA: | | | | | | | | | | | | | | | | | | | | |
| Net assets, end of period (000s) | | $ | 73,081 | | | $ | 92,881 | | | $ | 132,524 | | | $ | 133,294 | | | $ | 130,828 | |
| | | | | | | | | | | | | | | | | | | | | |
| Ratio of expenses to average net assets | | | 0.52 | % | | | 0.52 | % | | | 0.52 | % | | | 0.52 | % | | | 0.52 | % |
| Ratio of net investment income to average net assets | | | 2.84 | % | | | 3.23 | % | | | 1.47 | % | | | 1.68 | % | | | 2.05 | % |
| Portfolio turnover rate(c) | | | 50 | % | | | 104 | % | | | 0 | % | | | 75 | % | | | 64 | % |
| (a) | Based on average shares outstanding during the period. |
| (b) | Total return is calculated assuming an initial investment made at the net asset value at the beginning of the period and the redemption at the net asset value on the last day of the period and assuming all distributions are reinvested at the actual reinvestment prices. Total return calculated for a period of less than one year is not annualized. |
| (c) | Portfolio turnover for periods less than one year are not annualized and does not include securities received or delivered from processing creations or redemptions in-kind. |
See Notes to Financial Statements.
24 | November 30, 2023
RiverFront Strategic Income Fund
| Financial Highlights | For a Share Outstanding Throughout the Periods Presented |
| | | For the Year Ended November 30, 2023 | | | For the Year Ended November 30, 2022 | | | For the Year Ended November 30, 2021 | | | For the Year Ended November 30, 2020 | | | For the Year Ended November 30, 2019 | |
| NET ASSET VALUE, BEGINNING OF PERIOD | | $ | 22.65 | | | $ | 24.53 | | | $ | 24.79 | | | $ | 24.69 | | | $ | 24.27 | |
| | | | | | | | | | | | | | | | | | | | | |
| INCOME/(LOSS) FROM INVESTMENT OPERATIONS: | | | | | | | | | | | | | | | | | | | | |
| Net investment income(a) | | | 0.78 | | | | 0.55 | | | | 0.55 | | | | 0.81 | | | | 0.94 | |
| Net realized and unrealized gain/(loss) | | | (0.12 | ) | | | (1.82 | ) | | | (0.18 | ) | | | 0.13 | (b) | | | 0.48 | |
| Total from investment operations | | | 0.66 | | | | (1.27 | ) | | | 0.37 | | | | 0.94 | | | | 1.42 | |
| | | | | | | | | | | | | | | | | | | | | |
| DISTRIBUTIONS: | | | | | | | | | | | | | | | | | | | | |
| From net investment income | | | (0.78 | ) | | | (0.61 | ) | | | (0.63 | ) | | | (0.84 | ) | | | (1.00 | ) |
| Total distributions | | | (0.78 | ) | | | (0.61 | ) | | | (0.63 | ) | | | (0.84 | ) | | | (1.00 | ) |
| | | | | | | | | | | | | | | | | | | | | |
| NET INCREASE/(DECREASE) IN NET ASSET VALUE | | | (0.12 | ) | | | (1.88 | ) | | | (0.26 | ) | | | 0.10 | | | | 0.42 | |
| NET ASSET VALUE, END OF PERIOD | | $ | 22.53 | | | $ | 22.65 | | | $ | 24.53 | | | $ | 24.79 | | | $ | 24.69 | |
| TOTAL RETURN(c) | | | 2.98 | % | | | (5.20 | )% | | | 1.52 | % | | | 3.95 | % | | | 5.96 | % |
| | | | | | | | | | | | | | | | | | | | | |
| RATIOS/SUPPLEMENTAL DATA: | | | | | | | | | | | | | | | | | | | | |
| Net assets, end of period (000s) | | $ | 111,513 | | | $ | 104,759 | | | $ | 142,893 | | | $ | 118,984 | | | $ | 167,889 | |
| | | | | | | | | | | | | | | | | | | | | |
| Ratio of expenses excluding waiver/reimbursement to average net assets | | | 0.46 | % | | | 0.46 | % | | | 0.46 | % | | | 0.46 | % | | | 0.46 | % |
| Ratio of expenses including waiver/reimbursement to average net assets | | | 0.46 | % | | | 0.46 | % | | | 0.46 | % | | | 0.46 | % | | | 0.46 | % |
| Ratio of net investment income including expenses waiver/reimbursement to average net assets | | | 3.47 | % | | | 2.35 | % | | | 2.23 | % | | | 3.32 | % | | | 3.83 | % |
| Portfolio turnover rate(d) | | | 52 | % | | | 24 | % | | | 50 | % | | | 54 | % | | | 44 | % |
| (a) | Based on average shares outstanding during the period. |
| (b) | Net realized and unrealized gain on investments per share does not correlate to the aggregate of the net realized and unrealized gain/(loss) in the Statements of Operations for the period(s) presented, primarily due to the timing of the sales and repurchases of the Fund's shares in relation to the fluctuating market values for the Fund's portfolio. |
| (c) | Total return is calculated assuming an initial investment made at the net asset value at the beginning of the period and the redemption at the net asset value on the last day of the period and assuming all distributions are reinvested at the actual reinvestment prices. Total return calculated for a period of less than one year is not annualized. |
| (d) | Portfolio turnover for periods less than one year are not annualized and does not include securities received or delivered from processing creations or redemptions in-kind. |
See Notes to Financial Statements.
25 | November 30, 2023
RiverFront ETFs
| Notes to Financial Statements | November 30, 2023 |
1. ORGANIZATION
ALPS ETF Trust (the “Trust”), a Delaware statutory trust, is an open-end management investment company registered under the Investment Company Act of 1940, as amended (the “1940 Act”). As of November 30, 2023, the Trust consisted of twenty-three separate portfolios. Each portfolio represents a separate series of the Trust. This report pertains solely to the RiverFront Dynamic Core Income ETF, the RiverFront Dynamic US Dividend Advantage ETF, and the RiverFront Strategic Income Fund (each a “Fund” and collectively, the “Funds”).
The investment objective of the RiverFront Dynamic Core Income ETF Fund is to seek total return, with an emphasis on income as the source of that total return. The investment objective of the RiverFront Dynamic US Dividend Advantage ETF Fund is to seek to provide capital appreciation and dividend income. The investment objective of the RiverFront Strategic Income Fund is to seek total return, with an emphasis on income as the source of that total return. Each Fund has elected to qualify as a diversified series of the Trust under the 1940 Act
Each Fund’s Shares (“Shares”) are listed on the NYSE Arca, Inc. (the “NYSE Arca”). Each Fund issues and redeems Shares, at net asset value (“NAV”) in blocks of 25,000 Shares, each of which is called a “Creation Unit”. Creation Units are issued and redeemed principally in-kind for securities and/or cash. Except when aggregated in Creation Units, Shares are not redeemable securities of a Fund.
Pursuant to the Trust’s organizational documents, its Officers and Trustees are indemnified against certain liability arising out of the performance of their duties to the Trust. Additionally, in the normal course of business, the Trust enters into contracts with service providers that contain general indemnification clauses. The Trust’s maximum exposure under these arrangements is unknown, as this would involve future claims that may be made against the Trust that have not yet occurred.
2. SIGNIFICANT ACCOUNTING POLICIES
The following is a summary of significant accounting policies consistently followed by the Funds in the preparation of the financial statements. The accompanying financial statements were prepared in accordance with accounting principles generally accepted in the United States of America (“U.S. GAAP”). The preparation of financial statements in conformity with U.S. GAAP requires management to make certain estimates and assumptions that affect the reported amounts of assets and liabilities and disclosures of contingent assets and liabilities at the date of the financial statements and the reported amounts of revenue and expenses during the period. Actual results could differ from those estimates. Each Fund is considered an investment company under U.S. GAAP and follows the accounting and reporting guidance applicable to investment companies in the Financial Accounting Standards Board (“FASB”) Accounting Standards Codification Topic 946.
A. Portfolio Valuation
Each Fund’s NAV is determined daily, as of the close of regular trading on the New York Stock Exchange (the “NYSE”), normally 4:00 p.m. Eastern Time, on each day the NYSE is open for trading. The NAV is computed by dividing the value of all assets of each Fund (including accrued interest and dividends), less all liabilities (including accrued expenses and dividends declared but unpaid), by the total number of shares outstanding.
Portfolio securities listed on any exchange other than the NASDAQ Stock Market LLC (“NASDAQ”) are valued at the last sale price on the business day as of which such value is being determined. If there has been no sale on such day, the securities are valued at the mean of the most recent bid and ask prices on such day. Securities traded on the NASDAQ are valued at the NASDAQ Official Closing Price as determined by NASDAQ. Portfolio securities traded on more than one securities exchange are valued at the last sale price on the business day as of which such value is being determined at the close of the exchange representing the principal market for such securities. Portfolio securities traded in the over-the-counter market, but excluding securities traded on the NASDAQ, are valued at the last quoted sale price in such market.
Corporate bonds and United States government bonds are typically valued at the mean between the evaluated bid and ask prices formulated by an independent pricing service.
Each Fund’s investments are valued at market value or, in the absence of market value with respect to any portfolio securities, at fair value according to procedures adopted by the Trust’s Board of Trustees (the “Board”). Pursuant to Rule 2a-5 under the 1940 Act, the Board designated ALPS Advisors, Inc. (the "Adviser") as the valuation designee ("Valuation Designee") for each Fund to perform the fair value determinations relating to Fund investments. The Adviser may carry out its designated responsibilities as Valuation Designee through various teams and committees. When market quotations are not readily available or when events occur that make established valuation methods unreliable, securities of the Funds may be valued in good faith by the Valuation Designee. These securities generally include, but are not limited to, restricted securities (securities which may not be publicly sold without registration under the Securities Act of 1933) for which a pricing service is unable to provide a market price; securities whose trading has been formally suspended; a security whose market price is not available from a pre-established primary pricing source or the pricing source is not willing to provide a price; a security with respect to which an event has occurred that is most likely to materially affect the value of the security after the market has closed but before the calculation of a Fund’s NAV or make it difficult or impossible to obtain a reliable market quotation; or a security whose price, as provided by the pricing service, does not reflect the security’s “fair value” due to the security being de-listed from a national exchange or the security’s primary trading market is temporarily closed at a time when, under normal conditions, it would be open. As a general principle, the current “fair value” of a security would be the amount which the owner might reasonably expect to receive from the sale on the applicable exchange or principal market. A variety of factors may be considered in determining the fair value of such securities.
26 | November 30, 2023
RiverFront ETFs
| Notes to Financial Statements | November 30, 2023 |
B. Fair Value Measurements
Each Fund discloses the classification of its fair value measurements following a three-tier hierarchy based on the inputs used to measure fair value. Inputs refer broadly to the assumptions that market participants would use in pricing the asset or liability, including assumptions about risk. Inputs may be observable or unobservable. Observable inputs reflect the assumptions market participants would use in pricing the asset or liability that are developed based on market data obtained from sources independent of the reporting entity. Unobservable inputs reflect the reporting entity’s own assumptions about the assumptions market participants would use in pricing the asset or liability that are developed based on the best information available.
Valuation techniques used to value the Funds’ investments by major category are as follows:
Equity securities, including restricted securities, for which market quotations are readily available, are valued at the last reported sale price or official closing price as reported by a third party pricing vendor on the primary market or exchange on which they are traded and are categorized as Level 1 in the hierarchy. In the event there were no sales during the day or closing prices are not available, securities are valued at the mean of the most recent quoted bid and ask prices on such day and are generally categorized as Level 2 in the hierarchy. Investments in open-end mutual funds are valued at their closing NAV each business day and are categorized as Level 1 in the hierarchy.
Debt securities, including restricted securities, are valued based on evaluated prices received from third party pricing vendors or from brokers who make markets in such securities. For corporate bonds, pricing vendors utilize matrix pricing which considers yield or price of bonds of comparable quality, coupon, maturity and type as well as broker-supplied prices. When independent prices are unavailable or unreliable, debt securities may be valued utilizing pricing methodologies which consider similar factors that would be used by third party pricing vendors. Debt securities are generally categorized as Level 2 in the hierarchy but may be Level 3 depending on the circumstances. The RiverFront Dynamic Core Income ETF and the RiverFront Strategic Income Fund may invest a significant portion of their assets in below investment grade securities. The value of these securities can be more volatile due to changes in the credit quality of the issuer and is sensitive to changes in economic, market and regulatory conditions.
Changes in valuation techniques may result in transfers in or out of an assigned level within the disclosure hierarchy.
Various inputs are used in determining the value of each Fund’s investments as of the end of the reporting period. When inputs used fall into different levels of the fair value hierarchy, the level in the hierarchy within which the fair value measurement falls is determined based on the lowest level input that is significant to the fair value measurement in its entirety. The designated input levels are not necessarily an indication of the risk or liquidity associated with these investments.
These inputs are categorized in the following hierarchy under applicable financial accounting standards:
| Level 1 – | Unadjusted quoted prices in active markets for identical investments, unrestricted assets or liabilities that a Fund has the ability to access at the measurement date; |
| | |
| Level 2 – | Quoted prices which are not active, quoted prices for similar assets or liabilities in active markets or inputs other than quoted prices that are observable (either directly or indirectly) for substantially the full term of the asset or liability; and |
| | |
| Level 3 – | Significant unobservable prices or inputs (including the Fund’s own assumptions in determining the fair value of investments) where there is little or no market activity for the asset or liability at the measurement date. |
27 | November 30, 2023
RiverFront ETFs
| Notes to Financial Statements | November 30, 2023 |
The following is a summary of the inputs used to value the Funds’ investments as of November 30, 2023:
| RiverFront Dynamic Core Income ETF |
| Investments in Securities at Value | | Level 1 - Quoted and Unadjusted Prices | | | Level 2 - Other Significant Observable Inputs | | | Level 3 - Significant Unobservable Inputs | | | Total | |
| Corporate Bonds* | | $ | – | | | $ | 18,500,038 | | | $ | – | | | $ | 18,500,038 | |
| Government Bonds* | | | – | | | | 5,211,716 | | | | – | | | | 5,211,716 | |
| Short Term Investments | | | 2,772,904 | | | | – | | | | – | | | | 2,772,904 | |
| Total | | $ | 2,772,904 | | | $ | 23,711,754 | | | $ | – | | | $ | 26,484,658 | |
| | | | | | | | | | | | | | | | | |
| RiverFront Dynamic US Dividend Advantage ETF |
| Investments in Securities at Value | | | Level 1 - Quoted and Unadjusted Prices | | | | Level 2 - Other Significant Observable Inputs | | | | Level 3 - Significant Unobservable Inputs | | | | Total | |
| Common Stocks* | | $ | 72,855,674 | | | $ | – | | | $ | – | | | $ | 72,855,674 | |
| Short Term Investments | | | 428,336 | | | | – | | | | – | | | | 428,336 | |
| Total | | $ | 73,284,010 | | | $ | – | | | $ | – | | | $ | 73,284,010 | |
| | | | | | | | | | | | | | | | | |
| RiverFront Strategic Income Fund |
| Investments in Securities at Value | | | Level 1 - Quoted and Unadjusted Prices | | | | Level 2 - Other Significant Observable Inputs | | | | Level 3 - Significant Unobservable Inputs | | | | Total | |
| Corporate Bonds* | | $ | – | | | $ | 84,704,697 | | | $ | – | | | $ | 84,704,697 | |
| Government Bonds* | | | – | | | | 23,136,888 | | | | – | | | | 23,136,888 | |
| Short Term Investments | | | 3,463,886 | | | | – | | | | – | | | | 3,463,886 | |
| Total | | $ | 3,463,886 | | | $ | 107,841,585 | | | $ | – | | | $ | 111,305,471 | |
| * | For a detailed sector breakdown, see the accompanying Schedule of Investments. |
The Funds did not have any securities that used significant unobservable inputs (Level 3) in determining fair value and there were no transfers into or out of Level 3 during the year ended November 30, 2023.
C. Securities Transactions and Investment Income
Securities transactions are recorded as of the trade date. Realized gains and losses from securities transactions are recorded on the specific identification in accordance with GAAP. Dividend income and capital gains distributions, if any, are recorded on the ex-dividend date. Interest income, if any, is recorded on the accrual basis, including amortization of premiums and accretion of discounts.
D. Dividends and Distributions to Shareholders
Dividends from net investment income for each Fund, if any, are declared and paid monthly or as the Board may determine from time to time. Distributions of net realized capital gains earned by the Funds, if any, are distributed at least annually.
E. Federal Tax and Tax Basis Information
The timing and character of income and capital gain distributions are determined in accordance with income tax regulations, which may differ from U.S. GAAP. Reclassifications are made to the Funds’ capital accounts for permanent tax differences to reflect income and gains available for distribution (or available capital loss carryforwards) under income tax regulations.
For the year ended November 30, 2023, the following reclassifications, which had no impact on results of operations or net assets, were recorded to reflect permanent tax differences resulting primarily from in-kind transactions and partnership non-deductible expenses:
| Fund | | Paid-in Capital | | | Total Distributable Earnings/(Accumulated Losses) | |
| RiverFront Dynamic Core Income ETF | | $ | (1,109,418 | ) | | $ | 1,109,418 | |
| RiverFront Dynamic US Dividend Advantage ETF | | | 1,334,043 | | | | (1,334,043 | ) |
| RiverFront Strategic Income Fund | | | 45,620 | | | | (45,620 | ) |
28 | November 30, 2023
RiverFront ETFs
| Notes to Financial Statements | November 30, 2023 |
The tax character of the distributions paid during the fiscal years ended November 30, 2023 and November 30, 2022 was as follows:
| Fund | | Ordinary Income | | | Long-Term Capital Gain | | | Return of Capital | |
| November 30, 2023 | | | | | | | | | |
| RiverFront Dynamic Core Income ETF | | $ | 1,130,961 | | | $ | – | | | $ | – | |
| RiverFront Dynamic US Dividend Advantage ETF | | | 2,143,621 | | | | – | | | | – | |
| RiverFront Strategic Income Fund | | | 3,786,149 | | | | – | | | | – | |
| Fund | | Ordinary Income | | | Long-Term Capital Gain | | | Return of Capital | |
| November 30, 2022 | | | | | | | | | |
| RiverFront Dynamic Core Income ETF | | $ | 1,672,309 | | | $ | 1,710,559 | | | $ | – | |
| RiverFront Dynamic US Dividend Advantage ETF | | | 3,342,217 | | | | – | | | | – | |
| RiverFront Strategic Income Fund | | | 3,248,534 | | | | – | | | | – | |
The character of distributions made during the year may differ from its ultimate characterization for federal income tax purposes.
Under current law, capital losses maintain their character as short-term or long-term and are carried forward to the next tax year without expiration.
As of November 30, 2023, the following amounts are available as carry forwards to the next tax year:
| Fund | | Short-Term | | | Long-Term | |
| RiverFront Dynamic Core Income ETF | | $ | 1,831,505 | | | $ | 1,365,315 | |
| RiverFront Dynamic US Dividend Advantage ETF | | | 6,692,855 | | | | 247,427 | |
| RiverFront Strategic Income Fund | | | 7,813,865 | | | | 5,272,021 | |
During the year ended November 30, 2023, the Fund did not utilize any capital loss carryovers.
As of November 30, 2023, the components of distributable earnings/(accumulated losses) on a tax basis for each Fund were as follows:
| | | RiverFront Dynamic Core Income ETF | | | RiverFront Dynamic US Dividend Advantage ETF | | | RiverFront Strategic Income Fund | |
| Accumulated net investment income | | $ | 1,460 | | | $ | 170,905 | | | $ | 18,578 | |
| Accumulated net realized loss on investments | | | (3,196,820 | ) | | | (6,940,282 | ) | | | (13,085,886 | ) |
| Net unrealized appreciation/(depreciation) on investments | | | (1,273,124 | ) | | | 2,791,736 | | | | (5,774,785 | ) |
| Total | | $ | (4,468,484 | ) | | $ | (3,977,641 | ) | | $ | (18,842,093 | ) |
As of November 30, 2023, the cost of investments for federal income tax purposes and accumulated net unrealized appreciation/(depreciation) on investments were as follows:
| Fund | | RiverFront Dynamic Core
Income ETF | | | RiverFront Dynamic US
Dividend Advantage ETF | | | RiverFront Strategic
Income Fund | |
| Gross appreciation (excess of value over tax cost) | | $ | 73,639 | | | $ | 8,639,199 | | | $ | 153,451 | |
| Gross depreciation (excess of tax cost over value) | | | (1,346,763 | ) | | | (5,847,463 | ) | | | (5,928,236 | ) |
| Net unrealized appreciation/(depreciation) | | | (1,273,124 | ) | | | 2,791,736 | | | | (5,774,785 | ) |
| Cost of investments for income tax purposes | | $ | 27,757,782 | | | $ | 70,492,274 | | | $ | 117,080,256 | |
The differences between book-basis and tax-basis are primarily due to the deferral of losses from wash sales and difference between premium amortization due to Accounting Standards Update 2017-08.
F. Income Taxes
No provision for income taxes is included in the accompanying financial statements, as each Fund intends to distribute to shareholders all taxable investment income and realized gains and otherwise comply with Subchapter M of the Internal Revenue Code of 1986, as amended, applicable to regulated investment companies. Each Fund evaluates tax positions taken (or expected to be taken) in the course of preparing the Funds’ tax returns to determine whether these positions meet a “more-likely-than-not” standard that, based on the technical merits, have a more than fifty percent likelihood of being sustained by a taxing authority upon examination. A tax position that meets the “more-likely-than-not” recognition threshold is measured to determine the amount of benefit to recognize in the financial statements.
29 | November 30, 2023
RiverFront ETFs
| Notes to Financial Statements | November 30, 2023 |
As of and during the year ended November 30, 2023, each Fund did not have a liability for any unrecognized tax benefits. Each Fund files U.S. federal, state, and local tax returns as required. Each Fund’s tax returns are subject to examination by the relevant tax authorities until expiration of the applicable statute of limitations, which is generally three years after the filing of the tax return, but may extend to four years in certain jurisdictions. Each Fund’s tax returns for open years have incorporated no uncertain tax positions that require a provision for income taxes.
G. Lending of Portfolio Securities
The RiverFront Dynamic US Dividend Advantage ETF has entered into a securities lending agreement with State Street Bank & Trust Co. (“SSB”), the Fund's lending agent. The Fund may lend its portfolio securities only to borrowers that are approved by SSB. The Fund will limit such lending to not more than 33 1/3% of the value of its total assets. The Fund’s securities held at SSB as custodian shall be available to be lent except those securities the Fund or ALPS Advisors, Inc. specifically identifies in writing as not being available for lending. The borrower pledges and maintains with the Fund collateral consisting of cash (U.S. Dollars only), securities issued or guaranteed by the U.S. government or its agencies or instrumentalities, and cash equivalents (including irrevocable bank letters of credit) issued by a person other than the borrower or an affiliate of the borrower. The initial collateral received by the Fund is required to have a value of no less than 102% of the market value of the loaned securities for U.S equity securities and a value of no less than 105% of the market value for non-U.S. equity securities. The collateral is maintained thereafter, at a market value equal to not less than 102% of the current value of the U.S. equity securities on loan and not less than 105% of the current value of the non-U.S. equity securities on loan. The market value of the loaned securities is determined at the close of each business day and any additional required collateral is delivered to the Fund on the next business day. During the term of the loan, the Fund is entitled to all distributions made on or in respect of the loaned securities. Loans of securities are terminable at any time and the borrower, after notice, is required to return borrowed securities within the customary time period for settlement of securities transactions.
Any cash collateral received is reinvested in a money market fund managed by SSB as disclosed in the Fund’s Schedule of Investments and is reflected in the Statements of Assets and Liabilities as a payable for collateral upon return of securities loaned. Non-cash collateral, in the form of securities issued or guaranteed by the U.S. government or its agencies or instrumentalities, is not disclosed in the Fund’s Statements of Assets and Liabilities or the contractual maturity table below as it is held by the lending agent on behalf of the Fund, and the Fund does not have the ability to re-hypothecate these securities. Income earned by the Fund from securities lending activity is disclosed in the Statement of Operations.
The following is a summary of the Funds' securities lending agreement and related cash and non-cash collateral received as of November 30, 2023:
| Fund | Market Value of Securities on Loan | Cash Collateral Received | Non-Cash Collateral Received | Total Collateral Received |
| RiverFront Dynamic US Dividend Advantage ETF | $ 1,609,885 | $ 332,955 | $ 1,315,952 | $ 1,648,907 |
The risks of securities lending include the risk that the borrower may not provide additional collateral when required or may not return the securities when due. To mitigate these risks, the Funds benefit from a borrower default indemnity provided by SSB. SSB’s indemnity allows for full replacement of securities lent wherein SSB will purchase the unreturned loaned securities on the open market by applying the proceeds of the collateral, or to the extent such proceeds are insufficient or the collateral is unavailable, SSB will purchase the unreturned loan securities at SSB’s expense. However, the Funds could suffer a loss if the value of the investments purchased with cash collateral falls below the value of the cash collateral received. As of November 30, 2023, Riverfront Dynamic Core Income ETF and Riverfront Strategic Income ETF did not have any securities on loan.
The following table reflects a breakdown of transactions accounted for as secured borrowings, the gross obligation by the type of collateral pledged or securities loaned, and the remaining contractual maturity of those transactions as of November 30, 2023:
| RiverFront Dynamic US Dividend Advantage ETF | | Remaining Contractual Maturity of the Agreements | |
| Securities Lending Transactions | | Overnight & Continuous | | | Up to 30 Days | | | 30-90 Days | | | Greater than 90 Days | | | Total | |
| Common Stocks | | $ | 332,955 | | | $ | – | | | $ | – | | | $ | – | | | $ | 332,955 | |
| Total Borrowings | | | | | | | | | | | | | | | | | | | 332,955 | |
| Gross amount of recognized liabilities for securities lending (collateral received) | | | | | | $ | 332,955 | |
30 | November 30, 2023
RiverFront ETFs
| Notes to Financial Statements | November 30, 2023 |
3. INVESTMENT ADVISORY FEE AND OTHER AFFILIATED TRANSACTIONS
ALPS Advisors, Inc. serves as the Funds’ investment adviser pursuant to an Investment Advisory Agreement with the Trust on behalf of each Fund (the “Advisory Agreement”). Pursuant to the Advisory Agreement, each Fund pays the Adviser an annual management fee for the services and facilities it provides, payable on a monthly basis as a percentage of the relevant Fund’s average daily net assets as set out below:
| Fund | Advisory Fee |
| RiverFront Dynamic Core Income ETF | 0.51%(a) |
| RiverFront Dynamic US Dividend Advantage ETF | 0.52%(b) |
| RiverFront Strategic Income Fund | 0.11% |
| (a) | The unitary advisory fee as a percentage of net assets is subject to the following breakpoints: (i) 0.51% for average net assets up to $600 million, (ii) 0.48% for average net assets equal to or greater than $600 million. |
| (b) | The unitary advisory fee as a percentage of net assets is subject to the following breakpoints: (i) 0.52% for average net assets up to $600 million, (ii) 0.49% for average net assets equal to or greater than $600 million. |
Out of the unitary management fee, the Adviser pays substantially all expenses of each Fund, including the cost of transfer agency, custody, fund administration, legal, audit, trustees and other services, except for interest expenses, distribution fees or expenses, brokerage expenses, taxes and extraordinary expenses not incurred in the ordinary course of each Fund's business. The Adviser’s unitary management fee is designed to pay substantially all of each Fund's expenses and to compensate the Adviser for providing services for each Fund.
RiverFront Investment Group, LLC (the “Sub-Adviser”) serves as each Fund’s sub-adviser pursuant to a sub-advisory agreement with the Trust (the ‘‘Sub-Advisory Agreement’’). Pursuant to the Sub-Advisory Agreement, the Adviser pays the Sub-Adviser a sub-advisory fee out of the Adviser’s advisory fee for the services it provides besides RiverFront Strategic Income Fund, in which the Fund directly pays the Sub-Adviser. The fee is payable on a monthly basis at the annual rate of the relevant Fund’s average daily net assets as set out below:
| Fund | Sub-Advisory Fee |
| RiverFront Dynamic Core Income ETF | 0.35% |
| RiverFront Dynamic US Dividend Advantage ETF | 0.35% |
| RiverFront Strategic Income Fund | 0.35% |
ALPS Fund Services, Inc., an affiliate of the Adviser, is the administrator for the Funds.
Effective July 1, 2023, each Trustee receives (1) a quarterly retainer of $25,000, (2) a per meeting fee of $15,000, (3) $2,500 for any special meeting held outside of a regularly scheduled board meeting, and (4) reimbursement for all reasonable out-of-pocket expenses relating to attendance at meetings. In addition, the Chairman of the Board receives a quarterly retainer of $5,000, the Chairman of the Audit Committee receives a quarterly retainer of $3,000, and the Chairman of the Nominating & Governance Committee receives a quarterly retainer of $2,000, each in connection with their respective roles. Prior to July 1, 2023, each Trustee received (1) a quarterly retainer of $20,000, (2) a per meeting fee of $10,000, (3) $2,500 for any special meeting held outside of a regularly scheduled board meeting, and (4) reimbursement for all reasonable out-of-pocket expenses relating to attendance at meetings. In addition, the Chairman of the Board received a quarterly retainer of $5,000, the Chairman of the Audit Committee received a quarterly retainer of $3,000, and the Chairman of the Nominating & Governance Committee received a quarterly retainer of $2,000, each in connection with their respective roles.
31 | November 30, 2023
RiverFront ETFs
| Notes to Financial Statements | November 30, 2023 |
4. PURCHASES AND SALES OF SECURITIES
For the year ended November 30, 2023, the cost of purchases and proceeds from sales of investment securities, excluding in-kind transactions and short-term investments, were as follows:
| Fund | | Purchases | | | Sales | |
| RiverFront Dynamic Core Income ETF | | $ | 10,721,368 | | | $ | 4,889,157 | |
| RiverFront Dynamic US Dividend Advantage ETF | | | 38,983,804 | | | | 38,475,197 | |
| RiverFront Strategic Income Fund | | | 25,420,355 | | | | 29,415,322 | |
For the year ended November 30, 2023, the cost of U.S. Government security purchases and proceeds from U.S. Government security sales were as follows:
| Fund | | Purchases | | | Sales | |
| RiverFront Dynamic Core Income ETF | | $ | 7,766,299 | | | $ | 11,682,077 | |
| RiverFront Strategic Income Fund | | | 31,322,746 | | | | 23,327,007 | |
For the year ended November 30, 2023, the cost of in-kind purchases and proceeds from in-kind sales were as follows:
| Fund | | Purchases | | | Sales | |
| RiverFront Dynamic Core Income ETF | | $ | – | | | $ | 17,005,541 | |
| RiverFront Dynamic US Dividend Advantage ETF | | | 2,349,398 | | | | 22,924,242 | |
| RiverFront Strategic Income Fund | | | 22,169,838 | | | | 14,645,450 | |
For the year ended November 30, 2023, the in-kind net realized gains/(losses) were as follows:
| Fund | | Net Realized Gain/(Loss) | |
| RiverFront Dynamic Core Income ETF | | $ | (1,099,704 | ) |
| RiverFront Dynamic US Dividend Advantage ETF | | | 1,262,902 | |
| RiverFront Strategic Income Fund | | | 45,733 | |
Gains on in-kind transactions are not considered taxable for federal income tax purposes and losses on in-kind transactions are also not deductible for tax purposes.
5. CAPITAL SHARE TRANSACTIONS
Shares are created and redeemed by each Fund only in Creation Unit size aggregations of 25,000 Shares. Only broker-dealers or large institutional investors with creation and redemption agreements called Authorized Participants (“AP”) are permitted to purchase or redeem Creation Units from each Fund. Such transactions are generally permitted on an in-kind basis, with a balancing cash component to equate the transaction to the NAV per unit of each Fund on the transaction date. Cash may be substituted equivalent to the value of certain securities generally when they are not available in sufficient quantity for delivery, not eligible for trading by the AP or as a result of other market circumstances.
6. RELATED PARTY TRANSACTIONS
The Riverfront Dynamic US Dividend Advantage ETF engaged in cross trades between other funds in the Trust during the year ended November 30, 2023 pursuant to Rule 17a-7 under the 1940 Act. Cross trading is the buying or selling of portfolio securities between funds to which the Adviser serves as the investment adviser. The Board previously adopted procedures that apply to transactions between the Funds of the Trust pursuant to Rule 17a-7. These transactions related to cross trades during the period complied with the requirements set forth by Rule 17a- 7 and the Trust’s procedures. Transactions related to cross trades during the year ended November 30, 2023, were as follows:
| Fund | | Purchase cost paid | | | Sale proceeds received | | | Realized gain/(loss) on sales | |
| RiverFront Dynamic US Dividend Advantage ETF | | $ | 77,187 | | | $ | 100,527 | | | $ | 606 | |
32 | November 30, 2023
RiverFront ETFs
| Notes to Financial Statements | November 30, 2023 |
7. MARKET RISK
The Funds are subject to investment and operational risks associated with financial, economic and other global market developments and disruptions, including those arising from war, terrorism, market manipulation, government interventions, defaults and shutdowns, political changes or diplomatic developments, public health emergencies (such as the spread of infectious diseases, pandemics and epidemics) and natural/environmental disasters, which can negatively impact the securities markets and cause each Fund to lose value. Securities in the Fund’s portfolio may underperform in comparison to securities in general financial markets, a particular financial market or other asset classes due to a number of factors, including inflation (or expectations for inflation), deflation (or expectations for deflation), interest rates, global demand for particular products or resources, market instability, debt crises and downgrades, embargoes, tariffs, sanctions and other trade barriers, regulatory events, other governmental trade or market control programs and related geopolitical events. In addition, the value of the Fund’s investments may be negatively affected by the occurrence of global events such as war, terrorism, environmental disasters, natural disasters or events, country instability, and infectious disease epidemics or pandemics.
8. REGULATORY UPDATE
The SEC adopted rule and form amendments that will change the format and content of the Funds' annual and semi-annual reports. Certain information, including the financial statements, will not appear in the Funds' new tailored shareholder reports but will be available online, delivered free of charge upon request, and filed on a semi-annual basis on Form N-CSR. The rule and form amendments have a compliance date of July 24, 2024. At this time, the Trust is evaluating the impact of these rule and form amendment changes.
9. SUBSEQUENT EVENTS
Subsequent events, if any, after the date of the Statements of Assets and Liabilities have been evaluated through the date the financial statements were issued. Management has determined that there were no subsequent events to report through the issuance of these financial statements.
33 | November 30, 2023
RiverFront ETFs
| Additional Information | November 30, 2023 (Unaudited) |
PROXY VOTING RECORDS, POLICIES AND PROCEDURES
Information regarding how each Fund voted proxies relating to portfolio securities during the most recent 12-month period ended June 30 and a description of the Funds’ proxy voting policies and procedures used in determining how to vote for proxies are available without charge on the SEC’s website at www.sec.gov and upon request, by calling (toll-free) 1-866-759-5679.
PORTFOLIO HOLDINGS
Each Fund files a complete schedule of portfolio holdings with the U.S. Securities and Exchange Commission (“SEC”) for the first and third quarters of each fiscal year on Form N-PORT within 60 days after the end of the period. Copies of each Fund’s Form N-PORT are available without a charge, upon request, by contacting the Fund at 1-866-759-5679 and on the SEC’s website at https://www.sec.gov.
TAX INFORMATION
The Funds designate the following as a percentage of taxable ordinary income distributions, or up to the maximum amount allowable, for the calendar year ended December 31, 2022:
| | Qualified Dividend Income | Dividend Received Deduction |
| RiverFront Dynamic Core Income ETF | 0.00% | 0.00% |
| RiverFront Dynamic US Dividend Advantage ETF | 80.67% | 79.04% |
| RiverFront Strategic Income Fund | 0.00% | 0.00% |
In early 2023, if applicable, shareholders of record received this information for the distributions paid to them by the Funds during the calendar year 2022 via Form 1099. The Funds will notify shareholders in early 2024 of amounts paid to them by the Funds, if any, during the calendar year 2023.
34 | November 30, 2023
RiverFront ETFs
Board Considerations Regarding Approval of Investment Advisory Agreement and Investment Sub-Advisory Agreements | November 30, 2023 (Unaudited) |
At its meetings held on June 5, 2023 and June 20, 2023, the Board of Trustees of the Trust (the “Board” or the “Trustees”), where each Trustee is not an "interested person" of the Trust within the meaning of the Investment Company Act of 1940, as amended (the “Independent Trustees”), evaluated a proposal to approve the continuance of the Investment Advisory Agreement between the Trust and ALPS Advisors, Inc. (the “Adviser” or “AAI”) with respect to the RiverFront Dynamic Core Income ETF ("RFCI"), RiverFront Dynamic US Dividend Advantage ETF ("RFDA") and RiverFront Strategic Income Fund ("RIGS") (each “a Fund” and collectively the “Funds”) and the Investment Sub-Advisory Agreements between the Trust and RiverFront Investment Group, LLC (the “Sub-Adviser” or “RiverFront”) with respect to the Funds (the “RiverFront Sub-Advisory Agreements”). In evaluating the renewal of the Investment Advisory Agreement with respect to each Fund, the Board, including the Independent Trustees, considered various factors, including (i) the nature, extent and quality of the services provided by AAI with respect to the applicable Fund under the Investment Advisory Agreement; (ii) the advisory fees and other expenses paid by the Fund compared to those of similar funds managed by other investment advisers; (iii) the costs of the services provided to the Fund by AAI and the profits realized by AAI and its affiliates from its relationship to the Fund; (iv) the extent to which economies of scale have been or would be realized if and as the assets of the Fund grow and whether fees reflect the economies of scale for the benefit of shareholders; and (v) any additional benefits and other considerations.
With respect to the nature, extent and quality of the services provided by AAI under the Investment Advisory Agreement, the Board considered and reviewed information concerning the services provided under the Investment Advisory Agreement, financial information regarding AAI and its parent company, information describing AAI’s current organization and the background and experience of the persons responsible for the day-to-day management of the Funds.
The Board reviewed information on the performance of each Fund and its applicable benchmark for the 1-, 3-, and 5-year periods, as applicable, and against the appropriate FUSE performance universe. Based on this review, the Board, including the Independent Trustees found that the nature and extent of services provided to each Fund under the Investment Advisory Agreement was appropriate and that the quality of such services was satisfactory.
The Board noted that the advisory fees for each Fund were unitary fees pursuant to which AAI assumes all expenses of the Funds (including the cost of transfer agency, custody, fund administration, legal, audit and other services) other than the payments under the Advisory Agreement, brokerage expenses, taxes, interest, litigation expenses and other extraordinary expenses.
Based on the information available to them, including the Fund-specific summaries set forth below, the Board, including the Independent Trustees, concluded that the advisory fee rate for each of the Funds was reasonable under the circumstances and in light of the quality of the services provided.
The Board, including the Independent Trustees, considered other benefits available to AAI because of its relationship with the Funds and concluded that the advisory fees were reasonable taking into account any such benefits.
The Board, including the Independent Trustees, also considered with respect to each Fund the information provided by AAI about the costs and profitability of AAI with respect to each of the Funds, including the asset levels and other factors that influence the profitability and financial viability of the Funds. The Board, including the Independent Trustees, reviewed and noted the relatively small sizes of the Funds and the analysis AAI had conducted to support AAI’s assertion that it was not realizing any economies of scale with respect to such Funds. The Independent Trustees determined that AAI should continue to keep the Board informed on an ongoing basis of any significant developments (e.g., material increases in asset levels) so as to facilitate the Independent Trustees’ evaluation of whether further economies of scale have been achieved.
The Board, including the Independent Trustees, also considered other potential benefits available to AAI because of its relationship with the Funds, known as fall-out benefits.
With respect to each Fund, the Board, including the Independent Trustees, noted the following:
The gross management fee rate for RIGS is lower than the median of its FUSE expense group. RIGS’s net expense ratio is lower than the median of its FUSE expense group.
The Board, including the Independent Trustees, reviewed and noted the relatively small size of RIGS and the analysis AAI had conducted to support AAI's assertion that it was not realizing any economies of scale with respect to RIGS.
The gross management fee rate for RFCI is higher than the median of its FUSE expense group. RFCI’s net expense ratio is slightly above the median of its FUSE expense group.
35 | November 30, 2023
RiverFront ETFs
Board Considerations Regarding Approval of Investment Advisory Agreement and Investment Sub-Advisory Agreements | November 30, 2023 (Unaudited) |
The Board, including the Independent Trustees, reviewed and noted the relatively small size of RFCI and the analysis AAI had conducted to support AAI's assertion that it was not realizing any economies of scale with respect to RFCI.
The gross management fee rate for RFDA is equal to the median of its FUSE expense group. RFDA’s net expense ratio is lower than the median of its FUSE expense group.
The Board, including the Independent Trustees, reviewed and noted the relatively small size of RFDA and the analysis AAI had conducted to support AAI's assertion that it was not realizing any economies of scale with respect to RFDA.
In voting to renew the Investment Advisory Agreement with AAI, the Board, including the Independent Trustees, concluded that the terms of the Investment Advisory Agreement are reasonable and fair in light of the services to be performed, the fees paid by certain other funds, expenses to be incurred and such other matters as the members of the Board, including the Independent Trustees, considered relevant in the exercise of their reasonable business judgment. The Independent Trustees did not identify any single factor or group of factors as all important or controlling and considered all factors together.
RiverFront Sub-Advisory Agreements
The Board, including the Independent Trustees, discussed the RiverFront Sub-Advisory Agreements.
In evaluating the RiverFront Sub-Advisory Agreements, the Board, including the Independent Trustees, considered various factors, including (i) the nature, extent and quality of the services provided by RiverFront with respect to the RiverFront ETFs under the RiverFront Sub-Advisory Agreements; (ii) the advisory fees and other expenses paid by the RiverFront ETFs compared to those of similar funds managed by other investment advisers; (iii) the profitability to RiverFront of its sub-advisory relationship with the RiverFront ETFs and the reasonableness of compensation to RiverFront; (iv) the extent to which economies of scale would be realized if, and as, the RiverFront ETFs’ assets increase, and whether the fee level in the RiverFront Sub-Advisory Agreements reflects these economies of scale; and (v) any additional benefits and other considerations.
With respect to the nature, extent and quality of the services provided by RiverFront under the RiverFront Sub-Advisory Agreements, the Board, including the Independent Trustees, considered and reviewed information concerning the services provided under the RiverFront Sub-Advisory Agreements, the RiverFront ETFs’ respective performance, financial information regarding RiverFront, information describing RiverFront’s current organization and the background and experience of the persons responsible for the day-to-day management of the RiverFront ETFs. Based upon their review, the Board, including the Independent Trustees, concluded that RiverFront was qualified to oversee the portfolio management of the RiverFront ETFs and that the services provided by RiverFront to the RiverFront ETFs are satisfactory. The Board, including the Independent Trustees, considered that the contractual sub-advisory fee to be paid to RiverFront from RIGS was 0.35% of RIGS’ average daily net assets out of a total management fee of 0.46% of RIGS’ average daily net assets. The Board, including the Independent Trustees considered that the contractual sub-advisory fee to be paid to RiverFront with respect to each of RFCI and RFDA was 0.35% of each Fund’s average daily net assets out of a total management fee of 0.51% with respect to RFCI’s average daily net assets, and 0.52% with respect to RFDA’s average daily net assets, respectively.
In reviewing the Riverfront ETFs’ profitability with respect to RiverFront, the Board, including the Independent Trustees, considered the costs and resources required to manage the RiverFront ETFs.
The Board, including the Independent Trustees, also considered other benefits that have been and may be realized by RiverFront from its relationships with each RiverFront ETF, known as fall-out benefits.
The Board, including the Independent Trustees, considered the extent to which economies of scale may be realized if the RiverFront ETFs’ assets continue to grow in size and whether fee levels reflect a reasonable sharing of such economies of scale for the benefit of the Funds’ investors. They also noted that the RiverFront ETFs have experienced fluctuations in assets, which makes it difficult to quantify the potential variability in net assets and thus determine the sustainability of any potential economies of scale which may exist. The Independent Trustees determined that AAI should continue to keep the Board informed on an ongoing basis of any significant developments (e.g., material increases in asset levels) so as to facilitate the Independent Trustees’ evaluation of whether further economies of scale have been achieved with respect to each RiverFront ETF.
In voting to approve each of the RiverFront Sub-Advisory Agreements, the Board, including the Independent Trustees, concluded that the terms of each RiverFront Sub-Advisory Agreement are reasonable and fair in light of the services performed, expenses incurred and such other matters as the Board, including the Independent Trustees considered relevant in the exercise of their reasonable business judgment. The Board, including the Independent Trustees did not identify any single factor or group of factors as all important or controlling and considered all factors together.
36 | November 30, 2023
RiverFront ETFs
| Trustees & Officers | November 30, 2023 (Unaudited) |
The general supervision of the duties performed by the Adviser for the Fund under the Investment Advisory Agreement is the responsibility of the Board of Trustees. The Trust currently has four Trustees, each of whom have no affiliation or business connection with the Adviser or any of its affiliated persons and do not own any stock or other securities issued by the Adviser. These are the “non-interested” or “independent” Trustees (“Independent Trustees”).
The Independent Trustees of the Trust, their term of office and length of time served, their principal business occupations during the past five years, the number of portfolios in the Fund Complex overseen by each Independent Trustee, and other directorships, if any, held by the Trustee are shown below.
INDEPENDENT TRUSTEES
Name, Address and Year of Birth of Officer* | Position(s) Held with Trust | Length of Time Served** | Principal Occupation(s) During Past 5 Years | Number of Portfolios in Fund Complex Overseen by Trustees*** | Other Directorships Held by Trustees |
Mary K. Anstine, 1940 | Trustee | Since March 2008 | Ms. Anstine is Trustee/Director of AV Hunter Trust and Colorado Uplift Board. | 38 | Ms. Anstine is a Trustee of ALPS Variable Investment Trust (7 funds); Financial Investors Trust (29 funds); and Reaves Utility Income Fund. |
Jeremy W. Deems, 1976 | Trustee | Since March 2008 | Mr. Deems is the Co-Founder and Chief Financial Officer of Green Alpha Advisors, LLC, a registered investment advisor, and Co-Portfolio Manager of the AXS Green Alpha ETF. | 38 | Mr. Deems is a Trustee of ALPS Variable Investment Trust (7 funds); Financial Investors Trust (29 funds); and Reaves Utility Income Fund; and Clough Funds Trust (1 fund). |
Rick A. Pederson, 1952 | Trustee | Since March 2008 | Mr. Pederson is Partner, Bow River Capital Partners (private equity management), 2003 - present; Board Member, Prosci Inc. (private business services) 2013-2016; Advisory Board Member, Citywide Banks (Colorado community bank) 2014- 2017; Board Member, Strong-Bridge Consulting, 2015-2019; Board Member, IRI/ODMS Holdings LLC, 2017 – 2019; Director, National Western Stock Show (not for profit) 2010 - present; Director, History Colorado (not for profit) 2015-present; Director, Citywide Bank Advisory Board 2017-present; Trustee, Boettcher Foundation, 2018 -present. | 24 | Mr. Pederson is Trustee of Segall Bryant & Hamill Trust (14 funds) and Principal Real Estate Income Fund (1 fund). |
| * | The business address of the Trustee is c/o ALPS Advisors, Inc., 1290 Broadway, Suite 1000, Denver, Colorado 80203. |
| ** | This is the period for which the Trustee began serving the Trust. Each Trustee serves an indefinite term, until his or her successor is elected. |
| *** | The Fund Complex includes all series of the Trust and any other investment companies for which ALPS Advisors, Inc. provides investment advisory services |
37 | November 30, 2023
RiverFront ETFs
| Trustees & Officers | November 30, 2023 (Unaudited) |
Name, Address and Year of Birth of Officer* | Position(s) Held with Trust | Length of Time Served** | Principal Occupation(s) During Past 5 Years | Number of Portfolios in Fund Complex Overseen by Trustees*** | Other Directorships Held by Trustees |
Edmund J. Burke, 1961 | Trustee | Since December 2017 | Mr. Burke joined ALPS in 1991 and served as the President and Director of ALPS Holdings, Inc., and ALPS Advisors, Inc., and Director of ALPS Distributors, Inc., ALPS Fund Services, Inc. (“ALPS”), and ALPS Portfolio Solutions Distributor, Inc. (collectively, the “ALPS Companies”). Mr. Burke retired from the ALPS Companies in June 2019. Mr. Burke is currently a partner at ETF Action, a web-based system that provides data and analytics to registered investment advisers, (since 2020) and a Director of Alliance Bioenergy Plus, Inc., a technology company focused on emerging technologies in the renewable energy, biofuels, and bioplastics technology sectors (since 2020). | 33 | Mr. Burke is a Trustee of Clough Global Dividend and Income Fund (1 fund); Clough Global Equity Fund (1 fund); Clough Global Opportunities Fund (1 fund); Clough Funds Trust (1 fund); Liberty All-Star Equity Fund (1 fund); Director of the Liberty All-Star Growth Fund, Inc. (1 fund) and Financial Investors Trust (29 funds). |
| * | The business address of the Trustee is c/o ALPS Advisors, Inc., 1290 Broadway, Suite 1000, Denver, Colorado 80203. |
| ** | This is the period for which the Trustee began serving the Trust. Each Trustee serves an indefinite term, until his or her successor is elected. |
| *** | The Fund Complex includes all series of the Trust and any other investment companies for which ALPS Advisors, Inc. provides investment advisory services. |
38 | November 30, 2023
RiverFront ETFs
| Trustees & Officers | November 30, 2023 (Unaudited) |
OFFICERS
Name, Address and Year of Birth of Officer* | Position(s) Held with Trust | Length of Time Served** | Principal Occupation(s) During Past 5 Years |
Laton Spahr, 1975 | President | Since June 2021 | Mr. Spahr joined ALPS in 2019 and currently serves as President and Portfolio Manager of AAI. Prior to his current role, Mr. Spahr was a Senior Vice President and Strategy Leader of the Value & Income Team for Oppenheimer Funds from 2013 to 2019. |
Matthew Sutula, 1985 | Chief Compliance Officer ("CCO") | Since December 2019 | Mr. Sutula joined ALPS in 2012 and currently serves as Chief Compliance Officer of AAI. Prior to his current role, Mr. Sutula served as interim Compliance Officer of the Trust (September 2019 to December 2019). Compliance Manager and Senior Compliance Analyst for AAI, as well as Compliance Analyst for AFS. Prior to joining ALPS, he spent seven years at Morningstar, Inc. in various analyst roles supporting the registered investment company databases. Mr. Sutula is also Chief Compliance Officer of Principal Real Estate Income Fund, ALPS Variable Investment Trust, Liberty All-Star Equity Fund and Liberty All-Star Growth Fund, Inc. From September 2019 to September 2022 he served as Chief Compliance Officer of RiverNorth Opportunities Fund, Inc. |
Erich Rettinger, 1985 | Treasurer | Since September 2023 | Mr. Rettinger is Vice President of AAI (since 2021) and serves as Treasurer of Principal Real Estate Income Fund, Liberty All-Star Equity Fund, LibertyAll-Star Growth Fund, Inc., and ALPS Variable Investment Trust. From December 2021 to October 2022 he also served as Treasurer of RiverNorth Opportunities Fund, Inc. Because of his position with AAI, Mr. Rettinger is deemed an affiliate of the Fund as defined under the 1940 Act. From 2013-2021, he served as Vice President and Fund Controller of ALPS Fund Services. |
Michael P. Lawlor, 1969 | Secretary | Since December 2022 | Mr. Lawlor joined ALPS in January 2022, and is currently Vice President and Principal Legal Counsel. Prior to joining ALPS, Mr. Lawlor was Lead Fund Counsel at Brighthouse Financial (insurance company) (January 2007-April 2021). Mr. Lawlor also serves as Secretary of Financial Investors Trust and ALPS Variable Investment Trust. |
Susan M. Cannon, 1974 | Assistant Secretary | Since May 2023 | Ms. Cannon joined ALPS in September 2022, and is currently a Senior Paralegal of ALPS Fund Services, Inc. Prior to joining ALPS, Ms. Cannon worked for World Premier Private Partnership, Brown Brothers Harriman & Co. |
| * | The business address of each Officer is c/o ALPS Advisors, Inc., 1290 Broadway, Suite 1000, Denver, Colorado 80203. Each Officer is deemed an affiliate of the Trust as defined under the 1940 Act. |
| ** | This is the period for which the Officer began serving the Trust. Each Officer serves an indefinite term, until his or her successor is elected. |
The Statement of Additional Information includes additional information about the Funds' Trustees and is available, without charge, upon request by calling (toll-free) 1-866-759-5679
39 | November 30, 2023

| (a) | The Registrant, as of the end of the period covered by this report, has adopted a code of ethics that applies to the Registrant’s principal executive officer, principal financial officer, principal accounting officer or controller or any persons performing similar functions on behalf of the Registrant. |
| (c) | During the period covered by this report, no amendments to the provisions of the code of ethics adopted in 2(a) above were made. |
| (d) | During the period covered by this report, no implicit or explicit waivers to the provisions of the code of ethics adopted in 2(a) above were granted. |
| (f) | The Registrant’s Code of Ethics is attached as an Exhibit hereto. |
| Item 3. | Audit Committee Financial Expert. |
The Board of Trustees of the Registrant has determined that the Registrant has at least one Audit Committee Financial Expert serving on its audit committee. The Board of Trustees of the Registrant has designated Jeremy W. Deems as the Registrant’s “Audit Committee Financial Expert”. Mr. Deems is “independent” as defined in paragraph (a)(2) of Item 3 to Form N-CSR.
| Item 4. | Principal Accountant Fees and Services. |
| (a) | Audit Fees: For the Registrant’s fiscal years ended November 30, 2023 and November 30, 2022, the aggregate fees billed for professional services rendered by the principal accountant for the audit of the Registrant’s annual financial statements were $318,000 and $368,500, respectively. |
| (b) | Audit-Related Fees: For the Registrant’s fiscal years ended November 30, 2023 and November 30, 2022, the aggregate fees billed for professional services rendered by the principal accountant that are reasonably related to the performance of the audit of the Registrant’s financial statements and are not reported under paragraph (a) of this Item were $0 and $0, respectively. |
| (c) | Tax Fees: For the Registrant’s fiscal years ended November 30, 2023 and November 30, 2022, the aggregate fees billed for professional services rendered by the principal accountant for tax compliance, tax advice and tax planning were $ 85,250 and $96,000, respectively. The fiscal year 2023 and 2022 tax fees were for services pertaining to federal and state income tax return review, review of year end dividend distributions and excise tax preparation. |
| (d) | All Other Fees: For the Registrant’s fiscal years ended November 30, 2023 and November 30, 2022, aggregate fees billed to the Registrant by the principal accountant for services provided by the principal accountant other than the services reported in paragraphs (a) through (c) of this Item 4 were $0 and $0, respectively. |
| (1) | Audit Committee Pre-Approval Policies and Procedures: All services to be performed by the Registrant's principal accountant must be pre-approved by the Registrant's audit committee. |
| | (2) | No services described in paragraphs (b) through (d) of this Item were approved by the Registrant’s audit committee pursuant to paragraph (c)(7)(i)(C) of Rule 2-01 of Regulation S-X. |
| (g) | The aggregate non-audit fees billed by the Registrant’s accountant for the fiscal years ended November 30, 2023 and November 30, 2022 of the Registrant were $85,250 and $96,000, respectively. These fees consisted of non-audit fees billed to (i) the Registrant of $ 85,250 and $96,000, respectively as described in response to paragraph (c) above. |
| (h) | The Registrant’s audit committee has considered whether the provision of non- audit services that were rendered to the Registrant’s investment adviser (not including any sub-adviser whose role is primarily portfolio management and is subcontracted with or overseen by another investment adviser), and any entity controlling, controlled by, or under common control with the investment adviser that provides ongoing services to the Registrant that were not pre-approved pursuant to paragraph (c)(7)(ii) of Rule 2-01 of Regulation S-X, is compatible with maintaining the principal accountant’s independence. The Registrant’s audit committee determined that the provision of such non-audit services is compatible with maintaining the principal accountant’s independence. |
| Item 5. | Audit Committee of Listed Registrants. |
Not applicable to the Registrant.
| (a) | Schedule of Investments is included as part of the Report to Stockholders filed under Item 1 of this Form N-CSR. |
| Item 7. | Disclosure of Proxy Voting Policies and Procedures for Closed-End Management Investment Companies. |
Not applicable to Registrant.
| Item 8. | Portfolio Managers of Closed-End Management Investment Companies. |
Not applicable to Registrant.
| Item 9. | Purchases of Equity Securities by Closed-End Management Investment Company and Affiliated Purchasers. |
Not applicable to Registrant.
| Item 10. | Submission of Matters to a Vote of Security Holders. |
No material changes to the procedures by which the shareholders may recommend nominees to the Registrant’s Board of Trustees have been implemented after the Registrant’s last provided disclosure in response to the requirements of Item 407(c)(2)(iv) of Regulation S-K (17 CFR 229.407) (as required by Item 22(b)(15) of Schedule 14A (17 CFR 240.14a-101)), or this Item.
| Item 11. | Controls and Procedures. |
| (a) | The Registrant’s principal executive officer and principal financial officer have concluded that the Registrant’s disclosure controls and procedures (as defined in Rule 30a-3(c) under the Investment Company Act of 1940, as amended) are effective based on their evaluation of these controls and procedures as of a date within 90 days of the filing date of this report. |
| (b) | There was no change in the Registrant’s internal control over financial reporting (as defined in Rule 30a-3(d) under the Investment Company Act of 1940, as amended) during the period covered by this report that has materially affected, or is reasonably likely to materially affect, the Registrant’s internal control over financial reporting. |
| Item 12. | Disclosure of Securities Lending Activities for Closed-End Management Investment Companies. |
Not applicable.
SIGNATURES
Pursuant to the requirements of the Securities Exchange Act of 1934 and the Investment Company Act of 1940, the Registrant has duly caused this report to be signed on its behalf by the undersigned, thereunto duly authorized.
| ALPS ETF TRUST | |
| | | |
| By: | /s/ Laton Spahr | |
| | Laton Spahr (Principal Executive Officer) | |
| | President | |
| | | |
| Date: | February 6, 2024 | |
Pursuant to the requirements of the Securities Exchange Act of 1934 and the Investment Company Act of 1940, this report has been signed below by the following persons on behalf of the Registrant and in the capacities and on the dates indicated.
| By: | /s/ Laton Spahr | |
| | Laton Spahr (Principal Executive Officer) | |
| | President | |
| | | |
| Date: | February 6, 2024 | |
| | | |
| By: | /s/ Erich Rettinger | |
| | Erich Rettinger (Principal Financial Officer) | |
| | Treasurer | |
| | | |
| Date: | February 6, 2024 | |