Filed Pursuant to Rule 424(b)(3)
Registration No. 333-147414
SUPPLEMENT NO. 12 DATED AUGUST 19, 2010
TO PROSPECTUS DATED SEPTEMBER 21, 2009
APPLE REIT NINE, INC.
The following information supplements the prospectus of Apple REIT Nine, Inc. dated September 21, 2009 and is part of the prospectus. This Supplement updates the information presented in the prospectus.Prospective investors should carefully review the prospectus, Supplement No. 11 (which is cumulative and replaces all prior Supplements) and this Supplement No. 12.
TABLE OF CONTENTS
|
|
|
S-3 | ||
S-4 | ||
S-6 | ||
S-8 | ||
Financial and Operating Information for Our Recently Purchased Properties | S-9 | |
S-11 | ||
Management’s Discussion and Analysis of Financial Condition and Results of Operations | S-13 | |
F-1 |
Certain forward-looking statements are included in the prospectus and this supplement. These forward-looking statements may involve our plans and objectives for future operations, including future growth and availability of funds. These forward-looking statements are based on current expectations, which are subject to numerous risks and uncertainties. Assumptions relating to these statements involve judgments with respect to, among other things, the continuation of our offering of Units, future economic, competitive and market conditions and future business decisions, together with local, national and international events (including, without limitation, acts of terrorism or war, and their direct and indirect effects on travel and the economy). All of these matters are difficult or impossible to predict accurately and many of them are beyond our control. Although we believe the assumptions relating to the forward-looking statements, and the statements themselves, are reasonable, any of the assumptions could be inaccurate and, therefore, there can be no assurance that these forward-looking statements will prove to be accurate. In light of the significant uncertainties inherent in these forward-looking statements, the inclusion of this information should not be regarded as a representation by us or any other person that our objectives and plans, which we consider to be reasonable, will be achieved.
S-1
“Courtyard by Marriott,” “Fairfield Inn,” “Fairfield Inn & Suites,” “TownePlace Suites,” “Marriott,” “SpringHill Suites” and “Residence Inn” are each a registered trademark of Marriott International, Inc. or one of its affiliates. All references below to “Marriott” mean Marriott International, Inc. and all of its affiliates and subsidiaries, and their respective officers, directors, agents, employees, accountants and attorneys. Marriott is not responsible for the content of this prospectus supplement, whether relating to hotel information, operating information, financial information, Marriott’s relationship with Apple REIT Nine, Inc., or otherwise. Marriott is not involved in any way, whether as an “issuer” or “underwriter” or otherwise, in the offering by Apple REIT Nine, Inc. and receives no proceeds from the offering. Marriott has not expressed any approval or disapproval regarding this prospectus supplement or the offering related to this prospectus supplement, and the grant by Marriott of any franchise or other rights to Apple REIT Nine, Inc. shall not be construed as any expression of approval or disapproval. Marriott has not assumed, and shall not have, any liability in connection with this prospectus supplement or the offering related to this prospectus supplement. “Hampton Inn,” “Hampton Inn & Suites,” “Homewood Suites,” “Embassy Suites,” “Hilton Garden Inn” and “Home2 by Hilton” are each a registered trademark of Hilton Worldwide or one of its affiliates. All references below to “Hilton” mean Hilton Worldwide and all of its affiliates and subsidiaries, and their respective officers, directors, agents, employees, accountants and attorneys. Hilton is not responsible for the content of this prospectus supplement, whether relating to hotel information, operating information, financial information, Hilton’s relationship with Apple REIT Nine, Inc., or otherwise. Hilton is not involved in any way, whether as an “issuer” or “underwriter” or otherwise, in the offering by Apple REIT Nine, Inc. and receives no proceeds from the offering. Hilton has not expressed any approval or disapproval regarding this prospectus supplement or the offering related to this prospectus supplement, and the grant by Hilton of any franchise or other rights to Apple REIT Nine, Inc. shall not be construed as any expression of approval or disapproval. Hilton has not assumed, and shall not have, any liability in connection with this prospectus supplement or the offering related to this prospectus supplement. S-2
We completed the minimum offering of Units (with each Unit consisting of one Common Share and one Series A Preferred Share) at $10.50 per Unit on May 14, 2008. We are continuing the offering at $11 per Unit in accordance with the prospectus. We registered to sell a total of 182,251,082 Units. As of July 31, 2010, 39,018,408 Units remained unsold. Our offering of Units expires on April 25, 2011, provided that the offering will be terminated if all of the Units are sold before then. As of July 31, 2010, we had closed on the following sales of Units in the offering: Price Per Number of Gross Proceeds Net of Selling $10.50 9,523,810 $ 100,000,000 $ 90,000,000 $11.00 133,708,864 1,470,797,505 1,323,717,754 Total 143,232,674 $ 1,570,797,505 $ 1,413,717,754 Our distributions since the initial capitalization through June 30, 2010 totaled approximately $119.9 million of which approximately $74.9 million was used to purchase additional Units under the Company’s best-efforts offering. In 2008 and 2009, our initial years of operations, over half of the $70.3 million in total distributions represented a return of capital (specifically, 53% and 58% in 2009 and 2008, respectively), as detailed below. Our distributions were paid at a monthly rate of $0.073334 per common share beginning in June 2008. Since the initial capitalization through June 30, 2010, our net cash generated from operations, from our Consolidated Statements of Cash Flows, was approximately $48.1 million, which exceeded the net cash distributions. The following is a summary of the distributions and cash generated by operations. Total Total Declared and Paid Net Cash Cash Reinvested Total 2nd Quarter 2008 $ 0.07 $ 300,000 $ 593,000 $ 893,000 $ 323,000 3rd Quarter 2008 0.22 1,694,000 3,094,000 4,788,000 966,000 4th Quarter 2008 0.22 2,582,000 4,749,000 7,331,000 2,047,000 1st Quarter 2009 0.22 3,624,000 6,265,000 9,889,000 2,204,000 2nd Quarter 2009 0.22 4,728,000 7,897,000 12,625,000 8,888,000 3rd Quarter 2009 0.22 5,956,000 9,790,000 15,746,000 8,908,000 4th Quarter 2009 0.22 7,240,000 11,830,000 19,070,000 9,137,000 1st Quarter 2010 0.22 8,656,000 14,160,000 22,816,000 3,963,000 2nd Quarter 2010 0.22 10,241,000 16,518,000 26,759,000 11,697,000 $ 1.83 $ 45,021,000 $ 74,896,000 $ 119,917,000 $ 48,133,000
Unit
Units Sold
Proceeds
Commissions and Marketing
Expense Allowance
Distributions
Declared and
Paid per Share
From
Operations(1)
| ||||||||||||||||||||
(1) |
|
| See complete consolidated statement of cash flows for the six months ending June 30, 2010 included in our most recent Form 10-Q for the quarter ended June 30, 2010, and the complete consolidated statements of cash flows for the years ended December 31, 2009 and 2008 included in our audited financial statements included in our most recent Form 10-K for the year ended December 31, 2009. | |||||||||||||||||
Through July 31, 2010, we have received requests to redeem approximately 772,000 Units pursuant to our Unit Redemption Program for a total of $8.0 million. Through our last scheduled quarterly redemption date in 2010, July 20, 2010, we redeemed 100% of the redemption requests at an average per Unit redemption price of $10.30. We funded Unit redemptions for the periods noted above from the proceeds of dividends used to purchase additional Units under the Company’s best efforts offering of Units.
S-3
Recent Purchases On July 30, 2010, through one of our indirect wholly-owned subsidiaries, we closed on the purchase of three hotels located in Lafayette, Louisiana, West Monroe, Louisiana, and Silver Spring, Maryland. The aggregate gross purchase price for these hotels, which contain a total of 394 guest rooms, was $50.3 million. Further information about our recently purchased hotels is provided in other sections below. Recent Purchase Contracts We caused one of our indirect wholly-owned subsidiaries to enter into a series of purchase contracts for the potential purchase of six hotels. The total gross purchase price for these hotels, which contain 760 guest rooms, is approximately $121.1 million. The purchase contracts provide for an aggregate initial deposit of $370,000, and require an additional aggregate deposit in the amount of approximately $10.7 million after the end of our contractual review periods. A number of required conditions to closing currently remain unsatisfied under the purchase contracts. Accordingly, there can be no assurance at this time that any closings will occur under these purchase contracts. Upon a purchase, the deposit amounts would be credited against the purchase price. Further information about these purchase contracts and hotels is provided in the “Acquisitions and Related Matters” section below. Source of Funds and Related Party Payments Our recent purchases, which resulted in our ownership of three additional hotels, were funded by the proceeds from our ongoing offering of Units. Our offering proceeds also have been used to fund the initial deposits required by the hotel purchase contracts and will be used for the related additional deposits. We have entered into a property acquisition and disposition agreement with Apple Suites Realty Group, Inc. to acquire and dispose of our real estate assets. A fee of 2% of the gross purchase price or gross sale price in addition to certain reimbursable expenses will be payable for these services. This entity is owned by Glade M. Knight, who is our Chairman and Chief Executive Officer. We used our offering proceeds to pay $1.0 million to Apple Suites Realty Group, Inc., representing 2% of the gross purchase price for our recent purchases on July 30, 2010. David Lerner Associates, Inc., Apple Suites Realty Group, Inc. and Apple Nine Advisors, Inc. earned the compensation and expense reimbursements shown below in connection with their services from inception through the period ending June 30, 2010 relating to our offering phase, acquisition phase and operations phase. David Lerner Associates, Inc. is not related to Apple Suites Realty Group, Inc. or Apple Nine Advisors, Inc. Apple Realty Group, Inc. and Apple Nine Advisors, Inc. are owned by Glad M. Knight, our Chairman and Chief Executive Officer. As described on page 41 of our prospectus under the heading “Compensation” and as shown below, we pay certain fees and expenses as they are incurred, while others accrue and will be paid in future periods, subject in some cases to the achievement of performance criteria. We did not incur any amounts in connection with out disposition phase through June 30, 2010. S-4
Cumulative through June 30, 2010 Incurred Paid Accrued Offering Phase Selling commissions paid to David Lerner Associates, Inc. in connection with the offering $ 110,948,250 $ 110,948,250 $ — Marketing expense allowance paid to David Lerner Associates, Inc. in connection with the offering 36,982,750 36,982,750 — 147,931,000 147,931,000 — Acquisition Phase Acquisition commission paid to Apple Suites Realty Group, Inc. 18,037,000 18,037,000 — Operations Phase Asset management fee paid to Apple Nine Advisors, Inc. 1,516,000 1,516,000 — Reimbursement of costs paid to Apple Nine Advisors, Inc. 3,311,000 3,311,000 — Overview of Owned Hotels As a result of our recent purchases, we currently own 48 hotels, which are located in the states indicated in the map below: 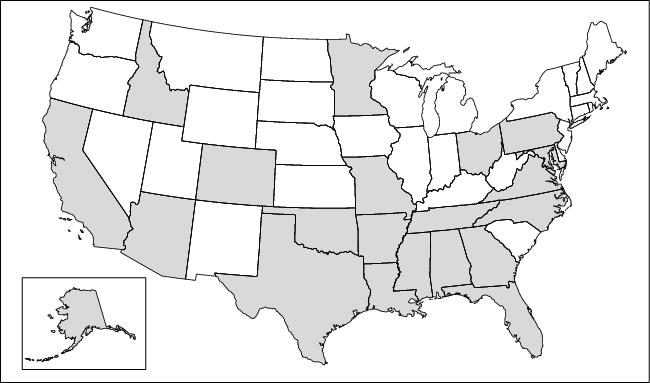
S-5
ACQUISITIONS AND RELATED MATTERS Each of our recently purchased hotels has been leased to one of our indirect wholly-owned subsidiaries, as the lessee, under a separate hotel lease agreement. For simplicity, the applicable lessee will be referred to below as the “lessee.” Each hotel is managed under a separate management agreement between the applicable lessee and the manager. For simplicity, the applicable manager will be referred to below as the “manager.” The hotel lease agreements and the management agreements are among the contracts described in another section below. The table below specifies the franchise, hotel owner, lessee and manager for our recently purchased hotels: Hotel Location Franchise (a) Hotel Lessee Manager 1. Lafayette, Louisiana Hilton Garden Inn Apple Nine Apple Nine LBAM—Investor 2. West Monroe, Louisiana Hilton Garden Inn Apple Nine Apple Nine Intermountain 3. Silver Spring, Maryland Hilton Garden Inn Apple Nine Apple Nine White Lodging
Owner/Lessor
Louisiana, LLC
Hospitality
Management, Inc.
Group, L.L.C.
Louisiana, LLC
Hospitality
Management, Inc.
Management, LLC
Hospitality
Ownership, Inc.
Hospitality
Management, Inc.
Services
Corporation
Note for Table:
| ||||||||||||||||||||
(a) |
|
| All brand and trade names, logos or trademarks contained, or referred to, in this prospectus supplement are the properties of their respective owners. These references shall not in any way be construed as participation by, or endorsement of, our offering by any of our franchisors or managers. | |||||||||||||||||
We have no material relationship or affiliation with the sellers or managers, except for the relationship resulting from our purchases, our management agreements for the hotels we own and any related documents.
Potential Acquisitions
The following table provides a summary of the hotels covered by pending purchase contracts entered into since our Post Effective Amendment No. 9 dated July 21, 2010:
Hotel Location
Franchise
Date of
Purchase
Contract
Number of
Rooms
Gross
Purchase
Price(a)
1.
Irving, Texas
Homewood Suites
August 5, 2010
77
$
10,250,000
2.
Grapevine, Texas
Hilton Garden Inn
August 5, 2010
110
17,000,000
3.
Tucson, Arizona (b)/(c)
TownePlace Suites
August 10, 2010
124
15,851,974
4.
El Paso, Texas (b)/(c)
Hilton Garden Inn
August 10, 2010
145
19,973,526
5.
Nashville, Tennessee
Hilton Garden Inn
August 13, 2010
194
42,667,000
6.
Nashville, Tennessee (b)
Home2 by Hilton
August 13, 2010
110
15,400,000
Total
760
$
121,142,500
Notes for Table:
| ||||||||||||||||||||
(a) |
|
| Under each purchase contract, we are required to make an initial deposit to the seller. The aggregate initial deposits for the hotels listed above totaled $370,000. We are required to make additional deposits after the end of our contractual review period. If we close on the purchase of a particular hotel, the initial deposit (and any additional deposit) will be applied to the purchase price. If a closing does not occur because the seller has failed to satisfy a closing condition or breaches the purchase contract, the deposits would be refunded to us. The total of both the initial and additional deposits for the purchase contracts listed above is $11.1 million. | |||||||||||||||||
| ||||||||||||||||||||
(b) |
| This hotel is currently under development. The table shows the expected number of rooms upon hotel completion and the expected franchise. | ||||||||||||||||||
S-6
(c) If the seller meets all of the conditions to closing, we are obligated to specifically perform under the purchase contract. As the property is under construction at this time, the seller has not met all conditions to closing. Loan Information for Potential Purchase The purchase contract for the hotel located in Irving, Texas would require us to assume an existing loan secured by the hotel. The current outstanding principal balance is approximately $6.1 million, the interest rate is 5.83% and the loan matures in April 2017. Monthly payments of principal and interest are due on an amortized basis. The assumed loan has a non-recourse structure, which means that the lender generally must rely on the property, rather than the borrower, as the lender’s source of repayment in any collection action. There are exceptions to the non-recourse structure in certain situations, such as misappropriation of funds and environmental liabilities. In these situations, the lender would be permitted to seek repayment from the guarantor or indemnitor of the loan, which is one of our wholly-owned subsidiaries. (Remainder of Page Intentionally Left Blank) S-7
SUMMARY OF CONTRACTS Hotel Lease Agreements Each of our recently purchased hotels is covered by a separate hotel lease agreement between the owner (one of our indirect wholly-owned subsidiaries) and the applicable lessee (another one of our indirect wholly-owned subsidiaries, as specified in the previous section). Each lease provides for an initial term of 10 years. The applicable lessee has the option to extend its lease term for two additional five-year periods, provided it is not in default at the end of the prior term or at the time the option is exercised. Each lease provides for annual base rent and percentage rent. The annual base rent is payable in advance in equal monthly installments and will be adjusted each year in proportion to the Consumer Price Index (based on the U.S. City Average). Shown below are the annual base rent and the lease commencement date for our recently purchased hotels: Hotel Location Franchise Annual Date of Lease 1. Lafayette, Louisiana Hilton Garden Inn $ 1,602,354 July 30, 2010 2. West Monroe, Louisiana Hilton Garden Inn 1,428,300 July 30, 2010 3. Silver Spring, Maryland Hilton Garden Inn 991,262 July 30, 2010 The annual percentage rent depends on a formula that compares fixed “suite revenue breakpoints” with a portion of “suite revenue,” which is equal to gross revenue from guest rentals less sales and room taxes and credit card fees. The suite revenue breakpoints will be adjusted each year in proportion to the Consumer Price Index (based on the U.S. City Average). Specifically, the annual percentage rent is equal to the sum of (a) 17% of all suite revenue for the year, up to the applicable suite revenue breakpoint; plus (b) 55% of the suite revenue for the year in excess of the applicable suite revenue breakpoint, as reduced by base rent paid for the year. Management Agreements Each of our hotels is being managed by the manager under a separate management agreement between the manager and the applicable lessee (which is one of our indirect wholly-owned subsidiaries, as specified in the previous section). The manager is responsible for managing and supervising the daily operations of the hotel and for collecting revenues for the benefit of the applicable lessee. The fees and other terms of these agreements are the result of commercial negotiations between otherwise unrelated parties. We believe that such fees and terms are appropriate for the hotels and the markets in which they operate. Franchise Agreements For each of the hotels franchised by Hilton Worldwide or one of its affiliates, there is a franchise license agreement between the lessee and Hilton Worldwide or an affiliate. Each franchise license agreement provides for the payment of royalty fees and program fees to the franchisor. A percentage of gross room revenues is used to determine these payments. Apple Nine Hospitality, Inc. or another one of our subsidiaries has guaranteed the payment and performance of the lessee under the applicable franchise license agreement. The fees and other terms of these agreements are the result of commercial negotiations between otherwise unrelated parties, and we believe that such fees and terms are appropriate for the hotels and the markets in which they operate. These agreements may be terminated for various reasons, including failure by the applicable lessee to operate in accordance with the standards, procedures and requirements established by the franchisor. S-8
FOR OUR RECENTLY PURCHASED PROPERTIES
Base Rent
Commencement
FINANCIAL AND OPERATING INFORMATION Our hotels offer guest rooms and suites, together with related amenities, that are consistent with their operations. The hotels are located in developed or developing areas and in competitive markets. We believe the hotels are well-positioned to compete in their markets based on location, amenities, rate structure and franchise affiliation. In the opinion of management, each hotel is adequately covered by insurance. The following tables present further information about our hotels: Table 1. General Information Hotel Location Franchise Number Gross Average Federal Purchase Date 1. Lafayette, Louisiana Hilton Garden Inn 153 $ 17,261,340 $ 129-149 $ 17,261,340 July 30, 2010 2. West Monroe, Louisiana Hilton Garden Inn 134 15,638,660 133-153 14,806,866 July 30, 2010 3. Silver Spring, Maryland (c) Hilton Garden Inn 107 17,400,000 129-135 16,039,113 July 30, 2010 Total 394 $ 50,300,000
FOR OUR RECENTLY PURCHASED
PROPERTIES
of
Rooms/
Suites
Purchase
Price
Daily
Rate
(Price)
per
Room/
Suite (a)
Income Tax
Basis for
Depreciable
Real
Property
Component
of Hotel (b)
Notes for Table 1:
| ||||||||||||||||||||
(a) |
|
| The amounts shown are subject to change, and exclude discounts that may be offered to corporate, frequent and other select customers. | |||||||||||||||||
| ||||||||||||||||||||
(b) |
| The depreciable life is 39 years (or less, as may be permitted by federal tax laws) using the straight-line method. The modified accelerated cost recovery system will be used for the hotel’s personal property component. | ||||||||||||||||||
| ||||||||||||||||||||
(c) |
| The date that the hotel was acquired was the date the hotel began operations. | ||||||||||||||||||
Table 2. Operating Information (a)
PART A
|
|
|
|
|
|
|
|
|
|
|
|
|
|
| ||||||||||||||||||||||||||||||
Hotel Location | Franchise | Avg. Daily Occupancy Rates (%) | ||||||||||||||||||||||||||||||||||||||||||
2005 | 2006 | 2007 | 2008 | 2009 | ||||||||||||||||||||||||||||||||||||||||
1. | Lafayette, Louisiana | Hilton Garden Inn |
|
| — |
|
| 68 | % |
|
|
| 74 | % |
|
|
| 75 | % |
|
|
| 65 | % |
| |||||||||||||||||||
| 2. | West Monroe, Louisiana | Hilton Garden Inn |
|
| — |
|
| — |
|
| 55 | % |
|
|
| 68 | % |
|
|
| 70 | % |
| ||||||||||||||||||||
3. | Silver Spring, Maryland | Hilton Garden Inn |
|
| — |
|
| — |
|
| — |
|
| — |
|
| — | |||||||||||||||||||||||||||
PART B
|
|
|
|
|
|
|
|
|
|
|
|
|
|
| ||||||||||||||||||||||||||||||
Hotel Location | Franchise | Revenue per Available Room/Suite ($) | ||||||||||||||||||||||||||||||||||||||||||
2005 | 2006 | 2007 | 2008 | 2009 | ||||||||||||||||||||||||||||||||||||||||
1. | Lafayette, Louisiana | Hilton Garden Inn |
|
| — |
|
| $ |
| 69 |
|
| $ |
| 80 |
|
| $ |
| 89 |
|
| $ |
| 74 | |||||||||||||||||||
| 2. | West Monroe, Louisiana | Hilton Garden Inn |
|
| — |
|
| — |
|
| $ |
| 57 |
|
| $ |
| 69 |
|
| $ |
| 75 | ||||||||||||||||||||
3. | Silver Spring, Maryland | Hilton Garden Inn |
|
| — |
|
| — |
|
| — |
|
| — |
|
| — | |||||||||||||||||||||||||||
Note for Table 2
| ||||||||||||||||||||
(a) |
|
| Operating data is presented for the last five years (or since the beginning of hotel operations). Hotels with no data for a period were under construction and not open at that time. The first year of data for a hotel reflects results only for the period of time open and may not be a reflection of results once established in its market. See Table 1. General Information above for the date the hotel was acquired. | |||||||||||||||||
S-9
Table 3. Tax and Related Information
Hotel Location
Franchise
Tax Year
Real
Property
Tax Rate (d)
Real
Property
Tax
1.
Lafayette, Louisiana
Hilton Garden Inn
2009(a
)
10
%
$
44,067
2.
West Monroe, Louisiana
Hilton Garden Inn
2009(a
)
8
%
87,362
3.
Silver Spring, Maryland
Hilton Garden Inn
2010(b
)
1
%
11,365
(c)
Notes for Table 3:
| ||||||||||||||||||||
(a) |
|
| Represents a calendar year. | |||||||||||||||||
| ||||||||||||||||||||
(b) |
| Represents 12-month period from July 1, 2010 through June 30, 2011 | ||||||||||||||||||
| ||||||||||||||||||||
(c) |
| The hotel property consisted of undeveloped land for a portion of the tax year, and the real property tax for tax year is not necessarily indicative of property taxes expected for the hotel in the future. | ||||||||||||||||||
| ||||||||||||||||||||
(d) |
| Property tax rate is an aggregate figure for county, city and other local taxing authorities (to the extent applicable). | ||||||||||||||||||
(Remainder of Page Intentionally Left Blank)
S-10
(in thousands except per share and statistical data) Six Months Year Ended Year Ended For the period Revenues: Room revenue $ 56,345 $ 76,163 $ 9,501 $ — Other revenue 5,758 9,043 2,023 — Total hotel revenue 62,103 85,206 11,524 — Rental revenue 10,640 15,961 — — Total revenue 72,743 101,167 11,524 — Expenses: Hotel operating expenses 37,745 52,297 7,422 — Taxes, insurance and other 4,471 6,032 731 — General and administrative 3,075 4,079 1,288 15 Acquisition related costs 5,500 4,951 — — Depreciation 12,549 15,936 2,277 — Interest (income) expense, net 304 1,018 (2,346 ) 2 Total expenses 63,644 84,313 9,372 17 Net income (loss) $ 9,099 $ 16,854 $ 2,152 $ (17 ) Per Share: Net income (loss) per common share $ 0.08 $ 0.26 $ 0.14 $ (1,684.60 ) Distributions declared and paid per common share $ 0.44 $ 0.88 $ 0.51 $ — Weighted-average common shares 113,781 66,041 15,852 — Balance Sheet Data (at end of period): Cash and cash equivalents $ 358,261 $ 272,913 $ 75,193 $ 20 Investment in real estate, net $ 907,610 $ 687,509 $ 346,423 $ — Total assets $ 1,295,732 $ 982,513 $ 431,619 $ 337 Notes payable $ 58,059 $ 58,688 $ 38,647 $ 151 Shareholders’ equity $ 1,231,531 $ 917,405 $ 389,740 $ 31 Net book value per share $ 9.17 $ 9.31 $ 9.50 $ — Other Data: Cash Flow From (Used In): Operating activities $ 15,660 $ 29,137 $ 3,317 $ (2 ) Investing activities $ (234,677 ) $ (341,131 ) $ (315,322 ) $ — Financing activities $ 304,365 $ 509,714 $ 387,178 $ (26 ) Number of hotels owned at end of period 44 33 21 — Average Daily Rate (ADR) (a) $ 102 $ 104 $ 110 $ — Occupancy 65 % 62 % 59 % — Revenue Per Available Room (RevPAR) (b) $ 66 $ 64 $ 65 $ — Funds From Operations Calculation (c): Net income (loss) $ 9,099 $ 16,854 $ 2,152 $ (17 ) Depreciation of real estate owned 12,549 15,936 2,277 — Acquisition related costs 5,500 4,951 — — Funds from operations 27,148 37,741 4,429 (17 ) Straight-line rental income 3,011 4,618 — — Modified funds from operations $ 24,137 $ 33,123 $ 4,429 $ (17 )
Ended
June 30,
2010
December 31,
2009
December 31,
2008
November 9, 2007
(initial
capitalization)
through
December 31,
2007
outstanding—basic and diluted
| ||||||||||||||||||||
(a) |
|
| Total room revenue divided by number of rooms sold. | |||||||||||||||||
| ||||||||||||||||||||
(b) |
| ADR multiplied by occupancy percentage. | ||||||||||||||||||
S-11
(c) Funds from operations (FFO) is defined as net income (loss) (computed in accordance with generally accepted accounting principals—GAAP) excluding gains and losses from sales of depreciable property, plus depreciation and amortization, plus costs associated with the acquisition of real estate. Modified FFO (MFFO) excludes rental revenue earned, but not received during the period or straight-line rental income. The Company considers FFO and MFFO in evaluating property acquisitions and its operating performance and believes that FFO and MFFO should be considered along with, but not as an alternative to, net income and cash flows as a measure of the Company’s activities in accordance with GAAP. FFO and MFFO are not necessarily indicative of cash available to fund cash needs. (Remainder of Page Intentionally Left Blank) S-12
MANAGEMENT’S DISCUSSION AND ANALYSIS General The Company is a Virginia corporation that has elected to be treated as a real estate investment trust (“REIT”) for federal income tax purposes. The Company, which has limited operating history, was formed to invest in hotels, residential apartment communities and other income-producing real estate in selected metropolitan areas in the United States. The Company was initially capitalized November 9, 2007, with its first investor closing on May 14, 2008. Prior to the Company’s first hotel acquisition on July 31, 2008, the Company had no revenue, exclusive of interest income. As of June 30, 2010, the Company owned 44 hotels (11 purchased during the first six months of 2010, 12 acquired in 2009 and 21 acquired during 2008). The Company’s real estate portfolio also includes approximately 410 acres of land and improvements located on 111 sites in the Ft. Worth, Texas area (acquired in April 2009) that are being leased to a subsidiary of Chesapeake Energy Corporation (“Chesapeake”) for the production of natural gas. Accordingly, the results of operations include only results from the date of ownership of the properties. Hotel Operations Although hotel performance can be influenced by many factors including local competition, local and general economic conditions in the United States and the performance of individual managers assigned to each hotel, performance of the hotels within their respective local markets, in general, has met the Company’s expectations for the period owned. With the significant decline in economic conditions throughout the United States, overall performance of the Company’s hotels have not met expectations. Although there is no way to predict general economic conditions, many industry analysts believe that the hotel industry revenues are improving and will see low single digit increases in 2010 as compared to 2009. In evaluating financial condition and operating performance, the most important matters on which the Company focuses are revenue measurements, such as average occupancy, average daily rate (“ADR”) and revenue per available room (“RevPAR”), and expenses, such as hotel operating expenses, general and administrative and property taxes and insurance. Hotels Owned As noted above, the Company commenced operations in July 2008 upon the purchase of its first hotel property. The following table summarizes the location, brand, manager, gross purchase price, number of hotel rooms and date of purchase for each of the 44 hotels the Company owned as of June 30, 2010. All dollar amounts are in thousands. S-13
OF FINANCIAL CONDITION AND RESULTS OF OPERATIONS
(for the six months ended June 30, 2010)
Location Brand Manager Gross Purchase Rooms Date of Tucson, AZ Hilton Garden Inn Western $ 18,375 125 7/31/2008 Santa Clarita, CA Courtyard Dimension 22,700 140 9/24/2008 Charlotte, NC Homewood Suites McKibbon 5,750 112 9/24/2008 Allen, TX Hampton Inn & Suites Gateway 12,500 103 9/26/2008 Twinsburg, OH Hilton Garden Inn Gateway 17,792 142 10/7/2008 Lewisville, TX Hilton Garden Inn Gateway 28,000 165 10/16/2008 Duncanville, TX Hilton Garden Inn Gateway 19,500 142 10/21/2008 Santa Clarita, CA Hampton Inn Dimension 17,129 128 10/29/2008 Santa Clarita, CA Residence Inn Dimension 16,600 90 10/29/2008 Santa Clarita, CA Fairfield Inn Dimension 9,337 66 10/29/2008 Beaumont, TX Residence Inn Western 16,900 133 10/29/2008 Pueblo, CO Hampton Inn & Suites Dimension 8,025 81 10/31/2008 Allen, TX Hilton Garden Inn Gateway 18,500 150 10/31/2008 Bristol, VA Courtyard LBA 18,650 175 11/7/2008 Durham, NC Homewood Suites McKibbon 19,050 122 12/4/2008 Hattiesburg, MS Residence Inn LBA 9,793 84 12/11/2008 Jackson, TN Courtyard Vista 15,200 94 12/16/2008 Jackson, TN Hampton Inn & Suites Vista 12,600 83 12/30/2008 Pittsburgh, PA Hampton Inn Vista 20,458 132 12/31/2008 Fort Lauderdale, FL Hampton Inn Vista 19,290 109 12/31/2008 Frisco, TX Hilton Garden Inn Western 15,050 102 12/31/2008 Round Rock, TX Hampton Inn Vista 11,500 93 3/6/2009 Panama City, FL Hampton Inn & Suites LBA 11,600 95 3/12/2009 Austin, TX Homewood Suites Vista 17,700 97 4/14/2009 Austin, TX Hampton Inn Vista 18,000 124 4/14/2009 Dothan, AL Hilton Garden Inn LBA 11,601 104 6/1/2009 Troy, AL Courtyard LBA 8,696 90 6/18/2009 Orlando, FL Fairfield Inn & Suites Marriott 25,800 200 7/1/2009 Orlando, FL SpringHill Suites Marriott 29,000 200 7/1/2009 Clovis, CA Hampton Inn & Suites Dimension 11,150 86 7/31/2009 Rochester, MN Hampton Inn & Suites White 14,136 124 8/3/2009 Johnson City, TN Courtyard LBA 9,880 90 9/25/2009 Baton Rouge, LA SpringHill Suites Dimension 15,100 119 9/25/2009 Houston, TX Marriott Western 50,750 206 1/8/2010 Albany, GA Fairfield Inn & Suites LBA 7,920 87 1/14/2010 Panama City, FL TownePlace Suites LBA 10,640 103 1/19/2010 Clovis, CA Homewood Suites Dimension 12,435 83 2/2/2010 Jacksonville, NC TownePlace Suites LBA 9,200 86 2/16/2010 Miami, FL Hampton Inn & Suites Dimension 11,900 121 4/9/2010 Anchorage, AK Embassy Suites Stonebridge 42,000 169 4/30/2010 Boise, ID Hampton Inn & Suites Raymond 22,370 186 4/30/2010 Rogers, AR Homewood Suites Raymond 10,900 126 4/30/2010 St. Louis, MO Hampton Inn & Suites Raymond 16,000 126 4/30/2010 Oklahoma City, OK Hampton Inn & Suites Raymond 32,657 200 5/28/2010 Total $ 752,134 5,393 Of the Company’s 44 hotels owned at June 30, 2010, 11 were purchased during the first six months of 2010. The total gross purchase price for these 11 hotels, with a total of 1,493 rooms, was $226.8 million. During 2009, the Company acquired land in Alexandria, Virginia totaling $5.1 million, for the planned construction of a SpringHill Suites hotel to be completed over the next nine months. Upon completion, it is expected that the hotel will contain approximately 152 guest rooms and will be managed by Marriott. To date the Company has incurred approximately $4.8 million in construction costs and anticipates the total construction costs to be approximately $20-$25 million. S-14
Price
Purchase
The purchase price for these properties, net of debt assumed, was funded primarily by the Company’s on-going best-efforts offering of Units. The Company assumed approximately $53.8 million of debt secured by six of its hotel properties and $3.8 million of unsecured debt in connection with one of its hotel properties. The following table summarizes the hotel location, interest rate, maturity date and the principal amount assumed associated with each note payable outstanding as of June 30, 2010. All dollar amounts are in thousands. Location Brand Interest Maturity Principal Outstanding Lewisville, TX Hilton Garden Inn 0.00 % 12/31/2016 $ 3,750 $ 3,750 Duncanville, TX Hilton Garden Inn 5.88 % 5/11/2017 13,966 13,658 Allen, TX Hilton Garden Inn 5.37 % 10/11/2015 10,787 10,493 Bristol, VA Courtyard 6.59 % 8/1/2016 9,767 9,577 Round Rock, TX Hampton Inn 5.95 % 5/1/2016 4,175 4,064 Austin, TX Homewood Suites 5.99 % 3/1/2016 7,556 7,364 Austin, TX Hampton Inn 5.95 % 3/1/2016 7,553 7,360 $ 57,554 $ 56,266
Rate (1)
Date
Assumed
balance as of
June 30, 2010
| ||||||||||||||||||||
(1) |
|
| At acquisition, the Company adjusted the interest rates on these loans to market rates and is amortizing the adjustments to interest expense over the life of the loan. | |||||||||||||||||
Land and Improvements and Lease
In April 2009, the Company acquired approximately 417 acres of land on 113 sites in the Ft. Worth, Texas area for approximately $147 million from Chesapeake. Simultaneous to the closing, the Company entered into a ground lease with Chesapeake for the 113 sites. Chesapeake is using the land for natural gas production. In February 2010, the Company agreed to sell back to Chesapeake two of the 113 sites originally purchased from Chesapeake in April 2009 and release Chesapeake from their associated lease obligation. The sales price for the two sites was equal to the Company’s original purchase price, approximately $2.6 million. The Company earned and received rental income for the period held totaling approximately $240,000. The lease has an initial term of 40 years and annual rent ranging from $15.2 million to $26.9 million with the average annual rent being $21.4 million. Under the lease, Chesapeake is responsible for all operating costs of the real estate.
Chesapeake is a publicly held company that is traded on the New York Stock Exchange. Chesapeake is the second-largest independent producer of natural gas in the United States with interests in approximately 38,000 net drill sites.
Results of Operations
The following is a summary of the Company’s consolidated financial results for the three and six months ended June 30, 2010 and 2009:
Three Months Ended
June 30,
Six Months Ended
June 30,
2010
2009
2010
2009
(in thousands)
Revenues:
Hotel revenue
$
35,627
$
21,508
$
62,103
$
40,191
Rental revenue
5,343
5,076
10,640
5,076
Expenses:
Hotel direct expenses
21,126
12,390
37,745
23,576
Taxes, insurance and other expense
2,341
1,686
4,471
3,031
General and administrative expenses
1,765
1,059
3,075
1,898
Acquisition related costs
3,349
1,435
5,500
2,463
Depreciation
6,851
3,736
12,549
6,388
Interest expense, net
(220
)
(545
)
(304
)
(628
)
S-15
During the period from the Company’s initial capitalization on November 9, 2007 to July 30, 2008, the Company owned no properties, had no revenue, exclusive of interest income and was primarily engaged in capital formation activities. The Company began operations on July 31, 2008 when it purchased its first hotel. As of June 30, 2010, the Company owned 44 hotels (of which 11 were acquired during 2010) with 5,393 rooms as compared to 27 hotels, with a total of 3,081 rooms as of June 30, 2009. The Company’s real estate portfolio also includes approximately 410 acres of land and improvements located on 111 sites in the Ft. Worth, Texas area (acquired in April 2009) that are being leased to Chesapeake for the production of natural gas. As a result of the acquisition activity during 2009 and 2010, a comparison of operations for 2010 to prior periods is not representative of the results that would have occurred if all properties had been owned for the entire periods presented. Hotel Performance The following is summary of the operating results of the 44 hotels acquired through June 30, 2010 for their respective periods of ownership by the Company: Three Months Ended Six Months Ended June 30, % of June 30, % of June 30, % of June 30, % of (in thousands) Hotel Revenue: Room revenue $ 32,252 $ 19,195 $ 56,345 $ 35,832 Other revenue 3,375 2,313 5,758 4,359 35,627 21,508 62,103 40,191 Hotel Operating Expenses: Hotel direct expenses 21,126 59 % 12,390 58 % 37,745 61 % 23,576 59 % Taxes, insurance and other expense 2,314 6 % 1,660 8 % 4,417 7 % 3,005 7 % Hotel Operating Statistics: Number of hotels 44 27 44 27 ADR $ 103 $ 108 $ 102 $ 111 Occupancy 68 % 67 % 65 % 66 % RevPAR $ 70 $ 72 $ 66 $ 73 Hotel performance is impacted by many factors including the economic conditions in the United States as well as each locality. During the past two years, the overall weakness in the U.S. economy has had a considerable negative impact on both consumer and business travel. As a result, revenue in most markets in the United States has declined. Although economic conditions appear to be stabilizing, and in some markets improving, the Company expects revenue for the industry as a whole to continue to be below pre-recession levels until general economic conditions improve. The Company’s hotels in general have shown results consistent with industry and brand averages for the period of ownership. Hotel Revenues The Company’s principal source of revenue is hotel revenue consisting of room and other related revenue. For the three months ended June 30, 2010 and 2009, the Company had hotel revenue of $35.6 million and $21.5 million. For the six months ended June 30, 2010 and 2009, the Company had hotel revenue of $62.1 million and $40.2 million. This revenue reflects hotel operations for the 44 hotels acquired through June 30, 2010 and 27 hotels acquired through June 30, 2009 for their respective periods of ownership by the Company. For the three months ended June 30, 2010, the hotels achieved combined average occupancy of approximately 68%, ADR of $103 and RevPAR of $70. For the three months ended June 30, 2009, the hotels achieved combined average S-16
2010
Hotel
Revenue
2009
Hotel
Revenue
2010
Hotel
Revenue
2009
Hotel
Revenue
occupancy of approximately 67%, ADR of $108 and RevPAR of $72. For the six months ended June 30, 2010, the hotels achieved combined average occupancy of approximately 65%, ADR of $102 and RevPAR of $66. For the six months ended June 30, 2009, the hotels achieved combined average occupancy of approximately 66%, ADR of $111 and RevPAR of $73. ADR is calculated as room revenue divided by the number of rooms sold, and RevPAR is calculated as occupancy multiplied by ADR. The decline in occupancy, ADR and RevPAR during the first six months of 2010 as compared to the same period in 2009 is due to several factors. General economic conditions in the United States have caused industry declines in certain markets. In addition, of the 17 hotels acquired by the Company since June 30, 2009, 10 were newly constructed. Generally, newly constructed hotels require 12-24 months to establish themselves in their respective markets. Therefore, revenue is below anticipated or market levels for this period of time. Lastly, many of the 17 hotels acquired by the Company since June 30, 2009 have been in markets with ADR below the average of the markets of the first 27 hotels acquired by the Company, thus reducing the overall average. Due to industry-wide hotel revenue declines from a general weakening economy, the Company’s hotel revenue has been lower than anticipated. The industry and the Company have begun to experience slight improvements in its hotel occupancy levels, as evidenced by the overall increase during the second quarter as compared to prior year, however, during the same period, ADR has continued to decline. While reflecting the impact of declining economic activity, the Company’s hotels continue to be leaders in RevPAR in their respective markets. The Company’s average RevPAR index was 133 for the first six months of 2010 (the index excludes hotels under renovation or open less than two years). The RevPAR index is a measure of each hotel’s RevPAR compared to the average in the market, with 100 being the average, and is provided by Smith Travel Research, Inc.Ò, an independent company that tracks historical hotel performance in most markets throughout the world. Although it is not possible to predict general economic conditions or their impact on the hotel industry, many industry analysts are now forecasting low single digit increases in RevPAR for 2010 as compared to 2009 for hotels established in their market. The Company will continue to pursue market opportunities to improve revenue. Hotel Operating Expenses Hotel operating expenses relate to the 44 hotels acquired through June 30, 2010 for their respective periods owned and consist of direct room expenses, hotel administrative expense, sales and marketing expense, utilities expense, repair and maintenance expense, franchise fees and management fees. For the three months ended June 30, 2010 and 2009, hotel operating expenses totaled $21.1 million or 59% of hotel revenue and $12.4 million or 58% of hotel revenue. For the six months ended June 30, 2010 and 2009, hotel operating expenses totaled $37.7 million or 61% of hotel revenue and $23.6 million or 59% of hotel revenue. Nine of the 12 hotels acquired in 2009 and four (including a full service Marriott hotel) of the 11 hotels acquired in 2010 are new hotels and as a result, hotel operating expenses as a percentage of hotel revenue for these hotels are higher than is expected once the properties have established themselves within their respective markets. In addition, operating expenses were impacted by several hotel renovations, with approximately 11,100 room nights out of service during the first six months of 2010 due to such renovations. While weakened economic conditions persist, the Company will continue to work with its management companies to reduce costs as aggressively as possible, however it is not anticipated that these reductions will offset any future revenue declines. Taxes, insurance, and other expense for the three months ended June 30, 2010 and 2009 totaled $2.3 million or 6% of hotel revenue and $1.7 million or 8% of hotel revenue. For the six months ended June 30, 2010 and 2009, taxes, insurance, and other expense totaled $4.4 million or 7% of hotel revenue and $3.0 million or 7% of hotel revenue. Rental Revenue The Company generates rental revenue from its purchase and leaseback transaction completed during the second quarter of 2009. In April 2009, the Company purchased 417 acres of land located S-17
on 113 sites in the Ft. Worth, Texas area and simultaneously entered into a long-term, triple net lease with Chesapeake, one of the nation’s largest producers of natural gas. In February 2010, the Company agreed to sell back to Chesapeake two of the 113 sites originally purchased and release Chesapeake from their associated lease obligations. Rental payments are fixed and have determinable rent increases during the initial lease term. The lease is classified as an operating lease and rental income is recognized on a straight line basis over the initial term of the lease. Rental income for the three months ended June 30, 2010 and 2009 was $5.3 million and $5.1 million, respectively and includes $1.5 million of adjustments to record rent on the straight line basis. Rental income for the six months ended June 30, 2010 and 2009 was $10.6 million and $5.1 million, respectively and includes $3.0 million and $1.5 million of adjustments to record rent on the straight line basis. Other Expenses General and administrative expense for the three months ended June 30, 2010 and 2009 was $1.8 million and $1.1 million. For the six months ended June 30, 2010 and 2009, general and administrative expenses were $3.1 million and $1.9 million. The principal components of general and administrative expense are advisory fees, legal fees, accounting fees, the Company’s share of the loss in its investment in Apple Air Holding, LLC, and reporting expenses. Acquisition related costs for the three months ended June 30, 2010 and 2009 were $3.3 million and $1.4 million, and $5.5 million and $2.5 million for the six months ended June 30, 2010 and 2009. In accordance with the Accounting Standards Codification on business combinations, the Company has expensed as incurred all transaction costs associated with the acquisitions of existing businesses that occurred on or after January 1, 2009, including title, legal, accounting and other related costs, as well as the brokerage commission paid to Apple Suites Realty Group, Inc. (“ASRG”), owned 100% by Glade M. Knight, Chairman and Chief Executive Officer of the Company. For acquisitions that occurred prior to January 1, 2009, these costs were capitalized as part of the cost of the acquisition. Depreciation expense for the three months ended June 30, 2010 and 2009 was $6.9 million and $3.7 million, and $12.5 million and $6.4 million for the six months ended June 30, 2010 and 2009. Depreciation expense primarily represents expense of the Company’s 44 hotel buildings and related improvements, and associated personal property (furniture, fixtures, and equipment) for their respective periods owned. Also, included in depreciation expense for the three and six months ended June 30, 2010 and 2009 is the depreciation of the Company’s land improvements (acquired in April 2009) located on 111 sites in Fort Worth, Texas which is leased to one of the nation’s largest producers of natural gas. Interest expense for the three months ended June 30, 2010 and 2009 was $620,000 and $693,000, and is net of approximately $110,000 and $60,000 of interest capitalized associated with renovation and construction projects. Interest expense for the six months ended June 30, 2010 and 2009 was $1.1 million and $1.2 million, and is net of approximately $316,000 and $60,000 of interest capitalized associated with renovation and construction projects. Interest expense primarily arose from debt assumed with the acquisition of seven of the Company’s hotels (four loan assumptions during 2008 and three in 2009). During the three months ended June 30, 2010 and 2009, the Company also recognized $400,000 and $148,000 in interest income, and $836,000 and $588,000 for the six months ended June 30, 2010 and 2009, representing interest on excess cash invested in short-term money market instruments and certificates of deposit. Related Parties The Company has significant transactions with related parties. These transactions cannot be construed to be at arm’s length and the results of the Company’s operations may be different than if conducted with non-related parties. The Company has a contract with ASRG, to acquire and dispose of real estate assets for the Company. A fee of 2% of the gross purchase price or gross sale price in addition to certain reimbursable expenses is paid to ASRG for these services. As of June 30, 2010, payments to ASRG S-18
for services under the terms of this contract have totaled approximately $18.0 million since inception. The Company is party to an advisory agreement with Apple Nine Advisors, Inc. (“A9A”) to provide management services to the Company. An annual fee ranging from 0.1% to 0.25% of total equity proceeds received by the Company, in addition to certain reimbursable expenses, are payable for these services. A9A has entered into an agreement with Apple REIT Six, Inc. (“AR6”) to provide certain management services to the Company. The Company will reimburse A9A for the cost of the services provided by AR6. A9A will in turn reimburse AR6. Total advisory fees and reimbursable expenses incurred by the Company under the advisory agreement are included in general and administrative expenses and totaled approximately $1.7 million and $956,000 for the six months ended June 30, 2010 and 2009. Of this total expense $623,000 and $283,000 were fees paid to A9A and $1.04 million and $673,000 were expenses reimbursed by A9A to AR6 for the six months ended June 30, 2010 and 2009. ASRG and A9A are 100% owned by Glade M. Knight, Chairman and Chief Executive Officer of the Company. Mr. Knight is also Chairman and Chief Executive Officer of AR6, Apple REIT Seven, Inc. and Apple REIT Eight, Inc. Members of the Company’s Board of Directors are also on the Board of Directors of AR6, Apple REIT Seven, Inc. and Apple REIT Eight, Inc. Series B Convertible Preferred Stock The Company has issued 480,000 Series B convertible preferred shares to Glade M. Knight, Chairman and Chief Executive Officer of the Company, in exchange for the payment by him of $0.10 per Series B convertible preferred share, or an aggregate of $48,000. The Series B convertible preferred shares are convertible into common shares pursuant to the formula and on the terms and conditions set forth below. There are no dividends payable on the Series B convertible preferred shares. Holders of more than two-thirds of the Series B convertible preferred shares must approve any proposed amendment to the articles of incorporation that would adversely affect the Series B convertible preferred shares. Upon the Company’s liquidation, the holder of the Series B convertible preferred shares is entitled to a priority liquidation payment before any distribution of liquidation proceeds to the holders of the common shares. However, the priority liquidation payment of the holder of the Series B convertible preferred shares is junior to the holders of the Series A preferred shares distribution rights. The holder of a Series B convertible preferred share is entitled to a liquidation payment of $11 per number of common shares each Series B convertible preferred share would be convertible into according to the formula described below. In the event that the liquidation of the Company’s assets results in proceeds that exceed the distribution rights of the Series A preferred shares and the Series B convertible preferred shares, the remaining proceeds will be distributed between the common shares and the Series B convertible preferred shares, on an as converted basis. Each holder of outstanding Series B convertible preferred shares shall have the right to convert any of such shares into common shares of the Company upon and for 180 days following the occurrence of any of the following events: (1) substantially all of the Company’s assets, stock or business is sold or transferred through exchange, merger, consolidation, lease, share exchange, sale or otherwise, other than a sale of assets in liquidation, dissolution or winding up of the Company; (2) the termination or expiration without renewal of the advisory agreement with A9A, or if the Company ceases to use ASRG to provide property acquisition and disposition services; or (3) the Company’s common shares are listed on any securities exchange or quotation system or in any established market. Upon the occurrence of any conversion event, each Series B convertible preferred share may be converted into a number of common shares based upon the gross proceeds raised through the date of conversion in the Company’s $2 billion offering according to the following table: S-19
Gross Proceeds Raised from Sales of Number of Common Shares $1.4 billion 16.93696 $1.5 billion 18.14264 $1.6 billion 19.34832 $1.7 billion 20.55400 $1.8 billion 21.75968 $1.9 billion 22.96537 $ 2 billion 24.17104 In the event that after raising gross proceeds of $2 billion, the Company raises additional gross proceeds in a subsequent public offering, each Series B convertible preferred share may be converted into an additional number of common shares based on the additional gross proceeds raised through the date of conversion in a subsequent public offering according to the following formula: (X/100 million)´ 1.20568, where X is the additional gross proceeds rounded down to the nearest 100 million. No additional consideration is due upon the conversion of the Series B convertible preferred shares. The conversion into common shares of the Series B convertible preferred shares will result in dilution of the shareholders’ interests. Expense related to the issuance of 480,000 Series B convertible preferred shares to Mr. Knight will be recognized at such time when the number of common shares to be issued for conversion of the Series B shares can be reasonably estimated and the event triggering the conversion of the Series B shares to common shares occurs. The expense will be measured as the difference between the fair value of the common stock for which the Series B shares can be converted and the amounts paid for the Series B shares. Although the fair market value cannot be determined at this time, expense if the maximum offering is achieved could range from $0 to in excess of $127 million (assumes $11 per unit fair market value). Based on equity raised through June 30, 2010, if a triggering event had occurred, expense would have ranged from $0 to $89.4 million (assumes $11 per unit fair market value) and approximately 8.1 million common shares would have been issued. Liquidity and Capital Resources The Company was initially capitalized on November 9, 2007, with its first investor closing on May 14, 2008. The Company’s principal source of liquidity is cash on hand, the proceeds of its on-going best-efforts offering and the cash flow generated from properties the Company has or will acquire and any short term investments. In addition, the Company may borrow funds, subject to the approval of the Company’s Board of Directors. The Company anticipates that cash flow, and cash on hand, will be adequate to cover its operating expenses and to permit the Company to meet its anticipated liquidity requirements, including debt service, capital improvements and anticipated distributions to shareholders. The Company intends to use the proceeds from the Company’s on-going best-efforts offering, and cash on hand, to purchase income producing real estate. The Company is raising capital through a best-efforts offering of Units (each Unit consists of one common share and one Series A preferred share) by David Lerner Associates, Inc., the managing dealer, which receives selling commissions and a marketing expense allowance based on proceeds of the Units sold. The minimum offering of 9,523,810 Units at $10.50 per Unit was sold as of May 14, 2008, with proceeds net of commissions and marketing expenses totaling $90 million. Subsequent to the minimum offering and through June 30, 2010, an additional 125.4 million Units, at $11 per Unit, were sold, with the Company receiving proceeds, net of commissions, marketing expenses and other offering costs of approximately $1.2 billion. On April 25, 2010, the offering was extended for one additional year. The offering expires on April 25, 2011, provided that the offering will be terminated if all of the Units are sold before then. As of June 30, 2010, 47,335,185 Units remained unsold. S-20
Units through Date of Conversion
through Conversion of
One Series B Convertible Preferred Share
To maintain its REIT status the Company is required to distribute at least 90% of its ordinary income. Distributions during the first six months of 2010 totaled approximately $49.6 million of which approximately $30.7 million was used to purchase additional Units under the Company’s best-efforts offering. Thus the net cash distributions were $18.9 million. The distributions were paid at a monthly rate of $0.073334 per common share. For the same period the Company’s net cash generated from operations was approximately $15.7 million. During the initial phase of the Company’s operations, the Company may, due to the inherent delay between raising capital and investing that same capital in income producing real estate, have a portion of its distributions funded from offering proceeds. The portion of the distributions funded from offering proceeds is expected to be treated as a return of capital for federal income tax purposes. In May 2008, the Company’s Board of Directors established a policy for an annualized dividend rate of $0.88 per common share, payable in monthly distributions. The Company intends to continue paying dividends on a monthly basis, consistent with the annualized dividend rate established by its Board of Directors. The Company’s Board of Directors, upon the recommendation of the Audit Committee, may amend or establish a new annualized dividend rate and may change the timing of when distributions are paid. The Company’s objective in setting a distribution rate is to project a rate that will provide consistency over the life of the Company taking into account acquisitions and capital improvements, ramp up of new properties and varying economic cycles. To meet this objective, the Company may require the use of debt or offering proceeds in addition to cash from operations. Since a portion of distributions has to date been funded with proceeds from the offering of Units, the Company’s ability to maintain its current intended rate of distribution will be based on its ability to fully invest its offering proceeds and thereby increase its cash generated from operations. As there can be no assurance of the Company’s ability to acquire properties that provide income at this level, or that the properties already acquired will provide income at this level, there can be no assurance as to the classification or duration of distributions at the current rate. Proceeds of the offering which are distributed are not available for investment in properties. The Company has a Unit Redemption Program to provide limited interim liquidity to its shareholders who have held their Units for at least one year. Shareholders may request redemption of Units for a purchase price equal to 92% of the price paid per Unit if the Units have been owned for less than three years, or 100% of the price paid per Unit if the Units have been owned more than three years. The maximum number of Units that may be redeemed in any given year will be three percent of the weighted average number of Units outstanding during the 12-month period immediately prior to the date of redemption. The Company reserves the right to change the purchase price of redemptions, reject any request for redemption, or otherwise amend the terms of, suspend, or terminate the Unit Redemption Program. During the six months ended June 30, 2010, the Company redeemed 306,753 Units in the amount of $3.1 million under the program. There were no redemptions for the first six months of 2009. The Company has on-going capital commitments to fund its capital improvements. The Company is required, under all of the hotel management agreements and certain loan agreements, to make available, for the repair, replacement, refurbishing of furniture, fixtures, and equipment, a percentage of gross revenues provided that such amount may be used for the Company’s capital expenditures with respect to the hotels. As of June 30, 2010, the Company held with various lenders $6.4 million in reserves for capital expenditures. As of June 30, 2010, the Company had six major renovations scheduled to be completed in 2010. Total capital expenditures on properties owned at June 30, 2010 are anticipated to be approximately $8 million for the remainder of 2010. Additionally, the Company is in the process of constructing a SpringHill Suites hotel in Alexandria, Virginia which is expected to be completed over the next nine months. To date the Company has incurred approximately $4.8 million in construction costs and anticipates the total construction costs to be approximately $20—$25 million. As of June 30, 2010, the Company had outstanding contracts for the potential purchase of 11 additional hotels for a total purchase price of $169.2 million. Of these 11 hotels, five are under construction and should be completed over the next 15 months. The other six hotels are expected to close within the next six months. Although the Company is working towards acquiring these hotels, there are many conditions to closing that have not yet been satisfied and there can be no assurance S-21
that closings will occur under the outstanding purchase contracts. The following table summarizes the location, brand, number of rooms, refundable (if the seller does not meet its obligations under the contract) contract deposits paid, and gross purchase price for each of the contracts. All dollar amounts are in thousands. Location Brand Rooms Deposits Gross Purchase Holly Springs, NC Hampton Inn 124 $ 100 $ 14,880 (a) Ft. Worth, TX TownePlace Suites 140 500 18,435 (a)/(b) Jacksonville, NC Fairfield Inn & Suites 79 125 7,800 Santa Ana, CA Courtyard 155 100 24,800 (a) Rogers, AR Hampton Inn 122 125 9,600 St. Louis, MO Hampton Inn 190 125 23,000 Kansas City, MO Hampton Inn 122 125 10,130 Lafayette, LA SpringHill Suites 103 3 10,232 (a)/(b) Lafayette, LA Hilton Garden Inn 153 150 (c) West Monroe, LA Hilton Garden Inn 134 150 (c) Silver Spring, MD Hilton Garden Inn 107 150 17,400 (a) 1,429 $ 1,653 $ 169,177
Paid
Price
| ||||||||||||||||||||
(a) |
|
| The hotels are currently under construction. The table shows the expected number of rooms upon hotel completion and the expected franchise. | |||||||||||||||||
| ||||||||||||||||||||
(b) |
| If the seller meets all of the conditions to closing, the Company is obligated to specifically perform under the contract. As the properties are under construction, at this time, the seller has not met all of the conditions to closing. | ||||||||||||||||||
| ||||||||||||||||||||
(c) |
| The total purchase price for these two hotels is $32.9 million. | ||||||||||||||||||
Three of the hotels under contract require the Company to assume approximately $29.0 million in mortgage debt. Each of these loans provide for monthly payments of principal and interest on an amortized basis.
As there can be no assurance that all conditions to closing will be satisfied, the Company includes deposits paid for hotels under contract in other assets, net in the Company’s consolidated balance sheets, and in deposits and other disbursements for potential acquisitions in the Company’s consolidated statements of cash flows. It is anticipated that the purchase price (less any debt assumed) for the outstanding contracts will be funded from the proceeds of the Company’s on-going best-efforts offering of Units and cash on hand if a closing occurs.
On October 14, 2009, the Company entered into a ground lease for approximately one acre of land located in downtown Richmond, Virginia. The lease terminates on December 31, 2098, subject to the Company’s right to exercise two renewal periods of ten years each. The Company intends to use the land to build two nationally recognized brand hotels. Under the terms of the lease the Company has a “Study Period” to determine the viability of the hotels. The Company can terminate the lease for any reason during the Study Period, which originally ended on April 14, 2010, and was extended for six months to October 14, 2010. After the Study Period, the lease continues to be subject to various conditions, including but not limited to obtaining various permits, licenses, zoning variances and franchise approvals. If any of these conditions are not met the Company has the right to terminate the lease at any time. Rent payments are not required until the Company decides to begin construction on the hotels. Annual rent under the lease is $300,000 with adjustments throughout the lease term based on the Consumer Price Index. As there are many conditions to beginning construction on the hotels, there are no assurances that the Company will construct the hotels or continue the lease.
S-22
Impact of Inflation Operators of hotels, in general, possess the ability to adjust room rates daily to reflect the effects of inflation. Competitive pressures may, however, limit the operators’ ability to raise room rates. Currently the Company is not experiencing any material impact from inflation. Business Interruption Being in the real estate industry, the Company is exposed to natural disasters on both a local and national scale. Although management believes there is adequate insurance to cover this exposure, there can be no assurance that such events will not have a material adverse effect on the Company’s financial position or results of operations. Seasonality The hotel industry historically has been seasonal in nature. Seasonal variations in occupancy at the Company’s hotels may cause quarterly fluctuations in its revenues. To the extent that cash flow from operations is insufficient during any quarter, due to temporary or seasonal fluctuations in revenue, the Company expects to utilize cash on hand to make distributions. Recent Accounting Pronouncements In June 2009, the Financial Accounting Standards Board (“FASB”) issued a pronouncement (Accounting Standards Update No. 2009-17) which amends its guidance surrounding a company’s analysis to determine whether any of its variable interests constitute controlling financial interests in a variable interest entity. This analysis identifies the primary beneficiary of a variable interest entity as the enterprise that has both of the following characteristics: (a) the power to direct the activities of a variable interest entity that most significantly impact the entity’s economic performance, and (b) the obligation to absorb losses of the entity that could potentially be significant to the variable interest entity or the right to receive benefits from the entity that could potentially be significant to the variable interest entity. Additionally, an enterprise is required to assess whether it has an implicit financial responsibility to ensure that a variable interest entity operates as designed when determining whether it has the power to direct the activities of the variable interest entity that most significantly impact the entity’s economic performance. The new pronouncement also requires ongoing assessments of whether an enterprise is the primary beneficiary of a variable interest entity and enhanced disclosure about an enterprise’s involvement with a variable interest entity. This pronouncement was adopted by the Company in the first quarter of 2010. The adoption of this standard did not have a material impact on the Company’s consolidated financial statements. Subsequent Events In July 2010, the Company declared and paid approximately $9.85 million in dividend distributions to its common shareholders, or $0.073334 per outstanding common share. During July 2010, the Company closed on the issuance of 8.3 million Units through its ongoing best-efforts offering, representing gross proceeds to the Company of $91.5 million and proceeds net of selling and marketing costs of $82.3 million. In July 2010, the Company redeemed 212,804 Units in the amount of $2.2 million under its Unit Redemption Program. Subsequent to June 30, 2010, the Company closed on the purchase of four hotels. The following table summarizes the hotel information. All dollar amounts are in thousands. S-23
Location Brand Gross Rooms Date of Ft. Worth, TX TownePlace Suites $ 18,435 140 7/19/2010 Lafayette, LA Hilton Garden Inn (a) 153 7/30/2010 West Monroe, LA Hilton Garden Inn (a) 134 7/30/2010 Silver Spring, MD Hilton Garden Inn 17,400 107 7/30/2010 $ 68,735 534
Purchase Price
Purchase
| ||||||||||||||||||||
(a) |
|
| The total purchase price for these two hotels is $32.9 million. | |||||||||||||||||
S-24
Financial Statements of Company Apple REIT Nine, Inc. (Unaudited) Consolidated Balance Sheets—June 30, 2010 and December 31, 2009 F-2 Consolidated Statements of Operations—Three and six months ended June 30, 2010 and 2009 F-3 Consolidated Statements of Cash Flows—Six months ended June 30, 2010 and 2009 F-4 F-5 F-1
APPLE REIT NINE, INC. June 30, December 31, (unaudited) ASSETS Investment in real estate, net of accumulated depreciation of $30,762 and $18,213, respectively $ 907,610 $ 687,509 Cash and cash equivalents 358,261 272,913 Due from third party managers, net 6,927 2,591 Other assets, net 22,934 19,500 Total Assets $ 1,295,732 $ 982,513 LIABILITIES Notes payable $ 58,059 $ 58,688 Accounts payable and accrued expenses 6,142 6,420 Total Liabilities 64,201 65,108 Shareholders’ Equity Preferred stock, authorized 30,000,000 shares; none issued and outstanding — — Series A preferred stock, no par value, authorized 400,000,000 shares; issued and outstanding 134,356,683 and 98,509,650 shares, respectively — — Series B convertible preferred stock, no par value, authorized 480,000 shares; issued and outstanding 480,000 shares, respectively 48 48 Common stock, no par value, authorized 400,000,000 shares; issued and outstanding 134,356,683 and 98,509,650 shares, respectively 1,323,312 968,710 Distributions greater than net income (91,829 ) (51,353 ) Total Shareholders’ Equity 1,231,531 917,405 Total Liabilities and Shareholders’ Equity $ 1,295,732 $ 982,513 See accompanying notes to consolidated financial statements. The Company was initially capitalized on November 9, 2007 and commenced operations on July 31, 2008. F-2
CONSOLIDATED BALANCE SHEETS
(in thousands, except
share data)
2010
2009
APPLE REIT NINE, INC. Three Months Ended Six Months Ended 2010 2009 2010 2009 Revenues: Room revenue $ 32,252 $ 19,195 $ 56,345 $ 35,832 Other revenue 3,375 2,313 5,758 4,359 Total hotel revenue 35,627 21,508 62,103 40,191 Rental revenue 5,343 5,076 10,640 5,076 Total revenue 40,970 26,584 72,743 45,267 Expenses: Operating expense 9,726 5,512 17,315 10,366 Hotel administrative expense 2,708 1,619 4,892 3,027 Sales and marketing 3,080 1,863 5,477 3,548 Utilities 1,573 945 2,968 1,813 Repair and maintenance 1,543 882 2,775 1,794 Franchise fees 1,367 904 2,371 1,692 Management fees 1,129 665 1,947 1,336 Taxes, insurance and other 2,341 1,686 4,471 3,031 General and administrative 1,765 1,059 3,075 1,898 Acquisition related costs 3,349 1,435 5,500 2,463 Depreciation expense 6,851 3,736 12,549 6,388 Total expenses 35,432 20,306 63,340 37,356 Operating income 5,538 6,278 9,403 7,911 Interest expense, net (220 ) (545 ) (304 ) (628 ) Net income $ 5,318 $ 5,733 $ 9,099 $ 7,283 Basic and diluted net income per common share $ 0.04 $ 0.10 $ 0.08 $ 0.14 Weighted average common shares outstanding—basic and diluted 122,696 58,320 113,781 51,972 Distributions declared and paid per common share $ 0.22 $ 0.22 $ 0.44 $ 0.44 See accompanying notes to consolidated financial statements. The Company was initially capitalized on November 9, 2007 and commenced operations on July 31, 2008. F-3
CONSOLIDATED STATEMENTS OF OPERATIONS
(in thousands, except per share data)
(Unaudited)
June 30,
June 30,
APPLE REIT NINE, INC. Six Months Ended 2010 2009 Cash flows from operating activities: Net income $ 9,099 $ 7,283 Adjustments to reconcile net income to cash provided by operating activities: Depreciation 12,549 6,388 Amortization of deferred financing costs, fair value adjustments and other non-cash expenses, net 186 194 Straight-line rental income (3,011 ) (1,469 ) Changes in operating assets and liabilities: Increase in funds due from third party managers, net (4,300 ) (1,951 ) Decrease (increase) in other assets, net 708 (1,605 ) Increase in accounts payable and accrued expenses 429 2,252 Net cash provided by operating activities 15,660 11,092 Cash flows used in investing activities: Cash paid for acquisitions, net (223,671 ) (221,494 ) Deposits and other disbursements for potential acquisitions, net (1,363 ) 269 Capital improvements (9,574 ) (2,261 ) Increase in capital improvement reserves (69 ) (280 ) Investment in other assets — (3,240 ) Net cash used in investing activities (234,677 ) (227,006 ) Cash flows from financing activities: Net proceeds related to issuance of common shares 357,551 252,201 Redemptions of common stock (3,144 ) — Distributions paid to common shareholders (49,575 ) (22,514 ) Payments of notes payable (466 ) (311 ) Deferred financing costs (1 ) (300 ) Net cash provided by financing activities 304,365 229,076 Increase in cash and cash equivalents 85,348 13,162 Cash and cash equivalents, beginning of period 272,913 75,193 Cash and cash equivalents, end of period $ 358,261 $ 88,355 Non-cash transactions: Notes payable assumed in acquisitions $ — $ 19,284 See accompanying notes to consolidated financial statements. The Company was initially capitalized on November 9, 2007 and commenced operations on July 31, 2008. F-4
CONSOLIDATED STATEMENTS OF CASH FLOWS
(in thousands)
(Unaudited)
June 30,
APPLE REIT NINE, INC. 1. Basis of Presentation The accompanying unaudited consolidated financial statements have been prepared in accordance with the rules and regulations for reporting on Form 10-Q. Accordingly, they do not include all of the information required by accounting principles generally accepted in the United States for complete financial statements. In the opinion of management, all adjustments (consisting of normal recurring accruals) considered necessary for a fair presentation have been included. These unaudited financial statements should be read in conjunction with the Company’s audited consolidated financial statements included in its 2009 Annual Report on Form 10-K. Operating results for the three and six months ended June 30, 2010 are not necessarily indicative of the results that may be expected for the twelve month period ending December 31, 2010. 2. General Information and Summary of Significant Accounting Policies Organization Apple REIT Nine, Inc. together with its wholly owned subsidiaries (the “Company”) is a Virginia corporation that has elected to be treated as a real estate investment trust (“REIT”) for federal income tax purposes. The Company was formed to invest in hotels, residential apartment communities and other income-producing real estate in selected metropolitan areas in the United States. Initial capitalization occurred on November 9, 2007, when 10 Units, each Unit consisting of one common share and one Series A preferred share, were purchased by Apple Nine Advisors, Inc. (“A9A”) and 480,000 Series B convertible preferred shares were purchased by Glade M. Knight, the Company’s Chairman and Chief Executive Officer. The Company began operations on July 31, 2008 when it purchased its first hotel. The Company’s fiscal year end is December 31. The Company has no foreign operations or assets and its operating structure includes two segments, hotels and a ground lease. The consolidated financial statements include the accounts of the Company and its subsidiaries. All intercompany accounts and transactions have been eliminated. As of June 30, 2010, the Company owned 44 hotels (11 purchased during the first six months of 2010, 12 acquired in 2009 and 21 acquired during 2008). The Company’s real estate portfolio also includes approximately 410 acres of land and improvements located on 111 sites in the Ft. Worth, Texas area (acquired in April 2009) that are being leased to a subsidiary of Chesapeake Energy Corporation (“Chesapeake”) for the production of natural gas. Significant Accounting Policies Use of Estimates The preparation of the financial statements in conformity with generally accepted accounting principles requires management to make estimates and assumptions that affect the amounts reported in the consolidated financial statements and accompanying notes. Actual results could differ from those estimates. Other Assets Included in other assets, net on the Company’s consolidated balance sheet is a 24% ownership interest in Apple Air Holding, LLC (“Apple Air”), purchased by the Company for $3.2 million in cash in January 2009. The other members of Apple Air are Apple REIT Six, Inc., Apple REIT Seven, Inc. and Apple REIT Eight, Inc. The interest was purchased to allow the Company access to two Lear jets for acquisition, asset management and renovation purposes. The Company has recorded its share of income and losses of the entity under the equity method of accounting and adjusted its investment in Apple Air accordingly. The Company’s ownership interest was approximately $2.6 million and $2.8 million at June 30, 2010 and December 31, 2009, respectively. F-5
NOTES TO CONSOLIDATED FINANCIAL STATEMENTS
APPLE REIT NINE, INC. For the three months ended June 30, 2010 and 2009, the Company recorded a loss of approximately $104,000 and $105,000, respectively. For the six months ended June 30, 2010 and 2009, the Company recorded a loss of approximately $213,000 and $205,000, respectively, as its share of the net loss of Apple Air, which primarily relates to the depreciation of the aircraft. The loss is included in general and administrative expense in the Company’s consolidated statements of operations. Offering Costs The Company is raising capital through a best-efforts offering of its Units by David Lerner Associates, Inc., the managing underwriter, which receives a selling commission and a marketing expense allowance based on proceeds of the Units sold. Additionally, the Company has incurred other offering costs including legal, accounting and reporting services. These offering costs are recorded by the Company as a reduction of shareholders’ equity. As of June 30, 2010, the Company had sold 134.9 million Units for gross proceeds of $1.5 billion and proceeds net of offering costs of $1.3 billion. On April 15, 2010, the Company extended its best-efforts offering until April 25, 2011. As a result, the offering will continue until all Units have been sold or until April 25, 2011, whichever occurs sooner. Rental Income During April 2009, the Company entered into a ground lease with a subsidiary of Chesapeake, the second-largest independent producer of natural gas in the United States and guarantor of the lease. The lease has an initial term of 40 years with five renewal options of five years each, exercisable by the tenant. Rental payments are fixed and have determinable rent increases during the initial lease term and reset to market during the first year of the renewal period. Rental payments are required to be made monthly in advance. Under the lease, the tenant is responsible for all operating costs associated with the land including, maintenance, insurance, property taxes, environmental, zoning, permitting, etc. and the tenant is required to maintain the land in good condition. The lease is classified as an operating lease and rental income is recognized on a straight line basis over the initial term of the lease. Rental revenue includes $1.5 million of adjustments to record rent on the straight line basis for the three months ended June 30, 2010 and 2009, and $3.0 million and $1.5 million of adjustments to record rent on the straight line basis for the six months ended June 30, 2010 and 2009. Straight line rental receivable is included in other assets, net in the Company’s consolidated balance sheets and totaled $7.6 million and $4.6 million as of June 30, 2010 and December 31, 2009, respectively. Earnings Per Common Share Basic earnings per common share is computed as net income divided by the weighted average number of common shares outstanding during the period. Diluted earnings per share is calculated after giving effect to all potential common shares that were dilutive and outstanding for the period. There were no shares with a dilutive effect for the three and six months ended June 30, 2010 or 2009. As a result, basic and dilutive outstanding shares were the same. Series B convertible preferred shares are not included in earnings per common share calculations until such time that such shares are converted to common shares. Recent Accounting Pronouncements In June 2009, the Financial Accounting Standards Board (“FASB”) issued a pronouncement (Accounting Standards Update No. 2009-17) which amends its guidance surrounding a company’s analysis to determine whether any of its variable interests constitute controlling financial interests in a variable interest entity. This analysis identifies the primary beneficiary of a variable interest entity as the enterprise that has both of the following characteristics: (a) the power to direct the activities F-6
NOTES TO CONSOLIDATED FINANCIAL STATEMENTS—(Continued)
APPLE REIT NINE, INC. of a variable interest entity that most significantly impact the entity’s economic performance, and (b) the obligation to absorb losses of the entity that could potentially be significant to the variable interest entity or the right to receive benefits from the entity that could potentially be significant to the variable interest entity. Additionally, an enterprise is required to assess whether it has an implicit financial responsibility to ensure that a variable interest entity operates as designed when determining whether it has the power to direct the activities of the variable interest entity that most significantly impact the entity’s economic performance. The new pronouncement also requires ongoing assessments of whether an enterprise is the primary beneficiary of a variable interest entity and enhanced disclosure about an enterprise’s involvement with a variable interest entity. This pronouncement was adopted by the Company in the first quarter of 2010. The adoption of this standard did not have a material impact on the Company’s consolidated financial statements. 3. Real Estate Investments Hotel Acquisitions The Company acquired 11 hotels during the first six months of 2010. The following table sets forth the location, brand, manager, gross purchase price, number of hotel rooms and date of purchase by the Company for each property. All dollar amounts are in thousands. Location Brand Manager Gross Purchase Price Rooms Date of Purchase Houston, TX Marriott Western $ 50,750 206 1/8/2010 Albany, GA Fairfield Inn & Suites LBA 7,920 87 1/14/2010 (a) Panama City, FL TownePlace Suites LBA 10,640 103 1/19/2010 Clovis, CA Homewood Suites Dimension 12,435 83 2/2/2010 Jacksonville, NC TownePlace Suites LBA 9,200 86 2/16/2010 Miami, FL Hampton Inn & Suites Dimension 11,900 121 4/9/2010 Anchorage, AK Embassy Suites Stonebridge 42,000 169 4/30/2010 Boise, ID Hampton Inn & Suites Raymond 22,370 186 4/30/2010 Rogers, AR Homewood Suites Raymond 10,900 126 4/30/2010 St. Louis, MO Hampton Inn & Suites Raymond 16,000 126 4/30/2010 Oklahoma City, OK Hampton Inn & Suites Raymond 32,657 200 5/28/2010 Total $ 226,772 1,493
NOTES TO CONSOLIDATED FINANCIAL STATEMENTS—(Continued)
| ||||||||||||||||||||
(a) |
|
| Purchase contract includes a provision for an additional $500,000 to be paid to the seller if certain earnings targets are met over the 15 months subsequent to acquisition. | |||||||||||||||||
The purchase price for these properties was funded primarily by the Company’s on-going best-efforts offering of Units. The Company also used the proceeds of its on-going best-efforts offering to pay approximately $5.5 million in acquisition related costs, including $4.5 million, representing 2% of the gross purchase price for these properties, as a brokerage commission to Apple Suites Realty Group, Inc. (“ASRG”), 100% owned by Glade M. Knight, the Company’s Chairman and Chief Executive Officer, and approximately $1.0 million in other acquisition related costs, including title, legal and other related costs. These costs are included in acquisition related costs in the Company’s consolidated statements of operations for the six months ended June 30, 2010.
The Company leases all of its hotels to its wholly-owned taxable REIT subsidiary (or a subsidiary thereof) under master hotel lease agreements.
No goodwill was recorded in connection with any of the acquisitions.
As of June 30, 2010, the Company owned 44 hotels, located in 20 states with an aggregate of 5,393 rooms and consisted of the following: seven Hilton Garden Inn hotels, five Homewood Suites
F-7
APPLE REIT NINE, INC. hotels, 15 Hampton Inn hotels, five Courtyard hotels, three Residence Inn hotels, two SpringHill Suites hotels, three Fairfield Inn hotels, two TownePlace Suites hotels, one Embassy Suites hotel, and one full service Marriott hotel. Additionally, the Company is in the process of constructing a SpringHill Suites hotel in Alexandria, Virginia which is expected to be completed over the next nine months. Upon completion, it is expected that the hotel will contain approximately 152 guest rooms and will be managed by Marriott. To date the Company has incurred approximately $4.8 million in construction costs and anticipates the total construction costs to be approximately $20-$25 million. Land and Land Improvements In February 2010, the Company agreed to sell back to Chesapeake two of the 113 sites originally purchased from Chesapeake in April 2009 and release Chesapeake from their associated lease obligation. The sales price for the two sites was equal to the Company’s original purchase price, approximately $2.6 million. The Company earned and received rental income for the period held totaling approximately $240,000. As of June 30, 2010, the Company owned approximately 410 acres of land and land improvements located on 111 sites in the Ft. Worth, Texas area that are being leased to Chesapeake for the production of natural gas. Chesapeake is a publicly held company that is traded on the New York Stock Exchange. Chesapeake is the second-largest independent producer of natural gas in the United States with interests in approximately 38,000 net drill sites. The land and land improvements were acquired in the second quarter of 2009. The purchase price allocation for the acquisition was not completed until the fourth quarter of 2009. As a result, depreciation expense for the three and six month periods have been increased by approximately $614,000 as compared to amounts reported in the 2009 second quarter Form 10-Q. Total Real Estate Investments At June 30, 2010, the Company’s investment in real estate consisted of the following (in thousands):
NOTES TO CONSOLIDATED FINANCIAL STATEMENTS—(Continued)
Land
$
133,460
Land Improvements
95,983
Building and Improvements
648,418
Furniture, Fixtures and Equipment
55,668
Construction in Progress
4,843
938,372
Less Accumulated Depreciation
(30,762
)
Investment in real estate, net
$
907,610
As of June 30, 2010, the Company had outstanding contracts for the potential purchase of 11 additional hotels for a total purchase price of $169.2 million. Of these 11 hotels, five are under construction and should be completed over the next 15 months. The other six hotels are expected to close within the next six months. Although the Company is working towards acquiring these hotels, there are many conditions to closing that have not yet been satisfied and there can be no assurance that closings will occur under the outstanding purchase contracts. The following table summarizes the location, brand, number of rooms, refundable (if the seller does not meet its obligations under the contract) contract deposits paid, and gross purchase price for each of the contracts. All dollar amounts are in thousands.
F-8
APPLE REIT NINE, INC. Location Brand Rooms Deposits Paid Gross Purchase Price Holly Springs, NC Hampton Inn 124 $ 100 $ 14,880 (a) Ft. Worth, TX TownePlace Suites 140 500 18,435 (a)/(b) Jacksonville, NC Fairfield Inn & Suites 79 125 7,800 Santa Ana, CA Courtyard 155 100 24,800 (a) Rogers, AR Hampton Inn 122 125 9,600 St. Louis, MO Hampton Inn 190 125 23,000 Kansas City, MO Hampton Inn 122 125 10,130 Lafayette, LA SpringHill Suites 103 3 10,232 (a)/(b) Lafayette, LA Hilton Garden Inn 153 150 (c) West Monroe, LA Hilton Garden Inn 134 150 (c) Silver Spring, MD Hilton Garden Inn 107 150 17,400 (a) 1,429 $ 1,653 $ 169,177
NOTES TO CONSOLIDATED FINANCIAL STATEMENTS—(Continued)
| ||||||||||||||||||||
(a) |
|
| The hotels are currently under construction. The table shows the expected number of rooms upon hotel completion and the expected franchise. | |||||||||||||||||
| ||||||||||||||||||||
(b) |
| If the seller meets all of the conditions to closing, the Company is obligated to specifically perform under the contract. As the properties are under construction, at this time, the seller has not met all of the conditions to closing. | ||||||||||||||||||
| ||||||||||||||||||||
(c) |
| The total purchase price for these two hotels is $32.9 million. | ||||||||||||||||||
Three of the hotels under contract require the Company to assume approximately $29.0 million in mortgage debt. Each of these loans provide for monthly payments of principal and interest on an amortized basis.
As there can be no assurance that all conditions to closing will be satisfied, the Company includes deposits paid for hotels under contract in other assets, net in the Company’s consolidated balance sheets, and in deposits and other disbursements for potential acquisitions in the Company’s consolidated statements of cash flows. It is anticipated that the purchase price (less any debt assumed) for the outstanding contracts will be funded from the proceeds of the Company’s on-going best-efforts offering of Units and cash on hand if a closing occurs.
On October 14, 2009, the Company entered into a ground lease for approximately one acre of land located in downtown Richmond, Virginia. The lease terminates on December 31, 2098, subject to the Company’s right to exercise two renewal periods of ten years each. The Company intends to use the land to build two nationally recognized brand hotels. Under the terms of the lease the Company has a “Study Period” to determine the viability of the hotels. The Company can terminate the lease for any reason during the Study Period, which originally ended on April 14, 2010, and was extended for six months to October 14, 2010. After the Study Period, the lease continues to be subject to various conditions, including but not limited to obtaining various permits, licenses, zoning variances and franchise approvals. If any of these conditions are not met the Company has the right to terminate the lease at any time. Rent payments are not required until the Company decides to begin construction on the hotels. Annual rent under the lease is $300,000 with adjustments throughout the lease term based on the Consumer Price Index. As there are many conditions to beginning construction on the hotels, there are no assurances that the Company will construct the hotels or continue the lease.
4. Notes Payable
In conjunction with the acquisition of seven hotel properties, the Company assumed approximately $57.6 million in debt. The following table summarizes the hotel location, interest rate,
F-9
APPLE REIT NINE, INC. maturity date and the principal amount assumed associated with each note payable outstanding as of June 30, 2010 and December 31, 2009. All dollar amounts are in thousands. Location Brand Interest Maturity Principal Outstanding Outstanding Lewisville, TX Hilton Garden Inn 0.00 % 12/31/2016 $ 3,750 $ 3,750 $ 3,750 Duncanville, TX Hilton Garden Inn 5.88 % 5/11/2017 13,966 13,658 13,754 Allen, TX Hilton Garden Inn 5.37 % 10/11/2015 10,787 10,493 10,585 Bristol, VA Courtyard 6.59 % 8/1/2016 9,767 9,577 9,640 Round Rock, TX Hampton Inn 5.95 % 5/1/2016 4,175 4,064 4,110 Austin, TX Homewood Suites 5.99 % 3/1/2016 7,556 7,364 7,448 Austin, TX Hampton Inn 5.95 % 3/1/2016 7,553 7,360 7,445 $ 57,554 $ 56,266 $ 56,732
NOTES TO CONSOLIDATED FINANCIAL STATEMENTS—(Continued)
Rate (1)
Date
Assumed
balance as of
June 30, 2010
balance as of
December 31,
2009
| ||||||||||||||||||||
(1) |
|
| At acquisition, the Company adjusted the interest rates on these loans to market rates and is amortizing the adjustments to interest expense over the life of the loan. | |||||||||||||||||
The Company estimates the fair value of its debt by discounting the future cash flows of each instrument at estimated market rates consistent with the maturity of the debt obligation with similar credit policies. Market rates take into consideration general market conditions and maturity. As of June 30, 2010, the carrying value and estimated fair value of the Company’s debt was $58.1 million and $53.7 million. As of December 31, 2009, the carrying value and estimated fair value of the Company’s debt was $58.7 million and $56.7 million. The carrying value of the Company’s other financial instruments approximates fair value due to the short-term nature of these financial instruments.
5. Related Parties
The Company has significant transactions with related parties. These transactions cannot be construed to be at arm’s length and the results of the Company’s operations may be different than if conducted with non-related parties.
The Company has a contract with ASRG, to acquire and dispose of real estate assets for the Company. A fee of 2% of the gross purchase price or gross sale price in addition to certain reimbursable expenses is paid to ASRG for these services. As of June 30, 2010, payments to ASRG for services under the terms of this contract have totaled approximately $18.0 million since inception.
The Company is party to an advisory agreement with A9A to provide management services to the Company. An annual fee ranging from 0.1% to 0.25% of total equity proceeds received by the Company, in addition to certain reimbursable expenses, are payable for these services. A9A has entered into an agreement with Apple REIT Six, Inc. (“AR6”) to provide certain management services to the Company. The Company will reimburse A9A for the cost of the services provided by AR6. A9A will in turn reimburse AR6. Total advisory fees and reimbursable expenses incurred by the Company under the advisory agreement are included in general and administrative expenses and totaled approximately $1.7 million and $956,000 for the six months ended June 30, 2010 and 2009. Of this total expense $623,000 and $283,000 were fees paid to A9A and $1.04 million and $673,000 were expenses reimbursed by A9A to AR6 for the six months ended June 30, 2010 and 2009.
ASRG and A9A are 100% owned by Glade M. Knight, Chairman and Chief Executive Officer of the Company.
F-10
APPLE REIT NINE, INC. Mr. Knight is also Chairman and Chief Executive Officer of AR6, Apple REIT Seven, Inc. and Apple REIT Eight, Inc. Members of the Company’s Board of Directors are also on the Board of Directors of AR6, Apple REIT Seven, Inc. and Apple REIT Eight, Inc. 6. Shareholders’ Equity The Company has a Unit Redemption Program to provide limited interim liquidity to its shareholders who have held their Units for at least one year. Shareholders may request redemption of Units for a purchase price equal to 92% of the price paid per Unit if the Units have been owned for less than three years, or 100% of the price paid per Unit if the Units have been owned more than three years. The maximum number of Units that may be redeemed in any given year will be three percent of the weighted average number of Units outstanding during the 12-month period immediately prior to the date of redemption. The Company reserves the right to change the purchase price of redemptions, reject any request for redemption, or otherwise amend the terms of, suspend, or terminate the Unit Redemption Program. During the six months ended June 30, 2010, the Company redeemed 306,753 Units in the amount of $3.1 million under the program. There were no redemptions in the first six months of 2009. 7. Series B Convertible Preferred Stock The Company has issued 480,000 Series B convertible preferred shares to Glade M. Knight, Chairman and Chief Executive Officer of the Company, in exchange for the payment by him of $0.10 per Series B convertible preferred share, or an aggregate of $48,000. The Series B convertible preferred shares are convertible into common shares pursuant to the formula and on the terms and conditions set forth below. There are no dividends payable on the Series B convertible preferred shares. Holders of more than two-thirds of the Series B convertible preferred shares must approve any proposed amendment to the articles of incorporation that would adversely affect the Series B convertible preferred shares. Upon the Company’s liquidation, the holder of the Series B convertible preferred shares is entitled to a priority liquidation payment before any distribution of liquidation proceeds to the holders of the common shares. However, the priority liquidation payment of the holder of the Series B convertible preferred shares is junior to the holders of the Series A preferred shares distribution rights. The holder of a Series B convertible preferred share is entitled to a liquidation payment of $11 per number of common shares each Series B convertible preferred share would be convertible into according to the formula described below. In the event that the liquidation of the Company’s assets results in proceeds that exceed the distribution rights of the Series A preferred shares and the Series B convertible preferred shares, the remaining proceeds will be distributed between the common shares and the Series B convertible preferred shares, on an as converted basis. Each holder of outstanding Series B convertible preferred shares shall have the right to convert any of such shares into common shares of the Company upon and for 180 days following the occurrence of any of the following events: (1) substantially all of the Company’s assets, stock or business is sold or transferred through exchange, merger, consolidation, lease, share exchange, sale or otherwise, other than a sale of assets in liquidation, dissolution or winding up of the Company; (2) the termination or expiration without renewal of the advisory agreement with A9A, or if the Company ceases to use ASRG to provide property acquisition and disposition services; or (3) the Company’s common shares are listed on any securities exchange or quotation system or in any established market. F-11
NOTES TO CONSOLIDATED FINANCIAL STATEMENTS—(Continued)
APPLE REIT NINE, INC. Upon the occurrence of any conversion event, each Series B convertible preferred share may be converted into a number of common shares based upon the gross proceeds raised through the date of conversion in the Company’s $2 billion offering according to the following table:
NOTES TO CONSOLIDATED FINANCIAL STATEMENTS—(Continued)
Gross Proceeds Raised from Sales of
Units through Date of Conversion
Number of Common Shares
through Conversion of
One Series B Convertible Preferred
Share
$1.4 billion
16.93696
$1.5 billion
18.14264
$1.6 billion
19.34832
$1.7 billion
20.55400
$1.8 billion
21.75968
$1.9 billion
22.96537
$ 2 billion
24.17104
In the event that after raising gross proceeds of $2 billion, the Company raises additional gross proceeds in a subsequent public offering, each Series B convertible preferred share may be converted into an additional number of common shares based on the additional gross proceeds raised through the date of conversion in a subsequent public offering according to the following formula: (X/100 million)´ 1.20568, where X is the additional gross proceeds rounded down to the nearest 100 million.
No additional consideration is due upon the conversion of the Series B convertible preferred shares. The conversion into common shares of the Series B convertible preferred shares will result in dilution of the shareholders’ interests.
Expense related to the issuance of 480,000 Series B convertible preferred shares to Mr. Knight will be recognized at such time when the number of common shares to be issued for conversion of the Series B shares can be reasonably estimated and the event triggering the conversion of the Series B shares to common shares occurs. The expense will be measured as the difference between the fair value of the common stock for which the Series B shares can be converted and the amounts paid for the Series B shares. Although the fair market value cannot be determined at this time, expense if the maximum offering is achieved could range from $0 to in excess of $127 million (assumes $11 per unit fair market value). Based on equity raised through June 30, 2010, if a triggering event had occurred, expense would have ranged from $0 to $89.4 million (assumes $11 per unit fair market value) and approximately 8.1 million common shares would have been issued.
8. Industry Segments
The Company has two reportable segments: hotel investments and real estate leased under a long-term triple-net lease. The Company owns extended-stay and limited service hotel properties throughout the United States that generate rental and other property related income. The Company separately evaluates the performance of each of its hotel properties. However, because each of the hotels has similar economic characteristics, facilities, and services, and each hotel is not individually significant, the properties have been aggregated into a single operating segment. In addition, the Company owns approximately 410 acres of land and land improvements on 111 sites in the Ft. Worth, Texas area (acquired in April 2009) that is leased to a tenant for the production of natural gas. Under the ground lease, the Company receives monthly rental payments. Prior to the acquisition of the land in Ft. Worth, Texas, the Company’s only reportable segment was hotel investments. The Company does not allocate corporate-level accounts to its operating segments, including corporate general and administrative expenses, non-operating interest income and interest expense. The following table summarizes the results of operations and assets for each segment for the three and six months ending June 30, 2010 and 2009. Dollar amounts are in thousands.
F-12
APPLE REIT NINE, INC. For the three months ended June 30, 2010 Hotels Ground Lease Corporate Consolidated Total revenue $ 35,627 $ 5,343 $ — $ 40,970 Operating expenses 23,440 27 — 23,467 Acquisition related costs 3,349 — — 3,349 Depreciation expense 6,251 600 — 6,851 General and administrative — — 1,765 1,765 Operating income/(loss) 2,587 4,716 (1,765 ) 5,538 Interest income — — 400 400 Interest expense (620 ) — — (620 ) Net income/(loss) $ 1,967 $ 4,716 $ (1,365 ) $ 5,318 For the six months ended June 30, 2010 Hotels Ground Lease Corporate Consolidated Total revenue $ 62,103 $ 10,640 $ — $ 72,743 Operating expenses 42,162 54 — 42,216 Acquisition related costs 5,500 — — 5,500 Depreciation expense 11,391 1,158 — 12,549 General and administrative — — 3,075 3,075 Operating income/(loss) 3,050 9,428 (3,075 ) 9,403 Interest income — — 836 836 Interest expense (1,140 ) — — (1,140 ) Net income/(loss) $ 1,910 $ 9,428 $ (2,239 ) $ 9,099 Total assets as of June 30, 2010 $ 778,133 $ 153,315 $ 364,284 $ 1,295,732 For the three months ended June 30, 2009 Hotels Ground Lease Corporate Consolidated Total revenue $ 21,508 $ 5,076 $ — $ 26,584 Operating expenses 14,050 26 — 14,076 Acquisition related costs 1,435 — — 1,435 Depreciation expense 3,122 614 — 3,736 General and administrative — — 1,059 1,059 Operating income/(loss) 2,901 4,436 (1,059 ) 6,278 Interest income — — 148 148 Interest expense (693 ) — — (693 ) Net income/(loss) $ 2,208 $ 4,436 $ (911 ) $ 5,733 For the six months ended June 30, 2009 Hotels Ground Lease Corporate Consolidated Total revenue $ 40,191 $ 5,076 $ — $ 45,267 Operating expenses 26,581 26 — 26,607 Acquisition related costs 2,463 — — 2,463 Depreciation expense 5,774 614 — 6,388 General and administrative — — 1,898 1,898 Operating income/(loss) 5,373 4,436 (1,898 ) 7,911 Interest income — — 588 588 Interest expense (1,216 ) — — (1,216 ) Net income/(loss) $ 4,157 $ 4,436 $ (1,310 ) $ 7,283 Total assets as of June 30, 2009 $ 442,904 $ 152,103 $ 94,657 $ 689,664 F-13
NOTES TO CONSOLIDATED FINANCIAL STATEMENTS—(Continued)
APPLE REIT NINE, INC. 9. Significant Tenant A subsidiary of Chesapeake Energy Corporation leases properties with carrying values that represent approximately 12% of the Company’s total assets, at cost, as of June 30, 2010. The following table presents summary financial information for Chesapeake Energy Corporation, which is a guarantor of the lease, as of June 30, 2010 and December 31, 2009, and for the three and six months ended June 30, 2010 and 2009, as reported in its June 30, 2010 Earnings Release on Form 8-K furnished with the Securities and Exchange Commission (the “SEC”). Chesapeake Energy Corporation Consolidated Balance Sheet Data: June 30, December 31, Current assets $ 3,018 $ 2,446 Noncurrent assets 29,151 27,468 Current liabilities 3,655 2,688 Noncurrent liabilities 13,699 14,885 Total equity 14,815 12,341 Consolidated Statements of Income Data: Three Months Ended Six Months Ended 2010 2009 2010 2009 Total revenues $ 2,012 $ 1,673 $ 4,810 $ 3,668 Total operating costs 1,565 1,249 3,151 12,297 Operating income/(loss) 447 424 1,659 (8,629 ) Net income/(loss) 255 243 993 (5,498 ) Consolidated Statements of Cash Flows Data: Six Months Ended June 30, 2010 2009 Cash provided by operating activities $ 2,978 $ 1,998 Cash used in investing activities (3,732 ) (3,465 ) Cash provided by financing activities 1,048 272 Net increase (decrease) in cash and cash equivalents 294 (1,195 ) Cash and cash equivalents, beginning of period 307 1,749 Cash and cash equivalents, end of period 601 554 The summary financial information of Chesapeake Energy Corporation is presented to comply with applicable accounting regulations of the SEC. References in these financials statements to the financial statements furnished with the SEC for Chesapeake Energy Corporation are included as textual references only, and the information in Chesapeake Energy Corporation’s filing is not incorporated by reference into these financial statements. 10. Pro Forma Information (unaudited) The following unaudited pro forma information for the three and six months ended June 30, 2010 and 2009 is presented as if the acquisitions of the Company’s hotels acquired after F-14
NOTES TO CONSOLIDATED FINANCIAL STATEMENTS—(Continued)
Selected Financial Data
(In millions)
2010
2009
June 30,
June 30,
APPLE REIT NINE, INC. December 31, 2008, had occurred on the latter of January 1, 2009 or the opening date of the hotel. The pro forma information does not purport to represent what the Company’s results of operations would actually have been if such transactions, in fact, had occurred on these applicable dates, nor does it purport to represent the results of operations for future periods. Amounts are in thousands, except per share data. Three Months Ended June 30, Six Months Ended June 30, 2010 2009 2010 2009 Total revenues $ 43,629 $ 35,438 $ 83,050 $ 64,013 Net income 9,161 8,413 14,704 7,636 Net income per share—basic and diluted $ 0.07 $ 0.12 $ 0.13 $ 0.13 The pro forma information reflects adjustments for actual revenues and expenses of the 23 hotels acquired during 2009 and 2010 for the respective period prior to acquisition by the Company. Net income has been adjusted as follows: (1) interest income and expense have been adjusted to reflect the reduction in cash and cash equivalents required to fund the acquisitions; (2) interest expense related to prior owners’ debt which was not assumed has been eliminated; (3) depreciation has been adjusted based on the Company’s basis in the hotels; and (4) transaction costs have been adjusted for the acquisition of existing businesses. 11. Subsequent Events In July 2010, the Company declared and paid approximately $9.85 million in dividend distributions to its common shareholders, or $0.073334 per outstanding common share. During July 2010, the Company closed on the issuance of 8.3 million Units through its ongoing best-efforts offering, representing gross proceeds to the Company of $91.5 million and proceeds net of selling and marketing costs of $82.3 million. In July 2010, the Company redeemed 212,804 Units in the amount of $2.2 million under its Unit Redemption Program. Subsequent to June 30, 2010, the Company closed on the purchase of four hotels. The following table summarizes the hotel information. All dollar amounts are in thousands. Location Brand Gross Rooms Date of Ft. Worth, TX TownePlace Suites $ 18,435 140 7/19/2010 Lafayette, LA Hilton Garden Inn (a ) 153 7/30/2010 West Monroe, LA Hilton Garden Inn (a ) 134 7/30/2010 Silver Spring, MD Hilton Garden Inn 17,400 107 7/30/2010 $ 68,735 534
NOTES TO CONSOLIDATED FINANCIAL STATEMENTS—(Continued)
Purchase Price
Purchase
| ||||||||||||||||||||
(a) |
|
| The total purchase price for these two hotels is $32.9 million. | |||||||||||||||||
F-15