Exhibit C2
|
Project Piston
MATERIALS PREPARED FOR DISCUSSION WITH IC AHN ENTERPRISES, L . P.
MAY 17, 2016 | CONFIDENTIAL – PRELIMINARY – SUBJECT TO FURTHER REVIEW AND REVISION
1
|
Table of Contents
Page
1. Selected Illustrative Financial Analyses 3
2. Certain Non-Financial Observations 9
3. Appendices 12
Selected Companies and Transactions Information 13
CONFIDENTIAL—PRELIMINARY—SUBJECT TO FURTHER REVIEW AND REVISION 2
2
|
Page
1. Selected Illustrative Financial Analyses 3
2. Certain Non-Financial Observations 9
3. Appendices 12
3
|

Piston Consolidated Summary Historical and Projected
Financial Data
The preliminary perspectives reflected are based on financial information provided by Company management.
(dollars in millions) LTM
3/31/2016 2016E 2017E 2018E 2019E 2020E
Revenue $7,481 $7,502 $7,914 $8,297 $8,593 $8,973
%Growth — 1.1% 5.5% 4.8% 3.6% 4.4%
Gross Profit $1,111 $1,186 $1,318 $1,431 $1,462 $1,539
%Margin 14.9% 15.8% 16.7% 17.2% 17.0% 17.2%
Less: Selling, General and Administrative Expenses 789 827 866 886 901 913
Less: Other Expenses / (Income)(28) 10 5 5 5 2
EBIT $350 $349 $446 $539 $556 $624
%Margin 4.7% 4.7% 5.6% 6.5% 6.5% 7.0%
Add: Depreciation, Amortization and Other Expenses 345 386 396 413 432 428
EBITDA¹ $695 $735 $842 $952 $988 $1,052
%Margin 9.3% 9.8% 10.6% 11.5% 11.5% 11.7%
Less: Adjustment for Pension Expense Included in D&A and Other Expenses² 2 13 12 9 6 3
Less: EBITDA of Interests in Consolidated JVs Not Attributable to Company² 20 23 26 29 32 34
Adjusted EBITDA² $673 $699 $804 $914 $950 $1,015
%Margin 9.0% 9.3% 10.2% 11.0% 11.1% 11.3%
Add: Pension (and OPEB) Expense 61 68 71 71 65 61
Adjusted EBITDAP $734 $767 $875 $985 $1,015 $1,076
Capital Expenditures $426 $434 $419 $409 $430 $430
Segment Information
Pow ertrain Adjusted EBITDA $416 $442 $497 $563 $614 $643
Pow ertrain Adjusted EBITDAP $468 $502 $560 $625 $671 $696
Motorparts Adjusted EBITDA $257 $257 $307 $351 $336 $372
Motorparts Adjusted EBITDAP $266 $265 $316 $360 $344 $380
Source: Company management
1. Per Company management, EBITDA reflects addbacks for projected restructuring expenses.
2. Reflects adjustments per direction of Company management, as discussed with the Special Committee.
Note: Illustrative discounted cash flow analyses also reflect additional cash flow items not shown above, including changes in net working capital,
restructuring expenses/payments, cash flows related to non-consolidated JVs, and pension (and OPEB) contributions.
Note: Certain figures may differ slightly due to rounding.
CONFIDENTIAL—PRELIMINARY—SUBJECT TO FURTHER REVIEW AND REVISION 4
4
|
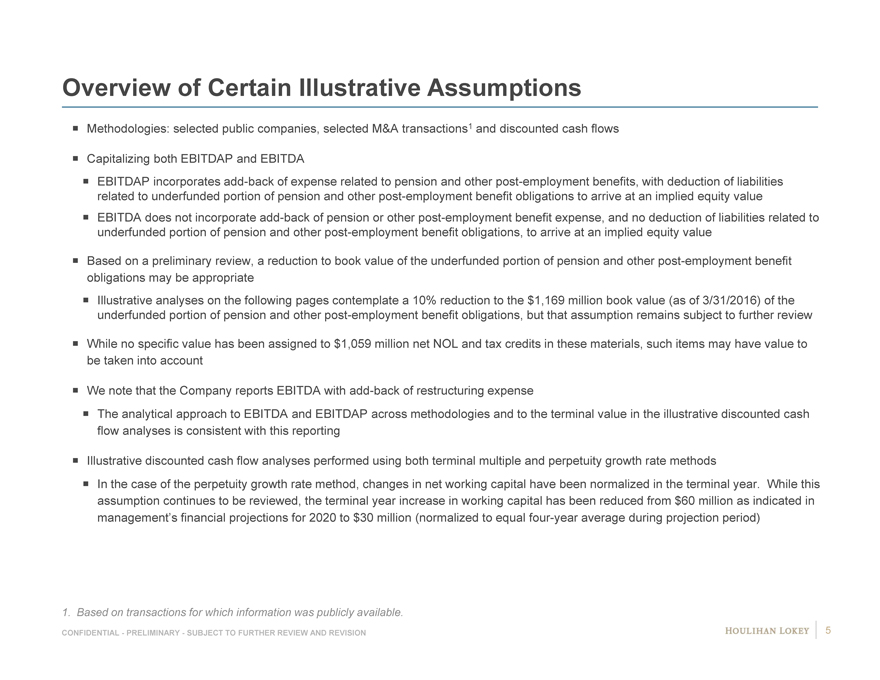
Overview of Certain Illustrative Assumptions
Methodologies: selected public companies, selected M&A transactions1 and discounted cash flows
Capitalizing both EBITDAP and EBITDA
EBITDAP incorporates add-back of expense related to pension and other post-employment benefits, with deduction of liabilities related to underfunded portion of pension and other post-employment benefit obligations to arrive at an implied equity value EBITDA does not incorporate add-back of pension or other post-employment benefit expense, and no deduction of liabilities related to underfunded portion of pension and other post-employment benefit obligations, to arrive at an implied equity value
Based on a preliminary review, a reduction to book value of the underfunded portion of pension and other post-employment benefit obligations may be appropriate Illustrative analyses on the following pages contemplate a 10% reduction to the $1,169 million book value (as of 3/31/2016) of the underfunded portion of pension and other post-employment benefit obligations, but that assumption remains subject to further review
While no specific value has been assigned to $1,059 million net NOL and tax credits in these materials, such items may have value to be taken into account
We note that the Company reports EBITDA with add-back of restructuring expense
The analytical approach to EBITDA and EBITDAP across methodologies and to the terminal value in the illustrative discounted cash flow analyses is consistent with this reporting
Illustrative discounted cash flow analyses performed using both terminal multiple and perpetuity growth rate methods
In the case of the perpetuity growth rate method, changes in net working capital have been normalized in the terminal year. While this assumption continues to be reviewed, the terminal year increase in working capital has been reduced from $60 million as indicated in management’s financial projections for 2020 to $30 million (normalized to equal four-year average during projection period)
1. Based on transactions for which information was publicly available.
CONFIDENTIAL—PRELIMINARY—SUBJECT TO FURTHER REVIEW AND REVISION 5
|
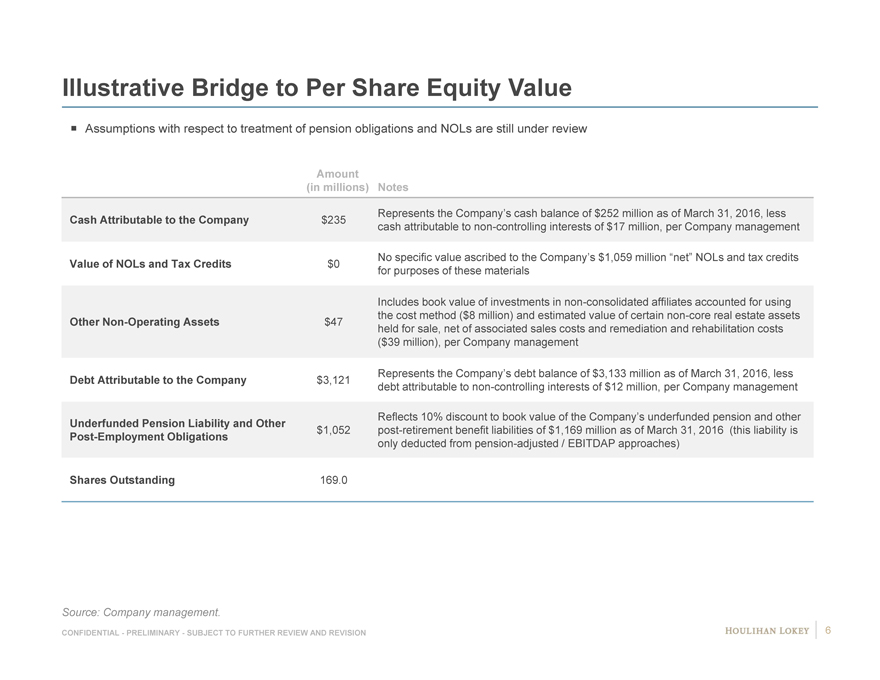
Illustrative Bridge to Per Share Equity Value
Assumptions with respect to treatment of pension obligations and NOLs are still under review
Amount
(in millions) Notes
Represents the Company’s cash balance of $252 million as of March 31, 2016, less
Cash Attributable to the Company $235 cash attributable to non-controlling interests of $17 million, per Company management
No specific value ascribed to the Company’s $1,059 million “net” NOLs and tax credits
Value of NOLs and Tax Credits $0 for purposes of these materials
Includes book value of investments in non-consolidated affiliates accounted for using the cost method ($8 million) and estimated value of certain non-core real estate assets
Other Non-Operating Assets $47 held for sale, net of associated sales costs and remediation and rehabilitation costs
($39 million), per Company management
Represents the Company’s debt balance of $3,133 million as of March 31, 2016, less
Debt Attributable to the Company $3,121 debt attributable to non-controlling interests of $12 million, per Company management
Reflects 10% discount to book value of the Company’s underfunded pension and other
Underfunded Pension Liability and Other $1,052 post-retirement benefit liabilities of $1,169 million as of March 31, 2016 (this liability is
Post-Employment Obligations only deducted from pension-adjusted / EBITDAP approaches)
Shares Outstanding 169.0
Source: Company management.
CONFIDENTIAL—PRELIMINARY—SUBJECT TO FURTHER REVIEW AND REVISION 6
|
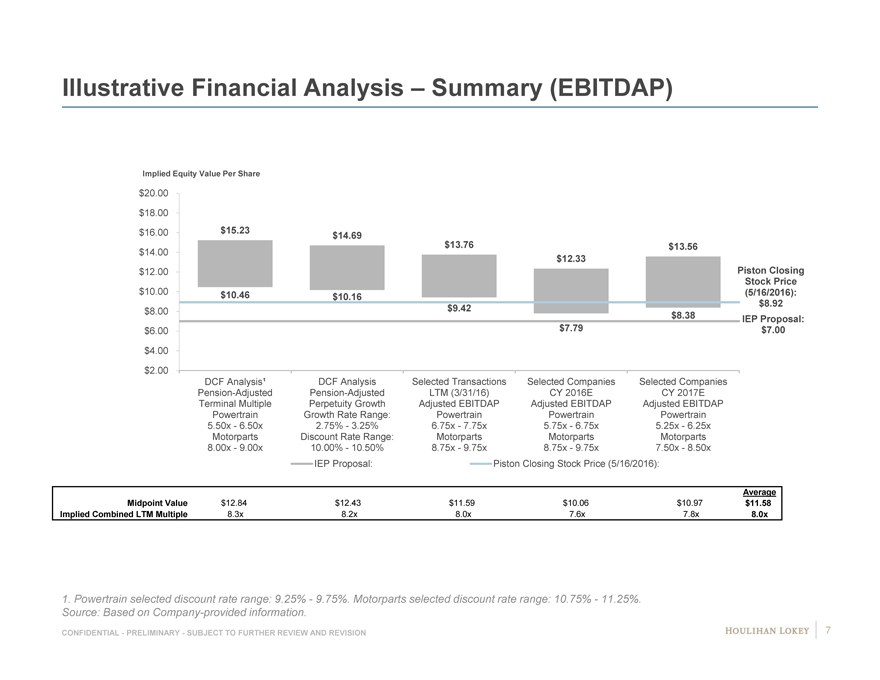
Illustrative Financial Analysis – Summary (EBITDAP)
Implied Equity Value Per Share
$20.00
$18.00
$16.00 $ 15.23 $ 14.69
$14.00 $13.76 $13.56
$12.33
$12.00 Piston Closing
Stock Price
$10.00 $ 10.46 $ 10.16(5/16/2016):
$8.92
$8.00 $9.42
$8.38 IEP Proposal:
$6.00 $7.79 $7.00
$4.00
$2.00
DCF Analysis¹ DCF Analysis Selected Transactions Selected Companies Selected Companies
Pension-Adjusted Pension-Adjusted LTM (3/31/16) CY 2016E CY 2017E
Terminal Multiple Perpetuity Growth Adjusted EBITDAP Adjusted EBITDAP Adjusted EBITDAP
Powertrain Growth Rate Range: Powertrain Powertrain Powertrain
5.50x—6.50x 2.75%—3.25% 6.75x—7.75x 5.75x—6.75x 5.25x—6.25x
Motorparts Discount Rate Range: Motorparts Motorparts Motorparts
8.00x—9.00x 10.00%—10.50% 8.75x—9.75x 8.75x—9.75x 7.50x—8.50x
IEP Proposal: Piston Closing Stock Price (5/16/2016):
Average
Midpoint Value $12.84 $12.43 $11.59 $10.06 $10.97 $11.58
Implied Combined LTM Multiple 8.3x 8.2x 8.0x 7.6x 7.8x 8.0x
1. Powertrain selected discount rate range: 9.25%—9.75%. Motorparts selected discount rate range: 10.75%—11.25%.
Source: Based on Company-provided information.
CONFIDENTIAL—PRELIMINARY—SUBJECT TO FURTHER REVIEW AND REVISION 7
|
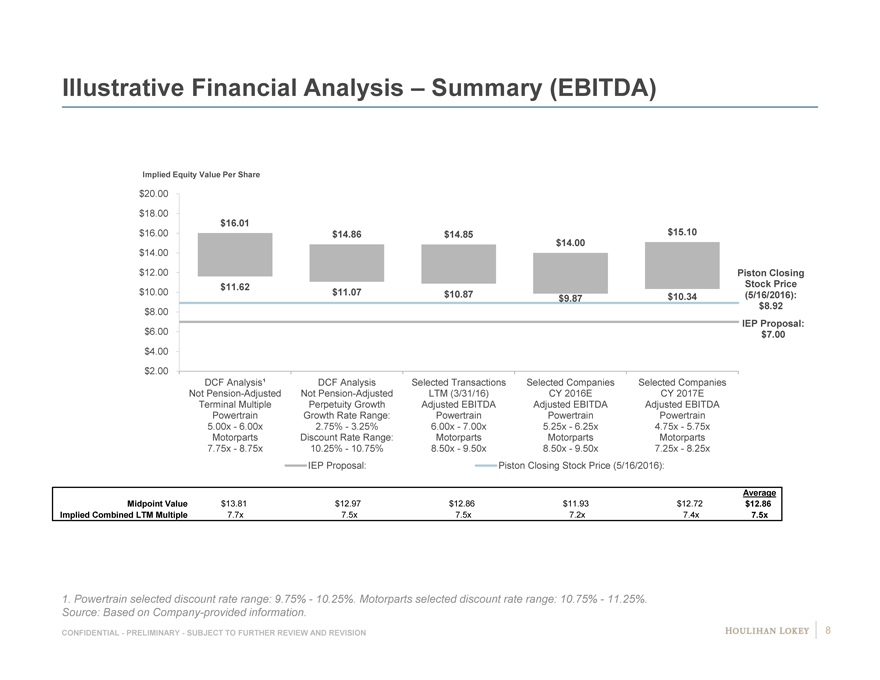
Illustrative Financial Analysis – Summary (EBITDA)
Implied Equity Value Per Share
$20.00
$18.00
$16.01
$16.00 $14.86 $14.85 $15.10
$14.00
$14.00
$12.00 Piston Closing
$11.62 Stock Price
$10.00 $11.07 $10.87 $9.87 $10.34(5/16/2016):
$8.00 $8.92
IEP Proposal:
$6.00 $7.00
$4.00
$2.00
DCF Analysis¹ DCF Analysis Selected Transactions Selected Companies Selected Companies
Not Pension-Adjusted Not Pension-Adjusted LTM (3/31/16) CY 2016E CY 2017E
Terminal Multiple Perpetuity Growth Adjusted EBITDA Adjusted EBITDA Adjusted EBITDA
Powertrain Growth Rate Range: Powertrain Powertrain Powertrain
5.00x—6.00x 2.75%—3.25% 6.00x—7.00x 5.25x—6.25x 4.75x—5.75x
Motorparts Discount Rate Range: Motorparts Motorparts Motorparts
7.75x—8.75x 10.25%—10.75% 8.50x—9.50x 8.50x—9.50x 7.25x—8.25x
IEP Proposal: Piston Closing Stock Price (5/16/2016):
Average
Midpoint Value $13.81 $12.97 $12.86 $11.93 $12.72 $12.86
Implied Combined LTM Multiple 7.7x 7.5x 7.5x 7.2x 7.4x 7.5x
1. Powertrain selected discount rate range: 9.75%—10.25%. Motorparts selected discount rate range: 10.75%—11.25%.
Source: Based on Company-provided information.
CONFIDENTIAL—PRELIMINARY—SUBJECT TO FURTHER REVIEW AND REVISION 8
|
Page
1. Selected Illustrative Financial Analyses 3
2. Certain Non-Financial Observations 9
3. Appendices 12
|
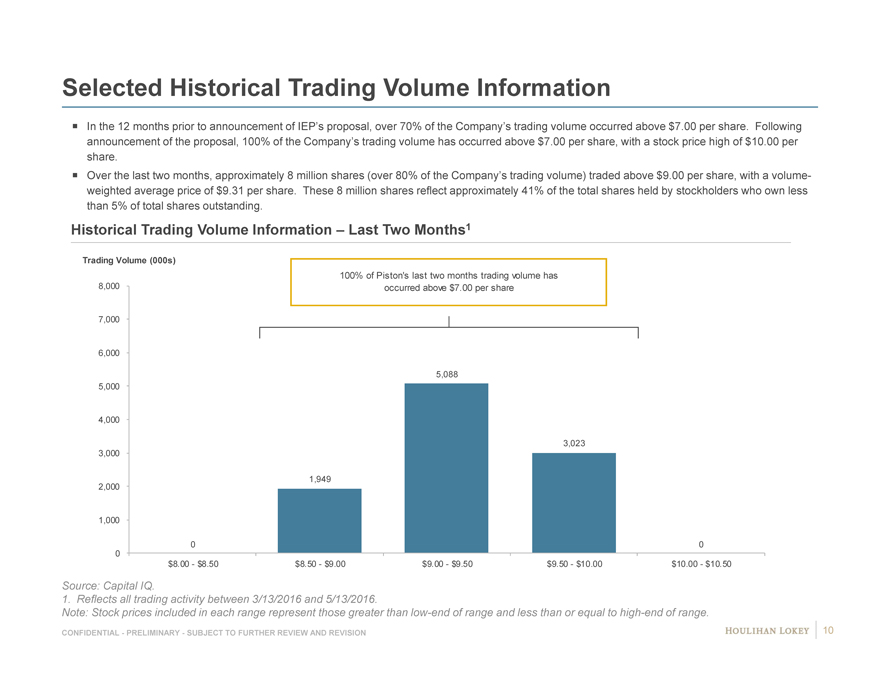
Selected Historical Trading Volume Information
In the 12 months prior to announcement of IEP’s proposal, over 70% of the Company’s trading volume occurred above $7.00 per share. Following announcement of the proposal, 100% of the Company’s trading volume has occurred above $7.00 per share, with a stock price high of $10.00 per share.
Over the last two months, approximately 8 million shares (over 80% of the Company’s trading volume) traded above $9.00 per share, with a volume-weighted average price of $9.31 per share. These 8 million shares reflect approximately 41% of the total shares held by stockholders who own less than 5% of total shares outstanding.
Historical Trading Volume Information – Last Two Months1
Trading Volume (000s)
100% of Piston’s last two months trading volume has
8,000 occurred above $7.00 per share
7,000
6,000
5,088
5,000
4,000
3,023
3,000
1,949
2,000
1,000
0 0
0
$8.00—$8.50 $8.50—$9.00 $9.00—$9.50 $9.50—$10.00 $10.00—$10.50
Source: Capital IQ.
1. Reflects all trading activity between 3/13/2016 and 5/13/2016.
Note: Stock prices included in each range represent those greater than low-end of range and less than or equal to high-end of range.
CONFIDENTIAL—PRELIMINARY—SUBJECT TO FURTHER REVIEW AND REVISION 10
|
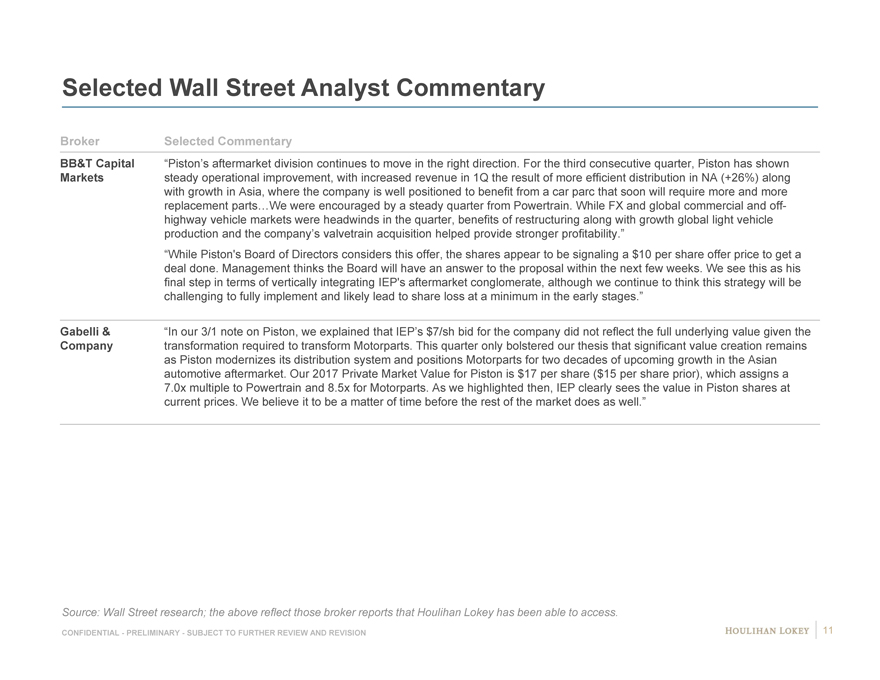
Selected Wall Street Analyst Commentary
Broker Selected Commentary
BB&T Capital “Piston’s aftermarket division continues to move in the right direction. For the third consecutive quarter, Piston has shown Markets steady operational improvement, with increased revenue in 1Q the result of more efficient distribution in NA (+26%) along with growth in Asia, where the company is well positioned to benefit from a car parc that soon will require more and more replacement parts…We were encouraged by a steady quarter from Powertrain. While FX and global commercial and off-highway vehicle markets were headwinds in the quarter, benefits of restructuring along with growth global light vehicle production and the company’s valvetrain acquisition helped provide stronger profitability.” “While Piston’s Board of Directors considers this offer, the shares appear to be signaling a $10 per share offer price to get a deal done. Management thinks the Board will have an answer to the proposal within the next few weeks. We see this as his final step in terms of vertically integrating IEP’s aftermarket conglomerate, although we continue to think this strategy will be challenging to fully implement and likely lead to share loss at a minimum in the early stages.”
Gabelli & “In our 3/1 note on Piston, we explained that IEP’s $7/sh bid for the company did not reflect the full underlying value given the Company transformation required to transform Motorparts. This quarter only bolstered our thesis that significant value creation remains as Piston modernizes its distribution system and positions Motorparts for two decades of upcoming growth in the Asian automotive aftermarket. Our 2017 Private Market Value for Piston is $17 per share ($15 per share prior), which assigns a 7.0x multiple to Powertrain and 8.5x for Motorparts. As we highlighted then, IEP clearly sees the value in Piston shares at current prices. We believe it to be a matter of time before the rest of the market does as well.”
Source: Wall Street research; the above reflect those broker reports that Houlihan Lokey has been able to access.
CONFIDENTIAL—PRELIMINARY—SUBJECT TO FURTHER REVIEW AND REVISION 11
|
Page
1. Selected Illustrative Financial Analyses 3
2. Certain Non-Financial Observations 9
3. Appendices 12 Selected Companies and Transactions Information 13
|
Page
1. Selected Illustrative Financial Analyses 3
2. Certain Non-Financial Observations 9
3. Appendices 12 Selected Companies and Transactions Information 13
|
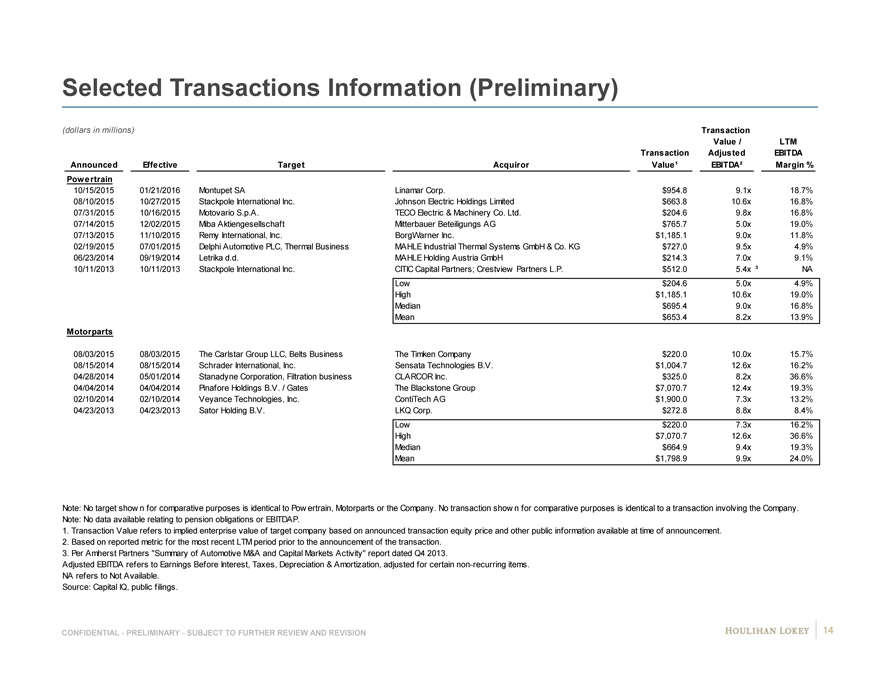
Selected Transactions Information (Preliminary)
(dollars in millions) Transaction
Value / LTM
Transaction Adjusted EBITDA
Announced Effective Target Acquiror Value¹ EBITDA² Margin %
Powertrain
10/15/2015 01/21/2016 Montupet SA Linamar Corp. $954.8 9.1x 18.7%
08/10/2015 10/27/2015 Stackpole International Inc. Johnson Electric Holdings Limited $663.8 10.6x 16.8%
07/31/2015 10/16/2015 Motovario S.p.A. TECO Electric & Machinery Co. Ltd. $204.6 9.8x 16.8%
07/14/2015 12/02/2015 Miba Aktiengesellschaft Mitterbauer Beteiligungs AG $765.7 5.0x 19.0%
07/13/2015 11/10/2015 Remy International, Inc. BorgWarner Inc. $1,185.1 9.0x 11.8%
02/19/2015 07/01/2015 Delphi Automotive PLC, Thermal Business MAHLE Industrial Thermal Systems GmbH & Co. KG $727.0 9.5x 4.9%
06/23/2014 09/19/2014 Letrika d.d. MAHLE Holding Austria GmbH $214.3 7.0x 9.1%
10/11/2013 10/11/2013 Stackpole International Inc. CITIC Capital Partners; Crestview Partners L.P. $512.0 5.4x ³ NA N
Low $204.6 5.0x 4.9%
High $1,185.1 10.6x 19.0%
Median $695.4 9.0x 16.8%
Mean $653.4 8.2x 13.9%
Motorparts
08/03/2015 08/03/2015 The Carlstar Group LLC, Belts Business The Timken Company $220.0 10.0x 15.7%
08/15/2014 08/15/2014 Schrader International, Inc. Sensata Technologies B.V. $1,004.7 12.6x 16.2%
04/28/2014 05/01/2014 Stanadyne Corporation, Filtration business CLARCOR Inc. $325.0 8.2x 36.6%
04/04/2014 04/04/2014 Pinafore Holdings B.V. / Gates The Blackstone Group $7,070.7 12.4x 19.3%
02/10/2014 02/10/2014 Veyance Technologies, Inc. ContiTech AG $1,900.0 7.3x 13.2%
04/23/2013 04/23/2013 Sator Holding B.V. LKQ Corp. $272.8 8.8x 8.4%
Low $220.0 7.3x 16.2%
High $7,070.7 12.6x 36.6%
Median $664.9 9.4x 19.3%
Mean $1,798.9 9.9x 24.0%
Note: No target show n for comparative purposes is identical to Pow ertrain, Motorparts or the Company. No transaction show n for comparative purposes is identical to a transaction involving the Company.
Note: No data available relating to pension obligations or EBITDAP.
1. Transaction Value refers to implied enterprise value of target company based on announced transaction equity price and other public information available at time of announcement.
2. Based on reported metric for the most recent LTM period prior to the announcement of the transaction.
3. Per Amherst Partners “Summary of Automotive M&A and Capital Markets Activity” report dated Q4 2013.
Adjusted EBITDA refers to Earnings Before Interest, Taxes, Depreciation & Amortization, adjusted for certain non-recurring items.
NA refers to Not Available.
Source: Capital IQ, public filings.
CONFIDENTIAL—PRELIMINARY—SUBJECT TO FURTHER REVIEW AND REVISION 14
|
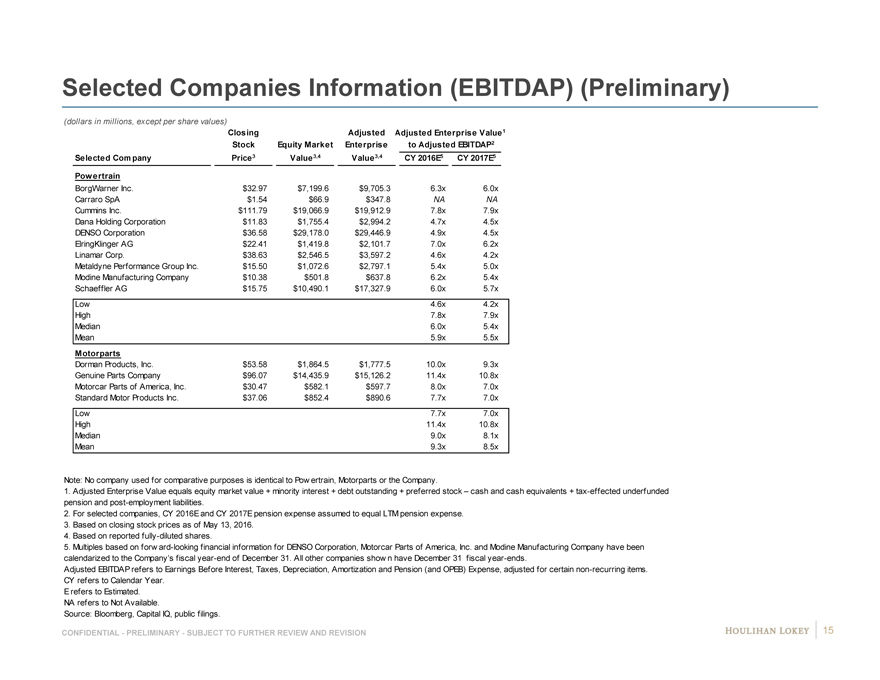
Selected Companies Information (EBITDAP) (Preliminary)
(dollars in millions, except per share values)
Closing Adjusted Adjusted Enterprise Value1
Stock Equity Market Enterprise to Adjusted EBITDAP2
Selected Company Price3 Value 3,4 Value 3,4 CY 2016E5 CY 2017E5
Powertrain
BorgWarner Inc. $32.97 $7,199.6 $9,705.3 6.3x 6.0x 6 9
Carraro SpA $1.54 $66.9 $347.8 NA NA N NA
Cummins Inc. $111.79 $19,066.9 $19,912.9 7.8x 7.9x 8 #
Dana Holding Corporation $11.83 $1,755.4 $2,994.2 4.7x 4.5x 4 8
DENSO Corporation $36.58 $29,178.0 $29,446.9 4.9x 4.5x 5 8
ElringKlinger AG $22.41 $1,419.8 $2,101.7 7.0x 6.2x 6 #
Linamar Corp. $38.63 $2,546.5 $3,597.2 4.6x 4.2x 4 9
Metaldyne Performance Group Inc. $15.50 $1,072.6 $2,797.1 5.4x 5.0x 5 8
Modine Manufacturing Company $10.38 $501.8 $637.8 6.2x 5.4x 5 #
Schaeffler AG $15.75 $10,490.1 $17,327.9 6.0x 5.7x 6 9
Low 4.6x 4.2x
High 7.8x 7.9x
Median 6.0x 5.4x
Mean 5.9x 5.5x
Motorparts
Dorman Products, Inc. $53.58 $1,864.5 $1,777.5 10.0x 9.3x 9 #
Genuine Parts Company $96.07 $14,435.9 $15,126.2 11.4x 10.8x # #
Motorcar Parts of America, Inc. $30.47 $582.1 $597.7 8.0x 7.0x 7 7
Standard Motor Products Inc. $37.06 $852.4 $890.6 7.7x 7.0x 7 NA
Low 7.7x 7.0x
High 11.4x 10.8x
Median 9.0x 8.1x
Mean 9.3x 8.5x
Note: No company used for comparative purposes is identical to Pow ertrain, Motorparts or the Company.
1. Adjusted Enterprise Value equals equity market value + minority interest + debt outstanding + preferred stock – cash and cash equivalents + tax-effected underfunded
pension and post-employment liabilities.
2. For selected companies, CY 2016E and CY 2017E pension expense assumed to equal LTM pension expense.
3. Based on closing stock prices as of May 13, 2016.
4. Based on reported fully-diluted shares.
5. Multiples based on forw ard-looking financial information for DENSO Corporation, Motorcar Parts of America, Inc. and Modine Manufacturing Company have been
calendarized to the Company’s fiscal year-end of December 31. All other companies show n have December 31 fiscal year-ends.
Adjusted EBITDAP refers to Earnings Before Interest, Taxes, Depreciation, Amortization and Pension (and OPEB) Expense, adjusted for certain non-recurring items.
CY refers to Calendar Year.
E refers to Estimated.
NA refers to Not Available.
Source: Bloomberg, Capital IQ, public filings.
CONFIDENTIAL—PRELIMINARY—SUBJECT TO FURTHER REVIEW AND REVISION 15
|
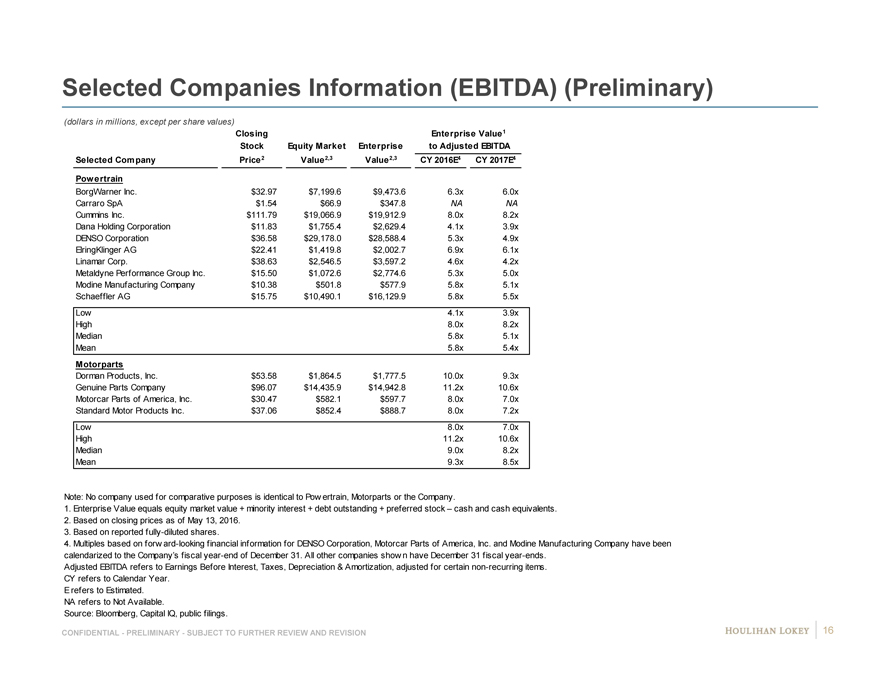
Selected Companies Information (EBITDA) (Preliminary)
(dollars in millions, except per share values)
Closing Enterprise Value 1
Stock Equity Market Enterprise to Adjusted EBITDA
Selected Company Price 2 Value 2,3 Value2,3 CY 2016E4 CY 2017E4
Powertrain
BorgWarner Inc. $32.97 $7,199.6 $9,473.6 6.3x 6.0x 6 9
Carraro SpA $1.54 $66.9 $347.8 NA NA N NA
Cummins Inc. $111.79 $19,066.9 $19,912.9 8.0x 8.2x 8 #
Dana Holding Corporation $11.83 $1,755.4 $2,629.4 4.1x 3.9x 4 7
DENSO Corporation $36.58 $29,178.0 $28,588.4 5.3x 4.9x 5 #
ElringKlinger AG $22.41 $1,419.8 $2,002.7 6.9x 6.1x 6 #
Linamar Corp. $38.63 $2,546.5 $3,597.2 4.6x 4.2x 4 9
Metaldyne Performance Group Inc. $15.50 $1,072.6 $2,774.6 5.3x 5.0x 5 8
Modine Manufacturing Company $10.38 $501.8 $577.9 5.8x 5.1x 5 #
Schaeffler AG $15.75 $10,490.1 $16,129.9 5.8x 5.5x 6 9
Low 4.1x 3.9x
High 8.0x 8.2x
Median 5.8x 5.1x
Mean 5.8x 5.4x
Motorparts
Dorman Products, Inc. $53.58 $1,864.5 $1,777.5 10.0x 9.3x 9 #
Genuine Parts Company $96.07 $14,435.9 $14,942.8 11.2x 10.6x # #
Motorcar Parts of America, Inc. $30.47 $582.1 $597.7 8.0x 7.0x 7 7
Standard Motor Products Inc. $37.06 $852.4 $888.7 8.0x 7.2x 7 NA
Low 8.0x 7.0x
High 11.2x 10.6x
Median 9.0x 8.2x
Mean 9.3x 8.5x
Note: No company used for comparative purposes is identical to Pow ertrain, Motorparts or the Company.
1. Enterprise Value equals equity market value + minority interest + debt outstanding + preferred stock – cash and cash equivalents.
2. Based on closing prices as of May 13, 2016.
3. Based on reported fully-diluted shares.
4. Multiples based on forw ard-looking financial information for DENSO Corporation, Motorcar Parts of America, Inc. and Modine Manufacturing Company have been
calendarized to the Company’s fiscal year-end of December 31. All other companies show n have December 31 fiscal year-ends.
Adjusted EBITDA refers to Earnings Before Interest, Taxes, Depreciation & Amortization, adjusted for certain non-recurring items.
CY refers to Calendar Year.
E refers to Estimated.
NA refers to Not Available.
Source: Bloomberg, Capital IQ, public filings.
CONFIDENTIAL—PRELIMINARY—SUBJECT TO FURTHER REVIEW AND REVISION 16
|
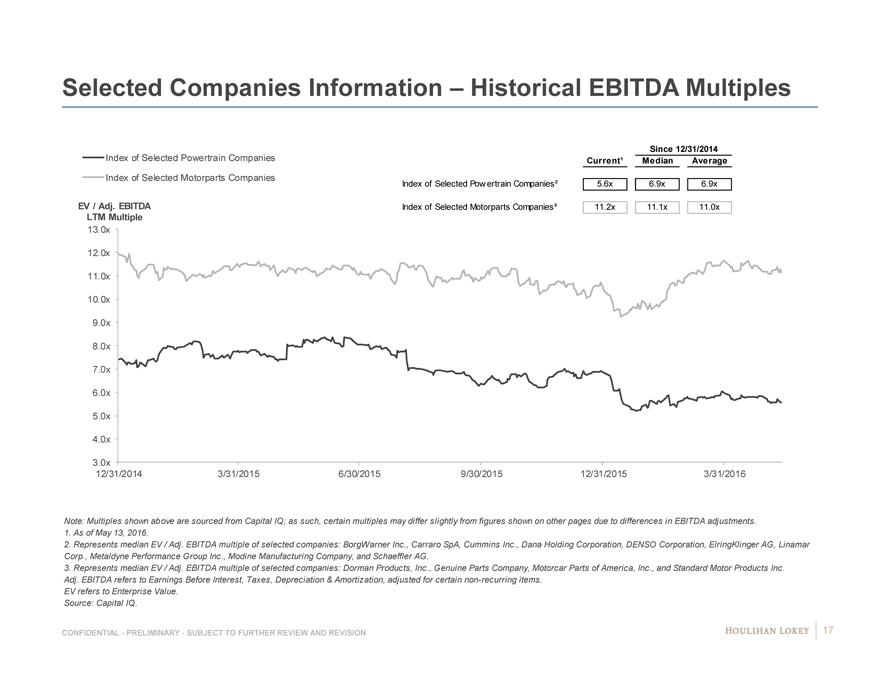
Selected Companies Information – Historical EBITDA Multiples
Since 12/31/2014
Index of Selected Powertrain Companies Current¹ Median Average
Index of Selected Motorparts Companies Index of Selected Pow ertrain Companies² 5.6x 6.9x 6.9x
EV / Adj. EBITDA Index of Selected Motorparts Companies³ 11.2x 11.1x 11.0x
LTM Multiple
13.0x
12.0x
11.0x
10.0x
9.0x
8.0x
7.0x
6.0x
5.0x
4.0x
3.0x
12/31/2014 3/31/2015 6/30/2015 9/30/2015 12/31/2015 3/31/2016
Note: Multiples shown above are sourced from Capital IQ; as such, certain multiples may differ slightly from figures shown on other pages due to differences in EBITDA adjustments.
1. As of May 13, 2016.
2. Represents median EV / Adj. EBITDA multiple of selected companies: BorgWarner Inc., Carraro SpA, Cummins Inc., Dana Holding Corporation, DENSO Corporation, ElringKlinger AG, Linamar
Corp., Metaldyne Performance Group Inc., Modine Manufacturing Company, and Schaeffler AG.
3. Represents median EV / Adj. EBITDA multiple of selected companies: Dorman Products, Inc., Genuine Parts Company, Motorcar Parts of America, Inc., and Standard Motor Products Inc.
Adj. EBITDA refers to Earnings Before Interest, Taxes, Depreciation & Amortization, adjusted for certain non-recurring items.
EV refers to Enterprise Value.
Source: Capital IQ.
CONFIDENTIAL—PRELIMINARY—SUBJECT TO FURTHER REVIEW AND REVISION 17
|
Disclaimer
Houlihan Lokey Capital, Inc. (“Houlihan Lokey”) has been retained by the Special Committee of the Board of Directors of Piston (“Piston” or the “Company”) to serve as its financial advisor in connection with the evaluation of a potential transaction involving the Company (a “Transaction”).
These materials have been prepared at the direction of the Special Committee for discussion purposes only and are delivered on a confidential basis in accordance with procedures established by the Special Committee. These materials do not purport to contain all of the information that may be required or relevant to an evaluation of the Company or any Transaction and you are solely responsible for conducting your own investigations and analysis and arriving at your own independent conclusions.
These materials may not be distributed, reproduced or used without the express consent of Special Committee or for any purpose other than the evaluation of a possible Transaction. In addition, if you do not wish to pursue a Transaction, you must promptly return these materials to Houlihan Lokey as soon as practicable, together with any other materials relating to the Company which you have received from or on behalf of the Special Committee or its representatives.
Houlihan Lokey has not independently verified any of the information contained herein. Neither the Special Committee nor Houlihan Lokey or any other representatives of the Special Committee makes any representation, warranty or guaranty of any kind, express or implied, as to the accuracy, completeness or reasonableness of the information contained herein or any other written or oral communication transmitted or made available to you. The Special Committee, Houlihan Lokey and other representatives of the Special Committee expressly disclaim any and all liability based on or arising from, in whole or in part, such information, errors therein or omissions therefrom. In addition, these materials include certain projections and forward-looking statements provided by the Company with respect to the anticipated future performance of the Company. Such projections and forward-looking statements, including the assumptions on which they are based, are subject to adjustment based on discussions with Company management and the Special Committee. Financial analyses performed by Houlihan Lokey for purposes of advising the Special Committee may differ from those set forth herein. In addition, the projections and forward-looking statements contained herein are subject to significant business, economic and competitive uncertainties and contingencies, many of which are beyond the control of the Special Committee and the Company. Accordingly, there can be no assurance that such projections or forward-looking statements will be realized. Actual results may vary from anticipated results and such variations may be material. No representations or warranties are made as to the accuracy or reasonableness of such projections or forward-looking statements or the assumptions based thereon. Only those representations and warranties that are made in a definitive written agreement relating to a Transaction, when and if executed, and subject to any limitations and restrictions as may be specified in such definitive agreement, shall have any legal effect. You should make an independent assessment of the merits of pursuing a Transaction and should consult your own professional advisors.
CONFIDENTIAL—PRELIMINARY—SUBJECT TO FURTHER REVIEW AND REVISION 18