Exhibit C5
|
Project Piston
D I S C U S S I O N M AT E R I A L S F O R T H E S P E C I A L C O M M I T T E E
S E P T E M B E R 5 , 2 0 1 6 | P R E L I M I N A R Y D R A F T – S U B J E C T T O R E V I E W – C O N F I D E N T I A L
|
Table of Contents
Page
1. Executive Summary 3
2. Preliminary Financial Analyses 9
3. Selected Public Market Observations 17
4. Appendix 22 Company Financial Update 23 Cost of Capital Considerations 26 Selected Companies—Operating Statistics 32 Company Financial Performance Observations 36 Implied Premiums Paid Observations 39 Illustrative Preliminary Financial Analyses (EBITDA) 42
5. Disclaimer 54
CONFIDENTIAL—PRELIMINARY DRAFT—SUBJECT TO FURTHER REVIEW 2
|
Page
1. Executive Summary 3
2. Preliminary Financial Analyses 9
3. Selected Public Market Observations 17
4. Appendix 22
5. Disclaimer 54
|
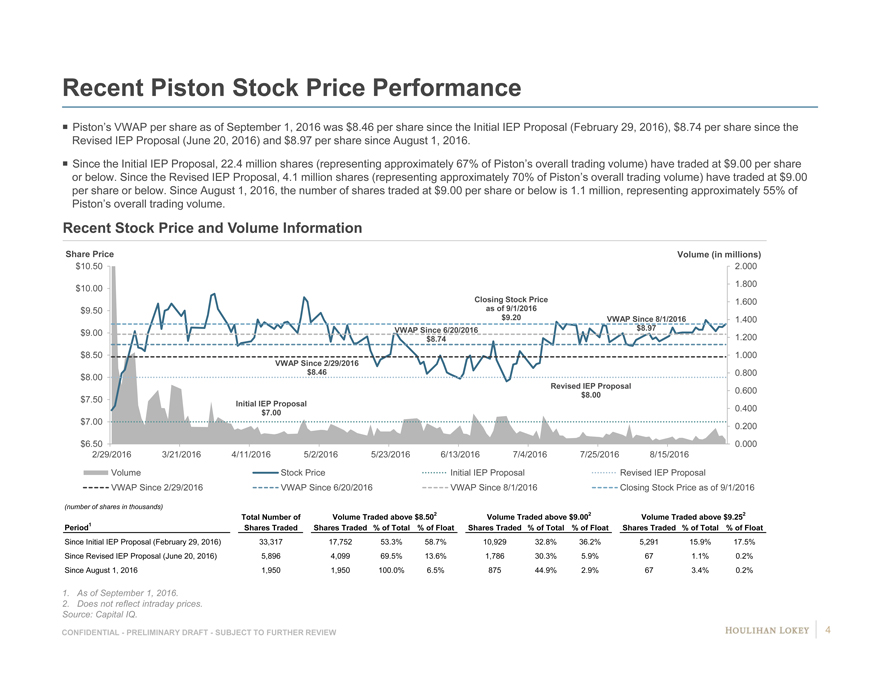
Recent Piston Stock Price Performance
Piston’s VWAP per share as of September 1, 2016 was $8.46 per share since the Initial IEP Proposal (February 29, 2016), $8.74 per share since the
Revised IEP Proposal (June 20, 2016) and $8.97 per share since August 1, 2016.
Since the Initial IEP Proposal, 22.4 million shares (representing approximately 67% of Piston’s overall trading volume) have traded at $9.00 per share
or below. Since the Revised IEP Proposal, 4.1 million shares (representing approximately 70% of Piston’s overall trading volume) have traded at $9.00
per share or below. Since August 1, 2016, the number of shares traded at $9.00 per share or below is 1.1 million, representing approximately 55% of
Piston’s overall trading volume.
Recent Stock Price and Volume Information
Share Price Volume (in millions)
$10.50 2.000
$10.00 1.800
Closing Stock Price1.600
$9.50 as of 9/1/2016
$9.20VWAP Since 8/1/20161.400
$9.00 VWAP Since 6/20/2016$8.97
$8.741.200
$8.50 1.000
VWAP Since 2/29/2016
$8.00 $8.460.800
Revised IEP Proposal0.600
$8.00
$7.50 Initial IEP Proposal
$7.000.400
$7.00 0.200
$6.50 0.000
2/29/2016 3/21/20164/11/20165/2/20165/23/20166/13/20167/4/20167/25/20168/15/2016
Volume Stock PriceInitial IEP ProposalRevised IEP Proposal
VWAP Since 2/29/2016 VWAP Since 6/20/2016VWAP Since 8/1/2016Closing Stock Price as of 9/1/2016
(number of shares in thousands)
Total Number ofVolume Traded above $8.502Volume Traded above $9.002Volume Traded above $9.252
Period1 Shares TradedShares Traded% of Total% of Float Shares Traded% of Total% of FloatShares Traded% of Total% of Float
Since Initial IEP Proposal (February 29, 2016)33,317 17,75253.3%58.7%10,92932.8%36.2%5,29115.9%17.5%
Since Revised IEP Proposal (June 20, 2016) 5,896 4,09969.5%13.6%1,78630.3%5.9%671.1%0.2%
Since August 1, 2016 1,9501,950100.0%6.5%87544.9%2.9%673.4%0.2%
1. As of September 1, 2016.
2. Does not reflect intraday prices.
Source: Capital IQ.
CONFIDENTIAL—PRELIMINARY DRAFT—SUBJECT TO FURTHER REVIEW 4
|
Recent Market Activity: Net Trading Activity and Ownership
Changes for Largest Stockholders
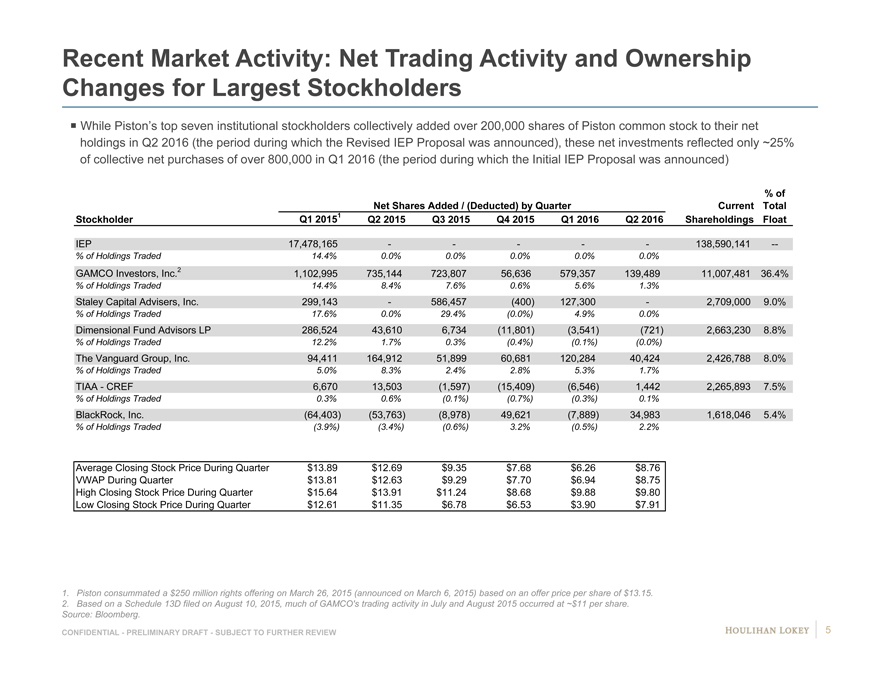
While Piston’s top seven institutional stockholders collectively added over 200,000 shares of Piston common stock to their net
holdings in Q2 2016 (the period during which the Revised IEP Proposal was announced), these net investments reflected only ~25%
of collective net purchases of over 800,000 in Q1 2016 (the period during which the Initial IEP Proposal was announced)
% of
Net Shares Added / (Deducted) by QuarterCurrentTotal
Stockholder Q1 20151 Q2 2015Q3 2015Q4 2015Q1 2016Q2 2016Shareholdings Float
IEP 17,478,165 -----138,590,141—
% of Holdings Traded 14.4% 0.0%0.0%0.0%0.0%0.0%
GAMCO Investors, Inc.2 1,102,995 735,144723,80756,636579,357139,48911,007,48136.4%
% of Holdings Traded 14.4% 8.4%7.6%0.6%5.6%1.3%
Staley Capital Advisers, Inc. 299,143 -586,457(400)127,300-2,709,0009.0%
% of Holdings Traded 17.6% 0.0%29.4%(0.0%)4.9%0.0%
Dimensional Fund Advisors LP 286,524 43,6106,734(11,801)(3,541)(721)2,663,2308.8%
% of Holdings Traded 12.2% 1.7%0.3%(0.4%)(0.1%)(0.0%)
The Vanguard Group, Inc. 94,411 164,91251,89960,681120,28440,4242,426,7888.0%
% of Holdings Traded 5.0%8.3%2.4%2.8%5.3%1.7%
TIAA—CREF 6,67013,503(1,597)(15,409)(6,546)1,4422,265,8937.5%
% of Holdings Traded 0.3%0.6%(0.1%)(0.7%)(0.3%)0.1%
BlackRock, Inc. (64,403) (53,763)(8,978)49,621(7,889)34,9831,618,0465.4%
% of Holdings Traded (3.9%)(3.4%)(0.6%)3.2%(0.5%)2.2%
Average Closing Stock Price During Quarter $13.89$12.69$9.35$7.68$6.26$8.76
VWAP During Quarter $13.81$12.63$9.29$7.70$6.94$8.75
High Closing Stock Price During Quarter $15.64$13.91$11.24$8.68$9.88$9.80
Low Closing Stock Price During Quarter $12.61$11.35$6.78$6.53$3.90$7.91
1. Piston consummated a $250 million rights offering on March 26, 2015 (announced on March 6, 2015) based on an offer price per share of $13.15.
2. Based on a Schedule 13D filed on August 10, 2015, much of GAMCO’s trading activity in July and August 2015 occurred at ~$11 per share.
Source: Bloomberg.
CONFIDENTIAL—PRELIMINARY DRAFT—SUBJECT TO FURTHER REVIEW 5
|
Updates to Financial Analyses Since August 15, 2016 Preliminary Discussion Materials
Since the preliminary Special Committee discussion materials on August 15, 2016, the following updates have been made:
Stock prices and other publicly available financial information for the selected companies have been updated to market close as of September 1, 2016 (refer to following page for further details).
LTM: Selected Adjusted Enterprise Value/Adjusted EBITDAP multiple range of 5.50x to 6.50x for Powertrain was unchanged, selected Adjusted Enterprise Value/Adjusted EBITDAP multiple range of 8.50x to 9.50x for Motorparts was unchanged CY 2016E: Selected Adjusted Enterprise Value/Adjusted EBITDAP multiple range of 5.25x to 6.25x for Powertrain was unchanged, selected Adjusted Enterprise Value/Adjusted EBITDAP multiple range of 8.50x to 9.50x for Motorparts was unchanged CY 2017E: Selected Adjusted Enterprise Value/Adjusted EBITDAP multiple range of 4.75x to 5.75x for Powertrain was unchanged, selected Adjusted Enterprise Value/Adjusted EBITDAP multiple range of 7.50x to 8.50x for Motorparts was unchanged
Discounted cash flow analysis reflects updated market data and present value date (see page 16)
Stock prices, betas, risk-free rate and other public information in the weighted average cost of capital calculation have been updated to market close as of September 1, 2016 Pension-adjusted WACC decreased from 10.3% in the August 15, 2016 preliminary Special Committee discussion materials to 10.2% currently; selected range of discount rates of 9.75% to 10.75% was unchanged
Based on discussions with Company management, there were no changes in the Company’s financials or projections
CONFIDENTIAL—PRELIMINARY DRAFT—SUBJECT TO FURTHER REVIEW 6
|
Recent Market Updates
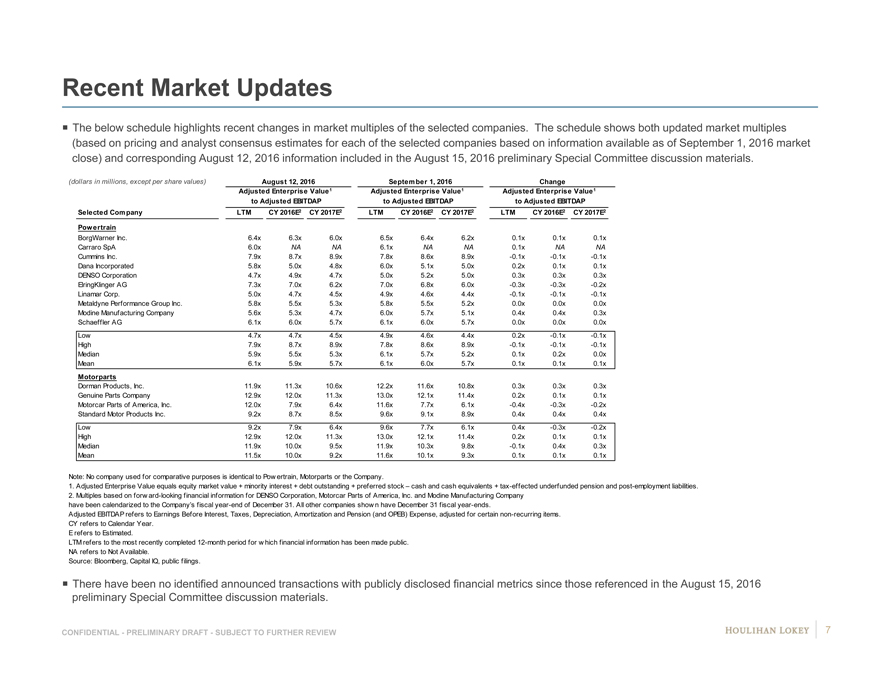
The below schedule highlights recent changes in market multiples of the selected companies. The schedule shows both updated market multiples
(based on pricing and analyst consensus estimates for each of the selected companies based on information available as of September 1, 2016 market
close) and corresponding August 12, 2016 information included in the August 15, 2016 preliminary Special Committee discussion materials.
(dollars in millions, except per share values) August 12, 2016September 1, 2016Change
Adjusted Enterprise Value1 Adjusted Enterprise Value1Adjusted Enterprise Value1
to Adjusted EBITDAP to Adjusted EBITDAPto Adjusted EBITDAP
Selected Company LTM CY 2016E2 CY 2017E2LTMCY 2016E2 CY 2017E2LTMCY 2016E2 CY 2017E2
Powertrain
BorgWarner Inc. 6.4x 6.3x6.0x #6.5x6.4x6.2x6 90.1x0.1x0.1x
Carraro SpA 6.0x NANA A6.1xNANA N N0.1xNANA
Cummins Inc. 7.9x 8.7x8.9x #7.8x8.6x8.9x9 #-0.1x-0.1x-0.1x
Dana Incorporated 5.8x 5.0x4.8x #6.0x5.1x5.0x5 90.2x0.1x0.1x
DENSO Corporation 4.7x 4.9x4.7x #5.0x5.2x5.0x5 #0.3x0.3x0.3x
ElringKlinger AG 7.3x 7.0x6.2x #7.0x6.8x6.0x6 #-0.3x-0.3x-0.2x
Linamar Corp. 5.0x 4.7x4.5x #4.9x4.6x4.4x4 9-0.1x-0.1x-0.1x
Metaldyne Performance Group Inc. 5.8x 5.5x5.3x #5.8x5.5x5.2x5 90.0x0.0x0.0x
Modine Manufacturing Company 5.6x 5.3x4.7x #6.0x5.7x5.1x5 #0.4x0.4x0.3x
Schaeffler AG 6.1x 6.0x5.7x #6.1x6.0x5.7x6 #0.0x0.0x0.0x
Low 4.7x 4.7x4.5x4.9x4.6x4.4x0.2x-0.1x-0.1x
High 7.9x 8.7x8.9x7.8x8.6x8.9x-0.1x-0.1x-0.1x
Median 5.9x 5.5x5.3x6.1x5.7x5.2x0.1x0.2x0.0x
Mean 6.1x 5.9x5.7x6.1x6.0x5.7x0.1x0.1x0.1x
Motorparts
Dorman Products, Inc. 11.9x 11.3x10.6x #12.2x11.6x10.8x# #0.3x0.3x0.3x
Genuine Parts Company 12.9x 12.0x11.3x #13.0x12.1x11.4x# #0.2x0.1x0.1x
Motorcar Parts of America, Inc. 12.0x 7.9x6.4x #11.6x7.7x6.1x6 6-0.4x-0.3x-0.2x
Standard Motor Products Inc. 9.2x 8.7x8.5x #9.6x9.1x8.9x9 N0.4x0.4x0.4x
Low 9.2x 7.9x6.4x9.6x7.7x6.1x0.4x-0.3x-0.2x
High 12.9x 12.0x11.3x13.0x12.1x11.4x0.2x0.1x0.1x
Median 11.9x 10.0x9.5x11.9x10.3x9.8x-0.1x0.4x0.3x
Mean 11.5x 10.0x9.2x11.6x10.1x9.3x0.1x0.1x0.1x
Note: No company used for comparative purposes is identical to Pow ertrain, Motorparts or the Company.
1. Adjusted Enterprise Value equals equity market value + minority interest + debt outstanding + preferred stock – cash and cash equivalents + tax-effected underfunded pension and post-employment liabilities.
2. Multiples based on forw ard-looking financial information for DENSO Corporation, Motorcar Parts of America, Inc. and Modine Manufacturing Company
have been calendarized to the Company’s fiscal year-end of December 31. All other companies show n have December 31 fiscal year-ends.
Adjusted EBITDAP refers to Earnings Before Interest, Taxes, Depreciation, Amortization and Pension (and OPEB) Expense, adjusted for certain non-recurring items.
CY refers to Calendar Year.
E refers to Estimated.
LTM refers to the most recently completed 12-month period for w hich financial information has been made public.
NA refers to Not Available.
Source: Bloomberg, Capital IQ, public filings.
There have been no identified announced transactions with publicly disclosed financial metrics since those referenced in the August 15, 2016
preliminary Special Committee discussion materials.
CONFIDENTIAL—PRELIMINARY DRAFT—SUBJECT TO FURTHER REVIEW 7
|
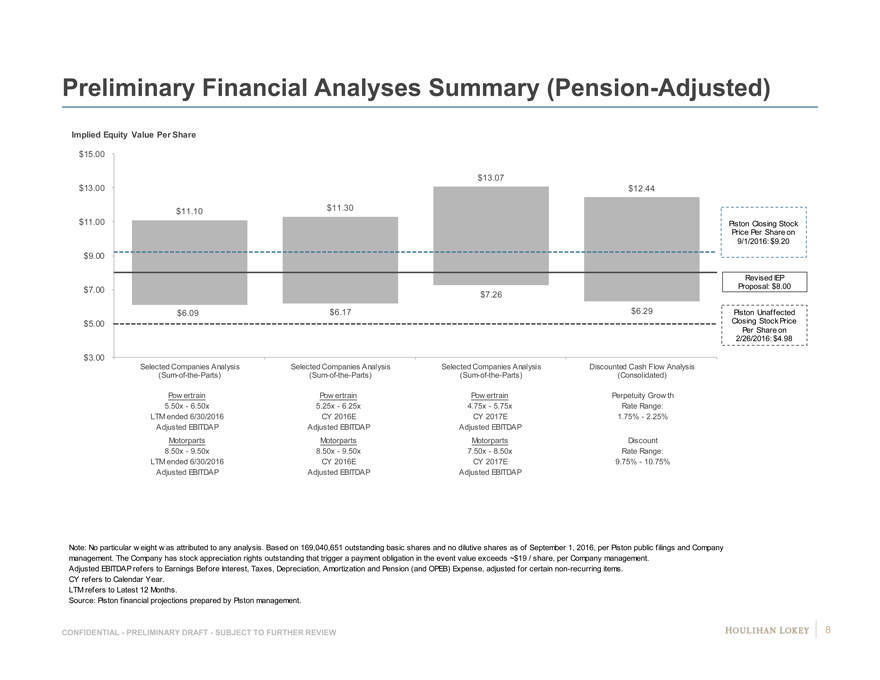
Preliminary Financial Analyses Summary (Pension-Adjusted)
Implied Equity Value Per Share
$15.00
$13.07
$13.00 $12.44
$11.10 $11.30
$11.00 Piston Closing Stock Price Per Share on 9/1/2016: $9.20 $9.00
Revised IEP $7.00 Proposal: $8.00
$7.26
$6.09 $6.17 $6.29 Piston Unaffected $5.00 Closing Stock Price Per Share on 2/26/2016: $4.98
$3.00
Selected Companies Analysis Selected Companies Analysis Selected Companies Analysis Discounted Cash Flow Analysis (Sum-of-the-Parts) (Sum-of-the-Parts) (Sum-of-the-Parts) (Consolidated)
Pow ertrain Pow ertrain Pow ertrain Perpetuity Grow th
5.50x—6.50x 5.25x—6.25x 4.75x—5.75x Rate Range: LTM ended 6/30/2016 CY 2016E CY 2017E 1.75%—2.25% Adjusted EBITDAP Adjusted EBITDAP Adjusted EBITDAP
Motorparts Motorparts Motorparts Discount
8.50x—9.50x 8.50x—9.50x 7.50x—8.50x Rate Range: LTM ended 6/30/2016 CY 2016E CY 2017E 9.75%—10.75% Adjusted EBITDAP Adjusted EBITDAP Adjusted EBITDAP
Note: No particular w eight w as attributed to any analysis. Based on 169,040,651 outstanding basic shares and no dilutive shares as of September 1, 2016, per Piston public filings and Company management. The Company has stock appreciation rights outstanding that trigger a payment obligation in the event value exceeds ~$19 / share, per Company management.
Adjusted EBITDAP refers to Earnings Before Interest, Taxes, Depreciation, Amortization and Pension (and OPEB) Expense, adjusted for certain non-recurring items. CY refers to Calendar Year.
LTM refers to Latest 12 Months.
Source: Piston financial projections prepared by Piston management.
CONFIDENTIAL—PRELIMINARY DRAFT—SUBJECT TO FURTHER REVIEW 8
|
Page
1. Executive Summary 3
2. Preliminary Financial Analyses 9
3. Selected Public Market Observations 17
4. Appendix 22
5. Disclaimer 54
|
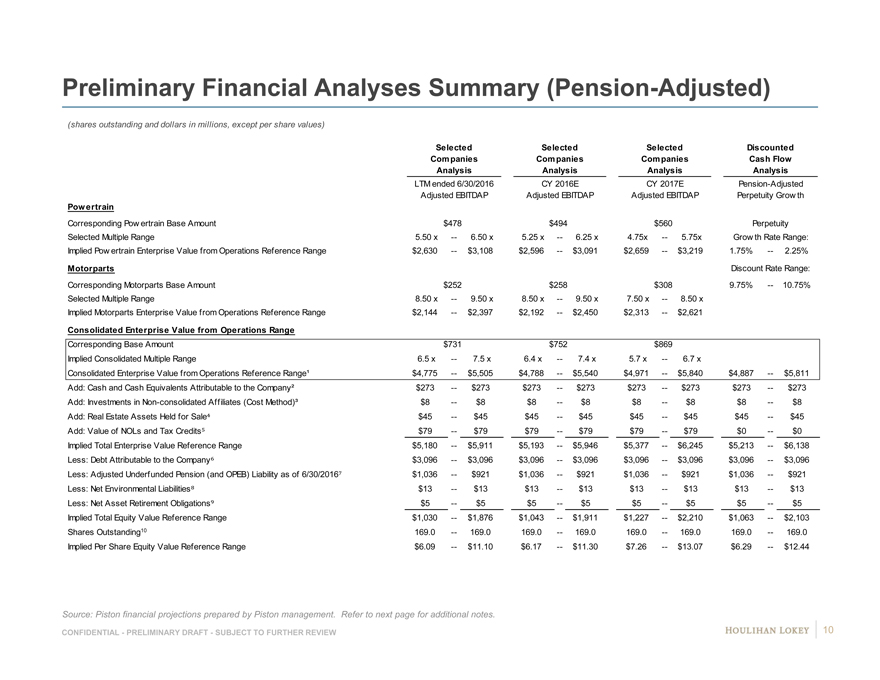
Preliminary Financial Analyses Summary (Pension-Adjusted)
(shares outstanding and dollars in millions, except per share values)
Selected SelectedSelectedDiscounted
Companies CompaniesCompaniesCash Flow
Analysis AnalysisAnalysisAnalysis
LTM ended 6/30/2016 CY 2016ECY 2017EPension-Adjusted
Adjusted EBITDAP Adjusted EBITDAPAdjusted EBITDAPPerpetuity Grow th
Powertrain Discount Rate Range:
Corresponding Pow ertrain Base Amount $478$494$560Perpetuity
Selected Multiple Range 5.50 x —6.50 x5.25 x—6.25 x4.75x—5.75xGrow th Rate Range:
Implied Pow ertrain Enterprise Value from Operations Reference Range $2,630 —$3,108$2,596—$3,091$2,659—$3,2191.75%—2.25%
Motorparts Discount Rate Range:
Corresponding Motorparts Base Amount $252$258$3089.75%—10.75%
Selected Multiple Range 8.50 x —9.50 x8.50 x—9.50 x7.50 x—8.50 x
Implied Motorparts Enterprise Value from Operations Reference Range $2,144 —$2,397$2,192—$2,450$2,313—$2,621
Consolidated Enterprise Value from Operations Range
Corresponding Base Amount $731$752$869
Implied Consolidated Multiple Range 6.5 x —7.5 x6.4 x—7.4 x5.7 x—6.7 x
Consolidated Enterprise Value from Operations Reference Range¹ $4,775 —$5,505$4,788—$5,540$4,971—$5,840$4,887—$5,811
Add: Cash and Cash Equivalents Attributable to the Company² $273 —$273$273—$273$273—$273$273—$273
Add: Investments in Non-consolidated Affiliates (Cost Method)³ $8 —$8$8—$8$8—$8$8—$8
Add: Real Estate Assets Held for Sale $45 —$45$45—$45$45—$45$45—$45
Add: Value of NOLs and Tax Credits $79 —$79$79—$79$79—$79$0—$0
Implied Total Enterprise Value Reference Range $5,180 —$5,911$5,193—$5,946$5,377—$6,245$5,213—$6,138
Less: Debt Attributable to the Company $3,096 —$3,096$3,096—$3,096$3,096—$3,096$3,096—$3,096
Less: Adjusted Underfunded Pension (and OPEB) Liability as of 6/30/2016 $1,036 —$921$1,036—$921$1,036—$921$1,036—$921
Less: Net Environmental Liabilities $13 —$13$13—$13$13—$13$13—$13
Less: Net Asset Retirement Obligations $5 —$5$5—$5$5—$5$5—$5
Implied Total Equity Value Reference Range $1,030 —$1,876$1,043—$1,911$1,227—$2,210$1,063—$2,103
Shares Outstanding10 169.0 —169.0169.0—169.0169.0—169.0169.0—169.0
Implied Per Share Equity Value Reference Range $6.09 —$11.10$6.17—$11.30$7.26—$13.07$6.29—$12.44
Source: Piston financial projections prepared by Piston management. Refer to next page for additional notes.
CONFIDENTIAL—PRELIMINARY DRAFT—SUBJECT TO FURTHER REVIEW 10
|
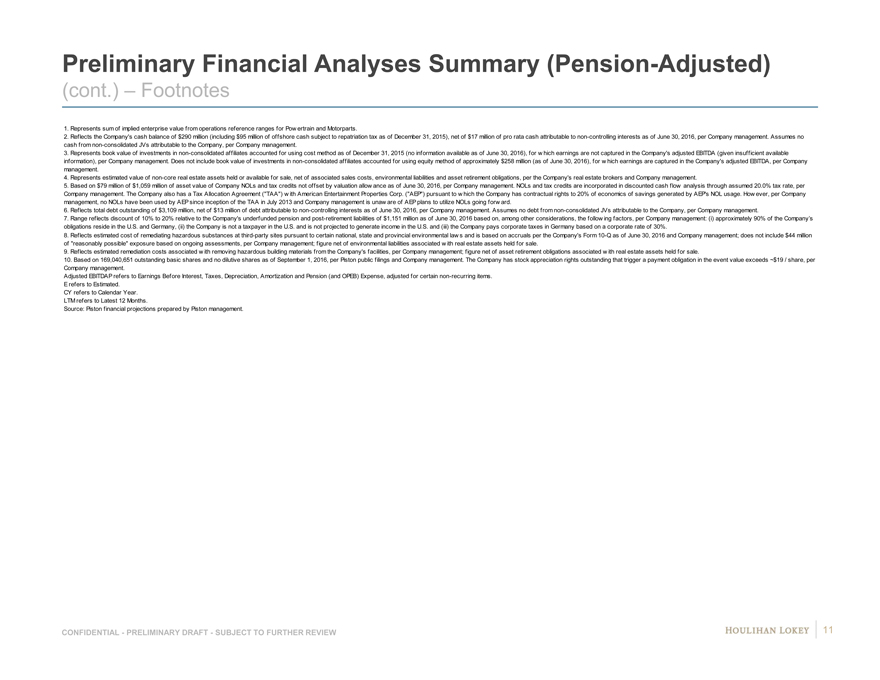
Preliminary Financial Analyses Summary (Pension-Adjusted)
(cont.) – Footnotes
1. Represents sum of implied enterprise value from operations reference ranges for Pow ertrain and Motorparts.
2. Reflects the Company’s cash balance of $290 million (including $95 million of offshore cash subject to repatriation tax as of December 31, 2015), net of $17 million of pro rata cash attributable to non-controlling interests as of June 30, 2016, per Company management. Assumes no cash from non-consolidated JVs attributable to the Company, per Company management.
3. Represents book value of investments in non-consolidated affiliates accounted for using cost method as of December 31, 2015 (no information available as of June 30, 2016), for w hich earnings are not captured in the Company’s adjusted EBITDA (given insufficient available information), per Company management. Does not include book value of investments in non-consolidated affiliates accounted for using equity method of approximately $258 million (as of June 30, 2016), for w hich earnings are captured in the Company’s adjusted EBITDA, per Company management.
4. Represents estimated value of non-core real estate assets held or available for sale, net of associated sales costs, environmental liabilities and asset retirement obligations, per the Company’s real estate brokers and Company management.
5. Based on $79 million of $1,059 million of asset value of Company NOLs and tax credits not offset by valuation allow ance as of June 30, 2016, per Company management. NOLs and tax credits are incorporated in discounted cash flow analysis through assumed 20.0% tax rate, per Company management. The Company also has a Tax Allocation Agreement (“TAA”) w ith American Entertainment Properties Corp. (“AEP”) pursuant to w hich the Company has contractual rights to 20% of economics of savings generated by AEP’s NOL usage. How ever, per Company management, no NOLs have been used by AEP since inception of the TAA in July 2013 and Company management is unaw are of AEP plans to utilize NOLs going forw ard.
6. Reflects total debt outstanding of $3,109 million, net of $13 million of debt attributable to non-controlling interests as of June 30, 2016, per Company management. Assumes no debt from non-consolidated JVs attributable to the Company, per Company management.
7. Range reflects discount of 10% to 20% relative to the Company’s underfunded pension and post-retirement liabilities of $1,151 million as of June 30, 2016 based on, among other considerations, the follow ing factors, per Company management: (i) approximately 90% of the Company’s obligations reside in the U.S. and Germany, (ii) the Company is not a taxpayer in the U.S. and is not projected to generate income in the U.S. and (iii) the Company pays corporate taxes in Germany based on a corporate rate of 30%.
8. Reflects estimated cost of remediating hazardous substances at third-party sites pursuant to certain national, state and provincial environmental law s and is based on accruals per the Company’s Form 10-Q as of June 30, 2016 and Company management; does not include $44 million of “reasonably possible” exposure based on ongoing assessments, per Company management; figure net of environmental liabilities associated w ith real estate assets held for sale.
9. Reflects estimated remediation costs associated w ith removing hazardous building materials from the Company’s facilities, per Company management; figure net of asset retirement obligations associated w ith real estate assets held for sale.
10. Based on 169,040,651 outstanding basic shares and no dilutive shares as of September 1, 2016, per Piston public filings and Company management. The Company has stock appreciation rights outstanding that trigger a payment obligation in the event value exceeds ~$19 / share, per Company management.
Adjusted EBITDAP refers to Earnings Before Interest, Taxes, Depreciation, Amortization and Pension (and OPEB) Expense, adjusted for certain non-recurring items. E refers to Estimated.
CY refers to Calendar Year. LTM refers to Latest 12 Months.
Source: Piston financial projections prepared by Piston management.
CONFIDENTIAL—PRELIMINARY DRAFT—SUBJECT TO FURTHER REVIEW 11
|
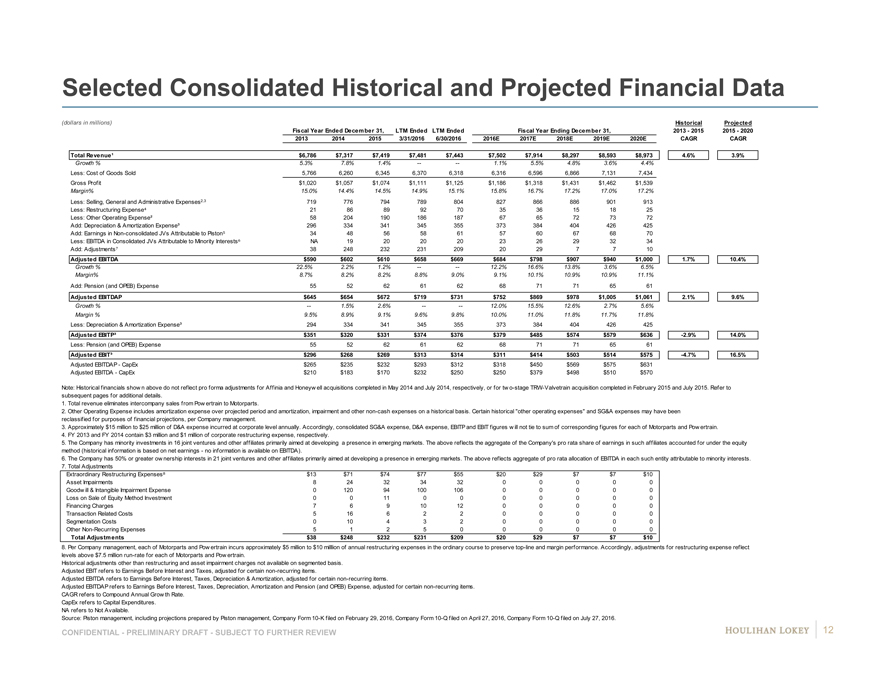
Selected Consolidated Historical and Projected Financial Data
(dollars in millions) HistoricalProjected
Fiscal Year Ended December 31, LTM EndedLTM EndedFiscal Year Ending December 31,2013—20152015—2020
2013 201420153/31/20166/30/20162016E2017E2018E2019E2020ECAGRCAGR
Total Revenue¹ $6,786 $7,317$7,419$7,481$7,443$7,502$7,914$8,297$8,593$8,9734.6%3.9%
Growth % 5.3% 7.8%1.4%——1.1%5.5%4.8%3.6%4.4%
Less: Cost of Goods Sold 5,766 6,2606,3456,3706,3186,3166,5966,8667,1317,434
Gross Profit $1,020 $1,057$1,074$1,111$1,125$1,186$1,318$1,431$1,462$1,539
Margin% 15.0% 14.4%14.5%14.9%15.1%15.8%16.7%17.2%17.0%17.2%
Less: Selling, General and Administrative Expenses2,3 719 776794789804827866886901913
Less: Restructuring Expense? 21 868992703536151825
Less: Other Operating Expense² 58 2041901861876765727372
Add: Depreciation & Amortization Expense³ 296 334341345355373384404426425
Add: Earnings in Non-consolidated JVs Attributable to Piston? 34 485658615760676870
Less: EBITDA in Consolidated JVs Attributable to Minority Interests? NA 192020202326293234
Add: Adjustments? 38 24823223120920297710
Adjusted EBITDA $590 $602$610$658$669$684$798$907$940$1,0001.7%10.4%
Growth % 22.5% 2.2%1.2%——12.2%16.6%13.8%3.6%6.5%
Margin% 8.7% 8.2%8.2%8.8%9.0%9.1%10.1%10.9%10.9%11.1%
Add: Pension (and OPEB) Expense 55 526261626871716561
Adjusted EBITDAP $645 $654$672$719$731$752$869$978$1,005$1,0612.1%9.6%
Growth % — 1.5%2.6%——12.0%15.5%12.6%2.7%5.6%
Margin % 9.5% 8.9%9.1%9.6%9.8%10.0%11.0%11.8%11.7%11.8%
Less: Depreciation & Amortization Expense³ 294 334341345355373384404426425
Adjusted EBITP³ $351 $320$331$374$376$379$485$574$579$636-2.9%14.0%
Less: Pension (and OPEB) Expense 55 526261626871716561
Adjusted EBIT³ $296 $268$269$313$314$311$414$503$514$575-4.7%16.5%
Adjusted EBITDAP—CapEx $265 $235$232$293$312$318$450$569$575$631
Adjusted EBITDA—CapEx $210 $183$170$232$250$250$379$498$510$570
Note: Historical financials show n above do not reflect pro forma adjustments for Affinia and Honeyw ell acquisitions completed in May 2014 and July 2014, respectively, or for tw o-stage TRW-Valvetrain acquisition completed in February 2015 and July 2015. Refer to
subsequent pages for additional details.
1. Total revenue eliminates intercompany sales from Pow ertrain to Motorparts.
2. Other Operating Expense includes amortization expense over projected period and amortization, impairment and other non-cash expenses on a historical basis. Certain historical “other operating expenses” and SG&A expenses may have been
reclassified for purposes of financial projections, per Company management.
3. Approximately $15 million to $25 million of D&A expense incurred at corporate level annually. Accordingly, consolidated SG&A expense, D&A expense, EBITP and EBIT figures w ill not tie to sum of corresponding figures for each of Motorparts and Pow ertrain.
4. FY 2013 and FY 2014 contain $3 million and $1 million of corporate restructuring expense, respectively.
5. The Company has minority investments in 16 joint ventures and other affiliates primarily aimed at developing a presence in emerging markets. The above reflects the aggregate of the Company’s pro rata share of earnings in such affiliates accounted for under the equity
method (historical information is based on net earnings—no information is available on EBITDA).
6. The Company has 50% or greater ow nership interests in 21 joint ventures and other affiliates primarily aimed at developing a presence in emerging markets. The above reflects aggregate of pro rata allocation of EBITDA in each such entity attributable to minority interests.
7. Total Adjustments
Extraordinary Restructuring Expenses? $13 $71$74$77$55$20$29$7$7$10
Asset Impairments 8 2432343200000
Goodw ill & Intangible Impairment Expense 0 1209410010600000
Loss on Sale of Equity Method Investment 0 0110000000
Financing Charges 7 69101200000
Transaction Related Costs 5 1662200000
Segmentation Costs 0 1043200000
Other Non-Recurring Expenses 5 125000000
Total Adjustments $38 $248$232$231$209$20$29$7$7$10
8. Per Company management, each of Motorparts and Pow ertrain incurs approximately $5 million to $10 milllion of annual restructuring expenses in the ordinary course to preserve top-line and margin performance. Accordingly, adjustments for restructuring expense reflect
levels above $7.5 million run-rate for each of Motorparts and Pow ertrain.
Historical adjustments other than restructuring and asset impairment charges not available on segmented basis.
Adjusted EBIT refers to Earnings Before Interest and Taxes, adjusted for certain non-recurring items.
Adjusted EBITDA refers to Earnings Before Interest, Taxes, Depreciation & Amortization, adjusted for certain non-recurring items.
Adjusted EBITDAP refers to Earnings Before Interest, Taxes, Depreciation, Amortization and Pension (and OPEB) Expense, adjusted for certain non-recurring items.
CAGR refers to Compound Annual Grow th Rate.
CapEx refers to Capital Expenditures.
NA refers to Not Available.
Source: Piston management, including projections prepared by Piston management, Company Form 10-K filed on February 29, 2016, Company Form 10-Q filed on April 27, 2016, Company Form 10-Q filed on July 27, 2016.
CONFIDENTIAL—PRELIMINARY DRAFT—SUBJECT TO FURTHER REVIEW 12
|

Selected Powertrain Historical and Projected Financial Data
(dollars in millions) Fiscal Year Ended December 31, LTM EndedLTM EndedFiscal Year Ending December 31,HistoricalProjected
2013 201420153/31/20166/30/20162016E2017E2018E2019E2020E2013—20152015—2020
Shipments $4,173 $4,430$4,450$4,440$4,445$4,490$4,906$5,206$5,478$5,714CAGRCAGR
Growth % — 6.2%0.5%——0.9%9.3%6.1%5.2%4.3%
Net Revenue¹ $3,889 $4,163$4,198$4,201$4,217$4,253$4,666$4,966$5,238$5,4743.9%5.5%
Growth % — 7.0%0.8%——1.3%9.7%6.4%5.5%4.5%
Less: Cost of Goods Sold 3,372 3,6303,6613,6703,6753,6784,0044,2374,4674,668
Gross Profit $517 $533$537$531$542$575$662$729$771$806
Margin% 13.3% 12.8%12.8%12.6%12.9%13.5%14.2%14.7%14.7%14.7%
Less: Selling, General and Administrative Expenses² 345 333388381380349386400413421
Less: Restructuring Expense 17 593339392100315
Less: Other Operating Expense² 0 00002722292929
Add: Depreciation & Amortization Expense 178 196208212219217219236261264
Add: Earnings in Non-consolidated JVs Attributable to Pow ertrain³ 25 354343434647525252
Less: EBITDA in Consolidated JVs Attributable to Minority Interests? NA 161818182023262829
Add: Adjustments? 15 59556159140008
Adjusted EBITDA $373 $414$403$408$425$434$497$562$611$6364.0%9.5%
Growth % 22.5% 11.2%-2.6%——7.7%14.5%13.1%8.7%4.0%
Margin% 9.6% 9.9%9.6%9.7%10.1%10.2%10.7%11.3%11.7%11.6%
Add: Pension (and OPEB) Expense 49 445352536062625753
Adjusted EBITDAP $421 $458$456$460$478$494$560$625$668$6894.1%8.6%
Growth % — 8.8%-0.4%——8.4%13.2%11.6%6.9%3.1%
Margin % 10.8% 11.0%10.9%10.9%11.3%11.6%12.0%12.6%12.8%12.6%
Less: Depreciation & Amortization Expense 178 196208212219217219236261264
Adjusted EBITP $243 $262$248$248$259$277$341$389$407$4251.0%11.3%
Less: Pension (and OPEB) Expense 49 445352536062625753
Adjusted EBIT $195 $218$195$196$206$217$278$326$350$3720.2%13.7%
Margin % 5.0% 5.2%4.7%4.7%4.9%5.1%6.0%6.6%6.7%6.8%
Adjusted EBITDAP—CapEx $145 $190$155$161$169$196$267$336$358$369
Adjusted EBITDA—CapEx $97 $146$102$109$116$136$204$273$301$316
Note: Historical financials show n above do not reflect pro forma adjustments for tw o-stage TRW-Valvetrain acquisition completed in February 2015 and July 2015. Per Company management, 2015 revenue and EBITDA w ould need to be
adjusted by $107 million and $13 million, respectively, to reflect pro forma full-year impact of TRW-Valvetrain acquisition. Per Company management, full year 2015 revenue and EBITDA for TRW-Valvetrain of $524 million and $67 million,
respectively, approximates 2013 and 2014 performance of the entity.
1. Net revenue adjusted for intercompany transactions.
2. “Other operating expenses” have been combined w ith SG&A expenses in historical periods given insufficient segment-level detail.
3. The Company has minority investments in 16 joint ventures and other affiliates primarily aimed at developing a presence in emerging markets. The above reflects the aggregate of Pow ertrain’s pro rata share of earnings in such affiliates accounted for
under the equity method (historical information is based on net earnings—no information is available on EBITDA).
4. The Company has 50% or greater ow nership interests in 21 joint ventures and other affiliates primarily aimed at developing a presence in emerging markets and 100% of EBITDA associated w ith such JVs associated w ith Pow ertrain is consolidated in
above financials. The above reflects aggregate of Pow ertrain’s pro rata allocation of EBITDA in each such entity attributable to minority interests.
5. Total Adjustments
Extraordinary Restructuring Expenses? $10 $52$26$32$32$14$0$0$0$8
Asset Impairments 5 729292700000
Total Adjustments $15 $59$55$61$59$14$0$0$0$8
6. Per Company management, Pow ertrain incurs approximately $5 million to $10 milllion of annual restructuring expenses in the ordinary course to preserve top-line and margin performance. Accordingly, adjustments for restructuring
expense reflect levels above $7.5 million run-rate for Pow ertrain.
Adjusted EBIT refers to Earnings Before Interest and Taxes, adjusted for certain non-recurring items.
Adjusted EBITDA refers to Earnings Before Interest, Taxes, Depreciation & Amortization, adjusted for certain non-recurring items.
Adjusted EBITDAP refers to Earnings Before Interest, Taxes, Depreciation, Amortization and Pension (and OPEB) Expense, adjusted for certain non-recurring items.
CAGR refers to Compound Annual Grow th Rate.
CapEx refers to Capital Expenditures.
NA refers to Not Available.
Source: Piston management, including projections prepared by Piston management, Company Form 10-K filed on February 29, 2016, Company Form 10-Q filed on April 27, 2016, Company Form 10-Q filed on July 27, 2016.
CONFIDENTIAL—PRELIMINARY DRAFT—SUBJECT TO FURTHER REVIEW 13
|
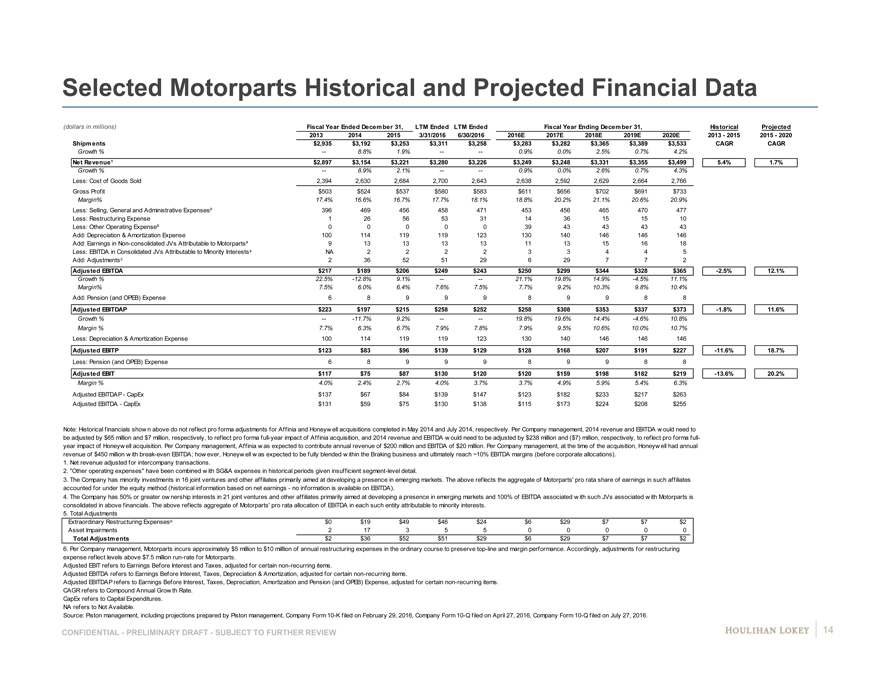
Selected Motorparts Historical and Projected Financial Data
(dollars in millions) Fiscal Year Ended December 31, LTM EndedLTM EndedFiscal Year Ending December 31,HistoricalProjected
2013 201420153/31/20166/30/20162016E2017E2018E2019E2020E2013—20152015—2020
Shipments $2,935 $3,192$3,253$3,311$3,258$3,283$3,282$3,365$3,389$3,533CAGRCAGR
Growth % — 8.8%1.9%——0.9%0.0%2.5%0.7%4.2%
Net Revenue¹ $2,897 $3,154$3,221$3,280$3,226$3,249$3,248$3,331$3,355$3,4995.4%1.7%
Growth % — 8.9%2.1%——0.9%0.0%2.6%0.7%4.3%
Less: Cost of Goods Sold 2,394 2,6302,6842,7002,6432,6382,5922,6292,6642,766
Gross Profit $503 $524$537$580$583$611$656$702$691$733
Margin% 17.4% 16.6%16.7%17.7%18.1%18.8%20.2%21.1%20.6%20.9%
Less: Selling, General and Administrative Expenses² 396 469456458471453456465470477
Less: Restructuring Expense 1 265653311436151510
Less: Other Operating Expense² 0 00003943434343
Add: Depreciation & Amortization Expense 100 114119119123130140146146146
Add: Earnings in Non-consolidated JVs Attributable to Motorparts³ 9 131313131113151618
Less: EBITDA in Consolidated JVs Attributable to Minority Interests? NA 222233445
Add: Adjustments? 2 36525129629772
Adjusted EBITDA $217 $189$206$249$243$250$299$344$328$365-2.5%12.1%
Growth % 22.5% -12.8%9.1%——21.1%19.8%14.9%-4.5%11.1%
Margin% 7.5% 6.0%6.4%7.6%7.5%7.7%9.2%10.3%9.8%10.4%
Add: Pension (and OPEB) Expense 6 899989988
Adjusted EBITDAP $223 $197$215$258$252$258$308$353$337$373-1.8%11.6%
Growth % — -11.7%9.2%——19.8%19.6%14.4%-4.6%10.8%
Margin % 7.7% 6.3%6.7%7.9%7.8%7.9%9.5%10.6%10.0%10.7%
Less: Depreciation & Amortization Expense 100 114119119123130140146146146
Adjusted EBITP $123 $83$96$139$129$128$168$207$191$227-11.6%18.7%
Less: Pension (and OPEB) Expense 6 899989988
Adjusted EBIT $117 $75$87$130$120$120$159$198$182$219-13.6%20.2%
Margin % 4.0% 2.4%2.7%4.0%3.7%3.7%4.9%5.9%5.4%6.3%
Adjusted EBITDAP—CapEx $137 $67$84$139$147$123$182$233$217$263
Adjusted EBITDA—CapEx $131 $59$75$130$138$115$173$224$208$255
Note: Historical financials show n above do not reflect pro forma adjustments for Affinia and Honeyw ell acquisitions completed in May 2014 and July 2014, respectively. Per Company management, 2014 revenue and EBITDA w ould need to
be adjusted by $65 million and $7 million, respectively, to reflect pro forma full-year impact of Affinia acquisition, and 2014 revenue and EBITDA w ould need to be adjusted by $238 million and ($7) million, respectively, to reflect pro forma full-
year impact of Honeyw ell acquisition. Per Company management, Affinia w as expected to contribute annual revenue of $200 million and EBITDA of $20 million. Per Company management, at the time of the acquisition, Honeyw ell had annual
revenue of $450 million w ith break-even EBITDA; how ever, Honeyw ell w as expected to be fully blended w ithin the Braking business and ultimately reach ~10% EBITDA margins (before corporate allocations).
1. Net revenue adjusted for intercompany transactions.
2. “Other operating expenses” have been combined w ith SG&A expenses in historical periods given insufficient segment-level detail.
3. The Company has minority investments in 16 joint ventures and other affiliates primarily aimed at developing a presence in emerging markets. The above reflects the aggregate of Motorparts’ pro rata share of earnings in such affiliates
accounted for under the equity method (historical information based on net earnings—no information is available on EBITDA).
4. The Company has 50% or greater ow nership interests in 21 joint ventures and other affiliates primarily aimed at developing a presence in emerging markets and 100% of EBITDA associated w ith such JVs associated w ith Motorparts is
consolidated in above financials. The above reflects aggregate of Motorparts’ pro rata allocation of EBITDA in each such entity attributable to minority interests.
5. Total Adjustments
Extraordinary Restructuring Expenses? $0 $19$49$46$24$6$29$7$7$2
Asset Impairments 2 1735500000
Total Adjustments $2 $36$52$51$29$6$29$7$7$2
6. Per Company management, Motorparts incurs approximately $5 million to $10 milllion of annual restructuring expenses in the ordinary course to preserve top-line and margin performance. Accordingly, adjustments for restructuring
expense reflect levels above $7.5 million run-rate for Motorparts.
Adjusted EBIT refers to Earnings Before Interest and Taxes, adjusted for certain non-recurring items.
Adjusted EBITDA refers to Earnings Before Interest, Taxes, Depreciation & Amortization, adjusted for certain non-recurring items.
Adjusted EBITDAP refers to Earnings Before Interest, Taxes, Depreciation, Amortization and Pension (and OPEB) Expense, adjusted for certain non-recurring items.
CAGR refers to Compound Annual Grow th Rate.
CapEx refers to Capital Expenditures.
NA refers to Not Available.
Source: Piston management, including projections prepared by Piston management, Company Form 10-K filed on February 29, 2016, Company Form 10-Q filed on April 27, 2016, Company Form 10-Q filed on July 27, 2016.
CONFIDENTIAL—PRELIMINARY DRAFT—SUBJECT TO FURTHER REVIEW 14
|
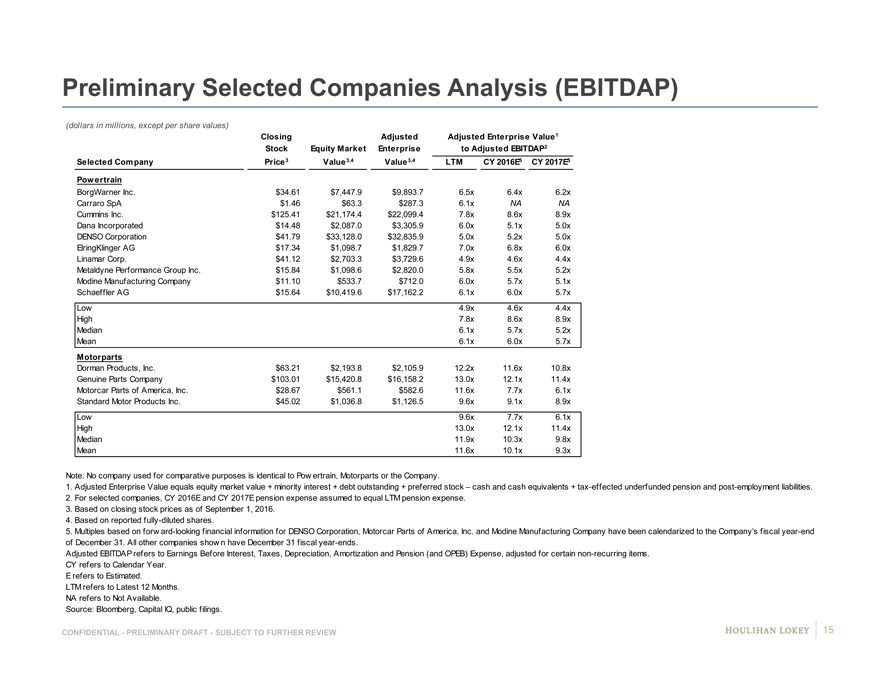
Preliminary Selected Companies Analysis (EBITDAP)
(dollars in millions, except per share values)
Closing AdjustedAdjusted Enterprise Value1
Stock Equity MarketEnterpriseto Adjusted EBITDAP2
Selected Company Price 3 Value 3,4Value 3,4LTMCY 2016E5CY 2017E5
Powertrain
BorgWarner Inc. $34.61 $7,447.9$9,893.76.5x6.4x6.2x6 9
Carraro SpA $1.46 $63.3$287.36.1xNANA N NA
Cummins Inc. $125.41 $21,174.4$22,099.47.8x8.6x8.9x9 #
Dana Incorporated $14.48 $2,087.0$3,305.96.0x5.1x5.0x5 9
DENSO Corporation $41.79 $33,128.0$32,835.95.0x5.2x5.0x5 #
ElringKlinger AG $17.34 $1,098.7$1,829.77.0x6.8x6.0x6 #
Linamar Corp. $41.12 $2,703.3$3,729.64.9x4.6x4.4x4 9
Metaldyne Performance Group Inc. $15.84 $1,098.6$2,820.05.8x5.5x5.2x5 9
Modine Manufacturing Company $11.10 $533.7$712.06.0x5.7x5.1x5 #
Schaeffler AG $15.64 $10,419.6$17,162.26.1x6.0x5.7x6 #
Low 4.9x4.6x4.4x
High 7.8x8.6x8.9x
Median 6.1x5.7x5.2x
Mean 6.1x6.0x5.7x
Motorparts
Dorman Products, Inc. $63.21 $2,193.8$2,105.912.2x11.6x10.8x# #
Genuine Parts Company $103.01 $15,420.8$16,158.213.0x12.1x11.4x# #
Motorcar Parts of America, Inc. $28.67 $561.1$582.611.6x7.7x6.1x6 6
Standard Motor Products Inc. $45.02 $1,036.8$1,126.59.6x9.1x8.9x9 NA
Low 9.6x7.7x6.1x
High 13.0x12.1x11.4x
Median 11.9x10.3x9.8x
Mean 11.6x10.1x9.3x
Note: No company used for comparative purposes is identical to Pow ertrain, Motorparts or the Company.
1. Adjusted Enterprise Value equals equity market value + minority interest + debt outstanding + preferred stock – cash and cash equivalents + tax-effected underfunded pension and post-employment liabilities.
2. For selected companies, CY 2016E and CY 2017E pension expense assumed to equal LTM pension expense.
3. Based on closing stock prices as of September 1, 2016.
4. Based on reported fully-diluted shares.
5. Multiples based on forw ard-looking financial information for DENSO Corporation, Motorcar Parts of America, Inc. and Modine Manufacturing Company have been calendarized to the Company’s fiscal year-end
of December 31. All other companies show n have December 31 fiscal year-ends.
Adjusted EBITDAP refers to Earnings Before Interest, Taxes, Depreciation, Amortization and Pension (and OPEB) Expense, adjusted for certain non-recurring items.
CY refers to Calendar Year.
E refers to Estimated.
LTM refers to Latest 12 Months.
NA refers to Not Available.
Source: Bloomberg, Capital IQ, public filings.
CONFIDENTIAL—PRELIMINARY DRAFT—SUBJECT TO FURTHER REVIEW 15
|
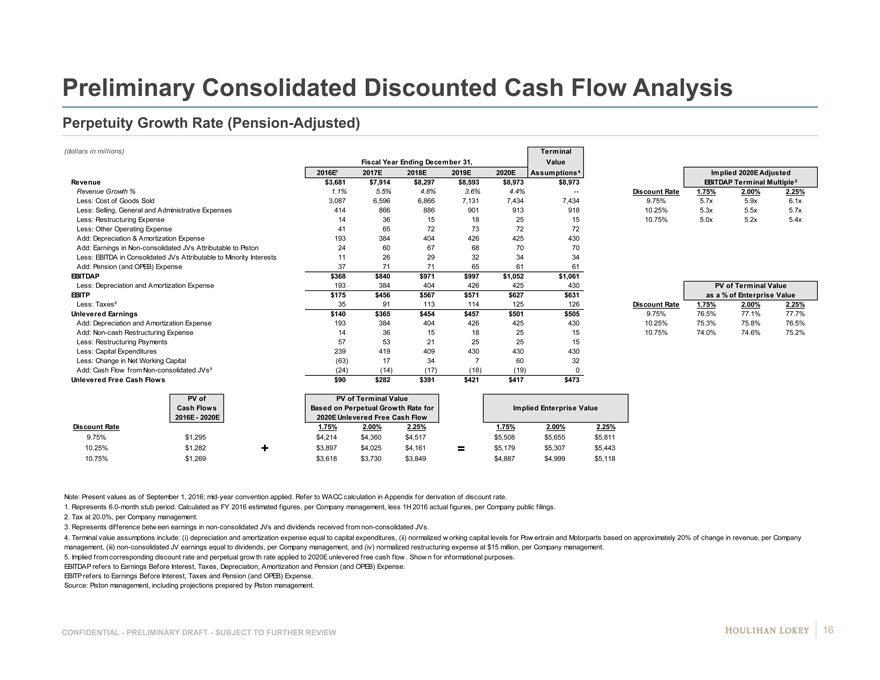
Preliminary Consolidated Discounted Cash Flow Analysis
Perpetuity Growth Rate (Pension-Adjusted)
(dollars in millions) Terminal
Fiscal Year Ending December 31,Value
2016E¹2017E2018E2019E2020E Assumptions?Implied 2020E Adjusted
Revenue $3,681$7,914$8,297$8,593$8,973$8,973EBITDAP Terminal Multiple?
Revenue Growth % 1.1%5.5%4.8%3.6%4.4%—Discount Rate1.75%2.00%2.25%
Less: Cost of Goods Sold 3,0876,5966,8667,1317,4347,4349.75%5.7x5.9x6.1x
Less: Selling, General and Administrative Expenses 41486688690191391810.25%5.3x5.5x5.7x
Less: Restructuring Expense 14361518251510.75%5.0x5.2x5.4x
Less: Other Operating Expense 416572737272
Add: Depreciation & Amortization Expense 193384404426425430
Add: Earnings in Non-consolidated JVs Attributable to Piston 24 6067687070
Less: EBITDA in Consolidated JVs Attributable to Minority Interests 11 2629323434
Add: Pension (and OPEB) Expense 377171656161
EBITDAP $368$840$971$997$1,052$1,061
Less: Depreciation and Amortization Expense 193384404426425430PV of Terminal Value
EBITP $175$456$567$571$627$631as a % of Enterprise Value
Less: Taxes² 3591113114125126Discount Rate1.75%2.00%2.25%
Unlevered Earnings $140$365$454$457$501$5059.75%76.5%77.1%77.7%
Add: Depreciation and Amortization Expense 19338440442642543010.25%75.3%75.8%76.5%
Add: Non-cash Restructuring Expense 14361518251510.75%74.0%74.6%75.2%
Less: Restructuring Payments 575321252515
Less: Capital Expenditures 239419409430430430
Less: Change in Net Working Capital (63)173476032
Add: Cash Flow from Non-consolidated JVs³ (24)(14)(17)(18)(19)0
Unlevered Free Cash Flows $90$282$391$421$417$473
PV ofPV of Terminal Value
Cash FlowsBased on Perpetual Growth Rate forImplied Enterprise Value
2016E—2020E2020E Unlevered Free Cash Flow
Discount Rate 1.75%2.00%2.25%1.75%2.00%2.25%
9.75% 0.098 $1,295$4,214$4,360$4,517$5,508$5,655$5,811
10.25% 0.103 $1,282+$3,897$4,025$4,161=$5,179$5,307$5,443
10.75% 0.108 $1,269$3,618$3,730$3,849$4,887$4,999$5,118
Note: Present values as of September 1, 2016; mid-year convention applied. Refer to WACC calculation in Appendix for derivation of discount rate.
1. Represents 6.0-month stub period. Calculated as FY 2016 estimated figures, per Company management, less 1H 2016 actual figures, per Company public filings.
2. Tax at 20.0%, per Company management.
3. Represents difference betw een earnings in non-consolidated JVs and dividends received from non-consolidated JVs.
4. Terminal value assumptions include: (i) depreciation and amortization expense equal to capital expenditures, (ii) normalized w orking capital levels for Pow ertrain and Motorparts based on approximately 20% of change in revenue, per Company
management, (iii) non-consolidated JV earnings equal to dividends, per Company management, and (iv) normalized restructuring expense at $15 million, per Company management.
5. Implied from corresponding discount rate and perpetual grow th rate applied to 2020E unlevered free cash flow . Show n for informational purposes.
EBITDAP refers to Earnings Before Interest, Taxes, Depreciation, Amortization and Pension (and OPEB) Expense.
EBITP refers to Earnings Before Interest, Taxes and Pension (and OPEB) Expense.
Source: Piston management, including projections prepared by Piston management.
CONFIDENTIAL—PRELIMINARY DRAFT—SUBJECT TO FURTHER REVIEW 16
|
Page
1. Executive Summary 3
2. Preliminary Financial Analyses 9
3. Selected Public Market Observations 17
4. Appendix 22
5. Disclaimer 54
|
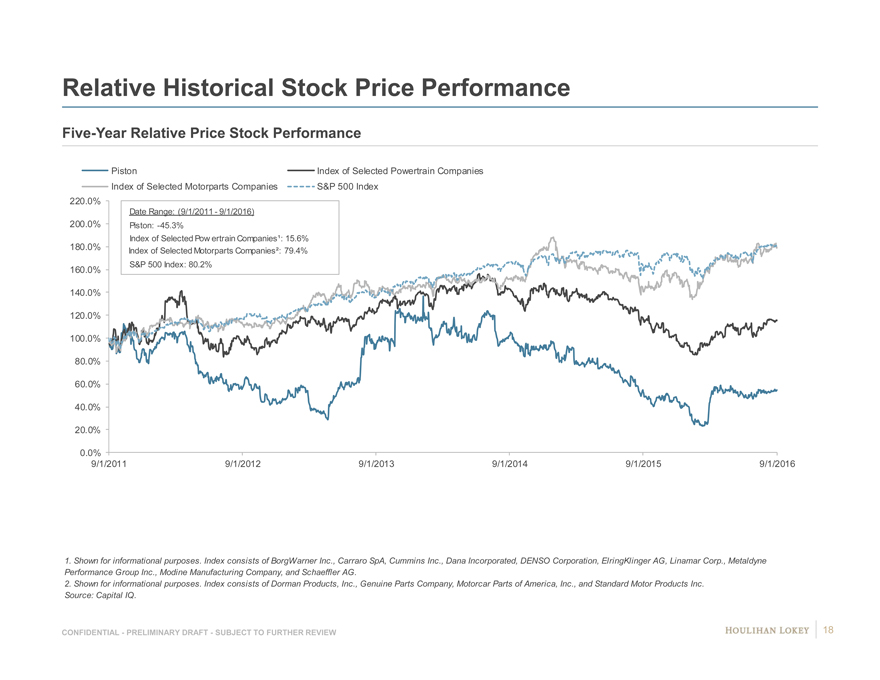
Relative Historical Stock Price Performance
Five-Year Relative Price Stock Performance
Piston Index of Selected Powertrain Companies Index of Selected Motorparts Companies S&P 500 Index 220.0%
Date Range: (9/1/2011—9/1/2016) 200.0% Piston: -45.3%
180.0% Index of Selected Pow ertrain Companies¹: 15.6% Index of Selected Motorparts Companies²: 79.4% S&P 500 Index: 80.2%
160.0% 140.0% 120.0% 100.0%
80.0%
60.0%
40.0%
20.0%
0.0%
9/1/2011 9/1/2012 9/1/2013 9/1/2014 9/1/2015 9/1/2016
1. Shown for informational purposes. Index consists of BorgWarner Inc., Carraro SpA, Cummins Inc., Dana Incorporated, DENSO Corporation, ElringKlinger AG, Linamar Corp., Metaldyne Performance Group Inc., Modine Manufacturing Company, and Schaeffler AG.
2. Shown for informational purposes. Index consists of Dorman Products, Inc., Genuine Parts Company, Motorcar Parts of America, Inc., and Standard Motor Products Inc.
Source: Capital IQ.
CONFIDENTIAL—PRELIMINARY DRAFT—SUBJECT TO FURTHER REVIEW 18
|
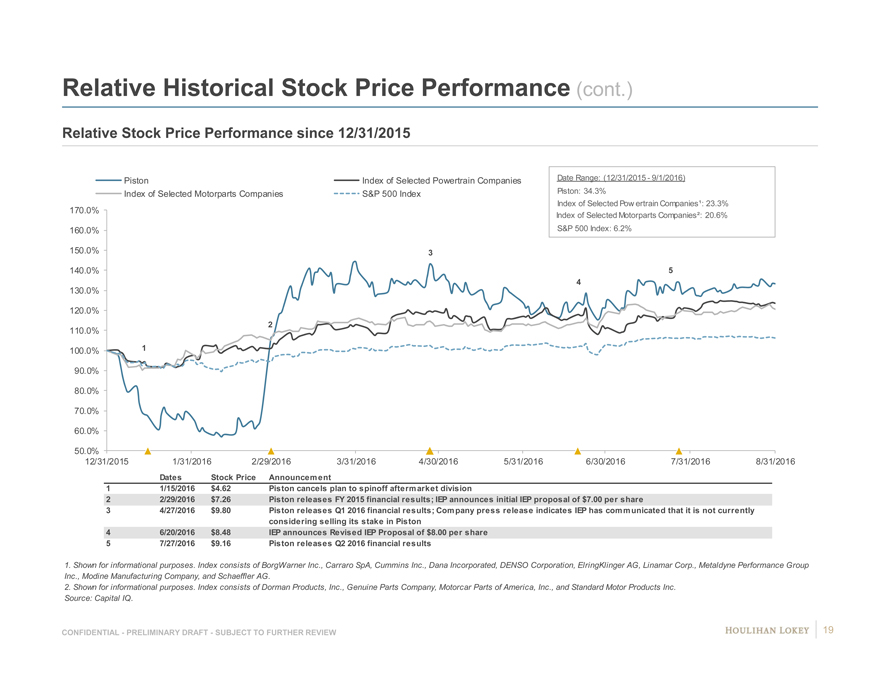
Relative Historical Stock Price Performance (cont.)
Relative Stock Price Performance since 12/31/2015
Piston Index of Selected Powertrain Companies Date Range: (12/31/2015—9/1/2016) Index of Selected Motorparts Companies S&P 500 Index Piston: 34.3%
Index of Selected Pow ertrain Companies¹: 23.3%
170.0%
Index of Selected Motorparts Companies²: 20.6% 160.0% S&P 500 Index: 6.2%
150.0% 3
140.0% 5 4
130.0%
120.0%
2
110.0%
100.0% 1 90.0%
80.0% 70.0% 60.0%
50.0%
12/31/2015 1/31/2016 2/29/2016 3/31/2016 4/30/2016 5/31/2016 6/30/2016 7/31/2016 8/31/2016
Dates Stock Price Announcement
1 1/15/2016 $4.62 Piston cancels plan to spinoff aftermarket division
2 2/29/2016 $7.26 Piston releases FY 2015 financial results; IEP announces initial IEP proposal of $7.00 per share
3 4/27/2016 $9.80 Piston releases Q1 2016 financial results; Company press release indicates IEP has communicated that it is not currently considering selling its stake in Piston
4 6/20/2016 $8.48 IEP announces Revised IEP Proposal of $8.00 per share
5 7/27/2016 $9.16 Piston releases Q2 2016 financial results
1. Shown for informational purposes. Index consists of BorgWarner Inc., Carraro SpA, Cummins Inc., Dana Incorporated, DENSO Corporation, ElringKlinger AG, Linamar Corp., Metaldyne Performance Group Inc., Modine Manufacturing Company, and Schaeffler AG.
2. Shown for informational purposes. Index consists of Dorman Products, Inc., Genuine Parts Company, Motorcar Parts of America, Inc., and Standard Motor Products Inc.
Source: Capital IQ.
CONFIDENTIAL—PRELIMINARY DRAFT—SUBJECT TO FURTHER REVIEW 19
|
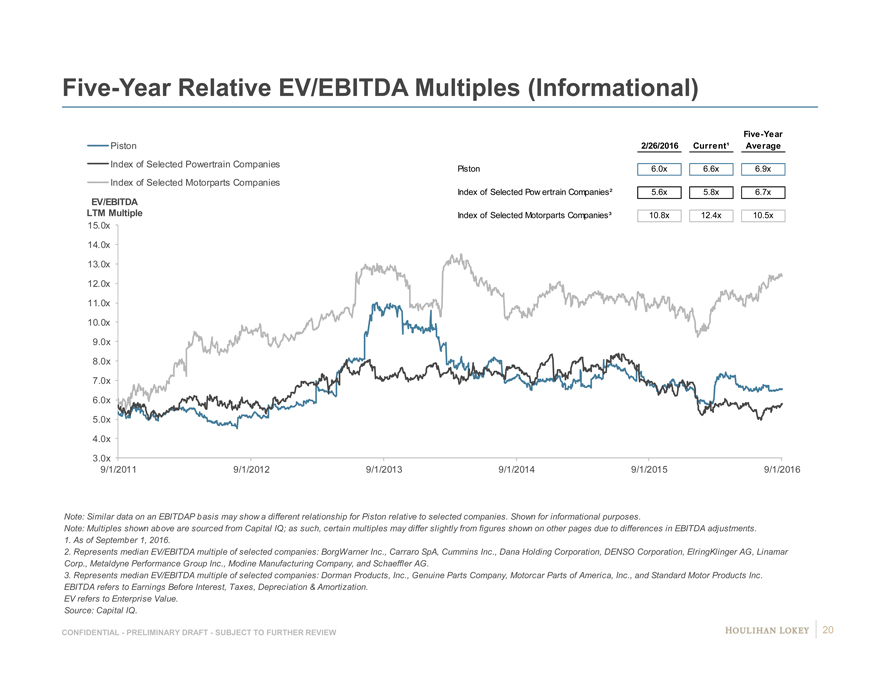
Five-Year Relative EV/EBITDA Multiples (Informational)
Five-Year
Piston 2/26/2016Current¹Average
Index of Selected Powertrain Companies Piston6.0x6.6x6.9x
Index of Selected Motorparts Companies
Index of Selected Pow ertrain Companies²5.6x5.8x6.7x
EV/EBITDA
LTM Multiple Index of Selected Motorparts Companies³10.8x12.4x10.5x
15.0x
14.0x
13.0x
12.0x
11.0x
10.0x
9.0x
8.0x
7.0x
6.0x
5.0x
4.0x
3.0x
9/1/2011 9/1/2012 9/1/20139/1/20149/1/20159/1/2016
Note: Similar data on an EBITDAP basis may show a different relationship for Piston relative to selected companies. Shown for informational purposes.
Note: Multiples shown above are sourced from Capital IQ; as such, certain multiples may differ slightly from figures shown on other pages due to differences in EBITDA adjustments.
1. As of September 1, 2016.
2. Represents median EV/EBITDA multiple of selected companies: BorgWarner Inc., Carraro SpA, Cummins Inc., Dana Holding Corporation, DENSO Corporation, ElringKlinger AG, Linamar
Corp., Metaldyne Performance Group Inc., Modine Manufacturing Company, and Schaeffler AG.
3. Represents median EV/EBITDA multiple of selected companies: Dorman Products, Inc., Genuine Parts Company, Motorcar Parts of America, Inc., and Standard Motor Products Inc.
EBITDA refers to Earnings Before Interest, Taxes, Depreciation & Amortization.
EV refers to Enterprise Value.
Source: Capital IQ.
CONFIDENTIAL—PRELIMINARY DRAFT—SUBJECT TO FURTHER REVIEW 20
|
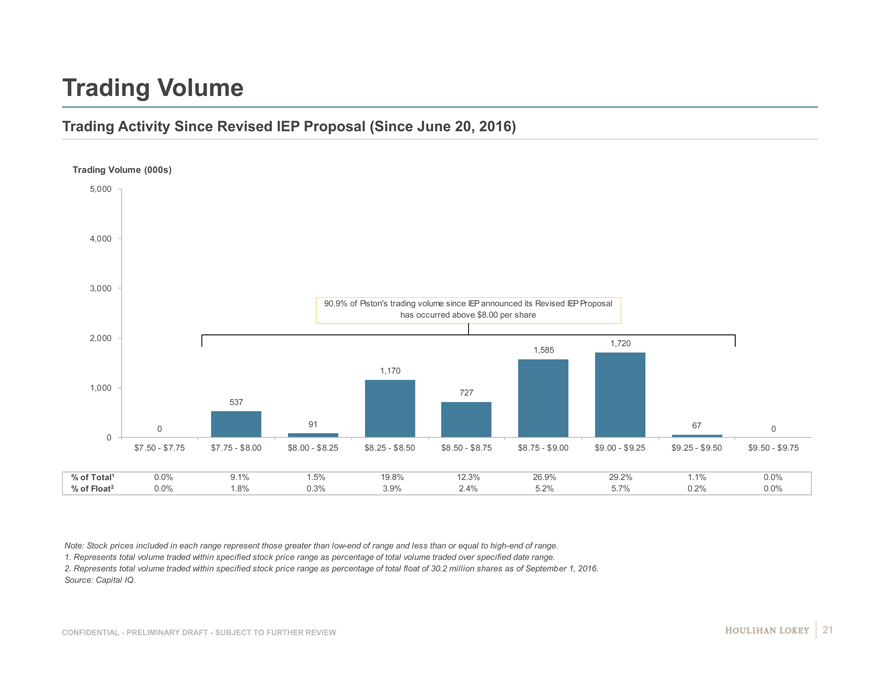
Trading Volume
Trading Activity Since Revised IEP Proposal (Since June 20, 2016)
Trading Volume (000s)
5,000
4,000
3,000
90.9% of Piston’s trading volume since IEP announced its Revised IEP Proposal
has occurred above $8.00 per share
2,000 1,720
1,585
1,170
1,000 727
537
0 91670
0
$7 .50—$7.75 $7.75—$8.00$8.00—$8.25$8.25—$8.50$8.50—$8.75$8.75—$9.00$9.00—$9.25$9.25—$9.50$9.50—$9.75
% of Total1 0.0% 9.1%1.5%19.8%12.3%26.9%29.2%1.1%0.0%
% of Float2 0.0% 1.8%0.3%3.9%2.4%5.2%5.7%0.2%0.0%
Note: Stock prices included in each range represent those greater than low-end of range and less than or equal to high-end of range.
1. Represents total volume traded within specified stock price range as percentage of total volume traded over specified date range.
2. Represents total volume traded within specified stock price range as percentage of total float of 30.2 million shares as of September 1, 2016.
Source: Capital IQ.
CONFIDENTIAL—PRELIMINARY DRAFT—SUBJECT TO FURTHER REVIEW 21
|
Page
1. Executive Summary 3
2. Preliminary Financial Analyses 9
3. Selected Public Market Observations 17
4. Appendix 22 Company Financial Update 23 Cost of Capital Considerations 26 Selected Companies—Operating Statistics 32 Company Financial Performance Observations 36 Implied Premiums Paid Observations 39 Illustrative Preliminary Financial Analyses (EBITDA) 42
5. Disclaimer 54
|
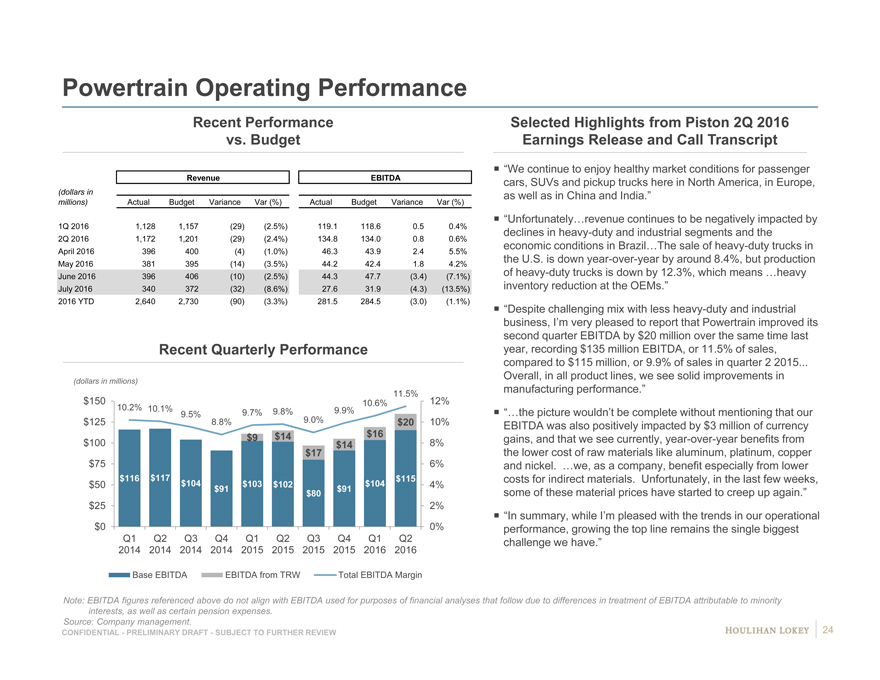
Powertrain Operating Performance
Recent Performance vs. Budget
Revenue EBITDA
(dollars in millions) Actual Budget Variance Var (%) Actual Budget Variance Var (%)
1Q 2016 1,128 1,157 (29) (2.5%) 119.1 118.6 0.5 0.4%
2Q 2016 1,172 1,201 (29) (2.4%) 134.8 134.0 0.8 0.6% April 2016 396 400 (4) (1.0%) 46.3 43.9 2.4 5.5% May 2016 381 395 (14) (3.5%) 44.2 42.4 1.8 4.2% June 2016 396 406 (10) (2.5%) 44.3 47.7 (3.4) (7.1%) July 2016 340 372 (32) (8.6%) 27.6 31.9 (4.3) (13.5%) 2016 YTD 2,640 2,730 (90) (3.3%) 281.5 284.5 (3.0) (1.1%)
Recent Quarterly Performance
(dollars in millions)
11.5% $150 10.6% 12%
10.2% 10.1% 9.9% 9.5% 9.7% 9.8% 9.0% $125 8.8% $20 10% $100 $9 $14 $16 8% $14 $17
$75 6% $116 $117 $115
$50 $104 $103 $102 $104 4%
$91 $91 $80
$25 2%
$0 0% Q1 Q2 Q3 Q4 Q1 Q2 Q3 Q4 Q1 Q2 2014 2014 2014 2014 2015 2015 2015 2015 2016 2016
Base EBITDA EBITDA from TRW Total EBITDA Margin
Selected Highlights from Piston 2Q 2016 Earnings Release and Call Transcript
? “We continue to enjoy healthy market conditions for passenger cars, SUVs and pickup trucks here in North America, in Europe, as well as in China and India.”
? “Unfortunately…revenue continues to be negatively impacted by declines in heavy-duty and industrial segments and the economic conditions in Brazil…The sale of heavy-duty trucks in the U.S. is down year-over-year by around 8.4%, but production of heavy-duty trucks is down by 12.3%, which means …heavy inventory reduction at the OEMs.”
? “Despite challenging mix with less heavy-duty and industrial business, I’m very pleased to report that Powertrain improved its second quarter EBITDA by $20 million over the same time last year, recording $135 million EBITDA, or 11.5% of sales, compared to $115 million, or 9.9% of sales in quarter 2 2015...
Overall, in all product lines, we see solid improvements in manufacturing performance.”
? “…the picture wouldn’t be complete without mentioning that our EBITDA was also positively impacted by $3 million of currency gains, and that we see currently, year-over-year benefits from the lower cost of raw materials like aluminum, platinum, copper and nickel. …we, as a company, benefit especially from lower costs for indirect materials. Unfortunately, in the last few weeks, some of these material prices have started to creep up again.”
? “In summary, while I’m pleased with the trends in our operational performance, growing the top line remains the single biggest challenge we have.”
Note: EBITDA figures referenced above do not align with EBITDA used for purposes of financial analyses that follow due to differences in treatment of EBITDA attributable to minority interests, as well as certain pension expenses.
Source: Company management. 24
CONFIDENTIAL—PRELIMINARY DRAFT—SUBJECT TO FURTHER REVIEW
|
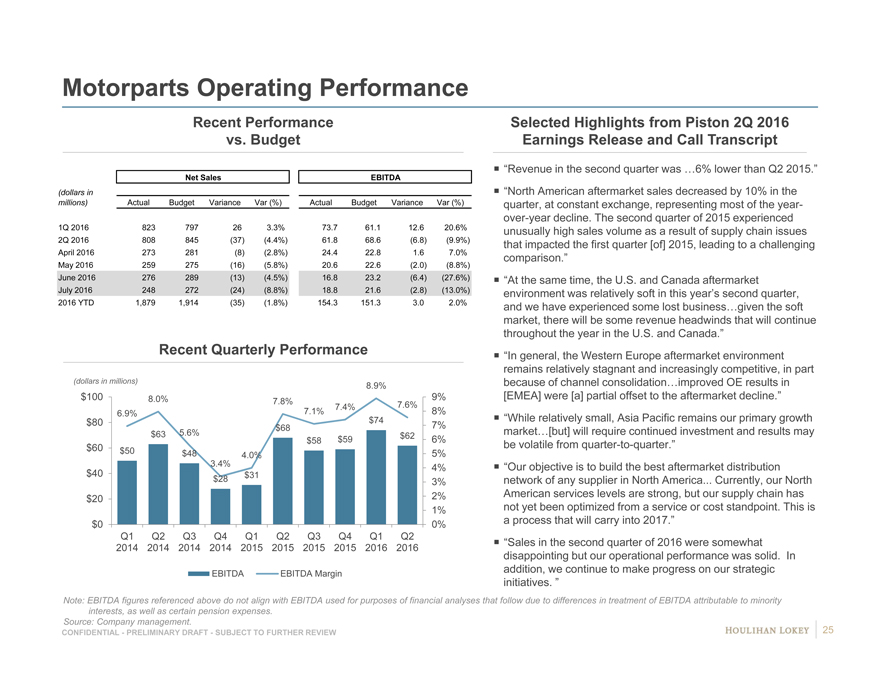
Motorparts Operating Performance
Recent Performance
vs. Budget
Net SalesEBITDA
(dollars in
millions) Actual Budget Variance Var (%)ActualBudgetVariance Var (%)
1Q 2016 823797263.3%73.761.112.620.6%
2Q 2016 808845(37)(4.4%)61.868.6(6.8)(9.9%)
April 2016 273281(8)(2.8%)24.422.81.67.0%
May 2016 259275(16)(5.8%)20.622.6(2.0)(8.8%)
June 2016 276289(13)(4.5%)16.823.2(6.4)(27.6%)
July 2016 248272(24)(8.8%)18.821.6(2.8)(13.0%)
2016 YTD 1,8791,914(35)(1.8%)154.3151.33.02.0%
Recent Quarterly Performance
(dollars in millions) 8.9%
$100 8.0%7.8%9%
7.4%7.6%
6.9% 7.1%8%
$80 $747%
$68
$635.6%$58$59$626%
$60 $50 $484.0%5%
3.4%4%
$40 $28 $31
3%
$20 2%
1%
$0 0%
Q1 Q2Q3Q4Q1Q2Q3Q4Q1Q2
2014 2014 20142014 201520152015201520162016
EBITDAEBITDA Margin
Selected Highlights from Piston 2Q 2016 Earnings Release and Call Transcript
? “Revenue in the second quarter was …6% lower than Q2 2015.”? “North American aftermarket sales decreased by 10% in the quarter, at constant exchange, representing most of the year-over-year decline. The second quarter of 2015 experienced unusually high sales volume as a result of supply chain issues that impacted the first quarter [of] 2015, leading to a challenging comparison.”? “At the same time, the U.S. and Canada aftermarket environment was relatively soft in this year’s second quarter, and we have experienced some lost business…given the soft market, there will be some revenue headwinds that will continue throughout the year in the U.S. and Canada.” ? “In general, the Western Europe aftermarket environment remains relatively stagnant and increasingly competitive, in part because of channel consolidation…improved OE results in [EMEA] were [a] partial offset to the aftermarket decline.” ? “While relatively small, Asia Pacific remains our primary growth market…[but] will require continued investment and results may be volatile from quarter-to-quarter.” ? “Our objective is to build the best aftermarket distribution network of any supplier in North America... Currently, our North American services levels are strong, but our supply chain has not yet been optimized from a service or cost standpoint. This is a process that will carry into 2017.”? “Sales in the second quarter of 2016 were somewhat disappointing but our operational performance was solid. In addition, we continue to make progress on our strategic initiatives. ”
Note: EBITDA figures referenced above do not align with EBITDA used for purposes of financial analyses that follow due to differences in treatment of EBITDA attributable to minority interests, as well as certain pension expenses.
Source: Company management. 25
CONFIDENTIAL—PRELIMINARY DRAFT—SUBJECT TO FURTHER REVIEW
|
Page
1. Executive Summary 3
2. Preliminary Financial Analyses 9
3. Selected Public Market Observations 17
4. Appendix 22 Company Financial Update 23 Cost of Capital Considerations 26 Selected Companies—Operating Statistics 32 Company Financial Performance Observations 36 Implied Premiums Paid Observations 39 Illustrative Preliminary Financial Analyses (EBITDA) 42
5. Disclaimer 54
|
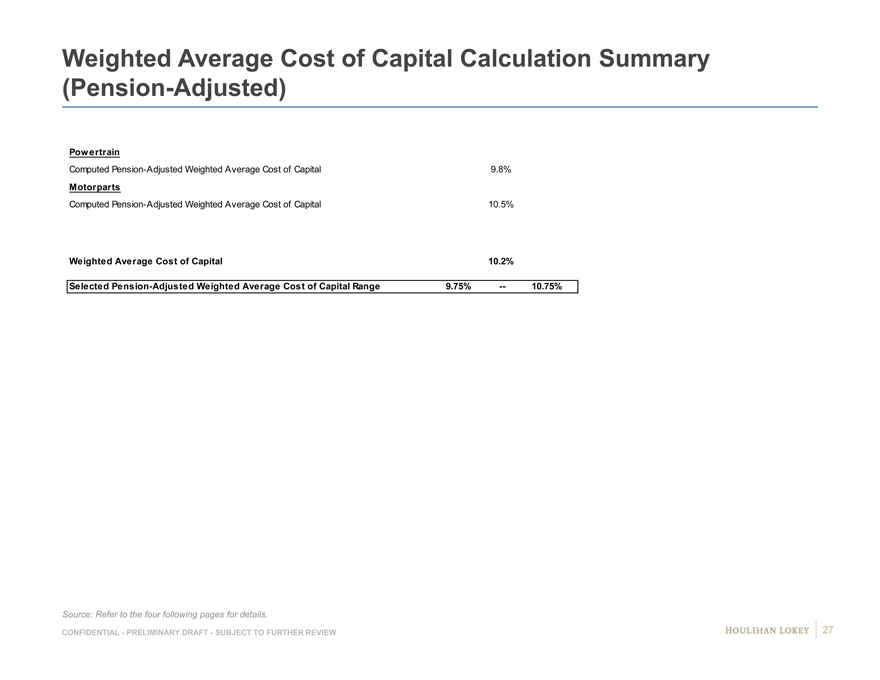
Weighted Average Cost of Capital Calculation Summary (Pension-Adjusted)
Powertrain
Computed Pension-Adjusted Weighted Average Cost of Capital 9.8%
Motorparts
Computed Pension-Adjusted Weighted Average Cost of Capital 10.5%
Weighted Average Cost of Capital 10.2%
Selected Pension-Adjusted Weighted Average Cost of Capital Range 9.75% — 10.75%
Source: Refer to the four following pages for details.
CONFIDENTIAL—PRELIMINARY DRAFT—SUBJECT TO FURTHER REVIEW 27
|
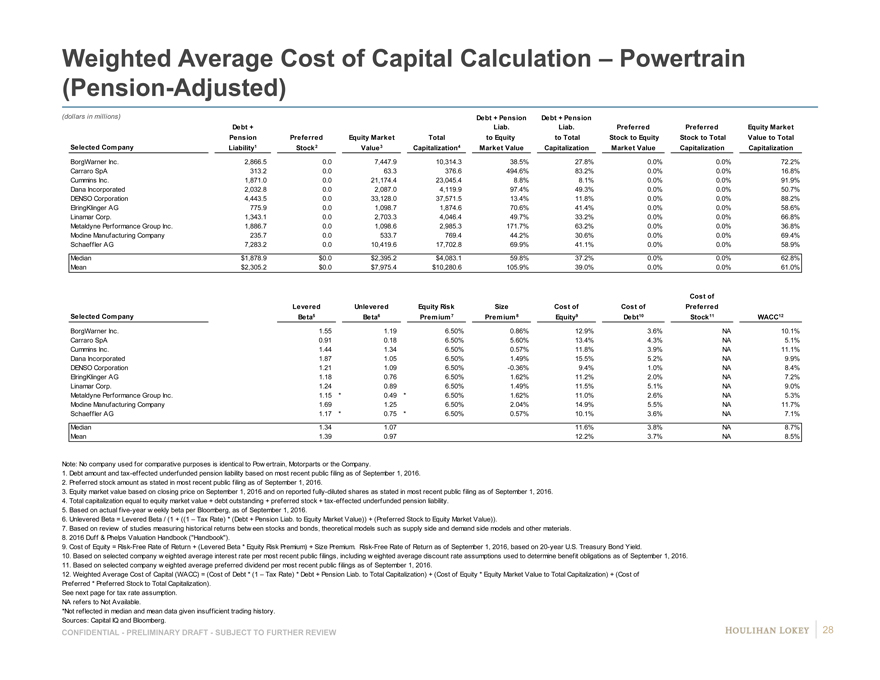
Weighted Average Cost of Capital Calculation – Powertrain
(Pension-Adjusted)
(dollars in millions) Debt + PensionDebt + Pension
Debt + Liab.Liab.PreferredPreferredEquity Market
Pension PreferredEquity MarketTotalto Equityto TotalStock to EquityStock to TotalValue to Total
Selected Company Liability1 Stock2Value3Capitalization4Market ValueCapitalizationMarket ValueCapitalizationCapitalization
BorgWarner Inc. 2,866.5#0.0#7,447.9#10,314.3#38.5% #27.8% #0.0% #0.0%#72.2%#
Carraro SpA 313.2#0.0#63.3#376.6#494.6% #83.2% #0.0% #0.0%#16.8%#
Cummins Inc. 1,871.0#0.0#21,174.4#23,045.4#8.8% #8.1% #0.0% #0.0%#91.9%#
Dana Incorporated 2,032.8#0.0#2,087.0#4,119.9#97.4% #49.3% #0.0% #0.0%#50.7%#
DENSO Corporation 4,443.5#0.0#33,128.0#37,571.5#13.4% #11.8% #0.0% #0.0%#88.2%#
ElringKlinger AG 775.9#0.0#1,098.7#1,874.6#70.6% #41.4% #0.0% #0.0%#58.6%#
Linamar Corp. 1,343.1#0.0#2,703.3#4,046.4#49.7% #33.2% #0.0% #0.0%#66.8%#
Metaldyne Performance Group Inc. 1,886.7#0.0#1,098.6#2,985.3#171.7% #63.2% #0.0% #0.0%#36.8%#
Modine Manufacturing Company 235.7#0.0#533.7#769.4#44.2% #30.6% #0.0% #0.0%#69.4%#
Schaeffler AG 7,283.2#0.0#10,419.6#17,702.8#69.9% #41.1% #0.0% #0.0%#58.9%#
Median $1,878.9$0.0$2,395.2$4,083.159.8%37.2%0.0%0.0%62.8%
Mean $2,305.2$0.0$7,975.4$10,280.6105.9%39.0%0.0%0.0%61.0%
Cost of
LeveredUnleveredEquity RiskSizeCost ofCost ofPreferred
Selected Company Beta5Beta6Premium 7Premium 8Equity9Debt10Stock11WACC12
BorgWarner Inc. 1.55#1.19#6.50%0.86%12.9% #3.6% #NA#10.1%0
Carraro SpA 0.91#0.18#6.50%5.60%13.4% #4.3% #NA#5.1%0
Cummins Inc. 1.44#1.34#6.50%0.57%11.8% #3.9% #NA#11.1%0
Dana Incorporated 1.87#1.05#6.50%1.49%15.5% #5.2% #NA#9.9%0
DENSO Corporation 1.21#1.09#6.50%-0.36%9.4% #1.0% #NA#8.4%0
ElringKlinger AG 1.18#0.76#6.50%1.62%11.2% #2.0% #NA#7.2%0
Linamar Corp. 1.24#0.89#6.50%1.49%11.5% #5.1% #NA#9.0%0
Metaldyne Performance Group Inc. 1.15*0.49*6.50%1.62%11.0% #2.6% #NA#5.3%0
Modine Manufacturing Company 1.69#1.25#6.50%2.04%14.9% #5.5% #NA#11.7%0
Schaeffler AG 1.17*0.75*6.50%0.57%10.1% #3.6% #NA#7.1%0
Median 1.341.0711.6%3.8%NA8.7%
Mean 1.390.9712.2%3.7%NA8.5%
Note: No company used for comparative purposes is identical to Pow ertrain, Motorparts or the Company.
1. Debt amount and tax-effected underfunded pension liability based on most recent public filing as of September 1, 2016.
2. Preferred stock amount as stated in most recent public filing as of September 1, 2016.
3. Equity market value based on closing price on September 1, 2016 and on reported fully-diluted shares as stated in most recent public filing as of September 1, 2016.
4. Total capitalization equal to equity market value + debt outstanding + preferred stock + tax-effected underfunded pension liability.
5. Based on actual five-year w eekly beta per Bloomberg, as of September 1, 2016.
6. Unlevered Beta = Levered Beta / (1 + ((1 – Tax Rate) * (Debt + Pension Liab. to Equity Market Value)) + (Preferred Stock to Equity Market Value)).
7. Based on review of studies measuring historical returns betw een stocks and bonds, theoretical models such as supply side and demand side models and other materials.
8. 2016 Duff & Phelps Valuation Handbook (“Handbook”).
9. Cost of Equity = Risk-Free Rate of Return + (Levered Beta * Equity Risk Premium) + Size Premium. Risk-Free Rate of Return as of September 1, 2016, based on 20-year U.S. Treasury Bond Yield.
10. Based on selected company w eighted average interest rate per most recent public filings, including w eighted average discount rate assumptions used to determine benefit obligations as of September 1, 2016.
11. Based on selected company w eighted average preferred dividend per most recent public filings as of September 1, 2016.
12. Weighted Average Cost of Capital (WACC) = (Cost of Debt * (1 – Tax Rate) * Debt + Pension Liab. to Total Capitalization) + (Cost of Equity * Equity Market Value to Total Capitalization) + (Cost of
Preferred * Preferred Stock to Total Capitalization).
See next page for tax rate assumption.
NA refers to Not Available.
*Not reflected in median and mean data given insufficient trading history.
Sources: Capital IQ and Bloomberg.
CONFIDENTIAL—PRELIMINARY DRAFT—SUBJECT TO FURTHER REVIEW 28
|
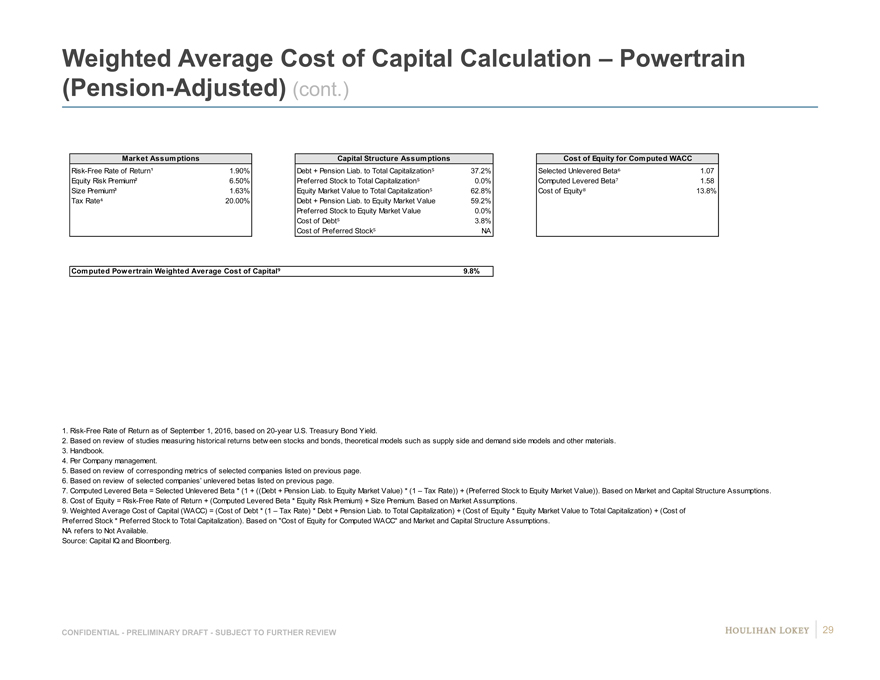
Weighted Average Cost of Capital Calculation – Powertrain
(Pension-Adjusted) (cont.)
Market Assumptions Capital Structure AssumptionsCost of Equity for Computed WACC
Risk-Free Rate of Return¹ 1.90% Debt + Pension Liab. to Total Capitalization 37.2%Selected Unlevered Beta 1.07
Equity Risk Premium² 6.50% Preferred Stock to Total Capitalization 0.0%Computed Levered Beta 1.58
Size Premium³ 1.63%Equity Market Value to Total Capitalization 62.8%Cost of Equity 13.8%
Tax Rate 20.00%Debt + Pension Liab. to Equity Market Value59.2%
Preferred Stock to Equity Market Value0.0%
Cost of Debt 3.8%
Cost of Preferred Stock NA
Computed Powertrain Weighted Average Cost of Capital 9.8%
1. Risk-Free Rate of Return as of September 1, 2016, based on 20-year U.S. Treasury Bond Yield.
2. Based on review of studies measuring historical returns betw een stocks and bonds, theoretical models such as supply side and demand side models and other materials.
3. Handbook.
4. Per Company management.
5. Based on review of corresponding metrics of selected companies listed on previous page.
6. Based on review of selected companies’ unlevered betas listed on previous page.
7. Computed Levered Beta = Selected Unlevered Beta * (1 + ((Debt + Pension Liab. to Equity Market Value) * (1 – Tax Rate)) + (Preferred Stock to Equity Market Value)). Based on Market and Capital Structure Assumptions.
8. Cost of Equity = Risk-Free Rate of Return + (Computed Levered Beta * Equity Risk Premium) + Size Premium. Based on Market Assumptions.
9. Weighted Average Cost of Capital (WACC) = (Cost of Debt * (1 – Tax Rate) * Debt + Pension Liab. to Total Capitalization) + (Cost of Equity * Equity Market Value to Total Capitalization) + (Cost of
Preferred Stock * Preferred Stock to Total Capitalization). Based on “Cost of Equity for Computed WACC” and Market and Capital Structure Assumptions.
NA refers to Not Available.
Source: Capital IQ and Bloomberg.
CONFIDENTIAL—PRELIMINARY DRAFT—SUBJECT TO FURTHER REVIEW 29
|
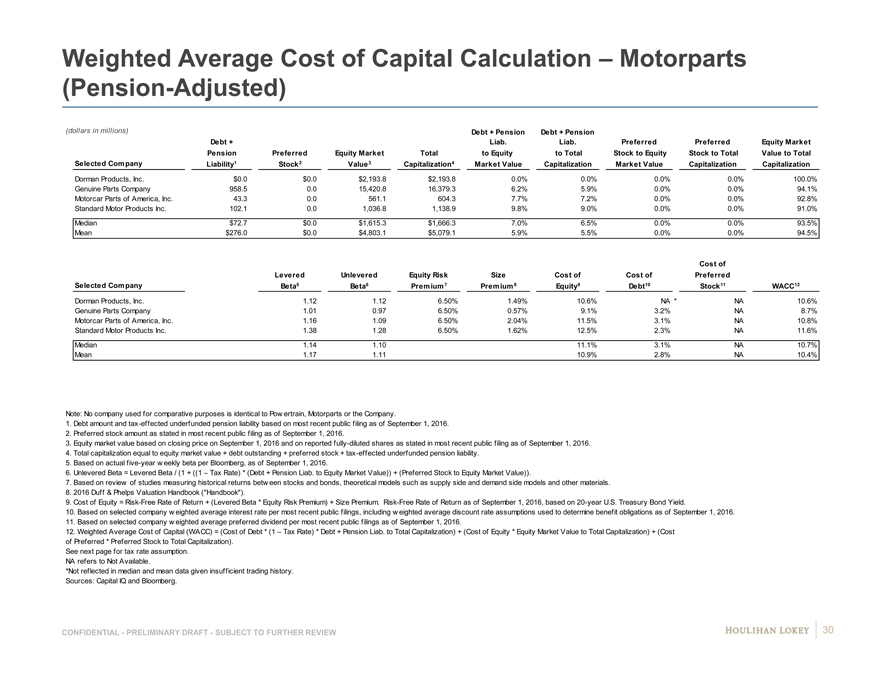
Weighted Average Cost of Capital Calculation – Motorparts
(Pension-Adjusted)
(dollars in millions) Debt + PensionDebt + Pension
Debt + Liab.Liab.PreferredPreferredEquity Market
Pension PreferredEquity MarketTotalto Equityto TotalStock to EquityStock to TotalValue to Total
Selected Company Liability1 Stock2Value3Capitalization4Market ValueCapitalizationMarket ValueCapitalizationCapitalization
Dorman Products, Inc. $0.0 #$0.0#$2,193.8#$2,193.8#0.0% #0.0%#0.0%#0.0% #100.0%#
Genuine Parts Company 958.5 #0.0#15,420.8#16,379.3#6.2% #5.9%#0.0%#0.0% #94.1%#
Motorcar Parts of America, Inc. 43.3 #0.0#561.1#604.3#7.7% #7.2%#0.0%#0.0% #92.8%#
Standard Motor Products Inc. 102.1 #0.0#1,036.8#1,138.9#9.8% #9.0%#0.0%#0.0% #91.0%#
Median $72.7 $0.0$1,615.3$1,666.37.0%6.5%0.0%0.0%93.5%
Mean $276.0 $0.0$4,803.1$5,079.15.9%5.5%0.0%0.0%94.5%
Cost of
LeveredUnleveredEquity RiskSizeCost ofCost ofPreferred
Selected Company Beta5Beta6Premium 7Premium 8Equity9Debt10Stock11WACC12
Dorman Products, Inc. 1.12#1.12#6.50%1.49%10.6%#NA *NA#10.6%0
Genuine Parts Company 1.01#0.97#6.50%0.57%9.1%#3.2%#NA#8.7%0
Motorcar Parts of America, Inc. 1.16#1.09#6.50%2.04%11.5%#3.1%#NA#10.8%0
Standard Motor Products Inc. 1.38#1.28#6.50%1.62%12.5%#2.3%#NA#11.6%0
Median 1.141.1011.1%3.1%NA10.7%
Mean 1.171.1110.9%2.8%NA10.4%
Note: No company used for comparative purposes is identical to Pow ertrain, Motorparts or the Company.
1. Debt amount and tax-effected underfunded pension liability based on most recent public filing as of September 1, 2016.
2. Preferred stock amount as stated in most recent public filing as of September 1, 2016.
3. Equity market value based on closing price on September 1, 2016 and on reported fully-diluted shares as stated in most recent public filing as of September 1, 2016.
4. Total capitalization equal to equity market value + debt outstanding + preferred stock + tax-effected underfunded pension liability.
5. Based on actual five-year w eekly beta per Bloomberg, as of September 1, 2016.
6. Unlevered Beta = Levered Beta / (1 + ((1 – Tax Rate) * (Debt + Pension Liab. to Equity Market Value)) + (Preferred Stock to Equity Market Value)).
7. Based on review of studies measuring historical returns betw een stocks and bonds, theoretical models such as supply side and demand side models and other materials.
8. 2016 Duff & Phelps Valuation Handbook (“Handbook”).
9. Cost of Equity = Risk-Free Rate of Return + (Levered Beta * Equity Risk Premium) + Size Premium. Risk-Free Rate of Return as of September 1, 2016, based on 20-year U.S. Treasury Bond Yield.
10. Based on selected company w eighted average interest rate per most recent public filings, including w eighted average discount rate assumptions used to determine benefit obligations as of September 1, 2016.
11. Based on selected company w eighted average preferred dividend per most recent public filings as of September 1, 2016.
12. Weighted Average Cost of Capital (WACC) = (Cost of Debt * (1 – Tax Rate) * Debt + Pension Liab. to Total Capitalization) + (Cost of Equity * Equity Market Value to Total Capitalization) + (Cost
of Preferred * Preferred Stock to Total Capitalization).
See next page for tax rate assumption.
NA refers to Not Available.
*Not reflected in median and mean data given insufficient trading history.
Sources: Capital IQ and Bloomberg.
CONFIDENTIAL—PRELIMINARY DRAFT—SUBJECT TO FURTHER REVIEW 30
|
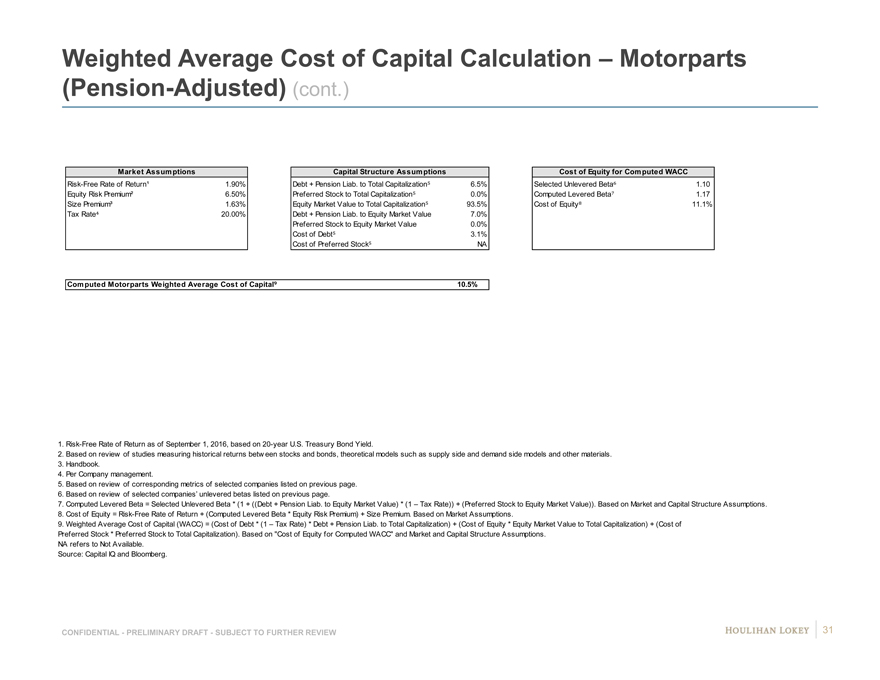
Weighted Average Cost of Capital Calculation – Motorparts
(Pension-Adjusted) (cont.)
Market Assumptions Capital Structure AssumptionsCost of Equity for Computed WACC
Risk-Free Rate of Return¹ 1.90% Debt + Pension Liab. to Total Capitalization 6.5%Selected Unlevered Beta 1.10
Equity Risk Premium² 6.50% Preferred Stock to Total Capitalization 0.0%Computed Levered Beta 1.17
Size Premium³ 1.63%Equity Market Value to Total Capitalization 93.5%Cost of Equity 11.1%
Tax Rate 20.00%Debt + Pension Liab. to Equity Market Value7.0%
Preferred Stock to Equity Market Value0.0%
Cost of Debt 3.1%
Cost of Preferred Stock NA
Computed Motorparts Weighted Average Cost of Capital 10.5%
1. Risk-Free Rate of Return as of September 1, 2016, based on 20-year U.S. Treasury Bond Yield.
2. Based on review of studies measuring historical returns betw een stocks and bonds, theoretical models such as supply side and demand side models and other materials.
3. Handbook.
4. Per Company management.
5. Based on review of corresponding metrics of selected companies listed on previous page.
6. Based on review of selected companies’ unlevered betas listed on previous page.
7. Computed Levered Beta = Selected Unlevered Beta * (1 + ((Debt + Pension Liab. to Equity Market Value) * (1 – Tax Rate)) + (Preferred Stock to Equity Market Value)). Based on Market and Capital Structure Assumptions.
8. Cost of Equity = Risk-Free Rate of Return + (Computed Levered Beta * Equity Risk Premium) + Size Premium. Based on Market Assumptions.
9. Weighted Average Cost of Capital (WACC) = (Cost of Debt * (1 – Tax Rate) * Debt + Pension Liab. to Total Capitalization) + (Cost of Equity * Equity Market Value to Total Capitalization) + (Cost of
Preferred Stock * Preferred Stock to Total Capitalization). Based on “Cost of Equity for Computed WACC” and Market and Capital Structure Assumptions.
NA refers to Not Available.
Source: Capital IQ and Bloomberg.
CONFIDENTIAL—PRELIMINARY DRAFT—SUBJECT TO FURTHER REVIEW 31
|
Page
1. Executive Summary 3
2. Preliminary Financial Analyses 9
3. Selected Public Market Observations 17
4. Appendix 22
Company Financial Update 23
Cost of Capital Considerations 26
Selected Companies—Operating Statistics 32
Company Financial Performance Observations 36
Implied Premiums Paid Observations 39
Illustrative Preliminary Financial Analyses (EBITDA) 42
5. Disclaimer 54
|
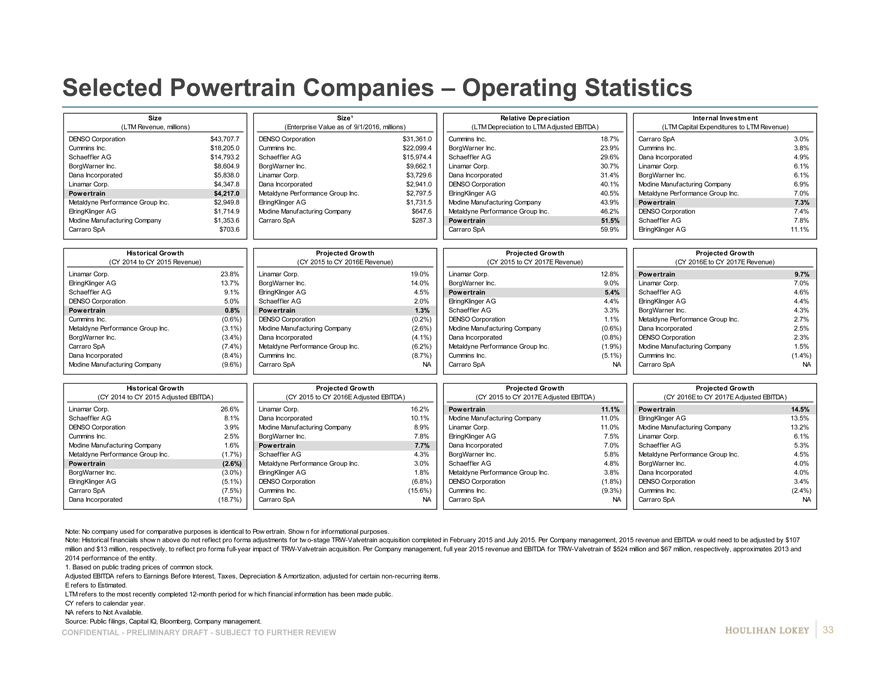
Selected Powertrain Companies – Operating Statistics
Size Size¹Relative DepreciationInternal Investment
(LTM Revenue, millions) (Enterprise Value as of 9/1/2016, millions)(LTM Depreciation to LTM Adjusted EBITDA)(LTM Capital Expenditures to LTM Revenue)
DENSO Corporation $43,707.7 DENSO Corporation$31,361.0Cummins Inc.18.7%Carraro SpA3.0%
Cummins Inc. $18,205.0 Cummins Inc.$22,099.4BorgWarner Inc.23.9%Cummins Inc.3.8%
Schaeffler AG $14,793.2 Schaeffler AG$15,974.4Schaeffler AG29.6%Dana Incorporated4.9%
BorgWarner Inc. $8,604.9 BorgWarner Inc.$9,662.1Linamar Corp.30.7%Linamar Corp.6.1%
Dana Incorporated $5,838.0 Linamar Corp.$3,729.6Dana Incorporated31.4%BorgWarner Inc.6.1%
Linamar Corp. $4,347.8 Dana Incorporated$2,941.0DENSO Corporation40.1%Modine Manufacturing Company6.9%
Powertrain $4,217.0 Metaldyne Performance Group Inc.$2,797.5ElringKlinger AG40.5%Metaldyne Performance Group Inc.7.0%
Metaldyne Performance Group Inc. $2,949.8 ElringKlinger AG$1,731.5Modine Manufacturing Company43.9%Powertrain7.3%
ElringKlinger AG $1,714.9 Modine Manufacturing Company$647.6Metaldyne Performance Group Inc.46.2%DENSO Corporation7.4%
Modine Manufacturing Company $1,353.6 Carraro SpA$287.3Powertrain51.5%Schaeffler AG7.8%
Carraro SpA $703.6 Carraro SpA59.9%ElringKlinger AG11.1%
Historical Growth Projected GrowthProjected GrowthProjected Growth
(CY 2014 to CY 2015 Revenue) (CY 2015 to CY 2016E Revenue)(CY 2015 to CY 2017E Revenue)(CY 2016E to CY 2017E Revenue)
Linamar Corp. 23.8% Linamar Corp.19.0%Linamar Corp.12.8%Powertrain9.7%
ElringKlinger AG 13.7% BorgWarner Inc.14.0%BorgWarner Inc.9.0%Linamar Corp.7.0%
Schaeffler AG 9.1% ElringKlinger AG4.5%Powertrain5.4%Schaeffler AG4.6%
DENSO Corporation 5.0% Schaeffler AG2.0%ElringKlinger AG4.4%ElringKlinger AG4.4%
Powertrain 0.8% Powertrain1.3%Schaeffler AG3.3%BorgWarner Inc.4.3%
Cummins Inc. (0.6%) DENSO Corporation(0.2%)DENSO Corporation1.1%Metaldyne Performance Group Inc.2.7%
Metaldyne Performance Group Inc. (3.1%) Modine Manufacturing Company(2.6%)Modine Manufacturing Company(0.6%)Dana Incorporated2.5%
BorgWarner Inc. (3.4%) Dana Incorporated(4.1%)Dana Incorporated(0.8%)DENSO Corporation2.3%
Carraro SpA (7.4%) Metaldyne Performance Group Inc.(6.2%)Metaldyne Performance Group Inc.(1.9%)Modine Manufacturing Company1.5%
Dana Incorporated (8.4%) Cummins Inc.(8.7%)Cummins Inc.(5.1%)Cummins Inc.(1.4%)
Modine Manufacturing Company (9.6%) Carraro SpANACarraro SpANACarraro SpANA
Historical Growth Projected GrowthProjected GrowthProjected Growth
(CY 2014 to CY 2015 Adjusted EBITDA) (CY 2015 to CY 2016E Adjusted EBITDA) (CY 2015 to CY 2017E Adjusted EBITDA)(CY 2016E to CY 2017E Adjusted EBITDA)
Linamar Corp. 26.6% Linamar Corp.16.2%Powertrain11.1%Powertrain14.5%
Schaeffler AG 8.1% Dana Incorporated10.1%Modine Manufacturing Company11.0%ElringKlinger AG13.5%
DENSO Corporation 3.9% Modine Manufacturing Company8.9%Linamar Corp.11.0%Modine Manufacturing Company13.2%
Cummins Inc. 2.5% BorgWarner Inc.7.8%ElringKlinger AG7.5%Linamar Corp.6.1%
Modine Manufacturing Company 1.6% Powertrain7.7%Dana Incorporated7.0%Schaeffler AG5.3%
Metaldyne Performance Group Inc. (1.7%) Schaeffler AG4.3%BorgWarner Inc.5.8%Metaldyne Performance Group Inc.4.5%
Powertrain (2.6%) Metaldyne Performance Group Inc.3.0%Schaeffler AG4.8%BorgWarner Inc.4.0%
BorgWarner Inc. (3.0%) ElringKlinger AG1.8%Metaldyne Performance Group Inc.3.8%Dana Incorporated4.0%
ElringKlinger AG (5.1%) DENSO Corporation(6.8%)DENSO Corporation(1.8%)DENSO Corporation3.4%
Carraro SpA (7.5%) Cummins Inc.(15.6%)Cummins Inc.(9.3%)Cummins Inc.(2.4%)
Dana Incorporated (18.7%) Carraro SpANACarraro SpANACarraro SpANA
Note: No company used for comparative purposes is identical to Pow ertrain. Show n for informational purposes.
Note: Historical financials show n above do not reflect pro forma adjustments for tw o-stage TRW-Valvetrain acquisition completed in February 2015 and July 2015. Per Company management, 2015 revenue and EBITDA w ould need to be adjusted by $107
million and $13 million, respectively, to reflect pro forma full-year impact of TRW-Valvetrain acquisition. Per Company management, full year 2015 revenue and EBITDA for TRW-Valvetrain of $524 million and $67 million, respectively, approximates 2013 and
2014 performance of the entity.
1. Based on public trading prices of common stock.
Adjusted EBITDA refers to Earnings Before Interest, Taxes, Depreciation & Amortization, adjusted for certain non-recurring items.
E refers to Estimated.
LTM refers to the most recently completed 12-month period for w hich financial information has been made public.
CY refers to calendar year.
NA refers to Not Available.
Source: Public filings, Capital IQ, Bloomberg, Company management.
CONFIDENTIAL—PRELIMINARY DRAFT—SUBJECT TO FURTHER REVIEW 33
|
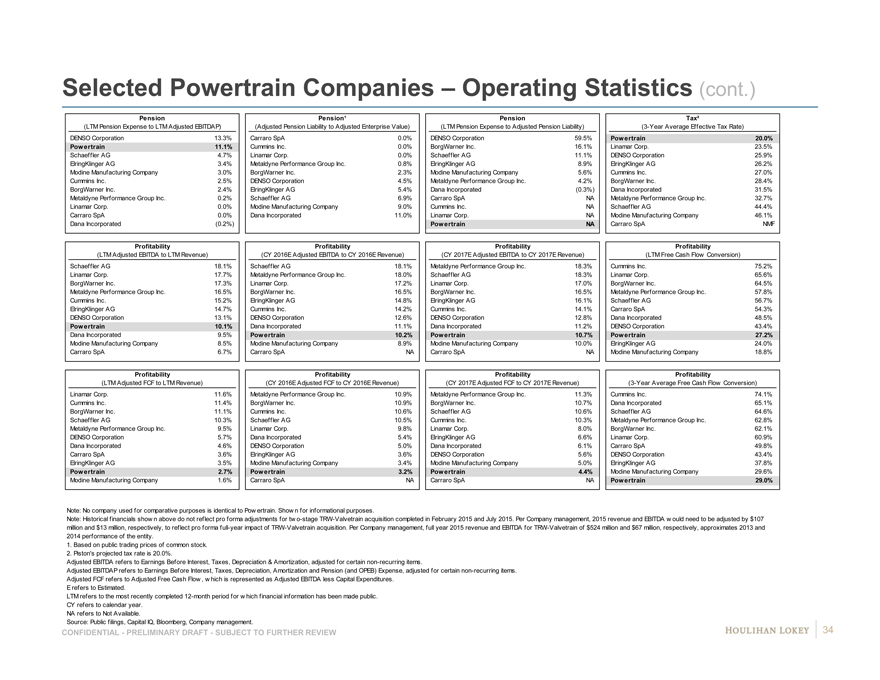
Selected Powertrain Companies – Operating Statistics (cont.)
Pension Pension¹PensionTax²
(LTM Pension Expense to LTM Adjusted EBITDAP) (Adjusted Pension Liability to Adjusted Enterprise Value) (LTM Pension Expense to Adjusted Pension Liability)(3-Year Average Effective Tax Rate)
DENSO Corporation 13.3% Carraro SpA0.0%DENSO Corporation59.5%Powertrain20.0%
Powertrain 11.1% Cummins Inc.0.0%BorgWarner Inc.16.1%Linamar Corp.23.5%
Schaeffler AG 4.7% Linamar Corp.0.0%Schaeffler AG11.1%DENSO Corporation25.9%
ElringKlinger AG 3.4% Metaldyne Performance Group Inc.0.8%ElringKlinger AG8.9%ElringKlinger AG26.2%
Modine Manufacturing Company 3.0% BorgWarner Inc.2.3%Modine Manufacturing Company5.6%Cummins Inc.27.0%
Cummins Inc. 2.5% DENSO Corporation4.5%Metaldyne Performance Group Inc.4.2%BorgWarner Inc.28.4%
BorgWarner Inc. 2.4% ElringKlinger AG5.4%Dana Incorporated(0.3%)Dana Incorporated31.5%
Metaldyne Performance Group Inc. 0.2% Schaeffler AG6.9%Carraro SpANAMetaldyne Performance Group Inc.32.7%
Linamar Corp. 0.0% Modine Manufacturing Company9.0%Cummins Inc.NASchaeffler AG44.4%
Carraro SpA 0.0% Dana Incorporated11.0%Linamar Corp.NAModine Manufacturing Company46.1%
Dana Incorporated (0.2%) PowertrainNACarraro SpANMF
Profitability ProfitabilityProfitabilityProfitability
(LTM Adjusted EBITDA to LTM Revenue) (CY 2016E Adjusted EBITDA to CY 2016E Revenue)(CY 2017E Adjusted EBITDA to CY 2017E Revenue)(LTM Free Cash Flow Conversion)
Schaeffler AG 18.1% Schaeffler AG18.1%Metaldyne Performance Group Inc.18.3%Cummins Inc.75.2%
Linamar Corp. 17.7% Metaldyne Performance Group Inc.18.0%Schaeffler AG18.3%Linamar Corp.65.6%
BorgWarner Inc. 17.3% Linamar Corp.17.2%Linamar Corp.17.0%BorgWarner Inc.64.5%
Metaldyne Performance Group Inc. 16.5% BorgWarner Inc.16.5%BorgWarner Inc.16.5%Metaldyne Performance Group Inc.57.8%
Cummins Inc. 15.2% ElringKlinger AG14.8%ElringKlinger AG16.1%Schaeffler AG56.7%
ElringKlinger AG 14.7% Cummins Inc.14.2%Cummins Inc.14.1%Carraro SpA54.3%
DENSO Corporation 13.1% DENSO Corporation12.6%DENSO Corporation12.8%Dana Incorporated48.5%
Powertrain 10.1% Dana Incorporated11.1%Dana Incorporated11.2%DENSO Corporation43.4%
Dana Incorporated 9.5% Powertrain10.2%Powertrain10.7%Powertrain27.2%
Modine Manufacturing Company 8.5% Modine Manufacturing Company8.9%Modine Manufacturing Company10.0%ElringKlinger AG24.0%
Carraro SpA 6.7% Carraro SpANACarraro SpANAModine Manufacturing Company18.8%
Profitability ProfitabilityProfitabilityProfitability
(LTM Adjusted FCF to LTM Revenue) (CY 2016E Adjusted FCF to CY 2016E Revenue)(CY 2017E Adjusted FCF to CY 2017E Revenue)(3-Year Average Free Cash Flow Conversion)
Linamar Corp. 11.6% Metaldyne Performance Group Inc.10.9%Metaldyne Performance Group Inc.11.3%Cummins Inc.74.1%
Cummins Inc. 11.4% BorgWarner Inc.10.9%BorgWarner Inc.10.7%Dana Incorporated65.1%
BorgWarner Inc. 11.1% Cummins Inc.10.6%Schaeffler AG10.6%Schaeffler AG64.6%
Schaeffler AG 10.3% Schaeffler AG10.5%Cummins Inc.10.3%Metaldyne Performance Group Inc.62.8%
Metaldyne Performance Group Inc. 9.5% Linamar Corp.9.8%Linamar Corp.8.0%BorgWarner Inc.62.1%
DENSO Corporation 5.7% Dana Incorporated5.4%ElringKlinger AG6.6%Linamar Corp.60.9%
Dana Incorporated 4.6% DENSO Corporation5.0%Dana Incorporated6.1%Carraro SpA49.8%
Carraro SpA 3.6% ElringKlinger AG3.6%DENSO Corporation5.6%DENSO Corporation43.4%
ElringKlinger AG 3.5% Modine Manufacturing Company3.4%Modine Manufacturing Company5.0%ElringKlinger AG37.8%
Powertrain 2.7% Powertrain3.2%Powertrain4.4%Modine Manufacturing Company29.6%
Modine Manufacturing Company 1.6% Carraro SpANACarraro SpANAPowertrain29.0%
Note: No company used for comparative purposes is identical to Pow ertrain. Show n for informational purposes.
Note: Historical financials show n above do not reflect pro forma adjustments for tw o-stage TRW-Valvetrain acquisition completed in February 2015 and July 2015. Per Company management, 2015 revenue and EBITDA w ould need to be adjusted by $107
million and $13 million, respectively, to reflect pro forma full-year impact of TRW-Valvetrain acquisition. Per Company management, full year 2015 revenue and EBITDA for TRW-Valvetrain of $524 million and $67 million, respectively, approximates 2013 and
2014 performance of the entity.
1. Based on public trading prices of common stock.
2. Piston’s projected tax rate is 20.0%.
Adjusted EBITDA refers to Earnings Before Interest, Taxes, Depreciation & Amortization, adjusted for certain non-recurring items.
Adjusted EBITDAP refers to Earnings Before Interest, Taxes, Depreciation, Amortization and Pension (and OPEB) Expense, adjusted for certain non-recurring items.
Adjusted FCF refers to Adjusted Free Cash Flow , w hich is represented as Adjusted EBITDA less Capital Expenditures.
E refers to Estimated.
LTM refers to the most recently completed 12-month period for w hich financial information has been made public.
CY refers to calendar year.
NA refers to Not Available.
Source: Public filings, Capital IQ, Bloomberg, Company management.
CONFIDENTIAL—PRELIMINARY DRAFT—SUBJECT TO FURTHER REVIEW 34
|
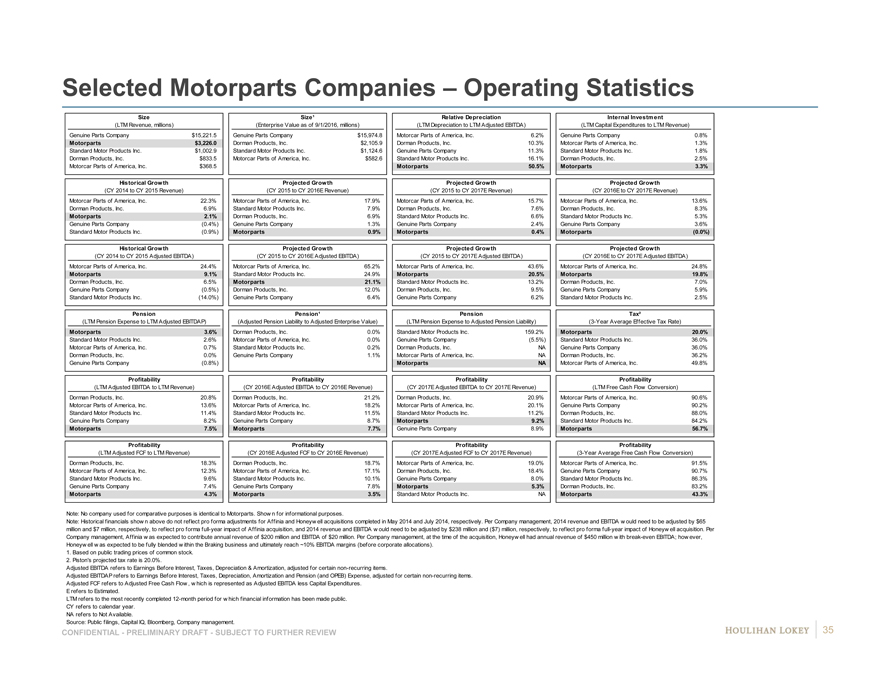
Selected Motorparts Companies – Operating Statistics
Size Size¹Relative DepreciationInternal Investment
(LTM Revenue, millions) (Enterprise Value as of 9/1/2016, millions)(LTM Depreciation to LTM Adjusted EBITDA)(LTM Capital Expenditures to LTM Revenue)
Genuine Parts Company $15,221.5 Genuine Parts Company$15,974.8Motorcar Parts of America, Inc.6.2%Genuine Parts Company0.8%
Motorparts $3,226.0 Dorman Products, Inc.$2,105.9Dorman Products, Inc.10.3%Motorcar Parts of America, Inc.1.3%
Standard Motor Products Inc. $1,002.9 Standard Motor Products Inc.$1,124.6Genuine Parts Company11.3%Standard Motor Products Inc.1.8%
Dorman Products, Inc. $833.5 Motorcar Parts of America, Inc.$582.6Standard Motor Products Inc.16.1%Dorman Products, Inc.2.5%
Motorcar Parts of America, Inc. $368.5 ##########Motorparts50.5%Motorparts3.3%
Historical Growth Projected GrowthProjected GrowthProjected Growth
(CY 2014 to CY 2015 Revenue) (CY 2015 to CY 2016E Revenue)(CY 2015 to CY 2017E Revenue)(CY 2016E to CY 2017E Revenue)
Motorcar Parts of America, Inc. 22.3% Motorcar Parts of America, Inc.17.9%Motorcar Parts of America, Inc.15.7%Motorcar Parts of America, Inc.13.6%
Dorman Products, Inc. 6.9% Standard Motor Products Inc.7.9%Dorman Products, Inc.7.6%Dorman Products, Inc.8.3%
Motorparts 2.1% Dorman Products, Inc.6.9%Standard Motor Products Inc.6.6%Standard Motor Products Inc.5.3%
Genuine Parts Company (0.4%) Genuine Parts Company1.3%Genuine Parts Company2.4%Genuine Parts Company3.6%
Standard Motor Products Inc. (0.9%) Motorparts0.9%Motorparts0.4%Motorparts(0.0%)
Historical Growth Projected GrowthProjected GrowthProjected Growth
(CY 2014 to CY 2015 Adjusted EBITDA) (CY 2015 to CY 2016E Adjusted EBITDA) (CY 2015 to CY 2017E Adjusted EBITDA)(CY 2016E to CY 2017E Adjusted EBITDA)
Motorcar Parts of America, Inc. 24.4% Motorcar Parts of America, Inc.65.2%Motorcar Parts of America, Inc.43.6%Motorcar Parts of America, Inc.24.8%
Motorparts 9.1% Standard Motor Products Inc.24.9%Motorparts20.5%Motorparts19.8%
Dorman Products, Inc. 6.5% Motorparts21.1%Standard Motor Products Inc.13.2%Dorman Products, Inc.7.0%
Genuine Parts Company (0.5%) Dorman Products, Inc.12.0%Dorman Products, Inc.9.5%Genuine Parts Company5.9%
Standard Motor Products Inc. (14.0%) Genuine Parts Company6.4%Genuine Parts Company6.2%Standard Motor Products Inc.2.5%
Pension Pension¹PensionTax²
(LTM Pension Expense to LTM Adjusted EBITDAP) (Adjusted Pension Liability to Adjusted Enterprise Value) (LTM Pension Expense to Adjusted Pension Liability)(3-Year Average Effective Tax Rate)
Motorparts 3.6% Dorman Products, Inc.0.0%Standard Motor Products Inc.159.2%Motorparts20.0%
Standard Motor Products Inc. 2.6% Motorcar Parts of America, Inc.0.0%Genuine Parts Company(5.5%)Standard Motor Products Inc.36.0%
Motorcar Parts of America, Inc. 0.7% Standard Motor Products Inc.0.2%Dorman Products, Inc.NAGenuine Parts Company36.0%
Dorman Products, Inc. 0.0% Genuine Parts Company1.1%Motorcar Parts of America, Inc.NADorman Products, Inc.36.2%
Genuine Parts Company (0.8%) MotorpartsNAMotorcar Parts of America, Inc.49.8%
Profitability ProfitabilityProfitabilityProfitability
(LTM Adjusted EBITDA to LTM Revenue) (CY 2016E Adjusted EBITDA to CY 2016E Revenue) (CY 2017E Adjusted EBITDA to CY 2017E Revenue)(LTM Free Cash Flow Conversion)
Dorman Products, Inc. 20.8% Dorman Products, Inc.21.2%Dorman Products, Inc.20.9%Motorcar Parts of America, Inc.90.6%
Motorcar Parts of America, Inc. 13.6% Motorcar Parts of America, Inc.18.2%Motorcar Parts of America, Inc.20.1%Genuine Parts Company90.2%
Standard Motor Products Inc. 11.4% Standard Motor Products Inc.11.5%Standard Motor Products Inc.11.2%Dorman Products, Inc.88.0%
Genuine Parts Company 8.2% Genuine Parts Company8.7%Motorparts9.2%Standard Motor Products Inc.84.2%
Motorparts 7.5% Motorparts7.7%Genuine Parts Company8.9%Motorparts56.7%
Profitability ProfitabilityProfitabilityProfitability
(LTM Adjusted FCF to LTM Revenue) (CY 2016E Adjusted FCF to CY 2016E Revenue)(CY 2017E Adjusted FCF to CY 2017E Revenue)(3-Year Average Free Cash Flow Conversion)
Dorman Products, Inc. 18.3% Dorman Products, Inc.18.7%Motorcar Parts of America, Inc.19.0%Motorcar Parts of America, Inc.91.5%
Motorcar Parts of America, Inc. 12.3% Motorcar Parts of America, Inc.17.1%Dorman Products, Inc.18.4%Genuine Parts Company90.7%
Standard Motor Products Inc. 9.6% Standard Motor Products Inc.10.1%Genuine Parts Company8.0%Standard Motor Products Inc.86.3%
Genuine Parts Company 7.4% Genuine Parts Company7.8%Motorparts5.3%Dorman Products, Inc.83.2%
Motorparts 4.3% Motorparts3.5%Standard Motor Products Inc.NAMotorparts43.3%
Note: No company used for comparative purposes is identical to Motorparts. Show n for informational purposes.
Note: Historical financials show n above do not reflect pro forma adjustments for Affinia and Honeyw ell acquisitions completed in May 2014 and July 2014, respectively. Per Company management, 2014 revenue and EBITDA w ould need to be adjusted by $65
million and $7 million, respectively, to reflect pro forma full-year impact of Affinia acquisition, and 2014 revenue and EBITDA w ould need to be adjusted by $238 million and ($7) million, respectively, to reflect pro forma full-year impact of Honeyw ell acquisition. Per
Company management, Affinia w as expected to contribute annual revenue of $200 million and EBITDA of $20 million. Per Company management, at the time of the acquisition, Honeyw ell had annual revenue of $450 million w ith break-even EBITDA; how ever,
Honeyw ell w as expected to be fully blended w ithin the Braking business and ultimately reach ~10% EBITDA margins (before corporate allocations).
1. Based on public trading prices of common stock.
2. Piston’s projected tax rate is 20.0%.
Adjusted EBITDA refers to Earnings Before Interest, Taxes, Depreciation & Amortization, adjusted for certain non-recurring items.
Adjusted EBITDAP refers to Earnings Before Interest, Taxes, Depreciation, Amortization and Pension (and OPEB) Expense, adjusted for certain non-recurring items.
Adjusted FCF refers to Adjusted Free Cash Flow , w hich is represented as Adjusted EBITDA less Capital Expenditures.
E refers to Estimated.
LTM refers to the most recently completed 12-month period for w hich financial information has been made public.
CY refers to calendar year.
NA refers to Not Available.
Source: Public filings, Capital IQ, Bloomberg, Company management.
CONFIDENTIAL—PRELIMINARY DRAFT—SUBJECT TO FURTHER REVIEW 35
|
Page
1. Executive Summary 3
2. Preliminary Financial Analyses 9
3. Selected Public Market Observations 17
4. Appendix 22
Company Financial Update 23
Cost of Capital Considerations 26
Selected Companies—Operating Statistics 32
Company Financial Performance Observations 36
Implied Premiums Paid Observations 39
Illustrative Preliminary Financial Analyses (EBITDA) 42
5. Disclaimer 54
|
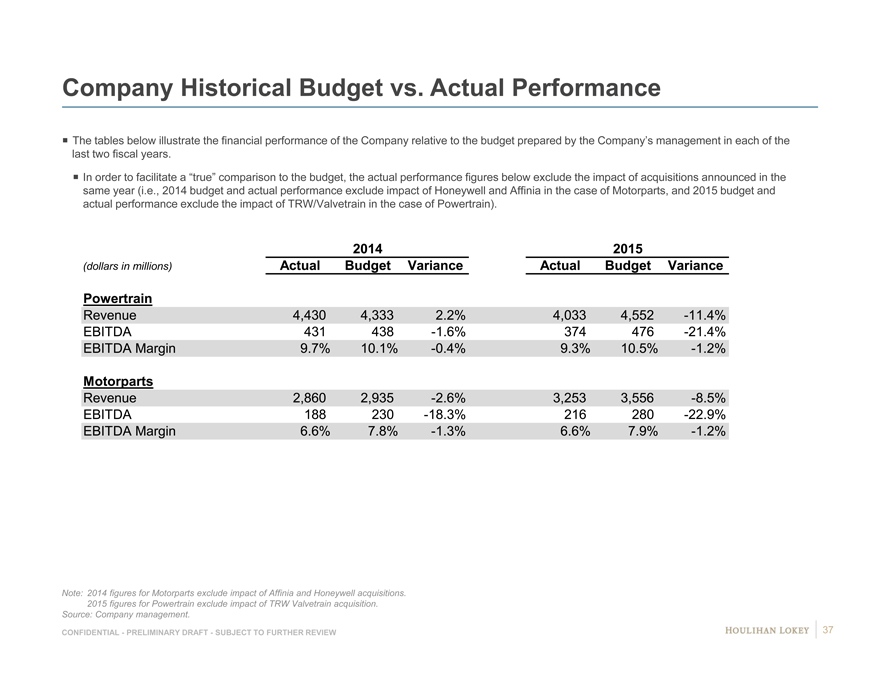
Company Historical Budget vs. Actual Performance
The tables below illustrate the financial performance of the Company relative to the budget prepared by the Company’s management in each of the
last two fiscal years.
In order to facilitate a “true” comparison to the budget, the actual performance figures below exclude the impact of acquisitions announced in the
same year (i.e., 2014 budget and actual performance exclude impact of Honeywell and Affinia in the case of Motorparts, and 2015 budget and
actual performance exclude the impact of TRW/Valvetrain in the case of Powertrain).
20142015
(dollars in millions) ActualBudgetVarianceActualBudgetVariance
Powertrain
Revenue 4,4304,3332.2%4,0334,552-11.4%
EBITDA 431438-1.6%374476-21.4%
EBITDA Margin 9.7%10.1%-0.4%9.3%10.5%-1.2%
Motorparts
Revenue 2,8602,935-2.6%3,2533,556-8.5%
EBITDA 188230-18.3%216280-22.9%
EBITDA Margin 6.6%7.8%-1.3%6.6%7.9%-1.2%
Note: 2014 figures for Motorparts exclude impact of Affinia and Honeywell acquisitions.
2015 figures for Powertrain exclude impact of TRW Valvetrain acquisition.
Source: Company management.
CONFIDENTIAL—PRELIMINARY DRAFT—SUBJECT TO FURTHER REVIEW 37
|
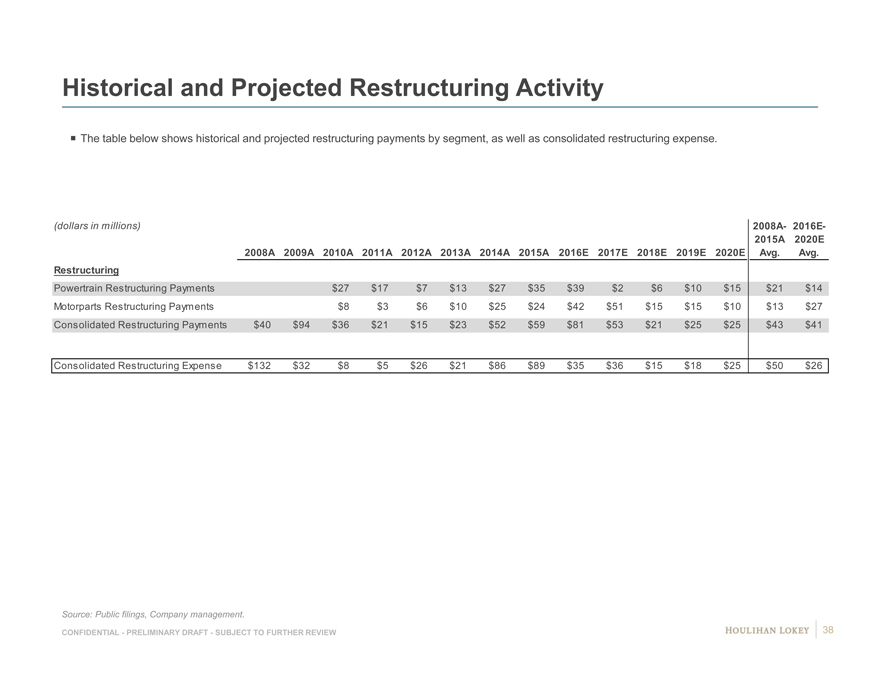
Historical and Projected Restructuring Activity
The table below shows historical and projected restructuring payments by segment, as well as consolidated restructuring expense.
(dollars in millions) 2008A-2016E-
2015A2020E
2008A 2009A2010A 2011A2012A2013A2014A2015A2016E 2017E 2018E2019E 2020EAvg.Avg.
Restructuring
Powertrain Restructuring Payments $27$17$7$13$27$35$39$2$6$10$15$21$14
Motorparts Restructuring Payments $8$3$6$10$25$24$42$51$15$15$10$13$27
Consolidated Restructuring Payments $40 $94$36$21$15$23$52$59$81$53$21$25$25$43$41
Consolidated Restructuring Expense $132 $32$8$5$26$21$86$89$35$36$15$18$25$50$26
Source: Public filings, Company management.
CONFIDENTIAL—PRELIMINARY DRAFT—SUBJECT TO FURTHER REVIEW 38
|
Page
1. Executive Summary 3
2. Preliminary Financial Analyses 9
3. Selected Public Market Observations 17
4. Appendix 22
Company Financial Update 23
Cost of Capital Considerations 26
Selected Companies—Operating Statistics 32
Company Financial Performance Observations 36
Implied Premiums Paid Observations 39
Illustrative Preliminary Financial Analyses (EBITDA) 42
5. Disclaimer 54
|
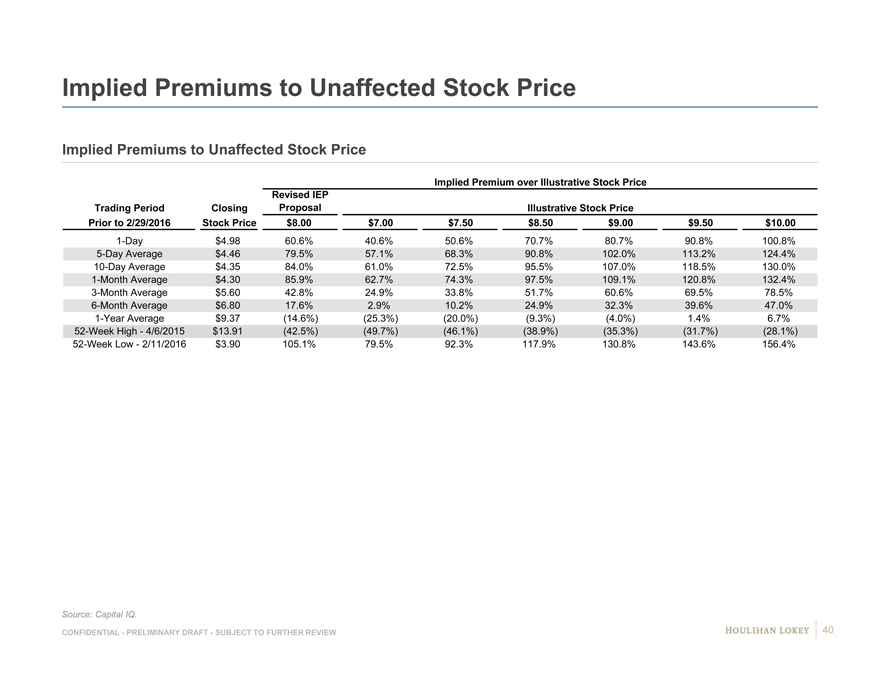
Implied Premiums to Unaffected Stock Price
Implied Premiums to Unaffected Stock Price
Implied Premium over Illustrative Stock Price
Revised IEP
Trading Period Closing ProposalIllustrative Stock Price
Prior to 2/29/2016 Stock Price $8.00$7.00$7.50$8.50$9.00$9.50$10.00
1-Day $4.98 60.6%40.6%50.6%70.7%80.7%90.8%100.8%
5-Day Average $4.46 79.5%57.1%68.3%90.8%102.0%113.2%124.4%
10-Day Average $4.35 84.0%61.0%72.5%95.5%107.0%118.5%130.0%
1-Month Average $4.30 85.9%62.7%74.3%97.5%109.1%120.8%132.4%
3-Month Average $5.60 42.8%24.9%33.8%51.7%60.6%69.5%78.5%
6-Month Average $6.80 17.6%2.9%10.2%24.9%32.3%39.6%47.0%
1-Year Average $9.37 (14.6%)(25.3%)(20.0%)(9.3%)(4.0%)1.4%6.7%
52-Week High—4/6/2015 $13.91 (42.5%)(49.7%)(46.1%)(38.9%)(35.3%)(31.7%)(28.1%)
52-Week Low—2/11/2016 $3.90 105.1%79.5%92.3%117.9%130.8%143.6%156.4%
Source: Capital IQ.
CONFIDENTIAL—PRELIMINARY DRAFT—SUBJECT TO FURTHER REVIEW 40
|
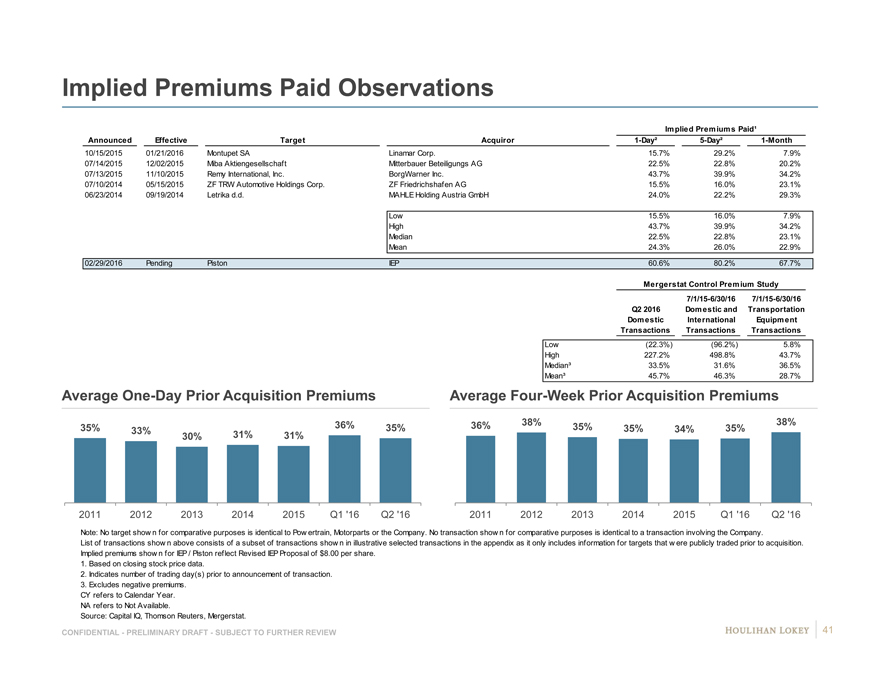
Implied Premiums Paid Observations
Implied Premiums Paid¹
Announced Effective TargetAcquiror1-Day²5-Day²1-Month
10/15/2015 01/21/2016 Montupet SALinamar Corp.15.7%#29.2%#7.9%#
07/14/2015 12/02/2015 Miba AktiengesellschaftMitterbauer Beteiligungs AG22.5%#22.8%#20.2%#
07/13/2015 11/10/2015 Remy International, Inc.BorgWarner Inc.43.7%#39.9%#34.2%#
07/10/2014 05/15/2015 ZF TRW Automotive Holdings Corp.ZF Friedrichshafen AG15.5%#16.0%#23.1%#
06/23/2014 09/19/2014 Letrika d.d.MAHLE Holding Austria GmbH24.0%#22.2%#29.3%#
Low15.5%16.0%7.9%
High43.7%39.9%34.2%
Median22.5%22.8%23.1%
Mean24.3%26.0%22.9%
02/29/2016 Pending PistonIEP60.6%80.2%67.7%
Mergerstat Control Premium Study
7/1/15-6/30/167/1/15-6/30/16
Q2 2016Domestic andTransportation
Domestic ic International al Equipment
TransactionsTransactionsTransactions
Low(22.3%) #(96.2%) #5.8%
High227.2%#498.8%#43.7%
Median³33.5%#31.6%#36.5%
Mean³45.7%#46.3%#28.7%
Average One-Day Prior Acquisition Premiums Average Four-Week Prior Acquisition Premiums
35% 33% 36%35%36%38%35%35%34%35%38%
30%31%31%
2011 2012 201320142015Q1 ‘16Q2 ‘1620112012201320142015Q1 ‘16Q2 ‘16
Note: No target show n for comparative purposes is identical to Pow ertrain, Motorparts or the Company. No transaction show n for comparative purposes is identical to a transaction involving the Company.
List of transactions show n above consists of a subset of transactions show n in illustrative selected transactions in the appendix as it only includes information for targets that w ere publicly traded prior to acquisition.
Implied premiums show n for IEP / Piston reflect Revised IEP Proposal of $8.00 per share.
1. Based on closing stock price data.
2. Indicates number of trading day(s) prior to announcement of transaction.
3. Excludes negative premiums.
CY refers to Calendar Year.
NA refers to Not Available.
Source: Capital IQ, Thomson Reuters, Mergerstat.
CONFIDENTIAL—PRELIMINARY DRAFT—SUBJECT TO FURTHER REVIEW 41
|
Page
1. Executive Summary 3
2. Preliminary Financial Analyses 9
3. Selected Public Market Observations 17
4. Appendix 22 Company Financial Update 23 Cost of Capital Considerations 26 Selected Companies—Operating Statistics 32 Company Financial Performance Observations 36 Implied Premiums Paid Observations 39 Illustrative Preliminary Financial Analyses (EBITDA) 42
5. Disclaimer 54
|
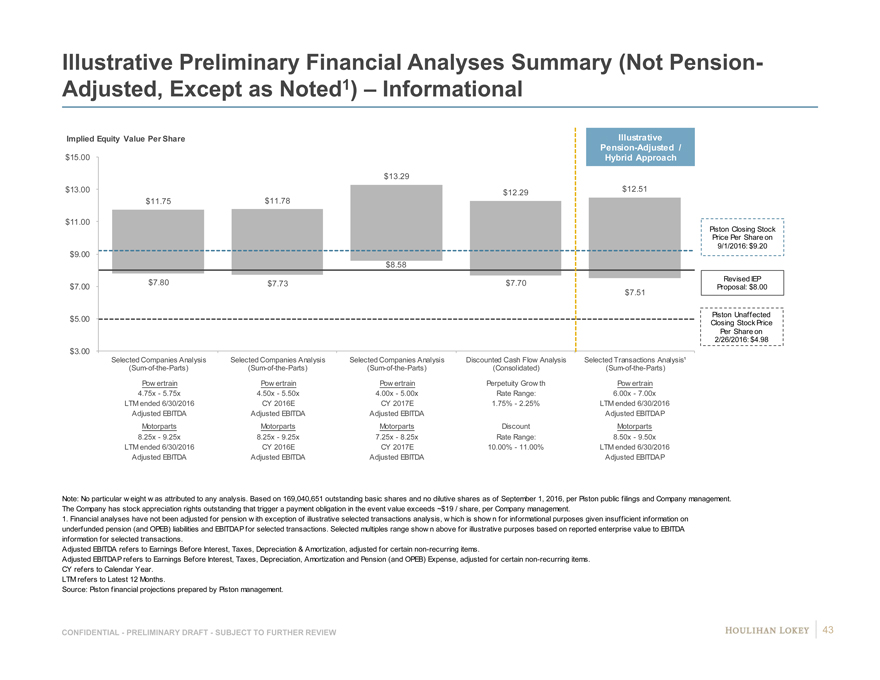
Illustrative Preliminary Financial Analyses Summary (Not Pension-
Adjusted, Except as Noted1) – Informational
Implied Equity Value Per Share Illustrative
Pension-Adjusted /
$15.00 Hybrid Approach
$13.29
$13.00 $12.29$12.51
$11.75 $11.78
$11.00
Piston Closing Stock
Price Per Share on
9/1/2016: $9.20
$9.00
$8.58
$7.80 $7.73 $7.70Revised IEP
$7.00 Proposal: $8.00
$7.51
Piston Unaffected
$5.00 Closing Stock Price
Per Share on
2/26/2016: $4.98
$3.00
Selected Companies Analysis Selected Companies Analysis Selected Companies AnalysisDiscounted Cash Flow AnalysisSelected Transactions Analysis¹
(Sum-of-the-Parts) (Sum-of-the-Parts) (Sum-of-the-Parts)(Consolidated)(Sum-of-the-Parts)
Pow ertrain Pow ertrain Pow ertrainPerpetuity Grow thPow ertrain
4.75x—5.75x 4.50x—5.50x 4.00x—5.00xRate Range:6.00x—7.00x
LTM ended 6/30/2016 CY 2016E CY 2017E1.75%—2.25%LTM ended 6/30/2016
Adjusted EBITDA Adjusted EBITDA Adjusted EBITDAAdjusted EBITDAP
Motorparts Motorparts MotorpartsDiscountMotorparts
8.25x—9.25x 8.25x—9.25x 7.25x—8.25xRate Range:8.50x—9.50x
LTM ended 6/30/2016 CY 2016E CY 2017E10.00%—11.00%LTM ended 6/30/2016
Adjusted EBITDA Adjusted EBITDA Adjusted EBITDAAdjusted EBITDAP
Note: No particular w eight w as attributed to any analysis. Based on 169,040,651 outstanding basic shares and no dilutive shares as of September 1, 2016, per Piston public filings and Company management.
The Company has stock appreciation rights outstanding that trigger a payment obligation in the event value exceeds ~$19 / share, per Company management.
1. Financial analyses have not been adjusted for pension w ith exception of illustrative selected transactions analysis, w hich is show n for informational purposes given insufficient information on
underfunded pension (and OPEB) liabilities and EBITDAP for selected transactions. Selected multiples range show n above for illustrative purposes based on reported enterprise value to EBITDA
information for selected transactions.
Adjusted EBITDA refers to Earnings Before Interest, Taxes, Depreciation & Amortization, adjusted for certain non-recurring items.
Adjusted EBITDAP refers to Earnings Before Interest, Taxes, Depreciation, Amortization and Pension (and OPEB) Expense, adjusted for certain non-recurring items.
CY refers to Calendar Year.
LTM refers to Latest 12 Months.
Source: Piston financial projections prepared by Piston management.
CONFIDENTIAL—PRELIMINARY DRAFT—SUBJECT TO FURTHER REVIEW 43
|
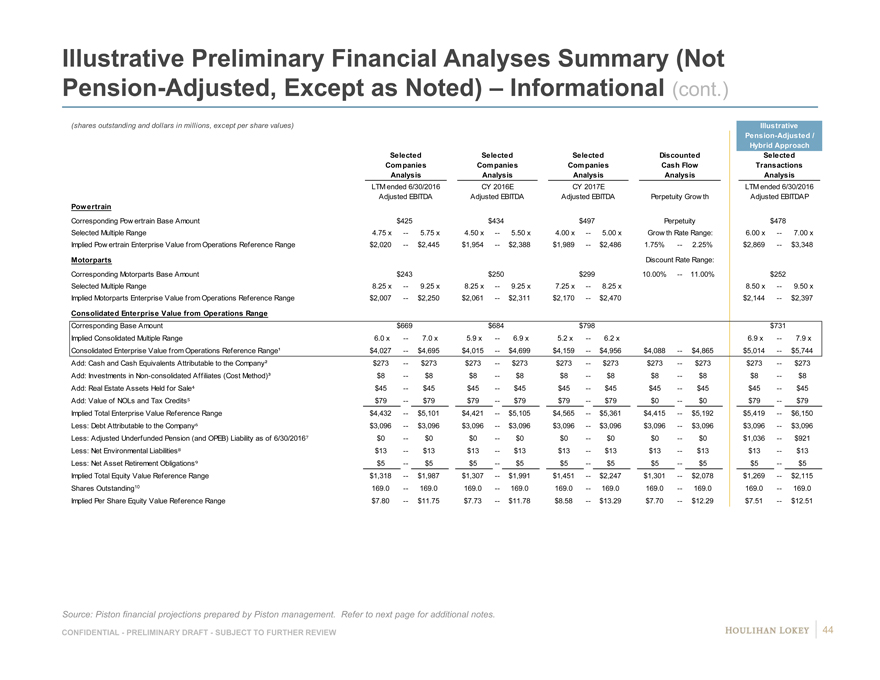
Illustrative Preliminary Financial Analyses Summary (Not
Pension-Adjusted, Except as Noted) – Informational (cont.)
(shares outstanding and dollars in millions, except per share values) Illustrative
Pension-Adjusted /
Hybrid Approach
Selected SelectedSelectedDiscountedSelected
Companies CompaniesCompaniesCash FlowTransactions
Analysis AnalysisAnalysisAnalysisAnalysis
LTM ended 6/30/2016 CY 2016ECY 2017ELTM ended 6/30/2016
Adjusted EBITDA Adjusted EBITDAAdjusted EBITDAPerpetuity Grow thAdjusted EBITDAP
Powertrain Discount Rate Range:
Corresponding Pow ertrain Base Amount $425$434$497Perpetuity$478
Selected Multiple Range 4.75 x —5.75 x4.50 x—5.50 x4.00 x—5.00 xGrow th Rate Range:6.00 x—7.00 x
Implied Pow ertrain Enterprise Value from Operations Reference Range $2,020 —$2,445$1,954—$2,388$1,989—$2,4861.75%—2.25%$2,869—$3,348
Motorparts Discount Rate Range:
Corresponding Motorparts Base Amount $243$250$29910.00%—11.00%$252
Selected Multiple Range 8.25 x —9.25 x8.25 x—9.25 x7.25 x—8.25 x8.50 x—9.50 x
Implied Motorparts Enterprise Value from Operations Reference Range $2,007 —$2,250$2,061—$2,311$2,170—$2,470$2,144—$2,397
Consolidated Enterprise Value from Operations Range
Corresponding Base Amount $669$684$798$731
Implied Consolidated Multiple Range 6.0 x —7.0 x5.9 x—6.9 x5.2 x—6.2 x6.9 x—7.9 x
Consolidated Enterprise Value from Operations Reference Range¹ $4,027 —$4,695$4,015—$4,699$4,159—$4,956$4,088—$4,865$5,014—$5,744
Add: Cash and Cash Equivalents Attributable to the Company² $273 —$273$273—$273$273—$273$273—$273$273—$273
Add: Investments in Non-consolidated Affiliates (Cost Method)³ $8 —$8$8—$8$8—$8$8—$8$8—$8
Add: Real Estate Assets Held for Sale $45 —$45$45—$45$45—$45$45—$45$45—$45
Add: Value of NOLs and Tax Credits $79 —$79$79—$79$79—$79$0—$0$79—$79
Implied Total Enterprise Value Reference Range $4,432 —$5,101$4,421—$5,105$4,565—$5,361$4,415—$5,192$5,419—$6,150
Less: Debt Attributable to the Company $3,096 —$3,096$3,096—$3,096$3,096—$3,096$3,096—$3,096$3,096—$3,096
Less: Adjusted Underfunded Pension (and OPEB) Liability as of 6/30/2016 $0 —$0$0—$0$0—$0$0—$0$1,036—$921
Less: Net Environmental Liabilities $13 —$13$13—$13$13—$13$13—$13$13—$13
Less: Net Asset Retirement Obligations $5 —$5$5—$5$5—$5$5—$5$5—$5
Implied Total Equity Value Reference Range $1,318 —$1,987$1,307—$1,991$1,451—$2,247$1,301—$2,078$1,269—$2,115
Shares Outstanding10 169.0 —169.0169.0—169.0169.0—169.0169.0—169.0169.0—169.0
Implied Per Share Equity Value Reference Range $7.80 —$11.75$7.73—$11.78$8.58—$13.29$7.70—$12.29$7.51—$12.51
Source: Piston financial projections prepared by Piston management. Refer to next page for additional notes.
CONFIDENTIAL—PRELIMINARY DRAFT—SUBJECT TO FURTHER REVIEW
44
|
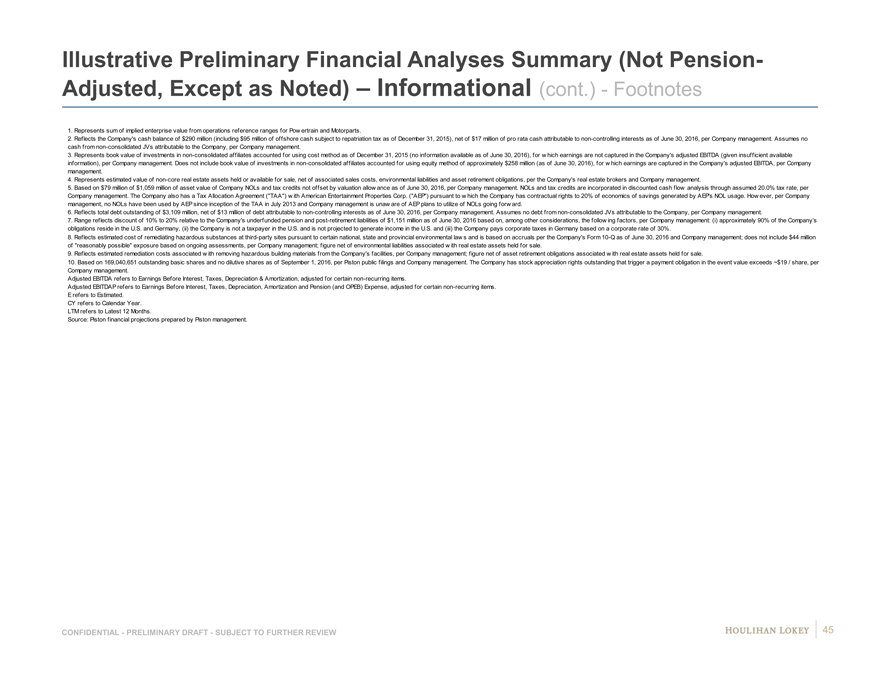
Illustrative Preliminary Financial Analyses Summary (Not Pension-Adjusted, Except as Noted) – Informational (cont.)—Footnotes
1. Represents sum of implied enterprise value from operations reference ranges for Pow ertrain and Motorparts.
2. Reflects the Company’s cash balance of $290 million (including $95 million of offshore cash subject to repatriation tax as of December 31, 2015), net of $17 million of pro rata cash attributable to non-controlling interests as of June 30, 2016, per Company management. Assumes no cash from non-consolidated JVs attributable to the Company, per Company management.
3. Represents book value of investments in non-consolidated affiliates accounted for using cost method as of December 31, 2015 (no information available as of June 30, 2016), for w hich earnings are not captured in the Company’s adjusted EBITDA (given insufficient available information), per Company management. Does not include book value of investments in non-consolidated affiliates accounted for using equity method of approximately $258 million (as of June 30, 2016), for w hich earnings are captured in the Company’s adjusted EBITDA, per Company management.
4. Represents estimated value of non-core real estate assets held or available for sale, net of associated sales costs, environmental liabilities and asset retirement obligations, per the Company’s real estate brokers and Company management.
5. Based on $79 million of $1,059 million of asset value of Company NOLs and tax credits not offset by valuation allow ance as of June 30, 2016, per Company management. NOLs and tax credits are incorporated in discounted cash flow analysis through assumed 20.0% tax rate, per Company management. The Company also has a Tax Allocation Agreement (“TAA”) w ith American Entertainment Properties Corp. (“AEP”) pursuant to w hich the Company has contractual rights to 20% of economics of savings generated by AEP’s NOL usage. How ever, per Company management, no NOLs have been used by AEP since inception of the TAA in July 2013 and Company management is unaw are of AEP plans to utilize of NOLs going forw ard.
6. Reflects total debt outstanding of $3,109 million, net of $13 million of debt attributable to non-controlling interests as of June 30, 2016, per Company management. Assumes no debt from non-consolidated JVs attributable to the Company, per Company management.
7. Range reflects discount of 10% to 20% relative to the Company’s underfunded pension and post-retirement liabilities of $1,151 million as of June 30, 2016 based on, among other considerations, the follow ing factors, per Company management: (i) approximately 90% of the Company’s obligations reside in the U.S. and Germany, (ii) the Company is not a taxpayer in the U.S. and is not projected to generate income in the U.S. and (iii) the Company pays corporate taxes in Germany based on a corporate rate of 30%.
8. Reflects estimated cost of remediating hazardous substances at third-party sites pursuant to certain national, state and provincial environmental law s and is based on accruals per the Company’s Form 10-Q as of June 30, 2016 and Company management; does not include $44 million of “reasonably possible” exposure based on ongoing assessments, per Company management; figure net of environmental liabilities associated w ith real estate assets held for sale.
9. Reflects estimated remediation costs associated w ith removing hazardous building materials from the Company’s facilities, per Company management; figure net of asset retirement obligations associated w ith real estate assets held for sale.
10. Based on 169,040,651 outstanding basic shares and no dilutive shares as of September 1, 2016, per Piston public filings and Company management. The Company has stock appreciation rights outstanding that trigger a payment obligation in the event value exceeds ~$19 / share, per Company management.
Adjusted EBITDA refers to Earnings Before Interest, Taxes, Depreciation & Amortization, adjusted for certain non-recurring items.
Adjusted EBITDAP refers to Earnings Before Interest, Taxes, Depreciation, Amortization and Pension (and OPEB) Expense, adjusted for certain non-recurring items. E refers to Estimated.
CY refers to Calendar Year. LTM refers to Latest 12 Months.
Source: Piston financial projections prepared by Piston management.
CONFIDENTIAL—PRELIMINARY DRAFT—SUBJECT TO FURTHER REVIEW 45
|
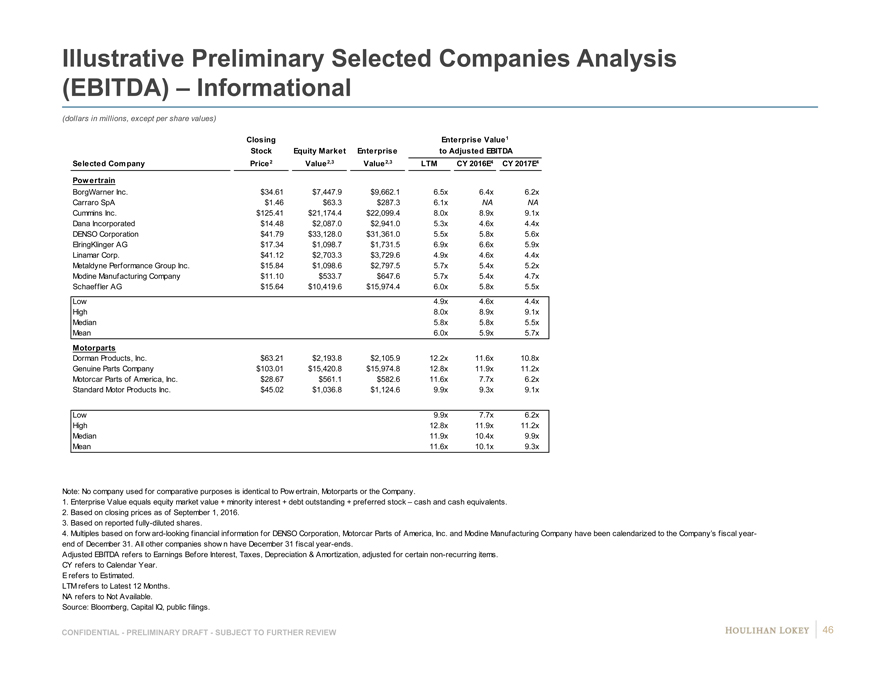
Illustrative Preliminary Selected Companies Analysis
(EBITDA) – Informational
(dollars in millions, except per share values)
Closing Enterprise Value1
Stock Equity MarketEnterpriseto Adjusted EBITDA
Selected Company Price2 Value2,3Value2,3LTMCY 2016E4CY 2017E4
Pow ertrain
BorgWarner Inc. $34.61 $7,447.9$9,662.16.5x6.4x6.2x6 9
Carraro SpA $1.46 $63.3$287.36.1xNANA N NA
Cummins Inc. $125.41 $21,174.4$22,099.48.0x8.9x9.1x9 #
Dana Incorporated $14.48 $2,087.0$2,941.05.3x4.6x4.4x4 8
DENSO Corporation $41.79 $33,128.0$31,361.05.5x5.8x5.6x6 #
ElringKlinger AG $17.34 $1,098.7$1,731.56.9x6.6x5.9x6 #
Linamar Corp. $41.12 $2,703.3$3,729.64.9x4.6x4.4x4 9
Metaldyne Performance Group Inc. $15.84 $1,098.6$2,797.55.7x5.4x5.2x5 8
Modine Manufacturing Company $11.10 $533.7$647.65.7x5.4x4.7x5 #
Schaeffler AG $15.64 $10,419.6$15,974.46.0x5.8x5.5x6 #
Low 4.9x4.6x4.4x
High 8.0x8.9x9.1x
Median 5.8x5.8x5.5x
Mean 6.0x5.9x5.7x
Motorparts
Dorman Products, Inc. $63.21 $2,193.8$2,105.912.2x11.6x10.8x# #
Genuine Parts Company $103.01 $15,420.8$15,974.812.8x11.9x11.2x# #
Motorcar Parts of America, Inc. $28.67 $561.1$582.611.6x7.7x6.2x# 7
Standard Motor Products Inc. $45.02 $1,036.8$1,124.69.9x9.3x9.1x# NA
Low 9.9x7.7x6.2x
High 12.8x11.9x11.2x
Median 11.9x10.4x9.9x
Mean 11.6x10.1x9.3x
Note: No company used for comparative purposes is identical to Pow ertrain, Motorparts or the Company.
1. Enterprise Value equals equity market value + minority interest + debt outstanding + preferred stock – cash and cash equivalents.
2. Based on closing prices as of September 1, 2016.
3. Based on reported fully-diluted shares.
4. Multiples based on forw ard-looking financial information for DENSO Corporation, Motorcar Parts of America, Inc. and Modine Manufacturing Company have been calendarized to the Company’s fiscal year-
end of December 31. All other companies show n have December 31 fiscal year-ends.
Adjusted EBITDA refers to Earnings Before Interest, Taxes, Depreciation & Amortization, adjusted for certain non-recurring items.
CY refers to Calendar Year.
E refers to Estimated.
LTM refers to Latest 12 Months.
NA refers to Not Available.
Source: Bloomberg, Capital IQ, public filings.
CONFIDENTIAL—PRELIMINARY DRAFT—SUBJECT TO FURTHER REVIEW 46
|
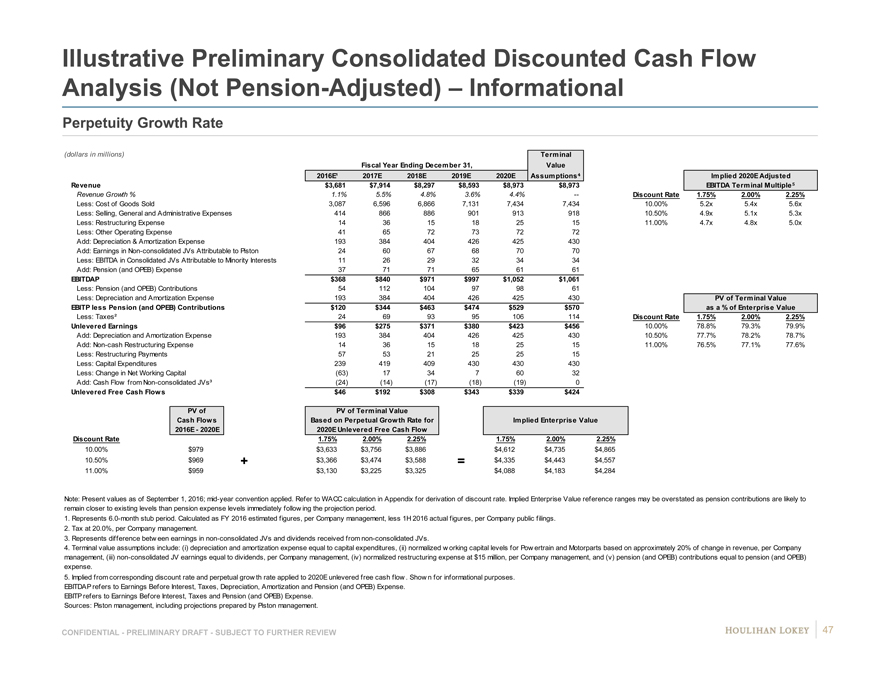
Illustrative Preliminary Consolidated Discounted Cash Flow
Analysis (Not Pension-Adjusted) – Informational
Perpetuity Growth Rate
(dollars in millions) Terminal
Fiscal Year Ending December 31,Value
2016E¹2017E2018E2019E2020E Assumptions Implied 2020E Adjusted
Revenue $3,681$7,914$8,297$8,593$8,973$8,973EBITDA Terminal Multiple
Revenue Growth % 1.1%5.5%4.8%3.6%4.4%—Discount Rate1.75%2.00%2.25%
Less: Cost of Goods Sold 3,0876,5966,8667,1317,4347,43410.00%5.2x5.4x5.6x
Less: Selling, General and Administrative Expenses 414 86688690191391810.50%4.9x5.1x5.3x
Less: Restructuring Expense 14361518251511.00%4.7x4.8x5.0x
Less: Other Operating Expense 416572737272
Add: Depreciation & Amortization Expense 193384404426425430
Add: Earnings in Non-consolidated JVs Attributable to Piston 24 6067687070
Less: EBITDA in Consolidated JVs Attributable to Minority Interests 11 2629323434
Add: Pension (and OPEB) Expense 377171656161
EBITDAP $368$840$971$997$1,052$1,061
Less: Pension (and OPEB) Contributions 54112104979861
Less: Depreciation and Amortization Expense 193384404426425430PV of Terminal Value
EBITP less Pension (and OPEB) Contributions $120 $344$463$474$529$570as a % of Enterprise Value
Less: Taxes² 24699395106114Discount Rate1.75%2.00%2.25%
Unlevered Earnings $96$275$371$380$423$45610.00%78.8%79.3%79.9%
Add: Depreciation and Amortization Expense 19338440442642543010.50%77.7%78.2%78.7%
Add: Non-cash Restructuring Expense 14361518251511.00%76.5%77.1%77.6%
Less: Restructuring Payments 575321252515
Less: Capital Expenditures 239419409430430430
Less: Change in Net Working Capital (63)173476032
Add: Cash Flow from Non-consolidated JVs³ (24)(14)(17)(18)(19)0
Unlevered Free Cash Flows $46$192$308$343$339$424
PV ofPV of Terminal Value
Cash FlowsBased on Perpetual Growth Rate forImplied Enterprise Value
2016E—2020E2020E Unlevered Free Cash Flow
Discount Rate 1.75%2.00%2.25%1.75%2.00%2.25%
10.00% 0.100 $979$3,633$3,756$3,886$4,612$4,735$4,865
10.50% 0.105 $969+$3,366$3,474$3,588=$4,335$4,443$4,557
11.00% 0.110 $959$3,130$3,225$3,325$4,088$4,183$4,284
Note: Present values as of September 1, 2016; mid-year convention applied. Refer to WACC calculation in Appendix for derivation of discount rate. Implied Enterprise Value reference ranges may be overstated as pension contributions are likely to
remain closer to existing levels than pension expense levels immediately follow ing the projection period.
1. Represents 6.0-month stub period. Calculated as FY 2016 estimated figures, per Company management, less 1H 2016 actual figures, per Company public filings.
2. Tax at 20.0%, per Company management.
3. Represents difference betw een earnings in non-consolidated JVs and dividends received from non-consolidated JVs.
4. Terminal value assumptions include: (i) depreciation and amortization expense equal to capital expenditures, (ii) normalized w orking capital levels for Pow ertrain and Motorparts based on approximately 20% of change in revenue, per Company
management, (iii) non-consolidated JV earnings equal to dividends, per Company management, (iv) normalized restructuring expense at $15 million, per Company management, and (v) pension (and OPEB) contributions equal to pension (and OPEB)
expense.
5. Implied from corresponding discount rate and perpetual grow th rate applied to 2020E unlevered free cash flow . Show n for informational purposes.
EBITDAP refers to Earnings Before Interest, Taxes, Depreciation, Amortization and Pension (and OPEB) Expense.
EBITP refers to Earnings Before Interest, Taxes and Pension (and OPEB) Expense.
Sources: Piston management, including projections prepared by Piston management.
CONFIDENTIAL—PRELIMINARY DRAFT—SUBJECT TO FURTHER REVIEW 47
|
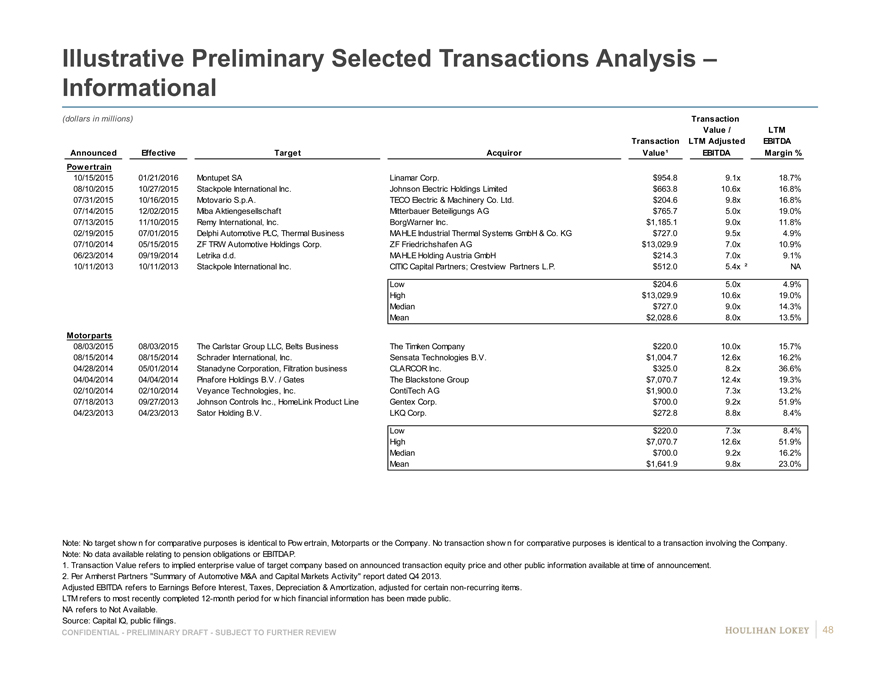
Illustrative Preliminary Selected Transactions Analysis –
Informational
(dollars in millions) Transaction
Value /LTM
Transaction LTM AdjustedEBITDA
Announced Effective TargetAcquirorValue¹EBITDAMargin %
Powertrain
10/15/2015 01/21/2016 Montupet SALinamar Corp.$954.89.1x18.7%
08/10/2015 10/27/2015 Stackpole International Inc.Johnson Electric Holdings Limited$663.810.6x16.8%
07/31/2015 10/16/2015 Motovario S.p.A.TECO Electric & Machinery Co. Ltd.$204.69.8x16.8%
07/14/2015 12/02/2015 Miba AktiengesellschaftMitterbauer Beteiligungs AG$765.75.0x19.0%
07/13/2015 11/10/2015 Remy International, Inc.BorgWarner Inc.$1,185.19.0x11.8%
02/19/2015 07/01/2015 Delphi Automotive PLC, Thermal BusinessMAHLE Industrial Thermal Systems GmbH & Co. KG$727.09.5x4.9%
07/10/2014 05/15/2015 ZF TRW Automotive Holdings Corp.ZF Friedrichshafen AG$13,029.97.0x10.9%
06/23/2014 09/19/2014 Letrika d.d.MAHLE Holding Austria GmbH$214.37.0x9.1%
10/11/2013 10/11/2013 Stackpole International Inc.CITIC Capital Partners; Crestview Partners L.P.$512.05.4x ²NA N
Low$204.65.0x4.9%
High$13,029.910.6x19.0%
Median$727.09.0x14.3%
Mean$2,028.68.0x13.5%
Motorparts
08/03/2015 08/03/2015 The Carlstar Group LLC, Belts BusinessThe Timken Company$220.010.0x15.7%
08/15/2014 08/15/2014 Schrader International, Inc.Sensata Technologies B.V.$1,004.712.6x16.2%
04/28/2014 05/01/2014 Stanadyne Corporation, Filtration businessCLARCOR Inc.$325.08.2x36.6%
04/04/2014 04/04/2014 Pinafore Holdings B.V. / GatesThe Blackstone Group$7,070.712.4x19.3%
02/10/2014 02/10/2014 Veyance Technologies, Inc.ContiTech AG$1,900.07.3x13.2%
07/18/2013 09/27/2013 Johnson Controls Inc., HomeLink Product LineGentex Corp.$700.09.2x51.9%
04/23/2013 04/23/2013 Sator Holding B.V.LKQ Corp.$272.88.8x8.4%
Low$220.07.3x8.4%
High$7,070.712.6x51.9%
Median$700.09.2x16.2%
Mean$1,641.99.8x23.0%
Note: No target show n for comparative purposes is identical to Pow ertrain, Motorparts or the Company. No transaction show n for comparative purposes is identical to a transaction involving the Company.
Note: No data available relating to pension obligations or EBITDAP.
1. Transaction Value refers to implied enterprise value of target company based on announced transaction equity price and other public information available at time of announcement.
2. Per Amherst Partners “Summary of Automotive M&A and Capital Markets Activity” report dated Q4 2013.
Adjusted EBITDA refers to Earnings Before Interest, Taxes, Depreciation & Amortization, adjusted for certain non-recurring items.
LTM refers to most recently completed 12-month period for w hich financial information has been made public.
NA refers to Not Available.
Source: Capital IQ, public filings.
CONFIDENTIAL—PRELIMINARY DRAFT—SUBJECT TO FURTHER REVIEW 48
|
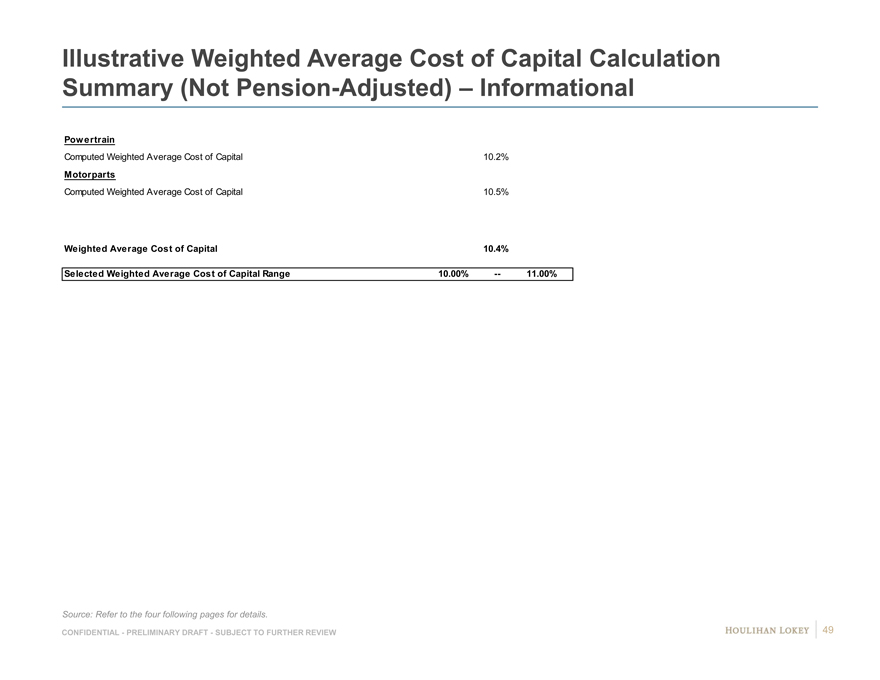
Illustrative Weighted Average Cost of Capital Calculation
Summary (Not Pension-Adjusted) – Informational
Powertrain
Computed Weighted Average Cost of Capital 10.2%
Motorparts
Computed Weighted Average Cost of Capital 10.5%
Weighted Average Cost of Capital 10.4%
Selected Weighted Average Cost of Capital Range 10.00% — 11.00%
Source: Refer to the four following pages for details.
CONFIDENTIAL—PRELIMINARY DRAFT—SUBJECT TO FURTHER REVIEW 49
|
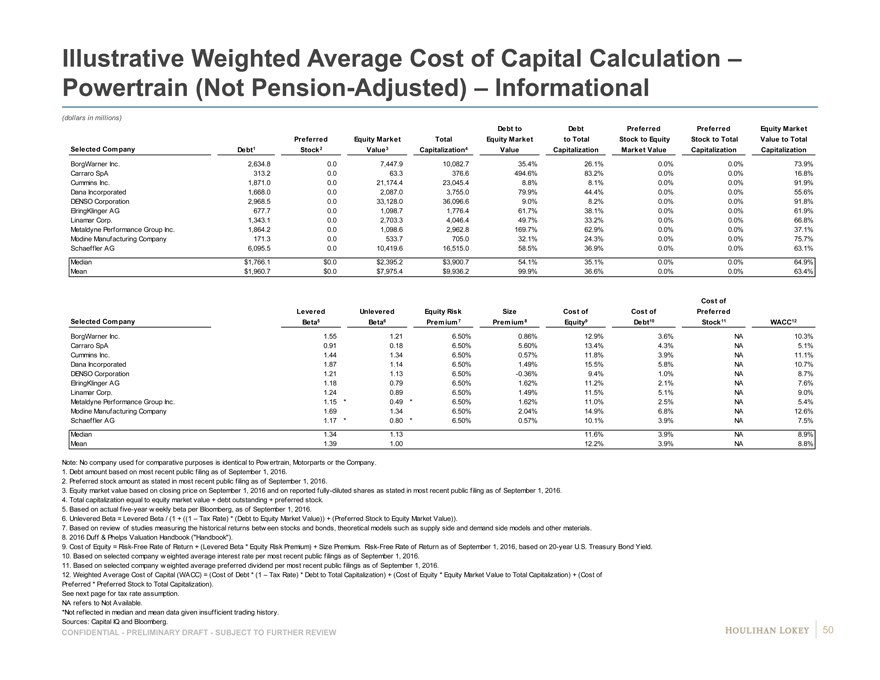
Illustrative Weighted Average Cost of Capital Calculation –
Powertrain (Not Pension-Adjusted) – Informational
(dollars in millions)
Debt toDebtPreferredPreferredEquity Market
PreferredEquity MarketTotalEquity Marketto TotalStock to EquityStock to TotalValue to Total
Selected Company Debt1 Stock2Value3Capitalization4ValueCapitalizationMarket ValueCapitalizationCapitalization
BorgWarner Inc. 2,634.8#0.0#7,447.9#10,082.7#35.4% #26.1% #0.0% #0.0% #73.9%#
Carraro SpA 313.2#0.0#63.3#376.6#494.6% #83.2% #0.0% #0.0% #16.8%#
Cummins Inc. 1,871.0#0.0#21,174.4#23,045.4#8.8% #8.1% #0.0% #0.0% #91.9%#
Dana Incorporated 1,668.0#0.0#2,087.0#3,755.0#79.9% #44.4% #0.0% #0.0% #55.6%#
DENSO Corporation 2,968.5#0.0#33,128.0#36,096.6#9.0% #8.2% #0.0% #0.0% #91.8%#
ElringKlinger AG 677.7#0.0#1,098.7#1,776.4#61.7% #38.1% #0.0% #0.0% #61.9%#
Linamar Corp. 1,343.1#0.0#2,703.3#4,046.4#49.7% #33.2% #0.0% #0.0% #66.8%#
Metaldyne Performance Group Inc. 1,864.2#0.0#1,098.6#2,962.8#169.7% #62.9% #0.0% #0.0% #37.1%#
Modine Manufacturing Company 171.3#0.0#533.7#705.0#32.1% #24.3% #0.0% #0.0% #75.7%#
Schaeffler AG 6,095.5#0.0#10,419.6#16,515.0#58.5% #36.9% #0.0% #0.0% #63.1%#
Median $1,766.1$0.0$2,395.2$3,900.754.1%35.1%0.0%0.0%64.9%
Mean $1,960.7$0.0$7,975.4$9,936.299.9%36.6%0.0%0.0%63.4%
Cost of
LeveredUnleveredEquity RiskSizeCost ofCost ofPreferred
Selected Company Beta5Beta6Premium 7Premium 8Equity9Debt10Stock11WACC12
BorgWarner Inc. 1.55#1.21#6.50%0.86%12.9% #3.6% #NA #10.3%0
Carraro SpA 0.91#0.18#6.50%5.60%13.4% #4.3% #NA #5.1%0
Cummins Inc. 1.44#1.34#6.50%0.57%11.8% #3.9% #NA #11.1%0
Dana Incorporated 1.87#1.14#6.50%1.49%15.5% #5.8% #NA #10.7%0
DENSO Corporation 1.21#1.13#6.50%-0.36%9.4% #1.0% #NA #8.7%0
ElringKlinger AG 1.18#0.79#6.50%1.62%11.2% #2.1% #NA #7.6%0
Linamar Corp. 1.24#0.89#6.50%1.49%11.5% #5.1% #NA #9.0%0
Metaldyne Performance Group Inc. 1.15*0.49*6.50%1.62%11.0% #2.5% #NA #5.4%0
Modine Manufacturing Company 1.69#1.34#6.50%2.04%14.9% #6.8% #NA #12.6%0
Schaeffler AG 1.17*0.80*6.50%0.57%10.1% #3.9% #NA #7.5%0
Median 1.341.1311.6%3.9%NA8.9%
Mean 1.391.0012.2%3.9%NA8.8%
Note: No company used for comparative purposes is identical to Pow ertrain, Motorparts or the Company.
1. Debt amount based on most recent public filing as of September 1, 2016.
2. Preferred stock amount as stated in most recent public filing as of September 1, 2016.
3. Equity market value based on closing price on September 1, 2016 and on reported fully-diluted shares as stated in most recent public filing as of September 1, 2016.
4. Total capitalization equal to equity market value + debt outstanding + preferred stock.
5. Based on actual five-year w eekly beta per Bloomberg, as of September 1, 2016.
6. Unlevered Beta = Levered Beta / (1 + ((1 – Tax Rate) * (Debt to Equity Market Value)) + (Preferred Stock to Equity Market Value)).
7. Based on review of studies measuring the historical returns betw een stocks and bonds, theoretical models such as supply side and demand side models and other materials.
8. 2016 Duff & Phelps Valuation Handbook (“Handbook”).
9. Cost of Equity = Risk-Free Rate of Return + (Levered Beta * Equity Risk Premium) + Size Premium. Risk-Free Rate of Return as of September 1, 2016, based on 20-year U.S. Treasury Bond Yield.
10. Based on selected company w eighted average interest rate per most recent public filings as of September 1, 2016.
11. Based on selected company w eighted average preferred dividend per most recent public filings as of September 1, 2016.
12. Weighted Average Cost of Capital (WACC) = (Cost of Debt * (1 – Tax Rate) * Debt to Total Capitalization) + (Cost of Equity * Equity Market Value to Total Capitalization) + (Cost of
Preferred * Preferred Stock to Total Capitalization).
See next page for tax rate assumption.
NA refers to Not Available.
*Not reflected in median and mean data given insufficient trading history.
Sources: Capital IQ and Bloomberg.
CONFIDENTIAL—PRELIMINARY DRAFT—SUBJECT TO FURTHER REVIEW 50
|
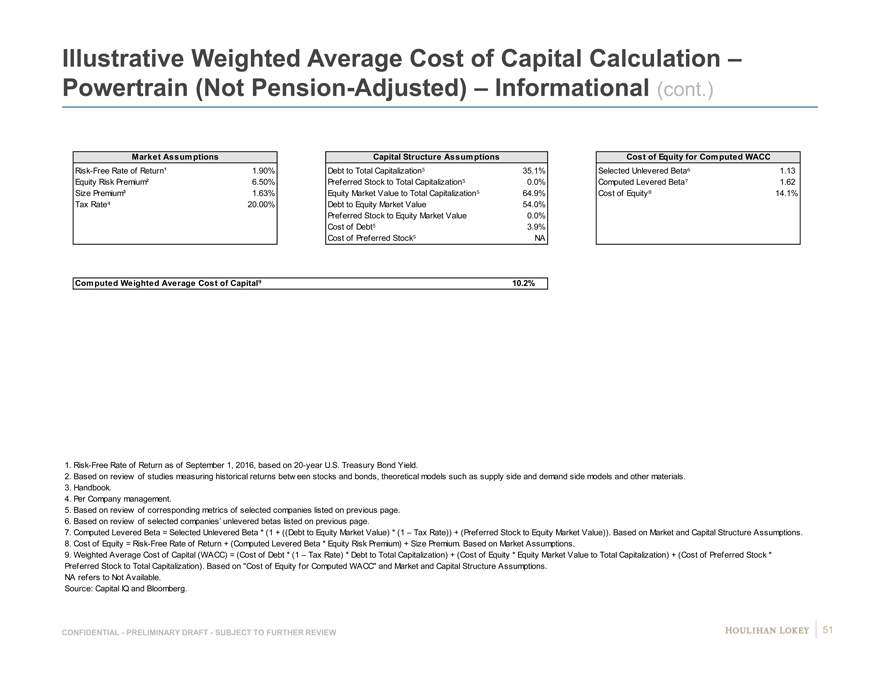
Illustrative Weighted Average Cost of Capital Calculation –
Powertrain (Not Pension-Adjusted) – Informational (cont.)
Market Assumptions Capital Structure AssumptionsCost of Equity for Computed WACC
Risk-Free Rate of Return¹ 1.90% Debt to Total Capitalization 35.1%Selected Unlevered Beta 1.13
Equity Risk Premium² 6.50% Preferred Stock to Total Capitalization 0.0%Computed Levered Beta 1.62
Size Premium³ 1.63%Equity Market Value to Total Capitalization 64.9%Cost of Equity 14.1%
Tax Rate 20.00%Debt to Equity Market Value54.0%
Preferred Stock to Equity Market Value0.0%
Cost of Debt 3.9%
Cost of Preferred Stock NA
Computed Weighted Average Cost of Capital 10.2%
1. Risk-Free Rate of Return as of September 1, 2016, based on 20-year U.S. Treasury Bond Yield.
2. Based on review of studies measuring historical returns betw een stocks and bonds, theoretical models such as supply side and demand side models and other materials.
3. Handbook.
4. Per Company management.
5. Based on review of corresponding metrics of selected companies listed on previous page.
6. Based on review of selected companies’ unlevered betas listed on previous page.
7. Computed Levered Beta = Selected Unlevered Beta * (1 + ((Debt to Equity Market Value) * (1 – Tax Rate)) + (Preferred Stock to Equity Market Value)). Based on Market and Capital Structure Assumptions.
8. Cost of Equity = Risk-Free Rate of Return + (Computed Levered Beta * Equity Risk Premium) + Size Premium. Based on Market Assumptions.
9. Weighted Average Cost of Capital (WACC) = (Cost of Debt * (1 – Tax Rate) * Debt to Total Capitalization) + (Cost of Equity * Equity Market Value to Total Capitalization) + (Cost of Preferred Stock *
Preferred Stock to Total Capitalization). Based on “Cost of Equity for Computed WACC” and Market and Capital Structure Assumptions.
NA refers to Not Available.
Source: Capital IQ and Bloomberg.
CONFIDENTIAL—PRELIMINARY DRAFT—SUBJECT TO FURTHER REVIEW 51
|
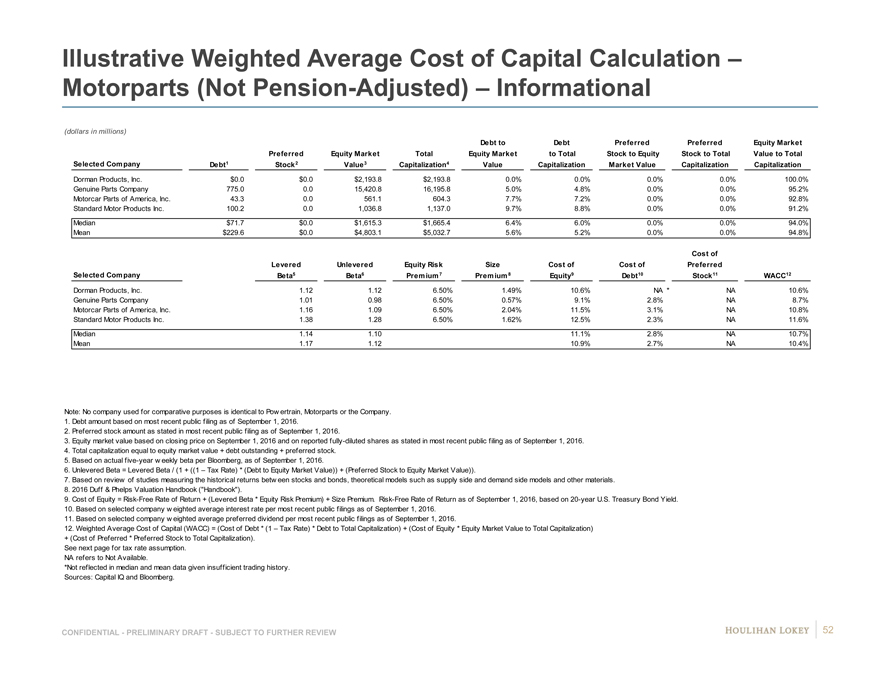
Illustrative Weighted Average Cost of Capital Calculation –
Motorparts (Not Pension-Adjusted) – Informational
(dollars in millions)
Debt toDebtPreferredPreferredEquity Market
PreferredEquity MarketTotalEquity Marketto TotalStock to EquityStock to TotalValue to Total
Selected Company Debt1 Stock2Value3Capitalization4ValueCapitalizationMarket ValueCapitalizationCapitalization
Dorman Products, Inc. $0.0 #$0.0#$2,193.8#$2,193.8#0.0% #0.0% #0.0%#0.0% #100.0%#
Genuine Parts Company 775.0 #0.0#15,420.8#16,195.8#5.0% #4.8% #0.0%#0.0% #95.2%#
Motorcar Parts of America, Inc. 43.3 #0.0#561.1#604.3#7.7% #7.2% #0.0%#0.0% #92.8%#
Standard Motor Products Inc. 100.2 #0.0#1,036.8#1,137.0#9.7% #8.8% #0.0%#0.0% #91.2%#
Median $71.7 $0.0$1,615.3$1,665.46.4%6.0%0.0%0.0%94.0%
Mean $229.6 $0.0$4,803.1$5,032.75.6%5.2%0.0%0.0%94.8%
Cost of
LeveredUnleveredEquity RiskSizeCost ofCost ofPreferred
Selected Company Beta5Beta6Premium 7Premium 8Equity9Debt10Stock11WACC12
Dorman Products, Inc. 1.12#1.12#6.50%1.49%10.6% #NA *NA #10.6%0
Genuine Parts Company 1.01#0.98#6.50%0.57%9.1% #2.8%#NA #8.7%0
Motorcar Parts of America, Inc. 1.16#1.09#6.50%2.04%11.5% #3.1%#NA #10.8%0
Standard Motor Products Inc. 1.38#1.28#6.50%1.62%12.5% #2.3%#NA #11.6%0
Median 1.141.1011.1%2.8%NA10.7%
Mean 1.171.1210.9%2.7%NA10.4%
Note: No company used for comparative purposes is identical to Pow ertrain, Motorparts or the Company.
1. Debt amount based on most recent public filing as of September 1, 2016.
2. Preferred stock amount as stated in most recent public filing as of September 1, 2016.
3. Equity market value based on closing price on September 1, 2016 and on reported fully-diluted shares as stated in most recent public filing as of September 1, 2016.
4. Total capitalization equal to equity market value + debt outstanding + preferred stock.
5. Based on actual five-year w eekly beta per Bloomberg, as of September 1, 2016.
6. Unlevered Beta = Levered Beta / (1 + ((1 – Tax Rate) * (Debt to Equity Market Value)) + (Preferred Stock to Equity Market Value)).
7. Based on review of studies measuring the historical returns betw een stocks and bonds, theoretical models such as supply side and demand side models and other materials.
8. 2016 Duff & Phelps Valuation Handbook (“Handbook”).
9. Cost of Equity = Risk-Free Rate of Return + (Levered Beta * Equity Risk Premium) + Size Premium. Risk-Free Rate of Return as of September 1, 2016, based on 20-year U.S. Treasury Bond Yield.
10. Based on selected company w eighted average interest rate per most recent public filings as of September 1, 2016.
11. Based on selected company w eighted average preferred dividend per most recent public filings as of September 1, 2016.
12. Weighted Average Cost of Capital (WACC) = (Cost of Debt * (1 – Tax Rate) * Debt to Total Capitalization) + (Cost of Equity * Equity Market Value to Total Capitalization)
+ (Cost of Preferred * Preferred Stock to Total Capitalization).
See next page for tax rate assumption.
NA refers to Not Available.
*Not reflected in median and mean data given insufficient trading history.
Sources: Capital IQ and Bloomberg.
CONFIDENTIAL—PRELIMINARY DRAFT—SUBJECT TO FURTHER REVIEW 52
|
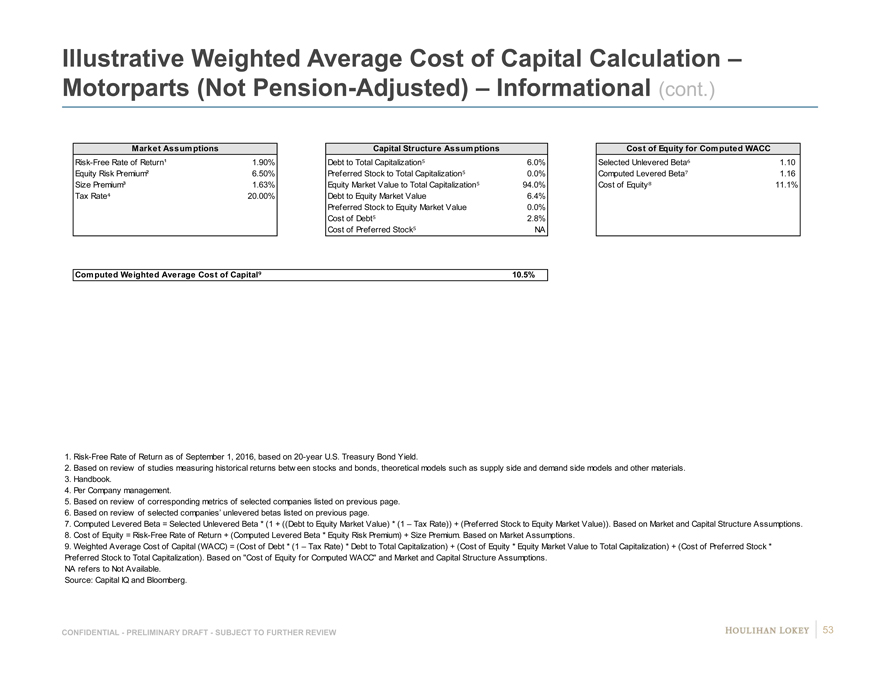
Illustrative Weighted Average Cost of Capital Calculation –
Motorparts (Not Pension-Adjusted) – Informational (cont.)
Market Assumptions Capital Structure AssumptionsCost of Equity for Computed WACC
Risk-Free Rate of Return¹ 1.90% Debt to Total Capitalization 6.0%Selected Unlevered Beta 1.10
Equity Risk Premium² 6.50% Preferred Stock to Total Capitalization 0.0%Computed Levered Beta 1.16
Size Premium³ 1.63%Equity Market Value to Total Capitalization 94.0%Cost of Equity 11.1%
Tax Rate 20.00%Debt to Equity Market Value6.4%
Preferred Stock to Equity Market Value0.0%
Cost of Debt 2.8%
Cost of Preferred Stock NA
Computed Weighted Average Cost of Capital 10.5%
1. Risk-Free Rate of Return as of September 1, 2016, based on 20-year U.S. Treasury Bond Yield.
2. Based on review of studies measuring historical returns betw een stocks and bonds, theoretical models such as supply side and demand side models and other materials.
3. Handbook.
4. Per Company management.
5. Based on review of corresponding metrics of selected companies listed on previous page.
6. Based on review of selected companies’ unlevered betas listed on previous page.
7. Computed Levered Beta = Selected Unlevered Beta * (1 + ((Debt to Equity Market Value) * (1 – Tax Rate)) + (Preferred Stock to Equity Market Value)). Based on Market and Capital Structure Assumptions.
8. Cost of Equity = Risk-Free Rate of Return + (Computed Levered Beta * Equity Risk Premium) + Size Premium. Based on Market Assumptions.
9. Weighted Average Cost of Capital (WACC) = (Cost of Debt * (1 – Tax Rate) * Debt to Total Capitalization) + (Cost of Equity * Equity Market Value to Total Capitalization) + (Cost of Preferred Stock *
Preferred Stock to Total Capitalization). Based on “Cost of Equity for Computed WACC” and Market and Capital Structure Assumptions.
NA refers to Not Available.
Source: Capital IQ and Bloomberg.
CONFIDENTIAL—PRELIMINARY DRAFT—SUBJECT TO FURTHER REVIEW 53
|
Page
1. Executive Summary 3
2. Preliminary Financial Analyses 9
3. Selected Public Market Observations 17
4. Appendix 22
5. Disclaimer 54
|
Disclaimer
This presentation, and any supplemental information (written or oral) or other documents provided in connection therewith (collectively, the “materials”), are provided solely for the information of the Special Committee (the “Committee”) of the Board of Directors (the “Board”) of Federal-Mogul Holdings Corporation (“Piston” or the “Company”) by Houlihan Lokey in connection with the Committee’s consideration of a potential transaction (the “Transaction”) involving the Company. This presentation is incomplete without reference to, and should be considered in conjunction with, any supplemental information provided by and discussions with Houlihan Lokey in connection therewith. Any defined terms used herein shall have the meanings set forth herein, even if such defined terms have been given different meanings elsewhere in the materials.
The materials are for discussion purposes only. Houlihan Lokey expressly disclaims any and all liability which may be based on the materials and any errors therein or omissions therefrom. The materials were prepared for specific persons familiar with the business and affairs of the Company for use in a specific context and were not prepared with a view to public disclosure or to conform with any disclosure standards under any state, federal or international securities laws or other laws, rules or regulations, and none of the Committee, the Company or Houlihan Lokey takes any responsibility for the use of the materials by persons other than the Committee. The materials are provided on a confidential basis solely for the information of the Committee and may not be disclosed, summarized, reproduced, disseminated or quoted or otherwise referred to, in whole or in part, without Houlihan Lokey’s express prior written consent.
Notwithstanding any other provision herein, the Company (and each employee, representative or other agent of the Company) may disclose to any and all persons without limitation of any kind, the tax treatment and tax structure of any transaction and all materials of any kind (including opinions or other tax analyses, if any) that are provided to the Company relating to such tax treatment and structure. However, any information relating to the tax treatment and tax structure shall remain confidential (and the foregoing sentence shall not apply) to the extent necessary to enable any person to comply with securities laws. For this purpose, the tax treatment of a transaction is the purported or claimed U.S. income or franchise tax treatment of the transaction and the tax structure of a transaction is any fact that may be relevant to understanding the purported or claimed U.S. income or franchise tax treatment of the transaction. If the Company plans to disclose information pursuant to the first sentence of this paragraph, the Company shall inform those to whom it discloses any such information that they may not rely upon such information for any purpose without Houlihan Lokey’s prior written consent. Houlihan Lokey is not an expert on, and nothing contained in the materials should be construed as advice with regard to, legal, accounting, regulatory, insurance, tax or other specialist matters. Houlihan Lokey’s role in reviewing any information is limited solely to performing such a review as it shall deem necessary to support its own advice and analysis and shall not be on behalf of the Committee.
The materials necessarily are based on financial, economic, market and other conditions as in effect on, and the information available to Houlihan Lokey as of, the date of the materials. Although subsequent developments may affect the contents of the materials, Houlihan Lokey has not undertaken, and is under no obligation, to update, revise or reaffirm the materials, except as may be expressly contemplated by Houlihan Lokey’s engagement letter. The materials are not intended to provide the sole basis for evaluation of the Transaction and do not purport to contain all information that may be required. The materials do not address the underlying business decision of the Company or any other party to proceed with or effect the Transaction. The materials do not constitute any opinion, nor do the materials constitute a recommendation to the Board, the Committee, the Company, any security holder of the Company or any other party as to how to vote or act with respect to any matter relating to the Transaction or otherwise or whether to buy or sell any assets or securities of any company. Houlihan Lokey’s only opinion is the opinion, if any, that is actually delivered to the Committee. The materials may not reflect information known to other professionals in other business areas of Houlihan Lokey and its affiliates.
The preparation of the materials was a complex process involving quantitative and qualitative judgments and determinations with respect to the financial, comparative and other analytic methods employed and the adaption and application of these methods to the unique facts and circumstances presented and, therefore, is not readily susceptible to partial analysis or summary description. Furthermore, Houlihan Lokey did not attribute any particular weight to any analysis or factor considered by it, but rather made qualitative judgments as to the significance and relevance of each analysis and factor. Each analytical technique has inherent strengths and weaknesses, and the nature of the available information may further affect the value of particular techniques. Accordingly, the analyses contained in the materials must be considered as a whole. Selecting portions of the analyses, analytic methods and factors without considering all analyses and factors could create a misleading or incomplete view. The materials reflect judgments and assumptions with regard to industry performance, general business, economic, regulatory, market and financial conditions and other matters, many of which are beyond the control of the participants in the Transaction. Any estimates of value contained in the materials are not necessarily indicative of actual value or predictive of future results or values, which may be significantly more or less favorable. Any analyses relating to the value of assets, businesses or securities do not purport to be appraisals or to reflect the prices at which any assets, businesses or securities may actually be sold. The materials do not constitute a valuation opinion or credit rating. In preparing the materials, Houlihan Lokey has not conducted any physical inspection or independent appraisal or evaluation of any of the assets, properties or liabilities (contingent or otherwise) of the Company or any other party and has no obligation to evaluate the solvency of the Company or any other party under any law.
All budgets, projections, estimates, financial analyses, reports and other information with respect to operations (including estimates of potential cost savings and expenses) reflected in the materials have been prepared by management of the relevant party or are derived from such budgets, projections, estimates, financial analyses, reports and other information or from other sources, which involve numerous and significant subjective determinations made by management of the relevant party and/or which such management has reviewed and found reasonable. The budgets, projections and estimates contained in the materials may or may not be achieved and differences between projected results and those actually achieved may be material. Houlihan Lokey has relied upon representations made by management of the Company that such budgets, projections and estimates have been reasonably prepared in good faith on bases reflecting the best currently available estimates and judgments of such management (or, with respect to information obtained from public sources, represent reasonable estimates), and Houlihan Lokey expresses no opinion with respect to such budgets, projections or estimates or the assumptions on which they are based. The scope of the financial analysis contained herein is based on discussions with the Company (including, without limitation, regarding the methodologies to be utilized), and Houlihan Lokey does not make any representation, express or implied, as to the sufficiency or adequacy of such financial analysis or the scope thereof for any particular purpose.
Houlihan Lokey has assumed and relied upon the accuracy and completeness of the financial and other information provided to, discussed with or reviewed by it without (and without assuming responsibility for) independent verification of such information, makes no representation or warranty (express or implied) in respect of the accuracy or completeness of such information and has further relied upon the assurances of the Company that it is not aware of any facts or circumstances that would make such information inaccurate or misleading. In addition, Houlihan Lokey has relied upon and assumed, without independent verification, that there has been no change in the business, assets, liabilities, financial condition, results of operations, cash flows or prospects of the Company or any other participant in the Transaction since the respective dates of the most recent financial statements and other information, financial or otherwise, provided to Houlihan Lokey that would be material to its analyses , and that the final forms of any draft documents reviewed by Houlihan Lokey will not differ in any material respect from such draft documents.
The materials are not an offer to sell or a solicitation of an indication of interest to purchase any security, option, commodity, future, loan or currency. The materials do not constitute a commitment by Houlihan Lokey or any of its affiliates to underwrite, subscribe for or place any securities, to extend or arrange credit, or to provide any other services. In the ordinary course of business, certain of Houlihan Lokey’s affiliates and employees, as well as investment funds in which they may have financial interests or with which they may co-invest, may acquire, hold or sell, long or short positions, or trade or otherwise effect transactions, in debt, equity, and other securities and financial instruments (including loans and other obligations) of, or investments in, one or more parties that may be involved in the Transaction and their respective affiliates or any currency or commodity that may be involved in the Transaction. Houlihan Lokey provides mergers and acquisitions, restructuring and other advisory and consulting services to clients. Houlihan Lokey’s personnel may make statements or provide advice that is contrary to information contained in the materials. Houlihan Lokey’s or its affiliates’ proprietary interests may conflict with the Company’s interests. Houlihan Lokey may have advised, may seek to advise and may in the future advise one or more participants in the Transaction and/or other companies mentioned in the materials.
CONFIDENTIAL—PRELIMINARY DRAFT—SUBJECT TO FURTHER REVIEW 55
|
CORPORATEFINANCE
FINANCIALADVISORYSERVICES FINANCIALRESTRUCTURING STRATEGICCONSULTING
HL.com
56