Exhibit C3
|
Project Piston
DISCUSSION MATERIALS FOR THESPECIAL COMMITTEE
JUNE 14, 2016 | PRELIMINARY DRAFT – SUBJECT TO REVIEW – CONFIDENTIAL
|
Table of Contents
Page
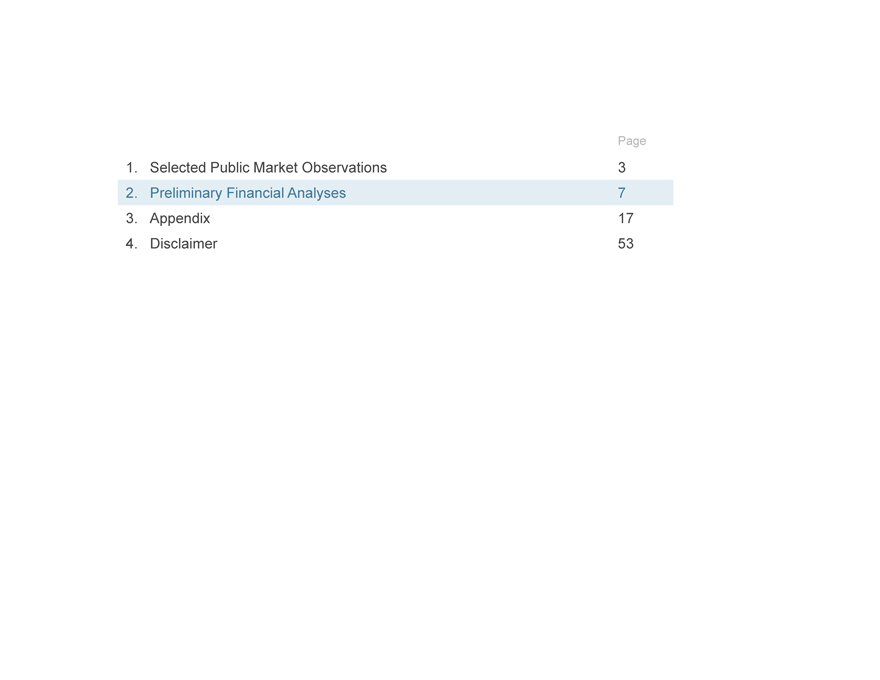
1. Selected Public Market Observations 3
2. Preliminary Financial Analyses 7
3. Appendix 17
Cost of Capital Considerations 18
Benchmarking 24
Company Financial Performance Observations 28
Premiums Paid Observations 32
Illustrative Preliminary Financial Analyses (EBITDA) 35
Selected Excerpt from June 1, 2016 Preliminary Discussion Materials:
47
Items Subject to Further Review
Selected Excerpts from May 11, 2016 / June 1, 2016 Preliminary
49
Discussion Materials: Illustrative Sensitivities
4. Disclaimer 53
CONFIDENTIAL—PRELIMINARY DRAFT—SUBJECT TO FURTHER REVIEW 2
Page
|
1. Selected Public Market Observations 3
2. Preliminary Financial Analyses 7
3. Appendix 17
4. Disclaimer 53
|
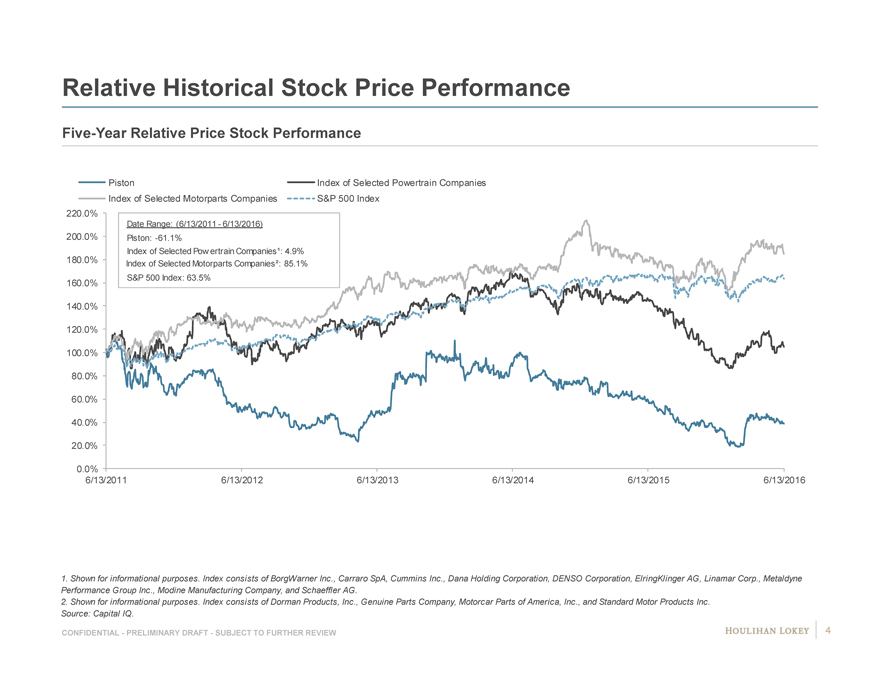
Relative Historical Stock Price Performance
Five-Year Relative Price Stock Performance
Piston Index of Selected Powertrain Companies
Index of Selected Motorparts Companies S&P 500 Index
220.0%
Date Range: (6/13/2011—6/13/2016)
200.0% Piston: -61.1%
Index of Selected Pow ertrain Companies¹: 4.9%
180.0% Index of Selected Motorparts Companies²: 85.1%
160.0% S&P 500 Index: 63.5%
140.0%
120.0%
100.0%
80.0%
60.0%
40.0%
20.0%
0.0%
6/13/2011 6/13/2012 6/13/2013 6/13/2014 6/13/2015 6/13/2016
1. Shown for informational purposes. Index consists of BorgWarner Inc., Carraro SpA, Cummins Inc., Dana Holding Corporation, DENSO Corporation, ElringKlinger AG, Linamar Corp., Metaldyne Performance Group Inc., Modine Manufacturing Company, and Schaeffler AG.
2. Shown for informational purposes. Index consists of Dorman Products, Inc., Genuine Parts Company, Motorcar Parts of America, Inc., and Standard Motor Products Inc.
Source: Capital IQ.
CONFIDENTIAL—PRELIMINARY DRAFT—SUBJECT TO FURTHER REVIEW 4
|
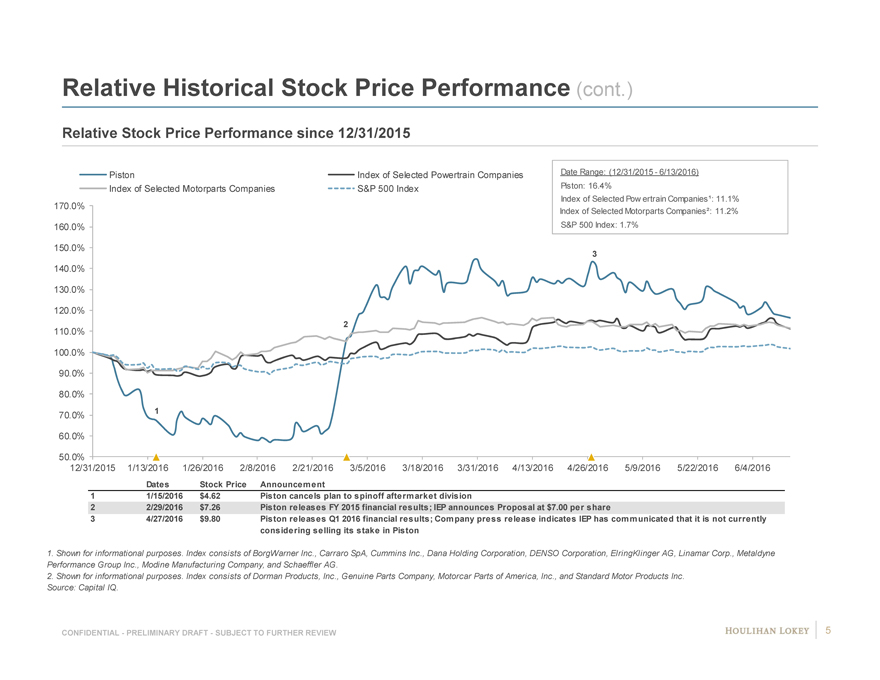
Relative Historical Stock Price Performance (cont.)
Relative Stock Price Performance since 12/31/2015
Piston Index of Selected Powertrain Companies Date Range: (12/31/2015—6/13/2016)
Index of Selected Motorparts Companies S&P 500 Index Piston: 16.4%
Index of Selected Pow ertrain Companies¹: 11.1%
170.0% Index of Selected Motorparts Companies²: 11.2%
160.0% S&P 500 Index: 1.7%
150.0%
3
140.0%
130.0%
120.0%
2
110.0%
100.0%
90.0%
80.0%
70.0% 1
60.0%
50.0%
12/31/2015 1/13/2016 1/26/2016 2/8/2016 2/21/2016 3/5/2016 3/18/2016 3/31/2016 4/13/2016 4/26/2016 5/9/2016 5/22/2016 6/4/2016
Dates Stock Price Announcement
1 1/15/2016 $4.62 Piston cancels plan to spinoff aftermarket division
2 2/29/2016 $7.26 Piston releases FY 2015 financial results; IEP announces Proposal at $7.00 per share
3 4/27/2016 $9.80 Piston releases Q1 2016 financial results; Company press release indicates IEP has communicated that it is not currently
considering selling its stake in Piston
1. Shown for informational purposes. Index consists of BorgWarner Inc., Carraro SpA, Cummins Inc., Dana Holding Corporation, DENSO Corporation, ElringKlinger AG, Linamar Corp., Metaldyne
Performance Group Inc., Modine Manufacturing Company, and Schaeffler AG.
2. Shown for informational purposes. Index consists of Dorman Products, Inc., Genuine Parts Company, Motorcar Parts of America, Inc., and Standard Motor Products Inc.
Source: Capital IQ.
CONFIDENTIAL—PRELIMINARY DRAFT—SUBJECT TO FURTHER REVIEW 5
|
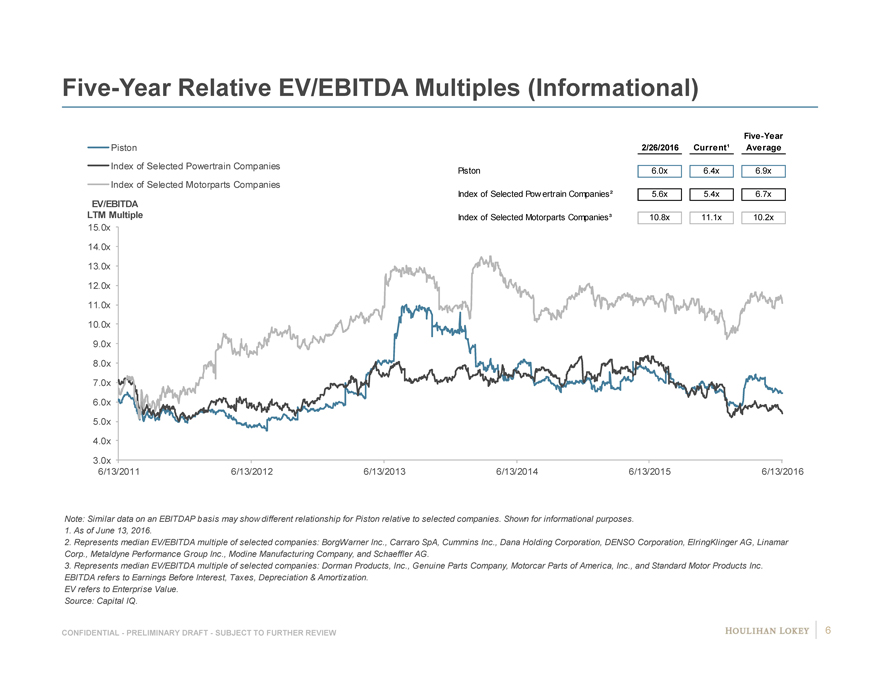
Five-Year Relative EV/EBITDA Multiples (Informational)
Five-Year
Piston 2/26/2016 Current¹ Average
Index of Selected Powertrain Companies Piston 6.0x 6.4x 6.9x
Index of Selected Motorparts Companies
Index of Selected Pow ertrain Companies² 5.6x 5.4x 6.7x
EV/EBITDA
LTM Multiple Index of Selected Motorparts Companies³ 10.8x 11.1x 10.2x
15.0x
14.0x
13.0x
12.0x
11.0x
10.0x
9.0x
8.0x
7.0x
6.0x
5.0x
4.0x
3.0x
6/13/2011 6/13/2012 6/13/2013 6/13/2014 6/13/2015 6/13/2016
Note: Similar data on an EBITDAP basis may show different relationship for Piston relative to selected companies. Shown for informational purposes.
1. As of June 13, 2016.
2. Represents median EV/EBITDA multiple of selected companies: BorgWarner Inc., Carraro SpA, Cummins Inc., Dana Holding Corporation, DENSO Corporation, ElringKlinger AG, Linamar
Corp., Metaldyne Performance Group Inc., Modine Manufacturing Company, and Schaeffler AG.
3. Represents median EV/EBITDA multiple of selected companies: Dorman Products, Inc., Genuine Parts Company, Motorcar Parts of America, Inc., and Standard Motor Products Inc.
EBITDA refers to Earnings Before Interest, Taxes, Depreciation & Amortization.
EV refers to Enterprise Value.
Source: Capital IQ.
CONFIDENTIAL—PRELIMINARY DRAFT—SUBJECT TO FURTHER REVIEW 6
|
Page
1. Selected Public Market Observations 3
2. Preliminary Financial Analyses 7
3. Appendix 17
4. Disclaimer 53
|
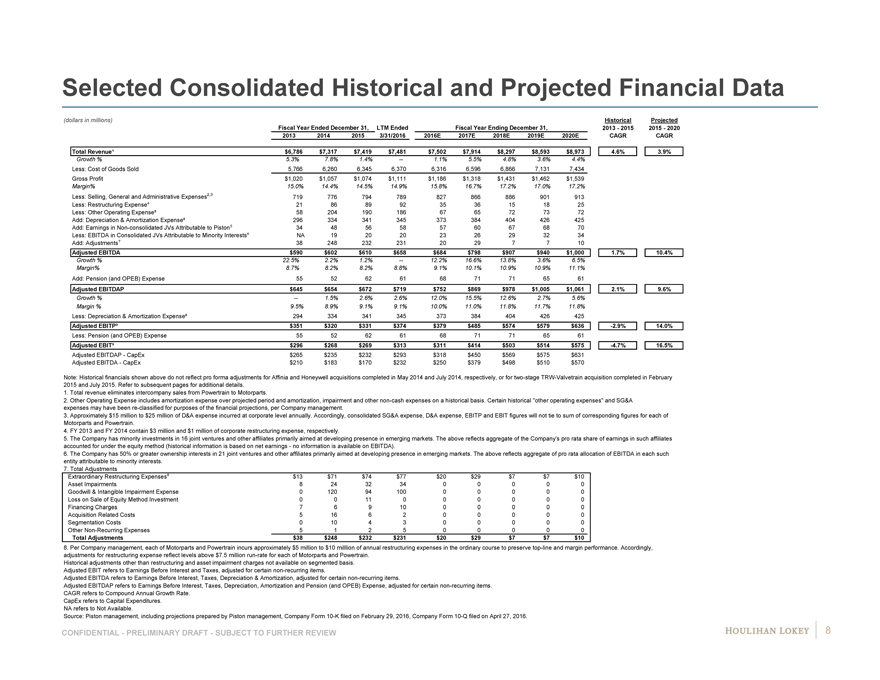
Selected Consolidated Historical and Projected Financial Data
(dollars in millions) Historical Projected Fiscal Year Ended December 31, LTM Ended Fiscal Year Ending December 31, 2013—2015 2015—2020 2013 2014 2015 3/31/2016 2016E 2017E 2018E 2019E 2020E CAGR CAGR
Total Revenue¹ $6,786 $7,317 $7,419 $7,481 $7,502 $7,914 $8,297 $8,593 $8,973 4.6% 3.9%
Growth % 5.3% 7.8% 1.4% — 1.1% 5.5% 4.8% 3.6% 4.4%
Less: Cost of Goods Sold 5,766 6,260 6,345 6,370 6,316 6,596 6,866 7,131 7,434 Gross Profit $1,020 $1,057 $1,074 $1,111 $1,186 $1,318 $1,431 $1,462 $1,539
Margin% 15.0% 14.4% 14.5% 14.9% 15.8% 16.7% 17.2% 17.0% 17.2%
Less: Selling, General and Administrative Expenses2,3 719 776 794 789 827 866 886 901 913 Less: Restructuring Expense 21 86 89 92 35 36 15 18 25 Less: Other Operating Expense² 58 204 190 186 67 65 72 73 72 Add: Depreciation & Amortization Expense³ 296 334 341 345 373 384 404 426 425 Add: Earnings in Non-consolidated JVs Attributable to Piston 34 48 56 58 57 60 67 68 70 Less: EBITDA in Consolidated JVs Attributable to Minority Interests NA 19 20 20 23 26 29 32 34 Add: Adjustments 38 248 232 231 20 29 7 7 10
Adjusted EBITDA $590 $602 $610 $658 $684 $798 $907 $940 $1,000 1.7% 10.4%
Growth % 22.5% 2.2% 1.2% — 12.2% 16.6% 13.8% 3.6% 6.5% Margin% 8.7% 8.2% 8.2% 8.8% 9.1% 10.1% 10.9% 10.9% 11.1%
Add: Pension (and OPEB) Expense 55 52 62 61 68 71 71 65 61
Adjusted EBITDAP $645 $654 $672 $719 $752 $869 $978 $1,005 $1,061 2.1% 9.6%
Growth % — 1.5% 2.6% 2.6% 12.0% 15.5% 12.6% 2.7% 5.6% Margin % 9.5% 8.9% 9.1% 9.1% 10.0% 11.0% 11.8% 11.7% 11.8%
Less: Depreciation & Amortization Expense³ 294 334 341 345 373 384 404 426 425
Adjusted EBITP³ $351 $320 $331 $374 $379 $485 $574 $579 $636 -2.9% 14.0%
Less: Pension (and OPEB) Expense 55 52 62 61 68 71 71 65 61
Adjusted EBIT³ $296 $268 $269 $313 $311 $414 $503 $514 $575 -4.7% 16.5%
Adjusted EBITDAP—CapEx $265 $235 $232 $293 $318 $450 $569 $575 $631 Adjusted EBITDA—CapEx $210 $183 $170 $232 $250 $379 $498 $510 $570
Note: Historical financials shown above do not reflect pro forma adjustments for Affinia and Honeywell acquisitions completed in May 2014 and July 2014, respectively, or for two-stage TRW-Valvetrain acquisition completed in February 2015 and July 2015. Refer to subsequent pages for additional details.
1. Total revenue eliminates intercompany sales from Powertrain to Motorparts.
2. Other Operating Expense includes amortization expense over projected period and amortization, impairment and other non-cash expenses on a historical basis. Certain historical “other operating expenses” and SG&A expenses may have been re-classified for purposes of the financial projections, per Company management.
3. Approximately $15 million to $25 million of D&A expense incurred at corporate level annually. Accordingly, consolidated SG&A expense, D&A expense, EBITP and EBIT figures will not tie to sum of corresponding figures for each of Motorparts and Powertrain.
4. FY 2013 and FY 2014 contain $3 million and $1 million of corporate restructuring expense, respectively.
5. The Company has minority investments in 16 joint ventures and other affiliates primarily aimed at developing presence in emerging markets. The above reflects aggregate of the Company’s pro rata share of earnings in such affiliates accounted for under the equity method (historical information is based on net earnings—no information is available on EBITDA).
6. The Company has 50% or greater ownership interests in 21 joint ventures and other affiliates primarily aimed at developing presence in emerging markets. The above reflects aggregate of pro rata allocation of EBITDA in each such entity attributable to minority interests.
7. Total Adjustments
Extraordinary Restructuring Expenses $13 $71 $74 $77 $20 $29 $7 $7 $10 Asset Impairments 8 24 32 34 0 0 0 0 0 Goodwill & Intangible Impairment Expense 0 120 94 100 0 0 0 0 0 Loss on Sale of Equity Method Investment 0 0 11 0 0 0 0 0 0 Financing Charges 7 6 9 10 0 0 0 0 0 Acquisition Related Costs 5 16 6 2 0 0 0 0 0 Segmentation Costs 0 10 4 3 0 0 0 0 0 Other Non-Recurring Expenses 5 1 2 5 0 0 0 0 0
Total Adjustments $38 $248 $232 $231 $20 $29 $7 $7 $10
8. Per Company management, each of Motorparts and Powertrain incurs approximately $5 million to $10 milllion of annual restructuring expenses in the ordinary course to preserve top-line and margin performance. Accordingly, adjustments for restructuring expense reflect levels above $7.5 million run-rate for each of Motorparts and Powertrain.
Historical adjustments other than restructuring and asset impairment charges not available on segmented basis. Adjusted EBIT refers to Earnings Before Interest and Taxes, adjusted for certain non-recurring items.
Adjusted EBITDA refers to Earnings Before Interest, Taxes, Depreciation & Amortization, adjusted for certain non-recurring items.
Adjusted EBITDAP refers to Earnings Before Interest, Taxes, Depreciation, Amortization and Pension (and OPEB) Expense, adjusted for certain non-recurring items. CAGR refers to Compound Annual Growth Rate.
CapEx refers to Capital Expenditures. NA refers to Not Available.
Source: Piston management, including projections prepared by Piston management, Company Form 10-K filed on February 29, 2016, Company Form 10-Q filed on April 27, 2016.
CONFIDENTIAL—PRELIMINARY DRAFT—SUBJECT TO FURTHER REVIEW 8
|
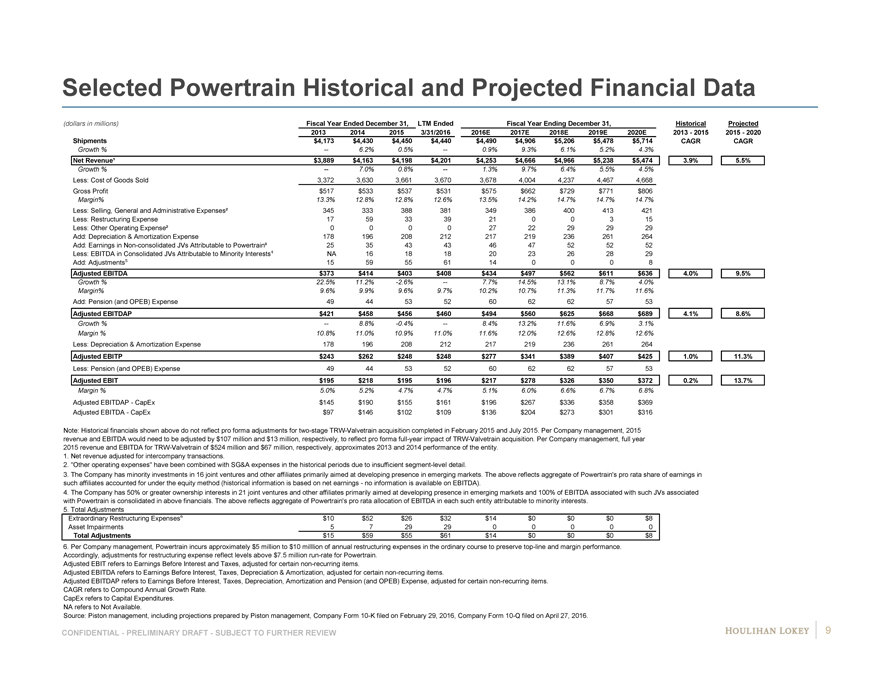
Selected Powertrain Historical and Projected Financial Data
(dollars in millions) Fiscal Year Ended December 31, LTM Ended Fiscal Year Ending December 31, Historical Projected
2013 2014 2015 3/31/2016 2016E 2017E 2018E 2019E 2020E 2013—2015 2015—2020
Shipments $4,173 $4,430 $4,450 $4,440 $4,490 $4,906 $5,206 $5,478 $5,714 CAGR CAGR
Growth % — 6.2% 0.5% — 0.9% 9.3% 6.1% 5.2% 4.3%
Net Revenue¹ $3,889 $4,163 $4,198 $4,201 $4,253 $4,666 $4,966 $5,238 $5,474 3.9% 5.5%
Growth % — 7.0% 0.8% — 1.3% 9.7% 6.4% 5.5% 4.5%
Less: Cost of Goods Sold 3,372 3,630 3,661 3,670 3,678 4,004 4,237 4,467 4,668
Gross Profit $517 $533 $537 $531 $575 $662 $729 $771 $806
Margin% 13.3% 12.8% 12.8% 12.6% 13.5% 14.2% 14.7% 14.7% 14.7%
Less: Selling, General and Administrative Expenses² 345 333 388 381 349 386 400 413 421
Less: Restructuring Expense 17 59 33 39 21 0 0 3 15
Less: Other Operating Expense² 0 0 0 0 27 22 29 29 29
Add: Depreciation & Amortization Expense 178 196 208 212 217 219 236 261 264
Add: Earnings in Non-consolidated JVs Attributable to Powertrain³ 25 35 43 43 46 47 52 52 52
Less: EBITDA in Consolidated JVs Attributable to Minority Interests NA 16 18 18 20 23 26 28 29
Add: Adjustments 15 59 55 61 14 0 0 0 8
Adjusted EBITDA $373 $414 $403 $408 $434 $497 $562 $611 $636 4.0% 9.5%
Growth % 22.5% 11.2% -2.6% — 7.7% 14.5% 13.1% 8.7% 4.0%
Margin% 9.6% 9.9% 9.6% 9.7% 10.2% 10.7% 11.3% 11.7% 11.6%
Add: Pension (and OPEB) Expense 49 44 53 52 60 62 62 57 53
Adjusted EBITDAP $421 $458 $456 $460 $494 $560 $625 $668 $689 4.1% 8.6%
Growth % — 8.8% -0.4% — 8.4% 13.2% 11.6% 6.9% 3.1%
Margin % 10.8% 11.0% 10.9% 11.0% 11.6% 12.0% 12.6% 12.8% 12.6%
Less: Depreciation & Amortization Expense 178 196 208 212 217 219 236 261 264
Adjusted EBITP $243 $262 $248 $248 $277 $341 $389 $407 $425 1.0% 11.3%
Less: Pension (and OPEB) Expense 49 44 53 52 60 62 62 57 53
Adjusted EBIT $195 $218 $195 $196 $217 $278 $326 $350 $372 0.2% 13.7%
Margin % 5.0% 5.2% 4.7% 4.7% 5.1% 6.0% 6.6% 6.7% 6.8%
Adjusted EBITDAP—CapEx $145 $190 $155 $161 $196 $267 $336 $358 $369
Adjusted EBITDA—CapEx $97 $146 $102 $109 $136 $204 $273 $301 $316
Note: Historical financials shown above do not reflect pro forma adjustments for two-stage TRW-Valvetrain acquisition completed in February 2015 and July 2015. Per Company management, 2015
revenue and EBITDA would need to be adjusted by $107 million and $13 million, respectively, to reflect pro forma full-year impact of TRW-Valvetrain acquisition. Per Company management, full year
2015 revenue and EBITDA for TRW-Valvetrain of $524 million and $67 million, respectively, approximates 2013 and 2014 performance of the entity.
1. Net revenue adjusted for intercompany transactions.
2. “Other operating expenses” have been combined with SG&A expenses in the historical periods due to insufficient segment-level detail.
3. The Company has minority investments in 16 joint ventures and other affiliates primarily aimed at developing presence in emerging markets. The above reflects aggregate of Powertrain’s pro rata share of earnings in
such affiliates accounted for under the equity method (historical information is based on net earnings—no information is available on EBITDA).
4. The Company has 50% or greater ownership interests in 21 joint ventures and other affiliates primarily aimed at developing presence in emerging markets and 100% of EBITDA associated with such JVs associated
with Powertrain is consolidated in above financials. The above reflects aggregate of Powertrain’s pro rata allocation of EBITDA in each such entity attributable to minority interests.
5. Total Adjustments
Extraordinary Restructuring Expenses $10 $52 $26 $32 $14 $0 $0 $0 $8
Asset Impairments 5 7 29 29 0 0 0 0 0
Total Adjustments $15 $59 $55 $61 $14 $0 $0 $0 $8
6. Per Company management, Powertrain incurs approximately $5 million to $10 milllion of annual restructuring expenses in the ordinary course to preserve top-line and margin performance.
Accordingly, adjustments for restructuring expense reflect levels above $7.5 million run-rate for Powertrain.
Adjusted EBIT refers to Earnings Before Interest and Taxes, adjusted for certain non-recurring items.
Adjusted EBITDA refers to Earnings Before Interest, Taxes, Depreciation & Amortization, adjusted for certain non-recurring items.
Adjusted EBITDAP refers to Earnings Before Interest, Taxes, Depreciation, Amortization and Pension (and OPEB) Expense, adjusted for certain non-recurring items.
CAGR refers to Compound Annual Growth Rate.
CapEx refers to Capital Expenditures.
NA refers to Not Available.
Source: Piston management, including projections prepared by Piston management, Company Form 10-K filed on February 29, 2016, Company Form 10-Q filed on April 27, 2016.
CONFIDENTIAL—PRELIMINARY DRAFT—SUBJECT TO FURTHER REVIEW 9
|

Selected Motorparts Historical and Projected Financial Data
(dollars in millions) Fiscal Year Ended December 31, LTM Ended Fiscal Year Ending December 31, Historical Projected
2013 2014 2015 3/31/2016 2016E 2017E 2018E 2019E 2020E 2013—2015 2015—2020
Shipments $2,935 $3,192 $3,253 $3,311 $3,283 $3,282 $3,365 $3,389 $3,533 CAGR CAGR
Growth % — 8.8% 1.9% — 0.9% 0.0% 2.5% 0.7% 4.2%
Net Revenue¹ $2,897 $3,154 $3,221 $3,280 $3,249 $3,248 $3,331 $3,355 $3,499 5.4% 1.7%
Growth % — 8.9% 2.1% — 0.9% 0.0% 2.6% 0.7% 4.3%
Less: Cost of Goods Sold 2,394 2,630 2,684 2,700 2,638 2,592 2,629 2,664 2,766
Gross Profit $503 $524 $537 $580 $611 $656 $702 $691 $733
Margin% 17.4% 16.6% 16.7% 17.7% 18.8% 20.2% 21.1% 20.6% 20.9%
Less: Selling, General and Administrative Expenses² 396 469 456 458 453 456 465 470 477
Less: Restructuring Expense 1 26 56 53 14 36 15 15 10
Less: Other Operating Expense² 0 0 0 0 39 43 43 43 43
Add: Depreciation & Amortization Expense 100 114 119 119 130 140 146 146 146
Add: Earnings in Non-consolidated JVs Attributable to Motorparts³ 9 13 13 13 11 13 15 16 18
Less: EBITDA in Consolidated JVs Attributable to Minority Interests NA 2 2 2 3 3 4 4 5
Add: Adjustments 2 36 52 51 6 29 7 7 2
Adjusted EBITDA $217 $189 $206 $249 $250 $299 $344 $328 $365 -2.5% 12.1%
Growth % 22.5% -12.8% 9.1% — 21.1% 19.8% 14.9% -4.5% 11.1%
Margin% 7.5% 6.0% 6.4% 7.6% 7.7% 9.2% 10.3% 9.8% 10.4%
Add: Pension (and OPEB) Expense 6 8 9 9 8 9 9 8 8
Adjusted EBITDAP $223 $197 $215 $258 $258 $308 $353 $337 $373 -1.8% 11.6%
Growth % — -11.7% 9.2% — 19.8% 19.6% 14.4% -4.6% 10.8%
Margin % 7.7% 6.3% 6.7% 7.9% 7.9% 9.5% 10.6% 10.0% 10.7%
Less: Depreciation & Amortization Expense 100 114 119 119 130 140 146 146 146
Adjusted EBITP $123 $83 $96 $139 $128 $168 $207 $191 $227 -11.6% 18.7%
Less: Pension (and OPEB) Expense 6 8 9 9 8 9 9 8 8
Adjusted EBIT $117 $75 $87 $130 $120 $159 $198 $182 $219 -13.6% 20.2%
Margin % 4.0% 2.4% 2.7% 4.0% 3.7% 4.9% 5.9% 5.4% 6.3%
Adjusted EBITDAP—CapEx $137 $67 $84 $139 $123 $182 $233 $217 $263
Adjusted EBITDA—CapEx $131 $59 $75 $130 $115 $173 $224 $208 $255
Note: Historical financials shown above do not reflect pro forma adjustments for Affinia and Honeywell acquisitions completed in May 2014 and July 2014, respectively. Per Company management, 2014
revenue and EBITDA would need to be adjusted by $65 million and $7 million, respectively, to reflect pro forma full-year impact of Affinia acquisition, and 2014 revenue and EBITDA would need to be
adjusted by $238 million and ($7) million, respectively, to reflect pro forma full-year impact of Honeywell acquisition. Per Company management, Affinia was expected to contribute annual revenue of $200
million and EBITDA of $20 million. Per Company management, at the time of the acquisition, Honeywell had annual revenue of $450 million with break-even EBITDA; however, Honeywell was expected to
be fully blended within the Braking business and ultimately reach ~10% EBITDA margins (before corporate allocations).
1. Net revenue adjusted for intercompany transactions.
2. “Other operating expenses” have been combined with SG&A expenses in the historical periods due to insufficient segment-level detail.
3. The Company has minority investments in 16 joint ventures and other affiliates primarily aimed at developing presence in emerging markets. The above reflects aggregate of Motorparts’ pro rata share
of earnings in such affiliates accounted for under the equity method (historical information based on net earnings—no information is available on EBITDA).
4. The Company has 50% or greater ownership interests in 21 joint ventures and other affiliates primarily aimed at developing presence in emerging markets and 100% of EBITDA associated with such JVs
associated with Motorparts is consolidated in above financials. The above reflects aggregate of Motorparts’ pro rata allocation of EBITDA in each such entity attributable to minority interests.
5. Total Adjustments
Extraordinary Restructuring Expenses $0 $19 $49 $46 $6 $29 $7 $7 $2
Asset Impairments 2 17 3 5 0 0 0 0 0
Total Adjustments $2 $36 $52 $51 $6 $29 $7 $7 $2
6. Per Company management, Motorparts incurs approximately $5 million to $10 milllion of annual restructuring expenses in the ordinary course to preserve top-line and margin performance.
Accordingly, adjustments for restructuring expense reflect levels above $7.5 million run-rate for Motorparts.
Adjusted EBIT refers to Earnings Before Interest and Taxes, adjusted for certain non-recurring items.
Adjusted EBITDA refers to Earnings Before Interest, Taxes, Depreciation & Amortization, adjusted for certain non-recurring items.
Adjusted EBITDAP refers to Earnings Before Interest, Taxes, Depreciation, Amortization and Pension (and OPEB) Expense, adjusted for certain non-recurring items.
CAGR refers to Compound Annual Growth Rate.
CapEx refers to Capital Expenditures.
NA refers to Not Available.
Source: Piston management, including projections prepared by Piston management, Company Form 10-K filed on February 29, 2016, Company Form 10-Q filed on April 27, 2016.
CONFIDENTIAL—PRELIMINARY DRAFT—SUBJECT TO FURTHER REVIEW 10
|
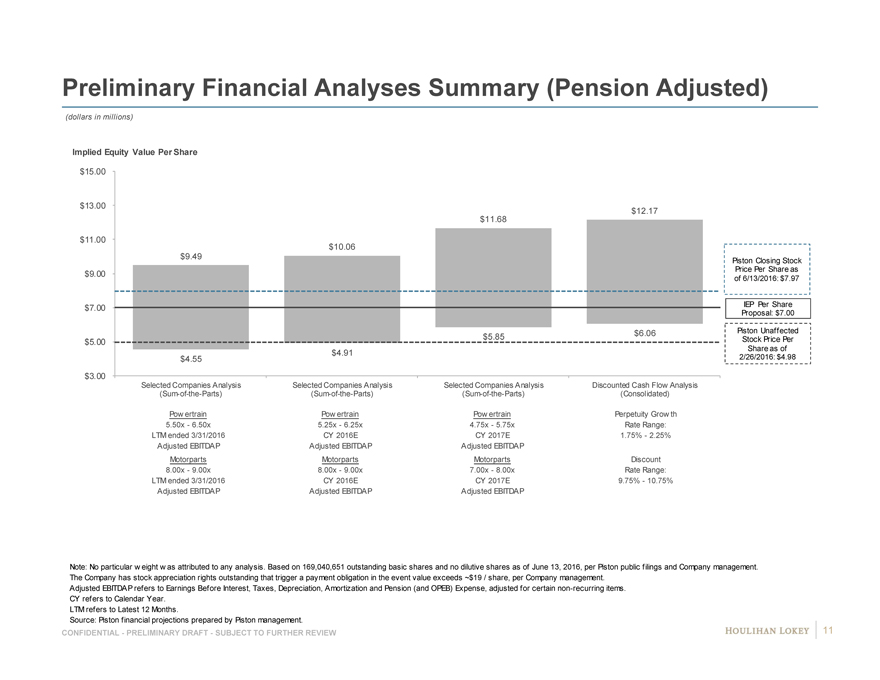
Preliminary Financial Analyses Summary (Pension Adjusted)
(dollars in millions)
Implied Equity Value Per Share
$15.00
$13.00 $12.17
$11.68
$11.00
$10.06
$9.49 Piston Closing Stock
Price Per Share as
$9.00 of 6/13/2016: $7.97
$7.00 IEP Per Share
Proposal: $7.00
$6.06 Piston Unaffected
$5.00 $5.85 Stock Price Per
$4.91 Share as of
$4.55 2/26/2016: $4.98
$3.00
Selected Companies Analysis Selected Companies Analysis Selected Companies Analysis Discounted Cash Flow Analysis
(Sum-of-the-Parts)(Sum-of-the-Parts)(Sum-of-the-Parts)(Consolidated)
Powertrain Powertrain Powertrain Perpetuity Growth
5.50x—6.50x 5.25x—6.25x 4.75x—5.75x Rate Range:
LTM ended 3/31/2016 CY 2016E CY 2017E 1.75%—2.25%
Adjusted EBITDAP Adjusted EBITDAP Adjusted EBITDAP
Motorparts Motorparts Motorparts Discount
8.00x—9.00x 8.00x—9.00x 7.00x—8.00x Rate Range:
LTM ended 3/31/2016 CY 2016E CY 2017E 9.75%—10.75%
Adjusted EBITDAP Adjusted EBITDAP Adjusted EBITDAP
Note: No particular w eight w as attributed to any analysis. Based on 169,040,651 outstanding basic shares and no dilutive shares as of June 13, 2016, per Piston public filings and Company management.
The Company has stock appreciation rights outstanding that trigger a payment obligation in the event value exceeds ~$19 / share, per Company management.
Adjusted EBITDAP refers to Earnings Before Interest, Taxes, Depreciation, Amortization and Pension (and OPEB) Expense, adjusted for certain non-recurring items.
CY refers to Calendar Year.
LTM refers to Latest 12 Months.
Source: Piston financial projections prepared by Piston management.
CONFIDENTIAL—PRELIMINARY DRAFT—SUBJECT TO FURTHER REVIEW 11
|
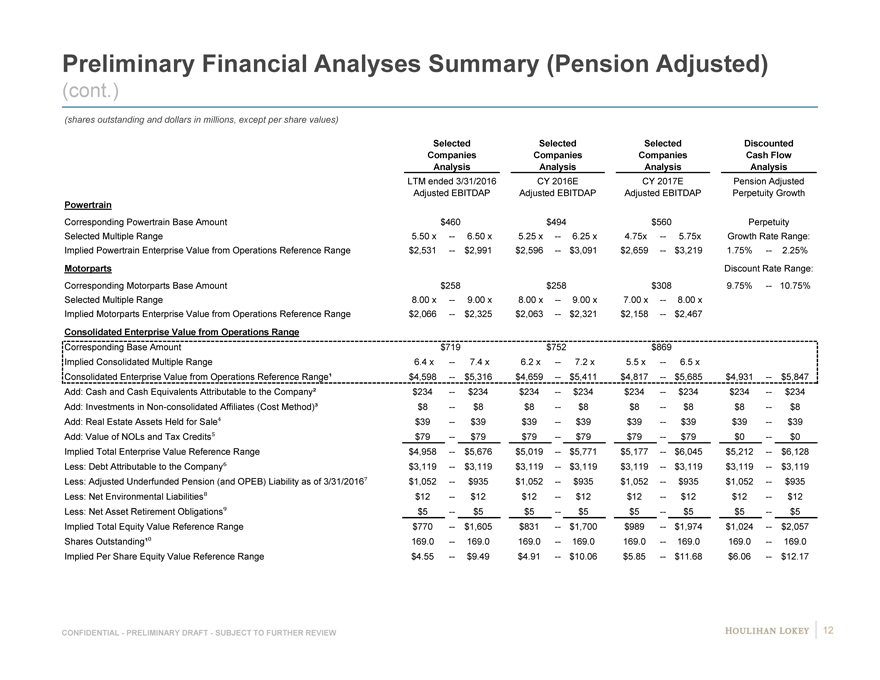
Preliminary Financial Analyses Summary (Pension Adjusted)
(cont.)
(shares outstanding and dollars in millions, except per share values)
Selected Selected Selected Discounted
Companies Companies Companies Cash Flow
Analysis Analysis Analysis Analysis
LTM ended 3/31/2016 CY 2016E CY 2017E Pension Adjusted
Adjusted EBITDAP Adjusted EBITDAP Adjusted EBITDAP Perpetuity Growth
Powertrain Discount Rate Range:
Corresponding Powertrain Base Amount $460 $494 $560 Perpetuity
Selected Multiple Range 5.50 x — 6.50 x 5.25 x — 6.25 x 4.75x — 5.75x Growth Rate Range:
Implied Powertrain Enterprise Value from Operations Reference Range $2,531 — $2,991 $2,596 — $3,091 $2,659 — $3,219 1.75% — 2.25%
Motorparts Discount Rate Range:
Corresponding Motorparts Base Amount $258 $258 $308 9.75% — 10.75%
Selected Multiple Range 8.00 x — 9.00 x 8.00 x — 9.00 x 7.00 x — 8.00 x
Implied Motorparts Enterprise Value from Operations Reference Range $2,066 — $2,325 $2,063 — $2,321 $2,158 — $2,467
Consolidated Enterprise Value from Operations Range
Corresponding Base Amount $719 $752 $869
Implied Consolidated Multiple Range 6.4 x — 7.4 x 6.2 x — 7.2 x 5.5 x — 6.5 x
Consolidated Enterprise Value from Operations Reference Range¹ $4,598 — $5,316 $4,659 — $5,411 $4,817 — $5,685 $4,931 — $5,847
Add: Cash and Cash Equivalents Attributable to the Company² $234 — $234 $234 — $234 $234 — $234 $234 — $234
Add: Investments in Non-consolidated Affiliates (Cost Method)³ $8 — $8 $8 — $8 $8 — $8 $8 — $8
Add: Real Estate Assets Held for Sale $39 — $39 $39 — $39 $39 — $39 $39 — $39
Add: Value of NOLs and Tax Credits $79 — $79 $79 — $79 $79 — $79 $0 — $0
Implied Total Enterprise Value Reference Range $4,958 — $5,676 $5,019 — $5,771 $5,177 — $6,045 $5,212 — $6,128
Less: Debt Attributable to the Company $3,119 — $3,119 $3,119 — $3,119 $3,119 — $3,119 $3,119 — $3,119
Less: Adjusted Underfunded Pension (and OPEB) Liability as of 3/31/2016 $1,052 — $935 $1,052 — $935 $1,052 — $935 $1,052 — $935
Less: Net Environmental Liabilities $12 — $12 $12 — $12 $12 — $12 $12 — $12
Less: Net Asset Retirement Obligations $5 — $5 $5 — $5 $5 — $5 $5 — $5
Implied Total Equity Value Reference Range $770 — $1,605 $831 — $1,700 $989 — $1,974 $1,024 — $2,057
Shares Outstanding¹ 169.0 — 169.0 169.0 — 169.0 169.0 — 169.0 169.0 — 169.0
Implied Per Share Equity Value Reference Range $4.55 — $9.49 $4.91 — $10.06 $5.85 — $11.68 $6.06 — $12.17
CONFIDENTIAL—PRELIMINARY DRAFT—SUBJECT TO FURTHER REVIEW 12
|
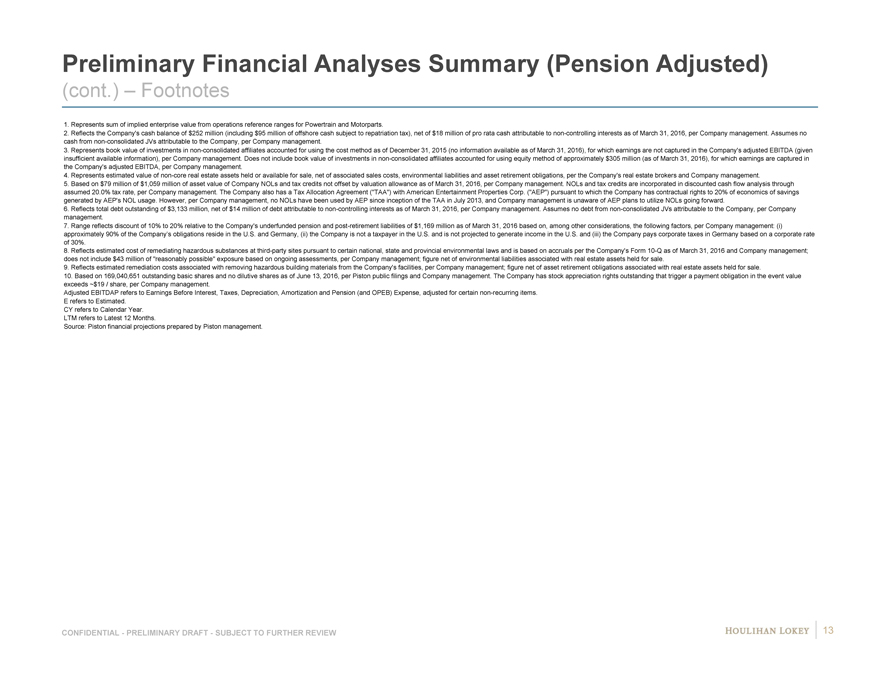
Preliminary Financial Analyses Summary (Pension Adjusted)
(cont.) – Footnotes
1. Represents sum of implied enterprise value from operations reference ranges for Powertrain and Motorparts.
2. Reflects the Company’s cash balance of $252 million (including $95 million of offshore cash subject to repatriation tax), net of $18 million of pro rata cash attributable to non-controlling interests as of March 31, 2016, per Company management. Assumes no
cash from non-consolidated JVs attributable to the Company, per Company management.
3. Represents book value of investments in non-consolidated affiliates accounted for using the cost method as of December 31, 2015 (no information available as of March 31, 2016), for which earnings are not captured in the Company’s adjusted EBITDA (given
insufficient available information), per Company management. Does not include book value of investments in non-consolidated affiliates accounted for using equity method of approximately $305 million (as of March 31, 2016), for which earnings are captured in
the Company’s adjusted EBITDA, per Company management.
4. Represents estimated value of non-core real estate assets held or available for sale, net of associated sales costs, environmental liabilities and asset retirement obligations, per the Company’s real estate brokers and Company management.
5. Based on $79 million of $1,059 million of asset value of Company NOLs and tax credits not offset by valuation allowance as of March 31, 2016, per Company management. NOLs and tax credits are incorporated in discounted cash flow analysis through
assumed 20.0% tax rate, per Company management. The Company also has a Tax Allocation Agreement (“TAA”) with American Entertainment Properties Corp. (“AEP”) pursuant to which the Company has contractual rights to 20% of economics of savings
generated by AEP’s NOL usage. However, per Company management, no NOLs have been used by AEP since inception of the TAA in July 2013, and Company management is unaware of AEP plans to utilize NOLs going forward.
6. Reflects total debt outstanding of $3,133 million, net of $14 million of debt attributable to non-controlling interests as of March 31, 2016, per Company management. Assumes no debt from non-consolidated JVs attributable to the Company, per Company
management.
7. Range reflects discount of 10% to 20% relative to the Company’s underfunded pension and post-retirement liabilities of $1,169 million as of March 31, 2016 based on, among other considerations, the following factors, per Company management: (i)
approximately 90% of the Company’s obligations reside in the U.S. and Germany, (ii) the Company is not a taxpayer in the U.S. and is not projected to generate income in the U.S. and (iii) the Company pays corporate taxes in Germany based on a corporate rate
of 30%.
8. Reflects estimated cost of remediating hazardous substances at third-party sites pursuant to certain national, state and provincial environmental laws and is based on accruals per the Company’s Form 10-Q as of March 31, 2016 and Company management;
does not include $43 million of “reasonably possible” exposure based on ongoing assessments, per Company management; figure net of environmental liabilities associated with real estate assets held for sale.
9. Reflects estimated remediation costs associated with removing hazardous building materials from the Company’s facilities, per Company management; figure net of asset retirement obligations associated with real estate assets held for sale.
10. Based on 169,040,651 outstanding basic shares and no dilutive shares as of June 13, 2016, per Piston public filings and Company management. The Company has stock appreciation rights outstanding that trigger a payment obligation in the event value
exceeds ~$19 / share, per Company management.
Adjusted EBITDAP refers to Earnings Before Interest, Taxes, Depreciation, Amortization and Pension (and OPEB) Expense, adjusted for certain non-recurring items.
E refers to Estimated.
CY refers to Calendar Year.
LTM refers to Latest 12 Months.
Source: Piston financial projections prepared by Piston management.
CONFIDENTIAL—PRELIMINARY DRAFT—SUBJECT TO FURTHER REVIEW 13
|
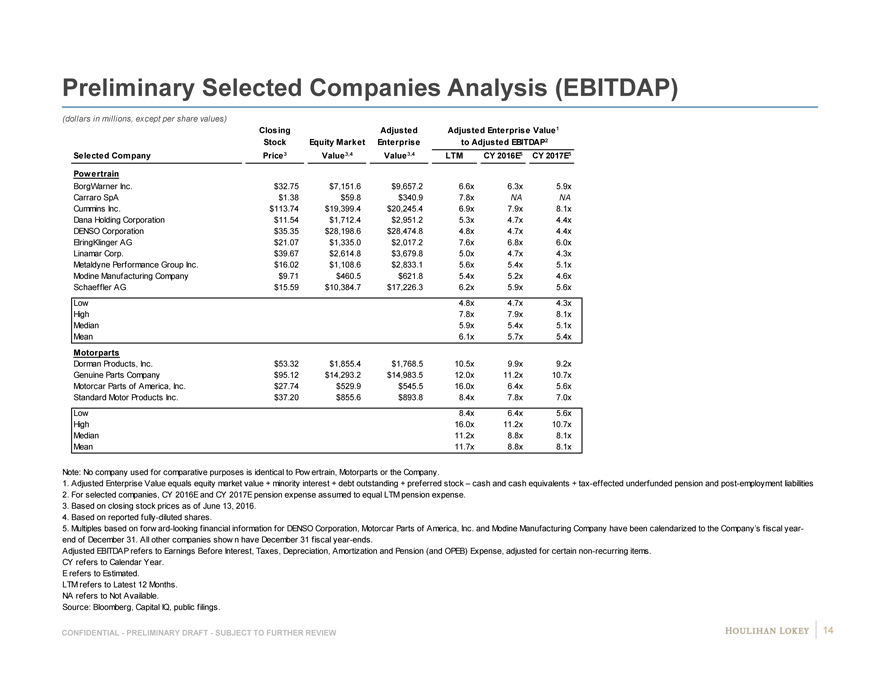
Preliminary Selected Companies Analysis (EBITDAP)
(dollars in millions, except per share values)
Closing Adjusted Adjusted Enterprise Value 1
Stock Equity Market Enterprise to Adjusted EBITDAP2
Selected Company Price 3 Value3,4 Value 3,4 LTM CY 2016E5 CY 2017E5
Powertrain
BorgWarner Inc. $32.75 $7,151.6 $9,657.2 6.6x 6.3x 5.9x 6 9
Carraro SpA $1.38 $59.8 $340.9 7.8x NA NA N NA
Cummins Inc. $113.74 $19,399.4 $20,245.4 6.9x 7.9x 8.1x 8 #
Dana Holding Corporation $11.54 $1,712.4 $2,951.2 5.3x 4.7x 4.4x 4 8
DENSO Corporation $35.35 $28,198.6 $28,474.8 4.8x 4.7x 4.4x 4 8
ElringKlinger AG $21.07 $1,335.0 $2,017.2 7.6x 6.8x 6.0x 6 #
Linamar Corp. $39.67 $2,614.8 $3,679.8 5.0x 4.7x 4.3x 4 #
Metaldyne Performance Group Inc. $16.02 $1,108.6 $2,833.1 5.6x 5.4x 5.1x 5 8
Modine Manufacturing Company $9.71 $460.5 $621.8 5.4x 5.2x 4.6x 5 NA
Schaeffler AG $15.59 $10,384.7 $17,226.3 6.2x 5.9x 5.6x 6 9
Low 4.8x 4.7x 4.3x
High 7.8x 7.9x 8.1x
Median 5.9x 5.4x 5.1x
Mean 6.1x 5.7x 5.4x
Motorparts
Dorman Products, Inc. $53.32 $1,855.4 $1,768.5 10.5x 9.9x 9.2x 9 #
Genuine Parts Company $95.12 $14,293.2 $14,983.5 12.0x 11.2x 10.7x # #
Motorcar Parts of America, Inc. $27.74 $529.9 $545.5 16.0x 6.4x 5.6x 6 6
Standard Motor Products Inc. $37.20 $855.6 $893.8 8.4x 7.8x 7.0x 7 NA
Low 8.4x 6.4x 5.6x
High 16.0x 11.2x 10.7x
Median 11.2x 8.8x 8.1x
Mean 11.7x 8.8x 8.1x
Note: No company used for comparative purposes is identical to Pow ertrain, Motorparts or the Company.
1. Adjusted Enterprise Value equals equity market value + minority interest + debt outstanding + preferred stock – cash and cash equivalents + tax-effected underfunded pension and post-employment liabilities
2. For selected companies, CY 2016E and CY 2017E pension expense assumed to equal LTM pension expense.
3. Based on closing stock prices as of June 13, 2016.
4. Based on reported fully-diluted shares.
5. Multiples based on forw ard-looking financial information for DENSO Corporation, Motorcar Parts of America, Inc. and Modine Manufacturing Company have been calendarized to the Company’s fiscal year-
end of December 31. All other companies show n have December 31 fiscal year-ends.
Adjusted EBITDAP refers to Earnings Before Interest, Taxes, Depreciation, Amortization and Pension (and OPEB) Expense, adjusted for certain non-recurring items.
CY refers to Calendar Year.
E refers to Estimated.
LTM refers to Latest 12 Months.
NA refers to Not Available.
Source: Bloomberg, Capital IQ, public filings.
CONFIDENTIAL—PRELIMINARY DRAFT—SUBJECT TO FURTHER REVIEW 14
|
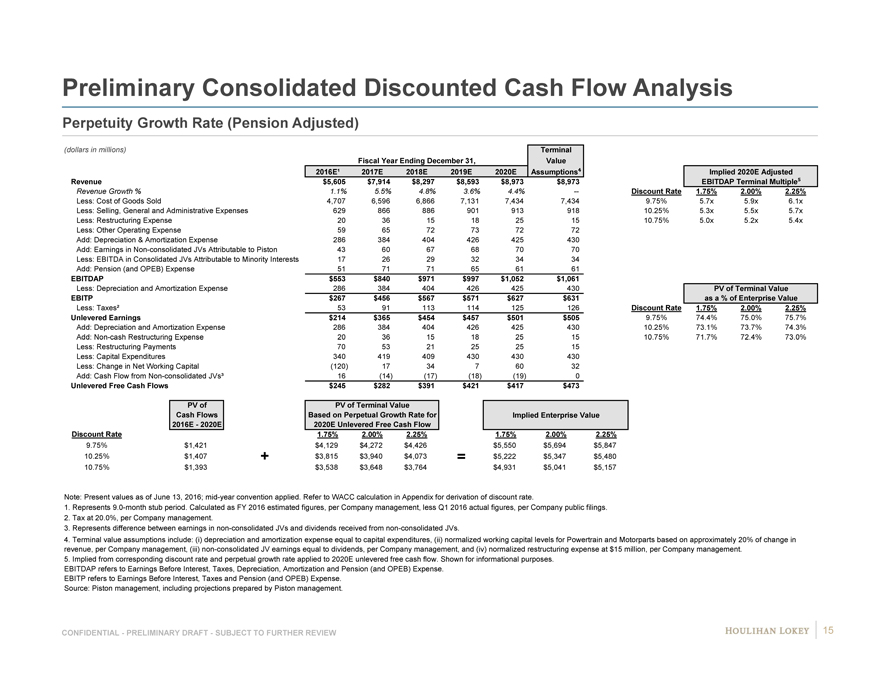
Preliminary Consolidated Discounted Cash Flow Analysis
Perpetuity Growth Rate (Pension Adjusted)
(dollars in millions) Terminal
Fiscal Year Ending December 31, Value
2016E¹ 2017E 2018E 2019E 2020E Assumptions Implied 2020E Adjusted
Revenue $5,605 $7,914 $8,297 $8,593 $8,973 $8,973 EBITDAP Terminal Multiple
Revenue Growth % 1.1% 5.5% 4.8% 3.6% 4.4% — Discount Rate 1.75% 2.00% 2.25%
Less: Cost of Goods Sold 4,707 6,596 6,866 7,131 7,434 7,434 9.75% 5.7x 5.9x 6.1x
Less: Selling, General and Administrative Expenses 629 866 886 901 913 918 10.25% 5.3x 5.5x 5.7x
Less: Restructuring Expense 20 36 15 18 25 15 10.75% 5.0x 5.2x 5.4x
Less: Other Operating Expense 59 65 72 73 72 72
Add: Depreciation & Amortization Expense 286 384 404 426 425 430
Add: Earnings in Non-consolidated JVs Attributable to Piston 43 60 67 68 70 70
Less: EBITDA in Consolidated JVs Attributable to Minority Interests 17 26 29 32 34 34
Add: Pension (and OPEB) Expense 51 71 71 65 61 61
EBITDAP $553 $840 $971 $997 $1,052 $1,061
Less: Depreciation and Amortization Expense 286 384 404 426 425 430 PV of Terminal Value
EBITP $267 $456 $567 $571 $627 $631 as a % of Enterprise Value
Less: Taxes² 53 91 113 114 125 126 Discount Rate 1.75% 2.00% 2.25%
Unlevered Earnings $214 $365 $454 $457 $501 $505 9.75% 74.4% 75.0% 75.7%
Add: Depreciation and Amortization Expense 286 384 404 426 425 430 10.25% 73.1% 73.7% 74.3%
Add: Non-cash Restructuring Expense 20 36 15 18 25 15 10.75% 71.7% 72.4% 73.0%
Less: Restructuring Payments 70 53 21 25 25 15
Less: Capital Expenditures 340 419 409 430 430 430
Less: Change in Net Working Capital (120) 17 34 7 60 32
Add: Cash Flow from Non-consolidated JVs³ 16 (14) (17) (18) (19) 0
Unlevered Free Cash Flows $245 $282 $391 $421 $417 $473
PV of PV of Terminal Value
Cash Flows Based on Perpetual Growth Rate for Implied Enterprise Value
2016E—2020E 2020E Unlevered Free Cash Flow
Discount Rate 1.75% 2.00% 2.25% 1.75% 2.00% 2.25%
9.75% 0.098 $1,421 $4,129 $4,272 $4,426 $5,550 $5,694 $5,847
10.25% 0.103 $1,407 + $3,815 $3,940 $4,073 = $5,222 $5,347 $5,480
10.75% 0.108 $1,393 $3,538 $3,648 $3,764 $4,931 $5,041 $5,157
Note: Present values as of June 13, 2016; mid-year convention applied. Refer to WACC calculation in Appendix for derivation of discount rate.
1. Represents 9.0-month stub period. Calculated as FY 2016 estimated figures, per Company management, less Q1 2016 actual figures, per Company public filings.
2. Tax at 20.0%, per Company management.
3. Represents difference between earnings in non-consolidated JVs and dividends received from non-consolidated JVs.
4. Terminal value assumptions include: (i) depreciation and amortization expense equal to capital expenditures, (ii) normalized working capital levels for Powertrain and Motorparts based on approximately 20% of change in
revenue, per Company management, (iii) non-consolidated JV earnings equal to dividends, per Company management, and (iv) normalized restructuring expense at $15 million, per Company management.
5. Implied from corresponding discount rate and perpetual growth rate applied to 2020E unlevered free cash flow. Shown for informational purposes.
EBITDAP refers to Earnings Before Interest, Taxes, Depreciation, Amortization and Pension (and OPEB) Expense.
EBITP refers to Earnings Before Interest, Taxes and Pension (and OPEB) Expense.
Source: Piston management, including projections prepared by Piston management.
CONFIDENTIAL—PRELIMINARY DRAFT—SUBJECT TO FURTHER REVIEW 15
|
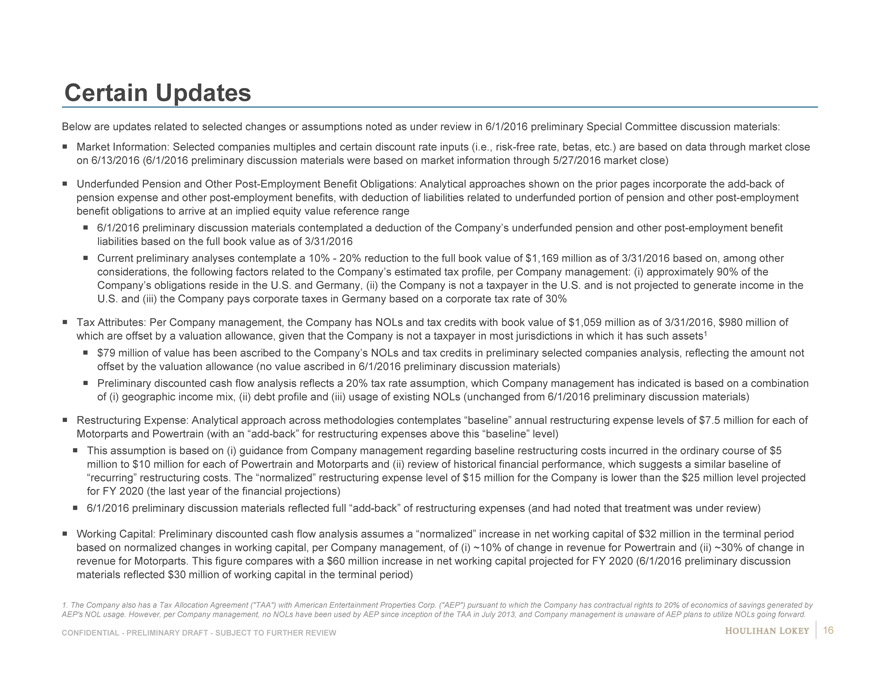
Certain Updates
Below are updates related to selected changes or assumptions noted as under review in 6/1/2016 preliminary Special Committee discussion materials: Market Information: Selected companies multiples and certain discount rate inputs (i.e., risk-free rate, betas, etc.) are based on data through market close on 6/13/2016 (6/1/2016 preliminary discussion materials were based on market information through 5/27/2016 market close)
Underfunded Pension and Other Post-Employment Benefit Obligations: Analytical approaches shown on the prior pages incorporate the add-back of pension expense and other post-employment benefits, with deduction of liabilities related to underfunded portion of pension and other post-employment benefit obligations to arrive at an implied equity value reference range 6/1/2016 preliminary discussion materials contemplated a deduction of the Company’s underfunded pension and other post-employment benefit liabilities based on the full book value as of 3/31/2016 Current preliminary analyses contemplate a 10%—20% reduction to the full book value of $1,169 million as of 3/31/2016 based on, among other considerations, the following factors related to the Company’s estimated tax profile, per Company management: (i) approximately 90% of the Company’s obligations reside in the U.S. and Germany, (ii) the Company is not a taxpayer in the U.S. and is not projected to generate income in the U.S. and (iii) the Company pays corporate taxes in Germany based on a corporate tax rate of 30%
Tax Attributes: Per Company management, the Company has NOLs and tax credits with book value of $1,059 million as of 3/31/2016, $980 million of which are offset by a valuation allowance, given that the Company is not a taxpayer in most jurisdictions in which it has such assets1 $79 million of value has been ascribed to the Company’s NOLs and tax credits in preliminary selected companies analysis, reflecting the amount not offset by the valuation allowance (no value ascribed in 6/1/2016 preliminary discussion materials) Preliminary discounted cash flow analysis reflects a 20% tax rate assumption, which Company management has indicated is based on a combination of (i) geographic income mix, (ii) debt profile and (iii) usage of existing NOLs (unchanged from 6/1/2016 preliminary discussion materials)
Restructuring Expense: Analytical approach across methodologies contemplates “baseline” annual restructuring expense levels of $7.5 million for each of Motorparts and Powertrain (with an “add-back” for restructuring expenses above this “baseline” level) This assumption is based on (i) guidance from Company management regarding baseline restructuring costs incurred in the ordinary course of $5 million to $10 million for each of Powertrain and Motorparts and (ii) review of historical financial performance, which suggests a similar baseline of “recurring” restructuring costs. The “normalized” restructuring expense level of $15 million for the Company is lower than the $25 million level projected for FY 2020 (the last year of the financial projections) 6/1/2016 preliminary discussion materials reflected full “add-back” of restructuring expenses (and had noted that treatment was under review)
Working Capital: Preliminary discounted cash flow analysis assumes a “normalized” increase in net working capital of $32 million in the terminal period based on normalized changes in working capital, per Company management, of (i) ~10% of change in revenue for Powertrain and (ii) ~30% of change in revenue for Motorparts. This figure compares with a $60 million increase in net working capital projected for FY 2020 (6/1/2016 preliminary discussion materials reflected $30 million of working capital in the terminal period)
1. The Company also has a Tax Allocation Agreement (“TAA”) with American Entertainment Properties Corp. (“AEP”) pursuant to which the Company has contractual rights to 20% of economics of savings generated by AEP’s NOL usage. However, per Company management, no NOLs have been used by AEP since inception of the TAA in July 2013, and Company management is unaware of AEP plans to utilize NOLs going forward.
CONFIDENTIAL—PRELIMINARY DRAFT—SUBJECT TO FURTHER REVIEW 16
|
Page
1. Selected Public Market Observations 3
2. Preliminary Financial Analyses 7
3. Appendix 17 Cost of Capital Considerations 18 Benchmarking 24 Company Financial Performance Observations 28 Premiums Paid Observations 32 Illustrative Preliminary Financial Analyses (EBITDA) 35 Selected Excerpt from June 1, 2016 Preliminary Discussion Materials: 47 Items Subject to Further Review Selected Excerpts from May 11, 2016 / June 1, 2016 Preliminary 49 Discussion Materials: Illustrative Sensitivities
4. Disclaimer 53
|
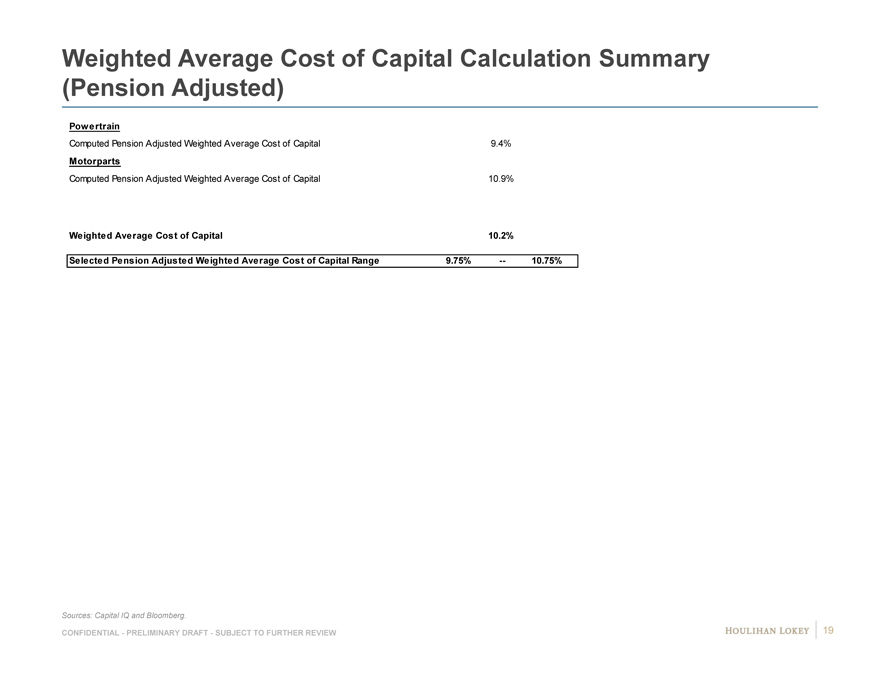
Weighted Average Cost of Capital Calculation Summary (Pension Adjusted)
Powertrain
Computed Pension Adjusted Weighted Average Cost of Capital 9.4%
Motorparts
Computed Pension Adjusted Weighted Average Cost of Capital 10.9%
Weighted Average Cost of Capital 10.2%
Selected Pension Adjusted Weighted Average Cost of Capital Range 9.75% — 10.75%
Sources: Capital IQ and Bloomberg.
CONFIDENTIAL—PRELIMINARY DRAFT—SUBJECT TO FURTHER REVIEW 19
|
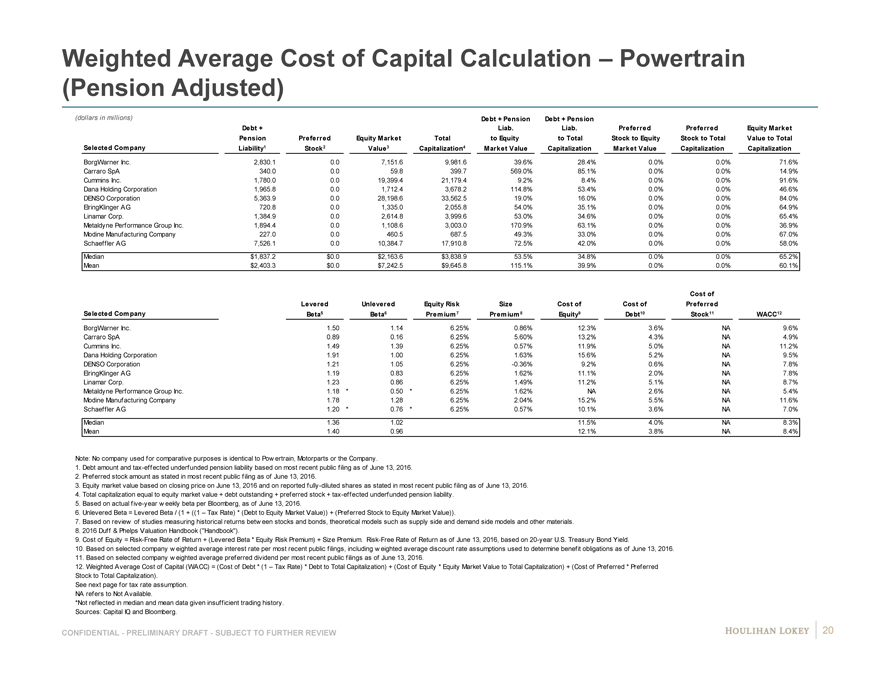
Weighted Average Cost of Capital Calculation – Powertrain
(Pension Adjusted)
(dollars in millions) Debt + Pension Debt + Pension
Debt + Liab. Liab. Preferred Preferred Equity Market
Pension Preferred Equity Market Total to Equity to Total Stock to Equity Stock to Total Value to Total
Selected Company Liability1 Stock2 Value3 Capitalization4 Market Value Capitalization Market Value Capitalization Capitalization
BorgWarner Inc. 2,830.1 # 0.0 # 7,151.6 # 9,981.6 # 39.6% # 28.4% # 0.0% # 0.0% # 71.6%
Carraro SpA 340.0 # 0.0 # 59.8 # 399.7 # 569.0% # 85.1% # 0.0% # 0.0% # 14.9%
Cummins Inc. 1,780.0 # 0.0 # 19,399.4 # 21,179.4 # 9.2% # 8.4% # 0.0% # 0.0% # 91.6%
Dana Holding Corporation 1,965.8 # 0.0 # 1,712.4 # 3,678.2 # 114.8% # 53.4% # 0.0% # 0.0% # 46.6%
DENSO Corporation 5,363.9 # 0.0 # 28,198.6 # 33,562.5 # 19.0% # 16.0% # 0.0% # 0.0% # 84.0%
ElringKlinger AG 720.8 # 0.0 # 1,335.0 # 2,055.8 # 54.0% # 35.1% # 0.0% # 0.0% # 64.9%
Linamar Corp. 1,384.9 # 0.0 # 2,614.8 # 3,999.6 # 53.0% # 34.6% # 0.0% # 0.0% # 65.4%
Metaldyne Performance Group Inc. 1,894.4 # 0.0 # 1,108.6 # 3,003.0 # 170.9% # 63.1% # 0.0% # 0.0% # 36.9%
Modine Manufacturing Company 227.0 # 0.0 # 460.5 # 687.5 # 49.3% # 33.0% # 0.0% # 0.0% # 67.0%
Schaeffler AG 7,526.1 # 0.0 # 10,384.7 # 17,910.8 # 72.5% # 42.0% # 0.0% # 0.0% # 58.0%
Median $ 1,837.2 $ 0.0 $ 2,163.6 $ 3,838.9 53.5% 34.8% 0.0% 0.0% 65.2%
Mean $ 2,403.3 $ 0.0 $ 7,242.5 $ 9,645.8 115.1% 39.9% 0.0% 0.0% 60.1%
Cost of
Levered Unlevered Equity Risk Size Cost of Cost of Preferred
Selected Company Beta5 Beta6 Premium 7 Premium 8 Equity9 Debt10 Stock11 WACC12
BorgWarner Inc. 1.50 # 1.14 # 6.25% 0.86% 12.3% # 3.6% # NA # 9.6%
Carraro SpA 0.89 # 0.16 # 6.25% 5.60% 13.2% # 4.3% # NA # 4.9%
Cummins Inc. 1.49 # 1.39 # 6.25% 0.57% 11.9% # 5.0% # NA # 11.2%
Dana Holding Corporation 1.91 # 1.00 # 6.25% 1.63% 15.6% # 5.2% # NA # 9.5%
DENSO Corporation 1.21 # 1.05 # 6.25% -0.36% 9.2% # 0.6% # NA # 7.8%
ElringKlinger AG 1.19 # 0.83 # 6.25% 1.62% 11.1% # 2.0% # NA # 7.8%
Linamar Corp. 1.23 # 0.86 # 6.25% 1.49% 11.2% # 5.1% # NA # 8.7%
Metaldyne Performance Group Inc. 1.18* 0.50* 6.25% 1.62% NA # 2.6% # NA # 5.4%
Modine Manufacturing Company 1.78 # 1.28 # 6.25% 2.04% 15.2% # 5.5% # NA # 11.6%
Schaeffler AG 1.20* 0.76* 6.25% 0.57% 10.1% # 3.6% # NA # 7.0%
Median 1.36 1.02 11.5% 4.0% NA 8.3%
Mean 1.40 0.96 12.1% 3.8% NA 8.4%
Note: No company used for comparative purposes is identical to Pow ertrain, Motorparts or the Company.
1. Debt amount and tax-effected underfunded pension liability based on most recent public filing as of June 13, 2016.
2. Preferred stock amount as stated in most recent public filing as of June 13, 2016.
3. Equity market value based on closing price on June 13, 2016 and on reported fully-diluted shares as stated in most recent public filing as of June 13, 2016.
4. Total capitalization equal to equity market value + debt outstanding + preferred stock + tax-effected underfunded pension liability.
5. Based on actual five-year w eekly beta per Bloomberg, as of June 13, 2016.
6. Unlevered Beta = Levered Beta / (1 + ((1 – Tax Rate) * (Debt to Equity Market Value)) + (Preferred Stock to Equity Market Value)).
7. Based on review of studies measuring historical returns betw een stocks and bonds, theoretical models such as supply side and demand side models and other materials.
8. 2016 Duff & Phelps Valuation Handbook (“Handbook”).
9. Cost of Equity = Risk-Free Rate of Return + (Levered Beta * Equity Risk Premium) + Size Premium. Risk-Free Rate of Return as of June 13, 2016, based on 20-year U.S. Treasury Bond Yield.
10. Based on selected company w eighted average interest rate per most recent public filings, including w eighted average discount rate assumptions used to determine benefit obligations as of June 13, 2016.
11. Based on selected company w eighted average preferred dividend per most recent public filings as of June 13, 2016.
12. Weighted Average Cost of Capital (WACC) = (Cost of Debt * (1 – Tax Rate) * Debt to Total Capitalization) + (Cost of Equity * Equity Market Value to Total Capitalization) + (Cost of Preferred * Preferred
Stock to Total Capitalization).
See next page for tax rate assumption.
NA refers to Not Available.
*Not reflected in median and mean data given insufficient trading history.
Sources: Capital IQ and Bloomberg.
CONFIDENTIAL—PRELIMINARY DRAFT—SUBJECT TO FURTHER REVIEW
20
|
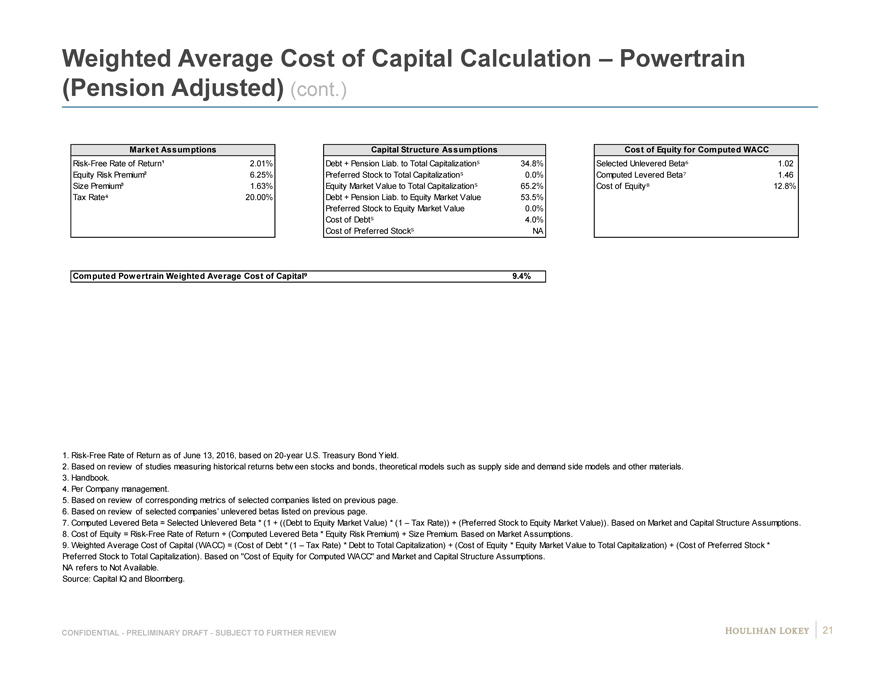
Weighted Average Cost of Capital Calculation – Powertrain
(Pension Adjusted) (cont.)
Market Assumptions Capital Structure Assumptions Cost of Equity for Computed WACC
Risk-Free Rate of Return¹ 2.01% Debt + Pension Liab. to Total Capitalization 34.8% Selected Unlevered Beta 1.02
Equity Risk Premium² 6.25% Preferred Stock to Total Capitalization 0.0% Computed Levered Beta 1.46
Size Premium³ 1.63% Equity Market Value to Total Capitalization 65.2% Cost of Equity 12.8%
Tax Rate 20.00% Debt + Pension Liab. to Equity Market Value 53.5%
Preferred Stock to Equity Market Value 0.0%
Cost of Debt 4.0%
Cost of Preferred Stock NA
Computed Powertrain Weighted Average Cost of Capital 9.4%
1. Risk-Free Rate of Return as of June 13, 2016, based on 20-year U.S. Treasury Bond Yield.
2. Based on review of studies measuring historical returns betw een stocks and bonds, theoretical models such as supply side and demand side models and other materials.
3. Handbook.
4. Per Company management.
5. Based on review of corresponding metrics of selected companies listed on previous page.
6. Based on review of selected companies’ unlevered betas listed on previous page.
7. Computed Levered Beta = Selected Unlevered Beta * (1 + ((Debt to Equity Market Value) * (1 – Tax Rate)) + (Preferred Stock to Equity Market Value)). Based on Market and Capital Structure Assumptions.
8. Cost of Equity = Risk-Free Rate of Return + (Computed Levered Beta * Equity Risk Premium) + Size Premium. Based on Market Assumptions.
9. Weighted Average Cost of Capital (WACC) = (Cost of Debt * (1 – Tax Rate) * Debt to Total Capitalization) + (Cost of Equity * Equity Market Value to Total Capitalization) + (Cost of Preferred Stock *
Preferred Stock to Total Capitalization). Based on “Cost of Equity for Computed WACC” and Market and Capital Structure Assumptions.
NA refers to Not Available.
Source: Capital IQ and Bloomberg.
CONFIDENTIAL—PRELIMINARY DRAFT—SUBJECT TO FURTHER REVIEW 21
|
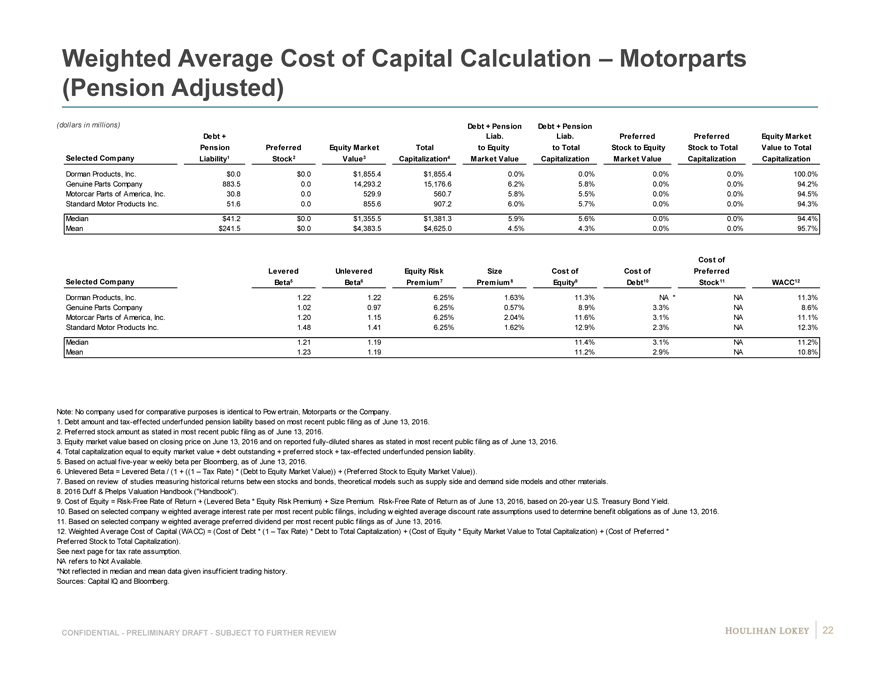
Weighted Average Cost of Capital Calculation – Motorparts
(Pension Adjusted)
(dollars in millions) Debt + Pension Debt + Pension
Debt + Liab. Liab. Preferred Preferred Equity Market
Pension Preferred Equity Market Total to Equity to Total Stock to Equity Stock to Total Value to Total
Selected Company Liability1 Stock2 Value3 Capitalization4 Market Value Capitalization Market Value Capitalization Capitalization
Dorman Products, Inc. $0.0 # $0.0 # $1,855.4 # $1,855.4 # 0.0% # 0.0% # 0.0% # 0.0% # 100.0%
Genuine Parts Company 883.5 # 0.0 # 14,293.2 # 15,176.6 # 6.2% # 5.8% # 0.0% # 0.0% # 94.2%
Motorcar Parts of America, Inc. 30.8 # 0.0 # 529.9 # 560.7 # 5.8% # 5.5% # 0.0% # 0.0% # 94.5%
Standard Motor Products Inc. 51.6 # 0.0 # 855.6 # 907.2 # 6.0% # 5.7% # 0.0% # 0.0% # 94.3%
Median $41.2 $0.0 $1,355.5 $1,381.3 5.9% 5.6% 0.0% 0.0% 94.4%
Mean $241.5 $0.0 $4,383.5 $4,625.0 4.5% 4.3% 0.0% 0.0% 95.7%
Cost of
Levered Unlevered Equity Risk Size Cost of Cost of Preferred
Selected Company Beta5 Beta6 Premium 7 Premium 8 Equity9 Debt10 Stock11 WACC12
Dorman Products, Inc. 1.22 # 1.22 # 6.25% 1.63% 11.3% # NA * NA # 11.3%
Genuine Parts Company 1.02 # 0.97 # 6.25% 0.57% 8.9% # 3.3% # NA # 8.6%
Motorcar Parts of America, Inc. 1.20 # 1.15 # 6.25% 2.04% 11.6% # 3.1% # NA # 11.1%
Standard Motor Products Inc. 1.48 # 1.41 # 6.25% 1.62% 12.9% # 2.3% # NA # 12.3%
Median 1.21 1.19 11.4% 3.1% NA 11.2%
Mean 1.23 1.19 11.2% 2.9% NA 10.8%
Note: No company used for comparative purposes is identical to Pow ertrain, Motorparts or the Company.
1. Debt amount and tax-effected underfunded pension liability based on most recent public filing as of June 13, 2016.
2. Preferred stock amount as stated in most recent public filing as of June 13, 2016.
3. Equity market value based on closing price on June 13, 2016 and on reported fully-diluted shares as stated in most recent public filing as of June 13, 2016.
4. Total capitalization equal to equity market value + debt outstanding + preferred stock + tax-effected underfunded pension liability.
5. Based on actual five-year w eekly beta per Bloomberg, as of June 13, 2016.
6. Unlevered Beta = Levered Beta / (1 + ((1 – Tax Rate) * (Debt to Equity Market Value)) + (Preferred Stock to Equity Market Value)).
7. Based on review of studies measuring historical returns betw een stocks and bonds, theoretical models such as supply side and demand side models and other materials.
8. 2016 Duff & Phelps Valuation Handbook (“Handbook”).
9. Cost of Equity = Risk-Free Rate of Return + (Levered Beta * Equity Risk Premium) + Size Premium. Risk-Free Rate of Return as of June 13, 2016, based on 20-year U.S. Treasury Bond Yield.
10. Based on selected company w eighted average interest rate per most recent public filings, including w eighted average discount rate assumptions used to determine benefit obligations as of June 13, 2016.
11. Based on selected company w eighted average preferred dividend per most recent public filings as of June 13, 2016.
12. Weighted Average Cost of Capital (WACC) = (Cost of Debt * (1 – Tax Rate) * Debt to Total Capitalization) + (Cost of Equity * Equity Market Value to Total Capitalization) + (Cost of Preferred *
Preferred Stock to Total Capitalization).
See next page for tax rate assumption.
NA refers to Not Available.
*Not reflected in median and mean data given insufficient trading history.
Sources: Capital IQ and Bloomberg.
CONFIDENTIAL—PRELIMINARY DRAFT—SUBJECT TO FURTHER REVIEW 22
|

Weighted Average Cost of Capital Calculation – Motorparts
(Pension Adjusted) (cont.)
Market Assumptions Capital Structure Assumptions Cost of Equity for Computed WACC
Risk-Free Rate of Return¹ 2.01% Debt + Pension Liab. to Total Capitalization 5.6% Selected Unlevered Beta 1.19
Equity Risk Premium² 6.25% Preferred Stock to Total Capitalization 0.0% Computed Levered Beta 1.24
Size Premium³ 1.63% Equity Market Value to Total Capitalization 94.4% Cost of Equity 11.4%
Tax Rate 20.00% Debt + Pension Liab. to Equity Market Value 5.9%
Preferred Stock to Equity Market Value 0.0%
Cost of Debt 3.1%
Cost of Preferred Stock NA
Computed Motorparts Weighted Average Cost of Capital 10.9%
1. Risk-Free Rate of Return as of June 13, 2016, based on 20-year U.S. Treasury Bond Yield.
2. Based on review of studies measuring historical returns betw een stocks and bonds, theoretical models such as supply side and demand side models and other materials.
3. Handbook.
4. Per Company management.
5. Based on review of corresponding metrics of selected companies listed on previous page.
6. Based on review of selected companies’ unlevered betas listed on previous page.
7. Computed Levered Beta = Selected Unlevered Beta * (1 + ((Debt to Equity Market Value) * (1 – Tax Rate)) + (Preferred Stock to Equity Market Value)). Based on Market and Capital Structure Assumptions.
8. Cost of Equity = Risk-Free Rate of Return + (Computed Levered Beta * Equity Risk Premium) + Size Premium. Based on Market Assumptions.
9. Weighted Average Cost of Capital (WACC) = (Cost of Debt * (1 – Tax Rate) * Debt to Total Capitalization) + (Cost of Equity * Equity Market Value to Total Capitalization) + (Cost of Preferred Stock *
Preferred Stock to Total Capitalization). Based on “Cost of Equity for Computed WACC” and Market and Capital Structure Assumptions.
NA refers to Not Available.
Source: Capital IQ and Bloomberg.
CONFIDENTIAL—PRELIMINARY DRAFT—SUBJECT TO FURTHER REVIEW 23
|
Page
1. Selected Public Market Observations 3
2. Preliminary Financial Analyses 7
3. Appendix 17 Cost of Capital Considerations 18 Benchmarking 24 Company Financial Performance Observations 28 Premiums Paid Observations 32 Illustrative Preliminary Financial Analyses (EBITDA) 35 Selected Excerpt from June 1, 2016 Preliminary Discussion Materials: 47 Items Subject to Further Review Selected Excerpts from May 11, 2016 / June 1, 2016 Preliminary 49 Discussion Materials: Illustrative Sensitivities
4. Disclaimer 53
|
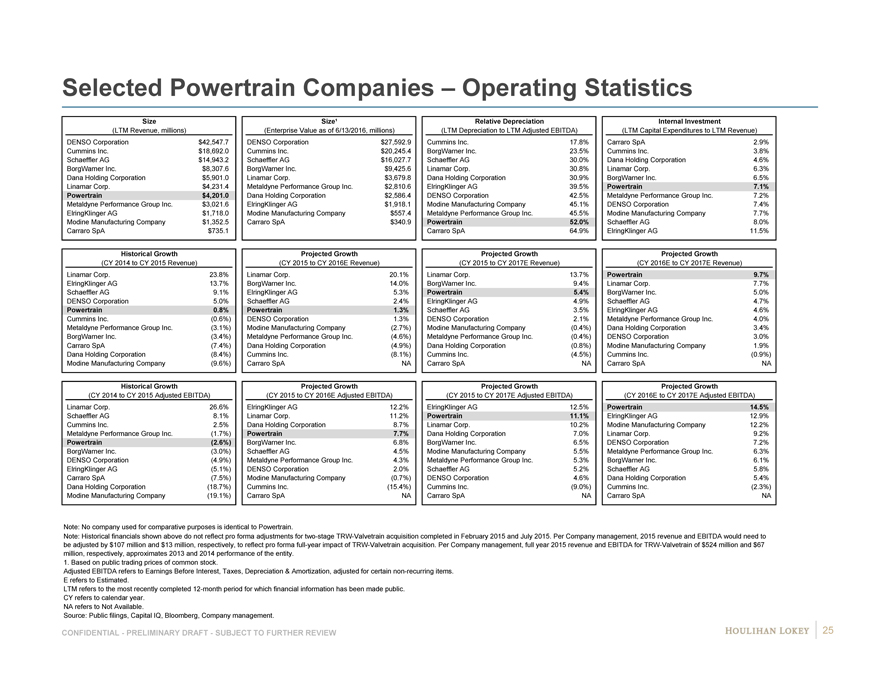
Selected Powertrain Companies – Operating Statistics
Size Size¹ Relative Depreciation Internal Investment
(LTM Revenue, millions)(Enterprise Value as of 6/13/2016, millions)(LTM Depreciation to LTM Adjusted EBITDA)(LTM Capital Expenditures to LTM Revenue)
DENSO Corporation $42,547.7 DENSO Corporation $27,592.9 Cummins Inc. 17.8% Carraro SpA 2.9%
Cummins Inc. $18,692.0 Cummins Inc. $20,245.4 BorgWarner Inc. 23.5% Cummins Inc. 3.8%
Schaeffler AG $14,943.2 Schaeffler AG $16,027.7 Schaeffler AG 30.0% Dana Holding Corporation 4.6%
BorgWarner Inc. $8,307.6 BorgWarner Inc. $9,425.6 Linamar Corp. 30.8% Linamar Corp. 6.3%
Dana Holding Corporation $5,901.0 Linamar Corp. $3,679.8 Dana Holding Corporation 30.9% BorgWarner Inc. 6.5%
Linamar Corp. $4,231.4 Metaldyne Performance Group Inc. $2,810.6 ElringKlinger AG 39.5% Powertrain 7.1%
Powertrain $4,201.0 Dana Holding Corporation $2,586.4 DENSO Corporation 42.5% Metaldyne Performance Group Inc. 7.2%
Metaldyne Performance Group Inc. $3,021.6 ElringKlinger AG $1,918.1 Modine Manufacturing Company 45.1% DENSO Corporation 7.4%
ElringKlinger AG $1,718.0 Modine Manufacturing Company $557.4 Metaldyne Performance Group Inc. 45.5% Modine Manufacturing Company 7.7%
Modine Manufacturing Company $1,352.5 Carraro SpA $340.9 Powertrain 52.0% Schaeffler AG 8.0%
Carraro SpA $735.1 Carraro SpA 64.9% ElringKlinger AG 11.5%
Historical Growth Projected Growth Projected Growth Projected Growth
(CY 2014 to CY 2015 Revenue)(CY 2015 to CY 2016E Revenue)(CY 2015 to CY 2017E Revenue)(CY 2016E to CY 2017E Revenue)
Linamar Corp. 23.8% Linamar Corp. 20.1% Linamar Corp. 13.7% Powertrain 9.7%
ElringKlinger AG 13.7% BorgWarner Inc. 14.0% BorgWarner Inc. 9.4% Linamar Corp. 7.7%
Schaeffler AG 9.1% ElringKlinger AG 5.3% Powertrain 5.4% BorgWarner Inc. 5.0%
DENSO Corporation 5.0% Schaeffler AG 2.4% ElringKlinger AG 4.9% Schaeffler AG 4.7%
Powertrain 0.8% Powertrain 1.3% Schaeffler AG 3.5% ElringKlinger AG 4.6%
Cummins Inc.(0.6%) DENSO Corporation 1.3% DENSO Corporation 2.1% Metaldyne Performance Group Inc. 4.0%
Metaldyne Performance Group Inc.(3.1%) Modine Manufacturing Company(2.7%) Modine Manufacturing Company(0.4%) Dana Holding Corporation 3.4%
BorgWarner Inc.(3.4%) Metaldyne Performance Group Inc.(4.6%) Metaldyne Performance Group Inc.(0.4%) DENSO Corporation 3.0%
Carraro SpA(7.4%) Dana Holding Corporation(4.9%) Dana Holding Corporation(0.8%) Modine Manufacturing Company 1.9%
Dana Holding Corporation(8.4%) Cummins Inc.(8.1%) Cummins Inc.(4.5%) Cummins Inc.(0.9%)
Modine Manufacturing Company(9.6%) Carraro SpA NA Carraro SpA NA Carraro SpA NA
Historical Growth Projected Growth Projected Growth Projected Growth
(CY 2014 to CY 2015 Adjusted EBITDA)(CY 2015 to CY 2016E Adjusted EBITDA)(CY 2015 to CY 2017E Adjusted EBITDA)(CY 2016E to CY 2017E Adjusted EBITDA)
Linamar Corp. 26.6% ElringKlinger AG 12.2% ElringKlinger AG 12.5% Powertrain 14.5%
Schaeffler AG 8.1% Linamar Corp. 11.2% Powertrain 11.1% ElringKlinger AG 12.9%
Cummins Inc. 2.5% Dana Holding Corporation 8.7% Linamar Corp. 10.2% Modine Manufacturing Company 12.2%
Metaldyne Performance Group Inc.(1.7%) Powertrain 7.7% Dana Holding Corporation 7.0% Linamar Corp. 9.2%
Powertrain(2.6%) BorgWarner Inc. 6.8% BorgWarner Inc. 6.5% DENSO Corporation 7.2%
BorgWarner Inc.(3.0%) Schaeffler AG 4.5% Modine Manufacturing Company 5.5% Metaldyne Performance Group Inc. 6.3%
DENSO Corporation(4.9%) Metaldyne Performance Group Inc. 4.3% Metaldyne Performance Group Inc. 5.3% BorgWarner Inc. 6.1%
ElringKlinger AG(5.1%) DENSO Corporation 2.0% Schaeffler AG 5.2% Schaeffler AG 5.8%
Carraro SpA(7.5%) Modine Manufacturing Company(0.7%) DENSO Corporation 4.6% Dana Holding Corporation 5.4%
Dana Holding Corporation(18.7%) Cummins Inc.(15.4%) Cummins Inc.(9.0%) Cummins Inc.(2.3%)
Modine Manufacturing Company(19.1%) Carraro SpA NA Carraro SpA NA Carraro SpA NA
Note: No company used for comparative purposes is identical to Powertrain.
Note: Historical financials shown above do not reflect pro forma adjustments for two-stage TRW-Valvetrain acquisition completed in February 2015 and July 2015. Per Company management, 2015 revenue and EBITDA would need to
be adjusted by $107 million and $13 million, respectively, to reflect pro forma full-year impact of TRW-Valvetrain acquisition. Per Company management, full year 2015 revenue and EBITDA for TRW-Valvetrain of $524 million and $67
million, respectively, approximates 2013 and 2014 performance of the entity.
1. Based on public trading prices of common stock.
Adjusted EBITDA refers to Earnings Before Interest, Taxes, Depreciation & Amortization, adjusted for certain non-recurring items.
E refers to Estimated.
LTM refers to the most recently completed 12-month period for which financial information has been made public.
CY refers to calendar year.
NA refers to Not Available.
Source: Public filings, Capital IQ, Bloomberg, Company management.
CONFIDENTIAL—PRELIMINARY DRAFT—SUBJECT TO FURTHER REVIEW 25
|
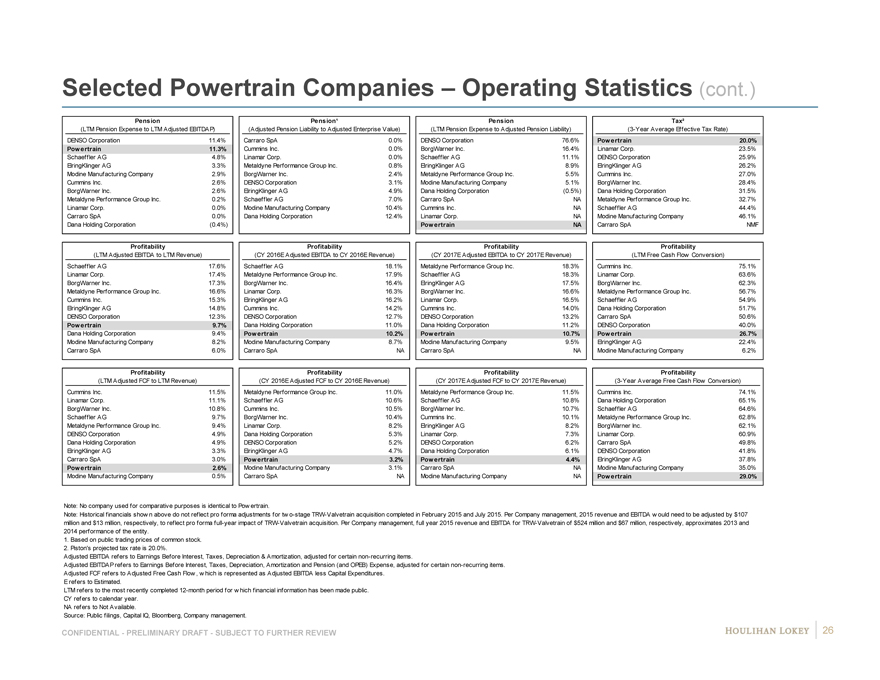
Selected Powertrain Companies – Operating Statistics (cont.)
Pension Pension¹ Pension Tax²
(LTM Pension Expense to LTM Adjusted EBITDAP)(Adjusted Pension Liability to Adjusted Enterprise Value)(LTM Pension Expense to Adjusted Pension Liability)(3-Year Average Effective Tax Rate)
DENSO Corporation 11.4% Carraro SpA 0.0% DENSO Corporation 76.6% Powertrain 20.0%
Powertrain 11.3% Cummins Inc. 0.0% BorgWarner Inc. 16.4% Linamar Corp. 23.5%
Schaeffler AG 4.8% Linamar Corp. 0.0% Schaeffler AG 11.1% DENSO Corporation 25.9%
ElringKlinger AG 3.3% Metaldyne Performance Group Inc. 0.8% ElringKlinger AG 8.9% ElringKlinger AG 26.2%
Modine Manufacturing Company 2.9% BorgWarner Inc. 2.4% Metaldyne Performance Group Inc. 5.5% Cummins Inc. 27.0%
Cummins Inc. 2.6% DENSO Corporation 3.1% Modine Manufacturing Company 5.1% BorgWarner Inc. 28.4%
BorgWarner Inc. 2.6% ElringKlinger AG 4.9% Dana Holding Corporation(0.5%) Dana Holding Corporation 31.5%
Metaldyne Performance Group Inc. 0.2% Schaeffler AG 7.0% Carraro SpA NA Metaldyne Performance Group Inc. 32.7%
Linamar Corp. 0.0% Modine Manufacturing Company 10.4% Cummins Inc. NA Schaeffler AG 44.4%
Carraro SpA 0.0% Dana Holding Corporation 12.4% Linamar Corp. NA Modine Manufacturing Company 46.1%
Dana Holding Corporation(0.4%) Powertrain NA Carraro SpA NMF
Profitability Profitability Profitability Profitability
(LTM Adjusted EBITDA to LTM Revenue)(CY 2016E Adjusted EBITDA to CY 2016E Revenue)(CY 2017E Adjusted EBITDA to CY 2017E Revenue)(LTM Free Cash Flow Conversion)
Schaeffler AG 17.6% Schaeffler AG 18.1% Metaldyne Performance Group Inc. 18.3% Cummins Inc. 75.1%
Linamar Corp. 17.4% Metaldyne Performance Group Inc. 17.9% Schaeffler AG 18.3% Linamar Corp. 63.6%
BorgWarner Inc. 17.3% BorgWarner Inc. 16.4% ElringKlinger AG 17.5% BorgWarner Inc. 62.3%
Metaldyne Performance Group Inc. 16.6% Linamar Corp. 16.3% BorgWarner Inc. 16.6% Metaldyne Performance Group Inc. 56.7%
Cummins Inc. 15.3% ElringKlinger AG 16.2% Linamar Corp. 16.5% Schaeffler AG 54.9%
ElringKlinger AG 14.8% Cummins Inc. 14.2% Cummins Inc. 14.0% Dana Holding Corporation 51.7%
DENSO Corporation 12.3% DENSO Corporation 12.7% DENSO Corporation 13.2% Carraro SpA 50.6%
Powertrain 9.7% Dana Holding Corporation 11.0% Dana Holding Corporation 11.2% DENSO Corporation 40.0%
Dana Holding Corporation 9.4% Powertrain 10.2% Powertrain 10.7% Powertrain 26.7%
Modine Manufacturing Company 8.2% Modine Manufacturing Company 8.7% Modine Manufacturing Company 9.5% ElringKlinger AG 22.4%
Carraro SpA 6.0% Carraro SpA NA Carraro SpA NA Modine Manufacturing Company 6.2%
Profitability Profitability Profitability Profitability
(LTM Adjusted FCF to LTM Revenue)(CY 2016E Adjusted FCF to CY 2016E Revenue)(CY 2017E Adjusted FCF to CY 2017E Revenue)(3-Year Average Free Cash Flow Conversion)
Cummins Inc. 11.5% Metaldyne Performance Group Inc. 11.0% Metaldyne Performance Group Inc. 11.5% Cummins Inc. 74.1%
Linamar Corp. 11.1% Schaeffler AG 10.6% Schaeffler AG 10.8% Dana Holding Corporation 65.1%
BorgWarner Inc. 10.8% Cummins Inc. 10.5% BorgWarner Inc. 10.7% Schaeffler AG 64.6%
Schaeffler AG 9.7% BorgWarner Inc. 10.4% Cummins Inc. 10.1% Metaldyne Performance Group Inc. 62.8%
Metaldyne Performance Group Inc. 9.4% Linamar Corp. 8.2% ElringKlinger AG 8.2% BorgWarner Inc. 62.1%
DENSO Corporation 4.9% Dana Holding Corporation 5.3% Linamar Corp. 7.3% Linamar Corp. 60.9%
Dana Holding Corporation 4.9% DENSO Corporation 5.2% DENSO Corporation 6.2% Carraro SpA 49.8%
ElringKlinger AG 3.3% ElringKlinger AG 4.7% Dana Holding Corporation 6.1% DENSO Corporation 41.8%
Carraro SpA 3.0% Powertrain 3.2% Powertrain 4.4% ElringKlinger AG 37.8%
Powertrain 2.6% Modine Manufacturing Company 3.1% Carraro SpA NA Modine Manufacturing Company 35.0%
Modine Manufacturing Company 0.5% Carraro SpA NA Modine Manufacturing Company NA Powertrain 29.0%
Note: No company used for comparative purposes is identical to Pow ertrain.
Note: Historical financials show n above do not reflect pro forma adjustments for tw o-stage TRW-Valvetrain acquisition completed in February 2015 and July 2015. Per Company management, 2015 revenue and EBITDA w ould need to be adjusted by $107
million and $13 million, respectively, to reflect pro forma full-year impact of TRW-Valvetrain acquisition. Per Company management, full year 2015 revenue and EBITDA for TRW-Valvetrain of $524 million and $67 million, respectively, approximates 2013 and
2014 performance of the entity.
1. Based on public trading prices of common stock.
2. Piston’s projected tax rate is 20.0%.
Adjusted EBITDA refers to Earnings Before Interest, Taxes, Depreciation & Amortization, adjusted for certain non-recurring items.
Adjusted EBITDAP refers to Earnings Before Interest, Taxes, Depreciation, Amortization and Pension (and OPEB) Expense, adjusted for certain non-recurring items.
Adjusted FCF refers to Adjusted Free Cash Flow , w hich is represented as Adjusted EBITDA less Capital Expenditures.
E refers to Estimated.
LTM refers to the most recently completed 12-month period for w hich financial information has been made public.
CY refers to calendar year.
NA refers to Not Available.
Source: Public filings, Capital IQ, Bloomberg, Company management.
CONFIDENTIAL—PRELIMINARY DRAFT—SUBJECT TO FURTHER REVIEW 26
|
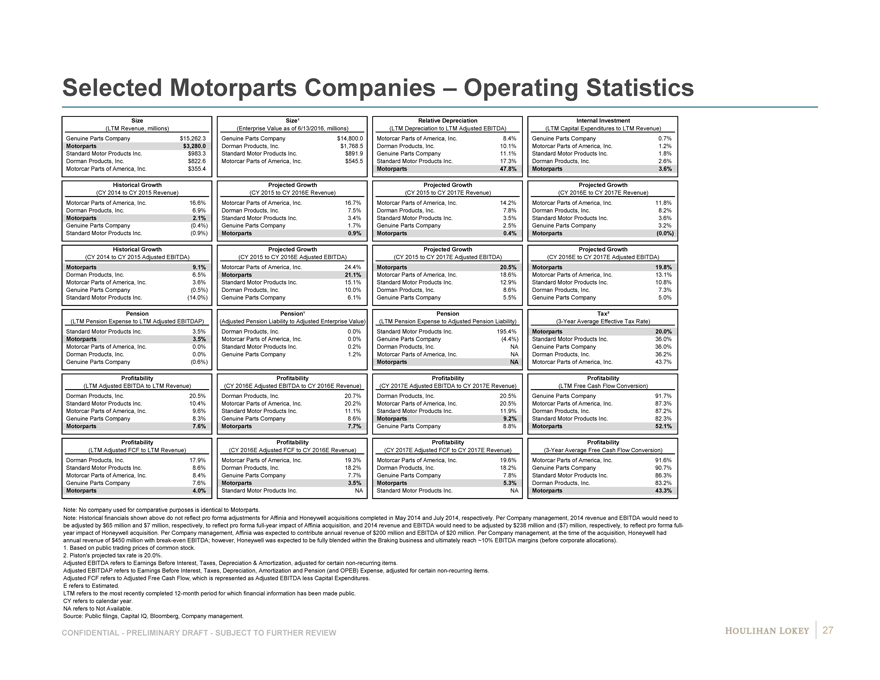
Selected Motorparts Companies – Operating Statistics
Size Size¹ Relative Depreciation Internal Investment
(LTM Revenue, millions)(Enterprise Value as of 6/13/2016, millions)(LTM Depreciation to LTM Adjusted EBITDA)(LTM Capital Expenditures to LTM Revenue)
Genuine Parts Company $15,262.3 Genuine Parts Company $14,800.0 Motorcar Parts of America, Inc. 8.4% Genuine Parts Company 0.7%
Motorparts $3,280.0 Dorman Products, Inc. $1,768.5 Dorman Products, Inc. 10.1% Motorcar Parts of America, Inc. 1.2%
Standard Motor Products Inc. $983.3 Standard Motor Products Inc. $891.9 Genuine Parts Company 11.1% Standard Motor Products Inc. 1.8%
Dorman Products, Inc. $822.6 Motorcar Parts of America, Inc. $545.5 Standard Motor Products Inc. 17.3% Dorman Products, Inc. 2.6%
Motorcar Parts of America, Inc. $355.4 ######### Motorparts 47.8% Motorparts 3.6%
Historical Growth Projected Growth Projected Growth Projected Growth
(CY 2014 to CY 2015 Revenue)(CY 2015 to CY 2016E Revenue)(CY 2015 to CY 2017E Revenue)(CY 2016E to CY 2017E Revenue)
Motorcar Parts of America, Inc. 16.6% Motorcar Parts of America, Inc. 16.7% Motorcar Parts of America, Inc. 14.2% Motorcar Parts of America, Inc. 11.8%
Dorman Products, Inc. 6.9% Dorman Products, Inc. 7.5% Dorman Products, Inc. 7.8% Dorman Products, Inc. 8.2%
Motorparts 2.1% Standard Motor Products Inc. 3.4% Standard Motor Products Inc. 3.5% Standard Motor Products Inc. 3.6%
Genuine Parts Company(0.4%) Genuine Parts Company 1.7% Genuine Parts Company 2.5% Genuine Parts Company 3.2%
Standard Motor Products Inc.(0.9%) Motorparts 0.9% Motorparts 0.4% Motorparts(0.0%)
Historical Growth Projected Growth Projected Growth Projected Growth
(CY 2014 to CY 2015 Adjusted EBITDA)(CY 2015 to CY 2016E Adjusted EBITDA)(CY 2015 to CY 2017E Adjusted EBITDA)(CY 2016E to CY 2017E Adjusted EBITDA)
Motorparts 9.1% Motorcar Parts of America, Inc. 24.4% Motorparts 20.5% Motorparts 19.8%
Dorman Products, Inc. 6.5% Motorparts 21.1% Motorcar Parts of America, Inc. 18.6% Motorcar Parts of America, Inc. 13.1%
Motorcar Parts of America, Inc. 3.6% Standard Motor Products Inc. 15.1% Standard Motor Products Inc. 12.9% Standard Motor Products Inc. 10.8%
Genuine Parts Company(0.5%) Dorman Products, Inc. 10.0% Dorman Products, Inc. 8.6% Dorman Products, Inc. 7.3%
Standard Motor Products Inc.(14.0%) Genuine Parts Company 6.1% Genuine Parts Company 5.5% Genuine Parts Company 5.0%
Pension Pension¹ Pension Tax²
(LTM Pension Expense to LTM Adjusted EBITDAP)(Adjusted Pension Liability to Adjusted Enterprise Value)(LTM Pension Expense to Adjusted Pension Liability)(3-Year Average Effective Tax Rate)
Standard Motor Products Inc. 3.5% Dorman Products, Inc. 0.0% Standard Motor Products Inc. 195.4% Motorparts 20.0%
Motorparts 3.5% Motorcar Parts of America, Inc. 0.0% Genuine Parts Company(4.4%) Standard Motor Products Inc. 36.0%
Motorcar Parts of America, Inc. 0.0% Standard Motor Products Inc. 0.2% Dorman Products, Inc. NA Genuine Parts Company 36.0%
Dorman Products, Inc. 0.0% Genuine Parts Company 1.2% Motorcar Parts of America, Inc. NA Dorman Products, Inc. 36.2%
Genuine Parts Company(0.6%) Motorparts NA Motorcar Parts of America, Inc. 43.7%
Profitability Profitability Profitability Profitability
(LTM Adjusted EBITDA to LTM Revenue)(CY 2016E Adjusted EBITDA to CY 2016E Revenue)(CY 2017E Adjusted EBITDA to CY 2017E Revenue)(LTM Free Cash Flow Conversion)
Dorman Products, Inc. 20.5% Dorman Products, Inc. 20.7% Dorman Products, Inc. 20.5% Genuine Parts Company 91.7%
Standard Motor Products Inc. 10.4% Motorcar Parts of America, Inc. 20.2% Motorcar Parts of America, Inc. 20.5% Motorcar Parts of America, Inc. 87.3%
Motorcar Parts of America, Inc. 9.6% Standard Motor Products Inc. 11.1% Standard Motor Products Inc. 11.9% Dorman Products, Inc. 87.2%
Genuine Parts Company 8.3% Genuine Parts Company 8.6% Motorparts 9.2% Standard Motor Products Inc. 82.3%
Motorparts 7.6% Motorparts 7.7% Genuine Parts Company 8.8% Motorparts 52.1%
Profitability Profitability Profitability Profitability
(LTM Adjusted FCF to LTM Revenue)(CY 2016E Adjusted FCF to CY 2016E Revenue)(CY 2017E Adjusted FCF to CY 2017E Revenue)(3-Year Average Free Cash Flow Conversion)
Dorman Products, Inc. 17.9% Motorcar Parts of America, Inc. 19.3% Motorcar Parts of America, Inc. 19.6% Motorcar Parts of America, Inc. 91.6%
Standard Motor Products Inc. 8.6% Dorman Products, Inc. 18.2% Dorman Products, Inc. 18.2% Genuine Parts Company 90.7%
Motorcar Parts of America, Inc. 8.4% Genuine Parts Company 7.7% Genuine Parts Company 7.8% Standard Motor Products Inc. 86.3%
Genuine Parts Company 7.6% Motorparts 3.5% Motorparts 5.3% Dorman Products, Inc. 83.2%
Motorparts 4.0% Standard Motor Products Inc. NA Standard Motor Products Inc. NA Motorparts 43.3%
Note: No company used for comparative purposes is identical to Motorparts.
Note: Historical financials shown above do not reflect pro forma adjustments for Affinia and Honeywell acquisitions completed in May 2014 and July 2014, respectively. Per Company management, 2014 revenue and EBITDA would need to
be adjusted by $65 million and $7 million, respectively, to reflect pro forma full-year impact of Affinia acquisition, and 2014 revenue and EBITDA would need to be adjusted by $238 million and ($7) million, respectively, to reflect pro forma full-
year impact of Honeywell acquisition. Per Company management, Affinia was expected to contribute annual revenue of $200 million and EBITDA of $20 million. Per Company management, at the time of the acquisition, Honeywell had
annual revenue of $450 million with break-even EBITDA; however, Honeywell was expected to be fully blended within the Braking business and ultimately reach ~10% EBITDA margins (before corporate allocations).
1. Based on public trading prices of common stock.
2. Piston’s projected tax rate is 20.0%.
Adjusted EBITDA refers to Earnings Before Interest, Taxes, Depreciation & Amortization, adjusted for certain non-recurring items.
Adjusted EBITDAP refers to Earnings Before Interest, Taxes, Depreciation, Amortization and Pension (and OPEB) Expense, adjusted for certain non-recurring items.
Adjusted FCF refers to Adjusted Free Cash Flow, which is represented as Adjusted EBITDA less Capital Expenditures.
E refers to Estimated.
LTM refers to the most recently completed 12-month period for which financial information has been made public.
CY refers to calendar year.
NA refers to Not Available.
Source: Public filings, Capital IQ, Bloomberg, Company management.
CONFIDENTIAL—PRELIMINARY DRAFT—SUBJECT TO FURTHER REVIEW 27
|
Page
1. Selected Public Market Observations 3
2. Preliminary Financial Analyses 7
3. Appendix 17 Cost of Capital Considerations 18 Benchmarking 24 Company Financial Performance Observations 28 Premiums Paid Observations 32 Illustrative Preliminary Financial Analyses (EBITDA) 35 Selected Excerpt from June 1, 2016 Preliminary Discussion Materials: 47 Items Subject to Further Review Selected Excerpts from May 11, 2016 / June 1, 2016 Preliminary 49 Discussion Materials: Illustrative Sensitivities
4. Disclaimer 53
|
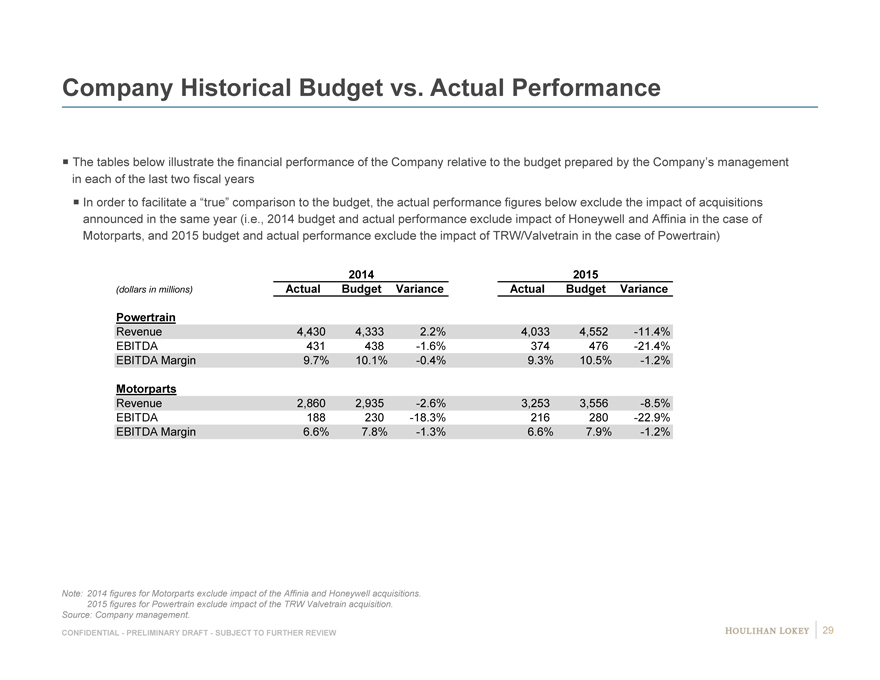
Company Historical Budget vs. Actual Performance
The tables below illustrate the financial performance of the Company relative to the budget prepared by the Company’s management
in each of the last two fiscal years
In order to facilitate a “true” comparison to the budget, the actual performance figures below exclude the impact of acquisitions
announced in the same year (i.e., 2014 budget and actual performance exclude impact of Honeywell and Affinia in the case of
Motorparts, and 2015 budget and actual performance exclude the impact of TRW/Valvetrain in the case of Powertrain)
2014 2015
(dollars in millions) Actual Budget Variance Actual Budget Variance
Powertrain
Revenue 4,430 4,333 2.2% 4,033 4,552 -11.4%
EBITDA 431 438 -1.6% 374 476 -21.4%
EBITDA Margin 9.7% 10.1% -0.4% 9.3% 10.5% -1.2%
Motorparts
Revenue 2,860 2,935 -2.6% 3,253 3,556 -8.5%
EBITDA 188 230 -18.3% 216 280 -22.9%
EBITDA Margin 6.6% 7.8% -1.3% 6.6% 7.9% -1.2%
Note: 2014 figures for Motorparts exclude impact of the Affinia and Honeywell acquisitions.
2015 figures for Powertrain exclude impact of the TRW Valvetrain acquisition.
Source: Company management.
CONFIDENTIAL—PRELIMINARY DRAFT—SUBJECT TO FURTHER REVIEW 29
|
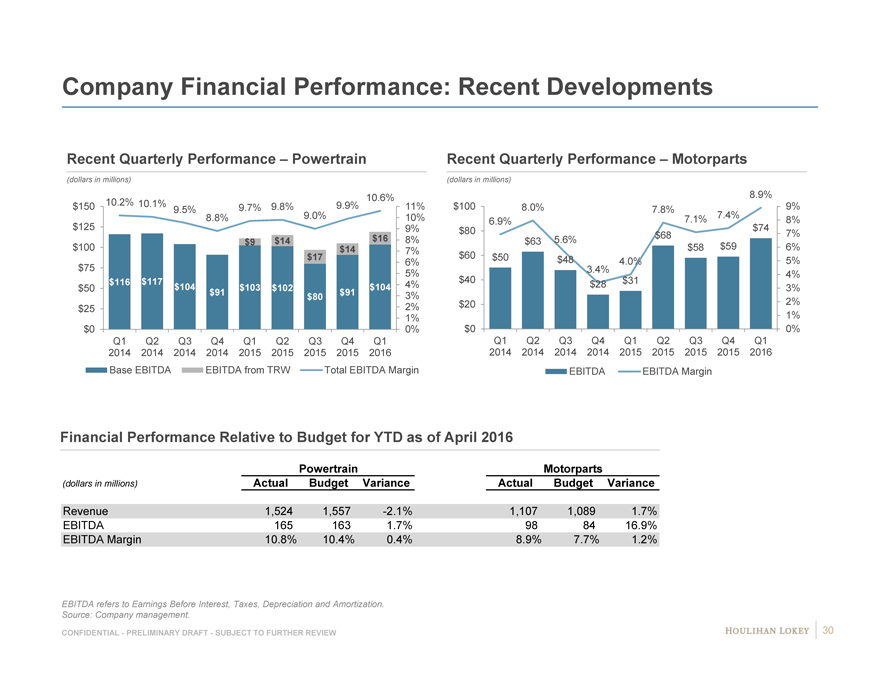
Company Financial Performance: Recent Developments
Recent Quarterly Performance – Powertrain
(dollars in millions)
$150 10.2% 10.1% 9.8% 9.9% 10.6% 11%
9.5% 9.7%
8.8% 9.0% 10%
$125 9%
$9 $14 $16 8%
$100 $ 14 7%
$ 17 6%
$75 5%
$50 $116 $117 $104 $103 $102 $104 4%
$91 $ 80 $ 91 3%
$25 2%
1%
$0 0%
Q1 Q2 Q3 Q4 Q1 Q2 Q3 Q4 Q1
2014 2014 2014 2014 2015 2015 2015 2015 2016
Base EBITDA EBITDA from TRW Total EBITDA Margin
Recent Quarterly Performance – Motorparts
(dollars in millions)
8.9%
$100 8.0% 7.8% 9%
6.9% 7.1% 7.4% 8%
$80 $68 $74 7%
$63 5.6% $58 $59 6%
$60 $50 $48 4.0% 5%
3.4% 4%
$40 $28 $31
3%
$20 2%
1%
$0 0%
Q1 Q2 Q3 Q4 Q1 Q2 Q3 Q4 Q1
2014 2014 2014 2014 2015 2015 2015 2015 2016
EBITDA EBITDA Margin
Financial Performance Relative to Budget for YTD as of April 2016
Powertrain Motorparts
(dollars in millions) Actual Budget Variance Actual Budget Variance
Revenue 1,524 1,557 -2.1% 1,107 1,089 1.7%
EBITDA 165 163 1.7% 98 84 16.9%
EBITDA Margin 10.8% 10.4% 0.4% 8.9% 7.7% 1.2%
EBITDA refers to Earnings Before Interest, Taxes, Depreciation and Amortization.
Source: Company management.
CONFIDENTIAL—PRELIMINARY DRAFT—SUBJECT TO FURTHER REVIEW 30
|
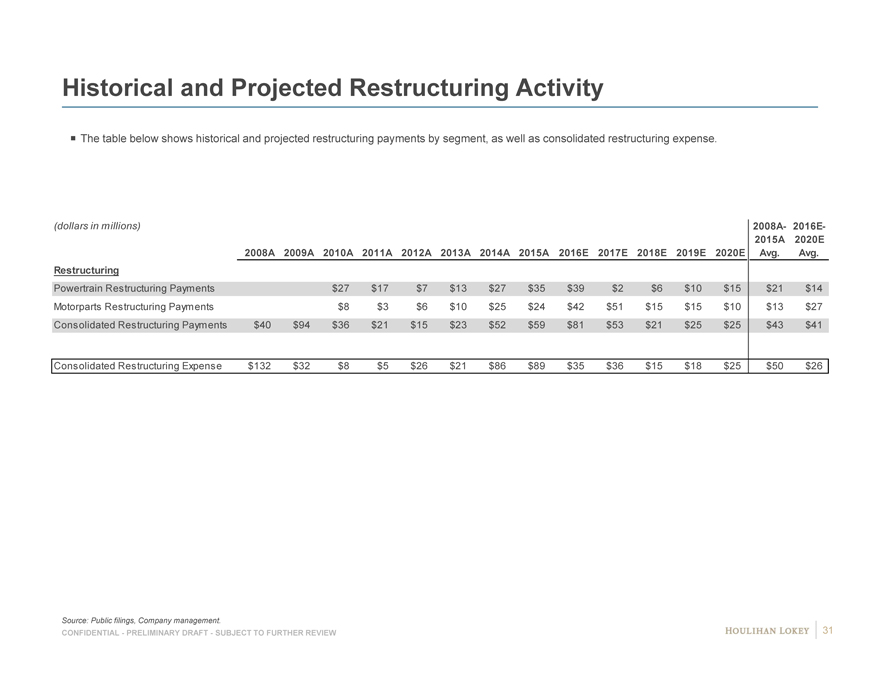
Historical and Projected Restructuring Activity
The table below shows historical and projected restructuring payments by segment, as well as consolidated restructuring expense.
(dollars in millions) 2008A- 2016E-
2015A 2020E
2008A 2009A 2010A 2011A 2012A 2013A 2014A 2015A 2016E 2017E 2018E 2019E 2020E Avg. Avg.
Restructuring
Powertrain Restructuring Payments $27 $17 $7 $ 13 $ 27 $ 35 $ 39 $2 $6 $10 $15 $21 $ 14
Motorparts Restructuring Payments $8 $3 $6 $10 $ 25 $24 $ 42 $51 $15 $ 15 $10 $ 13 $ 27
Consolidated Restructuring Payments $40 $ 94 $36 $21 $15 $ 23 $ 52 $ 59 $ 81 $53 $21 $ 25 $25 $ 43 $ 41
Consolidated Restructuring Expense $132 $ 32 $8 $5 $26 $ 21 $ 86 $ 89 $ 35 $36 $15 $ 18 $25 $ 50 $ 26
Source: Public filings, Company management.
CONFIDENTIAL—PRELIMINARY DRAFT—SUBJECT TO FURTHER REVIEW 31
|
Page
1. Selected Public Market Observations 3
2. Preliminary Financial Analyses 7
3. Appendix 17 Cost of Capital Considerations 18 Benchmarking 24 Company Financial Performance Observations 28 Premiums Paid Observations 32 Illustrative Preliminary Financial Analyses (EBITDA) 35 Selected Excerpt from June 1, 2016 Preliminary Discussion Materials: 47 Items Subject to Further Review Selected Excerpts from May 11, 2016 / June 1, 2016 Preliminary 49 Discussion Materials: Illustrative Sensitivities
4. Disclaimer 53
|
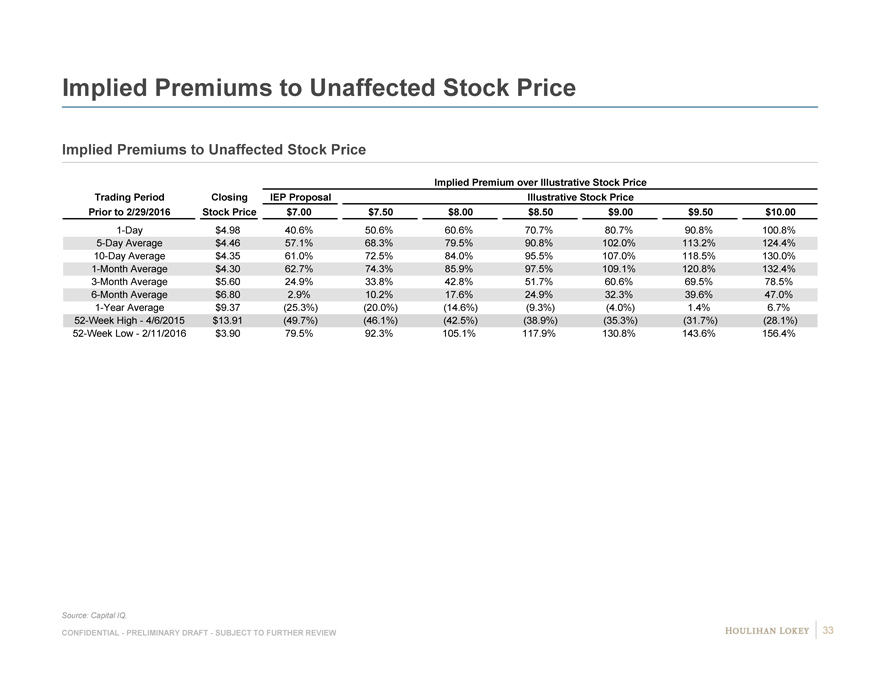
Implied Premiums to Unaffected Stock Price
Implied Premiums to Unaffected Stock Price
Implied Premium over Illustrative Stock Price
Trading Period Closing IEP Proposal Illustrative Stock Price
Prior to 2/29/2016 Stock Price $7.00 $7.50 $8.00 $8.50 $9.00 $9.50 $10.00
1-Day $4.98 40.6% 50.6% 60.6% 70.7% 80.7% 90.8% 100.8%
5-Day Average $4.46 57.1% 68.3% 79.5% 90.8% 102.0% 113.2% 124.4%
10-Day Average $4.35 61.0% 72.5% 84.0% 95.5% 107.0% 118.5% 130.0%
1-Month Average $4.30 62.7% 74.3% 85.9% 97.5% 109.1% 120.8% 132.4%
3-Month Average $5.60 24.9% 33.8% 42.8% 51.7% 60.6% 69.5% 78.5%
6-Month Average $6.80 2.9% 10.2% 17.6% 24.9% 32.3% 39.6% 47.0%
1-Year Average $9.37(25.3%)(20.0%)(14.6%)(9.3%)(4.0%) 1.4% 6.7%
52-Week High—4/6/2015 $13.91(49.7%)(46.1%)(42.5%)(38.9%)(35.3%)(31.7%)(28.1%)
52-Week Low—2/11/2016 $3.90 79.5% 92.3% 105.1% 117.9% 130.8% 143.6% 156.4%
Source: Capital IQ.
CONFIDENTIAL—PRELIMINARY DRAFT—SUBJECT TO FURTHER REVIEW 33
|
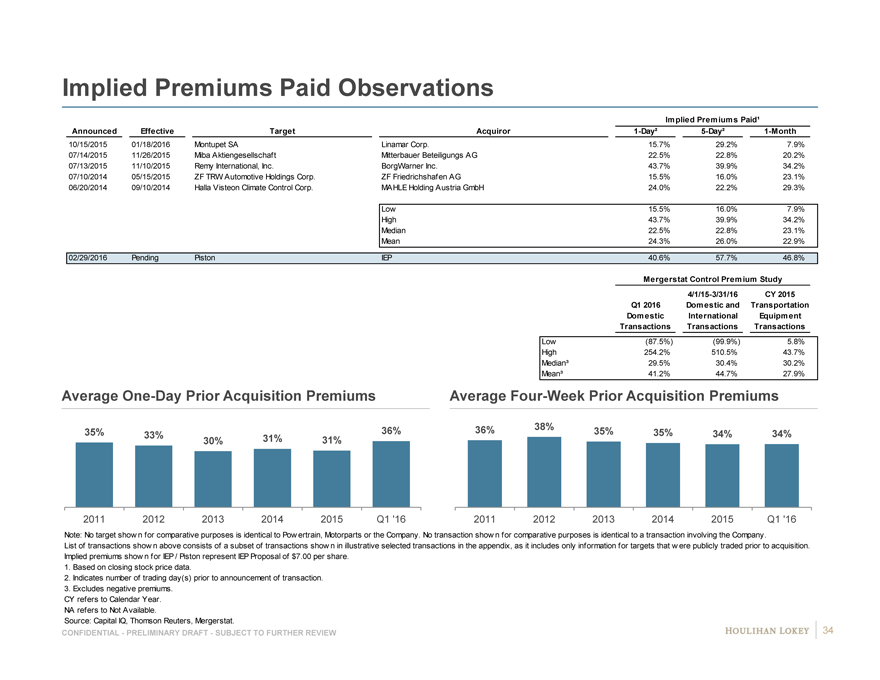
Implied Premiums Paid Observations
Implied Premiums Paid¹
Announced Effective Target Acquiror 1-Day² 5-Day² 1-Month
10/15/2015 01/18/2016 Montupet SA Linamar Corp. 15.7% # 29.2% # 7.9% #
07/14/2015 11/26/2015 Miba Aktiengesellschaft Mitterbauer Beteiligungs AG 22.5% # 22.8% # 20.2% #
07/13/2015 11/10/2015 Remy International, Inc. BorgWarner Inc. 43.7% # 39.9% # 34.2% #
07/10/2014 05/15/2015 ZF TRW Automotive Holdings Corp. ZF Friedrichshafen AG 15.5% # 16.0% # 23.1% #
06/20/2014 09/10/2014 Halla Visteon Climate Control Corp. MAHLE Holding Austria GmbH 24.0% # 22.2% # 29.3% #
Low 15.5% 16.0% 7.9%
High 43.7% 39.9% 34.2%
Median 22.5% 22.8% 23.1%
Mean 24.3% 26.0% 22.9%
02/29/2016 Pending Piston IEP 40.6% 57.7% 46.8%
Mergerstat Control Premium Study
4/1/15-3/31/16 CY 2015
Q1 2016 Domestic and Transportation
Domestic ic International al Equipment
Transactions Transactions Transactions
Low(87.5%) #(99.9%) # 5.8%
High 254.2% # 510.5% # 43.7%
Median³ 29.5% # 30.4% # 30.2%
Mean³ 41.2% # 44.7% # 27.9%
Average One-Day Prior Acquisition Premiums
35% 33% 36%
30% 31% 31%
2011 2012 2013 2014 2015 Q1 ‘16
Average Four-Week Prior Acquisition Premiums
36% 38% 35% 35% 34% 34%
2011 2012 2013 2014 2015 Q1 ‘16
Note: No target show n for comparative purposes is identical to Pow ertrain, Motorparts or the Company. No transaction show n for comparative purposes is identical to a transaction involving the Company.
List of transactions show n above consists of a subset of transactions show n in illustrative selected transactions in the appendix, as it includes only information for targets that w ere publicly traded prior to acquisition.
Implied premiums show n for IEP / Piston represent IEP Proposal of $7.00 per share.
1. Based on closing stock price data.
2. Indicates number of trading day(s) prior to announcement of transaction.
3. Excludes negative premiums.
CY refers to Calendar Year.
NA refers to Not Available.
Source: Capital IQ, Thomson Reuters, Mergerstat.
CONFIDENTIAL—PRELIMINARY DRAFT—SUBJECT TO FURTHER REVIEW 34
|
Page
1. Selected Public Market Observations 3
2. Preliminary Financial Analyses 7
3. Appendix 17 Cost of Capital Considerations 18 Benchmarking 24 Company Financial Performance Observations 28 Premiums Paid Observations 32 Illustrative Preliminary Financial Analyses (EBITDA) 35 Selected Excerpt from June 1, 2016 Preliminary Discussion Materials: 47 Items Subject to Further Review Selected Excerpts from May 11, 2016 / June 1, 2016 Preliminary 49 Discussion Materials: Illustrative Sensitivities
4. Disclaimer 53
|
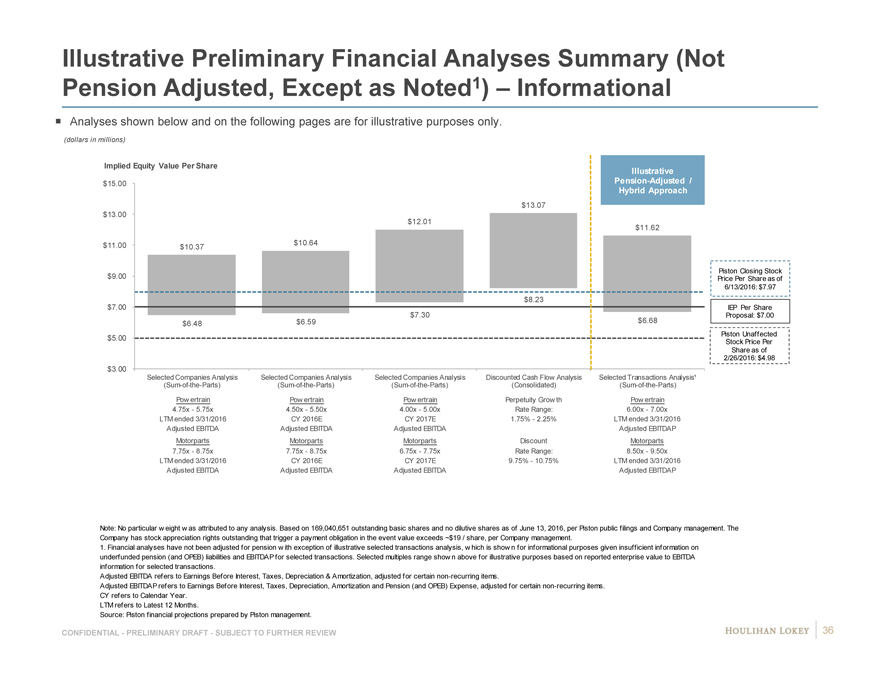
Illustrative Preliminary Financial Analyses Summary (Not
Pension Adjusted, Except as Noted1) – Informational
Analyses shown below and on the following pages are for illustrative purposes only.
(dollars in millions)
Implied Equity Value Per Share Illustrative
$15.00 Pension-Adjusted /
Hybrid Approach
$13.07
$13.00
$12.01
$11.62
$11.00 $10.37 $10.64
Piston Closing Stock
$9.00 Price Per Share as of
6/13/2016: $7.97
$8.23
$7.00 IEP Per Share
$7.30 Proposal: $7.00
$6.48 $6.59 $6.68
Piston Unaffected
$5.00 Stock Price Per
Share as of
2/26/2016: $4.98
$3.00
Selected Companies Analysis Selected Companies Analysis Selected Companies Analysis Discounted Cash Flow Analysis Selected Transactions Analysis¹
(Sum-of-the-Parts)(Sum-of-the-Parts)(Sum-of-the-Parts)(Consolidated)(Sum-of-the-Parts)
Pow ertrain Pow ertrain Pow ertrain Perpetuity Grow th Pow ertrain
4.75x—5.75x 4.50x—5.50x 4.00x—5.00x Rate Range: 6.00x—7.00x
LTM ended 3/31/2016 CY 2016E CY 2017E 1.75%—2.25% LTM ended 3/31/2016
Adjusted EBITDA Adjusted EBITDA Adjusted EBITDA Adjusted EBITDAP
Motorparts Motorparts Motorparts Discount Motorparts
7.75x—8.75x 7.75x—8.75x 6.75x—7.75x Rate Range: 8.50x—9.50x
LTM ended 3/31/2016 CY 2016E CY 2017E 9.75%—10.75% LTM ended 3/31/2016
Adjusted EBITDA Adjusted EBITDA Adjusted EBITDA Adjusted EBITDAP
Note: No particular w eight w as attributed to any analysis. Based on 169,040,651 outstanding basic shares and no dilutive shares as of June 13, 2016, per Piston public filings and Company management. The Company has stock appreciation rights outstanding that trigger a payment obligation in the event value exceeds ~$19 / share, per Company management.
1. Financial analyses have not been adjusted for pension w ith exception of illustrative selected transactions analysis, w hich is show n for informational purposes given insufficient information on underfunded pension (and OPEB) liabilities and EBITDAP for selected transactions. Selected multiples range show n above for illustrative purposes based on reported enterprise value to EBITDA information for selected transactions.
Adjusted EBITDA refers to Earnings Before Interest, Taxes, Depreciation & Amortization, adjusted for certain non-recurring items.
Adjusted EBITDAP refers to Earnings Before Interest, Taxes, Depreciation, Amortization and Pension (and OPEB) Expense, adjusted for certain non-recurring items. CY refers to Calendar Year.
LTM refers to Latest 12 Months.
Source: Piston financial projections prepared by Piston management.
CONFIDENTIAL—PRELIMINARY DRAFT—SUBJECT TO FURTHER REVIEW 36
|
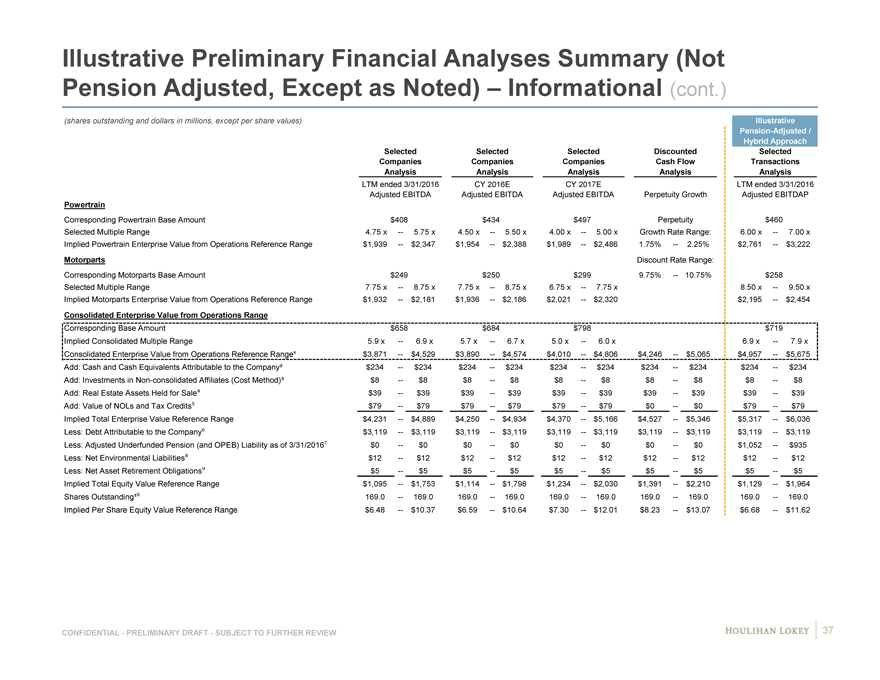
Illustrative Preliminary Financial Analyses Summary (Not
Pension Adjusted, Except as Noted) – Informational (cont.)
(shares outstanding and dollars in millions, except per share values) Illustrative
Pension-Adjusted /
Hybrid Approach
Selected Selected Selected Discounted Selected
Companies Companies Companies Cash Flow Transactions
Analysis Analysis Analysis Analysis Analysis
LTM ended 3/31/2016 CY 2016E CY 2017E LTM ended 3/31/2016
Adjusted EBITDA Adjusted EBITDA Adjusted EBITDA Perpetuity Growth Adjusted EBITDAP
Powertrain Discount Rate Range:
Corresponding Powertrain Base Amount $408 $434 $497 Perpetuity $460
Selected Multiple Range 4.75 x — 5.75 x 4.50 x — 5.50 x 4.00 x — 5.00 x Growth Rate Range: 6.00 x — 7.00 x
Implied Powertrain Enterprise Value from Operations Reference Range $1,939 — $2,347 $1,954 — $2,388 $1,989 — $2,486 1.75% — 2.25% $2,761 — $3,222
Motorparts Discount Rate Range:
Corresponding Motorparts Base Amount $249 $250 $299 9.75% — 10.75% $258
Selected Multiple Range 7.75 x — 8.75 x 7.75 x — 8.75 x 6.75 x — 7.75 x 8.50 x — 9.50 x
Implied Motorparts Enterprise Value from Operations Reference Range $1,932 — $2,181 $1,936 — $2,186 $2,021 — $2,320 $2,195 — $2,454
Consolidated Enterprise Value from Operations Range
Corresponding Base Amount $658 $684 $798 $719
Implied Consolidated Multiple Range 5.9 x — 6.9 x 5.7 x — 6.7 x 5.0 x — 6.0 x 6.9 x — 7.9 x
Consolidated Enterprise Value from Operations Reference Range¹ $3,871 — $4,529 $3,890 — $4,574 $4,010 — $4,806 $4,246 — $5,065 $4,957 — $5,675
Add: Cash and Cash Equivalents Attributable to the Company² $234 — $234 $234 — $234 $234 — $234 $234 — $234 $234 — $234
Add: Investments in Non-consolidated Affiliates (Cost Method)³ $8 — $8 $8 — $8 $8 — $8 $8 — $8 $8 — $8
Add: Real Estate Assets Held for Sale $39 — $39 $39 — $39 $39 — $39 $39 — $39 $39 — $39
Add: Value of NOLs and Tax Credits $79 — $79 $79 — $79 $79 — $79 $0 — $0 $79 — $79
Implied Total Enterprise Value Reference Range $4,231 — $4,889 $4,250 — $4,934 $4,370 — $5,166 $4,527 — $5,346 $5,317 — $6,036
Less: Debt Attributable to the Company $3,119 — $3,119 $3,119 — $3,119 $3,119 — $3,119 $3,119 — $3,119 $3,119 — $3,119
Less: Adjusted Underfunded Pension (and OPEB) Liability as of 3/31/2016 $0 — $0 $0 — $0 $0 — $0 $0 — $0 $1,052 — $935
Less: Net Environmental Liabilities $12 — $12 $12 — $12 $12 — $12 $12 — $12 $12 — $12
Less: Net Asset Retirement Obligations $5 — $5 $5 — $5 $5 — $5 $5 — $5 $5 — $5
Implied Total Equity Value Reference Range $1,095 — $1,753 $1,114 — $1,798 $1,234 — $2,030 $1,391 — $2,210 $1,129 — $1,964
Shares Outstanding¹ 169.0 — 169.0 169.0 — 169.0 169.0 — 169.0 169.0 — 169.0 169.0 — 169.0
Implied Per Share Equity Value Reference Range $6.48 — $10.37 $6.59 — $10.64 $7.30 — $12.01 $8.23 — $13.07 $6.68 — $11.62
CONFIDENTIAL—PRELIMINARY DRAFT—SUBJECT TO FURTHER REVIEW 37
|
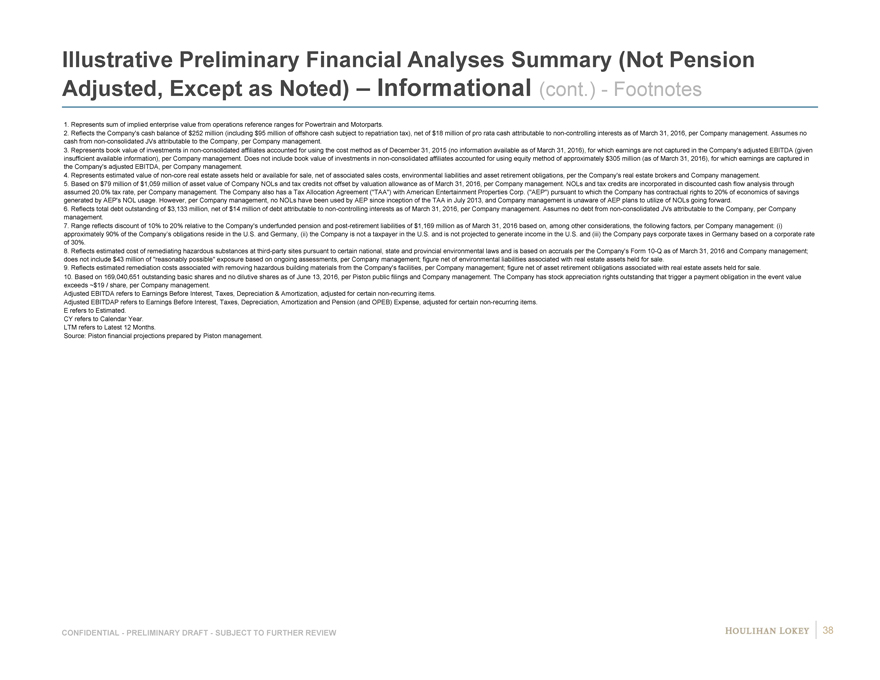
Illustrative Preliminary Financial Analyses Summary (Not Pension Adjusted, Except as Noted) – Informational (cont.)—Footnotes
1. Represents sum of implied enterprise value from operations reference ranges for Powertrain and Motorparts.
2. Reflects the Company’s cash balance of $252 million (including $95 million of offshore cash subject to repatriation tax), net of $18 million of pro rata cash attributable to non-controlling interests as of March 31, 2016, per Company management. Assumes no cash from non-consolidated JVs attributable to the Company, per Company management.
3. Represents book value of investments in non-consolidated affiliates accounted for using the cost method as of December 31, 2015 (no information available as of March 31, 2016), for which earnings are not captured in the Company’s adjusted EBITDA (given insufficient available information), per Company management. Does not include book value of investments in non-consolidated affiliates accounted for using equity method of approximately $305 million (as of March 31, 2016), for which earnings are captured in the Company’s adjusted EBITDA, per Company management.
4. Represents estimated value of non-core real estate assets held or available for sale, net of associated sales costs, environmental liabilities and asset retirement obligations, per the Company’s real estate brokers and Company management.
5. Based on $79 million of $1,059 million of asset value of Company NOLs and tax credits not offset by valuation allowance as of March 31, 2016, per Company management. NOLs and tax credits are incorporated in discounted cash flow analysis through assumed 20.0% tax rate, per Company management. The Company also has a Tax Allocation Agreement (“TAA”) with American Entertainment Properties Corp. (“AEP”) pursuant to which the Company has contractual rights to 20% of economics of savings generated by AEP’s NOL usage. However, per Company management, no NOLs have been used by AEP since inception of the TAA in July 2013, and Company management is unaware of AEP plans to utilize of NOLs going forward.
6. Reflects total debt outstanding of $3,133 million, net of $14 million of debt attributable to non-controlling interests as of March 31, 2016, per Company management. Assumes no debt from non-consolidated JVs attributable to the Company, per Company management.
7. Range reflects discount of 10% to 20% relative to the Company’s underfunded pension and post-retirement liabilities of $1,169 million as of March 31, 2016 based on, among other considerations, the following factors, per Company management: (i) approximately 90% of the Company’s obligations reside in the U.S. and Germany, (ii) the Company is not a taxpayer in the U.S. and is not projected to generate income in the U.S. and (iii) the Company pays corporate taxes in Germany based on a corporate rate of 30%.
8. Reflects estimated cost of remediating hazardous substances at third-party sites pursuant to certain national, state and provincial environmental laws and is based on accruals per the Company’s Form 10-Q as of March 31, 2016 and Company management; does not include $43 million of “reasonably possible” exposure based on ongoing assessments, per Company management; figure net of environmental liabilities associated with real estate assets held for sale.
9. Reflects estimated remediation costs associated with removing hazardous building materials from the Company’s facilities, per Company management; figure net of asset retirement obligations associated with real estate assets held for sale.
10. Based on 169,040,651 outstanding basic shares and no dilutive shares as of June 13, 2016, per Piston public filings and Company management. The Company has stock appreciation rights outstanding that trigger a payment obligation in the event value exceeds ~$19 / share, per Company management.
Adjusted EBITDA refers to Earnings Before Interest, Taxes, Depreciation & Amortization, adjusted for certain non-recurring items.
Adjusted EBITDAP refers to Earnings Before Interest, Taxes, Depreciation, Amortization and Pension (and OPEB) Expense, adjusted for certain non-recurring items. E refers to Estimated.
CY refers to Calendar Year. LTM refers to Latest 12 Months.
Source: Piston financial projections prepared by Piston management.
CONFIDENTIAL—PRELIMINARY DRAFT—SUBJECT TO FURTHER REVIEW 38
|
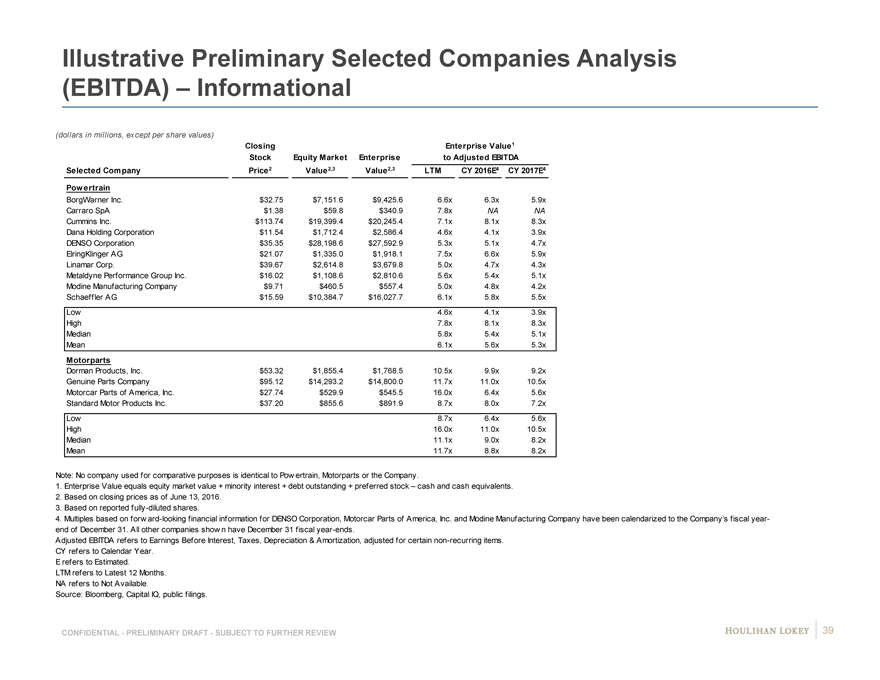
Illustrative Preliminary Selected Companies Analysis
(EBITDA) – Informational
(dollars in millions, except per share values)
Closing Enterprise Value1
Stock Equity Market Enterprise to Adjusted EBITDA
Selected Company Price 2 Value2,3 Value2,3 LTM CY 2016E4 CY 2017E4
Powertrain
BorgWarner Inc. $32.75 $7,151.6 $9,425.6 6.6x 6.3x 5.9x 6 9
Carraro SpA $1.38 $59.8 $340.9 7.8x NA NA N NA
Cummins Inc. $113.74 $19,399.4 $20,245.4 7.1x 8.1x 8.3x 8 #
Dana Holding Corporation $11.54 $1,712.4 $2,586.4 4.6x 4.1x 3.9x 4 7
DENSO Corporation $35.35 $28,198.6 $27,592.9 5.3x 5.1x 4.7x 5 #
ElringKlinger AG $21.07 $1,335.0 $1,918.1 7.5x 6.6x 5.9x 6 #
Linamar Corp. $39.67 $2,614.8 $3,679.8 5.0x 4.7x 4.3x 4 #
Metaldyne Performance Group Inc. $16.02 $1,108.6 $2,810.6 5.6x 5.4x 5.1x 5 8
Modine Manufacturing Company $9.71 $460.5 $557.4 5.0x 4.8x 4.2x 4 NA
Schaeffler AG $15.59 $10,384.7 $16,027.7 6.1x 5.8x 5.5x 5 9
Low 4.6x 4.1x 3.9x
High 7.8x 8.1x 8.3x
Median 5.8x 5.4x 5.1x
Mean 6.1x 5.6x 5.3x
Motorparts
Dorman Products, Inc. $53.32 $1,855.4 $1,768.5 10.5x 9.9x 9.2x 9 #
Genuine Parts Company $95.12 $14,293.2 $14,800.0 11.7x 11.0x 10.5x # #
Motorcar Parts of America, Inc. $27.74 $529.9 $545.5 16.0x 6.4x 5.6x 6 6
Standard Motor Products Inc. $37.20 $855.6 $891.9 8.7x 8.0x 7.2x 7 NA
Low 8.7x 6.4x 5.6x
High 16.0x 11.0x 10.5x
Median 11.1x 9.0x 8.2x
Mean 11.7x 8.8x 8.2x
Note: No company used for comparative purposes is identical to Pow ertrain, Motorparts or the Company.
1. Enterprise Value equals equity market value + minority interest + debt outstanding + preferred stock – cash and cash equivalents.
2. Based on closing prices as of June 13, 2016.
3. Based on reported fully-diluted shares.
4. Multiples based on forw ard-looking financial information for DENSO Corporation, Motorcar Parts of America, Inc. and Modine Manufacturing Company have been calendarized to the Company’s fiscal year-
end of December 31. All other companies show n have December 31 fiscal year-ends.
Adjusted EBITDA refers to Earnings Before Interest, Taxes, Depreciation & Amortization, adjusted for certain non-recurring items.
CY refers to Calendar Year.
E refers to Estimated.
LTM refers to Latest 12 Months.
NA refers to Not Available.
Source: Bloomberg, Capital IQ, public filings.
CONFIDENTIAL—PRELIMINARY DRAFT—SUBJECT TO FURTHER REVIEW 39
|
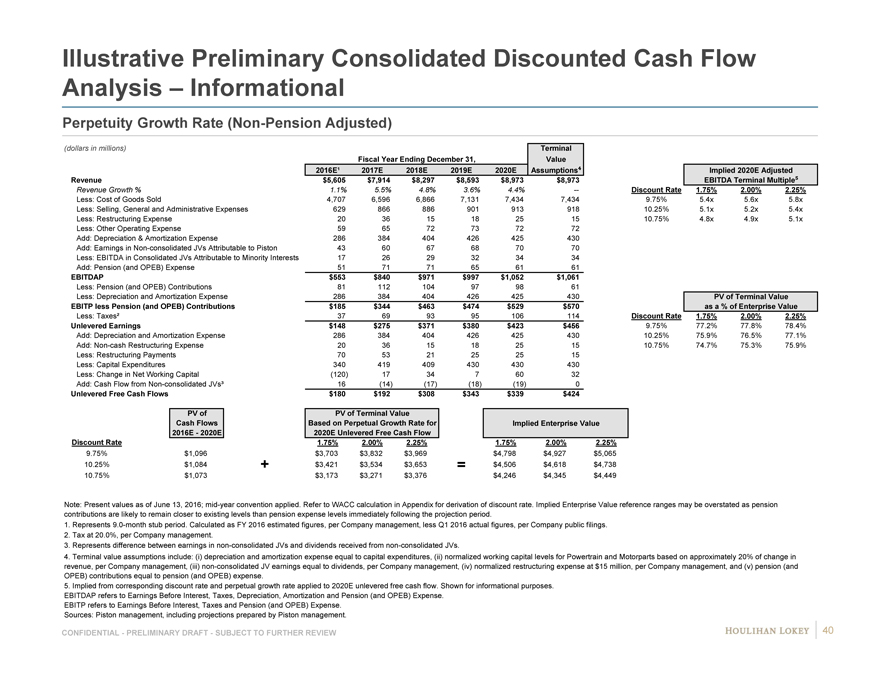
Illustrative Preliminary Consolidated Discounted Cash Flow Analysis – Informational
Perpetuity Growth Rate (Non-Pension Adjusted)
(dollars in millions) Terminal
Fiscal Year Ending December 31, Value
2016E¹ 2017E 2018E 2019E 2020E Assumptions
Revenue $5,605 $7,914 $8,297 $8,593 $8,973 $8,973
Revenue Growth % 1.1% 5.5% 4.8% 3.6% 4.4% —
Less: Cost of Goods Sold 4,707 6,596 6,866 7,131 7,434 7,434
Less: Selling, General and Administrative Expenses 629 866 886 901 913 918
Less: Restructuring Expense 20 36 15 18 25 15
Less: Other Operating Expense 59 65 72 73 72 72
Add: Depreciation & Amortization Expense 286 384 404 426 425 430
Add: Earnings in Non-consolidated JVs Attributable to Piston 43 60 67 68 70 70
Less: EBITDA in Consolidated JVs Attributable to Minority Interests 17 26 29 32 34 34
Add: Pension (and OPEB) Expense 51 71 71 65 61 61
EBITDAP $553 $840 $971 $997 $1,052 $1,061
Less: Pension (and OPEB) Contributions 81 112 104 97 98 61
Less: Depreciation and Amortization Expense 286 384 404 426 425 430
EBITP less Pension (and OPEB) Contributions $185 $344 $463 $474 $529 $570
Less: Taxes² 37 69 93 95 106 114
Unlevered Earnings $148 $275 $371 $380 $423 $456
Add: Depreciation and Amortization Expense 286 384 404 426 425 430
Add: Non-cash Restructuring Expense 20 36 15 18 25 15
Less: Restructuring Payments 70 53 21 25 25 15
Less: Capital Expenditures 340 419 409 430 430 430
Less: Change in Net Working Capital(120) 17 34 7 60 32
Add: Cash Flow from Non-consolidated JVs³ 16(14)(17)(18)(19) 0
Unlevered Free Cash Flows $180 $192 $308 $343 $339 $424
Implied 2020E Adjusted
EBITDA Terminal Multiple
Discount Rate 1.75% 2.00% 2.25%
9.75% 5.4x 5.6x 5.8x
10.25% 5.1x 5.2x 5.4x
10.75% 4.8x 4.9x 5.1x
PV of Terminal Value
as a % of Enterprise Value
Discount Rate 1.75% 2.00% 2.25%
9.75% 77.2% 77.8% 78.4%
10.25% 75.9% 76.5% 77.1%
10.75% 74.7% 75.3% 75.9%
PV of
Cash Flows
2016E—2020E
Discount Rate
9.75% 0.098 $ 1,096
10.25% 0.103 $ 1,084
10.75% 0.108 $ 1,073
PV of Terminal Value
Based on Perpetual Growth Rate for
2020E Unlevered Free Cash Flow
1.75% 2.00% 2.25%
$ 3,703 $ 3,832 $ 3,969
$ 3,421 $ 3,534 $3,653
$ 3,173 $ 3,271 $3,376
Implied Enterprise Value
1.75% 2.00% 2.25%
$ 4,798 $ 4,927 $ 5,065
$ 4,506 $ 4,618 $ 4,738
$ 4,246 $ 4,345 $ 4,449
Note: Present values as of June 13, 2016; mid-year convention applied. Refer to WACC calculation in Appendix for derivation of discount rate. Implied Enterprise Value reference ranges may be overstated as pension contributions are likely to remain closer to existing levels than pension expense levels immediately following the projection period.
1. Represents 9.0-month stub period. Calculated as FY 2016 estimated figures, per Company management, less Q1 2016 actual figures, per Company public filings.
2. Tax at 20.0%, per Company management.
3. Represents difference between earnings in non-consolidated JVs and dividends received from non-consolidated JVs.
4. Terminal value assumptions include: (i) depreciation and amortization expense equal to capital expenditures, (ii) normalized working capital levels for Powertrain and Motorparts based on approximately 20% of change in revenue, per Company management, (iii) non-consolidated JV earnings equal to dividends, per Company management, (iv) normalized restructuring expense at $15 million, per Company management, and (v) pension (and OPEB) contributions equal to pension (and OPEB) expense.
5. Implied from corresponding discount rate and perpetual growth rate applied to 2020E unlevered free cash flow. Shown for informational purposes.
EBITDAP refers to Earnings Before Interest, Taxes, Depreciation, Amortization and Pension (and OPEB) Expense. EBITP refers to Earnings Before Interest, Taxes and Pension (and OPEB) Expense.
Sources: Piston management, including projections prepared by Piston management.
CONFIDENTIAL—PRELIMINARY DRAFT—SUBJECT TO FURTHER REVIEW 40
|
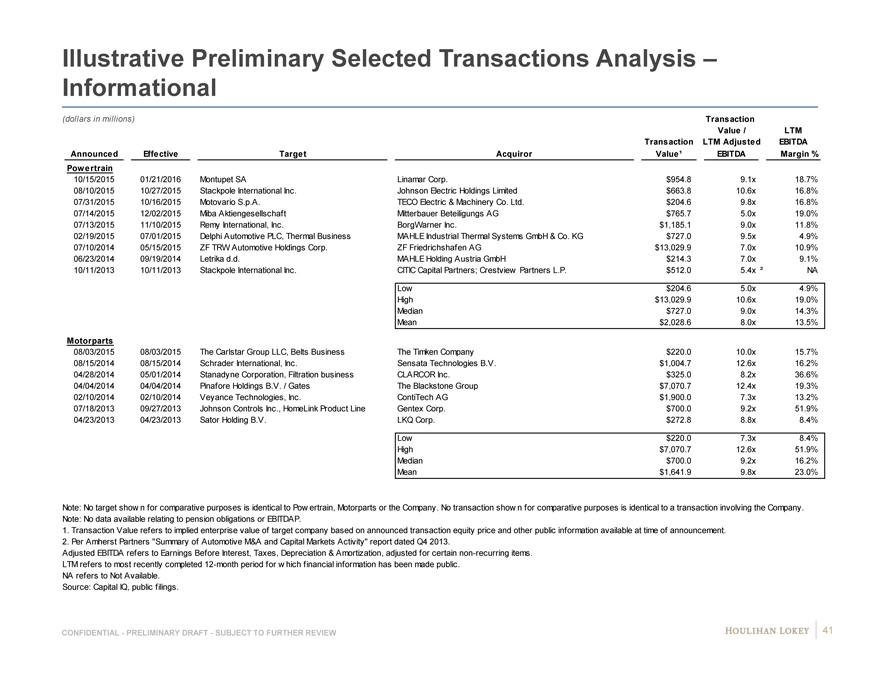
Illustrative Preliminary Selected Transactions Analysis –
Informational
(dollars in millions) Transaction
Value / LTM
Transaction LTM Adjusted EBITDA
Announced Effective Target Acquiror Value¹ EBITDA Margin %
Powertrain
10/15/2015 01/21/2016 Montupet SA Linamar Corp. $954.8 9.1x 18.7%
08/10/2015 10/27/2015 Stackpole International Inc. Johnson Electric Holdings Limited $663.8 10.6x 16.8%
07/31/2015 10/16/2015 Motovario S.p.A. TECO Electric & Machinery Co. Ltd. $204.6 9.8x 16.8%
07/14/2015 12/02/2015 Miba Aktiengesellschaft Mitterbauer Beteiligungs AG $765.7 5.0x 19.0%
07/13/2015 11/10/2015 Remy International, Inc. BorgWarner Inc. $1,185.1 9.0x 11.8%
02/19/2015 07/01/2015 Delphi Automotive PLC, Thermal Business MAHLE Industrial Thermal Systems GmbH & Co. KG $727.0 9.5x 4.9%
07/10/2014 05/15/2015 ZF TRW Automotive Holdings Corp. ZF Friedrichshafen AG $13,029.9 7.0x 10.9%
06/23/2014 09/19/2014 Letrika d.d. MAHLE Holding Austria GmbH $214.3 7.0x 9.1%
10/11/2013 10/11/2013 Stackpole International Inc. CITIC Capital Partners; Crestview Partners L.P. $512.0 5.4x ² NA N
Low $204.6 5.0x 4.9%
High $13,029.9 10.6x 19.0%
Median $727.0 9.0x 14.3%
Mean $2,028.6 8.0x 13.5%
Motorparts
08/03/2015 08/03/2015 The Carlstar Group LLC, Belts Business The Timken Company $220.0 10.0x 15.7%
08/15/2014 08/15/2014 Schrader International, Inc. Sensata Technologies B.V. $1,004.7 12.6x 16.2%
04/28/2014 05/01/2014 Stanadyne Corporation, Filtration business CLARCOR Inc. $325.0 8.2x 36.6%
04/04/2014 04/04/2014 Pinafore Holdings B.V. / Gates The Blackstone Group $7,070.7 12.4x 19.3%
02/10/2014 02/10/2014 Veyance Technologies, Inc. ContiTech AG $1,900.0 7.3x 13.2%
07/18/2013 09/27/2013 Johnson Controls Inc., HomeLink Product Line Gentex Corp. $700.0 9.2x 51.9%
04/23/2013 04/23/2013 Sator Holding B.V. LKQ Corp. $272.8 8.8x 8.4%
Low $220.0 7.3x 8.4%
High $7,070.7 12.6x 51.9%
Median $700.0 9.2x 16.2%
Mean $1,641.9 9.8x 23.0%
Note: No target show n for comparative purposes is identical to Pow ertrain, Motorparts or the Company. No transaction show n for comparative purposes is identical to a transaction involving the Company.
Note: No data available relating to pension obligations or EBITDAP.
1. Transaction Value refers to implied enterprise value of target company based on announced transaction equity price and other public information available at time of announcement.
2. Per Amherst Partners “Summary of Automotive M&A and Capital Markets Activity” report dated Q4 2013.
Adjusted EBITDA refers to Earnings Before Interest, Taxes, Depreciation & Amortization, adjusted for certain non-recurring items.
LTM refers to most recently completed 12-month period for w hich financial information has been made public.
NA refers to Not Available.
Source: Capital IQ, public filings.
CONFIDENTIAL—PRELIMINARY DRAFT—SUBJECT TO FURTHER REVIEW 41
|
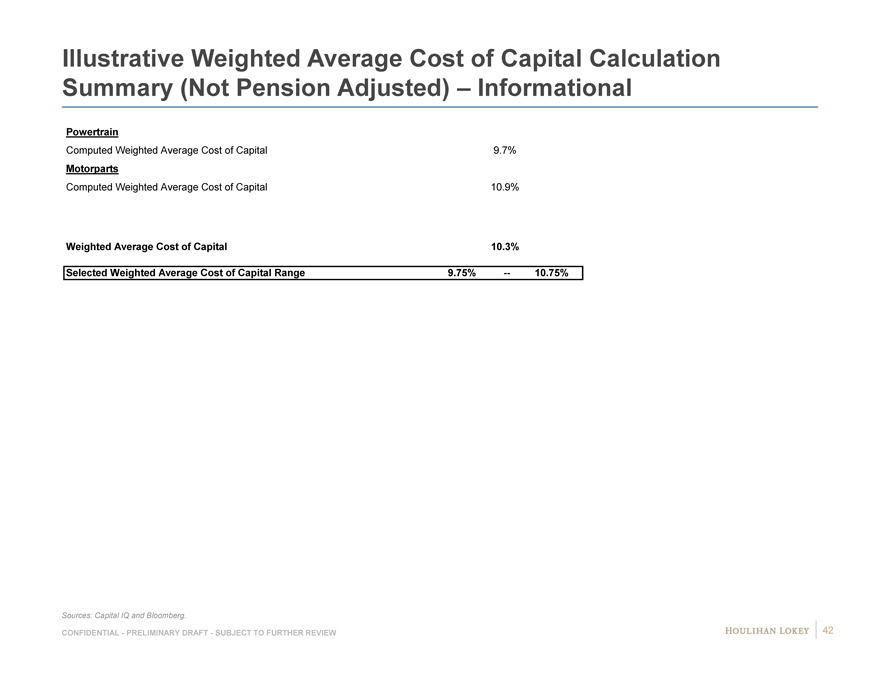
Illustrative Weighted Average Cost of Capital Calculation
Summary (Not Pension Adjusted) – Informational
Powertrain
Computed Weighted Average Cost of Capital 9.7%
Motorparts
Computed Weighted Average Cost of Capital 10.9%
Weighted Average Cost of Capital 10.3%
Selected Weighted Average Cost of Capital Range 9.75% — 10.75%
Sources: Capital IQ and Bloomberg.
CONFIDENTIAL—PRELIMINARY DRAFT—SUBJECT TO FURTHER REVIEW 42
|
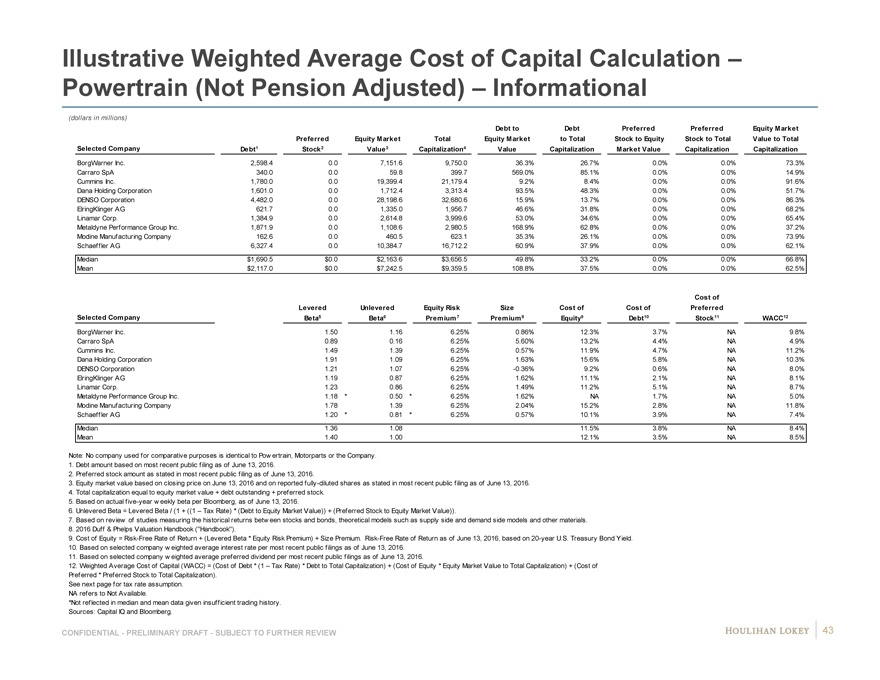
Illustrative Weighted Average Cost of Capital Calculation –
Powertrain (Not Pension Adjusted) – Informational
(dollars in millions)
Debt to Debt Preferred Preferred Equity Market
Preferred Equity Market Total Equity Market to Total Stock to Equity Stock to Total Value to Total
Selected Company Debt1 Stock2 Value3 Capitalization4 Value Capitalization Market Value Capitalization Capitalization
BorgWarner Inc. 2,598.4 # 0.0 # 7,151.6 # 9,750.0 # 36.3% # 26.7% # 0.0% # 0.0% # 73.3%
Carraro SpA 340.0 # 0.0 # 59.8 # 399.7 # 569.0% # 85.1% # 0.0% # 0.0% # 14.9%
Cummins Inc. 1,780.0 # 0.0 # 19,399.4 # 21,179.4 # 9.2% # 8.4% # 0.0% # 0.0% # 91.6%
Dana Holding Corporation 1,601.0 # 0.0 # 1,712.4 # 3,313.4 # 93.5% # 48.3% # 0.0% # 0.0% # 51.7%
DENSO Corporation 4,482.0 # 0.0 # 28,198.6 # 32,680.6 # 15.9% # 13.7% # 0.0% # 0.0% # 86.3%
ElringKlinger AG 621.7 # 0.0 # 1,335.0 # 1,956.7 # 46.6% # 31.8% # 0.0% # 0.0% # 68.2%
Linamar Corp. 1,384.9 # 0.0 # 2,614.8 # 3,999.6 # 53.0% # 34.6% # 0.0% # 0.0% # 65.4%
Metaldyne Performance Group Inc. 1,871.9 # 0.0 # 1,108.6 # 2,980.5 # 168.9% # 62.8% # 0.0% # 0.0% # 37.2%
Modine Manufacturing Company 162.6 # 0.0 # 460.5 # 623.1 # 35.3% # 26.1% # 0.0% # 0.0% # 73.9%
Schaeffler AG 6,327.4 # 0.0 # 10,384.7 # 16,712.2 # 60.9% # 37.9% # 0.0% # 0.0% # 62.1%
Median $ 1,690.5 $ 0.0 $ 2,163.6 $ 3,656.5 49.8% 33.2% 0.0% 0.0% 66.8%
Mean $ 2,117.0 $ 0.0 $ 7,242.5 $ 9,359.5 108.8% 37.5% 0.0% 0.0% 62.5%
Cost of
Levered Unlevered Equity Risk Size Cost of Cost of Preferred
Selected Company Beta5 Beta6 Premium 7 Premium 8 Equity9 Debt10 Stock11 WACC12
BorgWarner Inc. 1.50 # 1.16 # 6.25% 0.86% 12.3% # 3.7% # NA # 9.8%
Carraro SpA 0.89 # 0.16 # 6.25% 5.60% 13.2% # 4.4% # NA # 4.9%
Cummins Inc. 1.49 # 1.39 # 6.25% 0.57% 11.9% # 4.7% # NA # 11.2%
Dana Holding Corporation 1.91 # 1.09 # 6.25% 1.63% 15.6% # 5.8% # NA # 10.3%
DENSO Corporation 1.21 # 1.07 # 6.25% -0.36% 9.2% # 0.6% # NA # 8.0%
ElringKlinger AG 1.19 # 0.87 # 6.25% 1.62% 11.1% # 2.1% # NA # 8.1%
Linamar Corp. 1.23 # 0.86 # 6.25% 1.49% 11.2% # 5.1% # NA # 8.7%
Metaldyne Performance Group Inc. 1.18* 0.50* 6.25% 1.62% NA # 1.7% # NA # 5.0%
Modine Manufacturing Company 1.78 # 1.39 # 6.25% 2.04% 15.2% # 2.8% # NA # 11.8%
Schaeffler AG 1.20* 0.81* 6.25% 0.57% 10.1% # 3.9% # NA # 7.4%
Median 1.36 1.08 11.5% 3.8% NA 8.4%
Mean 1.40 1.00 12.1% 3.5% NA 8.5%
Note: No company used for comparative purposes is identical to Pow ertrain, Motorparts or the Company.
1. Debt amount based on most recent public filing as of June 13, 2016.
2. Preferred stock amount as stated in most recent public filing as of June 13, 2016.
3. Equity market value based on closing price on June 13, 2016 and on reported fully-diluted shares as stated in most recent public filing as of June 13, 2016.
4. Total capitalization equal to equity market value + debt outstanding + preferred stock.
5. Based on actual five-year w eekly beta per Bloomberg, as of June 13, 2016.
6. Unlevered Beta = Levered Beta / (1 + ((1 – Tax Rate) * (Debt to Equity Market Value)) + (Preferred Stock to Equity Market Value)).
7. Based on review of studies measuring the historical returns betw een stocks and bonds, theoretical models such as supply side and demand side models and other materials.
8. 2016 Duff & Phelps Valuation Handbook (“Handbook”).
9. Cost of Equity = Risk-Free Rate of Return + (Levered Beta * Equity Risk Premium) + Size Premium. Risk-Free Rate of Return as of June 13, 2016, based on 20-year U.S. Treasury Bond Yield.
10. Based on selected company w eighted average interest rate per most recent public filings as of June 13, 2016.
11. Based on selected company w eighted average preferred dividend per most recent public filings as of June 13, 2016.
12. Weighted Average Cost of Capital (WACC) = (Cost of Debt * (1 – Tax Rate) * Debt to Total Capitalization) + (Cost of Equity * Equity Market Value to Total Capitalization) + (Cost of
Preferred * Preferred Stock to Total Capitalization).
See next page for tax rate assumption.
NA refers to Not Available.
*Not reflected in median and mean data given insufficient trading history.
Sources: Capital IQ and Bloomberg.
CONFIDENTIAL—PRELIMINARY DRAFT—SUBJECT TO FURTHER REVIEW 43
|
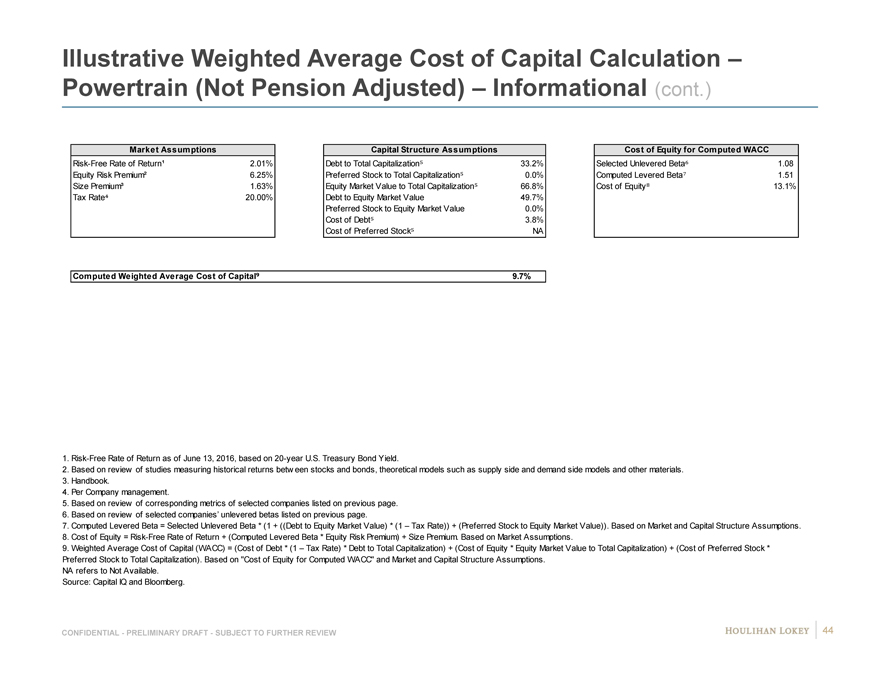
Illustrative Weighted Average Cost of Capital Calculation –Powertrain (Not Pension Adjusted) – Informational (cont.)
Market Assumptions
Risk-Free Rate of Return¹ 2.01%
Equity Risk Premium² 6.25%
Size Premium³ 1.63%
Tax Rate 20.00%
Capital Structure Assumptions
Debt to Total Capitalization 33.2%
Preferred Stock to Total Capitalization 0.0%
Equity Market Value to Total Capitalization 66.8%
Debt to Equity Market Value 49.7%
Preferred Stock to Equity Market Value 0.0%
Cost of Debt 3.8%
Cost of Preferred Stock NA
Cost of Equity for Computed WACC
Selected Unlevered Beta 1.08
Computed Levered Beta 1.51
Cost of Equity 13.1%
Computed Weighted Average Cost of Capital 9.7%
1. Risk-Free Rate of Return as of June 13, 2016, based on 20-year U.S. Treasury Bond Yield.
2. Based on review of studies measuring historical returns betw een stocks and bonds, theoretical models such as supply side and demand side models and other materials.
3. Handbook.
4. Per Company management.
5. Based on review of corresponding metrics of selected companies listed on previous page.
6. Based on review of selected companies’ unlevered betas listed on previous page.
7. Computed Levered Beta = Selected Unlevered Beta * (1 + ((Debt to Equity Market Value) * (1 – Tax Rate)) + (Preferred Stock to Equity Market Value)). Based on Market and Capital Structure Assumptions.
8. Cost of Equity = Risk-Free Rate of Return + (Computed Levered Beta * Equity Risk Premium) + Size Premium. Based on Market Assumptions.
9. Weighted Average Cost of Capital (WACC) = (Cost of Debt * (1 – Tax Rate) * Debt to Total Capitalization) + (Cost of Equity * Equity Market Value to Total Capitalization) + (Cost of Preferred Stock * Preferred Stock to Total Capitalization). Based on “Cost of Equity for Computed WACC” and Market and Capital Structure Assumptions.
NA refers to Not Available. Source: Capital IQ and Bloomberg.
CONFIDENTIAL—PRELIMINARY DRAFT—SUBJECT TO FURTHER REVIEW 44
|
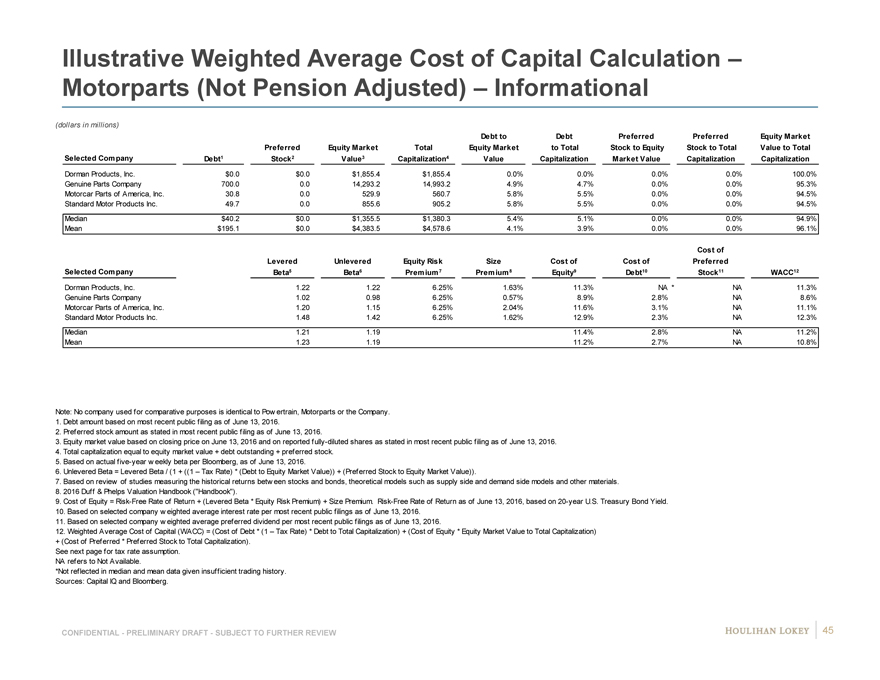
Illustrative Weighted Average Cost of Capital Calculation –
Motorparts (Not Pension Adjusted) – Informational
(dollars in millions)
Debt to Debt Preferred Preferred Equity Market
Preferred Equity Market Total Equity Market to Total Stock to Equity Stock to Total Value to Total
Selected Company Debt1 Stock2 Value3 Capitalization4 Value Capitalization Market Value Capitalization Capitalization
Dorman Products, Inc. $0.0 # $0.0 # $1,855.4 # $1,855.4 # 0.0% # 0.0% # 0.0% # 0.0% # 100.0%
Genuine Parts Company 700.0 # 0.0 # 14,293.2 # 14,993.2 # 4.9% # 4.7% # 0.0% # 0.0% # 95.3%
Motorcar Parts of America, Inc. 30.8 # 0.0 # 529.9 # 560.7 # 5.8% # 5.5% # 0.0% # 0.0% # 94.5%
Standard Motor Products Inc. 49.7 # 0.0 # 855.6 # 905.2 # 5.8% # 5.5% # 0.0% # 0.0% # 94.5%
Median $40.2 $0.0 $1,355.5 $1,380.3 5.4% 5.1% 0.0% 0.0% 94.9%
Mean $195.1 $0.0 $4,383.5 $4,578.6 4.1% 3.9% 0.0% 0.0% 96.1%
Cost of
Levered Unlevered Equity Risk Size Cost of Cost of Preferred
Selected Company Beta5 Beta6 Premium 7 Premium 8 Equity9 Debt10 Stock11 WACC12
Dorman Products, Inc. 1.22 # 1.22 # 6.25% 1.63% 11.3% # NA * NA # 11.3%
Genuine Parts Company 1.02 # 0.98 # 6.25% 0.57% 8.9% # 2.8% # NA # 8.6%
Motorcar Parts of America, Inc. 1.20 # 1.15 # 6.25% 2.04% 11.6% # 3.1% # NA # 11.1%
Standard Motor Products Inc. 1.48 # 1.42 # 6.25% 1.62% 12.9% # 2.3% # NA # 12.3%
Median 1.21 1.19 11.4% 2.8% NA 11.2%
Mean 1.23 1.19 11.2% 2.7% NA 10.8%
Note: No company used for comparative purposes is identical to Pow ertrain, Motorparts or the Company.
1. Debt amount based on most recent public filing as of June 13, 2016.
2. Preferred stock amount as stated in most recent public filing as of June 13, 2016.
3. Equity market value based on closing price on June 13, 2016 and on reported fully-diluted shares as stated in most recent public filing as of June 13, 2016.
4. Total capitalization equal to equity market value + debt outstanding + preferred stock.
5. Based on actual five-year w eekly beta per Bloomberg, as of June 13, 2016.
6. Unlevered Beta = Levered Beta / (1 + ((1 – Tax Rate) * (Debt to Equity Market Value)) + (Preferred Stock to Equity Market Value)).
7. Based on review of studies measuring the historical returns betw een stocks and bonds, theoretical models such as supply side and demand side models and other materials.
8. 2016 Duff & Phelps Valuation Handbook (“Handbook”).
9. Cost of Equity = Risk-Free Rate of Return + (Levered Beta * Equity Risk Premium) + Size Premium. Risk-Free Rate of Return as of June 13, 2016, based on 20-year U.S. Treasury Bond Yield.
10. Based on selected company w eighted average interest rate per most recent public filings as of June 13, 2016.
11. Based on selected company w eighted average preferred dividend per most recent public filings as of June 13, 2016.
12. Weighted Average Cost of Capital (WACC) = (Cost of Debt * (1 – Tax Rate) * Debt to Total Capitalization) + (Cost of Equity * Equity Market Value to Total Capitalization)
+ (Cost of Preferred * Preferred Stock to Total Capitalization).
See next page for tax rate assumption.
NA refers to Not Available.
*Not reflected in median and mean data given insufficient trading history.
Sources: Capital IQ and Bloomberg.
CONFIDENTIAL—PRELIMINARY DRAFT—SUBJECT TO FURTHER REVIEW 45
|
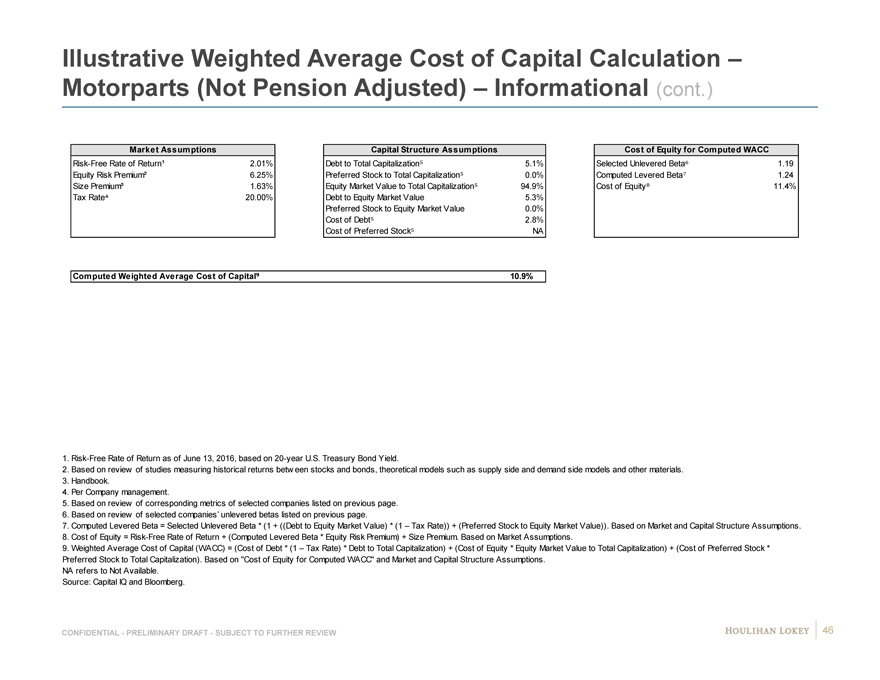
Illustrative Weighted Average Cost of Capital Calculation –
Motorparts (Not Pension Adjusted) – Informational (cont.)
Market Assumptions
Risk-Free Rate of Return¹ 2.01%
Equity Risk Premium² 6.25%
Size Premium³ 1.63%
Tax Rate 20.00%
Capital Structure Assumptions
Debt to Total Capitalization 5.1%
Preferred Stock to Total Capitalization 0.0%
Equity Market Value to Total Capitalization 94.9%
Debt to Equity Market Value 5.3%
Preferred Stock to Equity Market Value 0.0%
Cost of Debt 2.8%
Cost of Preferred Stock NA
Cost of Equity for Computed WACC
Selected Unlevered Beta 1.19
Computed Levered Beta 1.24
Cost of Equity 11.4%
Computed Weighted Average Cost of Capital 10.9%
1. Risk-Free Rate of Return as of June 13, 2016, based on 20-year U.S. Treasury Bond Yield.
2. Based on review of studies measuring historical returns betw een stocks and bonds, theoretical models such as supply side and demand side models and other materials.
3. Handbook.
4. Per Company management.
5. Based on review of corresponding metrics of selected companies listed on previous page.
6. Based on review of selected companies’ unlevered betas listed on previous page.
7. Computed Levered Beta = Selected Unlevered Beta * (1 + ((Debt to Equity Market Value) * (1 – Tax Rate)) + (Preferred Stock to Equity Market Value)). Based on Market and Capital Structure Assumptions.
8. Cost of Equity = Risk-Free Rate of Return + (Computed Levered Beta * Equity Risk Premium) + Size Premium. Based on Market Assumptions.
9. Weighted Average Cost of Capital (WACC) = (Cost of Debt * (1 – Tax Rate) * Debt to Total Capitalization) + (Cost of Equity * Equity Market Value to Total Capitalization) + (Cost of Preferred Stock *
Preferred Stock to Total Capitalization). Based on “Cost of Equity for Computed WACC” and Market and Capital Structure Assumptions.
NA refers to Not Available.
Source: Capital IQ and Bloomberg.
CONFIDENTIAL—PRELIMINARY DRAFT—SUBJECT TO FURTHER REVIEW 46
|
Page
1. Selected Public Market Observations 3
2. Preliminary Financial Analyses 7
3. Appendix 17
Cost of Capital Considerations 18 Benchmarking 24 Company Financial Performance Observations 28 Premiums Paid Observations 32 Illustrative Preliminary Financial Analyses (EBITDA) 35 Selected Excerpt from June 1, 2016 Preliminary Discussion Materials: 47 Items Subject to Further Review Selected Excerpts from May 11, 2016 / June 1, 2016 Preliminary 49 Discussion Materials: Illustrative Sensitivities
4. Disclaimer 53
|
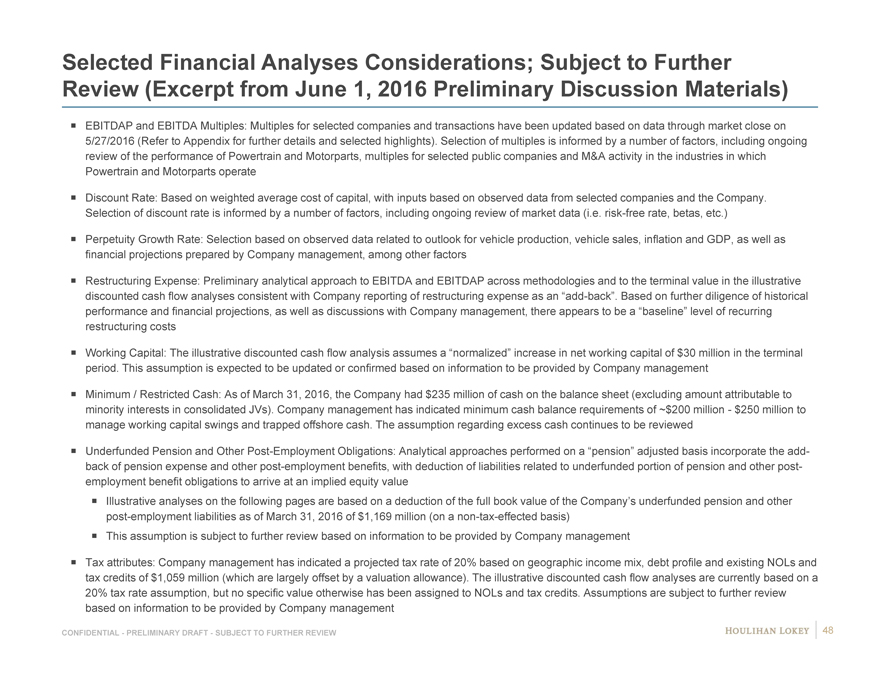
Selected Financial Analyses Considerations; Subject to Further Review (Excerpt from June 1, 2016 Preliminary Discussion Materials)
EBITDAP and EBITDA Multiples: Multiples for selected companies and transactions have been updated based on data through market close on 5/27/2016 (Refer to Appendix for further details and selected highlights). Selection of multiples is informed by a number of factors, including ongoing review of the performance of Powertrain and Motorparts, multiples for selected public companies and M&A activity in the industries in which Powertrain and Motorparts operate
Discount Rate: Based on weighted average cost of capital, with inputs based on observed data from selected companies and the Company. Selection of discount rate is informed by a number of factors, including ongoing review of market data (i.e. risk-free rate, betas, etc.)
Perpetuity Growth Rate: Selection based on observed data related to outlook for vehicle production, vehicle sales, inflation and GDP, as well as financial projections prepared by Company management, among other factors
Restructuring Expense: Preliminary analytical approach to EBITDA and EBITDAP across methodologies and to the terminal value in the illustrative discounted cash flow analyses consistent with Company reporting of restructuring expense as an “add-back”. Based on further diligence of historical performance and financial projections, as well as discussions with Company management, there appears to be a “baseline” level of recurring restructuring costs
Working Capital: The illustrative discounted cash flow analysis assumes a “normalized” increase in net working capital of $30 million in the terminal period. This assumption is expected to be updated or confirmed based on information to be provided by Company management
Minimum / Restricted Cash: As of March 31, 2016, the Company had $235 million of cash on the balance sheet (excluding amount attributable to minority interests in consolidated JVs). Company management has indicated minimum cash balance requirements of ~$200 million—$250 million to manage working capital swings and trapped offshore cash. The assumption regarding excess cash continues to be reviewed
Underfunded Pension and Other Post-Employment Obligations: Analytical approaches performed on a “pension” adjusted basis incorporate the add-back of pension expense and other post-employment benefits, with deduction of liabilities related to underfunded portion of pension and other post-employment benefit obligations to arrive at an implied equity value Illustrative analyses on the following pages are based on a deduction of the full book value of the Company’s underfunded pension and other post-employment liabilities as of March 31, 2016 of $1,169 million (on a non-tax-effected basis) This assumption is subject to further review based on information to be provided by Company management
Tax attributes: Company management has indicated a projected tax rate of 20% based on geographic income mix, debt profile and existing NOLs and tax credits of $1,059 million (which are largely offset by a valuation allowance). The illustrative discounted cash flow analyses are currently based on a 20% tax rate assumption, but no specific value otherwise has been assigned to NOLs and tax credits. Assumptions are subject to further review based on information to be provided by Company management
CONFIDENTIAL—PRELIMINARY DRAFT—SUBJECT TO FURTHER REVIEW 48
|
Page
1. Selected Public Market Observations 3
2. Preliminary Financial Analyses 7
3. Appendix 17 Cost of Capital Considerations 18 Benchmarking 24 Company Financial Performance Observations 28 Premiums Paid Observations 32 Illustrative Preliminary Financial Analyses (EBITDA) 35 Selected Excerpt from June 1, 2016 Preliminary Discussion Materials: 47 Items Subject to Further Review Selected Excerpts from May 11, 2016 / June 1, 2016 Preliminary 49 Discussion Materials: Illustrative Sensitivities
4. Disclaimer 53
|
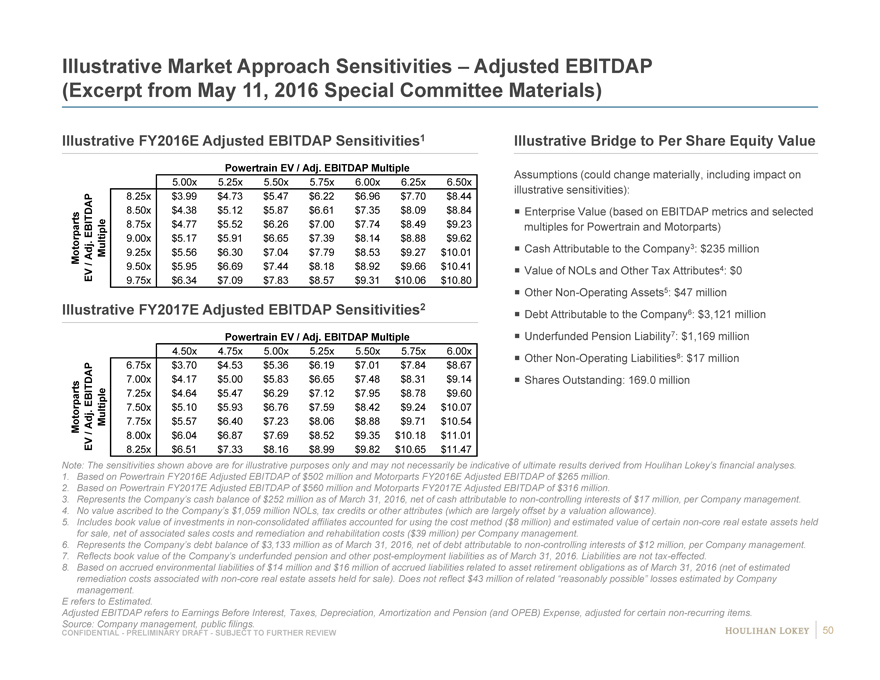
Illustrative Market Approach Sensitivities – Adjusted EBITDAP (Excerpt from May 11, 2016 Special Committee Materials)
Illustrative FY2016E Adjusted EBITDAP Sensitivities1
Powertrain EV / Adj. EBITDAP Multiple
$8.85 |
| 5.00x 5.25x 5.50x 5.75x 6.00x 6.25x 6.50x |
8.25x |
| $3.99 $4.73 $5.47 $6.22 $6.96 $7.70 $8.44 |
8.50x |
| $4.38 $5.12 $5.87 $6.61 $7.35 $8.09 $8.84 |
EBITDAP 8.75x $4.77 $5.52 $6.26 $7.00 $7.74 $8.49 $9.23
. 9.00x $5.17 $5.91 $6.65 $7.39 $8.14 $8.88 $9.62
Motorparts Adj Multiple 9.25x $5.56 $6.30 $7.04 $7.79 $8.53 $9.27 $10.01
/ 9.50x $5.95 $6.69 $7.44 $8.18 $8.92 $9.66 $10.41
EV 9.75x $6.34 $7.09 $7.83 $8.57 $9.31 $10.06 $10.80
Illustrative FY2017E Adjusted EBITDAP Sensitivities2
Powertrain EV / Adj. EBITDAP Multiple
$11.94 |
| 4.50x 4.75x 5.00x 5.25x 5.50x 5.75x 6.00x |
6.75x |
| $3.70 $4.53 $5.36 $6.19 $7.01 $7.84 $8.67 |
7.00x |
| $4.17 $5.00 $5.83 $6.65 $7.48 $8.31 $9.14 |
EBITDAP 7.25x $4.64 $5.47 $6.29 $7.12 $7.95 $8.78 $9.60
. 7.50x $5.10 $5.93 $6.76 $7.59 $8.42 $9.24 $10.07
Motorparts Adj Multiple 7.75x $5.57 $6.40 $7.23 $8.06 $8.88 $9.71 $10.54
/ 8.00x $6.04 $6.87 $7.69 $8.52 $9.35 $10.18 $11.01
EV 8.25x $6.51 $7.33 $8.16 $8.99 $9.82 $10.65 $11.47
Illustrative Bridge to Per Share Equity Value
Assumptions (could change materially, including impact on illustrative sensitivities): Enterprise Value (based on EBITDAP metrics and selected multiples for Powertrain and Motorparts) Cash Attributable to the Company3: $235 million Value of NOLs and Other Tax Attributes4: $0 Other Non-Operating Assets5: $47 million Debt Attributable to the Company6: $3,121 million Underfunded Pension Liability7: $1,169 million Other Non-Operating Liabilities8: $17 million Shares Outstanding: 169.0 million
Note: The sensitivities shown above are for illustrative purposes only and may not necessarily be indicative of ultimate results derived from Houlihan Lokey’s financial analyses.
1. Based on Powertrain FY2016E Adjusted EBITDAP of $502 million and Motorparts FY2016E Adjusted EBITDAP of $265 million.
2. Based on Powertrain FY2017E Adjusted EBITDAP of $560 million and Motorparts FY2017E Adjusted EBITDAP of $316 million.
3. Represents the Company’s cash balance of $252 million as of March 31, 2016, net of cash attributable to non-controlling interests of $17 million, per Company management.
4. No value ascribed to the Company’s $1,059 million NOLs, tax credits or other attributes (which are largely offset by a valuation allowance).
5. Includes book value of investments in non-consolidated affiliates accounted for using the cost method ($8 million) and estimated value of certain non-core real estate assets held for sale, net of associated sales costs and remediation and rehabilitation costs ($39 million) per Company management.
6. Represents the Company’s debt balance of $3,133 million as of March 31, 2016, net of debt attributable to non-controlling interests of $12 million, per Company management.
7. Reflects book value of the Company’s underfunded pension and other post-employment liabilities as of March 31, 2016. Liabilities are not tax-effected.
8. Based on accrued environmental liabilities of $14 million and $16 million of accrued liabilities related to asset retirement obligations as of March 31, 2016 (net of estimated remediation costs associated with non-core real estate assets held for sale). Does not reflect $43 million of related “reasonably possible” losses estimated by Company management.
E refers to Estimated.
Adjusted EBITDAP refers to Earnings Before Interest, Taxes, Depreciation, Amortization and Pension (and OPEB) Expense, adjusted for certain non-recurring items. Source: Company management, public filings.
CONFIDENTIAL—PRELIMINARY DRAFT—SUBJECT TO FURTHER REVIEW 50
|
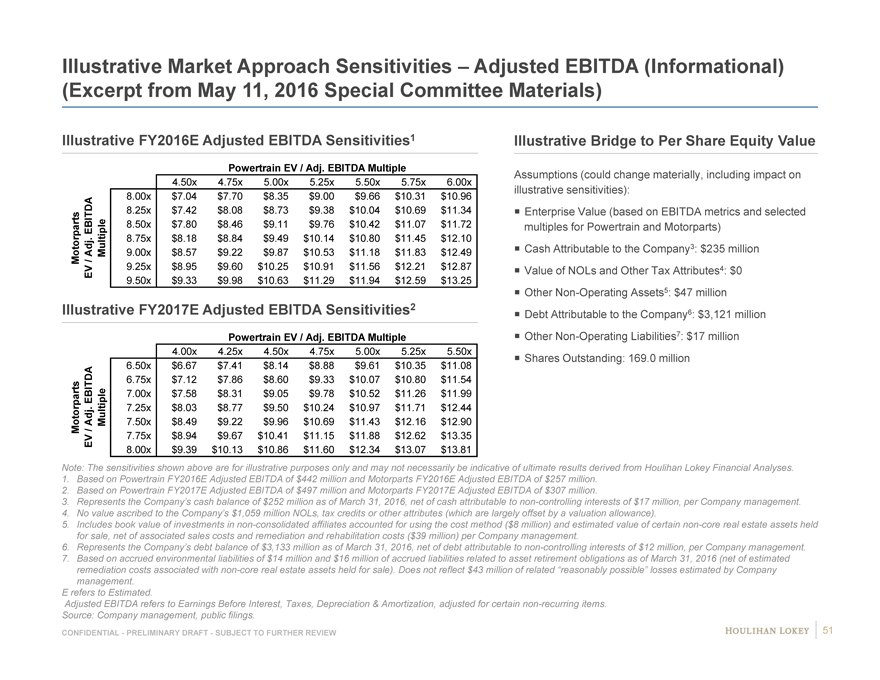
Illustrative Market Approach Sensitivities Adjusted EBITDA (Informational) (Excerpt from May 11, 2016 Special Committee Materials)
Illustrative FY2016E Adjusted EBITDA Sensitivities1
Powertrain EV / Adj. EBITDA Multiple
$8.85 4.50x 4.75x 5.00x 5.25x 5.50x 5.75x 6.00x
8.00x $7.04 $7.70 $8.35 $9.00 $9.66 $ 10.31 $ 10.96
8.25x $7.42 $8.08 $8.73 $9.38 $10.04 $ 10.69 $ 11.34
EBITDA 8.50x $7.80 $8.46 $9.11 $9.76 $10.42 $ 11.07 $ 11.72
Adj. 8.75x $8.18 $8.84 $9.49 $10.14 $10.80 $ 11.45 $ 12.10
9.00x $8.57 $9.22 $9.87 $10.53 $11.18 $ 11.83 $ 12.49
Motorparts / Multiple
EV 9.25x $8.95 $9.60 $10.25 $10.91 $11.56 $ 12.21 $ 12.87
9.50x $9.33 $9.98 $10.63 $11.29 $11.94 $ 12.59 $ 13.25
Illustrative FY2017E Adjusted EBITDA Sensitivities2
Powertrain EV / Adj. EBITDA Multiple
$16.18 4.00x 4.25x 4.50x 4.75x 5.00x 5.25x 5.50x
6.50x $6.67 $7.41 $8.14 $8.88 $9.61 $ 10.35 $ 11.08
6.75x $7.12 $7.86 $8.60 $9.33 $10.07 $ 10.80 $ 11.54
EBITDA 7.00x $7.58 $8.31 $9.05 $9.78 $10.52 $ 11.26 $ 11.99
. 7.25x $8.03 $8.77 $9.50 $10.24 $10.97 $ 11.71 $ 12.44
Adj 7.50x $8.49 $9.22 $9.96 $10.69 $11.43 $ 12.16 $ 12.90
Motorparts / Multiple
EV 7.75x $8.94 $9.67 $10.41 $11.15 $11.88 $ 12.62 $ 13.35
8.00x $9.39 $10.13 $10.86 $11.60 $12.34 $ 13.07 $ 13.81
Illustrative Bridge to Per Share Equity Value
Assumptions (could change materially, including impact on illustrative sensitivities): Enterprise Value (based on EBITDA metrics and selected multiples for Powertrain and Motorparts) Cash Attributable to the Company3: $235 million Value of NOLs and Other Tax Attributes4: $0 Other Non-Operating Assets5: $47 million Debt Attributable to the Company6: $3,121 million Other Non-Operating Liabilities7: $17 million Shares Outstanding: 169.0 million
Note: The sensitivities shown above are for illustrative purposes only and may not necessarily be indicative of ultimate results derived from Houlihan Lokey Financial Analyses.
1. Based on Powertrain FY2016E Adjusted EBITDA of $442 million and Motorparts FY2016E Adjusted EBITDA of $257 million.
2. Based on Powertrain FY2017E Adjusted EBITDA of $497 million and Motorparts FY2017E Adjusted EBITDA of $307 million.
3. Represents the Company’s cash balance of $252 million as of March 31, 2016, net of cash attributable to non-controlling interests of $17 million, per Company management.
4. No value ascribed to the Company’s $1,059 million NOLs, tax credits or other attributes (which are largely offset by a valuation allowance).
5. Includes book value of investments in non-consolidated affiliates accounted for using the cost method ($8 million) and estimated value of certain non-core real estate assets held for sale, net of associated sales costs and remediation and rehabilitation costs ($39 million) per Company management.
6. Represents the Company’s debt balance of $3,133 million as of March 31, 2016, net of debt attributable to non-controlling interests of $12 million, per Company management.
7. Based on accrued environmental liabilities of $14 million and $16 million of accrued liabilities related to asset retirement obligations as of March 31, 2016 (net of estimated remediation costs associated with non-core real estate assets held for sale). Does not reflect $43 million of related “reasonably possible” losses estimated by Company management.
E refers to Estimated.
Adjusted EBITDA refers to Earnings Before Interest, Taxes, Depreciation & Amortization, adjusted for certain non-recurring items. Source: Company management, public filings.
CONFIDENTIAL—PRELIMINARY DRAFT—SUBJECT TO FURTHER REVIEW 51
|
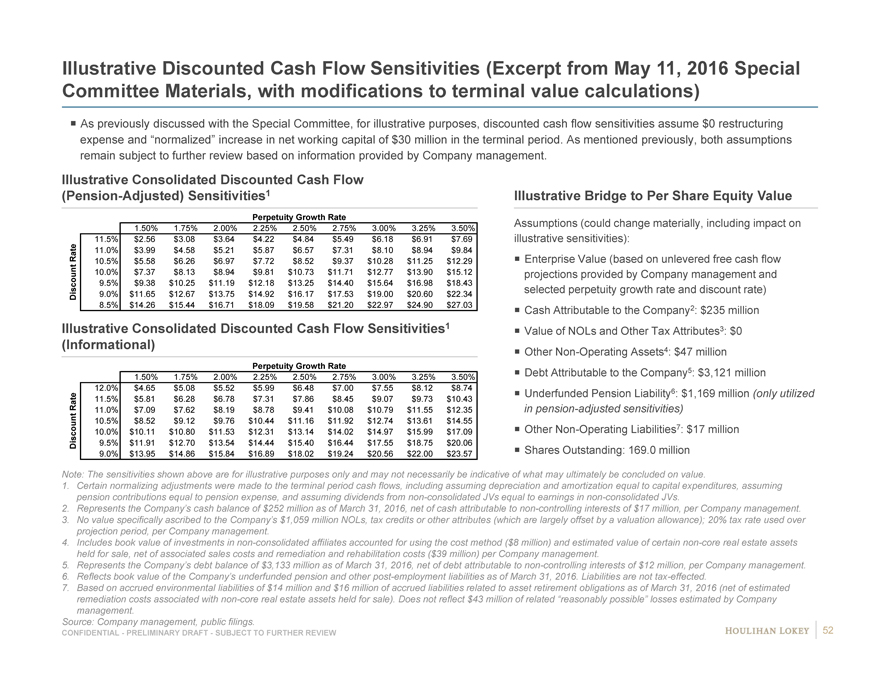
Illustrative Discounted Cash Flow Sensitivities (Excerpt from May 11, 2016 Special Committee Materials, with modifications to terminal value calculations)
As previously discussed with the Special Committee, for illustrative purposes, discounted cash flow sensitivities assume $0 restructuring expense and “normalized” increase in net working capital of $30 million in the terminal period. As mentioned previously, both assumptions remain subject to further review based on information provided by Company management.
Illustrative Consolidated Discounted Cash Flow
(Pension-Adjusted) Sensitivities1
Perpetuity Growth Rate
1.50% 1.75% 2.00% 2.25% 2.50% 2.75% 3.00% 3.25% 3.50%
11.5% $2.56 $3.08 $3.64 $4.22 $4.84 $5.49 $6.18 $6.91 $7.69
Rate 11.0% $3.99 $4.58 $5.21 $5.87 $6.57 $7.31 $8.10 $8.94 $9.84
10.5% $5.58 $6.26 $6.97 $7.72 $8.52 $9.37 $10.28 $11.25 $12.29
10.0% $7.37 $8.13 $8.94 $9.81 $10.73 $11.71 $12.77 $13.90 $15.12
9.5% $9.38 $10.25 $11.19 $12.18 $13.25 $14.40 $15.64 $16.98 $18.43
Discount 9.0% $11.65 $12.67 $13.75 $14.92 $16.17 $17.53 $19.00 $20.60 $22.34
8.5% $14.26 $15.44 $16.71 $18.09 $19.58 $21.20 $22.97 $24.90 $27.03
Illustrative Consolidated Discounted Cash Flow Sensitivities1
(Informational)
Perpetuity Growth Rate
1.50% 1.75% 2.00% 2.25% 2.50% 2.75% 3.00% 3.25% 3.50%
12.0% $4.65 $5.08 $5.52 $5.99 $6.48 $7.00 $7.55 $8.12 $8.74
Rate 11.5% $5.81 $6.28 $6.78 $7.31 $7.86 $8.45 $9.07 $9.73 $10.43
11.0% $7.09 $7.62 $8.19 $8.78 $9.41 $10.08 $10.79 $11.55 $12.35
10.5% $8.52 $9.12 $9.76 $10.44 $11.16 $11.92 $12.74 $13.61 $14.55
10.0% $10.11 $10.80 $11.53 $12.31 $13.14 $14.02 $14.97 $15.99 $17.09
Discount 9.5% $11.91 $12.70 $13.54 $14.44 $15.40 $16.44 $17.55 $18.75 $20.06
9.0% $13.95 $14.86 $15.84 $16.89 $18.02 $19.24 $20.56 $22.00 $23.57
Illustrative Bridge to Per Share Equity Value
Assumptions (could change materially, including impact on illustrative sensitivities): Enterprise Value (based on unlevered free cash flow projections provided by Company management and selected perpetuity growth rate and discount rate) Cash Attributable to the Company2: $235 million Value of NOLs and Other Tax Attributes3: $0 Other Non-Operating Assets4: $47 million Debt Attributable to the Company5: $3,121 million Underfunded Pension Liability6: $1,169 million (only utilized in pension-adjusted sensitivities)
Other Non-Operating Liabilities7: $17 million Shares Outstanding: 169.0 million
Note: The sensitivities shown above are for illustrative purposes only and may not necessarily be indicative of what may ultimately be concluded on value.
1. Certain normalizing adjustments were made to the terminal period cash flows, including assuming depreciation and amortization equal to capital expenditures, assuming pension contributions equal to pension expense, and assuming dividends from non-consolidated JVs equal to earnings in non-consolidated JVs.
2. Represents the Company’s cash balance of $252 million as of March 31, 2016, net of cash attributable to non-controlling interests of $17 million, per Company management.
3. No value specifically ascribed to the Company’s $1,059 million NOLs, tax credits or other attributes (which are largely offset by a valuation allowance); 20% tax rate used over projection period, per Company management.
4. Includes book value of investments in non-consolidated affiliates accounted for using the cost method ($8 million) and estimated value of certain non-core real estate assets held for sale, net of associated sales costs and remediation and rehabilitation costs ($39 million) per Company management.
5. Represents the Company’s debt balance of $3,133 million as of March 31, 2016, net of debt attributable to non-controlling interests of $12 million, per Company management.
6. Reflects book value of the Company’s underfunded pension and other post-employment liabilities as of March 31, 2016. Liabilities are not tax-effected.
7. Based on accrued environmental liabilities of $14 million and $16 million of accrued liabilities related to asset retirement obligations as of March 31, 2016 (net of estimated remediation costs associated with non-core real estate assets held for sale). Does not reflect $43 million of related “reasonably possible” losses estimated by Company management.
Source: Company management, public filings. 52
CONFIDENTIAL—PRELIMINARY DRAFT—SUBJECT TO FURTHER REVIEW
|
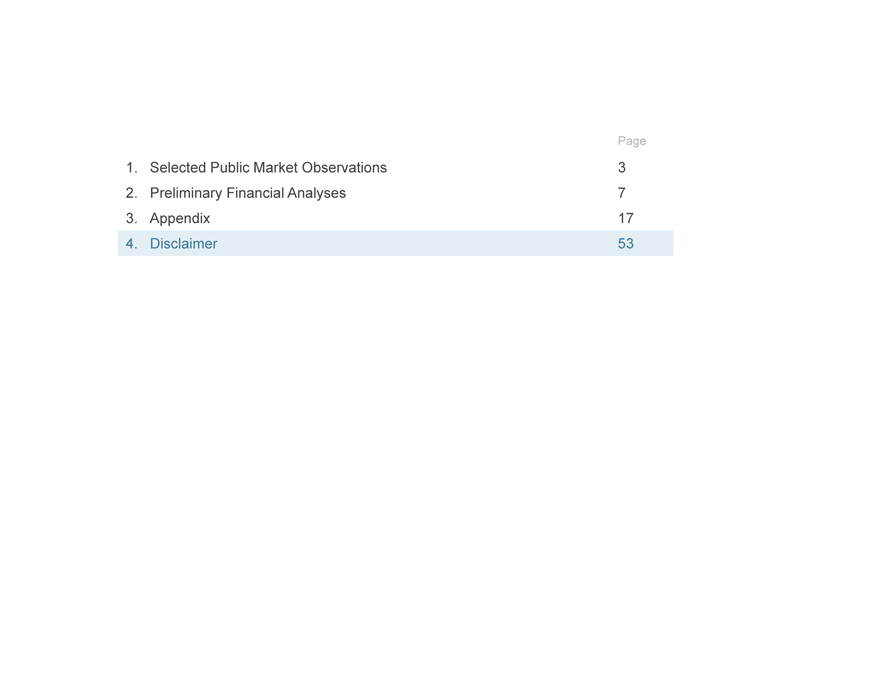
Page
1. Selected Public Market Observations 3
2. Preliminary Financial Analyses 7
3. Appendix 17
4. Disclaimer 53
|
Disclaimer
This presentation, and any supplemental information (written or oral) or other documents provided in connection therewith (collectively, the “materials”), are provided solely for the information of the Special Committee (the “Committee”) of the Board of Directors (the “Board”) of Federal-Mogul Holdings Corporation (“Piston” or the “Company”) by Houlihan Lokey in connection with the Committee’s consideration of a potential transaction (the “Transaction”) involving the Company. This presentation is incomplete without reference to, and should be considered in conjunction with, any supplemental information provided by and discussions with Houlihan Lokey in connection therewith. Any defined terms used herein shall have the meanings set forth herein, even if such defined terms have been given different meanings elsewhere in the materials.
The materials are for discussion purposes only. Houlihan Lokey expressly disclaims any and all liability which may be based on the materials and any errors therein or omissions therefrom. The materials were prepared for specific persons familiar with the business and affairs of the Company for use in a specific context and were not prepared with a view to public disclosure or to conform with any disclosure standards under any state, federal or international securities laws or other laws, rules or regulations, and none of the Committee, the Company or Houlihan Lokey takes any responsibility for the use of the materials by persons other than the Committee. The materials are provided on a confidential basis solely for the information of the Committee and may not be disclosed, summarized, reproduced, disseminated or quoted or otherwise referred to, in whole or in part, without Houlihan Lokey’s express prior written consent.
Notwithstanding any other provision herein, the Company (and each employee, representative or other agent of the Company) may disclose to any and all persons without limitation of any kind, the tax treatment and tax structure of any transaction and all materials of any kind (including opinions or other tax analyses, if any) that are provided to the Company relating to such tax treatment and structure. However, any information relating to the tax treatment and tax structure shall remain confidential (and the foregoing sentence shall not apply) to the extent necessary to enable any person to comply with securities laws. For this purpose, the tax treatment of a transaction is the purported or claimed U.S. income or franchise tax treatment of the transaction and the tax structure of a transaction is any fact that may be relevant to understanding the purported or claimed U.S. income or franchise tax treatment of the transaction. If the Company plans to disclose information pursuant to the first sentence of this paragraph, the Company shall inform those to whom it discloses any such information that they may not rely upon such information for any purpose without Houlihan Lokey’s prior written consent. Houlihan Lokey is not an expert on, and nothing contained in the materials should be construed as advice with regard to, legal, accounting, regulatory, insurance, tax or other specialist matters. Houlihan Lokey’s role in reviewing any information is limited solely to performing such a review as it shall deem necessary to support its own advice and analysis and shall not be on behalf of the Committee.
The materials necessarily are based on financial, economic, market and other conditions as in effect on, and the information available to Houlihan Lokey as of, the date of the materials. Although subsequent developments may affect the contents of the materials, Houlihan Lokey has not undertaken, and is under no obligation, to update, revise or reaffirm the materials, except as may be expressly contemplated by Houlihan Lokey’s engagement letter. The materials are not intended to provide the sole basis for evaluation of the Transaction and do not purport to contain all information that may be required. The materials do not address the underlying business decision of the Company or any other party to proceed with or effect the Transaction. The materials do not constitute any opinion, nor do the materials constitute a recommendation to the Board, the Committee, the Company, any security holder of the Company or any other party as to how to vote or act with respect to any matter relating to the Transaction or otherwise or whether to buy or sell any assets or securities of any company. Houlihan Lokey’s only opinion is the opinion, if any, that is actually delivered to the Committee. The materials may not reflect information known to other professionals in other business areas of Houlihan Lokey and its affiliates.
The preparation of the materials was a complex process involving quantitative and qualitative judgments and determinations with respect to the financial, comparative and other analytic methods employed and the adaption and application of these methods to the unique facts and circumstances presented and, therefore, is not readily susceptible to partial analysis or summary description. Furthermore, Houlihan Lokey did not attribute any particular weight to any analysis or factor considered by it, but rather made qualitative judgments as to the significance and relevance of each analysis and factor. Each analytical technique has inherent strengths and weaknesses, and the nature of the available information may further affect the value of particular techniques. Accordingly, the analyses contained in the materials must be considered as a whole. Selecting portions of the analyses, analytic methods and factors without considering all analyses and factors could create a misleading or incomplete view. The materials reflect judgments and assumptions with regard to industry performance, general business, economic, regulatory, market and financial conditions and other matters, many of which are beyond the control of the participants in the Transaction. Any estimates of value contained in the materials are not necessarily indicative of actual value or predictive of future results or values, which may be significantly more or less favorable. Any analyses relating to the value of assets, businesses or securities do not purport to be appraisals or to reflect the prices at which any assets, businesses or securities may actually be sold. The materials do not constitute a valuation opinion or credit rating. In preparing the materials, Houlihan Lokey has not conducted any physical inspection or independent appraisal or evaluation of any of the assets, properties or liabilities (contingent or otherwise) of the Company or any other party and has no obligation to evaluate the solvency of the Company or any other party under any law.
All budgets, projections, estimates, financial analyses, reports and other information with respect to operations (including estimates of potential cost savings and expenses) reflected in the materials have been prepared by management of the relevant party or are derived from such budgets, projections, estimates, financial analyses, reports and other information or from other sources, which involve numerous and significant subjective determinations made by management of the relevant party and/or which such management has reviewed and found reasonable. The budgets, projections and estimates contained in the materials may or may not be achieved and differences between projected results and those actually achieved may be material. Houlihan Lokey has relied upon representations made by management of the Company that such budgets, projections and estimates have been reasonably prepared in good faith on bases reflecting the best currently available estimates and judgments of such management (or, with respect to information obtained from public sources, represent reasonable estimates), and Houlihan Lokey expresses no opinion with respect to such budgets, projections or estimates or the assumptions on which they are based. The scope of the financial analysis contained herein is based on discussions with the Company (including, without limitation, regarding the methodologies to be utilized), and Houlihan Lokey does not make any representation, express or implied, as to the sufficiency or adequacy of such financial analysis or the scope thereof for any particular purpose.
Houlihan Lokey has assumed and relied upon the accuracy and completeness of the financial and other information provided to, discussed with or reviewed by it without (and without assuming responsibility for) independent verification of such information, makes no representation or warranty (express or implied) in respect of the accuracy or completeness of such information and has further relied upon the assurances of the Company that it is not aware of any facts or circumstances that would make such information inaccurate or misleading. In addition, Houlihan Lokey has relied upon and assumed, without independent verification, that there has been no change in the business, assets, liabilities, financial condition, results of operations, cash flows or prospects of the Company or any other participant in the Transaction since the respective dates of the most recent financial statements and other information, financial or otherwise, provided to Houlihan Lokey that would be material to its analyses , and that the final forms of any draft documents reviewed by Houlihan Lokey will not differ in any material respect from such draft documents.
The materials are not an offer to sell or a solicitation of an indication of interest to purchase any security, option, commodity, future, loan or currency. The materials do not constitute a commitment by Houlihan Lokey or any of its affiliates to underwrite, subscribe for or place any securities, to extend or arrange credit, or to provide any other services. In the ordinary course of business, certain of Houlihan Lokey’s affiliates and employees, as well as investment funds in which they may have financial interests or with which they may co-invest, may acquire, hold or sell, long or short positions, or trade or otherwise effect transactions, in debt, equity, and other securities and financial instruments (including loans and other obligations) of, or investments in, one or more parties that may be involved in the Transaction and their respective affiliates or any currency or commodity that may be involved in the Transaction. Houlihan Lokey provides mergers and acquisitions, restructuring and other advisory and consulting services to clients. Houlihan Lokey’s personnel may make statements or provide advice that is contrary to information contained in the materials. Houlihan Lokey’s or its affiliates’ proprietary interests may conflict with the Company’s interests. Houlihan Lokey may have advised, may seek to advise and may in the future advise one or more participants in the Transaction and/or other companies mentioned in the materials.
CONFIDENTIAL—PRELIMINARY DRAFT—SUBJECT TO FURTHER REVIEW 54
|
CORPORATE FINANCE
FINANCIAL ADVISORY SERVICES FINANCIAL RESTRUCTURING STRATEGIC CONSULTING
HL.com
55