LETTERTO SHAREHOLDERS
Dear Fellow Shareholder,
Rarely have investors witnessed market dislocation on the scale seen during the fiscal year ended March 31, 2009. The financial crisis that began with bank failures and a massive unwinding of debt pushed the global economy into a recession and sent stock prices sharply lower.
In this annual report, we review the performance of the financial markets and our mutual funds from April 1, 2008 through March 31, 2009. We also highlight some of the key factors that drove investment returns and share our outlook for the future.
In the United States, the S&P 500 Index fell 38.1%. Most of the decline occurred after the September collapse of the U.S. investment banking industry, which became overwhelmed by mortgage-related losses. The dramatic events triggered a sell-off in the stock and credit markets, which triggered write-downs and deleveraging in the financial system. Credit dried up and economic activity slowed, with GDP plunging at an annual rate of 6.3% in the fourth quarter of 2008 — the steepest drop since 1982. Policymakers took unprecedented steps to boost confidence in the financial system and economy, including cutting short-term interest rates from 2.25% to near zero. However, throughout the fall and winter, stock prices slid, credit remained tight and the recession that had started in 2007 deepened.
The picture was similarly bleak in developed markets overseas, where investors grappled with European bank failures and gloomy economic data. The euro zone fell into its first recession since the 1999 creation of the common currency, and the U.K. and Japanese economies also slipped into recession. The European Central Bank, Bank of England and Bank of Japan slashed their key interest rates to 1.5%, 0.5% and 0.1%, respectively. With little room for further cuts, U.K. and Japanese central bankers started purchasing government bonds to try to lower borrowing costs, a measure the U.S. Federal Reserve implemented as well. The MSCI EAFE Index lost 36.5% in local currencies and 46.2% in U.S. dollar terms. The dollar was essentially flat versus the yen but appreciated 16.1% and 27.8% versus the euro and pound, respectively. Dollar strength was due to a global flight to safety, while the yen benefited from the unwinding of carry trades — trades in which money had been borrowed at low Japanese interest rates to invest elsewhere at potentially higher returns.
In developing countries, the MSCI Emerging Markets Index fell 36.5% in local currencies and 46.9% in U.S. dollars. Emerging market equities were especially volatile due to rising risk aversion and deteriorating demand for commodity exports. As the global financial crisis unfolded, the Reuters/Jefferies CRB Index of nineteen commodities dropped approximately 53% from its July peak through the end of March. Recognizing that inflation was yesterday’s problem, governments in emerging countries joined their developed-market counterparts in trying to stimulate their economies. For example, China cut interest rates for the first time in six years, Brazil unveiled a $15.1 billion construction spending package and India more than doubled the limit on foreign investment in corporate bonds.
The downward volatility in the markets was obviously a headwind for our mutual funds, all of which posted declines. We were disappointed by the magnitude of the losses but take some comfort in the fact that the majority of our funds outperformed their benchmarks. Since Nicholas-Applegate was founded in 1984, we have adhered to our investment philosophy in all market environments. The consistency of our approach has served the funds well in the past, and it did so again this period.
The qualities of our firm help us attract and retain high-caliber people, and we welcomed several talented professionals to the company this period. We also continued to invest in our technology infrastructure, which supports risk management, trading, compliance and other vital operations. We will continue to fully resource our investment teams, as well as the critical functions that contribute to their success. Our shareholders should expect the same level of commitment and investment from us in these difficult times that we promised in good times, and we intend to deliver it. Our organization is healthy and stable, and we enjoy a strong working relationship with our well-capitalized parent company, Allianz Global Investors.
We close the books on this fiscal year with relief, and look forward to the future with optimism. We do not believe the global economy will slip into a depression given the massive, concerted fiscal and monetary response from governments around the world. Nonetheless, we think that the duration of the current downturn relies on the effectiveness of those measures. Until the credit markets resume lending and businesses have access to capital, it is difficult to anticipate returns for any asset class. Investors can take heart, however, as several asset classes, including high-yield corporate bonds and convertible securities, provide attractive investment opportunities. Spreads between high yield bonds, also known as junk bonds and below investment grade issues, and comparable Treasury issues, remain well above prior-cycle highs.
On behalf of everyone at the firm, thank you for your participation in the Nicholas-Applegate Institutional Funds. We appreciate the trust you have placed in us.
Best Regards,

Horacio A. Valeiras, CFA
President and Chief Investment Officer
March 31, 2009
TABLEOF CONTENTS
The Funds’ Review and Outlook, Performance and Schedules of Investments:
| | |
U.S. Ultra Micro Cap Fund | | 1 |
U.S. Micro Cap Fund | | 4 |
U.S. Emerging Growth Fund | | 9 |
U.S. Small to Mid Cap Growth Fund | | 13 |
U.S. Systematic Large Cap Growth Fund | | 17 |
U.S. Convertible Fund | | 21 |
Global Equity 130/30 Fund | | 26 |
Global Select Fund | | 29 |
International Growth Opportunities Fund | | 33 |
Emerging Markets Fund | | 37 |
International Systematic Fund | | 41 |
International All Cap Growth Fund | | 45 |
U.S. High Yield Bond Fund | | 49 |
The Funds’:
| | |
Financial Highlights | | 54 |
Statements of Assets and Liabilities | | 62 |
Statements of Operations | | 64 |
Statements of Changes in Net Assets | | 66 |
Statement of Cash Flows | | 70 |
Notes to Financial Statements | | 71 |
Report of Independent Registered Public Accounting Firm | | 81 |
Shareholder Expense Example | | 82 |
Supplementary Information | | 84 |
This report is authorized for distribution to shareholders and to others only when preceded or accompanied by a currently effective prospectus for Nicholas-Applegate Institutional Funds Class I, II, III & IV Shares. Distributor: Nicholas-Applegate Securities.
U.S. ULTRA MICRO CAP FUND
Management Team: John C. McCraw, Portfolio Manager; Robert S. Marren, Portfolio Manager
Chief Investment Officer: Horacio A. Valeiras, CFA Goal: The U.S. Ultra Micro Cap Fund seeks to maximize long-term capital appreciation by investing primarily in U.S. companies with market capitalizations below the weighted average of the Russell Microcap Growth Index at time of purchase.
Market Overview: The Russell Microcap Growth Index registered a loss during the twelve months ended March 31, 2009. The U.S. equity market was unusually weak and volatile, with stocks in all major styles, sectors and capitalization segments posting declines. Factors contributing to the sell-off included:
| | • | | Deterioration in the value of mortgage-linked securities, which led to the collapse or near collapse of several large financial institutions and caused the credit markets to seize up |
| | • | | Rapid falloff in economic activity, with the National Bureau of Economic Research officially declaring that the United States had been in recession since December 2007 |
| | • | | Disappointing corporate earnings, particularly from the financials sector given the huge amount of mortgage-related write-offs |
U.S. policymakers took unprecedented steps to jump-start the credit markets and economy. The Federal Reserve lowered interest rates to a record low and, with the Treasury Department, created special mechanisms for pumping liquidity into the financial system. On the fiscal front, President Obama signed a $787 billion economic stimulus package into law in February. Equities rallied in the last few weeks of the period on rising confidence in the government’s approach to addressing the crisis, as well as some positive news out of the banking and housing sectors.
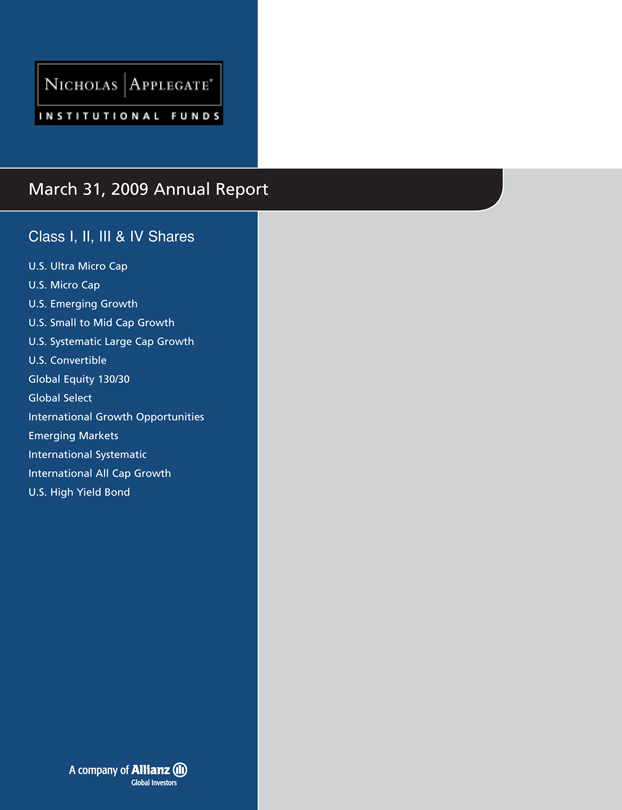
Performance: The Fund’s Class I shares lost 37.72% during the fiscal year ended March 31, 2009 but outperformed the Russell Microcap Growth Index, which fell 39.21%.
Portfolio Specifics: Consistent with our bottom-up investment process, the Fund’s outperformance was driven by stock selection, which was strongest in the consumer discretionary sector. Two of our best-performing holdings were Hot Topic and Citi Trends, apparel retailers whose stock prices advanced despite the weak consumer environment. Hot Topic experienced brisk sales of merchandise tied to the hit movie Twilight, while Citi Trends’ low prices attracted value-seeking customers. Stock selection was also strong in industrials and financials, where positive contributors included MYR Group, a supplier of services for the electrical infrastructure market; Graham Corp., a maker of equipment used in processing plants; and Life Partners, a provider of life settlement transactions.
Stock selection in the health care, energy and information technology sectors had the largest negative impact on relative results. In addition, an underweight in health care detracted, as this classic safe haven was one of the more resilient sectors in the benchmark.
Market Outlook: The stock market is likely to remain volatile in the months ahead given the challenging economic and earnings environment. Earnings estimates for 2009, already significantly reduced, are likely to decline further. The recession is expected to be longer and deeper than past contractions due to several factors, including tighter lending standards and higher job losses. That said, we are encouraged by the government’s aggressive monetary and fiscal policies, which should restore liquidity to the financial system and set the recovery process in motion.
Whatever direction the broad market takes, we believe that consistent application of our forward-looking investment philosophy will lead to strong returns in the Fund over time.
Comparison of Change in Value of a $250,000 Investment in U.S. Ultra Micro Cap Fund Class I Shares with the Russell Micro Cap Growth Index.
The graph above shows the value of a hypothetical $250,000 investment in the Fund’s Class I shares with the Russell Microcap Growth Index for the periods indicated. Average annual total return figures include changes in principal value, reinvested dividends, and capital gain distributions. The Class I shares commenced operations on January 28, 2008. The total returns shown above do not show the effects of income taxes on an individuals’ investment. In most cases, taxes may reduce your actual investment returns on income or gains paid by the Fund or any gains you may realize if you sell your shares. Past performance cannot guarantee future results.
The Russell Microcap Index measures performance of the microcap segment, representing less than 3% of the U.S. equity market. The Russell Microcap Index includes the smallest 1,000 securities in the small-cap Russell 2000 Index plus the next 1,000 securities. The Russell Microcap Growth Index isolates the securities in the Russell Microcap Index with purely growth characteristics. Unless otherwise noted, index returns reflect the reinvestment of income dividends and capital gains, if any, but do not reflect fees, brokerage commissions or other expenses of investing. Investors may not make direct investments into any index. Since markets can go down as well as up, investment return and principal value will fluctuate with market conditions. You may have a gain or loss when you sell your shares.
1
U.S. ULTRA MICRO CAP FUND
SCHEDULEOF INVESTMENTS
As of March 31, 2009
| | | | | |
| | | Number of
Shares | | Value |
Common Stock - 97.7% | | | | | |
Airlines - 0.6% | | | | | |
Hawaiian Holdings, Inc.* | | 1,730 | | $ | 6,453 |
| | | | | |
Apparel Manufacturers - 2.0% | | | | | |
G-III Apparel Group, Ltd.* | | 2,317 | | | 12,790 |
Maidenform Brands, Inc.* | | 910 | | | 8,335 |
| | | | | |
| | | | | 21,125 |
| | | | | |
Applications Software - 2.1% | | | | | |
Ebix, Inc.* | | 932 | | | 23,160 |
| | | | | |
Building & Construction-Miscellaneous - 1.7% | | | | | |
MYR Group, Inc.* | | 1,220 | | | 18,605 |
| | | | | |
Building-Heavy Construction - 1.1% | | | | | |
Orion Marine Group, Inc.* | | 900 | | | 11,790 |
| | | | | |
Chemicals-Diversified - 1.1% | | | | | |
Aceto Corp. | | 2,020 | | | 12,039 |
| | | | | |
Commercial Services - 1.1% | | | | | |
Medifast, Inc.* | | 2,770 | | | 11,496 |
| | | | | |
Communications Software - 1.2% | | | | | |
Seachange International, Inc.* | | 2,300 | | | 13,156 |
| | | | | |
Computer Services - 1.0% | | | | | |
Virtusa Corp.* | | 1,700 | | | 10,540 |
| | | | | |
Computer Software - 1.1% | | | | | |
Double-Take Software, Inc.* | | 1,774 | | | 11,992 |
| | | | | |
Computers-Integrated Systems - 1.7% | | | | | |
NCI, Inc. Cl. A* | | 428 | | | 11,128 |
Radisys Corp.* | | 1,200 | | | 7,272 |
| | | | | |
| | | | | 18,400 |
| | | | | |
Diagnostic Equipment - 0.5% | | | | | |
Home Diagnostics, Inc.* | | 1,020 | | | 5,783 |
| | | | | |
Direct Marketing - 1.7% | | | | | |
APAC Customer Services, Inc.* | | 5,500 | | | 18,700 |
| | | | | |
Distribution/Wholesale - 1.7% | | | | | |
FGX International Holdings, Ltd.* | | 1,550 | | | 18,011 |
| | | | | |
Drug Delivery Systems - 0.5% | | | | | |
Depomed, Inc.* | | 2,400 | | | 5,664 |
| | | | | |
Electronic Components-Miscellaneous - 1.3% | | | | | |
NVE Corp.* | | 500 | | | 14,405 |
| | | | | |
Electronic Components-Semiconductors - 3.9% | | | | | |
Ceva, Inc.* | | 1,792 | | | 13,046 |
MIPS Technologies, Inc. Cl. A* | | 6,200 | | | 18,166 |
White Electronic Designs Corp.* | | 2,700 | | | 10,827 |
| | | | | |
| | | | | 42,039 |
| | | | | |
Enterprise Software/Services - 2.5% | | | | | |
Opnet Technologies, Inc.* | | 1,530 | | | 13,265 |
Taleo Corp. Cl. A* | | 1,200 | | | 14,184 |
| | | | | |
| | | | | 27,449 |
| | | | | |
Firearms & Ammunition - 1.0% | | | | | |
Smith & Wesson Holding Corp.* | | 1,800 | | | 10,836 |
| | | | | |
Fisheries - 0.8% | | | | | |
HQ Sustainable Maritime Industries, Inc.* | | 1,100 | | | 8,415 |
| | | | | |
Food-Miscellaneous/Diversified - 1.2% | | | | | |
Overhill Farms, Inc.* | | 3,343 | | | 12,770 |
| | | | | |
Health Care Cost Containment - 1.5% | | | | | |
Integramed America, Inc.* | | 2,640 | | | 16,078 |
| | | | | |
| | | | | |
| | | Number of
Shares | | Value |
Human Resources - 0.2% | | | | | |
On Assignment, Inc.* | | 976 | | $ | 2,645 |
| | | | | |
Instruments-Controls - 1.0% | | | | | |
Spectrum Control, Inc.* | | 1,473 | | | 10,355 |
| | | | | |
Insurance Brokers - 1.0% | | | | | |
Life Partners Holdings, Inc. | | 652 | | | 11,123 |
| | | | | |
Internet Applications Software - 1.7% | | | | | |
Clicksoftware Technologies, Ltd.* | | 4,900 | | | 18,228 |
| | | | | |
Machinery-General Industry - 0.6% | | | | | |
Intevac, Inc.* | | 1,300 | | | 6,773 |
| | | | | |
Medical Instruments - 2.0% | | | | | |
SenoRx, Inc.* | | 2,926 | | | 10,124 |
Vascular Solutions, Inc.* | | 1,820 | | | 11,138 |
| | | | | |
| | | | | 21,262 |
| | | | | |
Medical Products - 9.2% | | | | | |
Alphatec Holdings, Inc.* | | 3,737 | | | 6,614 |
Atrion Corp. | | 178 | | | 15,707 |
ATS Medical, Inc.* | | 7,735 | | | 19,338 |
Cantel Medical Corp.* | | 910 | | | 11,712 |
Exactech, Inc.* | | 1,078 | | | 12,386 |
Synovis Life Technologies, Inc.* | | 963 | | | 13,328 |
Vnus Medical Technologies, Inc.* | | 974 | | | 20,717 |
| | | | | |
| | | | | 99,802 |
| | | | | |
Medical-Biomedical/Genetics - 3.8% | | | | | |
CryoLife, Inc.* | | 1,722 | | | 8,920 |
Facet Biotech Corp.* | | 1,300 | | | 12,350 |
Ligand Pharmaceuticals, Inc. Cl. B* | | 3,400 | | | 10,132 |
Repligen Corp.* | | 2,000 | | | 9,580 |
| | | | | |
| | | | | 40,982 |
| | | | | |
Medical-Drugs - 0.5% | | | | | |
Array Biopharma, Inc.* | | 2,100 | | | 5,544 |
| | | | | |
Medical-Outpatient/Home Medical Care - 3.5% | | | | | |
Almost Family, Inc.* | | 500 | | | 9,545 |
America Service Group, Inc.* | | 1,420 | | | 18,460 |
NovaMed, Inc.* | | 4,470 | | | 10,147 |
| | | | | |
| | | | | 38,152 |
| | | | | |
Miscellaneous Manufacturers - 0.8% | | | | | |
FreightCar America, Inc. | | 500 | | | 8,765 |
| | | | | |
Networking Products - 0.9% | | | | | |
Extreme Networks* | | 6,200 | | | 9,424 |
| | | | | |
Oil Companies-Exploration & Production - 1.1% | | | | | |
Double Eagle Petroleum Co.* | | 1,071 | | | 5,537 |
RAM Energy Resources, Inc.* | | 8,220 | | | 6,001 |
| | | | | |
| | | | | 11,538 |
| | | | | |
Oil Field Machine & Equipment - 1.2% | | | | | |
T-3 Energy Services, Inc.* | | 1,120 | | | 13,194 |
| | | | | |
Oil-Field Services - 0.8% | | | | | |
Boots & Coots International Control, Inc.* | | 6,664 | | | 8,330 |
| | | | | |
Patient Monitoring Equipment - 1.6% | | | | | |
Somanetics Corp.* | | 1,138 | | | 17,275 |
| | | | | |
Physical Practice Management - 0.9% | | | | | |
IPC The Hospitalist Co., Inc.* | | 510 | | | 9,705 |
| | | | | |
Physical Therapy/Rehabilitation Centers - 1.3% | | | | | |
US Physical Therapy, Inc.* | | 1,410 | | | 13,649 |
| | | | | |
Private Corrections - 1.2% | | | | | |
Cornell Cos., Inc.* | | 815 | | | 13,342 |
| | | | | |
| | | | |
| See Accompanying Notes to Financial Statements. |
| | 2 | | |
SCHEDULEOF INVESTMENTS
As of March 31, 2009
| | | | | |
| | | Number of
Shares | | Value |
Property/Casualty Insurance - 3.0% | | | | | |
First Mercury Financial Corp.* | | 1,000 | | $ | 14,440 |
Meadowbrook Insurance Group, Inc. | | 3,007 | | | 18,343 |
| | | | | |
| | | | | 32,783 |
| | | | | |
REIT-Diversified - 1.5% | | | | | |
DuPont Fabros Technology, Inc. - REIT | | 2,400 | | | 16,512 |
| | | | | |
Research & Development - 1.2% | | | | | |
Exponent, Inc.* | | 525 | | | 13,298 |
| | | | | |
Retail-Apparel/Shoe - 2.3% | | | | | |
HOT Topic, Inc.* | | 1,002 | | | 11,212 |
The Wet Seal, Inc. Cl. A* | | 4,153 | | | 13,954 |
| | | | | |
| | | | | 25,166 |
| | | | | |
Retail-Automobile - 1.2% | | | | | |
America’s Car-Mart, Inc.* | | 985 | | | 13,386 |
| | | | | |
Retail-Discount - 1.6% | | | | | |
Citi Trends, Inc.* | | 768 | | | 17,580 |
| | | | | |
Retail-Drug Store - 1.3% | | | | | |
Allion Healthcare, Inc.* | | 3,069 | | | 14,117 |
| | | | | |
Retail-Restaurants - 3.0% | | | | | |
AFC Enterprises, Inc.* | | 2,230 | | | 10,057 |
Carrols Restaurant Group, Inc.* | | 3,200 | | | 11,232 |
Einstein Noah Restaurant Group, Inc.* | | 1,983 | | | 11,561 |
| | | | | |
| | | | | 32,850 |
| | | | | |
Retirement/Aged Care - 0.6% | | | | | |
Five Star Quality Care, Inc.* | | 5,700 | | | 5,928 |
| | | | | |
Satellite Telecommunications - 1.1% | | | | | |
RRSat Global Communications Network, Ltd. | | 1,000 | | | 12,000 |
| | | | | |
Savings & Loans/Thrifts-Eastern US - 1.4% | | | | | |
United Financial Bancorp, Inc. | | 1,167 | | | 15,276 |
| | | | | |
Semiconductor Components-Integrated Circuits - 1.2% | | | | | |
Techwell, Inc.* | | 1,986 | | | 12,532 |
| | | | | |
Semiconductor Equipment - 1.2% | | | | | |
Ultratech, Inc.* | | 1,076 | | | 13,439 |
| | | | | |
Telecommunication Equipment - 3.5% | | | | | |
Anaren, Inc.* | | 1,120 | | | 12,253 |
Applied Signal Technology, Inc. | | 780 | | | 15,779 |
Symmetricom, Inc.* | | 2,930 | | | 10,255 |
| | | | | |
| | | | | 38,287 |
| | | | | |
Telecommunication Equipment-Fiber Optics - 0.9% | | | | | |
Oplink Communications, Inc.* | | 1,200 | | | 9,240 |
| | | | | |
Therapeutics - 0.6% | | | | | |
Cypress Bioscience, Inc.* | | 910 | | | 6,470 |
| | | | | |
Transactional Software - 1.9% | | | | | |
Innerworkings, Inc.* | | 1,900 | | | 8,113 |
Yucheng Technologies, Ltd.* | | 1,959 | | | 12,479 |
| | | | | |
| | | | | 20,592 |
| | | | | |
Transport-Marine - 0.6% | | | | | |
Paragon Shipping, Inc. Cl. A | | 2,000 | | | 6,980 |
| | | | | |
Transport-Services - 0.7% | | | | | |
Vitran Corp., Inc.* | | 1,404 | | | 7,385 |
| | | | | |
Transport-Truck - 2.6% | | | | | |
Celadon Group, Inc.* | | 1,726 | | | 9,579 |
Saia, Inc.* | | 1,545 | | | 18,463 |
| | | | | |
| | | | | 28,042 |
| | | | | |
| | | | | | | |
| | | Number of
Shares | | Value | |
Web Hosting/Design - 0.6% | | | | | | | |
Terremark Worldwide, Inc.* | | | 2,400 | | $ | 6,456 | |
| | | | | | | |
Wireless Equipment - 1.1% | | | | | | | |
Globecomm Systems, Inc.* | | | 1,978 | | | 11,453 | |
| | | | | | | |
Total Common Stock (Cost: $1,225,403) | | | | | | 1,058,766 | |
| | | | | | | |
Limited Partnerships - 1.1% | | | | | | | |
Transport-Marine - 1.1% | | | | | | | |
Navios Maritime Partners LP* (Cost $12,426) | | | 1,500 | | | 12,600 | |
| | | | | | | |
| | |
| | | Principal
Amount | | | |
Short Term Investments - 4.8% | | | | | | | |
Time Deposit - 4.8% | | | | | | | |
Citibank London 0.100%, 04/01/09 (Cost: $52,038) | | $ | 52,038 | | | 52,038 | |
| | | | | | | |
Total Investments - 103.6% (Cost: $1,289,867) | | | | | | 1,123,404 | |
| | | | | | | |
Liabilities in Excess of Other Assets - (3.6%) | | | | | | (39,333 | ) |
| | | | | | | |
Net Assets - 100.0% | | | | | $ | 1,084,071 | |
| | | | | | | |
| * | Non-income producing securities. |
REIT - Real Estate Investment Trust
SCHEDULEOF INVESTMENTSBY SECTOR
as of March 31, 2009
| | | |
Sector | | Percent of
Net Assets | |
Consumer, Non-cyclical | | 32.6 | % |
Technology | | 17.8 | |
Industrial | | 13.8 | |
Consumer, Cyclical | | 12.1 | |
Communications | | 11.4 | |
Financial | | 7.0 | |
Energy | | 3.0 | |
Basic Materials | | 1.1 | |
Short Term Investments | | 4.8 | |
| | | |
Total Investments | | 103.6 | |
Liabilities in excess of other assets | | (3.6 | ) |
| | | |
Net Assets | | 100.0 | % |
| | | |
| | | | |
| See Accompanying Notes to Financial Statements. |
3 |
U.S. MICRO CAP FUND
Management Team: John C. McCraw, Portfolio Manager; Robert S. Marren, Portfolio Manager
Chief Investment Officer: Horacio A. Valeiras, CFA
Goal: The U.S. Micro Cap Fund seeks to maximize long-term capital appreciation by investing primarily in U.S. companies with market capitalizations similar to the Russell Microcap Growth Index at time of purchase.
Market Overview: The Russell Microcap Growth Index posted a loss in the fiscal year ended March 31, 2009. The decline was part of a broad sell-off in U.S. equities that was triggered by the worst financial crisis in decades.
Early in the period, key market indexes advanced on hopes that emergency steps taken by the Federal Reserve in early 2008 would contain the housing-induced credit crisis. Those hopes were dashed over the summer amid credit write-downs, rising inflation and downbeat news on the economy.
Market conditions rapidly deteriorated over the remainder of the fiscal year, when mounting losses on mortgage-related securities led to the bankruptcy, sale or government takeover of several major financial institutions. Banks found it difficult to lend because they needed to conserve capital in the uncertain environment. The credit markets froze, the economy ground to a near standstill and investors fled equities. Forced selling by hedge funds to meet redemptions and margin calls contributed to the downward spiral, driving stock prices even lower and fear levels higher. A key barometer of market volatility spiked to nearly twice the level it had reached after the 2001 terrorist attacks.
In response to the crisis, the Fed cut interest rates close to zero and the government pledged trillions of dollars in rescue and stimulus packages. These efforts, combined with some upbeat news on the housing and banking industries, drove equities higher near the end of the period.
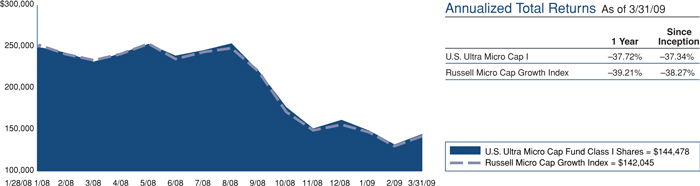
Performance: During the twelve months ended March 31, 2009, the Fund’s Class I shares declined 34.63%, outperforming the Russell Microcap Growth Index, which lost 39.21%.
Portfolio Specifics: Stock selection in the consumer discretionary sector had the largest positive impact on results versus the index. One of our best-performing stocks was Buffalo Wild Wings, a restaurant chain whose value-oriented pricing and targeted marketing programs helped drive sales growth in the weak economy. Several apparel retailers also contributed to relative strength in the consumer discretionary sector, including Jos. A. Bank Clothiers and Wet Seal.
Positioning in consumer staples was another key source of value added. This defensive sector was the most resilient in the index, and the Fund benefited from an overweight in the group. In addition, our stock selection was positive, led by a strong gain from American Italian Pasta, a manufacturer of dry pasta products.
Stock selection in the energy sector subtracted the most from relative results. One of our worst-performing holdings was a natural gas producer that was hurt by falling gas prices. An underweight in health care was another negative since, like consumer staples, health care is a defensive sector.
Market Outlook: The stock market is likely to remain volatile in the months ahead given the challenging economic and earnings environment. Earnings estimates for 2009, already significantly reduced, are likely to decline further. The recession is expected to be longer and deeper than past contractions due to several factors, including tighter lending standards and higher job losses. That said, we are encouraged by the government’s aggressive monetary and fiscal policies, which should restore liquidity to the financial system and set the recovery process in motion.
As events unfold, we are confident that our research-driven investment process will uncover exciting growth opportunities for the Fund.
Comparison of Change in Value of a $250,000 Investment in U.S. Micro Cap Fund Class I Shares with the Russell 2000 Growth/Russell Microcap Growth Blend Index and Russell 2000 Growth Index.
The graph above shows the value of a hypothetical $250,000 investment in the Fund’s Class I shares compared with the Russell 2000 Growth Index and a blended index comprised of the Russell 2000 Growth Index/Russell Microcap Growth Index. The Fund’s Class I shares calculate their performance based upon the historical performance of their corresponding series of
Nicholas-Applegate Mutual Funds (renamed ING Mutual Funds), adjusted to reflect all fees and expenses applicable to Class I shares. The Nicholas-Applegate Institutional Funds’ Class I shares were first available on May 7, 1999. Average annual total return figures include changes in principal value, reinvestment of dividends, and capital gain distributions. The total returns shown above do not show the effects of
7
U.S. MICRO CAP FUND
income taxes on an individual’s investment. In most cases, taxes may reduce your actual investment returns on income or gains paid by the Fund or any gains you may realize if you sell your shares. Past performance cannot guarantee future results.
The Russell 2000 Growth Index is an unmanaged index comprised of those Russell 2000 companies with higher price-to-book ratios and higher forecasted growth values. The Russell 2000 Growth Index is an unmanaged index generally representative of the 2,000 smallest companies in the Russell 3000 Index, which represents approximately 10% of the total market capitalization of the Russell 3000 Index.
The Russell Microcap Growth Index isolates the smallest 1,000 securities in the Russell 2000 Index plus the next 1,000 securities. The Russell Microcap Growth Index isolates the securities in the
Russell Microcap Index with purely growth characteristics. Unless otherwise noted, index returns reflect the reinvestment of income dividends and capital gains, if any, but do not reflect fees, brokerage commissions or other expenses of investing. The Russell 2000 Growth/Russell Microcap Growth Blend Index is a combination of the Russell 2000 Growth Index and the Russell Microcap Growth Index. The blended index exhibits Russell 2000 Growth performance from the inception of the Fund until August 2000, and Russell Microcap Growth performance thereafter. The Fund created the blended index because Russell Microcap Growth performance incepted in August 2000. One cannot invest directly in an index. Since markets can go down as well as up, investment return and principal value will fluctuate with market conditions. You may have a gain or loss when you sell your shares.
5
U.S. MICRO CAP FUND
SCHEDULEOF INVESTMENTS
As of March 31, 2009
| | | | | |
| | | Number of
Shares | | Value |
Common Stock - 99.1% | | | | | |
Aerospace/Defense - 0.6% | | | | | |
National Presto Industries, Inc. | | 4,200 | | $ | 256,242 |
| | | | | |
Airlines - 0.5% | | | | | |
Hawaiian Holdings, Inc.* | | 58,100 | | | 216,713 |
| | | | | |
Alternative Waste Technology - 1.4% | | | | | |
Calgon Carbon Corp.* | | 38,760 | | | 549,229 |
| | | | | |
Apparel Manufacturers - 0.8% | | | | | |
Maidenform Brands, Inc.* | | 34,700 | | | 317,852 |
| | | | | |
Applications Software - 2.2% | | | | | |
Ebix, Inc.* | | 12,100 | | | 300,685 |
EPIQ Systems, Inc.* | | 33,220 | | | 598,957 |
| | | | | |
| | | | | 899,642 |
| | | | | |
Auto Repair Centers - 1.0% | | | | | |
Monro Muffler, Inc. | | 15,100 | | | 412,683 |
| | | | | |
Batteries/Battery Systems - 0.9% | | | | | |
Greatbatch, Inc.* | | 17,900 | | | 346,365 |
| | | | | |
Broadcast Services/Programming - 1.0% | | | | | |
DG FastChannel, Inc.* | | 21,400 | | | 401,678 |
| | | | | |
Chemicals-Diversified - 0.6% | | | | | |
Aceto Corp. | | 39,600 | | | 236,016 |
| | | | | |
Coal - 0.6% | | | | | |
James River Coal Co.* | | 21,200 | | | 261,608 |
| | | | | |
Commercial Banks-Southern US - 0.8% | | | | | |
Bank of the Ozarks, Inc. | | 13,900 | | | 320,812 |
| | | | | |
Commercial Services - 2.5% | | | | | |
HMS Holdings Corp.* | | 22,361 | | | 735,677 |
Medifast, Inc.* | | 65,300 | | | 270,995 |
| | | | | |
| | | | | 1,006,672 |
| | | | | |
Commercial Services-Finance - 0.9% | | | | | |
CBIZ, Inc.* | | 51,200 | | | 356,864 |
| | | | | |
Communications Software - 0.8% | | | | | |
Seachange International, Inc.* | | 57,100 | | | 326,612 |
| | | | | |
Computer Software - 0.7% | | | | | |
Double-Take Software, Inc.* | | 40,200 | | | 271,752 |
| | | | | |
Computers-Integrated Systems - 1.5% | | | | | |
NCI, Inc. Cl. A* | | 10,400 | | | 270,400 |
Netscout Systems, Inc.* | | 45,200 | | | 323,632 |
| | | | | |
| | | | | 594,032 |
| | | | | |
Computers-Memory Devices - 0.8% | | | | | |
STEC, Inc.##,* | | 41,400 | | | 305,118 |
| | | | | |
Computers-Peripheral Equipment - 1.0% | | | | | |
Compellent Technologies, Inc.* | | 37,100 | | | 402,906 |
| | | | | |
Disposable Medical Products - 1.6% | | | | | |
ICU Medical, Inc.* | | 11,700 | | | 375,804 |
Merit Medical Systems, Inc.* | | 23,500 | | | 286,935 |
| | | | | |
| | | | | 662,739 |
| | | | | |
Distribution/Wholesale - 1.9% | | | | | |
FGX International Holdings, Ltd.* | | 37,200 | | | 432,264 |
MWI Veterinary Supply, Inc.* | | 11,700 | | | 333,216 |
| | | | | |
| | | | | 765,480 |
| | | | | |
Electronic Components-Miscellaneous - 0.6% | | | | | |
NVE Corp.* | | 9,000 | | | 259,290 |
| | | | | |
Electronic Components-Semiconductors - 0.7% | | | | | |
Ceva, Inc.* | | 39,700 | | | 289,016 |
| | | | | |
| | | | | |
| | | Number of
Shares | | Value |
Electronic Measure Instruments - 1.2% | | | | | |
Axsys Technologies, Inc.* | | 11,658 | | $ | 490,102 |
| | | | | |
Electronic Security Devices - 0.6% | | | | | |
American Science & Engineering, Inc. | | 4,500 | | | 251,100 |
| | | | | |
Engineering/R & D Services - 1.2% | | | | | |
Stanley, Inc.* | | 19,400 | | | 492,566 |
| | | | | |
Enterprise Software/Services - 2.1% | | | | | |
Opnet Technologies, Inc.* | | 46,200 | | | 400,554 |
Taleo Corp. Cl. A* | | 37,548 | | | 443,817 |
| | | | | |
| | | | | 844,371 |
| | | | | |
Finance-Consumer Loans - 0.8% | | | | | |
Portfolio Recovery Associates, Inc.##,* | | 11,600 | | | 311,344 |
| | | | | |
Finance-Investment Bankers/Brokers - 1.0% | | | | | |
SWS Group, Inc. | | 27,300 | | | 423,969 |
| | | | | |
Firearms & Ammunition - 0.7% | | | | | |
Smith & Wesson Holding Corp.* | | 46,900 | | | 282,338 |
| | | | | |
Food-Miscellaneous/Diversified - 3.5% | | | | | |
American Italian Pasta Co.##,* | | 23,738 | | | 826,320 |
Diamond Foods, Inc. | | 20,300 | | | 566,979 |
| | | | | |
| | | | | 1,393,299 |
| | | | | |
Food-Wholesale/Distribution - 1.6% | | | | | |
Nash Finch Co. | | 10,500 | | | 294,945 |
Spartan Stores, Inc. | | 23,270 | | | 358,591 |
| | | | | |
| | | | | 653,536 |
| | | | | |
Footwear & Related Apparel - 1.1% | | | | | |
Steven Madden, Ltd.* | | 23,000 | | | 431,940 |
| | | | | |
Hazardous Waste Disposal - 0.6% | | | | | |
American Ecology Corp. | | 17,400 | | | 242,556 |
| | | | | |
Human Resources - 0.2% | | | | | |
On Assignment, Inc.* | | 28,400 | | | 76,964 |
| | | | | |
Insurance Brokers - 0.9% | | | | | |
Life Partners Holdings, Inc.## | | 21,976 | | | 374,911 |
| | | | | |
Internet Applications Software - 1.9% | | | | | |
Art Technology Group, Inc.* | | 152,500 | | | 388,875 |
S1 Corp.* | | 75,170 | | | 387,126 |
| | | | | |
| | | | | 776,001 |
| | | | | |
Internet Infrastructure Software - 2.6% | | | | | |
AsiaInfo Holdings, Inc.* | | 42,700 | | | 719,495 |
TeleCommunication Systems, Inc. Cl. A* | | 36,000 | | | 330,120 |
| | | | | |
| | | | | 1,049,615 |
| | | | | |
Machinery-General Industry - 0.4% | | | | | |
Intevac, Inc.* | | 28,100 | | | 146,401 |
| | | | | |
Medical Information Systems - 0.7% | | | | | |
Computer Programs & Systems, Inc. | | 8,100 | | | 269,487 |
| | | | | |
Medical Labs & Testing Services - 1.0% | | | | | |
Bio-Reference Labs, Inc.* | | 18,460 | | | 385,999 |
| | | | | |
Medical Products - 3.6% | | | | | |
Cantel Medical Corp.* | | 23,200 | | | 298,584 |
Exactech, Inc.* | | 26,400 | | | 303,336 |
Hanger Orthopedic Group, Inc.* | | 29,300 | | | 388,225 |
Synovis Life Technologies, Inc.* | | 32,360 | | | 447,862 |
| | | | | |
| | | | | 1,438,007 |
| | | | | |
| | | | |
| See Accompanying Notes to Financial Statements. |
| 6 |
SCHEDULEOF INVESTMENTS
As of March 31, 2009
| | | | | |
| | | Number of
Shares | | Value |
Medical-Biomedical/Genetics - 3.8% | | | | | |
CryoLife, Inc.* | | 37,800 | | $ | 195,804 |
Halozyme Therapeutics, Inc.##,* | | 35,900 | | | 196,014 |
Immunogen, Inc.* | | 35,300 | | | 250,630 |
Ligand Pharmaceuticals, Inc. Cl. B* | | 73,000 | | | 217,540 |
NPS Pharmaceuticals, Inc.* | | 46,800 | | | 196,560 |
Seattle Genetics, Inc.* | | 45,900 | | | 452,574 |
| | | | | |
| | | | | 1,509,122 |
| | | | | |
Medical-Drugs - 2.9% | | | | | |
Array Biopharma, Inc.* | | 72,600 | | | 191,664 |
Medivation, Inc.##,* | | 14,600 | | | 266,742 |
Optimer Pharmaceuticals, Inc.##,* | | 21,800 | | | 287,542 |
Pharmasset, Inc.* | | 24,500 | | | 240,345 |
Vivus, Inc.* | | 43,200 | | | 186,624 |
| | | | | |
| | | | | 1,172,917 |
| | | | | |
Medical-Nursing Homes - 1.0% | | | | | |
Sun Healthcare Group, Inc.* | | 46,100 | | | 389,084 |
| | | | | |
Medical-Outpatient/Home Medical Care - 1.6% | | | | | |
Almost Family, Inc.##,* | | 13,200 | | | 251,988 |
LHC Group, Inc.* | | 17,900 | | | 398,812 |
| | | | | |
| | | | | 650,800 |
| | | | | |
Miscellaneous Manufacturers - 0.5% | | | | | |
FreightCar America, Inc. | | 11,000 | | | 192,830 |
| | | | | |
MRI/Medical Diagnostic Imaging Centers - 1.1% | | | | | |
Alliance Imaging, Inc.* | | 63,800 | | | 433,840 |
| | | | | |
Networking Products - 1.9% | | | | | |
BigBand Networks, Inc.* | | 37,700 | | | 246,935 |
Extreme Networks* | | 148,500 | | | 225,720 |
Switch & Data Facilities Co., Inc.* | | 35,500 | | | 311,335 |
| | | | | |
| | | | | 783,990 |
| | | | | |
Oil Companies-Exploration & Production - 0.5% | | | | | |
Carrizo Oil & Gas, Inc.* | | 12,400 | | | 110,112 |
GMX Resources, Inc.* | | 12,200 | | | 79,300 |
| | | | | |
| | | | | 189,412 |
| | | | | |
Oil-Field Services - 2.6% | | | | | |
Boots & Coots International Control, Inc.* | | 233,900 | | | 292,375 |
Hornbeck Offshore Services, Inc.* | | 17,000 | | | 259,080 |
Matrix Service Co.* | | 17,340 | | | 142,535 |
Willbros Group, Inc.* | | 35,500 | | | 344,350 |
| | | | | |
| | | | | 1,038,340 |
| | | | | |
Patient Monitoring Equipment - 1.6% | | | | | |
CardioNet, Inc.* | | 23,100 | | | 648,186 |
| | | | | |
Pharmacy Services - 0.7% | | | | | |
SXC Health Solutions Corp.* | | 12,300 | | | 264,942 |
| | | | | |
Physical Practice Management - 0.9% | | | | | |
IPC The Hospitalist Co., Inc.* | | 18,900 | | | 359,667 |
| | | | | |
Power Conversion/Supply Equipment - 1.1% | | | | | |
Powell Industries, Inc.* | | 12,800 | | | 451,968 |
| | | | | |
Private Corrections - 0.9% | | | | | |
Cornell Cos., Inc.* | | 22,400 | | | 366,688 |
| | | | | |
Property/Casualty Insurance - 2.2% | | | | | |
First Mercury Financial Corp.* | | 28,100 | | | 405,764 |
Meadowbrook Insurance Group, Inc. | | 81,200 | | | 495,320 |
| | | | | |
| | | | | 901,084 |
| | | | | |
Research & Development - 1.3% | | | | | |
Exponent, Inc.* | | 20,000 | | | 506,600 |
| | | | | |
| | | | | |
| | | Number of
Shares | | Value |
Retail-Apparel/Shoe - 3.2% | | | | | |
HOT Topic, Inc.* | | 38,900 | | $ | 435,291 |
JOS. A Bank Clothiers, Inc.##,* | | 16,100 | | | 447,741 |
The Wet Seal, Inc. Cl. A* | | 125,900 | | | 423,024 |
| | | | | |
| | | | | 1,306,056 |
| | | | | |
Retail-Appliances - 0.5% | | | | | |
Conn’s, Inc.* | | 13,100 | | | 183,924 |
| | | | | |
Retail-Discount - 1.0% | | | | | |
Citi Trends, Inc.* | | 18,300 | | | 418,887 |
| | | | | |
Retail-Pet Food & Supplies - 1.0% | | | | | |
PetMed Express, Inc.* | | 23,600 | | | 388,928 |
| | | | | |
Retail-Restaurants - 3.4% | | | | | |
Buffalo Wild Wings, Inc.##,* | | 12,200 | | | 446,276 |
CKE Restaurants, Inc. | | 39,700 | | | 333,480 |
Domino’s Pizza, Inc.* | | 54,900 | | | 359,595 |
Red Robin Gourmet Burgers, Inc.* | | 14,000 | | | 246,820 |
| | | | | |
| | | | | 1,386,171 |
| | | | | |
Savings & Loans/Thrifts-Eastern US - 0.8% | | | | | |
United Financial Bancorp, Inc. | | 23,300 | | | 304,997 |
| | | | | |
Schools - 1.2% | | | | | |
K12, Inc.##,* | | 13,800 | | | 191,130 |
Lincoln Educational Services Corp.* | | 15,600 | | | 285,792 |
| | | | | |
| | | | | 476,922 |
| | | | | |
Semiconductor Components-Integrated Circuits - 2.0% | | | | | |
O2Micro International, Ltd. -ADR* | | 61,570 | | | 210,569 |
Pericom Semiconductor Corp.* | | 36,700 | | | 268,277 |
Techwell, Inc.* | | 54,100 | | | 341,371 |
| | | | | |
| | | | | 820,217 |
| | | | | |
Semiconductor Equipment - 1.0% | | | | | |
Ultratech, Inc.* | | 30,900 | | | 385,941 |
| | | | | |
Telecommunication Equipment - 0.7% | | | | | |
Anaren, Inc.* | | 24,300 | | | 265,842 |
| | | | | |
Telecommunication Equipment-Fiber Optics - 0.6% | | | | | |
Harmonic, Inc.* | | 34,800 | | | 226,200 |
| | | | | |
Textile-Apparel - 0.3% | | | | | |
Perry Ellis International, Inc.* | | 31,000 | | | 107,260 |
| | | | | |
Therapeutics - 1.9% | | | | | |
Allos Therapeutics, Inc.* | | 25,000 | | | 154,500 |
Cypress Bioscience, Inc.* | | 49,700 | | | 353,367 |
Questcor Pharmaceuticals, Inc.* | | 48,600 | | | 239,112 |
| | | | | |
| | | | | 746,979 |
| | | | | |
Transport-Air Freight - 0.7% | | | | | |
Atlas Air Worldwide Holdings, Inc.* | | 16,600 | | | 288,010 |
| | | | | |
Transport-Marine - 1.0% | | | | | |
Genco Shipping & Trading, Ltd.## | | 19,400 | | | 239,396 |
Safe Bulkers, Inc. | | 50,800 | | | 160,528 |
| | | | | |
| | | | | 399,924 |
| | | | | |
Transport-Services - 0.6% | | | | | |
Vitran Corp., Inc.* | | 42,800 | | | 225,128 |
| | | | | |
Transport-Truck - 2.2% | | | | | |
Marten Transport, Ltd.* | | 22,200 | | | 414,696 |
Saia, Inc.* | | 39,400 | | | 470,830 |
| | | | | |
| | | | | 885,526 |
| | | | | |
Ultra Sound Imaging Systems - 0.7% | | | | | |
SonoSite, Inc.* | | 16,700 | | | 298,596 |
| | | | | |
| | |
See Accompanying Notes to Financial Statements. | | |
U.S. MICRO CAP FUND
SCHEDULEOF INVESTMENTS
As of March 31, 2009
| | | | | | | |
| | | Number of
Shares | | Value | |
Veterinary Diagnostics - 0.8% | | | | | | | |
Neogen Corp.* | | | 14,500 | | $ | 316,535 | |
| | | | | | | |
Water Treatment Systems - 0.7% | | | | | | | |
Energy Recovery, Inc.##,* | | | 39,200 | | | 297,920 | |
| | | | | | | |
Web Hosting/Design - 0.5% | | | | | | | |
Terremark Worldwide, Inc.* | | | 73,400 | | | 197,446 | |
| | | | | | | |
Wireless Equipment - 0.6% | | | | | | | |
Globecomm Systems, Inc.* | | | 40,950 | | | 237,100 | |
| | | | | | | |
Total Common Stock (Cost: $47,783,540) | | | | | | 39,817,806 | |
| | | | | | | |
| | |
| | | Principal
Amount | | | |
Short Term Investments - 10.8% | | | | | | | |
Repurchase Agreement - 10.1% | | | | | | | |
Credit Suisse Securities, LLC, 0.150% dated 3/31/09, to be repurchased at $4,061,632 on 4/01/09 (collateralized by U.S. Treasury Bill, 0.000% due 6/18/09)** | | $ | 4,061,615 | | | 4,061,615 | |
| | | | | | | |
Time Deposit - 0.7% | | | | | | | |
Citibank London 0.100%, 04/01/09 | | | 266,834 | | | 266,834 | |
| | | | | | | |
Total Short Term Investments (Cost: $4,328,449) | | | | | | 4,328,449 | |
| | | | | | | |
Total Investments - 109.9% (Cost: $52,111,989) | | | | | | 44,146,255 | |
| | | | | | | |
Liabilities in Excess of Other Assets - (9.9%) | | | | | | (3,968,632 | ) |
| | | | | | | |
Net Assets - 100.0% | | | | | $ | 40,177,623 | |
| | | | | | | |
| ## | All or a portion of the Fund’s holdings in this security was on loan as of March 31, 2009. |
| * | Non-income producing securities. |
| ** | All of the security is purchased with cash collateral proceeds from securities loans. |
ADR - American Depository Receipt
SCHEDULE OF INVESTMENTS BY SECTOR
as of March 31, 2009
| | | |
Sector | | Percent of
Net Assets | |
Consumer, Non-cyclical | | 36.0 | % |
Industrial | | 16.3 | |
Technology | | 13.5 | |
Consumer, Cyclical | | 12.7 | |
Communications | | 9.8 | |
Financial | | 6.5 | |
Energy | | 3.7 | |
Basic Materials | | 0.6 | |
Short Term Investments | | 10.8 | |
| | | |
Total Investments | | 109.9 | |
Liabilities in excess of other assets | | (9.9 | ) |
| | | |
Net Assets | | 100.0 | % |
| | | |
| | | | |
See Accompanying Notes to Financial Statements. | | | | |
| | 8 | | |
U.S. EMERGING GROWTH FUND
Management Team: John C. McCraw, Portfolio Manager; Robert S. Marren, Portfolio Manager
Chief Investment Officer: Horacio A. Valeiras, CFA
Goal: The U.S. Emerging Growth Fund seeks to maximize long-term capital appreciation through investments primarily in U.S. companies with market capitalizations similar to the Russell 2000 Growth Index at time of purchase.
Market Overview: U.S. equity indexes, including the Russell 2000 Growth Index, registered declines during the twelve months ended March 31, 2009. Stock prices tumbled in response to:
| | • | | Turmoil in the credit markets, as losses on subprime mortgages threatened the solvency of large financial institutions and bank lending effectively ceased |
| | • | | Mounting evidence that the credit crisis was wreaking havoc on the economy, including the first back-to-back contraction in quarterly consumer spending since reports were first kept in 1947 |
| | • | | Uncertainty about the terms and potential impact of government programs created to stabilize the financial system and economy |
Weak earnings reports and a lack of visibility into future earnings added to the selling pressure. The fourth quarter of 2008 marked the sixth consecutive quarter of earnings declines for small and large companies across corporate America.
Stocks advanced near the end of the period on positive news about bank profits, signs of life in the housing market and rising optimism that the government’s fiscal and monetary policies would spur growth. Those policies included a $787 billion economic stimulus package, near-zero interest rates, a plan to reduce toxic assets on banks’ balance sheets and government purchases of longer-term Treasuries.
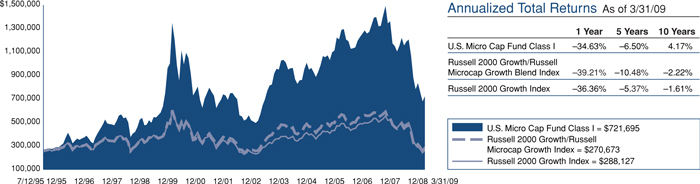
Performance: The Fund’s Class I shares fell 42.45% during the fiscal year ended March 31, 2009, while the Russell 2000 Growth Index declined 36.36%.
Portfolio Specifics: Stock selection in the consumer discretionary sector had a positive effect on performance versus the index. Several of our restaurant stocks did particularly well, including Cracker Barrel Old Country Store. Cracker Barrel’s sales and earnings were resilient, supported by the strength of the company’s brand, disciplined cost management and lower food inflation. Stock selection in the telecommunication services and utilities sectors was also positive.
Health care was one of the best-performing sectors in the index, and an underweight in the group hurt results versus the benchmark. When the economy is weak, investors tend to favor the stable demand characteristics of health care companies, and this period was no exception. Stock selection in health care was another area of relative weakness. One of the worst-performing holdings in the Fund was a provider of life sciences tools that reported disappointing operating results. Stock selection in the industrials and information technology sectors also weighed on performance versus the index.
Market Outlook: The stock market is likely to remain volatile in the months ahead given the challenging economic and earnings environment. Earnings estimates for 2009, already significantly reduced, are likely to decline further. The recession is expected to be longer and deeper than past contractions due to several factors, including tighter lending standards and higher job losses. That said, we are encouraged by the government’s aggressive monetary and fiscal policies, which should restore liquidity to the financial system and set the recovery process in motion.
Despite the uncertainty in the market, we believe that our focus on individual stock selection will lead to strong, long-term performance in the Fund.
Comparison of Change in Value of a $250,000 Investment in U.S. Emerging Growth Fund Class I Shares with the Russell 2000 Growth Index.
The graph above shows the value of a hypothetical $250,000 investment in the Fund’s Class I shares compared with the Russell 2000 Growth Index for the periods indicated. The Fund calculates performance based upon the historical performance of a corresponding series of Nicholas-Applegate Mutual Funds (renamed ING Mutual Funds), adjusted to reflect all fees and expenses applicable to Class I shares. The Nicholas-Applegate Institutional Funds’ Class I shares were first available on May 7, 1999. Average annual total return figures include changes in principal value, reinvested dividends, and capital gain distributions. The total returns shown above do not show the effects of income taxes on an individual’s investment. In most cases, taxes may reduce your actual investment returns on income or gains paid by the Fund or any gains
you may realize if you sell your shares. Past performance cannot guarantee future results.
The Russell 2000 Growth Index is an unmanaged index comprised of those Russell 2000 companies with higher price-to-book ratios and higher forecasted growth values. The Russell 2000 Index is an unmanaged index generally representative of the 2,000 smallest companies in the Russell 3000 Index, which represents approximately 10% of the total market capitalization of the Russell 3000 Index. Index returns include reinvestment of dividends. Unless otherwise noted, index returns reflect the reinvestment of income dividends and capital gains, if any, but do not reflect fees, brokerage commissions or other expenses of investing. One cannot invest directly in an index. Since markets can go down as well as up, investment returns and principal value will fluctuate with market conditions. You may have a gain or loss when you sell your shares.
9
U.S. EMERGING GROWTH FUND
SCHEDULEOF INVESTMENTS
As of March 31, 2009
| | | | | |
| | | Number of
Shares | | Value |
Common Stock - 97.6% | | | | | |
Aerospace/Defense - 1.1% | | | | | |
Cubic Corp. | | 2,000 | | $ | 50,660 |
National Presto Industries, Inc. | | 600 | | | 36,606 |
| | | | | |
| | | | | 87,266 |
| | | | | |
Aerospace/Defense-Equipment - 1.8% | | | | | |
BE Aerospace, Inc.* | | 5,700 | | | 49,419 |
Orbital Sciences Corp.* | | 3,800 | | | 45,182 |
Triumph Group, Inc. | | 1,300 | | | 49,660 |
| | | | | |
| | | | | 144,261 |
| | | | | |
Agricultural Chemicals - 0.5% | | | | | |
Intrepid Potash, Inc.* | | 2,400 | | | 44,280 |
| | | | | |
Airlines - 1.4% | | | | | |
Continental Airlines, Inc. Cl. B* | | 4,400 | | | 38,764 |
Hawaiian Holdings, Inc.* | | 12,400 | | | 46,252 |
JetBlue Airways Corp.* | | 8,000 | | | 29,200 |
| | | | | |
| | | | | 114,216 |
| | | | | |
Alternative Waste Technology - 0.6% | | | | | |
Calgon Carbon Corp.* | | 3,300 | | | 46,761 |
| | | | | |
Apparel Manufacturers - 0.4% | | | | | |
G-III Apparel Group, Ltd.* | | 5,200 | | | 28,704 |
| | | | | |
Applications Software - 0.7% | | | | | |
Compuware Corp.* | | 8,300 | | | 54,697 |
| | | | | |
Batteries/Battery Systems - 0.5% | | | | | |
Greatbatch, Inc.* | | 2,100 | | | 40,635 |
| | | | | |
Beverages-Wine/Spirits - 0.4% | | | | | |
Central European Distribution Corp.* | | 2,800 | | | 30,128 |
| | | | | |
Broadcast Services/Programming - 0.6% | | | | | |
DG FastChannel, Inc.* | | 2,600 | | | 48,802 |
| | | | | |
Building-Heavy Construction - 0.6% | | | | | |
Chicago Bridge & Iron Co. | | 8,000 | | | 50,160 |
| | | | | |
Chemicals-Diversified - 0.7% | | | | | |
Olin Corp. | | 3,900 | | | 55,653 |
| | | | | |
Chemicals-Specialty - 1.5% | | | | | |
Ashland, Inc. | | 4,600 | | | 47,518 |
Cytec Industries, Inc. | | 2,300 | | | 34,546 |
NewMarket Corp. | | 900 | | | 39,870 |
| | | | | |
| | | | | 121,934 |
| | | | | |
Coal - 0.5% | | | | | |
Massey Energy Co. | | 3,900 | | | 39,468 |
| | | | | |
Coffee - 0.5% | | | | | |
Green Mountain Coffee Roasters, Inc.* | | 900 | | | 43,200 |
| | | | | |
Commercial Services - 0.8% | | | | | |
HMS Holdings Corp.* | | 1,900 | | | 62,510 |
| | | | | |
Commercial Services-Finance - 0.6% | | | | | |
Wright Express Corp.* | | 2,700 | | | 49,194 |
| | | | | |
Computer Aided Design - 0.5% | | | | | |
Parametric Technology Corp.* | | 3,700 | | | 36,926 |
| | | | | |
Computer Software - 0.6% | | | | | |
Double-Take Software, Inc.* | | 7,400 | | | 50,024 |
| | | | | |
Computers-Integrated Systems - 0.5% | | | | | |
Netscout Systems, Inc.* | | 5,900 | | | 42,244 |
| | | | | |
Computers-Peripheral Equipment - 0.8% | | | | | |
Synaptics, Inc.* | | 2,400 | | | 64,224 |
| | | | | |
| | | | | |
| | | Number of
Shares | | Value |
Consulting Services - 0.6% | | | | | |
Watson Wyatt Worldwide, Inc. Cl. A | | 1,000 | | $ | 49,370 |
| | | | | |
Consumer Products-Miscellaneous - 0.6% | | | | | |
Tupperware Brands Corp. | | 2,700 | | | 45,873 |
| | | | | |
Containers-Paper/Plastic - 0.7% | | | | | |
Rock-Tenn Co. Cl. A | | 2,200 | | | 59,510 |
| | | | | |
Diagnostic Kits - 0.7% | | | | | |
Inverness Medical Innovations, Inc.* | | 2,100 | | | 55,923 |
| | | | | |
Disposable Medical Products - 0.5% | | | | | |
Merit Medical Systems, Inc.* | | 3,300 | | | 40,293 |
| | | | | |
Distribution/Wholesale - 1.3% | | | | | |
Beacon Roofing Supply, Inc.* | | 3,600 | | | 48,204 |
LKQ Corp.* | | 3,800 | | | 54,226 |
| | | | | |
| | | | | 102,430 |
| | | | | |
Diversified Manufacturing Operations - 0.6% | | | | | |
Brink’s Co. | | 1,900 | | | 50,274 |
| | | | | |
Diversified Operations - 0.4% | | | | | |
Compass Diversified Holdings | | 4,000 | | | 35,680 |
| | | | | |
E-Commerce/Services - 0.6% | | | | | |
IAC/InterActiveCorp* | | 3,300 | | | 50,259 |
| | | | | |
Electric-Integrated - 0.5% | | | | | |
Unisource Energy Corp. | | 1,400 | | | 39,466 |
| | | | | |
Electronic Components-Semiconductors - 3.1% | | | | | |
Macrovision Solutions Corp.* | | 5,600 | | | 99,624 |
ON Semiconductor Corp.* | | 9,300 | | | 36,270 |
PMC - Sierra, Inc.* | | 7,600 | | | 48,488 |
Skyworks Solutions, Inc.* | | 8,200 | | | 66,092 |
| | | | | |
| | | | | 250,474 |
| | | | | |
Electronic Design Automations - 0.5% | | | | | |
Mentor Graphics Corp.* | | 8,800 | | | 39,072 |
| | | | | |
Electronic Measure Instruments - 0.5% | | | | | |
Itron, Inc.* | | 800 | | | 37,880 |
| | | | | |
E-Marketing/Information - 1.2% | | | | | |
Digital River, Inc.* | | 1,600 | | | 47,712 |
Valueclick, Inc.* | | 6,100 | | | 51,911 |
| | | | | |
| | | | | 99,623 |
| | | | | |
Enterprise Software/Services - 3.4% | | | | | |
Lawson Software, Inc.* | | 9,200 | | | 39,100 |
Mantech International Corp. Cl. A* | | 1,200 | | | 50,280 |
Novell, Inc.* | | 11,300 | | | 48,138 |
Sybase, Inc.* | | 2,000 | | | 60,580 |
Taleo Corp. Cl. A* | | 6,500 | | | 76,830 |
| | | | | |
| | | | | 274,928 |
| | | | | |
Entertainment Software - 0.6% | | | | | |
Take-Two Interactive Software, Inc.* | | 5,400 | | | 45,090 |
| | | | | |
E-Services/Consulting - 0.6% | | | | | |
Websense, Inc.* | | 4,300 | | | 51,600 |
| | | | | |
Finance-Consumer Loans - 1.2% | | | | | |
Ocwen Financial Corp.* | | 4,600 | | | 52,578 |
Portfolio Recovery Associates, Inc.* | | 1,800 | | | 48,312 |
| | | | | |
| | | | | 100,890 |
| | | | | |
Finance-Investment Bankers/Brokers - 0.6% | | | | | |
SWS Group, Inc. | | 2,900 | | | 45,037 |
| | | | | |
Food-Miscellaneous/Diversified - 0.6% | | | | | |
Diamond Foods, Inc. | | 1,900 | | | 53,067 |
| | | | | |
See Accompanying Notes to Financial Statements.
SCHEDULEOF INVESTMENTS
As of March 31, 2009
| | | | | |
| | | Number of
Shares | | Value |
Food-Wholesale/Distribution - 1.2% | | | | | |
Spartan Stores, Inc. | | 3,100 | | $ | 47,771 |
United Natural Foods, Inc.* | | 2,800 | | | 53,116 |
| | | | | |
| | | | | 100,887 |
| | | | | |
Footwear & Related Apparel - 1.2% | | | | | |
Deckers Outdoor Corp.* | | 1,000 | | | 53,040 |
Steven Madden, Ltd.* | | 2,300 | | | 43,194 |
| | | | | |
| | | | | 96,234 |
| | | | | |
Hazardous Waste Disposal - 0.4% | | | | | |
American Ecology Corp. | | 2,500 | | | 34,850 |
| | | | | |
Human Resources - 0.5% | | | | | |
Emergency Medical Services Corp. Cl. A* | | 1,200 | | | 37,668 |
| | | | | |
Instruments-Scientific - 0.6% | | | | | |
FEI Co.* | | 3,200 | | | 49,376 |
| | | | | |
Internet Applications Software - 0.9% | | | | | |
Cybersource Corp.* | | 4,900 | | | 72,569 |
| | | | | |
Internet Infrastructure Equipment - 0.6% | | | | | |
Avocent Corp.* | | 3,900 | | | 47,346 |
| | | | | |
Internet Infrastructure Software - 0.8% | | | | | |
AsiaInfo Holdings, Inc.* | | 3,900 | | | 65,715 |
| | | | | |
Intimate Apparel - 0.8% | | | | | |
The Warnaco Group, Inc.* | | 2,700 | | | 64,800 |
| | | | | |
Life/Health Insurance - 0.6% | | | | | |
Delphi Financial Group, Inc. Cl. A | | 3,800 | | | 51,148 |
| | | | | |
Machinery-Construction & Mining - 0.6% | | | | | |
Bucyrus International, Inc. Cl. A | | 3,300 | | | 50,094 |
| | | | | |
Machinery-General Industry - 0.5% | | | | | |
Wabtec Corp. | | 1,600 | | | 42,208 |
| | | | | |
Marine Services - 1.1% | | | | | |
Aegean Marine Petroleum Network, Inc. | | 5,300 | | | 88,775 |
| | | | | |
Medical Instruments - 1.5% | | | | | |
Integra LifeSciences Holdings Corp.* | | 1,400 | | | 34,622 |
NuVasive, Inc.* | | 1,500 | | | 47,070 |
Thoratec Corp.* | | 1,600 | | | 41,104 |
| | | | | |
| | | | | 122,796 |
| | | | | |
Medical Labs & Testing Services - 0.4% | | | | | |
Bio-Reference Labs, Inc.* | | 1,500 | | | 31,365 |
| | | | | |
Medical Products - 4.0% | | | | | |
American Medical Systems Holdings, Inc.* | | 6,800 | | | 75,820 |
China Medical Technologies, Inc. - ADR | | 2,600 | | | 35,802 |
Exactech, Inc.* | | 3,600 | | | 41,364 |
Haemonetics Corp.* | | 900 | | | 49,572 |
Hanger Orthopedic Group, Inc.* | | 3,700 | | | 49,025 |
PSS World Medical, Inc.* | | 3,300 | | | 47,355 |
Wright Medical Group, Inc.* | | 2,100 | | | 27,363 |
| | | | | |
| | | | | 326,301 |
| | | | | |
Medical Sterilize Product - 0.7% | | | | | |
STERIS Corp. | | 2,500 | | | 58,200 |
| | | | | |
| | | | | |
| | | Number of
Shares | | Value |
Medical-Biomedical/Genetics - 6.9% | | | | | |
Alexion Pharmaceuticals, Inc.* | | 2,000 | | $ | 75,320 |
Alnylam Pharmaceuticals, Inc.* | | 2,000 | | | 38,080 |
Bio-Rad Laboratories, Inc. Cl. A* | | 600 | | | 39,540 |
Cubist Pharmaceuticals, Inc.* | | 2,700 | | | 44,172 |
Medicines Co.* | | 4,500 | | | 48,780 |
Myriad Genetics, Inc.* | | 1,800 | | | 81,846 |
OSI Pharmaceuticals, Inc.* | | 1,700 | | | 65,042 |
Regeneron Pharmaceuticals, Inc.* | | 3,100 | | | 42,966 |
Seattle Genetics, Inc.* | | 4,400 | | | 43,384 |
Sequenom, Inc.* | | 2,300 | | | 32,706 |
United Therapeutics Corp.* | | 700 | | | 46,263 |
| | | | | |
| | | | | 558,099 |
| | | | | |
Medical-Drugs - 1.5% | | | | | |
Eurand NV* | | 4,600 | | | 51,244 |
Pharmasset, Inc.* | | 3,200 | | | 31,392 |
Sepracor, Inc.* | | 2,500 | | | 36,650 |
| | | | | |
| | | | | 119,286 |
| | | | | |
Medical-Nursing Homes - 0.7% | | | | | |
Sun Healthcare Group, Inc.* | | 6,400 | | | 54,016 |
| | | | | |
Medical-Outpatient/Home Medical Care - 1.6% | | | | | |
Almost Family, Inc.* | | 1,900 | | | 36,271 |
Gentiva Health Services, Inc.* | | 2,500 | | | 38,000 |
LHC Group, Inc.* | | 2,400 | | | 53,472 |
| | | | | |
| | | | | 127,743 |
| | | | | |
MRI/Medical Diagnostic Imaging Centers - 0.4% | | | | | |
Alliance Imaging, Inc.* | | 5,300 | | | 36,040 |
| | | | | |
Oil & Gas Drilling - 0.5% | | | | | |
Atwood Oceanics, Inc.* | | 2,700 | | | 44,793 |
| | | | | |
Oil Companies-Exploration & Production - 3.3% | | | | | |
Arena Resources, Inc.* | | 2,800 | | | 71,344 |
Comstock Resources, Inc.* | | 1,600 | | | 47,680 |
EXCO Resources, Inc.* | | 4,700 | | | 47,000 |
GMX Resources, Inc.* | | 2,500 | | | 16,250 |
Quicksilver Resources, Inc.* | | 7,800 | | | 43,212 |
Whiting Petroleum Corp.* | | 1,600 | | | 41,360 |
| | | | | |
| | | | | 266,846 |
| | | | | |
Oil-Field Services - 1.0% | | | | | |
Cal Dive International, Inc.* | | 6,100 | | | 41,297 |
Global Industries, Ltd.* | | 10,900 | | | 41,856 |
| | | | | |
| | | | | 83,153 |
| | | | | |
Patient Monitoring Equipment - 1.0% | | | | | |
CardioNet, Inc.* | | 1,500 | | | 42,090 |
Mindray Medical International, Ltd. - ADR | | 2,200 | | | 40,722 |
| | | | | |
| | | | | 82,812 |
| | | | | |
Pharmacy Services - 0.6% | | | | | |
Catalyst Health Solutions, Inc. | | 2,400 | | | 47,568 |
| | | | | |
Physical Practice Management - 0.5% | | | | | |
IPC The Hospitalist Co., Inc.* | | 2,300 | | | 43,769 |
| | | | | |
Power Conversion/Supply Equipment - 0.5% | | | | | |
Powell Industries, Inc.* | | 1,200 | | | 42,372 |
| | | | | |
Printing-Commercial - 0.8% | | | | | |
VistaPrint, Ltd.* | | 2,300 | | | 63,227 |
| | | | | |
Private Corrections - 0.7% | | | | | |
Cornell Cos., Inc.* | | 3,500 | | | 57,295 |
| | | | | |
See Accompanying Notes to Financial Statements.
U.S. EMERGING GROWTH FUND
SCHEDULEOF INVESTMENTS
As of March 31, 2009
| | | | | |
| | | Number of
Shares | | Value |
Property/Casualty Insurance - 1.5% | | | | | |
Amtrust Financial Services, Inc. | | 6,500 | | $ | 62,075 |
Tower Group, Inc. | | 2,600 | | | 64,038 |
| | | | | |
| | | | | 126,113 |
| | | | | |
Real Estate Management/Service - 0.5% | | | | | |
Jones Lang LaSalle, Inc. | | 1,900 | | | 44,194 |
| | | | | |
Retail-Apparel/Shoe - 4.5% | | | | | |
Aeropostale, Inc.* | | 2,100 | | | 55,776 |
Collective Brands, Inc.* | | 3,700 | | | 36,038 |
Guess ?, Inc. | | 3,500 | | | 73,780 |
HOT Topic, Inc.* | | 4,000 | | | 44,760 |
JOS. A Bank Clothiers, Inc.* | | 1,500 | | | 41,715 |
Phillips-Van Heusen Corp. | | 2,600 | | | 58,968 |
The Childrens Place Retail Stores, Inc.* | | 2,500 | | | 54,725 |
| | | | | |
| | | | | 365,762 |
| | | | | |
Retail-Miscellaneous/Diversified - 0.6% | | | | | |
Pricesmart, Inc. | | 2,600 | | | 46,826 |
| | | | | |
Retail-Restaurants - 5.6% | | | | | |
Buffalo Wild Wings, Inc.* | | 1,700 | | | 62,186 |
CEC Entertainment, Inc.* | | 2,000 | | | 51,760 |
Chipotle Mexican Grill, Inc. Cl. A* | | 600 | | | 39,828 |
CKE Restaurants, Inc. | | 7,900 | | | 66,360 |
Cracker Barrel Old Country Store, Inc. | | 2,300 | | | 65,872 |
Domino’s Pizza, Inc.* | | 8,500 | | | 55,675 |
Jack in the Box, Inc.* | | 2,500 | | | 58,225 |
Wendy’s/Arby’s Group, Inc. | | 10,600 | | | 53,318 |
| | | | | |
| | | | | 453,224 |
| | | | | |
Schools - 0.7% | | | | | |
Corinthian Colleges, Inc.* | | 2,800 | | | 54,460 |
| | | | | |
Semiconductor Components-Integrated Circuits - 1.4% | | | | | |
Pericom Semiconductor Corp.* | | 7,200 | | | 52,632 |
TriQuint Semiconductor, Inc.* | | 25,800 | | | 63,726 |
| | | | | |
| | | | | 116,358 |
| | | | | |
Semiconductor Equipment - 0.7% | | | | | |
Tessera Technologies, Inc.* | | 4,000 | | | 53,480 |
| | | | | |
Telecommuications Services - 1.3% | | | | | |
NTELOS Holdings Corp. | | 2,400 | | | 43,536 |
Premiere Global Services, Inc.* | | 6,800 | | | 59,976 |
| | | | | |
| | | | | 103,512 |
| | | | | |
Theaters - 0.8% | | | | | |
Cinemark Holdings, Inc. | | 6,800 | | | 63,852 |
| | | | | |
Therapeutics - 2.0% | | | | | |
Cypress Bioscience, Inc.* | | 5,800 | | | 41,238 |
Medarex, Inc.* | | 8,100 | | | 41,553 |
Onyx Pharmaceuticals, Inc.* | | 1,600 | | | 45,680 |
Questcor Pharmaceuticals, Inc.* | | 6,700 | | | 32,964 |
| | | | | |
| | | | | 161,435 |
| | | | | |
Transactional Software - 0.8% | | | | | |
Solera Holdings, Inc.* | | 2,500 | | | 61,950 |
| | | | | |
Transport-Air Freight - 0.8% | | | | | |
Atlas Air Worldwide Holdings, Inc.* | | 3,700 | | | 64,195 |
| | | | | |
Transport-Marine - 1.5% | | | | | |
Diana Shipping, Inc. | | 3,300 | | | 38,907 |
Genco Shipping & Trading, Ltd. | | 3,900 | | | 48,126 |
Gulfmark Offshore, Inc.* | | 1,500 | | | 35,790 |
| | | | | |
| | | | | 122,823 |
| | | | | |
See Accompanying Notes to Financial Statements.
| | | | | | |
| | | Number of
Shares | | Value |
Transport-Rail - 0.5% | | | | | | |
Genesee & Wyoming, Inc. Cl. A* | | | 2,100 | | $ | 44,625 |
| | | | | | |
Transport-Services - 0.5% | | | | | | |
Bristow Group, Inc.* | | | 1,900 | | | 40,717 |
| | | | | | |
Transport-Truck - 1.4% | | | | | | |
Old Dominion Freight Line, Inc.* | | | 2,200 | | | 51,678 |
Saia, Inc.* | | | 5,400 | | | 64,530 |
| | | | | | |
| | | | | | 116,208 |
| | | | | | |
Ultra Sound Imaging Systems - 0.3% | | | | | | |
SonoSite, Inc.* | | | 1,600 | | | 28,608 |
| | | | | | |
Water Treatment Systems - 0.4% | | | | | | |
Energy Recovery, Inc.* | | | 4,800 | | | 36,480 |
| | | | | | |
Wire & Cable Products - 0.6% | | | | | | |
General Cable Corp.* | | | 2,400 | | | 47,568 |
| | | | | | |
Wireless Equipment - 0.4% | | | | | | |
InterDigital, Inc.* | | | 1,300 | | | 33,566 |
| | | | | | |
Total Common Stock (Cost: $9,971,831) | | | | | | 7,935,333 |
| | | | | | |
| | |
| | | Principal
Amount | | |
Short Term Investments - 1.9% | | | | | | |
Time Deposit - 1.9% | | | | | | |
Citibank London | | | | | | |
0.100%, 04/01/09 (Cost: $150,185) | | $ | 150,185 | | | 150,185 |
| | | | | | |
Total Investments - 99.5% (Cost: $10,122,016) | | | | | | 8,085,518 |
| | | | | | |
Other Assets in Excess of Liabilities - 0.5% | | | | | | 41,819 |
| | | | | | |
Net Assets - 100.0% | | | | | $ | 8,127,337 |
| | | | | | |
| * | Non-income producing securities. |
| ADR | - American Depository Receipt |
SCHEDULEOF INVESTMENTSBY SECTOR
as of March 31, 2009
| | | |
Sector | | Percent of
Net Assets | |
Consumer, Non-cyclical | | 32.4 | % |
Consumer, Cyclical | | 16.4 | |
Industrial | | 14.9 | |
Technology | | 13.4 | |
Communications | | 7.1 | |
Energy | | 5.3 | |
Financial | | 4.5 | |
Basic Materials | | 2.7 | |
Utilities | | 0.5 | |
Diversified | | 0.4 | |
Short Term Investments | | 1.9 | |
| | | |
Total Investments | | 99.5 | |
Other assets in excess of liabilities | | 0.5 | |
| | | |
Net Assets | | 100.0 | % |
| | | |
U.S. SMALLTO MID CAP GROWTH FUND
Management Team: John C. McCraw, Portfolio Manager; Robert S. Marren, Portfolio Manager
Chief Investment Officer: Horacio A. Valeiras, CFA
Goal: The U.S. Small to Mid Cap Growth Fund seeks to maximize long-term capital appreciation by investing primarily in stocks from a universe of U.S. companies with small to mid (SMID) market capitalizations similar to the Russell 2500 Growth Index at time of purchase.
Market Overview: The small- to mid-cap growth segment of the U.S. stock market, as measured by the Russell 2500 Growth Index, posted a loss during the twelve months ended March 31, 2009. The decline was part of a widespread sell-off that pressured U.S. equities across styles, sectors and capitalization ranges. Market conditions were volatile, with strong gains early and late in the fiscal year sandwiching dramatic losses in between.
Stocks advanced in April and May, lifted by hopes that expansionary monetary policy from the Federal Reserve would contain the credit crisis which had erupted in 2007. Despite the optimism, the market retreated over the summer due to continued stress in the credit markets, rising inflation and worries about the economy. Then, in September, an unprecedented series of events sent the stock market into a tailspin. Losses on mortgage-related assets forced a major securities firm into bankruptcy, and several other large financial institutions were taken over by the government or sold. Needing to conserve capital, banks pared back lending and credit dried up. Equities continued to plunge throughout most of the fall and winter on growing evidence that the financial crisis had pushed the economy into a deep recession.
The government took bold steps to shore up the financial system and economy, including slashing interest rates, cutting taxes and buying longer-term Treasuries. These actions, along with some good news out of the banking and housing sectors, caused stocks to soar near the end of the period.
Performance: During the fiscal year ended March 31, 2009, the Fund’s Class I shares lost 39.91% and the Russell 2500 Growth Index fell 38.14%.
Portfolio Specifics: Our positioning in energy stocks had a favorable impact on relative results. Amid a steep drop in oil prices, energy was the worst-performing sector in the index, and the Fund was underweight in the group. Our stock selection also added value, helped by positions in Patriot Coal, a coal producer, and Petrohawk Energy, an oil and gas company. Another major source of relative strength was stock selection in the consumer staples sector, where Green Mountain Coffee Roasters was a top performer. This coffee retailer/wholesaler consistently exceeded earnings estimates, driven by strong sales of its single-cup brewing machines.
Stock selection in the health care and consumer discretionary sectors had the largest negative effect on performance versus the index. Major detractors included a biotech firm whose lead drug candidate faced safety issues and an apparel manufacturer with a heavy debt burden. Stock selection and an underweight in information technology were also unfavorable. Information technology was one of the index’s most resilient sectors, supported by the generally strong balance sheets of tech companies.
Market Outlook: The stock market is likely to remain volatile in the months ahead given the challenging economic and earnings environment. Earnings estimates for 2009, already significantly reduced, are likely to decline further. The recession is expected to be longer and deeper than past contractions due to several factors, including tighter lending standards and higher job losses. That said, we are encouraged by the government’s aggressive monetary and fiscal policies, which should restore liquidity to the financial system and set the recovery process in motion.
As always, we believe that our strategy of investing in companies exhibiting sustainable, timely and positive change will result in strong returns in the Fund over time.
Comparison of Change in Value of a $250,000 Investment in U.S. Small to Mid Cap Growth Fund Class I with the Russell 2500 Growth Index.
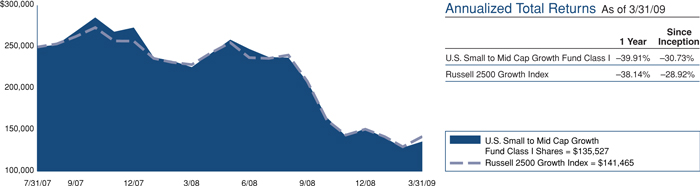
The graph above shows the value of a hypothetical $250,000 investment in the Fund’s Class I shares with the Russell 2500 Growth Index for the periods indicated. Average annual total return figures include changes in principal value, reinvested dividends, and capital gain distributions. The Class I shares commenced operations on July 31, 2007. The total returns shown above do not show the effects of income taxes on an individuals’ investment. In most cases, taxes may reduce your actual investment returns on income or gains paid by the Fund or any gains you may realize if you sell your shares. Past performance cannot guarantee future results.
The Russell 2500 Growth Index is an unmanaged index comprised of those Russell 2500 companies with higher price-to-book ratios and
higher forecasted growth values. The Russell 2500 Index is an unmanaged index generally representative of the 2,500 smallest companies in the Russell 3000 Index, which represents approximately 10% of the total market capitalization of the Russell 3000 Index. Unless otherwise noted, index returns reflect the reinvestment of income, dividends and capital gains, if any, but do not reflect fees, brokerage commissions or other expenses of investing. Investors may not make direct investments into any index. Since markets can go down as well as up, investment return and principal value will fluctuate with market conditions. You may have a gain or loss when you sell your shares.
13
U.S. SMALLTO MID CAP GROWTH FUND
SCHEDULEOF INVESTMENTS
As of March 31, 2009
| | | | | |
| | | Number of
Shares | | Value |
Common Stock - 99.4% | | | | | |
Aerospace/Defense-Equipment - 0.7% | | | | | |
Orbital Sciences Corp.* | | 1,810 | | $ | 21,521 |
| | | | | |
Agricultural Chemicals - 0.6% | | | | | |
Intrepid Potash, Inc.* | | 1,000 | | | 18,450 |
| | | | | |
Airlines - 1.2% | | | | | |
Allegiant Travel Co.* | | 350 | | | 15,911 |
Continental Airlines, Inc. Cl. B* | | 1,460 | | | 12,863 |
JetBlue Airways Corp.* | | 2,660 | | | 9,709 |
| | | | | |
| | | | | 38,483 |
| | | | | |
Alternative Waste Technology - 0.7% | | | | | |
Calgon Carbon Corp.* | | 1,600 | | | 22,672 |
| | | | | |
Applications Software - 3.4% | | | | | |
Compuware Corp.* | | 4,230 | | | 27,876 |
Ebix, Inc.* | | 1,100 | | | 27,335 |
Nuance Communications, Inc.* | | 1,970 | | | 21,394 |
Red Hat, Inc.* | | 1,600 | | | 28,544 |
| | | | | |
| | | | | 105,149 |
| | | | | |
Auto-Medium & Heavy Duty Trucks - 0.9% | | | | | |
Navistar International Corp.* | | 800 | | | 26,768 |
| | | | | |
Batteries/Battery Systems - 0.6% | | | | | |
Greatbatch, Inc.* | | 1,000 | | | 19,350 |
| | | | | |
Broadcast Services/Programming - 0.8% | | | | | |
DG FastChannel, Inc.* | | 1,300 | | | 24,401 |
| | | | | |
Building-Heavy Construction - 0.4% | | | | | |
Chicago Bridge & Iron Co. | | 2,200 | | | 13,794 |
| | | | | |
Chemicals-Specialty - 1.3% | | | | | |
Ashland, Inc. | | 2,300 | | | 23,759 |
Cytec Industries, Inc. | | 1,100 | | | 16,522 |
| | | | | |
| | | | | 40,281 |
| | | | | |
Coal - 0.6% | | | | | |
Massey Energy Co. | | 1,700 | | | 17,204 |
| | | | | |
Coffee - 0.5% | | | | | |
Green Mountain Coffee Roasters, Inc.* | | 300 | | | 14,400 |
| | | | | |
Commercial Banks-Southern US - 0.8% | | | | | |
Bank of the Ozarks, Inc. | | 1,100 | | | 25,388 |
| | | | | |
Commercial Services-Finance - 0.6% | | | | | |
Wright Express Corp.* | | 1,000 | | | 18,220 |
| | | | | |
Computers-Peripheral Equipment - 0.9% | | | | | |
Synaptics, Inc.* | | 1,100 | | | 29,436 |
| | | | | |
Consulting Services - 1.3% | | | | | |
FTI Consulting, Inc.* | | 500 | | | 24,740 |
Watson Wyatt Worldwide, Inc. Cl. A | | 340 | | | 16,786 |
| | | | | |
| | | | | 41,526 |
| | | | | |
Consumer Products-Miscellaneous - 1.3% | | | | | |
Scotts Miracle-Gro Co. Cl. A | | 700 | | | 24,290 |
Tupperware Brands Corp. | | 1,000 | | | 16,990 |
| | | | | |
| | | | | 41,280 |
| | | | | |
Containers-Paper/Plastic - 0.6% | | | | | |
Rock-Tenn Co. Cl. A | | 710 | | | 19,206 |
| | | | | |
Diagnostic Kits - 0.8% | | | | | |
Inverness Medical Innovations, Inc.* | | 900 | | | 23,967 |
| | | | | |
Disposable Medical Products - 0.9% | | | | | |
ICU Medical, Inc.* | | 850 | | | 27,302 |
| | | | | |
Distribution/Wholesale - 0.7% | | | | | |
LKQ Corp.* | | 1,600 | | | 22,832 |
| | | | | |
See Accompanying Notes to Financial Statements.
| | | | | |
| | | Number of
Shares | | Value |
Diversified Manufacturing Operations - 0.9% | | | | | |
Brink’s Co. | | 1,090 | | $ | 28,841 |
| | | | | |
E-Commerce/Services - 0.6% | | | | | |
IAC/InterActiveCorp* | | 1,300 | | | 19,799 |
| | | | | |
Electric-Integrated - 0.6% | | | | | |
Unisource Energy Corp. | | 660 | | | 18,605 |
| | | | | |
Electronic Components-Miscellaneous - 0.6% | | | | | |
NVE Corp.* | | 600 | | | 17,286 |
| | | | | |
Electronic Components-Semiconductors - 3.8% | | | | | |
LSI Corp.* | | 7,510 | | | 22,830 |
Macrovision Solutions Corp.* | | 1,820 | | | 32,378 |
ON Semiconductor Corp.* | | 3,570 | | | 13,923 |
PMC - Sierra, Inc.* | | 3,020 | | | 19,268 |
Skyworks Solutions, Inc.* | | 3,590 | | | 28,935 |
| | | | | |
| | | | | 117,334 |
| | | | | |
Electronic Design Automations - 0.5% | | | | | |
Mentor Graphics Corp.* | | 3,200 | | | 14,208 |
| | | | | |
Electronic Measure Instruments - 1.2% | | | | | |
Axsys Technologies, Inc.* | | 400 | | | 16,816 |
Flir Systems, Inc.* | | 540 | | | 11,059 |
Itron, Inc.* | | 220 | �� | | 10,417 |
| | | | | |
| | | | | 38,292 |
| | | | | |
E-Marketing/Information - 0.7% | | | | | |
Digital River, Inc.* | | 700 | | | 20,874 |
| | | | | |
Engineering/R & D Services - 1.3% | | | | | |
Stanley, Inc.* | | 1,000 | | | 25,390 |
URS Corp.* | | 400 | | | 16,164 |
| | | | | |
| | | | | 41,554 |
| | | | | |
Enterprise Software/Services - 2.1% | | | | | |
Mantech International Corp. Cl. A* | | 450 | | | 18,855 |
Novell, Inc.* | | 4,700 | | | 20,022 |
Sybase, Inc.* | | 900 | | | 27,261 |
| | | | | |
| | | | | 66,138 |
| | | | | |
E-Services/Consulting - 0.8% | | | | | |
Websense, Inc.* | | 1,950 | | | 23,400 |
| | | | | |
Finance-Consumer Loans - 0.9% | | | | | |
Ocwen Financial Corp.* | | 2,500 | | | 28,575 |
| | | | | |
Finance-Investment Bankers/Brokers - 0.7% | | | | | |
SWS Group, Inc. | | 1,400 | | | 21,742 |
| | | | | |
Food-Miscellaneous/Diversified - 2.4% | | | | | |
American Italian Pasta Co.* | | 1,000 | | | 34,810 |
Diamond Foods, Inc. | | 800 | | | 22,344 |
Ralcorp Holdings, Inc.* | | 330 | | | 17,780 |
| | | | | |
| | | | | 74,934 |
| | | | | |
Food-Wholesale/Distribution - 1.3% | | | | | |
Spartan Stores, Inc. | | 1,400 | | | 21,574 |
United Natural Foods, Inc.* | | 1,010 | | | 19,160 |
| | | | | |
| | | | | 40,734 |
| | | | | |
Footwear & Related Apparel - 0.9% | | | | | |
Deckers Outdoor Corp.* | | 500 | | | 26,520 |
| | | | | |
Hazardous Waste Disposal - 1.0% | | | | | |
Stericycle, Inc.* | | 650 | | | 31,025 |
| | | | | |
Internet Applications Software - 1.5% | | | | | |
Art Technology Group, Inc.* | | 7,800 | | | 19,890 |
Cybersource Corp.* | | 1,750 | | | 25,918 |
| | | | | |
| | | | | 45,808 |
| | | | | |
SCHEDULEOF INVESTMENTS
As of March 31, 2009
| | | | | |
| | | Number of
Shares | | Value |
Internet Infrastructure Equipment - 0.5% | | | | | |
Avocent Corp.* | | 1,370 | | $ | 16,632 |
| | | | | |
Internet Infrastructure Software - 2.0% | | | | | |
Akamai Technologies, Inc.* | | 1,700 | | | 32,980 |
AsiaInfo Holdings, Inc.* | | 1,700 | | | 28,645 |
| | | | | |
| | | | | 61,625 |
| | | | | |
Internet Security - 1.0% | | | | | |
McAfee, Inc.* | | 930 | | | 31,155 |
| | | | | |
Intimate Apparel - 0.9% | | | | | |
The Warnaco Group, Inc.* | | 1,200 | | | 28,800 |
| | | | | |
Machinery-Construction & Mining - 0.8% | | | | | |
Bucyrus International, Inc. Cl. A | | 1,600 | | | 24,288 |
| | | | | |
Marine Services - 0.9% | | | | | |
Aegean Marine Petroleum Network, Inc. | | 1,700 | | | 28,475 |
| | | | | |
Medical Information Systems - 0.5% | | | | | |
Computer Programs & Systems, Inc. | | 500 | | | 16,635 |
| | | | | |
Medical Instruments - 2.6% | | | | | |
Edwards Lifesciences Corp.* | | 400 | | | 24,252 |
Integra LifeSciences Holdings Corp.* | | 640 | | | 15,827 |
NuVasive, Inc.* | | 600 | | | 18,828 |
Thoratec Corp.* | | 810 | | | 20,809 |
| | | | | |
| | | | | 79,716 |
| | | | | |
Medical Products - 2.5% | | | | | |
American Medical Systems Holdings, Inc.* | | 2,700 | | | 30,105 |
Haemonetics Corp.* | | 500 | | | 27,540 |
Hanger Orthopedic Group, Inc.* | | 1,400 | | | 18,550 |
| | | | | |
| | | | | 76,195 |
| | | | | |
Medical Sterilize Product - 0.8% | | | | | |
STERIS Corp. | | 1,000 | | | 23,280 |
| | | | | |
Medical-Biomedical/Genetics - 8.9% | | | | | |
Alexion Pharmaceuticals, Inc.* | | 730 | | | 27,492 |
Bio-Rad Laboratories, Inc. Cl. A* | | 230 | | | 15,157 |
Cubist Pharmaceuticals, Inc.* | | 1,000 | | | 16,360 |
Illumina, Inc.* | | 740 | | | 27,558 |
Life Technologies Corp. | | 700 | | | 22,736 |
Medicines Co.* | | 2,000 | | | 21,680 |
Myriad Genetics, Inc.* | | 800 | | | 36,376 |
OSI Pharmaceuticals, Inc.* | | 700 | | | 26,782 |
Qiagen NV* | | 1,060 | | | 16,917 |
Regeneron Pharmaceuticals, Inc.* | | 900 | | | 12,474 |
Sequenom, Inc.* | | 780 | | | 11,091 |
United Therapeutics Corp.* | | 230 | | | 15,201 |
Vertex Pharmaceuticals, Inc.* | | 900 | | | 25,857 |
| | | | | |
| | | | | 275,681 |
| | | | | |
Medical-Drugs - 0.9% | | | | | |
Cephalon, Inc.* | | 410 | | | 27,921 |
| | | | | |
Medical-Generic Drugs - 0.6% | | | | | |
Mylan, Inc.* | | 1,500 | | | 20,115 |
| | | | | |
Medical-Nursing Homes - 0.5% | | | | | |
Sun Healthcare Group, Inc.* | | 1,930 | | | 16,289 |
| | | | | |
Medical-Outpatient/Home Medical Care - 0.5% | | | | | |
LHC Group, Inc.* | | 730 | | | 16,264 |
| | | | | |
MRI/Medical Diagnostic Imaging Centers - 0.9% | | | | | |
Alliance Imaging, Inc.* | | 4,260 | | | 28,968 |
| | | | | |
Multi-line Insurance - 0.5% | | | | | |
Assurant, Inc. | | 700 | | | 15,246 |
| | | | | |
See Accompanying Notes to Financial Statements.
| | | | | |
| | | Number of
Shares | | Value |
Oil & Gas Drilling - 0.9% | | | | | |
Atwood Oceanics, Inc.* | | 1,650 | | $ | 27,373 |
| | | | | |
Oil Companies-Exploration & Production - 3.6% | | | | | |
Arena Resources, Inc.* | | 940 | | | 23,951 |
Encore Acquisition Co.* | | 800 | | | 18,616 |
PetroHawk Energy Corp.* | | 1,560 | | | 29,999 |
Quicksilver Resources, Inc.* | | 2,920 | | | 16,177 |
Whiting Petroleum Corp.* | | 840 | | | 21,714 |
| | | | | |
| | | | | 110,457 |
| | | | | |
Oil-Field Services - 0.8% | | | | | |
Hornbeck Offshore Services, Inc.* | | 1,600 | | | 24,384 |
| | | | | |
Patient Monitoring Equipment - 0.5% | | | | | |
CardioNet, Inc.* | | 600 | | | 16,836 |
| | | | | |
Pharmacy Services - 1.2% | | | | | |
Catalyst Health Solutions, Inc. | | 920 | | | 18,235 |
Omnicare, Inc. | | 760 | | | 18,612 |
| | | | | |
| | | | | 36,847 |
| | | | | |
Physical Practice Management - 0.6% | | | | | |
IPC The Hospitalist Co., Inc.* | | 920 | | | 17,508 |
| | | | | |
Power Conversion/Supply Equipment - 0.7% | | | | | |
Powell Industries, Inc.* | | 610 | | | 21,539 |
| | | | | |
Printing-Commercial - 0.7% | | | | | |
VistaPrint, Ltd.* | | 800 | | | 21,992 |
| | | | | |
Property/Casualty Insurance - 1.6% | | | | | |
Amtrust Financial Services, Inc. | | 2,730 | | | 26,072 |
Tower Group, Inc. | | 1,000 | | | 24,630 |
| | | | | |
| | | | | 50,702 |
| | | | | |
Real Estate Management/Service - 0.6% | | | | | |
Jones Lang LaSalle, Inc. | | 800 | | | 18,608 |
| | | | | |
Respiratory Products - 0.7% | | | | | |
ResMed, Inc.* | | 580 | | | 20,497 |
| | | | | |
Retail-Apparel/Shoe - 4.8% | | | | | |
Aeropostale, Inc.* | | 1,000 | | | 26,560 |
Guess ?, Inc. | | 1,600 | | | 33,728 |
JOS. A Bank Clothiers, Inc.* | | 700 | | | 19,467 |
Phillips-Van Heusen Corp. | | 1,000 | | | 22,680 |
The Childrens Place Retail Stores, Inc.* | | 1,160 | | | 25,392 |
Urban Outfitters, Inc.* | | 1,300 | | | 21,281 |
| | | | | |
| | | | | 149,108 |
| | | | | |
Retail-Appliances - 0.5% | | | | | |
Conn’s, Inc.* | | 1,000 | | | 14,040 |
| | | | | |
Retail-Computer Equipment - 0.6% | | | | | |
GameStop Corp. Cl. A* | | 710 | | | 19,894 |
| | | | | |
Retail-Restaurants - 3.9% | | | | | |
Buffalo Wild Wings, Inc.* | | 630 | | | 23,045 |
CKE Restaurants, Inc. | | 2,730 | | | 22,932 |
Jack in the Box, Inc.* | | 1,200 | | | 27,948 |
Red Robin Gourmet Burgers, Inc.* | | 1,200 | | | 21,156 |
Wendy’s/Arby’s Group, Inc. | | 4,900 | | | 24,647 |
| | | | | |
| | | | | 119,728 |
| | | | | |
Schools - 2.0% | | | | | |
Corinthian Colleges, Inc.* | | 900 | | | 17,505 |
DeVry, Inc. | | 300 | | | 14,454 |
ITT Educational Services, Inc.* | | 250 | | | 30,355 |
| | | | | |
| | | | | 62,314 |
| | | | | |
U.S. SMALLTO MID CAP GROWTHFUND
SCHEDULEOF INVESTMENTS
As of March 31, 2009
| | | | | |
| | | Number of
Shares | | Value |
Semiconductor Components-Integrated Circuits - 0.7% | | | | | |
TriQuint Semiconductor, Inc.* | | 8,850 | | $ | 21,860 |
| | | | | |
Semiconductor Equipment - 0.8% | | | | | |
Tessera Technologies, Inc.* | | 1,800 | | | 24,066 |
| | | | | |
Telecommuications Services - 1.2% | | | | | |
NTELOS Holdings Corp. | | 900 | | | 16,326 |
Premiere Global Services, Inc.* | | 2,470 | | | 21,785 |
| | | | | |
| | | | | 38,111 |
| | | | | |
Therapeutics - 0.5% | | | | | |
Onyx Pharmaceuticals, Inc.* | | 500 | | | 14,275 |
| | | | | |
Transport-Air Freight - 0.9% | | | | | |
Atlas Air Worldwide Holdings, Inc.* | | 1,600 | | | 27,760 |
| | | | | |
Transport-Marine - 0.7% | | | | | |
Diana Shipping, Inc. | | 1,800 | | | 21,222 |
| | | | | |
Transport-Rail - 0.7% | | | | | |
Genesee & Wyoming, Inc. Cl. A* | | 1,010 | | | 21,463 |
| | | | | |
Transport-Services - 0.7% | | | | | |
Bristow Group, Inc.* | | 1,000 | | | 21,430 |
| | | | | |
Transport-Truck - 0.7% | | | | | |
Saia, Inc.* | | 1,700 | | | 20,315 |
| | | | | |
Vitamins & Nutrition Products - 0.7% | | | | | |
Mead Johnson Nutrition Co. Cl. A* | | 800 | | | 23,096 |
| | | | | |
Wire & Cable Products - 0.8% | | | | | |
General Cable Corp.* | | 1,200 | | | 23,784 |
| | | | | |
Wireless Equipment - 0.6% | | | | | |
InterDigital, Inc.* | | 700 | | | 18,074 |
| | | | | |
Total Common Stock (Cost: $3,522,244) | | | | | 3,081,867 |
| | | | | |
| | | | | | |
| | | Principal
Amount | | |
Short Term Investments - 0.0% | | | | | | |
Time Deposit - 0.0% | | | | | | |
Brown Brothers Harriman & Co. - Grand Cayman 0.100%, 04/01/09 (Cost: $797) | | $ | 797 | | | 797 |
| | | | | | |
Total Investments - 99.4% (Cost: $3,523,041) | | | | | | 3,082,664 |
| | | | | | |
Other Assets in Excess of Liabilities - 0.6% | | | | | | 19,815 |
| | | | | | |
Net Assets - 100.0% | | | | | $ | 3,102,479 |
| | | | | | |
| * | Non-income producing securities. |
See Accompanying Notes to Financial Statements.
SCHEDULEOF INVESTMENTSBY SECTOR
as of March 31, 2009
| | | |
Sector | | Percent of
Net Assets | |
Consumer, Non-cyclical | | 35.1 | % |
Consumer, Cyclical | | 14.4 | |
Industrial | | 14.0 | |
Technology | | 12.7 | |
Communications | | 9.7 | |
Energy | | 5.8 | |
Financial | | 5.2 | |
Basic Materials | | 1.9 | |
Utilities | | 0.6 | |
Short Term Investments | | 0.0 | |
| | | |
Total Investments | | 99.4 | |
Other assets in excess of liabilities | | 0.6 | |
| | | |
Net Assets | | 100.0 | % |
| | | |
U.S. SYSTEMATIC LARGE CAP GROWTH FUND
Management Team: James Li, Ph.D., CFA, Portfolio Manager; Jane Edmondson, Portfolio Manager
Chief Investment Officer: Horacio A. Valeiras, CFA
Goal: The U.S. Systematic Large Cap Growth Fund seeks to maximize long-term capital appreciation by investing primarily in stocks from a universe of large U.S. companies with market capitalizations similar to the Russell 1000 Growth Index at time of purchase.
Market Overview: The Russell 1000 Growth Index declined in the fiscal year ended March 31, 2009. During the period, the U.S. stock market suffered its most severe correction since the 1930s. Weakness was driven by:
| | • | | Deterioration in the value of mortgage-related securities, which led to the collapse or near collapse of several bellwether financial institutions |
| | • | | Fear of a systemic failure in the financial system, which made banks restrict credit and forced investors, consumers and businesses to rely less on debt |
| | • | | Rapid drop in economic activity and corporate earnings, with S&P 500 companies posting a sixth consecutive decline in quarterly earnings — the longest stretch on record |
Major market indexes touched twelve-year lows in February, despite the Federal Reserve having lowered its key lending rate to near zero and the government having pledged an estimated $11.6 trillion in rescue and stimulus programs. However, the stock market rallied sharply in the last few weeks of March due to a number of positive developments. For example, sales of new and existing homes jumped unexpectedly in February, and several large banks said they were profitable in the first two months of 2009.
Performance: The Fund’s Class I shares posted a 33.68% decline during the twelve months ended March 31, 2009 but outperformed the Russell 1000 Growth Index, which lost 34.28%.
Portfolio Specifics: Performance versus the index benefited from stock selection in the energy and consumer discretionary sectors. Holdings that generated gains included Cameron International, an energy equipment and services company that benefited from a positive outlook for its subsea business; Family Dollar Stores, a discount retailer that saw an increase in customer traffic; and fast-food chain McDonald’s, which reported consistent growth in same-store-sales. A number of our health care stocks also posted gains in the down market, including biotechnology firm Amgen. Amgen benefited from expectations that its lead product candidate, an osteoporosis drug, could be a major growth driver for the company.
Areas of relative weakness included stock selection in the industrials and materials sectors. Two of the biggest detractors in the portfolio were a railroad that was hurt by declining freight volumes and a mining company that was impacted by falling copper prices.
The Fund’s holdings remained broadly diversified throughout the fiscal year. On March 31, 2009, the largest overweights versus the Russell 1000 Growth Index were in the health care (+8.1%) and energy (+1.3%) sectors. The largest underweights were in industrials (–2.5%) and information technology (–2.4%).
Market Outlook: Our process evaluates investment opportunities on a relative basis and is required to remain fully invested. As such, the process neither utilizes, nor results in, a forecast or outlook on the overall market, but expects to perform equally well in both up and down markets versus the Russell 1000 Growth Index.
Through consistent application of our systematic, model-driven process, we believe that the Fund will add value relative to the benchmark over time.
Comparison of Change in Value of a $250,000 Investment in U.S. Systematic Large Cap Growth Fund Class I and II Shares with the Russell 1000 Growth Index.
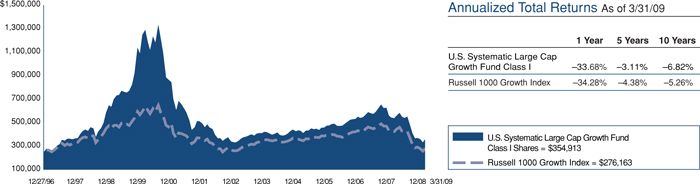
17
U.S. SYSTEMATIC LARGE CAP GROWTH FUND
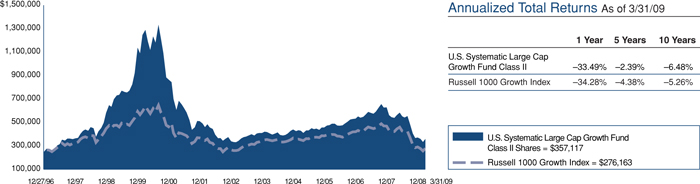
The graphs above show the value of a hypothetical $250,000 investment in the Fund’s Class I and II shares compared with the Russell 1000 Growth Index for the periods indicated. The Fund’s Class I and II shares calculate their performance based upon the historical performance of a corresponding series of Nicholas-Applegate Mutual Funds (renamed ING Mutual Funds), adjusted to reflect all fees and expenses applicable to the Fund’s Class I and II shares. The Nicholas-Applegate Institutional Funds’ Class I shares were first available on May 7, 1999 and Class II shares on September 30, 2005. The historical performance of Class II shares includes the performance of Class I shares for periods prior to the inception of Class II. Average annual total return figures include changes in principal value, reinvested dividends, and capital gain distributions. The total returns shown above do not show the effects of income taxes on an individual’s investment. In most cases, taxes may reduce your actual investment returns on income or gains paid by the Fund or
any gains you may realize if you sell your shares. Past performance cannot guarantee future results.
The Russell 1000 Growth Index measures the performance of those Russell 1000 companies with higher price-to-book ratios and higher forecasted growth values. The Russell 1000 Index consists of the 1,000 largest securities in the Russell 3000 Index, which represents approximately 90% of the total market capitalization of the Russell 3000 Index. It is a large-cap, market-oriented index and is highly correlated with the S&P 500 Index. Unless otherwise noted, index returns reflect the reinvestment of income dividends and capital gains, if any, but do not reflect fees, brokerage commissions or other expenses of investing. One cannot invest directly in an index. Since markets can go down as well as up, investment return and principal value will fluctuate with market conditions. You may have a gain or loss when you sell your shares.
U.S SYSTEMATIC LARGE CAP GROWTH FUND
SCHEDULEOF INVESTMENTS
As of March 31, 2009
| | | | | |
| | | Number of
Shares | | Value |
Common Stock - 99.1% | | | | | |
Advertising Agencies - 0.4% | | | | | |
Interpublic Group of Cos., Inc.* | | 6,200 | | $ | 25,544 |
| | | | | |
Aerospace/Defense - 4.3% | | | | | |
Lockheed Martin Corp. | | 1,900 | | | 131,157 |
Northrop Grumman Corp. | | 3,200 | | | 139,648 |
| | | | | |
| | | | | 270,805 |
| | | | | |
Agricultural Chemicals - 1.7% | | | | | |
CF Industries Holdings, Inc. | | 1,500 | | | 106,695 |
| | | | | |
Agricultural Operations - 1.0% | | | | | |
Archer-Daniels-Midland Co. | | 2,300 | | | 63,894 |
| | | | | |
Applications Software - 4.3% | | | | | |
Microsoft Corp. | | 14,600 | | | 268,202 |
| | | | | |
Beverages-Non-alcoholic - 2.3% | | | | | |
Coca-Cola Co. | | 2,500 | | | 109,875 |
PepsiCo, Inc. | | 600 | | | 30,888 |
| | | | | |
| | | | | 140,763 |
| | | | | |
Building-Residential/Commercial - 1.1% | | | | | |
Pulte Homes, Inc. | | 6,200 | | | 67,766 |
| | | | | |
Cable/Satellite TV - 0.2% | | | | | |
Time Warner Cable, Inc. Cl. A | | 635 | | | 15,748 |
| | | | | |
Coatings/Paint - 0.9% | | | | | |
Sherwin-Williams Co. | | 1,100 | | | 57,167 |
| | | | | |
Computer Services - 1.0% | | | | | |
Accenture, Ltd. Cl. A | | 2,200 | | | 60,478 |
| | | | | |
Computers - 7.5% | | | | | |
Apple, Inc.* | | 1,400 | | | 147,168 |
Hewlett-Packard Co. | | 3,700 | | | 118,622 |
International Business Machines Corp. | | 2,100 | | | 203,469 |
| | | | | |
| | | | | 469,259 |
| | | | | |
Computers-Memory Devices - 0.5% | | | | | |
EMC Corp./Massachusetts* | | 2,800 | | | 31,920 |
| | | | | |
Data Processing/Management - 1.4% | | | | | |
Fiserv, Inc.* | | 2,400 | | | 87,504 |
| | | | | |
E-Commerce/Products - 2.0% | | | | | |
Amazon.com, Inc.* | | 1,700 | | | 124,848 |
| | | | | |
Electronic Components-Semiconductors - 2.6% | | | | | |
Intel Corp. | | 7,600 | | | 114,380 |
Xilinx, Inc. | | 2,400 | | | 45,984 |
| | | | | |
| | | | | 160,364 |
| | | | | |
Engineering/R & D Services - 2.4% | | | | | |
Fluor Corp. | | 1,100 | | | 38,005 |
The Shaw Group, Inc.* | | 900 | | | 24,669 |
URS Corp.* | | 2,200 | | | 88,902 |
| | | | | |
| | | | | 151,576 |
| | | | | |
Enterprise Software/Services - 1.5% | | | | | |
Oracle Corp. | | 5,300 | | | 95,771 |
| | | | | |
Food-Miscellaneous/Diversified - 1.8% | | | | | |
General Mills, Inc. | | 2,300 | | | 114,724 |
| | | | | |
Gold Mining - 0.6% | | | | | |
Newmont Mining Corp. | | 800 | | | 35,808 |
| | | | | |
Internet Infrastructure Software - 0.5% | | | | | |
F5 Networks, Inc.* | | 1,400 | | | 29,330 |
| | | | | |
See Accompanying Notes to Financial Statements.
| | | | | |
| | | Number of
Shares | | Value |
Medical Instruments - 1.6% | | | | | |
Boston Scientific Corp.* | | 7,900 | | $ | 62,805 |
St. Jude Medical, Inc.* | | 1,100 | | | 39,963 |
| | | | | |
| | | | | 102,768 |
| | | | | |
Medical Products - 0.9% | | | | | |
Johnson & Johnson | | 1,100 | | | 57,860 |
| | | | | |
Medical-Biomedical/Genetics - 4.0% | | | | | |
Amgen, Inc.* | | 2,800 | | | 138,656 |
Biogen Idec, Inc.* | | 800 | | | 41,936 |
Celgene Corp.* | | 1,600 | | | 71,040 |
| | | | | |
| | | | | 251,632 |
| | | | | |
Medical-Drugs - 10.1% | | | | | |
Abbott Laboratories | | 2,700 | | | 128,790 |
Bristol-Myers Squibb Co. | | 6,200 | | | 135,904 |
Cephalon, Inc.##,* | | 1,400 | | | 95,340 |
Eli Lilly & Co. | | 2,700 | | | 90,207 |
Forest Laboratories, Inc.* | | 2,800 | | | 61,488 |
Schering-Plough Corp. | | 5,000 | | | 117,750 |
| | | | | |
| | | | | 629,479 |
| | | | | |
Medical-Generic Drugs - 1.0% | | | | | |
Mylan, Inc.* | | 4,500 | | | 60,345 |
| | | | | |
Medical-HMO - 1.4% | | | | | |
UnitedHealth Group, Inc.* | | 2,300 | | | 48,139 |
WellPoint, Inc.* | | 1,100 | | | 41,767 |
| | | | | |
| | | | | 89,906 |
| | | | | |
Multi-line Insurance - 1.2% | | | | | |
ACE, Ltd. | | 1,800 | | | 72,720 |
| | | | | |
Multimedia - 0.8% | | | | | |
Time Warner, Inc. | | 2,533 | | | 48,887 |
| | | | | |
Networking Products - 4.0% | | | | | |
Cisco Systems, Inc.* | | 14,800 | | | 248,196 |
| | | | | |
Oil & Gas Drilling - 1.3% | | | | | |
ENSCO International, Inc. | | 3,000 | | | 79,200 |
| | | | | |
Oil Companies-Exploration & Production - 2.1% | | | | | |
Occidental Petroleum Corp. | | 1,500 | | | 83,475 |
Southwestern Energy Co.* | | 1,700 | | | 50,473 |
| | | | | |
| | | | | 133,948 |
| | | | | |
Oil Companies-Integrated - 1.3% | | | | | |
Exxon Mobil Corp. | | 1,200 | | | 81,720 |
| | | | | |
Oil Field Machine & Equipment - 3.4% | | | | | |
Cameron International Corp.* | | 4,400 | | | 96,492 |
National Oilwell Varco, Inc.* | | 4,000 | | | 114,840 |
| | | | | |
| | | | | 211,332 |
| | | | | |
Oil Refining & Marketing - 1.1% | | | | | |
Valero Energy Corp. | | 3,800 | | | 68,020 |
| | | | | |
Pharmacy Services - 4.0% | | | | | |
Express Scripts, Inc. Cl. A* | | 500 | | | 23,085 |
Medco Health Solutions, Inc.* | | 2,400 | | | 99,216 |
Omnicare, Inc. | | 5,100 | | | 124,899 |
| | | | | |
| | | | | 247,200 |
| | | | | |
Retail-Discount - 5.6% | | | | | |
Family Dollar Stores, Inc. | | 2,500 | | | 83,425 |
Wal-Mart Stores, Inc. | | 5,100 | | | 265,710 |
| | | | | |
| | | | | 349,135 |
| | | | | |
U.S SYSTEMATIC LARGE CAP GROWTH FUND
SCHEDULEOF INVESTMENTS
As of March 31, 2009
| | | | | |
| | | Number of
Shares | | Value |
Retail-Drug Store - 1.0% | | | | | |
CVS Caremark Corp. | | 2,300 | | $ | 63,227 |
| | | | | |
Retail-Restaurants - 2.8% | | | | | |
McDonald’s Corp. | | 1,400 | | | 76,398 |
Panera Bread Co. Cl. A##,* | | 1,800 | | | 100,620 |
| | | | | |
| | | | | 177,018 |
| | | | | |
Schools - 1.6% | | | | | |
Apollo Group, Inc. Cl. A* | | 900 | | | 70,497 |
DeVry, Inc. | | 600 | | | 28,908 |
| | | | | |
| | | | | 99,405 |
| | | | | |
Semicon Components-Integrated Circuits - 1.0% | | | | | |
Marvell Technology Group, Ltd.* | | 7,000 | | | 64,120 |
| | | | | |
Tobacco - 3.7% | | | | | |
Altria Group, Inc. | | 10,900 | | | 174,618 |
Philip Morris International, Inc. | | 1,600 | | | 56,928 |
| | | | | |
| | | | | 231,546 |
| | | | | |
Transport-Rail - 2.6% | | | | | |
CSX Corp. | | 3,400 | | | 87,890 |
Norfolk Southern Corp. | | 1,400 | | | 47,250 |
Union Pacific Corp. | | 700 | | | 28,777 |
| | | | | |
| | | | | 163,917 |
| | | | | |
Web Portals/ISP - 3.1% | | | | | |
Google, Inc. Cl. A* | | 300 | | | 104,418 |
Sohu.com, Inc.* | | 2,100 | | | 86,751 |
| | | | | |
| | | | | 191,169 |
| | | | | |
Wireless Equipment - 1.5% | | | | | |
QUALCOMM, Inc. | | 2,400 | | | 93,384 |
| | | | | |
Total Common Stock (Cost: $6,998,778) | | | | | 6,194,300 |
| | | | | |
| | | | | | | |
| | | Principal
Amount | | | |
Short Term Investments - 5.2% | | | | | | | |
Repurchase Agreement - 2.7% | | | | | | | |
Credit Suisse Securities, LLC, 0.150% dated 3/31/09, to be repurchased at $170,101 on 4/1/09 (collateralized by U.S. Treasury Bill, 0.000% due 6/18/09)** | | $ | 170,100 | | | 170,100 | |
| | | | | | | |
Time Deposit - 2.5% | | | | | | | |
Citibank London | | | | | | | |
0.100%, 04/01/09 | | | 152,082 | | | 152,082 | |
| | | | | | | |
Total Short Term Investments (Cost: $322,182) | | | | | | 322,182 | |
| | | | | | | |
Total Investments - 104.3% (Cost: $7,320,960) | | | | | | 6,516,482 | |
| | | | | | | |
Liabilities in Excess of Other Assets - (4.3%) | | | | | | (268,910 | ) |
| | | | | | | |
Net Assets - 100.0% | | | | | $ | 6,247,572 | |
| | | | | | | |
| * | Non-income producing securities. |
| ## | All or a portion of the Fund’s holdings in this security was on loan as of March 31, 2009. |
| ** | All of the security is purchased with cash collateral proceeds from securities loans. |
See Accompanying Notes to Financial Statements.
SCHEDULEOF INVESTMENTSBY SECTOR
as of March 31, 2009
| | | |
Sector | | Percent of
Net Assets | |
Consumer, Non-cyclical | | 33.4 | % |
Technology | | 19.8 | |
Communications | | 12.4 | |
Consumer, Cyclical | | 10.5 | |
Industrial | | 9.4 | |
Energy | | 9.2 | |
Basic Materials | | 3.2 | |
Financial | | 1.2 | |
Short Term Investments | | 5.2 | |
| | | |
Total Investments | | 104.3 | |
Liabilities in excess of other assets | | (4.3 | ) |
| | | |
Net Assets | | 100.0 | % |
| | | |
U.S. CONVERTIBLE FUND
Management Team: Douglas G. Forsyth, CFA, Portfolio Manager; William L. Stickney, Portfolio Manager; Justin Kass, CFA, Portfolio Manager ; Michael E.Yee, Portfolio Manager
Chief Investment Officer: Horacio A. Valeiras, CFA
Goal: The U.S. Convertible Fund seeks to maximize total return consisting of capital appreciation and current income by investing primarily in securities that are convertible into common stock, across all ratings and capitalization ranges.
Market Overview: In the twelve months ended March 31, 2009, the Merrill Lynch All Convertibles All Qualities Index declined 30.00%, with most of the weakness concentrated in the September-to-early December time frame. By way of comparison, the S&P 500 Index fell 38.09% and the NASDAQ Composite Index lost 32.93% during the fiscal year.
The decline in the convertible market was caused by the domino effect of the unwinding of leverage in the financial markets that traced back to mortgage delinquencies and falling home prices. Forced liquidations of leveraged positions found few willing buyers, so even the smallest trades created gaps in pricing. Lower prices fueled more selling, as additional leverage triggers were struck. The market tried to absorb this activity amid fewer market makers, and those remaining dealers were unwilling to transact. The lack of transaction confidence worsened in the weeks surrounding the September failure of a major U.S. investment bank. By the end of 2008, economic indicators were universally weak and corporate earnings had faltered.
In the first quarter of 2009, the economy did not improve, the government expanded its stimulus programs, the federal funds rate was near zero and earnings remained highly unpredictable. While all of these factors are negative for credit and equity fundamentals, convertibles posted a gain in the first quarter. The positive return was driven by the oversold condition of the credit markets and signs of stabilization in the convertible market.
Performance: During the fiscal year ended March 31, 2009, the Fund’s Class I shares lost 21.30% but outperformed the Merrill Lynch All Convertibles All Qualities Index, which fell 30.00%.
Portfolio Specifics: Security selection was the key driver of the Fund’s outperformance, and our positions in the health care and telecommunications industries helped relative results. Health care companies benefited from their stable earnings and cash flows given the flight to safety that occurred. Telecommunications names also benefited from the relative stability of their cash flows and end-market demand. While the Fund did have some exposure to financials, an underweight was a plus.
Positions in the energy and materials industries hurt relative performance. Energy issuers were down because of falling energy prices and lower global demand. Similarly, our position in a mining company was lower due to falling metals prices.
On March 31, 2009, the Fund’s conversion premium was 68% versus 97% for the market. While the conversion premium is higher than historical levels, the Fund has benefited from additional downside protection. This is constantly being monitored and will change as market conditions warrant.
Market Outlook: The risk/reward profile of the convertible market is very favorable. It is attractive because of its credit characteristics and because it has better downside protection than equity investments. That said, we believe that convertible performance will remain volatile as investors balance the uncertain outlook for the economy, corporate profits, credit fundamentals and equity valuations versus prior cycles.
We continue to build the Fund one security at a time by finding companies that are opportunistically capitalizing on change. We are also maintaining our discipline of seeking to identify the best convertibles with the optimal risk/reward profile: 70-80% of the upside and 40-50% of the downside.
Comparison of Change in Value of a $250,000 Investment in U.S. Convertible Fund Class I, II and IV Shares with the Merrill Lynch All Convertibles, All Qualities Index.
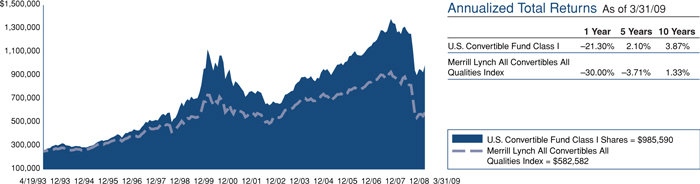
21
U.S. CONVERTIBLE FUND
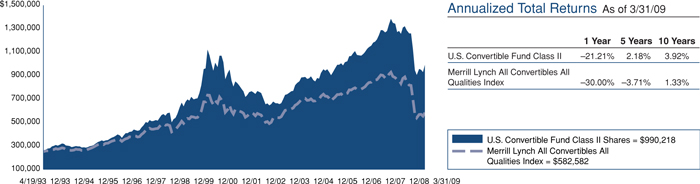

The graphs above show the value of a hypothetical $250,000 investment in the Fund’s Class I, II and IV shares compared with the Merrill Lynch All Convertibles All Qualities Index for the periods indicated. The Fund’s Class I, II and IV shares calculate their performance based upon the historical performance of their corresponding series of Nicholas-Applegate Mutual Funds (renamed ING Mutual Funds), adjusted to reflect all fees and expenses applicable to the Fund’s Class I, II and IV shares. The Nicholas-Applegate Institutional Funds’ Class I shares were first available on May 7, 1999, Class II shares on September 30, 2005 and Class IV shares on December 30, 2006. The historical performance of Class II and IV shares includes the performance of Class I shares for periods prior to the inception of Class II and IV. Average annual total return figures include changes in principal value, reinvested dividends, and capital gain distributions. The total returns shown above do not show the effects of income taxes on an individual’s investment. In most cases, taxes may reduce your actual investment returns on income or gains paid by the
Fund or any gains you may realize if you sell your shares. Past performance cannot guarantee future results.
The Merrill Lynch All Convertibles All Qualities Index represents convertible securities spanning all corporate sectors and having a par amount outstanding of $25 Mil+. Maturities must be at least one year. The coupon range must be equal to or greater than zero and all qualities of bonds are included. Preferred equity redemption stocks are not included nor are component bonds once they are converted into corporate stock.
Unless otherwise noted, index returns reflect the reinvestment of income dividends and capital gains, if any, but do not reflect fees, brokerage commissions or other expenses of investing. One cannot invest directly in an index. Since markets can go down as well as up, investment return and principal value will fluctuate with market conditions. You may have a gain or loss when you sell your shares.
U.S. CONVERTIBLE FUND
SCHEDULEOF INVESTMENTS
As of March 31, 2009
| | | | | | |
| | | Principal
Amount | | Value |
Convertible Corporate Bonds - 87.7% | | | |
Advertising Agencies - 1.6% | | | |
Interpublic Group of Cos, Inc. | | | | | | |
4.250%, 03/15/23 | | $ | 6,220,000 | | $ | 4,658,469 |
| | | | | | |
Aerospace/Defense-Equipment - 1.5% | | | |
Orbital Sciences Corp. | | | | | | |
2.438%, 01/15/27 | | | 5,510,000 | | | 4,600,850 |
| | | | | | |
Applications Software - 1.5% | | | |
Nuance Communications, Inc. 144A# | | | | | | |
2.750%, 08/15/27 | | | 2,845,000 | | | 2,368,462 |
Nuance Communications, Inc. | | | | | | |
2.750%, 08/15/27 | | | 2,475,000 | | | 2,060,438 |
| | | | | | |
| | | | | | 4,428,900 |
| | | | | | |
Auto-Cars/Light Trucks - 0.7% | | | |
Ford Motor Co. | | | | | | |
4.250%, 12/15/36 | | | 5,980,000 | | | 2,115,425 |
| | | | | | |
Batteries/Battery Systems - 1.3% | | | |
EnerSys | | | | | | |
3.375%, 06/01/38 | | | 6,100,000 | | | 3,934,500 |
| | | | | | |
Brewery - 1.6% | | | |
Molson Coors Brewing Co. | | | | | | |
2.500%, 07/30/13 | | | 4,555,000 | | | 4,657,488 |
| | | | | | |
Broadcast Services/Programming - 1.8% | | | |
Liberty Media LLC | | | | | | |
3.125%, 03/30/23 | | | 6,705,000 | | | 5,238,281 |
| | | | | | |
Cellular Telecommunications - 2.9% | | | |
Leap Wireless International, Inc. 144A# | | | | | | |
4.500%, 07/15/14 | | | 7,285,000 | | | 5,658,260 |
NII Holdings, Inc. | | | | | | |
2.750%, 08/15/25 | | | 3,140,000 | | | 2,877,025 |
| | | | | | |
| | | | | | 8,535,285 |
| | | | | | |
Coal - 0.9% | | | |
Peabody Energy Corp. | | | | | | |
4.750%, 12/15/41 | | | 3,650,000 | | | 2,582,375 |
| | | | | | |
Commercial Services - 3.1% | | | |
Alliance Data Systems Corp. 144A# | | | | | | |
1.750%, 08/01/13 | | | 7,020,000 | | | 4,992,975 |
Quanta Services, Inc. 144A# | | | | | | |
3.750%, 04/30/26 | | | 870,000 | | | 960,263 |
Quanta Services, Inc. | | | | | | |
3.750%, 04/30/26 | | | 2,915,000 | | | 3,217,431 |
| | | | | | |
| | | | | | 9,170,669 |
| | | | | | |
Consulting Services - 1.4% | | | |
FTI Consulting, Inc. | | | | | | |
3.750%, 07/15/12 | | | 2,558,000 | | | 4,287,848 |
| | | | | | |
Diagnostic Kits - 1.4% | | | |
Inverness Medical Innovations, Inc. | | | | | | |
3.000%, 05/15/16 | | | 5,075,000 | | | 4,313,750 |
| | | | | | |
Diversified Manufacturing Operations - 1.0% | | | |
Ingersoll-Rand Co., Ltd. | | | | | | |
4.500%, 04/15/12 | | | 2,950,000 | | | 2,950,000 |
| | | | | | |
| | | | | | |
| | | Principal
Amount | | Value |
Electronic Components-Semiconductors - 6.3% |
Intel Corp. | | | | | | |
2.950%, 12/15/35 | | $ | 5,760,000 | | $ | 4,723,200 |
Microchip Technology, Inc. | | | | | | |
2.125%, 12/15/37 | | | 6,425,000 | | | 4,642,063 |
ON Semiconductor Corp. | | | | | | |
2.625%, 12/15/26 | | | 6,105,000 | | | 4,342,181 |
Skyworks Solutions, Inc. | | | | | | |
1.250%, 03/01/10 | | | 2,555,000 | | | 2,602,906 |
Skyworks Solutions, Inc. | | | | | | |
1.500%, 03/01/12 | | | 2,280,000 | | | 2,314,200 |
| | | | | | |
| | | | | | 18,624,550 |
| | | | | | |
Electronic Measure Instruments - 0.8% |
Itron, Inc. | | | | | | |
2.500%, 08/01/26 | | | 2,395,000 | | | 2,392,006 |
| | | | | | |
Electronics-Military - 1.5% | | | |
Level-3 Communications Holdings, Inc. 144A# | | | | | | |
3.000%, 08/01/35 | | | 620,000 | | | 600,625 |
Level-3 Communications Holdings, Inc. | | | | | | |
3.000%, 08/01/35 | | | 4,045,000 | | | 3,918,594 |
| | | | | | |
| | | | | | 4,519,219 |
| | | | | | |
Energy-Alternate Sources - 1.5% | | | |
Covanta Holding Corp. | | | | | | |
1.000%, 02/01/27 | | | 5,540,000 | | | 4,376,600 |
| | | | | | |
Enterprise Software/Services - 2.7% | | | |
Lawson Software, Inc. | | | | | | |
2.500%, 04/15/12 | | | 3,895,000 | | | 3,072,181 |
Sybase, Inc. | | | | | | |
1.750%, 02/22/25 | | | 3,850,000 | | | 4,899,125 |
| | | | | | |
| | | | | | 7,971,306 |
| | | | | | |
Instruments-Scientific - 1.8% | | | |
Fisher Scientific International, Inc. | | | | | | |
3.250%, 03/01/24 | | | 4,380,000 | | | 5,217,675 |
| | | | | | |
Internet Content-Entertainment - 1.1% | | | |
Shanda Interactive Entertainment, Ltd. 144A# | | | | | | |
2.000%, 09/15/11 | | | 2,575,000 | | | 3,164,031 |
| | | | | | |
Internet Infrastructure Software - 1.5% | | | |
Akamai Technologies, Inc. | | | | | | |
1.000%, 12/15/33 | | | 3,330,000 | | | 4,520,475 |
| | | | | | |
Machinery-Farm - 0.7% | | | | | | |
AGCO Corp. | | | | | | |
1.250%, 12/15/36 | | | 2,820,000 | | | 2,171,400 |
| | | | | | |
Machinery-General Industry - 0.9% | | | |
Roper Industries, Inc. | | | | | | |
1.481%, 01/15/34 | | | 5,100,000 | | | 2,690,250 |
| | | | | | |
Medical Instruments - 4.0% | | | |
Integra LifeSciences Holdings Corp. 144A# | | | | | | |
2.750%, 06/01/10 | | | 2,335,000 | | | 2,148,200 |
Medtronic, Inc. | | | | | | |
1.625%, 04/15/13 | | | 5,815,000 | | | 5,168,081 |
NuVasive, Inc. 144A# | | | | | | |
2.250%, 03/15/13 | | | 5,175,000 | | | 4,663,969 |
| | | | | | |
| | | | | | 11,980,250 |
| | | | | | |
| | | | |
| See Accompanying Notes to Financial Statements. |
|
| 23 |
U.S. CONVERTIBLE FUND
SCHEDULEOF INVESTMENTS
As of March 31, 2009
| | | | | | |
| | | Principal
Amount | | Value |
Medical-Biomedical/Genetics - 8.3% | | | |
Amgen, Inc. | | | | | | |
0.375%, 02/01/13 | | $ | 4,705,000 | | $ | 4,305,075 |
Gilead Sciences, Inc. 144A# | | | | | | |
0.625%, 05/01/13 | | | 1,905,000 | | | 2,447,925 |
Gilead Sciences, Inc. | | | | | | |
0.625%, 05/01/13 | | | 2,140,000 | | | 2,749,900 |
Illumina, Inc. | | | | | | |
0.625%, 02/15/14 | | | 2,955,000 | | | 5,119,537 |
Life Technology Corp. | | | | | | |
2.000%, 08/01/23 | | | 4,475,000 | | | 4,849,781 |
OSI Pharmaceuticals, Inc. | | | | | | |
3.000%, 01/15/38 | | | 5,725,000 | | | 5,109,563 |
| | | | | | |
| | | | | | 24,581,781 |
| | | | | | |
Medical-Drugs - 8.4% | | | |
Allergan, Inc. 144A# | | | | | | |
1.500%, 04/01/26 | | | 1,800,000 | | | 1,881,000 |
Allergan, Inc. | | | | | | |
1.500%, 04/01/26 | | | 3,230,000 | | | 3,375,350 |
Bristol-Myers Squibb Co.++ | | | | | | |
0.820%, 09/15/23 | | | 6,635,000 | | | 5,871,974 |
Cephalon, Inc.+ | | | | | | |
0.000%, 06/15/33 | | | 725,000 | | | 905,344 |
Cephalon, Inc. | | | | | | |
2.000%, 06/01/15 | | | 2,315,000 | | | 3,463,819 |
Teva Pharmaceutical Finance LLC | | | | | | |
0.500%, 02/01/24 | | | 4,825,000 | | | 5,808,093 |
Wyeth++ | | | | | | |
0.965%, 01/15/24 | | | 4,155,000 | | | 4,146,690 |
| | | | | | |
| | | | | | 25,452,270 |
| | | | | | |
Medical-Generic Drugs - 3.7% | | | |
Mylan, Inc. | | | | | | |
1.250%, 03/15/12 | | | 5,280,000 | | | 4,547,400 |
Watson Pharmaceuticals, Inc. | | | | | | |
1.750%, 03/15/23 | | | 6,595,000 | | | 6,388,906 |
| | | | | | |
| | | | | | 10,936,306 |
| | | | | | |
Networking Products - 1.5% | | | |
Anixter International, Inc. | | | | | | |
1.000%, 02/15/13 | | | 5,835,000 | | | 4,449,188 |
| | | | | | |
Oil & Gas Drilling - 3.6% | | | |
Nabors Industries, Inc. | | | | | | |
0.940%, 05/15/11 | | | 5,035,000 | | | 4,481,150 |
Transocean, Inc. | | | | | | |
1.500%, 12/15/37 | | | 7,465,000 | | | 6,149,294 |
| | | | | | |
| | | | | | 10,630,444 |
| | | | | | |
Oil Companies-Exploration & Production - 1.7% |
Chesapeake Energy Corp. | | | | | | |
2.500%, 05/15/37 | | | 7,770,000 | | | 5,147,625 |
| | | | | | |
Oil Field Machinery & Equipment - 1.6% | | | |
Cameron International Corp. | | | | | | |
2.500%, 06/15/26 | | | 4,570,000 | | | 4,729,950 |
| | | | | | |
Power Conversion/Supply Equipment - 1.2% | | | |
JA Solar Holdings Co., Ltd. | | | | | | |
4.500%, 05/15/13 | | | 6,304,000 | | | 3,467,200 |
| | | | | | |
REIT-Diversified - 1.6% | | | |
Digital Realty Trust LP 144A# | | | | | | |
4.125%, 08/15/26 | | | 4,215,000 | | | 4,741,875 |
| | | | | | |
| | | | | | |
| | | Principal
Amount | | Value |
REIT-Office Property - 1.5% | | | |
Boston Properties LP | | | | | | |
3.750%, 05/15/36 | | $ | 5,825,000 | | $ | 4,521,656 |
| | | | | | |
Retail-Major Department Store - 1.5% | | | |
TJX Cos., Inc.+ | | | | | | |
0.000%, 02/13/21 | | | 4,980,000 | | | 4,531,800 |
| | | | | | |
Semiconductor Equipment - 0.2% | | | |
Teradyne, Inc. | | | | | | |
4.500%, 03/15/14 | | | 700,000 | | | 700,000 |
| | | | | | |
Super-Regional Banks-US - 1.7% | | | |
US BanCorp.++ | | | | | | |
0.000%, 09/20/36 | | | 5,855,000 | | | 5,181,675 |
| | | | | | |
Telephone-Integrated - 1.5% | | | |
Qwest Communications International, Inc. | | | | | | |
3.500%, 11/15/25 | | | 4,865,000 | | | 4,512,288 |
| | | | | | |
Toys - 1.5% | | | |
Hasbro, Inc. | | | | | | |
2.750%, 12/01/21 | | | 3,574,000 | | | 4,521,110 |
| | | | | | |
Web Hosting/Design - 1.7% | | | |
Equinix, Inc. | | | | | | |
2.500%, 04/15/12 | | | 6,235,000 | | | 5,190,638 |
| | | | | | |
Wire & Cable Products - 1.5% | | | |
General Cable Corp. | | | | | | |
0.875%, 11/15/13 | | | 6,270,000 | | | 4,412,513 |
| | | | | | |
Wireless Equipment - 1.5% | | | |
American Tower Corp. | | | | | | |
3.000%, 08/15/12 | | | 2,995,000 | | | 4,503,731 |
| | | | | | |
Total Convertible Corporate Bonds (Cost: $296,993,469) | | | 261,313,652 |
| | | | | | |
Convertible Preferred Stock - 9.9% | | | |
Agricultural Operations - 1.6% | | | |
Bunge, Ltd. | | | | | | |
4.875%, 12/31/49 | | | 61,835 | | | 4,738,107 |
| | | | | | |
Electric-Generation - 1.3% | | | |
AES Trust III | | | | | | |
6.750%, 10/15/29 | | | 114,143 | | | 3,947,065 |
| | | | | | |
Medical-Drugs - 1.1% | | | |
Schering-Plough Corp. | | | | | | |
6.000%, 08/13/10 | | | 16,035 | | | 3,375,368 |
| | | | | | |
Metal-Diversified - 1.5% | | | |
Freeport-McMoRan Copper & Gold, Inc. | | | | | | |
6.750%, 05/01/10 | | | 68,715 | | | 4,436,928 |
| | | | | | |
Multi-line Insurance - 0.6% | | | |
XL Capital, Ltd. | | | | | | |
10.750%, 08/15/11 | | | 152,945 | | | 1,873,576 |
| | | | | | |
Special Purpose Entity - 1.6% | | | |
Omnicare Capital Trust II | | | | | | |
4.000%, 06/15/33 | | | 137,400 | | | 4,635,189 |
| | | | | | |
Super-Regional Banks-US - 2.2% | | | |
Bank of America Corp. | | | | | | |
7.250%, 12/31/49 | | | 7,230 | | | 3,069,135 |
Wells Fargo & Co. | | | | | | |
7.500%, 12/31/49 | | | 6,990 | | | 3,348,139 |
| | | | | | |
| | | | | | 6,417,274 |
| | | | | | |
Total Convertible Preferred Stock (Cost: $40,167,972) | | | 29,423,507 |
| | | | | | |
| | | | |
| See Accompanying Notes to Financial Statements. |
|
| 24 |
SCHEDULEOF INVESTMENTS
As of March 31, 2009
| | | | | | | |
| | | Number of
Shares | | Value | |
Common Stock - 1.0% | | | | | | | |
Independent Power Producer -1.0% | | | | |
NRG Energy, Inc.* (Cost: $4,853,723) | | | 166,204 | | $ | 2,925,190 | |
| | | | | | | |
| | |
| | | Principal
Amount | | | |
Short Term Investments - 2.1% | | | | |
Time Deposit - 2.1% | | | | | | | |
Citibank London | | | | | | | |
0.100%, 04/01/09 | | | | | | | |
(Cost: $6,378,264) | | $ | 6,378,264 | | | 6,378,264 | |
| | | | | | | |
Total Investments - 100.7% (Cost: $348,393,428) | | | 300,040,613 | |
| | | | | | | |
Liabilities in Excess of Other Assets - (0.7%) | | | (2,158,302 | ) |
| | | | | | | |
Net Assets - 100.0% | | | | | $ | 297,882,311 | |
| | | | | | | |
| # | 144A Security. Certain conditions for public sale may exist. The total market value of 144A securities owned at March 31, 2009 was $33,627,585 or 11.29% of net assets. |
| ++ | The coupon rate shown on floating rate securities represents the rate at March 31, 2009. |
| * | Non-income producing securities. |
REIT - Real Estate Investment Trust
SCHEDULEOF INVESTMENTSBY SECTOR
as of March 31, 2009
| | | |
Sector | | Percent of
Net Assets | |
Consumer, Non-cyclical | | 34.7 | % |
Communications | | 15.0 | |
Industrial | | 12.2 | |
Technology | | 10.7 | |
Energy | | 9.3 | |
Financial | | 9.2 | |
Consumer, Cyclical | | 3.7 | |
Utilities | | 2.3 | |
Basic Materials | | 1.5 | |
Short Term Investments | | 2.1 | |
| | | |
Total Investments | | 100.7 | |
Liabilities in excess of other assets | | (0.7 | ) |
| | | |
Net Assets | | 100.0 | % |
| | | |
| | |
| See Accompanying Notes to Financial Statements. |
|
| 25 |
| | |
| GLOBAL EQUITY 130/30 FUND | | |
Management Team: Pedro V. Marcal, Portfolio Manager
Chief Investment Officer: Horacio A. Valeiras, CFA
Goal: The Global Equity 130/30 Fund seeks to maximize long-term capital appreciation by using fundamental research to identify both long and short investment opportunities that provide diversified exposure to a broad range of U.S. and non-U.S. companies. Normally, approximately 130% of the Fund’s assets will be in long positions and approximately 30% will be in short positions.
Market Overview: The world’s equity markets were weak and volatile during the twelve months ended March 31, 2009. Stock prices fell in response to a deepening in the U.S.-led credit crisis that fueled simultaneous recessions in the United States, Europe and Japan. The period was characterized by:
| | • | | Massive write-downs of mortgage-related assets that pushed one major financial institution into bankruptcy and forced others to take assistance from their respective governments |
| | • | | Turmoil in the credit markets, as bank lending ground to a virtual halt and investor demand for corporate and consumer debt evaporated |
| | • | | Government announcements of interest rate cuts, stimulus packages and special programs designed to unlock credit and spur growth |
The selling pressure was widespread, with stock markets across developed and emerging countries posting steep declines. Eastern European countries delivered some of the worst results, as capital flows out of the region led to falling local currencies and rising payments on foreign-denominated debt. China was one of the more resilient markets, thanks in large part to a rally near the end of the fiscal year. Chinese equities benefited from signs of stabilization in the country’s economy, including a pickup in home sales, as well as an increase in investors’ appetite for risk.
Performance: During the fiscal year ended March 31, 2009, the Fund’s Class I shares lost 43.50% and the MSCI All Country World Index fell 42.74%.
Portfolio Specifics: From a sector perspective, health care had the largest positive impact on performance versus the index due to an overweight and good stock selection. Teva Pharmaceutical, an Israel-based drug maker, was a solid contributor in the Fund. The company’s diversified global footprint and strong generic sales offered relative stability in a market experiencing significant reductions in growth. An underweight in the financials sector was also a plus. Energy allocations subtracted the most from results versus the index, as negative stock selection offset the benefit of an underweight in the group. One notable detractor was a maker of flexible pipe used in offshore drilling rigs whose shares slipped along with the price of oil.
In terms of countries, stock selection in Hong Kong was a key source of relative strength, helped by our position in Anhui Conch Cement. This Chinese cement company, which is listed on the Hong Kong exchange, is a direct beneficiary of the recent infrastructure stimulus package unveiled by the Chinese government. On the minus side, an overweight in Japan detracted from relative results.
In September, the Fund’s market exposure was reduced given short restrictions and changes in the regulatory environment. Since then, the portfolio has operated with about 10% additional leverage on the long side and 10% on the short side. The Fund plans to regain its normal 130/30 posture once the market environment shows more consistent stability.
Market Outlook: We expect a continued, elevated level of stock market volatility. Corporate earnings estimates for 2009, already significantly reduced, are likely to decline further. While governments are working to stimulate their economies, we expect recoveries among industrialized nations to be weak, uneven and commencing in late 2009, at the earliest.
In the changing market environment, we believe that our research-intensive investment process will uncover exciting opportunities for the Fund, both in long positions and short.
Comparison of Change in Value of a $250,000 Investment in Global Equity 130/30 Fund Class I Shares with the MSCI All Country World Index.
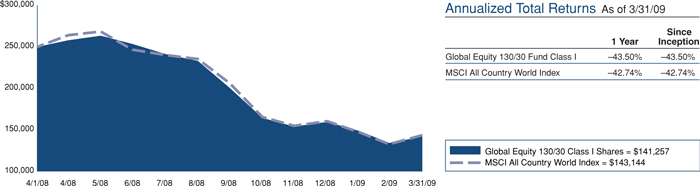
The graphs above show the value of a hypothetical $250,000 investment in the Fund’s Class I shares with the MSCI ACWI (All Country World Index) for the periods indicated. Average annual total return figures include changes in principal value, reinvested dividends, and capital gain distributions. The Class I shares commenced operations on April 1, 2008. The total returns shown above do not show the effects of income taxes on an individuals’ investment. In most cases, taxes may reduce your actual investment returns on income or gains paid by the Fund or any gains you may realize if you sell your shares. Past performance cannot guarantee future results.
The MSCI ACWI Index is a free float adjusted market capitalization index that is designed to measure equity market performance in the global developed and emerging markets. MSCI Growth Indexes measure the performance of those companies with higher price-to-book ratios and higher forecasted growth values. Unless otherwise noted, index returns reflect the reinvestment of income, dividends and capital gains, if any, but do not reflect fees, brokerage commissions or other expenses of investing. Investors may not make direct investments into any index. Since markets can go down as well as up, investment return and principal value will fluctuate with market conditions. You may have a gain or loss when you sell your shares.
GLOBAL EQUITY 130/30 FUND
SCHEDULEOF INVESTMENTS
As of March 31, 2009
| | | | | |
| | | Number of
Shares | | Value |
Common Stock - 98.7% | | | |
Australia - 3.4% | | | |
BHP Billiton, Ltd. | | 637 | | $ | 14,123 |
Cochlear, Ltd. | | 568 | | | 19,772 |
Incitec Pivot, Ltd. | | 15,729 | | | 23,169 |
Rio Tinto, Ltd. | | 582 | | | 22,875 |
| | | | | |
| | | | | 79,939 |
| | | | | |
Bermuda - 2.6% | | | |
Allied World Assurance Co. Holdings, Ltd. | | 600 | | | 22,818 |
PartnerRe, Ltd. | | 200 | | | 12,414 |
RenaissanceRe Holdings, Ltd. | | 500 | | | 24,720 |
| | | | | |
| | | | | 59,952 |
| | | | | |
Brazil - 0.6% | | | |
Cia Vale do Rio Doce Cl. B - ADR | | 1,000 | | | 13,300 |
| | | | | |
Denmark - 1.7% | | | |
Novo Nordisk - ADR | | 800 | | | 38,384 |
| | | | | |
France - 2.0% | | | |
Alstom SA | | 228 | | | 11,801 |
BNP Paribas | | 282 | | | 11,652 |
GDF Suez | | 669 | | | 22,961 |
| | | | | |
| | | | | 46,414 |
| | | | | |
Germany - 4.8% | | | |
E.ON AG | | 447 | | | 12,410 |
Fresenius Medical Care AG & Co. KGaA | | 598 | | | 23,231 |
Morphosys AG* | | 1,272 | | | 21,634 |
Porsche Automobil Holding SE | | 148 | | | 6,952 |
RWE AG | | 215 | | | 15,075 |
SAP AG | | 900 | | | 31,881 |
| | | | | |
| | | | | 111,183 |
| | | | | |
Hong Kong - 1.4% | | | |
HongKong Electric Holdings | | 5,500 | | | 32,858 |
| | | | | |
Ireland - 0.4% | | | |
Icon PLC - ADR* | | 600 | | | 9,690 |
| | | | | |
Israel - 1.6% | | | |
Teva Pharmaceutical Industries, Ltd. - ADR | | 800 | | | 36,040 |
| | | | | |
Japan - 14.9% | | | |
Capcom Co., Ltd. | | 800 | | | 14,142 |
East Japan Railway Co. | | 200 | | | 10,388 |
EPS Co., Ltd. | | 6 | | | 22,719 |
Japan Tobacco, Inc. | | 5 | | | 13,258 |
Mitsubishi UFJ Financial Group, Inc. | | 5,400 | | | 26,024 |
Mizuho Financial Group, Inc. | | 5,000 | | | 9,517 |
Nintendo Co., Ltd. | | 200 | | | 57,608 |
Nitori Co., Ltd. | | 300 | | | 16,766 |
Nomura Holdings, Inc. | | 1,600 | | | 8,019 |
Osaka Gas Co., Ltd. | | 6,000 | | | 18,710 |
Secom Co., Ltd. | | 300 | | | 11,026 |
Sumitomo Mitsui Financial Group, Inc. | | 800 | | | 27,620 |
T&D Holdings, Inc. | | 450 | | | 10,729 |
The Japan Steel Works, Ltd. | | 3,000 | | | 28,096 |
Tokio Marine Holdings, Inc. | | 400 | | | 9,699 |
Toyo Tanso Co., Ltd. | | 500 | | | 18,528 |
Unicharm Corp. | | 200 | | | 12,149 |
Unicharm Petcare Corp. | | 500 | | | 12,656 |
West Japan Railway Co. | | 6 | | | 18,953 |
| | | | | |
| | | | | 346,607 |
| | | | | |
Netherlands - 1.4% | | | | | |
Koninklijke KPN NV | | 2,453 | | | 32,764 |
| | | | | |
| | | | | |
| | | Number of
Shares | | Value |
Republic of China - 1.0% | | | | | |
Anhui Conch Cement Co., Ltd.* | | 4,000 | | $ | 22,142 |
| | | | | |
Switzerland - 5.9% | | | | | |
ACE, Ltd. | | 500 | | | 20,200 |
Nestle SA | | 970 | | | 32,827 |
Roche Holding AG | | 290 | | | 39,838 |
Syngenta AG | | 93 | | | 18,763 |
Synthes, Inc. | | 238 | | | 26,541 |
| | | | | |
| | | | | 138,169 |
| | | | | |
Taiwan - 0.5% | | | | | |
Taiwan Semiconductor Manufacturing Co., Ltd. - ADR | | 1,412 | | | 12,637 |
| | | | | |
United Kingdom - 5.5% | | | | | |
BG Group PLC | | 1,116 | | | 16,876 |
British American Tobacco PLC | | 1,483 | | | 34,286 |
Diageo PLC | | 1,528 | | | 17,226 |
Imperial Tobacco Group PLC | | 848 | | | 19,047 |
SSL International PLC | | 4,302 | | | 27,687 |
Unilever PLC | | 729 | | | 13,772 |
| | | | | |
| | | | | 128,894 |
| | | | | |
United States - 51.0% | | | | | |
Abbott Laboratories | | 500 | | | 23,850 |
Amazon.com, Inc.* | | 200 | | | 14,688 |
Apple, Inc.* | | 300 | | | 31,536 |
Best Buy Co., Inc. | | 400 | | | 15,184 |
Cisco Systems, Inc.* | | 800 | | | 13,416 |
Coca-Cola Co. | | 400 | | | 17,580 |
Exelon Corp. | | 500 | | | 22,695 |
Exxon Mobil Corp. | | 700 | | | 47,670 |
FirstEnergy Corp. | | 400 | | | 15,440 |
FPL Group, Inc. | | 400 | | | 20,292 |
General Dynamics Corp. | | 500 | | | 20,795 |
General Electric Co. | | 5,600 | | | 56,616 |
Genzyme Corp.* | | 300 | | | 17,817 |
Hess Corp. | | 300 | | | 16,260 |
Hewlett-Packard Co. | | 400 | | | 12,824 |
Hill-Rom Holdings, Inc. | | 1,100 | | | 10,879 |
Intel Corp. | | 900 | | | 13,545 |
International Business Machines Corp. | | 500 | | | 48,445 |
Johnson & Johnson | | 400 | | | 21,040 |
JP Morgan Chase & Co. | | 1,500 | | | 39,870 |
Kellogg Co. | | 400 | | | 14,652 |
Life Technologies Corp. | | 400 | | | 12,992 |
Lockheed Martin Corp. | | 400 | | | 27,612 |
Mastercard, Inc. Cl. A | | 100 | | | 16,748 |
McDonald’s Corp. | | 400 | | | 21,828 |
Merck & Co., Inc. | | 1,000 | | | 26,750 |
Microsoft Corp. | | 1,800 | | | 33,066 |
Monsanto Co. | | 300 | | | 24,930 |
National Oilwell Varco, Inc.* | | 700 | | | 20,097 |
Northern Trust Corp. | | 1,000 | | | 59,819 |
Oracle Corp. | | 2,500 | | | 45,175 |
Philip Morris International, Inc. | | 500 | | | 17,790 |
PNC Financial Services Group, Inc. | | 700 | | | 20,503 |
Praxair, Inc. | | 400 | | | 26,916 |
Precision Castparts Corp. | | 400 | | | 23,960 |
Procter & Gamble Co. | | 700 | | | 32,963 |
QUALCOMM, Inc. | | 600 | | | 23,346 |
Schering-Plough Corp. | | 2,000 | | | 47,100 |
Target Corp. | | 400 | | | 13,756 |
Texas Instruments, Inc. | | 800 | | | 13,208 |
The Bank of New York Mellon Corp. | | 1,800 | | | 50,850 |
| | | | |
| See Accompanying Notes to Financial Statements. |
|
| 27 |
GLOBAL EQUITY 130/30 FUND
SCHEDULEOF INVESTMENTS
As of March 31, 2009
| | | | | | |
| | | Number of
Shares | | Value |
Thermo Fisher Scientific, Inc.* | | | 1,200 | | $ | 42,804 |
Transocean, Ltd.* | | | 300 | | | 17,652 |
URS Corp.* | | | 400 | | | 16,164 |
Valero Energy Corp. | | | 800 | | | 14,320 |
Wells Fargo & Co. | | | 1,800 | | | 25,632 |
XTO Energy, Inc. | | | 425 | | | 13,014 |
| | | | | | |
| | | | | | 1,184,089 |
| | | | | | |
Total Common Stock (Cost: $3,229,668) | | | | | | 2,293,062 |
| | | | | | |
| | |
| | | Principal
Amount | | |
Short Term Investments - 0.2% | | | | | | |
Time Deposit - 0.2% | | | | | | |
Brown Brothers Harriman & Co. - Grand Cayman 0.100%, 04/01/09 (Cost: $3,892) | | $ | 3,892 | | | 3,892 |
| | | | | | |
Total Investments - 98.9% (Cost: $3,233,560) | | | | | | 2,296,954 |
| | | | | | |
Other Assets in Excess of Liabilities - 1.1% | | | | | | 25,607 |
| | | | | | |
Net Assets - 100.0% | | | | | $ | 2,322,561 |
| | | | | | |
FUTURES
| | | | | | | | | | |
Description | | Type | | Expiration
Month | | # of
Contracts | | Unrealized
Appreciation/
(Depreciation) | |
EMNI MSCI EAFE June | | | | | | | | | | |
Futures | | Long | | 06/2009 | | 2 | | $ | 5,500 | |
S&P 500 EMINI June | | | | | | | | | | |
Futures | | Long | | 06/2009 | | 2 | | | 4,020 | |
DJ Euro Stoxx 50 June | | | | | | | | | | |
Futures | | Short | | 06/2009 | | 2 | | | (1,301 | ) |
FTSE 100 Index June | | | | | | | | | | |
Futures | | Short | | 06/2009 | | 1 | | | (1,570 | ) |
Russell 1000 Mini June | | | | | | | | | | |
Futures | | Short | | 06/2009 | | 2 | | | (4,300 | ) |
| | | | | | | | | | |
| | | | | | | | $ | 2,349 | |
| | | | | | | | | | |
| * | Non-income producing securities. |
ADR - American Depository Receipt
SCHEDULEOF INVESTMENTSBY SECTOR
as of March 31, 2009
| | | |
Sector | | Percent of
Net Assets | |
Consumer, Non-cyclical | | 29.8 | % |
Financial | | 16.4 | |
Industrial | | 12.8 | |
Technology | | 11.0 | |
Utilities | | 6.9 | |
Energy | | 6.3 | |
Basic Materials | | 6.2 | |
Consumer, Cyclical | | 5.7 | |
Communications | | 3.6 | |
Short Term Investments | | 0.2 | |
| | | |
Total Investments | | 98.9 | |
Other assets in excess of liabilities | | 1.1 | |
| | | |
Net Assets | | 100.0 | % |
| | | |
| | | | |
| See Accompanying Notes to Financial Statements. |
|
| 28 |
Management Team: Christopher A. Herrera, Portfolio Manager; Nelson W. Shing, Portfolio Manager
Chief Investment Officer: Horacio A. Valeiras, CFA
Goal: The Global Select Fund seeks to maximize long-term capital appreciation by investing in companies that, in the opinion of the Investment Adviser, represent the “best of the best” globally.
Market Overview: Equity markets in developed and emerging countries generated losses during the fiscal year ended March 31, 2009. Stock prices plunged as deterioration in the value of mortgage-linked securities triggered the worst financial crisis since the Great Depression.
The period began on an upbeat note, with equities advancing in April and May on hopes that emergency actions taken by the U.S. Federal Reserve in March would contain the credit crisis. Unfortunately, the gains were short-lived, as high commodity prices, credit write-downs and weak economic and earnings reports drove stock prices lower over the summer. Then, in September, a dramatic series of events shook investor confidence in the global financial system and sent equity markets into a freefall. Weakened by mortgage-related losses, one major U.S. financial institution filed for bankruptcy, and several other large financial firms were either rescued by their respective governments or sold. Banks tightened credit, investors flocked to U.S. Treasuries and the credit markets seized up. Stock prices continued their descent throughout much of the fall and winter, as the credit markets remained frozen and the global economy stalled.
Equities rallied late in the period on optimism that government intervention would get credit flowing again. In response to the financial crisis, policymakers around the world had cut interest rates, unveiled stimulus packages and created special lending and debt-purchase programs.
Performance: During the twelve months ended March 31, 2009, the Fund’s Class I shares fell 42.26% and the MSCI All Country World Index declined 42.74%.
Portfolio Specifics: Stock selection in the United States and the materials sector had the largest positive impact on results versus the index. One of our best-performing holdings was U.S.-based Ecolab, a supplier of cleaning and sanitizing products. In the difficult economy, the company benefited from the strength of its balance sheet and the defensive nature of several of its end-markets, including health care and education/government. Genentech, a U.S.-based biotech firm, was another top performer, boosted by strong sales of its cancer drugs. In addition, the company agreed to sell itself to a pharmaceutical maker in a deal that closed near the end of the fiscal year.
The Fund’s sector weightings, which are a byproduct of our stock-by-stock investment decisions, also added value to the benchmark. An underweight in financials was particularly helpful, as credit write-downs damaged the balance sheets of many companies in the sector.
Areas of relative weakness included stock selection in the United Kingdom, Hong Kong and the industrials sector. Two of our biggest detractors were a U.K.-based energy pipeline producer that was affected by falling oil prices, and a Hong Kong-based conglomerate whose gaming business was hurt by a change in government regulation.
Market Outlook: We expect the stock market to remain volatile in the months ahead given the weakness in industrialized economies and the likelihood of further reductions in earnings estimates. That said, the Federal Reserve, U.S. Treasury and central banks abroad are acting in concert to avert a deepening in the credit crisis and global recession. Over time, their efforts should lead to a revival in economic and earnings growth.
Regardless of how macro events unfold, we believe that our bottom-up investment process will identify the “best of the best” globally for the Fund.
Comparison of Change in Value of a $250,000 Investment in Global Select Fund Class I and II Shares with the MSCI All Country World Index.

GLOBAL SELECT FUND
[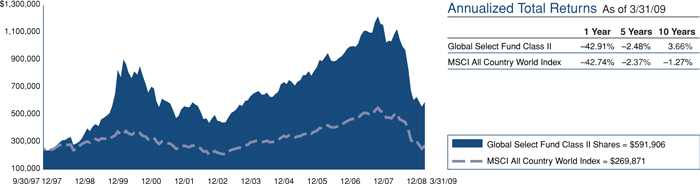
The graphs above show the value of a hypothetical $250,000 investment in the Fund’s Class I and II shares compared with the Morgan Stanley Capital International All Country World Index (“MSCI ACWI”) over the periods indicated. The Fund’s Class I and II shares calculate their performance based upon the historical performance of their corresponding series of Nicholas-Applegate Mutual Funds (renamed ING Mutual Funds), adjusted to reflect all fees and expenses applicable to the Fund’s Class I and II shares. The Nicholas-Applegate Funds’ Class I shares were first available on May 7, 1999 and Class II shares on June 30, 2003. The historical performance of Class II shares includes the performance of Class I shares for periods prior to the inception of Class II. Average annual total return figures include changes in principal value, reinvested dividends, and capital gain distributions. The total returns shown above do not show the effects of income taxes on an individual’s investment. In most cases, taxes may reduce your actual investment returns on
income or gains paid by the Fund or any gains you may realize if you sell your shares. Past performance cannot guarantee future results.
The MSCI ACWI is a market capitalization weighted index composed of over 2,000 companies. The MSCI ACWI is representative of the market structure of 21 countries in North America, Europe, and the Pacific Rim, excluding closed markets and those shares in otherwise free markets that are not purchasable by foreigners. Unless otherwise noted, index returns reflect the reinvestment of income dividends and capital gains, if any, but do not reflect fees, brokerage commissions or other expenses of investing. One cannot invest directly in an index. Since markets can go down as well as up, investment return and principal value will fluctuate with market conditions, currency volatility and the social, economic and political climates of countries where the Fund invests. You may have a gain or loss when you sell your shares.
30
GLOBAL SELECT FUND
SCHEDULEOF INVESTMENTS
As of March 31, 2009
| | | | | |
| | | Number of
Shares | | Value |
Common Stock - 91.8% | | | |
Australia - 1.7% | | | |
BHP Billiton, Ltd. | | 13,393 | | $ | 296,937 |
| | | | | |
Brazil - 1.8% | | | |
Banco do Brasil SA | | 42,800 | | | 313,622 |
| | | | | |
Finland - 1.3% | | | |
Sampo OYJ Cl. A | | 15,359 | | | 226,761 |
| | | | | |
France - 5.1% | | | |
Alstom SA | | 6,035 | | | 312,374 |
BNP Paribas | | 4,268 | | | 176,345 |
Ingenico | | 11,862 | | | 196,865 |
Neopost SA | | 2,872 | | | 222,707 |
| | | | | |
| | | | | 908,291 |
| | | | | |
Germany - 3.5% | | | |
Bayer AG | | 3,487 | | | 166,669 |
Fresenius Medical Care AG & Co. KGaA | | 5,784 | | | 224,699 |
RWE AG | | 3,149 | | | 220,795 |
| | | | | |
| | | | | 612,163 |
| | | | | |
Hong Kong - 1.6% | | | |
China Mobile, Ltd. | | 33,000 | | | 288,058 |
| | | | | |
Ireland - 0.9% | | | |
Icon PLC - ADR* | | 9,900 | | | 159,885 |
| | | | | |
Italy - 1.4% | | | |
Finmeccanica SpA | | 19,452 | | | 241,994 |
| | | | | |
Japan - 7.1% | | | |
Asics Corp. | | 37,000 | | | 253,984 |
Mitsubishi Estate Co., Ltd. | | 13,000 | | | 145,044 |
Mitsubishi UFJ Financial Group, Inc. | | 53,600 | | | 258,313 |
Nintendo Co., Ltd. | | 1,300 | | | 374,456 |
Nissin Food Holdings Co., Ltd. | | 7,600 | | | 223,145 |
| | | | | |
| | | | | 1,254,942 |
| | | | | |
Kuwait - 0.1% | | | |
Global Investment House | | | | | |
KSCC - GDR 144A#,* | | 17,747 | | | 16,682 |
| | | | | |
Netherlands - 2.6% | | | |
Koninklijke KPN NV | | 21,642 | | | 289,065 |
Nutreco Holding NV | | 4,758 | | | 170,280 |
| | | | | |
| | | | | 459,345 |
| | | | | |
Republic of China - 0.5% | | | |
China Green Holdings, Ltd. | | 159,000 | | | 93,554 |
Peace Mark Holdings, Ltd.* | | 314,000 | | | 405 |
| | | | | |
| | | | | 93,959 |
| | | | | |
Spain - 4.5% | | | |
Iberdrola Renovables SA* | | 65,134 | | | 269,813 |
Tecnicas Reunidas SA | | 6,463 | | | 205,170 |
Telefonica SA | | 16,135 | | | 321,765 |
| | | | | |
| | | | | 796,748 |
| | | | | |
Switzerland - 8.4% | | | |
ACE, Ltd. | | 8,400 | | | 339,360 |
Alcon, Inc. | | 3,300 | | | 300,003 |
Nestle SA | | 8,588 | | | 290,635 |
Roche Holding AG | | 2,231 | | | 306,479 |
Synthes, Inc. | | 2,160 | | | 240,876 |
| | | | | |
| | | | | 1,477,353 |
| | | | | |
| | | | | | |
| | | Number of
Shares | | Value |
United Kingdom - 6.5% | | | |
ARM Holdings PLC | | | 118,416 | | $ | 173,975 |
BG Group PLC | | | 20,174 | | | 305,068 |
Croda International PLC | | | 22,695 | | | 172,408 |
IG Group Holdings PLC | | | 84,411 | | | 212,036 |
Wellstream Holdings PLC | | | 45,947 | | | 284,507 |
| | | | | | |
| | | | | | 1,147,994 |
| | | | | | |
United States - 44.8% | | | |
Anadarko Petroleum Corp. | | | 6,700 | | | 260,563 |
Ansys, Inc.* | | | 11,300 | | | 283,630 |
Apple, Inc.* | | | 4,600 | | | 483,551 |
Best Buy Co., Inc. | | | 10,100 | | | 383,396 |
Corning, Inc. | | | 25,600 | | | 339,712 |
Crown Holdings, Inc.* | | | 11,800 | | | 268,214 |
Ecolab, Inc. | | | 8,500 | | | 295,205 |
Exxon Mobil Corp. | | | 4,700 | | | 320,070 |
FedEx Corp. | | | 4,000 | | | 177,960 |
Guess ?, Inc. | | | 18,100 | | | 381,548 |
Hess Corp. | | | 2,800 | | | 151,760 |
HJ Heinz Co. | | | 8,300 | | | 274,398 |
JP Morgan Chase & Co. | | | 12,300 | | | 326,934 |
Kellogg Co. | | | 7,400 | | | 271,062 |
Lockheed Martin Corp. | | | 3,700 | | | 255,411 |
Nike, Inc. Cl. B | | | 5,700 | | | 267,273 |
Oracle Corp. | | | 18,900 | | | 341,523 |
Praxair, Inc. | | | 4,800 | | | 322,992 |
Procter & Gamble Co. | | | 5,800 | | | 273,122 |
Schering-Plough Corp. | | | 13,700 | | | 322,635 |
Target Corp. | | | 9,000 | | | 309,510 |
The Bank of New York Mellon Corp. | | | 9,000 | | | 254,250 |
The Goldman Sachs Group, Inc. | | | 2,100 | | | 222,642 |
Thermo Fisher Scientific, Inc.* | | | 8,000 | | | 285,360 |
Transocean, Ltd.* | | | 5,500 | | | 323,620 |
URS Corp.* | | | 7,000 | | | 282,870 |
XTO Energy, Inc. | | | 8,100 | | | 248,022 |
| | | | | | |
| | | | | | 7,927,233 |
| | | | | | |
Total Common Stock (Cost: $19,711,149) | | | | | | 16,221,967 |
| | | | | | |
| | |
| | | Principal
Amount | | |
Short Term Investments - 7.4% | | | |
Time Deposit - 7.4% | | | |
Citibank London 0.100%, 04/01/09 (Cost: $1,301,910) | | $ | 1,301,910 | | | 1,301,910 |
| | | | | | |
Total Investments - 99.2% (Cost: $21,013,059) | | | | | | 17,523,877 |
| | | | | | |
Other Assets in Excess of Liabilities - 0.8% | | | | | | 139,060 |
| | | | | | |
Net Assets - 100.0% | | | | | $ | 17,662,937 |
| | | | | | |
| * | Non-income producing securities. |
| # | 144A Security. Certain conditions for public sale may exist. The total market value of 144A securities owned at March 31, 2009 was $16,682 or 0.09% of net assets. |
ADR - American Depository Receipt
GDR - Global Depository Receipt
| | | | |
| See Accompanying Notes to Financial Statements. |
|
| 31 |
GLOBAL SELECT FUND
SCHEDULEOF INVESTMENTS
As of March 31, 2009
SCHEDULEOF INVESTMENTSBY SECTOR
as of March 31, 2009
| | | |
Sector | | Percent of
Net Assets | |
Consumer, Non-cyclical | | 17.8 | % |
Financial | | 14.1 | |
Energy | | 12.2 | |
Industrial | | 11.5 | |
Consumer, Cyclical | | 11.2 | |
Technology | | 9.6 | |
Basic Materials | | 7.1 | |
Communications | | 7.0 | |
Utilities | | 1.3 | |
Short Term Investments | | 7.4 | |
| | | |
Total Investments | | 99.2 | |
Other assets in excess of liabilities | | 0.8 | |
| | | |
Net Assets | | 100.0 | % |
| | | |
| | | | |
| See Accompanying Notes to Financial Statements. |
|
| 32 |
INTERNATIONAL GROWTH OPPORTUNITIES FUND
Management Team: Christopher A. Herrera, Portfolio Manager; Nelson W. Shing, Portfolio Manager
Chief Investment Officer: Horacio A. Valeiras, CFA
Goal: The International Growth Opportunities Fund seeks to maximize long-term capital appreciation through investments primarily in companies located outside the United States with market capitalizations predominantly in the bottom 20% of publicly traded companies, as measured by the market capitalization in the S&P Developed Ex-US BMI.
Market Overview: International small-cap stocks, as measured by the S&P Developed Ex-US Small Cap Index, posted losses in local currencies during the twelve months ended March 31, 2009. Appreciation in the U.S. dollar versus a range of currencies widened the declines in dollar terms. The downturn was part of a global sell-off that pressured equity prices across countries, sectors and capitalization ranges. Major factors contributing to the downside volatility included:
| | • | | Rising risk aversion, as the failure or near failure of several bellwether U.S. and European financial institutions rattled investor confidence |
| | • | | Freeze in the credit markets due to banks’ need to conserve capital in the uncertain environment |
| | • | | Rapid drop in economic activity, with the Baltic Dry Index — a proxy for global trade — falling nearly 95% from May to December |
Governments worldwide took bold steps to pull their economies out of recession. The Bank of Japan cut its key interest rate to near zero, and European central banks reduced rates to record lows. Policymakers also unveiled many programs to spark growth and lending. For example, Japan announced stimulus packages worth upwards of $200 billion.
Performance: The Fund’s Class I shares fell 48.16% in the fiscal year ended March 31, 2009. The Fund outperformed the S&P Developed Ex-US Small Cap Growth Index, its primary benchmark, and the S&P Developed Ex-US Small Cap Index, which fell 49.47% and 49.75%, respectively.
Portfolio Specifics: Stock selection in Japan, Switzerland and the financials and health care sectors had a positive impact on results versus the indexes. Top-performing holdings included Japan-based Point, an apparel retailer whose inventory controls contributed to healthy profit growth; Switzerland-based Banque Cantonale Vaudoise, a bank that was rewarded for its strong fundamentals amid the credit market turmoil; and Japan-based Towa Pharmaceutical, a generic drug maker that benefited from growing sales of its hypertension tablets. Another key source of value added was an overweight in health care. Health care was one of the most resilient sectors in the indexes, living up to its reputation as a safe haven in volatile times.
On the minus side, stock selection in Italy, Belgium and the energy and consumer discretionary sectors weighed on relative results. Two big detractors were an Italy-based manufacturer of brake systems that was hurt by the weak outlook for auto sales, and a Belgium-based provider of video production systems that experienced a steep drop in orders following the Beijing Olympics.
Market Outlook: We expect the stock market to remain volatile in the months ahead given the weakness in industrialized economies and the likelihood of further reductions in earnings estimates. That said, the U.S. Federal Reserve, U.S. Treasury and central banks abroad are acting in concert to avert a deepening in the credit crisis and global recession. Over time, their efforts should lead to a revival in economic and earnings growth.
While the outlook for the broad market may be cloudy, we are confident that our bottom-up approach to stock selection will benefit the Fund over time.
Comparison of Change in Value of a $250,000 Investment in International Growth Opportunities Fund Class I and II Shares with the S&P Developed Ex-US Small Cap Growth Index and the S&P Developed Ex-US Small Cap Index.
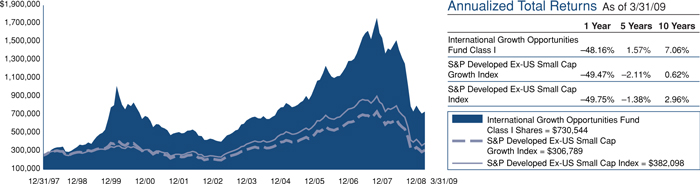
33
INTERNATIONAL GROWTH OPPORTUNITIES FUND
[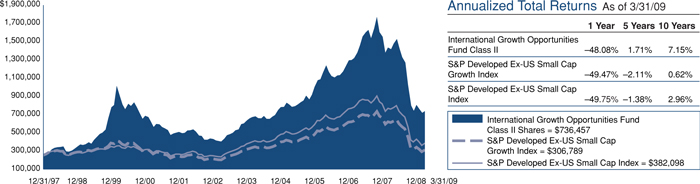
The graphs above show the value of a hypothetical $250,000 investment in the Fund’s Class I through III shares compared with the S&P Developed Ex-US Small Cap Index and S&P Developed Ex-US Small Cap Growth Index for the periods indicated. The Fund’s Class I through III shares calculate their performance based upon the historical performance of their corresponding series of Nicholas-Applegate Mutual Funds (renamed ING Mutual Funds), adjusted to reflect all fees and expenses applicable to the Fund’s Class I through III shares. The Nicholas-Applegate Institutional Funds’ Class I shares were first available on May 7, 1999, Class II shares commenced operations on June 5, 2003 and Class III shares on September 8, 2008. The historical performance of Class II and III shares includes the performance of Class I shares for periods prior to the inception of the relevant class. Average annual total return figures include changes in principal value, reinvested dividends, and capital gain distributions. The total returns shown above do not show the effects of income taxes on an individual’s investment. In most cases, taxes may reduce your actual investment returns on income or
gains paid by the Fund or any gains you may realize if you sell your shares. Past performance cannot guarantee future results.
As of October 1, 2008, the S&P/Citigroup World xUS EMI and S&P/Citigroup World xUS EMI Growth indices have been renamed the S&P Developed Ex-US Small Cap and S&P Developed Ex-US Small Cap Growth, respectively. The S&P Developed Ex-US Small Cap is a market capitalization weighted index measuring capital appreciation. It is an unmanaged world equity index representative of small capitalization securities, defined as the bottom 20% of any given country’s available market capitalization excluding the U.S. The index does not include dividends; however, total rates of return, including all payments to shareholders, are calculated and published each month-end. S&P Developed Ex-US Small Cap Growth covers those small capitalization companies in each country that exhibit the characteristics of growth. Investors may not make direct investments into any index. Since markets can go down as well as up, investment return and principal value will fluctuate with market conditions. You may have a gain or loss when you sell your shares.
34
INTERNATIONAL GROWTH OPPORTUNITIES FUND
SCHEDULEOF INVESTMENTS
As of March 31, 2009
| | | | | |
| | | Number of
Shares | | Value |
Common Stock - 91.7% | | | | | |
Australia - 5.9% | | | | | |
Incitec Pivot, Ltd. | | 649,202 | | $ | 956,259 |
Mount Gibson Iron, Ltd.* | | 2,141,549 | | | 691,896 |
Paladin Energy, Ltd.* | | 609,211 | | | 1,439,151 |
Western Areas NL* | | 271,212 | | | 635,036 |
| | | | | |
| | | | | 3,722,342 |
| | | | | |
Austria - 1.0% | | | | | |
Intercell AG* | | 21,382 | | | 658,622 |
| | | | | |
Belgium - 2.3% | | | | | |
EVS Broadcast Equipment SA | | 44,778 | | | 1,468,458 |
| | | | | |
Bermuda - 1.6% | | | | | |
Allied World Assurance Co. Holdings, Ltd. | | 26,000 | | | 988,780 |
| | | | | |
Canada - 1.7% | | | | | |
RONA, Inc. | | 110,800 | | | 1,045,341 |
| | | | | |
France - 10.5% | | | | | |
EDF Energies Nouvelles SA | | 37,284 | | | 1,404,371 |
Ingenico | | 82,460 | | | 1,368,527 |
Ipsen SA | | 21,867 | | | 841,661 |
Neopost SA | | 14,728 | | | 1,142,073 |
Nexans SA | | 19,482 | | | 739,257 |
SCOR SE | | 54,797 | | | 1,127,323 |
| | | | | |
| | | | | 6,623,212 |
| | | | | |
Germany - 5.7% | | | | | |
Bauer AG | | 41,542 | | | 1,214,520 |
Comdirect Bank AG | | 204,225 | | | 1,491,323 |
SGL Carbon AG* | | 35,383 | | | 843,255 |
| | | | | |
| | | | | 3,549,098 |
| | | | | |
Greece - 2.3% | | | | | |
JUMBO SA | | 187,284 | | | 1,417,345 |
| | | | | |
Ireland - 1.4% | | | | | |
Icon PLC - ADR* | | 53,700 | | | 867,255 |
| | | | | |
Italy - 2.9% | | | | | |
ACEA SpA | | 52,969 | | | 632,942 |
Maire Tecnimont SpA | | 578,975 | | | 1,193,799 |
| | | | | |
| | | | | 1,826,741 |
| | | | | |
Japan - 16.2% | | | | | |
Asics Corp. | | 140,600 | | | 965,139 |
NTT Urban Development Corp. | | 1,332 | | | 1,062,687 |
Point, Inc. | | 16,910 | | | 765,290 |
Santen Pharmaceutical Co., Ltd. | | 22,000 | | | 610,307 |
Seven Bank, Ltd. | | 197 | | | 523,365 |
Shinko Securities Co., Ltd. | | 224,000 | | | 433,168 |
The Japan Steel Works, Ltd. | | 114,300 | | | 1,070,442 |
Torishima Pump Manufacturing Co., Ltd. | | 66,300 | | | 720,258 |
Towa Pharmaceutical Co., Ltd. | | 24,900 | | | 1,038,655 |
Toyo Suisan Kaisha, Ltd. | | 31,000 | | | 635,567 |
Unicharm Petcare Corp. | | 41,800 | | | 1,058,014 |
Ushio, Inc. | | 94,000 | | | 1,317,162 |
| | | | | |
| | | | | 10,200,054 |
| | | | | |
Netherlands - 2.9% | | | | | |
Nutreco Holding NV | | 23,231 | | | 831,395 |
Unit 4 Agresso NV | | 88,055 | | | 993,740 |
| | | | | |
| | | | | 1,825,135 |
| | | | | |
| | | | | |
| | | Number of
Shares | | Value |
Norway - 1.5% | | | | | |
Pronova BioPharma AS* | | 347,000 | | $ | 919,906 |
| | | | | |
Republic of China - 1.8% | | | | | |
China Green Holdings, Ltd. | | 1,884,000 | | | 1,108,521 |
Peace Mark Holdings, Ltd.* | | 2,428,000 | | | 3,133 |
| | | | | |
| | | | | 1,111,654 |
| | | | | |
Singapore - 2.8% | | | | | |
StarHub, Ltd. | | 1,352,500 | | | 1,752,681 |
| | | | | |
Spain - 2.0% | | | | | |
Grifols SA | | 85,047 | | | 1,225,148 |
| | | | | |
Sweden - 1.6% | | | | | |
Loomis AB* | | 133,066 | | | 1,022,062 |
| | | | | |
Switzerland - 3.6% | | | | | |
Banque Cantonale Vaudoise | | 4,699 | | | 1,561,099 |
Partners Group Holding AG | | 11,584 | | | 696,334 |
| | | | | |
| | | | | 2,257,433 |
| | | | | |
United Arab Emirates - 0.3% | | | | | |
Lamprell PLC | | 216,242 | | | 204,567 |
| | | | | |
United Kingdom - 23.7% | | | | | |
ARM Holdings PLC | | 514,212 | | | 755,472 |
ASOS PLC* | | 169,113 | | | 730,224 |
Babcock International Group | | 204,919 | | | 1,261,530 |
Chemring Group PLC | | 47,528 | | | 1,292,317 |
Croda International PLC | | 128,921 | | | 979,381 |
Dana Petroleum PLC* | | 68,723 | | | 1,094,381 |
De La Rue PLC | | 69,721 | | | 971,364 |
IG Group Holdings PLC | | 353,276 | | | 887,410 |
N Brown Group PLC | | 327,717 | | | 890,144 |
Petrofac, Ltd. | | 112,797 | | | 864,975 |
Rotork PLC | | 62,953 | | | 768,791 |
RPS Group PLC | | 590,577 | | | 1,318,430 |
SSL International PLC | | 122,942 | | | 791,223 |
Victrex PLC | | 152,439 | | | 1,109,972 |
Wellstream Holdings PLC | | 179,876 | | | 1,113,805 |
| | | | | |
| | | | | 14,829,419 |
| | | | | |
Total Common Stock (Cost: $79,754,195) | | | | | 57,515,253 |
| | | | | |
Equity - Linked Securities - 4.2% | | | | | |
Taiwan - 4.2% | | | | | |
Merrill Lynch Wistron Corp. - | | | | | |
12/03/12 144A#,* | | 1,444,977 | | | 1,557,396 |
Credit Suisse FB Giant | | | | | |
Manufacturing - 8/22/11 | | 535,200 | | | 1,101,602 |
| | | | | |
Total Equity - Linked Securities (Cost: $2,805,159) | | | | | 2,658,998 |
| | | | | |
Preferred Stock - 2.1% | | | | | |
Brazil - 2.1% | | | | | |
Banco do Estado do Rio Grande do Sul (Cost: $2,182,729) | | 443,800 | | | 1,347,448 |
| | | | | |
| | | | |
| See Accompanying Notes to Financial Statements. |
| 35 |
INTERNATIONAL GROWTH OPPORTUNITIES FUND
SCHEDULEOF INVESTMENTS
As of March 31, 2009
| | | | | | |
| | | Principal
Amount | | Value |
Short Term Investment - 0.9% | | | | | | |
Time Deposit - 0.9% | | | | | | |
Citibank London 0.100%, 04/01/09 (Cost: $585,710) | | $ | 585,710 | | $ | 585,710 |
| | | | | | |
Total Investments - 98.9% (Cost: $85,327,793) | | | | | | 62,107,409 |
| | | | | | |
Other Assets in Excess of Liabilities - 1.1% | | | | | | 673,781 |
| | | | | | |
Net Assets - 100.0% | | | | | $ | 62,781,190 |
| | | | | | |
| * | Non - income producing securities. |
| # | 144A Security. Certain conditions for public sale may exist. The total market value of 144A securities owned at March 31, 2009 was $1,557,396 or 2.4% of net assets. |
ADR - American Depository Receipt
SCHEDULEOF INVESTMENTSBY SECTOR
as of March 31, 2009
| | | |
Sector | | Percent of
Net Assets | |
Consumer, Non - cyclical | | 25.9 | % |
Financial | | 13.7 | |
Industrial | | 13.7 | |
Basic Materials | | 10.6 | |
Energy | | 9.4 | |
Technology | | 9.3 | |
Consumer, Cyclical | | 8.1 | |
Communications | | 6.3 | |
Utilities | | 1.0 | |
Short Term Investment | | 0.9 | |
| | | |
Total Investments | | 98.9 | |
Other assets in excess of liabilities | | 1.1 | |
| | | |
Net Assets | | 100.0 | % |
| | | |
| | | | |
| See Accompanying Notes to Financial Statements. |
| 36 |
EMERGING MARKETS FUND
Management Team: Kunal Ghosh, Portfolio Manager; Steven Tael, Ph.D., CFA, Portfolio Manager
Chief Investment Officer: Horacio A. Valeiras, CFA
Goal: The Emerging Markets Fund seeks to maximize long-term capital appreciation primarily through investments in countries with emerging securities markets. These markets have yet to reach a level of maturity associated with the developed foreign stock markets and are, in the opinion of the Investment Adviser, less sophisticated than more developed markets in terms of participation, analyst coverage, liquidity and regulation.
Market Overview: Stocks in emerging countries generated losses during the twelve months ended March 31, 2009. A broad-based strengthening in the U.S. dollar accentuated the losses in dollar terms. The slump in these markets was driven by the global financial crisis, which led to:
| | • | | Panic selling by investors who fled riskier assets and piled into U.S. Treasury securities. |
| | • | | Less available credit for countries and companies needing to refinance maturing loans or enter into new loans. |
| | • | | Falloff in economic activity and, in turn, demand for commodity exports. |
Every country in the MSCI Emerging Markets (“MSCI EM”) Index posted a decline. Eastern European equities were especially hard hit amid a flight to the euro and Swiss franc and away from local currencies. Weaker local currencies meant higher loan payments for the region’s many consumers and businesses that had once been attracted to lower borrowing rates abroad.
The period ended on an upbeat note, with the index posting its largest monthly gain since December 1993. Investors waded back into riskier assets on hopes that coordinated efforts by central banks worldwide would promote economic growth.
Performance: The Fund’s Class I shares lost 52.61% in the fiscal year ended March 31, 2009. The MSCI Emerging Markets Index fell 46.90%.
Portfolio Specifics: The Fund’s underperformance was driven by stock selection, which was particularly weak in Israel, Brazil and the financials and materials sectors. One of our worst-performing holdings was an Israel-based fertilizer manufacturer that experienced a drop in demand due to falling grain prices and less-available credit for farmers. Other major detractors included a Brazil-based steel producer that was hurt by declining steel prices, and an Israel-based bank that reported an operating loss. Sector weightings were also a source of relative weakness. For example, the Fund was underweight in the defensive consumer staples, utilities and health care sectors, which were the three most resilient groups in the benchmark.
Stock selection in Poland and Argentina helped relative results, as did an underweight in Russia, one of the worst-performing countries in the index. In addition, several of our holdings posted gains in the down market, including Hyosung Corp., a South Korea-based conglomerate. The company benefited from strong operating performance in its industrial materials and power/industrial systems businesses.
Portfolio holdings remained broadly diversified throughout the fiscal year. On March 31, 2009, the Fund’s largest overweights versus the benchmark were in China (+2.8%) and the information technology sector (+3.6%). The largest underweights were in Malaysia (–2.7%) and materials (–2.8%).
Market Outlook: The Fund’s investment process evaluates opportunities on a relative basis and neither utilizes, nor results in, a forecast or outlook on the overall market. Rather, the Fund expects to outperform the MSCI Emerging Markets Index in both up and down markets.
We believe the Fund’s proprietary stock-selection model, in conjunction with its risk-controlled approach to portfolio construction, will drive strong performance over time.
Comparison of Change in Value of a $250,000 Investment in Emerging Markets Fund Class I and II Shares with the MSCI EM Index.
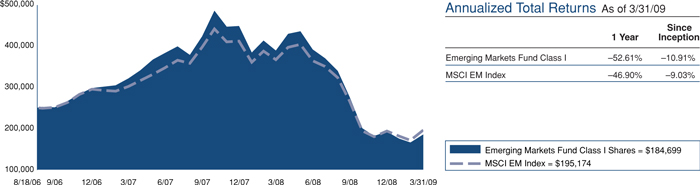
37
EMERGING MARKETS FUND
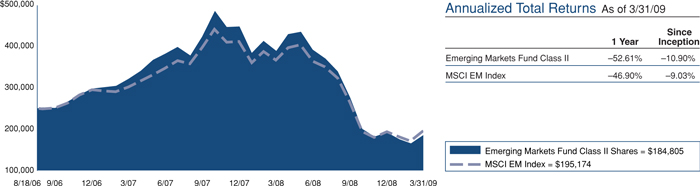
The graphs above show the value of a hypothetical $250,000 investment in the Fund’s Class I and II shares compared with the Morgan Stanley Capital International Emerging Markets Index (“MSCI EM”) over the periods indicated. Average annual total return figures include changes in principal value, reinvested dividends, and capital gain distributions. The total returns shown above do not show the effects of income taxes on an individual’s investment. In most cases, taxes may reduce your actual investment returns on income or gains paid by the Fund or any gains you may realize if you sell your shares. Past performance cannot guarantee future results.
The MSCI EM Index is a market capitalization weighted index composed of over 800 companies representative of the market structure of emerging countries in Europe, Latin America,
Africa, Middle East and Asia. The MSCI EM Index excludes closed markets and those shares in otherwise free markets that are not purchasable by foreigners. Index weightings represent the relative capitalizations of the major overseas markets included in the index on a U.S. dollar adjusted basis.
Unless otherwise noted, index returns reflect the reinvestment of income dividends and capital gains, if any, but do not reflect fees, brokerage commissions or other expenses of investing. One cannot invest directly in an index. Since markets can go down as well as up, investment return and principal value will fluctuate with market conditions, currency volatility and the social, economic and political climates of countries where the Fund invests. You may have a gain or loss when you sell your shares.
38
EMERGING MARKETS FUND
SCHEDULEOF INVESTMENTS
As of March 31, 2009
| | | | | |
| | | Number of
Shares | | Value |
Common Stock - 96.1% | | | | | |
Brazil-13.5% | | | | | |
Centrais Eletricas Brasileiras SA | | 7,000 | | $ | 78,810 |
Cia Vale do Rio Doce Cl. B - ADR | | 40,400 | | | 537,320 |
Investimentos Itau SA | | 52,500 | | | 181,746 |
Itau Unibanco Banco Multiplo SA - ADR | | 24,150 | | | 262,752 |
Natura Cosmeticos SA | | 8,000 | | | 78,706 |
Petroleo Brasileiro SA - ADR | | 21,900 | | | 667,293 |
Petroleo Brasileiro SA - ADR | | 38,800 | | | 950,600 |
Redecard SA | | 29,500 | | | 359,420 |
Souza Cruz SA | | 2,500 | | | 47,508 |
Tele Norte Leste Participacoes SA - ADR | | 26,000 | | | 359,840 |
Vivo Participacoes SA - ADR | | 5,000 | | | 65,250 |
| | | | | |
| | | | | 3,589,245 |
| | | | | |
Chile - 2.8% | | | | | |
Banco Santander Chile - ADR | | 1,600 | | | 54,960 |
Empresa Nacional de Electricidad SA - ADR | | 6,100 | | | 228,750 |
Enersis SA - ADR | | 27,300 | | | 412,230 |
Entel Empresa De Telecommunicaciones SA | | 4,396 | | | 50,585 |
| | | | | |
| | | | | 746,525 |
| | | | | |
Egypt - 0.9% | | | | | |
El Ezz Steel Co. | | 29,692 | | | 38,103 |
Orascom Telecom Holding SAE | | 44,681 | | | 203,499 |
| | | | | |
| | | | | 241,602 |
| | | | | |
Hong Kong - 3.8% | | | | | |
China Agri-Industries Holdings, Ltd.* | | 624,000 | | | 297,105 |
China Mobile, Ltd. | | 50,500 | | | 440,816 |
China Pharmaceutical Group, Ltd. | | 684,000 | | | 273,600 |
| | | | | |
| | | | | 1,011,521 |
| | | | | |
India - 5.4% | | | | | |
Axis Bank, Ltd. | | 12,175 | | | 99,409 |
Bharat Heavy Electricals, Ltd. | | 3,642 | | | 108,395 |
HDFC Bank, Ltd. - ADR | | 1,200 | | | 73,116 |
Hero Honda Motors, Ltd. | | 3,276 | | | 69,226 |
Hindustan Unilever, Ltd. | | 33,703 | | | 156,807 |
Infosys Technologies, Ltd. - ADR | | 8,400 | | | 223,692 |
ITC, Ltd. | | 38,980 | | | 142,213 |
Maruti Suzuki India, Ltd. | | 3,529 | | | 54,185 |
Oil & Natural Gas Corp., Ltd. | | 9,109 | | | 139,719 |
State Bank of India, Ltd. | | 13,822 | | | 287,419 |
Tata Motors, Ltd. - ADR | | 15,200 | | | 74,936 |
| | | | | |
| | | | | 1,429,117 |
| | | | | |
Indonesia - 1.4% | | | | | |
Bank Central Asia Tbk PT | | 564,000 | | | 151,311 |
Perusahaan Gas Negara PT | | 667,000 | | | 124,106 |
United Tractors Tbk PT | | 147,000 | | | 85,872 |
| | | | | |
| | | | | 361,289 |
| | | | | |
Israel - 5.2% | | | | | |
Bezeq Israeli Telecommunication Corp., Ltd. | | 72,639 | | | 113,606 |
Cellcom Israel, Ltd. | | 2,900 | | | 61,770 |
Israel Chemicals, Ltd. | | 12,468 | | | 101,103 |
Makhteshim-Agan Industries, Ltd. | | 35,082 | | | 146,979 |
Teva Pharmaceutical Industries, Ltd. - ADR | | 21,100 | | | 950,555 |
| | | | | |
| | | | | 1,374,013 |
| | | | | |
| | | | | |
| | | Number of
Shares | | Value |
Kuwait - 0.0% | | | | | |
Global Investment House KSCC - GDR 144A#,* | | 9,531 | | $ | 8,959 |
| | | | | |
Malaysia - 0.2% | | | | | |
Tenaga Nasional Berhad | | 37,800 | | | 63,251 |
| | | | | |
Mexico - 2.5% | | | | | |
America Movil SAB De CV | | | | | |
Series L - ADR | | 13,300 | | | 360,164 |
Grupo Financiero Inbursa SA | | 27,672 | | | 71,618 |
Grupo Mexico SAB de CV Cl. B | | 253,354 | | | 185,394 |
Kimberly-Clark de Mexico SAB de CV | | 19,200 | | | 62,598 |
| | | | | |
| | | | | 679,774 |
| | | | | |
Peru - 0.5% | | | | | |
Credicorp, Ltd. | | 3,100 | | | 145,204 |
| | | | | |
Philippines - 0.2% | | | | | |
Philippine Long Distance Telephone Co. - ADR | | 1,300 | | | 57,369 |
| | | | | |
Poland - 0.3% | | | | | |
Telekomunikacja Polska SA | | 15,381 | | | 82,124 |
| | | | | |
Republic of China - 17.9% | | | | | |
Bank of China, Ltd. | | 1,625,000 | | | 540,968 |
Bank of Communications Co., Ltd. | | 390,000 | | | 271,742 |
China Construction Bank Corp. | | 988,000 | | | 560,929 |
China COSCO Holdings Co., Ltd. | | 249,000 | | | 162,252 |
China Life Insurance Co., Ltd. | | 142,000 | | | 470,890 |
China Petroleum & Chemical Corp. | | 654,000 | | | 418,560 |
CNOOC, Ltd. | | 198,000 | | | 196,978 |
Dongfeng Motor Group Co., Ltd. | | 242,000 | | | 126,152 |
Harbin Power Equipment Co., Ltd. | | 114,000 | | | 74,137 |
Industrial & Commercial Bank of China | | .1,524,300 | | | 788,702 |
Maanshan Iron & Steel | | 434,000 | | | 152,880 |
PetroChina Co., Ltd. | | 136,000 | | | 108,098 |
Ping An Insurance Group Co. of | | | | | |
China, Ltd. | | 34,000 | | | 203,561 |
Shandong Weigao Group Medical | | | | | |
Polymer Co., Ltd. | | 28,000 | | | 49,858 |
Sino-Ocean Land Holdings, Ltd. | | 200,000 | | | 131,613 |
Tencent Holdings, Ltd. | | 59,200 | | | 439,226 |
Yanzhou Coal Mining Co., Ltd. | | 102,000 | | | 73,308 |
| | | | | |
| | | | | 4,769,854 |
| | | | | |
Russian Federation - 3.4% | | | | | |
Evraz Group SA - GDR | | 12,389 | | | 102,333 |
LUKOIL - ADR | | 12,100 | | | 456,170 |
Mobile Telesystems OJSC - ADR | | 6,200 | | | 185,504 |
Surgutneftegaz - ADR | | 27,500 | | | 170,500 |
| | | | | |
| | | | | 914,507 |
| | | | | |
Singapore - 0.9% | | | | | |
Golden Agri-Resources, Ltd. | | 1,278,160 | | | 231,216 |
| | | | | |
South Africa - 9.0% | | | | | |
ABSA Group, Ltd. | | 16,057 | | | 162,427 |
AngloGold Ashanti, Ltd. - ADR | | 6,200 | | | 227,912 |
Harmony Gold Mining Co., Ltd. - ADR* | | 19,200 | | | 210,048 |
Impala Platinum Holdings, Ltd. | | 11,043 | | | 183,760 |
MTN Group, Ltd. | | 29,539 | | | 326,140 |
Naspers, Ltd. Cl. N | | 24,028 | | | 404,257 |
Sanlam, Ltd. | | 128,038 | | | 226,726 |
Sasol, Ltd. | | 2,453 | | | 70,933 |
Shoprite Holdings, Ltd. | | 54,057 | | | 287,565 |
Standard Bank Group, Ltd. | | 15,771 | | | 131,840 |
Telkom South Africa, Ltd. | | 5,026 | | | 55,751 |
| | | | |
| See Accompanying Notes to Financial Statements. |
| 39 |
EMERGING MARKETS FUND
SCHEDULEOF INVESTMENTS
As of March 31, 2009
| | | | | |
| | | Number of
Shares | | Value |
Truworths International, Ltd. | | 35,621 | | $ | 120,347 |
| | | | | |
| | | | | 2,407,706 |
| | | | | |
South Korea - 12.4% | | | | | |
Daewoo Securities Co., Ltd.* | | 9,440 | | | 125,230 |
Daewoo Shipbuilding & Marine | | | | | |
Engineering Co., Ltd. | | 16,490 | | | 255,710 |
Daishin Securities Co., Ltd.* | | 5,960 | | | 73,248 |
Doosan Corp. | | 1,631 | | | 117,911 |
Hite Brewery Co., Ltd. | | 12 | | | 1,189 |
Hyosung Corp. | | 5,550 | | | 259,595 |
Hyundai Mobis | | 2,442 | | | 140,526 |
Kolon Industries, Inc. | | 6,760 | | | 151,498 |
Korea Line Corp. | | 2,874 | | | 121,546 |
Korea Zinc Co., Ltd. | | 2,002 | | | 163,547 |
Korean Air Lines Co., Ltd.* | | 1,870 | | | 46,708 |
KT&G Corp. | | 1,071 | | | 58,921 |
LG Chem, Ltd. | | 2,274 | | | 147,956 |
LG Corp. | | 9,740 | | | 346,435 |
NCSoft Corp. | | 3,220 | | | 214,628 |
POSCO | | 696 | | | 183,403 |
Samsung Electronics Co., Ltd. | | 609 | | | 250,072 |
Samsung Fire & Marine Insurance | | | | | |
Co., Ltd.* | | 2,541 | | | 293,917 |
SK Energy Co., Ltd. | | 4,400 | | | 281,511 |
SK Holdings Co., Ltd. | | 903 | | | 70,177 |
| | | | | |
| | | | | 3,303,728 |
| | | | | |
Taiwan - 13.6% | | | | | |
Acer, Inc. | | 328,000 | | | 493,276 |
AU Optronics Corp. | | 256,000 | | | 211,748 |
China Airlines* | | 697,000 | | | 173,675 |
Chunghwa Telecom Co., Ltd. | | 105,543 | | | 192,649 |
Compal Electronics, Inc. | | 419,000 | | | 300,239 |
Eva Airways Corp.* | | 362,000 | | | 89,240 |
Formosa Plastics Corp. | | 58,000 | | | 87,397 |
HTC Corp. | | 15,000 | | | 184,448 |
Lite-On Technology Corp. | | 181,000 | | | 122,225 |
Macronix International Co., Ltd. | | 302,000 | | | 114,434 |
MediaTek, Inc. | | 37,000 | | | 348,048 |
POU Chen Corp. | | 331,000 | | | 182,034 |
Powerchip Semiconductor Corp.* | | 1,267,000 | | | 164,764 |
Quanta Computer, Inc. | | 384,940 | | | 486,397 |
Taiwan Semiconductor Manufacturing | | | | | |
Co., Ltd. - ADR | | 38,700 | | | 346,365 |
Uni-President Enterprises Corp. | | 146,000 | | | 118,395 |
| | | | | |
| | | | | 3,615,334 |
| | | | | |
Turkey - 1.2% | | | | | |
Tupras Turkiye Petrol Rafine | | 7,638 | | | 76,241 |
Turk Hava Yollari* | | 51,235 | | | 200,586 |
Turk Telekomunikasyon AS* | | 24,259 | | | 55,969 |
| | | | | |
| | | | | 332,796 |
| | | | | |
United Kingdom - 1.0% | | | | | |
British American Tobacco PLC | | 11,279 | | | 259,915 |
| | | | | |
Total Common Stock (Cost: $25,069,335) | | | | | 25,625,049 |
| | | | | |
| | | | | | |
| | | Number of
Shares | | Value |
Preferred Stock - 1.0% | | | | | | |
Brazil - 1.0% | | | | | | |
Centrais Eletricas Brasileiras SA | | | 13,400 | | $ | 145,975 |
Usinas Siderurgicas de Minas Gerais SA | | | 8,750 | | | 112,119 |
| | | | | | |
| | | | | | 258,094 |
| | | | | | |
Total Preferred Stock (Cost: $248,429) | | | | | | 258,094 |
| | | | | | |
| | | Principal
Amount | | |
Short Term Investments - 2.6% | | | | | | |
Time Deposit - 2.6% | | | | | | |
Citibank London 0.100%, 04/01/09 (Cost: $699,046) | | $ | 699,046 | | | 699,046 |
| | | | | | |
Total Investments - 99.7% (Cost: $26,016,810) | | | | | | 26,582,189 |
| | | | | | |
Other Assets in Excess of Liabilities - 0.3% | | | | | | 91,830 |
| | | | | | |
Net Assets - 100.0% | | | | | $ | 26,674,019 |
| | | | | | |
| * | Non-income producing securities. |
| # | 144A Security. Certain conditions for public sale may exist. The total market value of 144A securities owned at March 31, 2009 was $8,959 or 0.03% of net assets. |
ADR - American Depository Receipt
GDR - Global Depository Receipt
SCHEDULEOF INVESTMENTSBY SECTOR
as of March 31, 2009
| | | |
Sector | | Percent of
Net Assets | |
Financial | | 20.5 | % |
Energy | | 13.8 | |
Communications | | 13.8 | |
Technology | | 11.4 | |
Consumer, Non-cyclical | | 11.1 | |
Basic Materials | | 10.5 | |
Consumer, Cyclical | | 5.8 | |
Industrial | | 4.3 | |
Utilities | | 3.9 | |
Diversified | | 2.0 | |
Short Term Investments | | 2.6 | |
| | | |
Total Investments | | 99.7 | |
Other assets in excess of liabilities | | 0.3 | |
| | | |
Net Assets | | 100.0 | % |
| | | |
| | | | |
| See Accompanying Notes to Financial Statements. |
| 40 |
INTERNATIONAL SYSTEMATIC FUND
Management Team: Kunal Ghosh, Portfolio Manager; Steven Tael, Ph.D., CFA, Portfolio Manager
Chief Investment Officer: Horacio A. Valeiras, CFA
Goal: The International Systematic Fund seeks to maximize long-term capital appreciation through investments primarily in companies located in the developed countries represented in the MSCI EAFE Index. The Investment Adviser identifies investment opportunities using a quantitative model that integrates stock, sector, country and currency selection decisions.
Market Overview: Developed non-U.S. stock markets generated losses in the twelve months ended March 31, 2009. Broad appreciation in the U.S. dollar increased the losses in dollar terms.
International equities were weak throughout much of the period, as the financial crisis that began with U.S. subprime mortgages intensified and tipped the global economy into a recession. Engulfed by mortgage-related losses, a large U.S. financial institution was forced into bankruptcy. Others teetered near the brink of collapse and were rescued by their respective governments or by other institutions. Risk aversion skyrocketed, banks cut back lending and economic activity ground to a virtual halt.
Every country and sector in the MSCI EAFE Index posted a decline. Japan was the one of the more resilient markets, supported by the healthier balance sheets of Japanese businesses and consumers. Ireland, which was dealing with the aftermath of its own housing bubble, led the declines. Consumer staples and health care were two of the most resilient sectors, as their demand patterns tend to be less dependent on economic cycles. Amid the turmoil in the credit markets, financials was the worst-performing group. Materials was another especially weak sector, since the slowdown in the global economy dampened demand for chemicals, metals and other commodities.
Performance: During the fiscal year ended March 31, 2009, the Fund’s Class I shares posted a 47.68% loss and the MSCI EAFE Index fell 46.20%.
Portfolio Specifics: The Fund’s relative performance was negatively affected by stock selection in Japan, Switzerland and the consumer discretionary and industrials sectors. Major detractors included a Japan-based shipping company that was impacted by the downturn in global trade; a Switzerland-based insurance firm that reported losses on its securities portfolio; and a U.K.-based materials technology company whose ceramics division was hurt by cuts in steel production. An overweight in the materials sector also detracted.
Results versus the index benefited from stock selection in Sweden, Hong Kong and the telecommunication services and materials sectors. Top-performing holdings included Sweden-based Ericsson, a manufacturer of communications equipment that won a major contract, and Australia-based Newcrest Mining, a gold producer that was recognized for its solid balance sheet. An underweight in the financials sector was another key area of relative strength.
The Fund remained well-diversified across countries and sectors throughout the period. Based on our model’s bottom-up stock recommendations, on March 31, 2009, the Funds’ largest overweights versus the benchmark were in the Fund’s United Kingdom (+3.6%) and the telecommunication services sector (+1.7%). The largest underweights were in Japan (–2.9%) and financials (–3.0%).
Market Outlook: The Fund’s investment process evaluates opportunities on a relative basis and neither utilizes, nor results in, a forecast or outlook on the overall market. Rather, the Fund expects to outperform the MSCI EAFE Index in both up and down markets.
We believe that the Fund’s proprietary stock-selection model, in conjunction with its risk-controlled approach to portfolio construction, will drive strong performance over time.
Comparison of Change in Value of a $250,000 Investment in International Systematic Fund Class I and III Shares with the MSCI EAFE Index.
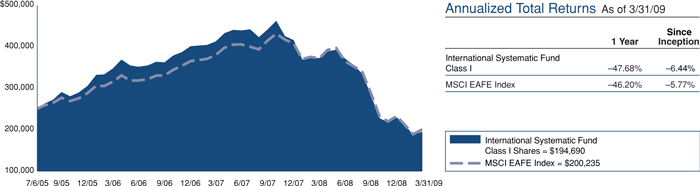
41
INTERNATIONAL SYSTEMATIC FUND
[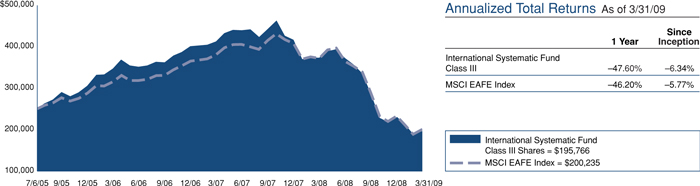
The graphs above show the value of a hypothetical $250,000 investment in the Fund’s Class I and III shares with the MSCI EAFE Index for the periods indicated. Average annual total return figures include changes in principal value, reinvested dividends, and capital gain distributions. The Class I shares commenced operations on July 6, 2005 and Class III shares on December 22, 2006. The historical performance of Class III shares includes the performance of Class I shares for the periods prior to the inception of Class III shares. The total returns shown above do not show the effects of income taxes on an individual’s investment. In most cases, taxes may reduce your actual investment returns on income or gains paid by the Fund or any gains you may realize if you sell your shares. Past performance cannot guarantee future results.
The MSCI EAFE Index is an unmanaged index comprised of over 900 companies and is a generally accepted benchmark for major overseas markets. Index weightings represent the relative capitalizations of the major overseas markets included in the Index on a U.S. dollar adjusted basis. Unless otherwise noted, index returns reflect the reinvestment of income dividends and capital gains, if any, but do not reflect fees, brokerage commissions or other expenses of investing. One cannot invest directly in an index. Since markets can go down as well as up, investment return and principal value will fluctuate with market conditions, currency volatility and the social, economic and political climates of countries where the Fund invests. You may have a gain or loss when you sell your shares.
42
INTERNATIONAL SYSTEMATIC FUND
SCHEDULEOF INVESTMENTS
As of March 31, 2009
| | | | | |
| | | Number of
Shares | | Value |
Common Stock - 96.3% | | | | | |
Australia - 9.6% | | | | | |
AGL Energy, Ltd. | | 14,493 | | $ | 150,643 |
Australia & New Zealand Banking Group, Ltd. | | 12,628 | | | 138,189 |
BHP Billiton, Ltd. | | 40,564 | | | 899,348 |
Commonwealth Bank of Australia | | 21,382 | | | 515,956 |
CSL, Ltd. | | 31,435 | | | 709,616 |
Energy Resources of Australia, Ltd. | | 12,388 | | | 182,817 |
Foster’s Group, Ltd. | | 35,975 | | | 126,477 |
National Australia Bank, Ltd. | | 13,675 | | | 190,978 |
Newcrest Mining, Ltd. | | 13,934 | | | 316,870 |
QBE Insurance Group, Ltd. | | 36,272 | | | 485,638 |
Westpac Banking Corp. | | 20,884 | | | 277,000 |
Woodside Petroleum, Ltd. | | 8,431 | | | 223,184 |
| | | | | |
| | | | | 4,216,716 |
| | | | | |
Belgium - 0.2% | | | | | |
AGFA-Gevaert NV* | | 39,420 | | | 66,469 |
| | | | | |
Bermuda - 0.7% | | | | | |
Seadrill, Ltd. | | 31,200 | | | 302,199 |
| | | | | |
France - 8.6% | | | | | |
Alstom SA | | 2,792 | | | 144,515 |
Credit Agricole SA | | 10,828 | | | 119,496 |
France Telecom SA | | 20,019 | | | 455,834 |
GDF Suez | | 6,837 | | | 234,653 |
Pernod-Ricard SA | | 2,892 | | | 161,172 |
Sanofi-Aventis SA | | 15,523 | | | 873,446 |
SCOR SE | | 10,762 | | | 221,404 |
Total SA | | 18,455 | | | 917,013 |
Unibail-Rodamco - REIT | | 2,511 | | | 355,489 |
Vinci SA | | 3,519 | | | 130,611 |
Vivendi | | 5,539 | | | 146,531 |
| | | | | |
| | | | | 3,760,164 |
| | | | | |
Germany - 6.1% | | | | | |
Bayerische Motoren Werke AG | | 13,446 | | | 389,001 |
Bilfinger Berger AG | | 8,417 | | | 318,159 |
Daimler AG | | 4,264 | | | 108,018 |
Deutsche Bank AG | | 8,560 | | | 344,363 |
Deutsche Lufthansa AG | | 9,765 | | | 105,924 |
Deutsche Telekom AG | | 22,710 | | | 281,922 |
E.ON AG | | 16,303 | | | 452,607 |
RWE AG | | 4,377 | | | 306,897 |
SAP AG | | 4,059 | | | 143,782 |
ThyssenKrupp AG | | 13,085 | | | 228,802 |
| | | | | |
| | | | | 2,679,475 |
| | | | | |
Hong Kong - 1.1% | | | | | |
Shun Tak Holdings Ltd. | | 362,000 | | | 113,037 |
Sun Hung Kai Properties, Ltd. | | 25,000 | | | 224,355 |
Swire Pacific, Ltd. | | 23,000 | | | 153,581 |
| | | | | |
| | | | | 490,973 |
| | | | | |
Ireland - 0.8% | | | | | |
Experian PLC | | 41,070 | | | 257,105 |
Ryanair Holdings PLC* | | 27,577 | | | 106,089 |
| | | | | |
| | | | | 363,194 |
| | | | | |
Italy - 1.8% | | | | | |
Enel SpA | | 26,514 | | | 127,170 |
ENI SpA | | 11,378 | | | 220,858 |
Finmeccanica SpA | | 22,014 | | | 273,866 |
Telecom Italia SpA | | 122,494 | | | 157,919 |
| | | | | |
| | | | | 779,813 |
| | | | | |
| | | | | |
| | | Number of
Shares | | Value |
Japan - 21.4% | | | | | |
Alpen Co., Ltd. | | 6,600 | | $ | 110,256 |
Chugai Pharmaceutical Co., Ltd. | | 10,000 | | | 168,067 |
Cosmo Oil Co., Ltd. | | 47,000 | | | 141,804 |
Dena Co., Ltd. | | 34 | | | 110,499 |
East Japan Railway Co. | | 6,100 | | | 316,827 |
Electric Power Development Co., Ltd. | | 6,200 | | | 183,295 |
FamilyMart Co., Ltd. | | 4,100 | | | 124,532 |
Fast Retailing Co., Ltd. | | 3,900 | | | 441,055 |
Hitachi, Ltd. | | 23,000 | | | 61,942 |
Idemitsu Kosan Co., Ltd. | | 2,000 | | | 149,438 |
KDDI Corp. | | 73 | | | 341,460 |
Konami Corp. | | 7,300 | | | 109,238 |
Marubeni Corp. | | 167,000 | | | 515,692 |
Meiji Seika Kaisha, Ltd. | | 34,000 | | | 119,105 |
Mitsubishi Heavy Industries, Ltd. | | 143,000 | | | 431,447 |
Mitsubishi UFJ Financial Group, Inc. | | 64,600 | | | 311,325 |
Mitsui Engineering & Shipbuilding Co., Ltd. | | 87,000 | | | 144,457 |
Mitsui OSK Lines, Ltd. | | 32,700 | | | 159,246 |
Mitsui Sumitomo Insurance Group Holdings, Inc. | | 6,400 | | | 147,413 |
Mizuho Financial Group, Inc. | | 158,900 | | | 302,452 |
Nintendo Co., Ltd. | | 700 | | | 201,630 |
Nippon Mining Holdings, Inc. | | 139,000 | | | 548,850 |
Nippon Paper Group, Inc. | | 4,900 | | | 118,568 |
Nitori Co., Ltd. | | 1,850 | | | 103,392 |
NTT Data Corp. | | 69 | | | 186,664 |
OJI Paper Co., Ltd. | | 64,000 | | | 259,188 |
Osaka Gas Co., Ltd. | | 61,000 | | | 190,220 |
Rakuten, Inc. | | 365 | | | 174,425 |
Ricoh Co., Ltd. | | 13,000 | | | 153,073 |
Rinnai Corp. | | 4,300 | | | 149,327 |
Seven & I Holdings Co., Ltd. | | 11,500 | | | 251,493 |
Softbank Corp. | | 23,800 | | | 302,651 |
Sumitomo Osaka Cement Co., Ltd. | | 63,000 | | | 144,791 |
Taiheiyo Cement Corp. | | 86,000 | | | 125,382 |
Takeda Pharmaceutical Co., Ltd. | | 4,500 | | | 154,905 |
The Sumitomo Trust & Banking Co., Ltd. | | 57,000 | | | 215,258 |
Tokyo Electric Power Co., Inc. | | 19,000 | | | 473,221 |
Tokyo Gas Co., Ltd. | | 60,000 | | | 209,578 |
Toyo Suisan Kaisha, Ltd. | | 18,100 | | | 371,089 |
Toyota Motor Corp. | | 13,900 | | | 439,081 |
UNY Co., Ltd. | | 29,000 | | | 225,494 |
| | | | | |
| | | | | 9,387,830 |
| | | | | |
Netherlands - 1.7% | | | | | |
Koninklijke Ahold NV | | 31,347 | | | 343,360 |
Koninklijke KPN NV | | 31,699 | | | 423,393 |
| | | | | |
| | | | | 766,753 |
| | | | | |
Norway - 1.5% | | | | | |
Tandberg ASA | | 25,200 | | | 369,857 |
TGS Nopec Geophysical Co. ASA* | | 22,800 | | | 176,941 |
Yara International ASA | | 4,800 | | | 104,679 |
| | | | | |
| | | | | 651,477 |
| | | | | |
Papua New Guinea - 0.3% | | | | | |
Lihir Gold, Ltd.* | | 51,569 | | | 117,523 |
| | | | | |
Singapore - 1.0% | | | | | |
Golden Agri-Resources, Ltd. | | 1,292,440 | | | 233,799 |
Wilmar International, Ltd. | | 104,000 | | | 216,866 |
| | | | | |
| | | | | 450,665 |
| | | | | |
| | | | |
| See Accompanying Notes to Financial Statements. |
| 43 |
INTERNATIONAL SYSTEMATIC FUND
SCHEDULEOF INVESTMENTS
As of March 31, 2009
| | | | | |
| | | Number of
Shares | | Value |
Spain - 6.0% | | | | | |
ACS Actividades de Construccion y Servicios SA | | 5,938 | | $ | 246,292 |
Banco Bilbao Vizcaya Argentaria SA | | 43,456 | | | 352,526 |
Banco Santander SA | | 110,709 | | | 762,869 |
Mapfre SA | | 222,177 | | | 486,724 |
Telefonica SA | | 38,758 | | | 772,915 |
| | | | | |
| | | | | 2,621,326 |
| | | | | |
Sweden - 4.8% | | | | | |
Boliden AB | | 92,850 | | | 476,195 |
Eniro AB | | 156,700 | | | 119,411 |
Hennes & Mauritz AB Cl. B | | 7,000 | | | 261,633 |
Millicom International Cellular SA* | | 3,450 | | | 128,948 |
Nordea Bank AB | | 47,000 | | | 233,087 |
Securitas AB Cl. B | | 50,730 | | | 368,173 |
Skandinaviska Enskilda Banken AB | | 19,994 | | | 62,638 |
Telefonaktiebolaget LM Ericsson Cl. B | | 43,218 | | | 352,862 |
Trelleborg AB Cl. B | | 21,400 | | | 81,020 |
| | | | | |
| | | | | 2,083,967 |
| | | | | |
Switzerland - 7.1% | | | | | |
Credit Suisse Group AG | | 4,797 | | | 146,224 |
Nestle SA | | 24,510 | | | 829,466 |
Novartis AG | | 13,775 | | | 521,901 |
OC Oerlikon Corp. AG* | | 2,025 | | | 64,861 |
Roche Holding AG | | 2,370 | | | 325,574 |
Swisscom AG | | 555 | | | 156,072 |
Syngenta AG | | 2,973 | | | 599,803 |
Zurich Financial Services AG | | 3,079 | | | 487,690 |
| | | | | |
| | | | | 3,131,591 |
| | | | | |
United Kingdom - 23.6% | | | | | |
Admiral Group PLC | | 9,065 | | | 110,898 |
AstraZeneca PLC | | 29,517 | | | 1,036,974 |
Autonomy Corp. PLC* | | 7,682 | | | 143,693 |
BAE Systems PLC | | 108,355 | | | 519,514 |
Barclays PLC | | 179,703 | | | 381,214 |
BG Group PLC | | 31,954 | | | 483,203 |
British American Tobacco PLC | | 32,425 | | | 749,664 |
Brixton PLC - REIT | | 103,767 | | | 26,400 |
Cable & Wireless PLC | | 108,000 | | | 215,949 |
Compass Group PLC | | 83,071 | | | 379,833 |
Cookson Group PLC | | 867,020 | | | 201,946 |
Diageo PLC | | 37,943 | | | 427,743 |
GlaxoSmithKline PLC | | 67,880 | | | 1,058,091 |
Imperial Tobacco Group PLC | | 10,853 | | | 243,765 |
Man Group PLC | | 39,956 | | | 125,137 |
Pearson PLC | | 13,085 | | | 131,569 |
Prudential PLC | | 90,444 | | | 436,880 |
Reckitt Benckiser Group PLC | | 5,141 | | | 192,990 |
Rio Tinto PLC | | 7,272 | | | 244,948 |
Royal Dutch Shell PLC Cl. B | | 48,198 | | | 1,057,685 |
RSA Insurance Group PLC | | 142,567 | | | 265,857 |
Standard Chartered PLC | | 15,850 | | | 192,245 |
Tullow Oil PLC | | 19,231 | | | 221,345 |
Unilever PLC | | 18,426 | | | 348,096 |
United Business Media, Ltd. | | 36,150 | | | 220,605 |
Vodafone Group PLC | | 276,476 | | | 486,442 |
WPP PLC | | 80,456 | | | 452,926 |
| | | | | |
| | | | | 10,355,612 |
| | | | | |
Total Common Stock (Cost: $50,541,728) | | | | | 42,225,747 |
| | | | | |
| | | | | | | |
| | | Number of
Shares | | Value | |
Rights - 0.1% | | | | | | | |
Sweden - 0.1% | | | | | | | |
Nordea Bank AB* (Cost: $104,066) | | | 508,200 | | $ | 57,783 | |
| | | | | | | |
| | |
| | | Principal
Amount | | | |
Short Term Investments - 4.9% | | | | | | | |
Time Deposit - 4.9% | | | | | | | |
Citibank London
0.100%, 04/01/09
(Cost: $2,144,456) | | $ | 2,144,456 | | | 2,144,456 | |
| | | | | | | |
Total Investments - 101.3% (Cost: $52,790,250) | | | | | | 44,427,986 | |
| | | | | | | |
Liabilities in Excess of Other Assets - (1.3%) | | | | | | (571,212 | ) |
| | | | | | | |
Net Assets - 100.0% | | | | | $ | 43,856,774 | |
| | | | | | | |
| * | Non-income producing securities. |
REIT - Real Estate Investment Trust
SCHEDULEOF INVESTMENTSBY SECTOR
as of March 31, 2009
| | | |
Sector | | Percent of
Net Assets | |
Consumer, Non-cyclical | | 22.4 | % |
Financial | | 18.4 | |
Communications | | 13.2 | |
Energy | | 10.1 | |
Consumer, Cyclical | | 8.6 | |
Industrial | | 8.2 | |
Basic Materials | | 8.1 | |
Utilities | | 5.3 | |
Technology | | 1.7 | |
Diversified | | 0.4 | |
Short Term Investments | | 4.9 | |
| | | |
Total Investments | | 101.3 | |
Liabilities in excess of other assets | | (1.3 | ) |
| | | |
Net Assets | | 100.0 | % |
| | | |
| | | | |
| See Accompanying Notes to Financial Statements. |
| 44 |
INTERNATIONAL ALL CAP GROWTH FUND
Management Team: Horacio A. Valeiras, CFA, Portfolio Manager and Chief Investment Officer; Pedro V. Marcal, Portfolio Manager
Goal: The International All Cap Growth Fund seeks to maximize long-term capital appreciation through investments in a diversified portfolio of equity securities of companies primarily located in developed non-U.S. markets.
Market Overview: Stock markets in developed non-U.S. countries registered losses in local currencies during the fiscal year ended March 31, 2009. The losses were driven by the U.S.-led credit crisis, which spread around the world and pushed major developed economies into recession. Appreciation in the U.S. dollar versus a range of currencies exacerbated the declines in dollar terms.
In Europe, the euro zone economy contracted at an annual pace of 5.7% in the fourth quarter of 2008 — the sharpest drop since records began in 1995 — and U.K. GDP slid at its fastest rate in nearly thirty years. Several major European financial institutions were overwhelmed by asset write-downs and had to be rescued or nationalized by their respective governments. Credit was extremely tight, and the combination of fading demand and higher borrowing costs dampened corporate profits.
The economic and earnings environment was also difficult in Japan, where weakening global consumer demand led to a steep decline in industrial production. The impact of falling exports and factory production was evident in fourth quarter GDP, which fell 12.7%, annualized. Near the end of the fiscal year, the Nikkei 225 Index touched a twenty-six year low, and a key barometer of European equities hit its lowest level since 1996.
Policymakers around the world cut interest rates and announced fiscal-stimulus packages to try and revive their faltering economies. With official overnight lending rates near zero, the Bank of England and Bank of Japan joined the U.S. Federal Reserve in quantitative easing, forcing down longer-term rates by purchasing government debt.
Performance: During the fiscal year ended March 31, 2009, the Fund’s Class I shares declined 46.87%. The MSCI EAFE Growth Index, the Fund’s primary benchmark, lost 45.12% and the MSCI EAFE Index fell 46.20%.
Portfolio Specifics: Stock selection in Hong Kong was a key area of relative strength in the Fund, where top contributors included HongKong Electric and Sun Hung Kai Properties. HongKong Electric, a utility, reported better-than-expected 2008 operating results, supported by strong earnings from recently acquired overseas assets. Sun Hung Kai Properties, a property development company, benefited from the successful launch of a luxury residential project.
Stock selection in Singapore and Denmark also positively impacted relative performance, as did an underweight in Finland. Finland was one of the weakest markets in the indexes, hurt by the exposure of Finnish banks to Icelandic banks, the latter of which collapsed in the wake of the credit crisis.
On the minus side, stock selection in the United Kingdom, Australia and Japan negatively affected relative results. The global recession led to a sell-off in commodities, and major detractors included a U.K.-based energy pipeline producer and an Australia-based fertilizer company. Our position in a Japanese brokerage firm was also unfavorable, as asset write-downs and trading losses eroded the company’s profits.
Market Outlook: We believe that the aggressive policy response from governments worldwide will soften the impact of the most significant economic downturn since World War II. That said, the duration of the current crisis depends upon the effectiveness of these measures, as does our outlook for equities. We do not foresee sustainable improvement in global stock markets until the credit markets resume lending and businesses have access to capital.
We are confident that the Fund is well-positioned for this dynamic market environment given our bottom-up approach to identifying companies with superior earnings prospects.
Comparison of Change in Value of a $250,000 Investment in International All Cap Growth Fund Class I Shares with the MSCI EAFE Growth Index and MSCI EAFE Index.
[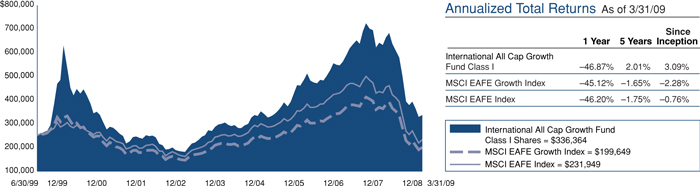
The graph above shows the value of a hypothetical $250,000 investment in the Fund’s Class I shares compared with the MSCI EAFE Growth Index and MSCI EAFE Index for the periods indicated. Average annual total return figures include changes in principal value,
reinvested dividends, and capital gain distributions. The total returns shown above do not show the effects of income taxes on an individual’s investment. In most cases, taxes may reduce your actual investment returns on income or gains paid by the Fund or any gains you may realize if you sell your shares. Past performance cannot guarantee future results.
45
INTERNATIONAL ALL CAP GROWTH FUND
On November 18, 2005, the Fund became the successor entity to the Nicholas-Applegate International All Cap Growth Fund, a series of the Professionally Managed Portfolios (“Acquired Fund”). The Acquired Fund transferred all of its assets and liabilities in exchange for shares of the Fund, and the investment objectives, policies and limitations of the Fund are substantially similar to those of the Acquired Fund. The Performance shown above includes the historical performance of the Acquired Fund from June 30, 1999 to November 18, 2005.
The MSCI EAFE Growth Index is an unmanaged index that is a generally accepted benchmark for major overseas markets. It consists of the top 50% of the MSCI EAFE, those companies with the highest
Price/Book Value ratio. The MSCI EAFE Index consists of approximately 900 companies with average market capitalization of U.S. $8.7 billion. Its weightings represent the relative capitalization of the major overseas markets included in the index on a U.S. dollar adjusted basis. Unless otherwise noted, index returns reflect the reinvestment of income dividends and capital gains, if any, but do not reflect fees, brokerage commissions or other expenses of investing. One cannot invest directly into an index. Since markets can go down as well as up, investment return and principal value will fluctuate with market conditions, currency volatility and the social, economic and political climates of countries where the Fund invests. You may have a gain or loss when you sell your shares.
46
INTERNATIONAL ALL CAP GROWTH FUND
SCHEDULEOF INVESTMENTS
As of March 31, 2009
| | | | | |
| | | Number of
Shares | | Value |
Common Stock - 92.9% | | | | | |
Australia - 6.2% | | | | | |
BHP Billiton, Ltd. | | 2,815 | | $ | 62,412 |
BHP Billiton, Ltd. - ADR | | 2,400 | | | 107,040 |
Cochlear, Ltd. | | 8,393 | | | 292,156 |
CSL, Ltd. | | 24,287 | | | 548,255 |
Incitec Pivot, Ltd. | | 158,433 | | | 233,368 |
Rio Tinto, Ltd | | 6,317 | | | 248,289 |
| | | | | |
| | | | | 1,491,520 |
| | | | | |
Brazil - 1.8% | | | | | |
Cia Vale do Rio Doce Cl. B - ADR | | 15,100 | | | 200,830 |
Petroleo Brasileiro SA - ADR | | 7,500 | | | 228,525 |
| | | | | |
| | | | | 429,355 |
| | | | | |
Canada - 0.9% | | | | | |
Rogers Communications, Inc. Cl. B | | 8,855 | | | 204,457 |
| | | | | |
Denmark - 1.8% | | | | | |
Novo Nordisk AS Cl. B | | 9,200 | | | 440,333 |
| | | | | |
Finland - 0.4% | | | | | |
Outotec OYJ | | 5,831 | | | 100,179 |
| | | | | |
France - 6.5% | | | | | |
Alstom SA | | 6,720 | | | 347,830 |
BNP Paribas | | 3,778 | | | 156,099 |
Electricite de France | | 1,207 | | | 47,331 |
France Telecom SA - ADR | | 2,200 | | | 49,852 |
France Telecom SA | | 4,266 | | | 97,137 |
GDF Suez | | 12,307 | | | 422,389 |
Total SA | | 8,679 | | | 431,253 |
| | | | | |
| | | | | 1,551,891 |
| | | | | |
Germany - 9.6% | | | | | |
Bayer AG | | 5,792 | | | 276,841 |
Deutsche Telekom AG - ADR | | 10,000 | | | 123,500 |
Deutsche Telekom AG | | 12,187 | | | 151,289 |
E.ON AG - ADR | | 5,100 | | | 141,168 |
E.ON AG | | 8,955 | | | 248,611 |
Fresenius Medical Care AG & Co. KGaA | | 7,290 | | | 283,206 |
Rhoen Klinikum AG | | 8,238 | | | 153,126 |
RWE AG - ADR | | 1,700 | | | 119,255 |
RWE AG | | 2,329 | | | 163,300 |
SAP AG - ADR | | 4,764 | | | 168,122 |
SAP AG | | 5,682 | | | 201,274 |
Siemens AG | | 2,907 | | | 166,002 |
Stada Arzneimittel AG | | 6,377 | | | 104,310 |
| | | | | |
| | | | | 2,300,004 |
| | | | | |
Hong Kong - 4.9% | | | | | |
China Mobile, Ltd. | | 13,000 | | | 113,477 |
Hengan International Group Co., Ltd. | | 22,000 | | | 88,426 |
HongKong Electric Holdings | | 49,500 | | | 295,723 |
Huabao International Holdings, Ltd. | | 105,000 | | | 86,439 |
Sun Hung Kai Properties, Ltd. | | 48,000 | | | 430,761 |
Wharf Holdings, Ltd. | | 62,000 | | | 155,040 |
| | | | | |
| | | | | 1,169,866 |
| | | | | |
Ireland - 0.9% | | | | | |
Icon PLC - ADR* | | 13,600 | | | 219,640 |
| | | | | |
Israel - 1.6% | | | | | |
Teva Pharmaceutical Industries, Ltd. - ADR | | 8,610 | | | 387,881 |
| | | | | |
| | | | | |
| | | Number of
Shares | | Value |
Italy - 2.3% | | | | | |
Finmeccanica SpA | | 8,812 | | $ | 109,626 |
Saipem SpA | | 16,963 | | | 301,792 |
Snam Rete Gas SpA | | 28,070 | | | 150,565 |
| | | | | |
| | | | | 561,983 |
| | | | | |
Japan - 23.4% | | | | | |
Capcom Co., Ltd. | | 6,200 | | | 109,600 |
East Japan Railway Co. - ADR | | 5,100 | | | 43,962 |
East Japan Railway Co. | | 4,600 | | | 238,919 |
Honda Motor Co., Ltd. | | 11,400 | | | 267,197 |
Japan Tobacco, Inc. | | 79 | | | 209,478 |
KDDI Corp. | | 29 | | | 135,648 |
Kirin Holdings Co., Ltd. | | 2,500 | | | 26,374 |
Mitsubishi Corp. | | 23,600 | | | 307,037 |
Mitsubishi Electric Corp. | | 29,400 | | | 131,269 |
Mitsubishi Estate Co., Ltd. | | 16,200 | | | 180,747 |
Mitsubishi UFJ Financial Group, Inc. | | 73,600 | | | 354,698 |
Mizuho Financial Group, Inc. - ADR | | 11,500 | | | 45,195 |
Mizuho Financial Group, Inc. | | 64,600 | | | 122,960 |
Nintendo Co., Ltd. | | 1,800 | | | 518,476 |
Nitori Co., Ltd. | | 2,900 | | | 162,074 |
Nomura Holdings, Inc. | | 29,000 | | | 145,338 |
Osaka Gas Co., Ltd. | | 59,600 | | | 185,854 |
Secom Co., Ltd. | | 2,300 | | | 84,530 |
Sumitomo Mitsui Financial Group, Inc. - ADR | | 16,400 | | | 57,072 |
Sumitomo Mitsui Financial Group, Inc. | | 9,477 | | | 327,190 |
T&D Holdings, Inc. | | 5,350 | | | 127,562 |
Takeda Pharmaceutical Co., Ltd. | | 5,400 | | | 185,886 |
The Japan Steel Works, Ltd. | | 36,100 | | | 338,082 |
Tokio Marine Holdings, Inc. | | 5,800 | | | 140,640 |
Tokyo Electric Power Co., Inc. | | 10,700 | | | 266,498 |
Toyo Tanso Co., Ltd. | | 6,200 | | | 229,746 |
Toyota Motor Corp. - ADR | | 3,200 | | | 202,560 |
Toyota Motor Corp. | | 4,600 | | | 145,307 |
Unicharm Corp. | | 1,600 | | | 97,196 |
West Japan Railway Co. | | 58 | | | 183,214 |
| | | | | |
| | | | | 5,570,309 |
| | | | | |
Netherlands - 3.2% | | | | | |
Koninklijke KPN NV - ADR | | 10,500 | | | 139,650 |
Koninklijke KPN NV | | 24,018 | | | 320,800 |
Royal Dutch Shell PLC Cl. A - ADR | | 2,100 | | | 93,030 |
Royal Dutch Shell PLC Cl. A | | 9,576 | | | 215,632 |
| | | | | |
| | | | | 769,112 |
| | | | | |
Republic of China - 3.7% | | | | | |
Anhui Conch Cement Co., Ltd.* | | 60,000 | | | 332,129 |
China Life Insurance Co., Ltd. | | 38,000 | | | 126,013 |
China Railway Group, Ltd.* | | 231,800 | | | 135,192 |
Shandong Weigao Group Medical Polymer Co., Ltd. | | 68,000 | | | 121,084 |
Tencent Holdings, Ltd. | | 12,400 | | | 92,000 |
Tingyi Cayman Islands Holding Corp. | | 70,000 | | | 81,290 |
| | | | | |
| | | | | 887,708 |
| | | | | |
Spain - 0.9% | | | | | |
Iberdrola SA | | 15,938 | | | 111,729 |
Telefonica SA | | 5,289 | | | 105,474 |
| | | | | |
| | | | | 217,203 |
| | | | | |
| | | | |
| See Accompanying Notes to Financial Statements. |
| 47 |
INTERNATIONAL ALL CAP GROWTH FUND
SCHEDULEOF INVESTMENTS
As of March 31, 2009
| | | | | | |
| | | Number of
Shares | | Value |
Switzerland - 8.8% | | | | | | |
ACE, Ltd. | | | 7,400 | | $ | 298,960 |
Julius Baer Holding AG | | | 1,662 | | | 40,927 |
Nestle SA | | | 12,569 | | | 425,360 |
Roche Holding AG | | | 4,781 | | | 656,780 |
Syngenta AG | | | 1,505 | | | 303,634 |
Synthes, Inc. | | | 3,371 | | | 375,923 |
| | | | | | |
| | | | | | 2,101,584 |
| | | | | | |
United Kingdom - 15.3% | | | | | | |
BG Group PLC | | | 21,447 | | | 324,318 |
BP PLC - ADR | | | 1,300 | | | 52,130 |
BP PLC | | | 33,534 | | | 226,631 |
British American Tobacco PLC | | | 27,665 | | | 639,613 |
Diageo PLC | | | 24,816 | | | 279,758 |
HSBC Holdings PLC | | | 21,533 | | | 118,501 |
Imperial Tobacco Group PLC | | | 12,584 | | | 282,644 |
International Power PLC | | | 73,720 | | | 222,428 |
Reckitt Benckiser Group PLC | | | 8,276 | | | 310,676 |
SSL International PLC | | | 32,014 | | | 206,034 |
Standard Chartered PLC | | | 28,950 | | | 351,135 |
Unilever PLC | | | 8,445 | | | 159,539 |
Vodafone Group PLC - ADR | | | 9,700 | | | 168,974 |
Vodafone Group PLC | | | 109,535 | | | 192,720 |
Wellstream Holdings PLC | | | 19,808 | | | 122,653 |
| | | | | | |
| | | | | | 3,657,754 |
| | | | | | |
United States - 0.7% | | | | | | |
Transocean, Ltd.* | | | 2,800 | | | 164,752 |
| | | | | | |
Total Common Stock (Cost: $25,411,278) | | | | | | 22,225,531 |
| | | | | | |
Preferred Stock - 1.5% | | | | | | |
Brazil - 0.9% | | | | | | |
Usinas Siderurgicas de Minas Gerais SA | | | 16,550 | | | 212,064 |
| | | | | | |
Germany - 0.6% | | | | | | |
Henkel AG & Co. KGaA | | | 5,529 | | | 150,341 |
| | | | | | |
Total Preferred Stock (Cost: $361,200) | | | | | | 362,405 |
| | | | | | |
| | |
| | | Principal
Amount | | |
Short Term Investments - 3.0% | | | | | | |
Time Deposit - 3.0% | | | | | | |
Citibank London | | | | | | |
0.100%, 04/01/09 | | | | | | |
(Cost: $714,379) | | $ | 714,379 | | | 714,379 |
| | | | | | |
Total Investments - 97.4% (Cost: $26,486,857) | | | | | | 23,302,315 |
| | | | | | |
Other Assets in Excess of Liabilities - 2.6% | | | | | | 614,188 |
| | | | | | |
Net Assets - 100.0% | | | | | $ | 23,916,503 |
| | | | | | |
| * | Non-income producing securities. |
ADR - American Depository Receipt
SCHEDULEOF INVESTMENTSBY SECTOR
as of March 31, 2009
| | | |
Sector | | Percent of
Net Assets | |
Consumer, Non-cyclical | | 28.5 | % |
Financial | | 12.6 | |
Industrial | | 9.9 | |
Utilities | | 9.9 | |
Energy | | 9.0 | |
Communications | | 7.9 | |
Basic Materials | | 7.2 | |
Consumer, Cyclical | | 6.7 | |
Technology | | 2.0 | |
Diversified | | 0.7 | |
Short Term Investments | | 3.0 | |
| | | |
Total Investments | | 97.4 | |
Other assets in excess of liabilities | | 2.6 | |
| | | |
Net Assets | | 100.0 | % |
| | | |
| | | | |
| See Accompanying Notes to Financial Statements. |
|
| 48 |
U.S. HIGH YIELD BOND FUND
Management Team: Douglas G. Forsyth, CFA, Portfolio Manager; William L. Stickney, Portfolio Manager; Justin Kass, CFA, Portfolio Manager; Michael E.Yee, Portfolio Manager
Chief Investment Officer: Horacio A. Valeiras, CFA
Goal: The U.S. High Yield Bond Fund seeks to deliver total return via high current income and capital growth from a diversified portfolio consisting primarily of lower-rated U.S. corporate fixed-income securities.
Market Overview: The Merrill Lynch High Yield Master II Index posted a 20.28% loss during the twelve months ended March 31, 2009. By way of comparison, the high-yield market outperformed the S&P 500 Index, which fell 38.09%, but lagged the ten-year Treasury, which gained 10.48%.
History books will be written to describe the shocking events that took place in the credit markets throughout much of the period. What started with falling housing prices and mortgage delinquencies ended with forced liquidations of leveraged positions. These liquidations found few willing buyers, so even the smallest trades created gaps in pricing. The newly lowered prices then caused more leverage triggers to be struck and more selling. The market attempted to absorb all of this amid fewer market makers, and those remaining dealers were unwilling to transact. The lack of transaction confidence worsened in the weeks surrounding the September failure of a major U.S. investment bank.
By the end of 2008, economic indicators were universally weak. Corporate earnings, and the outlook for earnings, also faltered. In the first quarter of 2009, the economy did not improve, the government added to its pledge of trillions of dollars in stimulus, the federal funds rate was close to zero, and earnings continued to be very unpredictable. Despite these headwinds, high-yield securities posted a healthy gain in the first quarter, evidence of the oversold condition of the market.
Performance: During the twelve months ended March 31, 2009, the Fund’s Class I shares lost 13.01%, outperforming the Merrill Lynch High Yield Master II Index, which declined 20.28%.
Portfolio Specifics: Two extremes in market volatility tested the Fund this period. What seemed like an endless sell-off from September through mid-December sharply reversed in the last weeks of 2008. The Fund outperformed in both of the record-setting down months of October and November. Our higher-quality holdings and avoidance of distressed issues helped during the tumultuous markets. As important as outperforming in poor market conditions, the Fund performed equally well in the record-setting rally in late December and as the gains continued into 2009. Maintaining our discipline of identifying superior credits, and standing firm with those decisions throughout the sell-off, positioned the Fund to both protect on the downside and participate in the upside.
There were many negative contributors during the period, including a supplier of automotive parts, a provider of information technology (IT) services and an upscale retail chain. Operational results were lower than expectations, and the outlook was tempered for these issuers. Positive performers included a metal processing firm that was acquired and a telecommunication services provider that was rewarded for its fundamental operating performance.
Market Outlook: Spreads between high-yield securities and comparable Treasuries remain well above prior-cycle highs. At current prices, it is difficult to identify an asset class offering a better risk/reward profile than high yield. High-yield bonds are attractive on an absolute return basis and have better downside protection than equity investments. Defaults will increase, but a far higher default rate is already priced into the market.
As always, we continue to build the Fund one security at a time, by performing rigorous credit analysis to identify companies which are opportunistically capitalizing on change.
Comparison of Change in Value of a $250,000 Investment in U.S. High Yield Bond Fund Class I Shares with the Merrill Lynch High Yield Master II Index.
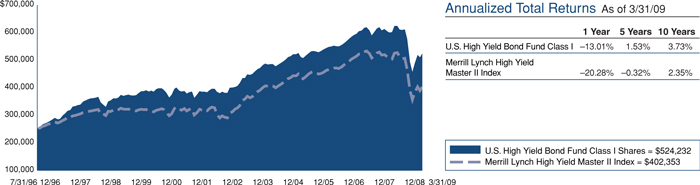
The graph above shows the value of a hypothetical $250,000 investment in the Fund’s Class I shares compared with the Merrill Lynch High Yield Master II Index for the periods indicated. The Fund’s Class I shares calculate their performance based upon the historical performance of their corresponding series of Nicholas-Applegate Mutual Funds (renamed ING Mutual Funds), adjusted to reflect all fees and expenses applicable to the Fund’s Class I shares. The Nicholas-Applegate Institutional Funds’ Class I shares were first available on May 7, 1999. Average annual total return figures include changes in principal value, reinvested dividends, and capital gain distributions. The total returns shown above do not show the effects of income taxes on an individual’s investment. In most cases, taxes may reduce your actual investment returns on income or gains paid by the
Fund or any gains you may realize if you sell your shares. Past performance cannot guarantee future results.
The Merrill Lynch High Yield Master II Index is an unmanaged index consisting of U.S. dollar denominated bonds that are issued in countries having a BBB3 or higher debt rating with at least one year remaining until maturity. All bonds must have a credit rating below investment grade but not in default. Unless otherwise noted, index returns reflect the reinvestment of income dividends and capital gains, if any, but do not reflect fees, brokerage commissions or other expenses of investing. One cannot invest directly in an index. Bond prices, and thus the Fund’s share price, generally move in the opposite direction from interest rates. Since markets can go down as well as up, investment return and principal value will fluctuate with market conditions. You may have a gain or loss when you sell your shares.
U.S. HIGH YIELD BOND FUND
SCHEDULEOF INVESTMENTS
As of March 31, 2009
| | | | | | |
| | | Principal
Amount | | Value |
Corporate Bonds - 89.4% |
Aerospace/Defense-Equipment - 2.1% |
BE Aerospace, Inc. | | | | | | |
8.500%, 07/01/18 | | $ | 525,000 | | $ | 439,031 |
TransDigm, Inc. | | | | | | |
7.750%, 07/15/14 | | | 645,000 | | | 604,688 |
| | | | | | |
| | | | | | 1,043,719 |
| | | | | | |
Apparel Manufacturers - 2.3% | | | |
Levi Strauss & Co. | | | | | | |
9.750%, 01/15/15 | | | 890,000 | | | 769,850 |
Oxford Industries, Inc. | | | | | | |
8.875%, 06/01/11 | | | 485,000 | | | 356,475 |
| | | | | | |
| | | | | | 1,126,325 |
| | | | | | |
Auto/Truck Parts & Equipment-Original - 0.6% |
Accuride Corp. | | | | | | |
8.500%, 02/01/15 | | | 840,000 | | | 260,400 |
Tenneco, Inc.** | | | | | | |
8.625%, 11/15/14 | | | 290,000 | | | 55,100 |
| | | | | | |
| | | | | | 315,500 |
| | | | | | |
Auto/Truck Parts & Equipment-Replacement - 0.5% |
Exide Technologies | | | | | | |
10.500%, 03/15/13 | | | 455,000 | | | 266,175 |
| | | | | | |
Building Products-Cement/Aggregate - 1.3% |
Texas Industries, Inc. 144A# | | | | | | |
7.250%, 07/15/13 | | | 850,000 | | | 646,000 |
| | | | | | |
Building-Residential/Commercial - 1.1% |
DR Horton, Inc. | | | | | | |
6.500%, 04/15/16 | | | 680,000 | | | 537,200 |
| | | | | | |
Cable/Satellite TV - 4.7% |
DirecTV Holdings LLC/DirecTV Financing Co. | | | | | | |
8.375%, 03/15/13 | | | 970,000 | | | 985,762 |
Echostar DBS Corp. | | | | | | |
7.125%, 02/01/16 | | | 800,000 | | | 720,000 |
Mediacom Broadband LLC/Mediacom Broadband Corp. | | | | | | |
8.500%, 10/15/15 | | | 300,000 | | | 271,500 |
Mediacom LLC/Mediacom Capital Corp. | | | | | | |
9.500%, 01/15/13 | | | 375,000 | | | 352,500 |
| | | | | | |
| | | | | | 2,329,762 |
| | | | | | |
Cellular Telecommunications - 4.9% |
Centennial Communications Corp. | | | | | | |
10.000%, 01/01/13 | | | 260,000 | | | 277,550 |
Cricket Communications, Inc. | | | | | | |
9.375%, 11/01/14 | | | 1,010,000 | | | 967,075 |
MetroPCS Wireless, Inc. 144A# | | | | | | |
9.250%, 11/01/14 | | | 670,000 | | | 649,900 |
Nextel Communications, Inc. | | | | | | |
7.375%, 08/01/15 | | | 965,000 | | | 516,275 |
| | | | | | |
| | | | | | 2,410,800 |
| | | | | | |
Coal - 0.4% |
Peabody Energy Corp. | | | | | | |
7.375%, 11/01/16 | | | 180,000 | | | 179,100 |
| | | | | | |
Commercial Services-Finance - 2.6% |
Deluxe Corp. | | | | | | |
7.375%, 06/01/15 | | | 790,000 | | | 588,550 |
Lender Processing Services, Inc. | | | | | | |
8.125%, 07/01/16 | | | 670,000 | | | 668,325 |
| | | | | | |
| | | | | | 1,256,875 |
| | | | | | |
| | | | | | |
| | | Principal
Amount | | Value |
Computer Services - 0.4% |
Unisys Corp. | | | | | | |
8.000%, 10/15/12 | | $ | 835,000 | | $ | 213,969 |
| | | | | | |
Consumer Products-Miscellaneous - 1.6% |
Jarden Corp. | | | | | | |
7.500%, 05/01/17 | | | 970,000 | | | 785,700 |
| | | | | | |
Containers-Metal/Glass - 1.5% |
Crown Americas LLC/Crown Americas Capital Corp. | | | | | | |
7.750%, 11/15/15 | | | 750,000 | | | 757,500 |
| | | | | | |
Data Processing/Management - 0.9% |
First Data Corp. | | | | | | |
9.875%, 09/24/15 | | | 785,000 | | | 463,150 |
| | | | | | |
Distribution/Wholesale - 0.7% |
KAR Holdings, Inc. | | | | | | |
8.750%, 05/01/14 | | | 600,000 | | | 321,000 |
| | | | | | |
Diversified Banking Institution - 0.9% |
GMAC LLC 144A# | | | | | | |
6.750%, 12/01/14 | | | 772,000 | | | 449,096 |
| | | | | | |
Diversified Manufacturing Operations - 1.2% |
Harland Clarke Holdings Corp. | | | | | | |
9.500%, 05/15/15 | | | 880,000 | | | 392,700 |
Park-Ohio Industries, Inc. | | | | | | |
8.375%, 11/15/14 | | | 495,000 | | | 190,575 |
| | | | | | |
| | | | | | 583,275 |
| | | | | | |
Diversified Operations - 1.5% |
Kansas City Southern Railway | | | | | | |
8.000%, 06/01/15 | | | 670,000 | | | 557,775 |
Kansas City Southern Railway | | | | | | |
13.000%, 12/15/13 | | | 175,000 | | | 179,375 |
| | | | | | |
| | | | | | 737,150 |
| | | | | | |
Diversified Operations/Commercial Services - 1.6% |
ARAMARK Corp. | | | | | | |
8.500%, 02/01/15 | | | 835,000 | | | 772,375 |
| | | | | | |
Electric-Generation - 2.7% |
Allegheny Energy Supply Co. LLC 144A# | | | | | | |
8.250%, 04/15/12 | | | 750,000 | | | 759,066 |
Edison Mission Energy | | | | | | |
7.000%, 05/15/17 | | | 750,000 | | | 551,250 |
| | | | | | |
| | | | | | 1,310,316 |
| | | | | | |
Electric-Integrated - 1.3% |
Energy Future Holdings Corp. | | | | | | |
10.875%, 11/01/17 | | | 950,000 | | | 617,500 |
| | | | | | |
Electronic Measure Instruments - 1.0% |
Itron, Inc. | | | | | | |
7.750%, 05/15/12 | | | 525,000 | | | 485,625 |
| | | | | | |
Filtration/Separation Products - 0.8% |
Polypore, Inc. | | | | | | |
8.750%, 05/15/12 | | | 545,000 | | | 400,575 |
| | | | | | |
Finance-Auto Loans - 1.9% |
Ford Motor Credit Co. LLC | | | | | | |
7.000%, 10/01/13 | | | 670,000 | | | 448,392 |
Ford Motor Credit Co. LLC | | | | | | |
9.875%, 08/10/11 | | | 670,000 | | | 507,413 |
| | | | | | |
| | | | | | 955,805 |
| | | | | | |
Independent Power Producer - 1.4% |
NRG Energy, Inc. | | | | | | |
7.375%, 01/15/17 | | | 750,000 | | | 699,375 |
| | | | | | |
| | | | |
| See Accompanying Notes to Financial Statements. |
|
| 50 |
SCHEDULEOF INVESTMENTS
As of March 31, 2009
| | | | | | |
| | | Principal
Amount | | Value |
Machinery-Construction & Mining - 0.9% |
Terex Corp. | | | | | | |
7.375%, 01/15/14 | | $ | 490,000 | | $ | 426,300 |
| | | | | | |
Machinery-Electrical - 1.4% |
Baldor Electric Co. | | | | | | |
8.625%, 02/15/17 | | | 890,000 | | | 709,775 |
| | | | | | |
Medical-Hospitals - 4.9% |
AMR HoldCo, Inc./EmCare HoldCo, Inc. | | | | | | |
10.000%, 02/15/15 | | | 810,000 | | | 810,000 |
Community Health Systems, Inc. | | | | | | |
8.875%, 07/15/15 | | | 840,000 | | | 798,000 |
HCA, Inc. | | | | | | |
9.250%, 11/15/16 | | | 870,000 | | | 793,875 |
| | | | | | |
| | | | | | 2,401,875 |
| | | | | | |
Medical-Nursing Homes - 1.4% |
Sun Healthcare Group, Inc. | | | | | | |
9.125%, 04/15/15 | | | 755,000 | | | 709,700 |
| | | | | | |
Medical-Outpatient/Home Medical Care - 1.4% |
Res-Care, Inc. | | | | | | |
7.750%, 10/15/13 | | | 770,000 | | | 683,375 |
| | | | | | |
MRI/Medical Diag Imaging - 0.3% |
Alliance Imaging, Inc. | | | | | | |
7.250%, 12/15/12 | | | 165,000 | | | 159,225 |
| | | | | | |
MRI/Medical Diagnostic Imaging Centers - 1.3% |
Alliance HealthCare Services, Inc. | | | | | | |
7.250%, 12/15/12 | | | 665,000 | | | 641,725 |
| | | | | | |
Networking Products - 0.3% |
Anixter International, Inc. | | | | | | |
10.000%, 03/15/14 | | | 165,000 | | | 153,862 |
| | | | | | |
Oil Companies-Exploration & Production - 5.9% |
Chesapeake Energy Corp. | | | | | | |
6.875%, 01/15/16 | | | 835,000 | | | 705,575 |
Forest Oil Corp. | | | | | | |
7.250%, 06/15/19 | | | 750,000 | | | 596,250 |
PetroHawk Energy Corp. 144A# | | | | | | |
7.875%, 06/01/15 | | | 790,000 | | | 699,150 |
SandRidge Energy, Inc. 144A# | | | | | | |
8.000%, 06/01/18 | | | 725,000 | | | 536,500 |
Southwestern Energy Co. 144A# | | | | | | |
7.500%, 02/01/18 | | | 395,000 | | | 383,150 |
| | | | | | |
| | | | | | 2,920,625 |
| | | | | | |
Oil-Field Services - 0.4% |
Helix Energy Solutions Group, Inc. 144A# | | | | | | |
9.500%, 01/15/16 | | | 295,000 | | | 175,525 |
| | | | | | |
Paper & Related Products - 1.1% |
Neenah Paper, Inc. | | | | | | |
7.375%, 11/15/14 | | | 790,000 | | | 296,250 |
NewPage Corp. | | | | | | |
10.000%, 05/01/12 | | | 650,000 | | | 229,125 |
| | | | | | |
| | | | | | 525,375 |
| | | | | | |
Pipelines - 2.3% |
Dynegy Holdings, Inc. | | | | | | |
7.750%, 06/01/19 | | | 760,000 | | | 497,800 |
El Paso Corp. | | | | | | |
8.250%, 02/15/16 | | | 395,000 | | | 371,300 |
El Paso Corp. | | | | | | |
12.000%, 12/12/13 | | | 265,000 | | | 280,237 |
| | | | | | |
| | | | | | 1,149,337 |
| | | | | | |
| | | | | | |
| | | Principal
Amount | | Value |
Printing-Commercial - 1.2% |
Cenveo Corp. | | | | | | |
7.875%, 12/01/13 | | $ | 1,085,000 | | $ | 569,625 |
| | | | | | |
Rental Auto/Equipment - 1.2% |
Hertz Corp. | | | | | | |
10.500%, 01/01/16 | | | 1,310,000 | | | 576,400 |
| | | | | | |
Retail-Apparel/Shoe - 2.5% |
Brown Shoe Co., Inc. | | | | | | |
8.750%, 05/01/12 | | | 555,000 | | | 452,325 |
Phillips-Van Heusen Corp. | | | | | | |
8.125%, 05/01/13 | | | 830,000 | | | 792,650 |
| | | | | | |
| | | | | | 1,244,975 |
| | | | | | |
Retail-Computer Equipment - 1.5% |
GameStop Corp./GameStop, Inc. | | | | | | |
8.000%, 10/01/12 | | | 720,000 | | | 730,800 |
| | | | | | |
Retail-Drug Store - 0.7% |
Rite Aid Corp. | | | | | | |
7.500%, 03/01/17 | | | 640,000 | | | 332,800 |
| | | | | | |
Retail-Propane Distribution - 1.6% |
Inergy LP/Inergy Finance Corp. | | | | | | |
8.250%, 03/01/16 | | | 845,000 | | | 806,975 |
| | | | | | |
Retail-Regional Department Stores - 0.5% |
The Neiman Marcus Group, Inc. | | | | | | |
10.375%, 10/15/15 | | | 735,000 | | | 238,875 |
| | | | | | |
Satellite Telecommunications - 1.4% |
Hughes Network Systems LLC/ HNS Finance Corp. | | | | | | |
9.500%, 04/15/14 | | | 740,000 | | | 666,000 |
| | | | | | |
Steel-Producers - 1.4% |
Steel Dynamics, Inc. | | | | | | |
7.375%, 11/01/12 | | | 895,000 | | | 702,575 |
| | | | | | |
Telecommuications Services - 4.0% |
MasTec, Inc. | | | | | | |
7.625%, 02/01/17 | | | 1,155,000 | | | 945,656 |
Time Warner Telecom Holdings, Inc. | | | | | | |
9.250%, 02/15/14 | | | 625,000 | | | 606,250 |
West Corp. | | | | | | |
11.000%, 10/15/16 | | | 585,000 | | | 391,950 |
| | | | | | |
| | | | | | 1,943,856 |
| | | | | | |
Telephone-Integrated - 6.2% |
Cincinnati Bell, Inc. | | | | | | |
8.375%, 01/15/14 | | | 880,000 | | | 831,600 |
Qwest Capital Funding, Inc. | | | | | | |
7.250%, 02/15/11 | | | 765,000 | | | 734,400 |
Sprint Capital Corp. | | | | | | |
8.375%, 03/15/12 | | | 750,000 | | | 678,750 |
Windstream Corp. | | | | | | |
8.625%, 08/01/16 | | | 820,000 | | | 809,750 |
| | | | | | |
| | | | | | 3,054,500 |
| | | | | | |
Wire & Cable Products - 2.5% |
Anixter, Inc. | | | | | | |
5.950%, 03/01/15 | | | 750,000 | | | 581,250 |
General Cable Corp. | | | | | | |
7.125%, 04/01/17 | | | 815,000 | | | 672,375 |
| | | | | | |
| | | | | | 1,253,625 |
| | | | | | |
| | | | |
| See Accompanying Notes to Financial Statements. |
|
| 51 |
U.S. HIGH YIELD BOND FUND
SCHEDULEOF INVESTMENTS
As of March 31, 2009
| | | | | | |
| | | Principal
Amount | | Value |
Wireless Equipment - 3.2% |
American Tower Corp. | | | | | | |
7.000%, 10/15/17 | | $ | 820,000 | | $ | 811,800 |
Crown Castle International Corp. | | | | | | |
9.000%, 01/15/15 | | | 745,000 | | | 750,588 |
| | | | | | |
| | | | | | 1,562,388 |
| | | | | | |
Total US Corporate Bonds (Cost: $53,077,815) | | | | | | 44,003,960 |
| | | | | | |
Foreign Corporate Bonds - 4.6% |
Cellular Telecommunications - 1.7% |
Millicom international Cellular SA | | | | | | |
10.000%, 12/01/13 | | | 605,000 | | | 594,413 |
Rogers Wireless, Inc. | | | | | | |
8.000%, 12/15/12 | | | 235,000 | | | 238,231 |
| | | | | | |
| | | | | | 832,644 |
| | | | | | |
Electronic Components-Miscellaneous - 0.6% |
Flextronics International, Ltd. | | | | | | |
6.250%, 11/15/14 | | | 350,000 | | | 297,500 |
| | | | | | |
Oil Companies-Exploration & Production - 0.9% |
OPTI Canada, Inc. | | | | | | |
8.250%, 12/15/14 | | | 1,000,000 | | | 452,500 |
| | | | | | |
Satellite Telecom - 1.4% |
Intelsat Jackson Holdings, Ltd. 144A# | | | | | | |
9.500%, 06/15/16 | | | 735,000 | | | 694,575 |
| | | | | | |
Total Foreign Corporate Bonds (Cost: $2,565,892) | | | | | | 2,277,219 |
| | | | | | |
Short Term Investments - 5.3% |
Time Deposit - 5.3% |
Citibank London | | | | | | |
0.100%, 04/01/09 | | | | | | |
(Cost: $2,585,927) | | | 2,585,927 | | | 2,585,927 |
| | | | | | |
Total Investments - 99.3% (Cost: $58,229,634) | | | | | | 48,867,106 |
| | | | | | |
Other Assets in Excess of Liabilities - 0.7% | | | | | | 366,254 |
| | | | | | |
Net Assets - 100.0% | | | | | $ | 49,233,360 |
| | | | | | |
| # | 144A Security. Certain conditions for public sale may exist. The total market value of 144A securities owned at March 31, 2009 was $4,992,962 or 10.14% of net assets. |
| ** | Security was in default at March 31, 2009. |
SCHEDULEOF INVESTMENTSBY SECTOR
as of March 31, 2009
| | | |
Sector | | Percent of
Net Assets | |
Communications | | 27.7 | % |
Consumer, Non-cyclical | | 17.4 | |
Industrial | | 13.4 | |
Consumer, Cyclical | | 12.0 | |
Energy | | 9.9 | |
Utilities | | 5.3 | |
Financial | | 2.9 | |
Basic Materials | | 2.5 | |
Diversified | | 1.5 | |
Technology | | 1.4 | |
Short Term Investments | | 5.3 | |
| | | |
Total Investments | | 99.3 | |
Other assets in excess of liabilities | | 0.7 | |
| | | |
Net Assets | | 100.0 | % |
| | | |
| | | | |
| See Accompanying Notes to Financial Statements. |
|
| 52 |
(This page intentionally left blank)
53
NICHOLAS-APPLEGATE INSTITUTIONAL FUNDS
FINANCIAL HIGHLIGHTS
For a Class I share outstanding during the periods indicated
| | | | | | | | | | | | | | | | | | | | | | | |
| | | | | | | | | | | | | | Distributions from: | |
| | | Net Asset
Value,
Beginning | | Net
Investment
Income (Loss) (1) | | | Net Realized
and Unrealized
Gain (Loss) | | | Total from
Investments
Operations | | | Net
Investment
Income | | | Net
Realized
Capital Gains | |
U.S. EQUITY FUNDS | | | | | | | | | | | | | | | | | | | | | | | |
| | | | | | |
U.S. ULTRA MICRO CAP | | | | | | | | | | | | | | | | | | | | | | | |
For the year ended 03/31/09 | | $ | 9.28 | | $ | (0.16 | ) | | $ | (3.34 | ) | | $ | (3.50 | ) | | $ | — | | | $ | — | |
1/28/08 (Commenced) to 03/31/08 | | | 10.00 | | | (0.03 | ) | | | (0.69 | ) | | | (0.72 | ) | | | — | | | | — | |
U.S. MICRO CAP | | | | | | | | | | | | | | | | | | | | | | | |
For the year ended 03/31/09 | | $ | 11.60 | | $ | (0.07 | ) | | $ | (3.95 | )(5) | | $ | (4.02 | ) | | $ | — | | | $ | (0.00 | )(7) |
For the year ended 03/31/08 | | | 15.33 | | | (0.18 | ) | | | (1.49 | ) | | | (1.67 | ) | | | — | | | | (2.06 | ) |
For the year ended 03/31/07 | | | 17.43 | | | (0.12 | ) | | | (0.19 | ) | | | (0.31 | ) | | | — | | | | (1.79 | ) |
For the year ended 03/31/06 | | | 12.83 | | | (0.11 | ) | | | 5.06 | | | | 4.95 | | | | — | | | | (0.35 | ) |
For the year ended 03/31/05 | | | 14.69 | | | (0.09 | ) | | | (1.09 | ) | | | (1.18 | ) | | | — | | | | (0.68 | ) |
U.S. EMERGING GROWTH | | | | | | | | | | | | | | | | | | | | | | | |
For the year ended 03/31/09 | | $ | 11.45 | | $ | (0.04 | ) | | $ | (4.82 | )(5) | | $ | (4.86 | ) | | $ | — | | | $ | — | |
For the year ended 03/31/08 | | | 13.09 | | | (0.06 | ) | | | (0.70 | )(5) | | | (0.76 | ) | | | — | | | | (0.88 | ) |
For the year ended 03/31/07 | | | 13.90 | | | (0.07 | ) | | | 0.19 | (5) | | | 0.12 | | | | — | | | | (0.93 | ) |
For the year ended 03/31/06 | | | 9.77 | | | (0.11 | ) | | | 4.25 | | | | 4.14 | | | | — | | | | (0.01 | ) |
For the year ended 03/31/05 | | | 9.61 | | | (0.07 | ) | | | 0.23 | | | | 0.16 | | | | — | | | | — | |
U.S. SMALL TO MID CAP GROWTH | | | | | | | | | | | | | | | | | | | | | | | |
For the year ended 03/31/09 | | $ | 9.02 | | $ | (0.03 | ) | | $ | (3.57 | ) | | $ | (3.60 | ) | | $ | — | | | $ | — | |
7/31/07 (Commenced) to 03/31/08 | | | 10.00 | | | (0.03 | ) | | | (0.95 | ) | | | (0.98 | ) | | | — | | | | — | |
U.S. SYSTEMATIC LARGE CAP GROWTH | | | | | | | | | | | | | | | | | | | | | | | |
For the year ended 03/31/09 | | $ | 19.39 | | $ | 0.10 | | | $ | (6.63 | )(5) | | $ | (6.53 | ) | | $ | — | | | $ | — | |
For the year ended 03/31/08 | | | 19.77 | | | (0.02 | ) | | | (0.36 | )(5) | | | (0.38 | ) | | | — | | | | — | |
For the year ended 03/31/07 | | | 17.86 | | | 0.02 | | | | 1.89 | | | | 1.91 | | | | — | | | | — | |
For the year ended 03/31/06 | | | 15.67 | | | 0.03 | | | | 2.16 | | | | 2.19 | | | | — | | | | — | |
For the year ended 03/31/05 | | | 15.06 | | | 0.07 | | | | 0.54 | | | | 0.61 | | | | — | | | | — | |
U.S. CONVERTIBLE | | | | | | | | | | | | | | | | | | | | | | | |
For the year ended 03/31/09 | | $ | 24.88 | | $ | 0.43 | | | $ | (5.73 | )(5) | | $ | (5.30 | ) | | $ | (0.43 | ) | | $ | (0.14 | ) |
For the year ended 03/31/08 | | | 24.35 | | | 0.37 | | | | 0.58 | | | | 0.95 | | | | (0.32 | ) | | | (0.10 | ) |
For the year ended 03/31/07 | | | 24.57 | | | 0.45 | | | | 2.03 | | | | 2.48 | | | | (0.47 | ) | | | (2.23 | ) |
For the year ended 03/31/06 | | | 22.44 | | | 0.27 | | | | 3.45 | | | | 3.72 | | | | (0.55 | ) | | | (1.04 | ) |
For the year ended 03/31/05 | | | 23.11 | | | 0.39 | | | | 0.66 | | | | 1.05 | | | | (0.45 | ) | | | (1.27 | ) |
| (1) | Net investment income per share is calculated by dividing net investment income for the period by the average shares outstanding during the period. |
| (2) | Total returns are not annualized for periods less than one year. |
| (3) | Ratios are annualized for periods of less than one year. Expense reimbursements reflect voluntary reductions of total expenses. Such amounts would increase net investment income (loss) ratios had such reductions not occurred. |
| (4) | Net expenses include certain items not subject to expense reimbursement for periods prior to January 23, 2006. |
See Accompanying Notes to Financial Statements.
54
| | | | | | | | | | | | | | | | | | | | | | | | | | | | | |
| | | | | | | | | | | Ratios to Average Net Assets (3) | | | | |
Total Distributions | | | Net Asset
Value,
Ending | | Total
Return (2) | | | Net Assets,
Ending (in 000’s) | | Net
Investment
Income (Loss) | | | Total
Expenses | | | Expenses
(Reimbursements)/
Recoupment | | | Expenses Net of
Reimbursement/
Recoupment | | | Expenses Net of
Reimbursement/
Recoupment
Offset (4) | | | Fund’s
Portfolio
Turnover
Rate | |
| | | | | | | | | | | | | | | | | | | | | | | | | | | | | |
| | | | | | | | | |
| | | | | | | | | | | | | | | | | | | | | | | | | | | | | |
| $ | — | | | $ | 5.78 | | (37.72 | )% | | $ | 1,084 | | (2.05 | )% | | 2.40 | % | | — | | | 2.40 | % | | 2.31 | % | | 109 | % |
| | — | | | | 9.28 | | (7.20 | )%(6) | | | 886 | | (2.10 | )% | | 2.31 | % | | — | | | 2.31 | % | | 2.15 | % | | 19 | % |
| | | | | | | | | | | | | | | | | | | | | | | | | | | | | |
| $ | (0.00 | )(7) | | $ | 7.58 | | (34.63 | )% | | $ | 40,178 | | (0.64 | )% | | 1.58 | % | | — | | | 1.58 | % | | 0.91 | % | | 104 | % |
| | (2.06 | ) | | | 11.60 | | (13.25 | )% | | | 60,122 | | (1.19 | )% | | 1.58 | % | | — | | | 1.58 | % | | 1.38 | % | | 139 | % |
| | (1.79 | ) | | | 15.33 | | (1.35 | )% | | | 84,405 | | (0.75 | )% | | 1.58 | % | | — | | | 1.58 | % | | 1.19 | % | | 165 | % |
| | (0.35 | ) | | | 17.43 | | 39.04 | % | | | 78,058 | | (0.78 | )% | | 1.64 | % | | (0.07 | )% | | 1.57 | % | | 1.10 | % | | 180 | % |
| | (0.68 | ) | | | 12.83 | | (8.17 | )% | | | 69,246 | | (0.72 | )% | | 1.63 | % | | (0.07 | )% | | 1.56 | % | | 1.12 | % | | 266 | % |
| $ | — | | | $ | 6.59 | | (42.45 | )% | | $ | 6,591 | | (0.34 | )% | | 1.21 | % | | — | | | 1.21 | % | | 0.90 | % | | 146 | % |
| | (0.88 | ) | | | 11.45 | | (7.01 | )% | | | 7,499 | | (0.46 | )% | | 1.21 | % | | — | | | 1.21 | % | | 0.72 | % | | 129 | % |
| | (0.93 | ) | | | 13.09 | | 1.30 | % | | | 7,409 | | (0.54 | )% | | 1.21 | % | | — | | | 1.21 | % | | 0.72 | % | | 148 | % |
| | (0.01 | ) | | | 13.90 | | 42.38 | % | | | 6,721 | | (1.04 | )% | | 1.89 | % | | (0.39 | )% | | 1.50 | % | | 1.17 | % | | 128 | % |
| | — | | | | 9.77 | | 1.66 | % | | | 12,043 | | (0.75 | )% | | 1.63 | % | | (0.17 | )% | | 1.46 | % | | 1.06 | % | | 142 | % |
| | | | | | | | | | | | | | | | | | | | | | | | | | | | | |
| $ | — | | | $ | 5.42 | | (39.91 | )% | | $ | 3,102 | | (0.44 | )% | | 0.97 | % | | — | | | 0.97 | % | | 0.81 | % | | 179 | % |
| | — | | | | 9.02 | | (9.80 | )%(6) | | | 4,862 | | (0.50 | )% | | 0.95 | % | | — | | | 0.95 | % | | 0.80 | % | | 105 | % |
| | | | | | | | | | | | | | | | | | | | | | | | | | | | | |
| $ | — | | | $ | 12.86 | | (33.68 | )% | | $ | 512 | | 0.58 | % | | 1.16 | % | | — | | | 1.16 | % | | 1.12 | % | | 116 | % |
| | — | | | | 19.39 | | (1.92 | )% | | | 791 | | (0.10 | )% | | 1.14 | % | | — | | | 1.14 | % | | 1.10 | % | | 106 | % |
| | — | | | | 19.77 | | 10.69 | % | | | 945 | | (0.09 | )% | | 1.13 | % | | — | | | 1.13 | % | | 1.05 | % | | 100 | % |
| | — | | | | 17.86 | | 13.98 | % | | | 667 | | 0.19 | % | | 1.67 | % | | (0.53 | )% | | 1.14 | % | | 1.04 | % | | 147 | % |
| | — | | | | 15.67 | | 4.05 | % | | | 780 | | 0.45 | % | | 1.66 | % | | (0.54 | )% | | 1.12 | % | | 1.00 | % | | 197 | % |
| | | | | | | | | | | | | | | | | | | | | | | | | | | | | |
| $ | (0.57 | ) | | $ | 19.01 | | (21.30 | )% | | $ | 20,664 | | 1.86 | % | | 1.03 | % | | — | | | 1.03 | % | | 0.98 | % | | 91 | % |
| | (0.42 | ) | | | 24.88 | | 3.84 | % | | | 47,773 | | 1.45 | % | | 1.03 | % | | — | | | 1.03 | % | | 0.89 | % | | 98 | % |
| | (2.70 | ) | | | 24.35 | | 10.79 | % | | | 39,022 | | 1.89 | % | | 1.02 | % | | — | | | 1.02 | % | | 0.85 | % | | 92 | % |
| | (1.59 | ) | | | 24.57 | | 17.15 | % | | | 31,627 | | 1.02 | % | | 1.14 | % | | (0.11 | )% | | 1.03 | % | | 0.87 | % | | 92 | % |
| | (1.72 | ) | | | 22.44 | | 4.62 | % | | | 35,397 | | 1.68 | % | | 1.10 | % | | (0.08 | )% | | 1.02 | % | | 0.85 | % | | 102 | % |
| (5) | Includes litigation proceeds of approximately $0.03 per share for U.S. Micro Cap Fund during the fiscal year ended 2009, $0.07 and $0.06 per share for the U.S. Emerging Growth Fund during the fiscal year for 2008 and 2009, respectively, $0.09 and $0.04 per share for the U.S. Systematic Large Cap Growth Fund during the fiscal year for 2008 and 2009, respectively. For U.S Convertible Fund during the fiscal year end 2009, litigation proceeds were less than $0.01 per share. The U.S. Emerging Growth Fund received $28,454 from a security litigation settlement for the fiscal year 2007 which is reflected in realized gains. The event had a $0.05 per share impact to the fund. |
| (6) | Inception to date return |
| (7) | Less than one penny per share. |
55
NICHOLAS-APPLEGATE INSTITUTIONAL FUNDS
FINANCIAL HIGHLIGHTS
For a Class I share outstanding during the periods indicated
| | | | | | | | | | | | | | | | | | | | | | | |
| | | | | | | | | | | | | | Distributions from: | |
| | | Net Asset
Value,
Beginning | | Net
Investment
Income (Loss) (1) | | | Net Realized
and Unrealized
Gain (Loss) | | | Total from
Investments
Operations | | | Net
Investment
Income | | | Net
Realized
Capital Gains | |
GLOBAL EQUITY FUNDS | | | | | | | | | | | | | | | | | | | | | | | |
| | | | | | |
GLOBAL EQUITY 130/30 | | | | | | | | | | | | | | | | | | | | | | | |
4/01/08 (Commenced) to 03/31/09 | | $ | 10.00 | | $ | (0.01 | ) | | $ | (4.34 | ) | | $ | (4.35 | ) | | $ | — | | | $ | — | |
GLOBAL SELECT | | | | | | | | | | | | | | | | | | | | | | | |
For the year ended 03/31/09 | | $ | 12.65 | | $ | 0.02 | | | $ | (5.44 | )(9) | | $ | (5.42 | ) | | $ | (0.04 | ) | | $ | (6.87 | ) |
For the year ended 03/31/08 | | | 18.60 | | | 0.11 | | | | 0.92 | | | | 1.03 | | | | (0.28 | ) | | | (6.69 | ) |
For the year ended 03/31/07 | | | 18.96 | | | 0.06 | | | | 1.85 | | | | 1.91 | | | | — | | | | (2.27 | ) |
For the year ended 03/31/06 | | | 16.09 | | | 0.03 | | | | 3.97 | | | | 4.00 | | | | (0.03 | ) | | | (1.10 | ) |
For the year ended 03/31/05 | | | 15.58 | | | 0.06 | | | | 1.37 | | | | 1.43 | | | | — | | | | (0.92 | ) |
INTERNATIONAL GROWTH OPPORTUNITIES | | | | | | | | | | | | | | | | | | | | | | | |
For the year ended 03/31/09 | | $ | 40.10 | | $ | 0.33 | | | $ | (19.44 | ) | | $ | (19.11 | ) | | $ | — | | | $ | (4.70 | ) |
For the year ended 03/31/08 | | | 57.36 | | | 0.14 | | | | 3.43 | | | | 3.57 | | | | (1.26 | ) | | | (19.56 | ) |
For the year ended 03/31/07 | | | 49.86 | | | 0.05 | | | | 9.07 | | | | 9.12 | | | | — | | | | (1.62 | ) |
For the year ended 03/31/06 | | | 35.01 | | | (0.01 | ) | | | 15.10 | | | | 15.09 | | | | (0.24 | ) | | | — | |
For the year ended 03/31/05 | | | 29.43 | | | 0.32 | | | | 5.35 | | | | 5.67 | | | | (0.09 | ) | | | — | |
EMERGING MARKETS | | | | | | | | | | | | | | | | | | | | | | | |
For the year ended 03/31/09 | | $ | 13.52 | | $ | 0.13 | (11) | | $ | (7.20 | ) | | $ | (7.07 | ) | | $ | (0.05 | ) | | $ | (1.17 | ) |
For the year ended 03/31/08 | | | 12.79 | | | 0.19 | | | | 2.80 | | | | 2.99 | | | | (0.10 | ) | | | (2.16 | ) |
8/18/06 (Commenced) to 03/31/07 | | | 10.00 | | | 0.02 | | | | 2.84 | | | | 2.86 | | | | (0.07 | ) | | | — | |
INTERNATIONAL SYSTEMATIC | | | | | | | | | | | | | | | | | | | | | | | |
For the year ended 03/31/09 (10) | | $ | 13.57 | | $ | 0.27 | | | $ | (6.70 | ) | | $ | (6.43 | ) | | $ | (0.36 | ) | | $ | (0.00 | )(6) |
For the year ended 03/31/08 | | | 16.02 | | | 0.16 | | | | (1.64 | ) | | | (1.48 | ) | | | (0.20 | ) | | | (0.77 | ) |
For the year ended 03/31/07 | | | 13.70 | | | 0.09 | | | | 2.50 | | | | 2.59 | | | | (0.02 | ) | | | (0.25 | ) |
7/06/05 (Commenced) to 03/31/06 | | | 10.00 | | | 0.06 | | | | 3.81 | | | | 3.87 | | | | (0.01 | ) | | | (0.16 | ) |
INTERNATIONAL ALL CAP GROWTH | | | | | | | | | | | | | | | | | | | | | | | |
For the year ended 03/31/09 | | $ | 12.01 | | $ | 0.13 | | | $ | (5.64 | ) | | $ | (5.51 | ) | | $ | (0.06 | ) | | $ | (1.01 | ) |
For the year ended 03/31/08 | | | 14.41 | | | 0.19 | | | | 2.02 | | | | 2.21 | | | | (0.76 | ) | | | (3.85 | ) |
For the year ended 03/31/07 | | | 13.00 | | | 0.07 | | | | 1.93 | | | | 2.00 | | | | (0.08 | ) | | | (0.51 | ) |
For the year ended 03/31/06 | | | 9.08 | | | 0.01 | | | | 3.92 | | | | 3.93 | | | | (0.01 | ) | | | — | |
For the year ended 03/31/05 | | | 8.19 | | | 0.01 | | | | 0.92 | | | | 0.93 | | | | — | | | | (0.04 | ) |
U.S. HIGH YIELD BOND | | | | | | | | | | | | | | | | | | | | | | | |
For the year ended 03/31/09 | | $ | 9.36 | | $ | 0.71 | | | $ | (1.90 | ) | | $ | (1.19 | ) | | $ | (0.77 | ) | | $ | — | |
For the year ended 03/31/08 | | | 10.27 | | | 0.76 | | | | (0.86 | ) | | | (0.10 | ) | | | (0.81 | ) | | | — | |
For the year ended 03/31/07 | | | 10.00 | | | 0.73 | | | | 0.30 | | | | 1.03 | | | | (0.76 | ) | | | — | |
For the year ended 03/31/06 | | | 10.04 | | | 0.70 | | | | 0.02 | | | | 0.72 | | | | (0.76 | ) | | | — | |
For the year ended 03/31/05 | | | 10.34 | | | 0.85 | | | | (0.31 | ) | | | 0.54 | | | | (0.84 | ) | | | 0.00 | (6) |
| (1) | Net investment income per share is calculated by dividing net investment income for the period by the average shares outstanding during the period. |
| (2) | Total returns are not annualized for periods less than one year. |
| (3) | Ratios are annualized for periods of less than one year. Expense reimbursements reflect voluntary reductions of total expenses. Such amounts would increase net investment income (loss) ratios had such reductions not occurred. |
| (4) | Net expenses include certain items not subject to expense reimbursement for periods prior to January 23, 2006. |
| (5) | Inception to date return. |
See Accompanying Notes to Financial Statements.
56
| | | | | | | | | | | | | | | | | | | | | | | | | | | | | |
| | | | | | | | | | | Ratios to Average Net Assets (3) | | | | |
Total
Distributions | | | Net Asset
Value,
Ending | | Total
Return (2) | | | Net Assets,
Ending (in 000’s) | | Net
Investment
Income (Loss) | | | Total Expenses | | | Expenses
(Reimbursements)/
Recoupment | | | Expenses Net of Reimbursement/
Recoupment | | | Expenses Net of
Reimbursement/
Recoupment
Offset (4) | | | Fund’s
Portfolio
Turnover
Rate | |
| | | | | | | | | | | | | | | | | | | | | | | | | | | | | |
| | | | | | | | | |
| | | | | | | | | | | | | | | | | | | | | | | | | | | | | |
| $ | — | | | $ | 5.65 | | (43.50 | )%(5) | | $ | 2,323 | | (0.16 | )% | | 2.79 | % | | — | | | 2.79 | % | | 2.77 | % | | 163 | % |
| $ | (6.91 | ) | | $ | 0.32 | | (42.26 | )% | | $ | 14,692 | | 1.04 | % | | 1.17 | % | | — | | | 1.17 | % | | 0.92 | % | | 122 | % |
| | (6.98 | ) | | | 12.65 | | 1.34 | % | | | 32,669 | | 0.60 | % | | 1.18 | % | | — | | | 1.18 | % | | 1.03 | % | | 80 | % |
| | (2.27 | ) | | | 18.60 | | 10.64 | % | | | 78,550 | | (0.35 | )% | | 1.16 | % | | — | | | 1.16 | % | | 1.00 | % | | 105 | % |
| | (1.13 | ) | | | 18.96 | | 25.76 | % | | | 77,225 | | 0.16 | % | | 1.13 | % | | (0.00 | )% | | 1.13 | % | | 0.88 | % | | 139 | % |
| | (0.92 | ) | | | 16.09 | | 9.27 | % | | | 66,115 | | 0.41 | % | | 1.15 | % | | (0.01 | )% | | 1.14 | % | | 0.95 | % | | 164 | % |
| | | | | | | | | | | | | | | | | | | | | | | | | | | | | |
| $ | (4.70 | ) | | $ | 16.29 | | (48.16 | )% | | $ | 39,680 | | 1.14 | % | | 1.44 | % | | — | | | 1.44 | % | | 1.17 | % | | 106 | % |
| | (20.83 | ) | | | 40.10 | | 2.74 | % | | | 113,239 | | 0.26 | % | | 1.44 | % | | — | | | 1.44 | % | | 1.13 | % | | 86 | % |
| | (1.62 | ) | | | 57.36 | | 18.71 | % | | | 104,003 | | 0.09 | % | | 1.43 | % | | — | | | 1.43 | % | | 1.18 | % | | 127 | % |
| | (0.24 | ) | | | 49.86 | | 43.34 | % | | | 107,749 | | (0.02 | )% | | 1.38 | % | | 0.00 | % | | 1.38 | % | | 1.07 | % | | 168 | % |
| | (0.09 | ) | | | 35.01 | | 19.28 | % | | | 55,462 | | 1.05 | % | | 1.42 | % | | 0.00 | % | | 1.42 | % | | 1.11 | % | | 110 | % |
| | | | | | | | | | | | | | | | | | | | | | | | | | | | | |
| $ | (1.22 | ) | | $ | 5.23 | | (52.61 | )% | | $ | 8,586 | | 1.78 | %(11) | | 1.40 | % | | — | | | 1.40 | % | | 1.27 | % | | 149 | % |
| | (2.26 | ) | | | 13.52 | | 21.19 | % | | | 2,491 | | 1.32 | % | | 1.45 | % | | — | | | 1.45 | % | | 1.16 | % | | 183 | % |
| | (0.07 | ) | | | 12.79 | | 28.65 | %(5) | | | 94 | | (0.23 | )% | | 1.63 | % | | — | | | 1.63 | % | | 1.52 | % | | 22 | % |
| | | | | | | | | | | | | | | | | | | | | | | | | | | | | |
| $ | (0.36 | ) | | $ | 6.78 | | (47.68 | )% | | $ | 17,997 | | 2.66 | % | | 1.02 | % | | — | | | 1.02 | % | | 0.87 | % | | 215 | % |
| | (0.97 | ) | | | 13.57 | | (9.87 | )% | | | 24,534 | | 1.13 | % | | 1.04 | % | | — | | | 1.04 | % | | 0.74 | % | | 202 | % |
| | (0.27 | ) | | | 16.02 | | 19.04 | % | | | 4,623 | | (0.70 | )% | | 0.93 | %(8) | | — | | | 0.93 | % | | 0.70 | % | | 210 | % |
| | (0.17 | ) | | | 13.70 | | 38.92 | %(5) | | | 4,662 | | 0.78 | % | | 2.94 | % | | (1.69 | )% | | 1.25 | % | | 1.11 | % | | 103 | % |
| | | | | | | | | | | | | | | | | | | | | | | | | | | | | |
| $ | (1.07 | ) | | $ | 5.43 | | (46.87 | )% | | $ | 17,034 | | 1.70 | % | | 1.16 | % | | — | | | 1.16 | % | | 0.91 | % | | 60 | % |
| | (4.61 | ) | | | 12.01 | | 12.58 | % | | | 7,340 | | 1.09 | % | | 1.16 | % | | — | | | 1.16 | % | | 0.90 | % | | 113 | % |
| | (0.59 | ) | | | 14.41 | | 15.75 | % | | | 23,827 | | 0.49 | % | | 1.18 | % | | — | | | 1.18 | % | | 1.04 | % | | 118 | % |
| | (0.01 | ) | | | 13.00 | | 43.28 | % | | | 20,562 | | 0.08 | % | | 1.89 | % | | (0.47 | )% | | 1.42 | % | | 1.39 | % | | 196 | % |
| | (0.04 | ) | | | 9.08 | | 11.34 | % | | | 33,900 | | (0.42 | )% | | 2.07 | % | | (0.59 | )% | | 1.48 | % | | 1.48 | % | | 166 | % |
| | | | | | | | | | | | | | | | | | | | | | | | | | | | | |
| $ | (0.77 | ) | | $ | 7.40 | | (13.01 | )% | | $ | 49,233 | | 8.56 | % | | 0.64 | % | | — | | | 0.64 | % | | 0.61 | % | | 55 | % |
| | (0.81 | ) | �� | | 9.36 | | (1.06 | )% | | | 50,271 | | 7.66 | % | | 0.63 | % | | — | | | 0.63 | % | | 0.57 | % | | 81 | % |
| | (0.76 | ) | | | 10.27 | | 10.76 | % | | | 63,925 | | 7.21 | % | | 0.64 | % | | — | | | 0.64 | % | | 0.52 | %(7) | | 92 | % |
| | (0.76 | ) | | | 10.00 | | 7.40 | % | | | 81,187 | | 6.70 | % | | 0.82 | % | | (0.18 | )% | | 0.64 | % | | 0.56 | % | | 112 | % |
| | (0.84 | ) | | | 10.04 | | 5.40 | % | | | 131,677 | | 7.82 | % | | 0.82 | % | | (0.19 | )% | | 0.63 | % | | 0.60 | % | | 123 | % |
| (6) | Less than one penny per share. |
| (7) | For the year ended March 31, 2007 ratios do not include one time expense credit. Had this credit been included, the expense ratios would have been decreased by 0.07%. |
| (8) | For the period from 11/28/06 to 12/21/06 the unitary fees for the International Systematic Fund Class I were reduced from 0.48% to 0.23%. The Unitary fees were resumed to 0.48% through March 31, 2007. |
| (9) | Includes litigation proceeds of approximately $0.01 per share for the Global Select Fund during the fiscal year ended 2009. |
| (10) | As of March 31, 2009 International Systematic Class II Shareholders exchanged their shares for Class I Shares, closing out Class II. |
| (11) | For the year ended March 31, 2009 the net investment income per share and the ratio of net investment income (loss) included a non-recurring special cash dividend amounting to $0.04 per share and 0.51% of average net assets, respectively. |
57
NICHOLAS-APPLEGATE INSTITUTIONAL FUNDS
FINANCIAL HIGHLIGHTS
For a Class II share outstanding during the period indicated
| | | | | | | | | | | | | | | | | | | | | | | |
| | | Net Asset
Value,
Beginning | | Net
Investment
Income (1) | | | Net Realized
and Unrealized
Gain (Loss) | | | Total from
Investments
Operations | | | Distributions from: | |
| | | | | | | Net
Investment
Income | | | Net
Realized
Capital Gains | |
U.S. EQUITY FUNDS | | | | | | | | | | | | | | | | | | | | | | | |
| | | | | | |
U.S. SYSTEMATIC LARGE CAP GROWTH | | | | | | | | | | | | | | | | | | | | | | | |
For the year ended 03/31/09 | | $ | 19.29 | | $ | 0.12 | | | $ | (6.58 | ) | | $ | (6.46 | ) | | $ | — | | | $ | — | |
For the year ended 03/31/08 | | | 19.67 | | | 0.01 | | | | (0.28 | )(5) | | | (0.27 | ) | | | (0.03 | ) | | | — | |
For the year ended 03/31/07 | | | 17.75 | | | 0.05 | | | | 1.87 | | | | 1.92 | | | | 0.00 | (7) | | | — | |
9/30/05 (Commenced) to 03/31/06 | | | 16.35 | | | 0.02 | | | | 1.51 | | | | 1.53 | | | | (0.13 | ) | | | — | |
U.S. CONVERTIBLE | | | | | | | | | | | | | | | | | | | | | | | |
For the year ended 03/31/09 | | $ | 24.88 | | $ | 0.53 | | | $ | (5.80 | )(5) | | $ | (5.27 | ) | | $ | (0.45 | ) | | $ | (0.14 | ) |
For the year ended 03/31/08 | | | 24.36 | | | 0.41 | | | | 0.56 | | | | 0.97 | | | | (0.35 | ) | | | (0.10 | ) |
For the year ended 03/31/07 | | | 24.58 | | | 0.47 | | | | 2.04 | | | | 2.51 | | | | (0.50 | ) | | | (2.23 | ) |
9/30/05 (Commenced) to 03/31/06 | | | 23.97 | | | 0.30 | | | | 1.63 | | | | 1.93 | | | | (0.28 | ) | | | (1.04 | ) |
| | | | | | |
GLOBAL EQUITY FUNDS | | | | | | | | | | | | | | | | | | | | | | | |
| | | | | | |
GLOBAL SELECT | | | | | | | | | | | | | | | | | | | | | | | |
For the year ended 03/31/09 | | $ | 12.92 | | $ | 0.02 | | | $ | (5.55 | )(5) | | $ | (5.53 | ) | | $ | (0.02 | ) | | $ | (6.87 | ) |
For the year ended 03/31/08 | | | 18.61 | | | 0.14 | | | | 6.87 | | | | 7.01 | | | | (0.00 | )(7) | | | (6.69 | ) |
For the year ended 03/31/07 | | | 18.97 | | | 0.08 | | | | 1.84 | | | | 1.92 | | | | (0.01 | ) | | | (2.27 | ) |
For the year ended 03/31/06 | | | 16.09 | | | 0.04 | | | | 3.98 | | | | 4.02 | | | | (0.04 | ) | | | (1.10 | ) |
For the year ended 03/31/05 | | | 15.58 | | | 0.07 | | | | 1.36 | | | | 1.43 | | | | — | | | | (0.92 | ) |
INTERNATIONAL GROWTH OPPORTUNITIES | | | | | | | | | | | | | | | | | | | | | | | |
For the year ended 03/31/09 | | $ | 41.28 | | $ | 0.34 | | | $ | (19.99 | ) | | $ | (19.65 | ) | | $ | — | | | $ | (4.70 | ) |
For the year ended 03/31/08 | | | 57.63 | | | 0.39 | | | | 3.17 | | | | 3.56 | | | | (0.35 | ) | | | (19.56 | ) |
For the year ended 03/31/07 | | | 50.01 | | | 0.02 | | | | 9.22 | | | | 9.24 | | | | — | | | | (1.62 | ) |
For the year ended 03/31/06 | | | 35.02 | | | 0.13 | | | | 15.06 | | | | 15.19 | | | | (0.20 | ) | | | — | |
For the year ended 03/31/05 | | | 29.47 | | | 0.38 | | | | 5.32 | | | | 5.70 | | | | (0.15 | ) | | | — | |
EMERGING MARKETS | | | | | | | | | | | | | | | | | | | | | | | |
For the year ended 03/31/09 | | $ | 13.54 | | $ | 0.15 | (8) | | $ | (7.24 | ) | | $ | (7.09 | ) | | $ | (0.02 | ) | | $ | (1.17 | ) |
For the year ended 03/31/08 | | | 12.78 | | | 0.11 | | | | 2.90 | | | | 3.01 | | | | (0.09 | ) | | | (2.16 | ) |
3/23/07 (Commenced) to 03/31/07 | | | 12.61 | | | 0.00 | (7) | | | 0.17 | | | | 0.17 | | | | — | | | | — | |
INTERNATIONAL ALL CAP GROWTH | | | | | | | | | | | | | | | | | | | | | | | |
2/17/09 (Commenced) to 03/31/09 | | $ | 5.54 | | $ | 0.04 | | | $ | (0.15 | ) | | $ | (0.11 | ) | | $ | — | | | $ | — | |
| (1) | Net investment income per share is calculated by dividing net investment income for the period by the average shares outstanding during the period. |
| (2) | Total returns are not annualized for periods less than one year. |
| (3) | Ratios are annualized for periods of less than one year. Expense reimbursements reflect voluntary reductions of total expenses. Such amounts would increase net investment income (loss) ratios had such reductions not occurred. |
| (4) | Net expenses include certain items not subject to expense reimbursement for periods prior to January 23, 2006. |
See Accompanying Notes to Financial Statements.
58
| | | | | | | | | | | | | | | | | | | | | | | | | | | | | |
| | | | | | | | | | | Ratios to Average Net Assets (3) | | | | |
Total Distributions | | | Net Asset
Value,
Ending | | Total
Return (2) | | | Net Assets,
Ending
(in 000’s) | | Net
Investment
Income | | | Total
Expenses | | | Expenses
(Reimbursements)/
Recoupment | | | Expenses
Net of
Reimbursement/
Recoupment | | | Expenses Net of
Reimbursement/
Recoupment
Offset (4) | | | Fund’s
Portfolio
Turnover
Rate | |
| | | | | | | | | | | | | | | | | | | | | | | | | | | | | |
| | | | | | | | | | | | | | | | | | | | | | | | | | | | | |
| $ | — | | | $ | 12.83 | | (33.49 | )% | | $ | 2,275 | | 0.69 | % | | 1.00 | % | | — | | | 1.00 | % | | 0.95 | % | | 116 | % |
| | (0.03 | ) | | | 19.29 | | (1.81 | )% | | | 10,594 | | 0.05 | % | | 0.99 | % | | — | | | 0.99 | % | | 0.96 | % | | 106 | % |
| | — | | | | 19.67 | | 10.83 | % | | | 10,040 | | 0.28 | % | | 0.98 | % | | — | | | 0.98 | % | | 0.91 | % | | 100 | % |
| | (0.13 | ) | | | 17.75 | | 9.43 | %(6) | | | 3,743 | | 0.27 | % | | 1.37 | % | | (0.37 | )% | | 1.00 | % | | 0.94 | % | | 147 | % |
| | | | | | | | | | | | | | | | | | | | | | | | | | | | | |
| $ | (0.59 | ) | | $ | 19.02 | | (21.21 | )% | | $ | 29,568 | | 2.51 | % | | 0.93 | % | | — | | | 0.93 | % | | 0.88 | % | | 91 | % |
| | (0.45 | ) | | | 24.88 | | 3.91 | % | | | 9,103 | | 1.58 | % | | 0.93 | % | | — | | | 0.93 | % | | 0.79 | % | | 98 | % |
| | (2.73 | ) | | | 24.36 | | 10.92 | % | | | 7,880 | | 2.05 | % | | 0.92 | % | | — | | | 0.92 | % | | 0.75 | % | | 92 | % |
| | (1.32 | ) | | | 24.58 | | 8.47 | %(6) | | | 3,634 | | 2.26 | % | | 1.01 | % | | (0.09 | )% | | 0.92 | % | | 0.77 | % | | 92 | % |
| | | | | | | | | | | | | | | | | | | | | | | | | | | | | |
| | | | | | | | | | | | | | | | | | | | | | | | | | | | | |
| $ | (6.89 | ) | | $ | 0.50 | | (42.91 | )% | | $ | 2,971 | | 0.98 | % | | 1.13 | % | | — | | | 1.13 | % | | 0.88 | % | | 122 | % |
| | (6.69 | ) | | | 12.92 | | 1.40 | % | | | 8,617 | | 0.67 | % | | 1.13 | % | | — | | | 1.13 | % | | 0.97 | % | | 80 | % |
| | (2.28 | ) | | | 18.61 | | 10.67 | % | | | 90,871 | | 0.44 | % | | 1.11 | % | | — | | | 1.11 | % | | 0.95 | % | | 105 | % |
| | (1.14 | ) | | | 18.97 | | 25.90 | % | | | 100,610 | | 0.21 | % | | 1.08 | % | | — | | | 1.08 | % | | 0.83 | % | | 139 | % |
| | (0.92 | ) | | | 16.09 | | 9.27 | % | | | 69,548 | | 0.44 | % | | 1.10 | % | | (0.01 | )% | | 1.09 | % | | 0.90 | % | | 164 | % |
| | | | | | | | | | | | | | | | | | | | | | | | | | | | | |
| $ | (4.70 | ) | | $ | 16.93 | | (48.08 | )% | | $ | 6,828 | | 1.27 | % | | 1.29 | % | | — | | | 1.29 | % | | 1.01 | % | | 106 | % |
| | (19.91 | ) | | | 41.28 | | 2.90 | % | | | 8,213 | | 0.57 | % | | 1.27 | % | | — | | | 1.27 | % | | 1.00 | % | | 86 | % |
| | (1.62 | ) | | | 57.63 | | 18.90 | % | | | 73,640 | | 0.05 | % | | 1.28 | % | | — | | | 1.28 | % | | 1.03 | % | | 127 | % |
| | (0.20 | ) | | | 50.01 | | 43.55 | % | | | 32,565 | | 0.36 | % | | 1.22 | % | | (0.00 | )% | | 1.22 | % | | 0.91 | % | | 168 | % |
| | (0.15 | ) | | | 35.02 | | 19.40 | % | | | 35,233 | | 1.19 | % | | 1.27 | % | | (0.00 | )% | | 1.27 | % | | 0.97 | % | | 110 | % |
| | | | | | | | | | | | | | | | | | | | | | | | | | | | | |
| $ | (1.19 | ) | | $ | 5.26 | | (52.61 | )% | | $ | 18,088 | | 1.92 | %(8) | | 1.29 | % | | — | | | 1.29 | % | | 1.12 | % | | 149 | % |
| | (2.25 | ) | | | 13.54 | | 21.18 | % | | | 14,656 | | 0.70 | % | | 1.32 | % | | — | | | 1.32 | % | | 1.13 | % | | 183 | % |
| | — | | | | 12.78 | | 1.35 | %(6) | | | 39,081 | | 1.28 | % | | 1.18 | % | | — | | | 1.18 | % | | 1.18 | % | | 22 | % |
| | | | | | | | | | | | | | | | | | | | | | | | | | | | | |
| $ | — | | | $ | 5.43 | | (1.99 | )%(6) | | $ | 6,882 | | 6.51 | % | | 1.00 | % | | — | | | 1.00 | % | | 0.93 | % | | 60 | % |
| (5) | Includes litigation proceeds for the Global Select Fund and U.S. Convertible Fund of approximately $0.01 and less than $0.01 per share, respectively for the fiscal year 2009 and litigation proceeds for the U.S. Systematic Large Cap Growth Fund of approximately $0.09 per share for the fiscal year 2008. |
| (6) | Inception to date Return. |
| (7) | Less than one penny per share. |
| (8) | For the year ended March 31, 2009 the net investment income per share and the ratio of net investment income (loss) included a non-recurring special cash dividend amounting to a $0.04 per share and 0.51% of average net assets, respectively. |
59
NICHOLAS-APPLEGATE INSTITUTIONAL FUNDS
FINANCIAL HIGHLIGHTS
For a Class III share outstanding during the periods indicated
| | | | | | | | | | | | | | | | | | | | | | |
| | | | | | | | | | | | | Distributions from: | |
| | | Net Asset
Value,
Beginning | | Net
Investment
Income (1) | | Net Realized
and Unrealized
Gain (Loss) | | | Total from
Investments
Operations | | | Net
Investment
Income | | | Net
Realized
Capital Gains | |
GLOBAL EQUITY FUNDS | | | | | | | | | | | | | | | | | | | | | | |
| | | | | | |
INTERNATIONAL GROWTH OPPORTUNITIES | | | | | | | | | | | | | | | | | | | | | | |
9/08/08 (Commenced) to 03/31/09 | | $ | 34.51 | | $ | 0.08 | | $ | (12.95 | ) | | $ | (12.87 | ) | | $ | — | | | $ | (4.70 | ) |
INTERNATIONAL SYSTEMATIC | | | | | | | | | | | | | | | | | | | | | | |
For the year ended 03/31/09 | | $ | 13.61 | | $ | 0.30 | | $ | (6.73 | ) | | $ | (6.43 | ) | | $ | (0.39 | ) | | $ | (0.00 | )(7) |
For the year ended 03/31/08 | | | 16.01 | | | 0.08 | | | (1.51 | ) | | | (1.43 | ) | | | (0.20 | ) | | | (0.77 | ) |
12/19/06 (Commenced) to 03/31/07 | | | 15.36 | | | 0.09 | | | 0.56 | | | | 0.65 | | | | — | | | | — | |
For a Class IV share outstanding during the periods indicated
| | | | | | | | | | | | | | | | | | | | | | |
| | | | | | | | | | | | | Distributions from: | |
| | | Net Asset
Value,
Beginning | | Net
Investment
Income (1) | | Net Realized
and Unrealized
Gain (Loss) | | | Total from
Investments
Operations | | | Net
Investment
Income | | | Net
Realized
Capital Gains | |
U.S. EQUITY FUNDS | | | | | | | | | | | | | | | | | | | | | | |
| | | | | | |
U.S. CONVERTIBLE | | | | | | | | | | | | | | | | | | | | | | |
For the year ended 03/31/09 | | $ | 24.89 | | $ | 0.53 | | $ | (5.78 | ) | | $ | (5.25 | ) | | $ | (0.48 | ) | | $ | (0.14 | ) |
For the year ended 03/31/08 | | | 24.37 | | | 0.11 | | | 0.91 | | | | 1.02 | �� | | | (0.39 | ) | | | (0.10 | ) |
12/28/06 (Commenced) to 03/31/07 | | | 23.47 | | | 0.12 | | | 0.91 | | | | 1.03 | | | | (0.13 | ) | | | — | |
| (1) | Net investment income per share is calculated by dividing net investment income for the period by the average shares outstanding during the period. |
| (2) | Total returns are not annualized for periods less than one year. |
| (3) | Ratios are annualized for periods of less than one year. Expense reimbursements reflect voluntary reductions of total expenses. Such amounts would increase net investment income (loss) ratios had such reductions not occurred. |
| (4) | Net expenses include certain items not subject to expense reimbursement for periods prior to January 23, 2006. |
See Accompanying Notes to Financial Statements.
60
| | | | | | | | | | | | | | | | | | | | | | | | | | | | |
| | | | | | | | | | Ratios to Average Net Assets (3) | | | | |
Total Distributions | | Net Asset
Value,
Ending | | Total
Return (2) | | | Net Assets,
Ending
(in 000’s) | | Net
Investment
Income | | | Total
Expenses | | | Expenses
(Reimbursements)/
Recoupment | | | Expenses
Net of
Reimbursement/
Recoupment | | | Expenses Net of
Reimbursement/
Recoupment
Offset (4) | | | Fund’s
Portfolio
Turnover
Rate | |
| | | | | | | | | | | | | | | | | | | | | | | | | | | | |
| | | | | | | | | | | | | | | | | | | | | | | | | | | | |
| $ | (4.70) | | $ | 16.94 | | (36.92 | )%(5) | | $ | 16,274 | | 0.68 | % | | 1.24 | % | | — | | | 1.24 | % | | 1.04 | % | | 106 | % |
| | | | | | | | | | | | | | | | | | | | | | | | | | | | |
| $ | (0.39) | | $ | 6.79 | | (47.60 | )% | | $ | 25,860 | | 2.94 | % | | 0.78 | % | | — | | | 0.78 | % | | 0.62 | % | | 215 | % |
| | (0.97) | | | 13.61 | | (9.57 | )% | | | 49,322 | | 1.79 | % | | 0.79 | % | | — | | | 0.79 | % | | 0.55 | % | | 202 | % |
| | — | | | 16.01 | | 4.23 | %(5) | | | 54,604 | | 1.95 | % | | 0.76 | % | | — | (6) | | 0.76 | % | | 0.46 | % | | 210 | % |
| | | | | |
| | | | | | | | | | Ratios to Average Net Assets (3) | | | | |
Total Distributions | | Net Asset
Value,
Ending | | Total
Return (2) | | | Net Assets,
Ending
(in 000’s) | | Net
Investment
Income | | | Total
Expenses | | | Expenses
(Reimbursements)/
Recoupment | | | Expenses
Net of
Reimbursement/
Recoupment | | | Expenses Net of
Reimbursement/
Recoupment
Offset (4) | | | Fund’s
Portfolio
Turnover
Rate | |
| | | | | | | | | | | | | | | | | | | | | | | | | | | | |
| | | | | | | | | | | | | | | | | | | | | | | | | | | | |
| $ | (0.62) | | $ | 19.02 | | (21.11 | )% | | $ | 247,651 | | 2.48 | % | | 0.78 | % | | — | | | 0.78 | % | | 0.73 | % | | 91 | % |
| | (0.50) | | | 24.89 | | 4.07 | % | | | 253,227 | | 1.70 | % | | 0.78 | % | | — | | | 0.78 | % | | 0.64 | % | | 98 | % |
| | (0.13) | | | 24.37 | | 4.39 | %(5) | | | 97,007 | | 1.97 | % | | 0.77 | % | | — | (6) | | 0.77 | % | | 0.60 | % | | 92 | % |
| (5) | Inception to date return. |
| (6) | The expense reimbursement was terminated on January 23, 2006. |
| (7) | Less than one penny per share per share. |
61
NICHOLAS-APPLEGATE INSTITUTIONAL FUNDS
STATEMENTSOF ASSETSAND LIABILITIES
| | | | | | | | | | | | | | | | | | | | |
March 31, 2009 | | U.S. Ultra
Micro Cap | | | U.S. Micro Cap | | | U.S. Emerging
Growth | | | U.S. Small
to Mid Cap
Growth | | | U.S. Systematic
Large Cap
Growth | |
Assets | | | | | | | | | | | | | | | | | | | | |
Investments, at value*, (a) | | $ | 1,123,404 | | | $ | 44,146,255 | | | $ | 8,085,518 | | | $ | 3,082,664 | | | $ | 6,516,482 | |
Foreign currencies, at value** | | | — | | | | — | | | | — | | | | — | | | | — | |
Cash | | | — | | | | — | | | | — | | | | — | | | | — | |
Receivables: | | | | | | | | | | | | | | | | | | | | |
Investment securities sold | | | 9,680 | | | | 387,402 | | | | 59,243 | | | | 40,410 | | | | — | |
Capital shares sold | | | 61 | | | | 18,697 | | | | 27,159 | | | | — | | | | — | |
Dividends | | | 100 | | | | 4,797 | | | | 2,195 | | | | 942 | | | | 8,901 | |
Foreign taxes receivable | | | — | | | | — | | | | — | | | | — | | | | — | |
Futures variation margin | | | — | | | | — | | | | — | | | | — | | | | — | |
Interest | | | — | | | | — | | | | — | | | | — | | | | — | |
Other | | | 696 | | | | 18,920 | | | | 258 | | | | 70 | | | | 164 | |
| | | | | | | | | | | | | | | | | | | | |
Total assets | | | 1,133,941 | | | | 44,576,071 | | | | 8,174,373 | | | | 3,124,086 | | | | 6,525,547 | |
| | | | | | | | | | | | | | | | | | | | |
Liabilities | | | | | | | | | | | | | | | | | | | | |
Payables: | | | | | | | | | | | | | | | | | | | | |
Investments purchased | | $ | 47,670 | | | $ | 266,325 | | | $ | 36,458 | | | $ | 17,456 | | | $ | 95,444 | |
Capital shares redeemed | | | — | | | | 4,927 | | | | — | | | | — | | | | 2,084 | |
Collateral on securities loaned | | | — | | | | 4,061,615 | | | | — | | | | — | | | | 170,100 | |
Financing fee | | | — | | | | — | | | | — | | | | — | | | | — | |
To investment advisor | | | 1,275 | | | | 33,242 | | | | 4,954 | | | | 1,287 | | | | 2,349 | |
Other Liabilities | | | 925 | | | | 32,339 | | | | 5,624 | | | | 2,864 | | | | 7,998 | |
| | | | | | | | | | | | | | | | | | | | |
Total Liabilities | | | 49,870 | | | | 4,398,448 | | | | 47,036 | | | | 21,607 | | | | 277,975 | |
| | | | | | | | | | | | | | | | | | | | |
NET ASSETS | | | 1,084,071 | | | | 40,177,623 | | | | 8,127,337 | | | | 3,102,479 | | | | 6,247,572 | |
| | | | | | | | | | | | | | | | | | | | |
| | | | | |
* Investments, at cost | | | 1,289,867 | | | | 52,111,989 | | | | 10,122,016 | | | | 3,523,041 | | | | 7,320,960 | |
| | | | | | | | | | | | | | | | | | | | |
** Foreign currencies, at cost | | | — | | | | — | | | | — | | | | — | | | | — | |
| | | | | | | | | | | | | | | | | | | | |
| | | | | |
Net Assets Consist of: | | | | | | | | | | | | | | | | | | | | |
Paid-in capital | | $ | 1,757,246 | | | $ | 65,318,920 | | | $ | 19,124,012 | | | $ | 5,536,221 | | | $ | 15,726,737 | |
Undistributed net investment income | | | — | | | | — | | | | — | | | | — | | | | 48,672 | |
Accumulated net realized (loss) on investments and foreign currencies and short sales | | | (506,712 | ) | | | (17,175,563 | ) | | | (8,960,177 | ) | | | (1,993,365 | ) | | | (8,723,359 | ) |
Net unrealized appreciation (depreciation) of investment and other assets and liabilities denominated in foreign currencies and short sales | | | (166,463 | ) | | | (7,965,734 | ) | | | (2,036,498 | ) | | | (440,377 | ) | | | (804,478 | ) |
| | | | | | | | | | | | | | | | | | | | |
Net Assets applicable to all shares outstanding | | $ | 1,084,071 | | | $ | 40,177,623 | | | $ | 8,127,337 | | | $ | 3,102,479 | | | $ | 6,247,572 | |
| | | | | | | | | | | | | | | | | | | | |
Net Assets of Class I shares | | $ | 1,084,071 | | | $ | 40,177,623 | | | $ | 6,590,839 | | | $ | 3,102,479 | | | $ | 511,534 | |
Net Assets of Class II shares | | | — | | | | — | | | | — | | | | — | | | | 2,274,810 | |
Net Assets of Class III shares | | | — | | | | — | | | | — | | | | — | | | | — | |
Net Assets of Class IV shares | | | — | | | | — | | | | — | | | | — | | | | — | |
Net Assets of Class R shares | | | — | | | | — | | | | 1,536,498 | | | | — | | | | 3,461,228 | |
| | | | | | | | | | | | | | | | | | | | |
| | | | | |
Class I Shares outstanding | | | 187,435 | | | | 5,300,327 | | | | 999,917 | | | | 571,913 | | | | 39,762 | |
Class II Shares outstanding | | | — | | | | — | | | | — | | | | — | | | | 177,372 | |
Class III Shares outstanding | | | — | | | | — | | | | — | | | | — | | | | — | |
Class IV Shares outstanding | | | — | | | | — | | | | — | | | | — | | | | — | |
Class R Shares outstanding | | | — | | | | — | | | | 239,339 | | | | — | | | | 275,278 | |
| | | | | | | | | | | | | | | | | | | | |
Net Asset Value — Class I Share | | $ | 5.78 | | | $ | 7.58 | | | $ | 6.59 | | | $ | 5.42 | | | $ | 12.86 | |
Net Asset Value — Class II Share | | $ | — | | | $ | — | | | $ | — | | | $ | — | | | $ | 12.83 | |
Net Asset Value — Class III Share | | $ | — | | | $ | — | | | $ | — | | | $ | — | | | $ | — | |
Net Asset Value — Class IV Share | | $ | — | | | $ | — | | | $ | — | �� | | $ | — | | | $ | — | |
Net Asset Value — Class R Share | | $ | — | | | $ | — | | | $ | 6.42 | | | $ | — | | | $ | 12.57 | |
| | | | | | | | | | | | | | | | | | | | |
| | | | | |
(a) Including securities on loan with values of: | | $ | — | | | $ | 3,943,619 | | | $ | — | | | $ | — | | | $ | 166,564 | |
| | | | | | | | | | | | | | | | | | | | |
See Accompanying Notes to Financial Statements.
62
| | | | | | | | | | | | | | | | | | | | | | | | | | | | | | |
| U.S. Convertible | | | Global Equity
130/30 | | | Global
Select | | | International
Growth
Opportunities | | | Emerging
Markets | | | International
Systematic | | | International
All Cap Growth | | | U.S. High Yield
Bond | |
| | | | | | | | | | | | | | | | | | | | | | | | | | | | | | |
| $ | 300,040,613 | | | $ | 2,296,954 | | | $ | 17,523,877 | | | $ | 62,107,409 | | | $ | 26,582,189 | | | $ | 44,427,986 | | | $ | 23,302,315 | | | $ | 48,867,106 | |
| | — | | | | 11,678 | | | | 1 | | | | — | | | | 119,133 | | | | — | | | | 2 | | | | — | |
| | 164 | | | | 1,170 | | | | 68 | | | | 98 | | | | 67 | | | | 150 | | | | 62 | | | | — | |
| | 521,250 | | | | 11,767 | | | | 220,447 | | | | 472,547 | | | | 219 | | | | 453,299 | | | | 444,993 | | | | — | |
| | — | | | | — | | | | 9,157 | | | | 2,198,308 | | | | 50 | | | | 1,114,753 | | | | 176,073 | | | | 65,550 | |
| | 131,044 | | | | 7,951 | | | | 32,980 | | | | 150,652 | | | | 103,775 | | | | 230,924 | | | | 149,980 | | | | — | |
| | — | | | | 1,270 | | | | 75,700 | | | | 22,976 | | | | 689 | | | | 83,966 | | | | 18,148 | | | | — | |
| | — | | | | 2,349 | | | | — | | | | — | | | | — | | | | — | | | | — | | | | — | |
| | 1,574,894 | | | | — | | | | — | | | | — | | | | — | | | | — | | | | — | | | | 1,427,587 | |
| | 591 | | | | 21 | | | | 2,535 | | | | 8,998 | | | | — | | | | 13,117 | | | | 1,145 | | | | — | |
| | | | | | | | | | | | | | | | | | | | | | | | | | | | | | | |
| | 302,268,556 | | | | 2,333,160 | | | | 17,864,765 | | | | 64,960,988 | | | | 26,806,122 | | | | 46,324,195 | | | | 24,092,718 | | | | 50,360,243 | |
| | | | | | | | | | | | | | | | | | | | | | | | | | | | | | | |
| | | | | | | | | | | | | | | | | | | | | | | | | | | | | | |
| | | | | | | | | | | | | | | | | | | | | | | | | | | | | | |
| $ | 4,150,000 | | | $ | — | | | $ | 169,605 | | | $ | — | | | $ | 86,134 | | | $ | 1,302,574 | | | $ | 23,677 | | | $ | 771,958 | |
| | — | | | | — | | | | — | | | | 2,083,211 | | | | 12,839 | | | | 1,114,753 | | | | 129,147 | | | | 319,260 | |
| | — | | | | — | | | | — | | | | — | | | | — | | | | — | | | | — | | | | — | |
| | — | | | | 5,191 | | | | — | | | | — | | | | — | | | | — | | | | — | | | | — | |
| | 137,732 | | | | 2,141 | | | | 9,543 | | | | 37,668 | | | | 19,788 | | | | 18,486 | | | | 17,023 | | | | 15,891 | |
| | 98,513 | | | | 3,267 | | | | 22,680 | | | | 58,919 | | | | 13,342 | | | | 31,608 | | | | 6,368 | | | | 19,774 | |
| | | | | | | | | | | | | | | | | | | | | | | | | | | | | | | |
| | 4,386,245 | | | | 10,599 | | | | 201,828 | | | | 2,179,798 | | | | 132,103 | | | | 2,467,421 | | | | 176,215 | | | | 1,126,883 | |
| | | | | | | | | | | | | | | | | | | | | | | | | | | | | | | |
| | 297,882,311 | | | | 2,322,561 | | | | 17,662,937 | | | | 62,781,190 | | | | 26,674,019 | | | | 43,856,774 | | | | 23,916,503 | | | | 49,233,360 | |
| | | | | | | | | | | | | | | | | | | | | | | | | | | | | | | |
| | | | | | | |
| | 348,393,428 | | | | 3,233,560 | | | | 21,013,059 | | | | 85,327,793 | | | | 26,016,810 | | | | 52,790,250 | | | | 26,486,857 | | | | 58,229,634 | |
| | | | | | | | | | | | | | | | | | | | | | | | | | | | | | | |
| | — | | | | 11,915 | | | | 1 | | | | — | | | | 116,641 | | | | — | | | | 2 | | | | — | |
| | | | | | | | | | | | | | | | | | | | | | | | | | | | | | | |
| | | | | | | |
| | | | | | | | | | | | | | | | | | | | | | | | | | | | | | |
| $ | 374,633,671 | | | $ | 4,125,297 | | | $ | 32,881,617 | | | $ | 135,084,960 | | | $ | 37,540,311 | | | $ | 99,349,218 | | | $ | 36,471,694 | | | $ | 66,437,772 | |
| | 373,877 | | | | — | | | | 298,921 | | | | 982,464 | | | | 262,498 | | | | 347,822 | | | | 247,129 | | | | 8,941 | |
| | | | | | | |
| | (28,772,422 | ) | | | (868,183 | ) | | | (12,030,693 | ) | | | (50,066,578 | ) | | | (11,695,518 | ) | | | (47,481,413 | ) | | | (9,618,726 | ) | | | (7,797,785 | ) |
| | | | | | | |
| | (48,352,815 | ) | | | (934,553 | ) | | | (3,486,908 | ) | | | (23,219,656 | ) | | | 566,728 | | | | (8,358,853 | ) | | | (3,183,594 | ) | | | (9,415,568 | ) |
| | | | | | | | | | | | | | | | | | | | | | | | | | | | | | | |
| $ | 297,882,311 | | | $ | 2,322,561 | | | $ | 17,662,937 | | | $ | 62,781,190 | | | $ | 26,674,019 | | | $ | 43,856,774 | | | $ | 23,916,503 | | | $ | 49,233,360 | |
| | | | | | | | | | | | | | | | | | | | | | | | | | | | | | | |
| $ | 20,663,543 | | | $ | 2,322,561 | | | $ | 14,692,052 | | | $ | 39,679,557 | | | $ | 8,586,489 | | | $ | 17,996,767 | | | $ | 17,034,492 | | | $ | 49,233,360 | |
| | 29,568,238 | | | | — | | | | 2,970,885 | | | | 6,828,071 | | | | 18,087,530 | | | | — | | | | 6,882,011 | | | | — | |
| | — | | | | — | | | | — | | | | 16,273,562 | | | | — | | | | 25,860,007 | | | | — | | | | — | |
| | 247,650,530 | | | | — | | | | — | | | | — | | | | — | | | | — | | | | — | | | | — | |
| | — | | | | — | | | | — | | | | — | | | | — | | | | — | | | | — | | | | — | |
| | | | | | | | | | | | | | | | | | | | | | | | | | | | | | | |
| | | | | | | |
| | 1,087,105 | | | | 411,313 | | | | 45,953,998 | | | | 2,436,206 | | | | 1,641,519 | | | | 2,655,475 | | | | 3,136,845 | | | | 6,653,962 | |
| | 1,554,396 | | | | — | | | | 5,889,771 | | | | 403,427 | | | | 3,438,372 | | | | — | | | | 1,268,477 | | | | — | |
| | — | | | | — | | | | — | | | | 960,742 | | | | — | | | | 3,807,083 | | | | — | | | | — | |
| | 13,018,403 | | | | — | | | | — | | | | — | | | | — | | | | — | | | | — | | | | — | |
| | — | | | | — | | | | — | | | | — | | | | — | | | | — | | | | — | | | | — | |
| | | | | | | | | | | | | | | | | | | | | | | | | | | | | | | |
| $ | 19.01 | | | $ | 5.65 | | | $ | 0.32 | | | $ | 16.29 | | | $ | 5.23 | | | $ | 6.78 | | | $ | 5.43 | | | $ | 7.40 | |
| $ | 19.02 | | | $ | — | | | $ | 0.50 | | | $ | 16.93 | | | $ | 5.26 | | | $ | — | | | $ | 5.43 | | | $ | — | |
| $ | — | | | $ | — | | | $ | — | | | $ | 16.94 | | | $ | — | | | $ | 6.79 | | | $ | — | | | $ | — | |
| $ | 19.02 | | | $ | — | | | $ | — | | | $ | — | | | $ | — | | | $ | — | | | $ | — | | | $ | — | |
| $ | — | | | $ | — | | | $ | — | | | $ | — | | | $ | — | | | $ | — | | | $ | — | | | $ | — | |
| | | | | | | | | | | | | | | | | | | | | | | | | | | | | | | |
| | | | | | | |
| $ | — | | | $ | — | | | $ | — | | | $ | — | | | $ | — | | | $ | — | | | $ | — | | | $ | — | |
| | | | | | | | | | | | | | | | | | | | | | | | | | | | | | | |
63
NICHOLAS-APPLEGATE INSTITUTIONAL FUNDS
STATEMENTSOF OPERATIONS
| | | | | | | | | | | | | | | | | | | | |
Year Ended March 31, 2009 | | U.S. Ultra
Micro Cap | | | U.S. Micro Cap | | | U.S. Emerging
Growth | | | U.S. Small
to Mid Cap
Growth | | | U.S. Systematic
Large Cap
Growth | |
Investment Income | | | | | | | | | | | | | | | | | | | | |
Dividends, net of foreign taxes* | | $ | 3,494 | | | $ | 145,845 | | | $ | 54,235 | | | $ | 15,578 | | | $ | 162,416 | |
Interest | | | — | | | | 6 | | | | — | | | | — | | | | — | |
| | | | | | | | | | | | | | | | | | | | |
Total Income | | | 3,494 | | | | 145,851 | | | | 54,235 | | | | 15,578 | | | | 162,416 | |
| | | | | | | | | | | | | | | | | | | | |
| | | | | |
Expenses | | | | | | | | | | | | | | | | | | | | |
Advisory fee | | | 19,902 | | | | 540,350 | | | | 74,251 | | | | 21,049 | | | | 43,781 | |
Administration fees | | | 9,685 | | | | 291,789 | | | | 40,591 | | | | 16,839 | | | | 55,793 | |
Shareholder servicing fees | | | — | | | | — | | | | 5,878 | | | | — | | | | 11,887 | |
Financing fees | | | — | | | | — | | | | — | | | | — | | | | — | |
Trustees’ fees and expenses | | | 587 | | | | 20,128 | | | | 3,520 | | | | 1,709 | | | | 3,942 | |
Interest fee | | | — | | | | — | | | | 193 | | | | — | | | | 1,781 | |
Dividend expense on securities sold short | | | — | | | | — | | | | — | | | | — | | | | — | |
Miscellaneous | | | 1,654 | | | | 4,021 | | | | 1,517 | | | | 1,215 | | | | 1,065 | |
| | | | | | | | | | | | | | | | | | | | |
Total Expenses | | | 31,828 | | | | 856,288 | | | | 125,950 | | | | 40,812 | | | | 118,249 | |
Expense offset | | | (1,196 | ) | | | (363,460 | ) | | | (31,475 | ) | | | (6,826 | ) | | | (4,505 | ) |
| | | | | | | | | | | | | | | | | | | | |
Net Expenses | | | 30,632 | | | | 492,828 | | | | 94,475 | | | | 33,986 | | | | 113,744 | |
| | | | | | | | | | | | | | | | | | | | |
Net Investment Income (Loss) | | | (27,138 | ) | | | (346,977 | ) | | | (40,240 | ) | | | (18,408 | ) | | | 48,672 | |
| | | | | | | | | | | | | | | | | | | | |
| | | | | |
Net Realized and Unrealized | | | | | | | | | | | | | | | | | | | | |
Gain (Loss) on Investments | | | | | | | | | | | | | | | | | | | | |
Realized gain from: | | | | | | | | | | | | | | | | | | | | |
Investments | | | (489,084 | ) | | | (15,983,886 | ) | | | (3,991,029 | ) | | | (1,672,761 | ) | | | (1,713,044 | ) |
Futures | | | — | | | | — | | | | — | | | | — | | | | — | |
Foreign currency transactions | | | — | | | | — | | | | — | | | | — | | | | — | |
| | | | | | | | | | | | | | | | | | | | |
Net realized loss | | | (489,084 | ) | | | (15,983,886 | ) | | | (3,991,029 | ) | | | (1,672,761 | ) | | | (1,713,044 | ) |
| | | | | | | | | | | | | | | | | | | | |
Change in unrealized appreciation (depreciation) of: | | | | | | | | | | | | | | | | | | | | |
Investments | | | (122,292 | ) | | | (6,288,864 | ) | | | (1,566,687 | ) | | | (257,128 | ) | | | (1,284,603 | ) |
Futures | | | — | | | | — | | | | — | | | | — | | | | — | |
Other assets and liabilities denominated in foreign currencies | | | — | | | | — | | | | — | | | | — | | | | — | |
| | | | | | | | | | | | | | | | | | | | |
Net unrealized appreciation (depreciation) | | | (122,292 | ) | | | (6,288,864 | ) | | | (1,566,687 | ) | | | (257,128 | ) | | | (1,284,603 | ) |
| | | | | | | | | | | | | | | | | | | | |
Net (Loss) on Investments | | | (611,376 | ) | | | (22,272,750 | ) | | | (5,557,716 | ) | | | (1,929,889 | ) | | | (2,997,647 | ) |
| | | | | | | | | | | | | | | | | | | | |
Net Increase/Decrease in Assets Resulting from Operations | | $ | (638,514 | ) | | $ | (22,619,727 | ) | | $ | (5,597,956 | ) | | $ | (1,948,297 | ) | | $ | (2,948,975 | ) |
| | | | | | | | | | | | | | | | | | | | |
* Foreign taxes withheld | | $ | — | | | $ | — | | | $ | — | | | $ | — | | | $ | — | |
| | | | | | | | | | | | | | | | | | | | |
See Accompanying Notes to Financial Statements.
64
| | | | | | | | | | | | | | | | | | | | | | | | | | | | | | |
| U.S. Convertible | | | Global Equity
130/30 | | | Global
Select | | | International
Growth
Opportunities | | | Emerging
Markets | | | International
Systematic | | | International
All Cap Growth | | | U.S. High Yield
Bond | |
| | | | | | | | | | | | | | | | | | | | | | | | | | | | | | |
| $ | 2,934,983 | | | $ | 85,307 | | | $ | 623,610 | | | $ | 2,108,832 | | | $ | 578,568 | | | $ | 2,571,348 | | | $ | 369,448 | | | $ | 1,959 | |
| | 6,263,493 | | | | 55 | | | | — | | | | 25 | | | | — | | | | 604 | | | | 197 | | | | 4,366,938 | |
| | | | | | | | | | | | | | | | | | | | | | | | | | | | | | | |
| | 9,198,476 | | | | 85,362 | | | | 623,610 | | | | 2,108,857 | | | | 578,568 | | | | 2,571,952 | | | | 369,645 | | | | 4,368,897 | |
| | | | | | | | | | | | | | | | | | | | | | | | | | | | | | | |
| | | | | | | |
| | | | | | | | | | | | | | | | | | | | | | | | | | | | | | |
| | 1,584,723 | | | | 36,035 | | | | 209,813 | | | | 658,634 | | | | 171,044 | | | | 354,434 | | | | 109,085 | | | | 190,608 | |
| | 652,886 | | | | 21,948 | | | | 147,693 | | | | 619,402 | | | | 65,635 | | | | 226,155 | | | | 33,672 | | | | 95,304 | |
| | — | | | | — | | | | — | | | | — | | | | — | | | | — | | | | — | | | | — | |
| | — | | | | 14,840 | | | | — | | | | — | | | | — | | | | — | | | | — | | | | — | |
| | 102,820 | | | | 1,043 | | | | 13,682 | | | | 36,305 | | | | 6,269 | | | | 28,889 | | | | 3,469 | | | | 16,814 | |
| | — | | | | 1,813 | | | | 715 | | | | 5,295 | | | | 1,199 | | | | 820 | | | | 367 | | | | 116 | |
| | — | | | | 14,398 | | | | — | | | | — | | | | — | | | | — | | | | — | | | | — | |
| | 12,644 | | | | 1,181 | | | | 3,210 | | | | 4,111 | | | | 5,614 | | | | 3,422 | | | | 1,450 | | | | 2,714 | |
| | | | | | | | | | | | | | | | | | | | | | | | | | | | | | | |
| | 2,353,073 | | | | 91,258 | | | | 375,113 | | | | 1,323,747 | | | | 249,761 | | | | 613,720 | | | | 148,043 | | | | 305,556 | |
| | (148,264 | ) | | | (623 | ) | | | (82,750 | ) | | | (247,946 | ) | | | (29,845 | ) | | | (109,215 | ) | | | (29,142 | ) | | | (15,047 | ) |
| | | | | | | | | | | | | | | | | | | | | | | | | | | | | | | |
| | 2,204,809 | | | | 90,635 | | | | 292,363 | | | | 1,075,801 | | | | 219,916 | | | | 504,505 | | | | 118,901 | | | | 290,509 | |
| | | | | | | | | | | | | | | | | | | | | | | | | | | | | | | |
| | 6,993,667 | | | | (5,273 | ) | | | 331,247 | | | | 1,033,056 | | | | 358,652 | | | | 2,067,447 | | | | 250,744 | | | | 4,078,388 | |
| | | | | | | | | | | | | | | | | | | | | | | | | | | | | | | |
| | | | | | | |
| | | | | | | | | | | | | | | | | | | | | | | | | | | | | | |
| | | | | | | | | | | | | | | | | | | | | | | | | | | | | | |
| | | | | | | | | | | | | | | | | | | | | | | | | | | | | | |
| | (22,074,355 | ) | | | (863,705 | ) | | | (9,562,457 | ) | | | (29,398,851 | ) | | | (11,571,175 | ) | | | (39,438,542 | ) | | | (5,030,000 | ) | | | (3,328,327 | ) |
| | — | | | | (3,541 | ) | | | — | | | | — | | | | — | | | | — | | | | — | | | | — | |
| | — | | | | 1,252 | | | | (42,443 | ) | | | 12,067 | | | | (96,119 | ) | | | 22,254 | | | | (3,601 | ) | | | — | |
| | | | | | | | | | | | | | | | | | | | | | | | | | | | | | | |
| | (22,074,355 | ) | | | (865,994 | ) | | | (9,604,900 | ) | | | (29,386,784 | ) | | | (11,667,294 | ) | | | (39,416,288 | ) | | | (5,033,601 | ) | | | (3,328,327 | ) |
| | | | | | | | | | | | | | | | | | | | | | | | | | | | | | | |
| | | | | | | | | | | | | | | | | | | | | | | | | | | | | | |
| | (49,650,857 | ) | | | (936,606 | ) | | | (9,517,474 | ) | | | (38,247,238 | ) | | | 262,629 | | | | (5,211,232 | ) | | | (3,838,706 | ) | | | (7,257,264 | ) |
| | — | | | | 2,349 | | | | — | | | | — | | | | — | | | | — | | | | — | | | | — | |
| | | | | | | |
| | — | | | | (296 | ) | | | (11,666 | ) | | | 1,897 | | | | (35,025 | ) | | | 137,872 | | | | (2,335 | ) | | | — | |
| | | | | | | | | | | | | | | | | | | | | | | | | | | | | | | |
| | (49,650,857 | ) | | | (934,553 | ) | | | (9,529,140 | ) | | | (38,245,341 | ) | | | 227,604 | | | | (5,073,360 | ) | | | (3,841,041 | ) | | | (7,257,264 | ) |
| | | | | | | | | | | | | | | | | | | | | | | | | | | | | | | |
| | (71,725,212 | ) | | | (1,800,547 | ) | | | (19,134,040 | ) | | | (67,632,125 | ) | | | (11,439,690 | ) | | | (44,489,648 | ) | | | (8,874,642 | ) | | | (10,585,591 | ) |
| | | | | | | | | | | | | | | | | | | | | | | | | | | | | | | |
| $ | (64,731,545 | ) | | $ | (1,805,820 | ) | | $ | (18,802,793 | ) | | $ | (66,599,069 | ) | | $ | (11,081,038 | ) | | $ | (42,422,201 | ) | | $ | (8,623,898 | ) | | $ | (6,507,203 | ) |
| | | | | | | | | | | | | | | | | | | | | | | | | | | | | | | |
| $ | — | | | $ | 6,239 | | | $ | 47,303 | | | $ | 156,496 | | | $ | 64,444 | | | $ | 265,293 | | | $ | 35,359 | | | $ | — | |
| | | | | | | | | | | | | | | | | | | | | | | | | | | | | | | |
65
NICHOLAS-APPLEGATE INSTITUTIONAL FUNDS
STATEMENTSOF CHANGESIN NET ASSETS
| | | | | | | | | | | | | | | | | | | | | | | | |
| | | U.S. Ultra Micro Cap | | | U.S. Micro Cap | | | U.S. Emerging Growth | |
Years/Periods Ended March 31 | | 2009 | | | 2008* | | | 2009 | | | 2008 | | | 2009 | | | 2008 | |
Increase (Decrease) in Net Assets | | | | | | | | | | | | | | | | | | | | | | | | |
Net investment income (loss) | | $ | (27,138 | ) | | $ | (2,880 | ) | | $ | (346,977 | ) | | $ | (971,799 | ) | | $ | (40,240 | ) | | $ | (63,162 | ) |
Net realized gain (loss) | | | (489,084 | ) | | | (17,628 | ) | | | (15,983,886 | ) | | | 5,666,026 | | | | (3,991,029 | ) | | | 1,109,622 | |
Net unrealized appreciation (depreciation) | | | (122,292 | ) | | | (44,171 | ) | | | (6,288,864 | ) | | | (13,753,967 | ) | | | (1,566,687 | ) | | | (1,932,344 | ) |
| | | | | | | | | | | | | | | | | | | | | | | | |
Investment operations | | | (638,514 | ) | | | (64,679 | ) | | | (22,619,727 | ) | | | (9,059,740 | ) | | | (5,597,956 | ) | | | (885,884 | ) |
| | | | | | | | | | | | | | | | | | | | | | | | |
Distributions to Shareholders: | | | | | | | | | | | | | | | | | | | | | | | | |
From net investment income | | | | | | | | | | | | | | | | | | | | | | | | |
Class I | | | — | | | | — | | | | — | | | | — | | | | — | | | | — | |
Class II | | | — | | | | — | | | | — | | | | — | | | | — | | | | — | |
Class IV | | | — | | | | — | | | | — | | | | — | | | | — | | | | — | |
Class R | | | — | | | | — | | | | — | | | | — | | | | — | | | | — | |
From net realized gains | | | | | | | | | | | | | | | | | | | | | | | | |
Class I | | | — | | | | — | | | | (18,218 | ) | | | (9,796,779 | ) | | | — | | | | (527,551 | ) |
Class II | | | — | | | | — | | | | — | | | | (98,864 | ) | | | — | | | | — | |
Class IV | | | — | | | | — | | | | — | | | | — | | | | — | | | | — | |
Class R | | | — | | | | — | | | | — | | | | — | | | | — | | | | (217,858 | ) |
From Capital Share Transactions: | | | | | | | | | | | | | | | | | | | | | | | | |
| | | | | | | | | | | | | | | | | | | | | | | | |
Total distributions | | | — | | | | — | | | | (18,218 | ) | | | (9,895,643 | ) | | | — | | | | (745,409 | ) |
| | | | | | | | | | | | | | | | | | | | | | | | |
Proceeds from shares sold | | | | | | | | | | | | | | | | | | | | | | | | |
Class I | | | 856,224 | | | | 950,827 | | | | 15,606,664 | | | | 17,361,071 | | | | 5,416,300 | | | | 2,539,292 | |
Class II | | | — | | | | — | | | | — | | | | 110,838 | | | | — | | | | — | |
Class IV | | | — | | | | — | | | | — | | | | — | | | | — | | | | — | |
Class R | | | — | | | | — | | | | — | | | | — | | | | 659,133 | | | | 1,124,520 | |
Distributions reinvested | | | | | | | | | | | | | | | | | | | | | | | | |
Class I | | | — | | | | — | | | | 18,097 | | | | 9,746,287 | | | | — | | | | 526,107 | |
Class II | | | — | | | | — | | | | — | | | | 98,864 | | | | — | | | | — | |
Class IV | | | — | | | | — | | | | — | | | | — | | | | — | | | | — | |
Class R | | | — | | | | — | | | | — | | | | — | | | | — | | | | 217,859 | |
Cost of shares redeemed | | | | | | | | | | | | | | | | | | | | | | | | |
Class I | | | (19,787 | ) | | | — | | | | (12,931,589 | ) | | | (32,282,224 | ) | | | (1,926,575 | ) | | | (1,777,085 | ) |
Class II | | | — | | | | — | | | | — | | | | (3,054,309 | ) | | | — | | | | — | |
Class IV | | | — | | | | — | | | | — | | | | — | | | | — | | | | — | |
Class R | | | — | | | | — | | | | — | | | | — | | | | (792,831 | ) | | | (1,216,005 | ) |
| | | | | | | | | | | | | | | | | | | | | | | | |
Net increase (decrease) in net assets from share transactions | | | 836,437 | | | | 950,827 | | | | 2,693,172 | | | | (8,019,473 | ) | | | 3,356,027 | | | | 1,414,688 | |
| | | | | | | | | | | | | | | | | | | | | | | | |
Net Increase (Decrease) in Net Assets | | | 197,923 | | | | 886,148 | | | | (19,944,773 | ) | | | (26,974,856 | ) | | | (2,241,929 | ) | | | (216,605 | ) |
Net Assets | | | | | | | | | | | | | | | | | | | | | | | | |
Beginning | | | 886,148 | | | | — | | | | 60,122,396 | | | | 87,097,252 | | | | 10,369,266 | | | | 10,585,871 | |
| | | | | | | | | | | | | | | | | | | | | | | | |
Ending | | $ | 1,084,071 | | | $ | 886,148 | | | $ | 40,177,623 | | | $ | 60,122,396 | | | $ | 8,127,337 | | | $ | 10,369,266 | |
| | | | | | | | | | | | | | | | | | | | | | | | |
Undistributed net investment income (loss), ending | | $ | — | | | $ | — | | | $ | — | | | $ | — | | | $ | — | | | $ | — | |
| | | | | | | | | | | | | | | | | | | | | | | | |
Class I — Capital Share Activity | | | | | | | | | | | | | | | | | | | | | | | | |
Shares sold | | | 95,380 | | | | 95,521 | | | | 1,532,253 | | | | 1,152,958 | | | | 554,485 | | | | 182,466 | |
Distributions reinvested | | | — | | | | — | | | | 2,288 | | | | 692,700 | | | | — | | | | 37,552 | |
Shares redeemed | | | (3,466 | ) | | | — | | | | (1,419,052 | ) | | | (2,167,801 | ) | | | (209,274 | ) | | | (131,451 | ) |
| | | | | | | | | | | | | | | | | | | | | | | | |
Net Class I Share Activity | | | 91,914 | | | | 95,521 | | | | 115,489 | | | | (322,143 | ) | | | 345,211 | | | | 88,567 | |
| | | | | | | | | | | | | | | | | | | | | | | | |
Class II — Capital Share Activity | | | | | | | | | | | | | | | | | | | | | | | | |
Shares sold | | | — | | | | — | | | | — | | | | 6,464 | | | | — | | | | — | |
Distributions reinvested | | | — | | | | — | | | | — | | | | 6,952 | | | | — | | | | — | |
Shares redeemed | | | — | | | | — | | | | — | | | | (187,792 | ) | | | — | | | | — | |
| | | | | | | | | | | | | | | | | | | | | | | | |
Net Class II Share Activity | | | — | | | | — | | | | — | | | | (174,376 | ) | | | — | | | | — | |
| | | | | | | | | | | | | | | | | | | | | | | | |
Class IV — Capital Share Activity | | | | | | | | | | | | | | | | | | | | | | | | |
Shares sold | | | — | | | | — | | | | — | | | | — | | | | — | | | | — | |
Distributions reinvested | | | — | | | | — | | | | — | | | | — | | | | — | | | | — | |
Shares redeemed | | | — | | | | — | | | | — | | | | — | | | | — | | | | — | |
| | | | | | | | | | | | | | | | | | | | | | | | |
Net Class IV Share Activity | | | — | | | | — | | | | — | | | | — | | | | — | | | | — | |
| | | | | | | | | | | | | | | | | | | | | | | | |
Class R — Capital Share Activity | | | | | | | | | | | | | | | | | | | | | | | | |
Shares sold | | | — | | | | — | | | | — | | | | — | | | | 72,627 | | | | 79,606 | |
Distributions reinvested | | | — | | | | — | | | | — | | | | — | | | | — | | | | 15,891 | |
Shares redeemed | | | — | | | | — | | | | — | | | | — | | | | (89,614 | ) | | | (86,526 | ) |
| | | | | | | | | | | | | | | | | | | | | | | | |
Net Class R Share Activity | | | — | | | | — | | | | — | | | | — | | | | (16,987 | ) | | | 8,971 | |
| | | | | | | | | | | | | | | | | | | | | | | | |
| * | The U.S. Ultra Micro Cap Fund commenced operations on January 28, 2008. |
| ** | The U.S. Small to Mid Cap Growth Fund commenced operations on July 31, 2007. |
See Accompanying Notes to Financial Statements.
66
| | | | | | | | | | | | | | | | | | | | | | | | | | |
U.S. Small to
Mid Cap Growth | | | U.S. Systematic
Large Cap Growth | | | U.S. Convertible | | | Global Equity
130/30 | |
| 2009 | | | 2008** | | | 2009 | | | 2008 | | | 2009 | | | 2008 | | | 2009 | |
| | | | | | | | | | | | | | | | | | | | | | | | | | |
| $ | (18,408 | ) | | $ | (17,854 | ) | | $ | 48,672 | | | $ | (17,588 | ) | | $ | 6,993,667 | | | $ | 3,307,246 | | | $ | (5,273 | ) |
| | (1,672,761 | ) | | | (320,604 | ) | | | (1,713,044 | ) | | | 1,142,381 | | | | (22,074,355 | ) | | | 2,428,013 | | | | (865,994 | ) |
| | (257,128 | ) | | | (183,249 | ) | | | (1,284,603 | ) | | | (1,503,590 | ) | | | (49,650,857 | ) | | | (8,015,589 | ) | | | (934,553 | ) |
| | | | | | | | | | | | | | | | | | | | | | | | | | | |
| | (1,948,297 | ) | | | (521,707 | ) | | | (2,948,975 | ) | | | (378,797 | ) | | | (64,731,545 | ) | | | (2,280,330 | ) | | | (1,805,820 | ) |
| | | | | | | | | | | | | | | | | | | | | | | | | | | |
| | | | | | | | | | | | | | | | | | | | | | | | | | |
| | | | | | | | | | | | | | | | | | | | | | | | | | |
| | — | | | | — | | | | — | | | | — | | | | (477,679 | ) | | | (514,906 | ) | | | — | |
| | — | | | | — | | | | — | | | | (16,091 | ) | | | (621,794 | ) | | | (122,122 | ) | | | — | |
| | — | | | | — | | | | — | | | | — | | | | (5,559,726 | ) | | | (2,605,259 | ) | | | — | |
| | — | | | | — | | | | — | | | | — | | | | — | | | | — | | | | — | |
| | | | | | | | | | | | | | | | | | | | | | | | | | |
| | — | | | | — | | | | — | | | | — | | | | (107,496 | ) | | | (150,355 | ) | | | — | |
| | — | | | | — | | | | — | | | | — | | | | (237,582 | ) | | | (38,002 | ) | | | — | |
| | — | | | | — | | | | — | | | | — | | | | (1,514,785 | ) | | | (710,833 | ) | | | — | |
| | — | | | | — | | | | — | | | | — | | | | — | | | | — | | | | — | |
| | | | | | | | | | | | | | | | | | | | | | | | | | |
| | | | | | | | | | | | | | | | | | | | | | | | | | | |
| | — | | | | — | | | | — | | | | (16,091 | ) | | | (8,519,062 | ) | | | (4,141,477 | ) | | | — | |
| | | | | | | | | | | | | | | | | | | | | | | | | | | |
| | | | | | | | | | | | | | | | | | | | | | | | | | |
| | 188,770 | | | | 5,383,713 | | | | 64,726 | | | | 106,984 | | | | 18,412,911 | | | | 15,784,572 | | | | 4,156,230 | |
| | — | | | | — | | | | (400 | ) | | | 2,468,812 | | | | 41,196,161 | | | | 965,357 | | | | — | |
| | — | | | | — | | | | — | | | | — | | | | 53,965,866 | | | | 164,185,347 | | | | — | |
| | — | | | | — | | | | 329,609 | | | | 486,815 | | | | — | | | | — | | | | — | |
| | | | | | | | | | | | | | | | | | | | | | | | | | |
| | — | | | | — | | | | — | | | | — | | | | 568,643 | | | | 654,378 | | | | — | |
| | — | | | | — | | | | — | | | | 16,091 | | | | 859,376 | | | | 160,124 | | | | — | |
| | — | | | | — | | | | — | | | | — | | | | 35,016 | | | | 4,685 | | | | — | |
| | — | | | | — | | | | — | | | | — | | | | — | | | | — | | | | — | |
| | | | | | | | | | | | | | | | | | | | | | | | | | |
| | — | | | | — | | | | (90,716 | ) | | | (262,579 | ) | | | (43,467,945 | ) | | | (9,010,639 | ) | | | (27,849 | ) |
| | — | | | | — | | | | (7,520,810 | ) | | | (1,650,704 | ) | | | (10,541,032 | ) | | | — | | | | — | |
| | — | | | | — | | | | — | | | | — | | | | — | | | | (127,582 | ) | | | — | |
| | — | | | | — | | | | (792,263 | ) | | | (571,886 | ) | | | — | | | | — | | | | — | |
| | | | | | | | | | | | | | | | | | | | | | | | | | | |
| | | | | | |
| | 188,770 | | | | 5,383,713 | | | | (8,009,854 | ) | | | 593,733 | | | | 61,028,996 | | | | 172,616,242 | | | | 4,128,381 | |
| | | | | | | | | | | | | | | | | | | | | | | | | | | |
| | (1,759,527 | ) | | | 4,862,006 | | | | (10,958,829 | ) | | | 198,845 | | | | (12,221,611 | ) | | | 166,194,435 | | | | 2,322,561 | |
| | | | | | | | | | | | | | | | | | | | | | | | | | |
| | 4,862,006 | | | | — | | | | 17,206,401 | | | | 17,007,556 | | | | 310,103,922 | | | | 143,909,487 | | | | — | |
| | | | | | | | | | | | | | | | | | | | | | | | | | | |
| $ | 3,102,479 | | | $ | 4,862,006 | | | $ | 6,247,572 | | | $ | 17,206,401 | | | $ | 297,882,311 | | | $ | 310,103,922 | | | $ | 2,322,561 | |
| | | | | | | | | | | | | | | | | | | | | | | | | | | |
| | | | | | |
| $ | — | | | $ | — | | | $ | 48,672 | | | $ | — | | | $ | 373,877 | | | $ | 41,918 | | | $ | — | |
| | | | | | | | | | | | | | | | | | | | | | | | | | | |
| | | | | | | | | | | | | | | | | | | | | | | | | | |
| | 32,886 | | | | 539,027 | | | | 4,483 | | | | 5,151 | | | | 875,435 | | | | 630,900 | | | | 415,977 | |
| | — | | | | — | | | | — | | | | — | | | | 27,942 | | | | 25,119 | | | | — | |
| | — | | | | — | | | | (5,503 | ) | | | 12,161 | | | | (1,736,645 | ) | | | (338,123 | ) | | | (4,664 | ) |
| | | | | | | | | | | | | | | | | | | | | | | | | | | |
| | 32,886 | | | | 539,027 | | | | (1,020 | ) | | | (7,010 | ) | | | (833,268 | ) | | | 317,896 | | | | 411,313 | |
| | | | | | | | | | | | | | | | | | | | | | | | | | | |
| | | | | | | | | | | | | | | | | | | | | | | | | | |
| | — | | | | — | | | | (21 | ) | | | 113,463 | | | | 1,621,749 | | | | 36,196 | | | | — | |
| | — | | | | — | | | | — | | | | 704 | | | | 45,437 | | | | 6,118 | | | | — | |
| | — | | | | — | | | | (371,830 | ) | | | (75,329 | ) | | | (478,652 | ) | | | — | | | | — | |
| | | | | | | | | | | | | | | | | | | | | | | | | | | |
| | — | | | | — | | | | (371,851 | ) | | | 38,838 | | | | 1,188,534 | | | | 42,314 | | | | — | |
| | | | | | | | | | | | | | | | | | | | | | | | | | | |
| | | | | | | | | | | | | | | | | | | | | | | | | | |
| | — | | | | — | | | | — | | | | — | | | | 2,843,254 | | | | 6,197,172 | | | | — | |
| | — | | | | — | | | | — | | | | — | | | | 1,837 | | | | 180 | | | | — | |
| | — | | | | — | | | | — | | | | — | | | | — | | | | (4,794 | ) | | | — | |
| | | | | | | | | | | | | | | | | | | | | | | | | | | |
| | — | | | | — | | | | — | | | | — | | | | 2,845,091 | | | | 6,192,558 | | | | — | |
| | | | | | | | | | | | | | | | | | | | | | | | | | | |
| | | | | | | | | | | | | | | | | | | | | | | | | | |
| | — | | | | — | | | | 20,763 | | | | 23,608 | | | | — | | | | — | | | | — | |
| | — | | | | — | | | | — | | | | — | | | | — | | | | — | | | | — | |
| | — | | | | — | | | | (51,985 | ) | | | (27,157 | ) | | | — | | | | — | | | | — | |
| | | | | | | | | | | | | | | | | | | | | | | | | | | |
| | — | | | | — | | | | (31,222 | ) | | | (3,549 | ) | | | — | | | | — | | | | — | |
| | | | | | | | | | | | | | | | | | | | | | | | | | | |
67
NICHOLAS-APPLEGATE INSTITUTIONAL FUNDS
STATEMENTSOF CHANGESIN NET ASSETS
| | | | | | | | | | | | | | | | |
| | | Global Select | | | International Growth Opportunities | |
Years Ended March 31 | | 2009 | | | 2008 | | | 2009 | | | 2008 | |
Increase (Decrease) in Net Assets | | | | | | | | | | | | | | | | |
Net investment income (loss) | | $ | 331,247 | | | $ | 753,296 | | | $ | 1,033,056 | | | $ | 839,340 | |
Net realized gain (loss) | | | (9,604,900 | ) | | | 32,195,785 | | | | (29,386,784 | ) | | | 68,324,600 | |
Net unrealized appreciation (depreciation) | | | (9,529,140 | ) | | | (15,140,580 | ) | | | (38,245,341 | ) | | | (46,775,990 | ) |
| | | | | | | | | | | | | | | | |
Investment operations | | | (18,802,793 | ) | | | 17,808,501 | | | | (66,599,069 | ) | | | 22,387,950 | |
| | | | | | | | | | | | | | | | |
Distributions to Shareholders: | | | | | | | | | | | | | | | | |
From net investment income | | | | | | | | | | | | | | | | |
Class I | | | (927,999 | ) | | | (612,353 | ) | | | — | | | | (2,374,268 | ) |
Class II | | | (115,238 | ) | | | (2,152 | ) | | | — | | | | (69,543 | ) |
Class III | | | — | | | | — | | | | — | | | | — | |
Class IV | | | — | | | | — | | | | — | | | | — | |
From net realized gains | | | | | | | | | | | | | | | | |
Class I | | | (23,253,999 | ) | | | (14,408,538 | ) | | | (10,682,297 | ) | | | (36,837,182 | ) |
Class II | | | (7,666,149 | ) | | | (5,564,143 | ) | | | (450,051 | ) | | | (3,939,300 | ) |
Class III | | | — | | | | — | | | | (3,457,540 | ) | | | (12,535 | ) |
Class IV | | | — | | | | — | | | | — | | | | — | |
From Capital Share Transactions: | | | | | | | | | | | | | | | | |
| | | | | | | | | | | | | | | | |
Total distributions | | | (31,963,385 | ) | | | (20,587,186 | ) | | | (14,589,888 | ) | | | (43,232,828 | ) |
| | | | | | | | | | | | | | | | |
Proceeds from shares sold | | | | | | | | | | | | | | | | |
Class I | | | 3,419,045 | | | | 3,385,644 | | | | 26,847,095 | | | | 60,762,777 | |
Class II | | | 3,565,280 | | | | 2,410,773 | | | | 12,108,095 | | | | 1,218,257 | |
Class III | | | — | | | | — | | | | 25,556,793 | | | | 45,968 | |
Class IV | | | — | | | | — | | | | — | | | | 26,893 | |
Distributions reinvested | | | | | | | | | | | | | | | | |
Class I | | | 22,886,619 | | | | 11,901,041 | | | | 10,572,511 | | | | 37,309,080 | |
Class II | | | 7,781,254 | | | | 5,566,296 | | | | 450,051 | | | | — | |
Class III | | | — | | | | — | | | | 3,457,540 | | | | 12,534 | |
Cost of shares redeemed | | | | | | | | | | | | | | | | |
Class I | | | (6,601,603 | ) | | | (51,776,128 | ) | | | (47,427,822 | ) | | | (52,627,289 | ) |
Class II | | | (3,907,251 | ) | | | (96,844,060 | ) | | | (9,046,524 | ) | | | (75,339,925 | ) |
Class III | | | — | | | | — | | | | — | | | | (5,460,800 | ) |
Class IV | | | — | | | | — | | | | — | | | | (75,746,255 | ) |
Shares exchanged | | | | | | | | | | | | | | | | |
Class II | | | — | | | | — | | | | — | | | | — | |
| | | | | | | | | | | | | | | | |
Net increase (decrease) in net assets from share transactions | | | 27,143,344 | | | | (125,356,434 | ) | | | 22,517,739 | | | | (109,798,760 | ) |
| | | | | | | | | | | | | | | | |
Net Increase (Decrease) in Net Assets | | | (23,622,834 | ) | | | (128,135,119 | ) | | | (58,671,218 | ) | | | (130,643,638 | ) |
Net Assets | | | | | | | | | | | | | | | | |
Beginning | | | 41,285,771 | | | | 169,420,890 | | | | 121,452,408 | | | | 252,096,046 | |
| | | | | | | | | | | | | | | | |
Ending | | $ | 17,662,937 | | | $ | 41,285,771 | | | $ | 62,781,190 | | | $ | 121,452,408 | |
| | | | | | | | | | | | | | | | |
Undistributed net investment income (loss), ending | | $ | 298,921 | | | $ | 1,041,786 | | | $ | 982,464 | | | $ | (863,873 | ) |
| | | | | | | | | | | | | | | | |
Class I — Capital Share Activity | | | | | | | | | | | | | | | | |
Shares sold | | | 3,371,929 | | | | 192,981 | | | | 1,091,824 | | | | 1,089,540 | |
Distributions reinvested | | | 45,906,774 | | | | 835,747 | | | | 621,547 | | | | 841,432 | |
Shares exchanged | | | — | | | | — | | | | — | | | | — | |
Shares redeemed | | | (5,907,624 | ) | | | (2,669,279 | ) | | | (2,101,210 | ) | | | (920,041 | ) |
| | | | | | | | | | | | | | | | |
Net Class I Share Activity | | | 43,371,079 | | | | (1,640,551 | ) | | | (387,839 | ) | | | 1,010,931 | |
| | | | | | | | | | | | | | | | |
Class II — Capital Share Activity | | | | | | | | | | | | | | | | |
Shares sold | | | 251,077 | | | | 114,030 | | | | 537,531 | | | | 20,169 | |
Distributions reinvested | | | 10,954,527 | | | | 382,826 | | | | 25,470 | | | | — | |
Shares exchanged | | | — | | | | — | | | | — | | | | — | |
Shares redeemed | | | (5,982,864 | ) | | | (4,713,094 | ) | | | (358,527 | ) | | | (1,099,006 | ) |
| | | | | | | | | | | | | | | | |
Net Class II Share Activity | | | 5,222,740 | | | | (4,216,238 | ) | | | 204,474 | | | | (1,078,837 | ) |
| | | | | | | | | | | | | | | | |
Class III — Capital Share Activity | | | | | | | | | | | | | | | | |
Shares sold | | | — | | | | — | | | | 765,180 | | | | 669 | |
Distributions reinvested | | | — | | | | — | | | | 195,562 | | | | 273 | |
Shares redeemed | | | — | | | | — | | | | — | | | | (82,580 | ) |
| | | | | | | | | | | | | | | | |
Net Class III Share Activity | | | — | | | | — | | | | 960,742 | | | | (81,638 | ) |
| | | | | | | | | | | | | | | | |
Class IV — Capital Share Activity | | | | | | | | | | | | | | | | |
Shares sold | | | — | | | | — | | | | — | | | | 402 | |
Distributions reinvested | | | — | | | | — | | | | — | | | | — | |
Shares redeemed | | | — | | | | — | | | | — | | | | (1,212,404 | ) |
| | | | | | | | | | | | | | | | |
Net Class IV Share Activity | | | — | | | | — | | | | — | | | | (1,212,002 | ) |
| | | | | | | | | | | | | | | | |
See Accompanying Notes to Financial Statements.
68
| | | | | | | | | | | | | | | | | | | | | | | | | | | | | | |
| Emerging Markets | | | International Systematic | | | International All Cap Growth | | | U.S. High Yield Bond | |
| 2009 | | | 2008 | | | 2009 | | | 2008 | | | 2009 | | | 2008 | | | 2009 | | | 2008 | |
| | | | | | | | | | | | | | | | | | | | | | | | | | | | | | |
| $ | 358,652 | | | $ | 266,966 | | | $ | 2,067,447 | | | $ | 1,558,184 | | | $ | 250,744 | | | $ | 181,081 | | | $ | 4,078,388 | | | $ | 5,120,757 | |
| | (11,667,294 | ) | | | 7,702,427 | | | | (39,416,288 | ) | | | (6,595,549 | ) | | | (5,033,601 | ) | | | 9,344,656 | | | | (3,328,327 | ) | | | (36,608 | ) |
| | 227,604 | | | | (419,728 | ) | | | (5,073,360 | ) | | | (7,581,342 | ) | | | (3,841,041 | ) | | | (4,606,291 | ) | | | (7,257,264 | ) | | | (6,230,507 | ) |
| | | | | | | | | | | | | | | | | | | | | | | | | | | | | | | |
| | (11,081,038 | ) | | | 7,549,665 | | | | (42,422,201 | ) | | | (12,618,707 | ) | | | (8,623,898 | ) | | | 4,919,446 | | | | (6,507,203 | ) | | | (1,146,358 | ) |
| | | | | | | | | | | | | | | | | | | | | | | | | | | | | | | |
| | | | | | | | | | | | | | | | | | | | | | | | | | | | | | |
| | | | | | | | | | | | | | | | | | | | | | | | | | | | | | |
| | (16,036 | ) | | | (14,063 | ) | | | (746,687 | ) | | | (362,782 | ) | | | (89,546 | ) | | | (289,056 | ) | | | (4,454,710 | ) | | | (4,645,370 | ) |
| | (62,553 | ) | | | (174,362 | ) | | | — | | | | (344,624 | ) | | | — | | | | — | | | | — | | | | (708,781 | ) |
| | — | | | | — | | | | (1,409,121 | ) | | | (685,445 | ) | | | — | | | | — | | | | — | | | | — | |
| | — | | | | — | | | | — | | | | — | | | | — | | | | — | | | | — | | | | — | |
| | | | | | | |
| | (404,993 | ) | | | (291,347 | ) | | | (4,064 | ) | | | (1,381,086 | ) | | | (1,561,939 | ) | | | (1,461,993 | ) | | | — | | | | — | |
| | (3,015,024 | ) | | | (4,120,846 | ) | | | (284 | ) | | | (1,380,699 | ) | | | — | | | | — | | | | — | | | | — | |
| | — | | | | — | | | | (7,178 | ) | | | (2,628,903 | ) | | | — | | | | — | | | | — | | | | — | |
| | — | | | | — | | | | — | | | | — | | | | — | | | | — | | | | — | | | | — | |
| | | | | | | | | | | | | | | | | | | | | | | | | | | | | | |
| | | | | | | | | | | | | | | | | | | | | | | | | | | | | | | |
| | (3,498,606 | ) | | | (4,600,618 | ) | | | (2,167,334 | ) | | | (6,783,539 | ) | | | (1,651,485 | ) | | | (1,751,049 | ) | | | (4,454,710 | ) | | | (5,354,151 | ) |
| | | | | | | | | | | | | | | | | | | | | | | | | | | | | | | |
| | | | | | | | | | | | | | | | | | | | | | | | | | | | | | |
| | 11,242,745 | | | | 2,500,423 | | | | 6,557,476 | | | | 28,313,307 | | | | 32,914,863 | | | | 3,445,406 | | | | 25,191,406 | | | | 15,112,012 | |
| | 11,246,474 | | | | 115,682 | | | | 1,672,727 | | | | 26,458,558 | | | | 6,757,109 | | | | — | | | | | | | | 57,244 | |
| | — | | | | — | | | | 3,024 | | | | 29,728 | | | | — | | | | — | | | | — | | | | — | |
| | — | | | | — | | | | — | | | | — | | | | — | | | | — | | | | — | | | | — | |
| | | | | | | |
| | 421,029 | | | | 305,410 | | | | 750,751 | | | | 1,681,704 | | | | 1,649,290 | | | | 1,751,051 | | | | 4,193,149 | | | | 4,260,974 | |
| | 3,077,577 | | | | 4,295,207 | | | | 284 | | | | 1,725,322 | | | | — | | | | — | | | | — | | | | 5,404 | |
| | — | | | | — | | | | 1,416,008 | | | | 3,314,349 | | | | — | | | | — | | | | — | | | | — | |
| | | | | | | |
| | (1,880,291 | ) | | | (54,413 | ) | | | (112,516 | ) | | | (4,245,485 | ) | | | (14,452,820 | ) | | | (24,851,609 | ) | | | (19,459,996 | ) | | | (27,693,992 | ) |
| | (1,000 | ) | | | (32,139,382 | ) | | | (22,510,707 | ) | | | (8,925,925 | ) | | | (16,827 | ) | | | — | | | | — | | | | (32,698,711 | ) |
| | — | | | | — | | | | (5,271 | ) | | | (66,872 | ) | | | — | | | | — | | | | — | | | | — | |
| | — | | | | — | | | | — | | | | — | | | | — | | | | — | | | | — | | | | — | |
| | | | | | | |
| | — | | | | — | | | | (157,007 | ) | | | — | | | | — | | | | — | | | | — | | | | — | |
| | | | | | | | | | | | | | | | | | | | | | | | | | | | | | | |
| | | | | | | | | | | | | | | | | | | | | | | | | | | | | | |
| | 24,106,534 | | | | (24,977,073 | ) | | | (12,385,231 | ) | | | 48,284,686 | | | | 26,851,615 | | | | (19,655,152 | ) | | | 9,924,559 | | | | (40,957,069 | ) |
| | | | | | | | | | | | | | | | | | | | | | | | | | | | | | | |
| | 9,526,890 | | | | (22,028,026 | ) | | | (56,974,766 | ) | | | 28,882,440 | | | | 16,576,232 | | | | (16,486,755 | ) | | | (1,037,354 | ) | | | (47,457,578 | ) |
| | | | | | | | | | | | | | | | | | | | | | | | | | | | | | |
| | 17,147,129 | | | | 39,175,155 | | | | 100,831,540 | | | | 71,949,100 | | | | 7,340,271 | | | | 23,827,026 | | | | 50,270,714 | | | | 97,728,292 | |
| | | | | | | | | | | | | | | | | | | | | | | | | | | | | | | |
| $ | 26,674,019 | | | $ | 17,147,129 | | | $ | 43,856,774 | | | $ | 100,831,540 | | | $ | 23,916,503 | | | $ | 7,340,271 | | | $ | 49,233,360 | | | $ | 50,270,714 | |
| | | | | | | | | | | | | | | | | | | | | | | | | | | | | | | |
| $ | 262,498 | | | $ | 78,571 | | | $ | 347,822 | | | $ | 413,930 | | | $ | 247,129 | | | $ | 89,535 | | | $ | 8,941 | | | $ | 243,250 | |
| | | | | | | | | | | | | | | | | | | | | | | | | | | | | | | |
| | | | | | | | | | | | | | | | | | | | | | | | | | | | | | |
| | 1,647,455 | | | | 160,501 | | | | 594,056 | | | | 1,688,592 | | | | 4,779,674 | | | | 244,259 | | | | 3,227,477 | | | | 1,521,238 | |
| | 77,681 | | | | 19,806 | | | | 96,746 | | | | 110,493 | | | | 269,492 | | | | 133,363 | | | | 523,672 | | | | 433,889 | |
| | — | | | | — | | | | 164,661 | | | | — | | | | — | | | | — | | | | — | | | | — | |
| | (267,836 | ) | | | (3,445 | ) | | | (8,156 | ) | | | (279,597 | ) | | | (2,523,359 | ) | | | (1,419,579 | ) | | | (2,469,177 | ) | | | (2,806,757 | ) |
| | | | | | | | | | | | | | | | | | | | | | | | | | | | | | | |
| | 1,457,300 | | | | 176,862 | | | | 847,307 | | | | 1,519,488 | | | | 2,525,807 | | | | (1,041,957 | ) | | | 1,281,972 | | | | (851,630 | ) |
| | | | | | | | | | | | | | | | | | | | | | | | | | | | | | | |
| | | | | | | | | | | | | | | | | | | | | | | | | | | | | | |
| | 1,790,959 | | | | 7,699 | | | | 164,800 | | | | 1,621,046 | | | | 1,268,477 | | | | — | | | | — | | | | 5,705 | |
| | 564,693 | | | | 278,367 | | | | 35 | | | | 113,210 | | | | — | | | | — | | | | — | | | | 386 | |
| | — | | | | — | | | | (157,007 | ) | | | — | | | | — | | | | — | | | | — | | | | — | |
| | (106 | ) | | | (2,261,227 | ) | | | (1,992,845 | ) | | | (544,129 | ) | | | — | | | | — | | | | — | | | | (3,305,489 | ) |
| | | | | | | | | | | | | | | | | | | | | | | | | | | | | | | |
| | 2,355,546 | | | | (1,975,161 | ) | | | (1,985,017 | ) | | | 1,190,127 | | | | 1,268,477 | | | | — | | | | — | | | | (3,299,398 | ) |
| | | | | | | | | | | | | | | | | | | | | | | | | | | | | | | |
| | | | | | | | | | | | | | | | | | | | | | | | | | | | | | |
| | — | | | | — | | | | 341 | | | | 1,938 | | | | — | | | | — | | | | — | | | | — | |
| | — | | | | — | | | | 182,240 | | | | 217,334 | | | | — | | | | — | | | | — | | | | — | |
| | — | | | | — | | | | (749 | ) | | | (3,906 | ) | | | — | | | | — | | | | — | | | | — | |
| | | | | | | | | | | | | | | | | | | | | | | | | | | | | | | |
| | — | | | | — | | | | 181,832 | | | | 215,366 | | | | — | | | | — | | | | — | | | | — | |
| | | | | | | | | | | | | | | | | | | | | | | | | | | | | | | |
| | | | | | | | | | | | | | | | | | | | | | | | | | | | | | |
| | — | | | | — | | | | — | | | | — | | | | — | | | | — | | | | — | | | | — | |
| | — | | | | — | | | | — | | | | — | | | | — | | | | — | | | | — | | | | — | |
| | — | | | | — | | | | — | | | | — | | | | — | | | | — | | | | — | | | | — | |
| | | | | | | | | | | | | | | | | | | | | | | | | | | | | | | |
| | — | | | | — | | | | — | | | | — | | | | — | | | | — | | | | — | | | | — | |
| | | | | | | | | | | | | | | | | | | | | | | | | | | | | | | |
69
NICHOLAS-APPLEGATE INSTITUTIONAL FUNDS
STATEMENTOF CASH FLOWS
| | | | |
For the year ended March 31, 2009 | | Global Equity
130/30 | |
Cash Flows from Operating Activities: | | | | |
Net decrease in assets from operations: | | $ | (1,805,820 | ) |
| |
Adjustments to reconcile net loss to net cash used in operating activities | | | | |
Purchase of investment securities | | | (7,167,400 | ) |
Proceeds from disposition of investment securities | | | 2,951,591 | |
Purchase of short term securities, net | | | (3,892 | ) |
Proceeds from securities sold short | | | 1,911,351 | |
Purchase to cover short positions | | | (1,788,915 | ) |
Increase in dividends and interest receivable | | | (7,951 | ) |
Increase in receivable for securities sold | | | (11,767 | ) |
Increase in unrealized appreciation on futures | | | (2,349 | ) |
Increase in foreign tax receivable | | | (1,270 | ) |
Increase in other assets | | | (21 | ) |
Increase in financing fee | | | 5,191 | |
Increase in investment advisor | | | 2,141 | |
Increase in other liabilities | | | 3,267 | |
Unrealized depreciation on securities and foreign cash | | | 936,843 | |
Net realized gain from investments | | | 863,705 | |
| | | | |
Net cash used in operating activities | | | (4,115,296 | ) |
| | | | |
| |
Cash Flows from Financing Activities: | | | | |
Proceeds from shares sold | | | 4,156,230 | |
Payment on shares redeemed | | | (27,849 | ) |
| | | | |
Net cash provided by financing activities | | | 4,128,381 | |
| | | | |
Net change in cash | | | 13,085 | |
| | | | |
Effects of Exchange Rate Change on Cash | | | (237 | ) |
| | | | |
| |
Cash, at beginning of period | | | — | |
| | | | |
Cash, at end of period | | $ | 12,848 | |
| | | | |
See Accompanying Notes to Financial Statements.
70
NICHOLAS-APPLEGATE INSTITUTIONAL FUNDS
NOTESTO FINANCIAL STATEMENTS
NOTE A — ORGANIZATION
Nicholas-Applegate Institutional Funds (the “Trust”) is an open-end investment management company. The Trust was established as a Delaware business trust on December 17, 1992 and consists of thirteen separate portfolios (collectively, the “Funds” and each, a “Fund”). Each Fund’s investment objectives, strategies and risks are discussed in the Funds’ current prospectuses. All of the Funds have issued Class I shares (“Class I”), six Funds have issued Class II shares (“Class II”), two Funds have issued Class III shares (“Class III”), one Fund has issued Class IV shares (“Class IV”) and two Funds have issued Retirement shares (“Class R”). No shares have a sales charge. Class R has a distribution fee. The Funds offering Class I, Class II, Class III and Class IV shares are covered in this report.
NOTE B — SIGNIFICANT ACCOUNTING POLICIES
Significant accounting policies consistently followed by the Funds in preparing these financial statements are described below. The policies conform with accounting principles generally accepted in the United States.
Security Valuations
Equity securities, including ADRs and GDRs, that are traded on a stock exchange or on the NASDAQ National Market System are valued at the last sale price as of the close of business on the New York Stock Exchange (normally 4:00 p.m. New York time) on the day the securities are being valued, or lacking any sales, at the mean between the closing bid and asked prices. Securities listed or traded on certain non-U.S. exchanges whose operations are similar to the United States over-the-counter market are valued at the price within the limits of the latest available current bid and asked prices deemed by the Adviser to best reflect fair value. A security that is listed or traded on more than one exchange is valued at the quotation on the exchange determined to be the primary market for such security by the Adviser. Equity Linked Notes (“ELN’s”) are valued by using the closing local price for the underlying security and applying the exchange rate for the currency to arrive at a USD equivalent.
Long-term debt obligations, including high quality and high yield corporate securities, municipal securities, asset backed securities, collateralized mortgage obligations and U.S. Government and Agency issues, are normally valued at the mean between the bid and ask price provided by an approved bond pricing service. In the event a TRACE price is used, the price is the last traded price on that day greater than or equal to 1mm par amount. Convertible securities are normally priced at a mean between the bid and ask prices. If such a security has a demand feature exercisable within one to seven days, the security is value at par. In the event that a pricing service does not price a particular security or the price is provided is not believed to be reliable, the Adviser will endeavor to use the average of one or two broker-dealer quotations. If broker-dealer quotations are not available, the Adviser generally “stales” the price. Short-term debt instruments, (e.g., commercial paper, bankers acceptances,
U.S. Treasury Bills, etc.) having a maturity of less than 60 days will be valued at amortized cost.
Securities or other assets for which reliable market quotations are not readily available or for which the pricing agent or principal market maker does not provide a valuation or methodology or provides a valuation or methodology that, in the judgment of the Adviser does not represent fair value (“Fair Value Securities”), are valued by the Adviser’s Pricing Committee overseen by the Board of Trustees in consultation as applicable, with the Adviser’s portfolio managers, investment analysts, and legal and compliance personnel. Fair Value Securities may include, but are not limited to, the following: certain private placements and restricted securities that do not have an active trading market; securities whose trading has been suspended or for which there is no current market; securities whose prices are stale; securities denominated in currencies that are restricted, untraded, or for which exchange rates are disrupted; securities affected by significant events; and securities that the Adviser’s Pricing Committee believes were pr iced incorrectly. A “significant event” (which includes, but is not limited to, an extraordinary political or market event) is an event that the Adviser’s Pricing Committee believes with a reasonably high degree of certainty has caused the closing market prices of a Fund’s portfolio securities to no longer reflect their value at the time of the Fund’s NAV calculation.
Security Transactions and Investment Income
Security transactions are accounted for as of trade date. Realized gains and losses from security transactions are determined on an identified-cost basis.
Dividend income is recorded on the ex-dividend date or, for certain non-U.S. securities, when the information becomes available to the Funds. Interest income is recorded on an accrual basis. Discounts and premiums on debt securities are accreted and amortized on the yield to maturity basis.
Non-U.S. Currency Transactions
At each net asset valuation date, the value of assets and liabilities denominated in non-U.S. currencies are translated into U.S. dollars using the current exchange rate at 11:00 a.m. Eastern Time against the U.S. dollar, as provided by an approved pricing service. Security transactions, income and expenses are converted at the prevailing exchange rate on the day of the event. The effect of changes in exchange rates on securities denominated in a non-U.S. currency is included with the net realized and unrealized gain or loss of the associated security. Foreign exchange rates are translated into U.S. dollars when the exchange rate is struck at the close of the London Stock Exchange. Other non-U.S. currency gains or losses are reported separately.
Certain Funds may use forward non-U.S. currency contracts to reduce their exposure to currency fluctuations of their non-U.S. securities. These contracts are commitments to purchase or sell a non-U.S. currency at a specified rate on a future date. When the contract is fulfilled or closed, gains or losses are realized. Until then, the gain or loss is included in unrealized appreciation or depreciation of investments. The contract
71
NICHOLAS-APPLEGATE INSTITUTIONAL FUNDS
NOTESTO FINANCIAL STATEMENTS — Continued
commitment is fully collateralized by cash or securities of the Fund. Non-U.S. denominated assets and forward currency contracts may involve more risks than U.S. transactions, including currency risk, political and economic risk, regulatory and market risk. Evaluating and monitoring such risk exposure is a part of the Funds’ management strategy. There were no such forward non-U.S. currency contracts at March 31, 2009.
Futures Contracts
Each Fund may enter into futures contracts involving non-U.S. currency, interest rates, securities, and securities indices for hedging purposes only. A futures contract obligates the seller of the contract to deliver and the purchaser of the contract to take delivery of the type of non-U.S. currency, financial instrument or security called for in the contract at a specified future time for a specified price. Upon entering into such a contract, a Fund is required to deposit and maintain as collateral such initial margin as required by the exchange on which the contract is traded. Pursuant to the contract, a Fund agrees to receive from or pay to the broker an amount equal to the daily fluctuations in the value of the contract. Such receipts or payments are known as variation margin and are recorded as unrealized gains or losses by the Fund. When the contract is closed, the Fund records a realized gain or loss equal to the difference between the value of the contract at the time it was opened and the value at the time it was closed.
Equity-Linked Securities
Certain Funds may purchase equity-linked securities, also known as participation notes, equity swaps, and zero strike calls and warrants. Equity-linked securities are primarily used by a Fund as an alternative means to more efficiently and effectively access the securities market of what is generally an emerging securities market. The Fund deposits an amount of cash with its custodian (or broker, if legally permitted) in an amount near or equal to the selling price of the underlying security in exchange for an equity linked security. Upon sale, the Fund receives cash from the broker or custodian equal to the value of the underlying security. Aside from market risk of the underlying securities, there is a risk of default by the counterparty to the transaction. In the event of insolvency of the counterparty, the Fund might be unable to obtain its expected benefit. In addition, while a Fund will seek to enter into such transactions only with parties which are capable of entering into closing transactions with the Fund, there can be no assurance that the Fund will be able to close out such a transaction with the counterparty or obtain an offsetting position with any counterparty, at any time prior to the end of the term of the underlying agreement. This may impair the Fund’s ability to enter into other transactions at a time when doing so might be advantageous.
Securities Lending
In order to generate expense offset credits, each of the Funds may lend portfolio securities, on a short-term or a long-term basis, up to 30% of a Fund’s total assets. The loans are secured by collateral in the form of cash, cash equivalents, U.S. government and agency securities equal to at least 102% of the market value of securities loaned on U.S. securities and 105% of the market value loaned on non-U.S. securities.
During the term of the loan, the Funds will continue to receive any interest, dividends or amounts equivalent thereto, on the loaned securities while receiving a fee from the borrower and/or earning interest on the investment of the cash collateral. Upon termination of the loan, the borrower will return to the lender securities identical to the loaned securities. The Funds may pay reasonable finders’, administration and custodial fees in connection with a loan of its securities and may share the interest earned on the collateral with the borrower.
The Funds bear the risk of delay in recovery of, or even loss of rights in the securities loaned should the borrower of the securities fail financially. The Funds also bear the risk of loss in the event the securities purchased with cash collateral depreciate in value. Loans are subject to termination at the option of the borrower or the Fund. The market value of securities on loan and the related collateral at March 31, 2009 were:
| | | | | | |
Fund | | Market Value | | Collateral |
U.S. Micro Cap | | $ | 3,943,619 | | $ | 4,061,615 |
U.S. Systematic Large Cap Growth | | | 166,564 | | | 170,100 |
Credit Facility
The Trust has a $15 million credit facility available to fund temporary or emergency borrowing expiring in March 2010. Each Fund pays its pro-rata share of an annual commitment fee plus interest on its specific borrowings. For the year ended March 31, 2009, the Funds did not borrow against the line of credit.
Commitments and Contingencies
In the normal course of business, the Funds may enter into contracts and agreements that contain a variety of representations and warranties which provide general indemnifications. The maximum exposure to the Funds under these arrangements is unknown, as this would involve future claims that may be made against the Funds that have not yet occurred. However, based on experience, the Funds expect the risks of loss to be remote.
Fund Expenses and Multi-Class Allocations
Each Fund bears expenses incurred specifically on its behalf plus an allocation of its share of Trust level expenses. Each share offered by a Fund has equal rights to assets but incurs certain Class specific expenses. The Funds allocate income, gains and losses, both realized and unrealized, and expenses, except for Class specific expenses, based on the relative net assets of each share class.
During the year ended March 31, 2009, many of the brokers with whom the Adviser places trades on behalf of the Funds provided services to the Funds in addition to trade execution. These services included payments of certain expenses on behalf of the Funds. In addition, through arrangements with the Funds’ custodian, credits realized as a result of uninvested cash balances were used to reduce the Funds’ expenses.
During the period ended March 31, 2009, the credits used to reduce the Funds’ expenses were:
| | | | | | |
Fund | | Credit
Interest
Offset | | Direct
Brokerage
Offset | | Security
Lending
Offset |
U.S. Ultra Micro Cap | | 562 | | 634 | | — |
U.S. Micro Cap | | 15,739 | | 66,102 | | 281,619 |
U.S. Emerging Growth | | 3,165 | | 11,066 | | 17,244 |
U.S. Small to Mid Cap Growth | | 1,297 | | 5,529 | | — |
U.S. Systematic Large Cap Growth | | 2,576 | | 1,391 | | 538 |
U.S. Convertible | | 148,264 | | — | | — |
Global Equity 130/30 | | 623 | | — | | — |
Global Select | | 14,491 | | 34,690 | | 33,569 |
International Growth Opportunities | | 47,905 | | 65,116 | | 134,925 |
Emerging Markets | | 6,390 | | 5,083 | | 18,372 |
International Systematic | | 55,473 | | 19,737 | | 34,005 |
International All Cap Growth | | 6,543 | | 13,826 | | 8,773 |
U.S. High Yield Bond | | 15,047 | | — | | — |
Use of Estimates
The preparation of financial statements in conformity with accounting principles generally accepted in the United States requires management to make estimates and assumptions that affect the amounts reported in the financial statements and accompanying notes. Actual results could differ from these estimates.
NOTE C — FEDERAL INCOME TAXES
The Funds intend to comply with the requirements of the Internal Revenue Code applicable to regulated investment companies and to distribute substantially all of their taxable income to shareholders. Accordingly, no provision for federal income taxes is required. A Fund investing in foreign securities records any foreign taxes on income and gains on such investments in accordance with the applicable tax rules. The Funds’ tax accounting treatment of loss deferrals, accretion, passive foreign investment companies and expiration of capital loss carryforwards are different from the financial statement recognition of income and gains.
Capital loss carryforwards may be used to offset current or future capital gains until expiration.
Income Tax Status
In June 2006, the Financial Accounting Standards Board (“FASB”) issued Interpretation No. 48, Accounting for Uncertainty in Income Taxes — an Interpretation of FASB Statement No. 109 (“FIN 48”), which applies to all registered investment companies and clarifies the accounting for uncertain tax positions. FIN 48 requires the evaluation of tax positions taken, or expected to be taken, in the course of preparing the Fund’s tax returns to determine whether the tax positions are “more-likely-than-not” of being sustained by the applicable tax authority. To the extent that a tax benefit of a position is not deemed to meet the more-likely-than-not threshold, the Funds would report an income tax expense in the Statement of Operations. FIN 48 was effective for fiscal years beginning after December 15, 2006. Accordingly, management has evaluated tax positions for each of the four open tax years as of March 31, 2009 and has determined that the implementation of FIN 48 did not have a material impact on the Funds’ financial statements. Also, the Funds do not have a liability for any unrecognized tax benefits. The Funds recognize interest and penalties, if any, related to unrecognized tax benefits as income tax expense in the Statements of Operations. During the year, the Funds did not incur any interest or penalties. The Funds’ federal tax returns for the prior three fiscal years remain subject to examination by the Internal Revenue Service.
Distributions to Shareholders
The Funds record distributions to shareholders on the ex-dividend date. Distributions are determined in accordance with income tax regulations that may differ from generally accepted accounting principles. Accordingly, the Funds’ capital accounts are periodically reclassified to reflect income and gains available for distribution under income tax regulations. The Funds make income and capital gain distributions at least annually. Funds with income objectives make distributions either quarterly or monthly in accordance with the prospectuses. Due to the concentrated shareholder base, a Fund at any time may be categorized for tax purposes as a Personal Holding Company (PHC) as defined under section 542 of the Internal Revenue Code.
73
NICHOLAS-APPLEGATE INSTITUTIONAL FUNDS
NOTESTO FINANCIAL STATEMENTS — Continued
The tax characters of distributions paid during the fiscal year ended March 31, 2009 were as follows:
| | | | | | | | |
| | | Distribution paid from: |
Fund | | Ordinary
Income | | Net
long term
capital gain | | Total
taxable
distributions | | Total
distributions
paid(1) |
U.S. Ultra Micro Cap | | — | | — | | — | | — |
U.S. Micro Cap | | 18,218 | | — | | 18,218 | | 18,218 |
U.S. Emerging Growth | | — | | — | | — | | — |
U.S. Small to Mid Cap Growth | | — | | — | | — | | — |
U.S. Systematic Large Cap Growth | | — | | — | | — | | — |
U.S. Convertible | | 7,466,553 | | 1,052,509 | | 8,519,062 | | 8,519,062 |
Global Equity 130/30 | | — | | — | | — | | — |
Global Select | | 11,418,240 | | 20,545,145 | | 31,963,385 | | 31,963,385 |
International Growth Opportunities | | 5,778,238 | | 8,811,650 | | 14,589,888 | | 14,589,888 |
Emerging Markets | | 3,315,152 | | 183,454 | | 3,498,606 | | 3,498,606 |
International Systematic | | 2,167,334 | | — | | 2,167,334 | | 2,167,334 |
International All Cap Growth | | 224,696 | | 1,426,789 | | 1,651,485 | | 1,651,485 |
U.S. High Yield Bond | | 4,454,710 | | — | | 4,454,710 | | 4,454,710 |
The tax characters of distributions paid during the fiscal year or period ended March 31, 2008 were as follows:
| | | | | | | | |
| | | Distribution paid from: |
Fund | | Ordinary
Income | | Net
long term
capital gain | | Total
taxable
distributions | | Total
distributions
paid(1) |
U.S. Ultra Micro Cap* | | — | | — | | — | | — |
U.S. Micro Cap | | 2,775,867 | | 7,119,776 | | 9,895,643 | | 9,895,643 |
U.S. Emerging Growth | | — | | 745,409 | | 745,409 | | 745,409 |
U.S. Small to Mid Cap Growth | | — | | — | | — | | — |
U.S. Systematic Large Cap Growth | | 16,091 | | — | | 16,091 | | 16,091 |
U.S. Convertible | | 3,242,287 | | 899,190 | | 4,141,477 | | 4,141,477 |
Global Select | | 7,863,884 | | 12,723,302 | | 20,587,186 | | 20,587,186 |
International Growth Opportunities | | 18,430,532 | | 24,802,296 | | 43,232,828 | | 43,232,828 |
Emerging Markets | | 4,535,495 | | 65,123 | | 4,600,618 | | 4,600,618 |
International Systematic | | 6,301,754 | | 481,785 | | 6,783,539 | | 6,783,539 |
International All Cap Growth | | 289,056 | | 1,461,993 | | 1,751,049 | | 1,751,049 |
U.S. High Yield Bond | | 5,354,151 | | — | | 5,354,151 | | 5,354,151 |
| * | U.S. Ultra Micro Cap commenced operations January 28, 2008. |
74
As of March 31, 2009, the components of accumulated earnings/(deficit) on a tax basis were as follows:
| | | | | | | | | | | | | | | |
| | | Components of accumulated earnings/(deficit): | |
Fund | | Undistributed
ordinary
income | | Undistributed
long-term
capital gains | | Accumulated
earnings | | Accumulated
capital and
other losses | | | Unrealized
appreciation/
(depreciation) | | | Total
Accumulated
earning/
(deficit) | |
U.S. Ultra Micro Cap | | — | | — | | — | | (484,725 | )(2) | | (188,450 | )(3) | | (673,175 | ) |
U.S. Micro Cap | | — | | — | | — | | (16,050,215 | )(2) | | (9,091,082 | )(3) | | (25,141,297 | ) |
U.S. Emerging Growth | | — | | — | | — | | (8,727,344 | )(2) | | (2,269,331 | )(3) | | (10,996,675 | ) |
U.S. Small to Mid Cap Growth | | — | | — | | — | | (1,922,601 | )(2) | | (511,141 | )(3) | | (2,433,742 | ) |
U.S. Systematic Large Cap Growth | | 48,672 | | — | | — | | (8,689,848 | )(2) | | (837,989 | )(3) | | (9,479,165 | ) |
U.S. Convertible | | 525,406 | | — | | — | | (26,461,367 | )(2) | | (50,815,399 | )(3) | | (76,751,360 | ) |
Global Equity 130/30 | | — | | — | | — | | (851,512 | )(2) | | (951,224 | )(3) | | (1,802,736 | ) |
Global Select | | 298,921 | | — | | — | | (11,693,093 | )(2) | | (3,824,507 | )(3) | | (15,218,679 | ) |
International Growth Opportunities | | 1,034,725 | | — | | — | | (48,215,187 | )(2) | | (25,123,311 | )(3) | | (72,303,773 | ) |
Emerging Markets | | 262,497 | | — | | — | | (10,334,638 | )(2) | | (794,149 | )(3) | | (10,866,290 | ) |
International Systematic | | 353,889 | | — | | — | | (45,994,113 | )(2) | | (9,852,219 | )(3) | | (55,492,443 | ) |
International All Cap Growth | | 247,128 | | — | | — | | (7,708,268 | )(2) | | (5,094,051 | )(3) | | (12,555,191 | ) |
U.S. High Yield Bond | | 132,534 | | — | | — | | (7,619,779 | )(2) | | (9,717,167 | )(3) | | (17,204,412 | ) |
| (1) | Total distributions paid differ from the Statement of Changes in Net Assets because for tax purposes, dividends are recognized when actually paid. |
| (2) | The following Funds had net capital loss carryforwards of approximately: |
| | | | | | |
Fund | | Net Capital Loss
CarryForward
(in 000’s) | | Expiration | | Post October
Losses
(in 000’s) |
U.S. Ultra Micro Cap | | 157 | | March 31, 2017 | | 328 |
U.S. Micro Cap | | 6,420 | | March 31, 2017 | | 9,630 |
U.S. Emerging Growth | | 1,673 | | March 31, 2017 | | 2,201 |
| | 1,030 | | March 31, 2011 | | |
| | 3,824 | | March 31, 2010 | | |
U.S. Small to Mid Cap Growth | | 777 | | March 31, 2017 | | 1,046 |
| | 99 | | March 31, 2012 | | |
U.S. Systematic Large Cap Growth | | 122 | | March 31, 2017 | | 1,828 |
| | 314 | | March 31, 2012 | | |
| | 2,671 | | March 31, 2011 | | |
| | 3,754 | | March 31, 2010 | | |
U.S. Convertible | | 11,402 | | March 31, 2017 | | 9,632 |
| | 5,427 | | March 31, 2011 | | |
Global Equity 130/30 | | 368 | | March 31, 2017 | | 483 |
Global Select | | 3,089 | | March 31, 2017 | | 6,445 |
| | 1,079 | | March 31, 2011 | | |
| | 1,079 | | March 31, 2010 | | |
International Growth Opportunities | | 13,102 | | March 31, 2017 | | 15,379 |
| | 19,734 | | March 31, 2011 | | |
Emerging Markets | | 5,159 | | March 31, 2017 | | 5,175 |
75
NICHOLAS-APPLEGATE INSTITUTIONAL FUNDS
NOTESTO FINANCIAL STATEMENTS — Continued
| | | | | | |
Fund | | Net Capital Loss
CarryForward
(in 000’s) | | Expiration | | Post October
Losses
(in 000’s) |
International Systematic | | 32,031 | | March 31, 2017 | | 13,963 |
International All Cap Growth | | 818 | | March 31, 2017 | | 2,310 |
| | 1,527 | | March 31, 2011 | | |
| | 3,053 | | March 31, 2010 | | |
U.S. High Yield Bond | | 2,302 | | March 31, 2017 | | 1,761 |
| | 3,557 | | March 31, 2010 | | |
To the extent future capital gains are offset by capital loss carryforwards, such gains will not be distributed. The availability of loss carryforwards to any future years may be substantially limited as a result of past or future ownership changes as determined under Internal Revenue Code Section 382.
Net capital losses incurred after October 31, and within the taxable year are deemed to arise on the first business day of the Fund’s next taxable year. For the year ended March 31, 2009, the Fund deferred to April 1, 2009, post October capital and currency losses.
| (3) | The difference between book-basis and tax-basis unrealized appreciation/(depreciation) is attributable primarily to the tax deferral of losses on wash sales. |
NOTE D — TRANSACTIONS WITH AFFILIATES
Investment Advisory Fee
The Adviser receives a monthly fee at an annual rate based on the average daily net assets of the Funds. The Investment Advisory Fee rates for each of the Funds are listed in the table below.
Administrative & Shareholder Services Fee
On January 24, 2006, the Funds entered into an Administration Agreement whereby the Funds pay for the administrative services they require under what is essentially an all-in fee structure. Class I, II, III & IV shareholders of the Funds pay an administrative fee to the Adviser computed as a percentage of the Funds’ average net assets attributable in the aggregate to Class I, II, III & IV shares. The Adviser, in turn, provides or procures administrative and shareholder services for Class I, II, III & IV shareholders and also bears the costs of most third-party administrative services required by the Funds, including audit, custodial, portfolio accounting, legal, transfer agency and printing costs. The administrative fees paid to the Adviser may exceed the related costs.
The investment advisory and administrative services fees are charged at the following annual rates:
| | | | | | | | | | | | | | | |
| | | Advisory Fee | | | Administration Fee* | |
Fund | | | | | Class I | | | Class II | | | Class III | | | Class IV | |
U.S. Ultra Micro Cap | | 1.50 | % | | 0.73 | % | | — | | | — | | | — | |
U.S. Micro Cap | | 1.00 | % | | 0.54 | % | | — | | | — | | | — | |
U.S. Emerging Growth | | 0.75 | % | | 0.41 | % | | — | | | — | | | — | |
U.S. Small to Mid Cap Growth | | 0.50 | % | | 0.40 | % | | — | | | — | | | — | |
U.S. Systematic Large Cap Growth | | 0.45 | % | | 0.64 | % | | 0.49 | % | | — | | | — | |
U.S. Convertible | | 0.55 | % | | 0.44 | % | | 0.34 | % | | — | | | 0.19 | % |
Global Equity 130/30 | | 1.10 | % | | 0.67 | % | | — | | | — | | | — | |
Global Select | | 0.65 | % | | 0.47 | % | | 0.42 | % | | — | | | — | |
International Growth Opportunities | | 0.70 | % | | 0.69 | % | | 0.54 | % | | 0.49 | %(1) | | — | |
Emerging Markets | | 0.90 | % | | 0.42 | % | | 0.32 | % | | — | | | — | |
International Systematic | | 0.50 | % | | 0.48 | % | | 0.33 | % | | 0.23 | % | | — | |
International All Cap Growth | | 0.85 | % | | 0.27 | % | | 0.12 | %(2) | | — | | | — | |
U.S. High Yield Bond | | 0.40 | % | | 0.20 | % | | — | | | — | | | — | |
| * | Excludes trustees’ fees and expenses, tax, brokerage and interest expenses, and extraordinary expenses. |
76
Affiliated Securities Lending Fees
The U.S. Micro Cap and U.S. Systematic Large Cap Growth Fund participate in an agency securities lending program with an affiliated agent, Dresdner Bank AG, a direct subsidiary to Allianz AG and affiliate to the Trust (“Dresdner Program”). Income generated from the investment of cash collateral, less negotiated rebate fees paid to borrowers and transaction costs, is divided pursuant to the Dresdner Program Agency Agreement between the Funds and Dresdner Bank AG. The amount paid to Dresdner Bank AG for the year ended March 31, 2009 was $60,149. Cash collateral received for securities on loan is invested in securities identified in the Schedules of Investments and the corresponding liability is recognized as such in the Statements of Assets and Liabilities.
Trustee Compensation
Certain officers of the Trust are also officers of the Investment Adviser and the Distributor. During the year ended March 31, 2009, the Trustees who were not affiliated with the Investment Adviser received aggregate annual compensation of $188,750 from the Trust. The Trustees who are not affiliated with the Investment Adviser and attended all scheduled meetings would receive annual compensation of approximately $36,000 each from the Trust, except for the chairman of the Board of Trustees of the Trust and the chairman of the Audit Committee, who would receive annual compensation of approximately $42,000 and $42,500, respectively, from the Trust.
NOTE E — INVESTMENT TRANSACTIONS
The following table presents purchases and sales of securities, excluding short-term investments, during the year ended March 31, 2009, to indicate the volume of transactions in each Fund. The tax cost of securities held at March 31, 2009, and the related gross and net unrealized appreciation and depreciation, provide aggregate information on a tax basis against which future gains and losses on these investments are measured for distribution purposes.
| | | | | | | | | | | | | | | | | | | | | |
Fund | | Purchases
(in 000’s) | | Sales
(in 000’s) | | | Tax Cost
(in 000’s) | | Gross
Unrealized
Appreciation
(in 000’s) | | Gross
Unrealized
Depreciation
(in 000’s) | | | Net
Unrealized
Appreciation
(Depreciation)
(in 000’s) | |
U.S. Ultra Micro Cap | | $ | 2,212 | | $ | 1,406 | | | $ | 1,312 | | $ | 95 | | $ | (284 | ) | | $ | (189 | ) |
U.S. Micro Cap | | | 58,661 | | | 55,475 | | | | 53,237 | | | 3,094 | | | (12,185 | ) | | | (9,091 | ) |
U.S. Emerging Growth | | | 17,538 | | | 14,169 | | | | 10,355 | | | — | | | (2,269 | ) | | | (2,269 | ) |
U.S. Small to Mid Cap Growth | | | 7,668 | | | 7,388 | | | | 3,593 | | | 191 | | | (702 | ) | | | (511 | ) |
U.S. Systematic Large Cap Growth | | | 11,372 | | | 18,946 | | | | 7,354 | | | 294 | | | (1,132 | ) | | | (838 | ) |
U.S. Convertible | | | 316,749 | | | 255,562 | | | | 350,856 | | | 3,241 | | | (54,056 | ) | | | (50,815 | ) |
Global Equity 130/30 | | | 8,956 | | | 4,863 | (1) | | | 3,250 | | | 71 | | | (1,022 | ) | | | (951 | ) |
Global Select | | | 37,570 | | | 41,288 | | | | 21,351 | | | 1,004 | | | (4,829 | ) | | | (3,825 | ) |
International Growth Opportunities | | | 106,738 | | | 95,601 | | | | 87,231 | | | 2,966 | | | (28,089 | ) | | | (25,123 | ) |
Emerging Markets | | | 53,126 | | | 31,818 | | | | 27,378 | | | 1,830 | | | (2,624 | ) | | | (794 | ) |
International Systematic | | | 144,734 | | | 153,425 | | | | 54,284 | | | 1,556 | | | (11,408 | ) | | | (9,852 | ) |
International All Cap Growth | | | 37,254 | | | 12,906 | | | | 28,397 | | | 353 | | | (5,447 | ) | | | (5,094 | ) |
U.S. High Yield Bond | | | 33,286 | | | 24,892 | | | | 58,584 | | | 269 | | | (9,986 | ) | | | (9,717 | ) |
| (1) | The value of short sales for the Global Equity 130/30 Fund for the fiscal year was $1,911,351. |
Gains and losses resulting from the redemptions-in-kind are included in the realized gain/loss from securities. During the year ended March 31, 2009, the Global Equity 130/30 Fund, U.S. Micro Cap Fund and the International All Cap Growth Fund had subscriptions-in kinds valued at $3,815,014, $2,931,699, $7,936,219, respectively. The International Systematic and U.S. Systematic Large Cap Growth Funds had redemptions-in-kind valued at $15,080,684 and $3,684,000, respectively. In conjunction with the redemption-in-kind, the International Systematic Fund had a realized loss of $2,574,491 and U.S. Systematic Large Cap Growth Fund had realized gain of $228,400.
NOTE F — FINANCIAL INSTRUMENTS
The Funds may be party to financial instruments with off balance sheet risks, including forward non-U.S. currency contracts, and futures primarily in an attempt to minimize the risk to the Fund, in respect of its portfolio transactions. These instruments involve market and/or credit risk in excess of the amount recognized in the Statement of Assets and Liabilities. Risks arise from the possible inability of counterparties to meet the terms of their contracts and from unexpected movement in currencies, securities values and interest rates. The contract amounts indicate the extent of the Funds’ involvement in such contracts. As of March 31, 2009 the Funds were not party to any such agreements.
77
NICHOLAS-APPLEGATE INSTITUTIONAL FUNDS
NOTESTO FINANCIAL STATEMENTS — Continued
NOTE G — FAIR VALUE OF FINANCIAL INSTRUMENTS
Effective April 1, 2008, the Funds adopted Statement of Financial Accounting Standards No. 157 — Fair Value Measurements (“FAS 157” or the “Statement”). FAS 157 defines fair value, establishes a framework for measuring fair value in generally accepted accounting principles (“GAAP”), and expands disclosures about fair value measurements. The Statement establishes a fair value hierarchy that distinguishes between (1) market participant assumptions developed based on market data obtained from sources independent of the Funds (observable inputs) and (2) the Funds’ own assumptions about market participant assumptions developed based on the best information available in the circumstances (unobservable inputs). The three levels defined by the hierarchy are as follows:
Level I — quoted prices in active markets for identical securities.
Level II — significant observable inputs (including quoted prices for similar securities, interest rates, prepayment speeds, credit risk, etc.).
Level III — significant unobservable inputs (including the Fund’s own assumptions in determining the fair value of investments).
In some instances, the inputs used to measure fair value might fall in different levels of the fair value hierarchy. The level in the fair value hierarchy within which the fair value measurement in its entirely falls shall be determined based on the lowest input level that is significant to the fair value measurement in its entirety.
The following table summarizes the valuation of each Fund’s securities using the fair value hierarchy:
| | | | | | | | | | | | |
March 31, 2008 | | Total | | Level I | | Level II | | Level III |
U.S. Ultra Micro Cap | | | | | | | | | | | | |
Investments | | $ | 1,123,404 | | $ | 1,123,404 | | $ | — | | $ | — |
U.S. Micro Cap | | | | | | | | | | | | |
Investments | | | 44,146,255 | | | 44,146,255 | | | — | | | — |
U.S. Emerging Growth | | | | | | | | | | | | |
Investments | | | 8,085,518 | | | 8,085,518 | | | — | | | — |
U.S. Small to Mid Cap Growth | | | | | | | | | | | | |
Investments | | | 3,082,664 | | | 3,082,664 | | | — | | | — |
U.S. Systematic Large Cap Growth | | | | | | | | | | | | |
Investments | | | 6,516,482 | | | 6,516,482 | | | — | | | — |
U.S. Convertible | | | | | | | | | | | | |
Investments | | | 300,040,613 | | | 38,726,962 | | | 261,313,651 | | | — |
Global Equity 130/30 | | | | | | | | | | | | |
Investments | | | 2,296,954 | | | 2,296,954 | | | — | | | — |
Futures | | | 2,349 | | | 2,349 | | | — | | | — |
Global Select | | | | | | | | | | | | |
Investments | | | 17,523,877 | | | 17,506,790 | | | — | | | 17,087 |
International Growth Opportunities | | | | | | | | | | | | |
Investments | | | 62,107,409 | | | 62,104,276 | | | — | | | 3,133 |
Emerging Markets | | | | | | | | | | | | |
Investments | | | 26,582,189 | | | 26,425,274 | | | — | | | 156,915 |
International Systematic | | | | | | | | | | | | |
Investments | | | 44,427,986 | | | 44,308,881 | | | — | | | 119,105 |
International All Cap Growth | | | | | | | | | | | | |
Investments | | | 23,302,315 | | | 23,302,315 | | | — | | | — |
U.S. High Yield Bond | | | | | | | | | | | | |
Investments | | | 48,867,106 | | | 2,585,927 | | | 46,281,179 | | | — |
78
A roll forward of fair value measurements using significant unobservable inputs (Level 3) for the year ended March 31, 2009 was as follows:
| | | | | | |
| | | Global Select Fund
Investment in Securities | | International Growth
Opportunities Fund
Investment in Securities |
Beginning balance, March 31, 2008 | | $ | — | | $ | — |
Net purchases (sales) and settlements | | | — | | | — |
Accrued discounts (premiums) | | | — | | | — |
Net realized and unrealized gain (loss) | | | — | | | — |
Transfer in and/or out of Level 3 | | | 17,087 | | | 3,133 |
| | | | | | |
Ending balance, March 31, 2009 | | $ | 17,087 | | $ | 3,133 |
| | | | | | |
| | |
| | | Emerging Markets Fund
Investments in Securities | | International Systematic Fund
Investment in Securities |
Beginning balance, March 31, 2008 | | $ | — | | $ | — |
Net purchases (sales) and settlements | | | — | | | — |
Accrued discounts (premiums) | | | — | | | — |
Net realized and unrealized gain (loss) | | | — | | | — |
Transfer in and/or out of Level 3 | | | 156,915 | | | 119,105 |
| | | | | | |
Ending balance, March 31, 2009 | | $ | 156,915 | | $ | 119,105 |
| | | | | | |
NOTE H — MARKET PRICE RISK
The prices of securities held by the Funds may decline in response to certain events, including those directly involving the companies whose securities are owned by the Funds; conditions affecting the general economy; overall market changes; local, regional or global political, social or economic instability; and currency, interest rate fluctuations. The growth-oriented, equity-type securities generally purchased by the Funds may involve large price swings and potential for loss.
Investments in securities issued by entities based outside the United States may be subject to the risk described above to a greater extent and may also be affected by currency controls; different accounting, auditing, financial reporting, and legal standards and practices in some countries; expropriation; changes in tax policy; greater market volatility; differing securities market structures; higher transaction costs; and various administrative difficulties, such as delays in clearing and settling portfolio transactions or in receiving payment of dividends. These risks may be heightened in connection with investments in developing countries.
NOTE I — NEW ACCOUNTING PRONOUNCEMENTS
In March 2008, Statement of Financial Accounting Standards No. 161, “Disclosures about Derivative Instruments and Hedging Activities” (“SFAS 161”), was issued and became effective for fiscal years and interim periods beginning after November 15, 2008. SFAS 161 requires enhanced disclosures to provide information about the reasons a Fund invests in derivative instruments, the accounting treatment and the effect derivatives have on financial performance.
In September 2008, “FASB Staff Position No. 133-1 and FASB Interpretation No. 45-4” (the “FSP”), “Disclosures about Credit Derivatives and Certain Guarantees: An Amendment of FASB Statement No. 133 and FASB Interpretation No. 45; and Clarification of the Effective Date of FASB Statement No. 161,” was issued and is effective for fiscal years and interim periods ending after November 15, 2008. The FSP amends FASB Statement No. 133, “Accounting for Derivative Instruments and Hedging Activities,” to require disclosures by sellers of credit derivatives, including credit derivatives embedded in hybrid instruments. The FSP was effective at March 31, 2009, whereas disclosures required by SFAS 161 are effective for financial statements issued for fiscal years and interim periods beginning after November 15, 2008. Management has reviewed SFAS 161 and the FSP and has determined that these implementations do not have a material impact on the Funds’ financial statements.
79
NICHOLAS-APPLEGATE INSTITUTIONAL FUNDS
NOTESTO FINANCIAL STATEMENTS — Continued
NOTE J — SIGNIFICANT SHAREHOLDER CONCENTRATION
As of March 31, 2009, the Funds had a single shareholder and/or omnibus shareholder accounts (which are comprised of a group of individual shareholders), which individually amounted to more than 10% of the total shares outstanding of a Fund as detailed below.
| | | | | |
Fund | | % of Fund | | | Number of
Shareholders |
U.S. Ultra Micro Cap | | 92.15 | % | | 4 |
U.S. Micro Cap | | 75.28 | % | | 3 |
U.S. Emerging Growth | | 77.26 | % | | 3 |
U.S .Small to Mid Cap Growth | | 93.14 | % | | 1 |
U.S. Systematic Large Cap Growth | | 87.24 | % | | 2 |
U.S. Convertible | | 81.97 | % | | 1 |
Global Equity 130/30 | | 92.91 | % | | 1 |
Global Select | | 55.84 | % | | 3 |
International Growth Opportunities | | 96.90 | % | | 3 |
Emerging Markets | | 81.77 | % | | 2 |
International Systematic | | 95.15 | % | | 3 |
International All Cap Growth | | 70.62 | % | | 3 |
U.S. High Yield | | 60.93 | % | | 2 |
NOTE K — SUBSEQUENT EVENTS
On May 14, 2009, the Board of Trustees approved the liquidation of the Global Equity 130/30 Fund. The Global Equity 130/30 Fund is closed to new investors as of May 26, 2009 and is planned to liquidate on May 26, 2009.
80
NICHOLAS-APPLEGATE INSTITUTIONAL FUNDS
REPORTOF INDEPENDENT REGISTERED PUBLIC ACCOUNTING FIRM
To the Shareholders and Board of Trustees of
Nicholas-Applegate Institutional Funds
In our opinion, the accompanying statements of assets and liabilities, including the schedules of investments, and the related statements of operations, of cash flows and changes in net assets and the financial highlights present fairly, in all material respects, the financial position of each of the portfolios comprising the Nicholas-Applegate Institutional Funds (collectively, the “Funds”) at March 31, 2009, and the results of each of their operations for the year then ended, the cash flows for the Nicholas-Applegate Global 130/30 Fund for the year then ended and the changes in each of their net assets and each of their financial highlights for the periods then ended (for the Nicholas-Applegate International All Cap Growth Fund, for the four years in the period ended March 31, 2009), in conformity with accounting principles generally accepted in the United States of America. These financial statements and financial highlights (hereafter referred to as “financial statements”) are the responsibility of the Funds’ management; our responsibility is to express an opinion on these financial statements based on our audits. We conducted our audits of these financial statements in accordance the standards of the Public Company Accounting Oversight Board (United States). Those standards require that we plan and perform the audit to obtain reasonable assurance about whether the financial statements are free of material misstatement. An audit includes examining, on a test basis, evidence supporting the amounts and disclosures in the financial statements, assessing the accounting principles used and significant estimates made by management, and evaluating the overall financial statement presentation. We believe that our audits, which included confirmation of securities owned at March 31, 2009 by correspondence with the custodian and brokers, provide a reasonable basis for our opinion. The financial highlights of the Nicholas-Applegate International All Cap Growth Fund for the year ended March 31, 2005 were audited by another independent registered public accounting firm whose report dated April 22, 2005 expressed an unqualified opinion thereon.
PricewaterhouseCoopers LLP
Los Angeles, California
May 29, 2009
81
SHAREHOLDER EXPENSE EXAMPLE — (Unaudited)
As a shareholder of a Fund, you incur two types of costs:
(1) transaction costs, including redemption fees, and
(2) ongoing costs, including management fees and other Fund expenses. This example is intended to help you understand your ongoing costs (in dollars) of investing in the Funds and to compare these costs with the ongoing costs of investing in other mutual funds.
The example is based on an investment of $1,000 invested at the beginning of the period and held for the entire period (October 1, 2008 to March 31, 2009).
ACTUAL EXPENSES
The first line of the table below for each Fund provides information about actual account values and actual expenses. You may use the information in this line, together with the amount you invested, to estimate the expenses that you paid over the period. Simply divide your account value by $1,000 (for example, an $8,600 account value divided by $1,000 = 8.6), then multiply the result by the number in the first line for a Fund under the heading “Expenses Paid During Period” to estimate the expenses you paid on your account during this period
HYPOTHETICAL EXAMPLE FOR
COMPARISON PURPOSES
The second line of the table below for each Fund provides information about hypothetical account values and hypothetical expenses based on a Fund’s actual expense ratio and an assumed rate of return of 5% per year before expenses, which is not the Fund’s actual return. The hypothetical account values and expenses may not be used to estimate the actual ending account balance or expenses you paid for the period. You may use this information to compare the ongoing costs of investing in a Fund and other funds. To do so, compare this 5% hypothetical example with the 5% hypothetical examples that appear in the shareholder reports of the other funds.
Please note that the expenses shown in the table are meant to highlight your ongoing costs only and do not reflect any transaction costs. Therefore, the second line of the table is useful in comparing ongoing costs only, and will not help you determine the relative total costs of owning different funds. In addition, if these transactional costs were included, your costs would have been higher.
| | | | | | | | | | | | |
| | | Beginning Account
Value
October 1, 2008 | | Ending Account
Value
March 31, 2009 | | Expenses Paid
During the Period*
October 1, 2008 to
March 31, 2009 | | Annualized
Expense Ratio | |
U.S. Micro Cap Growth — Class I | | | | | | | | | | | | |
Actual | | $ | 1,000.00 | | $ | 672.90 | | $ | 6.34 | | 1.52 | % |
| | | | | | | | | | | | |
Hypothetical (5% return before expenses) | | $ | 1,000.00 | | $ | 1,017.35 | | $ | 7.64 | | 1.52 | % |
| | | | | | | | | | | | |
U.S. Emerging Growth — Class I | | | | | | | | | | | | |
Actual | | $ | 1,000.00 | | $ | 620.50 | | $ | 4.89 | | 1.21 | % |
| | | | | | | | | | | | |
Hypothetical (5% return before expenses) | | $ | 1,000.00 | | $ | 1,018.90 | | $ | 6.09 | | 1.21 | % |
| | | | | | | | | | | | |
U.S. Ultra Micro Cap — Class I | | | | | | | | | | | | |
Actual | | $ | 1,000.00 | | $ | 653.80 | | $ | 9.57 | | 2.32 | % |
| | | | | | | | | | | | |
Hypothetical (5% return before expenses) | | $ | 1,000.00 | | $ | 1,013.36 | | $ | 11.65 | | 2.32 | % |
| | | | | | | | | | | | |
U.S. Systematic Large Cap Growth — Class I | | | | | | | | | | | | |
Actual | | $ | 1,000.00 | | $ | 732.20 | | $ | 4.79 | | 1.11 | % |
| | | | | | | | | | | | |
Hypothetical (5% return before expenses) | | $ | 1,000.00 | | $ | 1,019.40 | | $ | 5.59 | | 1.11 | % |
U.S. Systematic Large Cap Growth — Class II | | | | | | | | | | | | |
Actual | | $ | 1,000.00 | | $ | 733.60 | | $ | 4.11 | | 0.95 | % |
| | | | | | | | | | | | |
Hypothetical (5% return before expenses) | | $ | 1,000.00 | | $ | 1,020.19 | | $ | 4.78 | | 0.95 | % |
| | | | | | | | | | | | |
U.S. Small to Mid Cap Growth — Class I | | | | | | | | | | | | |
Actual | | $ | 1,000.00 | | $ | 652.20 | | $ | 4.00 | | 0.97 | % |
| | | | | | | | | | | | |
Hypothetical (5% return before expenses) | | $ | 1,000.00 | | $ | 1,020.09 | | $ | 4.89 | | 0.97 | % |
| | | | | | | | | | | | |
U.S. Convertible — Class I | | | | | | | | | | | | |
Actual | | $ | 1,000.00 | | $ | 879.80 | | $ | 4.87 | | 1.04 | % |
| | | | | | | | | | | | |
Hypothetical (5% return before expenses) | | $ | 1,000.00 | | $ | 1,019.79 | | $ | 5.24 | | 1.04 | % |
| | | | | | | | | | | | |
U.S. Convertible — Class II | | | | | | | | | | | | |
Actual | | $ | 1,000.00 | | $ | 880.40 | | $ | 4.36 | | 0.93 | % |
| | | | | | | | | | | | |
Hypothetical (5% return before expenses) | | $ | 1,000.00 | | $ | 1,020.29 | | $ | 4.68 | | 0.93 | % |
| | | | | | | | | | | | |
U.S. Convertible — Class IV | | | | | | | | | | | | |
Actual | | $ | 1,000.00 | | $ | 881.20 | | $ | 3.66 | | 0.78 | % |
| | | | | | | | | | | | |
Hypothetical (5% return before expenses) | | $ | 1,000.00 | | $ | 1,021.04 | | $ | 3.93 | | 0.78 | % |
| | | | | | | | | | | | |
82
| | | | | | | | | | | | |
| | | Beginning Account
Value
October 1, 2008 | | Ending Account
Value
March 31, 2009 | | Expenses Paid
During the Period*
October 1, 2008 to
March 31, 2009 | | Annualized
Expense Ratio | |
Global Equity 130/30 — Class I | | | | | | | | | | | | |
Actual | | $ | 1,000.00 | | $ | 705.40 | | $ | 5.70 | | 1.34 | % |
| | | | | | | | | | | | |
Hypothetical (5% return before expenses) | | $ | 1,000.00 | | $ | 1,018.25 | | $ | 6.74 | | 1.34 | % |
| | | | | | | | | | | | |
Global Select — Class I | | | | | | | | | | | | |
Actual | | $ | 1,000.00 | | $ | 718.90 | | $ | 5.06 | | 1.18 | % |
| | | | | | | | | | | | |
Hypothetical (5% return before expenses) | | $ | 1,000.00 | | $ | 1,019.05 | | $ | 5.94 | | 1.18 | % |
| | | | | | | | | | | | |
Global Select — Class II | | | | | | | | | | | | |
Actual | | $ | 1,000.00 | | $ | 710.70 | | $ | 4.82 | | 1.13 | % |
| | | | | | | | | | | | |
Hypothetical (5% return before expenses) | | $ | 1,000.00 | | $ | 1,019.30 | | $ | 5.69 | | 1.13 | % |
| | | | | | | | | | | | |
International Growth Opportunities — Class I | | | | | | | | | | | | |
Actual | | $ | 1,000.00 | | $ | 717.90 | | $ | 6.17 | | 1.44 | % |
| | | | | | | | | | | | |
Hypothetical (5% return before expenses) | | $ | 1,000.00 | | $ | 1,017.75 | | $ | 7.24 | | 1.44 | % |
| | | | | | | | | | | | |
International Growth Opportunities — Class II | | | | | | | | | | | | |
Actual | | $ | 1,000.00 | | $ | 718.50 | | $ | 5.48 | | 1.28 | % |
| | | | | | | | | | | | |
Hypothetical (5% return before expenses) | | $ | 1,000.00 | | $ | 1,018.55 | | $ | 6.44 | | 1.28 | % |
| | | | | | | | | | | | |
International Growth Opportunities — Class III | | | | | | | | | | | | |
Actual | | $ | 1,000.00 | | $ | 718.60 | | $ | 0.99 | | 0.23 | % |
| | | | | | | | | | | | |
Hypothetical (5% return before expenses) | | $ | 1,000.00 | | $ | 1,023.83 | | $ | 1.16 | | 0.23 | % |
| | | | | | | | | | | | |
Emerging Markets Fund — Class I | | | | | | | | | | | | |
Actual | | $ | 1,000.00 | | $ | 668.10 | | $ | 5.82 | | 1.40 | % |
| | | | | | | | | | | | |
Hypothetical (5% return before expenses) | | $ | 1,000.00 | | $ | 1,017.95 | | $ | 7.04 | | 1.40 | % |
| | | | | | | | | | | | |
Emerging Markets Fund — Class II | | | | | | | | | | | | |
Actual | | $ | 1,000.00 | | $ | 668.40 | | $ | 5.41 | | 1.30 | % |
| | | | | | | | | | | | |
Hypothetical (5% return before expenses) | | $ | 1,000.00 | | $ | 1,018.45 | | $ | 6.54 | | 1.30 | % |
| | | | | | | | | | | | |
International Systematic Fund — Class I | | | | | | | | | | | | |
Actual | | $ | 1,000.00 | | $ | 684.60 | | $ | 4.28 | | 1.02 | % |
| | | | | | | | | | | | |
Hypothetical (5% return before expenses) | | $ | 1,000.00 | | $ | 1,019.85 | | $ | 5.14 | | 1.02 | % |
| | | | | | | | | | | | |
International Systematic Fund — Class II | | | | | | | | | | | | |
Actual | | $ | 1,000.00 | | $ | 683.50 | | $ | 4.11 | | 0.98 | % |
| | | | | | | | | | | | |
Hypothetical (5% return before expenses) | | $ | 1,000.00 | | $ | 1,020.04 | | $ | 4.94 | | 0.98 | % |
| | | | | | | | | | | | |
International Systematic Fund — Class III | | | | | | | | | | | | |
Actual | | $ | 1,000.00 | | $ | 684.40 | | $ | 5.54 | | 1.32 | % |
| | | | | | | | | | | | |
Hypothetical (5% return before expenses) | | $ | 1,000.00 | | $ | 1,018.35 | | $ | 6.64 | | 1.32 | % |
| | | | | | | | | | | | |
International All Cap Growth — Class I | | | | | | | | | | | | |
Actual | | $ | 1,000.00 | | $ | 667.50 | | $ | 4.82 | | 1.16 | % |
| | | | | | | | | | | | |
Hypothetical (5% return before expenses) | | $ | 1,000.00 | | $ | 1,019.15 | | $ | 5.84 | | 1.16 | % |
| | | | | | | | | | | | |
International All Cap Growth — Class II (1) | | | | | | | | | | | | |
Actual | | $ | 1,000.00 | | $ | 980.10 | | $ | 0.47 | | 0.40 | % |
| | | | | | | | | | | | |
Hypothetical (5% return before expenses) | | $ | 1,000.00 | | $ | 1,005.42 | | $ | 0.47 | | 0.40 | % |
| | | | | | | | | | | | |
U.S. High Yield Bond — Class I | | | | | | | | | | | | |
Actual | | $ | 1,000.00 | | $ | 907.20 | | $ | 1.24 | | 0.26 | % |
| | | | | | | | | | | | |
Hypothetical (5% return before expenses) | | $ | 1,000.00 | | $ | 1,023.64 | | $ | 1.31 | | 0.26 | % |
| | | | | | | | | | | | |
| (1) | International All Cap Growth Class II beginning account value on 02/17/09 (Class inception date) |
| * | Expenses are equal to the Fund’s annualized expense ratio; multiplied by the average account value over the period |
83
SUPPLEMENTARY INFORMATION — (Unaudited)
PROXY VOTING
The Adviser votes proxies on behalf of the Funds pursuant to written policies and procedures adopted by the Funds. To obtain free information on how your Funds’ securities were voted, please call the Funds at 1-800-551-8043 or visit the Funds’ website at www.nacm.com. You may also view how the Fund’s securities were voted by visiting the Securities & Exchange Commission’s website at www.sec.gov. Additionally, information regarding each Fund’s proxy voting record for the most recent twelve month period ended June 30 is also available, free of charge, by calling the Funds at 1-800-551-8043 and from the SEC’s website at www.sec.gov.
SHAREHOLDER ACTIONS
The Trust held a special meeting of the shareholders of the International Growth Fund to approve an Agreement and Plan of Reorganization with respect to the reorganization of the International Growth Fund with and into the Allianz NACM International Growth Fund, a series of Allianz Funds as described in the proxy statement mailed to shareholders of record as of November 30, 2008.
In the matter of approving the reorganization and termination of the Fund there were the following votes either present or represented by proxy:
| | | | |
For | | Against | | Abstained |
| 1,249,715 | | 532,537 | | — |
In the matter approving the approval of the new Advisory Agreement between Allianz Global Investors Fund Management LLC and the International Growth Fund there were the following votes either present or represented by proxy:
| | | | |
For | | Against | | Abstained |
| 1,782,253 | | — | | — |
ADDITIONAL FEDERAL TAX INFORMATION
The Jobs and Growth Tax Relief Reconciliation Act of 2003 allows a fund to distribute certain dividends paid to its eligible shareholders as qualified dividend income. Of the ordinary income (including short-term capital gain) distributions made by the Funds during the fiscal year ended March 31, 2009, the following percentages represent the amount of qualified income within each Fund:
| | | |
U.S. Micro Cap | | 100 | % |
U.S. Convertible | | 35.20 | |
Global Select | | 4.98 | |
International Growth Opportunities | | 29.45 | |
Emerging Markets | | 11.14 | |
International Systematic | | 100 | |
International All Cap Growth | | 100 | |
The amounts which represent income derived from sources within, and taxes paid to non U.S. countries or possessions of the United States are as follows:
| | | | | | |
Fund | | Foreign
Source
Income | | Foreign
Tax Credit
Total: |
International Growth Opportunities | | $ | 2,265,333 | | $ | 156,623 |
Emerging Markets | | | 641,445 | | | 60,553 |
International Systematic | | | 2,830,597 | | | 254,350 |
International All Cap Growth | | | 401,489 | | | 27,415 |
The percentage of ordinary dividends paid by the Funds during the year ended March 31, 2009, which qualify for the Dividends Received Deduction available to corporate shareholders was:
| | | |
Fund | | Percentage | |
U.S. Micro Cap | | 100 | % |
U.S. Convertible | | 32.49 | |
Global Select | | 1.58 | |
International Systematic | | 0.31 | |
International All Cap Growth | | 1.46 | |
The Funds hereby designate the following approximate amounts as capital gains distributions for the purpose of the Dividends Paid Deduction:
| | | |
Fund | | Amounts: |
U.S. Convertible | | $ | 1,052,403 |
Global Select | | | 20,545,145 |
International Growth Opportunities | | | 8,811,650 |
Emerging Markets | | | 183,454 |
International All Cap Growth | | | 1,426,788 |
84
SUPPLEMENTARY INFORMATION — (Unaudited) — Continued
QUARTERLY FILING
The Funds provide a complete list of portfolio holdings four times in each fiscal year, at the end of each calendar quarter. For the second and fourth fiscal quarters, the portfolio holdings appear in the Funds’ semiannual and annual reports to shareholders. For the first and third fiscal quarters, the Funds file their portfolio holdings with the U.S. Securities and Exchange Commission (the “SEC”) on Form N-Q. Shareholders can access the Funds’ Form N-Q on the SEC’s website at www.sec.gov. Forms N-Q may also be reviewed and copied at the SEC’s Public Reference Room in Washington, DC. To find out more about this public service, call the SEC at 1-202-942-8090.
TRUSTEE APPROVAL OF INVESTMENT ADVISORY AGREEMENT
Based upon the recommendation of the Contract Committee of the Board of Trustees, a committee comprised of all of the Independent Trustees of the Trust, the Trustees unanimously approved the continuance of the Investment Advisory Agreement between the Funds and Nicholas-Applegate Capital Management (“Nicholas-Applegate”) at a meeting held on November 14, 2008. In approving the Investment Advisory Agreement, the Board of Trustees, through its Contract Committee, evaluated a comprehensive package of materials, including performance and expense data for other funds with similar asset sizes, investment objectives and policies that had been provided by Lipper Inc. (“Lipper”). Prior to making its recommendation, the Contract Committee reviewed the proposed continuance of the Investment Advisory Agreement with representatives of Nicholas-Applegate and with independent legal counsel to the Independent Trustees of the Trust. Members of the Contract Committee also met privately with independent legal counsel to discuss the factors they felt were relevant. The factors included: (1) the performance of the Funds and the financial condition of the Adviser and the Funds; (2) comparative performance data for each of the Funds and other funds with similar investment objectives/policies and to a relevant index; (3) the nature, extent and quality of investment advisory services rendered by Nicholas-Applegate; (4) marketing and sales efforts dedicated to the Funds; (5) compensation paid to Nicholas-Applegate; (6) costs borne by Nicholas-Applegate; (7) comparative fee and expense data for each of the Funds and other funds with similar investment objectives/policies; (8) Nicholas-Applegate’s policies and practices regarding allocation of portfolio transactions, best price and execution of portfolio transactions, and soft dollar arrangements; (9) fair valuation policy and procedures; (10) expense off-set arrangements; (11) portfolio turnover rates; (12) fall-out benefits, such as research received pursuant to Section 28(e) of the Securities Exchange Act of 1934, as amended; (13) fees that Nicholas-Applegate charges its other clients with similar investment objectives/policies; (14) experience and qualifications of each of the members of the portfolio management teams; (15) material changes in personnel managing the Funds; and (16) the time dedicated by Nicholas-Applegate’s senior management, portfolio managers and other key personnel, including the Chief Executive Officer and the Chief Investment Officer, to the Funds.
In their deliberations, the Contract Committee did not identify any particular information that was controlling, and each member of the Contract Committee attributed different weights to the various factors. The Contract Committee determined that the fees of the Investment Advisory Agreement between each of the Funds and Nicholas-Applegate were fair and reasonable in light of the services performed, expenses incurred and such other matters as the Contract Committee considered relevant in the exercise of their reasonable judgment. The Contract Committee also separately discussed the material factors and conclusions that formed the basis for the Contract Committee to recommend to the Board of Trustees to approve the Investment Advisory Agreement for each of the Funds.
SERVICES PROVIDED BY NICHOLAS-APPLEGATE
Nicholas-Applegate manages the portfolios of each of the Funds under the direction of the Board of Trustees and manages each Fund consistent with each Fund’s investment objectives and policies. Nicholas-Applegate provides each Fund with office space and such other services and personnel as are necessary for its operations. The Contract Committee considered the scope and quality of services provided by Nicholas-Applegate under the Investment Advisory Agreement. The Contract Committee considered the quality of the investment research capabilities of Nicholas-Applegate and the other services to be provided to the Funds by Nicholas-Applegate, such as selecting broker-dealers for executing portfolio transactions, serving as the Funds’ administrator, producing shareholder reports, providing support services for the Trustees and Board Committees and overseeing the activities of other service providers, including monitoring compliance with various Fund policies and procedures and with applicable securities laws and regulations. The Contract Committee concluded that the nature, extent and quality of the services provided by Nicholas-Applegate to the Funds were appropriate and consistent with the terms of the Investment Advisory Agreement and that the Funds will continue to benefit from services provided under the Investment Advisory Agreement with Nicholas-Applegate.
COST OF SERVICES & FUND EXPENSES
The Contract Committee examined the fee information and expenses for each of the Funds in comparison to information from other comparable funds as provided by Lipper. The Contract Committee agreed that overall the Funds’ management fees and expense ratios were reasonable in relation to the management fees and expense ratios of the Funds’ peer groups selected by Lipper. The Contract Committee also reviewed Nicholas-Applegate’s management fees charged to its institutional separate account clients and for sub-advised funds (funds for which Nicholas-Applegate provides portfolio management services only). The Contract Committee also reviewed the profitability analysis for each Fund. The Contract Committee concluded that overall the management fees and other compensation to be paid by the Funds to Nicholas-Applegate were reasonable in relation to
85
SUPPLEMENTARY INFORMATION — (Unaudited) — Continued
the nature and quality of the services to be provided, taking into account (1) the fees charged by other advisers for managing comparable mutual funds with similar strategies and assets; (2) the fees that Nicholas-Applegate charges to other clients; (3) the estimated overall expense ratio of the Funds, taking into account the Funds’ expense offset arrangements with brokers, custodians and third party services providers; and (4) the Funds’ performance in light of challenging market conditions.
INVESTMENT RESULTS
The Contract Committee considered the investment results of each of the Funds as compared to funds with similar investment objectives and policies as determined by Lipper and with relevant securities indices. In addition to the information received by the Contract Committee for their meeting, Nicholas-Applegate provides detailed performance information for each Fund at each regular meeting of the Board of Trustees. The Contract Committee reviewed information showing absolute and relative performance of each Fund over 1-year, 2-year, 3-year, 4-year, 5-year and 10-year periods, as applicable.
U.S. Ultra Micro Cap Fund
The Contract Committee reviewed Fund peer group information in connection with the approval of the Fund that commenced investment operations on January 28, 2008. The Committee compared the Fund’s performance since inception which had underperformed relative to the Russell Microcap Growth Index. Because the Fund had less than a year’s performance, Lipper peer group data was not available. After further discussion concerning the expense relative to the peers, the Contract Committee concluded that the Fund had commenced operations in an unprecedented market environment yet had adhered to its investment strategy and that performance on both a relative and absolute basis was acceptable.
U.S. Micro Cap Fund
The Contract Committee reviewed the information reporting performance of the US Micro Cap Fund compared to its Lipper peer group and the Russell 2000 Growth Index and the Russell Micro Cap Growth Blended Index. The comparative information showed the Fund had underperformed relative to the Russell 2000 Growth Index over the 1 and 5-year periods yet substantially outperformed over the 10-year and inception to date periods. The Fund underperformed relative to the Russell Microcap Growth Blended Index over the 1-year period yet outperformed over the 5 and 10-year periods. The Fund performed in the 1st, 2nd & 3rd quartiles over the 1, 5 and 10-year periods relative to its Lipper peer group. After further discussion, the Contract Committee concluded that, over the long-term, the U.S. Micro Cap Fund had adhered to its investment strategy through turbulent market conditions and that performance on both a relative and absolute basis was acceptable.
U.S. Emerging Growth Fund
The Contract Committee reviewed information showing performance of the Fund compared to its Lipper peer group and the Russell 2000 Growth Index. The comparative
information showed the Fund underperformed relative to the Russell 2000 Growth Index over the 1-year period yet outperformed the benchmark over the 5, 10 and inception to date periods. The Fund’s performance relative to its Lipper peer group placed it in the 4th, 2nd and 4th quartiles over the 1, 5 and 10-year periods, respectively. After further discussion, the Contract Committee concluded that the Fund had adhered to its investment strategy through turbulent market conditions and that performance on both a relative and absolute basis was acceptable.
U.S. Small to Mid Cap Growth Fund
The Fund incepted on July 31, 2007 and therefore had little performance information for the Contract Committee to evaluate. Inception to date performance showed that the Fund had underperformed the Russell 2500 Growth Index and its peer group since inception. The Contract Committee noted that the Fund’s peer group as selected by Lipper were predominately small-cap growth funds. Based on its review, the Contract Committee concluded that the Fund’s first year performance had been good.
U.S. Systematic Large Cap Growth Fund
The Contract Committee reviewed information showing performance of the Fund compared to its Lipper peer group and Russell 1000 Index. The comparative information showed that the Fund outperformed the Index in all periods and were in the 3rd and 4th percentiles relative to its peers over the 1, 5 and 10-year periods. After further discussion with the Adviser’s Chief Investment Officer, the Contract Committee concluded that the performance relative to the Index was acceptable.
U.S. Convertible Fund
The Contract Committee reviewed information showing performance of the Fund compared to its Lipper peer group and the Merrill Lynch All Convertibles All Qualities Index. The comparative information showed that the Fund performed in the top deciles of its peer group and outperformed the Index for the 1-year, 5-year and 10-year periods. Based on their review, the Contract Committee concluded that the Fund’s relative performance over time had been exceptional.
Global Select Fund
The Contract Committee reviewed information showing performance of the Fund compared to its Lipper peer group and the MSCI ACWI Index and the MSCI ACWI Growth Index. The comparative information showed the Fund had outperformed both Indexes in the 1-year, 5-year and 10-year periods. The Fund’s performance relative to its peers was above median over the 1, 5 and 10-year periods. Based on this review, the Contract Committee concluded the Fund’s relative investment performance over time had been very good.
Global Equity 130/30 Fund
The Fund incepted on April 1, 2008 and therefore had little performance information for the Contract Committee to evaluate. The Fund compares its performance to the MSCI ACWI Index. For the inception to date period, the Fund had underperformed relative to the Index. Based on its review, the Contract Committee concluded the Fund’s performance was off to a satisfactory start.
SUPPLEMENTARY INFORMATION — (Unaudited) — Continued
International Growth Opportunities Fund
The Contract Committee reviewed information showing performance of the Fund compared to its Lipper peer group and the Citigroup World Ex U.S. EMI Growth and Citigroup World Ex U.S. EMI Indexes. The comparative information showed that the Fund had outperformed its peers and the Indexes in the 1- year, 5-year and 10-year periods and performed in the 1st percentile relative to its peers over the 1-year, 3-year and 5-year periods. Based on its review, the Contract Committee concluded that the Fund’s performance had been exceptional over time despite a challenging 1-year period.
Emerging Markets Fund
The Fund has been in operation for two years and therefore no long-term performance comparisons were available for the Contract Committee to review. The Contract Committee reviewed information showing performance of the Fund compared to its Lipper peer group and the Lipper Emerging Market Fund Index. For the 1-year period, the Fund underperformed relative to the Index but outperformed relative to its peers group median. For the 2-year period, the Fund outperformed the Index and a majority of its peers. Based on its review, the Contract Committee concluded that the Fund’s performance through two years had been very good.
International Systematic Fund
The Contract Committee reviewed information showing performance of the Fund since its inception on July 5, 2006 compared to its Lipper peer group and the MSCI EAFE Index. The Fund underperformed relative to the Index and its peer group median over the 1-year, 2-year and 3-year periods. Based on their review, the Contract Committee concluded that the Adviser was taking appropriate steps towards improving performance.
International All Cap Growth Fund
The Contract Committee reviewed information showing performance of the Fund compared to its Lipper peer group and the Lipper International Multi-Cap Growth Index. The comparative information showed that the Fund had outperformed relative to the Index over the 1-year, 2-year, 3-year, 4-year and 5-year periods. The Fund also outperformed all of its group peers over the 2-year, 3-year, 4-year and 5-year periods and outperformed relative to its peer group median over the 1-year period. Based on its review, the Contract Committee concluded that the Fund’s performance had been exceptional.
U.S. High Yield Bond Fund
The Contract Committee reviewed information showing performance of the Fund compared to its Lipper peer group and the Lipper High Current Yield Bond Index. The comparative information showed that the Fund had outperformed its peer group median and the Index over each period. Based on its review, the Contact Committee concluded that the Fund’s relative performance over time had been exceptional.
INVESTMENT ADVISORY FEE AND OTHER EXPENSES
The Contract Committee considered the investment advisory fee paid by each Fund. The Contract Committee recognized that it was difficult to make comparisons of investment advisory fees because there are variations in the services that are included in the fees paid by other funds. The Contract Committee also considered the fees that Nicholas-Applegate charges other clients with similar investment objectives/policies. Nicholas-Applegate acts as sub-adviser to several open-end and closed-end registered investment companies, non-U.S. investment companies, and investment adviser to separately managed institutional accounts. For funds where Nicholas-Applegate acts as sub-adviser, the Investment advisory fee is generally lower. For separately managed accounts where Nicholas-Applegate acts solely as investment adviser, the investment advisory fee is comparable and in some cases higher. The Contract Committee also considered the total expense ratio for each Fund in comparison to their respective peers.
U.S. Ultra Micro Cap Fund
The Lipper peer group consisted of seven funds with average net assets ranging between $1.5 million and $108.1 million, with the Fund having the smallest average net assets. The Lipper peer group fee and expense data showed that the Fund’s total expenses were above the peer group median and higher than those of its peers. The Contract Committee concluded that the Fund’s expense ratio was acceptable in light of the quality of services offered and other factors considered.
U.S. Micro Cap Fund
The Lipper peer group consisted of nine funds with average net assets ranging between $46.4 million and $175.6 million, compared to $84.0 million for the Fund. The Lipper peer group fee and expense data showed that the Fund’s total expenses were lower than half of its peers, some with asset sizes significantly higher than the Fund. The Contract Committee concluded that the Fund’s expense ratio was acceptable in light of the quality of services offered and other factors considered.
U.S. Emerging Growth Fund
The Lipper peer group consisted of 13 funds with average net assets ranging between $9.2 million and $71.0 million, compared to $11.8 million for the Fund. The Lipper peer group fee and expense data showed that the Fund’s total expenses were the lowest among its peers after expense offsets. The Contract Committee concluded that the Fund’s expense ratio was acceptable in light of quality of services and other factors considered.
U.S. Small to Mid Cap Growth Fund
The Lipper peer group consisted of 10 funds with average net assets ranging between $2.1 million and $52.2 million, compared to $3.6 million for the Fund. The Lipper peer group fee and expense data showed that the Fund’s total expenses were the lowest of all funds in the peer group after expense
87
SUPPLEMENTARY INFORMATION — (Unaudited) — Continued
offsets. The Contract Committee concluded that the Fund’s expense ratio was acceptable in light of the quality of services and other factors considered.
U.S. Systematic Large Cap Growth Fund
The Lipper peer group consisted of 11 funds with average net assets ranging between $12.7 million and $70.8 million, compared to $19.3 million for the Fund. The Lipper peer group fee and expense data showed that the Fund’s total expenses were higher than the peer group median. The Contract Committee concluded that the Fund’s expense ratio was acceptable in light of the quality of services and other factors considered.
U.S. Convertible Fund
The Lipper peer group consisted of six funds with average net assets ranging between $88.7 million and $329.3 million, compared to $201.3 million for the Fund. The Lipper peer group fee and expense data showed that the Fund’s total expenses after expense offsets were above the peer group median and higher than those of its peers. The Contract Committee concluded that the Fund’s expense ratio was acceptable in light of the quality of services and other factors considered.
Global Select Fund
The Lipper peer group consisted of 10 funds with average net assets ranging between $26.8 million and $160.6 million, compared to $118.3 million for the Fund. The Lipper peer group fee and expense data showed that the Fund’s total expenses were lower than the peer group median and were the second lowest among the Fund’s peers after expense offsets. The Contract Committee concluded that the Fund’s expense ratio was acceptable in light of the quality of services and other factors considered.
Global Equity 130/30 Fund
The Lipper peer group consisted of six funds with average net assets ranging between $4.2 million and $247.6 million, with the Fund having the smallest average net assets. The Lipper peer group fee and expense data showed that the Fund’s total expenses were above the peer group median and higher than those of its peers. The Contract Committee concluded that the Fund’s expense ratio was acceptable in light of the quality of services and other factors considered.
International Growth Opportunities Fund
The Lipper peer group consisted of six funds with average net assets ranging between $112.5 million and $539.0 million, compared to $176.4 million for the Fund. The Lipper peer group fee and expense data showed that the Fund’s total expenses were the lowest among its peers after expense offsets. The Contract Committee concluded that the Fund’s expense ratio was acceptable in light of the quality of services offered and other factors considered.
Emerging Markets Fund
The Lipper peer group consisted of nine funds with average net assets ranging between $22.2 and $166.8 million, compared to $36.4 million for the Fund. The Lipper peer group fee and expense data showed that the Fund’s total expenses
were the lowest among its peers, some of which had significantly larger average net assets. The Contract Committee concluded that the Fund’s expense ratio was acceptable in light of the quality of services offered and other factors considered.
International Systematic Fund
The Lipper peer group consisted of 10 funds with average net assets ranging between $33.6 million and $130.5 million, compared to $98.6 million for the Fund. The Lipper peer group fee and expense data showed that the Fund’s total expenses were the lowest among its peers after expense offsets. The Contract Committee concluded that the Fund’s expense ratio was acceptable in light of the quality of services offered and other factors considered.
International All Cap Growth Fund
The Lipper peer group consisted of eight funds with average net assets ranging between $16.5 million and $185.5 million with the Fund having the smallest average net assets. The Lipper peer group fee and expense data showed that the Fund’s total expenses were the second lowest among its peers after expense offsets. The Contract Committee considered the relative small size of the Fund and concluded that the Fund’s expense ratio was acceptable in light of the quality of services offered and other factors considered.
U.S. High Yield Bond Fund
The peer group consisted of 10 funds with average net assets ranging between $13.1 million and $97.3 million, compared to $56.8 for the Fund. The Lipper peer group fee and expense data showed that the Fund’s total expenses were the second lowest among its peers after expense offsets. The Contract Committee concluded that the Fund’s expense ratio was acceptable in light of the quality of services offered and other factors considered.
ECONOMIES OF SCALE
The Contract Committee noted that the investment advisory and unitary fee schedules for the Funds do not contain breakpoints that reduce the fee rate on assets above specified levels. However, the Contract Committee did note that overall fees paid to Nicholas-Applegate (investment advisory, administration, and shareholder service) contain the functional equivalent of breakpoints through the offering of four to five different share classes that reduce the fees paid to Nicholas-Applegate based on the asset level of the account. The Contract Committee recognized that the existing fee structure is consistent with the institutional nature of the Funds’ shareholder base and of Nicholas-Applegate’s business, which caters to large institutional investors (e.g., pension plans, endowments and public funds). Having taken these factors into consideration, the Contract Committee concluded that the Funds’ current multiple share class fee structure establishes a reasonable basis for realizing economies of scale for the Funds which may exist when assets increase. At current asset levels, the Contract Committee also noted that the most of the Funds have not realized optimal economies of scale in respect to other expenses and that many expenses continue to be paid by the Adviser.
SUPPLEMENTARY INFORMATION — (Unaudited) — Continued
CORPORATE GOVERNANCE
| | |
Name, Address (1) Age Position(s) Held with Fund Length of Time Served (2) | | Principal Occupation(s) during Past 5 Years Other Directorship Held by Trustee Number of Portfolios in Fund complex Overseen by Trustee |
Darlene T. DeRemer 11/27/1955 Chairperson of the Board Since August 2007 & Trustee Since May 1999 | | Principal Occupations: Partner, Grail Partners LLC (since 2005); Managing Director, Putnam Lovell NBF Private Equity (since 2004-2005); Managing Director, NewRiver E-Business Advisory Services Division (2000-2003); Prior to, President and Founder, DeRemer Associates, a strategic and marketing consulting firm for the financial services industry (since 1987); Vice President and Director, Asset Management Division, State Street Bank and Trust Company, now referred to as State Street Global Advisers (1982-1987); Vice President, T. Rowe Price & Associates (1979-1982); Member, Boston Club (since 1998); Member, Financial Women’s Association Advisory Board (since 1995); Founder, Mutual Fund Cafe Website. |
| |
| | Other Directorships Held: Founding Member and Director, National Defined Contribution Council (since 1997); Trustee, Boston Alzheimer’s Association (since 1998); Director, King’s Wood Montessori School (since 1995); Editorial Board, National Association of Variable Annuities (since 1997); Director, Nicholas-Applegate Strategic Opportunities, Ltd. (1994-1997); Trustee, Nicholas-Applegate Mutual Funds (1994-1999); Director, Jurika & Voyles Fund Group (since 1994-2000); Trustee, Barnwell Funds (2003-2005); Director, Independent Director Council (since 2004); Mutual Fund Director’s Council-Advisory Board; Board Member-Chatman Partners; Board Member-X-Shares LLC. |
| |
| | Number of Portfolios Overseen by Trustee: 13 |
| |
John J. Murphy 4/8/1944 Trustee Since September 2005 | | Principal Occupations: Founder and senior principal, Murphy Capital Management. Other Directorships Held: Director, Smith Barney Multiple Discipline Trust; Director, Barclays International Funds Group Ltd. and affiliated companies; Smith Barney Consulting Group; Legg Mason Equity Funds. |
| |
| | Number of Portfolios Overseen by Trustee: 13 |
| |
Bradford K. Gallagher 2/24/1944 Trustee Since August 2007 | | Principal Occupations: Founder, Spyglass Investments LLC (a private investment vehicle) (since 2001); Founder, President and CEO of CypressTree Investment Management Company and Annuity Company; Managing Director, Fidelity Investments. Other Directorships Held: Trustee, The Common Fund (since 2005); Director, Anchor Point Inc. (since 1995); Chairman and Trustee, Atlantic Maritime Heritage Foundation (since 2007); Director, Shielding Technology Inc. (since 2006); Director, United Way of Eastern Massachusetts (1988-1990); Director, Ouimet Scholarship Fund (1993-2005); Director, Emerson Hospital (1995-2005). |
| |
| |
| | Number of Portfolios Overseen by Trustee: 13 |
| |
Steven Grenadier 12/14/1964 Trustee Since August 2007 | | Principal Occupations: William F. Sharpe Professor of Financial Economics, Stanford University Graduate School of Business; Research Associate, National Bureau of Economic Research (since 2002); Chairman of the Finance Department, Stanford University Graduate School of Business (2004-2006). |
| |
| | Other Directorships Held: Independent Trustee, E Trade Funds. |
| |
| | Number of Portfolios Overseen by Trustee: 13 |
| |
| Interested Trustees: | | |
| |
Horacio A. Valeiras 1/8/1959 President & Trustee Since August 2004 | | Principal Occupations: Managing Director (since 2004) and Chief Investment Officer, Nicholas-Applegate Capital Management, Nicholas-Applegate Securities (since 2002); Chief Investment Officer, Oppenheimer and AGI Management Partners (since 2008); Managing Director of Morgan Stanley Investment Management, London (1997-2002); Head of International Equity and Asset Allocation, Miller Anderson & Sherred; Director and Chief of Investment Strategies, Credit Suisse First Boston. |
| |
| | Other Directorships Held: Trustee, The Bishops School (since 2002); Trustee, San Diego Rowing Club (since 2002). |
| |
| | Number of Portfolios Overseen by Trustee: 13 |
| |
Arthur B. Laffer 8/14/1940 Trustee Since August 2007 | | Principal Occupations: Chairman, Laffer Associates (economic consulting) (since 1979); Chairman, Laffer Advisors Inc. (registered broker-dealer) (since 1981); Chairman, Laffer Investments (asset management) (since 2000); Member, Congressional Policy Advisory Board (since 1998); Distinguished University Professor and Director, Pepperdine University (1985-1988); Professor of Business Economics, University of Southern California (1976-1984); Associate Professor of Business Economics, University of Chicago (1967-1976). |
| |
| | Other Directorships Held: Director of MPS Group, Inc. (NYSE:MPS) (since 2003); Director, Petco Animal Supplies, Inc. (NASDAQ:PETC) (2002-2005); Director, Oxigene Inc. (NASDAQ:OXGN), biopharmaceutical company (since 1998); Director of Provide Commerce (NASDAQ: PRVD) (since 1998); Director, Veolia Environmental Corporation (successor to U.S. Filter Corporation) (water purification) (1991-2006); Director, Nicholas-Applegate Fund, Inc. (1987-2007). |
| |
| | Number of Portfolios Overseen by Trustee: 13 |
89
SUPPLEMENTARY INFORMATION — (Unaudited) — Continued
CORPORATE GOVERNANCE
| | |
Name, Address (1) Age Position(s) Held with Fund Length of Time Served (2) | | Principal Occupation(s) during Past 5 Years Other Directorship Held by Trustee Number of Portfolios in Fund complex Overseen by Trustee |
Charles H. Field, Jr. 7/24/1955 Secretary and Chief Compliance Officer Since May 2002 | | Principal Occupations: Managing Director and General Counsel, Nicholas-Applegate Capital Management, Nicholas-Applegate Securities, Nicholas-Applegate Holdings LLC (since February 2004); Deputy General Counsel, Nicholas-Applegate Capital Management (1996-2004). Other Directorships Held: NA |
| |
| | Number of Portfolios Overseen by Officer: 13 |
| |
Deborah A. Wussow 1/31/1960 Treasurer and Assistant Secretary Since August 2006 | | Principal Occupations: Senior Vice President and Chief Compliance Officer, Nicholas-Applegate Capital Management (since 2008), and previously Vice President and Director, Legal and Compliance, Nicholas-Applegate Capital Management (2005-2007) and Manager, Legal and Compliance, Nicholas-Applegate Capital Management (1995-2004). Other Directorships Held: NA Number of Portfolios Overseen by Officer: 13 |
| (1) | Unless otherwise noted, the address of the Trustees and Officers is c/o: Nicholas-Applegate Capital Management, 600 West Broadway, 32nd Floor, San Diego, California 92101. |
| (2) | Each Trustee serves for an indefinite term, until her or his successor is elected. |
90
TRUSTEES OF NICHOLAS-APPLEGATE INSTITUTIONAL FUNDS
Darlene T. DeRemer, Chairperson
Horacio A. Valeiras
John J. Murphy
Bradford K. Gallagher
Steven Grenadier
Arthur B. Laffer
OFFICERS
Horacio A. Valeiras, President
Charles H. Field, Jr., Secretary & Chief Compliance Officer
Deborah A. Wussow, Treasurer & Assistant Secretary
INVESTMENT ADVISER
Nicholas-Applegate Capital Management
DISTRIBUTOR
Nicholas-Applegate Securities
CUSTODIAN
Brown Brothers Harriman & Co., Private Bankers
TRANSFER AGENT
UMB Fund Services Group, Inc.
INDEPENDENT REGISTERED PUBLIC ACCOUNTING FIRM
PricewaterhouseCoopers LLP
| | |
 | | ARN0309INST |
| | |
 | | 600 West Broadway San Diego, California 92101 800.551.8043 |