November 30, 2008
International Growth Fund
Class I, II & R Shares

| | |
| TABLEOFCONTENTS | | |
| |
| THE FUND’S REVIEWAND OUTLOOK, PERFORMANCEAND SCHEDULEOF INVESTMENTS | | 3 |
| |
| FINANCIAL HIGHLIGHTS | | 10 |
| |
| STATEMENTOF ASSETSAND LIABILITIES | | 16 |
| |
| STATEMENTSOF OPERATIONS | | 17 |
| |
| STATEMENTSOF CHANGESIN NET ASSETS | | 18 |
| |
| NOTESTO FINANCIAL STATEMENTS | | 19 |
| |
| REPORTOF INDEPENDENT REGISTERED PUBLIC ACCOUNTING FIRM | | 25 |
| |
| SHAREHOLDER EXPENSE EXAMPLE (UNAUDITED) | | 26 |
| |
| SUPPLEMENTARY INFORMATION (UNAUDITED) | | 27 |
This report is authorized for distribution to shareholders and to others only when preceded or accompanied by a currently effective prospectus for Nicholas-Applegate Institutional Funds Class I, II & R shares. Distributor: Nicholas-Applegate Securities.
INTERNATIONAL GROWTH FUND
Management Team: Horacio A. Valeiras, CFA, Portfolio Manager and Chief Investment Officer; Pedro V. Marcal, Portfolio Manager
Goal: The International Growth Fund seeks to maximize long-term capital appreciation through investments primarily in companies with above-average earnings growth and positioned in strong growth areas.
Market Overview: Developed non-U.S. stock markets were weak from April 1 through November 30, 2008, with every country in the MSCI EAFE Index posting a steep decline in local currencies. A broad strengthening in the U.S. dollar increased the losses in dollar terms.
The period began on an upbeat note, as hopes that the worst of the U.S.-induced credit crisis had passed helped international equities advance in April and May. However, stock prices retreated over the summer — mainly due to inflation concerns — and then fell precipitously from September through November. The sell-off was driven by the collapse or near-collapse of several major U.S. and European financial institutions, which caused the global credit markets to seize up and economic activity to slow. Japan, Germany, Italy, Sweden and the overall euro zone all reported back-to-back drops in quarterly output, meeting the technical definition of a recession. The need for hedge funds to sell securities to reduce risk and meet client redemptions contributed to the sharp decline in equity prices.
Policymakers took aggressive steps to try and unfreeze the credit markets and stimulate growth. Globally, governments earmarked more than $3 trillion in emergency bailout and economic stimulus packages, and central banks slashed interest rates, including the European Central Bank and the Bank of England. Even the Bank of Japan cut its key rate from 0.5% to 0.3% — the country’s first monetary easing since March 2001. These measures helped stabilize investor confidence in the final days of November when international stock markets posted strong gains.
Performance: During the eight months ended November 30, 2008, the Fund’s Class I shares registered a 41.13% loss and the Fund’s Class R shares fell 41.33%. Results were in line with the 47.50% drop in the MSCI EAFE Index.
Portfolio Specifics: Like the market, weakness in the Fund was broad-based, with holdings in every country and sector generating a negative return. Compared to the index, major areas of relative strength included stock selection in Germany, Hong Kong and the consumer discretionary and telecommunication services sectors. Two of the portfolio’s best-performing holdings were Tognum, a German manufacturer of diesel engines that experienced resilient end-market demand, and Nitori, a Japanese furniture retailer whose low-price strategy was successful at attracting customers. Relative performance also benefited from the Fund’s sector
weightings, which are the result of our stock-by-stock investment decisions. Overweight positions in the defensive consumer staples, health care and utilities sectors were particularly helpful.
Sources of relative weakness included stock selection in Japan, Italy and the materials and energy sectors. In addition, the Fund’s exposure to emerging markets detracted. Emerging market equities were impacted by falling commodity prices — many developing countries export oil and other raw materials — and the generally risk-averse investment environment.
Market Outlook: It is possible that international equities will stage brief rallies in the months ahead, as government spending initiatives and inexpensive valuations capture investor attention. However, we believe that a sustained recovery will face substantial headwinds, including more negative economic news and additional selling by hedge funds. As events unfold, we will continue to consistently apply our proven, bottom-up process for selecting individual investments. By doing so, we are confident that the Fund will produce strong, long-term performance.
3
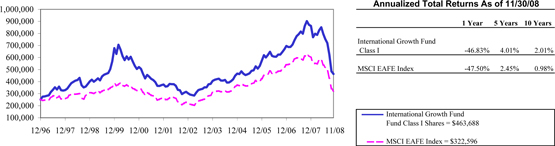
Comparison of Change in Value of $250,000 Investment in International Growth Fund Class I and II Shares with the MSCI EAFE Index.
|
 |
|
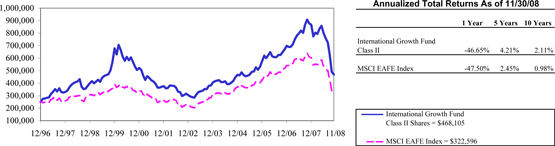 |
The graphs above show the value of hypothetical $250,000 investment in the Fund’s Class I and II shares compared with the Morgan Stanley Capital International Europe, Australasia, Far East Index (“MSCI EAFE”) over the periods indicated. The Fund’s Class I and Class II shares calculate their performance based upon the historical performance of their corresponding series of Nicholas-Applegate Mutual Funds (renamed ING Mutual Funds), adjusted to reflect all fees and expenses applicable to the Fund’s Class I and II shares. The Nicholas-Applegate Institutional Funds’ Class I shares were first available on May 7, 1999 and class II shares on January 23, 2006. The historical performance of Class II shares includes the performance of Class I shares for the periods prior to the inception of Class II shares. Average annual total returns figures include changes in principal value, reinvested dividends, and capital gain distributions.
The total returns shown above do not show the effects of income taxes on an individual’s investment. In most cases, taxes may reduce your actual investment returns on income or gains paid by the Fund or any gains you may realize if you sell your shares. Past performance cannot guarantee future results.
The MSCI EAFE Index is an unmanaged index of over 900 companies, and is a generally accepted benchmark for major overseas markets. Index weightings represent the relative capitalizations of ther major overseas markets included in the index on a U.S. dollar adjusted basis. The unmanaged index differs from the Fund in composition, does not pay management fees or expenses and includes reinvested dividends.
One cannot invest directly in an index.
Since markets can go down as well as up, investment return and principal value will fluctuate with market conditions, currency volatility and the social, economic and political climates of countries where the Fund invests. You may have a gain or loss when you sell you shares.
4
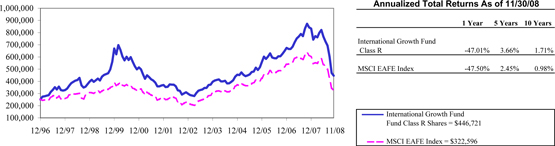
Comparison of Change in Value of $250,000 Investment in International Growth Fund Class R Shares with the MSCI EAFE Index.
The graph above shows the value of hypothetical $250,000 investment in the Fund’s Class R shares compared with the Morgan Stanley Capital International Europe, Australasia, Far East Index (“MSCI EAFE”) over the periods indicated. The Fund’s Class R shares were first available on May 21, 1999. Performance prior to the introduction of Class R shares reflects the historical performance of the Fund’s Class I shares.
This performance has been restated to reflect shareholder services fees of 0.25% applicable to Class R shares, but not Class I shares of the Fund. The Fund’s Class I shares calculate their performance based upon the historical performance of their corresponding series of Nicholas-Applegate Mutual Funds (renamed ING Mutual Funds), adjusted to reflect all fees and expenses applicable to the Fund’s Class I shares. Average annual total return figures include changes in principal value, reinvested dividends, and capital gain distributions.
The total returns shown above do not show the effects of income taxes on an individual’s investment. In most cases, taxes may reduce your actual investment returns on income or gains paid by the Fund or any gains you may realize if you sell your shares. Past performance cannot guarantee future results.
The MSCI EAFE Index is an unmanaged index of over 900 companies, and is a generally accepted benchmark for major overseas markets. Index weightings represent the relative capitalizations of ther major overseas markets included in the index on a U.S. dollar adjusted basis. The unmanaged index differs from the Fund in composition, does not pay management fees or expenses and includes reinvested dividends.
One cannot invest directly in an index.
Since markets can go down as well as up, investment return and principal value will fluctuate with market conditions, currency volatility and the social, economic and political climates of countries where the Fund invests. You may have a gain or loss when you sell you shares.
5
INTERNATIONAL GROWTH FUND
SCHEDULE OF INVESTMENTS
As of November 30, 2008
| | | | | |
| | | Number of Shares | | Value |
Common Stock - 91.7% | | | | | |
| | |
Australia - 4.4% | | | | | |
AMP, Ltd. | | 16,784 | | $ | 58,693 |
CSL, Ltd. | | 16,131 | | | 364,507 |
Incitec Pivot, Ltd. | | 45,403 | | | 78,351 |
Woolworths, Ltd. | | 3,670 | | | 64,049 |
| | | | | |
| | | | | 565,600 |
| | | | | |
| | |
Brazil - 0.6% | | | | | |
Cia Vale do Rio Doce Cl. B - ADR | | 6,500 | | | 77,610 |
| | | | | |
| | |
Canada - 2.1% | | | | | |
Potash Corp. of Saskatchewan* | | 1,300 | | | 80,132 |
Rogers Communications, Inc. Cl. B | | 5,600 | | | 161,972 |
Teck Cominco, Ltd. Cl. B | | 5,400 | | | 26,104 |
| | | | | |
| | | | | 268,208 |
| | | | | |
| | |
Denmark - 1.9% | | | | | |
Novo Nordisk AS Cl. B | | 4,750 | | | 242,731 |
| | | | | |
| | |
Finland - 0.3% | | | | | |
Outotec OYJ | | 2,886 | | | 40,356 |
| | | | | |
| | |
France - 8.4% | | | | | |
Alstom SA | | 3,327 | | | 176,464 |
BNP Paribas | | 2,221 | | | 122,100 |
Cie Generale de Geophysique-Veritas* | | 4,701 | | | 76,771 |
Electricite de France | | 1,244 | | | 71,893 |
France Telecom SA | | 2,714 | | | 69,634 |
GDF Suez | | 7,515 | | | 299,948 |
Total SA | | 3,955 | | | 206,009 |
Veolia Environnement | | 2,225 | | | 55,252 |
| | | | | |
| | | | | 1,078,071 |
| | | | | |
| | |
Germany - 8.0% | | | | | |
Bayer AG | | 2,421 | | | 124,969 |
Deutsche Telekom AG | | 9,215 | | | 127,336 |
E.ON AG | | 5,903 | | | 206,208 |
Rhoen Klinikum AG | | 4,076 | | | 77,063 |
RWE AG | | 1,720 | | | 144,220 |
SAP AG | | 4,396 | | | 149,716 |
Siemens AG | | 1,438 | | | 85,888 |
Stada Arzneimittel AG | | 4,143 | | | 111,765 |
| | | | | |
| | | | | 1,027,165 |
| | | | | |
See Accompanying Notes to Financials Statements.
6
SCHEDULE OF INVESTMENTS – (CONTINUED)
As of November 30, 2008
| | | | | |
| | | Number of Shares | | Value |
Greece - 1.1% | | | | | |
National Bank of Greece SA | | 3,844 | | $ | 72,189 |
Piraeus Bank SA | | 6,760 | | | 65,877 |
| | | | | |
| | | | | 138,066 |
| | | | | |
| | |
Hong Kong - 1.2% | | | | | |
HongKong Electric Holdings | | 28,000 | | | 157,158 |
| | | | | |
| | |
Ireland - 0.6% | | | | | |
Icon PLC - ADR* | | 3,500 | | | 74,165 |
| | | | | |
| | |
Israel - 1.7% | | | | | |
Teva Pharmaceutical Industries, Ltd. - ADR | | 5,200 | | | 224,380 |
| | | | | |
| | |
Italy - 1.6% | | | | | |
Saipem SpA | | 8,395 | | | 129,533 |
Snam Rete Gas SpA | | 13,893 | | | 72,499 |
| | | | | |
| | | | | 202,032 |
| | | | | |
| | |
Japan - 25.6% | | | | | |
Capcom Co., Ltd. | | 3,200 | | | 65,112 |
East JapanRailway Co. | | 33 | | | 254,659 |
Honda Motor Co., Ltd. | | 4,800 | | | 105,076 |
Japan Tobacco, Inc. | | 52 | | | 191,086 |
KDDI Corp. | | 26 | | | 169,248 |
Kirin Holdings Co., Ltd. | | 5,000 | | | 60,791 |
Mitsubishi Corp. | | 8,200 | | | 102,021 |
Mitsubishi Electric Corp. | | 14,300 | | | 76,871 |
Mitsubishi Estate Co., Ltd. | | 4,300 | | | 64,108 |
Mitsubishi UFJ Financial Group, Inc. | | 31,700 | | | 173,402 |
Mizuho Financial Group, Inc. | | 23 | | | 59,888 |
Nintendo Co., Ltd. | | 900 | | | 279,889 |
Nitori Co., Ltd. | | 2,400 | | | 171,348 |
Nomura Holdings, Inc. | | 15,300 | | | 110,519 |
Osaka Gas Co. Ltd. | | 30,000 | | | 114,337 |
Secom Co., Ltd. | | 2,200 | | | 102,326 |
Sumitomo Mitsui Financial Group, Inc. | | 37 | | | 134,023 |
T&D Holdings, Inc. | | 1,950 | | | 73,090 |
Takeda Pharmaceutical Co. Ltd. | | 2,700 | | | 130,684 |
The Japan Steel Works, Ltd. | | 17,000 | | | 174,739 |
Tokio Marine Holdings, Inc. | | 1,900 | | | 46,181 |
Tokyo Electric Power Co., Inc. | | 5,500 | | | 163,709 |
Toyo Tanso Co., Ltd. | | 3,100 | | | 149,719 |
Toyota Motor Corp. | | 3,100 | | | 97,643 |
See Accompanying Notes to Financials Statements.
7
SCHEDULE OF INVESTMENTS – (CONTINUED)
As of November 30, 2008
| | | | | |
| | | Number of Shares | | Value |
Japan - (Continued) | | | | | |
Unicharm Corp. | | 1,500 | | $ | 103,470 |
West Japan Railway Co. | | 29 | | | 129,099 |
| | | | | |
| | | | | 3,303,038 |
| | | | | |
| | |
Netherlands - 1.5% | | | | | |
Royal KPN NV | | 14,415 | | | 198,240 |
| | | | | |
| | |
Republic of China - 0.5% | | | | | |
Anhui Conch Cement Co., Ltd.* | | 16,000 | | | 66,063 |
| | | | | |
| | |
Spain - 1.5% | | | | | |
Iberdrola SA | | 7,889 | | | 58,260 |
Telefonica SA | | 6,915 | | | 139,338 |
| | | | | |
| | | | | 197,598 |
| | | | | |
| | |
Switzerland - 10.3% | | | | | |
ACE, Ltd. | | 5,400 | | | 282,150 |
Julius Baer Holding AG | | 2,850 | | | 93,291 |
Nestle SA | | 9,952 | | | 360,013 |
Roche Holding AG | | 2,367 | | | 331,281 |
Syngenta AG | | 534 | | | 95,928 |
Synthes, Inc. | | 1,377 | | | 159,506 |
| | | | | |
| | | | | 1,322,169 |
| | | | | |
| | |
United Kingdom - 20.4% | | | | | |
BG Group PLC | | 9,382 | | | 132,445 |
BP PLC | | 20,126 | | | 162,673 |
British American Tobacco PLC | | 13,693 | | | 356,770 |
Centrica PLC | | 14,935 | | | 54,199 |
Diageo PLC | | 14,858 | | | 206,786 |
HSBC Holdings PLC | | 31,200 | | | 336,953 |
Imperial Tobacco Group PLC | | 10,552 | | | 261,979 |
International Power PLC | | 36,487 | | | 144,308 |
Reckitt Benckiser Group PLC | | 4,098 | | | 173,617 |
Royal Dutch Shell PLC Cl. A | | 5,748 | | | 153,292 |
SSL International PLC | | 15,846 | | | 116,164 |
Standard Chartered PLC | | 5,600 | | | 68,644 |
Unilever PLC | | 10,346 | | | 237,020 |
Vodafone Group PLC | | 86,287 | | | 168,417 |
Wellstream Holdings PLC* | | 9,805 | | | 57,924 |
| | | | | |
| | | | | 2,631,191 |
| | | | | |
Total Common Stock (Cost: $16,617,138) | | | | $ | 11,813,841 |
| | | | | |
Preferred Stock - 4.0% | | | | | |
| | |
Brazil - 0.5% | | | | | |
Usinas Siderurgicas de Minas Gerais SA | | 6,500 | | | 66,423 |
| | | | | |
See Accompanying Notes to Financials Statements.
8
SCHEDULE OF INVESTMENTS – (CONTINUED)
As of November 30, 2008
| | | | | |
| | | Number of Shares | | Value |
Germany - 3.5% | | | | | |
Fresenius SE | | 5,239 | | $ | 289,908 |
Henkel KGaA | | 5,883 | | | 165,722 |
| | | | | |
| | | | | 455,630 |
| | | | | |
Total Preferred Stock (Cost: $868,454) | | | | | 522,053 |
| | | | | |
Rights - 0.1% | | | | | |
| | |
Australia - 0.0% | | | | | |
Incitec Pivot Ltd., expires 12/4/08* | | 12,611 | | | 1,232 |
| | | | | |
| | |
United Kingdom - 0.1% | | | | | |
Centrica PLC, expires 12/08/2008* | | 5,600 | | | 6,359 |
Standard Chartered, expires 12/17/08* | | 1,846 | | | 11,663 |
| | | | | |
| | | | | 18,022 |
| | | | | |
Total Rights (Cost: $0) | | | | | 19,254 |
| | | | | |
| | |
| | | Principal Amount | | |
Short Term Investment - 3.2% | | | | | |
| | |
Time Deposit - 3.2% | | | | | |
Bank of America Toronto | | | | | |
0.250%, 12/01/08 (Cost: $406,093) | | 406,093 | | | 406,093 |
| | | | | |
Total Investments -99.0% (Cost: $17,891,685) | | | | $ | 12,761,241 |
| | | | | |
Other Assets In Excess Of Liabilities - 1.0% | | | | | 130,766 |
| | | | | |
Net Assets - 100.0% | | | | $ | 12,892,007 |
| | | | | |
| * | Non-income producing securities. |
ADR - American Depository Receipt
SCHEDULEOF INVESTMENTSBY SECTOR
as of November 30, 2008
| | | |
Sector | | Percent of Net Assets | |
Consumer, Non-cyclical | | 34.2 | % |
Financial | | 13.8 | |
Utilities | | 11.9 | |
Industrial | | 8.9 | |
Communications | | 8.0 | |
Energy | | 7.1 | |
Consumer, Cyclical | | 5.9 | |
Basic Materials | | 4.3 | |
Technology | | 1.7 | |
Short Term Investment | | 3.2 | |
| | | |
Total Investments | | 99.0 | |
Other assets in excess of liabilities | | 1.0 | |
| | | |
Net Assets | | 100.0 | % |
| | | |
See Accompanying Notes to Financials Statements.
9
Financial Highlights
For a Class I share outstanding during the period indicated
| | | | | | | | | | | | | | | | | | | | | | | | | | | | | |
| | | | | | | | | | | | | Distributions from: | | | | | | |
| | | Net Asset
Value,
Beginning | | Net
Investment
Income
(Loss) (1) | | Net
Realized
and
Unrealized
Gains
(Loss) | | | Total from
Investment
Operations | | | Net
Investment
Income | | | Net
Realized
Capital
Gains | | | Total
Distributions | | | Net
Asset
Value,
Ending |
| | | GLOBAL EQUITY FUND | | | | | | | | | | | | | | | | | |
INTERNATIONAL GROWTH | | | | | | | | | | | | | | | | | | | | | | | | | | | | | |
For the period 4/01/08 through 11/30/08* | | $ | 8.46 | | $ | 0.10 | | $ | (3.58 | ) | | $ | (3.48 | ) | | $ | — | | | $ | — | | | $ | — | | | $ | 4.98 |
For the year ended 03/31/08 | | | 22.35 | | | 0.17 | | | 3.82 | | | | 3.99 | | | | (0.29 | ) | | | (17.59 | ) | | | (17.88 | ) | | | 8.46 |
For the year ended 03/31/07 | | | 22.69 | | | 0.07 | | | 2.86 | | | | 2.93 | | | | (0.07 | ) | | | (3.20 | ) | | | (3.27 | ) | | | 22.35 |
For the year ended 03/31/06 | | | 20.47 | | | 0.16 | | | 6.05 | | | | 6.21 | | | | — | | | | (3.99 | ) | | | (3.99 | ) | | | 22.69 |
For the year ended 03/31/05 | | | 19.09 | | | 0.08 | | | 1.72 | | | | 1.80 | | | | — | | | | (0.42 | ) | | | (0.42 | ) | | | 20.47 |
For the year ended 03/31/04 | | | 12.83 | | | 0.30 | | | 6.00 | | | | 6.30 | | | | (0.04 | ) | | | — | | | | (0.04 | ) | | | 19.09 |
| (1) | Net investment income per share is calculated by dividing net investment income for the period by the average shares outstanding during the period. |
| (2) | Total returns are not annualized for periods less than one year. |
| (3) | Ratios are annualized for periods of less than one year. Expense reimbursements reflect voluntary reductions to total expenses, as discussed in the notes to financial statements. Such amounts would decrease net investment income (loss) ratios had such reductions not occurred. |
| (4) | Net expenses include certain items not subject to expense reimbursement for periods prior to January 23, 2006. |
| * | On November 14, 2008, the Board of Trustees approved a change in the Fund’s fiscal year from March 31 to November 30. |
See Accompanying Notes to Financials Statements.
10
Financial Highlights – (Continued)
For a Class I share outstanding during the period indicated
| | | | | | | | | | | | | | | | | | | | | | | | |
| | | | | | | | Ratios to Average Net Assets (3) | | | | |
| | | Total
Return (2) | | | Net
Assets,
Ending
(in 000’s) | | Net
Investment
Income
(Loss) | | | Total
Expenses | | | Expense
(Reimbursements)/
Recoupment | | | Expenses Net of
Reimbursement/
Recoupment | | | Expenses Net of
Reimbursement/
Recoupment
Offset (4) | | | Fund’s
Portfolio
Turnover
Rate | |
INTERNATIONAL GROWTH | | | | | | | | | | | | | | | | | | | | | | | | |
For the period 4/01/08 through 11/30/08* | | (41.13 | )% | | $ | 5,878 | | 1.90 | % | | 1.42 | % | | — | | | 1.42 | % | | 1.12 | % | | 29 | % |
For the year ended 03/31/08 | | 11.37 | % | | | 9,496 | | 1.02 | % | | 1.38 | % | | — | | | 1.38 | % | | 0.99 | % | | 113 | % |
For the year ended 03/31/07 | | 13.80 | % | | | 15,000 | | (0.30 | )% | | 1.41 | % | | — | | | 1.41 | % | | 1.14 | % | | 119 | % |
For the year ended 03/31/06 | | 33.63 | % | | | 45,889 | | 0.73 | % | | 1.37 | % | | (0.00 | )% | | 1.37 | % | | 0.99 | % | | 167 | % |
For the year ended 03/31/05 | | 9.49 | % | | | 41,394 | | 0.42 | % | | 1.39 | % | | (0.00 | )% | | 1.39 | % | | 1.08 | % | | 203 | % |
For the year ended 03/31/04 | | 49.17 | % | | | 51,450 | | 1.35 | % | | 1.49 | % | | (0.04 | )% | | 1.45 | % | | 1.19 | % | | 186 | % |
| (1) | Net investment income per share is calculated by dividing net investment income for the period by the average shares outstanding during the period. |
| (2) | Total returns are not annualized for periods less than one year. |
| (3) | Ratios are annualized for periods of less than one year. Expense reimbursements reflect voluntary reductions to total expenses, as discussed in the notes to financial statements. Such amounts would decrease net investment income (loss) ratios had such reductions not occurred. |
| (4) | Net expenses include certain items not subject to expense reimbursement for periods prior to January 23, 2006. |
| * | On November 14, 2008, the Board of Trustees approved a change in the Fund’s fiscal year from March 31 to November 30. |
See Accompanying Notes to Financials Statements.
11
Financial Highlights – (Continued)
For a Class II share outstanding during the period indicated
| | | | | | | | | | | | | | | | | | | | | | | | | | | | | |
| | | | | | | | | | | | | Distributions from: | | | | | | |
| | | Net Asset
Value,
Beginning | | Net
Investment
Income
(Loss) (1) | | Net
Realized
and
Unrealized
Gains
(Loss) | | | Total from
Investment
Operations | | | Net
Investment
Income | | | Net
Realized
Capital
Gains | | | Total
Distributions | | | Net
Asset
Value,
Ending |
| | | GLOBAL EQUITY FUND | | | | | | | | | | | | | | | | | |
INTERNATIONAL GROWTH | | | | | | | | | | | | | | | | | | | | | | | | | | | | | |
For the period 4/01/08 through 11/30/08* | | $ | 7.71 | | $ | 0.11 | | $ | (3.27 | ) | | $ | (3.16 | ) | | $ | — | | | $ | — | | | $ | — | | | $ | 4.55 |
For the year ended 03/31/08 | | | 22.36 | | | 0.33 | | | 3.24 | | | | 3.57 | | | | (0.63 | ) | | | (17.59 | ) | | | (18.22 | ) | | | 7.71 |
For the year ended 03/31/07 | | | 22.71 | | | 0.14 | | | 2.86 | | | | 3.00 | | | | (0.15 | ) | | | (3.20 | ) | | | (3.35 | ) | | | 22.36 |
1/23/06 (Commenced) to 03/31/06 | | | 21.64 | | | 1.85 | | | (0.78 | ) | | | 1.07 | | | | — | | | | — | | | | — | | | | 22.71 |
| (1) | Net investment income per share is calculated by dividing net investment income for the period by the average shares outstanding during the period. |
| (2) | Total returns are not annualized for periods less than one year. |
| (3) | Ratios are annualized for periods of less than one year. Expense reimbursements reflect voluntary reductions to total expenses, as discussed in the notes to financial statements. Such amounts would decrease net investment income (loss) ratios had such reductions not occurred. |
| (4) | Net expenses include certain items not subject to expense reimbursement for periods prior to January 23, 2006. (5) Inception to date Return. |
| * | On November 14, 2008, the Board of Trustees approved a change in the Fund’s fiscal year from March 31 to November 30. |
See Accompanying Notes to Financials Statements.
12
Financial Highlights – (Continued)
For a Class II share outstanding during the period indicated
| | | | | | | | | | | | | | | | | | | | | | | | |
| | | | | | | | Ratios to Average Net Assets (3) | | | | |
| | | Total
Return (2) | | | Net
Assets,
Ending
(in 000’s) | | Net
Investment
Income
(Loss) | | | Total
Expenses | | | Expense
(Reimbursements)/
Recoupment | | | Expenses Net of
Reimbursement/
Recoupment | | | Expenses Net of
Reimbursement/
Recoupment
Offset (4) | | | Fund’s
Portfolio
Turnover
Rate | |
INTERNATIONAL GROWTH | | | | | | | | | | | | | | | | | | | | | | | | |
For the period 4/01/08 through 11/30/08* | | (41.06 | )% | | $ | 5,564 | | 2.37 | % | | 1.02 | % | | — | | | 1.02 | % | | 0.70 | % | | 29 | % |
For the year ended 03/31/08 | | 9.52 | % | | | 11,518 | | 1.56 | % | | 0.99 | % | | — | | | 0.99 | % | | 0.72 | % | | 113 | % |
For the year ended 03/31/07 | | 14.12 | % | | | 52,420 | | 0.64 | % | | 1.02 | % | | — | | | 1.02 | % | | 0.75 | % | | 119 | % |
1/23/06 (Commenced) to 03/31/06 | | 4.94 | %(5) | | | 56,501 | | 1.21 | % | | 0.99 | % | | (0.00 | )% | | 0.99 | % | | 0.73 | % | | 167 | % |
| (1) | Net investment income per share is calculated by dividing net investment income for the period by the average shares outstanding during the period. |
| (2) | Total returns are not annualized for periods less than one year. |
| (3) | Ratios are annualized for periods of less than one year. Expense reimbursements reflect voluntary reductions to total expenses, as discussed in the notes to financial statements. Such amounts would decrease net investment income (loss) ratios had such reductions not occurred. |
| (4) | Net expenses include certain items not subject to expense reimbursement for periods prior to January 23, 2006. (5) Inception to date Return. |
| * | On November 14, 2008, the Board of Trustees approved a change in the Fund’s fiscal year from March 31 to November 30. |
See Accompanying Notes to Financials Statements.
13
Financial Highlights – (Continued)
For a Class R share outstanding during the period indicated
| | | | | | | | | | | | | | | | | | | | | | | | |
| | | | | | | | Ratios to Average Net Assets (3) | | | | |
| | | Total
Return (2) | | | Net
Assets,
Ending
(in 000’s) | | Net
Investment
Income
(Loss) | | | Total
Expenses | | | Expense
(Reimbursements)/
Recoupment | | | Expenses Net of
Reimbursement/
Recoupment | | | Expenses Net of
Reimbursement/
Recoupment
Offset (4) | | | Fund’s
Portfolio
Turnover
Rate | |
INTERNATIONAL GROWTH | | | | | | | | | | | | | | | | | | | | | | | | |
For the period 4/01/08 through 11/30/08* | | (41.33 | )% | | $ | 1,450 | | 1.67 | % | | 1.67 | % | | — | | | 1.67 | % | | 1.37 | % | | 29 | % |
For the year ended 03/31/08 | | 11.05 | % | | | 2,595 | | 0.74 | % | | 1.64 | % | | — | | | 1.64 | % | | 1.24 | % | | 113 | % |
For the year ended 03/31/07 | | 13.36 | % | | | 2,294 | | (0.05 | )% | | 1.67 | % | | — | | | 1.67 | % | | 1.41 | % | | 119 | % |
For the year ended 03/31/06 | | 33.34 | % | | | 1,776 | | 0.57 | % | | 1.62 | % | | (0.00 | )% | | 1.62 | % | | 1.24 | % | | 167 | % |
For the year ended 03/31/05 | | 8.94 | % | | | 1,749 | | 0.80 | % | | 1.66 | % | | (0.02 | )% | | 1.64 | % | | 1.32 | % | | 203 | % |
For the year ended 03/31/04 | | 48.86 | % | | | 9,236 | | 0.71 | % | | 1.74 | % | | (0.04 | )% | | 1.70 | % | | 1.44 | % | | 186 | % |
| (1) | Net investment income per share is calculated by dividing net investment income for the period by the average shares outstanding during the period. |
| (2) | Total returns are not annualized for periods less than one year. |
| (3) | Ratios are annualized for periods of less than one year. Expense reimbursements reflect voluntary reductions to total expenses, as discussed in the notes to financial statements. Such amounts would decrease net investment income (loss) ratios had such reductions not occurred. |
| (4) | Net expenses include certain items not subject to expense reimbursement for periods prior to January 23, 2006. |
| * | On November 14, 2008, the Board of Trustees approved a change in the Fund’s fiscal year from March 31 to November 30. |
See Accompanying Notes to Financials Statements.
14
Financial Highlights – (Continued)
For a Class R share outstanding during the period indicated
| | | | | | | | | | | | | | | | | | | | | | | | | | | | | | |
| | | | | | | | | | | | | | Distributions from: | | | | | | |
| | | Net Asset
Value,
Beginning | | Net
Investment
Income
(Loss) (1) | | | Net
Realized
and
Unrealized
Gains
(Loss) | | | Total from
Investment
Operations | | | Net
Investment
Income | | | Net
Realized
Capital
Gains | | | Total
Distributions | | | Net
Asset
Value,
Ending |
| | | GLOBAL EQUITY FUND | | | | | | | | | | | | | | | | | | |
INTERNATIONAL GROWTH | | | | | | | | | | | | | | | | | | | | | | | | | | | | | | |
For the period 4/01/08 through 11/30/08* | | $ | 7.08 | | $ | 0.07 | | | $ | (2.99 | ) | | $ | (2.92 | ) | | $ | — | | | $ | — | | | $ | — | | | $ | 4.16 |
For the year ended 03/31/08 | | | 21.78 | | | 0.10 | | | | 3.85 | | | | 3.95 | | | | (1.06 | ) | | | (17.59 | ) | | | (18.65 | ) | | | 7.08 |
For the year ended 03/31/07 | | | 22.26 | | | (0.01 | ) | | | 2.79 | | | | 2.78 | | | | (0.06 | ) | | | (3.20 | ) | | | (3.26 | ) | | | 21.78 |
For the year ended 03/31/06 | | | 20.19 | | | 0.12 | | | | 5.94 | | | | 6.06 | | | | — | | | | (3.99 | ) | | | (3.99 | ) | | | 22.26 |
For the year ended 03/31/05 | | | 18.93 | | | 0.15 | | | | 1.53 | | | | 1.68 | | | | — | | | | (0.42 | ) | | | (0.42 | ) | | | 20.19 |
For the year ended 03/31/04 | | | 12.72 | | | 0.12 | | | | 6.10 | | | | 6.22 | | | | (0.01 | ) | | | — | | | | (0.01 | ) | | | 18.93 |
| (1) | Net investment income per share is calculated by dividing net investment income for the period by the average shares outstanding during the period. |
| (2) | Total returns are not annualized for periods less than one year. |
| (3) | Ratios are annualized for periods of less than one year. Expense reimbursements reflect voluntary reductions to total expenses, as discussed in the notes to financial statements. Such amounts would decrease net investment income (loss) ratios had such reductions not occurred. |
| (4) | Net expenses include certain items not subject to expense reimbursement for periods prior to January 23, 2006. |
| * | On November 14, 2008, the Board of Trustees approved a change in the Fund’s fiscal year from March 31 to November 30. |
See Accompanying Notes to Financials Statements.
15
Nicholas-Applegate Institutional Funds
International Growth
Statements of Assets and Liabilities
November 30, 2008
| | | | |
Assets | | | | |
Investments, at value* | | $ | 12,761,241 | |
Foreign currencies, at value** | | | 7,405 | |
Cash | | | 18 | |
Receivables: | | | | |
Investment securities sold | | | 50,640 | |
Capital shares sold | | | 14,193 | |
Dividends | | | 62,181 | |
Foreign taxes receivable | | | 32,092 | |
Other | | | 2,674 | |
| | | | |
| |
Total assets | | | 12,930,444 | |
| | | | |
| |
Liabilities | | | | |
Payables: | | | | |
Capital shares redeemed | | $ | 21,450 | |
Investment advisor | | | 5,245 | |
Accrued expenses and other liabilities | | | 11,742 | |
| | | | |
| |
Total Liabilities | | | 38,437 | |
| | | | |
| |
NET ASSETS | | $ | 12,892,007 | |
| | | | |
| |
* Investments, at cost | | | 17,891,685 | |
| | | | |
** Foreign currencies, at cost | | | 7,908 | |
| | | | |
| |
NET ASSETS CONSIST OF: | | | | |
Paid-in capital | | $ | 29,128,328 | |
Undistributed net investment income (loss) | | | 735,406 | |
Accumulated net realized gain (loss) on investments and foreign currencies | | | (11,843,136 | ) |
Net unrealized appreciation (depreciation) of investments and of other assets and liabilities denominated in foreign currencies | | | (5,128,591 | ) |
| | | | |
| |
Net Assets applicable to all shares outstanding | | $ | 12,892,007 | |
| | | | |
| |
Net Assets of Class I Shares | | $ | 5,878,279 | |
Net Assets of Class II Shares | | | 5,563,775 | |
Net Assets of Class R Shares | | | 1,449,953 | |
| | | | |
| |
Class I Shares outstanding | | | 1,180,908 | |
Class II Shares outstanding | | | 1,222,297 | |
Class R Shares outstanding | | | 348,414 | |
| | | | |
| |
Net Asset Value—Class I Shares | | $ | 4.98 | |
| |
Net Asset Value—Class II Shares | | $ | 4.55 | |
| |
Net Asset Value—Class R Shares | | $ | 4.16 | |
See Accompanying Notes to Financials Statements.
16
Nicholas-Applegate Institutional Funds
International Growth
Statements of Operations
| | | | | | | | |
| | | April 1, 2008
through
November 30, 2008 | | | Year ended
March 31, 2008 | |
Investment Income | | | | | | | | |
Dividends, net of foreign taxes* | | $ | 419,598 | | | $ | 844,235 | |
| | | — | | | | 384 | |
| | | | | | | | |
Total Income | | | 419,598 | | | | 844,619 | |
| | | | | | | | |
| | |
Expenses | | | | | | | | |
Advisory fee | | | 68,775 | | | | 194,196 | |
Administration fees | | | 92,198 | | | | 239,041 | |
Shareholder Servicing fees | | | 3,934 | | | | 6,769 | |
Professional fees | | | 754 | | | | — | |
Trustees’ fees and expenses | | | 4,805 | | | | 8,364 | |
Interest and credit facility fee | | | 182 | | | | 893 | |
Miscellaneous | | | 2,004 | | | | 902 | |
| | | | | | | | |
| | |
Total Expenses | | | 172,652 | | | | 450,165 | |
| | |
Expense offset | | | (41,886 | ) | | | (121,261 | ) |
| | | | | | | | |
| | |
Net Expenses | | | 130,766 | | | | 328,904 | |
| | | | | | | | |
| | |
Net Investment Income | | | 288,832 | | | | 515,715 | |
| | | | | | | | |
| | |
Net Realized and Unrealized Gain (Loss) on Investments | | | | | | | | |
Realized gain from: | | | | | | | | |
Securities | | | (2,721,741 | ) | | | 22,050,147 | |
Foreign currency transactions | | | (13,982 | ) | | | (17,466 | ) |
| | | | | | | | |
Net realized gain (loss) | | | (2,735,723 | ) | | | 22,032,681 | |
| | | | | | | | |
| | |
Change in unrealized appreciation (depreciation) of: | | | | | | | | |
Investments | | | (6,832,304 | ) | | | (11,503,281 | ) |
Other assets and liabilities denominated in foreign currencies | | | (5,651 | ) | | | 1,286,337 | |
| | | | | | | | |
| | |
Net unrealized appreciation (depreciation) | | | (6,837,955 | ) | | | (10,216,944 | ) |
| | | | | | | | |
| | |
Net Gain (Loss) on Investments | | | (9,573,678 | ) | | | 11,815,737 | |
| | | | | | | | |
Net increase (decrease) in net assets resulting from operations | | $ | (9,284,846 | ) | | | 12,331,452 | |
| | | | | | | | |
* Foreign taxes withheld | | $ | 45,782 | | | | 82,306 | |
| | | | | | | | |
See Accompanying Notes to Financials Statements.
17
Nicholas-Applegate Institutional Funds
International Growth
Statements of Changes in Net Assets
| | | | | | | | | | | | |
| | | April 1, 2008
through
November 30, 2008 | | | Year ended
March 31, 2008 | | | Year ended
March 31, 2007 | |
Increase (Decrease) In Net Assets From Investments Operations: | | | | | | | | | | | | |
Net investment income | | $ | 288,832 | | | $ | 515,715 | | | $ | 461,096 | |
Net realized gain (loss) | | | (2,735,723 | ) | | | 22,032,681 | | | | 19,578,811 | |
Net unrealized appreciation (depreciation) | | | (6,837,955 | ) | | | (10,216,944 | ) | | | (7,320,021 | ) |
| | | | | | | | | | | | |
Investment operations | | | (9,284,846 | ) | | | 12,331,452 | | | | 12,719,886 | |
| | | | | | | | | | | | |
| | | |
Distributions to Shareholders: | | | | | | | | | | | | |
| | | |
From net investment income | | | | | | | | | | | | |
Class I | | | — | | | | (102,579 | ) | | | (129,548 | ) |
Class II | | | — | | | | (264,648 | ) | | | (321,754 | ) |
Class R | | | — | | | | (122,626 | ) | | | (4,547 | ) |
From net realized gains | | | — | | | | | | | | | |
Class I | | | — | | | | (6,119,767 | ) | | | (6,240,893 | ) |
Class II | | | — | | | | (7,384,655 | ) | | | (7,047,836 | ) |
Class R | | | — | | | | (2,036,861 | ) | | | (264,556 | ) |
| | | | | | | | | | | | |
Total distributions | | | — | | | | (16,031,136 | ) | | | (14,009,134 | ) |
| | | | | | | | | | | | |
| | | |
From Capital Share Transactions: | | | | | | | | | | | | |
Proceeds from shares sold | | | | | | | | | | | | |
Class I | | | 1,781,413 | | | | 4,506,739 | | | | 3,016,780 | |
Class II | | | — | | | | 12,456,347 | | | | 50,000 | |
Class R | | | 412,003 | | | | 952,934 | | | | 995,312 | |
Distributions reinvested | | | | | | | | | | | | |
Class I | | | — | | | | 6,217,911 | | | | 6,370,440 | |
Class II | | | — | | | | 7,649,303 | | | | 7,369,591 | |
Class R | | | — | | | | 2,159,486 | | | | 269,106 | |
Cost of shares redeemed | | | | | | | | | | | | |
Class I | | | (1,513,279 | ) | | | (11,550,042 | ) | | | (39,097,481 | ) |
Class II | | | (1,649,606 | ) | | | (63,923,305 | ) | | | (11,428,000 | ) |
Class R | | | (463,128 | ) | | | (873,729 | ) | | | (709,385 | ) |
| | | | | | | | | | | | |
Net decrease in net assets from share transactions | | | (1,432,597 | ) | | | (42,404,356 | ) | | | (33,163,637 | ) |
| | | | | | | | | | | | |
Net Increase (Decrease) in Net Assets | | | (10,717,443 | ) | | | 46,104,040 | | | | (34,452,885 | ) |
Net Assets | | | | | | | | | | | | |
Beginning | | $ | 23,609,450 | | | $ | 69,713,490 | | | $ | 104,166,375 | |
| | | | | | | | | | | | |
Ending | | $ | 12,892,007 | | | $ | 23,609,450 | | | $ | 69,713,490 | |
| | | | | | | | | | | | |
| | | |
Undistributed net investment income, ending | | | 749,388 | | | | 460,556 | | | | 3,363,093 | |
| | | | | | | | | | | | |
| | | |
Class I—Capital Share Activity | | | | | | | | | | | | |
Shares sold | | | 270,863 | | | | 318,579 | | | | 134,231 | |
Distributions reinvested | | | — | | | | 675,126 | | | | 302,921 | |
Shares redeemed | | | (212,702 | ) | | | (542,226 | ) | | | (1,787,977 | ) |
| | | | | | | | | | | | |
Net Class I Share Activity | | | 58,161 | | | | 451,479 | | | | (1,350,825 | ) |
| | | | | | | | | | | | |
| | | |
Class II—Capital Share Activity | | | | | | | | | | | | |
| | | |
Shares sold | | | — | | | | 615,162 | | | | 2,199 | |
Distributions reinvested | | | — | | | | 911,717 | | | | 350,266 | |
Shares redeemed | | | (271,053 | ) | | | (2,377,559 | ) | | | (496,447 | ) |
| | | | | | | | | | | | |
Net Class II Share Activity | | | (271,053 | ) | | | (850,680 | ) | | | (143,982 | ) |
| | | | | | | | | | | | |
| | | |
Class R—Capital Share Activity | | | | | | | | | | | | |
| | | |
Shares sold | | | 61,380 | | | | 48,877 | | | | 45,495 | |
Distributions reinvested | | | — | | | | 279,726 | | | | 13,108 | |
Shares redeemed | | | (79,329 | ) | | | (67,553 | ) | | | (33,088 | ) |
| | | | | | | | | | | | |
Net Class R Share Activity | | | (17,949 | ) | | | 261,050 | | | | 25,515 | |
| | | | | | | | | | | | |
See Accompanying Notes to Financials Statements.
18
Notes to Financial Statements
Note A — ORGANIZATION
The International Growth Fund (the “Fund”) is one series of shares of beneficial interest of the Nicholas-Applegate Institutional Funds (the “Trust”), an open-end investment management company. The Trust was established as a Delaware business trust on December 17, 1992 and currently consists of fourteen separate portfolios including the International Growth Fund (the “Fund”). The Fund’s investment objectives, strategies and risks are discussed in the Fund’s current prospectus. The Fund has issued Classes I shares (“Class I”), Class II shares (“Class II”) and Class R shares (“Class R”). No shares have a sales charge. Class R shares are charged a distribution fee. All share classes for the Fund are covered in this report. On November 14, 2008 the Board of Trustees approved a change in the Fund’s fiscal year end from March 31 to November 30. The Board of Trustees also approved pending the reorganization of the Fund, Class II and R are closed to new investors.
Note B — SIGNIFICANT ACCOUNTING POLICIES
Significant accounting policies consistently followed by the Fund in preparing these financial statements are described below. The policies conform with accounting principles generally accepted in the United States.
Security Valuations
Equity securities, including ADRs, SDR’s and GDRs, that are traded on a stock exchange or on the NASDAQ National Market System are valued at the last sale price as of the close of business on the New York Stock Exchange (normally 4:00 P.M. New York time) on the day the securities are being valued, or lacking any sales, at the mean between the closing bid and asked prices. Securities listed or traded on certain non-U.S. exchanges whose operations are similar to the United States over-the-counter market are valued at the price within the limits of the latest available current bid and asked prices deemed by the Adviser to best reflect fair value. A security that is listed or traded on more than one exchange is valued at the quotation on the exchange determined to be the primary market for such security by the Adviser. The Adviser has determined the Xetra is the primary market in Germany. Equity Linked Notes (“ELN’s”) are valued by using the closing local price for the underlying security and are translated into U.S. dollars at the exchange rate struck at the close of the London Stock Exchange.
The Fund values long-term debt obligations, including high quality and high yield corporate securities, municipal securities, asset-backed securities, collateralized mortgage obligations and U.S. Government and Agency issues, at the quoted bid price provided by an approved bond pricing service. Convertible securities are normally priced at the mean between the bid and ask prices. Short-term debt instruments (e.g., commercial paper, bankers acceptances, U.S. Treasury Bills, etc.) having a maturity of less than 60 days will be valued at amortized cost.
Securities or other assets for which reliable market quotations are not readily available or for which the pricing agent or principal market maker does not provide a valuation or methodology or provides a valuation or methodology that, in the judgment of the Adviser does not represent fair value (“Fair Value Securities”), are valued by the Pricing Committee overseen by the Board of Trustees in consultation as applicable, with the Adviser’s portfolio managers, traders, and research and credit analysts and legal and compliance personnel. Fair Value Securities may include, but are not limited to, the following: certain private placements and restricted securities that do not have an active trading market; securities whose trading has been suspended or for which there is no current market; securities whose prices are stale; securities denominated in currencies that are restricted, untraded, or for which exchange rates are disrupted; securities affected by significant events; and securities that the Adviser or Pricing Committee believe were priced incorrectly. A significant event (which includes, but is not limited to, an extraordinarily political or market event) is an event that the Adviser or Pricing Committee believes with a reasonably high degree of certainty has caused the closing market prices of a Fund’s portfolio securities to no longer reflect their value at the time of the Fund’s NAV calculation.
Security Transactions and Investment Income
Security transactions are accounted for as of trade date. Realized gains and losses from security transactions are determined on an identified-cost basis.
Dividend income is recorded on the ex-dividend date or, for certain non-U.S. securities, when the information becomes available to the Fund. Interest income is recorded on an accrual basis. Discounts and premiums on debt securities are accreted and amortized on the yield to maturity basis.
Non-U.S. Currency Transactions
At each net asset valuation date, the value of assets and liabilities denominated in non-U.S. currencies are translated into U.S. dollars using the current exchange rate at the spot rate at 11:00 a.m. Eastern Time against the U.S. dollar, as provided by an approved pricing service. Security transactions, income and expenses are converted at the prevailing exchange rate on the day of the event. The effect of changes in exchange rates on securities denominated in a non-U.S. currency is included with the net realized and unrealized gain or loss of the associated security. Other Non-U.S. currency gains or losses are reported separately.
19
The Fund may use forward non-U.S. currency contracts to reduce their exposure to currency fluctuations of their non-U.S. securities. These contracts are commitments to purchase or sell a non-U.S. currency at a specified rate on a future date. When the contract is fulfilled or closed, gains or losses are realized. Until then, the gain or loss is included in unrealized appreciation or depreciation of forward currency contracts. The contract commitment is fully collateralized by cash or securities of the Fund. Non-U.S. denominated assets and forward currency contracts may involve more risks than U.S. transactions, including currency risk, political and economic risk, regulatory and market risk. Evaluating and monitoring such risk exposure is a part of the Funds’ management strategy. There were no such forward non-U.S. currency contracts at November 30, 2008.
Futures Contracts
The Fund may enter into futures contracts involving non-U.S. currency, interest rates, securities, and securities indices, for hedging purposes only. A futures contract obligates the seller of the contract to deliver and the purchaser of the contract to take delivery of the type of non-U.S. currency, financial instrument or security called for in the contract at a specified future time for a specified price. Upon entering into such a contract, the Fund is required to deposit and maintain as collateral such initial margin as required by the exchange on which the contract is traded. Pursuant to the contract, the Fund agrees to receive from or pay to the broker an amount equal to the daily fluctuations in the value of the contract. Such receipts or payments are known as variation margin and are recorded as unrealized gains or losses by the Fund. When the contract is closed, the Fund records a realized gain or loss equal to the difference between the value of the contract at the time it was opened and the value at the time it was closed. There were no such futures contracts at November 30, 2008.
Options Contracts
The Fund may: (a) buy call options on non-U.S. currency in anticipation of an increase in the value of the underlying asset; (b) buy put options on non-U.S. currency, portfolio securities, and futures in anticipation of a decrease in the value of the underlying asset; and (c) write call options on portfolio securities and futures to generate income from premiums, and in anticipation of a decrease or only limited increase in the value of the underlying asset. If a call written by the Fund is exercised, the Fund foregoes any possible gain from an increase in the market price of the underlying asset over the exercise price plus the premium received. When the Fund writes options on futures contracts, it will be subject to margin requirements similar to those applied to futures contracts. There were no such options at November 30, 2008.
Equity-Linked Securities
The Fund may purchase equity-linked securities, also known as participation notes, equity swaps, and zero strike calls and warrants. Equity-linked securities are primarily used by the Fund as an alternative means to more efficiently and effectively access the securities market of what is generally an emerging securities market. The Fund deposits an amount of cash with its custodian (or broker, if legally permitted) in an amount near or equal to the selling price of the underlying security in exchange for an equity-linked security. Upon sale, the Fund receives cash from the broker or custodian equal to the value of the underlying security. Aside from market risk of the underlying securities, there is a risk of default by the counterparty to the transaction. In the event of insolvency of the counterparty, the Fund might be unable to obtain its expected benefit. In addition, while the Fund will seek to enter into such transactions only with parties which are capable of entering into closing transactions with the Fund, there can be no assurance that the Fund will be able to close out such a transaction with the counterparty or obtain an offsetting position with any counterparty, at any time prior to the end of the term of the underlying agreement. This may impair the Fund’s ability to enter into other transactions at a time when doing so might be advantageous.
Securities Lending
In order to generate expense offset credits, the Fund may lend portfolio securities, on a short-term or a long-term basis, up to 30% of a Fund’s total assets. The loan is secured by collateral in the forms of cash, cash equivalents, or U.S. government and agency securities equal to at least 102% of the market value of the securities loaned on U.S. securities and 105% of the market value loaned on non-U.S. securities. During the term of the loan, the Fund will continue to receive any interest, dividends or amounts equivalent thereto, on the loaned securities while receiving a fee from the borrower and/or earning interest on the investment of the cash collateral. Upon termination of the loan, the borrower will return to the lender securities identical to the loaned securities and may share the interest earned on the collateral with the borrower.
The Fund bears the risk of delay in recovery of, or even loss of rights in, the securities loaned should the borrower of the securities fail financially. The Fund also bears the risk of loss in the event the securities purchased with cash collateral depreciate in value. Loans are subject to termination at the option of the borrower or the Fund. There were no securities on loan at November 30, 2008.
20
Credit Facility
The Trust has a $15 million credit facility available to the Fund for temporary or emergency borrowing expiring in March 2009. The Fund pays its pro-rata share of an annual commitment fee plus interest on its specific borrowings. For the period ended November 30, 2008, the Fund did not borrow against the line of credit.
Commitments and Contingencies
In the normal course of business, the Fund may enter into contracts and agreements that contain a variety of representations and warranties which provide general indemnifications. The maximum exposure to the Fund under these arrangements is unknown, as this would involve future claims that may be made against the Fund that have not yet occurred. However, based on experience, the Fund expects the risks of loss to be remote.
Fund Expenses and Multi-Class Allocations
The Fund bears expenses incurred specifically on its behalf plus an allocation of its share of Trust level expenses. Each share offered by the Fund has equal rights to assets but incurs certain Class specific expenses. The Fund allocates income, gains and losses, both realized and unrealized, and expenses, except for Class specific expenses, based on the relative net assets of each share class.
During the period ended November 30, 2008, many of the brokers with whom the Adviser places trades on behalf of the Fund provided services to the Fund in addition to trade execution. These services included payments of certain expenses on behalf of the Fund. In addition, through arrangements with the Fund’s custodian, credits realized as a result of uninvested cash balances were used to reduce the Fund’s expenses. During the period ended November 30, 2008, the credits used to reduce the Funds expenses were:
| | | | | | | | | |
| | | Credit Interest | | Directed Brokerage | | Securities Lending |
| | | Offset | | Offset | | Offset |
November 30, 2008 | | $ | 10,847 | | $ | 914 | | $ | 30,125 |
Use of Estimates
The preparation of financial statements in conformity with accounting principles generally accepted in the United States requires management to make estimates and assumptions that affect the amounts reported in the financial statements and accompanying notes. Actual results could differ from these estimates.
Note C — FEDERAL INCOME TAXES
The Fund intends to comply with the requirements of the Internal Revenue Code applicable to regulated investment companies and to distribute substantially all of its taxable income to shareholders. Accordingly, no provision for federal income taxes is required. The Fund records any foreign taxes on income and gains on investments in non-U.S. securities in accordance with the applicable tax rules. The Fund’s tax accounting treatment of loss deferrals, accretion, passive foreign investment companies and expiration of capital loss carryforwards are different from the financial statement recognition of income and gains.
Capital loss carryforwards may be used to offset current or future capital gains until expiration.
Income Tax Status
In June 2006, the Financial Accounting Standards Board (“FASB”) issued Interpretation No. 48, Accounting for Uncertainty in Income Taxes – an Interpretation of FASB Statement No. 109 (“FIN 48”), which applies to all registered investment companies and clarifies the accounting for uncertain tax positions. FIN 48 requires the evaluation of tax positions taken, or expected to be taken, in the course of preparing the Fund’s tax returns to determine whether the tax positions are “more-likely-than-not” of being sustained by the applicable tax authority. To the extent that a tax benefit of a position is not deemed to meet the more-likely-than-not threshold, the Fund would report an income tax expense in the statement of operations. Accordingly, management has evaluated tax positions for each of the four open tax years as of November 30, 2008 and has determined that the implementation of FIN 48 does not have a material impact on the Funds’ financial statements. Also, the Fund did not have a liability for any unrecognized tax benefits. The Fund recognizes interest and penalties, if any, related to unrecognized tax benefits as income tax expense in the statement of operations. During the period, the Fund did not incur any interest or penalties. The Fund’s federal tax returns for the prior three fiscal years remains subject to examination by the Internal Revenue Service.
21
Distributions to Shareholders
The Fund records distributions to shareholders on the ex-dividend date. Distributions are determined in accordance with income tax regulations that may differ from generally accepted accounting principles. Accordingly, the Fund’s capital accounts are periodically reclassified to reflect income and gains available for distribution under income tax regulations. The Fund makes income and capital gain distributions at least annually.
There were no distributions to shareholders paid during the period ended November 30, 2008.
The tax characters of distributions paid during the fiscal years indicated were as follows:
| | | | | | | | | | |
| | | Distribution paid from: |
| | | Ordinary
Income | | Net
long term
capital gain | | Total
taxable
distributions | | Tax return
of capital | | Total
distributions
paid |
For the year ended March 31, 2008 | | 3,113,776 | | 12,917,360 | | 16,031,136 | | — | | 16,031,136 |
For the year ended March 31, 2007 | | 6,638,836 | | 7,370,298 | | 14,009,134 | | — | | 14,009,134 |
As of November 30, 2008 the components of accumulated earnings/ (deficit) on a tax basis were as follows:
| | | | | | | | | | |
Components of accumulated earnings/(deficit): |
Undistributed
ordinary
income | | Undistributed
long-term
capital gains | | Accumulated
earnings | | Accumulated
capital and
other losses | | Unrealized
appreciation/
(depreciation) | | Total
accumulated
earning/
(deficit) |
735,406 | | 3,212,580 | | 3,947,986 | | (14,046,184) (1) | | (5,286,218) (2) | | (15,384,416) |
| (1) | The Fund had net capital loss carryforwards of approximately: |
| | |
Capital Loss CarryForward (in 000’s) | | Expiration Date |
10,739 | | November 30, 2010 |
1,573 | | November 30, 2009 |
1,734 | | November 30, 2016 |
To the extent future capital gains are offset by capital loss carryforwards, such gains will not be distributed. The availability of loss carryforwards to any future years may be substantially limited as a result of past or future ownership changes as determined under the Internal Revenue Code Section 382.
Net Capital Losses incurred after October 31st, and within the taxable year are deemed to arise on the first business day of the fund’s next taxable year. For the year ended November 30, 2008, the fund deferred to November 30, 2009, Post-October Capital Losses. Post-October Loss Deferrals for Short-Term Loss and Long-Term Loss were $426,269 and $427,489, respectively.
| (2) | The differences between book-basis and tax-basis unrealized appreciation/ (depreciation) are attributable primarily to the tax deferral of losses on wash sales. |
Note D — TRANSACTIONS WITH AFFILIATES
Investment Advisory Fee
The Adviser receives a monthly fee at an annual rate based on the average daily net assets of the Fund. The investment Advisory Fee rate for the Fund is listed in the table on the next page.
Administration Fee
On January 24, 2006, the Fund entered into a new Administration Agreement whereby the Fund pays for the administrative services it requires under what is essentially an all-in fee structure. Class I, II, & R shareholders of the Fund pay an administrative fee to the Investment Adviser computed as a percentage of the Funds’ assets attributable in the aggregate to Class I, II & R shares, the Adviser,
22
in turn, provides or procures administrative and shareholder services for Class I, II & R shareholders and also bears the costs of most third-party administrative services required by the Fund, including audit, custodial, portfolio accounting, legal, transfer agency and printing costs. The administrative fees paid to the Adviser may exceed the related costs.
The Fund does bear other expenses which are not covered under the administrative fee which may vary and affect the total level of expenses paid by Class I, II, & R shareholders, such as brokerages fees, taxes, commissions and other transaction expenses, costs of borrowing money, including interest expenses, extraordinary expenses (such as litigation and indemnification expenses) and fees and expenses of one interested Trustee and Independent Trustees of the Trust and their counsel.
The investment advisory and administrative services fees are charged at the following annual rates:
| | | | | | | | | | | | |
| | | Advisory
Fee | | | Administration Fee* | |
Fund | | | | | Class
I | | | Class
II | | | Class
R | |
International Growth Fund | | 0.50 | % | | 0.86 | % | | 0.46 | % | | 0.86 | % |
| * | Excludes trustees’ fees and expenses, tax, brokerage and interest expenses, and extraordinary expenses. |
Distribution Fees
The Fund has adopted a Plan of Distribution with respect to Class R (“Class R Plan”) in accordance with Rule 12b-1 of the Investment Company Act of 1940. Pursuant to the Class R Plan, the fund pays Nicholas-Applegate Securities, the Distributor, a service fee of 0.25% of the Fund’s average daily net assets attributable to Class R shares to pay or reimburse expenditures in connection with sales and promotional services of Class R shares.
Trustee Compensation
Certain officers of the Trust are also officers of the Investment Adviser and the Distributor. The Trustees who were not affiliated with the Investment Adviser receive annual compensation of approximately $36,000 each from the Trust, except for the chairman of the Board of Trustees of the Trust and the chairman of the Audit Committee, who will receive annual compensation of approximately $42,000 and $41,000, respectively, from the Trust.
Note E — INVESTMENT TRANSACTIONS
The following table presents purchases and sales of securities, excluding short-term investments, during the period ended November 30, 2008 to indicate the volume of transactions in the Fund. The tax cost of securities held at November 30, 2008, and the related gross and net unrealized appreciation and depreciation, provide aggregate information on a tax basis against which future gains and losses on these investments are measured for distribution purposes.
| | | | | | | | | | | | | | | | | | | | |
Fund | | Purchases
(in 000’s) | | Sales
(in 000’s) | | Tax Cost
(in 000’s) | | Gross
Unrealized
Appreciation
(in 000’s) | | Gross
Unrealized
Depreciation
(in 000’s) | | | Net
Unrealized
Appreciation
(Depreciation)
(in 000’s) | |
International Growth | | $ | 5,765 | | $ | 7,293 | | $ | 18,047 | | $ | 931 | | $ | (6,217 | ) | | $ | (5,286 | ) |
Gains and losses resulting from the redemptions-in-kind are included in the realized gain/loss from securities and non-U.S. currency transactions. During the period that ended November 30, 2008, the Fund did not have any subscription- or redemptions-in-kind.
Note F — FINANCIAL INSTRUMENTS
The Fund may be party to financial instruments with off-balance sheet risks, including forward non-U.S. currency contracts, primarily in an attempt to minimize the risk to the Fund, in respect of its portfolio transactions. These instruments involve market and/or credit risk in excess of the amount recognized in the Statement of Assets and Liabilities. Risks arise from the possible inability of counterparties to meet the terms of their contracts and from unexpected movement in currencies, securities values and interest rates. The contract amounts indicate the extent of the Fund’s involvement in such contracts. For the period ended November 30, 2008 the Fund was not party to any such agreements.
23
Note G — FAIR VALUE OF FINANCIAL INSTRUMENTS
Effective April 1, 2008, the Fund adopted FAS 157 – Fair Value Measurements (“FAS 157” or “the Statement”). FAS 157 defines fair value, establishes a framework for measuring fair value in generally accepted accounting principles (“GAAP”), and expands disclosures about fair value measurement. The Statement establishes a fair value hierarchy that distinguishes between (1) market participant assumptions developed based on market data obtained from sources independent of the fund’s (observable inputs) and (2) the fund’s own assumptions about market participant assumptions developed based on the best information available in the circumstances (unobservable inputs). The three levels defined by the FAS 157 hierarchy are as follows:
Level I – quoted prices in active markets for identical securities.
Level II – significant observable inputs (including quoted prices for similar securities, interest rates prepayment speeds, credit risk, etc.).
Level III – significant unobservable inputs (including the Fund’s own assumptions in determining the fair value of investments.
In some instances, the inputs used to measure fair value might fall in different levels of the fair value hierarchy. The level in the fair value hierarchy within which the fair value measurement in its entirety falls shall be determined based on the lowest input level that is significant to the fair value measurement in its entirety.
The following table summarizes the valuation of each fund’s securities using the fair value hierarchy:
| | | | | | | | | | | | |
At November 30, 2008 | | Total | | Level I | | Level II | | Level III |
International Growth Investments | | $ | 12,761,241 | | $ | 12,749,578 | | $ | 11,663 | | $ | — |
SFAS 157 also requires a reconciliation of assets and liabilities for which significant unobservable inputs (Level 3) were used in determining fair value. During the period April 1, 2008 through November 30, 2008, the Fund did not hold investments in which significant unobservable inputs (Level 3) were used in determining value.
Note H — NEW ACCOUNTING PRONOUNCEMENTS
In March 2008, Statement of Financial Accounting Standards No. 161, “Disclosures about Derivative Instruments and Hedging Activities” (“SFAS 161”), was issued and is effective for fiscal years and interim periods beginning after November 15, 2008. SFAS 161 requires enhanced disclosures to provide information about the reasons the Fund invests in derivative instruments, the accounting treatment and the effect derivatives have on financial performance.
In September 2008, “FASB Staff Position No. 133-1 and FASB Interpretation No. 45-4” (the “FSP”), “Disclosures about Credit Derivatives and Certain Guarantees: An Amendment of FASB Statement No. 133 and FASB Interpretation No. 45; and Clarification of the Effective Date of FASB Statement No. 161,” was issued and is effective for fiscal years and interim periods ending after November 15, 2008. The FSP amends FASB Statement No. 133, “Accounting for Derivative Instruments and Hedging Activities,” to require disclosures by sellers of credit derivatives, including credit derivatives embedded in hybrid instruments. The FSP was effective at November 30, 2008, whereby disclosures required by SFAS 161 are effective for financial statements issued for fiscal years and interim periods beginning after November 15, 2008. Management has reviewed FASB Statement 133 and FASB Interpretation 45 and has determined that these implementations do not have a material impact on the Fund’s financial statements.
Note I — SUBSEQUENT EVENTS
The Fund is expected to reorganized into the Allianz NACM International Growth Fund, a newly created series of the Allianz Funds Multi-Strategy Trust on or about January 30, 2009.
24
Report of Independent Registered Public Accounting Firm
To the Board of Trustees and Shareholders of the Nicholas-Applegate International Growth Fund:
In our opinion, the accompanying statement of assets and liabilities, including the schedule of investments, and the related statements of operations and of changes in net assets and the financial highlights present fairly, in all material respects, the financial position of the Nicholas-Applegate International Growth Fund (the “Fund”) at November 30, 2008, the results of its operations, the changes in its net assets and the financial highlights for each of the periods presented, in conformity with accounting principles generally accepted in the United States of America. These financial statements and financial highlights (hereafter referred to as “financial statements”) are the responsibility of the Fund’s management; our responsibility is to express an opinion on these financial statements based on our audits. We conducted our audits of these financial statements in accordance with the standards of the Public Company Accounting Oversight Board (United States). Those standards require that we plan and perform the audit to obtain reasonable assurance about whether the financial statements are free of material misstatement. An audit includes examining, on a test basis, evidence supporting the amounts and disclosures in the financial statements, assessing the accounting principles used and significant estimates made by management, and evaluating the overall financial statement presentation. We believe that our audits, which included confirmation of securities at November 30, 2008 by correspondence with the custodian and brokers, provide a reasonable basis for our opinion.
|
PricewaterhouseCoopers LLP |
|
Los Angeles, California |
|
January 20, 2009 |
25
Shareholder Expense Example – (Unaudited)
As a shareholder of a Fund, you incur two types of costs: (1) transaction costs, including redemption fees, and (2) ongoing costs, including management fees and other Fund expenses. This Example is intended to help you understand your ongoing costs (in dollars) of investing in the Fund and to compare these costs with the ongoing costs of investing in other mutual funds.
The Example is based on an investment of $1,000 invested at the beginning of the period and held for the entire period (April 1, 2008 to November 30, 2008).
Actual Expenses
The first line of the table below for the Fund provides information about actual account values and actual expenses. You may use the information in this line, together with the amount you invested, to estimate the expenses that you paid over the period. Simply divide your account value by $1,000 (for example, an $8,600 account value divided by $1,000 = 8.6), then multiply the result by the number in the first line for the fund under the heading “Expenses Paid During Period” to estimate the expenses you paid on your account during this period.
Hypothetical Example for Comparison Purposes
The second line of the table below for the Fund provides information about hypothetical account values and hypothetical expenses based on the Fund’s actual expense ratio and an assumed rate of return if 5% per year before expenses, which is not the Fund’s actual return. The hypothetical account values and expenses may not be used to estimate the actual ending account balance or expenses you paid for the period. You may use this information to compare the ongoing costs of investing in the Fund and other funds. To do so, compare this 5% hypothetical example with the 5% hypothetical examples that appear in the shareholder reports of the other funds.
Please note that the expenses shown in the table are meant to highlight your ongoing costs only and do not reflect any transaction costs. Therefore, the second line of the table is useful in comparing ongoing costs only, and will not help you determine the relative total costs of owning different funds. In addition, if these transactional costs were included, your costs would have been higher.
| | | | | | | | | | | | |
| | | Beginning Account
Value
June 1, 2008 | | Ending Account
Value
November 30, 2008 | | Expenses Paid During
the Period*
June 1, 2008 to
November 30, 2008 | | Annualized
Expense
Ratio | |
International Growth Fund—Class I | | | | | | | | | | | | |
Actual | | $ | 1,000.00 | | $ | 544.86 | | $ | 5.58 | | 1.44 | % |
Hypothetical (5% return before expenses) | | $ | 1,000.00 | | $ | 1,017.85 | | $ | 7.28 | | 1.44 | % |
| | | | | | | | | | | | |
International Growth Fund—Class II | | | | | | | | | | | | |
Actual | | $ | 1,000.00 | | $ | 545.60 | | $ | 4.00 | | 1.03 | % |
Hypothetical (5% return before expenses) | | $ | 1,000.00 | | $ | 1,019.90 | | $ | 5.22 | | 1.03 | % |
| | | | |
International Growth Fund—Class R | | | | | | | | | | | | |
Actual | | $ | 1,000.00 | | $ | 543.80 | | $ | 6.53 | | 1.69 | % |
Hypothetical (5% return before expenses) | | $ | 1,000.00 | | $ | 1,016.61 | | $ | 8.53 | | 1.69 | % |
26
Supplementary Information – (Unaudited)
PROXY VOTING (Unaudited)
The Investment Adviser votes proxies on behalf of the Fund pursuant to written policies and procedures adopted by the Fund. A description of the policies and procedures that the Fund uses to determine how to vote proxies relating to portfolio securities is available, without charge, upon request by calling 1-800-551-8043 or visit the Fund’s website at www.nacm.com. To obtain free information on how the Fund’s portfolio securities were voted, please call the Fund at 1-800-551-8043. You may also view how the Fund’s securities were voted by visiting the Securities & Exchange Commission’s website at www.sec.gov. Additionally, information regarding the Fund’s proxy voting record for the most recent twelve month period is also available, free of charge, by calling the Fund at 1-800-551-8043 and from the SEC’s website at http:///www.sec.gov.
ADDITIONAL FEDERAL TAX INFORMATION (Unaudited)
The amounts which represent income derived from sources within, and taxes paid to non-U.S. countries or possessions of the United States are as follows:
| | |
| Foreign Source | | FTC |
Income | | Total: |
$465,653 | | $44,455 |
QUARTERLY PORTFOLIO SCHEDULE (Unaudited)
The Fund provides a complete list of its holdings four times in each fiscal year, at the end of each calendar quarter. For the second and fourth quarters, the lists appear in the Fund’s semiannual and annual reports to shareholders dated March 31, 2008 and June 30, 2008, respectively. For the first quarter, the Fund filed its Portfolio Schedule with the Securities and Exchange Commission on Form N-Q. On November 14, 2008 the Board of Trustees approved a change in the Fund’s fiscal year end from March 31 to November 30. As a result, a complete list of the Fund’s holdings for the third quarter appear in the Fund’s annual report to shareholders dated November 30, 2008. Fund files its Portfolio Schedule with the Securities and Exchange Commission on Form N-Q. Shareholders can look up the Fund’s Form N-Q on the SEC’s website at www.sec.gov. Form N-Q may also be reviewed and copied at the SEC’s Public Reference Room in Washington, DC. To find out more about this public service, call the SEC at 1-202-942-8090.
27
Supplementary Information – (Unaudited) – Continued
CORPORATE GOVERNANCE (Unaudited)
| | |
Name, Address (1) Age Position(s) Held with Fund Length of Time Served (2) | | Principal Occupation(s) during Past 5 Years Other Directorship Held by Trustee Number of Portfolios in Fund complex Overseen by Trustee |
| |
Disinterested Trustees: | | |
| |
Darlene T. DeRemer 11/27/1955 Chairperson of the Board Since August 2007 & Trustee Since May 1999 | | Principal Occupations: Partner, Grail Partners LLC (since 2005); Managing Director, Putnam Lovell NBF Private Equity (Since 2004-2005); Managing Director, NewRiver E-Business Advisory Services Division (2000-2003); Prior to, President and Founder, DeRemer Associates, a strategic and marketing consulting firm for the financial services industry (1987-2003); Vice President and Director, Asset Management Division, State Street Bank and Trust Company, now referred to as State Street Global Advisers, (1982-1987); Vice President, T. Rowe Price & Associates (1979-1982); Member, Boston Club (since 1998); Member, Financial Women’s Association Advisory Board (since 1995); Founder, Mutual Fund Cafe Website. |
| |
| | Other Directorships Held: Founding Member and Director, National Defined Contribution Council (since 1997); Trustee, Boston Alzheimer’s Association (since 1998); Director, King’s Wood Montessori School (since 1995); Editorial Board, National Association of Variable Annuities (since 1997); Director, Nicholas-Applegate Strategic Opportunities, Ltd. (1994- 1997); Trustee, Nicholas-Applegate Mutual Funds (1994-1999); Director, Jurika & Voyles Fund Group (since 1994-2000); Trustee, Bramwell Funds (2003-2005); Director, Independent Director Council (since 2004); Mutual Fund Directors’s Council-Advisory Board; Board Member-Chatman Partners; Board Member X-Shares LLC. |
| |
| | Number of Portfolios Overseen by Trustee: 14 |
| |
John J. Murphy 4/8/1944 Trustee Since September 2005 | | Principal Occupations: Founder and senior principal, Murphy Capital Management |
| | Other Directorships Held: Director, Smith Barney Multiple Discipline Trust; Director, Barclays International Funds Group Ltd. and affiliated companies; Smith Barney Consulting Group; Legg Mason Equity Funds. |
| |
| | Number of Portfolios Overseen by Trustee: 14 |
| |
Bradford K. Gallagher 2/24/1944 Trustee Since August 2007 | | Principal Occupations: Founder, Spyglass Investments LLC (a private investment vehicle) (since 2001); Founder, President and CEO of CypressTree Investment Management Company and Annuity Company; Managing Director, Fidelity Investments. |
| |
| |
| | Other Directorships Held: Trustee, The Common Fund (since 2005); Director, Anchor Point Inc. (since 2005); Chairman and Trustee, Atlantic Maritime Heritage Foundation (since 2007); Director, Shielding Technology Inc. (since 2006);Director, United Way of Eastern Massachusetts (1988-1990); Director, Ouimet Scholarship Fund (1993-2005); Director, Emerson Hospital (1995-2005) |
| |
| | Number of Portfolios Overseen by Trustee: 14 |
| |
Steven Grenadier 12/14/1964 Trustee Since August 2007 | | Principal Occupations: William F. Sharpe Professor of Financial Economics, Stanford University Graduate School of Business; Research Associate, National Bureau of Economic Research (since 2002); Chairman of the Finance Department, Stanford University Graduate School of Business (2004-2006) |
| | Other Directorships Held: Independent Trustee, E Trade Funds. |
| |
| | Number of Portfolios Overseen by Trustee: 14 |
| |
Interested Trustees: | | |
| |
Horacio A. Valeiras 1/8/1959 President & Trustee Since August 2004 | | Principal Occupations: Managing Director (since 2004) and Chief Investment Officer. Nicholas-Applegate Capital Management, Nicholas-Applegate Securities (since 2002); Chief Investment Officer Oppenheimer Capital and AGI Management Partners (since 2008); Managing Director of Morgan Stanley Investment Management, London (1997-2002); Head of International Equity and Asset Allocation, Miller Anderson & Sherred; Director and Chief of Investment Strategies, Credit Suisse First Boston. |
| |
| |
| |
| |
| | Other Directorships Held: Trustee, The Bishops School (since 2002); Trustee, San Diego Rowing Club (since 2002). |
| |
| | Number of Portfolios Overseen by Trustee: 14 |
| |
Arthur B. Laffer 8/14/1940 Trustee Since August 2007 | | Principal Occupations: Chairman, Laffer Associates (economic consulting) (since 1979); Chairman, Laffer Advisors Inc. (registered broker-dealer) (since 1981); Chairman, Laffer Investments (asset management) (since 2000); Member, Congressional Policy Advisory Board (since 1998); Distinguished University Professor and Director, Pepperdine University (1985-1988); Professor of Business Economics, University of Southern California (1976-1984); Associate Professor of Business Economics, University of Chicago (1967-1976). |
| |
| |
| |
| |
| | Other Directorships Held: Director of MPS Group, Inc. (NYSE:MPS) (since 2003); Director, Petco Animal Supplies, Inc. (NASDAQ:PETC) (2002-2005); Director, Oxigene Inc. (NASDAQ:OXGN); biopharmaceutical company (since 1998); Director of Provide Commerce (NASDAQ: PRVD) (since 1998); Director, Veolia Environmental Corporation (successor to U.S. Filter Corporation) (water purification) (1991-2006); Director, Nicholas Applegate Fund, Inc. (1987-2007). |
| |
| | Number of Portfolios Overseen by Trustee: 14 |
28
Supplementary Information – (Unaudited) – Continued
CORPORATE GOVERNANCE (Unaudited)
| | |
Name, Address (1) Age Position(s) Held with Fund Length of Time Served (2) | | Principal Occupation(s) during Past 5 Years Other Directorship Held by Trustee Number of Portfolios in Fund complex Overseen by Trustee |
| |
| Officers: | | |
| |
Charles H. Field, Jr. 7/24/1955 Secretary and Chief
Compliance Officer Since May 2002 | | Principal Occupations: Managing Director and General Counsel, Nicholas-Applegate Capital
Management, Nicholas- Applegate Securities LLC, Nicholas-Applegate Holdings LLC (since
February 2004), Deputy General Counsel, Nicholas- Applegate Capital Management, LLC (1996-
2004). |
| |
| |
| | Other Directorships Held: N/A |
| |
Deborah A. Wussow 1/31/1960 Treasurer and Assistant Secretary Since August 2006 | | Principal Occupations: Senior Vice President and Chief Compliance Officer, Nicholas-Applegate Capital Management, (Since 2008), and previously Vice President and Director, Legal and Compliance, Nicholas-Applegate Capital Management (2005-2007) and Manager, Legal and Compliance, Nicholas-Applegate Capital Management (1995-2004)) |
| |
| |
| | Other Directorships Held: N/A |
| (1) | Unless otherwise noted, the address of the Trustees and Officers is c/o: Nicholas-Applegate Capital Management, 600 West Broadway, 32nd Floor, San Diego, California 92101. |
| (2) | Each Trustee serves for an indefinite term, until her or his successor is elected. |
29
TRUSTEES OF NICHOLAS-APPLEGATE INSTITUTIONAL FUNDS
Darlene T. DeRemer, Chairperson
Horacio A. Valeiras
John J. Murphy
Bradford K. Gallagher
Steven Grenadier
Arthur B. Laffer
OFFICERS
Horacio A. Valeiras, President
Charles H. Field, Jr., Secretary & Chief Compliance Officer
Deborah A. Wussow, Treasurer & Assistant Secretary
INVESTMENT ADVISER
Nicholas-Applegate Capital Management
DISTRIBUTOR
Nicholas-Applegate Securities
CUSTODIAN
Brown Brothers Harriman & Co., Private Bankers
TRANSFER AGENT
UMB Fund Services Group, Inc.
INDEPENDENT REGISTERED PUBLIC ACCOUNTING FIRM
PricewaterhouseCoopers LLP
30