Table of Contents
UNITED STATES
SECURITIES AND EXCHANGE COMMISSION
Washington, D.C. 20549
FORM N-Q
QUARTERLY SCHEDULE OF PORTFOLIO HOLDINGS
OF REGISTERED MANAGEMENT INVESTMENT COMPANY
Investment Company Act file number: 811-22167
Allianz Funds Multi-Strategy Trust
(Exact name of registrant as specified in charter)
1633 Broadway,
New York, NY 10019
(Address of principal executive offices) (Zip code)
Lawrence G. Altadonna
1633 Broadway,
New York, NY 10019
(Name and address of agent for service)
Registrant’s telephone number, including area code: 212-739-3371
Date of fiscal year end: November 30, 2013
Date of reporting period: May 31, 2013
Table of Contents
Item 1. Report to Shareholders

Allianz Multi-Strategy Funds
SHARE CLASSES A, B, C, D, R, P, INSTITUTIONAL, R6, ADMINISTRATIVE
Semiannual Report
May 31, 2013
AllianzGI Retirement 2015 Fund
AllianzGI Retirement 2020 Fund
AllianzGI Retirement 2025 Fund
AllianzGI Retirement 2030 Fund
AllianzGI Retirement 2035 Fund
AllianzGI Retirement 2040 Fund
AllianzGI Retirement 2045 Fund
AllianzGI Retirement 2050 Fund
AllianzGI Retirement 2055 Fund
AllianzGI Retirement Income Fund
AllianzGI Global Allocation Fund
AllianzGI Global Growth Allocation Fund
AllianzGI Behavioral Advantage Large Cap Fund
AllianzGI China Equity Fund
AllianzGI Convertible Fund
AllianzGI Disciplined Equity Fund
AllianzGI Dynamic Emerging Multi-Asset Fund
AllianzGI Global Managed Volatility Fund
AllianzGI Global Water Fund
AllianzGI High Yield Bond Fund
AllianzGI International Small-Cap Fund
AllianzGI Micro Cap Fund
AllianzGI Multi-Asset Real Return Fund
AllianzGI NFJ Emerging Markets Value Fund
AllianzGI NFJ Global Dividend Value Fund
AllianzGI NFJ International Small-Cap Value Fund
AllianzGI NFJ International Value II Fund
AllianzGI Redwood Fund
AllianzGI Short Duration High Income Fund
AllianzGI Structured Alpha Fund
AllianzGI Ultra Micro Cap Fund
AllianzGI U.S. Emerging Growth Fund
AllianzGI U.S. Equity Hedged Fund
This material is authorized for use only when preceded or accompanied by the current Allianz Multi-Strategy Funds prospectus. Investors should consider the investment objectives, risks, charges and expenses of each Fund carefully before investing. This and other information is contained in the Funds’ prospectuses. Please read the prospectus carefully before you invest or send money.

Table of Contents
A Word About Risk: A fund may be subject to various risks as described in its prospectus. Some of those risks may include, but are not limited to, the following: derivatives risk, small company risk, foreign investment risk and specific sector investment risks. Use of derivative instruments may involve certain costs and risks such as liquidity risk, interest rate risk, market risk, credit risk, management risk and the risk that a fund is unable to close out a position when it is most advantageous to do so. Portfolios investing in derivatives could lose more than the principal amount invested in those instruments. Investing in foreign securities may entail risk due to foreign economic and political developments; this risk may be enhanced when investing in emerging markets. Smaller companies may be more volatile than larger companies and may entail more risk. Concentrating investments in individual sectors may add additional risk and additional volatility compared to a diversified equity portfolio. AllianzGI target-date funds seek to manage risk and return by blending two separately-managed portfolios: a return-generating portfolio for growth potential, and a defensive portfolio for principal protection. The balance grows increasingly defensive over time until the target date is reached, after which the Fund’s assets roll into a retirement income strategy. The principal value of the Funds is not guaranteed at any time, including the target date. Please refer to the Fund’s applicable current prospectus for complete details.
Table of Contents

Brian S. Shlissel
President
Dear Shareholder,
The US economy continued to expand throughout the six-month fiscal reporting period ended May 31, 2013. In contrast, growth in many other developed countries moderated and in certain situations, fell into recession. Demand for equities and lower rated, higher yielding fixed income securities was generally solid as investors looked to generate incremental returns in the low interest rate environment.
Six Months in Review
For the six-month fiscal reporting period ended May 31, 2013, US stocks, as measured by the Standard & Poor’s 500 Index, rose 16.43%. Two measures of stock performance in developed international and global markets, the MSCI EAFE (Europe, Australasia and Far East) Index and the MSCI World Index, advanced 11.39% and 13.26% respectively, in dollar-denominated terms. The MSCI Emerging Markets Index rose 1.30%, in dollar-denominated terms.
With respect to bonds, the Barclays US Credit Index declined 0.86%, the Barclays US High Yield Index rose 5.79%, the Barclays US Government Bond Index decreased 1.35%, and the broader US bond market, as measured by the Barclays US Aggregate Index, fell 1.05%.
The US economy continued to grow during the six-month fiscal reporting period, however the pace of expansion was far from robust. Gross domestic product (“GDP”), the value of goods and services produced in the country, the broadest measure of economic activity and the principal indicator of economic performance, grew at an annual pace of 3.1% during the third quarter of 2012 before declining to an annual rate of 0.4% during the fourth quarter of 2012. GDP growth, however rebounded to a 1.8% annual rate during the first quarter of 2013.
While US economic data was mixed at times, there were continued signs of recovery in the housing market. In addition, while unemployment remains elevated, the unemployment rate dropped from 7.8% in November 2012 to 7.6% in May 2013. Elsewhere, despite concerns related to higher tax rates, the “fiscal cliff” and sequestration, consumer spending held up relatively well during the six-month reporting period.
The Federal Reserve (the “Fed”) initiated a number of actions to support the economy and reduce unemployment. In September 2012, prior to the beginning of the fiscal reporting period, the Fed introduced a third round of “quantitative easing” which entailed the purchase of $40 billion of mortgage securities each month. Toward the end of 2012, the Fed revealed that it
| 2 | May 31, 2013 | | Semiannual Report |
Table of Contents
would continue the purchase of $40 billion of mortgage securities each month, in addition to purchasing $45 billion per month of longer-term Treasuries on an open-ended basis. At its meeting in December 2012, the Fed indicated that it expected to keep the Fed Funds rate in the 0.0% to 0.25% range, “…as long as the unemployment rate remains above 6.5%,” provided that inflation remains well contained. The Fed maintained this stance at its meetings in January, March and May 2013.
Outlook
From a global economic perspective, key US economic indicators are continuing their slow but steady improvement. Japan’s economic growth also appears to be accelerating, perhaps from witnessing the initial impact of the new economic policies under Prime Minister Abe. However, growth in Asia (ex-Japan) and Latin America appears to be stagnating and euro-zone economies are experiencing a double-dip
recession, with the current retrenchment lasting longer than the sharp downturn at the onset of the financial crisis.
While US unemployment remains well above the Fed’s 6.5% target, recently there has been an increase in market volatility and rising Treasury yields. This was partially triggered by expectations that the Fed may begin tapering the amount of quantitative easing. We expect that the Fed will want more evidence that the economy is on solid footing prior to adjusting monetary policy and that tapering could be more of an issue in 2014. That being said,
there may continue to be periods of heightened volatility given incoming economic data and the market’s attempts to anticipate future Fed actions.
On behalf of Allianz Global Investors Fund Management and our Sub-Advisers, thank you for investing with us. We encourage you to consult with your financial advisor and to visit our website, us.allianzgi.com, for additional information. We remain dedicated to serving your investment needs.
Sincerely,

Brian S. Shlissel
President
Past performance is no guarantee of future results. Unless otherwise noted, index returns reflect the reinvestment of income dividends and capital gains, if any, but do not reflect fees, brokerage commissions or other expenses of investing. It is not possible to invest directly in an index.
Receive this report electronically and eliminate paper mailings.
To enroll, go to us.allianzgi.com/edelivery.
| Semiannual Report | | May 31, 2013 | 3 |
Table of Contents
Unaudited
AllianzGI Retirement 2015 Fund (formerly Allianz Global Investors Solutions 2015 Fund)
For the period of December 1, 2012 through May 31, 2013, as provided by the Allianz Global Investors US Multi Asset Group.
Portfolio Insights
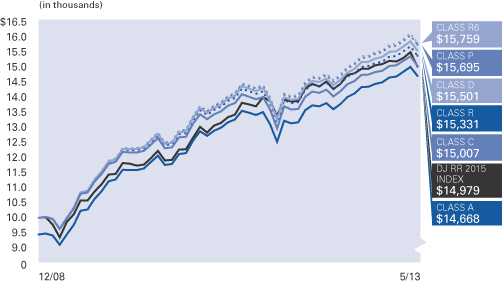
For the reporting period ended May 31, 2013, Class A shares at Net Asset Value (“NAV”) of the AllianzGI Retirement 2015 Fund (the “Fund”) returned 1.78% outperforming the Dow Jones Real Return 2015 Index (the “benchmark index”) which returned -0.27%.
What Happened
For the six months ended May 31, 2013, the dominant theme for global market returns has been central bank policy. Quantitative Easing (QE) has gone global and is the single most dominant force in global markets. Turning from QE to the fundamentals of economic growth and earnings, in the US, the economy continued to grow, albeit at a slower pace than initially expected, with first quarter GDP expanding at 2.4%. In Europe, the struggle for growth remains a persistent theme, which has forced the European Central Bank (ECB) to take more unconventional policy actions including, in early May, raising the prospect of introducing negative interest rates on deposits at the ECB. Further evidence of a slowdown in emerging markets, mainly the BRICs, continued to trickle in during the period.
During the past six months, there have been three major market-moving events. First, the most radical quantitative easing experiment to date was announced and then implemented in Japan following the election of Shinzo Abe to Prime Minister in December. A second new theme is the uncertainty surrounding the timing and size of the Federal Reserve’s (the “Fed’s”) beginning of the end of QE, the so-called “taper,” when the Fed reduces its monthly bond purchases from its current rate of $85 billion. Third, on the fiscal front in the US, the threat of a sequester and fear of a government shutdown ended with the sequester slowing government spending while tax revenues are up in a growing (even if slowly) economy, producing a rapidly improving fiscal position. The US federal deficit is now on track to decline from more than 10% of GDP to around 4% of GDP by the end of the fiscal year (based on Congressional Budget Office projections).
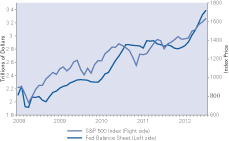
Quantitative easing around the world drove risk asset returns in the developed world. For the period, equities returned 47.7% in Japan, 16.5% in the US and 13.3% in Europe (all equity returns based on MSCI indexes, local currency). The link
between central bank asset purchases and equity performance has strengthened significantly since quantitative easing was first initiated: in the US, since November 2008, the correlation between the Fed’s balance sheet and the S&P 500 Index is over .90 (whereas in the five years leading up to the financial crisis, the correlation is less than 0.2).1
The questions surrounding the taper—both when and how quickly the Fed will put the brakes on asset purchases—also resulted in higher volatility across asset markets for the period, while core fixed income generally sold off toward the end of the period and equities rallied. Within fixed income, high yield and convertibles stand out as exceptions returning 5.50% and 14.57% for the period, respectively. US Treasuries suffered as the 10-year yield increased from a low of 1.59% on December 6, 2012 to an intraday high of 2.23% on May 29, 2013—a pronounced move given that that the yield had remained well below 2 percent since April 2012.
When interpreting economic evidence through the prism of the taper, not only is good economic data good for equity returns but bad economic data has also been good news for developed market equities—when it signifies that the Fed will continue to provide liquidity to markets for longer. For most of the rest of the world in equity and commodity markets returns were flat to down. Emerging market equities returned 1.5%. The broad commodity futures were down 8.5% in the period with precious metals suffering the biggest decline, down 22.8% and gold futures down 18.9% (returns based on DJ UBS Commodity Index, Sub Precious Metals Index and Gold Index).
Portfolio Review
During the six month period, the Fund held overweight positions in US small-cap equities, US
and non-US fixed-income assets and short-term Treasury inflation protected securities (TIPS). The Fund held underweights in US large- cap and non-US equities, including emerging markets and in real return assets, including real estate and commodities as well as in intermediate-term TIPS.
In the return generating part of portfolio, the equity holdings underperformed their benchmark. This was mostly due to underperformance in large cap equities as a result of both allocation and fund selection effects. The Fund was underweight US large cap equities in a period in which the Russell 1000 Index returned 16.68%. Selection effects in US small cap also detracted. Positive fund selection in international equities and emerging markets contributed to performance, helping to offset the negative effect from being underweight those sectors. Exposure to underlying funds implementing managed volatility strategies was a contributor to performance during the period as well.
In the defensive part of the portfolio, the Fund’s aggregate nominal bond positions outperformed the fixed income benchmark mainly due to fund selection and an overweight in agency and non-agency mortgage backed securities. The PIMCO Income Fund was up 6.58% in the period, with an excess return of 7.63% percentage points versus the Barclays US Aggregate Bond Index. A large allocation to the PIMCO Income Fund as well as the PIMCO Mortgage Opportunities Fund enabled the portfolios to gain exposure to the recovery in the housing market in the US and was part of the rationale for the underweight in equities.
The TIPS portion of the fixed income portfolio also contributed to performance due to asset allocation—a large underweight to intermediate term TIPS—and fund selection. Within the Fixed Income universe, TIPS overall underperformed Treasuries as the Barclays US Treasury US TIPS TR Index returned -4.57% versus the Barclays Aggregate Bond Treasury TR Index which was down 1.05%.
The Fund outperformed in commodities, due to a combination of being underweight the commodity benchmark, which was down 8.49% (based on the DJ UBS Commodity Total Return Index) for the period and positive fund selection.
1. Correlation is a measure of how two or more items move together. Perfect positive and negative correlation are 1 and -1, respectively. Zero indicates no correlation.
| 4 | May 31, 2013 | | Semiannual Report |
Table of Contents
Unaudited
AllianzGI Retirement 2015 Fund (formerly Allianz Global Investors Solutions 2015 Fund) (cont’d)
In real estate, the Fund underperformed its benchmark. Fund selection and a tilt toward global REITs detracted from performance in this sector. For the quarter, the S&P United States Property Index outperformed the S&P Europe Property Index by more than 4%.
Outlook
Economic theory tells us that 10-year treasury yields will, in time, match long-term nominal GDP, at around 4% given the Fed’s 2% target inflation. However, the paths to get there and the timing remain uncertain. One virtuous path entails global growth accelerating and economic data steadily improving. The other path is dominated by eroding pricing power and a lack of improvement in the labor market. Both paths will lead to higher interest rates. But the first would be associated with good returns in
equities while the second would be associated with equity losses.
More broadly, we are either experiencing the great rotation into equity market outperformance and global growth or the early stages of another global slowdown. An expansion in global growth would be led by the US and emerging markets and would be associated with a recovery in Europe and an escape from deflation in Japan. In such a scenario, we would expect earnings to grow and valuations to continue to improve.
Chairman Bernanke, in particular, has stated that the risks to taking stimulus out of the economy too soon outweigh the risks of keeping quantitative easing in place too long. Thus, should the global economy slow, the Fed, along
with other developed country central banks will likely err on the side of maintaining low to negative real rates.
If evidence mounts that suggests that the world is healing and growth is accelerating, we are prepared to systematically add to risk assets, targeting those with the most attractive valuations. We are positioned to be liquidity suppliers. The portfolios are overweight high-quality dividend-paying stocks, overweight US stocks and remain underweight euro-zone stocks. The portfolios are modestly underweight commodities and real estate, as well as underweight nominal duration. All of the portfolios are within their benchmark-determined risk budgets.
Average Annual Total Return for the period ended May 31, 2013
| 6 Month* | 1 Year | Since Inception† | ||||||||||||
| AllianzGI Retirement 2015 Fund Class A | 1.78% | 8.03% | 10.46% | |||||||||||
| AllianzGI Retirement 2015 Fund Class A (adjusted) | –3.82% | 2.09% | 9.05% | ||||||||||
| AllianzGI Retirement 2015 Fund Class C | 1.38% | 7.20% | 9.62% | |||||||||||
| AllianzGI Retirement 2015 Fund Class C (adjusted) | 0.39% | 6.20% | 9.62% | ||||||||||
| AllianzGI Retirement 2015 Fund Class D | 1.69% | 7.88% | 10.42% | ||||||||||
| AllianzGI Retirement 2015 Fund Class R | 1.60% | 7.67% | 10.15% | ||||||||||
| AllianzGI Retirement 2015 Fund Class P | 1.92% | 8.37% | 10.74% | ||||||||||
| AllianzGI Retirement 2015 Fund Class R6 | 2.00% | 8.46% | 10.84% | ||||||||||
| AllianzGI Retirement 2015 Fund Administrative Class | 1.77% | 8.05% | 10.51% | |||||||||||
| Dow Jones Real Return 2015 Index | –0.27% | 5.23% | 9.57% | ||||||||||
| Lipper Mixed-Asset Target 2015 Funds Average | 5.14% | 12.61% | 11.33% | |||||||||||
† The Fund began operations on 12/29/08. Benchmark return comparisons began on the fund inception date. Lipper performance comparisons began on 12/31/08.
* Cumulative return.
Performance quoted represents past performance and is no guarantee of future results. Current performance may be lower or higher than performance shown. For performance current to the most recent month-end, visit our website at us.allianzgi.com. Investment return and the principal value will fluctuate. Shares may be worth more or less than original cost when redeemed. The adjusted returns take into account the maximum initial sales charge of 5.50% on Class A shares and the contingent deferred sales charge (CDSC) of 1% on Class C shares, which may apply to shares redeemed during the first year of ownership. Returns do not reflect deduction of taxes that a shareholder would pay on fund distributions or redemption of fund shares. See pages 94 and 95 for more information. The Fund’s gross expense ratios are 1.16% for Class A shares, 1.91% for Class C shares, 1.16% for Class D shares, 1.41% for Class R shares, 0.76% for Class P shares, 0.66% for Class R6 shares and 1.01% for Administrative Class shares. These ratios do not include an expense reduction, contractually guaranteed through at least 3/31/14. The Fund’s expense ratios net of this reduction are 0.97% for Class A shares, 1.72% for Class C shares, 1.07% for Class D shares, 1.32% for Class R shares, 0.67% for Class P shares, 0.57% for Class R6 shares and 0.92% for Administrative Class shares. Expense ratio information is as of the Fund’s current prospectus dated April 1, 2013, as supplemented to date.
| Semiannual Report | | May 31, 2013 | 5 |
Table of Contents
Unaudited
AllianzGI Retirement 2015 Fund (formerly Allianz Global Investors Solutions 2015 Fund) (cont’d)
Cumulative Returns Through May 31, 2013
Fund Allocation (as of May 31, 2013)
| PIMCO Real Return | 30.1% | |||
| PIMCO Income | 9.1% | |||
| PIMCO Foreign Bond (U.S. Dollar-Hedged) | 6.9% | |||
| PIMCO Mortgage Opportunities | 6.0% | |||
| PIMCO Short-Term | 6.0% | |||
| PIMCO Floating Income | 4.0% | |||
| AllianzGI Income & Growth | 4.0% | |||
| Wells Fargo Advantage Short-Term High Yield Bond | 3.6% | |||
| Other | 29.7% | |||
| Cash & Equivalents — Net | 0.6% |
| Shareholder Expense Example | Actual Performance | |||||||||||||
| Class A | Class C | Class D | Class R | Class P | Class R6 | Administrative Class | ||||||||
| Beginning Account Value (12/1/12) | $1,000.00 | $1,000.00 | $1,000.00 | $1,000.00 | $1,000.00 | $1,000.00 | $1,000.00 | |||||||
| Ending Account Value (5/31/13) | $1,017.80 | $1,013.80 | $1,016.90 | $1,016.00 | $1,019.20 | $1,020.00 | $1,017.70 | |||||||
| Expenses Paid During Period | $2.06 | $5.82 | $2.56 | $3.82 | $0.55 | $0.05 | $1.81 | |||||||
| Hypothetical Performance | ||||||||||||||
| (5% return before expenses) | ||||||||||||||
| Class A | Class C | Class D | Class R | Class P | Class R6 | Administrative Class | ||||||||
| Beginning Account Value (12/1/12) | $1,000.00 | $1,000.00 | $1,000.00 | $1,000.00 | $1,000.00 | $1,000.00 | $1,000.00 | |||||||
| Ending Account Value (5/31/13) | $1,022.89 | $1,019.15 | $1,022.39 | $1,021.14 | $1,024.38 | $1,024.88 | $1,023.14 | |||||||
| Expenses Paid During Period | $2.07 | $5.84 | $2.57 | $3.83 | $0.56 | $0.05 | $1.82 | |||||||
For each class of the Fund, expenses (net of fee waiver and reimbursement, if any) are equal to the annualized expense ratio for the class (0.41% for Class A, 1.16% for Class C, 0.51% for Class D, 0.76% for Class R, 0.11% for Class P, 0.01% for Class R6 and 0.36% for Administrative Class), multiplied by the average account value over the period, multiplied by 182/365. The expense ratio excludes the expenses of the Underlying Funds, which based upon the allocation of the Fund’s assets among the Underlying Funds are indirectly borne by the shareholders of the Fund.
| 6 | May 31, 2013 | | Semiannual Report |
Table of Contents
(THIS PAGE INTENTIONALLY LEFT BLANK)
| Semiannual Report | | May 31, 2013 | 7 |
Table of Contents
Unaudited
AllianzGI Retirement 2020 Fund (formerly Allianz Global Investors Solutions 2020 Fund)
For the period of December 1, 2012 through May 31, 2013, as provided by the Allianz Global Investors US Multi Asset Group.
Portfolio Insights
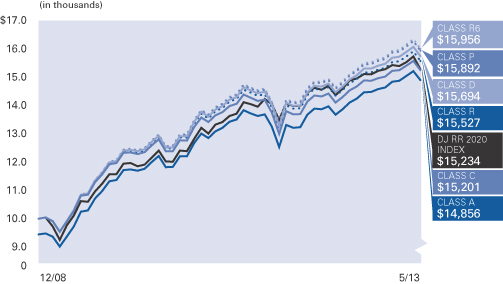
For the reporting period ended May 31, 2013, Class A shares at NAV of the AllianzGI Retirement 2020 Fund (the “Fund”) returned 2.18% outperforming the Dow Jones Real Return 2020 Index (the “benchmark index”) which returned 0.38%.
For the six months ended May 31, 2013, the dominant theme for global market returns has been central bank policy. Quantitative Easing (QE) has gone global and is the single most dominant force in global markets. Turning from QE to the fundamentals of economic growth and earnings, in the US, the economy continued to grow, albeit at a slower pace than initially expected, with first quarter GDP expanding at 2.4%. In Europe, the struggle for growth remains a persistent theme, which has forced the European Central Bank (ECB) to take more unconventional policy actions including, in early May, raising the prospect of introducing negative interest rates on deposits at the ECB. Further evidence of a slowdown in emerging markets, mainly the BRICs, continued to trickle in during the period.
During the past six months, there have been three major market-moving events. First, the most radical quantitative easing experiment to date was announced and then implemented in Japan following the election of Shinzo Abe to Prime Minister in December. A second new theme is the uncertainty surrounding the timing and size of the Federal Reserve’s (the “Fed’s”) beginning of the end of QE, the so-called “taper,” when the Fed reduces its monthly bond purchases from its current rate of $85 billion. Third, on the fiscal front in the US, the threat of a sequester and fear of a government shutdown ended with the sequester slowing government spending while tax revenues are up in a growing (even if slowly) economy, producing a rapidly improving fiscal position. The US federal deficit is now on track to decline from more than 10% of GDP to around 4% of GDP by the end of the fiscal year (based on Congressional Budget Office projections).
Quantitative easing around the world drove risk asset returns in the developed world. For the period, equities returned 47.7% in Japan, 16.5% in the US and 13.3% in Europe (all equity returns based on MSCI indexes, local currency). The link between central bank asset purchases and equity
performance has strengthened significantly since quantitative easing was first initiated: in the US, since November 2008, the correlation
between the Fed’s balance sheet and the S&P 500 Index is over .90 (whereas in the five years leading up to the financial crisis, the correlation is less than 0.2).
The questions surrounding the taper—both when and how quickly the Fed will put the brakes on asset purchases—also resulted in higher volatility across asset markets for the period, while core fixed income generally sold off toward the end of the period and equities rallied. Within fixed income, high yield and convertibles stand out as exceptions returning 5.50% and 14.57% for the period, respectively. US Treasuries suffered as the 10-year yield increased from a low of 1.59% on December 6, 2012 to an intraday high of 2.23% on May 29, 2013—a pronounced move given that that the yield had remained well below 2 percent since April 2012.
When interpreting economic evidence through the prism of the taper, not only is good economic data good for equity returns but bad economic data has also been good news for developed market equities—when it signifies that the Fed will continue to provide liquidity to markets for longer. For most of the rest of the world in equity and commodity markets returns were flat to down. Emerging market equities returned 1.5%. The broad commodity futures were down 8.5% in the period with precious metals suffering the biggest decline, down 22.8% and gold futures down 18.9% (returns based on DJ UBS Commodity Index, Sub Precious Metals Index and Gold Index).
Portfolio Review
During the six month period and relative to its benchmark index, the Fund held overweight positions in US small-cap equities, US and non-US fixed-income assets and short-term Treasury inflation protected securities (TIPS). The Fund held underweights in US large- cap and non-US equities, including emerging markets and in real return assets, including real estate and commodities as well as in intermediate-term TIPS.
In the return generating part of portfolio, the equity holdings underperformed their benchmark. This was mostly due to underperformance in large cap equities as a result of both allocation and fund selection effects. The Fund was underweight US large cap in a period in which the Russell 1000 Index returned 16.68%. Selection effects in US small cap also detracted. Positive fund selection in international equities and emerging markets contributed to performance, helping to offset the negative effect from being underweight those sectors. Exposure to underlying funds implementing managed volatility strategies was a contributor to performance during the period as well.
In the defensive part of the portfolio, the Fund’s aggregate nominal bond positions outperformed the fixed income benchmark mainly due to fund selection and an overweight in agency and non-agency mortgage backed securities. The PIMCO Income Fund was up 6.58% in the period, with an excess return of 7.63% percentage points versus the Barclays US Aggregate Bond Index. A large allocation to the PIMCO Income Fund as well as the PIMCO Mortgage Opportunities Fund enabled the portfolios to gain exposure to the recovery in the housing market in the US and was part of the rationale for the underweight in equities.
The TIPS portion of the fixed income portfolio also contributed to performance due to asset allocation—a large underweight to intermediate term TIPS—and fund selection. Within the Fixed Income universe, TIPS overall underperformed Treasuries as the Barclays US Treasury US TIPS TR Index returned -4.57% versus the Barclays Aggregate Bond Treasury TR Index which was down 1.05%.
The Fund outperformed in commodities, due to a combination of being underweight the commodity benchmark, which was down 8.49% (based on the DJ UBS Commodity Total Return Index) for the period and positive fund selection.
In real estate, the Fund underperformed its benchmark. Fund selection and a tilt toward global REITs detracted from performance in this sector. For the quarter, the S&P United States Property Index outperformed the S&P Europe Property Index by more than 4%.
| 8 | May 31, 2013 | | Semiannual Report |
Table of Contents
Unaudited
AllianzGI Retirement 2020 Fund (formerly Allianz Global Investors Solutions 2020 Fund) (cont’d)
Outlook
Economic theory tells us that 10-year treasury yields will, in time, match long-term nominal GDP, at around 4% given the Fed’s 2% target inflation. However, the paths to get there and the timing remain uncertain. One virtuous path entails global growth accelerating and economic data steadily improving. The other path is dominated by eroding pricing power and a lack of improvement in the labor market. Both paths will lead to higher interest rates. But the first would be associated with good returns in equities while the second would be associated with equity losses.
More broadly, we are either experiencing the great rotation into equity market
outperformance and global growth or the early stages of another global slowdown. An expansion in global growth would be led by the US and emerging markets and would be associated with a recovery in Europe and an escape from deflation in Japan. In such a scenario, we would expect earnings to grow and valuations to continue to improve.
Chairman Bernanke, in particular, has stated that the risks to taking stimulus out of the economy too soon outweigh the risks of keeping quantitative easing in place too long. Thus, should the global economy slow, the Fed, along with other developed country central banks will likely err on the side of maintaining low to negative real rates.
If evidence mounts that suggests that the world is healing and growth is accelerating, we are prepared to systematically add to risk assets, targeting those with the most attractive valuations. We are positioned to be liquidity suppliers. The portfolios are overweight high-quality dividend-paying stocks, overweight US stocks and remain underweight euro-zone stocks. The portfolios are modestly underweight commodities and real estate, as well as underweight nominal duration. All of the portfolios are within their benchmark-determined risk budgets.
Average Annual Total Return for the period ended May 31, 2013
| 6 Month* | 1 Year | Since Inception† | ||||||||||||
| AllianzGI Retirement 2020 Fund Class A | 2.18% | 8.89% | 10.78% | |||||||||||
| AllianzGI Retirement 2020 Fund Class A (adjusted) | –3.44% | 2.90% | 9.37% | ||||||||||
| AllianzGI Retirement 2020 Fund Class C | 1.82% | 8.04% | 9.93% | |||||||||||
| AllianzGI Retirement 2020 Fund Class C (adjusted) | 0.82% | 7.04% | 9.93% | ||||||||||
| AllianzGI Retirement 2020 Fund Class D | 2.16% | 8.80% | 10.73% | ||||||||||
| AllianzGI Retirement 2020 Fund Class R | 1.99% | 8.51% | 10.47% | ||||||||||
| AllianzGI Retirement 2020 Fund Class P | 2.34% | 9.25% | 11.06% | ||||||||||
| AllianzGI Retirement 2020 Fund Class R6 | 2.36% | 9.32% | 11.15% | ||||||||||
| AllianzGI Retirement 2020 Fund Administrative Class | 2.23% | 8.91% | 10.83% | |||||||||||
| Dow Jones Real Return 2020 Index | 0.38% | 6.30% | 10.00% | ||||||||||
| Lipper Mixed-Asset Target 2020 Funds Average | 6.04% | 13.89% | 11.99% | |||||||||||
† The Fund began operations on 12/29/08. Benchmark return comparisons began on the fund inception date. Lipper performance comparisons began on 12/31/08.
* Cumulative return.
Performance quoted represents past performance and is no guarantee of future results. Current performance may be lower or higher than performance shown. For performance current to the most recent month-end, visit our website at us.allianzgi.com. Investment return and the principal value will fluctuate. Shares may be worth more or less than original cost when redeemed. The adjusted returns take into account the maximum initial sales charge of 5.50% on Class A shares and the contingent deferred sales charge (CDSC) of 1% on Class C shares, which may apply to shares redeemed during the first year of ownership. Returns do not reflect deduction of taxes that a shareholder would pay on fund distributions or redemption of fund shares. See pages 94 and 95 for more information. The Fund’s gross expense ratios are 1.20% for Class A shares, 1.95% for Class C shares, 1.20% for Class D shares, 1.45% for Class R shares, 0.80% for Class P shares, 0.70% for Class R6 shares and 1.05% for Administrative Class shares. These ratios do not include an expense reduction, contractually guaranteed through at least 3/31/14. The Fund’s expense ratios net of this reduction are 0.99% for Class A shares, 1.74% for Class C shares, 1.09% for Class D shares, 1.34% for Class R shares, 0.69% for Class P shares, 0.59% for Class R6 shares and 0.94% for Administrative Class shares. Expense ratio information is as of the Fund’s current prospectus dated April 1, 2013, as supplemented to date.
| Semiannual Report | | May 31, 2013 | 9 |
Table of Contents
Unaudited
AllianzGI Retirement 2020 Fund (formerly Allianz Global Investors Solutions 2020 Fund) (cont’d)
Cumulative Returns Through May 31, 2013
Fund Allocation (as of May 31, 2013)
PIMCO Real Return | 30.1% | |||
PIMCO Income | 9.0% | |||
PIMCO Mortgage Opportunities | 6.0% | |||
PIMCO Foreign Bond (U.S. Dollar-Hedged) | 5.5% | |||
PIMCO Floating Income | 4.5% | |||
AllianzGI Income & Growth | 4.0% | |||
AllianzGI NFJ Dividend Value | 3.7% | |||
AllianzGI NFJ Global Dividend Value | 3.6% | |||
Other | 32.8% | |||
Cash & Equivalents — Net | 0.8% |
| Shareholder Expense Example | Actual Performance | |||||||||||||
| Class A | Class C | Class D | Class R | Class P | Class R6 | Administrative Class | ||||||||
Beginning Account Value (12/1/12) | $1,000.00 | $1,000.00 | $1,000.00 | $1,000.00 | $1,000.00 | $1,000.00 | $1,000.00 | |||||||
Ending Account Value (5/31/13) | $1,021.80 | $1,018.20 | $1,021.60 | $1,019.90 | $1,023.40 | $1,023.60 | $1,022.30 | |||||||
Expenses Paid During Period | $2.17 | $5.94 | $2.67 | $3.93 | $0.66 | $0.15 | $1.92 | |||||||
Hypothetical Performance | ||||||||||||||
(5% return before expenses) | ||||||||||||||
Class A | Class C | Class D | Class R | Class P | Class R6 | Administrative | ||||||||
Beginning Account Value (12/1/12) | $1,000.00 | $1,000.00 | $1,000.00 | $1,000.00 | $1,000.00 | $1,000.00 | $1,000.00 | |||||||
Ending Account Value (5/31/13) | $1,022.79 | $1,019.05 | $1,022.29 | $1,021.04 | $1,024.28 | $1,024.78 | $1,023.04 | |||||||
Expenses Paid During Period | $2.17 | $5.94 | $2.67 | $3.93 | $0.66 | $0.15 | $1.92 | |||||||
For each class of the Fund, expenses (net of fee waiver and reimbursement, if any) are equal to the annualized expense ratio for the class (0.43% for Class A, 1.18% for Class C, 0.53% for Class D, 0.78% for Class R, 0.13% for Class P, 0.03% for Class R6 and 0.38% for Administrative Class), multiplied by the average account value over the period, multiplied by 182/365. The expense ratio excludes the expenses of the Underlying Funds, which based upon the allocation of the Fund’s assets among the Underlying Funds are indirectly borne by the shareholders of the Fund.
| 10 | May 31, 2013 | | Semiannual Report |
Table of Contents
(THIS PAGE INTENTIONALLY LEFT BLANK)
| Semiannual Report | | May 31, 2013 | 11 |
Table of Contents
Unaudited
AllianzGI Retirement 2025 Fund (formerly Allianz Global Investors Solutions 2025 Fund)
For the period of December 1, 2012 through May 31, 2013, as provided by the Allianz Global Investors US Multi Asset Group.
Portfolio Insights
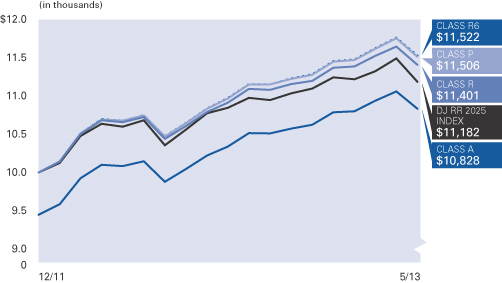
For the reporting period ended May 31, 2013, Class A shares at NAV of the AllianzGI Retirement 2025 Fund (the “Fund”) returned 2.43% outperforming the Dow Jones Real Return 2025 Index (the “benchmark index”) which returned 1.36%.
What Happened
For the six months ending May 31, 2013 the dominant theme for global market returns has been central bank policy. Quantitative Easing (QE) has gone global and is the single most dominant force in global markets. Turning from QE to the fundamentals of economic growth and earnings, in the US, the economy continued to grow, albeit at a slower pace than initially expected, with first quarter GDP expanding at 2.4%. In Europe, the struggle for growth remains a persistent theme, which has forced the European Central Bank (ECB) to take more unconventional policy actions including, in early May, raising the prospect of introducing negative interest rates on deposits at the ECB. Further evidence of a slowdown in emerging markets, mainly the BRICs, continued to trickle in during the period.
During the past six months, there have been three major market-moving events. First, the most radical quantitative easing experiment to date was announced and then implemented in Japan following the election of Shinzo Abe to Prime Minister in December. A second new theme is the uncertainty surrounding the timing and size of the Federal Reserve’s (the “Fed’s”) beginning of the end of QE, the so-called “taper,” when the Fed reduces its monthly bond purchases from its current rate of $85 billion. Third, on the fiscal front in the US, the threat of a sequester and fear of a government shutdown ended with the sequester slowing government spending while tax revenues are up in a growing (even if slowly) economy, producing a rapidly improving fiscal position. The US federal deficit is now on track to decline from more than 10% of GDP to around 4% of GDP by the end of the fiscal year (based on Congressional Budget Office projections).
Quantitative easing around the world drove risk asset returns in the developed world. For the period, equities returned 47.7% in Japan, 16.5% in the US and 13.3% in Europe (all equity returns based on MSCI indexes, local currency). The link between central bank asset purchases and equity performance has strengthened significantly
since quantitative easing was first initiated: in the US, since November 2008, the correlation between the Fed’s balance sheet and the S&P 500 Index is over .90 (whereas in the five years leading up to the financial crisis, the correlation is less than 0.2).
The questions surrounding the taper—both when and how quickly the Fed will put the brakes on asset purchases—also resulted in higher volatility across asset markets for the period, while core fixed income generally sold off toward the end of the period and equities rallied. Within fixed income, high yield and convertibles stand out as exceptions returning 5.50% and 14.57% for the period, respectively. US Treasuries suffered as the 10-year yield increased from a low of 1.59% on December 6, 2012 to an intraday high of 2.23% on May 29, 2013—a pronounced move given that that the yield had remained well below 2 percent since April 2012.
When interpreting economic evidence through the prism of the taper, not only is good economic data good for equity returns but bad economic data has also been good news for developed market equities—when it signifies that the Fed will continue to provide liquidity to markets for longer. For most of the rest of the world in equity and commodity markets returns were flat to down. Emerging market equities returned 1.5%. The broad commodity futures were down 8.5% in the period with precious metals suffering the biggest decline, down 22.8% and gold futures down 18.9% (returns based on DJ UBS Commodity Index, Sub Precious Metals Index and Gold Index).
Portfolio Review
During the six month period, and relative to its benchmark index, the Fund held overweight positions in US small-cap equities, US and non-US fixed-income assets and short-term Treasury inflation protected securities (TIPS). The Fund held underweights in US large- cap and non-US
equities, including emerging markets and in real return assets, including real estate and commodities as well as in intermediate-term TIPS.
In the return generating part of portfolio, the equity holdings underperformed their benchmark. This was mostly due to underperformance in large cap equities as a result of both allocation and fund selection effects. The Fund was underweight US large cap in a period in which the Russell 1000 Index returned 16.68%. Selection effects in US small cap also detracted. Positive fund selection in international equities and emerging markets contributed to performance, helping to offset the negative effect from being underweight those sectors. Exposure to underlying funds implementing managed volatility strategies was a contributor to performance during the period as well.
In the defensive part of the portfolio, the Fund’s aggregate nominal bond positions outperformed the fixed income benchmark mainly due to fund selection and an overweight in agency and non-agency mortgage backed securities. The PIMCO Income Fund was up 6.58% in the period, with an excess return of 7.63% percentage points versus the Barclays US Aggregate Bond Index. A large allocation to the PIMCO Income Fund as well as the PIMCO Mortgage Opportunities Fund enabled the portfolios to gain exposure to the recovery in the housing market in the US and was part of the rationale for the underweight in equities.
The TIPS portion of the fixed income portfolio also contributed to performance due to asset allocation—a large underweight to intermediate term TIPS—and fund selection. Within the Fixed Income universe, TIPS overall underperformed Treasuries as the Barclays US Treasury US TIPS TR Index returned -4.57% versus the Barclays Aggregate Bond Treasury TR Index which was down 1.05%.
The Fund outperformed in commodities, due to a combination of being underweight the commodity benchmark, which was down 8.49% (based on the DJ UBS Commodity Total Return Index USD) for the period and positive fund selection.
In real estate, the Fund underperformed its benchmark. Fund selection and a tilt toward global REITs detracted from performance in this
| 12 | May 31, 2013 | | Semiannual Report |
Table of Contents
Unaudited
AllianzGI Retirement 2025 Fund (formerly Allianz Global Investors Solutions 2025 Fund) (cont’d)
sector. For the quarter, the S&P United States Property Index outperformed the S&P Europe Property Index by more than 4%.
Outlook
Economic theory tells us that 10-year treasury yields will, in time, match long-term nominal GDP, at around 4% given the Fed’s 2% target inflation. However, the paths to get there and the timing remain uncertain. One virtuous path entails global growth accelerating and economic data steadily improving. The other path is dominated by eroding pricing power and a lack of improvement in the labor market. Both paths will lead to higher interest rates. But the first would be associated with good returns in equities while the second would be associated with equity losses.
More broadly, we are either experiencing the great rotation into equity market outperformance and global growth or the early stages of another global slowdown. An expansion in global growth would be led by the US and emerging markets and would be associated with a recovery in Europe and an escape from deflation in Japan. In such a scenario, we would expect earnings to grow and valuations to continue to improve.
Chairman Bernanke, in particular, has stated that the risks to taking stimulus out of the economy too soon outweigh the risks of keeping quantitative easing in place too long. Thus, should the global economy slow, the Fed, along with other developed country central banks will
likely err on the side of maintaining low to negative real rates.
If evidence mounts that suggests that the world is healing and growth is accelerating, we are prepared to systematically add to risk assets, targeting those with the most attractive valuations. We are positioned to be liquidity suppliers. The portfolios are overweight high-quality dividend-paying stocks, overweight US stocks and remain underweight euro-zone stocks. The portfolios are modestly underweight commodities and real estate, as well as underweight nominal duration. All of the portfolios are within their benchmark-determined risk budgets.
Average Annual Total Return for the period ended May 31, 2013
| 6 Month* | 1 Year | Since Inception† | ||||||||||||
| AllianzGI Retirement 2025 Fund Class A | 2.43% | 9.63% | 9.85% | |||||||||||
| AllianzGI Retirement 2025 Fund Class A (adjusted) | –3.20% | 3.60% | 5.64% | ||||||||||
| AllianzGI Retirement 2025 Fund Class R | 2.23% | 9.22% | 9.46% | ||||||||||
| AllianzGI Retirement 2025 Fund Class P | 2.55% | 9.94% | 10.17% | ||||||||||
| AllianzGI Retirement 2025 Fund Class R6 | 2.64% | 10.03% | 10.28% | ||||||||||
| AllianzGI Retirement 2025 Fund Administrative Class | 2.50% | 9.62% | 9.90% | |||||||||||
| Dow Jones Real Return 2025 Index | 1.36% | 7.98% | 8.02% | ||||||||||
| Lipper Mixed-Asset Target 2025 Funds Average | 8.05% | 17.17% | 14.05% | |||||||||||
† The Fund began operations on 12/19/11. Benchmark return comparisons began on the fund inception date. Lipper performance comparisons began on 12/31/11.
* Cumulative return.
Performance quoted represents past performance and is no guarantee of future results. Current performance may be lower or higher than performance shown. For performance current to the most recent month-end, visit our website at us.allianzgi.com. Investment return and the principal value will fluctuate. Shares may be worth more or less than original cost when redeemed. The adjusted returns take into account the maximum initial sales charge of 5.50% on Class A shares. Returns do not reflect deduction of taxes that a shareholder would pay on fund distributions or redemption of fund shares. See pages 94 and 95 for more information. The Fund’s gross expense ratios are 1.22% for Class A shares, 1.47% for Class R shares, 0.82% for Class P shares, 0.72% for Class R6 shares and 1.07% for Administrative Class shares. These ratios do not include an expense reduction, contractually guaranteed through at least 3/31/14. The Fund’s expense ratios net of this reduction are 1.01% for Class A shares, 1.36% for Class R shares, 0.71% for Class P shares, 0.61% for Class R6 shares and 0.96% for Administrative Class shares. Expense ratio information is as of the Fund’s current prospectus dated April 1, 2013, as supplemented to date.
| Semiannual Report | | May 31, 2013 | 13 |
Table of Contents
Unaudited
AllianzGI Retirement 2025 Fund (formerly Allianz Global Investors Solutions 2025 Fund) (cont’d)
Cumulative Returns Through May 31, 2013
Fund Allocation (as of May 31, 2013)
| PIMCO Real Return | 26.7% | |||
| PIMCO Income | 7.6% | |||
| PIMCO Mortgage Opportunities | 6.1% | |||
| PIMCO Foreign Bond (U.S. Dollar-Hedged) | 5.1% | |||
| PIMCO Floating Income | 4.5% | |||
| AllianzGI NFJ Global Dividend Value | 4.2% | |||
| AllianzGI Income & Growth | 4.0% | |||
| AllianzGI NFJ Dividend Value | 3.8% | |||
| Other | 37.3% | |||
| Cash & Equivalents — Net | 0.7% |
| Shareholder Expense Example | Actual Performance | |||||||||
| Class A | Class R | Class P | Class R6 | Administrative Class | ||||||
| Beginning Account Value (12/1/12) | $1,000.00 | $1,000.00 | $1,000.00 | $1,000.00 | $1,000.00 | |||||
| Ending Account Value (5/31/13) | $1,024.30 | $1,022.30 | $1,025.50 | $1,026.40 | $1,025.00 | |||||
| Expenses Paid During Period | $2.17 | $3.93 | $0.66 | $0.15 | $1.92 | |||||
| Hypothetical Performance | ||||||||||
| (5% return before expenses) | ||||||||||
| Class A | Class R | Class P | Class R6 | Administrative Class | ||||||
| Beginning Account Value (12/1/12) | $1,000.00 | $1,000.00 | $1,000.00 | $1,000.00 | $1,000.00 | |||||
| Ending Account Value (5/31/13) | $1,022.79 | $1,021.04 | $1,024.28 | $1,024.78 | $1,023.04 | |||||
| Expenses Paid During Period | $2.17 | $3.93 | $0.66 | $0.15 | $1.92 | |||||
For each class of the Fund, expenses (net of fee waiver and reimbursement, if any) are equal to the annualized expense ratio for the class (0.43% for Class A, 0.78% for Class R, 0.13% for Class P, 0.03% for Class R6 and 0.38% for Administrative Class), multiplied by the average account value over the period, multiplied by 182/365. The expense ratio excludes the expenses of the Underlying Funds, which based upon the allocation of the Fund’s assets among the Underlying Funds are indirectly borne by the shareholders of the Fund.
| 14 | May 31, 2013 | | Semiannual Report |
Table of Contents
(THIS PAGE INTENTIONALLY LEFT BLANK)
| Semiannual Report | | May 31, 2013 | 15 |
Table of Contents
Unaudited
AllianzGI Retirement 2030 Fund (formerly Allianz Global Investors Solutions 2030 Fund)
For the period of December 1, 2012 through May 31, 2013, as provided by the Allianz Global Investors US Multi Asset Group.
Portfolio Insights
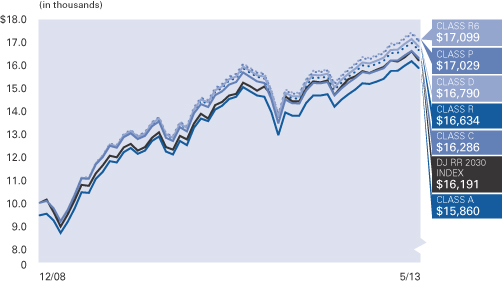
For the reporting period ended May 31, 2013, Class A shares at NAV of the AllianzGI Retirement 2030 Fund (the “Fund”) returned 3.94% outperforming the Dow Jones Real Return 2030 Index (the “benchmark index”) which returned 2.70%.
What Happened
For the six months ending May 31, 2013 the dominant theme for global market returns has been central bank policy. Quantitative Easing (QE) has gone global and is the single most dominant force in global markets. Turning from QE to the fundamentals of economic growth and earnings, in the US, the economy continued to grow, albeit at a slower pace than initially expected, with first quarter GDP expanding at 2.4%. In Europe, the struggle for growth remains a persistent theme, which has forced the European Central Bank (ECB) to take more unconventional policy actions including, in early May, raising the prospect of introducing negative interest rates on deposits at the ECB. Further evidence of a slowdown in emerging markets, mainly the BRICs, continued to trickle in during the period.
During the past six months, there have been three major market-moving events. First, the most radical quantitative easing experiment to date was announced and then implemented in Japan following the election of Shinzo Abe to Prime Minister in December. A second new theme is the uncertainty surrounding the timing and size of the Federal Reserve’s (the “Fed’s”) beginning of the end of QE, the so-called “taper,” when the Fed reduces its monthly bond purchases from its current rate of $85 billion. Third, on the fiscal front in the US, the threat of a sequester and fear of a government shutdown ended with the sequester slowing government spending while tax revenues are up in a growing (even if slowly) economy, producing a rapidly improving fiscal position. The US federal deficit is now on track to decline from more than 10% of GDP to around 4% of GDP by the end of the fiscal year (based on Congressional Budget Office projections).
Quantitative easing around the world drove risk asset returns in the developed world. For the period, equities returned 47.7% in Japan, 16.5% in the US and 13.3% in Europe (all equity returns based on MSCI indexes, local currency). The link between central bank asset purchases and equity performance has strengthened significantly
since quantitative easing was first initiated: in the US, since November 2008, the correlation between the Fed’s balance sheet and the S&P 500 Index is over .90 (whereas in the five years leading up to the financial crisis, the correlation is less than 0.2).
The questions surrounding the taper—both when and how quickly the Fed will put the brakes on asset purchases—also resulted in higher volatility across asset markets for the period, while core fixed income generally sold off toward the end of the period and equities rallied. Within fixed income, high yield and convertibles stand out as exceptions returning 5.50% and 14.57% for the period, respectively. US Treasuries suffered as the 10-year yield increased from a low of 1.59% on December 6, 2012 to an intraday high of 2.23% on May 29, 2013—a pronounced move given that that the yield had remained well below 2 percent since April 2012.
When interpreting economic evidence through the prism of the taper, not only is good economic data good for equity returns but bad economic data has also been good news for developed market equities—when it signifies that the Fed will continue to provide liquidity to markets for longer. For most of the rest of the world in equity and commodity markets returns were flat to down. Emerging market equities returned 1.5%. The broad commodity futures were down 8.5% in the period with precious metals suffering the biggest decline, down 22.8% and gold futures down 18.9% (returns based on DJ UBS Commodity Index, Sub Precious Metals Index and Gold Index).
Portfolio Review
During the six month period, and relative to its benchmark index, the Fund held overweight positions in US small-cap equities and US and non-US fixed-income assets. The Fund held underweights in US large- cap and non-US equities, including emerging markets and in real
return assets, including real estate and commodities as well as in intermediate-term Treasury inflation protected securities (TIPS).
In the return generating part of portfolio, the equity holdings underperformed their benchmark. This was mostly due to underperformance in large cap equities as a result of both allocation and fund selection effects. The Fund was underweight US large cap in a period in which the Russell 1000 Index returned 16.68%. Selection effects in US small cap also detracted. Positive fund selection in international equities and emerging markets contributed to performance, helping to offset the negative effect from being underweight those sectors. Exposure to underlying funds implementing managed volatility strategies was a contributor to performance during the period as well.
In the defensive part of the portfolio, the Fund’s aggregate nominal bond positions outperformed the fixed income benchmark mainly due to fund selection and an overweight in agency and non-agency mortgage backed securities. The PIMCO Income Fund was up 6.58% in the period, with an excess return of 7.63% percentage points versus the Barclays US Aggregate Bond Index. A large allocation to the PIMCO Income Fund as well as the PIMCO Mortgage Opportunities Fund enabled the portfolios to gain exposure to the recovery in the housing market in the US and was part of the rationale for the underweight in equities.
The TIPS portion of the fixed income portfolio also contributed to performance due to asset allocation—a large underweight to intermediate term TIPS—and fund selection. Within the Fixed Income universe, TIPS overall underperformed Treasuries as the Barclays US Treasury US TIPS TR Index returned -4.57% versus the Barclays Aggregate Bond Treasury TR Index which was down 1.05%.
The Fund outperformed in commodities, due to a combination of being underweight the commodity benchmark, which was down 8.49% (based on the DJ UBS Commodity Total Return Index) for the period and positive fund selection. In real estate, the Fund underperformed its benchmark. Fund selection and a tilt toward global REITs detracted from performance in this sector. For the quarter, the S&P United States
| 16 | May 31, 2013 | | Semiannual Report |
Table of Contents
Unaudited
AllianzGI Retirement 2030 Fund (formerly Allianz Global Investors Solutions 2030 Fund) (cont’d)
Property Index outperformed the S&P Europe Property Index by more than 4%.
Outlook
Economic theory tells us that 10-year treasury yields will, in time, match long-term nominal GDP, at around 4% given the Fed’s 2% target inflation. However, the paths to get there and the timing remain uncertain. One virtuous path entails global growth accelerating and economic data steadily improving. The other path is dominated by eroding pricing power and a lack of improvement in the labor market. Both paths will lead to higher interest rates. But the first would be associated with good returns in equities while the second would be associated with equity losses.
More broadly, we are either experiencing the great rotation into equity market outperformance and global growth or the early stages of another global slowdown. An expansion in global growth would be led by the US and emerging markets and would be associated with a recovery in Europe and an escape from deflation in Japan. In such a scenario, we would expect earnings to grow and valuations to continue to improve.
Chairman Bernanke, in particular, has stated that the risks to taking stimulus out of the economy too soon outweigh the risks of keeping quantitative easing in place too long. Thus, should the global economy slow, the Fed, along with other developed country central banks will
likely err on the side of maintaining low to negative real rates.
If evidence mounts that suggests that the world is healing and growth is accelerating, we are prepared to systematically add to risk assets, targeting those with the most attractive valuations. We are positioned to be liquidity suppliers. The portfolios are overweight high-quality dividend-paying stocks, overweight US stocks and remain underweight euro-zone stocks. The portfolios are modestly underweight commodities and real estate, as well as underweight nominal duration. All of the portfolios are within their benchmark-determined risk budgets.
Average Annual Total Return for the period ended May 31, 2013
| 6 Month* | 1 Year | Since Inception† | ||||||||||||
| AllianzGI Retirement 2030 Fund Class A | 3.94% | 11.97% | 12.43% | |||||||||||
| AllianzGI Retirement 2030 Fund Class A (adjusted) | –1.78% | 5.81% | 11.00% | ||||||||||
| AllianzGI Retirement 2030 Fund Class C | 3.55% | 11.11% | 11.68% | |||||||||||
| AllianzGI Retirement 2030 Fund Class C (adjusted) | 2.55% | 10.11% | 11.68% | ||||||||||
| AllianzGI Retirement 2030 Fund Class D | 3.87% | 11.87% | 12.44% | ||||||||||
| AllianzGI Retirement 2030 Fund Class R | 3.82% | 11.63% | 12.21% | ||||||||||
| AllianzGI Retirement 2030 Fund Class P | 4.11% | 12.36% | 12.80% | ||||||||||
| AllianzGI Retirement 2030 Fund Class R6 | 4.16% | 12.46% | 12.90% | ||||||||||
| AllianzGI Retirement 2030 Fund Administrative Class | 4.03% | 12.06% | 12.58% | |||||||||||
| Dow Jones Real Return 2030 Index | 2.70% | 10.32% | 11.52% | ||||||||||
| Lipper Mixed-Asset Target 2030 Funds Average | 8.83% | 18.43% | 13.55% | |||||||||||
† The Fund began operations on 12/29/08. Benchmark return comparisons began on the fund inception date. Lipper performance comparisons began on 12/31/08.
* Cumulative return.
Performance quoted represents past performance and is no guarantee of future results. Current performance may be lower or higher than performance shown. For performance current to the most recent month-end, visit our website at us.allianzgi.com. Investment return and the principal value will fluctuate. Shares may be worth more or less than original cost when redeemed. The adjusted returns take into account the maximum initial sales charge of 5.50% on Class A shares and the contingent deferred sales charge (CDSC) of 1% on Class C shares, which may apply to shares redeemed during the first year of ownership. Returns do not reflect deduction of taxes that a shareholder would pay on fund distributions or redemption of fund shares. See pages 94 and 95 for more information. The Fund’s gross expense ratios are 1.32% for Class A shares, 2.07% for Class C shares, 1.32% for Class D shares, 1.57% for Class R shares, 0.92% for Class P shares, 0.82% for Class R6 shares and 1.17% for Administrative Class shares. These ratios do not include an expense reduction, contractually guaranteed through at least 3/31/14. The Fund’s expense ratios net of this reduction are 1.03% for Class A shares, 1.78% for Class C shares, 1.13% for Class D shares, 1.38% for Class R shares, 0.73% for Class P shares, 0.63% for Class R6 shares and 0.98% for Administrative Class shares. Expense ratio information is as of the Fund’s current prospectus dated April 1, 2013, as supplemented to date.
| Semiannual Report | | May 31, 2013 | 17 |
Table of Contents
Unaudited
AllianzGI Retirement 2030 Fund (formerly Allianz Global Investors Solutions 2030 Fund) (cont’d)
Cumulative Returns Through May 31, 2013
Fund Allocation (as of May 31, 2013)
PIMCO Real Return | 16.4% | |||
PIMCO Income | 7.1% | |||
PIMCO Mortgage Opportunities | 6.1% | |||
AllianzGI NFJ Global Dividend Value | 5.0% | |||
AllianzGI NFJ International Value | 5.0% | |||
PIMCO Foreign Bond (U.S. Dollar-Hedged | 4.5% | |||
PIMCO Floating Income | 4.5% | |||
AllianzGI Income & Growth | 4.5% | |||
Other | 46.1% | |||
Cash & Equivalents — Net | 0.8% |
| Shareholder Expense Example | Actual Performance | |||||||||||||
| Class A | Class C | Class D | Class R | Class P | Class R6 | Administrative Class | ||||||||
Beginning Account Value (12/1/12) | $1,000.00 | $1,000.00 | $1,000.00 | $1,000.00 | $1,000.00 | $1,000.00 | $1,000.00 | |||||||
Ending Account Value (5/31/13) | $1,039.40 | $1,035.50 | $1,038.70 | $1,038.20 | $1,041.10 | $1,041.60 | $1,040.30 | |||||||
Expenses Paid During Period | $1.73 | $5.53 | $2.24 | $3.51 | $0.20 | $— | $1.48 | |||||||
Hypothetical Performance | ||||||||||||||
(5% return before expenses) | ||||||||||||||
Class A | Class C | Class D | Class R | Class P | Class R6 | Administrative | ||||||||
Beginning Account Value (12/1/12) | $1,000.00 | $1,000.00 | $1,000.00 | $1,000.00 | $1,000.00 | $1,000.00 | $1,000.00 | |||||||
Ending Account Value (5/31/13) | $1,023.24 | $1,019.50 | $1,022.74 | $1,021.49 | $1,024.73 | $1,024.93 | $1,023.49 | |||||||
Expenses Paid During Period | $1.72 | $5.49 | $2.22 | $3.48 | $0.20 | $— | $1.46 | |||||||
For each class of the Fund, expenses (net of fee waiver and reimbursement, if any) are equal to the annualized expense ratio for the class (0.34% for Class A, 1.09% for Class C, 0.44% for Class D, 0.69% for Class R, 0.04% for Class P, 0.00% for Class R6 and 0.29% for Administrative Class), multiplied by the average account value over the period, multiplied by 182/365. The expense ratio excludes the expenses of the Underlying Funds, which based upon the allocation of the Fund’s assets among the Underlying Funds are indirectly borne by the shareholders of the Fund.
| 18 | May 31, 2013 | | Semiannual Report |
Table of Contents
(THIS PAGE INTENTIONALLY LEFT BLANK)
| Semiannual Report | | May 31, 2013 | 19 |
Table of Contents
Unaudited
AllianzGI Retirement 2035 Fund (formerly Allianz Global Investors Solutions 2035 Fund)
For the period of December 1, 2012 through May 31, 2013, as provided by the Allianz Global Investors US Multi Asset Group.
Portfolio Insights
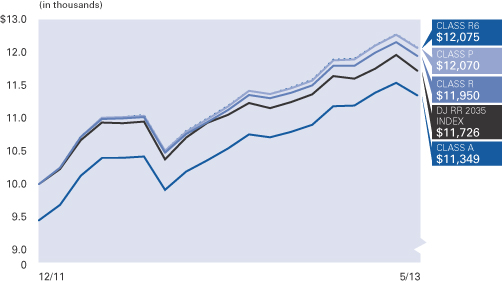
For the reporting period ended May 31, 2013, Class A shares at NAV of the AllianzGI Retirement 2035 Fund (the “Fund”) returned 5.14% outperforming the Dow Jones Real Return 2035 Index (the “benchmark index”) which returned 4.25%.
What Happened
For the six months ended May 31, 2013, the dominant theme for global market returns has been central bank policy. Quantitative Easing (QE) has gone global and is the single most dominant force in global markets. Turning from QE to the fundamentals of economic growth and earnings, in the US, the economy continued to grow, albeit at a slower pace than initially expected, with first quarter GDP expanding at 2.4%. In Europe, the struggle for growth remains a persistent theme, which has forced the European Central Bank (ECB) to take more unconventional policy actions including, in early May, raising the prospect of introducing negative interest rates on deposits at the ECB. Further evidence of a slowdown in emerging markets, mainly the BRICs, continued to trickle in during the period.
During the past six months, there have been three major market-moving events. First, the most radical quantitative easing experiment to date was announced and then implemented in Japan following the election of Shinzo Abe to Prime Minister in December. A second new theme is the uncertainty surrounding the timing and size of the Federal Reserve’s (the “Fed’s”) beginning of the end of QE, the so-called “taper,” when the Fed reduces its monthly bond purchases from its current rate of $85 billion. Third, on the fiscal front in the US, the threat of a sequester and fear of a government shutdown ended with the sequester slowing government spending while tax revenues are up in a growing (even if slowly) economy, producing a rapidly improving fiscal position. The US federal deficit is now on track to decline from more than 10% of GDP to around 4% of GDP by the end of the fiscal year (based on Congressional Budget Office projections).
Quantitative easing around the world drove risk asset returns in the developed world. For the period, equities returned 47.7% in Japan, 16.5% in the US and 13.3% in Europe (all equity returns based on MSCI indexes, local currency). The link between central bank asset purchases and equity performance has strengthened significantly
since quantitative easing was first initiated: in the US, since November 2008, the correlation between the Fed’s balance sheet and the S&P 500 Index is over .90 (whereas in the five years leading up to the financial crisis, the correlation is less than 0.2).
The questions surrounding the taper—both when and how quickly the Fed will put the brakes on asset purchases—also resulted in higher volatility across asset markets for the period, while core fixed income generally sold off toward the end of the period and equities rallied. Within fixed income, high yield and convertibles stand out as exceptions returning 5.50% and 14.57% for the period, respectively. US Treasuries suffered as the 10-year yield increased from a low of 1.59% on December 6, 2012 to an intraday high of 2.23% on May 29, 2013—a pronounced move given that that the yield had remained well below 2 percent since April 2012.
When interpreting economic evidence through the prism of the taper, not only is good economic data good for equity returns but bad economic data has also been good news for developed market equities—when it signifies that the Fed will continue to provide liquidity to markets for longer. For most of the rest of the world in equity and commodity markets returns were flat to down. Emerging market equities returned 1.5%. The broad commodity futures were down 8.5% in the period with precious metals suffering the biggest decline, down 22.8% and gold futures down 18.9% (returns based on DJ UBS Commodity Index, Sub Precious Metals Index and Gold Index).
Portfolio Review
During the six month period, and relative to its benchmark index, the Fund held overweight positions in US and non-US small-cap equities and US and non-US fixed-income assets. The Fund held underweights in US and non-US large-cap, emerging markets equities and in real
return assets, including real estate and commodities as well as in intermediate-term Treasury inflation protected securities (TIPS).
In the return generating part of portfolio, the equity holdings underperformed their benchmark. This was mostly due to underperformance in large cap equities as a result of both allocation and fund selection effects. The Fund was underweight US large cap in a period in which the Russell 1000 Index returned 16.68%. Selection effects in US small cap also detracted. Positive fund selection in international equities and emerging markets contributed to performance, helping to offset the negative effect from being underweight those sectors. Exposure to underlying funds implementing managed volatility strategies was a contributor to performance during the period as well.
In the defensive part of the portfolio, the Fund’s aggregate nominal bond positions outperformed the fixed income benchmark mainly due to fund selection and an overweight in agency and non-agency mortgage backed securities. The PIMCO Income Fund was up 6.58% in the period, with an excess return of 7.63% percentage points versus the Barclays US Aggregate Bond Index. A large allocation to the PIMCO Income Fund as well as the PIMCO Mortgage Opportunities Fund enabled the portfolios to gain exposure to the recovery in the housing market in the US and was part of the rationale for the underweight in equities.
The TIPS portion of the fixed income portfolio also contributed to performance due to asset allocation—a large underweight to intermediate term TIPS—and fund selection. Within the Fixed Income universe, TIPS overall underperformed Treasuries as the Barclays US Treasury US TIPS TR Index returned -4.57% versus the Barclays Aggregate Bond Treasury TR Index which was down 1.05%.
The Fund outperformed in commodities, due to a combination of being underweight the commodity benchmark, which was down 8.49% (based on the DJ UBS Commodity Total Return Index) for the period and positive fund selection.
In real estate, the Fund underperformed its benchmark. Fund selection and a tilt toward
| 20 | May 31, 2013 | | Semiannual Report |
Table of Contents
Unaudited
AllianzGI Retirement 2035 Fund (formerly Allianz Global Investors Solutions 2035 Fund) (cont’d)
global REITs detracted from performance in this sector. For the quarter, the S&P United States Property Index outperformed the S&P Europe Property Index by more than 4%.
Outlook
Economic theory tells us that 10-year treasury yields will, in time, match long-term nominal GDP, at around 4% given the Fed’s 2% target inflation. However, the paths to get there and the timing remain uncertain. One virtuous path entails global growth accelerating and economic data steadily improving. The other path is dominated by eroding pricing power and a lack of improvement in the labor market. Both paths will lead to higher interest rates. But the first would be associated with good returns in equities while the second would be associated with equity losses.
More broadly, we are either experiencing the great rotation into equity market outperformance and global growth or the early stages of another global slowdown. An expansion in global growth would be led by the US and emerging markets and would be associated with a recovery in Europe and an escape from deflation in Japan. In such a scenario, we would expect earnings to grow and valuations to continue to improve.
Chairman Bernanke, in particular, has stated that the risks to taking stimulus out of the economy too soon outweigh the risks of keeping quantitative easing in place too long. Thus, should the global economy slow, the Fed, along with other developed country central banks will likely err on the side of maintaining low to negative real rates.
If evidence mounts that suggests that the world is healing and growth is accelerating, we are prepared to systematically add to risk assets, targeting those with the most attractive valuations. We are positioned to be liquidity suppliers. The portfolios are overweight high-quality dividend-paying stocks, overweight US stocks and remain underweight euro-zone stocks. The portfolios are modestly underweight commodities and real estate, as well as underweight nominal duration. All of the portfolios are within their benchmark-determined risk budgets.
Average Annual Total Return for the period ended May 31, 2013
| 6 Month* | 1 Year | Since Inception† | ||||||||||||
| AllianzGI Retirement 2035 Fund Class A | 5.14% | 14.47% | 13.48% | |||||||||||
| AllianzGI Retirement 2035 Fund Class A (adjusted) | –0.64% | 8.17% | 9.13% | ||||||||||
| AllianzGI Retirement 2035 Fund Class R | 4.95% | 14.07% | 13.09% | ||||||||||
| AllianzGI Retirement 2035 Fund Class P | 5.33% | 14.86% | 13.85% | ||||||||||
| AllianzGI Retirement 2035 Fund Class R6 | 5.33% | 14.93% | 13.90% | ||||||||||
| AllianzGI Retirement 2035 Fund Administrative Class | 5.21% | 14.54% | 13.52% | |||||||||||
| Dow Jones Real Return 2035 Index | 4.25% | 13.04% | 11.62% | ||||||||||
| Lipper Mixed-Asset Target 2035 Funds Average | 10.48% | 20.97% | 16.62% | |||||||||||
† The Fund began operations on 12/19/11. Benchmark return comparisons began on the fund inception date. Lipper performance comparisons began on 12/31/11.
* Cumulative return.
Performance quoted represents past performance and is no guarantee of future results. Current performance may be lower or higher than performance shown. For performance current to the most recent month-end, visit our website at us.allianzgi.com. Investment return and the principal value will fluctuate. Shares may be worth more or less than original cost when redeemed. The adjusted returns take into account the maximum initial sales charge of 5.50% on Class A shares. Returns do not reflect deduction of taxes that a shareholder would pay on fund distributions or redemption of fund shares. See pages 94 and 95 for more information. The Fund’s gross expense ratios are 1.34% for Class A shares, 1.59% for Class R shares, 0.94% for Class P shares, 0.84% for Class R6 shares and 1.19% for Administrative Class shares. These ratios do not include an expense reduction, contractually guaranteed through at least 3/31/14. The Fund’s expense ratios net of this reduction are 1.06% for Class A shares, 1.41% for Class R shares, 0.76% for Class P shares, 0.66% for Class R6 shares and 1.01% for Administrative Class shares. Expense ratio information is as of the Fund’s current prospectus dated April 1, 2013, as supplemented to date.
| Semiannual Report | | May 31, 2013 | 21 |
Table of Contents
Unaudited
AllianzGI Retirement 2035 Fund (formerly Allianz Global Investors Solutions 2035 Fund) (cont’d)
Cumulative Returns Through May 31, 2013
Fund Allocation (as of
May 31, 2013)
| PIMCO Real Return | 9.1% | |||
| PIMCO Income | 6.6% | |||
| AllianzGI NFJ International Value | 5.9% | |||
| AllianzGI NFJ Global Dividend Value | 5.4% | |||
| PIMCO Mortgage Opportunities | 5.0% | |||
| AllianzGI NFJ Dividend Value | 5.0% | |||
| AllianzGI Income & Growth | 4.7% | |||
| AllianzGI NFJ Mid-Cap Value | 4.6% | |||
| Other | 53.0% | |||
| Cash & Equivalents — Net | 0.7% |
| Shareholder Expense Example | Actual Performance | |||||||||
Class A | Class R | Class P | Class R6 | Administrative | ||||||
Beginning Account Value (12/1/12) | $1,000.00 | $1,000.00 | $1,000.00 | $1,000.00 | $1,000.00 | |||||
Ending Account Value (5/31/13) | $1,051.40 | $1,049.50 | $1,053.30 | $1,053.30 | $1,052.10 | |||||
Expenses Paid During Period | $1.84 | $3.63 | $0.31 | $— | $1.59 | |||||
| Hypothetical Performance | ||||||||||
| (5% return before expenses) | ||||||||||
Class A | Class R | Class P | Class R6 | Administrative | ||||||
Beginning Account Value (12/1/12) | $1,000.00 | $1,000.00 | $1,000.00 | $1,000.00 | $1,000.00 | |||||
Ending Account Value (5/31/13) | $1,023.14 | $1,021.39 | $1,024.63 | $1,024.93 | $1,023.39 | |||||
Expenses Paid During Period | $1.82 | $3.58 | $0.30 | $— | $1.56 | |||||
For each class of the Fund, expenses (net of fee waiver and reimbursement, if any) are equal to the annualized expense ratio for the class (0.36% for Class A, 0.71% for Class R, 0.06% for Class P, 0.00% for Class R6 and 0.31% for Administrative Class), multiplied by the average account value over the period, multiplied by 182/365. The expense ratio excludes the expenses of the Underlying Funds, which based upon the allocation of the Fund’s assets among the Underlying Funds are indirectly borne by the shareholders of the Fund.
| 22 | May 31, 2013 | | Semiannual Report |
Table of Contents
(THIS PAGE INTENTIONALLY LEFT BLANK)
| Semiannual Report | | May 31, 2013 | 23 |
Table of Contents
Unaudited
AllianzGI Retirement 2040 Fund (formerly Allianz Global Investors Solutions 2040 Fund)
For the period of December 1, 2012 through May 31, 2013, as provided by the Allianz Global Investors US Multi Asset Group.
Portfolio Insights
For the reporting period ended May 31, 2013, Class A shares at NAV of the AllianzGI Retirement 2040 Fund (the “Fund”) returned 6.41% outperforming the Dow Jones Real Return 2040 Index (the “benchmark index”) which returned 5.66%.
What Happened
For the six months ended May 31, 2013, the dominant theme for global market returns has been central bank policy. Quantitative Easing (QE) has gone global and is the single most dominant force in global markets. Turning from QE to the fundamentals of economic growth and earnings, in the US, the economy continued to grow, albeit at a slower pace than initially expected, with first quarter GDP expanding at 2.4%. In Europe, the struggle for growth remains a persistent theme, which has forced the European Central Bank (ECB) to take more unconventional policy actions including, in early May, raising the prospect of introducing negative interest rates on deposits at the ECB. Further evidence of a slowdown in emerging markets, mainly the BRICs, continued to trickle in during the period.
During the past six months, there have been three major market-moving events. First, the most radical quantitative easing experiment to date was announced and then implemented in Japan following the election of Shinzo Abe to Prime Minister in December. A second new theme is the uncertainty surrounding the timing and size of the Federal Reserve’s (the “Fed’s”) beginning of the end of QE, the so-called “taper,” when the Fed reduces its monthly bond purchases from its current rate of $85 billion. Third, on the fiscal front in the US, the threat of a sequester and fear of a government shutdown ended with the sequester slowing government spending while tax revenues are up in a growing (even if slowly) economy, producing a rapidly improving fiscal position. The US federal deficit is now on track to decline from more than 10% of GDP to around 4% of GDP by the end of the fiscal year (based on Congressional Budget Office projections).
Quantitative easing around the world drove risk asset returns in the developed world. For the period, equities returned 47.7% in Japan, 16.5% in the US and 13.3% in Europe (all equity returns based on MSCI indexes, local currency). The link
between central bank asset purchases and equity performance has strengthened significantly since quantitative easing was first initiated: in the US, since November 2008, the correlation between the Fed’s balance sheet and the S&P 500 Index is over .90 (whereas in the five years leading up to the financial crisis, the correlation is less than 0.2).
The questions surrounding the taper—both when and how quickly the Fed will put the brakes on asset purchases—also resulted in higher volatility across asset markets for the period, while core fixed income generally sold off toward the end of the period and equities rallied. Within fixed income, high yield and convertibles stand out as exceptions returning 5.50% and 14.57% for the period, respectively. US Treasuries suffered as the 10-year yield increased from a low of 1.59% on December 6, 2012 to an intraday high of 2.23% on May 29, 2013—a pronounced move given that that the yield had remained well below 2 percent since April 2012.
When interpreting economic evidence through the prism of the taper, not only is good economic data good for equity returns but bad economic data has also been good news for developed market equities—when it signifies that the Fed will continue to provide liquidity to markets for longer. For most of the rest of the world in equity and commodity markets returns were flat to down. Emerging market equities returned 1.5%. The broad commodity futures were down 8.5% in the period with precious metals suffering the biggest decline, down 22.8% and gold futures down 18.9% (returns based on DJ UBS Commodity Index, Sub Precious Metals Index and Gold Index).
Portfolio Review
During the six month period, and relative to its benchmark index, the Fund held overweight positions in US and non-US small-cap equities
and US and non-US fixed-income assets. The Fund held underweights in US and non-US large- cap, emerging markets equities and in real return assets, including real estate and commodities as well as in intermediate-term Treasury inflation protected securities (TIPS).
In the return generating part of portfolio, the equity holdings underperformed their benchmark. This was mostly due to underperformance in large cap equities as a result of both allocation and fund selection effects. The Fund was underweight US large cap in a period in which the Russell 1000 Index returned 16.68%. Selection effects in US small cap also detracted. Positive fund selection in international equities and emerging markets contributed to performance, helping to offset the negative effect from being underweight those sectors. Exposure to underlying funds implementing managed volatility strategies was a contributor to performance during the period as well.
In the defensive part of the portfolio, the Fund’s aggregate nominal bond positions outperformed the fixed income benchmark mainly due to fund selection and an overweight in agency and non-agency mortgage backed securities. The PIMCO Income Fund was up 6.58% in the period, with an excess return of 7.63% percentage points versus the Barclays US Aggregate Bond Index. A large allocation to the PIMCO Income Fund as well as the PIMCO Mortgage Opportunities Fund enabled the portfolios to gain exposure to the recovery in the housing market in the US and was part of the rationale for the underweight in equities.
The TIPS portion of the fixed income portfolio also contributed to performance due to asset allocation—a large underweight to intermediate term TIPS—and fund selection. Within the Fixed Income universe, TIPS overall underperformed Treasuries as the Barclays US Treasury US TIPS TR Index returned -4.57% versus the Barclays Aggregate Bond Treasury TR Index which was down 1.05%.
The Fund outperformed in commodities, due to a combination of being underweight the commodity benchmark, which was down 8.49% (based on the DJ UBS Commodity Total Return Index) for the period and positive fund selection.
| 24 | May 31, 2013 | | Semiannual Report |
Table of Contents
Unaudited
AllianzGI Retirement 2040 Fund (formerly Allianz Global Investors Solutions 2040 Fund) (cont’d)
In real estate, the Fund underperformed its benchmark. Fund selection and a tilt toward global REITs detracted from performance in this sector. For the quarter, the S&P United States Property Index outperformed the S&P Europe Property Index by more than 4%.
Outlook
Economic theory tells us that 10-year treasury yields will, in time, match long-term nominal GDP, at around 4% given the Fed’s 2% target inflation. However, the paths to get there and the timing remain uncertain. One virtuous path entails global growth accelerating and economic data steadily improving. The other path is dominated by eroding pricing power and a lack of improvement in the labor market. Both paths will lead to higher interest rates. But the first
would be associated with good returns in equities while the second would be associated with equity losses.
More broadly, we are either experiencing the great rotation into equity market outperformance and global growth or the early stages of another global slowdown. An expansion in global growth would be led by the US and emerging markets and would be associated with a recovery in Europe and an escape from deflation in Japan. In such a scenario, we would expect earnings to grow and valuations to continue to improve.
Chairman Bernanke, in particular, has stated that the risks to taking stimulus out of the economy too soon outweigh the risks of keeping quantitative easing in place too long. Thus,
should the global economy slow, the Fed, along with other developed country central banks will likely err on the side of maintaining low to negative real rates.
If evidence mounts that suggests that the world is healing and growth is accelerating, we are prepared to systematically add to risk assets, targeting those with the most attractive valuations. We are positioned to be liquidity suppliers. The portfolios are overweight high-quality dividend-paying stocks, overweight US stocks and remain underweight euro-zone stocks. The portfolios are modestly underweight commodities and real estate, as well as underweight nominal duration. All of the portfolios are within their benchmark-determined risk budgets.
Average Annual Total Return for the period ended May 31, 2013
6 Month* | 1 Year | Since Inception† | ||||||||||||
| AllianzGI Retirement 2040 Fund Class A | 6.41% | 16.10% | 14.03% | |||||||||||
| AllianzGI Retirement 2040 Fund Class A (adjusted) | 0.56% | 9.72% | 12.58% | ||||||||||
| AllianzGI Retirement 2040 Fund Class C | 5.95% | 15.24% | 13.14% | |||||||||||
| AllianzGI Retirement 2040 Fund Class C (adjusted) | 4.95% | 14.24% | 13.14% | ||||||||||
| AllianzGI Retirement 2040 Fund Class D | 6.35% | 15.95% | 13.93% | ||||||||||
| AllianzGI Retirement 2040 Fund Class R | 6.19% | 15.70% | 13.69% | ||||||||||
| AllianzGI Retirement 2040 Fund Class P | 6.54% | 16.50% | 14.31% | ||||||||||
| AllianzGI Retirement 2040 Fund Class R6 | 6.59% | 16.54% | 14.40% | ||||||||||
| AllianzGI Retirement 2040 Fund Administrative Class | 6.40% | 16.12% | 14.07% | |||||||||||
| Dow Jones Real Return 2040 Index | 5.66% | 15.53% | 13.12% | ||||||||||
| Lipper Mixed-Asset Target 2040 Funds Average | 10.40% | 21.13% | 14.31% | |||||||||||
† The Fund began operations on 12/29/08. Benchmark return comparisons began on the fund inception date. Lipper performance comparisons began on 12/31/08.
* Cumulative return.
Performance quoted represents past performance and is no guarantee of future results. Current performance may be lower or higher than performance shown. For performance current to the most recent month-end, visit our website at us.allianzgi.com. Investment return and the principal value will fluctuate. Shares may be worth more or less than original cost when redeemed. The adjusted returns take into account the maximum initial sales charge of 5.50% on Class A shares and the contingent deferred sales charge (CDSC) of 1% on Class C shares, which may apply to shares redeemed during the first year of ownership. Returns do not reflect deduction of taxes that a shareholder would pay on fund distributions or redemption of fund shares. See pages 94 and 95 for more information. The Fund’s gross expense ratios are 1.39% for Class A shares, 2.14% for Class C shares, 1.39% for Class D shares, 1.64% for Class R shares, 0.99% for Class P shares, 0.89% for Class R6 shares and 1.24% for Administrative Class shares. These ratios do not include an expense reduction, contractually guaranteed through at least 3/31/14. The Fund’s expense ratios net of this reduction are 1.09% for Class A shares, 1.84% for Class C shares, 1.19% for Class D shares, 1.44% for Class R shares, 0.79% for Class P shares, 0.69% for Class R6 shares and 1.04% for Administrative Class shares. Expense ratio information is as of the Fund’s current prospectus dated April 1, 2013, as supplemented to date.
| Semiannual Report | | May 31, 2013 | 25 |
Table of Contents
Unaudited
AllianzGI Retirement 2040 Fund (formerly Allianz Global Investors Solutions 2040 Fund) (cont’d)
Cumulative Returns Through May 31, 2013
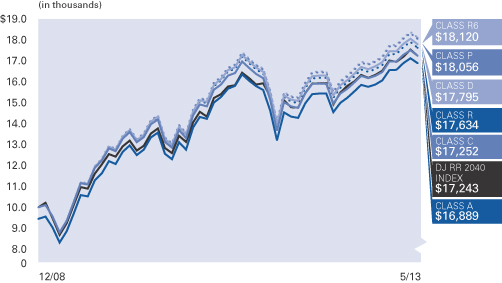
Fund Allocation (as of May 31, 2013)
| AllianzGI NFJ International Value | 6.3% | |||
| PIMCO Income | 6.1% | |||
| AllianzGI NFJ Dividend Value | 6.0% | |||
| AllianzGI Income & Growth | 5.5% | |||
| AllianzGI NFJ Global Dividend Value | 5.5% | |||
| PIMCO Mortgage Opportunities | 5.1% | |||
| AllianzGI International Small-Cap | 4.7% | |||
| PIMCO Floating Income | 4.5% | |||
| Other | 55.5% | |||
| Cash & Equivalents — Net | 0.8% |
| Shareholder Expense Example | Actual Performance | |||||||||||||
| Class A | Class C | Class D | Class R | Class P | Class R6 | Administrative Class | ||||||||
| Beginning Account Value (12/1/12) | $1,000.00 | $1,000.00 | $1,000.00 | $1,000.00 | $1,000.00 | $1,000.00 | $1,000.00 | |||||||
| Ending Account Value (5/31/13) | $1,064.10 | $1,059.50 | $1,063.50 | $1,061.90 | $1,065.40 | $1,065.90 | $1,064.00 | |||||||
| Expenses Paid During Period | $1.80 | $5.65 | $2.32 | $3.60 | $0.26 | $— | $1.54 | |||||||
| Hypothetical Performance | ||||||||||||||
| (5% return before expenses) | ||||||||||||||
| Class A | Class C | Class D | Class R | Class P | Class R6 | Administrative Class | ||||||||
| Beginning Account Value (12/1/12) | $1,000.00 | $1,000.00 | $1,000.00 | $1,000.00 | $1,000.00 | $1,000.00 | $1,000.00 | |||||||
| Ending Account Value (5/31/13) | $1,023.19 | $1,019.45 | $1,022.69 | $1,021.44 | $1,024.68 | $1,024.93 | $1,023.44 | |||||||
| Expenses Paid During Period | $1.77 | $5.54 | $2.27 | $3.53 | $0.25 | $— | $1.51 | |||||||
For each class of the Fund, expenses (net of fee waiver and reimbursement, if any) are equal to the annualized expense ratio for the class (0.35% for Class A, 1.10% for Class C, 0.45% for Class D, 0.70% for Class R, 0.05% for Class P, 0.00% for Class R6 and 0.30% for Administrative Class), multiplied by the average account value over the period, multiplied by 182/365. The expense ratio excludes the expenses of the Underlying Funds, which based upon the allocation of the Fund’s assets among the Underlying Funds are indirectly borne by the shareholders of the Fund.
| 26 | May 31, 2013 | | Semiannual Report |
Table of Contents
(THIS PAGE INTENTIONALLY LEFT BLANK)
| Semiannual Report | | May 31, 2013 | 27 |
Table of Contents
Unaudited
AllianzGI Retirement 2045 Fund (formerly Allianz Global Investors Solutions 2045 Fund)
For the period of December 1, 2012 through May 31, 2013, as provided by the Allianz Global Investors US Multi Asset Group.
Portfolio Insights
For the reporting period ended May 31, 2013, Class A shares at NAV of the AllianzGI Retirement 2045 Fund (the “Fund”) returned 6.94% outperforming the Dow Jones Real Return 2045 Index (the “benchmark index”) which returned 6.78%.
What Happened
For the six months ending May 31, 2013 the dominant theme for global market returns has been central bank policy. Quantitative Easing (QE) has gone global and is the single most dominant force in global markets. Turning from QE to the fundamentals of economic growth and earnings, in the US, the economy continued to grow, albeit at a slower pace than initially expected, with first quarter GDP expanding at 2.4%. In Europe, the struggle for growth remains a persistent theme, which has forced the European Central Bank (ECB) to take more unconventional policy actions including, in early May, raising the prospect of introducing negative interest rates on deposits at the ECB. Further evidence of a slowdown in emerging markets, mainly the BRICs, continued to trickle in during the period.
During the past six months, there have been three major market-moving events. First, the most radical quantitative easing experiment to date was announced and then implemented in Japan following the election of Shinzo Abe to Prime Minister in December. A second new theme is the uncertainty surrounding the timing and size of the Federal Reserve’s (the “Fed’s”) beginning of the end of QE, the so-called “taper,” when the Fed reduces its monthly bond purchases from its current rate of $85 billion. Third, on the fiscal front in the US, the threat of a sequester and fear of a government shutdown ended with the sequester slowing government spending while tax revenues are up in a growing (even if slowly) economy, producing a rapidly improving fiscal position. The US federal deficit is now on track to decline from more than 10% of GDP to around 4% of GDP by the end of the fiscal year (based on Congressional Budget Office projections).
Quantitative easing around the world drove risk asset returns in the developed world. For the period, equities returned 47.7% in Japan, 16.5% in the US and 13.3% in Europe (all equity returns based on MSCI indexes, local currency). The link between central bank asset purchases and equity performance has strengthened significantly
since quantitative easing was first initiated: in the US, since November 2008, the correlation between the Fed’s balance sheet and the S&P 500 Index is over .90 (whereas in the five years leading up to the financial crisis, the correlation is less than 0.2).
The questions surrounding the taper—both when and how quickly the Fed will put the brakes on asset purchases—also resulted in higher volatility across asset markets for the period, while core fixed income generally sold off toward the end of the period and equities rallied. Within fixed income, high yield and convertibles stand out as exceptions returning 5.50% and 14.57% for the period, respectively. US Treasuries suffered as the 10-year yield increased from a low of 1.59% on December 6, 2012 to an intraday high of 2.23% on May 29, 2013—a pronounced move given that that the yield had remained well below 2 percent since April 2012.
When interpreting economic evidence through the prism of the taper, not only is good economic data good for equity returns but bad economic data has also been good news for developed market equities—when it signifies that the Fed will continue to provide liquidity to markets for longer. For most of the rest of the world in equity and commodity markets returns were flat to down. Emerging market equities returned 1.5%. The broad commodity futures were down 8.5% in the period with precious metals suffering the biggest decline, down 22.8% and gold futures down 18.9% (returns based on DJ UBS Commodity Index, Sub Precious Metals Index and Gold Index).
Portfolio Review
During the six month period, and relative to its benchmark, the Fund held overweight positions in US and non-US small-cap equities and US and non-US fixed-income assets. The Fund held underweights in US and non-US large- cap, emerging markets equities and in real return
assets, including real estate and commodities as well as in intermediate-term Treasury inflation protected securities (TIPS).
In the return generating part of portfolio, the equity holdings underperformed their benchmark. This was mostly due to underperformance in large cap equities as a result of both allocation and fund selection effects. The Fund was underweight US large cap in a period in which the Russell 1000 Index returned 16.68%. Selection effects in US small cap also detracted. Positive fund selection in international equities and emerging markets contributed to performance, helping to offset the negative effect from being underweight those sectors. Exposure to underlying funds implementing managed volatility strategies was a contributor to performance during the period as well.
In the defensive part of the portfolio, the Fund’s aggregate nominal bond positions outperformed the fixed income benchmark mainly due to fund selection and an overweight in agency and non-agency mortgage backed securities. The PIMCO Income Fund was up 6.58% in the period, with an excess return of 7.63% percentage points versus the Barclays US Aggregate Bond Index. A large allocation to the PIMCO Income Fund as well as the PIMCO Mortgage Opportunities Fund enabled the portfolios to gain exposure to the recovery in the housing market in the US and was part of the rationale for the underweight in equities.
The TIPS portion of the fixed income portfolio also contributed to performance due to asset allocation—a large underweight to intermediate term TIPS—and fund selection. Within the Fixed Income universe, TIPS overall underperformed Treasuries as the Barclays US Treasury US TIPS TR Index returned -4.57% versus the Barclays Aggregate Bond Treasury TR Index which was down 1.05%.
The Fund outperformed in commodities, due to a combination of being underweight the commodity benchmark, which was down 8.49% (based on the DJ UBS Commodity Total Return Index) for the period and positive fund selection.
In real estate, the Fund underperformed its benchmark. Fund selection and a tilt toward global REITs detracted from performance in this
| 28 | May 31, 2013 | | Semiannual Report |
Table of Contents
Unaudited
AllianzGI Retirement 2045 Fund (formerly Allianz Global Investors Solutions 2045 Fund) (cont’d)
sector. For the quarter, the S&P United States Property Index outperformed the S&P Europe Property Index by more than 4%.
Outlook
Economic theory tells us that 10-year treasury yields will, in time, match long-term nominal GDP, at around 4% given the Fed’s 2% target inflation. However, the paths to get there and the timing remain uncertain. One virtuous path entails global growth accelerating and economic data steadily improving. The other path is dominated by eroding pricing power and a lack of improvement in the labor market. Both paths will lead to higher interest rates. But the first would be associated with good returns in equities while the second would be associated with equity losses.
More broadly, we are either experiencing the great rotation into equity market outperformance and global growth or the early stages of another global slowdown. An expansion in global growth would be led by the US and emerging markets and would be associated with a recovery in Europe and an escape from deflation in Japan. In such a scenario, we would expect earnings to grow and valuations to continue to improve.
Chairman Bernanke, in particular, has stated that the risks to taking stimulus out of the economy too soon outweigh the risks of keeping quantitative easing in place too long. Thus, should the global economy slow, the Fed, along with other developed country central banks will likely err on the side of maintaining low to negative real rates.
If evidence mounts that suggests that the world is healing and growth is accelerating, we are prepared to systematically add to risk assets, targeting those with the most attractive valuations. We are positioned to be liquidity suppliers. The portfolios are overweight high-quality dividend-paying stocks, overweight US stocks and remain underweight euro-zone stocks. The portfolios are modestly underweight commodities and real estate, as well as underweight nominal duration. All of the portfolios are within their benchmark-determined risk budgets.
Average Annual Total Return for the period ended May 31, 2013
| 6 Month* | 1 Year | Since Inception† | ||||||||||||
| AllianzGI Retirement 2045 Fund Class A | 6.94% | 17.50% | 15.40% | |||||||||||
| AllianzGI Retirement 2045 Fund Class A (adjusted) | 1.05% | 11.04% | 10.98% | ||||||||||
| AllianzGI Retirement 2045 Fund Class R | 6.78% | 17.07% | 14.99% | ||||||||||
| AllianzGI Retirement 2045 Fund Class P | 7.12% | 17.83% | 15.73% | ||||||||||
| AllianzGI Retirement 2045 Fund Class R6 | 7.18% | 17.88% | 15.82% | ||||||||||
| AllianzGI Retirement 2045 Fund Administrative Class | 6.95% | 17.45% | 15.37% | |||||||||||
| Dow Jones Real Return 2045 Index | 6.78% | 17.48% | 14.83% | ||||||||||
| Lipper Mixed-Asset Target 2045 Funds Average | 11.38% | 22.51% | 17.91% | |||||||||||
† The Fund began operations on 12/19/11. Benchmark return comparisons began on the fund inception date. Lipper performance comparisons began on 12/31/11.
* Cumulative return.
Performance quoted represents past performance and is no guarantee of future results. Current performance may be lower or higher than performance shown. For performance current to the most recent month-end, visit our website at us.allianzgi.com. Investment return and the principal value will fluctuate. Shares may be worth more or less than original cost when redeemed. The adjusted returns take into account the maximum initial sales charge of 5.50% on Class A shares. Returns do not reflect deduction of taxes that a shareholder would pay on fund distributions or redemption of fund shares. See pages 94 and 95 for more information. The Fund’s gross expense ratios are 1.40% for Class A shares, 1.65% for Class R shares, 1.00% for Class P shares, 0.90% for Class R6 shares and 1.25% for Administrative Class shares. These ratios do not include an expense reduction, contractually guaranteed through at least 3/31/14. The Fund’s expense ratios net of this reduction are 1.10% for Class A shares, 1.45% for Class R shares, 0.80% for Class P shares, 0.70% for Class R6 shares and 1.05% for Administrative Class shares. Expense ratio information is as of the Fund’s current prospectus dated April 1, 2013, as supplemented to date.
| Semiannual Report | | May 31, 2013 | 29 |
Table of Contents
Unaudited
AllianzGI Retirement 2045 Fund (formerly Allianz Global Investors Solutions 2045 Fund) (cont’d)
Cumulative Returns Through May 31, 2013
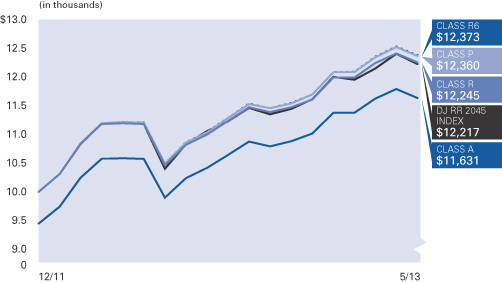
Fund Allocation (as of May 31, 2013)
| AllianzGI NFJ International Value | 6.8% | |||
| AllianzGI NFJ Dividend Value | 6.1% | |||
| AllianzGI NFJ Global Dividend Value | 6.0% | |||
| AllianzGI International Small-Cap | 5.8% | |||
| AllianzGI Income & Growth | 5.5% | |||
| PIMCO Mortgage Opportunities | 5.1% | |||
| AllianzGI NFJ Mid-Cap Value | 5.1% | |||
| AllianzGI U.S. Managed Volatility | 5.0% | |||
| Other | 53.7% | |||
| Cash & Equivalents — Net | 0.9% |
| Shareholder Expense Example | Actual Performance | |||||||||
| Class A | Class R | Class P | Class R6 | Administrative Class | ||||||
| Beginning Account Value (12/1/12) | $1,000.00 | $1,000.00 | $1,000.00 | $1,000.00 | $1,000.00 | |||||
| Ending Account Value (5/31/13) | $1,069.40 | $1,067.80 | $1,071.20 | $1,071.80 | $1,069.50 | |||||
| Expenses Paid During Period | $1.81 | $3.61 | $0.26 | $— | $1.55 | |||||
| Hypothetical Performance | ||||||||||
| (5% return before expenses) | ||||||||||
| Class A | Class R | Class P | Class R6 | Administrative Class | ||||||
| Beginning Account Value (12/1/12) | $1,000.00 | $1,000.00 | $1,000.00 | $1,000.00 | $1,000.00 | |||||
| Ending Account Value (5/31/13) | $1,023.19 | $1,021.44 | $1,024.68 | $1,024.93 | $1,023.44 | |||||
| Expenses Paid During Period | $1.77 | $3.53 | $0.25 | $— | $1.51 | |||||
For each class of the Fund, expenses (net of fee waiver and reimbursement, if any) are equal to the annualized expense ratio for the class (0.35% for Class A, 0.70% for Class R, 0.05% for Class P, 0.00% for Class R6 and 0.30% for Administrative Class), multiplied by the average account value over the period, multiplied by 182/365. The expense ratio excludes the expenses of the Underlying Funds, which based upon the allocation of the Fund’s assets among the Underlying Funds are indirectly borne by the shareholders of the Fund.
| 30 | May 31, 2013 | | Semiannual Report |
Table of Contents
(THIS PAGE INTENTIONALLY LEFT BLANK)
| Semiannual Report | | May 31, 2013 | 31 |
Table of Contents
Unaudited
AllianzGI Retirement 2050 Fund (formerly Allianz Global Investors Solutions 2050 Fund)
For the period of December 1, 2012 through May 31, 2013, as provided by the Allianz Global Investors US Multi Asset Group.
Portfolio Insights
For the reporting period ended May 31, 2013, Class A shares at NAV of the AllianzGI Retirement 2050 Fund (the “Fund”) returned 7.75% outperforming the Dow Jones Real Return 2050 Index (the “benchmark index”) which returned 7.53%.
What Happened
For the six months ended May 31, 2013, the dominant theme for global market returns has been central bank policy. Quantitative Easing (QE) has gone global and is the single most dominant force in global markets. Turning from QE to the fundamentals of economic growth and earnings, in the US, the economy continued to grow, albeit at a slower pace than initially expected, with first quarter GDP expanding at 2.4%. In Europe, the struggle for growth remains a persistent theme, which has forced the European Central Bank (ECB) to take more unconventional policy actions including, in early May, raising the prospect of introducing negative interest rates on deposits at the ECB. Further evidence of a slowdown in emerging markets, mainly the BRICs, continued to trickle in during the period.
During the past six months, there have been three major market-moving events. First, the most radical quantitative easing experiment to date was announced and then implemented in Japan following the election of Shinzo Abe to Prime Minister in December. A second new theme is the uncertainty surrounding the timing and size of the Federal Reserve’s (the “Fed”) beginning of the end of QE, the so-called “taper,” when the Fed reduces its monthly bond purchases from its current rate of $85 billion. Third, on the fiscal front in the US, the threat of a sequester and fear of a government shutdown ended with the sequester slowing government spending while tax revenues are up in a growing (even if slowly) economy, producing a rapidly improving fiscal position. The US federal deficit is now on track to decline from more than 10% of GDP to around 4% of GDP by the end of the fiscal year (based on Congressional Budget Office projections).
Quantitative easing around the world drove risk asset returns in the developed world. For the period, equities returned 47.7% in Japan, 16.5% in the US and 13.3% in Europe (all equity returns based on MSCI indexes, local currency). The link between central bank asset purchases and equity performance has strengthened significantly
since quantitative easing was first initiated: in the US, since November 2008, the correlation between the Fed’s balance sheet and the S&P 500 Index is over .90 (whereas in the five years leading up to the financial crisis, the correlation is less than 0.2).
The questions surrounding the taper—both when and how quickly the Fed will put the brakes on asset purchases—also resulted in higher volatility across asset markets for the period, while core fixed income generally sold off toward the end of the period and equities rallied. Within fixed income, high yield and convertibles stand out as exceptions returning 5.50% and 14.57% for the period, respectively. US Treasuries suffered as the 10-year yield increased from a low of 1.59% on December 6, 2012 to an intraday high of 2.23% on May 29, 2013—a pronounced move given that that the yield had remained well below 2 percent since April 2012.
When interpreting economic evidence through the prism of the taper, not only is good economic data good for equity returns but bad economic data has also been good news for developed market equities—when it signifies that the Fed will continue to provide liquidity to markets for longer. For most of the rest of the world in equity and commodity markets returns were flat to down. Emerging market equities returned 1.5%. The broad commodity futures were down 8.5% in the period with precious metals suffering the biggest decline, down 22.8% and gold futures down 18.9% (returns based on DJ UBS Commodity Index, Sub Precious Metals Index and Gold Index).
Portfolio Review
During the six month period ended May 31, 2013, the Fund held overweight positions in US small-cap equities, US and non-US fixed-income assets and short-term Treasury inflation protected securities (TIPS). The Fund held underweights in US large-cap
and non-US equities, including emerging markets and in real return assets, including real estate and commodities as well as in intermediate-term TIPS.
In the return generating part of portfolio, the equity holdings underperformed their benchmark. This was mostly due to underperformance in large cap equities as a result of both allocation and fund selection effects. The Fund was underweight US large cap equities in a period in which the Russell 1000 Index returned 16.68%. Selection effects in US small cap also detracted. Positive fund selection in international equities and emerging markets contributed to performance, helping to offset the negative effect from being underweight those sectors. Exposure to underlying funds implementing managed volatility strategies was a contributor to performance during the period as well.
In the defensive part of the portfolio, the Fund’s aggregate nominal bond positions outperformed the fixed income benchmark mainly due to fund selection and an overweight in agency and non-agency mortgage backed securities. The PIMCO Income Fund was up 6.58% in the period, with an excess return of 7.63% percentage points versus the Barclays US Aggregate Bond Index. A large allocation to the PIMCO Income Fund as well as the PIMCO Mortgage Opportunities Fund enabled the portfolios to gain exposure to the recovery in the housing market in the US and was part of the rationale for the underweight in equities.
The TIPS portion of the fixed income portfolio also contributed to performance due to asset allocation—a large underweight to intermediate term TIPS—and fund selection. Within the Fixed Income universe, TIPS overall underperformed Treasuries as the Barclays US Treasury US TIPS TR Index returned -4.57% versus the Barclays Aggregate Bond Treasury TR Index which was down 1.05%.
The Fund outperformed in commodities, due to a combination of being underweight the commodity benchmark, which was down 8.49% (based on the DJ UBS Commodity Total Return Index) for the period and positive fund selection.
In real estate, the Fund underperformed its benchmark. Fund selection and a tilt toward global REITs detracted from performance in this
| 32 | May 31, 2013 | | Semiannual Report |
Table of Contents
Unaudited
AllianzGI Retirement 2050 Fund (formerly Allianz Global Investors Solutions 2050 Fund) (cont’d)
sector. For the quarter, the S&P United States Property Index outperformed the S&P Europe Property Index by more than 4%.
Outlook
Economic theory tells us that 10-year treasury yields will, in time, match long-term nominal GDP, at around 4% given the Fed’s 2% target inflation. However, the paths to get there and the timing remain uncertain. One virtuous path entails global growth accelerating and economic data steadily improving. The other path is dominated by eroding pricing power and a lack of improvement in the labor market. Both paths will lead to higher interest rates. But the first would be associated with good returns in equities while the second would be associated with equity losses.
More broadly, we are either experiencing the great rotation into equity market outperformance and global growth or the early stages of another global slowdown. An expansion in global growth would be led by the US and emerging markets and would be associated with a recovery in Europe and an escape from deflation in Japan. In such a scenario, we would expect earnings to grow and valuations to continue to improve.
Chairman Bernanke, in particular, has stated that the risks to taking stimulus out of the economy too soon outweigh the risks of keeping quantitative easing in place too long. Thus, should the global economy slow, the Fed, along with other developed country central banks will likely err on the side of maintaining low to negative real rates.
If evidence mounts that suggests that the world is healing and growth is accelerating, we are prepared to systematically add to risk assets, targeting those with the most attractive valuations. We are positioned to be liquidity suppliers. The portfolios are overweight high-quality dividend-paying stocks, overweight US stocks and remain underweight euro-zone stocks. The portfolios are modestly underweight commodities and real estate, as well as underweight nominal duration. All of the portfolios are within their benchmark-determined risk budgets.
Average Annual Total Return for the period ended May 31, 2013
| 6 Month* | 1 Year | Since Inception† | ||||||||||||
| AllianzGI Retirement 2050 Fund Class A | 7.75% | 18.33% | 14.47% | |||||||||||
| AllianzGI Retirement 2050 Fund Class A (adjusted) | 1.82% | 11.82% | 13.01% | ||||||||||
| AllianzGI Retirement 2050 Fund Class C | 7.35% | 17.29% | 13.64% | |||||||||||
| AllianzGI Retirement 2050 Fund Class C (adjusted) | 6.35% | 16.29% | 13.64% | ||||||||||
| AllianzGI Retirement 2050 Fund Class D | 7.68% | 18.12% | 14.43% | ||||||||||
| AllianzGI Retirement 2050 Fund Class R | 7.56% | 17.93% | 14.18% | ||||||||||
| AllianzGI Retirement 2050 Fund Class P | 7.92% | 18.62% | 14.78% | ||||||||||
| AllianzGI Retirement 2050 Fund Class R6 | 7.97% | 18.73% | 14.89% | ||||||||||
| AllianzGI Retirement 2050 Fund Administrative Class | 7.83% | 18.30% | 14.56% | |||||||||||
| Dow Jones Real Return 2050 Index | 7.53% | 18.77% | 13.90% | ||||||||||
| Lipper Mixed-Asset Target 2050+ Funds Average | 11.33% | 22.60% | 14.44% | |||||||||||
† The Fund began operations on 12/29/08. Benchmark return comparisons began on the fund inception date. Lipper performance comparisons began on 12/31/08.
* Cumulative return.
Performance quoted represents past performance and is no guarantee of future results. Current performance may be lower or higher than performance shown. For performance current to the most recent month-end, visit our website at us.allianzgi.com. Investment return and the principal value will fluctuate. Shares may be worth more or less than original cost when redeemed. The adjusted returns take into account the maximum initial sales charge of 5.50% on Class A shares and the contingent deferred sales charge (CDSC) of 1% on Class C shares, which may apply to shares redeemed during the first year of ownership. Returns do not reflect deduction of taxes that a shareholder would pay on fund distributions or redemption of fund shares. See pages 94 and 95 for more information. The Fund’s gross expense ratios are 1.43% for Class A shares, 2.18% for Class C shares, 1.43% for Class D shares, 1.68% for Class R shares, 1.03% for Class P shares, 0.93% for Class R6 shares and 1.28% for Administrative Class shares. These ratios do not include an expense reduction, contractually guaranteed through at least 3/31/14. The Fund’s expense ratios net of this reduction are 1.10% for Class A shares, 1.85% for Class C shares, 1.20% for Class D shares, 1.45% for Class R shares, 0.80% for Class P shares, 0.70% for Class R6 shares and 1.05% for Administrative Class shares. Expense ratio information is as of the Fund’s current prospectus dated April 1, 2013, as supplemented to date.
The Dow Jones Real Return 2050 Index inception date was 12/31/2009. Accordingly, Dow Jones Real Return 40+ Index performance is used for periods prior to 12/31/2009.
| Semiannual Report | | May 31, 2013 | 33 |
Table of Contents
Unaudited
AllianzGI Retirement 2050 Fund (formerly Allianz Global Investors Solutions 2050 Fund) (cont’d)
Cumulative Returns Through May 31, 2013
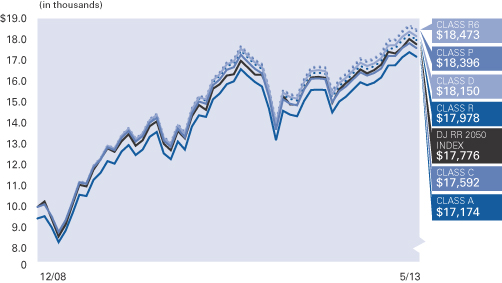
Fund Allocation (as of May 31, 2013)
| AllianzGI NFJ International Value | 7.0% | |||
| AllianzGI NFJ Dividend Value | 6.6% | |||
| AllianzGI Income & Growth | 6.0% | |||
| AllianzGI International Small-Cap | 6.0% | |||
| AllianzGI NFJ Global Dividend Value | 6.0% | |||
| AllianzGI U.S. Managed Volatility | 5.5% | |||
| AllianzGI Disciplined Equity | 5.0% | |||
| PIMCO Floating Income | 4.5% | |||
| Other | 52.4% | |||
| Cash & Equivalents — Net | 1.0% |
| Shareholder Expense Example | Actual Performance | |||||||||||||
| Class A | Class C | Class D | Class R | Class P | Class R6 | Administrative Class | ||||||||
| Beginning Account Value (12/1/12) | $1,000.00 | $1,000.00 | $1,000.00 | $1,000.00 | $1,000.00 | $1,000.00 | $1,000.00 | |||||||
| Ending Account Value (5/31/13) | $1,077.50 | $1,073.50 | $1,076.80 | $1,075.60 | $1,079.20 | $1,079.70 | $1,078.30 | |||||||
| Expenses Paid During Period | $1.45 | $5.32 | $1.97 | $3.26 | $— | $— | $1.19 | |||||||
| Hypothetical Performance | ||||||||||||||
| (5% return before expenses) | ||||||||||||||
| Class A | Class C | Class D | Class R | Class P | Class R6 | Administrative Class | ||||||||
| Beginning Account Value (12/1/12) | $1,000.00 | $1,000.00 | $1,000.00 | $1,000.00 | $1,000.00 | $1,000.00 | $1,000.00 | |||||||
| Ending Account Value (5/31/13) | $1,023.54 | $1,019.80 | $1,023.04 | $1,021.79 | $1,024.93 | $1,024.93 | $1,023.78 | |||||||
| Expenses Paid During Period | $1.41 | $5.19 | $1.92 | $3.18 | $— | $— | $1.16 | |||||||
For each class of the Fund, expenses (net of fee waiver and reimbursement, if any) are equal to the annualized expense ratio for the class (0.28% for Class A, 1.03% for Class C, 0.38% for Class D, 0.63% for Class R, 0.00% for Class P, 0.00% for Class R6 and 0.23% for Administrative Class), multiplied by the average account value over the period, multiplied by 182/365. The expense ratio excludes the expenses of the Underlying Funds, which based upon the allocation of the Fund’s assets among the Underlying Funds are indirectly borne by the shareholders of the Fund.
| 34 | May 31, 2013 | | Semiannual Report |
Table of Contents
(THIS PAGE INTENTIONALLY LEFT BLANK)
| Semiannual Report | | May 31, 2013 | 35 |
Table of Contents
Unaudited
AllianzGI Retirement 2055 Fund (formerly Allianz Global Investors Solutions 2055 Fund)
For the period of December 1, 2012 through May 31, 2013, as provided by the Allianz Global Investors US Multi Asset Group.
Portfolio Insights
For the reporting period ended May 31, 2013, Class A shares at NAV of the AllianzGI Retirement 2055 Fund (the “Fund”) returned 7.79% underperforming the Dow Jones Real Return 40+ Index (the “benchmark index”) which returned 7.82%.
What Happened
For the six months ended May 31, 2013, the dominant theme for global market returns has been central bank policy. Quantitative Easing (QE) has gone global and is the single most dominant force in global markets. Turning from QE to the fundamentals of economic growth and earnings, in the US, the economy continued to grow, albeit at a slower pace than initially expected, with first quarter GDP expanding at 2.4%. In Europe, the struggle for growth remains a persistent theme, which has forced the European Central Bank (ECB) to take more unconventional policy actions including, in early May, raising the prospect of introducing negative interest rates on deposits at the ECB. Further evidence of a slowdown in emerging markets, mainly the BRICs, continued to trickle in during the period.
During the past six months, there have been three major market-moving events. First, the most radical quantitative easing experiment to date was announced and then implemented in Japan following the election of Shinzo Abe to Prime Minister in December. A second new theme is the uncertainty surrounding the timing and size of the Federal Reserve’s (the “Fed’s”) beginning of the end of QE, the so-called “taper,” when the Fed reduces its monthly bond purchases from its current rate of $85 billion. Third, on the fiscal front in the US, the threat of a sequester and fear of a government shutdown ended with the sequester slowing government spending while tax revenues are up in a growing (even if slowly) economy, producing a rapidly improving fiscal position. The US federal deficit is now on track to decline from more than 10% of GDP to around 4% of GDP by the end of the fiscal year (based on Congressional Budget Office projections).
Quantitative easing around the world drove risk asset returns in the developed world. For the period, equities returned 47.7% in Japan, 16.5% in the US and 13.3% in Europe (all equity returns based on MSCI indexes, local currency). The link between central bank asset purchases and equity performance has strengthened significantly
since quantitative easing was first initiated: in the US, since November 2008, the correlation between the Fed’s balance sheet and the S&P 500 Index is over .90 (whereas in the five years leading up to the financial crisis, the correlation is less than 0.2).
The questions surrounding the taper—both when and how quickly the Fed will put the brakes on asset purchases—also resulted in higher volatility across asset markets for the period, while core fixed income generally sold off toward the end of the period and equities rallied. Within fixed income, high yield and convertibles stand out as exceptions returning 5.50% and 14.57% for the period, respectively. US Treasuries suffered as the 10-year yield increased from a low of 1.59% on December 6, 2012 to an intraday high of 2.23% on May 29, 2013—a pronounced move given that that the yield had remained well below 2 percent since April 2012.
When interpreting economic evidence through the prism of the taper, not only is good economic data good for equity returns but bad economic data has also been good news for developed market equities—when it signifies that the Fed will continue to provide liquidity to markets for longer. For most of the rest of the world in equity and commodity markets returns were flat to down. Emerging market equities returned 1.5%. The broad commodity futures were down 8.5% in the period with precious metals suffering the biggest decline, down 22.8% and gold futures down 18.9% (returns based on DJ UBS Commodity Index, Sub Precious Metals Index and Gold Index).
Portfolio Review
During the six month period, and relative to its benchmark index, the Fund held overweight positions in US and non-US small-cap equities and US and non-US fixed-income assets. The Fund held underweights in US and non-US large- cap, emerging markets equities and in real
return assets, including real estate and commodities as well as in intermediate-term Treasury inflation protected securities (TIPS).
In the return generating part of portfolio, the equity holdings underperformed their benchmark. This was mostly due to underperformance in large cap equities as a result of both allocation and fund selection effects. The Fund was underweight US large cap in a period in which the Russell 1000 Index returned 16.68%. Selection effects in US small cap also detracted. Positive fund selection in international equities and emerging markets contributed to performance, helping to offset the negative effect from being underweight those sectors. Exposure to underlying funds implementing managed volatility strategies was a contributor to performance during the period as well.
In the defensive part of the portfolio, the Fund’s aggregate nominal bond positions outperformed the fixed income benchmark mainly due to fund selection and an overweight in agency and non-agency mortgage backed securities. The PIMCO Income Fund was up 6.58% in the period, with an excess return of 7.63% percentage points versus the Barclays US Aggregate Bond Index. A large allocation to the PIMCO Income Fund as well as the PIMCO Mortgage Opportunities Fund enabled the portfolios to gain exposure to the recovery in the housing market in the US and was part of the rationale for the underweight in equities.
The TIPS portion of the fixed income portfolio also contributed to performance due to asset allocation—a large underweight to intermediate term TIPS—and fund selection. Within the Fixed Income universe, TIPS overall underperformed Treasuries as the Barclays US Treasury US TIPS TR Index returned -4.57% versus the Barclays Aggregate Bond Treasury TR Index which was down 1.05%.
The Fund outperformed in commodities, due to a combination of being underweight the commodity benchmark, which was down 8.49% (based on the DJ UBS Commodity Total Return Index) for the period and positive fund selection.
In real estate, the Fund underperformed its benchmark. Fund selection and a tilt toward global REITs detracted from performance in this
| 36 | May 31, 2013 | | Semiannual Report |
Table of Contents
Unaudited
AllianzGI Retirement 2055 Fund (formerly Allianz Global Investors Solutions 2055 Fund) (cont’d)
sector. For the quarter, the S&P United States Property Index outperformed the S&P Europe Property Index by more than 4%.
Outlook
Economic theory tells us that 10-year treasury yields will, in time, match long-term nominal GDP, at around 4% given the Fed’s 2% target inflation. However, the paths to get there and the timing remain uncertain. One virtuous path entails global growth accelerating and economic data steadily improving. The other path is dominated by eroding pricing power and a lack of improvement in the labor market. Both paths will lead to higher interest rates. But the first would be associated with good returns in equities while the second would be associated with equity losses.
More broadly, we are either experiencing the great rotation into equity market outperformance and global growth or the early stages of another global slowdown. An expansion in global growth would be led by the US and emerging markets and would be associated with a recovery in Europe and an escape from deflation in Japan. In such a scenario, we would expect earnings to grow and valuations to continue to improve.
Chairman Bernanke, in particular, has stated that the risks to taking stimulus out of the economy too soon outweigh the risks of keeping quantitative easing in place too long. Thus, should the global economy slow, the Fed, along with other developed country central banks will likely err on the side of maintaining low to negative real rates.
If evidence mounts that suggests that the world is healing and growth is accelerating, we are prepared to systematically add to risk assets, targeting those with the most attractive valuations. We are positioned to be liquidity suppliers. The portfolios are overweight high-quality dividend-paying stocks, overweight US stocks and remain underweight euro-zone stocks. The portfolios are modestly underweight commodities and real estate, as well as underweight nominal duration. All of the portfolios are within their benchmark-determined risk budgets.
Average Annual Total Return for the period ended May 31, 2013
| 6 Month* | 1 Year | Since Inception† | ||||||||||||
| AllianzGI Retirement 2055 Fund Class A | 7.79% | 18.37% | 16.05% | |||||||||||
| AllianzGI Retirement 2055 Fund Class A (adjusted) | 1.87% | 11.86% | 11.60% | ||||||||||
| AllianzGI Retirement 2055 Fund Class R | 7.60% | 18.04% | 15.66% | ||||||||||
| AllianzGI Retirement 2055 Fund Class P | 7.91% | 18.76% | 16.43% | ||||||||||
| AllianzGI Retirement 2055 Fund Class R6 | 8.03% | 18.89% | 16.52% | ||||||||||
| AllianzGI Retirement 2055 Fund Administrative Class | 7.76% | 18.39% | 16.07% | |||||||||||
| Dow Jones Real Return 40+ Index | 7.82% | 19.23% | 16.09% | ||||||||||
| Lipper Mixed-Asset Target 2050+ Funds Average | 11.33% | 22.60% | 17.61% | |||||||||||
† The Fund began operations on 12/19/11. Benchmark return comparisons began on the fund inception date. Lipper performance comparisons began on 12/31/11.
* Cumulative return.
Performance quoted represents past performance and is no guarantee of future results. Current performance may be lower or higher than performance shown. For performance current to the most recent month-end, visit our website at us.allianzgi.com. Investment return and the principal value will fluctuate. Shares may be worth more or less than original cost when redeemed. The adjusted returns take into account the maximum initial sales charge of 5.50% on Class A shares. Returns do not reflect deduction of taxes that a shareholder would pay on fund distributions or redemption of fund shares. See pages 94 and 95 for more information. The Fund’s gross expense ratios are 1.43% for Class A shares, 1.68% for Class R shares, 1.03% for Class P shares, 0.93% for Class R6 shares and 1.28% for Administrative Class shares. These ratios do not include an expense reduction, contractually guaranteed through at least 3/31/14. The Fund’s expense ratios net of this reduction are 1.10% for Class A shares, 1.45% for Class R shares, 0.80% for Class P shares, 0.70% for Class R6 shares and 1.05% for Administrative Class shares. Expense ratio information is as of the Fund’s current prospectus dated April 1, 2013, as supplemented to date.
| Semiannual Report | | May 31, 2013 | 37 |
Table of Contents
Unaudited
AllianzGI Retirement 2055 Fund (formerly Allianz Global Investors Solutions 2055 Fund) (cont’d)
Cumulative Return Through May 31, 2013
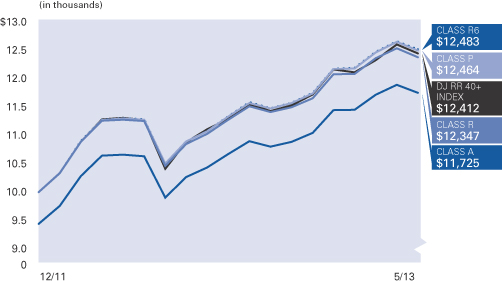
Fund Allocation (as of May 31, 2013)
AllianzGI NFJ International Value | 7.0% | |||
AllianzGI NFJ Dividend Value | 6.6% | |||
AllianzGI Income & Growth | 6.0% | |||
AllianzGI International Small-Cap | 6.0% | |||
AllianzGI NFJ Global Dividend Value | 6.0% | |||
AllianzGI NFJ Mid-Cap Value | 5.6% | |||
AllianzGI U.S. Managed Volatility | 5.5% | |||
AllianzGI Disciplined Equity | 5.0% | |||
Other | 51.5% | |||
Cash & Equivalents — Net | 0.8% |
| Shareholder Expense Example | Actual Performance | |||||||||
| Class A | Class R | Class P | Class R6 | Administrative Class | ||||||
Beginning Account Value (12/1/12) | $1,000.00 | $1,000.00 | $1,000.00 | $1,000.00 | $1,000.00 | |||||
Ending Account Value (5/31/13) | $1,077.90 | $1,076.00 | $1,079.10 | $1,080.30 | $1,077.60 | |||||
Expenses Paid During Period | $1.50 | $3.31 | $— | $— | $1.24 | |||||
| Hypothetical Performance | ||||||||||
| (5% return before expenses) | ||||||||||
Class A | Class R | Class P | Class R6 | Administrative | ||||||
Beginning Account Value (12/1/12) | $1,000.00 | $1,000.00 | $1,000.00 | $1,000.00 | $1,000.00 | |||||
Ending Account Value (5/31/13) | $1,023.49 | $1,021.74 | $1,024.93 | $1,024.93 | $1,023.73 | |||||
Expenses Paid During Period | $1.46 | $3.23 | $— | $— | $1.21 | |||||
For each class of the Fund, expenses (net of fee waiver and reimbursement, if any) are equal to the annualized expense ratio for the class (0.29% for Class A, 0.64% for Class R, 0.00% for Class P, 0.00% for Class R6 and 0.24% for Administrative Class), multiplied by the average account value over the period, multiplied by 182/365. The expense ratio excludes the expenses of the Underlying Funds, which based upon the allocation of the Fund’s assets among the Underlying Funds are indirectly borne by the shareholders of the Fund.
| 38 | May 31, 2013 | | Semiannual Report |
Table of Contents
(THIS PAGE INTENTIONALLY LEFT BLANK)
| Semiannual Report | | May 31, 2013 | 39 |
Table of Contents
Unaudited
AllianzGI Retirement Income Fund (formerly Allianz Global Investors Solutions Retirement Income Fund)
For the period of December 1, 2012 through May 31, 2013, as provided by the Allianz Global Investors US Multi Asset Group.
Portfolio Insights
For the reporting period ended May 31, 2013, Class A shares at NAV of the AllianzGI Retirement Income Fund (the “Fund”) returned 1.74% outperforming the Dow Jones Real Return Today Index (the “benchmark index”) which returned -0.48%.
What Happened
For the six months ended May 31, 2013, the dominant theme for global market returns has been central bank policy. Quantitative Easing (QE) has gone global and is the single most dominant force in global markets. Turning from QE to the fundamentals of economic growth and earnings, in the US, the economy continued to grow, albeit at a slower pace than initially expected, with first quarter GDP expanding at 2.4%. In Europe, the struggle for growth remains a persistent theme, which has forced the European Central Bank (ECB) to take more unconventional policy actions including, in early May, raising the prospect of introducing negative interest rates on deposits at the ECB. Further evidence of a slowdown in emerging markets, mainly the BRICs, continued to trickle in during the period.
During the past six months, there have been three major market-moving events. First, the most radical quantitative easing experiment to date was announced and then implemented in Japan following the election of Shinzo Abe to Prime Minister in December. A second new theme is the uncertainty surrounding the timing and size of the Federal Reserve’s (the “Fed’s”) beginning of the end of QE, the so-called “taper,” when the Fed reduces its monthly bond purchases from its current rate of $85 billion. Third, on the fiscal front in the US, the threat of a sequester and fear of a government shutdown ended with the sequester slowing government spending while tax revenues are up in a growing (even if slowly) economy, producing a rapidly improving fiscal position. The US federal deficit is now on track to decline from more than 10% of GDP to around 4% of GDP by the end of the fiscal year (based on Congressional Budget Office projections).
Quantitative easing around the world drove risk asset returns in the developed world. For the period, equities returned 47.7% in Japan, 16.5% in the US and 13.3% in Europe (all equity returns based on MSCI indexes, local currency). The link between central bank asset purchases and equity performance has strengthened significantly
since quantitative easing was first initiated: in the US, since November 2008, the correlation between the Fed’s balance sheet and the S&P 500 Index is over .90 (whereas in the five years leading up to the financial crisis, the correlation is less than 0.2).
The questions surrounding the taper—both when and how quickly the Fed will put the brakes on asset purchases—also resulted in higher volatility across asset markets for the period, while core fixed income generally sold off toward the end of the period and equities rallied. Within fixed income, high yield and convertibles stand out as exceptions returning 5.50% and 14.57% for the period, respectively. US Treasuries suffered as the 10-year yield increased from a low of 1.59% on December 6, 2012 to an intraday high of 2.23% on May 29, 2013—a pronounced move given that that the yield had remained well below 2 percent since April 2012.
When interpreting economic evidence through the prism of the taper, not only is good economic data good for equity returns but bad economic data has also been good news for developed market equities—when it signifies that the Fed will continue to provide liquidity to markets for longer. For most of the rest of the world in equity and commodity markets returns were flat to down. Emerging market equities returned 1.5%. The broad commodity futures were down 8.5% in the period with precious metals suffering the biggest decline, down 22.8% and gold futures down 18.9% (returns based on DJ UBS Commodity Index, Sub Precious Metals Index and Gold Index).
Portfolio Review
During the six month period, and relative to its benchmark index, the Fund held overweight positions in US small-cap equities, US and non-US fixed-income assets and short-term Treasury inflation protected securities (TIPS). The Fund held underweights in US large- cap and non-US
equities, including emerging markets and in real return assets, including real estate and commodities as well as in intermediate-term TIPS.
In the return generating part of portfolio, the equity holdings underperformed their benchmark. This was mostly due to underperformance in large cap equities as a result of both allocation and fund selection effects. The Fund was underweight US large cap in a period in which the Russell 1000 Index returned 16.68%. Selection effects in US small cap also detracted. Positive fund selection in international equities and emerging markets contributed to performance, helping to offset the negative effect from being underweight those sectors. Exposure to underlying funds implementing managed volatility strategies was a contributor to performance during the period as well.
In the defensive part of the portfolio, the Fund’s aggregate nominal bond positions outperformed the fixed income benchmark mainly due to fund selection and an overweight in agency and non-agency mortgage backed securities. The PIMCO Income Fund was up 6.58% in the period, with an excess return of 7.63% percentage points versus the Barclays US Aggregate Bond Index. A large allocation to the PIMCO Income Fund as well as the PIMCO Mortgage Opportunities Fund enabled the portfolios to gain exposure to the recovery in the housing market in the US and was part of the rationale for the underweight in equities.
The TIPS portion of the fixed income portfolio also contributed to performance due to asset allocation—a large underweight to intermediate term TIPS—and fund selection. Within the Fixed Income universe, TIPS overall underperformed Treasuries as the Barclays US Treasury US TIPS TR Index returned -4.57% versus the Barclays Aggregate Bond Treasury TR Index which was down 1.05%.
The Fund outperformed in commodities, due to a combination of being underweight the commodity benchmark, which was down 8.49% (based on the DJ UBS Commodity Total Return Index) for the period and positive fund selection.
In real estate, the Fund underperformed its benchmark. Fund selection and a tilt toward global REITs detracted from performance in this sector. For the quarter, the S&P United States
| 40 | May 31, 2013 | | Semiannual Report |
Table of Contents
Unaudited
AllianzGI Retirement Income Fund (formerly Allianz Global Investors Solutions Retirement Income Fund) (cont’d)
Property Index outperformed the S&P Europe Property Index by more than 4%.
Outlook
Economic theory tells us that 10-year treasury yields will, in time, match long-term nominal GDP, at around 4% given the Fed’s 2% target inflation. However, the paths to get there and the timing remain uncertain. One virtuous path entails global growth accelerating and economic data steadily improving. The other path is dominated by eroding pricing power and a lack of improvement in the labor market. Both paths will lead to higher interest rates. But the first would be associated with good returns in equities while the second would be associated with equity losses.
More broadly, we are either experiencing the great rotation into equity market outperformance and global growth or the early stages of another global slowdown. An expansion in global growth would be led by the US and emerging markets and would be associated with a recovery in Europe and an escape from deflation in Japan. In such a scenario, we would expect earnings to grow and valuations to continue to improve.
Chairman Bernanke, in particular, has stated that the risks to taking stimulus out of the economy too soon outweigh the risks of keeping quantitative easing in place too long. Thus, should the global economy slow, the Fed, along with other developed country central banks will
likely err on the side of maintaining low to negative real rates.
If evidence mounts that suggests that the world is healing and growth is accelerating, we are prepared to systematically add to risk assets, targeting those with the most attractive valuations. We are positioned to be liquidity suppliers. The portfolios are overweight high-quality dividend-paying stocks, overweight US stocks and remain underweight euro-zone stocks. The portfolios are modestly underweight commodities and real estate, as well as underweight nominal duration. All of the portfolios are within their benchmark-determined risk budgets.
Average Annual Total Return for the period ended May 31, 2013
| 6 Month* | 1 Year | Since Inception† | ||||||||||||
AllianzGI Retirement Income Fund Class A | 1.74% | 7.68% | 10.14% | |||||||||||
| AllianzGI Retirement Income Fund Class A (adjusted) | –3.86% | 1.75% | 8.74% | ||||||||||
AllianzGI Retirement Income Fund Class C | 1.39% | 6.86% | 9.34% | |||||||||||
| AllianzGI Retirement Income Fund Class C (adjusted) | 0.40% | 5.86% | 9.34% | ||||||||||
| AllianzGI Retirement Income Fund Class D | 1.74% | 7.62% | 10.11% | ||||||||||
| AllianzGI Retirement Income Fund Class R | 1.57% | 7.32% | 9.84% | ||||||||||
| AllianzGI Retirement Income Fund Class P | 1.88% | 8.05% | 10.43% | ||||||||||
| AllianzGI Retirement Income Fund Class R6 | 1.97% | 8.10% | 10.53% | ||||||||||
AllianzGI Retirement Income Fund Administrative Class | 1.82% | 7.74% | 10.21% | |||||||||||
| Dow Jones Real Return Today Index | –0.48% | 4.87% | 9.38% | ||||||||||
Lipper Mixed-Asset Target Today Funds Average | 2.62% | 7.84% | 9.08% | |||||||||||
† The Fund began operations on 12/29/08. Benchmark return comparisons began on the fund inception date. Lipper performance comparisons began on 12/31/08.
* Cumulative return.
Performance quoted represents past performance and is no guarantee of future results. Current performance may be lower or higher than performance shown. For performance current to the most recent month-end, visit our website at us.allianzgi.com. Investment return and the principal value will fluctuate. Shares may be worth more or less than original cost when redeemed. The adjusted returns take into account the maximum initial sales charge of 5.50% on Class A shares and the contingent deferred sales charge (CDSC) of 1% on Class C shares, which may apply to shares redeemed during the first year of ownership. Returns do not reflect deduction of taxes that a shareholder would pay on fund distributions or redemption of fund shares. See pages 94 and 95 for more information. The Fund’s gross expense ratios are 1.15% for Class A shares, 1.90% for Class C shares, 1.15% for Class D shares, 1.40% for Class R shares, 0.75% for Class P shares, 0.65% for Class R6 shares and 1.00% for Administrative Class shares. These ratios do not include an expense reduction, contractually guaranteed through at least 3/31/14. The Fund’s expense ratios net of this reduction are 0.95% for Class A shares, 1.70% for Class C shares, 1.05% for Class D shares, 1.30% for Class R shares, 0.65% for Class P shares, 0.55% for Class R6 shares and 0.90% for Administrative Class shares. Expense ratio information is as of the Fund’s current prospectus dated April 1, 2013, as supplemented to date.
| Semiannual Report | | May 31, 2013 | 41 |
Table of Contents
Unaudited
AllianzGI Retirement Income Fund (formerly Allianz Global Investors Solutions Retirement Income Fund) (cont’d)
Cumulative Returns Through May 31, 2013
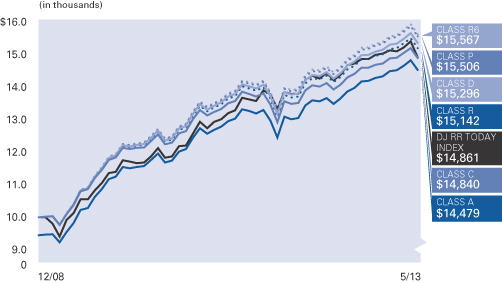
Fund Allocation (as of May 31, 2013)
| PIMCO Real Return | 29.9% | |||
| PIMCO Income | 10.1% | |||
| PIMCO Foreign Bond (U.S. Dollar-Hedged) | 7.6% | |||
| PIMCO Mortgage Opportunities | 7.1% | |||
| PIMCO Short-Term | 7.1% | |||
| AllianzGI Income & Growth | 4.0% | |||
| Wells Fargo Advantage Short-Term High Yield Bond | 3.5% | |||
| AllianzGI NFJ Dividend Value | 3.5% | |||
| Other | 26.7% | |||
| Cash & Equivalents — Net | 0.5% |
| Shareholder Expense Example | Actual Performance | |||||||||||||
| Class A | Class C | Class D | Class R | Class P | Class R6 | Administrative Class | ||||||||
| Beginning Account Value (12/1/12) | $1,000.00 | $1,000.00 | $1,000.00 | $1,000.00 | $1,000.00 | $1,000.00 | $1,000.00 | |||||||
| Ending Account Value (5/31/13) | $1,017.40 | $1,013.90 | $1,017.40 | $1,015.70 | $1,018.80 | $1,019.70 | $1,018.20 | |||||||
| Expenses Paid During Period | $1.96 | $5.72 | $2.46 | $3.72 | $0.45 | $— | $1.71 | |||||||
| Hypothetical Performance | ||||||||||||||
| (5% return before expenses) | ||||||||||||||
| Class A | Class C | Class D | Class R | Class P | Class R6 | Administrative Class | ||||||||
| Beginning Account Value (12/1/12) | $1,000.00 | $1,000.00 | $1,000.00 | $1,000.00 | $1,000.00 | $1,000.00 | $1,000.00 | |||||||
| Ending Account Value (5/31/13) | $1,022.99 | $1,019.25 | $1,022.49 | $1,021.24 | $1,024.48 | $1,024.93 | $1,023.24 | |||||||
| Expenses Paid During Period | $1.97 | $5.74 | $2.47 | $3.73 | $0.45 | $— | $1.72 | |||||||
For each class of the Fund, expenses (net of fee waiver and reimbursement, if any) are equal to the annualized expense ratio for the class (0.39% for Class A, 1.14% for Class C, 0.49% for Class D, 0.74% for Class R, 0.09% for Class P, 0.00% for Class R6 and 0.34% for Administrative Class), multiplied by the average account value over the period, multiplied by 182/365. The expense ratio excludes the expenses of the Underlying Funds, which based upon the allocation of the Fund’s assets among the Underlying Funds are indirectly borne by the shareholders of the Fund.
| 42 | May 31, 2013 | | Semiannual Report |
Table of Contents
(THIS PAGE INTENTIONALLY LEFT BLANK)
| Semiannual Report | | May 31, 2013 | 43 |
Table of Contents
Unaudited
AllianzGI Global Allocation Fund (formerly Allianz Global Investors Solutions Global Allocation Fund)
For the period of December 1, 2012 through May 31, 2013, as provided by the Allianz Global Investors US Multi Asset Group.
Portfolio Insights
For the reporting period ended May 31, 2013, Class A shares at NAV of the AllianzGI Global Allocation Fund (the “Fund”) returned 6.33% underperforming the 60% MSCI All Country World/ 40% Barclays US Aggregate Index (the “benchmark index”) which returned 6.48%.
What Happened
For the six months ended May 31, 2013, the dominant theme for global market returns has been central bank policy. Quantitative Easing (QE) has gone global and is the single most dominant force in global markets. Turning from QE to the fundamentals of economic growth and earnings, in the US, the economy continued to grow, albeit at a slower pace than initially expected, with first quarter GDP expanding at 2.4%. In Europe, the struggle for growth remains a persistent theme, which has forced the European Central Bank (ECB) to take more unconventional policy actions including, in early May, raising the prospect of introducing negative interest rates on deposits at the ECB. Further evidence of a slowdown in emerging markets, mainly the BRICs, continued to trickle in during the period.
During the past six months, there have been three major market-moving events. First, the most radical quantitative easing experiment to date was announced and then implemented in Japan following the election of Shinzo Abe to Prime Minister in December. A second new theme is the uncertainty surrounding the timing and size of the Federal Reserve’s (the “Fed’s”) beginning of the end of QE, the so-called “taper,” when the Fed reduces its monthly bond purchases from its current rate of $85 billion. Third, on the fiscal front in the US, the threat of a sequester and fear of a government shutdown ended with the sequester slowing government spending while tax revenues are up in a growing (even if slowly) economy, producing a rapidly improving fiscal position. The US federal deficit is now on track to decline from more than 10% of GDP to around 4% of GDP by the end of the fiscal year (based on Congressional Budget Office projections).
Quantitative easing around the world drove risk asset returns in the developed world. For the period, equities returned 47.7% in Japan, 16.5% in the US and 13.3% in Europe (all equity returns based on MSCI indexes, local currency). The link between central bank asset purchases and equity performance has strengthened significantly
since quantitative easing was first initiated: in the US, since November 2008, the correlation between the Fed’s balance sheet and the S&P 500 Index is over .90 (whereas in the five years leading up to the financial crisis, the correlation is less than 0.2).
The questions surrounding the taper—both when and how quickly the Fed will put the brakes on asset purchases—also resulted in higher volatility across asset markets for the period, while core fixed income generally sold off toward the end of the period and equities rallied. Within fixed income, high yield and convertibles stand out as exceptions returning 5.50% and 14.57% for the period, respectively. US Treasuries suffered as the 10-year yield increased from a low of 1.59% on December 6, 2012 to an intraday high of 2.23% on May 29, 2013—a pronounced move given that that the yield had remained well below 2 percent since April 2012.
When interpreting economic evidence through the prism of the taper, not only is good economic data good for equity returns but bad economic data has also been good news for developed market equities—when it signifies that the Fed will continue to provide liquidity to markets for longer. For most of the rest of the world in equity and commodity markets returns were flat to down. Emerging market equities returned 1.5%. The broad commodity futures were down 8.5% in the period with precious metals suffering the biggest decline, down 22.8% and gold futures down 18.9% (returns based on DJ UBS Commodity Index, Sub Precious Metals Index and Gold Index).
Portfolio Review
During the six month period, and relative to its benchmark index, the Fund held a small overweight position in US and non-US small-cap equities and US and non-US fixed-income assets. Treasury inflation protected securities (TIPS). The fund had off benchmark exposure in US and
non-US Small Cap, Treasury inflation protected securities (TIPS) and in real return assets, including real estate and commodities. The Fund held underweights in US and non-US large- cap and emerging markets equities.
In the return generating part of portfolio, the equity holdings underperformed their benchmark. This was mostly due to underperformance in large cap equities as a result of both allocation and fund selection effects. The Fund was underweight US large cap in a period in which the Russell 1000 Index returned 16.68%. Selection effects in US small cap also detracted. Positive fund selection in international equities and emerging markets contributed to performance, helping to offset the negative effect from being underweight those sectors. Exposure to underlying funds implementing managed volatility strategies was a contributor to performance during the period as well.
In the defensive part of the portfolio, the Fund’s aggregate nominal bond positions outperformed the fixed income benchmark mainly due to fund selection and an overweight in agency and non-agency mortgage backed securities. The PIMCO Income Fund was up 6.58% in the period, with an excess return of 7.63% percentage points versus the Barclays US Aggregate Bond Index. A large allocation to the PIMCO Income Fund as well as the PIMCO Mortgage Opportunities Fund enabled the portfolios to gain exposure to the recovery in the housing market in the US and was part of the rationale for the underweight in equities.
The TIPS portion of the fixed income portfolio also contributed to performance due to asset allocation—a large underweight to intermediate term TIPS—and fund selection. Within the Fixed Income universe, TIPS overall underperformed Treasuries as the Barclays US Treasury US TIPS TR Index returned -4.57% versus the Barclays Aggregate Bond Treasury TR Index which was down 1.05%.
The Fund outperformed in commodities, due to a combination of being underweight the commodity benchmark, which was down 8.49% (based on the DJ UBS Commodity Total Return Index) for the period and positive fund selection.
In real estate, the Fund underperformed its benchmark. Fund selection and a tilt toward
| 44 | May 31, 2013 | | Semiannual Report |
Table of Contents
Unaudited
AllianzGI Global Allocation Fund (formerly Allianz Global Investors Solutions Global Allocation Fund) (cont’d)
global REITs detracted from performance in this sector. For the quarter, the S&P United States Property
Index outperformed the S&P Europe Property Index by more than 4%.
Outlook
Economic theory tells us that 10-year treasury yields will, in time, match long-term nominal GDP, at around 4% given the Fed’s 2% target inflation. However, the paths to get there and the timing remain uncertain. One virtuous path entails global growth accelerating and economic data steadily improving. The other path is dominated by eroding pricing power and a lack of improvement in the labor market. Both paths will lead to higher interest rates. But the first would be associated with good returns in
equities while the second would be associated with equity losses.
More broadly, we are either experiencing the great rotation into equity market outperformance and global growth or the early stages of another global slowdown. An expansion in global growth would be led by the US and emerging markets and would be associated with a recovery in Europe and an escape from deflation in Japan. In such a scenario, we would expect earnings to grow and valuations to continue to improve.
Chairman Bernanke, in particular, has stated that the risks to taking stimulus out of the economy too soon outweigh the risks of keeping quantitative easing in place too long. Thus,
should the global economy slow, the Fed, along with other developed country central banks will likely err on the side of maintaining low to negative real rates.
If evidence mounts that suggests that the world is healing and growth is accelerating, we are prepared to systematically add to risk assets, targeting those with the most attractive valuations. We are positioned to be liquidity suppliers. The portfolios are overweight high-quality dividend-paying stocks, overweight US stocks and remain underweight euro-zone stocks. The portfolios are modestly underweight commodities and real estate, as well as underweight nominal duration. All of the portfolios are within their benchmark-determined risk budgets.
Average Annual Total Return for the period ended May 31, 2013
| 6 Month* | 1 Year | 5 Year | 10 Year | Since Inception† | ||||||||||||||||||
| AllianzGI Global Allocation Fund Class A | 6.33% | 15.44% | 4.45% | 6.90% | 5.99% | |||||||||||||||||
| AllianzGI Global Allocation Fund Class A (adjusted) | 0.48% | 9.09% | 3.27% | 6.30% | 5.58% | ||||||||||||||||
| AllianzGI Global Allocation Fund Class B | 5.87% | 14.59% | 3.69% | 6.35% | 5.61% | |||||||||||||||||
| AllianzGI Global Allocation Fund Class B (adjusted) | 0.87% | 9.59% | 3.34% | 6.35% | 5.61% | ||||||||||||||||
| AllianzGI Global Allocation Fund Class C | 5.86% | 14.60% | 3.67% | 6.10% | 5.20% | |||||||||||||||||
| AllianzGI Global Allocation Fund Class C (adjusted) | 4.86% | 13.60% | 3.67% | 6.10% | 5.20% | ||||||||||||||||
| AllianzGI Global Allocation Fund Class D | 6.25% | 15.43% | 4.44% | 6.91% | 5.99% | ||||||||||||||||
| AllianzGI Global Allocation Fund Class R | 6.15% | 15.27% | 4.20% | 6.66% | 5.73% | ||||||||||||||||
| AllianzGI Global Allocation Fund Class P | 6.33% | 15.64% | 4.65% | 7.13% | 6.20% | ||||||||||||||||
| AllianzGI Global Allocation Fund Institutional Class | 6.35% | 15.81% | 4.80% | 7.33% | 6.47% | ||||||||||||||||
| AllianzGI Global Allocation Fund Administrative Class | 6.29% | 15.53% | 4.50% | 6.97% | 6.05% | |||||||||||||||||
| MSCI All Country World Index | 11.72% | 26.01% | 1.16% | 8.11% | 5.24% | ||||||||||||||||
| 60% MSCI AC World Index, 40% Barclays U.S. Aggregate Index | 6.48% | 15.41% | 3.43% | 7.08% | 5.72% | ||||||||||||||||
| Barclays U.S. Aggregate Index | –1.05% | 0.91% | 5.50% | 4.66% | 5.46% | ||||||||||||||||
| Lipper Mixed-Asset Target Allocation Moderate Funds Average | 7.75% | 15.68% | 4.26% | 6.17% | 5.31% | |||||||||||||||||
† The Fund began operations on 9/30/98. Benchmark return comparisons began on the fund inception date. Lipper performance comparisons began on 9/30/98.
* Cumulative return.
Performance quoted represents past performance and is no guarantee of future results. Current performance may be lower or higher than performance shown. For performance current to the most recent month-end, visit our website at us.allianzgi.com. Investment return and the principal value will fluctuate. Shares may be worth more or less than original cost when redeemed. The adjusted returns take into account the maximum sales charge of 5.50% on Class A shares, 5% contingent deferred sales charge (CDSC) on Class B shares and 1% CDSC on Class C shares. Returns do not reflect deduction of taxes that a shareholder would pay on fund distributions or redemption of fund shares. See pages 94 and 95 for more information. The Fund’s gross expense ratios are 2.11% for Class A shares, 2.82% for Class B shares, 2.84% for Class C shares, 2.06% for Class D shares, 2.29% for Class R shares, 2.10% for Class P shares, 1.87% for Institutional Class shares and 2.15% for Administrative Class shares. These ratios do not include an expense reduction, contractually guaranteed through at least 3/31/14. The Fund’s expense ratios net of this reduction are 1.13% for Class A shares, 1.84% for Class B shares, 1.86% for Class C shares, 1.08% for Class D shares, 1.29% for Class R shares, 0.89% for Class P shares, 0.89% for Institutional Class shares and 1.14% for Administrative Class shares. Expense ratio information is as of the Fund’s current prospectus dated April 1, 2013, as supplemented to date.
| Semiannual Report | | May 31, 2013 | 45 |
Table of Contents
Unaudited
AllianzGI Global Allocation Fund (formerly Allianz Global Investors Solutions Global Allocation Fund) (cont’d)
Cumulative Returns Through May 31, 2013
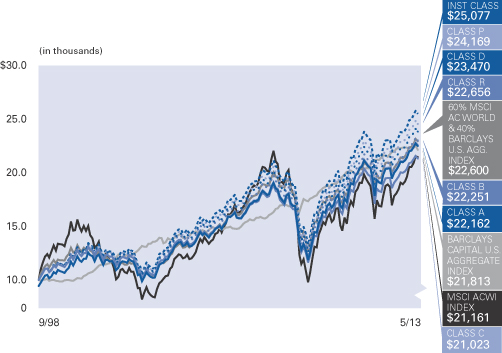
Fund Allocation (as of May 31, 2013)
| PIMCO Income | 10.1% | |||
| AllianzGI NFJ International Value | 8.4% | |||
| PIMCO Foreign Bond (U.S. Dollar-Hedged) | 7.0% | |||
| PIMCO Floating Income | 6.5% | |||
| PIMCO Mortgage Opportunities | 6.1% | |||
| AllianzGI NFJ Global Dividend Value | 5.5% | |||
| PIMCO Short-Term | 4.0% | |||
| AllianzGI NFJ Dividend Value | 4.0% | |||
| Other | 48.2% | |||
| Cash & Equivalents — Net | 0.2% |
| Shareholder Expense Example | Actual Performance | |||||||||||||||
| Class A | Class B | Class C | Class D | Class R | Class P | Institutional Class | Administrative Class | |||||||||
| Beginning Account Value (12/1/12) | $1,000.00 | $1,000.00 | $1,000.00 | $1,000.00 | $1,000.00 | $1,000.00 | $1,000.00 | $1,000.00 | ||||||||
| Ending Account Value (5/31/13) | $1,063.30 | $1,058.70 | $1,058.60 | $1,062.50 | $1,061.50 | $1,063.30 | $1,063.50 | $1,062.90 | ||||||||
| Expenses Paid During Period | $2.16 | $5.95 | $5.95 | $2.16 | $3.24 | $1.18 | $0.82 | $2.11 | ||||||||
| Hypothetical Performance | ||||||||||||||||
| (5% return before expenses) | ||||||||||||||||
| Class A | Class B | Class C | Class D | Class R | Class P | Institutional Class | Administrative Class | |||||||||
| Beginning Account Value (12/1/12) | $1,000.00 | $1,000.00 | $1,000.00 | $1,000.00 | $1,000.00 | $1,000.00 | $1,000.00 | $1,000.00 | ||||||||
| Ending Account Value (5/31/13) | $1,022.84 | $1,019.15 | $1,019.15 | $1,022.84 | $1,021.79 | $1,023.78 | $1,024.13 | $1,022.89 | ||||||||
| Expenses Paid During Period | $2.12 | $5.84 | $5.84 | $2.12 | $3.18 | $1.16 | $0.81 | $2.07 | ||||||||
For each class of the Fund, expenses (net of fee waiver and reimbursement, if any) are equal to the annualized expense ratio for the class (0.42% for Class A, 1.16% for Class B, 1.16% for Class C, 0.42% for Class D, 0.63% for Class R, 0.23% for Class P, 0.16% for Institutional Class and 0.41% for Administrative Class), multiplied by the average account value over the period, multiplied by 182/365. The expense ratio excludes the expenses of the Underlying Funds, which based upon the allocation of the Fund’s assets among the Underlying Funds are indirectly borne by the shareholders of the Fund.
| 46 | May 31, 2013 | | Semiannual Report |
Table of Contents
(THIS PAGE INTENTIONALLY LEFT BLANK)
| Semiannual Report | | May 31, 2013 | 47 |
Table of Contents
Unaudited
AllianzGI Global Growth Allocation Fund (formerly Allianz Global Investors Solutions Global Growth Allocation Fund)
For the period of December 1, 2012 through May 31, 2013, as provided by the Allianz Global Investors US Multi Asset Group.
Portfolio Insights
For the reporting period ended May 31, 2013, Class A shares at NAV of the AllianzGI Global Growth Allocation Fund (the “Fund”) returned 8.70% underperforming the MSCI All Country World Index (the “benchmark index”) which returned 11.72%.
What Happened
For the six months ended May 31, 2013, the dominant theme for global market returns has been central bank policy. Quantitative Easing (QE) has gone global and is the single most dominant force in global markets. Turning from QE to the fundamentals of economic growth and earnings, in the US, the economy continued to grow, albeit at a slower pace than initially expected, with first quarter GDP expanding at 2.4%. In Europe, the struggle for growth remains a persistent theme, which has forced the European Central Bank (ECB) to take more unconventional policy actions including, in early May, raising the prospect of introducing negative interest rates on deposits at the ECB. Further evidence of a slowdown in emerging markets, mainly the BRICs, continued to trickle in during the period.
During the past six months, there have been three major market-moving events. First, the most radical quantitative easing experiment to date was announced and then implemented in Japan following the election of Shinzo Abe to Prime Minister in December. A second new theme is the uncertainty surrounding the timing and size of the Federal Reserve’s (the “Fed’s”) beginning of the end of QE, the so-called “taper,” when the Fed reduces its monthly bond purchases from its current rate of $85 billion. Third, on the fiscal front in the US, the threat of a sequester and fear of a government shutdown ended with the sequester slowing government spending while tax revenues are up in a growing (even if slowly) economy, producing a rapidly improving fiscal position. The US federal deficit is now on track to decline from more than 10% of GDP to around 4% of GDP by the end of the fiscal year (based on Congressional Budget Office projections).
Quantitative easing around the world drove risk asset returns in the developed world. For the period, equities returned 47.7% in Japan, 16.5% in the US and 13.3% in Europe (all equity returns based on MSCI indexes, local currency). The link between central bank asset purchases and equity performance has strengthened significantly
since quantitative easing was first initiated: in the US, since November 2008, the correlation between the Fed’s balance sheet and the S&P 500 Index is over .90 (whereas in the five years leading up to the financial crisis, the correlation is less than 0.2).
The questions surrounding the taper—both when and how quickly the Fed will put the brakes on asset purchases—also resulted in higher volatility across asset markets for the period, while core fixed income generally sold off toward the end of the period and equities rallied. Within fixed income, high yield and convertibles stand out as exceptions returning 5.50% and 14.57% for the period, respectively. US Treasuries suffered as the 10-year yield increased from a low of 1.59% on December 6, 2012 to an intraday high of 2.23% on May 29, 2013—a pronounced move given that that the yield had remained well below 2 percent since April 2012.
When interpreting economic evidence through the prism of the taper, not only is good economic data good for equity returns but bad economic data has also been good news for developed market equities—when it signifies that the Fed will continue to provide liquidity to markets for longer. For most of the rest of the world in equity and commodity markets returns were flat to down. Emerging market equities returned 1.5%. The broad commodity futures were down 8.5% in the period with precious metals suffering the biggest decline, down 22.8% and gold futures down 18.9% (returns based on DJ UBS Commodity Index, Sub Precious Metals Index and Gold Index).
Portfolio Review
During the six month period, and relative to its benchmark index, the Fund held overweight positions had off benchmark exposure in US and non-US small-cap equities and US and non-US fixed-income assets, US and non-US fixed-income assets and in real return assets, including
real estate and commodities. The Fund held underweights in US and non-US large-cap and emerging markets.
In the return generating part of portfolio, the equity holdings underperformed their benchmark. This was mostly due to underperformance in large cap equities as a result of both allocation and fund selection effects. The Fund was underweight US large cap in a period in which the Russell 1000 Index returned 16.68%. Selection effects in US small cap also detracted. Positive fund selection in international equities and emerging markets contributed to performance, helping to offset the negative effect from being underweight those sectors. Exposure to underlying funds implementing managed volatility strategies was a contributor to performance during the period as well.
In the defensive part of the portfolio, the Fund’s aggregate nominal bond positions outperformed the fixed income benchmark mainly due to fund selection and an overweight in agency and non-agency mortgage backed securities. The PIMCO Income Fund was up 6.58% in the period, with an excess return of 7.63% percentage points versus the Barclays US Aggregate Bond Index. A large allocation to the PIMCO Income Fund as well as the PIMCO Mortgage Opportunities Fund enabled the portfolios to gain exposure to the recovery in the housing market in the US and was part of the rationale for the underweight in equities.
The TIPS portion of the fixed income portfolio also contributed to performance due to asset allocation—a large underweight to intermediate term TIPS—and fund selection. Within the Fixed Income universe, TIPS overall underperformed Treasuries as the Barclays US Treasury US TIPS TR Index returned -4.57% versus the Barclays Aggregate Bond Treasury TR Index which was down 1.05%.
The Fund outperformed in commodities, due to a combination of being underweight the commodity benchmark, which was down 8.49% (based on the DJ UBS Commodity Total Return Index) for the period and positive fund selection.
In real estate, the Fund underperformed its benchmark. Fund selection and a tilt toward global REITs detracted from performance in this sector. For the quarter, the S&P United States
| 48 | May 31, 2013 | | Semiannual Report |
Table of Contents
Unaudited
AllianzGI Global Growth Allocation Fund (formerly Allianz Global Investors Solutions Global Growth Allocation Fund) (cont’d)
Property Index outperformed the S&P Europe Property Index by more than 4%.
Outlook
Economic theory tells us that 10-year treasury yields will, in time, match long-term nominal GDP, at around 4% given the Fed’s 2% target inflation. However, the paths to get there and the timing remain uncertain. One virtuous path entails global growth accelerating and economic data steadily improving. The other path is dominated by eroding pricing power and a lack of improvement in the labor market. Both paths will lead to higher interest rates. But the first would be associated with good returns in equities while the second would be associated with equity losses.
More broadly, we are either experiencing the great rotation into equity market outperformance and global growth or the early stages of another global slowdown. An expansion in global growth would be led by the US and emerging markets and would be associated with a recovery in Europe and an escape from deflation in Japan. In such a scenario, we would expect earnings to grow and valuations to continue to improve.
Chairman Bernanke, in particular, has stated that the risks to taking stimulus out of the economy too soon outweigh the risks of keeping quantitative easing in place too long. Thus, should the global economy slow, the Fed, along with other developed country central banks will
likely err on the side of maintaining low to negative real rates.
If evidence mounts that suggests that the world is healing and growth is accelerating, we are prepared to systematically add to risk assets, targeting those with the most attractive valuations. We are positioned to be liquidity suppliers. The portfolios are overweight high-quality dividend-paying stocks, overweight US stocks and remain underweight euro-zone stocks. The portfolios are modestly underweight commodities and real estate, as well as underweight nominal duration. All of the portfolios are within their benchmark-determined risk budgets.
Average Annual Total Return for the period ended May 31, 2013
| 6 Month* | 1 Year | Since Inception† | ||||||||||||
| AllianzGI Global Growth Allocation Fund Class A | 8.70% | 19.91% | 15.78% | |||||||||||
| AllianzGI Global Growth Allocation Fund Class A (adjusted) | 2.72% | 13.32% | 14.19% | ||||||||||
| AllianzGI Global Growth Allocation Fund Class C | 8.24% | 19.00% | 14.94% | |||||||||||
| AllianzGI Global Growth Allocation Fund Class C (adjusted) | 7.24% | 18.00% | 14.94% | ||||||||||
| AllianzGI Global Growth Allocation Fund Class D | 8.71% | 19.90% | 15.80% | ||||||||||
| AllianzGI Global Growth Allocation Fund Class R | 8.54% | 19.64% | 15.51% | ||||||||||
| AllianzGI Global Growth Allocation Fund Class P | 8.79% | 20.12% | 16.01% | ||||||||||
| AllianzGI Global Growth Allocation Fund Institutional Class | 8.84% | 20.27% | 16.14% | ||||||||||
| AllianzGI Global Growth Allocation Fund Administrative Class | 8.74% | 19.97% | 15.85% | |||||||||||
| MSCI AC World Index | 11.72% | 26.01% | 15.85% | ||||||||||
| Lipper Global Flexible Port Fund Average | 5.82% | 14.00% | 11.92% | |||||||||||
† The Fund began operations on 4/27/09. Benchmark return comparisons began on the fund inception date. Lipper performance comparisons began on 4/30/09.
* Cumulative return.
Performance quoted represents past performance and is no guarantee of future results. Current performance may be lower or higher than performance shown. For performance current to the most recent month-end, visit our website at us.allianzgi.com. Investment return and the principal value will fluctuate. Shares may be worth more or less than original cost when redeemed. The adjusted returns take into account the maximum initial sales charge of 5.50% on Class A shares and the contingent deferred sales charge (CDSC) of 1% on Class C shares, which may apply to shares redeemed during the first year of ownership. Returns do not reflect deduction of taxes that a shareholder would pay on fund distributions or redemption of fund shares. See pages 94 and 95 for more information. The Fund’s gross expense ratios are 4.98% for Class A shares, 5.51% for Class C shares, 4.81% for Class D shares, 5.02% for Class R shares, 4.53% for Class P shares, 4.70% for Institutional Class shares and 4.68% for Administrative Class shares. These ratios do not include an expense reduction, contractually guaranteed through at least 3/31/14. The Fund’s expense ratios net of this reduction are 1.26% for Class A shares, 2.04% for Class C shares, 1.26% for Class D shares, 1.49% for Class R shares, 1.09% for Class P shares, 0.99% for Institutional Class shares and 1.24% for Administrative Class shares. Expense ratio information is as of the Fund’s current prospectus dated April 1, 2013, as supplemented to date.
| Semiannual Report | | May 31, 2013 | 49 |
Table of Contents
Unaudited
AllianzGI Global Growth Allocation Fund (formerly Allianz Global Investors Solutions Global Growth Allocation Fund) (cont’d)
Cumulative Returns Through May 31, 2013
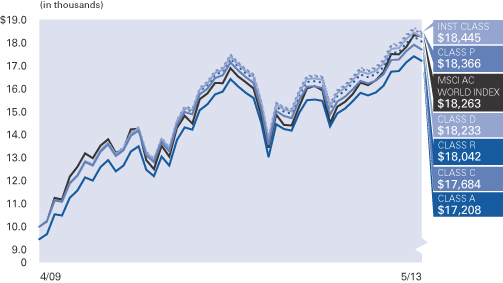
Fund Allocation (as of May 31, 2013)
| AllianzGI U.S. Managed Volatility | 7.0% | |||
| PIMCO Floating Income | 6.1% | |||
| AllianzGI Behavioral Advantage Large Cap | 6.0% | |||
| AllianzGI NFJ International Value | 6.0% | |||
| AllianzGI Emerging Markets Opportunities | 5.9% | |||
| AllianzGI NFJ Small-Cap Value | 5.6% | |||
| PIMCO International StocksPLUS AR Strategy (U.S. Dollar-Hedged) | 4.9% | |||
| ING Global Real Estate | 4.6% | |||
| Other | 53.0% | |||
| Cash & Equivalents — Net | 0.9% |
| Shareholder Expense Example | Actual Performance | |||||||||||||
| Class A | Class C | Class D | Class R | Class P | Institutional Class | Administrative Class | ||||||||
| Beginning Account Value (12/1/12) | $1,000.00 | $1,000.00 | $1,000.00 | $1,000.00 | $1,000.00 | $1,000.00 | $1,000.00 | |||||||
| Ending Account Value (5/31/13) | $1,087.00 | $1,082.40 | $1,087.10 | $1,085.40 | $1,087.90 | $1,088.40 | $1,087.40 | |||||||
| Expenses Paid During Period | $2.08 | $6.13 | $2.08 | $3.28 | $1.20 | $0.68 | $1.98 | |||||||
| Hypothetical Performance | ||||||||||||||
| (5% return before expenses) | ||||||||||||||
| Class A | Class C | Class D | Class R | Class P | Institutional Class | Administrative Class | ||||||||
| Beginning Account Value (12/1/12) | $1,000.00 | $1,000.00 | $1,000.00 | $1,000.00 | $1,000.00 | $1,000.00 | $1,000.00 | |||||||
| Ending Account Value (5/31/13) | $1,022.94 | $1,019.05 | $1,022.94 | $1,021.79 | $1,023.78 | $1,024.28 | $1,023.04 | |||||||
| Expenses Paid During Period | $2.02 | $5.94 | $2.02 | $3.18 | $1.16 | $0.66 | $1.92 | |||||||
For each class of the Fund, expenses (net of fee waiver and reimbursement, if any) are equal to the annualized expense ratio for the class (0.40% for Class A, 1.18% for Class C, 0.40% for Class D, 0.63% for Class R, 0.23% for Class P, 0.13% for Institutional Class and 0.38% for Administrative Class), multiplied by the average account value over the period, multiplied by 182/365. The expense ratio excludes the expenses of the Underlying Funds, which based upon the allocation of the Fund’s assets among the Underlying Funds are indirectly borne by the shareholders of the Fund.
| 50 | May 31, 2013 | | Semiannual Report |
Table of Contents
(THIS PAGE INTENTIONALLY LEFT BLANK)
| Semiannual Report | | May 31, 2013 | 51 |
Table of Contents
Unaudited
AllianzGI Behavioral Advantage Large Cap Fund (formerly Allianz F&T Behavioral Advantage Large Cap Fund)
For the period of December 1, 2012, through May 31, 2013, as provided by Russell Fuller, CFA, PhD, Portfolio Manager.
Portfolio Insights
For the reporting period ended May 31, 2013, Class A shares at NAV of the AllianzGI Behavioral Advantage Large Cap Fund (the “Fund”) returned 17.11% outperforming the S&P 500 Index (the “benchmark index”) which returned 16.43%.
The final days of 2012 were marked by a lack of clarity regarding a compromise solution to avoid falling over the “fiscal cliff,” a combination of spending cuts and tax increases that would take effect at the beginning of 2013. However, with a resolution to the fiscal cliff having been reached to start 2013, stock prices surged as investors also overcame global economic growth concerns, which included worries brought on by austerity and inflation concerns in Europe and China, respectively. Equity markets were also buoyed by the Federal Reserve’s continued stimulus program in purchasing $85 billion per month in Treasury bonds and mortgage-backed securities which kept interest rates low. This helped not only corporations borrow more cheaply, but it also spurred the domestic housing market as major metropolitan areas experienced marked
home price increases on a year-over-year basis. Also bolstering the attractiveness of stocks were the low yields on bonds. Yields did increase towards the end of the period, however, as remarks from Federal Reserve members suggested that asset purchases could begin to wind down with improved employment conditions and signs of increased inflation risk.
While the economic landscape in the US favored stocks, fears related to the dismantling of the Euro currency were raised again in March when Cyprus cut the value of bank depositors’ accounts in order to comply with the terms of a bailout from euro-zone members and the International Monetary Fund. In light of the issues facing euro-zone members, steady global commodity prices in the form of falling copper and flat oil prices helped to create a stable cost environment and ease inflation concerns.
All ten sectors in the benchmark index generated positive returns during the reporting period. Financials was the best performing sector due, in part, to greater mortgage demand from an
improved housing market and the increased likelihood of higher loan profitability due to the growing possibility of increased longer-term lending rates over shorter-term deposit rates. Telecommunication Services and Utilities were the worst performing sectors as investors rotated away from defensive sectors later in the period.
Stock selection was the main driver of performance during the period with sector allocation also contributing positively to relative performance. Driving results was positive stock selection among Information Technology, Industrial, and Energy stocks. Negative stock selection was generated in the Consumer Discretionary, Consumer Staples, and Financials sectors. Helping results from a sector allocation perspective was an underweight allocation to Utilities and overweight allocations to both the Consumer Discretionary and Health Care sectors. Detracting from performance was an underweight allocation to Financials while an overweight to the Telecommunication Services sector was also a slight detractor.
Average Annual Total Return for the period ended May 31, 2013
| 6 Month* | 1 Year | Since Inception† | ||||||||||||
| AllianzGI Behavioral Advantage Large Cap Fund Class A | 17.11% | 26.90% | 26.04% | |||||||||||
| AllianzGI Behavioral Advantage Large Cap Fund Class A (adjusted) | 10.66% | 19.92% | 21.98% | ||||||||||
| AllianzGI Behavioral Advantage Large Cap Fund Class C | 16.69% | 25.95% | 25.08% | |||||||||||
| AllianzGI Behavioral Advantage Large Cap Fund Class C (adjusted) | 15.69% | 24.95% | 25.08% | ||||||||||
| AllianzGI Behavioral Advantage Large Cap Fund Class D | 17.08% | 26.88% | 26.03% | ||||||||||
| AllianzGI Behavioral Advantage Large Cap Fund Class P | 17.20% | 27.20% | 26.32% | ||||||||||
| AllianzGI Behavioral Advantage Large Cap Fund Institutional Class | 17.31% | 27.30% | 26.45% | ||||||||||
| S&P 500 Index | 16.43% | 27.28% | 22.97% | ||||||||||
| Lipper Multi-Cap Core Fund Average | 16.84% | 27.62% | 18.17% | |||||||||||
† The Fund began operations on 9/8/11. Benchmark return comparisons began on the fund inception date. Lipper performance comparisons began on 8/31/11.
* Cumulative return.
Performance quoted represents past performance and is no guarantee of future results. Current performance may be lower or higher than performance shown. For performance current to the most recent month-end, visit our website at us.allianzgi.com. Investment return and the principal value will fluctuate. Shares may be worth more or less than original cost when redeemed. The adjusted returns take into account the maximum initial sales charge of 5.50% on Class A shares and the contingent deferred sales charge (CDSC) of 1% on Class C shares, which may apply to shares redeemed during the first year of ownership. Returns do not reflect deduction of taxes that a shareholder would pay on fund distributions or redemption of fund shares. See pages 94 and 95 for more information. The Fund’s gross expense ratios are 2.76% for Class A shares, 3.62% for Class C shares, 2.61% for Class D shares, 2.38% for Class P shares and 2.32% for Institutional Class shares. These ratios do not include an expense reduction, contractually guaranteed through at least 3/31/14. The Fund’s expense ratios net of this reduction are 0.83% for Class A shares, 1.57% for Class C shares, 0.81% for Class D shares, 0.65% for Class P shares and 0.55% for Institutional Class shares. Expense ratio information is as of the Fund’s current prospectus dated April 1, 2013, as supplemented to date.
| 52 | May 31, 2013 | | Semiannual Report |
Table of Contents
Unaudited
AllianzGI Behavioral Advantage Large Cap Fund (formerly Allianz F&T Behavioral Advantage Large Cap Fund) (cont’d)
Cumulative Returns Through May 31, 2013
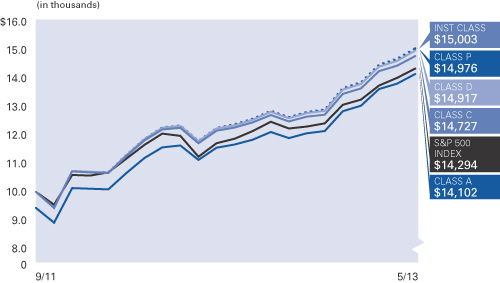
Industry Allocation (as of May 31, 2013)
| Oil, Gas & Consumable Fuels | 9.6% | |||
| Insurance | 5.8% | |||
| Pharmaceuticals | 5.2% | |||
| Specialty Retail | 4.6% | |||
| IT Services | 4.1% | |||
| Food & Staples Retailing | 3.8% | |||
| Software | 3.8% | |||
| Media | 3.6% | |||
| Other | 59.2% | |||
| Cash & Equivalents — Net | 0.3% |
| Shareholder Expense Example | Actual Performance | |||||||||
| Class A | Class C | Class D | Class P | Institutional Class | ||||||
| Beginning Account Value (12/1/12) | $1,000.00 | $1,000.00 | $1,000.00 | $1,000.00 | $1,000.00 | |||||
| Ending Account Value (5/31/13) | $1,171.10 | $1,166.90 | $1,170.80 | $1,172.00 | $1,173.10 | |||||
| Expenses Paid During Period | $4.66 | $8.75 | $4.71 | $3.52 | $2.98 | |||||
| Hypothetical Performance | ||||||||||
| (5% return before expenses) | ||||||||||
| Class A | Class C | Class D | Class P | Institutional Class | ||||||
| Beginning Account Value (12/1/12) | $1,000.00 | $1,000.00 | $1,000.00 | $1,000.00 | $1,000.00 | |||||
| Ending Account Value (5/31/13) | $1,020.64 | $1,016.85 | $1,020.59 | $1,021.69 | $1,022.19 | |||||
| Expenses Paid During Period | $4.33 | $8.15 | $4.38 | $3.28 | $2.77 | |||||
For each class of the Fund, expenses (net of fee waiver and reimbursement, if any) are equal to the annualized expense ratio for the class (0.86% for Class A, 1.62% for Class C, 0.87% for Class D, 0.65% for Class P and 0.55% for Institutional Class), multiplied by the average account value over the period, multiplied by 182/365.
| Semiannual Report | | May 31, 2013 | 53 |
Table of Contents
Unaudited
AllianzGI China Equity Fund (formerly Allianz RCM China Equity Fund)
For the period of December 1, 2012, through May 31, 2013, as provided by Christina Chung, CFA, CMA, Portfolio Manager.
Portfolio Insights
For the reporting period ended May 31, 2013, Class A shares at NAV of the AllianzGI China Equity Fund (the “Fund”) returned 4.40% outperforming the MSCI China Index (the “benchmark index”) which returned 0.31%.
The relative outperformance was largely attributed to positive stock selection, with particular strengths from the industrials and materials sectors. In contrast, stock selection in information technology and financials had been the areas of weakness and detracted from performance. However, our relative overweight in the information technology sector had partially offset the negative attribution from stock selection in the sector. One of our stock picks in the industrial sector (an environmental protection company) continued to add to relative performance, driven by an acceleration of new projects given the increased attention to the pollution problem in China. The materials sector contributed positively to relative performance in part because of our stock positioning in the high speed steel manufacturing industry. On the negative side, the information technology sector detracted from relative performance for the period in part because of our position in an IT services provider
whose share price was undermined by PC weakness. However, we believe consumer sentiment could improve by mid-2013 along with somewhat better PC demand to propel H2/2013 growth. Within the financials sector, our holdings in the real estate and insurance industries were amongst the largest detractors to performance.
The China equity market consolidated in the first quarter of 2013 and again in May amidst looming worries over China’s growth recovery as well as the absence of economic reform drivers. Investors were disappointed by the lower-than-expected GDP of 7.7% annual rate of growth in the first quarter of 2013. Then in May, the flash HSBC Purchasing Managers’ Index (PMI) fell 0.8 percentage points to 49.6, back into the contractionary zone for the first time in seven months. This triggered concerns over China’s economic recovery. In addition, the lack of news flow on reform initiatives triggered some short-term selling during the first quarter as the market had built in expectations of reform measures to be initiated by the new leaders in China. This month, Premier Li reiterated China’s reform agenda, but more details of the reform measures might not be announced until the
third plenary session of the Central Committee, which would take place in October.
Following the release of a series of weak macroeconomic data from China, economic growth expectations for China have been revised downward. This has triggered renewed concerns over a potential economic ‘hard landing’ in China. We believe that the concerns are overdone and China equities have built in much of the concerns as reflected by the market’s low valuation. As such, we maintain our view that the market downside risk is limited. Expectations of economic reform initiatives over the next few months should help to drive share price recovery over the course of the year.
During the first half of 2013, earnings results are likely to continue to present a mixed picture. On the negative side, following the strong performance of many Chinese small cap stocks, share prices are vulnerable to correction particularly with potential risk of earnings disappointments. As such, we remain selective in small/mid cap exposure focusing on those with low valuations and medium-term growth prospects.
Average Annual Total Return for the period ended May 31, 2013
| 6 Month* | 1 Year | Since Inception† | ||||||||||||
AllianzGI China Equity Fund Class A | 4.40% | 16.10% | 5.96% | |||||||||||
| AllianzGI China Equity Fund Class A (adjusted) | –1.34% | 9.72% | 3.97% | ||||||||||
AllianzGI China Equity Fund Class C | 4.03% | 15.22% | 5.24% | |||||||||||
| AllianzGI China Equity Fund Class C (adjusted) | 3.03% | 14.22% | 5.24% | ||||||||||
| AllianzGI China Equity Fund Class D | 4.46% | 16.06% | 6.03% | ||||||||||
| AllianzGI China Equity Fund Class P | 4.54% | 16.35% | 6.29% | ||||||||||
| AllianzGI China Equity Fund Institutional Class | 4.54% | 16.41% | 6.38% | ||||||||||
| MSCI China Index | 0.31% | 15.39% | 3.75% | ||||||||||
Lipper China Region Funds Average | 6.76% | 19.56% | 6.18% | |||||||||||
† The Fund began operations on 6/7/10. Benchmark return comparisons began on the fund inception date. Lipper performance comparisons began on 5/31/2010.
* Cumulative return.
Performance quoted represents past performance and is no guarantee of future results. Current performance may be lower or higher than performance shown. For performance current to the most recent month-end, visit our website at us.allianzgi.com. Investment return and the principal value will fluctuate. Shares may be worth more or less than original cost when redeemed. The adjusted returns take into account the maximum initial sales charge of 5.50% on Class A shares and the contingent deferred sales charge (CDSC) of 1% on Class C shares, which may apply to shares redeemed during the first year of ownership. Returns do not reflect deduction of taxes that a shareholder would pay on fund distributions or redemption of fund shares. See pages 94 and 95 for more information. The Fund’s gross expense ratios are 6.54% for Class A shares, 8.46% for Class C shares, 16.67% for Class D shares, 5.74% for Class P shares and 6.19% for Institutional Class shares. These ratios do not include an expense reduction, contractually guaranteed through at least 3/31/14. The Fund’s expense ratios net of this reduction are 1.73% for Class A shares, 2.56% for Class C shares, 1.77% for Class D shares, 1.51% for Class P shares and 1.45% for Institutional Class shares. Expense ratio information is as of the Fund’s current prospectus dated April 1, 2013, as supplemented to date.
| 54 | May 31, 2013 | | Semiannual Report |
Table of Contents
Unaudited
AllianzGI China Equity Fund (formerly Allianz RCM China Equity Fund) (cont’d)
Cumulative Returns Through May 31, 2013
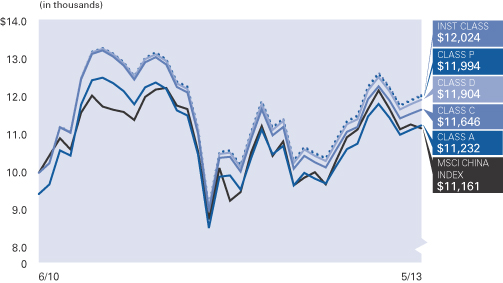
Industry Allocation (as of May 31, 2013)
Commercial Banks | 18.4% | |||
Oil, Gas & Consumable Fuels | 10.4% | |||
Real Estate Management & Development | 6.7% | |||
Commercial Services & Supplies | 6.5% | |||
Insurance | 6.2% | |||
Internet Software & Services | 5.7% | |||
Specialty Retail | 4.9% | |||
Wireless Telecommunication Services | 4.7% | |||
Other | 33.1% | |||
Cash & Equivalents — Net | 3.4% |
Shareholder Expense Example | Actual Performance | |||||||||
Class A | Class C | Class D | Class P | Institutional | ||||||
Beginning Account Value (12/1/12) | $1,000.00 | $1,000.00 | $1,000.00 | $1,000.00 | $1,000.00 | |||||
Ending Account Value (5/31/13) | $1,044.00 | $1,040.30 | $1,044.60 | $1,045.40 | $1,045.40 | |||||
Expenses Paid During Period | $8.82 | $13.02 | $9.02 | $7.70 | $7.39 | |||||
| Hypothetical Performance | ||||||||||
(5% return before expenses) | ||||||||||
Class A | Class C | Class D | Class P | Institutional Class | ||||||
| Beginning Account Value (12/1/12) | $1,000.00 | $1,000.00 | $1,000.00 | $1,000.00 | $1,000.00 | |||||
Ending Account Value (5/31/13) | $1,016.31 | $1,012.17 | $1,016.11 | $1,017.40 | $1,017.70 | |||||
Expenses Paid During Period | $8.70 | $12.84 | $8.90 | $7.59 | $7.29 | |||||
For each class of the Fund, expenses (net of fee waiver and reimbursement, if any) are equal to the annualized expense ratio for the class (1.73% for Class A, 2.56 % for Class C, 1.77% for Class D, 1.51% for Class P and 1.45% for Institutional Class), multiplied by the average account value over the period, multiplied by 182/365.
| Semiannual Report | | May 31, 2013 | 55 |
Table of Contents
Unaudited
AllianzGI Convertible Fund (formerly Allianz AGIC Convertible Fund)
For the period of December 1, 2012 through May 31, 2013, as provided by Justin Kass, CFA, Portfolio Manager.
Portfolio Insights
For the reporting period ended May 31, 2013, Class A shares at NAV of the AllianzGI Convertible Fund (the “Fund”) returned 15.36% outperforming the BofA Merrill Lynch All Convertibles Index (the “benchmark index”) which returned 14.57%.
The convertible market was higher over the reporting period.
During the reporting period, convertible bonds benefited from both credit-spread tightening and higher equity prices. The primary reason for continued credit improvement was, and is, the lack of credit risk. Solid balance sheets were confirmed in the reporting season. The new-issue corporate-bond market produced a lower semi-annual interest-expense burden for issuers, and again proved the widespread availability of new capital. Furthermore, the majority of the new issues’ use-of-proceeds continued to be refinancing, which helps eliminate near-term amortization risk in the market. A consistently accommodative global monetary policy has continued to offset any headline macroeconomic softness.
Other positive factors affecting the convertible-bond market included a rebound in housing as well as growth in domestic-energy exploration and production. On the negative side, reported revenue and earnings growth slowed in the second half of 2012. However, this did not materially affect balance-sheet integrity or corporate profits among the majority of issuers.
Against this backdrop, non-investment-grade issuers outperformed investment-grade issuers during the reporting period, while total-return convertibles outperformed yield or busted categories.
New convertible issuance increased significantly during the reporting period and totaled approximately $18.0 billion in proceeds thus far in 2013. Unlike in recent years, many of the issuers in the period were companies that were accessing capital for growth, which may lead to improving fundamentals.
Performance
The Fund rallied with the market during the reporting period. The attribution for the period included several positive single-name
performers from a variety of sectors. The majority of the Fund’s issuers exceeded earnings expectations, which helped contribute to absolute and relative performance.
Sector allocations that helped relative performance in the period included Consumer Discretionary, Industrials and Materials. An overweight and positive security selection in the Consumer Discretionary sector was beneficial, while stronger issue-specific performance within the Industrials sector had a positive impact on a relative basis. In addition, the fund benefited from being underweight Materials, and to a lesser extent, avoiding poor-performing issuers within the sector.
In contrast, the Fund’s Healthcare, Transportation and Energy exposure weighed on relative performance in the reporting period. In particular, negative security selection within the Healthcare sector detracted, while an underweight in Energy and weaker returns from individual issues hindered performance on a relative basis. In addition, lower issuer-specific performance in Transportation more than offset any benefit from the sector overweight.
Average Annual Total Return for the period ended May 31, 2013
| 6 Month* | 1 Year | 5 Year | 10 Year | Since Inception† | ||||||||||||||||||
| AllianzGI Convertible Fund Class A | 15.36% | 23.96% | 8.08% | 10.06% | 10.47% | |||||||||||||||||
| AllianzGI Convertible Fund Class A (adjusted) | 9.02% | 17.14% | 6.86% | 9.44% | 10.16% | ||||||||||||||||
| AllianzGI Convertible Fund Class C | 14.94% | 23.05% | 7.29% | 9.25% | 9.65% | |||||||||||||||||
| AllianzGI Convertible Fund Class C (adjusted) | 13.94% | 22.05% | 7.29% | 9.25% | 9.65% | ||||||||||||||||
| AllianzGI Convertible Fund Class D | 15.34% | 23.90% | 8.08% | 10.06% | 10.47% | ||||||||||||||||
| AllianzGI Convertible Fund Class R | 15.19% | 23.52% | 7.80% | 9.78% | 10.19% | ||||||||||||||||
| AllianzGI Convertible Fund Class P | 15.49% | 24.24% | 8.30% | 10.29% | 10.70% | ||||||||||||||||
| AllianzGI Convertible Fund Institutional Class | 15.58% | 24.42% | 8.42% | 10.41% | 10.82% | ||||||||||||||||
| AllianzGI Convertible Fund Administrative Class | 15.42% | 24.11% | 8.12% | 10.08% | 10.48% | |||||||||||||||||
| BofA Merrill Lynch All Convertibles Index | 14.57% | 23.52% | 6.34% | 7.21% | 8.15% | ||||||||||||||||
| Lipper Conv. Securities Fund Average | 12.96% | 20.37% | 4.66% | 6.84% | 8.51% | |||||||||||||||||
† The Fund began operations on 4/19/93. Benchmark return comparisons began on the fund inception date. Lipper performance comparisons began on 4/30/93.
* Cumulative return.
Performance quoted represents past performance and is no guarantee of future results. Current performance may be lower or higher than performance shown. For performance current to the most recent month-end, visit our website at us.allianzgi.com. Investment return and the principal value will fluctuate. Shares may be worth more or less than original cost when redeemed. The adjusted returns take into account the maximum initial sales charge of 5.50% on Class A shares and the contingent deferred sales charge (CDSC) of 1% on Class C shares, which may apply to shares redeemed during the first year of ownership. Returns do not reflect deduction of taxes that a shareholder would pay on fund distributions or redemption of fund shares. See pages 94 and 95 for more information. The Fund’s gross expense ratios are 1.01% for Class A shares, 1.76% for Class C shares, 1.06% for Class D shares, 1.36% for Class R shares, 0.86% for Class P shares, 0.67% for Institutional Class shares and 0.92% for Administrative Class shares. The ratio for Class P shares does not include an expense reduction, contractually guaranteed through at least 3/31/14. The Fund’s expense ratio net of this reduction is 0.80% for Class P shares. Expense ratio information is as of the Fund’s current prospectus dated April 1, 2013, as supplemented to date.
| 56 | May 31, 2013 | | Semiannual Report |
Table of Contents
Unaudited
AllianzGI Convertible Fund (formerly Allianz AGIC Convertible Fund) (cont’d)
Cumulative Returns Through May 31, 2013
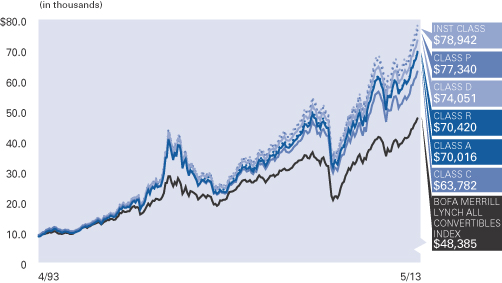
Industry Allocation (as of May 31, 2013)
| Semiconductors | 6.6% | |||
| Oil & Gas | 6.3% | |||
| Biotechnology | 5.8% | |||
| Insurance | 5.7% | |||
| Pharmaceuticals | 5.3% | |||
| Internet | 5.2% | |||
| Real Estate Investment Trust | 4.7% | |||
| Commercial Services | 4.5% | |||
| Other | 53.7% | |||
| Cash & Equivalents — Net | 2.2% |
Moody’s Ratings* (as of May 31, 2013)
(as a % of total investments)
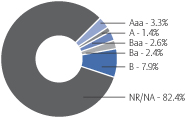
| * | The letter ratings are provided to indicate the creditworthiness of the underlying bonds in the portfolio and generally range from AAA (highest) to D (lowest). Ratings do not apply to the Fund. |
| Shareholder Expense Example | Actual Performance | |||||||||||||
| Class A | Class C | Class D | Class R | Class P | Institutional Class | Administrative Class | ||||||||
| Beginning Account Value (12/1/12) | $1,000.00 | $1,000.00 | $1,000.00 | $1,000.00 | $1,000.00 | $1,000.00 | $1,000.00 | |||||||
| Ending Account Value (5/31/13) | $1,153.60 | $1,149.40 | $1,153.40 | $1,151.90 | $1,154.90 | $1,155.80 | $1,154.20 | |||||||
| Expenses Paid During Period | $5.10 | $9.06 | $5.48 | $7.35 | $3.98 | $3.44 | $4.94 | |||||||
| Hypothetical Performance | ||||||||||||||
| (5% return before expenses) | ||||||||||||||
| Class A | Class C | Class D | Class R | Class P | Institutional Class | Administrative Class | ||||||||
| Beginning Account Value (12/1/12) | $1,000.00 | $1,000.00 | $1,000.00 | $1,000.00 | $1,000.00 | $1,000.00 | $1,000.00 | |||||||
| Ending Account Value (5/31/13) | $1,020.19 | $1,016.50 | $1,019.85 | $1,018.10 | $1,021.24 | $1,021.74 | $1,020.34 | |||||||
| Expenses Paid During Period | $4.78 | $8.50 | $5.14 | $6.89 | $3.73 | $3.23 | $4.63 | |||||||
For each class of the Fund, expenses (net of fee waiver and reimbursement, if any) are equal to the annualized expense ratio for the class (0.95% for Class A, 1.69% for Class C, 1.02% for Class D, 1.37% for Class R, 0.74% for Class P, 0.64% for Institutional Class and 0.92% for Administrative Class), multiplied by the average account value over the period, multiplied by 182/365.
| Semiannual Report | | May 31, 2013 | 57 |
Table of Contents
Unaudited
AllianzGI Disciplined Equity Fund (formerly Allianz RCM Disciplined Equity Fund)
For the period of December 1, 2012, through May 31, 2013, as provided by Seung H. Minn, CFA, Portfolio Manager.
Portfolio Insights
For the reporting period ended May 31, 2013, Class A shares at NAV of the AllianzGI Disciplined Equity Fund (the “Fund”) returned 12.13% underperforming the S&P 500 Index (the “benchmark index”) which returned 16.43%. Approximately 70% of the Fund’s underperformance during this period was due to stock selection while the remainder was attributable to our sector positioning.
The market environment over the most recent reporting period continued to be challenging for our strategy. With ongoing monetary support from global central banks and the sluggish economic recovery in the world’s major economies, we have found investors favoring the shares of defensive companies that pay high dividends. These companies do not fit our general investment profile, which is contrarian based with an emphasis on relative valuation. However, the outperformance of “defensives” has persisted for an unusually prolonged period and our analysis indicates that the valuation levels on many of these companies have likely expanded beyond sustainable levels.
Stock selection in the technology and energy sectors detracted from active returns during the six-month period ended May 31, 2013. In this period, some of the top detractors in technology were long-term holdings that have done well over our holding period but have fallen under recent pressure. We continually re-evaluate the investment theses in such cases and make
position adjustments as needed. In many cases, we see these issues as temporary and believe these stocks should appreciate as conditions in their respective markets improve and/or execution issues are resolved. In energy, we believe our top holdings in the sector have varied secular growth drivers not appreciated by the market in this latest period. We continue to have conviction that our holdings will eventually be rewarded for the fundamental drivers supporting our investment.
On the positive side, stock selection in financials and consumer staples helped relative performance. Our holdings in the asset management segment were especially strong amid the strength in equity markets and solid business execution. In consumer staples, we avoided several of the poorest sector performers which we considered to be relatively expensive and instead picked stocks whose relative valuation and fundamentals were more attractive to the market in this period.
On a sector allocation basis, the Fund’s underweights in financials and consumer discretionary as well as an overweight in materials detracted from relative returns. Conversely, underweighting utilities and consumer staples helped returns. On balance, the impact of sector allocation was negative.
The disciplined implementation of our contrarian philosophy is a key component of our strategy to
outperform over the long-term and through various market environments. However, in the recent environment, our valuation-based investment process has been challenged. What we consider to be over-valued has continued to out-pace what we consider to be under-valued. Therefore, our process of trimming and selling over-valued stocks, and re-investing in under-valued stocks has been out-of-favor, and thus, a strong headwind condition.
In this current regime we have re-evaluated and improved certain aspects of our valuation work, but continue to have conviction in our investment philosophy and process. We believe the Fund stands to perform strongly as the economic and political situations in the US and abroad continue to stabilize. In fact, we were very encouraged to see growing optimism on global growth prospects reflected in the outperformance of some cyclical sectors such as industrials, energy, and technology later in the period.
In time, we see the market returning to a more normal environment in which company’s demonstrating fundamental improvements should be rewarded. However, risks are still present such as uncertainty regarding the full impact of federal spending cuts in the US as well as stalled policy or economic progress in Europe and Asia.
In the coming months, we will continue to adhere to our investment process and remain focused on identifying undervalued companies undergoing positive change.
Average Annual Total Return for the period ended May 31, 2013
| 6 Month* | 1 Year | Since Inception† | ||||||||||||
| AllianzGI Disciplined Equity Fund Class A | 12.13% | 20.75% | 6.90% | |||||||||||
| AllianzGI Disciplined Equity Fund Class A (adjusted) | 5.96% | 14.11% | 5.67% | ||||||||||
| AllianzGI Disciplined Equity Fund Class C | 11.68% | 19.79% | 6.10% | |||||||||||
| AllianzGI Disciplined Equity Fund Class C (adjusted) | 10.68% | 18.79% | 6.10% | ||||||||||
| AllianzGI Disciplined Equity Fund Class D | 12.11% | 20.74% | 6.90% | ||||||||||
| AllianzGI Disciplined Equity Fund Class P | 12.21% | 20.92% | 7.13% | ||||||||||
| AllianzGI Disciplined Equity Fund Institutional Class | 12.28% | 21.00% | 7.23% | ||||||||||
| S&P 500 Index | 16.43% | 27.28% | 8.63% | ||||||||||
| Lipper Large-Cap Core Fund Average | 16.05% | 26.82% | 6.64% | |||||||||||
† The Fund began operations on 7/15/08. Benchmark return comparisons began on the fund inception date. Lipper performance comparisons began on 7/31/08.
* Cumulative return.
Performance quoted represents past performance and is no guarantee of future results. Current performance may be lower or higher than performance shown. For performance current to the most recent month-end, visit our website at us.allianzgi.com. Investment return and the principal value will fluctuate. Shares may be worth more or less than original cost when redeemed. The adjusted returns take into account the maximum initial sales charge of 5.50% on Class A shares and the contingent deferred sales charge (CDSC) of 1% on Class C shares, which may apply to shares redeemed during the first year of ownership. Returns do not reflect deduction of taxes that a shareholder would pay on fund distributions or redemption of fund shares. See pages 94 and 95 for more information. The Fund’s gross expense ratios are 1.38% for Class A shares, 2.21% for Class C shares, 4.88% for Class D shares, 1.26% for Class P shares and 1.09% for Institutional Class shares. These ratios do not include an expense reduction, contractually guaranteed through at least 3/31/14. The Fund’s expense ratios net of this reduction are 0.95% for Class A shares, 1.70% for Class C shares, 0.95% for Class D shares, 0.79% for Class P shares and 0.70% for Institutional Class shares. Expense ratio information is as of the Fund’s current prospectus dated April 1, 2013, as supplemented to date.
| 58 | May 31, 2013 | | Semiannual Report |
Table of Contents
Unaudited
AllianzGI Disciplined Equity Fund (formerly Allianz RCM Disciplined Equity Fund) (cont’d)
Cumulative Returns Through May 31, 2013
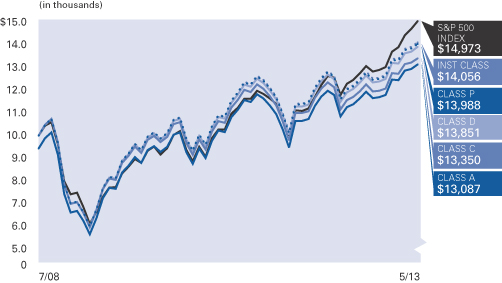
Industry Allocation (as of May 31, 2013)
| Oil, Gas & Consumable Fuels | 8.0% | |||
| Energy Equipment & Services | 6.0% | |||
| Pharmaceuticals | 5.9% | |||
| Software | 5.8% | |||
| Computers & Peripherals | 5.5% | |||
| Aerospace & Defense | 5.4% | |||
| Commercial Banks | 5.1% | |||
| Capital Markets | 5.0% | |||
| Other | 50.9% | |||
| Cash & Equivalents — Net | 2.4% |
| Shareholder Expense Example | Actual Performance | |||||||||
| Class A | Class C | Class D | Class P | Institutional Class | ||||||
| Beginning Account Value (12/1/12) | $1,000.00 | $1,000.00 | $1,000.00 | $1,000.00 | $1,000.00 | |||||
| Ending Account Value (5/31/13) | $1,121.30 | $1,116.80 | $1,121.10 | $1,122.10 | $1,122.80 | |||||
| Expenses Paid During Period | $5.02 | $8.97 | $5.02 | $4.23 | $3.70 | |||||
| Hypothetical Performance | ||||||||||
| (5% return before expenses) | ||||||||||
| Class A | Class C | Class D | Class P | Institutional Class | ||||||
| Beginning Account Value (12/1/12) | $1,000.00 | $1,000.00 | $1,000.00 | $1,000.00 | $1,000.00 | |||||
| Ending Account Value (5/31/13) | $1,020.19 | $1,016.45 | $1,020.19 | $1,020.94 | $1,021.44 | |||||
| Expenses Paid During Period | $4.78 | $8.55 | $4.78 | $4.03 | $3.53 | |||||
For each class of the Fund, expenses (net of fee waiver and reimbursement, if any) are equal to the annualized expense ratio for the class (0.95% for Class A, 1.70% for Class C, 0.95% for Class D, 0.80% for Class P and 0.70% for Institutional Class), multiplied by the average account value over the period, multiplied by 182/365.
| Semiannual Report | | May 31, 2013 | 59 |
Table of Contents
Unaudited
AllianzGI Dynamic Emerging Multi-Asset Fund
From December 17, 2012 through May 31, 2013, as provided by Stefan Nixel, CFA, Portfolio Manager.
Portfolio Insights
For the period from inception on December 17, 2012 through May 31, 2013, Class A shares at NAV of the AllianzGI Dynamic Emerging Multi Asset Fund (the “Fund”) returned -5.47% underperforming the MSCI Emerging Markets Index (the “benchmark index”) which returned -1.94% since the Fund’s inception.
Returns of emerging market equities and emerging market fixed income came under pressure during the first five months of 2013 due to concerns that the US Federal Reserve may begin tapering their easy monetary policy, growth in China may continue to slow, and news
that the euro-zone GDP rate remains in negative territory, dropping -0.2% in the first quarter of the year. Global economic growth concerns continue to reduce demand for raw materials from export-driven emerging market economies resulting in the benchmark index falling -1.94%, the JPMorgan Emerging Market Bond Index dropping -2.89%, and the DJ UBS Commodity Index returning -6.97% since the inception of the Fund.
As of May 31, 2013 the Fund held 54% of the portfolio in Emerging Market Equities, and 46% in Emerging Market Fixed Income. The Fund does
have the ability to invest in Commodities but due to our asset allocation analysis, the portfolio has reduced exposure from a 5% allocation at the beginning of the year down to 0%. In regards to Emerging Market equities the Fund currently gains exposure through Futures on the benchmark index and has taken active country weights through Futures with an overweight to Turkey, Brazil, China, and South Korea and an underweight to South Africa, Taiwan, and India.
Cumulative Total Return for the period ended May 31, 2013
Since Inception† | ||||||
AllianzGI Dynamic Emerging Multi-Asset Fund Class A | –5.47% | |||||
| AllianzGI Dynamic Emerging Multi-Asset Fund Class A (adjusted) | –10.67% | ||||
AllianzGI Dynamic Emerging Multi-Asset Fund Class C | –5.80% | |||||
| AllianzGI Dynamic Emerging Multi-Asset Fund Class C (adjusted) | –6.74% | ||||
| AllianzGI Dynamic Emerging Multi-Asset Fund Class D | –5.47% | ||||
| AllianzGI Dynamic Emerging Multi-Asset Fund Class P | –5.40% | ||||
| AllianzGI Dynamic Emerging Multi-Asset Fund Institutional Class | –5.40% | ||||
| MSCI Emerging Markets Index | –1.94% | ||||
Lipper Global Flexible Port. Fund Average | 3.90% | |||||
† The Fund began operations on 12/17/12. Benchmark return comparisons began on the fund inception date. Lipper performance comparisons began on 12/31/12.
Performance quoted represents past performance and is no guarantee of future results. Current performance may be lower or higher than performance shown. For performance current to the most recent month-end, visit our website at us.allianzgi.com. Investment return and the principal value will fluctuate. Shares may be worth more or less than original cost when redeemed. The adjusted returns take into account the maximum initial sales charge of 5.50% on Class A shares and the contingent deferred sales charge (CDSC) of 1% on Class C shares, which may apply to shares redeemed during the first year of ownership. Returns do not reflect deduction of taxes that a shareholder would pay on fund distributions or redemption of fund shares. See pages 94 and 95 for more information. The Fund’s gross expense ratios are 7.28% for Class A shares, 8.03% for Class C shares, 7.28% for Class D shares, 7.13% for Class P shares and 7.03% for Institutional Class shares. These ratios do not include an expense reduction, contractually guaranteed through at least 3/31/14. The Fund’s expense ratios net of this reduction are 1.53% for Class A shares, 2.28% for Class C shares, 1.53% for Class D shares, 1.38% for
Class P shares and 1.28% for Institutional Class shares. Expense ratio information is as of the Fund’s current prospectus dated April 1, 2013, as supplemented to date.
| 60 | May 31, 2013 | | Semiannual Report |
Table of Contents
Unaudited
AllianzGI Dynamic Emerging Multi-Asset Fund (cont’d)
Cumulative Returns Through May 31, 2013
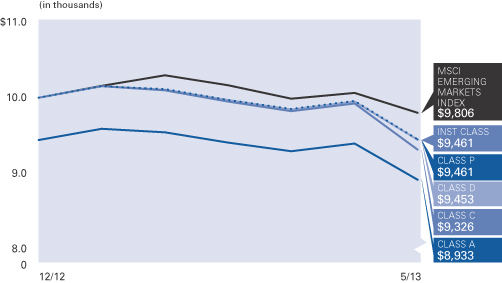
Asset Allocation (as of May 31, 2013)
| Mutual Funds | 47.4% | |||
| Corporate Bonds | 8.2% | |||
| Cash & Equivalents — Net | 44.4% |
| Shareholder Expense Example | Actual Performance | |||||||||
| Class A | Class C | Class D | Class P | Institutional Class | ||||||
| Beginning Account Value (12/17/12) | $1,000.00 | $1,000.00 | $1,000.00 | $1,000.00 | $1,000.00 | |||||
| Ending Account Value (5/31/13) | $945.30 | $942.00 | $945.30 | $946.00 | $946.00 | |||||
| Expenses Paid During Period | $6.46 | $9.74 | $6.46 | $5.81 | $5.37 | |||||
| Hypothetical Performance | ||||||||||
| (5% return before expenses) | ||||||||||
| Class A | Class C | Class D | Class P | Institutional Class | ||||||
| Beginning Account Value (12/1/12) | $1,000.00 | $1,000.00 | $1,000.00 | $1,000.00 | $1,000.00 | |||||
| Ending Account Value (5/31/13) | $1,017.60 | $1,013.86 | $1,017.60 | $1,018.35 | $1,018.85 | |||||
| Expenses Paid During Period | $7.39 | $11.15 | $7.39 | $6.64 | $6.14 | |||||
The Fund commenced operations on December 17, 2012. The Actual expense example is based on the period since inception; the Hypothetical expense example is based on the period beginning December 1, 2012. If the Hypothetical expense example had been based on the period since inception, the Ending Account Value and Expenses Paid During Period would have been: $1,015.96 and $6.70, respectively, for Class A; $1,012.57 and $10.10, respectively, for Class C; $1,015.96 and $6.70, respectively, for Class D; $1,016.64 and $6.02, respectively, for Class P; and $1,017.09 and $5.56, respectively, for Institutional Class.
For each class of the Fund, expenses (net of fee waiver and reimbursement, if any) are equal to the annualized expense ratio for the class (1.47% for Class A, 2.22% for Class C, 1.47% for Class D, 1.32% for Class P and 1.22% for Institutional Class), multiplied by theaverage account value over the period, multiplied by 165/365 for the Actual expense example and 182/365 for the Hypothetical expense example. The expense ratio excludes the expenses of the Underlying Funds, which based upon the allocation of the Fund’s assets among the Underlying Funds are indirectly borne by the shareholders of the Fund.
| Semiannual Report | | May 31, 2013 | 61 |
Table of Contents
Unaudited
AllianzGI Global Managed Volatility Fund (formerly Allianz AGIC Global Managed Volatility Fund)
For the period of December 1, 2012 through May 31, 2013, as provided by Kunal Ghosh, Portfolio Manager.
Portfolio Insights
For the reporting period ended May 31, 2013, Class A shares at NAV of the AllianzGI Global Managed Volatility Fund (the “Fund”) returned 7.64% underperforming the MSCI World Index (the “benchmark index”) which returned 13.26%.
Market Environment
During the reporting period, developed market stocks performed well, posting positive results for six straight months. During this timeframe, investors reacted favorably to additional central bank easing policies coupled with the prospects of higher earnings growth.
Japan was the best benchmark index performer, with the country’s new Prime Minister Shinzo Abe making unprecedented efforts to boost the country’s competitiveness through monetary easing in an effort to help break the deflationary cycle. Within Europe, countries on the periphery, including Ireland, Sweden and Portugal were among the best performers. In the United States, stocks recorded at record highs, with the S&P 500 Index beating its previous October 2007 close. In statements, the Federal Reserve noted persistent “downside risks” and pledged exceptionally low interest rates until unemployment sinks below 6.5% or inflation breaks above 2.5%. Despite the positive performance, a mixed economic picture has presented itself, with disappointing consumer
confidence and purchasing manager index results offsetting the rosy picture. The strong momentum from earlier in the reporting period began to fade at the end of May, particularly as investors digested the potential ramifications of a potential Federal Reserve tapering.
Sector performance was broad-based, with each of the ten benchmark index sectors reporting positive results. Consumer Discretionary, Health Care and Financials stocks were the biggest outperformers, while the Materials sector managed to eke out only a slight gain for the reporting period.
Volatility and market risk are increasingly important given the rapidly adjusting macroeconomic environment, and we anticipate continued “risk on/risk off” periods for the foreseeable future. Like previous periods, we anticipate that macro events will likely continue having significant influence on Fund performance.
Performance driven by stock selection at both a sector and country level
The managed volatility investment process takes advantage of the fact that stocks can have complementary risk characteristics and creates a portfolio with lower expected risk than the benchmark index over time.
The Fund’s performance relative to the benchmark index was primarily due to stock selection. During the reporting period, lower risk, higher quality stocks were initially rewarded with the Fund outperforming on a cumulative basis from the December to April time period. This phenomenon reversed sharply in May, whereby lower risk stocks with higher dividend yields underperformed by a wide margin in response to the Federal Reserve comments about reducing its quantitative easing program.
From a county perspective, the Fund’s more conservative stock selections in the United States, Canada and Hong Kong offset results given the higher risk payoff at the end of the reporting period. Conversely, underweight to the United Kingdom and Australia positively impacted results versus the benchmark index.
The primary sector detractor was Financials, due to returns which lagged the benchmark. Bottom-up selections in Utilities and Health Care sectors also lowered relative results for the reporting period. Meanwhile strong stock selection in Information Technology and an underweight allocation to the Energy sector added to relative results for the period.
Average Annual Total Return for the period ended May 31, 2013
| 6 Month* | 1 Year | Since Inception† | ||||||||||||
| AllianzGI Global Managed Volatility Fund Class A | 7.64% | 17.35% | 13.21% | |||||||||||
| AllianzGI Global Managed Volatility Fund Class A (adjusted) | 1.72% | 10.90% | 8.88% | ||||||||||
| AllianzGI Global Managed Volatility Fund Class C | 7.22% | 16.43% | 12.34% | |||||||||||
| AllianzGI Global Managed Volatility Fund Class C (adjusted) | 6.22% | 15.43% | 12.34% | ||||||||||
| AllianzGI Global Managed Volatility Fund Class D | 7.66% | 17.37% | 13.22% | ||||||||||
| AllianzGI Global Managed Volatility Fund Class P | 7.82% | 17.60% | 13.48% | ||||||||||
| AllianzGI Global Managed Volatility Fund Institutional Class | 7.83% | 17.75% | 13.57% | ||||||||||
| MSCI World Index | 13.26% | 27.77% | 22.52% | ||||||||||
| Lipper Global Multi-Cap Value Funds Average | 14.88% | 27.03% | 16.71% | |||||||||||
† The Fund began operations on 12/19/11. Benchmark return comparisons began on the fund inception date. Lipper performance comparisons began on 12/31/11.
* Cumulative return.
Performance quoted represents past performance and is no guarantee of future results. Current performance may be lower or higher than performance shown. For performance current to the most recent month-end, visit our website at us.allianzgi.com. Investment return and the principal value will fluctuate. Shares may be worth more or less than original cost when redeemed. The adjusted returns take into account the maximum initial sales charge of 5.50% on Class A shares and the contingent deferred sales charge (CDSC) of 1% on Class C shares, which may apply to shares redeemed during the first year of ownership. Returns do not reflect deduction of taxes that a shareholder would pay on fund distributions or redemption of fund shares. See pages 94 and 95 for more information. The Fund’s gross expense ratios are 2.55% for Class A shares, 3.20% for Class C shares, 2.44% for Class D shares, 2.27% for Class P shares and 2.30% for Institutional Class shares. These ratios do not include an expense reduction, contractually guaranteed through at least 3/31/14. The Fund’s expense ratios net of this reduction are 0.95% for Class A shares, 1.63% for Class C shares, 0.88% for Class D shares, 0.70% for Class P shares and 0.60% for Institutional Class shares. Expense ratio information is as of the Fund’s current prospectus dated April 1, 2013, as supplemented to date.
| 62 | May 31, 2013 | | Semiannual Report |
Table of Contents
Unaudited
AllianzGI Global Managed Volatility Fund (formerly Allianz AGIC Global Managed Volatility Fund) (cont’d)
Cumulative Returns Through May 31, 2013
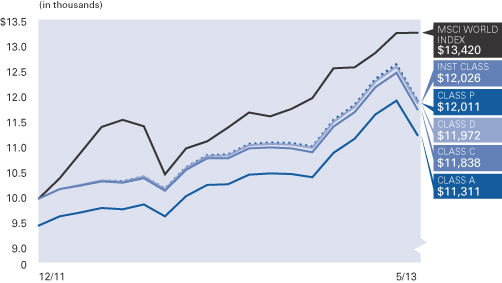
Country Allocation (as of May 31, 2013)
| United States | 54.2% | |||
| Canada | 14.0% | |||
| Japan | 11.5% | |||
| China | 7.1% | |||
| Hong Kong | 5.2% | |||
| Singapore | 2.8% | |||
| Switzerland | 1.7% | |||
| Israel | 1.4% | |||
| Other | 0.6% | |||
| Cash & Equivalents — Net | 1.5% |
| Shareholder Expense Example | Actual Performance | |||||||||
| Class A | Class C | Class D | Class P | Institutional Class | ||||||
| Beginning Account Value (12/1/12) | $1,000.00 | $1,000.00 | $1,000.00 | $1,000.00 | $1,000.00 | |||||
| Ending Account Value (5/31/13) | $1,076.40 | $1,072.20 | $1,076.60 | $1,078.20 | $1,078.30 | |||||
| Expenses Paid During Period | $4.92 | $8.63 | $4.71 | $3.63 | $3.11 | |||||
| Hypothetical Performance | ||||||||||
| (5% return before expenses) | ||||||||||
| Class A | Class C | Class D | Class P | Institutional Class | ||||||
| Beginning Account Value (12/1/12) | $1,000.00 | $1,000.00 | $1,000.00 | $1,000.00 | $1,000.00 | |||||
| Ending Account Value (5/31/13) | $1,020.19 | $1,016.60 | $1,020.39 | $1,021.44 | $1,021.94 | |||||
| Expenses Paid During Period | $4.78 | $8.40 | $4.58 | $3.53 | $3.02 | |||||
For each class of the Fund, expenses (net of fee waiver and reimbursement, if any) are equal to the annualized expense ratio for the class (0.95% for Class A, 1.67% for Class C, 0.91% for Class D, 0.70% for Class P and 0.60% for Institutional Class), multiplied by the average account value over the period, multiplied by 182/365.
| Semiannual Report | | May 31, 2013 | 63 |
Table of Contents
Unaudited
AllianzGI Global Water Fund (formerly Allianz RCM Global Water Fund)
For the period of December 1, 2012, through May 31, 2013, as provided by Andreas Fruschki, CFA, Portfolio Manager.
Portfolio Insights
For the reporting period ended May 31, 2013, Class A shares at NAV of the AllianzGI Global Water Fund (the “Fund”) returned 10.28% underperforming the S&P Global Water Index (the “benchmark index”) which returned 13.76%.
The beginning of 2013 was marked by a return of M&A speculation around private water utilities in the UK, underscoring the attractiveness of stable growing infrastructure assets in times of low yields from government bonds. Fund holdings United Utilities Group PLC and Pennon Group PLC both benefited from the news of an acquisition offer for UK water utility Severn Trent PLC.
Water monitoring and efficiency around water management and usage within industrial production continued to be an attractive theme. Over the period, we added exposure to this sector by establishing a new position in the Swiss market leader in water actuators, Belimo Holding
AG. The company expects growth in its major European markets in 2013, even as the financial crisis limits government spending.
Industrial holdings IDEX Corp. and Ametek Inc. were also top contributors during the period.
Conversely, our sizeable cash position over the period detracted from returns as global equity markets continued their steady march upwards.
In terms of laggards, shares of Austrian-based Andritz AG fell as the company preannounced that it would miss Q1 earnings estimates. The hydro-turbine manufacturer stated one of its projects in Brazil suffered from unexpected cost overruns.
Additionally, underweighting Asian companies Beijing Enterprises Water Group Ltd., Daiseki Co. Ltd., and Ebara Corp. also detracted from active returns. We have since built positions in these companies.
Looking forward, we believe water as a structural, long-term infrastructure and upgrading theme remains a valid and attractive story as water scarcity driven by agriculture, industrialization, automation, mining, shale gas drilling, urbanization and stricter water quality regulations continue to drive growth. In seeking to leverage this growth in the Fund, we have added positions in several emerging market water utilities such as Chilean Aguas Andinas and Brazilian Companhia de Saneamento de Minas Gerais.
We also remain comfortable with our general preference for high cash-return businesses with leading market positions and high barriers to entry. We see opportunities in the US water infrastructure market as we expect municipalities to reverse the trend of underinvestment over the past several years. Finally, there should be incremental demand for water projects with improvements in the US residential housing market.
Average Annual Total Return for the period ended May 31, 2013
| 6 Month* | 1 Year | 5 Year | Since Inception† | |||||||||||||||
| AllianzGI Global Water Fund Class A | 10.28% | 22.06% | 2.16% | 3.14% | ||||||||||||||
| AllianzGI Global Water Fund Class A (adjusted) | 4.22% | 15.35% | 1.01% | 2.01% | |||||||||||||
| AllianzGI Global Water Fund Class C | 9.88% | 21.12% | 1.38% | 2.36% | ||||||||||||||
| AllianzGI Global Water Fund Class C (adjusted) | 8.88% | 20.12% | 1.38% | 2.36% | |||||||||||||
| AllianzGI Global Water Fund Class D | 10.25% | 22.04% | 2.13% | 3.11% | |||||||||||||
| AllianzGI Global Water Fund Class P | 10.41% | 22.28% | 2.39% | 3.36% | |||||||||||||
| AllianzGI Global Water Fund Institutional Class | 10.36% | 22.42% | 2.48% | 3.45% | |||||||||||||
| S&P Global Water Index | 13.76% | 27.07% | 3.17% | 4.91% | |||||||||||||
| Lipper Global Natural Resources Funds Average | 5.76% | 15.00% | –7.94% | –4.14% | ||||||||||||||
† The Fund began operations on 3/31/08. Benchmark return comparisons began on the fund inception date. Lipper performance comparisons began on 3/31/08.
* Cumulative return.
Performance quoted represents past performance and is no guarantee of future results. Current performance may be lower or higher than performance shown. For performance current to the most recent month-end, visit our website at us.allianzgi.com. Investment return and the principal value will fluctuate. Shares may be worth more or less than original cost when redeemed. The adjusted returns take into account the maximum initial sales charge of 5.50% on Class A shares and the contingent deferred sales charge (CDSC) of 1% on Class C shares, which may apply to shares redeemed during the first year of ownership. Returns do not reflect deduction of taxes that a shareholder would pay on fund distributions or redemption of fund shares. See pages 94 and 95 for more information. The Fund’s gross expense ratios are 1.60% for Class A shares, 2.41% for Class C shares, 2.25% for Class D shares, 1.47% for Class P shares and 1.29% for Institutional Class shares. These ratios do not include an expense reduction, contractually guaranteed through at least 3/31/14. The Fund’s expense ratios net of this reduction are 1.57% for Class A shares, 2.33% for Class C shares, 1.60% for Class D shares, 1.40% for Class P shares and 1.29% for Institutional Class shares. Expense ratio information is as of the Fund’s current prospectus dated April 1, 2013, as supplemented to date.
| 64 | May 31, 2013 | | Semiannual Report |
Table of Contents
Unaudited
AllianzGI Global Water Fund (formerly Allianz RCM Global Water Fund) (cont’d)
Cumulative Returns Through May 31, 2013
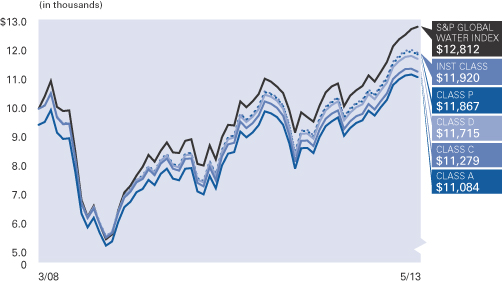
Country Allocation (as of May 31, 2013)
| United States | 33.4% | |||
| United Kingdom | 17.8% | |||
| Switzerland | 13.3% | |||
| France | 5.9% | |||
| Austria | 4.1% | |||
| Brazil | 3.6% | |||
| China | 3.6% | |||
| Sweden | 3.3% | |||
| Other | 7.7% | |||
| Cash & Equivalents — Net | 7.3% |
| Shareholder Expense Example | Actual Performance | |||||||||
| Class A | Class C | Class D | Class P | Institutional Class | ||||||
| Beginning Account Value (12/1/12) | $1,000.00 | $1,000.00 | $1,000.00 | $1,000.00 | $1,000.00 | |||||
| Ending Account Value (5/31/13) | $1,102.80 | $1,098.80 | $1,102.50 | $1,104.10 | $1,103.60 | |||||
| Expenses Paid During Period | $7.97 | $11.88 | $7.81 | $6.82 | $6.29 | |||||
| Hypothetical Performance | ||||||||||
| (5% return before expenses) | ||||||||||
| Class A | Class C | Class D | Class P | Institutional Class | ||||||
| Beginning Account Value (12/1/12) | $1,000.00 | $1,000.00 | $1,000.00 | $1,000.00 | $1,000.00 | |||||
| Ending Account Value (5/31/13) | $1,017.35 | $1,013.61 | $1,017.50 | $1,018.45 | $1,018.95 | |||||
| Expenses Paid During Period | $7.64 | $11.40 | $7.49 | $6.54 | $6.04 | |||||
For each class of the Fund, expenses (net of fee waiver and reimbursement, if any) are equal to the annualized expense ratio for the class (1.52% for Class A, 2.27% for Class C, 1.49% for Class D, 1.30% for Class P and 1.20% for Institutional Class), multiplied by the average account value over the period, multiplied by 182/365.
| Semiannual Report | | May 31, 2013 | 65 |
Table of Contents
Unaudited
AllianzGI High Yield Bond Fund (formerly Allianz AGIC High Yield Bond Fund)
For the period of December 1, 2012 through May 31, 2013, as provided by Doug Forsyth, CFA, Portfolio Manager.
Portfolio Insights
For the reporting period ended May 31, 2013, Class A shares at NAV of the AllianzGI High Yield Bond Fund (the “Fund”) returned 6.22% outperforming the BofA Merrill Lynch High Yield Master II Index (the “benchmark index”) which returned 5.90%.
The high-yield bond market was higher over the reporting period, posting another solid gain for investors.
Many of the factors contributing to the period’s high-yield market return were seen throughout 2012. The primary reason for continued strength in the market was, and is, the lack of credit risk. Solid balance sheets were confirmed in the reporting season. The new-issues market produced a lower semi-annual interest expense burden for issuers, and again proved the widespread availability of new capital. Furthermore, the majority of the new issues’ use-of-proceeds continued to be refinancing, which helps eliminate near-term amortization risk in the market. A consistently accommodative global monetary policy has continued to offset any headline macroeconomic softness. In addition, the lack of high-single-digit income alternatives has kept investors engaged.
Last year, a unique return characteristic was observed in the market. Typically, bullish
environments like the one seen in 2012 have rewarded the most aggressive investors. That was the case in 2012, with the CCC category return (the lowest-rated, highest-yield issuers) leading all rating categories. In the same environment, historically, the BB category (the highest-rated/lowest-yield issuers) would then underperform—but in 2012, the BB category also performed well. As was noted then, that situation has not been sustainable in past cycles and was likely to revert to a more conventional return relationship. This occurred in 2013, where the CCC rated issuers were up 7.96% on average and the BB rated issuers were only up 2.99%. Investors were spooked in January and again in May, and they reacted by selling narrow-spread/lower-yield issues.
Against this back drop, new high-yield issuance was robust and on pace to surpass last year’s record-setting level. Year-to-date through May, issuance totaled $205 billion with more than 64% of all proceeds used for refinancing.
Performance
The Fund rallied with the market in the reporting period. The attribution for the period was broad and included several positive single-name performers from a variety of industries. Most importantly, there were no material underperformers across the entire Fund. While the lack of loss incurred from any holding is the
goal for every period, that objective has proven to be difficult to achieve. Shock events can occur in the high-yield market, but earnings and fundamental operational performance can be more predictable. The Fund was helped by the lack of issuers held that materially underperformed earnings expectations.
Issue selection in many industries was positive and helped relative performance. In particular, holdings in the Homebuilders/Real Estate, Energy and Publishing/Printing industries benefited results. Positive security-specific performance in Homebuilders/Real Estate contributed on a relative basis. The Fund’s lower-than-benchmark weight in Energy and stronger returns from individual issues aided performance. In addition, an overweight and positive security selection in Publishing/Printing helped.
Industry exposure that hurt relative performance in the period included Services, Banking and Food & Drug Retail. Particularly, negative relative performance in Services more than offset any benefit from the industry overweight. The Fund’s lower-than-benchmark weight in the Banking industry and weaker returns from individual issues hindered performance on a relative basis. Additionally, negative security selection in the Food & Drug Retail industry hampered relative returns.
Average Annual Total Return for the period ended May 31, 2013
| 6 Month* | 1 Year | 5 Year | 10 Year | Since Inception† | ||||||||||||||||||
| AllianzGI High Yield Bond Fund Class A | 6.22% | 13.50% | 9.91% | 8.45% | 8.24% | |||||||||||||||||
| AllianzGI High Yield Bond Fund Class A (adjusted) | 2.24% | 9.25% | 9.07% | 8.03% | 8.00% | ||||||||||||||||
| AllianzGI High Yield Bond Fund Class C | 5.82% | 12.56% | 9.13% | 7.66% | 7.45% | |||||||||||||||||
| AllianzGI High Yield Bond Fund Class C (adjusted) | 4.82% | 11.56% | 9.13% | 7.66% | 7.45% | ||||||||||||||||
| AllianzGI High Yield Bond Fund Class D | 6.18% | 13.38% | 9.93% | 8.46% | 8.25% | ||||||||||||||||
| AllianzGI High Yield Bond Fund Class R | 6.07% | 13.09% | 9.64% | 8.18% | 7.97% | ||||||||||||||||
| AllianzGI High Yield Bond Fund Class P | 6.38% | 13.75% | 10.12% | 8.63% | 8.42% | ||||||||||||||||
| AllianzGI High Yield Bond Fund Institutional Class | 6.44% | 13.85% | 10.37% | 8.93% | 8.74% | ||||||||||||||||
| AllianzGI High Yield Bond Fund Administrative Class | 6.23% | 13.59% | 9.95% | 8.47% | 8.25% | |||||||||||||||||
| BofA Merrill Lynch High Yield Master II Index | 5.90% | 14.82% | 10.62% | 9.34% | 7.73% | ||||||||||||||||
| Lipper High Yield Funds Average | 5.50% | 13.97% | 8.76% | 8.07% | 6.66% | |||||||||||||||||
† The Fund began operations on 7/31/96. Benchmark return comparisons began on the fund inception date. Lipper performance comparisons began on 7/31/96.
* Cumulative return.
Performance quoted represents past performance and is no guarantee of future results. Current performance may be lower or higher than performance shown. For performance current to the most recent month-end, visit our website at us.allianzgi.com. Investment return and the principal value will fluctuate. Shares may be worth more or less than original cost when redeemed. The adjusted returns take into account the maximum initial sales charge of 3.75% on Class A shares and the contingent deferred sales charge (CDSC) of 1% on Class C shares, which may apply to shares redeemed during the first year of ownership. Returns do not reflect deduction of taxes that a shareholder would pay on fund distributions or redemption of fund shares. See pages 94 and 95 for more information. The Fund’s gross expense ratios are 0.90% for Class A shares, 1.68% for Class C shares, 1.07% for Class D shares, 1.25% for Class R shares, 0.79% for Class P shares, 0.63% for Institutional Class shares and 1.14% for Administrative Class shares. These ratios do not include an expense reduction, contractually guaranteed through at least 3/31/14. The Fund’s expense ratios net of this reduction are 1.00% for Class D shares, 1.15% for Class R shares and 0.90% for Administrative Class shares. Expense ratio information is as of the Fund’s current prospectus dated April 1, 2013, as supplemented to date.
| 66 | May 31, 2013 | | Semiannual Report |
Table of Contents
Unaudited
AllianzGI High Yield Bond Fund (formerly Allianz AGIC High Yield Bond Fund) (cont’d)
Cumulative Returns Through May 31, 2013
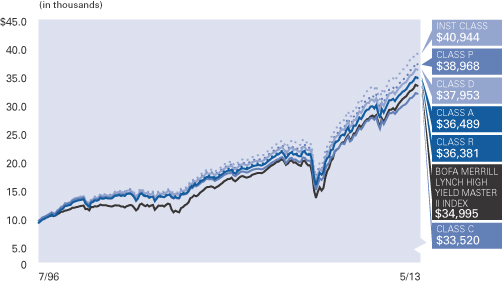
Industry Allocation (as of May 31, 2013)
| Telecommunications | 11.8% | |||
| Oil & Gas | 11.5% | |||
| Commercial Services | 9.9% | |||
| Diversified Financial Services | 7.1% | |||
| Retail | 6.7% | |||
| Media | 5.4% | |||
| Auto Components | 5.3% | |||
| Home Builders | 3.8% | |||
| Other | 35.7% | |||
| Cash & Equivalents — Net | 2.8% |
Moody’s Ratings* (as of May 31, 2013)
(as a % of total investments)
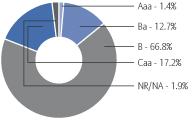
| * | The letter ratings are provided to indicate the creditworthiness of the underlying bonds in the portfolio and generally range from AAA (highest) to D (lowest). Ratings do not apply to the Fund. |
| Shareholder Expense Example | Actual Performance | |||||||||||||
| Class A | Class C | Class D | Class R | Class P | Institutional Class | Administrative Class | ||||||||
| Beginning Account Value (12/1/12) | $1,000.00 | $1,000.00 | $1,000.00 | $1,000.00 | $1,000.00 | $1,000.00 | $1,000.00 | |||||||
| Ending Account Value (5/31/13) | $1,062.20 | $1,058.20 | $1,061.80 | $1,060.70 | $1,063.80 | $1,064.40 | $1,062.30 | |||||||
| Expenses Paid During Period | $4.42 | $8.42 | $4.68 | $5.91 | $3.55 | $3.09 | $4.37 | |||||||
| Hypothetical Performance | ||||||||||||||
| (5% return before expenses) | ||||||||||||||
| Class A | Class C | Class D | Class R | Class P | Institutional Class | Administrative Class | ||||||||
| Beginning Account Value (12/1/12) | $1,000.00 | $1,000.00 | $1,000.00 | $1,000.00 | $1,000.00 | $1,000.00 | $1,000.00 | |||||||
| Ending Account Value (5/31/13) | $1,020.64 | $1,016.75 | $1,020.39 | $1,019.20 | $1,021.49 | $1,021.94 | $1,020.69 | |||||||
| Expenses Paid During Period | $4.33 | $8.25 | $4.58 | $5.79 | $3.48 | $3.02 | $4.28 | |||||||
For each class of the Fund, expenses (net of fee waiver and reimbursement, if any) are equal to the annualized expense ratio for the class (0.86% for Class A, 1.64% for Class C, 0.91% for Class D, 1.15% for Class R, 0.69% for Class P, 0.60% for Institutional Class and 0.85% for Administrative Class), multiplied by the average account value over the period, multiplied by 182/365.
| Semiannual Report | | May 31, 2013 | 67 |
Table of Contents
Unaudited
AllianzGI International Small-Cap Fund (formerly Allianz RCM International Small-Cap Fund)
For the period of December 1, 2012 through May 31, 2013, as provided by Andrew Neville, Portfolio Manager.
Portfolio Insights
For the reporting period ended May 31, 2013, Class A shares at NAV of the AllianzGI International Small-Cap Fund (the “Fund”) returned 16.75% outperforming the MSCI World ex US Small-Cap Index (the “benchmark index”) which returned 11.85%.
International Smaller Companies posted a strong positive return which was primarily driven by strong performance from Japanese and European smaller-cap companies. Gains were however offset by a decline in Asian ex Japan smaller companies.
The reporting period began positively with the European Union announcing its first steps towards a banking union; increased Chinese growth and the new Japanese Prime Minister Abe following through on campaign pledges to aggressively stimulate the economy. However, European smaller-cap companies were held back during February and March as political uncertainty rose in Italy due to the indecisive election where a large share of the Italian vote was won by anti-austerity parties. In addition, fraught negotiations to bailout Cyprus resulted in private bank deposits being targeted for the first time in the European sovereign debt crisis. Furthermore, the European economy unexpectedly deteriorated negating hopes of a near term revival which was confirmed by poor company reports. However, anticipation of an interest cut and a relaxing austerity program to stimulate growth
revived European smaller-cap companies to the end of the reporting period. In Japan, the earlier than expected appointment of the Bank of Japan’s Governor Kuroda, followed quickly by an aggressive easing policy and the start of structural reforms by Prime Minister Abe, drove Japanese smaller-cap companies strongly upwards. Following this strong performance, comments by the Fed chairman Bernanke suggesting tapering quantitative easing caused Japanese smaller-cap companies to pull back at the end of the reporting period. Concerns about a slowing economy in China following the leadership change caused Asian (ex Japan) smaller companies to give up all gains made during the reporting period during May.
Stock selection was the main driver of the Fund’s outperformance versus the benchmark index led by holdings in the Materials, Industrials and Financial sectors though in part offset by holdings in the Consumer Discretionary sector.
Sector allocation was also positive towards the outperformance versus the benchmark index led by the overweight in Information Technology and the underweight in Materials whilst the underweight in the Financials sector detracted.
Geographically, stock selection within Japan was strong though more than offset by detrimental stock selection in Sweden, Germany and the United
Kingdom. Being overweight China and underweight Canada and Australia benefitted the Fund offset by being overweight Germany and Norway.
During the reporting period, the Fund’s largest overweights relative to the benchmark index were in Industrials followed closely by Information Technology whilst the largest underweights were in Financials followed by Materials. Geographically the largest overweights were in China and Germany whilst the largest underweights were in Canada and Australia.
The strongest stock contributors to performance were Sunny Optical Technologies and Tadano offset in part by China Machinery Engineering and Chiyoda which detracted. Sunny Optical Technology, a Chinese optical component maker for mobile phone cameras, is benefitting from the strong growth of smartphones into China and for Samsung emerging market smartphones. Tadano, a Japanese manufacturer of cranes, is seeing rising demand in Japan from post-quake reconstruction and in the US and Middle East energy industries. China Machinery Engineering, a Chinese power plant construction company, fell back from a strong IPO whilst Chiyoda, a Japanese plant engineering company, struggled due to sales delays in LNG projects.
Average Annual Total Return for the period ended May 31, 2013
| 6 Month* | 1 Year | 5 Year | 10 Year | Since Inception† | ||||||||||||||||||
| AllianzGI International Small-Cap Fund Class A | 16.75% | 31.43% | 2.05% | 13.43% | 12.89% | |||||||||||||||||
| AllianzGI International Small-Cap Fund Class A (adjusted) | 10.32% | 24.21% | 0.90% | 12.79% | 12.48% | ||||||||||||||||
| AllianzGI International Small-Cap Fund Class C | 16.32% | 30.44% | 1.29% | 12.59% | 12.05% | |||||||||||||||||
| AllianzGI International Small-Cap Fund Class C (adjusted) | 15.32% | 29.44% | 1.29% | 12.59% | 12.05% | ||||||||||||||||
| AllianzGI International Small-Cap Fund Class D | 16.75% | 31.38% | 2.04% | 13.42% | 12.89% | ||||||||||||||||
| AllianzGI International Small-Cap Fund Class R | 16.59% | 31.09% | 1.79% | 13.14% | 12.61% | ||||||||||||||||
| AllianzGI International Small-Cap Fund Class P | 16.82% | 31.60% | 2.30% | 13.72% | 13.25% | ||||||||||||||||
| AllianzGI International Small-Cap Fund Institutional Class | 16.85% | 31.69% | 2.42% | 13.87% | 13.34% | ||||||||||||||||
| AllianzGI International Small-Cap Fund Administrative Class | 16.74% | 31.28% | 2.01% | 13.41% | 12.88% | |||||||||||||||||
| MSCI World ex US Small Cap Index | 11.85% | 26.90% | 1.25% | 11.26% | 7.68% | ||||||||||||||||
| S&P Developed Ex-U.S. Small Cap Growth Index | 9.96% | 26.09% | 0.19% | 10.55% | 6.26% | ||||||||||||||||
| MSCI EAFE Small Cap | 14.24% | 30.53% | 1.49% | 11.37% | 7.55% | ||||||||||||||||
| Lipper International Small/Mid-Cap Growth Funds Average | 12.03% | 28.45% | 1.93% | 12.36% | 8.99% | |||||||||||||||||
† The Fund began operations on 12/31/97. Benchmark return comparisons began on the fund inception date. Lipper performance comparisons began on 12/31/97.
* Cumulative return.
Performance quoted represents past performance and is no guarantee of future results. Current performance may be lower or higher than performance shown. For performance current to the most recent month-end, visit our website at us.allianzgi.com. Investment return and the principal value will fluctuate. Shares may be worth more or less than original cost when redeemed. The adjusted returns take into account the maximum initial sales charge of 5.50% on Class A shares and the contingent deferred sales charge (CDSC) of 1% on Class C shares, which may apply to shares redeemed during the first year of ownership. Returns do not reflect deduction of taxes that a shareholder would pay on fund distributions or redemption of fund shares. See pages 94 and 95 for more information. The Fund’s gross expense ratios are 1.76% for Class A shares, 2.37% for Class C shares, 5.66% for Class D shares, 1.90% for Class R shares, 1.52% for Class P shares, 1.38% for Institutional Class shares and 1.64% for Administrative Class shares. These ratios do not include an expense reduction, contractually guaranteed through at least 3/31/14. The Fund’s expense ratios net of this reduction are 1.45% for Class A shares, 2.20% for Class C shares, 1.45% for Class D shares, 1.70% for Class R shares, 1.30% for Class P shares, 1.21% for Institutional Class shares and 1.45% for Administrative Class shares. Expense ratio information is as of the Fund’s current prospectus dated April 1, 2013, as supplemented to date.
| 68 | May 31, 2013 | | Semiannual Report |
Table of Contents
Unaudited
AllianzGI International Small-Cap Fund (formerly Allianz RCM International Small-Cap Fund) (cont’d)
Cumulative Returns Through May 31, 2013
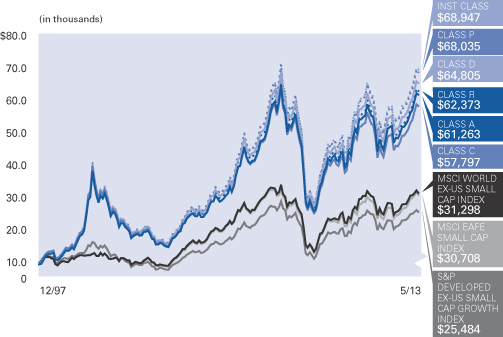
Country Allocation (as of May 31, 2013)
| Japan | 26.5% | |||
| United Kingdom | 10.9% | |||
| Germany | 8.4% | |||
| Denmark | 7.2% | |||
| China | 5.0% | |||
| Sweden | 4.3% | |||
| Hong Kong | 4.1% | |||
| Italy | 3.9% | |||
| Other | 27.3% | |||
| Cash & Equivalents — Net | 2.4% |
| Shareholder Expense Example | Actual Performance | |||||||||||||
| Class A | Class C | Class D | Class R | Class P | Institutional Class | Administrative Class | ||||||||
| Beginning Account Value (12/1/12) | $1,000.00 | $1,000.00 | $1,000.00 | $1,000.00 | $1,000.00 | $1,000.00 | $1,000.00 | |||||||
| Ending Account Value (5/31/13) | $1,167.50 | $1,163.20 | $1,167.50 | $1,165.90 | $1,168.20 | $1,168.50 | $1,167.40 | |||||||
| Expenses Paid During Period | $7.84 | $11.87 | $7.84 | $9.18 | $7.03 | $6.49 | $7.84 | |||||||
| Hypothetical Performance | ||||||||||||||
| (5% return before expenses) | ||||||||||||||
| Class A | Class C | Class D | Class R | Class P | Institutional Class | Administrative Class | ||||||||
| Beginning Account Value (12/1/12) | $1,000.00 | $1,000.00 | $1,000.00 | $1,000.00 | $1,000.00 | $1,000.00 | $1,000.00 | |||||||
| Ending Account Value (5/31/13) | $1,017.70 | $1,013.96 | $1,017.70 | $1,016.45 | $1,018.45 | $1,018.95 | $1,017.70 | |||||||
| Expenses Paid During Period | $7.29 | $11.05 | $7.29 | $8.55 | $6.54 | $6.04 | $7.29 | |||||||
For each class of the Fund, expenses (net of fee waiver and reimbursement, if any) are equal to the annualized expense ratio for the class (1.45% for Class A, 2.20% for Class C, 1.45% for Class D, 1.70% for Class R, 1.30% for Class P, 1.20% for Institutional Class and 1.45% for Administrative Class), multiplied by the average account value over the period, multiplied by 182/365.
| Semiannual Report | | May 31, 2013 | 69 |
Table of Contents
Unaudited
AllianzGI Micro Cap Fund (formerly Allianz AGIC Micro Cap Fund)
For the period of December 1, 2012 through May 31, 2013, as provided by Robert Marren, Portfolio Manager.
Portfolio Insights
For the reporting period ended May 31, 2013, Class A shares at NAV of the AllianzGI Micro Cap Fund (the “Fund”) returned 20.27% underperforming the Russell Microcap Growth Index (the “benchmark index”) which returned 23.09%.
The stock market was higher over the reporting period, with major US equity indices recording all-time highs in the period.
Initially, the market moved higher with investors applauding the fiscal budget deal. As the year progressed, healthy fourth-quarter corporate profits, strong US equity asset flows and signs of stabilization in Europe helped drive additional gains. Other factors boosting investor sentiment included M&A and shareholder-friendly announcements, as well as continued accommodative global central bank policies. Sequestration fears and hawkish Fed commentary also failed to disrupt the market’s upward trajectory. The Cyprus banking crisis made headlines, however investor reaction in the
US was negligible. Indeed, the market’s strength was nearly unwavering.
In April, disappointing global economic data and signs of a softening labor market in the US overshadowed healthy first-quarter corporate earnings and pressured stocks. Market weakness was temporary, however. Stocks rebounded sharply on better-than-expected economic reports and continued to advance as interest rates spiked. In addition, some reallocation of cash into equities helped fuel demand for stocks.
By mid-May, the market became fixated on the timing of stimulus tapering. Comments from Fed Chairman Ben Bernanke capped the market’s ascent and gave way to increased stock market volatility into the end of the reporting period.
Against this backdrop, nearly all sectors within the Russell Microcap Growth Index posted a gain in the reporting period. Consumer Discretionary, Industrials and Health Care were the strongest-performing sectors followed by Financials and
Information Technology. In contrast, the Energy sector declined during the period. Utilities stocks closed higher, but significantly underperformed the overall universe.
Performance
The Fund rallied with the market in the reporting period. Strength was evident in a variety of holdings and sectors. From an attribution perspective, negative security selection was the primary driver of underperformance relative to the benchmark index whereas asset weighting effects were negligible in comparison. In particular, stock picking in the Consumer Discretionary, Health Care and Information Technology sectors hampered relative performance. Conversely, security selection within the Telecommunication Services, Energy and Industrials sectors positively impacted relative returns. Separately, an overweight in Financials and an underweight in Health Care hindered performance, but was partially offset by an overweight in Industrials.
Average Annual Total Return for the period ended May 31, 2013
| 6 Month* | 1 Year | 5 Year | 10 Year | Since Inception† | ||||||||||||||||||
| AllianzGI Micro Cap Fund Class A | 20.27% | 31.59% | 7.15% | 10.17% | 11.15% | |||||||||||||||||
| AllianzGI Micro Cap Fund Class A (adjusted)* | 13.65% | 24.36% | 5.95% | 9.55% | 10.80% | ||||||||||||||||
| AllianzGI Micro Cap Fund Class P | 20.47% | 31.94% | 7.37% | 10.41% | 11.39% | ||||||||||||||||
| AllianzGI Micro Cap Fund Institutional Class | 20.48% | 32.04% | 7.50% | 10.53% | 11.51% | ||||||||||||||||
| Russell Microcap Growth Index | 23.09% | 33.57% | 7.24% | 7.85% | 6.05% | ||||||||||||||||
| Lipper Small-Cap Core Funds Average | 19.01% | 29.25% | 6.61% | 9.76% | 9.86% | |||||||||||||||||
† The Fund began operations on 7/12/95. Benchmark return comparisons began on the fund inception date. Lipper performance comparisons began on 6/30/95.
* Cumulative return.
Performance quoted represents past performance and is no guarantee of future results. Current performance may be lower or higher than performance shown. For performance current to the most recent month-end, visit our website at us.allianzgi.com. Investment return and the principal value will fluctuate. Shares may be worth more or less than original cost when redeemed. The adjusted returns take into account the maximum initial sales charge of 5.50% on Class A shares. Returns do not reflect deduction of taxes that a shareholder would pay on fund distributions or redemption of fund shares. See pages 94 and 95 for more information. The Fund’s gross expense ratios are 2.18% for Class A shares, 1.99% for Class P shares and 1.84% for Institutional Class shares. This ratio does not include an expense reduction, contractually guaranteed through at least 3/31/14. The Fund’s expense ratios net of this reduction are 1.80% for Class A shares, 1.63% for Class P shares and 1.54% for Institutional Class shares. Expense ratio information is as of the Fund’s current prospectus dated April 1, 2013, as supplemented to date.
| 70 | May 31, 2013 | | Semiannual Report |
Table of Contents
Unaudited
AllianzGI Micro Cap Fund (formerly Allianz AGIC Micro Cap Fund) (cont’d)
Cumulative Returns Through May 31, 2013
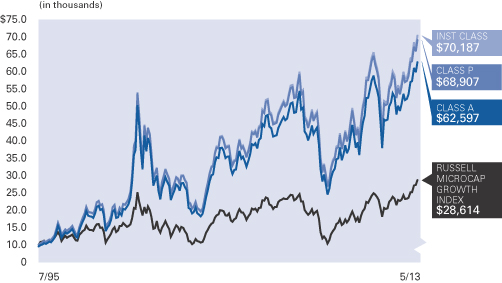
Industry Allocation (as of May 31, 2013 )
| Health Care Equipment & Supplies | 11.8% | |||
| Biotechnology | 5.6% | |||
| Internet Software & Services | 5.2% | |||
| Health Care Providers & Services | 4.8% | |||
| Road & Rail | 4.3% | |||
| Software | 3.8% | |||
| Trading Companies & Distributors | 3.6% | |||
| Semiconductors & Semiconductor Equipment | 3.3% | |||
| Other | 55.7% | |||
| Cash & Equivalents — Net | 1.9% |
| Shareholder Expense Example | Actual Performance | |||||
| Class A | Class P | Institutional Class | ||||
| Beginning Account Value (12/1/12) | $1,000.00 | $1,000.00 | $1,000.00 | |||
| Ending Account Value (5/31/13) | $1,202.70 | $1,204.70 | $1,204.80 | |||
| Expenses Paid During Period | $9.94 | $9.01 | $8.47 | |||
| Hypothetical Performance | ||||||
| (5% return before expenses) | ||||||
| Class A | Class P | Institutional Class | ||||
| Beginning Account Value (12/1/12) | $1,000.00 | $1,000.00 | $1,000.00 | |||
| Ending Account Value (5/31/13) | $1,015.91 | $1,016.75 | $1,017.25 | |||
| Expenses Paid During Period | $9.10 | $8.25 | $7.75 | |||
For each class of the Fund, expenses (net of fee waiver and reimbursement, if any) are equal to the annualized expense ratio for the class (1.81% for Class A, 1.64% for Class P and 1.54% for Institutional Class), multiplied by the average account value over the period, multiplied by 182/365.
| Semiannual Report | | May 31, 2013 | 71 |
Table of Contents
Unaudited
AllianzGI Multi-Asset Real Return Fund
From December 17, 2012 through May 31, 2013, as provided by Michael Stamos, CFA, Portfolio Manager.
Portfolio Insights
For the period from inception on December 17, 2012, Class A shares at NAV of the AllianzGI Multi-Asset Real Return Fund (the “Fund”) returned 0.93%, outperforming the Barclays US Government Inflation-Linked Bond Index (the “benchmark index”) which returned -4.43%.
Returns of assets deemed highly correlated to inflation varied during the period, with Global Real Estate Investments outperforming since the inception of the Fund. Real Estate Investments did experience a selloff in the latter part of the period, led by a selloff in the Japanese REIT market during the month of May. Global Resource Equities posted strong returns, led by Industrials which helped push global equities
higher. Commodities experienced negative returns during the period on concerns that growth in China will continue to slow and news that the Eurozone GDP rate remains in negative territory, dropping -0.2% in the first quarter of 2013. Treasury Inflation Protected Securities (TIPS) also experienced negative returns over the period due to investors continued appetite for equities due to the positive effects on continued easy monetary policy around the globe rather than any major inflationary fears.
Within the Fund, a relatively high exposure to Global Real Estate in the beginning of 2013 and a gradual reduction to the asset class in May helped returns during the period. The Fund
reduced exposure to Japanese Real Estate Investments in April which helped returns due to the aforementioned selloff in May. The Fund also allocated assets towards Global Resource Equities during the first four months of 2013 from Commodities which helped returns due to Global Resource Equities outperforming. In regards to TIPS, the Fund is focused on intermediate and longer-term maturities due to negative real yields at the front end of the TIPS curve.
As of May 31, 2013 the Fund held 35% of the portfolio in Global Real Estate Investments, 31% in Global Resource Equities, 18% in TIPS, 10% in Commodities and 6% in cash.
Cumulative Total Return for the period ended May 31, 2013
| Since Inception† | ||||||
| AllianzGI Multi-Asset Real Return Fund Class A | 0.93% | |||||
| AllianzGI Multi-Asset Real Return Fund Class A (adjusted) | –4.62% | ||||
| AllianzGI Multi-Asset Real Return Fund Class C | 0.60% | |||||
| AllianzGI Multi-Asset Real Return Fund Class C (adjusted) | –0.40% | ||||
| AllianzGI Multi-Asset Real Return Fund Class D | 0.93% | ||||
| AllianzGI Multi-Asset Real Return Fund Class P | 1.00% | ||||
| AllianzGI Multi-Asset Real Return Fund Institutional Class | 1.07% | ||||
| Barclays US Government Inflation-Linked Bond Index | –4.43% | ||||
| Lipper Global Flexible Port Fund Average | 3.90% | |||||
† The Fund began operations on 12/17/12. Benchmark return comparisons began on the fund inception date. Lipper performance comparisons began on 12/31/12.
Performance quoted represents past performance and is no guarantee of future results. Current performance may be lower or higher than performance shown. For performance current to the most recent month-end, visit our website at us.allianzgi.com. Investment return and the principal value will fluctuate. Shares may be worth more or less than original cost when redeemed. The adjusted returns take into account the maximum initial sales charge of 5.50% on Class A shares and the contingent deferred sales charge (CDSC) of 1% on Class C shares, which may apply to shares redeemed during the first year of ownership. Returns do not reflect deduction of taxes that a shareholder would pay on fund distributions or redemption of fund shares. See pages 94 and 95 for more information. The Fund’s gross expense ratios are 7.21% for Class A shares, 7.96% for Class C shares, 7.21% for Class D shares, 7.06% for Class P shares and 6.96% for Institutional Class shares. These ratios do not include an expense reduction, contractually guaranteed through at least 3/31/14. The Fund’s expense ratios net of this reduction are 0.93% for Class A shares, 1.68% for Class C shares, 0.93% for Class D shares, 0.78% for Class P shares and 0.68% for Institutional Class shares. Expense ratio information is as of the Fund’s current prospectus dated April 1, 2013, as supplemented to date.
| 72 | May 31, 2013 | | Semiannual Report |
Table of Contents
Unaudited
AllianzGI Multi-Asset Real Return Fund (cont’d)
Cumulative Returns Through May 31, 2013
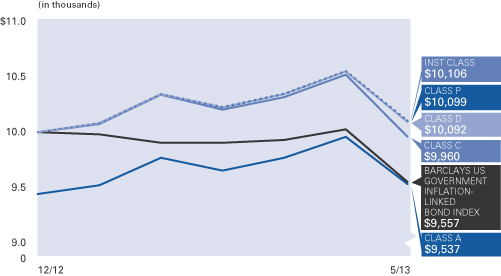
Country Allocation (as of May 31, 2013)
| United States | 77.0% | |||
| Hong Kong | 4.8% | |||
| Japan | 3.4% | |||
| Australia | 3.2% | |||
| France | 1.5% | |||
| Singapore | 1.4% | |||
| Canada | 1.3% | |||
| United Kingdom | 1.3% | |||
| Other | 0.5% | |||
| Cash & Equivalents — Net | 5.6% |
| Shareholder Expense Example | Actual Performance | |||||||||
| Class A | Class C | Class D | Class P | Institutional Class | ||||||
| Beginning Account Value (12/17/12) | $1,000.00 | $1,000.00 | $1,000.00 | $1,000.00 | $1,000.00 | |||||
| Ending Account Value (5/31/13) | $1,009.30 | $1,006.00 | $1,009.30 | $1,010.00 | $1,010.70 | |||||
| Expenses Paid During Period | $3.95 | $7.30 | $4.00 | $3.27 | $2.82 | |||||
| Hypothetical Performance | ||||||||||
| (5% return before expenses) | ||||||||||
| Class A | Class C | Class D | Class P | Institutional Class | ||||||
| Beginning Account Value (12/1/12) | $1,000.00 | $1,000.00 | $1,000.00 | $1,000.00 | $1,000.00 | |||||
| Ending Account Value (5/31/13) | $1,020.59 | $1,016.90 | $1,020.54 | $1,021.34 | $1,021.84 | |||||
| Expenses Paid During Period | $4.38 | $8.10 | $4.43 | $3.63 | $3.13 | |||||
The Fund commenced operations on December 17, 2012. The Actual expense example is based on the period since inception; the Hypothetical expense example is based on the period beginning December 1, 2012. If the Hypothetical expense example had been based on the period since inception, the Ending Account Value and Expenses Paid During Period would have been: $1,018.67 and $3.97, respectively, for Class A; $1,015.32 and $7.33, respectively, for Class C; $1,018.62 and $4.02, respectively, for Class D; $1,019.35 and $3.29, respectively, for Class P; and $1,019.80 and $2.83, respectively, for Institutional Class.
For each class of the Fund, expenses (net of fee waiver and reimbursement, if any) are equal to the annualized expense ratio for the class (0.87% for Class A, 1.61% for Class C, 0.88% for Class D, 0.72% for Class P and 0.62% for Institutional Class), multiplied by the average account value over the period, multiplied by 165/365 for the Actual expense example and 182/365 for the Hypothetical expense example. The expense ratio excludes the expenses of the Underlying Funds, which based upon the allocation of the Fund’s assets among the Underlying Funds are indirectly borne by the shareholders of the Fund.
| Semiannual Report | | May 31, 2013 | 73 |
Table of Contents
Unaudited
AllianzGI NFJ Emerging Markets Value Fund
For the period of December 18, 2012, through May 31, 2013, as provided by Morley Campbell CFA, Portfolio Manager.
Portfolio Insights
For the period from inception on December 18, 2012, Class A shares at NAV of the AllianzGI NFJ Emerging Markets Value Fund (the “Fund”) returned 5.41%, outperforming the MSCI Emerging Markets Index (the “benchmark index”) which returned -2.52% since the Fund’s inception.
The reporting period took place against a backdrop of sustained commitment to aggressive monetary policy by central banks around the globe. Indications of strength from the US housing and labor markets, as well as the bi-partisan cooperation that resulted in legislation to keep the government operational through September of 2013 brought some optimism to the market. However, international markets generally lagged US stocks as a stronger dollar year-to-date and instability out of Europe caused many international companies to struggle. Emerging countries generally did not keep pace with developed countries, partly due to concerns for growth prospects in China, flagging commodity prices, and expectations that the US Federal Reserve may tighten monetary policy. China accounts for approximately two-fifths of the world’s metals demand, and signs that the country’s growth may not be as strong as expected have disproportionately hurt many emerging countries. For example, in Chile and Peru, mining alone accounts for about one-fifth of economic output. China reported a year-over-year (y/y) slowing of GDP growth for the fourth quarter of
2012, and production for the first quarter of 2013 came in below expectations. Heightened uncertainty surrounding the timing of Fed “tapering” (i.e., beginning of a reduction in the amount of stimulus) toward the end of the reporting period caused investors to sell out of emerging-market currencies, bonds and stocks for most of May. This sell off of emerging market currencies included several significant price dips, including the South African rand and Brazil’s real, both of which slumped to four-year lows.
Dispersion among sector returns was notable within the benchmark index, as the weakest sector (Materials) had total returns of -18%, while the strongest sector (Information Technology) climbed 4%. Only four sectors generated positive returns for the period. The Materials, Energy, Telecommunication Services and Industrials sectors were the worst performing sectors. In contrast, the Information Technology, Health Care, Consumer Staples and Financials sectors generated the strongest results. On an MSCI country basis, the weakest returns were experienced by Peru, Czech Republic, Colombia and South Africa. Conversely, the strongest results were generated by the Philippines, Indonesia, Malaysia and Turkey.
Stock selection drove the Fund’s outperformance
The Fund’s outperformance versus the benchmark index was due to favorable stock
selection, though sector and country allocation were also positive. The Fund’s strong absolute returns were also notable during a period when benchmark index returns were negative.
Stock selection added value across all sectors, with the exception of Health Care.
By country, selection was strong in China and South Korea, but slightly offset by poor selection in India and the Philippines.
From a sector allocation perspective, an underweight in Materials and overweight in Consumer Discretionary contributed to results. Conversely, underweights in Consumer Staples and Financials detracted during the reporting period.
Overweights in Hong Kong and Turkey contributed to relative performance, while underweights in Malaysia and Taiwan muted results during the period.
Sector weight deviations are a result of NFJ’s bottom-up investment process. On average during the reporting period, the Fund’s largest overweights relative to the benchmark index were in the Consumer Discretionary and Utilities sectors, whereas the largest relative underweights were in the Financials and Materials sectors.
Cumulative Total Return for the period ended May 31, 2013
| Since Inception† | ||||||
AllianzGI NFJ Emerging Markets Value Fund Class A | 5.41% | |||||
| AllianzGI NFJ Emerging Markets Value Fund Class A (adjusted) | –0.39% | ||||
AllianzGI NFJ Emerging Markets Value Fund Class C | 5.07% | |||||
| AllianzGI NFJ Emerging Markets Value Fund Class C (adjusted) | 4.07% | ||||
| AllianzGI NFJ Emerging Markets Value Fund Class D | 5.47% | ||||
| AllianzGI NFJ Emerging Markets Value Fund Class P | 5.47% | ||||
| AllianzGI NFJ Emerging Markets Value Fund Institutional Class | 5.55% | ||||
| MSCI Emerging Markets Index | –2.52% | ||||
Lipper Emerging Markets Fund Average | –1.07% | |||||
† The Fund began operations on 12/18/12. Benchmark return comparisons began on the fund inception date. Lipper performance comparisons began on 12/31/12.
Performance quoted represents past performance and is no guarantee of future results. Current performance may be lower or higher than performance shown. For performance current to the most recent month-end, visit our website at us.allianzgi.com. Investment return and the principal value will fluctuate. Shares may be worth more or less than original cost when redeemed. The adjusted returns take into account the maximum initial sales charge of 5.50% on Class A shares and the contingent deferred sales charge (CDSC) of 1% on Class C shares, which may apply to shares redeemed during the first year of ownership. Returns do not reflect deduction of taxes that a shareholder would pay on fund distributions or redemption of fund shares. See pages 94 and 95 for more information. The Fund’s gross expense ratios are 13.36% for Class A shares, 14.11% for Class C shares, 13.36% for Class D shares, 13.21% for Class P shares and 13.11% for Institutional Class shares. These ratios do not include an expense reduction, contractually guaranteed through at least 3/31/14. The Fund’s expense ratios net of this reduction are 1.55% for Class A shares, 2.30% for Class C shares, 1.55% for Class D shares, 1.40% for Class P shares and 1.30% for Institutional Class shares. Expense ratio information is as of the Fund’s current prospectus dated April 1, 2013, as supplemented to date.
| 74 | May 31, 2013 | | Semiannual Report |
Table of Contents
Unaudited
AllianzGI NFJ Emerging Markets Value Fund (cont’d)
Cumulative Returns Through May 31, 2013
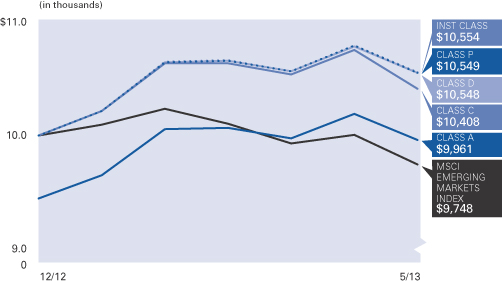
Country Allocation (as of May 31, 2013)
| China | 22.0% | |||
| Korea (Republic of) | 12.1% | |||
| Brazil | 10.2% | |||
| India | 8.1% | |||
| Taiwan | 6.5% | |||
| Russian Federation | 5.5% | |||
| Thailand | 5.4% | |||
| Hong Kong | 4.7% | |||
| Other | 21.4% | |||
| Cash & Equivalents — Net | 4.1% |
| Shareholder Expense Example | Actual Performance | |||||||||
| Class A | Class C | Class D | Class P | Institutional Class | ||||||
| Beginning Account Value (12/18/12) | $1,000.00 | $1,000.00 | $1,000.00 | $1,000.00 | $1,000.00 | |||||
| Ending Account Value (5/31/13) | $1,054.10 | $1,050.70 | $1,054.70 | $1,054.70 | $1,055.50 | |||||
| Expenses Paid During Period | $7.20 | $10.64 | $7.20 | $6.51 | $6.05 | |||||
| Hypothetical Performance | ||||||||||
| (5% return before expenses) | ||||||||||
| Class A | Class C | Class D | Class P | Institutional Class | ||||||
| Beginning Account Value (12/1/12) | $1,000.00 | $1,000.00 | $1,000.00 | $1,000.00 | $1,000.00 | |||||
| Ending Account Value (5/31/13) | $1,017.15 | $1,013.41 | $1,017.15 | $1,017.90 | $1,018.40 | |||||
| Expenses Paid During Period | $7.85 | $11.60 | $7.85 | $7.09 | $6.59 | |||||
The Fund commenced operations on December 18, 2012. The Actual expense example is based on the period since inception; the Hypothetical expense example is based on the period beginning December 1, 2012. If the Hypothetical expense example had been based on the period since inception, the Ending Account Value and Expenses Paid During Period would have been: $1,015.46 and $7.06, respectively, for Class A; $1,012.09 and $10.44, respectively, for Class C; $1,015.46 and $7.06, respectively, for Class D; $1,016.13 and $6.39, respectively, for Class P; and $1,016.58 and $5.93, respectively, for Institutional Class.
For each class of the Fund, expenses (net of fee waiver and reimbursement, if any) are equal to the annualized expense ratio for the class (1.56% for Class A, 2.31% for Class C, 1.56% for Class D, 1.41% for Class P and 1.31% for Institutional Class), multiplied by the average account value over the period, multiplied by 164/365 for the Actual expense example and 182/365 for the Hypothetical expense example.
| Semiannual Report | | May 31, 2013 | 75 |
Table of Contents
Unaudited
AllianzGI NFJ Global Dividend Value Fund (formerly Allianz NFJ Global Dividend Value Fund)
For the period of December 1, 2012, through May 31, 2013, as provided by Burns McKinney, CFA, Portfolio Manager.
Portfolio Insights
For the reporting period ended May 31, 2013, Class A shares at NAV of the AllianzGI NFJ Global Dividend Value Fund (the “Fund”) returned 14.29% outperforming the MSCI ACWI Index (the “benchmark index”) which returned 11.72%.
The reporting period took place against a backdrop of sustained commitment to aggressive monetary policy by central banks around the globe. Indications of strength from the US housing and labor markets, as well as the bi-partisan cooperation that resulted in legislation to keep the government operational through September of 2013 brought some optimism to the market. However, international markets generally lagged US stocks as a stronger dollar year-to-date and instability out of Europe caused many international companies to struggle. Cyprus avoided an ungraceful exit from the euro-zone, and an Italian Prime Minister was confirmed in April, ending two months of stymied political leadership. The euro-zone’s GDP shrank for six straight quarters. Weak global growth combined with a sharply lower Japanese yen contributed to several central banks continuing to cut interest rates. Japanese stocks experienced severe price swings toward the end of May, and the country’s government bond yields rose suddenly. Emerging countries generally did not keep pace with developed countries, partly due to concerns for growth prospects in China and flagging commodity
prices. The reporting period closed amid heightened uncertainty surrounding the timing of Fed “tapering” (i.e., beginning of a reduction in the amount of stimulus), causing investors to sell out of higher income-oriented sectors such as Utilities and Telecommunication Services as well as emerging-market assets for most of May.
Dispersion among sector returns was notable within the benchmark index, as the weakest sector (Materials) had total returns of -2%, while the strongest sector (Health Care) climbed over 19%. Only one sector generated a negative return for the period. The Materials, Energy, Telecommunication Services and Utilities sectors were the worst performing sectors. In contrast, the Health Care, Consumer Discretionary, Financials and Industrials sectors generated the strongest results. On an MSCI country basis, the strongest results were generated in the Philippines, Japan, Ireland and the United States. Conversely, the weakest returns were experienced by many emerging countries, including Peru, Czech Republic, Colombia and Morocco.
Stock selection drove the Fund’s outperformance
The Fund’s outperformance versus the benchmark index was largely due to stock selection. Conversely, sector and country allocation was negative during the period and detracted from the Fund’s relative results.
In terms of stock selection, the Fund’s holdings in the Information Technology, Telecommunication Services and Financials sectors contributed to performance during the reporting period. This was somewhat offset by the Fund’s holdings in the Materials, Utilities and Health Care sectors.
By country, selection was strong in the United States and South Korea, but somewhat offset by negative selection in Canada and Germany.
From a sector allocation perspective, overweights in Energy and Telecommunication Services, as well as an underweight in Consumer Discretionary detracted from results. An underweight in Consumer Staples was positive during the reporting period.
Overweights in Brazil and South Korea, in addition to an underweight in Japan, were the primary detractors from relative returns. In contrast, underweights in China, Canada and India benefited the Fund’s relative performance.
Sector weight deviations are a result of NFJ’s bottom-up investment process. On average during the reporting period, the Fund’s largest overweights relative to the benchmark index were in the Energy and Telecommunication Services sectors, whereas the largest relative underweights were in the Consumer Staples and Consumer Discretionary sectors.
Average Annual Total Return for the period ended May 31, 2013
| 6 Month* | 1 Year | Since Inception† | ||||||||||||
| AllianzGI NFJ Global Dividend Value Fund Class A | 14.29% | 27.85% | 13.16% | |||||||||||
| AllianzGI NFJ Global Dividend Value Fund Class A (adjusted) | 8.01% | 20.82% | 11.54% | ||||||||||
| AllianzGI NFJ Global Dividend Value Fund Class C | 13.88% | 26.79% | 12.30% | |||||||||||
| AllianzGI NFJ Global Dividend Value Fund Class C (adjusted) | 12.88% | 25.79% | 12.30% | ||||||||||
| AllianzGI NFJ Global Dividend Value Fund Class D | 14.25% | 27.68% | 13.13% | ||||||||||
| AllianzGI NFJ Global Dividend Value Fund Class P | 14.44% | 28.03% | 13.38% | ||||||||||
| AllianzGI NFJ Global Dividend Value Fund Institutional Class | 14.51% | 28.19% | 13.50% | ||||||||||
| MSCI ACWI Index | 11.72% | 26.01% | 13.30% | ||||||||||
| Lipper Global Equity Income Average | 10.55% | 23.86% | 12.83% | |||||||||||
† The Fund began operations on 6/26/09. Benchmark return comparisons began on the fund inception date. Lipper performance comparisons began on 6/30/09.
* Cumulative return.
Performance quoted represents past performance and is no guarantee of future results. Current performance may be lower or higher than performance shown. For performance current to the most recent month-end, visit our website at us.allianzgi.com. Investment return and the principal value will fluctuate. Shares may be worth more or less than original cost when redeemed. The adjusted returns take into account the maximum initial sales charge of 5.50% on Class A shares and the contingent deferred sales charge (CDSC) of 1% on Class C shares, which may apply to shares redeemed during the first year of ownership. Returns do not reflect deduction of taxes that a shareholder would pay on fund distributions or redemption of fund shares. See pages 94 and 95 for more information. The Fund’s gross expense ratios are 1.70% for Class A shares, 2.45% for Class C shares, 3.03% for Class D shares, 1.50% for Class P shares and 1.39% for Institutional Class shares. These ratios do not include an expense reduction, contractually guaranteed through at least 3/31/14. The Fund’s expense ratios net of this reduction are 1.20% for Class A shares, 1.99% for Class C shares, 1.30% for Class D shares, 1.04% for Class P shares and 0.95% for Institutional Class shares. Expense ratio information is as of the Fund’s current prospectus dated April 1, 2013, as supplemented to date.
| 76 | May 31, 2013 | | Semiannual Report |
Table of Contents
Unaudited
AllianzGI NFJ Global Dividend Value Fund (formerly Allianz NFJ Global Dividend Value Fund) (cont’d)
Cumulative Returns Through May 31, 2013
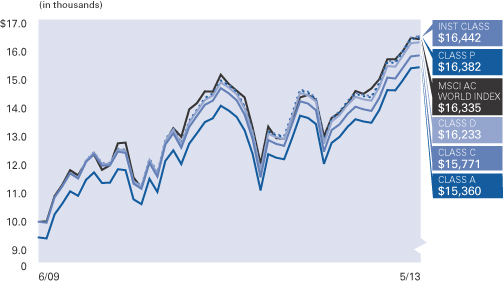
Country Allocation (as of May 31, 2013)
| United States | 41.3% | |||
| United Kingdom | 10.0% | |||
| Korea (Republic of) | 5.9% | |||
| France | 5.9% | |||
| Japan | 5.8% | |||
| Brazil | 4.9% | |||
| South Africa | 4.1% | |||
| Switzerland | 3.9% | |||
| Other | 16.2% | |||
| Cash & Equivalents — Net | 2.0% |
| Shareholder Expense Example | Actual Performance | |||||||||
| Class A | Class C | Class D | Class P | Institutional Class | ||||||
| Beginning Account Value (12/1/12) | $1,000.00 | $1,000.00 | $1,000.00 | $1,000.00 | $1,000.00 | |||||
| Ending Account Value (5/31/13) | $1,142.90 | $1,138.80 | $1,142.50 | $1,144.40 | $1,145.10 | |||||
| Expenses Paid During Period | $6.52 | $10.72 | $7.05 | $5.72 | $5.19 | |||||
| Hypothetical Performance | ||||||||||
| (5% return before expenses) | ||||||||||
| Class A | Class C | Class D | Class P | Institutional Class | ||||||
| Beginning Account Value (12/1/12) | $1,000.00 | $1,000.00 | $1,000.00 | $1,000.00 | $1,000.00 | |||||
| Ending Account Value (5/31/13) | $1,018.85 | $1,014.91 | $1,018.35 | $1,019.60 | $1,020.09 | |||||
| Expenses Paid During Period | $6.14 | $10.10 | $6.64 | $5.39 | $4.89 | |||||
For each class of the Fund, expenses (net of fee waiver and reimbursement, if any) are equal to the annualized expense ratio for the class (1.22% for Class A, 2.01% for Class C, 1.32% for Class D, 1.07% for Class P and 0.97% for Institutional Class), multiplied by the average account value over the period, multiplied by 182/365.
| Semiannual Report | | May 31, 2013 | 77 |
Table of Contents
Unaudited
AllianzGI NFJ International Small-Cap Value Fund (formerly Allianz NFJ International Small-Cap Value Fund)
For the period of December 1, 2012, through May 31, 2013, as provided by L. Baxter Hines, CFA, Portfolio Manager.
Portfolio Insights
For the reporting period ended May 31, 2013, Class A shares at NAV of the AllianzGI NFJ International Small Cap Value Fund (the “Fund”) returned 12.17% outperforming the MSCI World ex-US Small Cap Index (the “benchmark index”) which returned 11.85%.
The reporting period took place against a backdrop of sustained commitment to aggressive monetary policy by central banks around the globe. Indications of strength from the US housing and labor markets, as well as the bi-partisan cooperation that resulted in legislation to keep the government operational through September of 2013 brought some optimism to the market. However, international markets generally lagged US stocks as a stronger dollar year-to-date and instability out of Europe caused many international companies to struggle. Cyprus avoided an ungraceful exit from the euro zone, and an Italian Prime Minister was confirmed in April, ending two months of stymied political leadership. The euro-zone’s GDP shrank for six straight quarters. Weak global growth combined with a sharply lower Japanese yen contributed to several central banks continuing to cut interest rates. Japanese stocks experienced severe price swings toward the end of May, as the country’s government bond yields rose suddenly. Emerging countries generally did not keep pace with developed countries, partly
due to concerns for growth prospects in China and flagging commodity prices. The reporting period closed amid heightened uncertainty surrounding the timing of Fed “tapering” (i.e., beginning of a reduction in the amount of stimulus), causing investors to sell out of emerging-market assets for most of May.
Dispersion among sector returns was notable within the benchmark index, as the weakest sector (Materials) had total returns of -7%, while the strongest sector (Information Technology) climbed 23%. Only one sector generated a negative return for the period. The Materials, Energy, Utilities and Consumer Staples sectors were the worst performing sectors. In contrast, the Information Technology, Consumer Discretionary, Health Care and Industrials sectors generated the strongest results. On an MSCI country basis, the strongest results were generated by many of Europe’s peripheral countries: Portugal, Denmark, Ireland and Italy. Conversely, negative returns were experienced by two developed countries: Australia and Canada.
Stock selection and sector allocation drove the Fund’s outperformance
The Fund’s outperformance versus the benchmark index was due to positive stock selection and sector allocation. Country allocation was net neutral during the period.
In terms of stock selection, the Fund’s holdings in the Materials, Financials and Energy sectors contributed to performance during the reporting period. This was somewhat offset by the Fund’s holdings in the Consumer Discretionary, Information Technology and Health Care sectors.
By country, selection was strong in Canada and Australia, but somewhat offset by poor selection in Japan and the United Kingdom.
From a sector allocation perspective, underweights in Materials and Energy contributed to results. An overweight in Utilities and underweight in Financials detracted during the reporting period.
Underweights in Canada and Australia, in addition to an overweight in the United States, were the primary contributors from relative returns. These positive results were largely offset by the Fund’s underweight in Japan and overweights in South Africa and China, which hindered relative performance.
Sector weight deviations are a result of NFJ’s bottom-up investment process. On average during the reporting period, the Fund’s largest overweights relative to the benchmark index were in the Utilities and Health Care sectors, whereas the largest relative underweights were in the Financials and Materials sectors.
Average Annual Total Return for the period ended May 31, 2013
| 6 Month* | Since Inception† | |||||||||
| AllianzGI NFJ International Small-Cap Value Fund Class A | 12.17% | 27.87% | ||||||||
| AllianzGI NFJ International Small-Cap Value Fund Class A (adjusted) | 6.00% | 20.84% | |||||||
| AllianzGI NFJ International Small-Cap Value Fund Class C | 11.77% | 26.98% | ||||||||
| AllianzGI NFJ International Small-Cap Value Fund Class C (adjusted) | 10.77% | 25.98% | |||||||
| AllianzGI NFJ International Small-Cap Value Fund Class D | 12.15% | 27.92% | |||||||
| AllianzGI NFJ International Small-Cap Value Fund Class P | 12.26% | 28.05% | |||||||
| AllianzGI NFJ International Small-Cap Value Fund Institutional Class | 12.33% | 28.21% | |||||||
| MSCI World ex-US Small Cap Index | 11.85% | 29.42% | |||||||
Lipper International Small/Mid-Cap Value Fund Average | 13.50% | 31.01% | ||||||||
† The Fund began operations on 6/1/12. Benchmark return comparisons began on the fund inception date. Lipper performance comparisons began on 5/31/12.
* Cumulative return.
Performance quoted represents past performance and is no guarantee of future results. Current performance may be lower or higher than performance shown. For performance current to the most recent month-end, visit our website at us.allianzgi.com. Investment return and the principal value will fluctuate. Shares may be worth more or less than original cost when redeemed. The adjusted returns take into account the maximum initial sales charge of 5.50% on Class A shares and the contingent deferred sales charge (CDSC) of 1% on Class C shares, which may apply to shares redeemed during the first year of ownership. Returns do not reflect deduction of taxes that a shareholder would pay on fund distributions or redemption of fund shares. See pages 94 and 95 for more information. The Fund’s gross expense ratios are 4.27% for Class A shares, 5.02% for Class C shares, 4.51% for Class D shares, 4.12% for Class P shares and 4.07% for Institutional Class shares. These ratios do not include an expense reduction, contractually guaranteed through at least 3/31/14. The Fund’s expense ratios net of this reduction are 1.45% for Class A shares, 2.20% for Class C shares, 1.45% for Class D shares, 1.30% for Class P shares and 1.20% for Institutional Class shares. Expense ratio information is as of the Fund’s current prospectus dated June 1, 2012, as supplemented to date.
| 78 | May 31, 2013 | | Semiannual Report |
Table of Contents
Unaudited
AllianzGI NFJ International Small-Cap Value Fund (formerly Allianz NFJ International Small-Cap Value Fund) (cont’d)
Cumulative Returns Through May 31, 2013
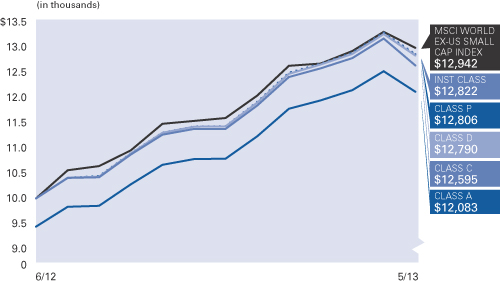
Country Allocation (as of May 31, 2013)
| United Kingdom | 18.9% | |||
| Japan | 16.6% | |||
| Canada | 9.8% | |||
| Australia | 5.4% | |||
| China | 5.2% | |||
| France | 5.0% | |||
| Hong Kong | 3.9% | |||
| Germany | 2.7% | |||
| Other | 27.6% | |||
| Cash & Equivalents — Net | 4.9% |
| Shareholder Expense Example | Actual Performance | |||||||||
| Class A | Class C | Class D | Class P | Institutional Class | ||||||
| Beginning Account Value (12/1/12) | $1,000.00 | $1,000.00 | $1,000.00 | $1,000.00 | $1,000.00 | |||||
| Ending Account Value (5/31/13) | $1,121.70 | $1,117.70 | $1,121.50 | $1,122.60 | $1,123.30 | |||||
| Expenses Paid During Period | $7.72 | $11.67 | $7.72 | $6.93 | $6.41 | |||||
| Hypothetical Performance | ||||||||||
| (5% return before expenses) | ||||||||||
| Class A | Class C | Class D | Class P | Institutional Class | ||||||
| Beginning Account Value (12/1/12) | $1,000.00 | $1,000.00 | $1,000.00 | $1,000.00 | $1,000.00 | |||||
| Ending Account Value (5/31/13) | $1,017.65 | $1,013.91 | $1,017.65 | $1,018.40 | $1,018.90 | |||||
| Expenses Paid During Period | $7.34 | $11.10 | $7.34 | $6.59 | $6.09 | |||||
For each class of the Fund, expenses (net of fee waiver and reimbursement, if any) are equal to the annualized expense ratio for the class (1.46% for Class A, 2.21% for Class C, 1.46% for Class D, 1.31% for Class P and 1.21% for Institutional Class), multiplied by the average account value over the period, multiplied by 182/365.
| Semiannual Report | | May 31, 2013 | 79 |
Table of Contents
Unaudited
AllianzGI NFJ International Value II Fund (formerly Allianz NFJ International Value II Fund)
For the period of December 1, 2012, through May 31, 2013, as provided by L. Baxter Hines, CFA, Portfolio Manager.
Portfolio Insights
For the reporting period ended May 31, 2013, Class A shares at NAV of the AllianzGI NFJ International Value II Fund (the “Fund”) returned 7.85% underperforming the MSCI EAFE Index (the “benchmark index”) which returned 11.39%.
The reporting period took place against a backdrop of sustained commitment to aggressive monetary policy by central banks around the globe. Indications of strength from the US housing and labor markets, as well as the bi-partisan cooperation that resulted in legislation to keep the government operational through September of 2013 brought some optimism to the market. However, international markets generally lagged US stocks as a stronger dollar year-to-date and instability out of Europe caused many international companies to struggle. Cyprus avoided an ungraceful exit from the euro zone, and an Italian Prime Minister was confirmed in April, ending two months of stymied political leadership. The euro-zone’s GDP shrank for six straight quarters. Weak global growth combined with a sharply lower Japanese yen contributed to several central banks continuing to cut interest rates. Japanese stocks experienced severe price swings toward the end of May, as the country’s government bond yields rose suddenly. Emerging countries generally did not keep pace with developed countries, partly
due to concerns for growth prospects in China and flagging commodity prices. The reporting period closed amid heightened uncertainty surrounding the timing of Fed “tapering” (i.e., beginning of a reduction in the amount of stimulus), causing investors to sell out of emerging-market assets for most of May.
Dispersion among sector returns was notable within the benchmark index, as the weakest sector (Materials) had total returns of less than 1%, while the strongest sector (Consumer Discretionary) climbed over 21%. The Materials, Energy, Utilities and Consumer Staples sectors were the worst performing sectors. In contrast, the Consumer Discretionary, Health Care, Financials and Information Technology sectors generated the strongest results. On an MSCI country basis, the strongest results were generated by Japan, Ireland, Sweden and Portugal. Conversely, negative returns were experienced by one country, Israel.
Stock selection drove the Fund’s underperformance
The Fund’s underperformance versus the benchmark index was due to negative stock selection. Sector and country allocation also detracted during the period.
In terms of stock selection, the Fund’s holdings in the Materials, Consumer Staples and Consumer Discretionary sectors detracted from performance during the reporting period. This was somewhat offset by positive selection in the Industrials, Telecommunication Services and Financials sectors.
By country, selection was strong in France and the United Kingdom, but somewhat offset by negative selection in Japan and Norway.
From a sector allocation perspective, overweights in Energy and Materials, as well as an underweight in Financials, muted results. Conversely, overweights in the Health Care and Consumer Discretionary sectors contributed during the reporting period.
Overweights in Brazil and China hindered relative performance, while underweights in Australia and Germany added to gains.
Sector weight deviations are a result of NFJ’s bottom-up investment process. On average during the reporting period, the Fund’s largest overweights relative to the benchmark index were in the Energy and Telecommunication Services sectors, whereas the largest relative underweights were in the Financials and Information Technology sectors.
Average Annual Total Return for the period ended May 31, 2013
| 6 Month* | 1 Year | Since Inception† | ||||||||||||
| AllianzGI NFJ International Value II Fund Class A | 7.85% | 24.02% | 12.75% | |||||||||||
| AllianzGI NFJ International Value II Fund Class A (adjusted) | 1.92% | 17.20% | 8.58% | ||||||||||
| AllianzGI NFJ International Value II Fund Class C | 7.42% | 23.01% | 11.89% | |||||||||||
| AllianzGI NFJ International Value II Fund Class C (adjusted) | 6.42% | 22.01% | 11.89% | ||||||||||
| AllianzGI NFJ International Value II Fund Class D | 7.84% | 23.99% | 12.73% | ||||||||||
| AllianzGI NFJ International Value II Fund Class P | 7.96% | 24.25% | 13.02% | ||||||||||
| AllianzGI NFJ International Value II Fund Institutional Class | 8.05% | 24.42% | 13.14% | ||||||||||
| MSCI EAFE Index | 11.39% | 31.62% | 16.09% | ||||||||||
| Lipper International Multi-Cap Value Average | 10.25% | 28.79% | 13.32% | |||||||||||
† The Fund began operations on 12/1/11. Benchmark return comparisons began on the fund inception date. Lipper performance comparisons began on 11/30/11.
* Cumulative return.
Performance quoted represents past performance and is no guarantee of future results. Current performance may be lower or higher than performance shown. For performance current to the most recent month-end, visit our website at us.allianzgi.com. Investment return and the principal value will fluctuate. Shares may be worth more or less than original cost when redeemed. The adjusted returns take into account the maximum initial sales charge of 5.50% on Class A shares and the contingent deferred sales charge (CDSC) of 1% on Class C shares, which may apply to shares redeemed during the first year of ownership. Returns do not reflect deduction of taxes that a shareholder would pay on fund distributions or redemption of fund shares. See pages 94 and 95 for more information. The Fund’s gross expense ratios are 5.14% for Class A shares, 5.89% for Class C shares, 5.14% for Class D shares, 4.89% for Class P shares and 4.95% for Institutional Class shares. These ratios do not include an expense reduction, contractually guaranteed through at least 3/31/14. The Fund’s expense ratios net of this reduction are 1.20% for Class A shares, 1.95% for Class C shares, 1.20% for Class D shares, 1.05% for Class P shares and 0.95% for Institutional Class shares. Expense ratio information is as of the Fund’s current prospectus dated April 1, 2013, as supplemented to date.
| 80 | May 31, 2013 | | Semiannual Report |
Table of Contents
Unaudited
AllianzGI NFJ International Value II Fund (formerly Allianz NFJ International Value II Fund) (cont’d)
Cumulative Returns Through May 31, 2013
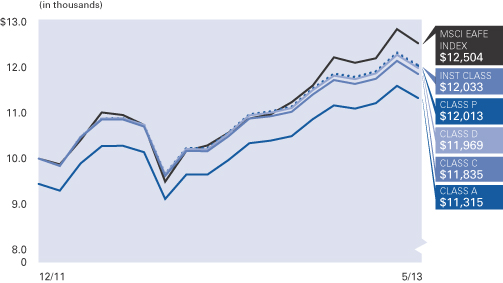
Country Allocation (as of May 31, 2013)
| United Kingdom | 27.2% | |||
| Japan | 17.0% | |||
| Canada | 7.7% | |||
| France | 7.0% | |||
| Hong Kong | 3.8% | |||
| Norway | 2.9% | |||
| China | 2.7% | |||
| Germany | 2.5% | |||
| Other | 26.4% | |||
| Cash & Equivalents — Net | 2.8% |
| Shareholder Expense Example | Actual Performance | |||||||||
| Class A | Class C | Class D | Class P | Institutional Class | ||||||
| Beginning Account Value (12/1/12) | $1,000.00 | $1,000.00 | $1,000.00 | $1,000.00 | $1,000.00 | |||||
| Ending Account Value (5/31/13) | $1,078.50 | $1,074.20 | $1,078.40 | $1,079.60 | $1,080.50 | |||||
| Expenses Paid During Period | $6.53 | $10.39 | $6.58 | $5.44 | $4.93 | |||||
| Hypothetical Performance | ||||||||||
| (5% return before expenses) | ||||||||||
| Class A | Class C | Class D | Class P | Institutional Class | ||||||
| Beginning Account Value (12/1/12) | $1,000.00 | $1,000.00 | $1,000.00 | $1,000.00 | $1,000.00 | |||||
| Ending Account Value (5/31/13) | $1,018.65 | $1,014.91 | $1,018.60 | $1,019.70 | $1,020.19 | |||||
| Expenses Paid During Period | $6.34 | $10.10 | $6.39 | $5.29 | $4.78 | |||||
For each class of the Fund, expenses (net of fee waiver and reimbursement, if any) are equal to the annualized expense ratio for the class (1.26% for Class A, 2.01% for Class C, 1.27% for Class D, 1.05% for Class P and 0.95% for Institutional Class), multiplied by the average account value over the period, multiplied by 182/365.
| Semiannual Report | | May 31, 2013 | 81 |
Table of Contents
Unaudited
AllianzGI Redwood Fund (formerly Allianz RCM Redwood Fund)
For the period of December 1, 2012, through May 31, 2013, as provided by Todd Hawthorne, Portfolio Manager.
Portfolio Insights
For the reporting period ended May 31, 2013, Class A shares at NAV of the AllianzGI Redwood Fund (the “Fund”) returned 3.43% underperforming the S&P 500 Index (the “benchmark index”) which returned 16.43%.
Volatility, as measured by the CBOE Volatility Index (VIX), was historically low over the period. Lack of volatility and the slow steady grind up of equities resulted in the broad equity market outperforming the Fund.
The Fund’s robust breakeven protection should prove beneficial in the case of a correction from the all-time highs equity markets have traced so far this year. Additionally, the Fund has exhibited less than half the volatility of the S&P 500 Index over the period.
Our bottom-up fundamental approach to identifying buy-write opportunities resulted in decreased weights in the Technology, Materials, and Energy sectors. Our total exposure to the Healthcare and Industrials sectors was increased.
Top contributors to performance included our positions in Comerica Inc., Google Inc., Intel Corp., American Express Co., and Express Scripts Holding Company.
Conversely, top detractors included positions in Whole Foods Market Inc., Cliffs Natural Resources Inc., Oracle Corp., United States Steel Corp., and Apple Inc.
In the near-term, it would not be surprising to see the equity market pull back following the
strong year-to-date gains. Risks to the equity market include the economic impact of fiscal tightening, contagion of the European debt crisis, and negative sentiment sparked by fears the Fed could dial back its bond-buying programs sooner than expected and disappointing company earnings.
The macro events in Cyprus have reminded investors that the debt troubles in Europe are far from completely resolved. This, combined with other factors/risks, could cause a correction in the equity markets. We would expect a coincident rise in market volatility off of these historic lows. A rise in volatility should play into the Fund’s strengths which could increase the investment opportunity set.
Average Annual Total Return for the period ended May 31, 2013
| 6 Month* | 1 Year | Since Inception† | ||||||||||||
AllianzGI Redwood Fund Class A | 3.43% | 7.39% | 1.90% | |||||||||||
| AllianzGI Redwood Fund Class A (adjusted) | –2.26% | 1.48% | –0.45% | ||||||||||
AllianzGI Redwood Fund Class C | 2.96% | 6.37% | 1.07% | |||||||||||
| AllianzGI Redwood Fund Class C (adjusted) | 1.96% | 5.37% | 1.07% | ||||||||||
| AllianzGI Redwood Fund Class D | 3.30% | 7.11% | 1.82% | ||||||||||
| AllianzGI Redwood Fund Class P | 3.47% | 7.42% | 2.08% | ||||||||||
| AllianzGI Redwood Fund Institutional Class | 3.51% | 7.53% | 2.18% | ||||||||||
| BofA Merrill Lynch 3-Month U.S. Treasury Bill | 0.05% | 0.12% | 0.10% | ||||||||||
| S&P 500 Index | 16.43% | 27.28% | 13.76% | ||||||||||
Lipper Equity Market Neutral Funds Average | 0.77% | 2.31% | 1.62% | |||||||||||
† The Fund began operations on 12/27/10. Benchmark return comparisons began on the fund inception date. Lipper performance comparisons began on 12/31/10.
* Cumulative return.
Performance quoted represents past performance and is no guarantee of future results. Current performance may be lower or higher than performance shown. For performance current to the most recent month-end, visit our website at us.allianzgi.com. Investment return and the principal value will fluctuate. Shares may be worth more or less than original cost when redeemed. The adjusted returns take into account the maximum initial sales charge of 5.50% on Class A shares and the contingent deferred sales charge (CDSC) of 1% on Class C shares, which may apply to shares redeemed during the first year of ownership. Returns do not reflect deduction of taxes that a shareholder would pay on fund distributions or redemption of fund shares. See pages 94 and 95 for more information. The Fund’s gross expense ratios are 3.57% for Class A shares, 4.50% for Class C shares, 10.19% for Class D shares, 3.48% for Class P shares and 3.30% for Institutional Class shares. These ratios do not include an expense reduction, contractually guaranteed through at least 3/31/14. The Fund’s expense ratios net of this reduction are 1.60% for Class A shares, 2.50% for Class C shares, 1.75% for Class D shares, 1.50% for Class P shares and 1.40% for Institutional Class shares. Expense ratio information is as of the Fund’s current prospectus dated April 1, 2013, as supplemented to date.
| 82 | May 31, 2013 | | Semiannual Report |
Table of Contents
Unaudited
AllianzGI Redwood Fund (formerly Allianz RCM Redwood Fund) (cont’d)
Cumulative Returns Through May 31, 2013
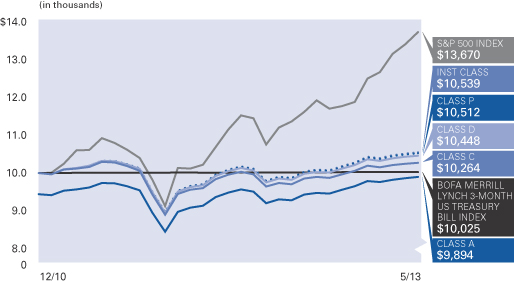
Industry Allocation (as of May 31, 2013)
| Health Care Providers & Services | 12.7% | |||
| Software | 6.2% | |||
| Oil, Gas & Consumable Fuels | 5.6% | |||
| Hotels, Restaurants & Leisure | 4.6% | |||
| Energy Equipment & Services | 4.3% | |||
| Food Products | 3.5% | |||
| Commercial Banks | 3.4% | |||
| Industrial Conglomerates | 3.4% | |||
| Other | 43.9% | |||
| Cash & Equivalents — Net (including Options Written) | 12.4% |
| Shareholder Expense Example | Actual Performance | |||||||||
| Class A | Class C | Class D | Class P | Institutional Class | ||||||
| Beginning Account Value (12/1/12) | $1,000.00 | $1,000.00 | $1,000.00 | $1,000.00 | $1,000.00 | |||||
| Ending Account Value (5/31/13) | $1,034.30 | $1,029.60 | $1,033.00 | $1,034.70 | $1,035.10 | |||||
| Expenses Paid During Period | $8.11 | $12.65 | $8.87 | $7.61 | $7.10 | |||||
| Hypothetical Performance | ||||||||||
| (5% return before expenses) | ||||||||||
| Class A | Class C | Class D | Class P | Institutional Class | ||||||
| Beginning Account Value (12/1/12) | $1,000.00 | $1,000.00 | $1,000.00 | $1,000.00 | $1,000.00 | |||||
| Ending Account Value (5/31/13) | $1,016.95 | $1,012.47 | $1,016.21 | $1,017.45 | $1,017.95 | |||||
| Expenses Paid During Period | $8.05 | $12.54 | $8.80 | $7.54 | $7.04 | |||||
For each class of the Fund, expenses (net of fee waiver and reimbursement, if any) are equal to the annualized expense ratio for the class (1.60% for Class A, 2.50% for Class C, 1.75% for Class D, 1.50% for Class P and 1.40% for Institutional Class), multiplied by the average account value over the period, multiplied by 182/365.
| Semiannual Report | | May 31, 2013 | 83 |
Table of Contents
Unaudited
AllianzGI Short Duration High Income Fund (formerly Allianz RCM Short Duration High Income Fund)
For the period of December 1, 2012 through May 31, 2013, as provided by Tom Saake and Eric Scholl, Portfolio Managers.
Portfolio Insights
Performance
For the reporting period ended May 31, 2013, Class A shares at NAV of the AllianzGI Short Duration High Income Fund (the “Fund”) returned 2.24% underperforming the BofA Merrill Lynch 1-3 year BB US Cash Pay High Yield Index (the “benchmark index”) which returned 3.08%.
The AllianzGI Short Duration High Income Fund seeks a high level of current income while emphasizing the preservation of capital. The Fund’s underperformance these past six months can be largely attributed to its industry weightings. Overweights in Telecom and Aerospace/Defense proved to be a drag on performance as was the Fund’s underweight in the bank sector. As of May 31, 2013, the Bank sector comprised approximately 25% of the benchmark index versus roughly 3% for the Fund. This sector returned 4.67% during the reporting period, significantly outperforming the overall benchmark index. We are unwilling to take on the benchmark’s industry concentration risk and the attendant return volatility, hence our decision to maintain an underweight in the Bank sector. To maintain a well-diversified portfolio, we generally restrict industry weightings to a maximum of 15%.
Contributors
Chesapeake Energy, an independent exploration and production company, outperformed due to
continued progress on a more balanced capital allocation program.
MGM Resorts, the large gaming company, was a strong performer as investors responded favorably to the firm’s continued improvement in operations which has been largely driven by the Macau joint venture.
Sabine Pass, an LNG terminal, is supported by two contracts with investment grade entities. The recent appreciation of the bonds was driven by further progress on their affiliate’s LNG export facility.
Detractors
Community Health, this hospital operator’s secured bonds suffered due to the cheapening of bank loans over the past month.
Dish Network, a satellite cable provider, came under pressure due to its pursuit of Clearwire and Sprint. In preparation for its bid, Dish has raised a significant amount of debt which has adversely impacted the pricing of its outstanding issues including those that the Fund owns.
Univision, a Spanish network operator, saw its debt come under pressure due to the unexpectedly cheap pricing of a recently-placed 10 year secured bond issue.
Outlook
Concern that the Federal Reserve may taper Quantitative Easing 3 sooner than expected,
coupled with growing uncertainty about the timing and magnitude of the Bank of Japan’s stimulus measures, and renewed fears that the Chinese economy is weakening, has led to recent profit-taking in many asset classes including high yield. There have been record outflows from market-based high yield mutual funds. Associated with these outflows has been a back-up in yields. With the yield-to-worst for the BofA Merrill Lynch High Yield Index having risen almost 70 basis points from recent lows, we believe the high yield market should begin to find support. High yield issuers’ financial metrics, while off their highs, remain solid. The US economy continues to improve and corporate profits are growing. As a result, defaults are projected to remain at relatively benign levels over the foreseeable future. In addition, even if the Federal Reserve reduces it purchases of Treasury and mortgage-backed securities later this year, economists still project that it will maintain short-term interest rates at very low nominal levels for the foreseeable future. Maintenance of a zero interest rate policy by the Fed and the world’s other central banks, along with solid corporate fundamentals, should provide strong underpinnings for the short duration high yield marketplace and reinforces our belief that the near-term outlook for the Fund is positive despite recent market volatility.
Average Annual Total Return for the period ended May 31, 2013
| 6 Month* | 1 Year | Since Inception† | ||||||||||||
| AllianzGI RCM Short Duration High Income Fund Class A | 2.24% | 6.83% | 8.21% | |||||||||||
| AllianzGI RCM Short Duration High Income Fund Class A (adjusted) | –0.06% | 4.43% | 6.74% | ||||||||||
| AllianzGI RCM Short Duration High Income Fund Class C | 2.13% | 6.46% | 7.65% | |||||||||||
| AllianzGI RCM Short Duration High Income Fund Class C (adjusted) | 1.13% | 5.46% | 7.65% | ||||||||||
| AllianzGI RCM Short Duration High Income Fund Class D | 2.24% | 6.87% | 8.21% | ||||||||||
| AllianzGI RCM Short Duration High Income Fund Class P | 2.32% | 6.95% | 8.34% | ||||||||||
| AllianzGI RCM Short Duration High Income Fund Institutional Class | 2.31% | 7.05% | 8.48% | ||||||||||
| BofA Merrill Lynch 1-3 Year BB U.S. Cash Pay High Yield Index | 3.08% | 8.32% | 10.05% | ||||||||||
† The Fund began operations on 10/3/11. Benchmark return comparisons began on the fund inception date.
* Cumulative return.
Performance quoted represents past performance and is no guarantee of future results. Current performance may be lower or higher than performance shown. For performance current to the most recent month-end, visit our website at us.allianzgi.com. Investment return and the principal value will fluctuate. Shares may be worth more or less than original cost when redeemed. The adjusted returns take into account the maximum initial sales charge of 2.25% on Class A shares and the contingent deferred sales charge (CDSC) of 1% on Class C shares, which may apply to shares redeemed during the first year of ownership. Returns do not reflect deduction of taxes that a shareholder would pay on fund distributions or redemption of fund shares. See pages 94 and 95 for more information. The Fund’s gross expense ratios are 1.09% for Class A shares, 1.50% for Class C shares, 1.18% for Class D shares, 0.92% for Class P shares and 0.89% for Institutional Class shares. These ratios do not include an expense reduction, contractually guaranteed through at least 3/31/14. The Fund’s expense ratios net of this reduction are 0.85% for Class A shares, 1.10% for Class C shares, 0.85% for Class D shares, 0.70% for Class P shares and 0.61% for Institutional Class shares. Expense ratio information is as of the Fund’s current prospectus dated April 1, 2013, as supplemented to date.
| 84 | May 31, 2013 | | Semiannual Report |
Table of Contents
Unaudited
AllianzGI Short Duration High Income Fund (formerly Allianz RCM Short Duration High Income Fund) (cont’d)
Cumulative Returns Through May 31, 2013
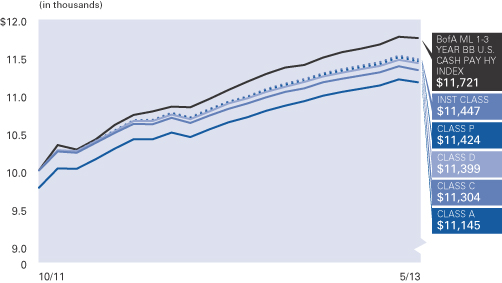
Industry Allocation (as of May 31, 2013)
| Diversified Financial Services | 11.0% | |||
| Telecommunications | 10.3% | |||
| Media | 9.3% | |||
| Food & Beverage | 7.6% | |||
| Electric Utilities | 6.0% | |||
| Mining | 4.6% | |||
| Oil & Gas | 4.6% | |||
| Pharmaceuticals | 3.5% | |||
| Other | 40.4% | |||
| Cash & Equivalents — Net | 2.7% |
Moody’s Ratings* (as of May 31, 2013)
(as a % of total investments)
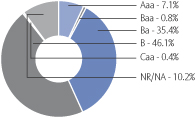
| * | The letter ratings are provided to indicate the creditworthiness of the underlying bonds in the portfolio and generally range from AAA (highest) to D (lowest). Ratings do not apply to the Fund. |
| Shareholder Expense Example | Actual Performance | |||||||||
| Class A | Class C | Class D | Class P | Institutional Class | ||||||
| Beginning Account Value (12/1/12) | $1,000.00 | $1,000.00 | $1,000.00 | $1,000.00 | $1,000.00 | |||||
| Ending Account Value (5/31/13) | $1,022.40 | $1,021.30 | $1,022.40 | $1,023.20 | $1,023.10 | |||||
| Expenses Paid During Period | $4.29 | $5.54 | $4.29 | $3.53 | $3.03 | |||||
| Hypothetical Performance | ||||||||||
| (5% return before expenses) | ||||||||||
| Class A | Class C | Class D | Class P | Institutional Class | ||||||
| Beginning Account Value (12/1/12) | $1,000.00 | $1,000.00 | $1,000.00 | $1,000.00 | $1,000.00 | |||||
| Ending Account Value (5/31/13) | $1,020.69 | $1,019.45 | $1,020.69 | $1,021.44 | $1,021.94 | |||||
| Expenses Paid During Period | $4.28 | $5.54 | $4.28 | $3.53 | $3.02 | |||||
For each class of the Fund, expenses (net of fee waiver and reimbursement, if any) are equal to the annualized expense ratio for the class (0.85% for Class A, 1.10% for Class C, 0.85% for Class D, 0.70% for Class P and 0.60% for Institutional Class), multiplied by the average account value over the period, multiplied by 182/365.
| Semiannual Report | | May 31, 2013 | 85 |
Table of Contents
Unaudited
AllianzGI Structured Alpha Fund
For the period of December 3, 2012, through May 31, 2013, as provided by Greg Tournant, Portfolio Manager.
Portfolio Insights
Since inception on December 3, 2012 through May 31, 2013 Class A shares at NAV of the AllianzGI Structured Alpha Fund (the “Fund”) returned 1.33%, outperforming the BofA Merrill Lynch 3-Month US Treasury Bill (the “benchmark index”) which returned 0.05% since inception.
In the fourth quarter of 2012, the Fund navigated somewhat volatile market conditions and finished the year ahead of its performance target. The binary nature of the US fiscal cliff showdown, coupled with implied-volatility levels that were too low to provide as much statistical safety as we typically seek, caused us to exercise caution in constructing positions during the period. Given that the fiscal cliff negotiations were either heading for an agreement, which could have caused a massive equity rally, or a
stalemate, which could have sent markets reeling, we elected to modestly reduce our range-bound positions in favor of increased directional spreads.
During the first quarter of 2013, the US equity market represented by the S&P 500 Index, nearly reached an all-time high (in US Dollars). The sharp advance was driven by easing concerns regarding the US fiscal cliff and signs of economic stabilization. As the equity market rallied, market volatility represented by the CBOE Volatility Index (VIX) reached multi-year lows. In this environment we kept our profit zones more narrow and relied slightly more on small directional trades.
In April of 2013, the equity markets remained range-bound, with just a mild pullback. This
mid-month statistical move was not large enough for us to capitalize on our directional put spreads. The volatility environment remained in a low range throughout the month with the exception of a short lived increase on April 15. May was a challenging month for the Fund as a result of the very rapid increase in the equity markets from late April to the 3rd week of May which forced us to restructure several positions.
Going forward, we believe that we are well diversified with both upside and downside directional profit zones in addition to our “range bound” positions. Additionally, the increase in the VIX from the 12-13 levels to 15-16 is expected to aid the portfolio as it allows us to build more attractive new positions.
Cumulative Total Return for the period ended May 31, 2013
| Since Inception† | ||||||
| AllianzGI Structured Alpha Fund Class A | 1.33% | |||||
| AllianzGI Structured Alpha Fund Class A (adjusted) | –4.24% | ||||
| AllianzGI Structured Alpha Fund Class C | 1.00% | |||||
| AllianzGI Structured Alpha Fund Class C (adjusted) | 0.00% | ||||
| AllianzGI Structured Alpha Fund Class D | 1.33% | ||||
| AllianzGI Structured Alpha Fund Class P | 1.40% | ||||
| AllianzGI Structured Alpha Fund Institutional Class | 1.47% | ||||
| BofA Merrill Lynch 3-Month U.S. Treasury Bill | 0.05% | ||||
| Lipper Absolute Return Funds Average | 2.59% | |||||
† The Fund began operations on 12/3/12. Benchmark return comparisons began on the fund inception date. Lipper performance comparisons began on 11/30/12.
Performance quoted represents past performance and is no guarantee of future results. Current performance may be lower or higher than performance shown. For performance current to the most recent month-end, visit our website at us.allianzgi.com. Investment return and the principal value will fluctuate. Shares may be worth more or less than original cost when redeemed. The adjusted returns take into account the maximum initial sales charge of 5.50% on Class A shares and the contingent deferred sales charge (CDSC) of 1% on Class C shares, which may apply to shares redeemed during the first year of ownership. Returns do not reflect deduction of taxes that a shareholder would pay on fund distributions or redemption of fund shares. See pages 94 and 95 for more information. The Fund’s gross expense ratios are 5.28% for Class A shares, 6.03% for Class C shares, 5.28% for Class D shares, 5.13% for Class P shares and 5.03% for Institutional Class shares. These ratios do not include an expense reduction, contractually guaranteed through at least 3/31/14. The Fund’s expense ratios net of this reduction are 1.90% for Class A shares, 2.65% for Class C shares, 1.90% for Class D shares, 1.75% for Class P shares and 1.65% for Institutional Class shares. Expense ratio information is as of the Fund’s current prospectus dated April 1, 2013, as supplemented to date.
| 86 | May 31, 2013 | | Semiannual Report |
Table of Contents
Unaudited
AllianzGI Structured Alpha Fund (cont’d)
Cumulative Returns Through May 31, 2013
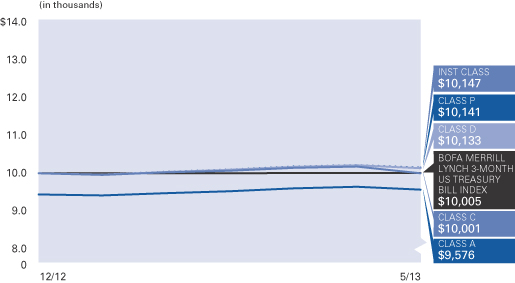
Maturity of Positions at Initiation
| 0-30 Days to Expiry: | 12% | |||
| 30-45 Days to Expiry: | 43% | |||
| 45 Days or More to Expiry: | 45% |
Options in Equity Indices
| S&P 500 Index: | 42% | |||
| Russell 2000 Index: | 48% | |||
| NASDAQ 100 Index: | 10% |
| Shareholder Expense Example | Actual Performance | |||||||||
| Class A | Class C | Class D | Class P | Institutional Class | ||||||
| Beginning Account Value (12/3/12) | $1,000.00 | $1,000.00 | $1,000.00 | $1,000.00 | $1,000.00 | |||||
| Ending Account Value (5/31/13) | $1,013.30 | $1,010.00 | $1,013.30 | $1,014.00 | $1,014.70 | |||||
| Expenses Paid During Period | $9.38 | $13.06 | $9.38 | $8.64 | $8.15 | |||||
| Hypothetical Performance | ||||||||||
| (5% return before expenses) | ||||||||||
| Class A | Class C | Class D | Class P | Institutional Class | ||||||
| Beginning Account Value (12/1/12) | $1,000.00 | $1,000.00 | $1,000.00 | $1,000.00 | $1,000.00 | |||||
| Ending Account Value (5/31/13) | $1,015.46 | $1,011.72 | $1,015.46 | $1,016.21 | $1,016.70 | |||||
| Expenses Paid During Period | $9.55 | $13.29 | $9.55 | $8.80 | $8.30 | |||||
The Fund commenced operations on December 3, 2012. The Actual expense example is based on the period since inception; the Hypothetical expense example is based on the period beginning December 1, 2012. If the Hypothetical expense example had been based on the period since inception, the Ending Account Value and Expenses Paid During Period would have been: $1,015.20 and $9.39, respectively, for Class A; $1,011.52 and $13.07, respectively, for Class C; $1,015.20 and $9.39, respectively, for Class D; $1,015.94 and $8.65, respectively, for Class P; and $1,016.43 and $8.16, respectively, for Institutional Class.
For each class of the Fund, expenses (net of fee waiver and reimbursement, if any) are equal to the annualized expense ratio for the class (1.90% for Class A, 2.65% for Class C, 1.90% for Class D, 1.75% for Class P and 1.65% for Institutional Class), multiplied by the average account value over the period, multiplied by 179/365 for the Actual expense example and 182/365 for the Hypothetical expense example.
| Semiannual Report | | May 31, 2013 | 87 |
Table of Contents
Unaudited
AllianzGI Ultra Micro Cap Fund (formerly Allianz AGIC Ultra Micro Cap Fund)
For the period of December 1, 2012 through May 31, 2013, as provided by Robert Marren, Portfolio Manager.
Portfolio Insights
From December 1, 2012 through May 31, 2013, Class A Shares, at NAV, of AllianzGI Ultra Micro Cap Fund returned 26.98%, outperforming its benchmark, the Russell Microcap Growth Index (the “benchmark index”), which returned 23.09% during the reporting period.
The stock market was higher over the reporting period, with major US equity indices recording all-time highs in the period.
Initially, the market moved higher with investors applauding the fiscal budget deal. As the year progressed, healthy fourth-quarter corporate profits, strong US equity asset flows and signs of stabilization in Europe helped drive additional gains. Other factors boosting investor sentiment included M&A and shareholder-friendly announcements as well as continued accommodative global central bank policies. Sequestration fears and hawkish Fed commentary also failed to disrupt the market’s upward trajectory. The Cyprus banking crisis
made headlines, however investor reaction in the US was negligible. Indeed, the market’s strength was nearly unwavering.
In April, disappointing global economic data and signs of a softening labor market in the US overshadowed healthy first-quarter corporate earnings and pressured stocks. Market weakness was temporary, however. Stocks rebounded sharply on better-than-expected economic reports and continued to advance as interest rates spiked. In addition, some reallocation of cash into equities helped fuel demand for stocks.
By mid-May, the market became fixated on the timing of stimulus tapering. Comments from Fed Chairman Ben Bernanke capped the market’s ascent and gave way to increased stock market volatility into the end of the reporting period.
Against this backdrop, nearly all sectors within the Russell Microcap Growth Index posted a gain
in the reporting period. Consumer Discretionary, Industrials and Health Care were the strongest-performing sectors followed by Financials and Information Technology. In contrast, the Energy sector declined during the period. Utilities stocks closed higher, but significantly underperformed the overall universe.
Performance
The Fund rallied with the market in the reporting period. Strength was evident in a variety of holdings and sectors. From an attribution perspective, security selection positively impacted relative returns whereas asset weighting effects hampered performance, but to a lesser extent. In particular, stock picking in the Industrials, Consumer Discretionary and Financials sectors drove relative outperformance. Conversely, the only sector to exhibit negative security selection was Information Technology. Separately, an overweight in Energy hindered performance.
Average Annual Total Return for the period ended May 31, 2013
| 6 Month* | 1 Year | 5 Year | Since Inception† | |||||||||||||||
| AllianzGI Ultra Micro Cap Fund Class A | 26.98% | 38.78% | 15.61% | 14.82% | ||||||||||||||
| AllianzGI Ultra Micro Cap Fund Class A (adjusted)* | 20.00% | 31.14% | 14.31% | 13.61% | |||||||||||||
| AllianzGI Ultra Micro Cap Fund Class P | 27.09% | 39.09% | 15.89% | 15.10% | |||||||||||||
| AllianzGI Ultra Micro Cap Fund Institutional Class | 27.13% | 39.19% | 16.03% | 15.23% | |||||||||||||
| Russell Microcap Growth Index | 23.09% | 33.57% | 7.24% | 7.05% | |||||||||||||
| Lipper Small-Cap Core Fund Average | 19.01% | 29.25% | 6.61% | 7.38% | ||||||||||||||
† The Fund began operations on 1/28/08. Benchmark return comparisons began on the fund inception date. Lipper performance comparisons began on 1/31/08.
* Cumulative return.
Performance quoted represents past performance and is no guarantee of future results. Current performance may be lower or higher than performance shown. For performance current to the most recent month-end, visit our website at us.allianzgi.com. Investment return and the principal value will fluctuate. Shares may be worth more or less than original cost when redeemed. The adjusted returns take into account the maximum initial sales charge of 5.50% on Class A shares. Returns do not reflect deduction of taxes that a shareholder would pay on fund distributions or redemption of fund shares. See pages 94 and 95 for more information. The Fund’s gross expense ratios are 3.36% for Class A shares, 3.08% for Class P shares and 3.15% for Institutional Class shares. This ratio does not include an expense reduction, contractually guaranteed through at least 3/31/14. The Fund’s expense ratios net of this reduction are 2.17% for Class A shares, 2.00% for Class P shares and 2.00% for Institutional Class shares. Expense ratio information is as of the Fund’s current prospectus dated April 1, 2013, as supplemented to date.
| 88 | May 31, 2013 | | Semiannual Report |
Table of Contents
Unaudited
AllianzGI Ultra Micro Cap Fund (formerly Allianz AGIC Ultra Micro Cap Fund) (cont’d)
Cumulative Returns Through May 31, 2013
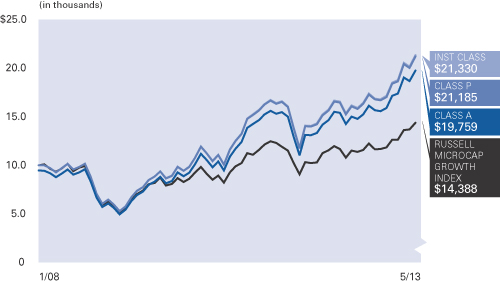
Industry Allocation (as of May 31, 2013)
| Health Care Equipment & Supplies | 14.8% | |||
| Health Care Providers & Services | 5.6% | |||
| Internet Software & Services | 5.3% | |||
| Hotels, Restaurants & Leisure | 4.8% | |||
| Semiconductors & Semiconductor Equipment | 3.3% | |||
| Professional Services | 3.1% | |||
| Thrifts & Mortgage Finance | 3.1% | |||
| Specialty Retail | 3.0% | |||
| Other | 53.5% | |||
| Cash & Equivalents — Net | 3.5% |
| Shareholder Expense Example | Actual Performance | |||||
| Class A | Class P | Institutional Class | ||||
| Beginning Account Value (12/1/12) | $1,000.00 | $1,000.00 | $1,000.00 | |||
| Ending Account Value (5/31/13) | $1,269.80 | $1,270.90 | $1,271.30 | |||
| Expenses Paid During Period | $12.85 | $11.55 | $11.33 | |||
| Hypothetical Performance | ||||||
| (5% return before expenses) | ||||||
| Class A | Class P | Institutional Class | ||||
| Beginning Account Value (12/1/12) | $1,000.00 | $1,000.00 | $1,000.00 | |||
| Ending Account Value (5/31/13) | $1,013.61 | $1,014.76 | $1,014.96 | |||
| Expenses Paid During Period | $11.40 | $10.25 | $10.05 | |||
For each class of the Fund, expenses (net of fee waiver and reimbursement, if any) are equal to the annualized expense ratio for the class (2.27% for Class A, 2.04% for Class P and 2.00% for Institutional Class), multiplied by the average account value over the period, multiplied by 182/365.
| Semiannual Report | | May 31, 2013 | 89 |
Table of Contents
Unaudited
AllianzGI U.S. Emerging Growth Fund (formerly Allianz AGIC U.S. Emerging Growth Fund)
For the period of December 1, 2012 through May 31, 2013, as provided by John McCraw, Portfolio Manager.
Portfolio Insights
For the reporting period ended May 31, 2013, Class A shares at NAV of the AllianzGI U.S. Emerging Growth Fund (the “Fund”) returned 22.40% outperforming the Russell 2000 Growth Index (the “benchmark index”) which returned 21.58%.
The stock market was higher over the reporting period, with major US equity indices recording all-time highs in the period.
Initially, the market moved higher with investors applauding the fiscal budget deal. As the year progressed, healthy fourth-quarter corporate profits, strong US equity asset flows and signs of stabilization in Europe helped drive additional gains. Other factors boosting investor sentiment included M&A and shareholder-friendly announcements as well as continued accommodative global central bank policies. Sequestration fears and hawkish Fed commentary also failed to disrupt the market’s upward trajectory. The Cyprus banking crisis made headlines, however investor reaction in the US was negligible. Indeed, the market’s strength was nearly unwavering.
In April, disappointing global economic data and signs of a softening labor market in the US overshadowed healthy first-quarter corporate earnings and pressured stocks. Market weakness was temporary, however. Stocks rebounded sharply on better-than-expected economic reports and continued to advance as interest rates spiked. In addition, some reallocation of cash into equities helped fuel demand for stocks.
By mid-May, the market became fixated on the timing of stimulus tapering. Comments from Fed Chairman Ben Bernanke capped the market’s ascent and gave way to increased stock market volatility into the end of the reporting period.
Against this backdrop, the Russell 2000 Index returned 19.69% and outperformed the Russell 1000 Index, which returned 16.68%. Within the small-cap universe, growth stocks outpaced value stocks.
Specific to the Russell 2000 Growth Index, performance was positive across all sectors.
Industrials, Health Care and Consumer Discretionary were the strongest-performing sectors followed by Financials and Information Technology. In contrast, Utilities, Materials and Energy stocks closed higher, but underperformed the overall universe by the greatest magnitude.
Performance
The Fund rallied with the market in the reporting period. Strength was evident in a variety of holdings and sectors. From an attribution perspective, security selection positively impacted relative returns whereas asset weighting effects hampered performance. In particular, stock picking in the Industrials, Health Care and Materials sectors had a positive impact on relative returns. Conversely, security selection within the Financials, Information Technology and Consumer Staples sectors detracted and negatively influenced relative performance. Separately, an overweight in Materials and Energy hindered performance.
Average Annual Total Return for the period ended May 31, 2013
| 6 Month* | 1 Year | 5 Year | 10 Year | Since Inception† | ||||||||||||||||||
| AllianzGI AGIC U.S. Emerging Growth Fund Class A | 22.40% | 30.89% | 6.36% | 10.04% | 7.35% | |||||||||||||||||
| AllianzGI AGIC U.S. Emerging Growth Fund Class A (adjusted) | 15.66% | 23.69% | 5.17% | 9.42% | 7.04% | ||||||||||||||||
| AllianzGI AGIC U.S. Emerging Growth Fund Class C | 21.93% | 29.99% | 5.59% | 9.23% | 6.55% | |||||||||||||||||
| AllianzGI AGIC U.S. Emerging Growth Fund Class C (adjusted) | 20.93% | 28.99% | 5.59% | 9.23% | 6.55% | ||||||||||||||||
| AllianzGI AGIC U.S. Emerging Growth Fund Class D | 22.47% | 30.97% | 6.37% | 10.04% | 7.35% | ||||||||||||||||
| AllianzGI AGIC U.S. Emerging Growth Fund Class R | 22.34% | 30.67% | 6.12% | 9.78% | 7.09% | ||||||||||||||||
| AllianzGI AGIC U.S. Emerging Growth Fund Class P | 22.58% | 31.25% | 6.64% | 10.32% | 7.62% | ||||||||||||||||
| AllianzGI AGIC U.S. Emerging Growth Fund Institutional Class | 22.60% | 31.36% | 6.74% | 10.43% | 7.72% | ||||||||||||||||
| Russell 2000 Growth Index | 21.58% | 30.86% | 7.69% | 9.90% | 6.62% | ||||||||||||||||
| Lipper Small-Cap Growth Funds Average | 18.80% | 26.36% | 6.84% | 9.31% | 8.94% | |||||||||||||||||
† The Fund began operations on 10/1/93. Benchmark return comparisons began on the fund inception date. Lipper performance comparisons began on 9/30/93.
* Cumulative return.
Performance quoted represents past performance and is no guarantee of future results. Current performance may be lower or higher than performance shown. For performance current to the most recent month-end, visit our website at us.allianzgi.com. Investment return and the principal value will fluctuate. Shares may be worth more or less than original cost when redeemed. The adjusted returns take into account the maximum initial sales charge of 5.50% on Class A shares and the contingent deferred sales charge (CDSC) of 1% on Class C shares, which may apply to shares redeemed during the first year of ownership. Returns do not reflect deduction of taxes that a shareholder would pay on fund distributions or redemption of fund shares. See pages 94 and 95 for more information. The Fund’s gross expense ratios are 2.45% for Class A shares, 3.16% for Class C shares, 2.36% for Class D shares, 2.60% for Class R shares, 2.25% for Class P shares and 2.09% for Institutional Class shares. These ratios do not include an expense reduction, contractually guaranteed through at least 3/31/14. The Fund’s expense ratios net of this reduction are 1.50% for Class A shares, 2.21% for Class C shares, 1.42% for Class D shares, 1.67% for Class R shares, 1.25% for Class P shares and 1.16% for Institutional Class shares. Expense ratio information is as of the Fund’s current prospectus dated April 1, 2013, as supplemented to date.
| 90 | May 31, 2013 | | Semiannual Report |
Table of Contents
Unaudited
AllianzGI U.S. Emerging Growth Fund (formerly Allianz AGIC U.S. Emerging Growth Fund) (cont’d)
Cumulative Returns Through May 31, 2013
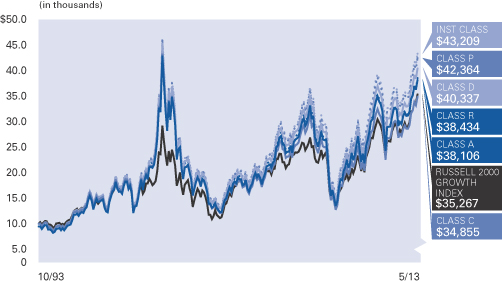
Industry Allocation (as of May 31, 2013)
| Software | 7.0% | |||
| Pharmaceuticals | 5.3% | |||
| Machinery | 5.0% | |||
| Commercial Banks | 4.7% | |||
| Energy Equipment & Services | 4.6% | |||
| Road & Rail | 4.6% | |||
| Oil, Gas & Consumable Fuels | 4.0% | |||
| Semiconductors & Semiconductor Equipment | 3.7% | |||
| Other | 60.2% | |||
| Cash & Equivalents — Net | 0.9% |
| Shareholder Expense Example | Actual Performance | |||||||||||
| Class A | Class C | Class D | Class R | Class P | Institutional Class | |||||||
| Beginning Account Value (12/1/12) | $1,000.00 | $1,000.00 | $1,000.00 | $1,000.00 | $1,000.00 | $1,000.00 | ||||||
| Ending Account Value (5/31/13) | $1,224.00 | $1,219.30 | $1,224.70 | $1,223.40 | $1,225.80 | $1,226.00 | ||||||
| Expenses Paid During Period | $8.32 | $12.23 | $8.10 | $9.26 | $6.94 | $6.38 | ||||||
| Hypothetical Performance | ||||||||||||
| (5% return before expenses) | ||||||||||||
| Class A | Class C | Class D | Class R | Class P | Institutional Class | |||||||
| Beginning Account Value (12/1/12) | $1,000.00 | $1,000.00 | $1,000.00 | $1,000.00 | $1,000.00 | $1,000.00 | ||||||
| Ending Account Value (5/31/13) | $1,017.45 | $1,013.91 | $1,017.65 | $1,016.60 | $1,018.70 | $1,019.20 | ||||||
| Expenses Paid During Period | $7.54 | $11.10 | $7.34 | $8.40 | $6.29 | $5.79 | ||||||
For each class of the Fund, expenses (net of fee waiver and reimbursement, if any) are equal to the annualized expense ratio for the class (1.50% for Class A, 2.21% for Class C, 1.46% for Class D, 1.67% for Class R, 1.25% for Class P and 1.15% for Institutional Class), multiplied by the average account value over the period, multiplied by 182/365.
| Semiannual Report | | May 31, 2013 | 91 |
Table of Contents
Unaudited
AllianzGI U.S. Equity Hedged Fund
For the period of December 3, 2012, through May 31, 2013, as provided by Greg Tournant, Portfolio Manager.
Portfolio Insights
From inception on December 3, 2013 through May 31, 2013, Class A Shares at NAV of AllianzGI US Equity Hedged Fund returned 8.60%, underperforming the S&P 500 Index (the “benchmark index”), which returned 16.98% since the Fund’s inception.
The stock market was higher over the reporting period, with major US equity indices recording all-time highs in the period.
As a reminder, the Fund attempts to provide protection against downside equity-market moves, while asymmetrically preserving the upside potential of the underlying equity portfolio. The strategy uses a combination of index option positions consisting of long puts and short calls that have carefully selected duration and strike profiles.
From an attribution perspective, approximately 40% of our underperformance resulted from
realized losses on our short S&P 500 Index calls. As is typical in the low-VIX environment that prevailed in the first quarter, the strike distances of our one-month short call positions ranged between 3% and 5% out-of-the-money. So over a 30-day period we would be unable to keep pace with any index advance beyond those distances. With the broad equity market advancing so rapidly, the Fund’s gains could not match those of the benchmark index.
The other 60% of our relative underperformance reflected negative mark-to-market valuations on our long S&P 500 Index put positions. Many of these one-year puts were purchased at higher levels of implied volatility, meaning that as the S&P 500 rose and the VIX declined, the puts lost value. While our short call positions benefited from the VIX’s decline, this was more than offset by the unrealized losses from our puts, whose
longer duration gives them greater sensitivity to changes in implied volatility.
While the current volatility environment resembles pre-financial-crisis levels, the VIX has shown signs of jitters. For example, when news of Italy’s deepening political crisis emerged on Feb. 25, the VIX spiked 34% despite just a 1.8% decline in the S&P 500. This represents more than twice the reaction that has been historically observed, and could signify that any future bad news might prompt a swift and sharp reaction from option buyers.
In addition, following such a strong equity-market move during the reporting period, statistical history suggests a high probability of a market correction at some point in 2013. Should such a pullback materialize, the portfolio’s long puts and short calls are expected to be well positioned to narrow its performance gap.
Cumulative Total Return for the period ended May 31, 2013
Since Inception† | ||||||
AllianzGI U.S. Equity Hedged Fund Class A | 8.60% | |||||
| AllianzGI U.S. Equity Hedged Fund Class A (adjusted) | 2.63% | ||||
AllianzGI U.S. Equity Hedged Fund Class C | 8.27% | |||||
| AllianzGI U.S. Equity Hedged Fund Class C (adjusted) | 7.27% | ||||
| AllianzGI U.S. Equity Hedged Fund Class D | 8.67% | ||||
| AllianzGI U.S. Equity Hedged Fund Class P | 8.73% | ||||
| AllianzGI U.S. Equity Hedged Fund Institutional Class | 8.80% | ||||
| S&P 500 Index | 16.98% | ||||
Lipper Equity Market Neutral Funds Average | 7.47% | |||||
† The Fund began operations on 12/3/12. Benchmark return comparisons began on the fund inception date. Lipper performance comparisons began on 11/30/12.
Performance quoted represents past performance and is no guarantee of future results. Current performance may be lower or higher than performance shown. For performance current to the most recent month-end, visit our website at us.allianzgi.com. Investment return and the principal value will fluctuate. Shares may be worth more or less than original cost when redeemed. The adjusted returns take into account the maximum initial sales charge of 5.50% on Class A shares and the contingent deferred sales charge (CDSC) of 1% on Class C shares, which may apply to shares redeemed during the first year of ownership. Returns do not reflect deduction of taxes that a shareholder would pay on fund distributions or redemption of fund shares. See pages 94 and 95 for more information. The Fund’s gross expense ratios are 8.23% for Class A shares, 8.98% for Class C shares, 8.23% for Class D shares, 8.08% for Class P shares and 7.98% for Institutional Class shares. These ratios do not include an expense reduction, contractually guaranteed through at least 3/31/14. The Fund’s expense ratios net of this reduction are 1.25% for Class A shares, 2.00% for Class C shares, 1.25% for Class D shares, 1.10% for Class P shares and 1.00% for Institutional Class shares. Expense ratio information is as of the Fund’s current prospectus dated April 1, 2013, as supplemented to date.
| 92 | May 31, 2013 | | Semiannual Report |
Table of Contents
Unaudited
AllianzGI U.S. Equity Hedged Fund (cont’d)
Cumulative Returns Through May 31, 2013
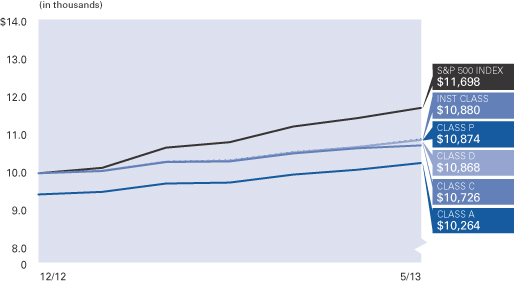
Industry Allocation (as of May 31, 2013)
Oil, Gas & Consumable Fuels | 8.2% | |||
Pharmaceuticals | 5.4% | |||
Insurance | 4.0% | |||
Diversified Financial Services | 3.8% | |||
Computers & Peripherals | 3.8% | |||
IT Services | 3.5% | |||
Media | 3.3% | |||
Software | 3.3% | |||
Other | 57.9% | |||
Cash & Equivalents — Net (including Options Purchased and Written) | 6.8% |
Shareholder Expense Example | Actual Performance | |||||||||
Class A | Class C | Class D | Class P | Institutional | ||||||
Beginning Account Value (12/3/12) | $1,000.00 | $1,000.00 | $1,000.00 | $1,000.00 | $1,000.00 | |||||
Ending Account Value (5/31/13) | $1,086.00 | $1,082.70 | $1,086.00 | $1,087.30 | $1,088.00 | |||||
Expenses Paid During Period | $6.44 | $10.26 | $6.44 | $5.68 | $5.17 | |||||
| Hypothetical Performance | ||||||||||
(5% return before expenses) | ||||||||||
Class A | Class C | Class D | Class P | Institutional Class | ||||||
| Beginning Account Value (12/1/12) | $1,000.00 | $1,000.00 | $1,000.00 | $1,000.00 | $1,000.00 | |||||
Ending Account Value (5/31/13) | $1,018.65 | $1,014.91 | $1,018.65 | $1,019.40 | $1,019.90 | |||||
Expenses Paid During Period | $6.34 | $10.10 | $6.34 | $5.59 | $5.09 | |||||
The Fund commenced operations on December 3, 2012. The Actual expense example is based on the period since inception; the Hypothetical expense example is based on the period beginning December 1, 2012. If the Hypothetical expense example had been based on the period since inception, the Ending Account Value and Expenses Paid During Period would have been: $1,018.34 and $6.24, respectively, for Class A; $1,014.66 and $9.93, respectively, for Class C; $1,018.34 and $6.24, respectively, for Class D; $1,019.08 and $5.50, respectively, for Class P; and $1,019.57 and $5.00, respectively, for Institutional Class.
For each class of the Fund, expenses (net of fee waiver and reimbursement, if any) are equal to the annualized expense ratio for the class (1.26% for Class A, 2.01% for Class C, 1.26% for Class D, 1.11% for Class P and 1.01% for Institutional Class), multiplied by the average account value over the period, multiplied by 179/365 for the Actual expense example and 182/365 for the Hypothetical expense example.
| Semiannual Report | | May 31, 2013 | 93 |
Table of Contents
Unaudited
The inception date on each Fund Summary page is the inception date of the Fund’s oldest share class or classes. The oldest share classes for AllianzGI Global Water Fund are A, C, D, and P, and the Institutional Class shares were first offered in 7/08. The AllianzGI Global Allocation Fund reorganized on May 4, 2009 when its predecessor merged into the Trust. The Global Allocation Fund’s shares were first offered in 9/98. On April 12, 2010, the following funds reorganized when their predecessors merged into series of the Trust (including fund’s inception date): AllianzGI Convertible Fund (4/93), AllianzGI High Yield Bond Fund (7/96), AllianzGI International Small-Cap Fund (12/97), AllianzGI U.S. Emerging Growth Fund (10/93), AllianzGI Micro Cap Fund (7/95), AllianzGI Ultra Micro Cap Fund (1/08). For each of the reorganized funds, Institutional Class is the oldest share class, except that for AllianzGI International Small-Cap Fund, the oldest share class of the predecessor fund merged into Class P.
The Target Date Funds are designed to offer individual investors comprehensive asset allocation strategies tailored to the approximate date when they expect to begin withdrawing assets. The target date included in the Fund’s name does not necessarily represent the specific year an investor will begin withdrawing assets. It is intended only as a general guide. Each Fund follows a target asset allocation schedule that changes over time to help reduce portfolio risk, increasing its exposure to conservative investments as the target date approaches. The principal value of a Fund is not guaranteed at any time, including the target date. A Fund’s shareholders may experiences losses, including losses near, at, or after the target year indicated in the Fund’s name.
Returns measure performance from the inception of the oldest share class to the present, so some returns predate the inception of the actual share class. Those returns are calculated by adjusting the returns of the oldest share class to reflect the indicated share class’s different operating expenses. Total return performance assumes that all dividend and capital gain distributions were reinvested on the payable date.
Class A shares are subject to an initial sales charge. Class C shares are subject to a 1% contingent deferred sales charge (“CDSC”) for shares redeemed in the first year. Class D shares are continuously offered through financial service firms, such as broker-dealers or registered investment advisers. Class R shares are generally available only to 401(k) plans, 457 plans, employer sponsored 403(b) plans, profit sharing and money purchase pension plans, defined benefit plans, non-qualified deferred compensation plans and healthcare benefit funding plans. Class P shares are offered primarily through certain asset allocation, wrap fee and other similar programs offered by broker-dealers and other intermediaries. Institutional Class shares are offered primarily for direct investment by investors such as pension and profit sharing plans, employee benefit trusts, endowments, foundations, corporations and high net worth individuals. Administrative Class shares are offered primarily through employee benefit plan alliances, broker-dealers and other intermediaries. Class R6 shares are offered primarily for 401(k) plans, 457 plans, employer sponsored 403(b) plans, profit sharing and money purchase pension
plans, defined benefit plans, non-qualified deferred compensation plans, healthcare benefit funding plans and other specified benefit plans and accounts whereby the plan or the plan’s broker, dealer or other financial Intermediary has an agreement with the Distributor or the Investment Manager to utilize Class R6 shares In certain Investment products or programs.
Class B shares of Allianz Multi-Strategy Funds are not available for purchase, except through exchanges and dividend reinvestments for any Funds with Class B shares outstanding (currently only AllianzGI Global Allocation Fund).
The Lipper Averages are calculated by Lipper, Inc. They are based on the total return performance, with distributions reinvested and operating expenses deducted, of funds included by Lipper in the stated category. Lipper does not take into account sales charges.
The Cumulative Returns charts for each Fund assume the initial investment was made on the first day of the Fund’s initial fiscal year. The charts reflect any sales load that would have applied at the time of purchase or any CDSC that would have applied if a full redemption occurred on the last business day of the most recent fiscal year. Results assume that all dividends and capital gain distributions were reinvested. They do not take into account the effect of taxes. The benchmark cumulative return began on the last day of the month of the respective Fund’s inception date.
Proxy Voting
The Trust’s Investment Manager and each Sub-Adviser have adopted written proxy voting policies and procedures (“Proxy Policy”) as required by Rule 206(4)-6 under the Investment Advisers Act of 1940. The Proxy Policy has been adopted by Allianz Funds Multi-Strategy Trust (the “Trust”) as the policies and procedures that the Sub-Advisers will use when voting proxies on behalf of the Funds. Copies of the written Proxy Policy and the factors that the Sub-Advisers may consider in determining how to vote proxies for each Fund, and information about how each Fund voted proxies relating to portfolio securities held during the most recent twelve-month period ended June 30, are available without charge, upon request, by calling 1-800-988-8380 (retail classes: A, B, C, D & R) or 1-800-498-5413 (Class P, R6, Institutional and Administrative classes), on the Allianz Global Investors Distributors website at us.allianzgi.com, and on the Securities and Exchange Commission’s (“SEC”) Web site at http://www.sec.gov.
Form N-Q
The Trust files complete schedules of each Fund’s portfolio holdings with the SEC on Form N-Q for the first and third quarters of each fiscal year, which are available on the SEC’s Web site at http://www.sec.gov. A copy of the Trust’s Form N-Q is available without charge, upon request, by calling 1-800-988-8380 (retail classes: A, B, C, D & R) or 1-800-498-5413 (Class P, R6, Institutional and Administrative classes). In addition, the Trust’s Form N-Q may be reviewed and copied at the SEC’s Public Reference Room in Washington, DC. Information on the operation of the Public Reference Room may be obtained by calling 1-800-SEC-0330.
| 94 | May 31, 2013 | | Semiannual Report |
Table of Contents
The following disclosure provides important information regarding each Fund’s Shareholder Expense Example, which appears on each Fund Summary page in this Semiannual Report. Please refer to this information when reviewing the Shareholder Expense Example for a Fund.
Shareholder Expense Example
Shareholders of a Fund incur two types of costs: (1) transaction costs; and (2) ongoing costs, including investment management fees; distribution and/or service (12b-1) fees and other Fund expenses. The Shareholder Expense Example is intended to help shareholders understand ongoing costs (in dollars) of investing in a Fund and to compare these costs with the ongoing costs of investing in other mutual funds. The Shareholder Expense Example is based on an investment of $1,000.00 invested at the beginning of the period, as indicated, and held for the entire period through May 31, 2013.
Actual Expenses
The information in the table under the heading “Actual Performance” provides information about actual account values and actual expenses. You may use the information in these columns, together with the amount you invested, to estimate the expenses that you paid over the period. Simply divide your account value by $1,000.00 (for example, an $8,600.00 account value divided by $1,000.00 = 8.6), then multiply the result by the number in the appropriate column for your share class, in the row entitled “Expenses Paid During Period” to estimate the expenses you paid on your account during this period.
Hypothetical Example for Comparison Purposes
The information in the table under the heading “Hypothetical Performance (5% return before expenses)” provides information about hypothetical account values and hypothetical expenses based on a Fund’s actual expense ratio and an assumed rate of return of 5% per year before expenses, which is not the Fund’s actual return. The hypothetical account values and expenses may not be used to estimate the actual ending account balance or expenses you paid for the period. You may use this information to compare the ongoing costs of investing in a Fund and other funds. To do so, compare this 5% hypothetical example with the 5% hypothetical examples that appear in the shareholder reports of other funds.
Please note that the expenses shown in the table are meant to highlight your ongoing costs only and do not reflect any transactional costs. Therefore, the information under the heading “Hypothetical Performance (5% return before expenses)” is useful in comparing ongoing costs only, and will not help you determine the relative total costs of owning different funds. In addition, if these transactional costs were included, your costs would have been higher.
All the information on the Fund Summary pages, including Portfolio Insights, Average Annual/Cumulative Total Return and Cumulative Return charts, Shareholder Expense Examples and Allocation Summaries, is unaudited.
Allianz Global Investors Distributors LLC, 1633 Broadway, New York, NY, 10019, us.allianzgi.com, 1-800-988-8380 (retail classes: A, B, C, D & R) or 1-800-498-5413 (Class P, R6, Institutional and Administrative classes).
| Semiannual Report | | May 31, 2013 | 95 |
Table of Contents
Unaudited
Unless otherwise noted, index returns reflect the reinvestment of income dividends and capital gains, if any, but do not reflect fees, brokerage commissions or other expenses of investing. It is not possible to invest directly in an index.
Prior to November 1, 2006, performance data for the MSCI Indices was calculated gross of dividend tax withholding. Performance data presently shown for the Indices is net of dividend tax withholding. This recalculation results in lower performance for the Indices.
| Index | Description | |
| Barclays High Yield Index | The Barclays High Yield Index is an unmanaged market-weighted index including only SEC registered and 144(a) securities with fixed (non-variable) coupons. All bonds must have an outstanding principal of $100 million or greater, a remaining maturity of at least one year, a rating of below investment grade and a U.S. Dollar denomination. | |
| Barclays U.S. Aggregate Index | The Barclays U.S. Aggregate Index is composed of securities from the Barclays Government/Credit Bond Index, Mortgage-Backed Securities Index, and Asset-Backed Securities Index. It is generally considered to be representative of the domestic, investment-grade, fixed-rate, taxable bond market. | |
| Barclays U.S. Credit Index | The Barclays U.S. Credit Index is the credit component of the U.S. Government/Credit index. It includes publicly issued U.S. corporate and specified foreign debentures and secured notes that meet the specified maturity, liquidity and quality requirements. To qualify, securities must be rated investment grade (Baa3 or better) by Moody’s. | |
| Barclays U.S. Government Bond Index | The Barclays U.S. Government Bond Index is composed of all publicly issued, nonconvertible, domestic debt of the U.S. Government or any agency thereof, quasi-federal corporations or corporate debt guaranteed by the U.S. Government. | |
| Barclays U.S. Government Inflation-Linked Bond Index | Barclays U.S. Government Inflation-Linked Bond Index measures the performance of the US Treasury Inflation Protected Securities (“TIPS”) market. The index includes TIPS with one or more years remaining maturity with total outstanding issue size of $500m or more. | |
| BofA Merrill Lynch 1-3 Year BB U.S. Cash Pay High Yield Index | The BofA Merrill Lynch 1-3 Year BB U.S. Cash Pay High Yield Index is a subset of The BofA Merrill Lynch U.S. Cash Pay High Yield Index including all securities with a remaining term to final maturity less than 3 years and rated BB1 through BB3, inclusive. The BofA Merrill Lynch U.S. Cash Pay High Yield Index tracks the performance of U.S. dollar denominated below investment grade corporate debt, currently in a coupon paying period, that is publicly issued in the U.S. domestic market. | |
| BofA Merrill Lynch 1-5 year US Inflation Linked Treasury Index | BofA Merrill Lynch 1-5 year US Inflation Linked Treasury Index is an unmanaged index comprised of U.S. Treasury Inflation Protected Securities with at least $1 billion in outstanding face value and a remaining term to final maturity of at least 1 year and less than 5 years. | |
| BofA Merrill Lynch 3-Month U.S. Treasury Bill Index | The BofA Merrill Lynch 3-Month U.S. Treasury Bill Index tracks the performance of the 3-month U.S. Treasury markets. | |
| BofA Merrill Lynch All Convertibles Index | The BofA Merrill Lynch All Convertibles Index is a widely used, unmanaged index that measures the performance of U.S. dollar-denominated convertible securities not currently in bankruptcy with a total market value greater than $50 million at issuance. | |
| BofA Merrill Lynch U.S. High Yield Master II Index | The BofA Merrill Lynch U.S. High Yield Master II Index is an unmanaged index consisting of U.S. dollar denominated bonds that are issued in countries having a BBB3 or higher debt rating with at least one year remaining until maturity. All bonds must have a credit rating below investment grade but not in default. | |
| CBOE Volatility Index | The CBOE Volatility Index is the Chicago Board Options Exchange Market Volatility Index, a popular measure of the implied volatility of S&P 500 Index options. It represents one measure of the market’s expectation of stock market volatility over the next 30 day period. | |
| 96 | May 31, 2013 | | Semiannual Report |
Table of Contents
| Index | Description | |
| Dow Jones Real Return Target Date Index; DJ RR 2015 Index; DJ RR 2020 Index; DJ RR 2025 Index; DJ RR 2030 Index; DJ RR 2035 Index; DJ RR 2040 Index; DJ RR 2045 Index; DJ RR 2050 Index; DJ RR 40+ Index; DJ RR Today Index | Each Dow Jones Real Return Target Date Index is a composite of other indexes. The sub-indexes represent traditional stocks and bonds in addition to real return assets such as inflation-linked bonds, commodities and real estate securities that are considered to potentially counterbalance inflation. The component asset classes are weighted within each index to reflect a targeted level of risk at the beginning and end of the investment horizon. Over time, the weights are adjusted based on predetermined formulas to systematically reduce the level of potential risk as the index’s maturity date approaches. | |
| Dow Jones UBS Commodity Total Return Index | The Dow Jones UBS Commodity Index is composed of futures contracts on 19 physical commodities. | |
| JPMorgan Emerging Market Bond Index | The JPMorgan Emerging Market Bond Index tracks total returns for US dollar-denominated debt instruments issued by emerging market sovereign and quasi-sovereign entities, including Brady bonds, loans and Eurobonds. | |
| MSCI All Country World Ex-U.S. Small-Cap Index | The MSCI All Country World Index ex-U.S. Small-Cap Index covers all investable small-cap securities with a market capitalization below that of the companies in the MSCI Standard Indices (excluding USA), and targets approximately 14% of each market’s free-float adjusted market capitalization. | |
| MSCI All Country World Index (Also known as: MSCI AC World Index and MSCI ACWI) | The MSCI All Country World Index (MSCI ACWI) is a free float-adjusted market capitalization weighted index that is designed to measure the equity market performance of developed and emerging markets. The MSCI ACWI consists of 45 country indices comprising 24 developed and 21 emerging market country indices. | |
| MSCI China Index | The MSCI China Index is a free float-adjusted market capitalization-weighted index of Chinese equities that includes China-affiliated corporations (“Red-chips” or “P-chips”) and China-incorporated corporations listed as “H-shares” on the Hong Kong Exchange or listed as B-shares on the Shanghai and Shenzhen exchanges. | |
| MSCI EAFE Index | The MSCI EAFE Index (Europe, Australasia, Far East) is a free float-adjusted market capitalization index that is designed to measure the equity market performance of developed markets, excluding the U.S. & Canada. | |
| MSCI EAFE Small Cap Index | The MSCI EAFE Small Cap Index captures small cap representation across Developed Markets countries around the world, excluding the U.S. and Canada. | |
| MSCI Emerging Markets Index | The MSCI Emerging Markets Index is a free float-adjusted market capitalization index that is designed to measure equity market performance in emerging markets. | |
| MSCI Europe Index | The MSCI Europe Index is a free float-adjusted market capitalization weighted index that is designed to measure the equity market performance of the developed markets in Europe. | |
| MSCI World Ex-US Small Cap Index | The MSCI World ex-US Small Cap Index captures small cap representation across 23 of 24 of Developed Markets (DM) countries (excluding the United States). | |
| MSCI World Index | The MSCI World Index is a free float-adjusted market capitalization weighted index that is designed to measure the equity market performance of developed markets. | |
| Russell 1000 Index | The Russell 1000 Index is an unmanaged index that consists of the 1,000 largest companies in the Russell 3000 Index and represents approximately 90% of the total market capitalization of the Russell 3000 Index. It is highly correlated with the S&P 500 Index. | |
| Russell 2000 Growth Index | The Russell 2000 Growth Index is an unmanaged index composed of those Russell 2000 companies with higher price-to-book ratios and higher forecasted growth values. | |
| Russell 2000 Index | The Russell 2000 Index measures the performance of the small-cap segment of the U.S. equity universe. The Russell 2000 is a subset of the Russell 3000 Index representing approximately 10% of total market capitalization of that index. | |
| Semiannual Report | | May 31, 2013 | 97 |
Table of Contents
Unaudited
Benchmark Descriptions (cont’d)
| Index | Description | |
| Russell 2500 Growth Index | The Russell 2500 Growth Index is an unmanaged index composed of those Russell 2500 companies with higher price-to-book ratios and higher forecasted growth values. | |
| Russell Microcap Growth Index | The Russell Microcap Growth Index measures the performance of the microcap growth segment of the U.S. Equity market. It includes those Russell Microcap Index companies with higher price-to-book ratios and higher forecasted growth values. | |
| S&P 500 Index | The Standard & Poor’s 500 Index is an unmanaged market index generally considered representative of the stock market as a whole. The Index focuses on the large-cap segment of the U.S. equities market. | |
| S&P Developed Ex-U.S. Small Cap Growth Index | The Standard & Poor’s Developed Ex-U.S. Small Cap Growth Index is an unmanaged index representing small capitalization securities, defined as the bottom 15% of any given country’s available market capitalization excluding the U.S. | |
| S&P Developed Property Index | The S&P Developed Property Index represents the developed markets portion of the S&P Global Property Index. | |
| S&P Developed REIT Index | The S&P Developed REIT Index consists of all real estate investment trusts in developed markets, as defined by S&P Dow Jones Indices. | |
| S&P Emerging Property Index | The S&P Emerging Property Index represents the emerging markets portion of the S&P Global Property Index. | |
| S&P Europe Property Index | The S&P Europe Property Index is a region specific subset of the S&P Global Property Index. Within the S&P Global Property family, property indices are available at world, regional, country and peer group levels. | |
| S&P Global Property Index | The S&P Global Property Index contains more than 530 property companies trading in 36 countries and is market-capitalization weighted, as are many of its sub-indices. All of the constituents are drawn from the S&P Global Broad Market Index. The S&P Global Property Index has sub-indices—the S&P Developed Property, the S&P Emerging Property, and the S&P Global REIT Indices. The Global REIT Index is further broken down into Developed and Emerging Indices. | |
| S&P Global REIT Index | The S&P Global REIT Index consists of all real estate investment trusts in both developed and emerging markets. | |
| S&P Global Water Index | The Standard & Poor’s Global Water Index is comprised of 50 of the largest publicly traded companies in water-related businesses that meet specific invest ability requirements. The Index is designed to provide liquid exposure to the leading publicly-listed companies in the global water industry, from both developed markets and emerging markets. | |
| S&P U.S. Property Index | The S&P U.S. Property Index is a region specific subset of the S&P Global Property Index. Within the S&P Global Property family, property indices are available at world, regional, country and peer group levels. | |
| 98 | May 31, 2013 | | Semiannual Report |
Table of Contents
May 31, 2013 (Unaudited)
AllianzGI Retirement 2015 Fund
| Shares | Value | |||||||
| Mutual Funds—99.4% | ||||||||
AllianzGI Behavioral Advantage Large Cap (a)(b) | 5,807 | $120,670 | ||||||
AllianzGI Disciplined Equity (a)(b) | 6,663 | 120,735 | ||||||
AllianzGI Emerging Markets Opportunities (a)(b) | 9,100 | 236,063 | ||||||
AllianzGI Global Commodity Equity (a)(b) | 11,141 | 188,957 | ||||||
AllianzGI Global Managed Volatility (a)(b) | 20,412 | 351,697 | ||||||
AllianzGI Income & Growth (a)(b) | 76,041 | 955,835 | ||||||
AllianzGI International Small-Cap (a)(b) | 12,524 | 472,785 | ||||||
AllianzGI NFJ Dividend Value (a)(b) | 58,649 | 851,579 | ||||||
AllianzGI NFJ Global Dividend Value (a)(b) | 35,131 | 719,136 | ||||||
AllianzGI NFJ International Value (a)(b) | 16,081 | 354,099 | ||||||
AllianzGI NFJ Mid-Cap Value (a)(b) | 13,035 | 284,552 | ||||||
AllianzGI NFJ Small-Cap Value (a)(b) | 6,699 | 230,459 | ||||||
AllianzGI Short Duration High Income (a)(b) | 37,655 | 600,976 | ||||||
AllianzGI U.S. Emerging Growth (a)(b) | 15,206 | 244,062 | ||||||
AllianzGI U.S. Managed Volatility (a)(b) | 43,250 | 596,411 | ||||||
ING Global Real Estate (c) | 20,661 | 380,775 | ||||||
PIMCO CommoditiesPLUS Strategy (a)(b) | 25,377 | 265,955 | ||||||
PIMCO Commodity RealReturn Strategy (a)(b) | 43,255 | 262,993 | ||||||
PIMCO Floating Income (a)(b) | 107,609 | 962,023 | ||||||
PIMCO Foreign Bond (U.S. Dollar-Hedged) (a)(b) | 155,084 | 1,664,053 | ||||||
PIMCO Income (a)(b) | 171,322 | 2,170,644 | ||||||
PIMCO Mortgage Opportunities (a)(b) | 129,990 | 1,446,792 | ||||||
PIMCO Real Return (a)(b) | 612,503 | 7,203,030 | ||||||
PIMCO RealEstateRealReturn Strategy (a)(b) | 21,684 | 107,336 | ||||||
PIMCO Short-Term (a)(b) | 146,160 | 1,445,519 | ||||||
PIMCO Total Return (a)(b) | 65,208 | 721,849 | ||||||
Wells Fargo Advantage Short-Term High Yield Bond (d) | 103,900 | 859,253 | ||||||
|
| |||||||
| Total Investments (cost—$22,832,110)—99.4% | 23,818,238 | |||||||
|
| |||||||
| Other assets less liabilities—0.6% | 142,616 | |||||||
|
| |||||||
| Net Assets—100.0% | $23,960,854 | |||||||
|
| |||||||
Notes to Schedule of Investments:
(a) Affiliated fund.
(b) Institutional Class share.
(c) Class I share.
(d) Administrator Class share.
AllianzGI Retirement 2020 Fund
| Shares | Value | |||||||
| Mutual Funds—99.2% | ||||||||
AllianzGI Behavioral Advantage Large Cap (a)(b) | 8,160 | $169,556 | ||||||
AllianzGI Disciplined Equity (a)(b) | 9,347 | 169,376 | ||||||
AllianzGI Emerging Markets Opportunities (a)(b) | 19,588 | 508,125 | ||||||
AllianzGI Global Commodity Equity (a)(b) | 19,839 | 336,476 | ||||||
AllianzGI Global Managed Volatility (a)(b) | 31,446 | 541,814 | ||||||
AllianzGI Income & Growth (a)(b) | 108,721 | 1,366,626 | ||||||
AllianzGI International Small-Cap (a)(b) | 17,998 | 679,429 | ||||||
AllianzGI NFJ Dividend Value (a)(b) | 86,414 | 1,254,733 | ||||||
AllianzGI NFJ Global Dividend Value (a)(b) | 61,234 | 1,253,458 | ||||||
AllianzGI NFJ International Value (a)(b) | 23,010 | 506,675 | ||||||
AllianzGI NFJ Mid-Cap Value (a)(b) | 35,315 | 770,920 | ||||||
AllianzGI NFJ Small-Cap Value (a)(b) | 3,734 | 128,456 | ||||||
AllianzGI Short Duration High Income (a)(b) | 53,846 | 859,378 | ||||||
AllianzGI U.S. Emerging Growth (a)(b) | 31,794 | 510,301 | ||||||
AllianzGI U.S. Managed Volatility (a)(b) | 74,009 | 1,020,580 | ||||||
ING Global Real Estate (c) | 30,124 | 555,183 | ||||||
PIMCO CommoditiesPLUS Strategy (a)(b) | 48,734 | 510,734 | ||||||
PIMCO Commodity RealReturn Strategy (a)(b) | 84,491 | 513,703 | ||||||
PIMCO Floating Income (a)(b) | 173,117 | 1,547,670 | ||||||
PIMCO Foreign Bond (U.S. Dollar-Hedged) (a)(b) | 176,772 | 1,896,768 | ||||||
PIMCO Income (a)(b) | 244,992 | 3,104,049 | ||||||
PIMCO Mortgage Opportunities (a)(b) | 185,888 | 2,068,930 | ||||||
PIMCO Real Return (a)(b) | 877,455 | 10,318,872 | ||||||
PIMCO RealEstateRealReturn Strategy (a)(b) | 94,902 | 469,766 | ||||||
PIMCO Short-Term (a)(b) | 104,503 | 1,033,534 | ||||||
PIMCO Total Return (a)(b) | 62,164 | 688,152 | ||||||
Wells Fargo Advantage Short-Term High Yield Bond (d) | 151,448 | 1,252,477 | ||||||
|
| |||||||
| Total Investments (cost—$33,373,077)—99.2% | 34,035,741 | |||||||
|
| |||||||
| Other assets less liabilities—0.8% | 257,681 | |||||||
|
| |||||||
| Net Assets—100.0% | $34,293,422 | |||||||
|
| |||||||
Notes to Schedule of Investments:
(a) Affiliated fund.
(b) Institutional Class share.
(c) Class I share.
(d) Administrator Class share.
AllianzGI Retirement 2025 Fund
| Shares | Value | |||||||
| Mutual Funds—99.3% | ||||||||
AllianzGI Behavioral Advantage Large Cap (a)(b) | 21,025 | $436,896 | ||||||
AllianzGI Disciplined Equity (a)(b) | 27,585 | 499,842 | ||||||
AllianzGI Emerging Markets Opportunities (a)(b) | 24,846 | 644,499 | ||||||
AllianzGI Global Commodity Equity (a)(b) | 19,738 | 334,760 | ||||||
AllianzGI Global Managed Volatility (a)(b) | 40,634 | 700,130 | ||||||
AllianzGI Income & Growth (a)(b) | 106,175 | 1,334,620 | ||||||
AllianzGI International Small-Cap (a)(b) | 19,053 | 719,235 | ||||||
AllianzGI NFJ Dividend Value (a)(b) | 86,639 | 1,257,996 | ||||||
AllianzGI NFJ Global Dividend Value (a)(b) | 68,146 | 1,394,949 | ||||||
AllianzGI NFJ International Value (a)(b) | 29,430 | 648,057 | ||||||
AllianzGI NFJ Mid-Cap Value (a)(b) | 47,020 | 1,026,442 | ||||||
AllianzGI Short Duration High Income (a)(b) | 52,133 | 832,041 | ||||||
AllianzGI U.S. Emerging Growth (a)(b) | 31,839 | 511,017 | ||||||
AllianzGI U.S. Managed Volatility (a)(b) | 70,943 | 978,303 | ||||||
ING Global Real Estate (c) | 28,180 | 519,359 | ||||||
PIMCO CommoditiesPLUS Strategy (a)(b) | 62,667 | 656,746 | ||||||
PIMCO Commodity RealReturn Strategy (a)(b) | 108,174 | 657,696 | ||||||
PIMCO Floating Income (a)(b) | 167,776 | 1,499,917 | ||||||
PIMCO Foreign Bond (U.S. Dollar-Hedged) (a)(b) | 155,353 | 1,666,935 | ||||||
PIMCO Income (a)(b) | 197,845 | 2,506,690 | ||||||
PIMCO Mortgage Opportunities (a)(b) | 181,174 | 2,016,462 | ||||||
PIMCO Real Return (a)(b) | 747,085 | 8,785,722 | ||||||
PIMCO RealEstateRealReturn Strategy (a)(b) | 120,821 | 598,064 | ||||||
PIMCO Short-Term (a)(b) | 84,964 | 840,297 | ||||||
PIMCO Total Return (a)(b) | 44,733 | 495,200 | ||||||
Wells Fargo Advantage Short-Term High Yield Bond (d) | 141,677 | 1,171,665 | ||||||
|
| |||||||
| Total Mutual Funds (cost—$32,667,016) | 32,733,540 | |||||||
|
| |||||||
| Principal Amount (000s) | ||||||||
| Repurchase Agreements—0.8% | ||||||||
State Street Bank & Trust Co., dated 5/31/13, 0.01%, due 6/3/13, proceeds $279,000; collateralized by Freddie Mac, 3.00%, due 8/6/20, valued at $288,919 including accrued interest |
| |||||||
(cost—$279,000) | $279 | 279,000 | ||||||
|
| |||||||
| Total Investments (cost—$32,946,016)—100.1% | 33,012,540 | |||||||
|
| |||||||
| Liabilities in excess of other assets—(0.1)% | (49,190 | ) | ||||||
|
| |||||||
| Net Assets—100.0% | $32,963,350 | |||||||
|
| |||||||
| See accompanying Notes to Financial Statements | | May 31, 2013 | | Semiannual Report | 99 |
Table of Contents
Schedule of Investments
May 31, 2013 (Unaudited)
Notes to Schedule of Investments:
(a) Affiliated fund.
(b) Institutional Class share.
(c) Class I share.
(d) Administrator Class share.
AllianzGI Retirement 2030 Fund
Shares | Value | |||||||
| Mutual Funds—99.2% | ||||||||
AllianzGI Behavioral Advantage Large Cap (a)(b) | 28,876 | $600,041 | ||||||
AllianzGI Disciplined Equity (a)(b) | 66,344 | 1,202,162 | ||||||
AllianzGI Emerging Markets Opportunities (a)(b) | 45,643 | 1,183,983 | ||||||
AllianzGI Global Commodity Equity (a)(b) | 23,438 | 397,506 | ||||||
AllianzGI Global Managed Volatility (a)(b) | 52,320 | 901,479 | ||||||
AllianzGI Income & Growth (a)(b) | 143,717 | 1,806,522 | ||||||
AllianzGI International Managed Volatility (a)(b) | 22,874 | 312,685 | ||||||
AllianzGI International Small-Cap (a)(b) | 31,800 | 1,200,441 | ||||||
AllianzGI NFJ Dividend Value (a)(b) | 111,010 | 1,611,866 | ||||||
AllianzGI NFJ Global Dividend Value (a)(b) | 97,299 | 1,991,719 | ||||||
AllianzGI NFJ International Value (a)(b) | 90,089 | 1,983,750 | ||||||
AllianzGI NFJ Mid-Cap Value (a)(b) | 61,006 | 1,331,772 | ||||||
AllianzGI NFJ Small-Cap Value (a)(b) | 8,161 | 280,739 | ||||||
AllianzGI Short Duration High Income (a)(b) | 63,001 | 1,005,500 | ||||||
AllianzGI U.S. Emerging Growth (a)(b) | 37,982 | 609,611 | ||||||
AllianzGI U.S. Managed Volatility (a)(b) | 100,489 | 1,385,737 | ||||||
ING Global Real Estate (c) | 56,748 | 1,045,871 | ||||||
PIMCO CommoditiesPLUS Strategy (a)(b) | 95,547 | 1,001,337 | ||||||
PIMCO Commodity RealReturn Strategy (a)(b) | 162,635 | 988,821 | ||||||
PIMCO Floating Income (a)(b) | 202,270 | 1,808,292 | ||||||
PIMCO Foreign Bond (U.S. Dollar-Hedged) (a)(b) | 168,645 | 1,809,561 | ||||||
PIMCO Income (a)(b) | 222,742 | 2,822,141 | ||||||
PIMCO Mortgage Opportunities (a)(b) | 217,759 | 2,423,659 | ||||||
PIMCO Real Return (a)(b) | 557,522 | 6,556,457 | ||||||
PIMCO RealEstateRealReturn Strategy (a)(b) | 150,881 | 746,859 | ||||||
PIMCO Short-Term (a)(b) | 81,600 | 807,023 | ||||||
PIMCO Total Return (a)(b) | 36,222 | 400,978 | ||||||
Wells Fargo Advantage Short-Term High Yield Bond (d) | 170,697 | 1,411,663 | ||||||
|
| |||||||
| Total Mutual Funds (cost—$38,294,873) | 39,628,175 | |||||||
|
| |||||||
| Principal Amount (000s) | Value | |||||||
| Repurchase Agreements—0.7% | ||||||||
State Street Bank & Trust Co., dated 5/31/13, 0.01%, due 6/3/13, proceeds $267,000; collateralized by Freddie Mac, 3.00%, due 8/6/20, valued at $273,713 including accrued interest |
| |||||||
(cost—$267,000) | $267 | $267,000 | ||||||
|
| |||||||
| Total Investments (cost—$38,561,873)—99.9% | 39,895,175 | |||||||
|
| |||||||
| Other assets less liabilities—0.1% | 48,095 | |||||||
|
| |||||||
| Net Assets—100.0% | $39,943,270 | |||||||
|
| |||||||
Notes to Schedule of Investments:
(a) Affiliated fund.
(b) Institutional Class share.
(c) Class I share.
(d) Administrator Class share.
| 100 | Semiannual Report | | May 31, 2013 | | See accompanying Notes to Financial Statements |
Table of Contents
Schedule of Investments
May 31, 2013 (Unaudited)
AllianzGI Retirement 2035 Fund
| Shares | Value | |||||||
| Mutual Funds—98.3% | ||||||||
AllianzGI Behavioral Advantage Large Cap (a)(b) | 33,281 | $691,581 | ||||||
AllianzGI Disciplined Equity (a)(b) | 51,324 | 929,992 | ||||||
AllianzGI Emerging Markets Opportunities (a)(b) | 36,001 | 933,861 | ||||||
AllianzGI Global Commodity Equity (a)(b) | 15,738 | 266,915 | ||||||
AllianzGI Global Managed Volatility (a)(b) | 38,455 | 662,584 | ||||||
AllianzGI Income & Growth (a)(b) | 100,194 | 1,259,440 | ||||||
AllianzGI International Managed Volatility (a)(b) | 23,013 | 314,586 | ||||||
AllianzGI International Small-Cap (a)(b) | 28,312 | 1,068,766 | ||||||
AllianzGI NFJ Dividend Value (a)(b) | 92,614 | 1,344,756 | ||||||
AllianzGI NFJ Global Dividend Value (a)(b) | 71,388 | 1,461,317 | ||||||
AllianzGI NFJ International Value (a)(b) | 72,197 | 1,589,770 | ||||||
AllianzGI NFJ Mid-Cap Value (a)(b) | 56,353 | 1,230,182 | ||||||
AllianzGI Short Duration High Income (a)(b) | 42,228 | 673,961 | ||||||
AllianzGI U.S. Emerging Growth (a)(b) | 33,251 | 533,674 | ||||||
AllianzGI U.S. Managed Volatility (a)(b) | 77,390 | 1,067,205 | ||||||
ING Global Real Estate (c) | 46,176 | 851,016 | ||||||
PIMCO CommoditiesPLUS Strategy (a)(b) | 76,449 | 801,184 | ||||||
PIMCO Commodity RealReturn Strategy (a)(b) | 133,336 | 810,683 | ||||||
PIMCO Floating Income (a)(b) | 136,868 | 1,223,604 | ||||||
PIMCO Foreign Bond (U.S. Dollar-Hedged) (a)(b) | 100,820 | 1,081,801 | ||||||
PIMCO Income (a)(b) | 138,749 | 1,757,954 | ||||||
PIMCO Mortgage Opportunities (a)(b) | 121,475 | 1,352,011 | ||||||
PIMCO Real Return (a)(b) | 206,439 | 2,427,720 | ||||||
PIMCO RealEstateRealReturn Strategy (a)(b) | 98,113 | 485,657 | ||||||
PIMCO Short-Term (a)(b) | 27,318 | 270,175 | ||||||
PIMCO Total Return (a)(b) | 24,374 | 269,819 | ||||||
Wells Fargo Advantage Short-Term High Yield Bond (d) | 117,421 | 971,076 | ||||||
|
| |||||||
| Total Mutual Funds (cost—$25,791,321) | 26,331,290 | |||||||
|
| |||||||
| Exchange-Traded Funds—1.0% | ||||||||
| iShares Dow Jones U.S. Real Estate Index (cost—$252,743) | 3,734 | 256,600 | ||||||
|
| |||||||
| Total Investments (cost—$26,044,064)—99.3% | 26,587,890 | |||||||
|
| |||||||
| Other assets less liabilities—0.7% | 188,633 | |||||||
|
| |||||||
| Net Assets—100.0% | $26,776,523 | |||||||
|
| |||||||
Notes to Schedule of Investments:
(a) Affiliated fund.
(b) Institutional Class share.
(c) Class I share.
(d) Administrator Class share.
AllianzGI Retirement 2040 Fund
| Shares | Value | |||||||
| Mutual Funds—97.8% | ||||||||
AllianzGI Behavioral Advantage Large Cap (a)(b) | 30,990 | $643,962 | ||||||
AllianzGI Disciplined Equity (a)(b) | 61,212 | 1,109,169 | ||||||
AllianzGI Emerging Markets Opportunities (a)(b) | 37,780 | 980,013 | ||||||
AllianzGI Global Commodity Equity (a)(b) | 14,497 | 245,863 | ||||||
AllianzGI Global Managed Volatility (a)(b) | 35,649 | 614,237 | ||||||
AllianzGI Income & Growth (a)(b) | 109,090 | 1,371,256 | ||||||
AllianzGI International Managed Volatility (a)(b) | 44,796 | 612,358 | ||||||
AllianzGI International Small-Cap (a)(b) | 30,888 | 1,166,039 | ||||||
AllianzGI NFJ Dividend Value (a)(b) | 101,946 | 1,480,258 | ||||||
AllianzGI NFJ Global Dividend Value (a)(b) | 66,216 | 1,355,450 | ||||||
AllianzGI NFJ International Value (a)(b) | 71,417 | 1,572,598 | ||||||
AllianzGI NFJ Mid-Cap Value (a)(b) | 42,790 | 934,111 | ||||||
AllianzGI NFJ Small-Cap Value (a)(b) | 9,134 | 314,218 | ||||||
AllianzGI Short Duration High Income (a)(b) | 39,318 | 627,519 | ||||||
AllianzGI U.S. Emerging Growth (a)(b) | 34,145 | 548,035 | ||||||
AllianzGI U.S. Managed Volatility (a)(b) | 80,687 | 1,112,674 | ||||||
ING Global Real Estate (c) | 49,642 | 914,908 | ||||||
PIMCO CommoditiesPLUS Strategy (a)(b) | 82,846 | 868,226 | ||||||
PIMCO Commodity RealReturn Strategy (a)(b) | 142,549 | 866,700 | ||||||
PIMCO Floating Income (a)(b) | 126,101 | 1,127,347 | ||||||
PIMCO Foreign Bond (U.S. Dollar-Hedged) (a)(b) | 86,857 | 931,980 | ||||||
PIMCO Income (a)(b) | 118,775 | 1,504,881 | ||||||
PIMCO Mortgage Opportunities (a)(b) | 113,660 | 1,265,036 | ||||||
PIMCO Real Return (a)(b) | 63,945 | 751,997 | ||||||
PIMCO RealEstateRealReturn Strategy (a)(b) | 96,448 | 477,420 | ||||||
Wells Fargo Advantage Short-Term High Yield Bond (d) | 106,658 | 882,065 | ||||||
|
| |||||||
| Total Mutual Funds (cost—$22,791,289) | 24,278,320 | |||||||
|
| |||||||
| Exchange-Traded Funds—1.4% | ||||||||
| iShares Dow Jones U.S. Real Estate Index (cost—$336,366) | 5,129 | 352,465 | ||||||
|
| |||||||
| See accompanying Notes to Financial Statements | | May 31, 2013 | | Semiannual Report | 101 |
Table of Contents
Schedule of Investments
May 31, 2013 (Unaudited)
| Principal Amount (000s) | Value | |||||||
| Repurchase Agreements—0.5% | ||||||||
State Street Bank & Trust Co., dated 5/31/13, 0.01%, due 6/3/13, proceeds $125,000; collateralized by Freddie Mac, 3.00%, due 8/6/20, valued at $131,788 including accrued interest |
| |||||||
(cost-$125,000) | $125 | $125,000 | ||||||
|
| |||||||
| Total Investments (cost—$23,252,655)—99.7% | 24,755,785 | |||||||
|
| |||||||
| Other assets less liabilities—0.3% | 72,339 | |||||||
|
| |||||||
| Net Assets—100.0% | $24,828,124 | |||||||
|
| |||||||
Notes to Schedule of Investments:
(a) Affiliated fund.
(b) Institutional Class share.
(c) Class I share.
(d) Administrator Class share.
AllianzGI Retirement 2045 Fund
Shares | Value | |||||||
| Mutual Funds—97.7% | ||||||||
AllianzGI Behavioral Advantage Large Cap (a)(b) | 20,231 | $420,400 | ||||||
AllianzGI Disciplined Equity (a)(b) | 27,522 | 498,700 | ||||||
AllianzGI Emerging Markets Opportunities (a)(b) | 16,831 | 436,598 | ||||||
AllianzGI Global Commodity Equity (a)(b) | 7,778 | 131,918 | ||||||
AllianzGI Global Managed Volatility (a)(b) | 18,875 | 325,218 | ||||||
AllianzGI Income & Growth (a)(b) | 48,580 | 610,649 | ||||||
AllianzGI International Managed Volatility (a)(b) | 22,142 | 302,686 | ||||||
AllianzGI International Small-Cap (a)(b) | 17,003 | 641,868 | ||||||
AllianzGI NFJ Dividend Value (a)(b) | 46,051 | 668,660 | ||||||
AllianzGI NFJ Global Dividend Value (a)(b) | 32,291 | 661,001 | ||||||
AllianzGI NFJ International Value (a)(b) | 33,886 | 746,164 | ||||||
AllianzGI NFJ Mid-Cap Value (a)(b) | 25,536 | 557,442 | ||||||
AllianzGI Short Duration High Income (a)(b) | 17,425 | 278,099 | ||||||
AllianzGI U.S. Emerging Growth (a)(b) | 17,497 | 280,831 | ||||||
AllianzGI U.S. Managed Volatility (a)(b) | 39,704 | 547,522 | ||||||
ING Global Real Estate (c) | 21,755 | 400,953 | ||||||
PIMCO CommoditiesPLUS Strategy (a)(b) | 38,054 | 398,803 | ||||||
PIMCO Commodity RealReturn Strategy (a)(b) | 64,769 | 393,795 | ||||||
PIMCO Floating Income (a)(b) | 55,948 | 500,178 | ||||||
PIMCO Foreign Bond (U.S. Dollar-Hedged) (a)(b) | 31,094 | 333,640 | ||||||
PIMCO Income (a)(b) | 39,604 | 501,784 | ||||||
PIMCO Mortgage Opportunities (a)(b) | 50,189 | 558,608 | ||||||
PIMCO RealEstateRealReturn Strategy (a)(b) | 41,748 | 206,654 | ||||||
Wells Fargo Advantage Short-Term High Yield Bond (d) | 47,211 | 390,435 | ||||||
|
| |||||||
| Total Mutual Funds (cost—$10,150,497) | 10,792,606 | |||||||
|
| |||||||
| Exchange-Traded Funds—1.4% | ||||||||
| iShares Dow Jones U.S. Real Estate Index (cost—$145,330) | 2,245 | 154,276 | ||||||
|
| |||||||
| Total Investments (cost—$10,295,827)—99.1% | 10,946,882 | |||||||
|
| |||||||
| Other assets less liabilities—0.9% | 100,016 | |||||||
|
| |||||||
| Net Assets—100.0% | $11,046,898 | |||||||
|
| |||||||
Notes to Schedule of Investments:
(a) Affiliated fund.
(b) Institutional Class share.
(c) Class I share.
(d) Administrator Class share.
AllianzGI Retirement 2050 Fund
Shares | Value | |||||||
| Mutual Funds—97.6% | ||||||||
AllianzGI Behavioral Advantage Large Cap (a)(b) | 22,414 | $465,769 | ||||||
AllianzGI Disciplined Equity (a)(b) | 32,186 | 583,217 | ||||||
AllianzGI Emerging Markets Opportunities (a)(b) | 19,930 | 516,974 | ||||||
AllianzGI Global Commodity Equity (a)(b) | 8,187 | 138,848 | ||||||
AllianzGI Global Managed Volatility (a)(b) | 19,866 | 342,296 | ||||||
AllianzGI Income & Growth (a)(b) | 55,422 | 696,654 | ||||||
AllianzGI International Managed Volatility (a)(b) | 24,970 | 341,336 | ||||||
AllianzGI International Small-Cap (a)(b) | 18,381 | 693,884 | ||||||
AllianzGI NFJ Dividend Value (a)(b) | 52,509 | 762,431 | ||||||
AllianzGI NFJ Global Dividend Value (a)(b) | 33,747 | 690,797 | ||||||
AllianzGI NFJ International Value (a)(b) | 36,714 | 808,451 | ||||||
AllianzGI NFJ Mid-Cap Value (a)(b) | 13,897 | 303,377 | ||||||
AllianzGI NFJ Small-Cap Value (a)(b) | 9,943 | 342,026 | ||||||
AllianzGI Short Duration High Income (a)(b) | 18,340 | 292,705 | ||||||
AllianzGI U.S. Emerging Growth (a)(b) | 21,789 | 349,709 | ||||||
AllianzGI U.S. Managed Volatility (a)(b) | 45,968 | 633,905 | ||||||
ING Global Real Estate (c) | 25,948 | 478,216 | ||||||
PIMCO CommoditiesPLUS Strategy (a)(b) | 40,856 | 428,170 | ||||||
PIMCO Commodity RealReturn Strategy (a)(b) | 70,071 | 426,030 | ||||||
PIMCO Floating Income (a)(b) | 58,886 | 526,442 | ||||||
PIMCO Foreign Bond (U.S. Dollar-Hedged) (a)(b) | 32,730 | 351,188 | ||||||
PIMCO Income (a)(b) | 37,053 | 469,462 | ||||||
PIMCO Mortgage Opportunities (a)(b) | 42,103 | 468,609 | ||||||
PIMCO RealEstateRealReturn Strategy (a)(b) | 43,940 | 217,504 | ||||||
|
| |||||||
| Total Mutual Funds (cost—$10,020,679) | 11,328,000 | |||||||
|
| |||||||
| Exchange-Traded Funds—1.4% | ||||||||
| iShares Dow Jones U.S. Real Estate Index (cost—$148,667) | 2,365 | 162,523 | ||||||
|
| |||||||
| Total Investments (cost—$10,169,346)—99.0% | 11,490,523 | |||||||
|
| |||||||
| Other assets less liabilities—1.0% | 120,417 | |||||||
|
| |||||||
| Net Assets—100.0% | $11,610,940 | |||||||
|
| |||||||
Notes to Schedule of Investments:
(a) Affiliated fund.
(b) Institutional Class share.
(c) Class I share.
| 102 | Semiannual Report | | May 31, 2013 | | See accompanying Notes to Financial Statements |
Table of Contents
Schedule of Investments
May 31, 2013 (Unaudited)
AllianzGI Retirement 2055 Fund
| Shares | Value | |||||||
| Mutual Funds—97.8% | ||||||||
AllianzGI Behavioral Advantage Large Cap (a)(b) | 8,259 | $171,627 | ||||||
AllianzGI Disciplined Equity (a)(b) | 11,860 | 214,904 | ||||||
AllianzGI Emerging Markets Opportunities (a)(b) | 7,344 | 190,507 | ||||||
AllianzGI Global Commodity Equity (a)(b) | 3,017 | 51,163 | ||||||
AllianzGI Global Managed Volatility (a)(b) | 7,320 | 126,118 | ||||||
AllianzGI Income & Growth (a)(b) | 20,554 | 258,360 | ||||||
AllianzGI International Managed Volatility (a)(b) | 9,200 | 125,771 | ||||||
AllianzGI International Small-Cap (a)(b) | 6,822 | 257,515 | ||||||
AllianzGI NFJ Dividend Value (a)(b) | 19,349 | 280,941 | ||||||
AllianzGI NFJ Global Dividend Value (a)(b) | 12,524 | 256,358 | ||||||
AllianzGI NFJ International Value (a)(b) | 13,529 | 297,903 | ||||||
AllianzGI NFJ Mid-Cap Value (a)(b) | 10,894 | 237,816 | ||||||
AllianzGI Short Duration High Income (a)(b) | 6,758 | 107,856 | ||||||
AllianzGI U.S. Emerging Growth (a)(b) | 8,143 | 130,699 | ||||||
AllianzGI U.S. Managed Volatility (a)(b) | 16,939 | 233,582 | ||||||
ING Global Real Estate (c) | 9,562 | 176,229 | ||||||
PIMCO CommoditiesPLUS Strategy (a)(b) | 15,168 | 158,957 | ||||||
PIMCO Commodity RealReturn Strategy (a)(b) | 25,820 | 156,984 | ||||||
PIMCO Floating Income (a)(b) | 21,699 | 193,986 | ||||||
PIMCO Foreign Bond (U.S. Dollar-Hedged) (a)(b) | 12,060 | 129,402 | ||||||
PIMCO Income (a)(b) | 13,667 | 173,156 | ||||||
PIMCO Mortgage Opportunities (a)(b) | 15,573 | 173,324 | ||||||
PIMCO RealEstateRealReturn Strategy (a)(b) | 16,191 | 80,146 | ||||||
|
| |||||||
| Total Mutual Funds (cost—$3,723,895) | 4,183,304 | |||||||
|
| |||||||
| Exchange-Traded Funds—1.4% | ||||||||
| iShares Dow Jones U.S. Real Estate Index (cost—$53,239) | 871 | 59,855 | ||||||
|
| |||||||
| Total Investments (cost—$3,777,134)—99.2% | 4,243,159 | |||||||
|
| |||||||
| Other assets less liabilities—0.8% | 35,797 | |||||||
|
| |||||||
| Net Assets—100.0% | $4,278,956 | |||||||
|
| |||||||
Notes to Schedule of Investments:
(a) Affiliated fund.
(b) Institutional Class share.
(c) Class I share.
AllianzGI Retirement Income Fund
| Shares | Value | |||||||
| Mutual Funds—99.5% | ||||||||
AllianzGI Behavioral Advantage Large Cap (a)(b) | 7,473 | $155,290 | ||||||
AllianzGI Emerging Markets Opportunities (a)(b) | 11,669 | 302,694 | ||||||
AllianzGI Global Commodity Equity (a)(b) | 12,583 | 213,401 | ||||||
AllianzGI Global Managed Volatility (a)(b) | 27,141 | 467,648 | ||||||
AllianzGI Income & Growth (a)(b) | 99,059 | 1,245,178 | ||||||
AllianzGI International Small-Cap (a)(b) | 14,558 | 549,553 | ||||||
AllianzGI NFJ Dividend Value (a)(b) | 75,278 | 1,093,038 | ||||||
AllianzGI NFJ Global Dividend Value (a)(b) | 45,074 | 922,657 | ||||||
AllianzGI NFJ International Value (a)(b) | 13,779 | 303,406 | ||||||
AllianzGI NFJ Mid-Cap Value (a)(b) | 8,305 | 181,301 | ||||||
AllianzGI NFJ Small-Cap Value (a)(b) | 8,355 | 287,428 | ||||||
AllianzGI Short Duration High Income (a)(b) | 48,851 | 779,662 | ||||||
AllianzGI U.S. Emerging Growth (a)(b) | 19,737 | 316,775 | ||||||
AllianzGI U.S. Managed Volatility (a)(b) | 56,686 | 781,703 | ||||||
ING Global Real Estate (c) | 28,519 | 525,610 | ||||||
PIMCO CommoditiesPLUS Strategy (a)(b) | 29,625 | 310,470 | ||||||
PIMCO Commodity RealReturn Strategy (a)(b) | 50,486 | 306,954 | ||||||
PIMCO Floating Income (a)(b) | 86,876 | 776,675 | ||||||
PIMCO Foreign Bond (U.S. Dollar-Hedged) (a)(b) | 221,412 | 2,375,752 | ||||||
PIMCO Income (a)(b) | 246,605 | 3,124,486 | ||||||
PIMCO Mortgage Opportunities (a)(b) | 197,325 | 2,196,223 | ||||||
PIMCO Real Return (a)(b) | 788,517 | 9,272,960 | ||||||
PIMCO RealEstateRealReturn Strategy (a)(b) | 31,849 | 157,653 | ||||||
PIMCO Short-Term (a)(b) | 221,792 | 2,193,520 | ||||||
PIMCO Total Return (a)(b) | 84,392 | 934,215 | ||||||
Wells Fargo Advantage Short-Term High Yield Bond (d) | 132,542 | 1,096,119 | ||||||
|
| |||||||
| Total Mutual Funds (cost—$29,524,061) | 30,870,371 | |||||||
|
| |||||||
| Principal Amount (000s) | ||||||||
| Repurchase Agreements—1.0% | ||||||||
State Street Bank & Trust Co., dated 5/31/13, 0.01%, due 6/3/13, proceeds $297,000; collateralized by Freddie Mac, 3.00%, due 8/6/20, valued at $304,125 including accrued interest |
| |||||||
(cost—$297,000) | $297 | 297,000 | ||||||
|
| |||||||
| Total Investments (cost—$29,821,061)—100.5% | 31,167,371 | |||||||
|
| |||||||
| Liabilities in excess of other assets—(0.5)% | (141,349 | ) | ||||||
|
| |||||||
| Net Assets—100.0% | $31,026,022 | |||||||
|
| |||||||
Notes to Schedule of Investments:
(a) Affiliated fund.
(b) Institutional Class share.
(c) Class I share.
(d) Administrator Class share.
| See accompanying Notes to Financial Statements | | May 31, 2013 | | Semiannual Report | 103 |
Table of Contents
Schedule of Investments
May 31, 2013 (Unaudited)
AllianzGI Global Allocation Fund
| Shares | Value | |||||||
| Mutual Funds—99.8% | ||||||||
AllianzGI Behavioral Advantage Large Cap (a)(b) | 191,092 | $3,970,899 | ||||||
AllianzGI Disciplined Equity (a)(b) | 345,915 | 6,267,976 | ||||||
AllianzGI Emerging Markets Opportunities (a)(b) | 315,271 | 8,178,141 | ||||||
AllianzGI Global Commodity Equity (a)(b) | 171,688 | 2,911,829 | ||||||
AllianzGI Global Managed Volatility (a)(b) | 447,914 | 7,717,561 | ||||||
AllianzGI Income & Growth (a)(b) | 502,796 | 6,320,143 | ||||||
AllianzGI International Managed Volatility (a)(b) | 443,543 | 6,063,234 | ||||||
AllianzGI International Small-Cap (a)(b) | 220,640 | 8,329,141 | ||||||
AllianzGI NFJ Dividend Value (a)(b) | 573,703 | 8,330,175 | ||||||
AllianzGI NFJ Global Dividend Value (a)(b) | 558,746 | 11,437,530 | ||||||
AllianzGI NFJ International Value (a)(b) | 795,460 | 17,516,019 | ||||||
AllianzGI NFJ Mid-Cap Value (a)(b) | 4 | 89 | ||||||
AllianzGI NFJ Small-Cap Value (a)(b) | 223,630 | 7,692,855 | ||||||
AllianzGI Short Duration High Income (a)(b) | 329,200 | 5,254,036 | ||||||
AllianzGI U.S. Emerging Growth (a)(b) | 325,064 | 5,217,271 | ||||||
AllianzGI U.S. Managed Volatility (a)(b) | 494,687 | 6,821,737 | ||||||
ING Global Real Estate (c) | 331,756 | 6,114,263 | ||||||
PIMCO CommoditiesPLUS Strategy (a)(b) | 298,627 | 3,129,607 | ||||||
PIMCO Commodity RealReturn Strategy (a)(b) | 500,279 | 3,041,694 | ||||||
PIMCO Floating Income (a)(b) | 1,524,407 | 13,628,194 | ||||||
PIMCO Foreign Bond (U.S. Dollar-Hedged) (a)(b) | 1,366,131 | 14,658,581 | ||||||
PIMCO Income | 1,661,225 | 21,047,722 | ||||||
PIMCO Mortgage Opportunities | 1,133,945 | 12,620,813 | ||||||
PIMCO Short-Term (a)(b) | 851,731 | 8,423,615 | ||||||
PIMCO Total Return (a)(b) | 569,927 | 6,309,090 | ||||||
Wells Fargo Advantage Short-Term High Yield Bond (d) | 883,551 | 7,306,969 | ||||||
|
| |||||||
| Total Mutual Funds (cost—$181,437,900) | 208,309,184 | |||||||
|
| |||||||
| Principal Amount (000s) | Value | |||||||
| Repurchase Agreements—0.3% | ||||||||
State Street Bank & Trust Co., dated 5/31/13, 0.01%, due 6/3/13, proceeds $707,001; collateralized by Freddie Mac, 3.00%, due 8/6/20, valued at $724,831 including accrued interest |
| |||||||
(cost—$707,000) | $707 | $707,000 | ||||||
|
| |||||||
| Total Investments (cost—$182,144,900)—100.1% | 209,016,184 | |||||||
|
| |||||||
| Liabilities in excess of other assets—(0.1)% | (238,911 | ) | ||||||
|
| |||||||
| Net Assets—100.0% | $208,777,273 | |||||||
|
| |||||||
Notes to Schedule of Investments:
(a) Affiliated fund.
(b) Institutional Class share.
(c) Class I share.
(d) Administrator Class share.
AllianzGI Global Growth Allocation Fund
| Shares | Value | |||||||
| Mutual Funds—97.8% | ||||||||
AllianzGI Behavioral Advantage Large Cap (a)(b) | 24,616 | $511,526 | ||||||
AllianzGI Disciplined Equity (a)(b) | 14,116 | 255,789 | ||||||
AllianzGI Emerging Markets Opportunities (a)(b) | 19,560 | 507,392 | ||||||
AllianzGI Global Commodity Equity (a)(b) | 19,008 | 322,370 | ||||||
AllianzGI Global Managed Volatility (a)(b) | 19,616 | 337,990 | ||||||
AllianzGI Income & Growth (a)(b) | 18,419 | 231,521 | ||||||
AllianzGI International Managed Volatility (a)(b) | 24,655 | 337,040 | ||||||
AllianzGI International Small-Cap (a)(b) | 7,884 | 297,615 | ||||||
AllianzGI NFJ Dividend Value (a)(b) | 23,509 | 341,344 | ||||||
AllianzGI NFJ Emerging Markets Value (a)(b) | 17,650 | 279,397 | ||||||
AllianzGI NFJ Global Dividend Value (a)(b) | 16,648 | 340,792 | ||||||
AllianzGI NFJ International Small Cap Value (a)(b) | 15,813 | 299,175 | ||||||
AllianzGI NFJ International Value (a)(b) | 23,201 | 510,876 | ||||||
AllianzGI NFJ Mid-Cap Value (a)(b) | 1,472 | 32,126 | ||||||
AllianzGI NFJ Small-Cap Value (a)(b) | 14,008 | 481,884 | ||||||
AllianzGI Short Duration High Income (a)(b) | 10,783 | 172,103 | ||||||
AllianzGI U.S. Emerging Growth (a)(b) | 16,074 | 257,993 | ||||||
AllianzGI U.S. Managed Volatility (a)(b) | 43,340 | 597,653 | ||||||
ING Global Real Estate (c) | 21,203 | 390,764 | ||||||
PIMCO CommoditiesPLUS Strategy (a)(b) | 16,302 | 170,849 | ||||||
PIMCO Floating Income (a)(b) | 57,865 | 517,310 | ||||||
PIMCO Income (a)(b) | 30,659 | 388,448 | ||||||
PIMCO International StocksPLUS AR Strategy (U.S. Dollar-Hedged) | 54,327 | 422,123 | ||||||
PIMCO Mortgage Opportunities (a)(b) | 31,045 | 345,531 | ||||||
|
| |||||||
| Total Mutual Funds (cost—$7,059,113) | 8,349,611 | |||||||
|
| |||||||
| Exchange-Traded Funds—1.3% | ||||||||
| iShares Dow Jones U.S. Real Estate Index (cost—$100,886) | 1,660 | 114,075 | ||||||
|
| |||||||
| Total Investments (cost—$7,159,999)—99.1% | 8,463,686 | |||||||
|
| |||||||
| Other assets less liabilities—0.9% | 75,602 | |||||||
|
| |||||||
| Net Assets—100.0% | $8,539,288 | |||||||
|
| |||||||
Notes to Schedule of Investments:
(a) Affiliated fund.
(b) Institutional Class share.
(c) Class I share.
| 104 | Semiannual Report | | May 31, 2013 | | See accompanying Notes to Financial Statements |
Table of Contents
Schedule of Investments
May 31, 2013 (Unaudited)
AllianzGI Behavioral Advantage Large Cap Fund
| Shares | Value | |||||||
| Common Stock—99.5% | ||||||||
| Aerospace & Defense—2.5% | ||||||||
Alliant Techsystems, Inc. | 200 | $15,704 | ||||||
Boeing Co. | 3,400 | 336,668 | ||||||
DigitalGlobe, Inc. (a) | 400 | 12,092 | ||||||
Honeywell International, Inc. | 1,800 | 141,228 | ||||||
L-3 Communications Holdings, Inc. | 1,150 | 97,853 | ||||||
Lockheed Martin Corp. | 1,650 | 174,619 | ||||||
Northrop Grumman Corp. | 850 | 70,032 | ||||||
Raytheon Co. | 800 | 53,312 | ||||||
Rockwell Collins, Inc. | 350 | 22,663 | ||||||
Textron, Inc. | 500 | 13,480 | ||||||
|
| |||||||
| 937,651 | ||||||||
|
| |||||||
| Air Freight & Logistics—0.8% | ||||||||
Expeditors International of Washington, Inc. | 300 | 11,709 | ||||||
FedEx Corp. | 800 | 77,072 | ||||||
United Parcel Service, Inc., Class B | 2,200 | 188,980 | ||||||
|
| |||||||
| 277,761 | ||||||||
|
| |||||||
| Airlines—0.7% | ||||||||
Alaska Air Group, Inc. (a) | 400 | 22,728 | ||||||
Allegiant Travel Co. | 200 | 18,502 | ||||||
Delta Air Lines, Inc. (a) | 5,750 | 103,558 | ||||||
Southwest Airlines Co. | 5,700 | 80,769 | ||||||
United Continental Holdings, Inc. (a) | 700 | 22,722 | ||||||
|
| |||||||
| 248,279 | ||||||||
|
| |||||||
| Auto Components—0.4% | ||||||||
Cooper Tire & Rubber Co. | 500 | 12,920 | ||||||
Delphi Automotive PLC | 1,100 | 53,691 | ||||||
Goodyear Tire & Rubber Co. (a) | 1,900 | 28,766 | ||||||
Lear Corp. | 400 | 23,992 | ||||||
TRW Automotive Holdings Corp. (a) | 600 | 38,010 | ||||||
|
| |||||||
| 157,379 | ||||||||
|
| |||||||
| Automobiles—0.7% | ||||||||
General Motors Co. (a) | 6,300 | 213,507 | ||||||
Harley-Davidson, Inc. | 700 | 38,178 | ||||||
|
| |||||||
| 251,685 | ||||||||
|
| |||||||
| Beverages—1.6% | ||||||||
Brown-Forman Corp., Class B | 600 | 41,292 | ||||||
Coca-Cola Co. | 3,500 | 139,965 | ||||||
Coca-Cola Enterprises, Inc. | 1,100 | 40,876 | ||||||
PepsiCo, Inc. | 4,650 | 375,581 | ||||||
|
| |||||||
| 597,714 | ||||||||
|
| |||||||
| Biotechnology—3.2% | ||||||||
Acorda Therapeutics, Inc. (a) | 400 | 13,380 | ||||||
Amgen, Inc. | 2,850 | 286,510 | ||||||
Biogen Idec, Inc. (a) | 1,400 | 332,486 | ||||||
Celgene Corp. (a) | 1,350 | 166,928 | ||||||
Gilead Sciences, Inc. (a) | 3,300 | 179,784 | ||||||
Pharmacyclics, Inc. (a) | 600 | 54,984 | ||||||
Vertex Pharmaceuticals, Inc. (a) | 1,800 | 144,558 | ||||||
|
| |||||||
| 1,178,630 | ||||||||
|
| |||||||
| Building Products—0.3% | ||||||||
AO Smith Corp. | 400 | 15,680 | ||||||
Fortune Brands Home & Security, Inc. | 300 | 12,684 | ||||||
Lennox International, Inc. | 200 | 12,798 | ||||||
Masco Corp. | 2,300 | 48,346 | ||||||
| Shares | Value | |||||||
Nortek, Inc. (a) | 200 | $14,130 | ||||||
|
| |||||||
| 103,638 | ||||||||
|
| |||||||
| Capital Markets—2.8% | ||||||||
Affiliated Managers Group, Inc. (a) | 100 | 16,400 | ||||||
American Capital Ltd. (a) | 800 | 10,664 | ||||||
Ameriprise Financial, Inc. | 850 | 69,292 | ||||||
Bank of New York Mellon Corp. | 3,800 | 114,228 | ||||||
Charles Schwab Corp. | 1,000 | 19,860 | ||||||
Financial Engines, Inc. | 300 | 12,936 | ||||||
Franklin Resources, Inc. | 750 | 116,107 | ||||||
Goldman Sachs Group, Inc. | 1,600 | 259,328 | ||||||
Greenhill & Co., Inc. | 100 | 4,981 | ||||||
Morgan Stanley | 2,400 | 62,160 | ||||||
Northern Trust Corp. | 700 | 40,705 | ||||||
Raymond James Financial, Inc. | 300 | 13,191 | ||||||
SEI Investments Co. | 1,350 | 41,324 | ||||||
State Street Corp. | 2,100 | 138,978 | ||||||
T Rowe Price Group, Inc. | 600 | 45,516 | ||||||
TD Ameritrade Holding Corp. | 600 | 14,064 | ||||||
Virtus Investment Partners, Inc. (a) | 100 | 23,186 | ||||||
Waddell & Reed Financial, Inc., Class A | 1,000 | 46,040 | ||||||
|
| |||||||
| 1,048,960 | ||||||||
|
| |||||||
| Chemicals—2.6% | ||||||||
Axiall Corp. | 518 | 22,352 | ||||||
CF Industries Holdings, Inc. | 100 | 19,096 | ||||||
Chemtura Corp. (a) | 500 | 11,465 | ||||||
Ecolab, Inc. | 700 | 59,129 | ||||||
EI du Pont de Nemours & Co. | 1,100 | 61,369 | ||||||
Huntsman Corp. | 600 | 11,670 | ||||||
International Flavors & Fragrances, Inc. | 300 | 24,087 | ||||||
LyondellBasell Industries NV, Class A | 1,800 | 119,970 | ||||||
Monsanto Co. | 2,850 | 286,824 | ||||||
Mosaic Co. | 300 | 18,246 | ||||||
NewMarket Corp. | 50 | 13,712 | ||||||
PPG Industries, Inc. | 683 | 104,916 | ||||||
Praxair, Inc. | 350 | 40,015 | ||||||
Sherwin-Williams Co. | 500 | 94,265 | ||||||
Sigma-Aldrich Corp. | 200 | 16,732 | ||||||
Stepan Co. | 100 | 5,403 | ||||||
Valspar Corp. | 300 | 21,501 | ||||||
Westlake Chemical Corp. | 200 | 18,680 | ||||||
|
| |||||||
| 949,432 | ||||||||
|
| |||||||
| Commercial Banks—1.9% | ||||||||
CapitalSource, Inc. | 1,200 | 11,292 | ||||||
East West Bancorp, Inc. | 500 | 13,170 | ||||||
Fifth Third Bancorp | 1,000 | 18,200 | ||||||
U.S. Bancorp | 550 | 19,283 | ||||||
Wells Fargo & Co. | 14,500 | 587,975 | ||||||
Zions Bancorporation | 1,600 | 44,880 | ||||||
|
| |||||||
| 694,800 | ||||||||
|
| |||||||
| Commercial Services & Supplies—0.7% | ||||||||
Avery Dennison Corp. | 600 | 26,100 | ||||||
Cintas Corp. | 600 | 27,393 | ||||||
Copart, Inc. (a) | 400 | 13,756 | ||||||
Deluxe Corp. | 400 | 14,960 | ||||||
Mine Safety Appliances Co. | 200 | 9,984 | ||||||
Rollins, Inc. | 700 | 17,682 | ||||||
Steelcase, Inc., Class A | 600 | 8,304 | ||||||
Tyco International Ltd. | 4,400 | 148,764 | ||||||
|
| |||||||
| 266,943 | ||||||||
|
| |||||||
| Communications Equipment—1.3% | ||||||||
Cisco Systems, Inc. | 10,850 | 261,268 | ||||||
| Shares | Value | |||||||
Harris Corp. | 400 | $20,052 | ||||||
Motorola Solutions, Inc. | 1,900 | 110,124 | ||||||
Plantronics, Inc. | 150 | 6,930 | ||||||
QUALCOMM, Inc. | 1,100 | 69,828 | ||||||
|
| |||||||
| 468,202 | ||||||||
|
| |||||||
| Computers & Peripherals—2.0% | ||||||||
Apple, Inc. | 550 | 247,324 | ||||||
Hewlett-Packard Co. | 9,900 | 241,758 | ||||||
NetApp, Inc. (a) | 2,500 | 93,825 | ||||||
Western Digital Corp. | 2,250 | 142,470 | ||||||
|
| |||||||
| 725,377 | ||||||||
|
| |||||||
| Construction & Engineering—0.1% | ||||||||
AECOM Technology Corp. (a) | 600 | 18,474 | ||||||
Fluor Corp. | 200 | 12,642 | ||||||
MasTec, Inc. (a) | 400 | 12,720 | ||||||
|
| |||||||
| 43,836 | ||||||||
|
| |||||||
| Consumer Finance—1.0% | ||||||||
American Express Co. | 3,850 | 291,483 | ||||||
Credit Acceptance Corp. (a) | 100 | 11,386 | ||||||
Discover Financial Services | 850 | 40,299 | ||||||
Portfolio Recovery Associates, Inc. (a) | 100 | 15,227 | ||||||
|
| |||||||
| 358,395 | ||||||||
|
| |||||||
| Containers & Packaging—0.4% | ||||||||
Ball Corp. | 250 | 10,790 | ||||||
Bemis Co., Inc. | 200 | 7,830 | ||||||
Crown Holdings, Inc. (a) | 300 | 12,705 | ||||||
Graphic Packaging Holding Co. (a) | 3,600 | 27,684 | ||||||
Packaging Corp. of America | 400 | 19,600 | ||||||
Sealed Air Corp. | 900 | 21,618 | ||||||
Silgan Holdings, Inc. | 700 | 32,739 | ||||||
|
| |||||||
| 132,966 | ||||||||
|
| |||||||
| Distributors—0.1% | ||||||||
Genuine Parts Co. | 350 | 27,209 | ||||||
Pool Corp. | 200 | 10,290 | ||||||
|
| |||||||
| 37,499 | ||||||||
|
| |||||||
| Diversified Consumer Services—0.2% | ||||||||
H&R Block, Inc. | 2,050 | 60,004 | ||||||
Service Corp. International | 600 | 10,788 | ||||||
|
| |||||||
| 70,792 | ||||||||
|
| |||||||
| Diversified Financial Services—2.9% | ||||||||
Bank of America Corp. | 17,100 | 233,586 | ||||||
CBOE Holdings, Inc. | 1,200 | 48,168 | ||||||
Citigroup, Inc. | 3,000 | 155,970 | ||||||
IntercontinentalExchange, Inc. (a) | 200 | 34,242 | ||||||
JPMorgan Chase & Co. | 7,500 | 409,425 | ||||||
McGraw Hill Financial, Inc. | 1,100 | 60,005 | ||||||
Moody’s Corp. | 2,150 | 142,846 | ||||||
|
| |||||||
| 1,084,242 | ||||||||
|
| |||||||
| Diversified Telecommunication Services—2.9% | ||||||||
AT&T, Inc. | 14,750 | 516,102 | ||||||
Verizon Communications, Inc. | 11,250 | 545,400 | ||||||
|
| |||||||
| 1,061,502 | ||||||||
|
| |||||||
| Electric Utilities—0.5% | ||||||||
American Electric Power Co., Inc. | 600 | 27,492 | ||||||
Edison International | 2,500 | 114,850 | ||||||
OGE Energy Corp. | 300 | 20,361 | ||||||
Pinnacle West Capital Corp. | 500 | 28,240 | ||||||
UIL Holdings Corp. | 300 | 11,688 | ||||||
|
| |||||||
| 202,631 | ||||||||
|
| |||||||
| See accompanying Notes to Financial Statements | | May 31, 2013 | | Semiannual Report | 105 |
Table of Contents
Schedule of Investments
May 31, 2013 (Unaudited)
| Shares | Value | |||||||
| Electrical Equipment—0.6% | ||||||||
AMETEK, Inc. | 1,050 | $45,307 | ||||||
Emerson Electric Co. | 2,050 | 117,793 | ||||||
Hubbell, Inc., Class B | 150 | 15,065 | ||||||
Rockwell Automation, Inc. | 600 | 52,812 | ||||||
|
| |||||||
| 230,977 | ||||||||
|
| |||||||
| Electronic Equipment, Instruments & Components—0.2% | ||||||||
Amphenol Corp., Class A | 550 | 42,845 | ||||||
Arrow Electronics, Inc. (a) | 300 | 11,928 | ||||||
National Instruments Corp. | 300 | 8,520 | ||||||
|
| |||||||
| 63,293 | ||||||||
|
| |||||||
| Energy Equipment & Services—0.8% | ||||||||
Forum Energy Technologies, Inc. (a) | 300 | 8,907 | ||||||
Halliburton Co. | 2,000 | 83,700 | ||||||
Oceaneering International, Inc. | 350 | 25,368 | ||||||
Schlumberger Ltd. | 2,300 | 167,969 | ||||||
|
| |||||||
| 285,944 | ||||||||
|
| |||||||
| Food & Staples Retailing—3.8% | ||||||||
Costco Wholesale Corp. | 1,600 | 175,472 | ||||||
CVS Caremark Corp. | 4,700 | 270,626 | ||||||
Kroger Co. | 3,600 | 121,212 | ||||||
Sysco Corp. | 300 | 10,140 | ||||||
Wal-Mart Stores, Inc. | 8,200 | 613,688 | ||||||
Walgreen Co. | 4,100 | 195,816 | ||||||
|
| |||||||
| 1,386,954 | ||||||||
|
| |||||||
| Food Products—1.9% | ||||||||
Archer-Daniels-Midland Co. | 900 | 29,007 | ||||||
Campbell Soup Co. | 1,000 | 42,810 | ||||||
Dean Foods Co. (a) | 1,000 | 10,490 | ||||||
Flowers Foods, Inc. | 500 | 16,685 | ||||||
General Mills, Inc. | 900 | 42,372 | ||||||
Hershey Co. | 1,700 | 151,487 | ||||||
Hillshire Brands Co. | 1,500 | 51,960 | ||||||
Hormel Foods Corp. | 1,350 | 53,757 | ||||||
Ingredion, Inc. | 200 | 13,624 | ||||||
J&J Snack Foods Corp. | 100 | 7,590 | ||||||
JM Smucker Co. | 400 | 40,384 | ||||||
Kellogg Co. | 900 | 55,845 | ||||||
Lancaster Colony Corp. | 100 | 8,247 | ||||||
McCormick & Co., Inc. | 200 | 13,816 | ||||||
Mead Johnson Nutrition Co. | 550 | 44,589 | ||||||
Mondelez International, Inc., Class A | 2,000 | 58,920 | ||||||
Tyson Foods, Inc., Class A | 1,400 | 35,000 | ||||||
WhiteWave Foods Co., Class A (a) | 255 | 4,455 | ||||||
WhiteWave Foods Co., Class B (a) | 364 | 6,017 | ||||||
|
| |||||||
| 687,055 | ||||||||
|
| |||||||
| Gas Utilities—0.0% | ||||||||
National Fuel Gas Co. | 300 | 18,360 | ||||||
|
| |||||||
| Health Care Equipment & Supplies—2.5% | ||||||||
Abbott Laboratories | 4,450 | 163,181 | ||||||
Baxter International, Inc. | 1,450 | 101,978 | ||||||
Becton Dickinson and Co. | 1,000 | 98,620 | ||||||
Boston Scientific Corp. (a) | 3,800 | 35,112 | ||||||
CareFusion Corp. (a) | 600 | 22,050 | ||||||
Covidien PLC | 1,350 | 85,860 | ||||||
CR Bard, Inc. | 100 | 10,309 | ||||||
IDEXX Laboratories, Inc. (a) | 100 | 8,244 | ||||||
Intuitive Surgical, Inc. (a) | 20 | 9,951 | ||||||
Medtronic, Inc. | 2,800 | 142,828 | ||||||
ResMed, Inc. | 800 | 38,400 | ||||||
Sirona Dental Systems, Inc. (a) | 300 | 21,282 | ||||||
STERIS Corp. | 200 | 9,068 | ||||||
Stryker Corp. | 1,150 | 76,349 | ||||||
Varian Medical Systems, Inc. (a) | 350 | 23,454 | ||||||
| Shares | Value | |||||||
West Pharmaceutical Services, Inc. | 200 | $13,710 | ||||||
Zimmer Holdings, Inc. | 700 | 54,957 | ||||||
|
| |||||||
| 915,353 | ||||||||
|
| |||||||
| Health Care Providers & Services—1.8% | ||||||||
Aetna, Inc. | 1,400 | 84,532 | ||||||
Air Methods Corp. | 200 | 7,488 | ||||||
AmerisourceBergen Corp. | 2,200 | 118,976 | ||||||
Brookdale Senior Living, Inc. (a) | 300 | 8,505 | ||||||
Cardinal Health, Inc. | 1,400 | 65,744 | ||||||
Centene Corp. (a) | 400 | 19,800 | ||||||
Cigna Corp. | 700 | 47,530 | ||||||
HCA Holdings, Inc. | 1,450 | 56,637 | ||||||
Health Management Associates, Inc., Class A (a) | 900 | 12,411 | ||||||
HealthSouth Corp. (a) | 300 | 8,787 | ||||||
Henry Schein, Inc. (a) | 150 | 14,443 | ||||||
Humana, Inc. | 1,100 | 88,858 | ||||||
McKesson Corp. | 1,000 | 113,860 | ||||||
Patterson Cos., Inc. | 300 | 11,724 | ||||||
Quest Diagnostics, Inc. | 200 | 12,368 | ||||||
Universal Health Services, Inc., Class B | 100 | 6,914 | ||||||
|
| |||||||
| 678,577 | ||||||||
|
| |||||||
| Health Care Technology—0.2% | ||||||||
Cerner Corp. (a) | 450 | 44,226 | ||||||
Medidata Solutions, Inc. (a) | 200 | 13,804 | ||||||
|
| |||||||
| 58,030 | ||||||||
|
| |||||||
| Hotels, Restaurants & Leisure—1.7% | ||||||||
Bloomin’ Brands, Inc. (a) | 1,100 | 25,586 | ||||||
Carnival Corp. | 400 | 13,240 | ||||||
Chipotle Mexican Grill, Inc. (a) | 50 | 18,050 | ||||||
Choice Hotels International, Inc. | 450 | 17,766 | ||||||
Churchill Downs, Inc. | 100 | 8,394 | ||||||
DineEquity, Inc. | 100 | 7,239 | ||||||
Domino’s Pizza, Inc. | 650 | 38,525 | ||||||
Interval Leisure Group, Inc. | 300 | 6,483 | ||||||
Las Vegas Sands Corp. | 1,200 | 69,480 | ||||||
Marriott International, Inc., Class A | 850 | 35,709 | ||||||
McDonald’s Corp. | 1,490 | 143,889 | ||||||
Panera Bread Co., Class A (a) | 100 | 19,183 | ||||||
Papa John’s International, Inc. (a) | 200 | 12,886 | ||||||
Six Flags Entertainment Corp. | 300 | 22,371 | ||||||
Starbucks Corp. | 2,100 | 132,447 | ||||||
Starwood Hotels & Resorts Worldwide, Inc. | 800 | 54,640 | ||||||
Wyndham Worldwide Corp. | 300 | 17,436 | ||||||
|
| |||||||
| 643,324 | ||||||||
|
| |||||||
| Household Durables—0.5% | ||||||||
Jarden Corp. (a) | 300 | 13,974 | ||||||
Mohawk Industries, Inc. (a) | 100 | 11,117 | ||||||
Newell Rubbermaid, Inc. | 1,100 | 29,744 | ||||||
NVR, Inc. (a) | 20 | 19,666 | ||||||
PulteGroup, Inc. (a) | 1,900 | 41,021 | ||||||
Tupperware Brands Corp. | 100 | 8,098 | ||||||
Whirlpool Corp. | 400 | 51,104 | ||||||
|
| |||||||
| 174,724 | ||||||||
|
| |||||||
| Household Products—2.3% | ||||||||
Church & Dwight Co., Inc. | 400 | 24,324 | ||||||
Clorox Co. | 550 | 45,694 | ||||||
Colgate-Palmolive Co. | 3,900 | 225,576 | ||||||
Energizer Holdings, Inc. | 200 | 19,142 | ||||||
Kimberly-Clark Corp. | 1,650 | 159,769 | ||||||
Procter & Gamble Co. | 4,900 | 376,124 | ||||||
|
| |||||||
| 850,629 | ||||||||
|
| |||||||
| Shares | Value | |||||||
| Independent Power Producers & Energy Traders—0.1% | ||||||||
AES Corp. | 2,300 | $28,060 | ||||||
|
| |||||||
| Industrial Conglomerates—2.3% | ||||||||
3M Co. | 2,200 | 242,594 | ||||||
Carlisle Cos., Inc. | 200 | 13,082 | ||||||
Danaher Corp. | 1,200 | 74,184 | ||||||
General Electric Co. | 20,650 | 481,558 | ||||||
Seaboard Corp. | 10 | 27,553 | ||||||
|
| |||||||
| 838,971 | ||||||||
|
| |||||||
| Insurance—5.8% | ||||||||
ACE Ltd. | 600 | 53,808 | ||||||
Aflac, Inc. | 3,100 | 172,639 | ||||||
Allied World Assurance Co. Holdings AG | 200 | 17,882 | ||||||
Allstate Corp. | 2,250 | 108,540 | ||||||
American Financial Group, Inc. | 600 | 29,136 | ||||||
American International Group, Inc. (a) | 3,800 | 168,948 | ||||||
American National Insurance Co. | 100 | 9,988 | ||||||
Amtrust Financial Services, Inc. | 1,000 | 33,030 | ||||||
Aon PLC | 600 | 38,202 | ||||||
Arch Capital Group Ltd. (a) | 800 | 40,968 | ||||||
Arthur J Gallagher & Co. | 200 | 8,736 | ||||||
Aspen Insurance Holdings Ltd. | 300 | 11,022 | ||||||
Axis Capital Holdings Ltd. | 700 | 30,492 | ||||||
Berkshire Hathaway, Inc., Class B (a) | 700 | 79,849 | ||||||
Chubb Corp. | 1,100 | 95,810 | ||||||
CNA Financial Corp. | 700 | 23,919 | ||||||
Erie Indemnity Co., Class A | 100 | 7,591 | ||||||
Everest Re Group Ltd. | 200 | 25,922 | ||||||
First American Financial Corp. | 500 | 11,940 | ||||||
Hartford Financial Services Group, Inc. | 400 | 12,252 | ||||||
HCC Insurance Holdings, Inc. | 300 | 12,855 | ||||||
Loews Corp. | 1,000 | 45,820 | ||||||
Marsh & McLennan Cos., Inc. | 950 | 38,019 | ||||||
MetLife, Inc. | 7,500 | 331,575 | ||||||
Old Republic International Corp. | 1,400 | 19,054 | ||||||
PartnerRe Ltd. | 400 | 36,260 | ||||||
Principal Financial Group, Inc. | 1,400 | 52,990 | ||||||
Progressive Corp. | 2,650 | 67,549 | ||||||
Prudential Financial, Inc. | 3,300 | 227,601 | ||||||
RenaissanceRe Holdings Ltd. | 400 | 34,384 | ||||||
Torchmark Corp. | 300 | 19,353 | ||||||
Travelers Cos., Inc. | 2,050 | 171,626 | ||||||
Unum Group | 400 | 11,392 | ||||||
White Mountains Insurance Group Ltd. | 20 | 11,823 | ||||||
XL Group PLC | 2,100 | 66,003 | ||||||
|
| |||||||
| 2,126,978 | ||||||||
|
| |||||||
| Internet & Catalog Retail—1.4% | ||||||||
Amazon.com, Inc. (a) | 1,100 | 295,933 | ||||||
Expedia, Inc. | 750 | 43,095 | ||||||
HSN, Inc. | 200 | 11,378 | ||||||
Liberty Interactive Corp., Class A (a) | 3,900 | 87,555 | ||||||
priceline.com, Inc. (a) | 100 | 80,393 | ||||||
|
| |||||||
| 518,354 | ||||||||
|
| |||||||
| Internet Software & Services—2.4% | ||||||||
AOL, Inc. (a) | 1,300 | 45,058 | ||||||
eBay, Inc. (a) | 2,700 | 146,070 | ||||||
Equinix, Inc. (a) | 50 | 10,132 | ||||||
Facebook, Inc., Class A (a) | 1,800 | 43,830 | ||||||
Google, Inc., Class A (a) | 515 | 448,261 | ||||||
LinkedIn Corp., Class A (a) | 1,100 | 184,283 | ||||||
NIC, Inc. | 500 | 8,360 | ||||||
| 106 | Semiannual Report | | May 31, 2013 | | See accompanying Notes to Financial Statements |
Table of Contents
Schedule of Investments
May 31, 2013 (Unaudited)
| Shares | Value | |||||||
Rackspace Hosting, Inc. (a) | 200 | $7,506 | ||||||
|
| |||||||
| 893,500 | ||||||||
|
| |||||||
| IT Services—4.1% | ||||||||
Accenture PLC, Class A | 1,600 | 131,376 | ||||||
Acxiom Corp. (a) | 500 | 10,995 | ||||||
Amdocs Ltd. | 550 | 19,635 | ||||||
Automatic Data Processing, Inc. | 1,500 | 103,080 | ||||||
Cognizant Technology Solutions Corp., Class A (a) | 800 | 51,720 | ||||||
Computer Sciences Corp. | 1,500 | 66,915 | ||||||
Convergys Corp. | 400 | 7,268 | ||||||
CoreLogic, Inc. (a) | 600 | 15,720 | ||||||
DST Systems, Inc. | 200 | 13,636 | ||||||
Fiserv, Inc. (a) | 500 | 43,580 | ||||||
FleetCor Technologies, Inc. (a) | 300 | 26,124 | ||||||
Gartner, Inc. (a) | 800 | 45,288 | ||||||
International Business Machines Corp. | 1,700 | 353,634 | ||||||
Jack Henry & Associates, Inc. | 500 | 23,465 | ||||||
Mastercard, Inc., Class A | 700 | 399,175 | ||||||
MAXIMUS, Inc. | 200 | 14,926 | ||||||
NeuStar, Inc., Class A (a) | 200 | 9,692 | ||||||
Paychex, Inc. | 1,050 | 39,091 | ||||||
Syntel, Inc. | 200 | 12,782 | ||||||
Visa, Inc., Class A | 700 | 124,698 | ||||||
|
| |||||||
| 1,512,800 | ||||||||
|
| |||||||
| Leisure Equipment & Products—0.3% | ||||||||
Brunswick Corp. | 600 | 20,142 | ||||||
Mattel, Inc. | 1,150 | 51,463 | ||||||
Polaris Industries, Inc. | 400 | 38,204 | ||||||
|
| |||||||
| 109,809 | ||||||||
|
| |||||||
| Life Sciences Tools & Services—0.5% | ||||||||
Covance, Inc. (a) | 200 | 14,916 | ||||||
Life Technologies Corp. (a) | 300 | 22,230 | ||||||
Mettler-Toledo International, Inc. (a) | 150 | 32,739 | ||||||
Parexel International Corp. (a) | 200 | 9,138 | ||||||
Thermo Fisher Scientific, Inc. | 800 | 70,640 | ||||||
Waters Corp. (a) | 200 | 19,342 | ||||||
|
| |||||||
| 169,005 | ||||||||
|
| |||||||
| Machinery—1.8% | ||||||||
AGCO Corp. | 200 | 11,094 | ||||||
Briggs & Stratton Corp. | 300 | 7,020 | ||||||
CNH Global NV | 2,900 | 125,715 | ||||||
Donaldson Co., Inc. | 400 | 15,004 | ||||||
Dover Corp. | 400 | 31,300 | ||||||
Flowserve Corp. | 200 | 33,626 | ||||||
Graco, Inc. | 100 | 6,445 | ||||||
Illinois Tool Works, Inc. | 1,300 | 91,169 | ||||||
Ingersoll-Rand PLC | 950 | 54,653 | ||||||
ITT Corp. | 1,800 | 54,270 | ||||||
Lincoln Electric Holdings, Inc. | 500 | 29,900 | ||||||
Middleby Corp. (a) | 100 | 16,349 | ||||||
Mueller Industries, Inc. | 300 | 16,335 | ||||||
Navistar International Corp. (a) | 1,600 | 57,392 | ||||||
Nordson Corp. | 300 | 21,366 | ||||||
Pall Corp. | 450 | 30,690 | ||||||
Toro Co. | 300 | 14,298 | ||||||
Valmont Industries, Inc. | 100 | 15,233 | ||||||
Wabtec Corp. | 200 | 22,002 | ||||||
Watts Water Technologies, Inc., Class A | 200 | 9,520 | ||||||
|
| |||||||
| 663,381 | ||||||||
|
| |||||||
| Marine—0.0% | ||||||||
Matson, Inc. | 400 | 10,068 | ||||||
|
| |||||||
| Media—3.6% | ||||||||
AMC Networks, Inc., Class A (a) | 200 | 12,804 | ||||||
| Shares | Value | |||||||
CBS Corp., Class B | 1,650 | $81,675 | ||||||
Comcast Corp., Class A | 6,300 | 252,945 | ||||||
DIRECTV (a) | 1,650 | 100,864 | ||||||
DISH Network Corp., Class A | 800 | 30,832 | ||||||
Gannett Co., Inc. | 1,000 | 21,500 | ||||||
Lamar Advertising Co., Class A (a) | 200 | 9,346 | ||||||
Loral Space & Communications, Inc. | 200 | 12,044 | ||||||
Madison Square Garden Co., Class A (a) | 300 | 17,559 | ||||||
Morningstar, Inc. | 250 | 17,195 | ||||||
News Corp., Class A | 5,150 | 165,366 | ||||||
Omnicom Group, Inc. | 750 | 46,598 | ||||||
Scripps Networks Interactive, Inc., Class A | 500 | 33,680 | ||||||
Sirius XM Radio, Inc. | 12,250 | 42,630 | ||||||
Thomson Reuters Corp. | 3,100 | 103,540 | ||||||
Time Warner Cable, Inc. | 450 | 42,980 | ||||||
Time Warner, Inc. | 1,500 | 87,555 | ||||||
Viacom, Inc., Class B | 1,650 | 108,718 | ||||||
Walt Disney Co. | 2,350 | 148,238 | ||||||
|
| |||||||
| 1,336,069 | ||||||||
|
| |||||||
| Metals & Mining—0.5% | ||||||||
Southern Copper Corp. | 4,850 | 151,078 | ||||||
Worthington Industries, Inc. | 500 | 17,190 | ||||||
|
| |||||||
| 168,268 | ||||||||
|
| |||||||
| Multi-line Retail—0.4% | ||||||||
Dillard’s, Inc., Class A | 200 | 18,454 | ||||||
Macy’s, Inc. | 700 | 33,838 | ||||||
Nordstrom, Inc. | 400 | 23,528 | ||||||
Target Corp. | 1,000 | 69,500 | ||||||
|
| |||||||
| 145,320 | ||||||||
|
| |||||||
| Multi-Utilities—0.3% | ||||||||
Ameren Corp. | 300 | 10,212 | ||||||
Black Hills Corp. | 300 | 14,241 | ||||||
CMS Energy Corp. | 600 | 16,170 | ||||||
DTE Energy Co. | 500 | 33,305 | ||||||
Public Service Enterprise Group, Inc. | 700 | 23,128 | ||||||
Wisconsin Energy Corp. | 500 | 20,405 | ||||||
|
| |||||||
| 117,461 | ||||||||
|
| |||||||
| Office Electronics—0.1% | ||||||||
Xerox Corp. | 3,400 | 29,886 | ||||||
Zebra Technologies Corp., Class A (a) | 200 | 9,132 | ||||||
|
| |||||||
| 39,018 | ||||||||
|
| |||||||
| Oil, Gas & Consumable Fuels—9.6% | ||||||||
Alon USA Energy, Inc. | 600 | 10,986 | ||||||
Anadarko Petroleum Corp. | 2,000 | 174,940 | ||||||
Cabot Oil & Gas Corp. | 1,300 | 91,468 | ||||||
Chesapeake Energy Corp. | 2,500 | 54,600 | ||||||
Chevron Corp. | 6,130 | 752,457 | ||||||
ConocoPhillips | 5,990 | 367,427 | ||||||
CVR Energy, Inc. | 500 | 31,405 | ||||||
Delek U.S. Holdings, Inc. | 400 | 14,412 | ||||||
EOG Resources, Inc. | 400 | 51,640 | ||||||
Exxon Mobil Corp. | 8,070 | 730,093 | ||||||
Hess Corp. | 1,000 | 67,410 | ||||||
HollyFrontier Corp. | 1,400 | 69,300 | ||||||
Marathon Petroleum Corp. | 3,600 | 297,000 | ||||||
Noble Energy, Inc. | 1,000 | 57,650 | ||||||
Phillips 66 | 4,600 | 306,222 | ||||||
Pioneer Natural Resources Co. | 300 | 41,604 | ||||||
SemGroup Corp., Class A | 200 | 10,464 | ||||||
Southwestern Energy Co. (a) | 300 | 11,307 | ||||||
Targa Resources Corp. | 200 | 12,884 | ||||||
Tesoro Corp. | 1,500 | 92,475 | ||||||
Valero Energy Corp. | 4,700 | 190,961 | ||||||
Western Refining, Inc. | 1,600 | 53,392 | ||||||
| Shares | Value | |||||||
Williams Cos., Inc. | 700 | $24,626 | ||||||
|
| |||||||
| 3,514,723 | ||||||||
|
| |||||||
| Paper & Forest Products—0.2% | ||||||||
International Paper Co. | 1,300 | 59,995 | ||||||
Louisiana-Pacific Corp. (a) | 400 | 7,028 | ||||||
|
| |||||||
| 67,023 | ||||||||
|
| |||||||
| Personal Products—0.2% | ||||||||
Avon Products, Inc. | 2,000 | 47,140 | ||||||
Estee Lauder Cos., Inc., Class A | 250 | 16,945 | ||||||
|
| |||||||
| 64,085 | ||||||||
|
| |||||||
| Pharmaceuticals—5.2% | ||||||||
Allergan, Inc. | 1,150 | 114,414 | ||||||
Bristol-Myers Squibb Co. | 3,950 | 181,739 | ||||||
Eli Lilly & Co. | 6,200 | 329,592 | ||||||
Johnson & Johnson | 6,628 | 557,945 | ||||||
Merck & Co., Inc. | 3,350 | 156,445 | ||||||
Mylan, Inc. (a) | 1,000 | 30,480 | ||||||
Pfizer, Inc. | 19,800 | 539,154 | ||||||
|
| |||||||
| 1,909,769 | ||||||||
|
| |||||||
| Professional Services—0.3% | ||||||||
Corporate Executive Board Co. | 100 | 6,119 | ||||||
Dun & Bradstreet Corp. | 350 | 34,349 | ||||||
Manpowergroup, Inc. | 200 | 11,454 | ||||||
Robert Half International, Inc. | 700 | 24,332 | ||||||
Verisk Analytics, Inc., Class A (a) | 800 | 47,056 | ||||||
|
| |||||||
| 123,310 | ||||||||
|
| |||||||
| Real Estate Investment Trust—0.5% | ||||||||
American Tower Corp. | 1,150 | 89,516 | ||||||
Corrections Corp. of America | 337 | 11,846 | ||||||
Plum Creek Timber Co., Inc. | 200 | 9,540 | ||||||
Public Storage | 350 | 53,130 | ||||||
Rayonier, Inc. | 250 | 13,850 | ||||||
|
| |||||||
| 177,882 | ||||||||
|
| |||||||
| Road & Rail—1.3% | ||||||||
AMERCO | 100 | 17,240 | ||||||
CSX Corp. | 400 | 10,084 | ||||||
Hertz Global Holdings, Inc. (a) | 1,100 | 28,413 | ||||||
JB Hunt Transport Services, Inc. | 450 | 33,147 | ||||||
Kansas City Southern | 400 | 44,280 | ||||||
Norfolk Southern Corp. | 700 | 53,613 | ||||||
Union Pacific Corp. | 1,900 | 293,778 | ||||||
|
| |||||||
| 480,555 | ||||||||
|
| |||||||
| Semiconductors & Semiconductor Equipment—1.2% | ||||||||
Analog Devices, Inc. | 1,300 | 59,709 | ||||||
Applied Materials, Inc. | 4,300 | 65,360 | ||||||
Hittite Microwave Corp. (a) | 100 | 5,428 | ||||||
Intel Corp. | 6,450 | 156,606 | ||||||
KLA-Tencor Corp. | 200 | 11,258 | ||||||
Linear Technology Corp. | 2,000 | 75,000 | ||||||
Maxim Integrated Products, Inc. | 400 | 11,796 | ||||||
NVIDIA Corp. | 1,800 | 26,082 | ||||||
Texas Instruments, Inc. | 1,100 | 39,479 | ||||||
Ultratech, Inc. (a) | 200 | 7,292 | ||||||
|
| |||||||
| 458,010 | ||||||||
|
| |||||||
| Software—3.8% | ||||||||
Activision Blizzard, Inc. | 2,900 | 41,847 | ||||||
Adobe Systems, Inc. (a) | 1,050 | 45,055 | ||||||
Ansys, Inc. (a) | 250 | 18,625 | ||||||
Aspen Technology, Inc. (a) | 450 | 13,779 | ||||||
Autodesk, Inc. (a) | 300 | 11,319 | ||||||
BMC Software, Inc. (a) | 300 | 13,588 | ||||||
Cadence Design Systems, Inc. (a) | 700 | 10,591 | ||||||
Fortinet, Inc. (a) | 900 | 17,334 | ||||||
Guidewire Software, Inc. (a) | 600 | 24,576 | ||||||
| See accompanying Notes to Financial Statements | | May 31, 2013 | | Semiannual Report | 107 |
Table of Contents
Schedule of Investments
May 31, 2013 (Unaudited)
| Shares | Value | |||||||
Intuit, Inc. | 700 | $40,908 | ||||||
Manhattan Associates, Inc. (a) | 200 | 15,006 | ||||||
Microsoft Corp. | 10,200 | 355,776 | ||||||
Oracle Corp. | 17,900 | 604,304 | ||||||
Red Hat, Inc. (a) | 400 | 19,292 | ||||||
Salesforce.com, Inc. (a) | 800 | 33,864 | ||||||
SolarWinds, Inc. (a) | 500 | 21,075 | ||||||
Solera Holdings, Inc. | 200 | 10,954 | ||||||
Symantec Corp. (a) | 2,100 | 47,019 | ||||||
Synopsys, Inc. (a) | 300 | 10,935 | ||||||
Tyler Technologies, Inc. (a) | 150 | 10,352 | ||||||
Ultimate Software Group, Inc. (a) | 150 | 16,695 | ||||||
|
| |||||||
| 1,382,894 | ||||||||
|
| |||||||
| Specialty Retail—4.6% | ||||||||
Advance Auto Parts, Inc. | 100 | 8,152 | ||||||
American Eagle Outfitters, Inc. | 800 | 15,832 | ||||||
AutoNation, Inc. (a) | 200 | 9,266 | ||||||
AutoZone, Inc. (a) | 75 | 30,662 | ||||||
Best Buy Co., Inc. | 6,900 | 190,095 | ||||||
CST Brands, Inc. (a) | 522 | 15,864 | ||||||
DSW, Inc., Class A | 100 | 7,399 | ||||||
Foot Locker, Inc. | 250 | 8,580 | ||||||
Gap, Inc. | 3,200 | 129,760 | ||||||
Home Depot, Inc. | 7,700 | 605,682 | ||||||
Lowe’s Cos., Inc. | 4,900 | 206,339 | ||||||
O’Reilly Automotive, Inc. (a) | 650 | 70,791 | ||||||
PetSmart, Inc. | 100 | 6,750 | ||||||
Pier 1 Imports, Inc. | 350 | 8,117 | ||||||
Ross Stores, Inc. | 600 | 38,580 | ||||||
Signet Jewelers Ltd. | 300 | 20,553 | ||||||
TJX Cos., Inc. | 5,100 | 258,111 | ||||||
Tractor Supply Co. | 250 | 27,995 | ||||||
Urban Outfitters, Inc. (a) | 500 | 20,965 | ||||||
Williams-Sonoma, Inc. | 200 | 10,792 | ||||||
|
| |||||||
| 1,690,285 | ||||||||
|
| |||||||
| Textiles, Apparel & Luxury Goods—0.8% | ||||||||
Carter’s, Inc. | 150 | 10,811 | ||||||
Hanesbrands, Inc. | 500 | 24,930 | ||||||
Michael Kors Holdings Ltd. (a) | 700 | 43,974 | ||||||
NIKE, Inc., Class B | 1,900 | 117,154 | ||||||
Ralph Lauren Corp. | 250 | 43,772 | ||||||
V.F. Corp. | 300 | 55,158 | ||||||
|
| |||||||
| 295,799 | ||||||||
|
| |||||||
| Thrifts & Mortgage Finance—0.1% | ||||||||
Ocwen Financial Corp. (a) | 1,300 | 55,614 | ||||||
|
| |||||||
| Tobacco—1.7% | ||||||||
Altria Group, Inc. | 6,400 | 231,040 | ||||||
Philip Morris International, Inc. | 3,970 | 360,913 | ||||||
Reynolds American, Inc. | 1,000 | 48,110 | ||||||
|
| |||||||
| 640,063 | ||||||||
|
| |||||||
| Trading Companies & Distributors—0.2% | ||||||||
MRC Global, Inc. (a) | 500 | 14,195 | ||||||
WW Grainger, Inc. | 175 | 45,052 | ||||||
|
| |||||||
| 59,247 | ||||||||
|
| |||||||
| Water Utilities—0.1% | ||||||||
American Water Works Co., Inc. | 350 | 13,979 | ||||||
Aqua America, Inc. | 400 | 12,436 | ||||||
|
| |||||||
| 26,415 | ||||||||
|
| |||||||
| Wireless Telecommunication Services—0.2% | ||||||||
Sprint Nextel Corp. (a) | 10,800 | 78,840 | ||||||
|
| |||||||
| Total Common Stock (cost—$31,973,761) | 36,593,110 | |||||||
|
| |||||||
| Shares | Value | |||||||
| Exchange-Traded Funds—0.2% | ||||||||
| SPDR S&P 500 ETF Trust (cost—$77,973) | 500 | $81,620 | ||||||
|
| |||||||
Total Investments (cost—$32,051,734)—99.7% | 36,674,730 | |||||||
|
| |||||||
| Other assets less liabilities—0.3% | 99,837 | |||||||
|
| |||||||
| Net Assets—100.0% | $36,774,567 | |||||||
|
| |||||||
Notes to Schedule of Investments:
(a) Non-income producing.
Glossary:
ETF—Exchange-Traded Fund
SPDR—Standard & Poor’s Depositary Receipts
AllianzGI China Equity Fund
| Shares | Value | |||||||
| Common Stock—93.6% | ||||||||
| China—83.8% | ||||||||
Agricultural Bank of China Ltd., Class H | 122,000 | $57,037 | ||||||
Bank of China Ltd., Class H | 481,500 | 226,170 | ||||||
Beijing Enterprises Holdings Ltd. | 23,500 | 191,772 | ||||||
China Communications Construction Co., Ltd., Class H | 66,000 | 61,234 | ||||||
China Construction Bank Corp., Class H | 206,800 | 166,993 | ||||||
China Everbright International Ltd. (b) | 333,000 | 270,011 | ||||||
China Life Insurance Co., Ltd., Class H | 67,500 | 172,750 | ||||||
China Minsheng Banking Corp. Ltd., Class H | 31,500 | 38,486 | ||||||
China Mobile Ltd. | 18,500 | 195,032 | ||||||
China Petroleum & Chemical Corp., Class H | 74,000 | 75,657 | ||||||
China Resources Land Ltd. | 26,000 | 79,435 | ||||||
China Shenhua Energy Co., Ltd., Class H | 15,500 | 50,564 | ||||||
CNOOC Ltd. | 91,000 | 159,175 | ||||||
Comba Telecom Systems Holdings Ltd. (c) | 80,600 | 28,913 | ||||||
CSR Corp. Ltd., Class H | 99,000 | 72,182 | ||||||
Digital China Holdings Ltd. (b) | 85,000 | 118,825 | ||||||
Industrial & Commercial Bank of China Ltd., Class H | 400,335 | 281,122 | ||||||
Kunlun Energy Co., Ltd. | 36,000 | 68,705 | ||||||
PetroChina Co., Ltd., Class H | 70,000 | 81,090 | ||||||
Ping An Insurance Group Co., Class H | 12,000 | 88,825 | ||||||
Poly Property Group Co., Ltd. (c) | 92,000 | 61,537 | ||||||
Qingling Motors Co., Ltd., Class H (b) | 522,000 | 151,744 | ||||||
Shui On Land Ltd. | 120,500 | 42,957 | ||||||
Sino-Ocean Land Holdings Ltd. | 153,500 | 93,783 | ||||||
Tencent Holdings Ltd. | 6,000 | 235,858 | ||||||
Tiangong International Co., Ltd. (b) | 542,000 | 186,893 | ||||||
Yuexiu Transport Infrastructure Ltd. | 76,000 | 39,841 | ||||||
Zhongsheng Group Holdings Ltd. | 46,500 | 58,089 | ||||||
Zhuzhou CSR Times Electric Co., Ltd., Class H (b) | 28,700 | 88,023 | ||||||
ZTE Corp., Class H (c) | 30,560 | 49,164 | ||||||
|
| |||||||
| 3,491,867 | ||||||||
|
| |||||||
| Hong Kong—9.8% | ||||||||
Aeon Stores Hong Kong Co., Ltd. | 34,500 | 72,443 | ||||||
CPMC Holdings Ltd. | 148,000 | 113,839 | ||||||
Hengan International Group Co., Ltd. | 4,500 | 49,764 | ||||||
Natural Beauty Bio-Technology Ltd. | 350,000 | 26,151 | ||||||
Sa Sa International Holdings Ltd. | 130,000 | 144,796 | ||||||
|
| |||||||
| 406,993 | ||||||||
|
| |||||||
| Total Common Stock (cost—$3,736,482) | 3,898,860 | |||||||
|
| |||||||
| 108 | Semiannual Report | | May 31, 2013 | | See accompanying Notes to Financial Statements |
Table of Contents
Schedule of Investments
May 31, 2013 (Unaudited)
| Shares | Value | |||||||
| Exchange-Traded Funds—3.0% | ||||||||
| ChinaAMC CSI 300 Index (c) (cost—$130,302) | 30,600 | $126,734 | ||||||
|
| |||||||
| Principal Amount (000s) | ||||||||
| Repurchase Agreements—2.6% | ||||||||
State Street Bank & Trust Co., dated 5/31/13, 0.01%, due 6/3/13, proceeds $107,000; collateralized by Federal Home Loan Bank, 3.30%, due 8/27/32, valued at $111,694 including accrued interest |
| |||||||
(cost—$107,000) | $107 | 107,000 | ||||||
|
| |||||||
| Total Investments (cost—$3,973,784) (a)—99.2% | 4,132,594 | |||||||
|
| |||||||
| Other assets less liabilities—0.8% | 33,376 | |||||||
|
| |||||||
| Net Assets—100.0% | $4,165,970 | |||||||
|
| |||||||
Notes to Schedule of Investments:
(a) Securities with an aggregate value of $3,800,266, representing 91.2% of net assets, were valued utilizing modeling tools provided by a third-party vendor. See Note 1(a) and Note 1(b) in the Notes to Financial Statements.
(b) Affiliated security.
(c) Non-income producing.
The industry classification of portfolio holdings and other assets less liabilities shown as a percentage of net assets as of May 31, 2013 were as follows:
Commercial Banks | 18.4% | |||
Oil, Gas & Consumable Fuels | 10.4% | |||
Real Estate Management & Development | 6.7% | |||
Commercial Services & Supplies | 6.5% | |||
Insurance | 6.2% | |||
Internet Software & Services | 5.7% | |||
Specialty Retail | 4.9% | |||
Wireless Telecommunication Services | 4.7% | |||
Industrial Conglomerates | 4.6% | |||
Metals & Mining | 4.5% | |||
Automobiles | 3.6% | |||
Exchange-Traded Funds | 3.0% | |||
Electronic Equipment, Instruments & Components | 2.9% | |||
Containers & Packaging | 2.7% | |||
Electrical Equipment | 2.1% | |||
Communications Equipment | 1.9% | |||
Personal Products | 1.8% | |||
Multi-line Retail | 1.8% | |||
Machinery | 1.7% | |||
Construction & Engineering | 1.5% | |||
Transportation Infrastructure | 1.0% | |||
Repurchase Agreements | 2.6% | |||
Other assets less liabilities | 0.8% | |||
|
| |||
| 100.0% | ||||
|
|
AllianzGI Convertible Fund
| Principal Amount (000s) | Value | |||||||
| Convertible Bonds—81.9% | ||||||||
| Aerospace & Defense—0.6% | ||||||||
Triumph Group, Inc., 2.625%, 10/1/26 | $3,605 | $10,301,288 | ||||||
|
| |||||||
| Airlines—0.9% | ||||||||
United Continental Holdings, Inc., |
| |||||||
6.00%, 10/15/29 | 3,670 | 13,923,063 | ||||||
|
| |||||||
| Apparel & Textiles—1.0% | ||||||||
Iconix Brand Group, Inc. (a)(b), |
| |||||||
1.50%, 3/15/18 | 14,190 | 16,460,400 | ||||||
|
| |||||||
| Auto Manufacturers—2.4% | ||||||||
Ford Motor Co., 4.25%, 11/15/16 | 11,895 | 21,775,284 | ||||||
Wabash National Corp., 3.375%, 5/1/18 | 12,660 | 16,022,813 | ||||||
|
| |||||||
| 37,798,097 | ||||||||
|
| |||||||
| Biotechnology—5.8% | ||||||||
Gilead Sciences, Inc., 1.625%, 5/1/16 | 13,365 | 32,126,186 | ||||||
Illumina, Inc. (a)(b), 0.25%, 3/15/16 | 18,815 | 20,190,847 | ||||||
Medicines Co. (a)(b), 1.375%, 6/1/17 | 12,845 | 16,859,062 | ||||||
Regeneron Pharmaceuticals, Inc., |
| |||||||
1.875%, 10/1/16 | 4,500 | 12,993,750 | ||||||
Sequenom, Inc. (a)(b), 5.00%, 10/1/17 | 8,650 | 9,936,687 | ||||||
|
| |||||||
| 92,106,532 | ||||||||
|
| |||||||
| Commercial Services—4.5% | ||||||||
Alliance Data Systems Corp., |
| |||||||
1.75%, 8/1/13 | 8,260 | 18,595,325 | ||||||
Avis Budget Group, Inc., 3.50%, 10/1/14 | 8,575 | 17,712,735 | ||||||
Cenveo Corp., 7.00%, 5/15/17 | 10,330 | 9,535,881 | ||||||
Hertz Global Holdings, Inc., |
| |||||||
5.25%, 6/1/14 | 6,400 | 20,072,032 | ||||||
PHH Corp., | 4,960 | 5,369,200 | ||||||
|
| |||||||
| 71,285,173 | ||||||||
|
| |||||||
| Computers—3.9% | ||||||||
Cadence Design Systems, Inc., |
| |||||||
2.625%, 6/1/15 | 10,105 | 20,500,518 | ||||||
EMC Corp., 1.75%, 12/1/13 | 14,735 | 22,793,277 | ||||||
SanDisk Corp., | 14,170 | 18,872,669 | ||||||
|
| |||||||
| 62,166,464 | ||||||||
|
| |||||||
| Diversified Financial Services—1.1% | ||||||||
Air Lease Corp. (a)(b), 3.875%, 12/1/18 | 13,355 | 16,752,178 | ||||||
|
| |||||||
| Electrical Equipment—0.5% | ||||||||
General Cable Corp. (e), 4.50%, 11/15/29 | 5,965 | 7,418,969 | ||||||
|
| |||||||
| Engineering & Construction—1.0% | ||||||||
MasTec, Inc., | 7,905 | 16,121,259 | ||||||
|
| |||||||
| Food & Beverage—1.0% | ||||||||
Molson Coors Brewing Co., |
| |||||||
2.50%, 7/30/13 | 16,095 | 16,557,731 | ||||||
|
| |||||||
| Healthcare-Products—2.9% | ||||||||
HeartWare International, Inc., |
| |||||||
3.50%, 12/15/17 | 11,545 | 14,236,428 | ||||||
| Principal Amount (000s) | Value | |||||||
Hologic, Inc. (e), | $9,445 | $10,932,588 | ||||||
Wright Medical Group, Inc. (a)(b), |
| |||||||
2.00%, 8/15/17 | 17,870 | 21,388,156 | ||||||
|
| |||||||
| 46,557,172 | ||||||||
|
| |||||||
| Healthcare-Services—4.1% | ||||||||
Brookdale Senior Living, Inc., |
| |||||||
2.75%, 6/15/18 | 15,290 | 18,921,375 | ||||||
Molina Healthcare, Inc., | ||||||||
1.125%, 1/15/20 (a)(b) | 10,475 | 11,823,656 | ||||||
3.75%, 10/1/14 | 9,010 | 11,819,994 | ||||||
WellPoint, Inc. (a)(b), 2.75%, 10/15/42 | 18,510 | 22,697,888 | ||||||
|
| |||||||
| 65,262,913 | ||||||||
|
| |||||||
| Home Builders—4.2% | ||||||||
DR Horton, Inc., | 9,040 | 17,034,750 | ||||||
KB Home, | 12,865 | 14,995,766 | ||||||
Lennar Corp. (a)(b), 3.25%, 11/15/21 | 9,560 | 17,166,175 | ||||||
Ryland Group, Inc., | ||||||||
0.25%, 6/1/19 | 5,845 | 5,724,447 | ||||||
1.625%, 5/15/18 | 7,815 | 12,352,584 | ||||||
|
| |||||||
| 67,273,722 | ||||||||
|
| |||||||
| Home Furnishings—0.9% | ||||||||
TiVo, Inc. (a)(b), | 10,420 | 14,731,275 | ||||||
|
| |||||||
| Household Products/Wares—1.3% | ||||||||
Jarden Corp. (a)(b), 1.875%, 9/15/18 | 17,120 | 20,586,800 | ||||||
|
| |||||||
| Insurance—4.2% | ||||||||
American Equity Investment Life Holding Co. (a)(b), |
| |||||||
3.50%, 9/15/15 | 12,800 | 17,560,000 | ||||||
Amtrust Financial Services, Inc., |
| |||||||
5.50%, 12/15/21 | 11,855 | 16,500,678 | ||||||
Fidelity National Financial, Inc., |
| |||||||
4.25%, 8/15/18 | 14,185 | 20,054,044 | ||||||
Radian Group, Inc., | 9,425 | 13,242,125 | ||||||
|
| |||||||
| 67,356,847 | ||||||||
|
| |||||||
| Internet—5.2% | ||||||||
Dealertrack Technologies, Inc., |
| |||||||
1.50%, 3/15/17 | 16,615 | 18,764,566 | ||||||
Equinix, Inc., | 7,345 | 18,270,687 | ||||||
priceline.com, Inc., | ||||||||
1.00%, 3/15/18 | 16,700 | 19,267,625 | ||||||
1.25%, 3/15/15 | 3,805 | 10,109,409 | ||||||
Symantec Corp., | 14,645 | 17,537,388 | ||||||
|
| |||||||
| 83,949,675 | ||||||||
|
| |||||||
| Lodging—1.2% | ||||||||
MGM Resorts International, |
| |||||||
4.25%, 4/15/15 | 17,505 | 19,944,759 | ||||||
|
| |||||||
| Machinery-Construction & Mining—0.7% | ||||||||
Terex Corp., | 5,125 | 11,720,234 | ||||||
|
| |||||||
| Machinery-Diversified—1.0% | ||||||||
Chart Industries, Inc., 2.00%, 8/1/18 | 9,925 | 15,464,391 | ||||||
|
| |||||||
| Media—2.2% | ||||||||
Liberty Interactive LLC, 3.50%, 1/15/31 | 29,620 | 15,846,700 | ||||||
| See accompanying Notes to Financial Statements | | May 31, 2013 | | Semiannual Report | 109 |
Table of Contents
Schedule of Investments
May 31, 2013 (Unaudited)
| Principal Amount (000s) | Value | |||||||
XM Satellite Radio, Inc. (a)(b), |
| |||||||
7.00%, 12/1/14 | $9,820 | $19,320,850 | ||||||
|
| |||||||
| 35,167,550 | ||||||||
|
| |||||||
| Metal Fabricate/Hardware—0.8% | ||||||||
RTI International Metals, Inc., |
| |||||||
1.625%, 10/15/19 | 13,205 | 13,345,303 | ||||||
|
| |||||||
| Mining—1.1% | ||||||||
Kaiser Aluminum Corp., 4.50%, 4/1/15 | 12,390 | 17,214,418 | ||||||
|
| |||||||
| Oil & Gas—4.8% | ||||||||
Cobalt International Energy, Inc., |
| |||||||
2.625%, 12/1/19 | 17,875 | 19,383,203 | ||||||
Exterran Holdings, Inc., 4.25%, 6/15/14 | 15,235 | 20,262,550 | ||||||
Helix Energy Solutions Group, Inc., |
| |||||||
3.25%, 3/15/32 | 12,795 | 16,585,519 | ||||||
Hornbeck Offshore Services, Inc. (a)(b), |
| |||||||
1.50%, 9/1/19 | 17,035 | 21,176,634 | ||||||
|
| |||||||
| 77,407,906 | ||||||||
|
| |||||||
| Pharmaceuticals—5.3% | ||||||||
Akorn, Inc., | 5,540 | 9,930,450 | ||||||
BioMarin Pharmaceutical, Inc., |
| |||||||
1.875%, 4/23/17 | 3,440 | 10,840,300 | ||||||
Medivation, Inc., | 7,505 | 9,540,731 | ||||||
Mylan, Inc., | 8,645 | 20,153,657 | ||||||
Pacira Pharmaceuticals, Inc. (a)(b), |
| |||||||
3.25%, 2/1/19 | 6,065 | 8,600,928 | ||||||
Salix Pharmaceuticals Ltd., |
| |||||||
1.50%, 3/15/19 | 4,720 | 5,590,250 | ||||||
Theravance, Inc., | 4,435 | 6,389,172 | ||||||
ViroPharma, Inc., | 8,130 | 12,952,106 | ||||||
|
| |||||||
| 83,997,594 | ||||||||
|
| |||||||
| Real Estate Investment Trust—4.7% | ||||||||
DDR Corp., | 16,215 | 19,549,209 | ||||||
Host Hotels & Resorts L.P. (a)(b), |
| |||||||
2.50%, 10/15/29 | 14,030 | 19,791,069 | ||||||
iStar Financial, Inc., | 15,230 | 19,018,462 | ||||||
Starwood Property Trust, Inc., |
| |||||||
4.55%, 3/1/18 | 16,260 | 17,489,663 | ||||||
|
| |||||||
| 75,848,403 | ||||||||
|
| |||||||
| Retail—1.2% | ||||||||
Group 1 Automotive, Inc. (e), |
| |||||||
2.25%, 6/15/36 | 16,240 | 19,589,500 | ||||||
|
| |||||||
| Semiconductors—6.6% | ||||||||
Intel Corp., | 17,850 | 23,327,808 | ||||||
Micron Technology, Inc., 1.50%, 8/1/31 | 16,990 | 21,864,006 | ||||||
Novellus Systems, Inc., 2.625%, 5/15/41 | 11,010 | 16,563,169 | ||||||
ON Semiconductor Corp., 2.625%, 12/15/26 | 17,345 | 20,575,506 | ||||||
Xilinx, Inc., | 15,605 | 23,368,488 | ||||||
|
| |||||||
| 105,698,977 | ||||||||
|
| |||||||
| Software—4.5% | ||||||||
Bottomline Technologies, Inc., |
| |||||||
1.50%, 12/1/17 | 12,190 | 13,995,644 | ||||||
| Principal Amount (000s) | Value | |||||||
Concur Technologies, Inc. (a)(b), |
| |||||||
0.50%, 6/15/18 (c) | $11,165 | $11,346,431 | ||||||
2.50%, 4/15/15 | 3,305 | 5,275,606 | ||||||
NetSuite, Inc. (a)(b)(c), 0.25%, 6/1/18 | 8,290 | 8,455,800 | ||||||
Salesforce.com, Inc., 0.75%, 1/15/15 | 7,700 | 15,332,625 | ||||||
Take-Two Interactive Software, Inc., |
| |||||||
1.75%, 12/1/16 | 11,095 | 13,050,494 | ||||||
4.375%, 6/1/14 | 2,380 | 3,779,737 | ||||||
|
| |||||||
| 71,236,337 | ||||||||
|
| |||||||
| Telecommunications—1.4% | ||||||||
Ixia, | 8,455 | 9,739,103 | ||||||
SBA Communications Corp., |
| |||||||
4.00%, 10/1/14 | 5,130 | 12,812,175 | ||||||
|
| |||||||
| 22,551,278 | ||||||||
|
| |||||||
| Transportation—0.9% | ||||||||
Bristow Group, Inc., 3.00%, 6/15/38 | 12,010 | 13,909,081 | ||||||
|
| |||||||
| Total Convertible Bonds (cost—$1,110,703,545) | 1,309,705,289 | |||||||
|
| |||||||
| Shares | ||||||||
| Convertible Preferred Stock—15.6% | ||||||||
| Advertising—0.5% | ||||||||
Interpublic Group of Cos., Inc., | 6,560 | 8,181,140 | ||||||
|
| |||||||
| Aerospace & Defense—1.5% | ||||||||
United Technologies Corp., |
| |||||||
7.50%, 8/1/15 | 385,805 | 23,279,474 | ||||||
|
| |||||||
| Automobiles—2.2% | ||||||||
General Motors Co., |
| |||||||
4.75%, 12/1/13 | 724,210 | 35,348,690 | ||||||
|
| |||||||
| Banking—1.4% | ||||||||
Wells Fargo & Co., | 17,870 | 22,426,850 | ||||||
|
| |||||||
| Diversified Financial Services—3.3% | ||||||||
2010 Swift Mandatory Common Exchange Security Trust (b), 6.00%, 12/31/13 | 864,585 | 12,633,230 | ||||||
AMG Capital Trust I, 5.10%, 4/15/36 | 303,385 | 19,663,140 | ||||||
Bank of America Corp., Ser. L (d), 7.25% | 17,710 | 21,039,480 | ||||||
|
| |||||||
| 53,335,850 | ||||||||
|
| |||||||
| Electric Utilities—0.6% | ||||||||
PPL Corp., | 171,165 | 9,201,830 | ||||||
|
| |||||||
| Insurance—1.5% | ||||||||
MetLife, Inc., | 432,780 | 23,028,224 | ||||||
|
| |||||||
| Machinery—1.4% | ||||||||
Stanley Black & Decker, Inc., | 172,775 | 22,849,494 | ||||||
|
| |||||||
| Oil & Gas—1.5% | ||||||||
Chesapeake Energy Corp. (a)(b)(d), |
| |||||||
5.75%, 5/17/15 | 21,675 | 23,753,090 | ||||||
|
| |||||||
| Shares | Value | |||||||
| Telecommunications—0.5% | ||||||||
Intelsat S.A., Ser. A, | 128,090 | $7,919,805 | ||||||
|
| |||||||
| Transportation—1.2% | ||||||||
Genesee & Wyoming, Inc., | 154,330 | 19,379,218 | ||||||
|
| |||||||
| Total Convertible Preferred Stock (cost—$217,474,613) | 248,703,665 | |||||||
|
| |||||||
| Common Stock—0.3% | ||||||||
| Media—0.3% | ||||||||
Interpublic Group of Cos., Inc. (cost—$4,996,531) | 384,934 | 5,473,762 | ||||||
|
| |||||||
| Principal Amount (000s) | ||||||||
| Repurchase Agreements—3.3% | ||||||||
State Street Bank & Trust Co., dated 5/31/13, 0.01%, due 6/3/13, proceeds $53,103,044; collateralized by Fannie Mae, 6.25%, due 5/15/29, valued at $54,171,965 including accrued interest |
| |||||||
(cost—$53,103,000) | $53,103 | 53,103,000 | ||||||
|
| |||||||
| Total Investments (cost—$1,386,277,689)—101.1% | 1,616,985,716 | |||||||
|
| |||||||
| Liabilities in excess of other assets—(1.1)% | (16,990,998 | ) | ||||||
|
| |||||||
| Net Assets—100.0% | $1,599,994,718 | |||||||
|
| |||||||
Notes to Schedule of Investments:
(a) Private Placement—Restricted as to resale and may not have a readily available market. Securities with an aggregate value of $323,873,532, representing 20.2% of net assets.
(b) 144A—Exempt from registration under Rule 144A of the Securities Act of 1933. These securities may be resold in transactions exempt from registration, typically only to qualified institutional buyers. Unless otherwise indicated, these securities are not considered to be illiquid.
(c) When-issued or delayed-delivery. To be settled/delivered after May 31, 2013.
(d) Perpetual maturity. The date shown, if any, is the next call date. For Corporate Bonds & Notes the interest rate is fixed until the first call date and variable thereafter.
(e) Step Bond—Coupon is a fixed rate for an initial period then resets at a specific date and rate.
| 110 | Semiannual Report | | May 31, 2013 | | See accompanying Notes to Financial Statements |
Table of Contents
Schedule of Investments
May 31, 2013 (Unaudited)
AllianzGI Disciplined Equity Fund
| Shares | Value | |||||||
| Common Stock—97.6% | ||||||||
| Aerospace & Defense—5.4% | ||||||||
BE Aerospace, | 12,038 | $763,691 | ||||||
Boeing Co. | 20,840 | 2,063,577 | ||||||
|
| |||||||
| 2,827,268 | ||||||||
|
| |||||||
| Beverages—1.8% | ||||||||
PepsiCo, Inc. | 11,730 | 947,432 | ||||||
|
| |||||||
| Biotechnology—4.5% | ||||||||
Amgen, Inc. | 10,230 | 1,028,422 | ||||||
Celgene Corp. (a) | 10,760 | 1,330,474 | ||||||
|
| |||||||
| 2,358,896 | ||||||||
|
| |||||||
| Capital Markets—5.0% | ||||||||
BlackRock, Inc. | 3,500 | 977,200 | ||||||
Northern Trust Corp. | 16,679 | 969,884 | ||||||
SEI Investments Co. | 23,009 | 704,305 | ||||||
|
| |||||||
| 2,651,389 | ||||||||
|
| |||||||
| Chemicals—4.6% | ||||||||
Air Products & Chemicals, Inc. | 7,294 | 688,626 | ||||||
Mosaic Co. | 18,480 | 1,123,954 | ||||||
Rockwood Holdings, Inc. | 8,920 | 594,607 | ||||||
|
| |||||||
| 2,407,187 | ||||||||
|
| |||||||
| Commercial Banks—5.1% | ||||||||
PNC Financial Services Group, Inc. | 9,851 | 705,726 | ||||||
U.S. Bancorp | 18,010 | 631,431 | ||||||
Wells Fargo & Co. | 33,830 | 1,371,806 | ||||||
|
| |||||||
| 2,708,963 | ||||||||
|
| |||||||
| Communications Equipment—3.9% | ||||||||
F5 Networks, Inc. (a) | 4,980 | 414,386 | ||||||
QUALCOMM, Inc. | 25,670 | 1,629,531 | ||||||
|
| |||||||
| 2,043,917 | ||||||||
|
| |||||||
| Computers & Peripherals—5.5% | ||||||||
Apple, Inc. | 4,376 | 1,967,799 | ||||||
EMC Corp. (a) | 38,322 | 948,853 | ||||||
|
| |||||||
| 2,916,652 | ||||||||
|
| |||||||
| Diversified Financial Services—2.6% | ||||||||
Citigroup, Inc. | 7,460 | 387,845 | ||||||
JPMorgan Chase & Co. | 18,495 | 1,009,642 | ||||||
|
| |||||||
| 1,397,487 | ||||||||
|
| |||||||
| Diversified Telecommunication Services—4.1% | ||||||||
AT&T, Inc. | 41,553 | 1,453,939 | ||||||
Verizon Communications, Inc. | 14,322 | 694,331 | ||||||
|
| |||||||
| 2,148,270 | ||||||||
|
| |||||||
| Energy Equipment & Services—6.0% | ||||||||
Cameron International Corp. (a) | 13,550 | 824,789 | ||||||
National Oilwell Varco, Inc. | 10,880 | 764,864 | ||||||
Schlumberger Ltd. | 21,340 | 1,558,460 | ||||||
|
| |||||||
| 3,148,113 | ||||||||
|
| |||||||
| Food Products—2.7% | ||||||||
Archer-Daniels-Midland Co. | 10,480 | 337,770 | ||||||
General Mills, Inc. | 9,080 | 427,487 | ||||||
Mead Johnson Nutrition Co. | 8,460 | 685,852 | ||||||
|
| |||||||
| 1,451,109 | ||||||||
|
| |||||||
| Health Care Equipment & Supplies—3.8% | ||||||||
Hologic, Inc. (a) | 30,200 | 626,650 | ||||||
Intuitive Surgical, Inc. (a) | 684 | 340,310 | ||||||
Varian Medical Systems, | 15,273 | 1,023,444 | ||||||
|
| |||||||
| 1,990,404 | ||||||||
|
| |||||||
| Shares | Value | |||||||
| Hotels, Restaurants & Leisure—2.0% | ||||||||
McDonald’s Corp. | 8,390 | $810,222 | ||||||
Starwood Hotels & Resorts Worldwide, Inc. | 3,530 | 241,099 | ||||||
|
| |||||||
| 1,051,321 | ||||||||
|
| |||||||
| Household Products—2.2% | ||||||||
Procter & Gamble Co. | 15,160 | 1,163,682 | ||||||
|
| |||||||
| Industrial Conglomerates—4.6% | ||||||||
General Electric Co. | 104,390 | 2,434,375 | ||||||
|
| |||||||
| Insurance—1.4% | ||||||||
MetLife, Inc. | 16,560 | 732,118 | ||||||
|
| |||||||
| Internet Software & Services—2.7% | ||||||||
Akamai Technologies, Inc. (a) | 16,980 | 783,118 | ||||||
eBay, Inc. (a) | 11,790 | 637,839 | ||||||
|
| |||||||
| 1,420,957 | ||||||||
|
| |||||||
| Leisure Equipment & Products—0.8% | ||||||||
Hasbro, Inc. | 9,590 | 426,563 | ||||||
|
| |||||||
| Machinery—3.4% | ||||||||
Caterpillar, Inc. | 14,458 | 1,240,497 | ||||||
Deere & Co. | 6,640 | 578,410 | ||||||
|
| |||||||
| 1,818,907 | ||||||||
|
| |||||||
| Metals & Mining—1.5% | ||||||||
Freeport-McMoRan Copper & Gold, Inc. | 26,190 | 813,200 | ||||||
|
| |||||||
| Multi-line Retail—1.7% | ||||||||
Target Corp. | 13,160 | 914,620 | ||||||
|
| |||||||
| Oil, Gas & Consumable Fuels—8.0% | ||||||||
Apache Corp. | 6,630 | 544,522 | ||||||
Exxon Mobil Corp. | 22,050 | 1,994,863 | ||||||
Occidental Petroleum Corp. | 9,880 | 909,651 | ||||||
Southwestern Energy Co. (a) | 9,243 | 348,369 | ||||||
Williams Cos., Inc. | 12,220 | 429,900 | ||||||
|
| |||||||
| 4,227,305 | ||||||||
|
| |||||||
| Pharmaceuticals—5.9% | ||||||||
AbbVie, Inc. | 19,330 | 825,198 | ||||||
Johnson & Johnson | 10,720 | 902,410 | ||||||
Pfizer, Inc. | 51,380 | 1,399,077 | ||||||
|
| |||||||
| 3,126,685 | ||||||||
|
| |||||||
| Semiconductors & Semiconductor Equipment—2.6% | ||||||||
Intel Corp. | 55,480 | 1,347,054 | ||||||
|
| |||||||
| Software—5.8% | ||||||||
Adobe Systems, Inc. (a) | 24,290 | 1,042,284 | ||||||
Autodesk, Inc. (a) | 19,199 | 724,378 | ||||||
Intuit, Inc. | 13,640 | 797,122 | ||||||
Nuance Communications, Inc. (a) | 25,960 | 493,240 | ||||||
|
| |||||||
| 3,057,024 | ||||||||
|
| |||||||
| Total Common Stock (cost—$42,321,241) | 51,530,898 | |||||||
|
| |||||||
| Principal Amount (000s) | Value | |||||||
| Repurchase Agreements—2.4% | ||||||||
State Street Bank & Trust Co., dated 5/31/13, 0.01%, due 6/3/13, proceeds $1,246,001; collateralized by Fannie Mae, 2.23%, due 12/6/22, valued at $1,273,600 including accrued interest |
| |||||||
(cost—$1,246,000) | $1,246 | $1,246,000 | ||||||
|
| |||||||
| Total Investments (cost—$43,567,241)—100.0% | 52,776,898 | |||||||
|
| |||||||
| Liabilities in excess of other assets—0.0% | (12,415 | ) | ||||||
|
| |||||||
| Net Assets—100.0% | $52,764,483 | |||||||
|
| |||||||
Notes to Schedule of Investments:
(a) Non-income producing.
| See accompanying Notes to Financial Statements | | May 31, 2013 | | Semiannual Report | 111 |
Table of Contents
Schedule of Investments
May 31, 2013 (Unaudited)
AllianzGI Dynamic Emerging
Multi-Asset Fund
| Shares | Value | |||||||
| Mutual Funds—47.4% | ||||||||
| PIMCO Emerging Markets Bond (a)(b) (cost—$2,466,226) | 197,780 | $2,351,602 | ||||||
|
| |||||||
| Principal Amount (000s) | ||||||||
| Corporate Bonds & Notes—8.2% | ||||||||
| Germany—8.2% | ||||||||
KFW, | ||||||||
4.00%, 10/15/13 | $400 | 405,407 | ||||||
|
| |||||||
| Short-Term Investments—52.5% | ||||||||
| U.S. Treasury Obligations (c)—32.2% | ||||||||
U.S. Treasury Bills, | ||||||||
0.039%-0.058%, 6/20/13-7/11/2013 (cost—$1,599,934) | 1,600 | 1,599,934 | ||||||
|
| |||||||
| Repurchase Agreements—20.3% | ||||||||
State Street Bank & Trust Co., dated 5/31/13, 0.01%, due 6/3/13, proceeds $1,006,001; collateralized by Federal Home Loan Bank, 5.50%, due 7/15/36, valued at $1,030,168 including accrued interest |
| |||||||
(cost—$1,006,000) | 1,006 | 1,006,000 | ||||||
|
| |||||||
| Total Short-Term Investments (cost—$2,605,934) | 2,605,934 | |||||||
|
| |||||||
| Total Investments (cost—$5,477,668)—108.1% | 5,362,943 | |||||||
|
| |||||||
| Liabilities in excess of other assets—(8.1)% | (403,089 | ) | ||||||
|
| |||||||
| Net Assets—100.0% | $4,959,854 | |||||||
|
| |||||||
Notes to Schedule of Investments:
(a) Affiliated fund.
(b) Institutional Class share.
(c) Rates reflect the effective yields at purchase date.
AllianzGI Global Managed
Volatility Fund
| Shares | Value | |||||||
| Common Stock—98.5% | ||||||||
| Canada—14.0% | ||||||||
Allied Properties Real Estate Investment Trust REIT | 1,291 | $41,765 | ||||||
Barrick Gold Corp. | 2,882 | 60,545 | ||||||
BCE, Inc. | 13,058 | 586,807 | ||||||
Bell Aliant, Inc. | 4,552 | 123,070 | ||||||
Boardwalk Real Estate Investment Trust REIT | 1,463 | 86,080 | ||||||
Canadian Apartment Properties REIT | 5,832 | 138,550 | ||||||
Cineplex, Inc. | 1,240 | 40,964 | ||||||
Dundee Real Estate Investment Trust, Class A REIT | 1,431 | 47,054 | ||||||
Fairfax Financial Holdings Ltd. | 580 | 234,210 | ||||||
Franco-Nevada Corp. | 4,576 | 190,941 | ||||||
Intact Financial Corp. | 1,856 | 109,829 | ||||||
Manitoba Telecom Services, Inc. | 3,483 | 119,801 | ||||||
RioCan REIT | 3,079 | 81,671 | ||||||
TELUS Corp. | 10,224 | 356,102 | ||||||
|
| |||||||
| 2,217,389 | ||||||||
|
| |||||||
| China—7.1% | ||||||||
Bank of Communications Co., Ltd., Class H | 267,000 | 203,257 | ||||||
BYD Co., Ltd., Class H (b) | 25,000 | 108,930 | ||||||
China Citic Bank Corp. Ltd., Class H | 84,000 | 44,969 | ||||||
China Minsheng Banking Corp. Ltd., Class H | 50,000 | 61,089 | ||||||
China Mobile Ltd. | 6,700 | 70,633 | ||||||
China Oilfield Services Ltd., Class H | 22,000 | 46,255 | ||||||
Datang International Power Generation Co., Ltd., Class H | 184,000 | 75,826 | ||||||
Huaneng Power International, Inc., Class H | 176,000 | 179,047 | ||||||
PetroChina Co., Ltd., Class H | 244,000 | 282,656 | ||||||
Skyworth Digital Holdings Ltd. | 80,000 | 53,648 | ||||||
|
| |||||||
| 1,126,310 | ||||||||
|
| |||||||
| France—0.3% | ||||||||
UBISOFT Entertainment (b) | 3,930 | 51,376 | ||||||
|
| |||||||
| Hong Kong—5.2% | ||||||||
CLP Holdings Ltd. | 25,600 | 215,396 | ||||||
Hongkong Land Holdings Ltd. | 8,000 | 55,307 | ||||||
Jardine Matheson Holdings Ltd. | 4,000 | 262,501 | ||||||
Link REIT | 24,800 | 127,587 | ||||||
Power Assets Holdings Ltd. | 19,200 | 168,051 | ||||||
|
| |||||||
| 828,842 | ||||||||
|
| |||||||
| Israel—1.4% | ||||||||
Mizrahi Tefahot Bank Ltd. (b) | 4,455 | 46,005 | ||||||
Teva Pharmaceutical Industries Ltd. | 4,644 | 177,894 | ||||||
|
| |||||||
| 223,899 | ||||||||
|
| |||||||
| Japan—11.5% | ||||||||
Alps Electric Co., Ltd. | 6,300 | 43,162 | ||||||
ANA Holdings, Inc. | 55,000 | 115,433 | ||||||
Eisai Co., Ltd. | 900 | 34,541 | ||||||
FamilyMart Co., Ltd. | 1,200 | 48,644 | ||||||
HIS Co., Ltd. | 1,700 | 67,918 | ||||||
ITOCHU Corp. | 8,000 | 99,141 | ||||||
Japan Airlines Co., Ltd. | 1,200 | 61,509 | ||||||
| Shares | Value | |||||||
Japan Real Estate Investment Corp. REIT | 9 | $88,614 | ||||||
Kao Corp. | 3,700 | 115,949 | ||||||
Nippon Building Fund, Inc. REIT | 3 | 30,852 | ||||||
Nippon Telegraph & Telephone Corp. | 6,600 | 325,512 | ||||||
NTT DoCoMo, Inc. | 115 | 168,017 | ||||||
Oriental Land Co., Ltd. | 1,400 | 190,891 | ||||||
Orix JREIT, Inc. REIT | 36 | 38,754 | ||||||
Osaka Gas Co., Ltd. | 25,000 | 100,950 | ||||||
Takeda Pharmaceutical Co., Ltd. | 1,000 | 44,322 | ||||||
Tokyo Gas Co., Ltd. | 34,000 | 182,815 | ||||||
West Japan Railway Co. | 1,800 | 74,861 | ||||||
|
| |||||||
| 1,831,885 | ||||||||
|
| |||||||
| Singapore—2.8% | ||||||||
Ascendas Real Estate Investment Trust REIT | 119,000 | 217,687 | ||||||
CapitaMall Trust REIT | 92,000 | 155,847 | ||||||
ComfortDelGro Corp. Ltd. | 43,000 | 64,633 | ||||||
|
| |||||||
| 438,167 | ||||||||
|
| |||||||
| Switzerland—1.7% | ||||||||
Nestle S.A. | 2,552 | 169,056 | ||||||
Novartis AG | 1,297 | 92,907 | ||||||
|
| |||||||
| 261,963 | ||||||||
|
| |||||||
| United Kingdom—0.3% | ||||||||
AstraZeneca PLC | 899 | 45,997 | ||||||
|
| |||||||
| United States—54.2% | ||||||||
Alleghany Corp. (b) | 200 | 78,000 | ||||||
AMC Networks, Inc., Class A (b) | 600 | 38,412 | ||||||
American Capital Agency Corp. REIT | 8,800 | 227,040 | ||||||
Annaly Capital Management, Inc. REIT | 34,400 | 467,152 | ||||||
AutoZone, Inc. (b) | 1,200 | 490,596 | ||||||
Axis Capital Holdings Ltd. | 900 | 39,204 | ||||||
Campbell Soup Co. | 7,500 | 321,075 | ||||||
Capitol Federal Financial, Inc. | 16,500 | 195,855 | ||||||
Capstead Mortgage Corp. REIT | 15,100 | 185,428 | ||||||
Chimera Investment Corp. REIT | 35,800 | 109,190 | ||||||
Clorox Co. | 3,900 | 324,012 | ||||||
Consolidated Edison, Inc. | 3,400 | 194,038 | ||||||
Dollar General Corp. (b) | 4,100 | 216,480 | ||||||
Dollar Tree, Inc. (b) | 1,200 | 57,648 | ||||||
Duke Energy Corp. | 7,766 | 519,778 | ||||||
Endo Health Solutions, Inc. (b) | 3,000 | 108,900 | ||||||
Exelon Corp. | 4,200 | 131,628 | ||||||
General Mills, Inc. | 14,000 | 659,120 | ||||||
Hatteras Financial Corp. REIT | 5,300 | 136,846 | ||||||
HCA Holdings, Inc. | 1,400 | 54,684 | ||||||
Kellogg Co. | 3,000 | 186,150 | ||||||
Kimberly-Clark Corp. | 3,700 | 358,271 | ||||||
Lorillard, Inc. | 2,100 | 89,124 | ||||||
McDonald’s Corp. | 1,900 | 183,483 | ||||||
MFA Financial, Inc. REIT | 12,900 | 113,262 | ||||||
Mondelez International, Inc., Class A | 3,000 | 88,380 | ||||||
O’Reilly Automotive, Inc. (b) | 600 | 65,346 | ||||||
PepsiCo, Inc. | 7,200 | 581,544 | ||||||
PPL Corp. | 4,100 | 121,770 | ||||||
Procter & Gamble Co. | 2,500 | 191,900 | ||||||
RenaissanceRe Holdings Ltd. | 3,600 | 309,456 | ||||||
Southern Co. | 12,300 | 539,970 | ||||||
Target Corp. | 1,700 | 118,150 | ||||||
| 112 | Semiannual Report | | May 31, 2013 | | See accompanying Notes to Financial Statements |
Table of Contents
Schedule of Investments
May 31, 2013 (Unaudited)
| Shares | Value | |||||||
Validus Holdings Ltd. | 13,200 | $476,652 | ||||||
Wal-Mart Stores, Inc. | 6,600 | 493,944 | ||||||
Waste Connections, Inc. | 2,000 | 80,480 | ||||||
Zynga, Inc., Class A (b) | 15,000 | 51,000 | ||||||
|
| |||||||
| 8,603,968 | ||||||||
|
| |||||||
| Total Common Stock (cost—$14,668,193) | 15,629,796 | |||||||
|
| |||||||
| Principal Amount (000s) | ||||||||
| Repurchase Agreements—3.1% | ||||||||
State Street Bank & Trust Co., dated 5/31/13, 0.01%, due 6/3/13, proceeds $486,000; collateralized by Federal Home Loan Bank, 5.50%, due 7/15/36, valued at $501,877 including accrued interest |
| |||||||
(cost—$486,000) | $486 | 486,000 | ||||||
|
| |||||||
| Total Investments (cost—$15,154,193) (a)—101.6% | 16,115,796 | |||||||
|
| |||||||
| Liabilities in excess of other assets—(1.6)% | (247,334 | ) | ||||||
|
| |||||||
| Net Assets—100.0% | $15,868,462 | |||||||
|
| |||||||
Notes to Schedule of Investments:
(a) Securities with an aggregate value of $4,808,439, representing 30.3% of net assets, were valued utilizing modeling tools provided by a third-party vendor. See Note 1(a) and Note 1(b) in the Notes to Financial Statements.
(b) Non-income producing.
Glossary:
REIT—Real Estate Investment Trust
The industry classification of portfolio holdings and liabilities in excess of other assets shown as a percentage of net assets as of May 31, 2013 were as follows:
Real Estate Investment Trust | 14.5% | |||
Electric Utilities | 10.8% | |||
Diversified Telecommunication Services | 9.4% | |||
Food Products | 9.1% | |||
Insurance | 7.8% | |||
Household Products | 5.5% | |||
Beverages | 3.7% | |||
Specialty Retail | 3.5% | �� | ||
Food & Staples Retailing | 3.4% | |||
Pharmaceuticals | 3.2% | |||
Hotels, Restaurants & Leisure | 2.8% | |||
Multi-line Retail | 2.5% | |||
Commercial Banks | 2.3% | |||
Gas Utilities | 1.8% | |||
Oil, Gas & Consumable Fuels | 1.8% | |||
Industrial Conglomerates | 1.6% | |||
Independent Power Producers & | 1.6% | |||
Metals & Mining | 1.6% | |||
Wireless Telecommunication Services | 1.5% | |||
Thrifts & Mortgage Finance | 1.2% | |||
Multi-Utilities | 1.2% | |||
Airlines | 1.1% | |||
Road & Rail | 0.9% | |||
Personal Products | 0.7% | |||
Automobiles | 0.7% | |||
Software | 0.6% | |||
Trading Companies & Distributors | 0.6% | |||
Tobacco | 0.6% | |||
Commercial Services & Supplies | 0.5% | |||
Media | 0.5% | |||
Real Estate Management & Development | 0.3% | |||
Health Care Providers & Services | 0.3% | |||
Household Durables | 0.3% | |||
Energy Equipment & Services | 0.3% | |||
Electronic Equipment, Instruments & Components | 0.3% | |||
Repurchase Agreements | 3.1% | |||
Liabilities in excess of other assets | (1.6)% | |||
|
| |||
| 100.0% | ||||
|
|
AllianzGI Global Water Fund
| Shares | Value | |||||||
| Common Stock—92.7% | ||||||||
| Austria—4.1% | ||||||||
Andritz AG | 131,747 | $7,173,805 | ||||||
|
| |||||||
| Brazil—3.6% | ||||||||
Cia de Saneamento Basico do Estado de Sao Paulo ADR | 394,938 | 5,023,612 | ||||||
Cia de Saneamento de Minas Gerais | 60,900 | 1,265,314 | ||||||
|
| |||||||
| 6,288,926 | ||||||||
|
| |||||||
| Chile—0.9% | ||||||||
Aguas Andinas S.A., Class A | 2,188,383 | 1,624,539 | ||||||
|
| |||||||
| China—3.6% | ||||||||
China Everbright International Ltd. (c) | 2,042,000 | 1,655,744 | ||||||
Guangdong Investment Ltd. | 5,214,000 | 4,563,004 | ||||||
|
| |||||||
| 6,218,748 | ||||||||
|
| |||||||
| France—5.9% | ||||||||
Suez Environnement Co. | 391,985 | 5,047,444 | ||||||
Veolia Environnement S.A. | 408,397 | 5,100,630 | ||||||
|
| |||||||
| 10,148,074 | ||||||||
|
| |||||||
| Hong Kong—1.1% | ||||||||
Beijing Enterprises Water Group Ltd. | 5,000,000 | 1,893,805 | ||||||
Fook Woo Group Holdings Ltd. (b)(d) | 944,000 | 41,712 | ||||||
|
| |||||||
| 1,935,517 | ||||||||
|
| |||||||
| Israel—1.8% | ||||||||
Israel Chemicals Ltd. | 278,906 | 3,102,013 | ||||||
|
| |||||||
| Japan—1.9% | ||||||||
Daiseki Co., Ltd. | 86,900 | 1,417,407 | ||||||
Ebara Corp. | 358,000 | 1,842,026 | ||||||
|
| |||||||
| 3,259,433 | ||||||||
|
| |||||||
| Netherlands—2.0% | ||||||||
Arcadis NV | 121,543 | 3,402,893 | ||||||
|
| |||||||
| Sweden—3.3% | ||||||||
Alfa Laval AB | 265,855 | 5,778,503 | ||||||
|
| |||||||
| Switzerland—13.3% | ||||||||
Belimo Holding AG | 760 | 1,743,728 | ||||||
Geberit AG (d) | 30,128 | 7,499,932 | ||||||
Pentair Ltd. | 149,010 | 8,678,342 | ||||||
Sulzer AG | 30,060 | 5,021,983 | ||||||
|
| |||||||
| 22,943,985 | ||||||||
|
| |||||||
| United Kingdom—17.8% | ||||||||
Halma PLC | 637,405 | 4,978,057 | ||||||
Pennon Group PLC | 300,731 | 3,106,716 | ||||||
Rotork PLC (c) | 117,788 | 5,079,401 | ||||||
Severn Trent PLC | 291,149 | 9,077,463 | ||||||
Spectris PLC | 48,719 | 1,525,948 | ||||||
United Utilities Group PLC | 619,316 | 7,075,825 | ||||||
|
| |||||||
| 30,843,410 | ||||||||
|
| |||||||
| United States—33.4% | ||||||||
American Water Works Co., Inc. | 260,238 | 10,393,906 | ||||||
AMETEK, Inc. | 39,933 | 1,723,109 | ||||||
Aqua America, Inc. | 96,615 | 3,003,760 | ||||||
Badger Meter, Inc. | 23,212 | 1,034,327 | ||||||
Danaher Corp. | 165,380 | 10,223,792 | ||||||
Franklin Electric Co., Inc. | 105,186 | 3,556,339 | ||||||
Gorman-Rupp Co. | 42,213 | 1,235,152 | ||||||
IDEX Corp. | 136,550 | 7,517,077 | ||||||
Lindsay Corp. | 25,989 | 2,111,606 | ||||||
| See accompanying Notes to Financial Statements | | May 31, 2013 | | Semiannual Report | 113 |
Table of Contents
Schedule of Investments
May 31, 2013 (Unaudited)
| Shares | Value | |||||||
Roper Industries, Inc. | 12,315 | $1,529,769 | ||||||
Tetra Tech, Inc. (d) | 179,827 | 4,957,830 | ||||||
Watts Water Technologies, Inc., Class A | 83,551 | 3,977,028 | ||||||
Xylem, Inc. | 231,820 | 6,523,415 | ||||||
|
| |||||||
| 57,787,110 | ||||||||
|
| |||||||
| Total Common Stock (cost—$140,682,585) | 160,506,956 | |||||||
|
| |||||||
| Principal Amount (000s) | ||||||||
| Repurchase Agreements—6.9% | ||||||||
State Street Bank & Trust Co., dated 5/31/13, 0.01%, due 6/3/13, proceeds $12,013,010; collateralized by Federal Home Loan Bank, 5.50%, due 7/15/36, valued at $12,256,356 including accrued interest |
| |||||||
(cost—$12,013,000) | $12,013 | 12,013,000 | ||||||
|
| |||||||
| Total Investments (cost—$152,695,585) (a)—99.6% | 172,519,956 | |||||||
|
| |||||||
| Other assets less liabilities—0.4% | 675,266 | |||||||
|
| |||||||
| Net Assets—100.0% | $173,195,222 | |||||||
|
| |||||||
Notes to Schedule of Investments:
(a) Securities with an aggregate value of $75,265,136, representing 43.5% of net assets, were valued utilizing modeling tools provided by a third-party vendor. See Note 1(a) and Note 1(b) in the Notes to Financial Statements.
(b) Fair-Valued—Security with a value of $41,712, representing less than 0.05% of net assets. See Note 1(a) and Note 1(b) in the Notes to Financial Statements.
(c) Affiliated security.
(d) Non-income producing.
Glossary:
ADR—American Depositary Receipt
The industry classification of portfolio holdings and other assets less liabilities shown as a percentage of net assets as of May 31, 2013 were as follows:
Machinery | 31.6% | |||
Water Utilities | 27.0% | |||
Industrial Conglomerates | 5.9% | |||
Multi-Utilities | 5.9% | |||
Building Products | 5.4% | |||
Commercial Services & Supplies | 4.7% | |||
Electronic Equipment, Instruments & Components | 4.4% | |||
Electrical Equipment | 4.0% | |||
Construction & Engineering | 2.0% | |||
Chemicals | 1.8% | |||
Repurchase Agreements | 6.9% | |||
Other assets less liabilities | 0.4% | |||
|
| |||
| 100.0% | ||||
|
|
AllianzGI High Yield Bond Fund
| Principal Amount (000s) | Value | |||||||
| Corporate Bonds & Notes—97.2% | ||||||||
| Advertising—0.5% | ||||||||
Affinion Group, Inc., | ||||||||
11.50%, 10/15/15 | $2,395 | $2,059,700 | ||||||
|
| |||||||
| Aerospace & Defense—3.1% | ||||||||
AAR Corp., | ||||||||
7.25%, 1/15/22 | 3,165 | 3,449,850 | ||||||
Erickson Air-Crane, Inc. (a)(b), |
| |||||||
8.25%, 5/1/20 | 2,750 | 2,842,813 | ||||||
TransDigm, Inc., | ||||||||
7.75%, 12/15/18 | 2,905 | 3,184,606 | ||||||
Triumph Group, Inc., | ||||||||
8.00%, 11/15/17 | 2,795 | 2,969,687 | ||||||
|
| |||||||
| 12,446,956 | ||||||||
|
| |||||||
| Apparel & Textiles—0.7% | ||||||||
Quiksilver, Inc., | ||||||||
6.875%, 4/15/15 | 2,705 | 2,708,408 | ||||||
|
| |||||||
| Auto Components—5.3% | ||||||||
American Axle & Manufacturing, Inc., |
| |||||||
6.625%, 10/15/22 | 1,665 | 1,800,281 | ||||||
7.75%, 11/15/19 | 3,580 | 4,099,100 | ||||||
Commercial Vehicle Group, Inc., |
| |||||||
7.875%, 4/15/19 | 3,435 | 3,495,113 | ||||||
Cooper-Standard Automotive, Inc., |
| |||||||
8.50%, 5/1/18 | 3,750 | 4,101,562 | ||||||
Goodyear Tire & Rubber Co., |
| |||||||
8.25%, 8/15/20 | 2,965 | 3,317,094 | ||||||
Titan International, Inc., | ||||||||
7.875%, 10/1/17 (a)(b) | 1,860 | 1,999,500 | ||||||
7.875%, 10/1/17 | 2,305 | 2,477,875 | ||||||
|
| |||||||
| 21,290,525 | ||||||||
|
| |||||||
| Auto Manufacturers—2.7% | ||||||||
Chrysler Group LLC, | ||||||||
8.25%, 6/15/21 | 3,305 | 3,751,175 | ||||||
Jaguar Land Rover Automotive PLC (a)(b), |
| |||||||
7.75%, 5/15/18 | 3,310 | 3,624,450 | ||||||
Navistar International Corp., |
| |||||||
8.25%, 11/1/21 | 3,245 | 3,322,069 | ||||||
|
| |||||||
| 10,697,694 | ||||||||
|
| |||||||
| Banking—1.2% | ||||||||
Ally Financial, Inc., | ||||||||
8.00%, 3/15/20 | 2,940 | 3,513,300 | ||||||
8.30%, 2/12/15 | 1,000 | 1,102,500 | ||||||
|
| |||||||
| 4,615,800 | ||||||||
|
| |||||||
| Building Materials—1.1% | ||||||||
Louisiana-Pacific Corp., | ||||||||
7.50%, 6/1/20 | 3,790 | 4,292,175 | ||||||
|
| |||||||
| Chemicals—0.6% | ||||||||
Omnova Solutions, Inc., | ||||||||
7.875%, 11/1/18 | 2,260 | 2,429,500 | ||||||
|
| |||||||
| Coal—0.9% | ||||||||
Arch Coal, Inc. (a)(b), | ||||||||
9.875%, 6/15/19 | 3,415 | 3,534,525 | ||||||
|
| |||||||
| Commercial Services—9.9% | ||||||||
Avis Budget Car Rental LLC, | ||||||||
9.625%, 3/15/18 | 1,285 | 1,423,138 | ||||||
9.75%, 3/15/20 | 500 | 586,250 | ||||||
Cardtronics, Inc., | ||||||||
8.25%, 9/1/18 | 2,690 | 2,925,375 | ||||||
Cenveo Corp., | ||||||||
11.50%, 5/15/17 | 3,610 | 3,095,575 | ||||||
Deluxe Corp., | ||||||||
7.00%, 3/15/19 | 1,650 | 1,802,625 | ||||||
Envision Healthcare, | ||||||||
8.125%, 6/1/19 | 3,206 | 3,510,570 | ||||||
| Principal Amount (000s) | Value | |||||||
ExamWorks Group, Inc., | ||||||||
9.00%, 7/15/19 | $3,695 | $4,082,975 | ||||||
H&E Equipment Services, Inc., |
| |||||||
7.00%, 9/1/22 | 3,380 | 3,667,300 | ||||||
Harland Clarke Holdings Corp., |
| |||||||
9.50%, 5/15/15 | 325 | 327,031 | ||||||
9.75%, 8/1/18 (a)(b) | 2,550 | 2,798,625 | ||||||
Hertz Corp., | ||||||||
6.75%, 4/15/19 | 2,595 | 2,831,794 | ||||||
Interactive Data Corp., | ||||||||
10.25%, 8/1/18 | 3,375 | 3,805,312 | ||||||
Monitronics International, Inc., |
| |||||||
9.125%, 4/1/20 | 2,430 | 2,636,550 | ||||||
United Rentals North America, Inc., |
| |||||||
8.25%, 2/1/21 | 1,980 | 2,202,750 | ||||||
8.375%, 9/15/20 | 3,610 | 3,952,950 | ||||||
|
| |||||||
| 39,648,820 | ||||||||
|
| |||||||
| Computers—1.8% | ||||||||
j2 Global, Inc., | ||||||||
8.00%, 8/1/20 | 4,395 | 4,746,600 | ||||||
Unisys Corp., | ||||||||
6.25%, 8/15/17 | 2,150 | 2,311,250 | ||||||
|
| |||||||
| 7,057,850 | ||||||||
|
| |||||||
| Distribution/Wholesale—0.8% | ||||||||
HD Supply, Inc., | ||||||||
10.50%, 1/15/21 | 3,205 | 3,337,206 | ||||||
|
| |||||||
| Diversified Financial Services—7.1% | ||||||||
Aircastle Ltd., | ||||||||
9.75%, 8/1/18 | 2,410 | 2,735,350 | ||||||
Community Choice Financial, Inc., |
| |||||||
10.75%, 5/1/19 | 3,275 | 3,242,250 | ||||||
International Lease Finance Corp., |
| |||||||
8.25%, 12/15/20 | 3,480 | 4,228,200 | ||||||
8.75%, 3/15/17 | 3,050 | 3,625,687 | ||||||
National Money Mart Co., | ||||||||
10.375%, 12/15/16 | 2,599 | 2,797,174 | ||||||
Nationstar Mortgage LLC (a)(b), |
| |||||||
7.875%, 10/1/20 | 2,265 | 2,491,500 | ||||||
9.625%, 5/1/19 | 2,640 | 3,036,000 | ||||||
SLM Corp., | ||||||||
8.45%, 6/15/18 | 3,750 | 4,181,250 | ||||||
Springleaf Finance Corp., | ||||||||
6.90%, 12/15/17 | 2,055 | 2,139,769 | ||||||
|
| |||||||
| 28,477,180 | ||||||||
|
| |||||||
| Electric Utilities—0.3% | ||||||||
Texas Competitive Electric Holdings Co. LLC (a)(b), |
| |||||||
11.50%, 10/1/20 | 1,490 | 1,177,100 | ||||||
|
| |||||||
| Electrical Equipment—0.9% | ||||||||
WireCo WorldGroup, Inc., | ||||||||
9.50%, 5/15/17 | 3,445 | 3,591,413 | ||||||
|
| |||||||
| Electronics—2.5% | ||||||||
Kemet Corp., | ||||||||
10.50%, 5/1/18 | 3,069 | 3,184,087 | ||||||
NXP BV (a)(b), | ||||||||
9.75%, 8/1/18 | 2,655 | 3,013,425 | ||||||
Viasystems, Inc. (a)(b), | ||||||||
7.875%, 5/1/19 | 3,550 | 3,816,250 | ||||||
|
| |||||||
| 10,013,762 | ||||||||
|
| |||||||
| Engineering & Construction—0.6% | ||||||||
Dycom Investments, Inc., | ||||||||
7.125%, 1/15/21 | 2,175 | 2,365,313 | ||||||
|
| |||||||
| Healthcare-Products—1.0% | ||||||||
Kinetic Concepts, Inc., | ||||||||
10.50%, 11/1/18 | 3,695 | 4,018,312 | ||||||
|
| |||||||
| Healthcare-Services—1.3% | ||||||||
Community Health Systems, Inc., |
| |||||||
7.125%, 7/15/20 | 1,500 | 1,648,125 | ||||||
| 114 | Semiannual Report | | May 31, 2013 | | See accompanying Notes to Financial Statements |
Table of Contents
Schedule of Investments
May 31, 2013 (Unaudited)
| Principal Amount (000s) | Value | |||||||
8.00%, 11/15/19 | $3,195 | $3,530,475 | ||||||
|
| |||||||
| 5,178,600 | ||||||||
|
| |||||||
| Home Builders—3.8% | ||||||||
Beazer Homes USA, Inc., | ||||||||
7.25%, 2/1/23 (a)(b) | 2,750 | 2,925,313 | ||||||
9.125%, 5/15/19 | 2,280 | 2,505,150 | ||||||
Brookfield Residential Properties, Inc. (a)(b), |
| |||||||
6.50%, 12/15/20 | 2,695 | 2,897,125 | ||||||
KB Home, | 2,215 | 2,613,700 | ||||||
Standard Pacific Corp., 8.375%, 5/15/18 | 3,115 | 3,687,381 | ||||||
William Lyon Homes, Inc. (a)(b), |
| |||||||
8.50%, 11/15/20 | 680 | 760,750 | ||||||
|
| |||||||
| 15,389,419 | ||||||||
|
| |||||||
| Household Products/Wares—1.5% | ||||||||
Jarden Corp., | ||||||||
7.50%, 5/1/17 | 930 | 1,062,525 | ||||||
Mead Products LLC (a)(b), | ||||||||
6.75%, 4/30/20 | 1,500 | 1,582,500 | ||||||
Reynolds Group Issuer, Inc., | ||||||||
9.875%, 8/15/19 | 3,115 | 3,407,031 | ||||||
|
| |||||||
| 6,052,056 | ||||||||
|
| |||||||
| Internet—1.6% | ||||||||
Mood Media Corp. (a)(b), | ||||||||
9.25%, 10/15/20 | 3,120 | 3,073,200 | ||||||
Zayo Group LLC, | ||||||||
8.125%, 1/1/20 | 3,005 | 3,350,575 | ||||||
|
| |||||||
| 6,423,775 | ||||||||
|
| |||||||
| Iron/Steel—1.3% | ||||||||
AK Steel Corp., | ||||||||
8.375%, 4/1/22 | 1,800 | 1,620,000 | ||||||
ArcelorMittal, | ||||||||
10.35%, 6/1/19 | 2,830 | 3,516,275 | ||||||
|
| |||||||
| 5,136,275 | ||||||||
|
| |||||||
| Leisure—0.5% | ||||||||
NCL Corp. Ltd., | ||||||||
9.50%, 11/15/18 | 1,891 | 2,141,558 | ||||||
|
| |||||||
| Lodging—2.7% | ||||||||
Caesars Entertainment Operating Co., Inc., |
| |||||||
11.25%, 6/1/17 | 2,745 | 2,875,387 | ||||||
12.75%, 4/15/18 | 2,495 | 1,758,975 | ||||||
MGM Resorts International, | ||||||||
11.375%, 3/1/18 | 3,300 | 4,290,000 | ||||||
Wynn Las Vegas LLC, | ||||||||
7.75%, 8/15/20 | 1,670 | 1,891,275 | ||||||
|
| |||||||
| 10,815,637 | ||||||||
|
| |||||||
| Media—5.4% | ||||||||
Cablevision Systems Corp., | ||||||||
8.625%, 9/15/17 | 2,960 | 3,463,200 | ||||||
Cambium Learning Group, Inc., |
| |||||||
9.75%, 2/15/17 | 1,045 | 950,950 | ||||||
Clear Channel Worldwide Holdings, Inc. (a)(b), |
| |||||||
6.50%, 11/15/22 | 2,315 | 2,453,900 | ||||||
McClatchy Co. (a)(b), | ||||||||
9.00%, 12/15/22 | 2,610 | 2,831,850 | ||||||
McGraw-Hill Global Education Holdings LLC (a)(b), |
| |||||||
9.75%, 4/1/21 | 3,745 | 3,908,844 | ||||||
Media General, Inc., | ||||||||
11.75%, 2/15/17 | 3,210 | 3,595,200 | ||||||
Nexstar Broadcasting, Inc. (a)(b), |
| |||||||
6.875%, 11/15/20 | 2,780 | 2,974,600 | ||||||
Sinclair Television Group, Inc. (a)(b), |
| |||||||
9.25%, 11/1/17 | 1,205 | 1,292,362 | ||||||
|
| |||||||
| 21,470,906 | ||||||||
|
| |||||||
| Principal Amount (000s) | Value | |||||||
| Mining—0.7% | ||||||||
Thompson Creek Metals Co., Inc., |
| |||||||
7.375%, 6/1/18 | $3,235 | $2,943,850 | ||||||
|
| |||||||
| Miscellaneous Manufacturing—1.0% | ||||||||
Park-Ohio Industries, Inc., | ||||||||
8.125%, 4/1/21 | 3,680 | 4,121,600 | ||||||
|
| |||||||
| Oil & Gas—11.5% | ||||||||
BreitBurn Energy Partners L.P., |
| |||||||
8.625%, 10/15/20 | 2,745 | 3,033,225 | ||||||
Carrizo Oil & Gas, Inc., | ||||||||
8.625%, 10/15/18 | 3,615 | 3,958,425 | ||||||
Chesapeake Energy Corp., | ||||||||
6.625%, 8/15/20 | 2,455 | 2,743,462 | ||||||
Concho Resources, Inc., | ||||||||
7.00%, 1/15/21 | 3,600 | 3,933,000 | ||||||
CVR Refining LLC (a)(b), | ||||||||
6.50%, 11/1/22 | 3,580 | 3,723,200 | ||||||
Endeavour International Corp., | ||||||||
12.00%, 3/1/18 | 3,770 | 3,562,650 | ||||||
Energy XXI Gulf Coast, Inc., | ||||||||
9.25%, 12/15/17 | 2,990 | 3,333,850 | ||||||
EP Energy LLC, | ||||||||
9.375%, 5/1/20 | 3,325 | 3,786,344 | ||||||
EV Energy Partners L.P., | ||||||||
8.00%, 4/15/19 | 1,335 | 1,378,388 | ||||||
Laredo Petroleum, Inc., | ||||||||
7.375%, 5/1/22 | 2,585 | 2,856,425 | ||||||
Northern Oil and Gas, Inc., | ||||||||
8.00%, 6/1/20 | 3,195 | 3,338,775 | ||||||
PBF Holding Co. LLC, | ||||||||
8.25%, 2/15/20 | 2,570 | 2,852,700 | ||||||
Pioneer Energy Services Corp., | ||||||||
9.875%, 3/15/18 | 1,080 | 1,182,600 | ||||||
United Refining Co., | ||||||||
10.50%, 2/28/18 | 2,560 | 2,918,400 | ||||||
Vanguard Natural Resources LLC, |
| |||||||
7.875%, 4/1/20 | 3,275 | 3,520,625 | ||||||
|
| |||||||
| 46,122,069 | ||||||||
|
| |||||||
| Pharmaceuticals—0.8% | ||||||||
Endo Health Solutions, Inc., | ||||||||
7.00%, 12/15/20 | 2,855 | 3,090,538 | ||||||
|
| |||||||
| Real Estate Investment Trust—1.0% | ||||||||
iStar Financial, Inc., | ||||||||
7.125%, 2/15/18 | 3,580 | 3,884,300 | ||||||
|
| |||||||
| Retail—6.7% | ||||||||
Bon-Ton Department Stores, Inc. (a)(b), |
| |||||||
8.00%, 6/15/21 | 1,345 | 1,387,031 | ||||||
Brown Shoe Co., Inc., | ||||||||
7.125%, 5/15/19 | 3,530 | 3,750,625 | ||||||
Claire’s Stores, Inc. (a)(b), | ||||||||
9.00%, 3/15/19 | 1,790 | 2,022,700 | ||||||
DineEquity, Inc., | ||||||||
9.50%, 10/30/18 | 3,600 | 4,068,000 | ||||||
Fifth & Pacific Cos., Inc., | ||||||||
10.50%, 4/15/19 | 3,840 | 4,300,800 | ||||||
Rite Aid Corp., | ||||||||
9.50%, 6/15/17 | 3,310 | 3,429,988 | ||||||
Sonic Automotive, Inc., | ||||||||
7.00%, 7/15/22 | 3,265 | 3,628,231 | ||||||
Toys R Us, Inc., | ||||||||
10.375%, 8/15/17 | 3,750 | 4,115,625 | ||||||
|
| |||||||
| 26,703,000 | ||||||||
|
| |||||||
| Semiconductors—1.7% | ||||||||
Advanced Micro Devices, Inc., |
| |||||||
8.125%, 12/15/17 | 3,195 | 3,322,800 | ||||||
| Principal Amount (000s) | Value | |||||||
Freescale Semiconductor, Inc. (a)(b), |
| |||||||
10.125%, 3/15/18 | $2,930 | $3,288,925 | ||||||
|
| |||||||
| 6,611,725 | ||||||||
|
| |||||||
| Software—1.5% | ||||||||
First Data Corp., | ||||||||
10.625%, 6/15/21 (a)(b) | 3,305 | 3,338,050 | ||||||
12.625%, 1/15/21 | 2,510 | 2,754,725 | ||||||
|
| |||||||
| 6,092,775 | ||||||||
|
| |||||||
| Telecommunications—11.8% | ||||||||
Cincinnati Bell, Inc., |
| |||||||
8.75%, 3/15/18 | 4,340 | 4,470,200 | ||||||
Clearwire Communications LLC (a)(b), |
| |||||||
12.00%, 12/1/15 | 3,500 | 3,749,550 | ||||||
Consolidated Communications Finance Co., |
| |||||||
10.875%, 6/1/20 | 3,000 | 3,480,000 | ||||||
Cricket Communications, Inc., |
| |||||||
7.75%, 10/15/20 | 3,620 | 3,629,050 | ||||||
EarthLink, Inc., | ||||||||
7.375%, 6/1/20 (a)(b) | 3,390 | 3,356,100 | ||||||
8.875%, 5/15/19 | 3,477 | 3,511,770 | ||||||
Hughes Satellite Systems Corp., |
| |||||||
7.625%, 6/15/21 | 3,260 | 3,659,350 | ||||||
Intelsat Jackson Holdings S.A., |
| |||||||
7.25%, 4/1/19 | 3,695 | 3,999,837 | ||||||
ITC Deltacom, Inc., 10.50%, 4/1/16 | 3,436 | 3,636,834 | ||||||
MetroPCS Wireless, Inc., 6.625%, 11/15/20 | 1,250 | 1,342,188 | ||||||
NII Capital Corp., 8.875%, 12/15/19 | 3,260 | 2,966,600 | ||||||
NII International Telecom SCA (a)(b), |
| |||||||
7.875%, 8/15/19 | 1,040 | 1,016,600 | ||||||
Sprint Nextel Corp., | ||||||||
6.00%, 11/15/22 | 1,235 | 1,278,225 | ||||||
11.50%, 11/15/21 | 3,085 | 4,272,725 | ||||||
West Corp., | 1,340 | 1,458,925 | ||||||
Windstream Corp., 7.50%, 6/1/22 | 1,500 | 1,597,500 | ||||||
|
| |||||||
| 47,425,454 | ||||||||
|
| |||||||
| Transportation—1.4% | ||||||||
Quality Distribution LLC, 9.875%, 11/1/18 | 1,405 | 1,577,113 | ||||||
Swift Services Holdings, Inc., |
| |||||||
10.00%, 11/15/18 | 3,505 | 4,021,987 | ||||||
|
| |||||||
| 5,599,100 | ||||||||
|
| |||||||
| Total Corporate Bonds & Notes (cost—$370,138,036) | 388,964,876 | |||||||
|
| |||||||
| Repurchase Agreements—1.4% | ||||||||
State Street Bank & Trust Co., dated 5/31/13, 0.01%, due 6/3/13, proceeds $5,520,005; collateralized by Freddie Mac, 3.00%, due 8/6/20, valued at $5,631,381 including accrued interest |
| |||||||
(cost—$5,520,000) | 5,520 | 5,520,000 | ||||||
|
| |||||||
| Total Investments (cost—$375,658,036)—98.6% | 394,484,876 | |||||||
|
| |||||||
| Other assets less liabilities—1.4% | 5,690,954 | |||||||
|
| |||||||
| Net Assets—100.0% | $400,175,830 | |||||||
|
| |||||||
| See accompanying Notes to Financial Statements | | May 31, 2013 | | Semiannual Report | 115 |
Table of Contents
Schedule of Investments
May 31, 2013 (Unaudited)
Notes to Schedule of Investments:
(a) Private Placement—Restricted as to resale and may not have a readily available market. Securities with an aggregate value of $74,916,788, representing 18.7% of net assets.
(b) 144A—Exempt from registration under Rule 144A of the Securities Act of 1933. These securities may be resold in transactions exempt from registration, typically only to qualified institutional buyers. Unless otherwise indicated, these securities are not considered to be illiquid.
AllianzGI International Small-Cap Fund
| Shares | Value | |||||||
| Common Stock—97.6% | ||||||||
| Austria—1.5% | ||||||||
Schoeller-Bleckmann Oilfield Equipment AG | 13,989 | $1,435,029 | ||||||
|
| |||||||
| China—5.0% | ||||||||
China Everbright International Ltd. (c) | 1,535,000 | 1,244,646 | ||||||
China Machinery Engineering Corp., Class H (d) | 1,350,000 | 950,813 | ||||||
Golden Wheel Tiandi Holdings Co., Ltd. | 1,738,000 | 289,631 | ||||||
Sunny Optical Technology Group Co., Ltd. | 544,000 | 776,745 | ||||||
Tiangong International Co., Ltd. (c) | 4,600,000 | 1,586,177 | ||||||
|
| |||||||
| 4,848,012 | ||||||||
|
| |||||||
| Denmark—7.2% | ||||||||
Christian Hansen Holding A/S | 22,131 | 788,967 | ||||||
DSV A/S | 42,160 | 1,011,994 | ||||||
Jyske Bank A/S (d) | 34,204 | 1,350,506 | ||||||
Pandora A/S | 31,836 | 1,110,081 | ||||||
SimCorp A/S (c) | 5,668 | 1,745,619 | ||||||
Topdanmark A/S (d) | 41,070 | 1,046,605 | ||||||
|
| |||||||
| 7,053,772 | ||||||||
|
| |||||||
| Finland—1.7% | ||||||||
Vacon PLC (c) | 24,145 | 1,663,270 | ||||||
|
| |||||||
| France—2.6% | ||||||||
Sartorius Stedim Biotech | 12,978 | 1,672,139 | ||||||
Virbac S.A. | 4,186 | 909,966 | ||||||
|
| |||||||
| 2,582,105 | ||||||||
|
| |||||||
| Germany—8.4% | ||||||||
Aareal Bank AG (c)(d) | 56,334 | 1,389,284 | ||||||
Bechtle AG | 16,960 | 836,968 | ||||||
Gerry Weber International AG | 20,334 | 865,594 | ||||||
MTU Aero Engines Holding AG | 12,705 | 1,276,194 | ||||||
Pfeiffer Vacuum Technology AG (c) | 12,890 | 1,381,736 | ||||||
United Internet AG (c) | 43,714 | 1,240,873 | ||||||
Wirecard AG | 41,127 | 1,180,054 | ||||||
|
| |||||||
| 8,170,703 | ||||||||
|
| |||||||
| Greece—0.8% | ||||||||
Hellenic Telecommunications Organization S.A. (d) | 88,882 | 777,931 | ||||||
|
| |||||||
| Hong Kong—4.1% | ||||||||
AAC Technologies Holdings, Inc. | 32,000 | 182,450 | ||||||
Dah Sing Financial Holdings Ltd. | 44,000 | 195,754 | ||||||
Emperor International Holdings | 2,750,000 | 832,720 | ||||||
Future Bright Holdings Ltd. | 960,000 | 326,170 | ||||||
Ju Teng International Holdings Ltd. | 2,718,000 | 1,777,832 | ||||||
Tongda Group Holdings Ltd. | 9,310,000 | 678,879 | ||||||
|
| |||||||
| 3,993,805 | ||||||||
|
| |||||||
| Indonesia—2.2% | ||||||||
Erajaya Swasembada Tbk PT (d) | 2,507,500 | 881,785 | ||||||
| Shares | Value | |||||||
Surya Semesta Internusa Tbk PT | 7,375,500 | $1,245,506 | ||||||
|
| |||||||
| 2,127,291 | ||||||||
|
| |||||||
| Ireland—3.4% | ||||||||
Bank of Ireland (d) | 3,790,914 | 873,540 | ||||||
Glanbia PLC | 90,858 | 1,232,017 | ||||||
Paddy Power PLC | 14,948 | 1,259,949 | ||||||
|
| |||||||
| 3,365,506 | ||||||||
|
| |||||||
| Italy—3.9% | ||||||||
De’Longhi SpA | 68,457 | 1,052,194 | ||||||
Mediolanum SpA | 156,080 | 1,036,318 | ||||||
Yoox SpA (d) | 81,109 | 1,670,752 | ||||||
|
| |||||||
| 3,759,264 | ||||||||
|
| |||||||
| Japan—26.5% | ||||||||
Aica Kogyo Co., Ltd. | 68,500 | 1,280,370 | ||||||
Anritsu Corp. | 102,000 | 1,377,559 | ||||||
Denki Kogyo Co., Ltd. | 132,000 | 692,364 | ||||||
Don Quijote Co., Ltd. | 22,300 | 1,004,979 | ||||||
Kakaku.com, Inc. | 51,500 | 1,242,145 | ||||||
KYB Co., Ltd. | 216,000 | 1,194,889 | ||||||
Nichiha Corp. | 102,600 | 1,452,175 | ||||||
Park24 Co., Ltd. | 44,000 | 817,251 | ||||||
Rohto Pharmaceutical Co., Ltd. | 78,000 | 1,132,249 | ||||||
Ship Healthcare Holdings, Inc. | 34,500 | 1,246,175 | ||||||
Suruga Bank Ltd. | 76,000 | 1,138,426 | ||||||
Tadano Ltd. | 155,000 | 1,808,177 | ||||||
Taiheiyo Cement Corp. | 481,000 | 1,385,907 | ||||||
Tatsuta Electric Wire and Cable Co., Ltd. | 136,600 | 1,201,680 | ||||||
THK Co., Ltd. | 48,500 | 1,029,458 | ||||||
Tokai Tokyo Financial Holdings, Inc. | 120,700 | 817,688 | ||||||
Tokyo Tatemono Co., Ltd. | 169,000 | 1,265,923 | ||||||
Toshiba Plant Systems & Services Corp. | 68,000 | 979,367 | ||||||
TS Tech Co., Ltd. | 56,600 | 1,773,174 | ||||||
UT Holdings Co., Ltd. | 1,804 | 1,764,587 | ||||||
Yaskawa Electric Corp. | 104,000 | 1,255,969 | ||||||
|
| |||||||
| 25,860,512 | ||||||||
|
| |||||||
| Korea (Republic of)—1.2% | ||||||||
KH Vatec Co., Ltd. (d) | 15,800 | 400,021 | ||||||
Modetour Network, Inc. | 14,300 | 364,777 | ||||||
Partron Co., Ltd. | 10,500 | 230,094 | ||||||
Silicon Works Co., Ltd. | 6,997 | 153,402 | ||||||
|
| |||||||
| 1,148,294 | ||||||||
|
| |||||||
| Malaysia—0.5% | ||||||||
Gamuda Bhd. | 301,300 | 469,104 | ||||||
|
| |||||||
| Netherlands—2.3% | ||||||||
Nutreco NV | 28,998 | 1,230,733 | ||||||
Unit 4 NV (c) | 28,781 | 1,012,181 | ||||||
|
| |||||||
| 2,242,914 | ||||||||
|
| |||||||
| Norway—2.3% | ||||||||
ProSafe SE | 104,661 | 977,421 | ||||||
Schibsted ASA | 29,322 | 1,234,632 | ||||||
|
| |||||||
| 2,212,053 | ||||||||
|
| |||||||
| Philippines—2.5% | ||||||||
Alliance Global Group, Inc. | 1,428,700 | 807,682 | ||||||
Century Properties Group, Inc. | 8,100,000 | 378,919 | ||||||
Global-Estate Resorts, Inc. (d) | 7,934,000 | 400,268 | ||||||
Robinsons Land Corp. | 1,714,000 | 888,020 | ||||||
|
| |||||||
| 2,474,889 | ||||||||
|
| |||||||
| Singapore—1.0% | ||||||||
Courts Asia Ltd. (d) | 1,151,000 | 980,223 | ||||||
|
| |||||||
| 116 | Semiannual Report | | May 31, 2013 | | See accompanying Notes to Financial Statements |
Table of Contents
Schedule of Investments
May 31, 2013 (Unaudited)
| Shares | Value | |||||||
| Spain—1.0% | ||||||||
Tecnicas Reunidas S.A. | 20,429 | $986,339 | ||||||
|
| |||||||
| Sweden—4.3% | ||||||||
Axis Communications AB | 43,440 | 1,134,640 | ||||||
Betsson AB (d) | 38,063 | 921,591 | ||||||
Betsson AB (Redemption Shares) (d) | 38,063 | 54,307 | ||||||
Elekta AB, Class B (c) | 63,548 | 966,529 | ||||||
Wallenstam AB, Class B | 82,810 | 1,123,772 | ||||||
|
| |||||||
| 4,200,839 | ||||||||
|
| |||||||
| Switzerland—2.4% | ||||||||
Burckhardt Compression Holding AG (c) | 3,520 | 1,337,212 | ||||||
GAM Holding AG (d) | 58,097 | 1,011,880 | ||||||
|
| |||||||
| 2,349,092 | ||||||||
|
| |||||||
| Thailand—1.9% | ||||||||
Major Cineplex Group PCL (b) | 920,000 | 708,206 | ||||||
Unique Engineering & Construction PCL (b) | 3,251,000 | 1,144,111 | ||||||
|
| |||||||
| 1,852,317 | ||||||||
|
| |||||||
| United Kingdom—10.9% | ||||||||
Aveva Group PLC (c) | 29,311 | 1,071,192 | ||||||
Elementis PLC | 214,970 | 759,664 | ||||||
Hikma Pharmaceuticals PLC | 87,761 | 1,290,302 | ||||||
Michael Page International PLC | 235,269 | 1,366,493 | ||||||
Restaurant Group PLC | 203,842 | 1,598,170 | ||||||
Rotork PLC (c) | 36,403 | 1,569,816 | ||||||
Spirax-Sarco Engineering PLC (c) | 42,864 | 1,830,690 | ||||||
Victrex PLC (c) | 44,539 | 1,142,834 | ||||||
|
| |||||||
| 10,629,161 | ||||||||
|
| |||||||
| Total Common Stock (cost—$77,266,507) | 95,182,425 | |||||||
|
| |||||||
| Principal Amount (000s) | ||||||||
| Repurchase Agreements—1.9% | ||||||||
State Street Bank & Trust Co., dated 5/31/13, 0.01%, due 6/3/13, proceeds $1,836,002; collateralized by Federal Home Loan Bank, 3.30%, due 8/27/32, valued at $1,874,513 including accrued interest |
| |||||||
(cost—$1,836,000) | $1,836 | 1,836,000 | ||||||
|
| |||||||
| Total Investments (cost—$79,102,507) (a)—99.5% | 97,018,425 | |||||||
|
| |||||||
| Other assets less liabilities—0.5% | 512,342 | |||||||
|
| |||||||
| Net Assets—100.0% | $97,530,767 | |||||||
|
| |||||||
Notes to Schedule of Investments:
(a) Securities with an aggregate value of $84,637,736, representing 86.8% of net assets, were valued utilizing modeling tools provided by a third-party vendor. See Note 1(a) and Note 1(b) in the Notes to Financial Statements.
(b) Fair-Valued—Securities with an aggregate value of $1,852,317, representing 1.9% of net assets. See Note 1(a) and Note 1(b) in the Notes to Financial Statements.
(c) Affiliated security.
(d) Non-income producing.
The industry classification of portfolio holdings and other assets less liabilities shown as a percentage of net assets as of May 31, 2013 were as follows:
Machinery | 9.3% | |||
Electronic Equipment, Instruments & Components | 7.5% | |||
Real Estate Management & Development | 5.3% | |||
Construction & Engineering | 5.0% | |||
Hotels, Restaurants & Leisure | 4.6% | |||
Software | 3.9% | |||
Commercial Banks | 3.7% | |||
Energy Equipment & Services | 3.5% | |||
Pharmaceuticals | 3.4% | |||
Auto Components | 3.0% | |||
Electrical Equipment | 2.9% | |||
Building Products | 2.8% | |||
Chemicals | 2.8% | |||
Health Care Equipment & Supplies | 2.7% | |||
Internet Software & Services | 2.6% | |||
Food Products | 2.5% | |||
Insurance | 2.2% | |||
Commercial Services & Supplies | 2.1% | |||
IT Services | 2.1% | |||
Communications Equipment | 2.1% | |||
Textiles, Apparel & Luxury Goods | 2.0% | |||
Media | 2.0% | |||
Semiconductors & Semiconductor Equipment | 2.0% | |||
Capital Markets | 1.8% | |||
Internet & Catalog Retail | 1.7% | |||
Metals & Mining | 1.6% | |||
Thrifts & Mortgage Finance | 1.4% | |||
Construction Materials | 1.4% | |||
Professional Services | 1.4% | |||
Aerospace & Defense | 1.3% | |||
Health Care Providers & Services | 1.3% | |||
Household Durables | 1.1% | |||
Road & Rail | 1.0% | |||
Multi-line Retail | 1.0% | |||
Specialty Retail | 1.0% | |||
Industrial Conglomerates | 0.8% | |||
Diversified Telecommunication Services | 0.8% | |||
Repurchase Agreements | 1.9% | |||
Other assets less liabilities | 0.5% | |||
|
| |||
| 100.0% | ||||
|
|
AllianzGI Micro Cap Fund
| Shares | Value | |||||||
| Common Stock—98.1% | ||||||||
| Air Freight & Logistics—0.6% | ||||||||
XPO Logistics, Inc. (a) | 13,700 | $227,831 | ||||||
|
| |||||||
| Auto Components—2.2% | ||||||||
Gentherm, Inc. (a) | 16,600 | 305,772 | ||||||
Stoneridge, Inc. (a) | 17,000 | 190,570 | ||||||
Tower International, Inc. (a) | 14,000 | 264,740 | ||||||
|
| |||||||
| 761,082 | ||||||||
|
| |||||||
| Biotechnology—5.6% | ||||||||
ACADIA Pharmaceuticals, Inc. (a) | 27,700 | 389,739 | ||||||
Celldex Therapeutics, Inc. (a) | 21,300 | 272,427 | ||||||
Coronado Biosciences, Inc. (a) | 10,700 | 105,716 | ||||||
Ligand Pharmaceuticals, Inc., Class B (a) | 10,900 | 326,019 | ||||||
Neurocrine Biosciences, Inc. (a) | 23,200 | 299,976 | ||||||
Orexigen Therapeutics, Inc. (a) | 30,900 | 195,597 | ||||||
Repligen Corp. (a) | 30,100 | 249,228 | ||||||
Sangamo Biosciences, Inc. (a) | 16,600 | 132,800 | ||||||
|
| |||||||
| 1,971,502 | ||||||||
|
| |||||||
| Building Products—2.9% | ||||||||
Builders FirstSource, Inc. (a) | 43,300 | 291,842 | ||||||
NCI Building Systems, Inc. (a) | 17,800 | 257,210 | ||||||
Patrick Industries, Inc. (a) | 15,200 | 296,248 | ||||||
PGT, Inc. (a) | 21,900 | 180,675 | ||||||
|
| |||||||
| 1,025,975 | ||||||||
|
| |||||||
| Capital Markets—3.3% | ||||||||
HFF, Inc., Class A | 18,200 | 342,342 | ||||||
ICG Group, Inc. (a) | 24,300 | 269,973 | ||||||
Investment Technology Group, Inc. (a) | 21,400 | 295,534 | ||||||
Medley Capital Corp. | 17,849 | 259,703 | ||||||
|
| |||||||
| 1,167,552 | ||||||||
|
| |||||||
| Chemicals—1.8% | ||||||||
American Vanguard Corp. | 9,600 | 292,416 | ||||||
Landec Corp. (a) | 24,100 | 338,364 | ||||||
|
| |||||||
| 630,780 | ||||||||
|
| |||||||
| Commercial Banks—2.6% | ||||||||
Banner Corp. | 10,600 | 340,048 | ||||||
Eagle Bancorp, Inc. (a) | 12,430 | 279,799 | ||||||
First Merchants Corp. | 18,500 | 306,360 | ||||||
|
| |||||||
| 926,207 | ||||||||
|
| |||||||
| Communications Equipment—1.5% | ||||||||
CalAmp Corp. (a) | 28,400 | 374,028 | ||||||
Calix, Inc. (a) | 13,600 | 142,528 | ||||||
|
| |||||||
| 516,556 | ||||||||
|
| |||||||
| Computers & Peripherals—0.9% | ||||||||
Datalink Corp. (a) | 28,700 | 328,902 | ||||||
|
| |||||||
| Construction & Engineering—1.2% | ||||||||
Great Lakes Dredge & Dock Corp. | 32,800 | 272,240 | ||||||
Orion Marine Group, Inc. (a) | 13,400 | 160,934 | ||||||
|
| |||||||
| 433,174 | ||||||||
|
| |||||||
| Diversified Consumer Services—0.7% | ||||||||
Carriage Services, Inc. | 13,500 | 255,555 | ||||||
|
| |||||||
| Diversified Telecommunication Services—1.8% | ||||||||
8x8, Inc. (a) | 41,400 | 342,378 | ||||||
inContact, Inc. (a) | 43,000 | 312,180 | ||||||
|
| |||||||
| 654,558 | ||||||||
|
| |||||||
| Electrical Equipment—1.2% | ||||||||
Coleman Cable, Inc. | 11,500 | 213,900 | ||||||
| See accompanying Notes to Financial Statements | | May 31, 2013 | | Semiannual Report | 117 |
Table of Contents
Schedule of Investments
May 31, 2013 (Unaudited)
| Shares | Value | |||||||
PowerSecure International, Inc. (a) | 15,900 | $214,332 | ||||||
|
| |||||||
| 428,232 | ||||||||
|
| |||||||
| Electronic Equipment, Instruments & Components—2.3% | ||||||||
Fabrinet (a) | 17,400 | 252,822 | ||||||
Measurement Specialties, Inc. (a) | 6,100 | 271,145 | ||||||
Methode Electronics, Inc. | 19,200 | 302,016 | ||||||
|
| |||||||
| 825,983 | ||||||||
|
| |||||||
| Energy Equipment & Services—0.8% | ||||||||
Matrix Service Co. (a) | 17,800 | 293,522 | ||||||
|
| |||||||
| Food Products—1.2% | ||||||||
Boulder Brands, Inc. (a) | 23,800 | 249,662 | ||||||
Inventure Foods, Inc. (a) | 24,700 | 185,744 | ||||||
|
| |||||||
| 435,406 | ||||||||
|
| |||||||
| Health Care Equipment & Supplies—11.8% | ||||||||
Anika Therapeutics, Inc. (a) | 17,800 | 262,728 | ||||||
Antares Pharma, Inc. (a) | 60,300 | 244,818 | ||||||
Cantel Medical Corp. | 13,750 | 468,050 | ||||||
Cardiovascular Systems, Inc. (a) | 13,700 | 281,535 | ||||||
Cutera, Inc. (a) | 20,900 | 196,669 | ||||||
Cynosure, Inc., Class A (a) | 12,900 | 321,339 | ||||||
Endologix, Inc. (a) | 19,200 | 258,048 | ||||||
GenMark Diagnostics, Inc. (a) | 24,600 | 366,540 | ||||||
ICU Medical, Inc. (a) | 3,000 | 214,170 | ||||||
Spectranetics Corp. (a) | 23,300 | 435,710 | ||||||
Staar Surgical Co. (a) | 24,300 | 216,270 | ||||||
SurModics, Inc. (a) | 12,500 | 296,750 | ||||||
Symmetry Medical, Inc. (a) | 26,100 | 243,513 | ||||||
TearLab Corp. (a) | 11,800 | 124,136 | ||||||
Trinity Biotech PLC ADR | 13,500 | 236,655 | ||||||
|
| |||||||
| 4,166,931 | ||||||||
|
| |||||||
| Health Care Providers & Services—4.8% | ||||||||
AMN Healthcare Services, Inc. (a) | 36,500 | 488,735 | ||||||
Capital Senior Living Corp. (a) | 21,700 | 569,625 | ||||||
Five Star Quality Care, Inc. (a) | 47,700 | 244,701 | ||||||
Providence Service Corp. (a) | 14,400 | 379,584 | ||||||
|
| |||||||
| 1,682,645 | ||||||||
|
| |||||||
| Health Care Technology—1.6% | ||||||||
HealthStream, Inc. (a) | 10,100 | 270,478 | ||||||
Omnicell, Inc. (a) | 15,600 | 282,828 | ||||||
|
| |||||||
| 553,306 | ||||||||
|
| |||||||
| Hotels, Restaurants & Leisure—2.3% | ||||||||
AFC Enterprises, Inc. (a) | 14,100 | 514,086 | ||||||
Jamba, Inc. (a) | 96,100 | 287,339 | ||||||
|
| |||||||
| 801,425 | ||||||||
|
| |||||||
| Household Durables—1.8% | ||||||||
Libbey, Inc. (a) | 14,600 | 308,936 | ||||||
M/I Homes, Inc. (a) | 13,900 | 345,415 | ||||||
|
| |||||||
| 654,351 | ||||||||
|
| |||||||
| Insurance—3.0% | ||||||||
eHealth, Inc. (a) | 11,700 | 288,054 | ||||||
Homeowners Choice, Inc. | 11,700 | 406,692 | ||||||
Stewart Information Services Corp. | 13,200 | 365,508 | ||||||
|
| |||||||
| 1,060,254 | ||||||||
|
| |||||||
| Internet Software & Services—5.2% | ||||||||
Blucora, Inc. (a) | 14,100 | 257,325 | ||||||
Internap Network Services Corp. (a) | 38,600 | 308,028 | ||||||
SciQuest, Inc. (a) | 12,800 | 293,760 | ||||||
SPS Commerce, Inc. (a) | 9,900 | 534,303 | ||||||
Web.com Group, Inc. (a) | 15,100 | 316,949 | ||||||
| Shares | Value | |||||||
Zix Corp. (a) | 33,300 | $132,867 | ||||||
|
| |||||||
| 1,843,232 | ||||||||
|
| |||||||
| IT Services—1.8% | ||||||||
Computer Task Group, Inc. | 12,600 | 281,232 | ||||||
Virtusa Corp. (a) | 15,100 | 354,246 | ||||||
|
| |||||||
| 635,478 | ||||||||
|
| |||||||
| Leisure Equipment & Products—1.5% | ||||||||
Arctic Cat, Inc. | 6,200 | 290,718 | ||||||
Nautilus, Inc. (a) | 31,100 | 248,489 | ||||||
|
| |||||||
| 539,207 | ||||||||
|
| |||||||
| Life Sciences Tools & Services—1.7% | ||||||||
Albany Molecular Research, Inc. (a) | 28,600 | 314,600 | ||||||
Cambrex Corp. (a) | 22,100 | 304,096 | ||||||
|
| |||||||
| 618,696 | ||||||||
|
| |||||||
| Machinery—2.9% | ||||||||
American Railcar Industries, Inc. | 6,300 | 214,200 | ||||||
LB Foster Co., Class A | 6,500 | 288,015 | ||||||
Manitex International, Inc. (a) | 22,700 | 246,295 | ||||||
Wabash National Corp. (a) | 25,600 | 268,800 | ||||||
|
| |||||||
| 1,017,310 | ||||||||
|
| |||||||
| Media—1.9% | ||||||||
Carmike Cinemas, Inc. (a) | 14,700 | 260,484 | ||||||
MDC Partners, Inc., Class A | 8,600 | 151,618 | ||||||
ReachLocal, Inc. (a) | 18,800 | 261,320 | ||||||
|
| |||||||
| 673,422 | ||||||||
|
| |||||||
| Oil, Gas & Consumable Fuels—1.9% | ||||||||
Callon Petroleum Co. (a) | 8,000 | 29,760 | ||||||
Penn Virginia Corp. | 34,500 | 160,770 | ||||||
StealthGas, Inc. (a) | 23,500 | 248,395 | ||||||
Synergy Resources Corp. (a) | 35,000 | 236,950 | ||||||
|
| |||||||
| 675,875 | ||||||||
|
| |||||||
| Paper & Forest Products—0.7% | ||||||||
Neenah Paper, Inc. | 8,100 | 254,421 | ||||||
|
| |||||||
| Pharmaceuticals—2.6% | ||||||||
Endocyte, Inc. (a) | 11,300 | 154,697 | ||||||
Pacira Pharmaceuticals, Inc. (a) | 8,000 | 234,400 | ||||||
Santarus, Inc. (a) | 23,900 | 532,253 | ||||||
|
| |||||||
| 921,350 | ||||||||
|
| |||||||
| Professional Services—2.1% | ||||||||
Barrett Business Services, Inc. | 7,800 | 454,974 | ||||||
GP Strategies Corp. (a) | 11,600 | 290,116 | ||||||
|
| |||||||
| 745,090 | ||||||||
|
| |||||||
| Road & Rail—4.3% | ||||||||
Arkansas Best Corp. | 12,200 | 232,898 | ||||||
Celadon Group, Inc. | 13,100 | 255,581 | ||||||
Roadrunner Transportation Systems, Inc. (a) | 13,200 | 365,640 | ||||||
Saia, Inc. (a) | 13,600 | 649,876 | ||||||
|
| |||||||
| 1,503,995 | ||||||||
|
| |||||||
| Semiconductors & Semiconductor Equipment—3.3% | ||||||||
Ambarella, Inc. (a) | 8,700 | 140,679 | ||||||
Exar Corp. (a) | 26,800 | 302,304 | ||||||
PDF Solutions, Inc. (a) | 29,200 | 535,236 | ||||||
Rudolph Technologies, Inc. (a) | 16,400 | 201,064 | ||||||
|
| |||||||
| 1,179,283 | ||||||||
|
| |||||||
| Software—3.8% | ||||||||
Actuate Corp. (a) | 33,000 | 222,750 | ||||||
Ellie Mae, Inc. (a) | 7,800 | 174,642 | ||||||
Monotype Imaging Holdings, Inc. | 14,800 | 336,848 | ||||||
PROS Holdings, Inc. (a) | 13,000 | 376,090 | ||||||
| Shares | Value | |||||||
Seachange International, Inc. (a) | 20,300 | $218,428 | ||||||
|
| |||||||
| 1,328,758 | ||||||||
|
| |||||||
| Specialty Retail—2.1% | ||||||||
America’s Car-Mart, Inc. (a) | 4,700 | 211,923 | ||||||
Lithia Motors, Inc., Class A | 5,900 | 307,331 | ||||||
MarineMax, Inc. (a) | 19,100 | 219,459 | ||||||
|
| |||||||
| 738,713 | ||||||||
|
| |||||||
| Textiles, Apparel & Luxury Goods—1.0% | ||||||||
Movado Group, Inc. | 9,700 | 350,170 | ||||||
|
| |||||||
| Thrifts & Mortgage Finance—1.8% | ||||||||
BofI Holding, Inc. (a) | 9,200 | 430,744 | ||||||
HomeStreet, Inc. | 8,400 | 192,024 | ||||||
|
| |||||||
| 622,768 | ||||||||
|
| |||||||
| Trading Companies & Distributors—3.6% | ||||||||
Aceto Corp. | 25,000 | 318,250 | ||||||
CAI International, Inc. (a) | 12,200 | 312,076 | ||||||
DXP Enterprises, Inc. (a) | 4,900 | 289,443 | ||||||
H&E Equipment Services, Inc. | 15,000 | 335,700 | ||||||
|
| |||||||
| 1,255,469 | ||||||||
|
| |||||||
| Total Common Stock (cost—$23,805,439) | 34,704,966 | |||||||
|
| |||||||
| Units | ||||||||
| Warrants—0.0% | ||||||||
| Oil, Gas & Consumable Fuels—0.0% | ||||||||
Magnum Hunter Resources Corp., | 9,960 | 996 | ||||||
|
| |||||||
| Principal Amount (000s) | ||||||||
| Repurchase Agreements—2.6% | ||||||||
State Street Bank & Trust Co., dated 5/31/13, 0.01%, due 6/3/13, proceeds $903,001; collateralized by Federal Home Loan Bank, 3.30%, due 8/27/32, valued at $922,688 including accrued interest |
| |||||||
(cost—$903,000) | $903 | 903,000 | ||||||
|
| |||||||
| Total Investments (cost—$24,708,439)—100.7% | 35,608,962 | |||||||
|
| |||||||
| Liabilities in excess of other assets—(0.7)% | (264,385 | ) | ||||||
|
| |||||||
| Net Assets—100.0% | $35,344,577 | |||||||
|
| |||||||
Notes to Schedule of Investments:
(a) Non-income producing.
Glossary:
ADR—American Depositary Receipt
| 118 | Semiannual Report | | May 31, 2013 | | See accompanying Notes to Financial Statements |
Table of Contents
Schedule of Investments
May 31, 2013 (Unaudited)
AllianzGI Multi-Asset Real Return Fund
| Shares | Value | |||||||
| Mutual Funds (c)(d)—41.8% | ||||||||
AllianzGI Global Commodity Equity | 95,829 | $1,625,257 | ||||||
PIMCO CommoditiesPLUS Strategy | 50,421 | 528,408 | ||||||
|
| |||||||
| Total Mutual Funds (cost—$2,156,833) | 2,153,665 | |||||||
|
| |||||||
| Common Stock—34.5% | ||||||||
| Australia—3.2% | ||||||||
CFS Retail Property Trust Group REIT | 4,280 | 8,205 | ||||||
Dexus Property Group REIT | 9,690 | 10,152 | ||||||
Federation Centres REIT | 2,930 | 6,945 | ||||||
Goodman Group REIT | 3,760 | 18,351 | ||||||
GPT Group REIT | 3,240 | 11,999 | ||||||
Lend Lease Group | 1,120 | 10,658 | ||||||
Mirvac Group REIT | 7,750 | 12,353 | ||||||
Stockland REIT | 4,850 | 16,820 | ||||||
Westfield Group REIT | 4,700 | 51,588 | ||||||
Westfield Retail Trust REIT | 6,150 | 18,048 | ||||||
|
| |||||||
| 165,119 | ||||||||
|
| |||||||
| Austria—0.2% | ||||||||
IMMOFINANZ AG (e) | 2,020 | 8,265 | ||||||
|
| |||||||
| Canada—1.3% | ||||||||
Brookfield Asset Management, Inc., Class A | 1,230 | 43,375 | ||||||
Brookfield Office Properties, Inc. | 630 | 10,829 | ||||||
H&R Real Estate Investment Trust REIT | 220 | 4,904 | ||||||
RioCan REIT | 320 | 8,488 | ||||||
|
| |||||||
| 67,596 | ||||||||
|
| |||||||
| France—1.5% | ||||||||
Fonciere Des Regions REIT | 60 | 5,074 | ||||||
Gecina S.A. REIT | 50 | 6,086 | ||||||
ICADE REIT | 60 | 5,409 | ||||||
Klepierre REIT | 230 | 9,901 | ||||||
Unibail-Rodamco SE REIT | 200 | 49,136 | ||||||
|
| |||||||
| 75,606 | ||||||||
|
| |||||||
| Hong Kong—4.8% | ||||||||
Cheung Kong Holdings Ltd. | 3,090 | 43,517 | ||||||
Hang Lung Properties Ltd. | 5,000 | 17,478 | ||||||
Henderson Land Development Co., Ltd. | 1,960 | 13,738 | ||||||
Hysan Development Co., Ltd. | 1,450 | 6,446 | ||||||
Kerry Properties Ltd. | 1,700 | 6,902 | ||||||
Link REIT | 5,110 | 26,289 | ||||||
New World Development Co., Ltd. | 7,830 | 12,410 | ||||||
Sino Land Co., Ltd. | 6,840 | 10,172 | ||||||
Sun Hung Kai Properties Ltd. | 3,400 | 45,123 | ||||||
Swire Pacific Ltd., Class A | 1,460 | 18,486 | ||||||
Swire Properties Ltd. | 2,670 | 8,300 | ||||||
Wharf Holdings Ltd. | 3,240 | 28,773 | ||||||
Wheelock & Co., Ltd. | 2,140 | 12,019 | ||||||
|
| |||||||
| 249,653 | ||||||||
|
| |||||||
| Japan—3.4% | ||||||||
Aeon Mall Co., Ltd. | 130 | 3,404 | ||||||
Daito Trust Construction Co., Ltd. | 170 | 15,822 | ||||||
Daiwa House Industry Co., Ltd. | 1,110 | 20,977 | ||||||
Hulic Co., Ltd. | 600 | 5,028 | ||||||
Japan Prime Realty Investment Corp. REIT | 2 | 6,213 | ||||||
Japan Real Estate Investment Corp. REIT | 1 | 9,846 | ||||||
| Shares | Value | |||||||
Japan Retail Fund Investment Corp. REIT | 2 | $3,797 | ||||||
Mitsubishi Estate Co., Ltd. | 1,540 | 37,941 | ||||||
Mitsui Fudosan Co., Ltd. | 1,020 | 28,140 | ||||||
Nippon Building Fund, Inc. REIT | 1 | 10,284 | ||||||
Nomura Real Estate Holdings, Inc. | 200 | 4,435 | ||||||
Nomura Real Estate Office Fund, Inc. REIT | 1 | 5,675 | ||||||
NTT Urban Development Corp. | 2 | 2,291 | ||||||
Sumitomo Realty & Development Co., Ltd. | 430 | 16,445 | ||||||
Tokyu Land Corp. | 830 | 7,501 | ||||||
|
| |||||||
| 177,799 | ||||||||
|
| |||||||
| Netherlands—0.1% | ||||||||
Corio NV REIT | 150 | 6,686 | ||||||
|
| |||||||
| Singapore—1.4% | ||||||||
Ascendas Real Estate Investment Trust REIT | 4,520 | 8,268 | ||||||
CapitaCommercial Trust REIT | 3,940 | 4,713 | ||||||
CapitaLand Ltd. | 5,850 | 15,916 | ||||||
CapitaMall Trust REIT | 5,170 | 8,758 | ||||||
CapitaMalls Asia Ltd. | 3,240 | 4,898 | ||||||
City Developments Ltd. | 980 | 8,314 | ||||||
Global Logistic Properties Ltd. | 4,700 | 10,395 | ||||||
Keppel Land Ltd. | 1,600 | 4,700 | ||||||
UOL Group Ltd. | 1,110 | 5,852 | ||||||
|
| |||||||
| 71,814 | ||||||||
|
| |||||||
| Switzerland—0.2% | ||||||||
Swiss Prime Site AG (e) | 110 | 8,271 | ||||||
|
| |||||||
| United Kingdom—1.3% | ||||||||
British Land Co. PLC REIT | 1,750 | 16,103 | ||||||
Hammerson PLC REIT | 1,580 | 12,251 | ||||||
Intu Properties PLC REIT | 1,220 | 6,255 | ||||||
Land Securities Group PLC REIT | 1,750 | 24,685 | ||||||
Segro PLC REIT | 1,800 | 7,585 | ||||||
|
| |||||||
| 66,879 | ||||||||
|
| |||||||
| United States—17.1% | ||||||||
American Capital Agency Corp. REIT | 750 | 19,350 | ||||||
American Tower Corp. REIT | 850 | 66,164 | ||||||
Annaly Capital Management, Inc. REIT | 2,120 | 28,790 | ||||||
AvalonBay Communities, Inc. REIT | 250 | 33,165 | ||||||
Boston Properties, Inc. REIT | 340 | 36,237 | ||||||
Brookfield Property Partners L.P. | 70 | 1,475 | ||||||
Camden Property Trust REIT | 180 | 12,465 | ||||||
CBRE Group, Inc., Class A (e) | 720 | 16,690 | ||||||
Digital Realty Trust, Inc. REIT | 270 | 16,446 | ||||||
Duke Realty Corp. REIT | 650 | 10,771 | ||||||
Equity Residential REIT | 700 | 39,585 | ||||||
Federal Realty Investment Trust REIT | 140 | 15,085 | ||||||
General Growth Properties, Inc. REIT | 980 | 20,119 | ||||||
HCP, Inc. REIT | 1,030 | 48,801 | ||||||
Health Care REIT, Inc. REIT | 570 | 38,777 | ||||||
Host Hotels & Resorts, Inc. REIT | 1,620 | 28,820 | ||||||
Kimco Realty Corp. REIT | 910 | 20,156 | ||||||
Liberty Property Trust REIT | 250 | 10,145 | ||||||
Macerich Co. REIT | 310 | 20,122 | ||||||
Plum Creek Timber Co., Inc. REIT | 370 | 17,649 | ||||||
Prologis, Inc. REIT | 1,010 | 40,703 | ||||||
Public Storage REIT | 320 | 48,576 | ||||||
Rayonier, Inc. REIT | 280 | 15,512 | ||||||
Realty Income Corp. REIT | 300 | 13,635 | ||||||
Regency Centers Corp. REIT | 190 | 9,804 | ||||||
Simon Property Group, Inc. REIT | 670 | 111,515 | ||||||
| Shares | Value | |||||||
SL Green Realty Corp. REIT | 210 | $18,266 | ||||||
UDR, Inc. REIT | 550 | 13,403 | ||||||
Ventas, Inc. REIT | 670 | 47,818 | ||||||
Vornado Realty Trust REIT | 360 | 28,782 | ||||||
Weyerhaeuser Co. REIT | 1,150 | 34,293 | ||||||
|
| |||||||
| 883,119 | ||||||||
|
| |||||||
| Total Common Stock (cost—$1,729,515) | 1,780,807 | |||||||
|
| |||||||
| Principal Amount (000s) | ||||||||
| U.S. Treasury Obligations (b)—18.1% | ||||||||
U.S. Treasury Inflation Indexed Bonds, |
| |||||||
2.125%, 2/15/40 | $53 | 69,033 | ||||||
2.375%, 1/15/25 | 98 | 123,254 | ||||||
3.875%, 4/15/29 | 69 | 106,166 | ||||||
U.S. Treasury Inflation Indexed Notes, |
| |||||||
0.625%, 7/15/21 | 173 | 188,538 | ||||||
2.375%, 1/15/17 | 398 | 448,641 | ||||||
|
| |||||||
| Total U.S. Treasury Obligations (cost—$985,050) | 935,632 | |||||||
|
| |||||||
| Total Investments (cost—$4,871,398) (a)—94.4% | 4,870,104 | |||||||
|
| |||||||
| Other assets less liabilities—5.6% | 288,795 | |||||||
|
| |||||||
| Net Assets—100.0% | $5,158,899 | |||||||
|
| |||||||
Notes to Schedule of Investments:
(a) Securities with an aggregate value of $830,092, representing 16.1% of net assets, were valued utilizing modeling tools provided by a third-party vendor. See Note 1(a) and Note 1(b) in the Notes to Financial Statements.
(b) Inflationary Bonds—Principal amount of security is adjusted for inflation/deflation.
(c) Affiliated fund.
(d) Institutional Class share.
(e) Non-income producing.
Glossary:
REIT—Real Estate Investment Trust
The industry classification of portfolio holdings and other assets less liabilities shown as a percentage of net assets as of May 31, 2013 were as follows:
Mutual Funds | 41.8% | |||
Real Estate Investment Trust | 24.6% | |||
U.S. Treasury Obligations | 18.1% | |||
Real Estate Management & Development | 9.9% | |||
Other assets less liabilities | 5.6% | |||
|
| |||
| 100.0% | ||||
|
|
| See accompanying Notes to Financial Statements | | May 31, 2013 | | Semiannual Report | 119 |
Table of Contents
Schedule of Investments
May 31, 2013 (Unaudited)
AllianzGI NFJ Emerging Markets Value Fund
| Shares | Value | |||||||
| Common Stock—84.2% | ||||||||
| Brazil—5.9% | ||||||||
Cia de Saneamento Basico do Estado de Sao Paulo | 3,200 | $40,160 | ||||||
Cia de Saneamento de Minas Gerais | 1,900 | 39,476 | ||||||
Cia Energetica de Minas Gerais | 3,824 | 38,924 | ||||||
Energias do Brasil S.A. | 6,700 | 39,572 | ||||||
Even Construtora e Incorporadora S.A. | 9,500 | 36,815 | ||||||
Grendene S.A. | 4,000 | 36,605 | ||||||
Minerva S.A. (d) | 8,100 | 39,899 | ||||||
Sul America S.A. UNIT | 5,663 | 36,617 | ||||||
Transmissora Alianca de Energia Eletrica S.A. UNIT | 3,900 | 42,245 | ||||||
Vale S.A. | 2,500 | 35,542 | ||||||
|
| |||||||
| 385,855 | ||||||||
|
| |||||||
| Chile—0.7% | ||||||||
Administrada de Fondos de Pensiones Habitat S.A. | 22,065 | 42,690 | ||||||
|
| |||||||
| China—22.0% | ||||||||
Agricultural Bank of China Ltd., Class H | 88,000 | 41,142 | ||||||
Anhui Expressway Co., Class H | 80,400 | 41,848 | ||||||
Anxin-China Holdings Ltd. | 186,000 | 45,369 | ||||||
Bank of China Ltd., Class H | 91,000 | 42,744 | ||||||
Bank of Communications Co., Ltd., Class H | 53,000 | 40,347 | ||||||
Bosideng International Holdings Ltd. | 127,000 | 34,166 | ||||||
China Communications Services Corp. Ltd., Class H | 64,000 | 41,884 | ||||||
China Construction Bank Corp., Class H | 50,000 | 40,376 | ||||||
China Minsheng Banking Corp. Ltd., Class H | 32,500 | 39,708 | ||||||
China Mobile Ltd. | 3,700 | 39,006 | ||||||
China Petroleum & Chemical Corp., Class H | 38,000 | 38,851 | ||||||
Chongqing Machinery & Electric Co., Ltd., Class H | 273,000 | 37,004 | ||||||
CP Pokphand Co., Ltd. | 347,000 | 36,972 | ||||||
CSG Holding Co., Ltd., Class B | 55,300 | 47,698 | ||||||
Datang International Power Generation Co., Ltd., Class H | 95,000 | 39,149 | ||||||
Giant Interactive Group, Inc. ADR | 5,766 | 48,780 | ||||||
Honghua Group Ltd. | 86,000 | 42,245 | ||||||
Industrial & Commercial Bank of China Ltd., Class H | 59,000 | 41,431 | ||||||
Inner Mongolia Yitai Coal Co., Ltd., Class B | 7,800 | 39,747 | ||||||
Kingboard Laminates Holdings Ltd. | 98,500 | 41,453 | ||||||
Luthai Textile Co., Ltd., Class B | 44,000 | 48,424 | ||||||
Minth Group Ltd. | 26,000 | 44,539 | ||||||
PetroChina Co., Ltd., Class H | 35,000 | 40,545 | ||||||
Shenzhen International Holdings Ltd. | 336,000 | 45,576 | ||||||
Shenzhen Investment Ltd. | 103,000 | 43,682 | ||||||
Shenzhou International Group Holdings Ltd. | 13,500 | 45,779 | ||||||
Skyworth Digital Holdings Ltd. | 62,000 | 41,578 | ||||||
TCL Multimedia Technology Holdings Ltd. | 53,000 | 44,488 | ||||||
Tianjin Port Development Holdings Ltd. | 308,000 | 44,581 | ||||||
TPV Technology Ltd. | 158,000 | 40,453 | ||||||
Travelsky Technology Ltd., Class H | 64,000 | 46,701 | ||||||
| Shares | Value | |||||||
Wasion Group Holdings Ltd. | 72,000 | $48,372 | ||||||
Xinhua Winshare Publishing and Media Co., Ltd., Class H | 81,000 | 40,827 | ||||||
Zhejiang Expressway Co., Ltd., Class H | 50,000 | 43,357 | ||||||
|
| |||||||
| 1,438,822 | ||||||||
|
| |||||||
| Czech Republic—0.6% | ||||||||
Philip Morris CR AS | 76 | 42,235 | ||||||
|
| |||||||
| Egypt—0.6% | ||||||||
Eastern Tobacco | 2,939 | 41,288 | ||||||
|
| |||||||
| Hong Kong—4.7% | ||||||||
Emperor International Holdings | 144,000 | 43,604 | ||||||
Hutchison Telecommunications Hong Kong Holdings Ltd. | 80,000 | 43,717 | ||||||
MGM China Holdings Ltd. | 18,000 | 47,606 | ||||||
NagaCorp Ltd. | 54,000 | 44,557 | ||||||
Pacific Textile Holdings Ltd. | 35,000 | 43,601 | ||||||
Singamas Container Holdings Ltd. | 146,000 | 35,195 | ||||||
Truly International Holdings | 74,000 | 47,884 | ||||||
|
| |||||||
| 306,164 | ||||||||
|
| |||||||
| Hungary—0.7% | ||||||||
EGIS Pharmaceuticals PLC | 530 | 47,420 | ||||||
|
| |||||||
| India—0.7% | ||||||||
Tata Motors Ltd. ADR | 1,652 | 45,314 | ||||||
|
| |||||||
| Indonesia—3.3% | ||||||||
Astra Agro Lestari Tbk PT | 21,500 | 42,655 | ||||||
Bank Pembangunan Daerah Jawa Barat Dan Banten Tbk PT | 338,900 | 42,149 | ||||||
Bank Pembangunan Daerah Jawa Timur Tbk PT | 968,500 | 42,881 | ||||||
Malindo Feedmill Tbk PT | 118,000 | 44,640 | ||||||
Surya Semesta Internusa Tbk PT | 274,000 | 46,271 | ||||||
|
| |||||||
| 218,596 | ||||||||
|
| |||||||
| Korea (Republic of)—12.1% | ||||||||
BS Financial Group, Inc. | 3,250 | 44,763 | ||||||
Daelim Industrial Co., Ltd. | 510 | 42,382 | ||||||
Daou Technology, Inc. | 2,570 | 42,937 | ||||||
Dongbu Insurance Co., Ltd. | 1,026 | 45,021 | ||||||
Dongwon Industries Co., Ltd. | 136 | 43,706 | ||||||
Global & Yuasa Battery Co., Ltd. | 900 | 44,871 | ||||||
Hanwha Life Insurance Co., Ltd. | 7,380 | 45,216 | ||||||
Hyundai Marine & Fire Insurance Co., Ltd. | 1,500 | 43,024 | ||||||
Hyundai Motor Co. | 243 | 45,192 | ||||||
KT Corp. | 1,224 | 41,843 | ||||||
KT&G Corp. | 604 | 42,559 | ||||||
LIG Insurance Co., Ltd. | 2,100 | 45,885 | ||||||
Meritz Fire & Marine Insurance Co., Ltd. | 4,010 | 46,547 | ||||||
Samsung Electronics Co., Ltd. | 31 | 41,768 | ||||||
Sindoh Co., Ltd. | 674 | 43,076 | ||||||
SK Telecom Co., Ltd. | 245 | 45,233 | ||||||
Soulbrain Co., Ltd. | 1,070 | 43,471 | ||||||
Tongyang Life Insurance | 4,640 | 43,926 | ||||||
|
| |||||||
| 791,420 | ||||||||
|
| |||||||
| Malaysia—0.7% | ||||||||
UOA Development Bhd. | 55,500 | 47,569 | ||||||
|
| |||||||
| Shares | Value | |||||||
| Mexico—0.6% | ||||||||
Value Grupo Financiero S.A.B. de C.V. (c) | 7,500 | $39,031 | ||||||
|
| |||||||
| Peru—0.6% | ||||||||
Intercorp Financial Services, Inc. | 1,149 | 38,285 | ||||||
|
| |||||||
| Philippines—1.3% | ||||||||
First Philippine Holdings Corp. | 17,150 | 40,429 | ||||||
Lopez Holdings Corp. | 287,600 | 41,093 | ||||||
|
| |||||||
| 81,522 | ||||||||
|
| |||||||
| Poland—2.6% | ||||||||
KGHM Polska Miedz S.A. | 900 | 40,208 | ||||||
Lubelski Wegiel Bogdanka S.A. | 1,108 | 43,009 | ||||||
Powszechny Zaklad Ubezpieczen S.A. | 318 | 44,247 | ||||||
Synthos S.A. | 26,457 | 42,985 | ||||||
|
| |||||||
| 170,449 | ||||||||
|
| |||||||
| Russian Federation—5.5% | ||||||||
Acron JSC (c) | 1,082 | 43,983 | ||||||
Bashneft OAO | 642 | 40,125 | ||||||
Gazprom OAO (c) | 9,502 | 36,393 | ||||||
Lukoil OAO (c) | 655 | 38,521 | ||||||
Mobile Telesystems OJSC (c) | 5,038 | 40,102 | ||||||
Rosneft OAO (c) | 5,773 | 38,102 | ||||||
Sberbank of Russia (c) | 13,171 | 40,698 | ||||||
Tatneft OAO (c) | 7,035 | 39,959 | ||||||
VimpelCom Ltd. ADR | 3,900 | 38,805 | ||||||
|
| |||||||
| 356,688 | ||||||||
|
| |||||||
| Singapore—1.2% | ||||||||
Lippo Malls Indonesia Retail Trust REIT | 101,000 | 41,052 | ||||||
Venture Corp. Ltd. | 6,000 | 34,683 | ||||||
|
| |||||||
| 75,735 | ||||||||
|
| |||||||
| South Africa—4.3% | ||||||||
Blue Label Telecoms Ltd. | 54,937 | 40,676 | ||||||
Imperial Holdings Ltd. | 1,907 | 39,910 | ||||||
Mondi Ltd. | 3,198 | 42,491 | ||||||
MTN Group Ltd. | 2,172 | 39,319 | ||||||
S.A. Corporate Real Estate Fund Nominees Pty Ltd. UNIT | 101,889 | 39,391 | ||||||
Sasol Ltd. | 964 | 42,993 | ||||||
Vukile Property Fund Ltd. UNIT | 23,020 | 38,893 | ||||||
|
| |||||||
| 283,673 | ||||||||
|
| |||||||
| Taiwan—6.5% | ||||||||
Chicony Electronics Co., Ltd. | 15,000 | 41,285 | ||||||
China Synthetic Rubber Corp. | 39,000 | 40,871 | ||||||
Gigabyte Technology Co., Ltd. | 46,000 | 44,405 | ||||||
Hon Hai Precision Industry Co., Ltd. GDR | 7,705 | 38,949 | ||||||
Inventec Corp. | 104,000 | 50,090 | ||||||
King Yuan Electronics Co., Ltd. | 61,000 | 46,291 | ||||||
King’s Town Bank (d) | 46,000 | 41,568 | ||||||
Lite-On Technology Corp. | 27,000 | 42,952 | ||||||
Pou Chen Corp. | 39,000 | 37,977 | ||||||
Taiwan Semiconductor Manufacturing Co., Ltd. | 12,000 | 43,634 | ||||||
|
| |||||||
| 428,022 | ||||||||
|
| |||||||
| Thailand—5.4% | ||||||||
Bangchak Petroleum PCL (c) | 34,400 | 38,502 | ||||||
Bangchak Petroleum PCL NVDR | 1,700 | 1,903 | ||||||
Bangkok Expressway PCL (c) | 32,400 | 42,495 | ||||||
Delta Electronics Thailand PCL (c) | 33,700 | 40,572 | ||||||
MBK PCL (c) | 7,600 | 40,123 | ||||||
| 120 | Semiannual Report | | May 31, 2013 | | See accompanying Notes to Financial Statements |
Table of Contents
Schedule of Investments
May 31, 2013 (Unaudited)
| Shares | Value | |||||||
PTT Exploration & Production PCL (c) | 6,900 | $34,499 | ||||||
PTT Global Chemical PCL (c) | 17,100 | 40,761 | ||||||
PTT PCL (c) | 3,600 | 38,586 | ||||||
Sansiri PCL (c) | 304,600 | 40,305 | ||||||
Thai Oil PCL (c) | 18,200 | 38,255 | ||||||
|
| |||||||
| 356,001 | ||||||||
|
| |||||||
| Turkey—4.2% | ||||||||
Aygaz AS | 7,524 | 42,391 | ||||||
Selcuk Ecza Deposu Ticaret ve Sanayi A.S. | 36,278 | 41,864 | ||||||
Tekfen Holding AS ADR | 4,868 | 35,512 | ||||||
Torunlar Gayrimenkul Yatirim Ortakligi AS REIT | 18,421 | 40,189 | ||||||
Tupras Turkiye Petrol Rafinerileri AS GDR (a) | 7,343 | 39,216 | ||||||
Turk Telekomunikasyon AS ADR | 4,981 | 38,548 | ||||||
Turk Traktor ve Ziraat Makineleri AS | 1,252 | 39,383 | ||||||
|
| |||||||
| 277,103 | ||||||||
|
| |||||||
| Total Common Stock (cost—$5,454,892) | 5,513,882 | |||||||
|
| |||||||
| Units | ||||||||
| Warrants—7.4% | ||||||||
| India—7.4% | ||||||||
Apollo Tyres Ltd., | 25,491 | 40,276 | ||||||
Aurobindo Pharma Ltd., | 12,994 | 39,242 | ||||||
Bajaj Holdings & Investments Ltd., |
| |||||||
expires 6/12/16 | 2,483 | 40,672 | ||||||
GAIL India Ltd., | 6,698 | 36,303 | ||||||
India Cements Ltd., | 26,106 | 30,805 | ||||||
Indiabulls Finanicial Services Ltd., |
| |||||||
expires 9/28/15 | 8,375 | 40,367 | ||||||
Jammu & Kashmir Band Ltd., | 1,849 | 40,031 | ||||||
Oil & Natural Gas Corp. Ltd., | 7,474 | 43,349 | ||||||
Oil India Ltd., | 4,431 | 46,614 | ||||||
Power Finance Corp. Ltd., | 12,366 | 40,066 | ||||||
Rural Electrification Corp. Ltd., | 11,367 | 44,445 | ||||||
Tata Chemicals Ltd., | 7,391 | 39,468 | ||||||
|
| |||||||
| Total Warrants (cost—$501,577) | 481,638 | |||||||
|
| |||||||
| Shares | ||||||||
| Preferred Stock—4.3% | ||||||||
| Brazil—4.3% | ||||||||
AES Tiete S.A. | 4,000 | 43,421 | ||||||
Banco ABC Brasil S.A. | 5,300 | 36,599 | ||||||
Banco Daycoval S.A. | 8,400 | 39,612 | ||||||
Cia Energetica do Ceara, Class A | 1,900 | 39,121 | ||||||
Itausa - Investimentos Itau S.A. | 9,300 | 40,903 | ||||||
Petroleo Brasileiro S.A. | 4,300 | 40,253 | ||||||
Telefonica Brasil S.A. | 1,600 | 39,369 | ||||||
|
| |||||||
| Total Preferred Stock (cost—$293,281) | 279,278 | �� | ||||||
|
| |||||||
| Principal Amount (000s) | Value | |||||||
| Repurchase Agreements—2.2% | ||||||||
State Street Bank & Trust Co., dated 5/31/13, 0.01%, due 6/3/13, proceeds $146,000; collateralized by Federal Home Loan Bank, 5.50%, due 7/15/36, valued at $151,884 including accrued interest |
| |||||||
(cost—$146,000) | $146 | $146,000 | ||||||
|
| |||||||
| Total Investments (cost—$6,395,750) (b)—98.1% | 6,420,798 | |||||||
|
| |||||||
| Other assets less liabilities—1.9% | 125,728 | |||||||
|
| |||||||
| Net Assets—100.0% | $6,546,526 | |||||||
|
| |||||||
Notes to Schedule of Investments:
(a) 144A—Exempt from registration under Rule 144A of the Securities Act of 1933. These securities may be resold in transactions exempt from registration, typically only to qualified institutional buyers. Unless otherwise indicated, these securities are not considered to be illiquid.
(b) Securities with an aggregate value of $3,761,695, representing 57.5% of net assets, were valued utilizing modeling tools provided by a third-party vendor. See Note 1(a) and Note 1(b) in the Notes to Financial Statements.
(c) Fair-Valued—Securities with an aggregate value of $670,887, representing 10.2% of net assets. See Note 1(a) and Note 1(b) in the Notes to Financial Statements.
(d) Non-income producing.
Glossary:
ADR—American Depositary Receipt
GDR—Global Depositary Receipt
NVDR—Non-Voting Depository Receipt
REIT—Real Estate Investment Trust
UNIT—More than one class of securities traded together.
The industry classification of portfolio holdings and other assets less liabilities shown as a percentage of net assets as of May 31, 2013 were as follows:
Oil, Gas & Consumable Fuels | 11.1% | |||
Commercial Banks | 6.9% | |||
Insurance | 6.1% | |||
Electronic Equipment, Instruments & Components | 4.5% | |||
Real Estate Management & Development | 3.9% | |||
Chemicals | 3.8% | |||
Textiles, Apparel & Luxury Goods | 3.8% | |||
Electric Utilities | 3.7% | |||
Diversified Financial Services | 3.7% | |||
Transportation Infrastructure | 3.4% | |||
Computers & Peripherals | 3.3% | |||
Food Products | 3.2% | |||
Wireless Telecommunication Services | 3.1% | |||
Diversified Telecommunication Services | 2.6% | |||
Semiconductors & Semiconductor Equipment | 2.0% | |||
Auto Components | 2.0% | |||
Household Durables | 1.9% | |||
Tobacco | 1.8% | |||
Construction & Engineering | 1.8% | |||
Real Estate Investment Trust | 1.8% | |||
Hotels, Restaurants & Leisure | 1.4% | |||
Automobiles | 1.4% | |||
Pharmaceuticals | 1.3% | |||
Distributors | 1.2% | |||
Water Utilities | 1.2% | |||
Construction Materials | 1.2% | |||
Banking | 1.2% | |||
Metals & Mining | 1.1% | |||
Machinery | 1.1% | |||
Software | 0.8% | |||
IT Services | 0.7% | |||
Office Electronics | 0.7% | |||
Capital Markets | 0.7% | |||
Gas Utilities | 0.7% | |||
Energy Equipment & Services | 0.7% | |||
Media | 0.7% | |||
Internet Software & Services | 0.6% | |||
Paper & Forest Products | 0.6% | |||
Health Care Providers & Services | 0.6% | |||
Holding Companies-Diversified | 0.6% | |||
Commercial Services & Supplies | 0.6% | |||
Oil & Gas | 0.6% | |||
Telecommunications | 0.6% | |||
Independent Power Producers & Energy Traders | 0.6% | |||
Industrial Conglomerates | 0.6% | |||
Repurchase Agreements | 2.2% | |||
Other assets less liabilities | 1.9% | |||
|
| |||
| 100.0% | ||||
|
|
| See accompanying Notes to Financial Statements | | May 31, 2013 | | Semiannual Report | 121 |
Table of Contents
Schedule of Investments
May 31, 2013 (Unaudited)
AllianzGI NFJ Global Dividend Value Fund
| Shares | Value | |||||||
| Common Stock—98.0% | ||||||||
| Australia—1.8% | ||||||||
Telstra Corp. Ltd. | 272,200 | $1,230,785 | ||||||
|
| |||||||
| Brazil—4.9% | ||||||||
Cia de Saneamento Basico do Estado de Sao Paulo ADR | 98,400 | 1,251,648 | ||||||
Cia Energetica de Minas Gerais ADR | 95,278 | 992,794 | ||||||
Vale S.A. ADR | 83,800 | 1,206,720 | ||||||
|
| |||||||
| 3,451,162 | ||||||||
|
| |||||||
| Canada—1.4% | ||||||||
Barrick Gold Corp. | 48,000 | 1,013,760 | ||||||
|
| |||||||
| France—5.9% | ||||||||
Sanofi | 12,300 | 1,311,526 | ||||||
Total S.A. | 56,000 | 2,799,067 | ||||||
|
| |||||||
| 4,110,593 | ||||||||
|
| |||||||
| Germany—3.9% | ||||||||
RWE AG | 38,900 | 1,327,288 | ||||||
Siemens AG | 13,300 | 1,401,985 | ||||||
|
| |||||||
| 2,729,273 | ||||||||
|
| |||||||
| Hong Kong—3.4% | ||||||||
First Pacific Co., Ltd. | 962,600 | 1,273,970 | ||||||
Yue Yuen Industrial Holdings Ltd. | 393,876 | 1,137,545 | ||||||
|
| |||||||
| 2,411,515 | ||||||||
|
| |||||||
| Israel—1.9% | ||||||||
Israel Chemicals Ltd. | 116,800 | 1,299,058 | ||||||
|
| |||||||
| Japan—5.8% | ||||||||
ITOCHU Corp. | 119,400 | 1,479,675 | ||||||
Mizuho Financial Group, Inc. | 651,200 | 1,239,828 | ||||||
Sega Sammy Holdings, Inc. | 57,200 | 1,359,009 | ||||||
|
| |||||||
| 4,078,512 | ||||||||
|
| |||||||
| Korea (Republic of)—5.9% | ||||||||
POSCO | 4,500 | 1,273,873 | ||||||
SK Telecom Co., Ltd. | 15,633 | 2,886,249 | ||||||
|
| |||||||
| 4,160,122 | ||||||||
|
| |||||||
| Russian Federation—1.8% | ||||||||
Lukoil OAO ADR | 21,100 | 1,235,405 | ||||||
|
| |||||||
| South Africa—4.1% | ||||||||
Sasol Ltd. ADR | 64,000 | 2,840,320 | ||||||
|
| |||||||
| Spain—2.0% | ||||||||
Banco Santander S.A. | 192,942 | 1,379,966 | ||||||
|
| |||||||
| Switzerland—3.9% | ||||||||
Credit Suisse Group AG (b) | 49,129 | 1,452,071 | ||||||
Zurich Insurance Group AG (b) | 4,900 | 1,295,886 | ||||||
|
| |||||||
| 2,747,957 | ||||||||
|
| |||||||
| United Kingdom—10.0% | ||||||||
AstraZeneca PLC | 54,300 | 2,778,216 | ||||||
BAE Systems PLC | 242,100 | 1,479,965 | ||||||
TESCO PLC | 246,800 | 1,366,626 | ||||||
Vodafone Group PLC | 460,300 | 1,334,000 | ||||||
|
| |||||||
| 6,958,807 | ||||||||
|
| |||||||
| United States—41.3% | ||||||||
Altria Group, Inc. | 38,400 | 1,386,240 | ||||||
Annaly Capital Management, Inc. REIT | 93,200 | 1,265,656 | ||||||
Axis Capital Holdings Ltd. | 32,900 | 1,433,124 | ||||||
CA, Inc. | 52,900 | 1,444,699 | ||||||
Cisco Systems, Inc. | 116,600 | 2,807,728 | ||||||
ConocoPhillips | 22,600 | 1,386,284 | ||||||
| Shares | Value | |||||||
Ensco PLC, Class A | 23,600 | $1,420,012 | ||||||
Ford Motor Co. | 102,600 | 1,608,768 | ||||||
HollyFrontier Corp. | 29,200 | 1,445,400 | ||||||
Intel Corp. | 58,700 | 1,425,236 | ||||||
JPMorgan Chase & Co. | 29,900 | 1,632,241 | ||||||
Microsoft Corp. | 44,100 | 1,538,208 | ||||||
Northrop Grumman Corp. | 17,000 | 1,400,630 | ||||||
Pfizer, Inc. | 49,000 | 1,334,270 | ||||||
PNC Financial Services Group, Inc. | 20,500 | 1,468,620 | ||||||
Seagate Technology PLC | 32,200 | 1,387,176 | ||||||
SLM Corp. | 67,200 | 1,595,328 | ||||||
Staples, Inc. | 92,800 | 1,392,000 | ||||||
Xerox Corp. | 166,200 | 1,460,898 | ||||||
|
| |||||||
| 28,832,518 | ||||||||
|
| |||||||
| Total Common Stock (cost—$63,796,566) | 68,479,753 | |||||||
|
| |||||||
| Principal Amount (000s) | ||||||||
| Repurchase Agreements—0.5% | ||||||||
State Street Bank & Trust Co., dated 5/31/13, 0.01%, due 6/3/13, proceeds $317,000; collateralized by Federal Home Loan Bank, 5.50%, due 7/15/36, valued at $323,578 including accrued interest |
| |||||||
(cost—$317,000) | $317 | 317,000 | ||||||
|
| |||||||
| Total Investments (cost—$64,113,566) (a)—98.5% | 68,796,753 | |||||||
|
| |||||||
| Other assets less liabilities—1.5% | 1,071,963 | |||||||
|
| |||||||
| Net Assets—100.0% | $69,868,716 | |||||||
|
| |||||||
Notes to Schedule of Investments:
(a) Securities with an aggregate value of $31,106,588, representing 44.5% of net assets, were valued utilizing modeling tools provided by a third-party vendor. See Note 1(a) and Note 1(b) in the Notes to Financial Statements.
(b) Non-income producing.
Glossary:
ADR—American Depositary Receipt
REIT—Real Estate Investment Trust
The industry classification of portfolio holdings and other assets less liabilities shown as a percentage of net assets as of May 31, 2013 were as follows:
Oil, Gas & Consumable Fuels | 14.0% | |||
Pharmaceuticals | 7.8% | |||
Wireless Telecommunication Services | 6.0% | |||
Commercial Banks | 5.9% | |||
Metals & Mining | 4.9% | |||
Software | 4.3% | |||
Diversified Financial Services | 4.1% | |||
Aerospace & Defense | 4.1% | |||
Communications Equipment | 4.0% | |||
Insurance | 3.9% | |||
Automobiles | 2.3% | |||
Consumer Finance | 2.3% | |||
Trading Companies & Distributors | 2.1% | |||
Office Electronics | 2.1% | |||
Capital Markets | 2.1% | |||
Semiconductors & Semiconductor Equipment | 2.0% | |||
Energy Equipment & Services | 2.0% | |||
Industrial Conglomerates | 2.0% | |||
Specialty Retail | 2.0% | |||
Computers & Peripherals | 2.0% | |||
Tobacco | 2.0% | |||
Food & Staples Retailing | 2.0% | |||
Leisure Equipment & Products | 1.9% | |||
Multi-Utilities | 1.9% | |||
Chemicals | 1.9% | |||
Real Estate Investment Trust | 1.8% | |||
Water Utilities | 1.8% | |||
Diversified Telecommunication Services | 1.8% | |||
Textiles, Apparel & Luxury Goods | 1.6% | |||
Electric Utilities | 1.4% | |||
Repurchase Agreements | 0.5% | |||
Other assets less liabilities | 1.5% | |||
|
| |||
| 100.0% | ||||
|
|
| 122 | Semiannual Report | | May 31, 2013 | | See accompanying Notes to Financial Statements |
Table of Contents
Schedule of Investments
May 31, 2013 (Unaudited)
AllianzGI NFJ International Small-Cap Value Fund
| Shares | Value | |||||||
| Common Stock—92.7% | ||||||||
| Australia—5.4% | ||||||||
Beach Energy Ltd. | 56,000 | $64,198 | ||||||
Bendigo and Adelaide Bank Ltd. | 3,000 | 28,151 | ||||||
Cabcharge Australia Ltd. | 12,200 | 46,348 | ||||||
Cardno Ltd. | 4,900 | 25,018 | ||||||
Charter Hall Retail REIT | 10,600 | 41,551 | ||||||
Mermaid Marine Australia Ltd. | 13,200 | 43,259 | ||||||
Myer Holdings Ltd. | 24,600 | 57,250 | ||||||
Primary Health Care Ltd. | 16,900 | 82,183 | ||||||
SP AusNet | 61,500 | 70,925 | ||||||
|
| |||||||
| 458,883 | ||||||||
|
| |||||||
| Austria—1.4% | ||||||||
EVN AG | 3,300 | 43,174 | ||||||
RHI AG | 2,100 | 73,462 | ||||||
|
| |||||||
| 116,636 | ||||||||
|
| |||||||
| Belgium—0.7% | ||||||||
Barco NV | 700 | 60,623 | ||||||
|
| |||||||
| Brazil—0.9% | ||||||||
Cia de Saneamento Basico do Estado de Sao Paulo ADR | 6,100 | 77,592 | ||||||
|
| |||||||
| Canada—9.8% | ||||||||
Aimia, Inc. | 3,700 | 52,997 | ||||||
Atco Ltd., Class I | 700 | 62,792 | ||||||
CML HealthCare, Inc. | 8,100 | 59,456 | ||||||
Cogeco, Inc. | 1,800 | 72,399 | ||||||
Cott Corp. | 7,800 | 63,882 | ||||||
Genworth MI Canada, Inc. | 2,300 | 54,064 | ||||||
Horizon North Logistics, Inc. | 9,800 | 63,616 | ||||||
Linamar Corp. | 2,600 | 72,928 | ||||||
Maple Leaf Foods, Inc. | 3,500 | 41,524 | ||||||
Methanex Corp. | 1,000 | 44,200 | ||||||
Norbord, Inc. | 1,900 | 62,164 | ||||||
Sherritt International Corp. | 9,700 | 43,413 | ||||||
Torstar Corp., Class B | 6,600 | 39,342 | ||||||
Total Energy Services, Inc. | 3,400 | 48,208 | ||||||
Transcontinental, Inc., Class A | 4,100 | 48,722 | ||||||
|
| |||||||
| 829,707 | ||||||||
|
| |||||||
| China—5.2% | ||||||||
CP Pokphand Co., Ltd. | 514,400 | 54,808 | ||||||
Giant Interactive Group, Inc. ADR | 10,300 | 87,138 | ||||||
Guangdong Investment Ltd. | 97,700 | 85,502 | ||||||
Guangshen Railway Co., Ltd., Class H | 154,900 | 69,346 | ||||||
REXLot Holdings Ltd. | 804,900 | 62,052 | ||||||
Shougang Fushan Resources Group Ltd. | 94,600 | 37,747 | ||||||
Zhejiang Expressway Co., Ltd., Class H | 52,400 | 45,438 | ||||||
|
| |||||||
| 442,031 | ||||||||
|
| |||||||
| Denmark—0.8% | ||||||||
Schouw & Co. | 2,100 | 65,169 | ||||||
|
| |||||||
| Finland—1.3% | ||||||||
Ramirent Oyj | 6,400 | 61,246 | ||||||
Tieto Oyj | 2,200 | 45,098 | ||||||
|
| |||||||
| 106,344 | ||||||||
|
| |||||||
| France—5.0% | ||||||||
Arkema S.A. | 600 | 61,722 | ||||||
Groupe Steria SCA | 3,400 | 52,114 | ||||||
Ipsen S.A. | 1,800 | 65,061 | ||||||
Neopost S.A. | 500 | 33,221 | ||||||
Sa des Ciments Vicat | 1,100 | 70,056 | ||||||
Saft Groupe S.A. | 2,400 | 57,074 | ||||||
Valeo S.A. | 1,200 | 79,963 | ||||||
|
| |||||||
| 419,211 | ||||||||
|
| |||||||
| Shares | Value | |||||||
| Germany—1.2% | ||||||||
Leoni AG | 1,000 | $49,876 | ||||||
NORMA Group AG | 1,400 | 53,166 | ||||||
|
| |||||||
| 103,042 | ||||||||
|
| |||||||
| Greece—1.1% | ||||||||
Costamare, Inc. | 5,400 | 90,774 | ||||||
|
| |||||||
| Hong Kong—3.9% | ||||||||
First Pacific Co., Ltd. | 55,300 | 73,188 | ||||||
Giordano International Ltd. | 44,500 | 42,406 | ||||||
Great Eagle Holdings Ltd. | 13,200 | 52,310 | ||||||
Johnson Electric Holdings Ltd. | 116,900 | 76,422 | ||||||
Singamas Container Holdings Ltd. | 142,100 | 34,255 | ||||||
Yue Yuen Industrial Holdings Ltd. | 18,000 | 51,985 | ||||||
|
| |||||||
| 330,566 | ||||||||
|
| |||||||
| Ireland—1.6% | ||||||||
C&C Group PLC | 10,900 | 64,965 | ||||||
DCC PLC | 1,900 | 71,788 | ||||||
|
| |||||||
| 136,753 | ||||||||
|
| |||||||
| Israel—0.7% | ||||||||
Elbit Systems Ltd. | 1,400 | 60,312 | ||||||
|
| |||||||
| Italy—0.7% | ||||||||
Recordati SpA | 5,900 | 62,448 | ||||||
|
| |||||||
| Japan—16.6% | ||||||||
Ain Pharmaciez, Inc. | 1,400 | 54,840 | ||||||
Air Water, Inc. | 4,500 | 62,863 | ||||||
Canon Electronics, Inc. | 2,400 | 43,562 | ||||||
Daiichikosho Co., Ltd. | 1,400 | 35,831 | ||||||
Daikyo, Inc. | 14,500 | 43,236 | ||||||
Fukuoka Financial Group, Inc. | 9,000 | 36,524 | ||||||
Higo Bank Ltd. | 5,900 | 34,126 | ||||||
Idemitsu Kosan Co., Ltd. | 900 | 72,830 | ||||||
Japan Aviation Electronics Industry Ltd. | 6,400 | 62,483 | ||||||
Japan Petroleum Exploration Co. | 1,500 | 62,922 | ||||||
Kaken Pharmaceutical Co., Ltd. | 5,300 | 77,319 | ||||||
Kato Sangyo Co., Ltd. | 3,500 | 65,452 | ||||||
KYORIN Holdings, Inc. | 3,400 | 74,965 | ||||||
Megane TOP Co., Ltd. | 5,700 | 78,565 | ||||||
Mitsubishi Gas Chemical Co., Inc. | 8,400 | 59,563 | ||||||
Mitsubishi UFJ Lease & Finance Co., Ltd. | 7,000 | 31,733 | ||||||
Namco Bandai Holdings, Inc. | 4,200 | 68,079 | ||||||
Nichii Gakkan Co. | 4,200 | 38,457 | ||||||
Nippon Soda Co., Ltd. | 7,800 | 36,721 | ||||||
NS Solutions Corp. | 3,600 | 63,769 | ||||||
Sumitomo Forestry Co., Ltd. | 4,100 | 48,204 | ||||||
Suruga Bank Ltd. | 2,200 | 32,954 | ||||||
Tosoh Corp. | 15,000 | 48,980 | ||||||
Toyo Suisan Kaisha Ltd. | 2,100 | 67,607 | ||||||
Unipres Corp. | 3,000 | 55,294 | ||||||
Yokohama Rubber Co., Ltd. | 5,000 | 50,087 | ||||||
|
| |||||||
| 1,406,966 | ||||||||
|
| |||||||
| Korea (Republic of)—0.8% | ||||||||
SFA Engineering Corp. | 1,200 | 66,125 | ||||||
|
| |||||||
| Luxembourg—0.8% | ||||||||
Ternium S.A. ADR | 2,800 | 65,240 | ||||||
|
| |||||||
| Netherlands—1.6% | ||||||||
Aalberts Industries NV | 2,900 | 65,752 | ||||||
BinckBank NV | 3,100 | 28,443 | ||||||
Sligro Food Group NV | 1,100 | 36,993 | ||||||
|
| |||||||
| 131,188 | ||||||||
|
| |||||||
| Shares | Value | |||||||
| New Zealand—1.2% | ||||||||
Infratil Ltd. | 18,500 | $33,524 | ||||||
Telecom Corp. of New Zealand Ltd. | 39,000 | 71,362 | ||||||
|
| |||||||
| 104,886 | ||||||||
|
| |||||||
| Norway—2.2% | ||||||||
Ekornes ASA | 3,900 | 62,468 | ||||||
Petroleum Geo-Services ASA | 4,200 | 62,374 | ||||||
TGS Nopec Geophysical Co. ASA | 1,700 | 59,341 | ||||||
|
| |||||||
| 184,183 | ||||||||
|
| |||||||
| Panama—0.8% | ||||||||
Banco Latinoamericano de Comercio Exterior S.A. | 3,100 | 71,083 | ||||||
|
| |||||||
| Russian Federation—0.7% | ||||||||
CTC Media, Inc. | 5,300 | 63,282 | ||||||
|
| |||||||
| Singapore—1.9% | ||||||||
First Resources Ltd. | 38,000 | 56,936 | ||||||
Lippo Malls Indonesia Retail Trust REIT | 105,100 | 42,718 | ||||||
UOL Group Ltd. | 11,500 | 60,634 | ||||||
|
| |||||||
| 160,288 | ||||||||
|
| |||||||
| South Africa—0.3% | ||||||||
African Bank Investments Ltd. | 14,300 | 22,739 | ||||||
|
| |||||||
| Spain—2.0% | ||||||||
Construcciones y Auxiliar de Ferrocarriles S.A. | 200 | 83,304 | ||||||
Duro Felguera S.A. | 5,400 | 37,402 | ||||||
Grupo Catalana Occidente S.A. | 2,200 | 51,375 | ||||||
|
| |||||||
| 172,081 | ||||||||
|
| |||||||
| Sweden—1.8% | ||||||||
Loomis AB, Class B | 3,400 | 65,677 | ||||||
Saab AB, Class B | 4,000 | 82,487 | ||||||
|
| |||||||
| 148,164 | ||||||||
|
| |||||||
| Switzerland—2.1% | ||||||||
AMS AG | 600 | 57,914 | ||||||
BKW AG | 1,800 | 59,487 | ||||||
Helvetia Holding AG | 150 | 61,754 | ||||||
|
| |||||||
| 179,155 | ||||||||
|
| |||||||
| Taiwan—0.5% | ||||||||
Gigabyte Technology Co., Ltd. | 44,800 | 43,247 | ||||||
|
| |||||||
| United Kingdom—18.9% | ||||||||
Bank of Georgia Holdings PLC | 2,300 | 64,181 | ||||||
Beazley PLC | 21,800 | 77,757 | ||||||
Berendsen PLC | 7,800 | 89,944 | ||||||
Bodycote PLC | 8,200 | 68,083 | ||||||
Carillion PLC | 10,600 | 41,107 | ||||||
Catlin Group Ltd. | 5,100 | 38,790 | ||||||
Debenhams PLC | 65,000 | 92,292 | ||||||
Ferrexpo PLC | 19,500 | 49,634 | ||||||
Go-Ahead Group PLC | 2,100 | 49,093 | ||||||
Greene King PLC | 6,200 | 71,759 | ||||||
Inchcape PLC | 8,800 | 72,805 | ||||||
Intermediate Capital Group PLC | 5,700 | 40,199 | ||||||
Interserve PLC | 9,700 | 71,600 | ||||||
JD Wetherspoon PLC | 4,100 | 41,022 | ||||||
Kcom Group PLC | 48,900 | 62,299 | ||||||
Laird PLC | 18,200 | 58,115 | ||||||
Marston’s PLC | 24,700 | 53,427 | ||||||
Mondi PLC | 5,700 | 75,029 | ||||||
Morgan Advanced Materials PLC | 19,300 | 85,016 | ||||||
Soco International PLC (b) | 10,500 | 61,298 | ||||||
TalkTalk Telecom Group PLC | 20,700 | 71,867 | ||||||
Tullett Prebon PLC | 15,100 | 67,115 | ||||||
United Drug PLC | 17,300 | 86,138 | ||||||
| See accompanying Notes to Financial Statements | | May 31, 2013 | | Semiannual Report | 123 |
Table of Contents
Schedule of Investments
May 31, 2013 (Unaudited)
| Shares | Value | |||||||
WH Smith PLC | 6,200 | $70,877 | ||||||
William Hill PLC | 6,300 | 42,107 | ||||||
|
| |||||||
| 1,601,554 | ||||||||
|
| |||||||
| United States—0.8% | ||||||||
Maiden Holdings Ltd. | 6,500 | 69,420 | ||||||
|
| |||||||
| Total Common Stock (cost—$7,060,176) | 7,849,692 | |||||||
|
| |||||||
| Preferred Stock—2.4% | ||||||||
| Brazil—0.9% | ||||||||
AES Tiete S.A. | 6,800 | 73,817 | ||||||
|
| |||||||
| Germany—1.5% | ||||||||
Hornbach Holding AG | 1,000 | 65,962 | ||||||
Jungheinrich AG | 1,300 | 60,771 | ||||||
|
| |||||||
| 126,733 | ||||||||
|
| |||||||
| Total Preferred Stock (cost—$176,633) | 200,550 | |||||||
|
| |||||||
| Principal Amount (000s) | ||||||||
| Repurchase Agreements—2.4% | ||||||||
State Street Bank & Trust Co., dated 5/31/13, 0.01%, due 6/3/13, proceeds $204,000; collateralized by Federal Home Loan Bank, 5.50%, due 7/15/36, valued at $211,316 including accrued interest |
| |||||||
(cost—$204,000) | $204 | 204,000 | ||||||
|
| |||||||
| Total Investments (cost—$7,440,809) (a)—97.5% | 8,254,242 | |||||||
|
| |||||||
| Other assets less liabilities—2.5% | 208,687 | |||||||
|
| |||||||
| Net Assets—100.0% | $8,462,929 | |||||||
|
| |||||||
Notes to Schedule of Investments:
(a) Securities with an aggregate value of $5,826,292, representing 68.8% of net assets, were valued utilizing modeling tools provided by a third-party vendor. See Note 1(a) and Note 1(b) in the Notes to Financial Statements.
(b) Non-income producing.
Glossary:
ADR—American Depositary Receipt
REIT—Real Estate Investment Trust
The industry classification of portfolio holdings and other assets less liabilities shown as a percentage of net assets as of May 31, 2013 were as follows:
Machinery | 5.7% | |||
Auto Components | 3.8% | |||
Commercial Services & Supplies | 3.7% | |||
Chemicals | 3.6% | |||
Insurance | 3.5% | |||
Electronic Equipment, Instruments & Components | 3.4% | |||
Electric Utilities | 3.3% | |||
Pharmaceuticals | 3.3% | |||
Health Care Providers & Services | 3.2% | |||
Hotels, Restaurants & Leisure | 3.1% | |||
Commercial Banks | 3.1% | |||
Media | 3.1% | |||
Oil, Gas & Consumable Fuels | 3.1% | |||
Specialty Retail | 3.0% | |||
Food Products | 2.7% | |||
Metals & Mining | 2.4% | |||
Diversified Telecommunication Services | 2.3% | |||
Energy Equipment & Services | 2.0% | |||
IT Services | 2.0% | |||
Water Utilities | 1.9% | |||
Food & Staples Retailing | 1.9% | |||
Real Estate Management & Development | 1.8% | |||
Multi-line Retail | 1.8% | |||
Construction Materials | 1.7% | |||
Aerospace & Defense | 1.7% | |||
Construction & Engineering | 1.6% | |||
Paper & Forest Products | 1.6% | |||
Industrial Conglomerates | 1.6% | |||
Capital Markets | 1.6% | |||
Marine | 1.6% | |||
Electrical Equipment | 1.6% | |||
Beverages | 1.6% | |||
Diversified Financial Services | 1.6% | |||
Road & Rail | 1.4% | |||
Household Durables | 1.4% | |||
Software | 1.0% | |||
Real Estate Investment Trust | 1.0% | |||
Distributors | 0.9% | |||
Leisure Equipment & Products | 0.8% | |||
Multi-Utilities | 0.7% | |||
Trading Companies & Distributors | 0.7% | |||
Semiconductors & Semiconductor Equipment | 0.7% | |||
Thrifts & Mortgage Finance | 0.6% | |||
Textiles, Apparel & Luxury Goods | 0.6% | |||
Transportation Infrastructure | 0.5% | |||
Computers & Peripherals | 0.5% | |||
Office Electronics | 0.4% | |||
Repurchase Agreements | 2.4% | |||
Other assets less liabilities | 2.5% | |||
|
| |||
| 100.0% | ||||
|
|
AllianzGI NFJ International Value II Fund
| Shares | Value | |||||||
| Common Stock—97.2% | ||||||||
| Australia—1.4% | ||||||||
AMP Ltd. | 7,600 | $37,270 | ||||||
SP AusNet | 15,700 | 18,106 | ||||||
|
| |||||||
| 55,376 | ||||||||
|
| |||||||
| Austria—1.5% | ||||||||
EVN AG | 1,975 | 25,839 | ||||||
OMV AG | 700 | 32,290 | ||||||
|
| |||||||
| 58,129 | ||||||||
|
| |||||||
| Brazil—2.1% | ||||||||
Cia de Saneamento Basico do Estado de Sao Paulo ADR | 3,600 | 45,792 | ||||||
Vale S.A. ADR | 2,600 | 37,440 | ||||||
|
| |||||||
| 83,232 | ||||||||
|
| |||||||
| Canada—7.7% | ||||||||
Atco Ltd., Class I | 500 | 44,852 | ||||||
Barrick Gold Corp. | 800 | 16,806 | ||||||
Canadian Imperial Bank of Commerce | 500 | 37,786 | ||||||
Cogeco Cable, Inc. | 700 | 30,438 | ||||||
Genworth MI Canada, Inc. | 1,300 | 30,558 | ||||||
Manulife Financial Corp. | 2,800 | 44,346 | ||||||
Maple Leaf Foods, Inc. | 1,500 | 17,796 | ||||||
Power Financial Corp. | 1,400 | 42,105 | ||||||
Suncor Energy, Inc. | 1,200 | 36,372 | ||||||
|
| |||||||
| 301,059 | ||||||||
|
| |||||||
| China—2.7% | ||||||||
China Petroleum & Chemical Corp., Class H | 27,700 | 28,320 | ||||||
CNOOC Ltd. | 22,300 | 39,006 | ||||||
Guangdong Investment Ltd. | 40,600 | 35,531 | ||||||
|
| |||||||
| 102,857 | ||||||||
|
| |||||||
| Denmark—1.0% | ||||||||
Carlsberg A/S, Class B | 400 | 37,987 | ||||||
|
| |||||||
| France—7.0% | ||||||||
Arkema S.A. | 400 | 41,148 | ||||||
AXA S.A. | 2,200 | 44,417 | ||||||
Christian Dior S.A. | 225 | 41,163 | ||||||
Cie Generale des Etablissements Michelin | 400 | 34,908 | ||||||
Sanofi | 600 | 63,977 | ||||||
Valeo S.A. | 700 | 46,645 | ||||||
|
| |||||||
| 272,258 | ||||||||
|
| |||||||
| Germany—2.5% | ||||||||
Bayerische Motoren Werke AG | 300 | 28,469 | ||||||
Deutsche Boerse AG | 500 | 32,234 | ||||||
Muenchener Rueckversicherungs AG | 200 | 37,305 | ||||||
|
| |||||||
| 98,008 | ||||||||
|
| |||||||
| Hong Kong—3.8% | ||||||||
First Pacific Co., Ltd. | 33,600 | 44,469 | ||||||
Jardine Strategic Holdings Ltd. | 1,000 | 39,988 | ||||||
Wheelock & Co., Ltd. | 6,300 | 35,384 | ||||||
Yue Yuen Industrial Holdings Ltd. | 9,300 | 26,859 | ||||||
|
| |||||||
| 146,700 | ||||||||
|
| |||||||
| India—1.7% | ||||||||
Sterlite Industries India Ltd. ADR | 4,700 | 31,114 | ||||||
Tata Motors Ltd. ADR | 1,200 | 32,916 | ||||||
|
| |||||||
| 64,030 | ||||||||
|
| |||||||
| Ireland—0.8% | ||||||||
C&C Group PLC | 5,400 | 32,184 | ||||||
|
| |||||||
| Israel—2.2% | ||||||||
Israel Chemicals Ltd. ADR | 2,900 | 32,538 | ||||||
| 124 | Semiannual Report | | May 31, 2013 | | See accompanying Notes to Financial Statements |
Table of Contents
Schedule of Investments
May 31, 2013 (Unaudited)
| Shares | Value | |||||||
Teva Pharmaceutical Industries Ltd. ADR | 1,400 | $53,480 | ||||||
|
| |||||||
| 86,018 | ||||||||
|
| |||||||
| Japan—17.0% | ||||||||
Asahi Group Holdings Ltd. | 2,300 | 55,148 | ||||||
Central Japan Railway Co. | 400 | 44,039 | ||||||
Chiba Bank Ltd. | 4,600 | 28,623 | ||||||
Daiichikosho Co., Ltd. | 1,400 | 35,831 | ||||||
Hoya Corp. | 1,400 | 28,115 | ||||||
Idemitsu Kosan Co., Ltd. | 400 | 32,369 | ||||||
IHI Corp. | 14,500 | 53,034 | ||||||
Japan Airlines Co., Ltd. | 600 | 30,755 | ||||||
Kaken Pharmaceutical Co., Ltd. | 1,800 | 26,259 | ||||||
KDDI Corp. | 1,400 | 63,160 | ||||||
KYORIN Holdings, Inc. | 800 | 17,639 | ||||||
Marubeni Corp. | 4,100 | 28,310 | ||||||
Mitsui & Co., Ltd. | 3,600 | 45,086 | ||||||
Nippon Telegraph & Telephone Corp. | 1,200 | 59,184 | ||||||
Nissan Motor Co., Ltd. | 2,400 | 25,917 | ||||||
Otsuka Holdings Co., Ltd. | 900 | 28,870 | ||||||
Suruga Bank Ltd. | 2,200 | 32,955 | ||||||
Toyo Suisan Kaisha Ltd. | 800 | 25,755 | ||||||
|
| |||||||
| 661,049 | ||||||||
|
| |||||||
| Korea (Republic of)—2.3% | ||||||||
KT Corp. ADR | 1,700 | 28,662 | ||||||
POSCO ADR | 500 | 35,325 | ||||||
Shinhan Financial Group Co., Ltd. ADR | 700 | 24,906 | ||||||
|
| |||||||
| 88,893 | ||||||||
|
| |||||||
| Netherlands—0.8% | ||||||||
Aalberts Industries NV | 1,400 | 31,743 | ||||||
|
| |||||||
| Norway—2.9% | ||||||||
Statoil ASA | 2,400 | 54,191 | ||||||
Telenor ASA | 1,300 | 27,345 | ||||||
Yara International ASA | 700 | 31,258 | ||||||
|
| |||||||
| 112,794 | ||||||||
|
| |||||||
| Russian Federation—1.6% | ||||||||
Gazprom OAO ADR (b) | 3,400 | 25,738 | ||||||
Lukoil OAO ADR | 600 | 35,130 | ||||||
|
| |||||||
| 60,868 | ||||||||
|
| |||||||
| Singapore—1.9% | ||||||||
First Resources Ltd. | 10,100 | 15,133 | ||||||
Golden Agri-Resources Ltd. | 64,400 | 29,240 | ||||||
UOL Group Ltd. | 5,900 | 31,108 | ||||||
|
| |||||||
| 75,481 | ||||||||
|
| |||||||
| South Africa—1.8% | ||||||||
MTN Group Ltd. ADR | 1,600 | 29,040 | ||||||
Sasol Ltd. ADR | 900 | 39,942 | ||||||
|
| |||||||
| 68,982 | ||||||||
|
| |||||||
| Spain—2.3% | ||||||||
Duro Felguera S.A. | 4,200 | 29,090 | ||||||
Enagas S.A. | 900 | 22,499 | ||||||
Mapfre S.A. | 11,000 | 39,525 | ||||||
|
| |||||||
| 91,114 | ||||||||
|
| |||||||
| Sweden—0.6% | ||||||||
Saab AB, Class B | 1,100 | 22,684 | ||||||
|
| |||||||
| Switzerland—1.9% | ||||||||
Aryzta AG (b) | 400 | 22,947 | ||||||
Roche Holdings AG | 200 | 49,587 | ||||||
|
| |||||||
| 72,534 | ||||||||
|
| |||||||
| Taiwan—0.9% | ||||||||
Advanced Semiconductor Engineering, Inc. ADR | 8,095 | 33,999 | ||||||
|
| |||||||
| Shares | Value | |||||||
| Turkey—1.0% | ||||||||
KOC Holding AS ADR | 1,375 | $39,187 | ||||||
|
| |||||||
| United Kingdom—27.2% | ||||||||
Aberdeen Asset Management PLC | 3,400 | 23,894 | ||||||
AstraZeneca PLC | 1,100 | 56,281 | ||||||
Aviva PLC | 6,500 | 32,665 | ||||||
BAE Systems PLC | 7,500 | 45,848 | ||||||
BP PLC | 4,800 | 34,307 | ||||||
BT Group PLC | 12,200 | 55,517 | ||||||
Centrica PLC | 4,700 | 27,028 | ||||||
G4S PLC | 7,900 | 29,701 | ||||||
GlaxoSmithKline PLC | 2,400 | 62,096 | ||||||
Greene King PLC | 2,800 | 32,407 | ||||||
HSBC Holdings PLC | 3,700 | 40,593 | ||||||
Imperial Tobacco Group PLC | 1,700 | 61,004 | ||||||
Inchcape PLC | 4,400 | 36,402 | ||||||
Kingfisher PLC | 7,800 | 40,637 | ||||||
Marks & Spencer Group PLC | 7,800 | 55,200 | ||||||
Mondi PLC | 3,400 | 44,754 | ||||||
Old Mutual PLC | 11,437 | 35,321 | ||||||
Reckitt Benckiser Group PLC | 600 | 42,905 | ||||||
Rio Tinto PLC | 900 | 38,440 | ||||||
Royal Dutch Shell PLC, Class A | 1,800 | 59,906 | ||||||
Sage Group PLC | 6,800 | 37,532 | ||||||
Smith & Nephew PLC | 3,100 | 36,256 | ||||||
TESCO PLC | 7,800 | 43,192 | ||||||
Vodafone Group PLC | 17,400 | 50,427 | ||||||
William Hill PLC | 5,100 | 34,087 | ||||||
|
| |||||||
| 1,056,400 | ||||||||
|
| |||||||
| United States—0.6% | ||||||||
Ensco PLC, Class A | 400 | 24,068 | ||||||
|
| |||||||
| Total Investments (cost—$3,331,818) (a)—97.2% | 3,777,634 | |||||||
|
| |||||||
| Other assets less liabilities—2.8% | 108,903 | |||||||
|
| |||||||
| Net Assets—100.0% | $3,886,537 | |||||||
|
| |||||||
Notes to Schedule of Investments:
(a) Securities with an aggregate value of $2,873,361, representing 73.9% of net assets, were valued utilizing modeling tools provided by a third-party vendor. See Note 1(a) and Note 1(b) in the Notes to Financial Statements.
(b) Non-income producing.
Glossary:
ADR—American Depositary Receipt
The industry classification of portfolio holdings and other assets less liabilities shown as a percentage of net assets as of May 31, 2013 were as follows:
Oil, Gas & Consumable Fuels | 10.7% | |||
Pharmaceuticals | 9.3% | |||
Insurance | 7.9% | |||
Diversified Telecommunication Services | 4.3% | |||
Commercial Banks | 4.3% | |||
Metals & Mining | 4.0% | |||
Wireless Telecommunication Services | 3.7% | |||
Beverages | 3.2% | |||
Machinery | 2.9% | |||
Food Products | 2.9% | |||
Chemicals | 2.7% | |||
Automobiles | 2.3% | |||
Auto Components | 2.1% | |||
Water Utilities | 2.1% | |||
Industrial Conglomerates | 2.0% | |||
Diversified Financial Services | 2.0% | |||
Trading Companies & Distributors | 1.9% | |||
Multi-Utilities | 1.8% | |||
Aerospace & Defense | 1.8% | |||
Textiles, Apparel & Luxury Goods | 1.8% | |||
Hotels, Restaurants & Leisure | 1.7% | |||
Real Estate Management & Development | 1.7% | |||
Media | 1.7% | |||
Tobacco | 1.6% | |||
Multi-line Retail | 1.4% | |||
Paper & Forest Products | 1.2% | |||
Electric Utilities | 1.2% | |||
Road & Rail | 1.1% | |||
Food & Staples Retailing | 1.1% | |||
Household Products | 1.1% | |||
Specialty Retail | 1.1% | |||
Software | 1.0% | |||
Distributors | 0.9% | |||
Health Care Equipment & Supplies | 0.9% | |||
Semiconductors & Semiconductor Equipment | 0.9% | |||
Airlines | 0.8% | |||
Thrifts & Mortgage Finance | 0.8% | |||
Commercial Services & Supplies | 0.8% | |||
Electronic Equipment, Instruments & Components | 0.7% | |||
Energy Equipment & Services | 0.6% | |||
Capital Markets | 0.6% | |||
Gas Utilities | 0.6% | |||
Other assets less liabilities | 2.8% | |||
|
| |||
| 100.0% | ||||
|
|
| See accompanying Notes to Financial Statements | | May 31, 2013 | | Semiannual Report | 125 |
Table of Contents
Schedule of Investments
May 31, 2013 (Unaudited)
AllianzGI Redwood Fund
| Shares | Value | |||||||
| Common Stock—87.6% | ||||||||
| Aerospace & Defense—1.2% | ||||||||
Boeing Co. (a) | 900 | $89,118 | ||||||
|
| |||||||
| Air Freight & Logistics—2.0% | ||||||||
Expeditors International of Washington, Inc. (a) | 3,900 | 152,217 | ||||||
|
| |||||||
| Beverages—1.8% | ||||||||
Monster Beverage Corp. (a)(b) | 2,500 | 136,475 | ||||||
|
| |||||||
| Building Products—2.8% | ||||||||
Owens Corning (a)(b) | 4,800 | 209,760 | ||||||
|
| |||||||
| Commercial Banks—3.4% | ||||||||
Comerica, Inc. (a) | 6,500 | 256,685 | ||||||
|
| |||||||
| Communications Equipment—3.1% | ||||||||
F5 Networks, Inc. (a)(b) | 1,300 | 108,173 | ||||||
Juniper Networks, Inc. (a)(b) | 7,000 | 124,110 | ||||||
|
| |||||||
| 232,283 | ||||||||
|
| |||||||
| Computers & Peripherals—1.9% | ||||||||
NetApp, Inc. (a)(b) | 3,900 | 146,367 | ||||||
|
| |||||||
| Diversified Consumer Services—1.7% | ||||||||
Weight Watchers International, Inc. (a) | 2,800 | 128,380 | ||||||
|
| |||||||
| Diversified Financial Services—1.2% | ||||||||
JPMorgan Chase & Co. (a) | 1,700 | 92,803 | ||||||
|
| |||||||
| Energy Equipment & Services—4.3% | ||||||||
Cameron International Corp. (a)(b) | 4,000 | 243,480 | ||||||
Schlumberger Ltd. (a) | 1,100 | 80,333 | ||||||
|
| |||||||
| 323,813 | ||||||||
|
| |||||||
| Food & Staples Retailing—2.1% | ||||||||
Whole Foods Market, Inc. (a) | 3,000 | 155,580 | ||||||
|
| |||||||
| Food Products—3.5% | ||||||||
Mead Johnson Nutrition Co. (a) | 3,200 | 259,424 | ||||||
|
| |||||||
| Health Care Equipment & Supplies—2.9% | ||||||||
Edwards Lifesciences Corp. (b) | 2,100 | 139,566 | ||||||
Thoratec Corp. (a)(b) | 2,500 | 77,925 | ||||||
|
| |||||||
| 217,491 | ||||||||
|
| |||||||
| Health Care Providers & Services—12.7% | ||||||||
Aetna, Inc. (a) | 4,400 | 265,672 | ||||||
Express Scripts Holding Co. (a)(b) | 3,600 | 223,632 | ||||||
HCA Holdings, Inc. (a) | 6,500 | 253,890 | ||||||
UnitedHealth Group, Inc. (a) | 3,400 | 212,942 | ||||||
|
| |||||||
| 956,136 | ||||||||
|
| |||||||
| Hotels, Restaurants & Leisure—4.6% | ||||||||
Las Vegas Sands Corp. (a) | 4,600 | 266,340 | ||||||
Yum! Brands, Inc. (a) | 1,200 | 81,300 | ||||||
|
| |||||||
| 347,640 | ||||||||
|
| |||||||
| Household Durables—1.7% | ||||||||
Lennar Corp., Class A (a) | 3,300 | 129,756 | ||||||
|
| |||||||
| Industrial Conglomerates—3.4% | ||||||||
Danaher Corp. (a) | 4,100 | 253,462 | ||||||
|
| |||||||
| Internet Software & Services—1.2% | ||||||||
Akamai Technologies, Inc. (a)(b) | 2,000 | 92,240 | ||||||
|
| |||||||
| IT Services—1.8% | ||||||||
Western Union Co. (a) | 8,100 | 132,678 | ||||||
|
| |||||||
| Machinery—1.3% | ||||||||
Deere & Co. (a) | 1,100 | 95,821 | ||||||
|
| |||||||
| Media—2.6% | ||||||||
CBS Corp., Class B (a) | 3,900 | 193,050 | ||||||
|
| |||||||
| Metals & Mining—2.0% | ||||||||
U.S. Steel Corp. (a) | 8,400 | 148,596 | ||||||
|
| |||||||
| Shares | Value | |||||||
| Oil, Gas & Consumable Fuels—5.6% | ||||||||
Anadarko Petroleum Corp. (a) | 2,300 | $201,181 | ||||||
CONSOL Energy, Inc. (a) | 2,900 | 100,572 | ||||||
EOG Resources, Inc. (a) | 900 | 116,190 | ||||||
|
| |||||||
| 417,943 | ||||||||
|
| |||||||
| Personal Products—2.2% | ||||||||
Estee Lauder Cos., Inc., Class A (a) | 2,400 | 162,672 | ||||||
|
| |||||||
| Pharmaceuticals—2.9% | ||||||||
Allergan, Inc. (a) | 2,200 | 218,878 | ||||||
|
| |||||||
| Semiconductors & Semiconductor Equipment—2.6% | ||||||||
Broadcom Corp., Class A (a) | 5,500 | 197,505 | ||||||
|
| |||||||
| Software—6.2% | ||||||||
Citrix Systems, Inc. (a)(b) | 2,100 | 135,135 | ||||||
Oracle Corp. (a) | 7,500 | 253,200 | ||||||
TIBCO Software, Inc. (a)(b) | 3,800 | 81,054 | ||||||
|
| |||||||
| 469,389 | ||||||||
|
| |||||||
| Textiles, Apparel & Luxury Goods—2.7% | ||||||||
Coach, Inc. (a) | 3,500 | 203,910 | ||||||
|
| |||||||
| Trading Companies & Distributors—2.2% | ||||||||
United Rentals, Inc. (a)(b) | 2,900 | 164,836 | ||||||
|
| |||||||
| Total Common Stock (cost—$5,706,392) | 6,584,908 | |||||||
|
| |||||||
| Principal Amount (000s) | ||||||||
| Repurchase Agreements—33.7% | ||||||||
State Street Bank & Trust Co., dated 5/31/13, 0.01%, due 6/3/13, proceeds $2,531,002; collateralized by Federal Home Loan Bank, 3.30%, due 8/27/32, valued at $2,583,525 including accrued interest |
| |||||||
(cost—$2,531,000) | $2,531 | 2,531,000 | ||||||
|
| |||||||
| Total Investments, before options written (cost—$8,237,392)—121.3% | 9,115,908 | |||||||
|
| |||||||
| Contracts | ||||||||
| Options Written (b)(c)—(21.5)% | ||||||||
| Call Options—(20.7)% | ||||||||
Aetna, Inc., | 44 | (91,190 | ) | |||||
Akamai Technologies, Inc., | 20 | (36,400 | ) | |||||
Allergan, Inc., | 22 | (41,580 | ) | |||||
Anadarko Petroleum Corp., | 23 | (35,995 | ) | |||||
Boeing Co., | 9 | (28,755 | ) | |||||
Broadcom Corp., | 55 | (38,500 | ) | |||||
Cameron International Corp., | 40 | (62,800 | ) | |||||
CBS Corp., | 39 | (58,695 | ) | |||||
| Contracts | Value | |||||||
Citrix Systems, Inc., | 21 | $(26,040 | ) | |||||
Coach, Inc., | 35 | (36,890 | ) | |||||
Comerica, Inc., | 65 | (63,700 | ) | |||||
Consol Energy, Inc., | 29 | (21,025 | ) | |||||
Danaher Corp., | 41 | (63,755 | ) | |||||
Deere & Co., | 11 | (11,055 | ) | |||||
Edwards Lifesciences Corp., | 21 | (22,680 | ) | |||||
EOG Resources, Inc., | 9 | (31,140 | ) | |||||
Estee Lauder Cos. , Inc., | 24 | (39,720 | ) | |||||
Expeditors International of Washington, Inc., |
| |||||||
strike price $32.50, | 39 | (28,470 | ) | |||||
Express Scripts Holding Co., | 36 | (41,040 | ) | |||||
F5 Networks, Inc., | 13 | (16,250 | ) | |||||
HCA Holdings, Inc., | 65 | (51,025 | ) | |||||
JPMorgan Chase & Co., | 17 | (23,783 | ) | |||||
Juniper Networks, Inc., | 70 | (9,170 | ) | |||||
Las Vegas Sands Corp., | 46 | (104,995 | ) | |||||
Lennar Corp., | 33 | (23,760 | ) | |||||
Mead Johnson Nutrition Co., | 32 | (52,880 | ) | |||||
Monster Worldwide, Inc., | 25 | (38,500 | ) | |||||
NetApp, Inc., | 39 | (37,538 | ) | |||||
Oracle Corp., | 75 | (37,500 | ) | |||||
Owens Corning, | 48 | (91,920 | ) | |||||
Schlumberger Ltd., | 11 | (14,300 | ) | |||||
Thoratec Corp., | 25 | (15,000 | ) | |||||
TIBCO Software, Inc., | 38 | (11,780 | ) | |||||
| 126 | Semiannual Report | | May 31, 2013 | | See accompanying Notes to Financial Statements |
Table of Contents
Schedule of Investments
May 31, 2013 (Unaudited)
| Contracts | Value | |||||||
U.S. Steel Corp., | 84 | $(12,012 | ) | |||||
United Rentals, Inc., | 29 | (88,740 | ) | |||||
UnitedHealth Group, Inc., | 7 | (7,787 | ) | |||||
strike price $47.00, | 27 | (43,808 | ) | |||||
Weight Watchers International, Inc., |
| |||||||
strike price $45.00, | 28 | (6,370 | ) | |||||
Western Union Co., | 81 | (27,945 | ) | |||||
Whole Foods Market, Inc., | 30 | (47,550 | ) | |||||
Yum! Brands, Inc., | 12 | (11,088 | ) | |||||
|
| |||||||
| (1,553,131 | ) | |||||||
|
| |||||||
| Put Options—(0.8)% | ||||||||
American Express Co., | 76 | (2,660 | ) | |||||
AT&T, Inc., | 51 | (6,375 | ) | |||||
Baxter International, Inc., | 18 | (927 | ) | |||||
Cardinal Health, Inc., | 24 | (2,400 | ) | |||||
Caterpillar, Inc., | 24 | (10,200 | ) | |||||
Finisar Corp., | 151 | (9,437 | ) | |||||
Google, Inc., | 9 | (1,935 | ) | |||||
Harman International, | 34 | (340 | ) | |||||
Intel Corp., | 19 | (1,216 | ) | |||||
strike price $22.00, | 18 | (1,692 | ) | |||||
JPMorgan Chase & Co., | 14 | (1,176 | ) | |||||
Lockheed Martin Corp., | 10 | (375 | ) | |||||
Morgan Stanley, | 59 | (6,608 | ) | |||||
QUALCOMM, Inc., | 20 | (6,700 | ) | |||||
Safeway, Inc., | 60 | (7,650 | ) | |||||
| Contracts | Value | |||||||
United Continental Holdings, | 15 | $(2,550 | ) | |||||
strike price $20.00, | 59 | (3,068 | ) | |||||
|
| |||||||
| (65,309 | ) | |||||||
|
| |||||||
| Total Options Written (premiums received—$1,469,003) | (1,618,440 | ) | ||||||
|
| |||||||
| Total Investments, net of options written (cost—$6,768,389)—99.8% | 7,497,468 | |||||||
|
| |||||||
| Other assets less other liabilities—0.2% | 15,380 | |||||||
|
| |||||||
| Net Assets—100.0% | $7,512,848 | |||||||
|
| |||||||
Notes to Schedule of Investments:
(a) All or partial amount segregated for the benefit of the counterparty as collateral for options written.
(b) Non-income producing.
(c) Exchange traded-Chicago Board Options Exchange.
AllianzGI Short Duration High Income Fund
| Principal Amount (000s) | Value | |||||||
| Corporate Bonds & Notes—85.1% | ||||||||
| Aerospace & Defense—3.5% | ||||||||
Spirit Aerosystems, Inc., | ||||||||
7.50%, 10/1/17 | $6,560 | $6,920,800 | ||||||
Triumph Group, Inc., | ||||||||
8.00%, 11/15/17 | 7,197 | 7,646,812 | ||||||
8.625%, 7/15/18 | 340 | 372,300 | ||||||
|
| |||||||
| 14,939,912 | ||||||||
|
| |||||||
| Banking—2.2% | ||||||||
Ally Financial, Inc., | ||||||||
3.125%, 1/15/16 | 720 | 728,281 | ||||||
4.50%, 2/11/14 | 1,250 | 1,271,875 | ||||||
4.625%, 6/26/15 | 2,500 | 2,613,528 | ||||||
5.50%, 2/15/17 | 1,535 | 1,650,320 | ||||||
CIT Group, Inc., | ||||||||
4.75%, 2/15/15 (a)(c) | 1,615 | 1,687,675 | ||||||
5.00%, 5/15/17 | 1,567 | 1,676,690 | ||||||
|
| |||||||
| 9,628,369 | ||||||||
|
| |||||||
| Chemicals—0.9% | ||||||||
Ashland, Inc. (a)(c), | ||||||||
3.00%, 3/15/16 | 3,025 | 3,066,594 | ||||||
3.875%, 4/15/18 | 840 | 866,250 | ||||||
|
| |||||||
| 3,932,844 | ||||||||
|
| |||||||
| Coal—2.7% | ||||||||
Cloud Peak Energy Resources LLC, |
| |||||||
8.25%, 12/15/17 | 2,550 | 2,728,500 | ||||||
CONSOL Energy, Inc., | ||||||||
8.00%, 4/1/17 | 6,451 | 6,934,825 | ||||||
Peabody Energy Corp., | ||||||||
6.00%, 11/15/18 | 2,000 | 2,147,500 | ||||||
|
| |||||||
| 11,810,825 | ||||||||
|
| |||||||
| Commercial Services—2.5% | ||||||||
Avis Budget Car Rental LLC, | ||||||||
2.775%, 5/15/14 (e) | 2,830 | 2,837,103 | ||||||
4.875%, 11/15/17 (a)(c) | 6,140 | 6,385,600 | ||||||
Hertz Corp. (a)(c), | ||||||||
4.25%, 4/1/18 | 85 | 87,763 | ||||||
United Rentals North America, Inc., |
| |||||||
5.75%, 7/15/18 | 1,570 | 1,683,825 | ||||||
|
| |||||||
| 10,994,291 | ||||||||
|
| |||||||
| Containers & Packaging—0.6% | ||||||||
Ardagh Packaging Finance PLC (a)(c), |
| |||||||
7.375%, 10/15/17 | 2,495 | 2,724,850 | ||||||
|
| |||||||
| Diversified Financial Services—11.0% | ||||||||
Aircastle Ltd., | ||||||||
6.75%, 4/15/17 | 8,600 | 9,503,000 | ||||||
CNH Capital LLC, | ||||||||
3.875%, 11/1/15 | 1,170 | 1,202,175 | ||||||
6.25%, 11/1/16 | 2,000 | 2,210,000 | ||||||
Ford Motor Credit Co. LLC, | ||||||||
3.875%, 1/15/15 | 1,300 | 1,348,971 | ||||||
General Motors Financial Co., Inc., |
| |||||||
3.25%, 5/15/18 (a)(c) | 250 | 248,437 | ||||||
4.75%, 8/15/17 (a)(c) | 5,555 | 5,888,300 | ||||||
6.75%, 6/1/18 | 1,725 | 1,975,125 | ||||||
International Lease Finance Corp., |
| |||||||
3.875%, 4/15/18 | 9,000 | 9,028,125 | ||||||
4.875%, 4/1/15 | 1,900 | 1,987,875 | ||||||
5.65%, 6/1/14 | 750 | 780,000 | ||||||
6.625%, 11/15/13 | 1,467 | 1,499,091 | ||||||
National Money Mart Co., | ||||||||
10.375%, 12/15/16 | 6,419 | 6,908,449 | ||||||
| See accompanying Notes to Financial Statements | | May 31, 2013 | | Semiannual Report | 127 |
Table of Contents
Schedule of Investments
May 31, 2013 (Unaudited)
| Principal Amount (000s) | Value | |||||||
SLM Corp., | ||||||||
3.875%, 9/10/15 | $1,850 | $1,891,625 | ||||||
5.00%, 4/15/15 | 175 | 182,437 | ||||||
5.00%, 6/15/18 | 2,220 | 2,225,559 | ||||||
6.00%, 1/25/17 | 500 | 528,750 | ||||||
|
| |||||||
| 47,407,919 | ||||||||
|
| |||||||
| Electric Utilities—6.0% | ||||||||
AES Corp., | ||||||||
7.75%, 10/15/15 | 300 | 334,500 | ||||||
Calpine Construction Finance Co. L.P. (a)(c), |
| |||||||
8.00%, 6/1/16 | 2,285 | 2,376,400 | ||||||
Calpine Corp. (a)(c), | ||||||||
7.25%, 10/15/17 | 10,641 | 11,173,050 | ||||||
CMS Energy Corp., | ||||||||
2.75%, 5/15/14 | 250 | 254,315 | ||||||
Ipalco Enterprises, Inc. (a)(c), |
| |||||||
7.25%, 4/1/16 | 300 | 336,750 | ||||||
NRG Energy, Inc., | ||||||||
7.625%, 1/15/18 | 10,045 | 11,375,963 | ||||||
|
| |||||||
| 25,850,978 | ||||||||
|
| |||||||
| Electrical Equipment—1.4% | ||||||||
General Cable Corp. (e), | ||||||||
2.659%, 4/1/15 | 6,167 | 6,120,747 | ||||||
|
| |||||||
| Electronics—0.6% | ||||||||
NXP BV (a)(c), | ||||||||
3.75%, 6/1/18 | 2,598 | 2,572,020 | ||||||
|
| |||||||
| Food & Beverage—6.4% | ||||||||
Constellation Brands, Inc., | ||||||||
8.375%, 12/15/14 | 73 | 80,848 | ||||||
Cott Beverages, Inc., | ||||||||
8.375%, 11/15/17 | 6,550 | 7,000,313 | ||||||
Delhaize Group S.A., | ||||||||
6.50%, 6/15/17 | 760 | 871,296 | ||||||
Ingles Markets, Inc., | ||||||||
8.875%, 5/15/17 | 11,909 | 12,519,336 | ||||||
Stater Bros. Holdings, Inc., | ||||||||
7.75%, 4/15/15 | 7,110 | 7,136,662 | ||||||
|
| |||||||
| 27,608,455 | ||||||||
|
| |||||||
| Healthcare-Services—2.8% | ||||||||
Community Health Systems, Inc., |
| |||||||
5.125%, 8/15/18 | 3,000 | 3,135,000 | ||||||
HCA, Inc., | ||||||||
6.50%, 2/15/16 | 5,915 | 6,536,075 | ||||||
6.75%, 7/15/13 | 475 | 477,850 | ||||||
7.19%, 11/15/15 | 880 | 974,600 | ||||||
Health Management Associates, Inc., |
| |||||||
6.125%, 4/15/16 | 1,050 | 1,155,000 | ||||||
|
| |||||||
| 12,278,525 | ||||||||
|
| |||||||
| Holding Companies-Diversified—0.3% | ||||||||
Leucadia National Corp., | ||||||||
7.75%, 8/15/13 | 316 | 320,187 | ||||||
8.125%, 9/15/15 | 860 | 980,400 | ||||||
|
| |||||||
| 1,300,587 | ||||||||
|
| |||||||
| Home Builders—2.1% | ||||||||
Lennar Corp., | ||||||||
4.75%, 12/15/17 | 350 | 373,625 | ||||||
Meritage Homes Corp., | ||||||||
4.50%, 3/1/18 | 8,695 | 8,825,425 | ||||||
|
| |||||||
| 9,199,050 | ||||||||
|
| |||||||
| Household Products/Wares—0.7% | ||||||||
Jarden Corp., | ||||||||
7.50%, 5/1/17 | 345 | 394,162 | ||||||
Prestige Brands, Inc., | ||||||||
8.25%, 4/1/18 | 2,506 | 2,719,010 | ||||||
|
| |||||||
| 3,113,172 | ||||||||
|
| |||||||
| Principal Amount (000s) | Value | |||||||
| Iron/Steel—2.1% | ||||||||
ArcelorMittal, | ||||||||
4.25%, 2/25/15 | $4,650 | $4,789,500 | ||||||
6.125%, 6/1/18 | 2,000 | 2,127,500 | ||||||
Commercial Metals Co., | ||||||||
6.50%, 7/15/17 | 1,775 | 1,952,500 | ||||||
|
| |||||||
| 8,869,500 | ||||||||
|
| |||||||
| Leisure—0.1% | ||||||||
Royal Caribbean Cruises Ltd., |
| |||||||
7.00%, 6/15/13 | 250 | 250,312 | ||||||
7.25%, 6/15/16 | 230 | 261,625 | ||||||
|
| |||||||
| 511,937 | ||||||||
|
| |||||||
| Lodging—2.7% | ||||||||
MGM Resorts International, | ||||||||
5.875%, 2/27/14 | 701 | 725,535 | ||||||
6.625%, 7/15/15 | 3,619 | 3,944,710 | ||||||
6.875%, 4/1/16 | 6,208 | 6,859,840 | ||||||
|
| |||||||
| 11,530,085 | ||||||||
|
| |||||||
| Machinery-Diversified—0.0% | ||||||||
Case New Holland, Inc., | ||||||||
7.75%, 9/1/13 | 150 | 152,062 | ||||||
|
| |||||||
| Media—9.3% | ||||||||
Allbritton Communications Co., |
| |||||||
8.00%, 5/15/18 | 2,514 | 2,727,690 | ||||||
Cablevision Systems Corp., | ||||||||
7.75%, 4/15/18 | 5,855 | 6,645,425 | ||||||
CCO Holdings LLC, | ||||||||
7.25%, 10/30/17 | 4,860 | 5,200,200 | ||||||
Cequel Communications Holdings I LLC (a)(c), |
| |||||||
8.625%, 11/15/17 | 2,094 | 2,239,533 | ||||||
DISH DBS Corp., | ||||||||
4.25%, 4/1/18 (a)(c) | 4,235 | 4,150,300 | ||||||
4.625%, 7/15/17 | 6,355 | 6,386,775 | ||||||
5.00%, 5/15/17 (a)(c) | 2,500 | 2,512,500 | ||||||
6.625%, 10/1/14 | 65 | 68,575 | ||||||
7.00%, 10/1/13 | 175 | 177,984 | ||||||
Entravision Communications Corp., |
| |||||||
8.75%, 8/1/17 | 1,460 | 1,569,500 | ||||||
Quebecor Media, Inc., | ||||||||
7.75%, 3/15/16 | 661 | 674,220 | ||||||
Sinclair Television Group, Inc. (a)(c), |
| |||||||
9.25%, 11/1/17 | 4,218 | 4,523,805 | ||||||
Univision Communications, Inc. (a)(c), |
| |||||||
6.875%, 5/15/19 | 3,000 | 3,202,500 | ||||||
|
| |||||||
| 40,079,007 | ||||||||
|
| |||||||
| Mining—4.6% | ||||||||
FMG Resources August 206 Pty Ltd. (a)(c), |
| |||||||
7.00%, 11/1/15 | 12,770 | 13,216,950 | ||||||
Novelis, Inc., | ||||||||
8.375%, 12/15/17 | 6,110 | 6,629,350 | ||||||
|
| |||||||
| 19,846,300 | ||||||||
|
| |||||||
| Miscellaneous Manufacturing—0.9% | ||||||||
Bombardier, Inc. (a)(c), | ||||||||
4.25%, 1/15/16 | 3,755 | 3,905,200 | ||||||
|
| |||||||
| Oil & Gas—2.6% | ||||||||
Chesapeake Energy Corp., | ||||||||
3.25%, 3/15/16 | 2,125 | 2,114,375 | ||||||
Sabine Pass LNG L.P., | ||||||||
7.50%, 11/30/16 | 8,135 | 9,111,200 | ||||||
|
| |||||||
| 11,225,575 | ||||||||
|
| |||||||
| Paper & Forest Products—2.1% | ||||||||
Boise Paper Holdings LLC, | ||||||||
9.00%, 11/1/17 | 8,295 | 8,875,650 | ||||||
|
| |||||||
| Principal Amount (000s) | Value | |||||||
| Pharmaceuticals—3.5% | ||||||||
Valeant Pharmaceuticals International (a)(c), |
| |||||||
6.50%, 7/15/16 | $11,034 | $11,475,360 | ||||||
6.75%, 10/1/17 | 3,500 | 3,753,750 | ||||||
|
| |||||||
| 15,229,110 | ||||||||
|
| |||||||
| Pipelines—1.8% | ||||||||
Regency Energy Partners L.P., |
| |||||||
9.375%, 6/1/16 | 1,803 | 1,887,525 | ||||||
Targa Resources Partners L.P., |
| |||||||
7.875%, 10/15/18 | 5,294 | 5,757,225 | ||||||
|
| |||||||
| 7,644,750 | ||||||||
|
| |||||||
| Real Estate Investment Trust—3.1% | ||||||||
DuPont Fabros Technology L.P., |
| |||||||
8.50%, 12/15/17 | 8,695 | 9,347,125 | ||||||
Felcor Lodging L.P., | ||||||||
10.00%, 10/1/14 | 278 | 305,800 | ||||||
Geo Group, Inc., | ||||||||
7.75%, 10/15/17 | 2,719 | 2,875,343 | ||||||
Host Hotels & Resorts L.P., | ||||||||
6.75%, 6/1/16 | 928 | 939,503 | ||||||
|
| |||||||
| 13,467,771 | ||||||||
|
| |||||||
| Retail—0.0% | ||||||||
Limited Brands, Inc., | ||||||||
5.25%, 11/1/14 | 125 | 131,094 | ||||||
|
| |||||||
| Software—0.3% | ||||||||
First Data Corp. (a)(c), | ||||||||
7.375%, 6/15/19 | 1,000 | 1,060,000 | ||||||
|
| |||||||
| Telecommunications—8.3% | ||||||||
CenturyLink, Inc., | ||||||||
5.15%, 6/15/17 | 1,010 | 1,085,750 | ||||||
6.00%, 4/1/17 | 8,035 | 8,898,762 | ||||||
Frontier Communications Corp., |
| |||||||
8.25%, 5/1/14 | 170 | 179,775 | ||||||
Inmarsat Finance PLC (a)(c), |
| |||||||
7.375%, 12/1/17 | 6,540 | 6,899,700 | ||||||
Intelsat Luxembourg S.A. (a)(c), |
| |||||||
6.75%, 6/1/18 | 1,730 | 1,812,175 | ||||||
MetroPCS Wireless, Inc., | ||||||||
7.875%, 9/1/18 | 6,325 | 6,925,875 | ||||||
SBA Communications Corp. (a)(c), |
| |||||||
5.625%, 10/1/19 | 3,745 | 3,871,394 | ||||||
Sprint Nextel Corp., | ||||||||
6.00%, 12/1/16 | 5,595 | 6,056,588 | ||||||
|
| |||||||
| 35,730,019 | ||||||||
|
| |||||||
| Total Corporate Bonds & Notes (cost—$366,039,014) | 367,740,604 | |||||||
|
| |||||||
| Senior Loans (a)(b)—10.4% | ||||||||
| Commercial Services & Supplies—0.4% | ||||||||
KAR Auction Services, Inc., Term B, |
| |||||||
3.75%, 5/19/17 | 1,783 | 1,806,327 | ||||||
|
| |||||||
| Energy Equipment & Services—0.1% | ||||||||
Energy Transfer Equity, L.P., Term B, |
| |||||||
3.75%, 3/26/17 | 675 | 682,910 | ||||||
|
| |||||||
| Financial Services—0.6% | ||||||||
Capital Automotive L.P., Term B, |
| |||||||
4.00%, 3/27/19 | 2,732 | 2,760,263 | ||||||
|
| |||||||
| Food & Beverage—1.2% | ||||||||
Sprouts Farmers Markets Holdings LLC (d), |
| |||||||
4.50%, 4/12/20 | 5,000 | 5,018,750 | ||||||
|
| |||||||
| Insurance—1.9% | ||||||||
Asurion LLC, Term B1 (d), | ||||||||
4.50%, 5/24/19 | 7,979 | 8,052,207 | ||||||
|
| |||||||
| 128 | Semiannual Report | | May 31, 2013 | | See accompanying Notes to Financial Statements |
Table of Contents
Schedule of Investments
May 31, 2013 (Unaudited)
| Principal Amount (000s) | Value | |||||||
| IT Services—0.7% | ||||||||
Blue Coat Systems, Inc. (d), | ||||||||
4.50%, 5/23/19 | $3,000 | $3,025,314 | ||||||
|
| |||||||
| Leisure—0.7% | ||||||||
AMC Entertainment, Inc., | ||||||||
3.50%, 4/23/20 | 3,000 | 3,015,312 | ||||||
|
| |||||||
| Miscellaneous Manufacturing—0.1% | ||||||||
Generac Power Systems, Inc., Term B (d), |
| |||||||
3.50%, 5/31/20 | 500 | 502,188 | ||||||
|
| |||||||
| Oil & Gas—2.0% | ||||||||
Chesapeake Energy Corp., | ||||||||
5.75%, 12/2/17 | 8,250 | 8,489,398 | ||||||
|
| |||||||
| Software—0.7% | ||||||||
First Data Corp. (d), | ||||||||
4.199%, 3/24/17 | 3,000 | 2,992,500 | ||||||
|
| |||||||
| Telecommunications—2.0% | ||||||||
Cricket Communications, Inc., |
| |||||||
4.75%, 10/10/19 | 3,990 | 4,017,431 | ||||||
4.75%, 3/8/20, Term C | 3,000 | 3,020,625 | ||||||
Intelsat Jackson Holdings Ltd., |
| |||||||
5.25%, 2/1/14 | 1,659 | 1,659,089 | ||||||
|
| |||||||
| 8,697,145 | ||||||||
|
| |||||||
| Total Senior Loans (cost—$44,740,416) | 45,042,314 | |||||||
|
| |||||||
| Convertible Bonds—1.8% | ||||||||
| Containers & Packaging—1.8% | ||||||||
Owens-Brockway Glass Container, Inc. (a)(c), |
| |||||||
(cost—$7,850,275) | 7,900 | 8,107,375 | ||||||
|
| |||||||
| Repurchase Agreements—7.5% | ||||||||
State Street Bank & Trust Co., dated 5/31/13, 0.01%, due 6/3/13, proceeds $32,236,027; collateralized by Freddie Mac, 3.00%, due 8/6/20, valued at $32,880,981 including accrued interest |
| |||||||
(cost—$32,236,000) | 32,236 | 32,236,000 | ||||||
|
| |||||||
| Total Investments (cost—$450,865,705)—104.8% | 453,126,293 | |||||||
|
| |||||||
| Liabilities in excess of other assets—(4.8)% | (20,955,503 | ) | ||||||
|
| |||||||
| Net Assets—100.0% | $432,170,790 | |||||||
|
| |||||||
Notes to Schedule of Investments:
(a) Private Placement—Restricted as to resale and may not have a readily available market. Securities with an aggregate value of $153,186,545, representing 35.4% of net assets.
(b) These securities generally pay interest at rates which are periodically pre-determined by reference to a base lending rate plus a premium. These base lending rates are generally either the lending rate offered by one or more major European banks, such as the “LIBOR” or the prime rate offered by one or more major United States banks, or the certificate of deposit rate. These securities are generally considered to be restricted as the Fund is ordinarily contractually obligated to receive approval from the Agent bank and/or borrower prior to disposition. Remaining maturities of senior loans may be less than the stated maturities shown as a result of contractual or optional payments by the borrower. Such prepayments cannot be predicted with certainty. The interest rate disclosed on settled loans reflects the rate in effect on May 31, 2013. The interest rate disclosed on unsettled loans reflects the rate that will go into effect on settlement date.
(c) 144A—Exempt from registration under Rule 144A of the Securities Act of 1933. These securities may be resold in transactions exempt from registration, typically only to qualified institutional buyers. Unless otherwise indicated, these securities are not considered to be illiquid.
(d) When-issued or delayed-delivery. To be settled/delivered after May 31, 2013.
(e) Variable or Floating Rate Security—Securities with an interest rate that changes periodically. The interest rate disclosed reflects the rate in effect on May 31, 2013.
AllianzGI Structured Alpha Fund
| Principal Amount (000s) | Value | |||||||
| Short-Term Investments—98.3% | ||||||||
| U.S. Treasury Obligations—91.9% | ||||||||
U.S. Treasury Bills (a)(b), 0.038%, 8/22/13 | $7,600 | $7,599,536 | ||||||
|
| |||||||
| Repurchase Agreements—6.4% | ||||||||
State Street Bank & Trust Co., dated 5/31/13, 0.01%, due 6/3/13, proceeds $527,000; collateralized by Fannie Mae, 2.23%, due 12/6/22, valued at $542,275 including accrued interest |
| |||||||
(cost—$527,000) | 527 | 527,000 | ||||||
|
| |||||||
| Total Short-Term Investments (cost—$8,126,279) | 8,126,536 | |||||||
|
| |||||||
| Contracts | ||||||||
| Options Purchased (c)(d)—2.5% | ||||||||
| Call Options—1.7% | ||||||||
iPATH S&P 500 VIX, | 2 | 6 | ||||||
strike price $31.00, expires 6/7/13 | 93 | 186 | ||||||
Russell 2000 Index, | 2 | 1,466 | ||||||
strike price $945.00, expires 6/22/13 | 2 | 8,830 | ||||||
strike price $985.00, expires 6/22/13 | 4 | 6,840 | ||||||
strike price $1,000.00, expires 6/22/13 | 7 | 6,097 | ||||||
strike price $1,010.00, expires 6/28/13 | 4 | 4,473 | ||||||
strike price $1,035.00, expires 7/20/13 | 2 | 1,280 | ||||||
Russell 2000 Index Flex, | 2 | 2,430 | ||||||
strike price $970.00, expires 6/5/13 | 2 | 5,184 | ||||||
strike price $965.00, expires 6/7/13 | 2 | 6,207 | ||||||
strike price $965.00, expires 6/10/13 | 2 | 6,462 | ||||||
strike price $980.00, expires 6/14/13 | 2 | 4,471 | ||||||
strike price $968.00, expires 6/17/13 | 2 | 6,526 | ||||||
strike price $953.00, expires 6/19/13 | 2 | 9,133 | ||||||
strike price $990.00, expires 6/19/13 | 4 | 7,261 | ||||||
strike price $947.00, expires 6/24/13 | 2 | 10,456 | ||||||
strike price $985.00, expires 6/24/13 | 4 | 9,305 | ||||||
strike price $980.00, expires 6/28/13 | 2 | 5,556 | ||||||
strike price $985.00, expires 7/1/13 | 2 | 5,130 | ||||||
strike price $980.00, expires 7/3/13 | 2 | 5,893 | ||||||
strike price $1,010.00, expires 7/3/13 | 4 | 5,162 | ||||||
strike price $1,005.00, expires 7/5/13 | 2 | 3,174 | ||||||
| See accompanying Notes to Financial Statements | | May 31, 2013 | | Semiannual Report | 129 |
Table of Contents
Schedule of Investments
May 31, 2013 (Unaudited)
| Contracts | Value | |||||||
strike price $1,009.00, expires 7/10/13 | 2 | $3,110 | ||||||
strike price $1,000.00, expires 7/12/13 | 2 | 4,098 | ||||||
strike price $1,020.00, expires 7/15/13 | 2 | 2,487 | ||||||
strike price $1,030.00, expires 7/17/13 | 2 | 1,906 | ||||||
strike price $1,040.00, expires 7/22/13 | 2 | 1,562 | ||||||
strike price $1,050.00, expires 7/24/13 | 2 | 1,176 | ||||||
strike price $1,030.00, expires 7/26/13 | 2 | 2,319 | ||||||
strike price $1,026.00, expires 7/31/13 | 2 | 2,826 | ||||||
strike price $1,040.00, expires 8/2/13 | 2 | 1,625 | ||||||
|
| |||||||
| 142,637 | ||||||||
|
| |||||||
| Put Options—0.8% | ||||||||
iPATH S&P 500 VIX, | 26 | 1,066 | ||||||
strike price $18.00, expires 6/22/13 | 52 | 1,976 | ||||||
strike price $18.00, expires 6/28/13 | 26 | 1,404 | ||||||
strike price $18.00, expires 7/5/13 | 26 | 2,028 | ||||||
Nasdaq 100 Stock Index, | 1 | 1,990 | ||||||
strike price $2,975.00, expires 6/22/13 | 1 | 3,010 | ||||||
Russell 2000 Index, | 18 | 360 | ||||||
strike price $810.00, expires 6/22/13 | 16 | 400 | ||||||
strike price $820.00, expires 6/22/13 | 18 | 540 | ||||||
strike price $950.00, expires 6/22/13 | 2 | 1,690 | ||||||
strike price $965.00, expires 6/22/13 | 1 | 1,000 | ||||||
strike price $970.00, expires 6/22/13 | 1 | 1,326 | ||||||
strike price $950.00, expires 7/20/13 | 2 | 3,276 | ||||||
strike price $980.00, expires 7/20/13 | 2 | 5,652 | ||||||
Russell 2000 Index Flex, | 2 | 1,141 | ||||||
S&P 500 Index, | 79 | 790 | ||||||
strike price $1,430.00, expires 6/7/13 | 8 | 120 | ||||||
strike price $1,450.00, expires 6/7/13 | 73 | 1,460 | ||||||
strike price $1,560.00, expires 6/7/13 | 2 | 280 | ||||||
strike price $1,400.00, expires 6/14/13 | 8 | 160 | ||||||
strike price $1,425.00, expires 6/14/13 | 87 | 3,045 | ||||||
strike price $1,450.00, expires 6/14/13 | 64 | 2,560 | ||||||
strike price $1,455.00, expires 6/14/13 | 10 | 700 | ||||||
strike price $1,590.00, expires 6/14/13 | 2 | 1,560 | ||||||
| Contracts | Value | |||||||
strike price $1,625.00, expires 6/14/13 | 1 | $1,710 | ||||||
strike price $1,630.00, expires 6/14/13 | 1 | 1,950 | ||||||
strike price $1,600.00, expires 6/22/13 | 1 | 1,350 | ||||||
strike price $1,620.00, expires 6/22/13 | 3 | 5,775 | ||||||
S&P 500 Index Flex, | 2 | 12 | ||||||
strike price $1,590.00, expires 6/11/13 | 2 | 821 | ||||||
strike price $1,614.00, expires 6/18/13 | 2 | 2,603 | ||||||
strike price $1,600.00, expires 6/25/13 | 2 | 2,594 | ||||||
strike price $1,618.00, expires 7/2/13 | 2 | 4,283 | ||||||
S&P 500 PM Index, | 1 | 3,170 | ||||||
strike price $1,645.00, expires 6/28/13 | 1 | 2,100 | ||||||
|
| |||||||
| 63,902 | ||||||||
|
| |||||||
| Total Options Purchased (cost—$159,522) | 206,539 | |||||||
|
| |||||||
| Total Investments, before options written (cost—$8,285,801)—100.8% | 8,333,075 | |||||||
|
| |||||||
| Options Written (c)(d)— (3.4)% | ||||||||
| Call Options—(1.9)% | ||||||||
iPATH S&P 500 VIX, | 54 | (756 | ) | |||||
strike price $28.00, expires 6/22/13 | 81 | (891 | ) | |||||
strike price $29.00, expires 6/22/13 | 143 | (1,573 | ) | |||||
strike price $30.00, expires 6/22/13 | 35 | (350 | ) | |||||
strike price $27.00, expires 7/20/13 | 26 | (884 | ) | |||||
strike price $28.00, expires 7/20/13 | 40 | (1,360 | ) | |||||
strike price $30.00, expires 7/20/13 | 69 | (1,656 | ) | |||||
Nasdaq 100 Stock Index, | 8 | (1,840 | ) | |||||
strike price $3,150.00, expires 6/22/13 | 4 | (580 | ) | |||||
strike price $3,200.00, expires 7/20/13 | 3 | (1,107 | ) | |||||
Russell 2000 Index, | 6 | (14,760 | ) | |||||
strike price $1,020.00, expires 6/22/13 | 13 | (4,420 | ) | |||||
strike price $1,025.00, expires 6/22/13 | 4 | (904 | ) | |||||
strike price $1,040.00, expires 6/22/13 | 4 | (340 | ) | |||||
strike price $1,030.00, expires 7/20/13 | 4 | (3,220 | ) | |||||
strike price $1,040.00, expires 7/20/13 | 4 | (2,180 | ) | |||||
strike price $1,045.00, expires 7/20/13 | 5 | (2,500 | ) | |||||
strike price $1,060.00, expires 7/20/13 | 8 | (1,920 | ) | |||||
| Contracts | Value | |||||||
strike price $1,065.00, expires 7/20/13 | 6 | $(1,272 | ) | |||||
Russell 2000 Index Flex, | 6 | (661 | ) | |||||
strike price $1,002.00, expires 6/5/13 | 6 | (2,617 | ) | |||||
strike price $987.00, expires 6/7/13 | 6 | (8,193 | ) | |||||
strike price $990.00, expires 6/10/13 | 4 | (5,488 | ) | |||||
strike price $1,005.00, expires 6/14/13 | 2 | (1,634 | ) | |||||
strike price $1,015.00, expires 6/14/13 | 4 | (1,864 | ) | |||||
strike price $995.00, expires 6/17/13 | 4 | (5,762 | ) | |||||
strike price $980.00, expires 6/19/13 | 6 | (14,761 | ) | |||||
strike price $975.00, expires 6/24/13 | 6 | (18,031 | ) | |||||
strike price $1,020.00, expires 6/24/13 | 8 | (5,167 | ) | |||||
strike price $1,005.00, expires 6/28/13 | 6 | (8,041 | ) | |||||
strike price $1,030.00, expires 7/1/13 | 6 | (3,336 | ) | |||||
strike price $1,005.00, expires 7/3/13 | 6 | (9,100 | ) | |||||
strike price $1,030.00, expires 7/5/13 | 6 | (3,954 | ) | |||||
strike price $1,035.00, expires 7/10/13 | 6 | (3,897 | ) | |||||
strike price $1,031.00, expires 7/12/13 | 6 | (4,805 | ) | |||||
strike price $1,049.00, expires 7/15/13 | 6 | (2,723 | ) | |||||
strike price $1,062.00, expires 7/17/13 | 6 | (1,761 | ) | |||||
strike price $1,070.00, expires 7/22/13 | 6 | (1,570 | ) | |||||
strike price $1,080.00, expires 7/24/13 | 6 | (1,147 | ) | |||||
strike price $1,060.00, expires 7/26/13 | 6 | (2,629 | ) | |||||
strike price $1,061.00, expires 7/31/13 | 6 | (2,938 | ) | |||||
strike price $1,070.00, expires 8/2/13 | 6 | (1,795 | ) | |||||
S&P 500 Index, | 5 | (625 | ) | |||||
strike price $1,720.00, expires 7/20/13 | 2 | (680 | ) | |||||
strike price $1,725.00, expires 7/20/13 | 4 | (980 | ) | |||||
S&P 500 PM Index, | 2 | (460 | ) | |||||
|
| |||||||
| (157,132 | ) | |||||||
|
| |||||||
| Put Options—(1.5)% | ||||||||
iPATH S&P 500 VIX, | 78 | (156 | ) | |||||
strike price $16.00, expires 6/22/13 | 156 | (312 | ) | |||||
strike price $16.50, expires 6/28/13 | 26 | (312 | ) | |||||
strike price $17.00, expires 6/28/13 | 52 | (1,092 | ) | |||||
strike price $16.50, expires 7/5/13 | 39 | (975 | ) | |||||
| 130 | Semiannual Report | | May 31, 2013 | | See accompanying Notes to Financial Statements |
Table of Contents
Schedule of Investments
May 31, 2013 (Unaudited)
| Contracts | Value | |||||||
strike price $17.00, expires 7/5/13 | 39 | $(1,326 | ) | |||||
Nasdaq 100 Stock Index, | 5 | (475 | ) | |||||
strike price $2,650.00, expires 6/22/13 | 6 | (900 | ) | |||||
strike price $2,700.00, expires 6/22/13 | 5 | (1,000 | ) | |||||
strike price $2,750.00, expires 6/22/13 | 4 | (1,164 | ) | |||||
strike price $2,775.00, expires 6/22/13 | 1 | (409 | ) | |||||
strike price $2,800.00, expires 6/22/13 | 3 | (1,680 | ) | |||||
strike price $2,875.00, expires 6/22/13 | 4 | (3,648 | ) | |||||
strike price $2,675.00, expires 7/20/13 | 5 | (3,975 | ) | |||||
strike price $2,700.00, expires 7/20/13 | 2 | (1,260 | ) | |||||
Russell 2000 Index, | 7 | (1,435 | ) | |||||
strike price $900.00, expires 6/22/13 | 6 | (1,500 | ) | |||||
strike price $910.00, expires 6/22/13 | 19 | (5,966 | ) | |||||
strike price $920.00, expires 6/22/13 | 2 | (800 | ) | |||||
strike price $860.00, expires 7/20/13 | 6 | (2,184 | ) | |||||
strike price $875.00, expires 7/20/13 | 9 | (4,230 | ) | |||||
strike price $900.00, expires 7/20/13 | 17 | (12,240 | ) | |||||
strike price $930.00, expires 7/20/13 | 4 | (4,680 | ) | |||||
Russell 2000 Index Flex, | 6 | (862 | ) | |||||
S&P 500 Index, | 5 | (150 | ) | |||||
strike price $1,520.00, expires 6/7/13 | 4 | (240 | ) | |||||
strike price $1,525.00, expires 6/7/13 | 5 | (300 | ) | |||||
strike price $1,530.00, expires 6/7/13 | 5 | (325 | ) | |||||
strike price $1,550.00, expires 6/14/13 | 3 | (930 | ) | |||||
strike price $1,560.00, expires 6/14/13 | 4 | (900 | ) | |||||
strike price $1,570.00, expires 6/14/13 | 6 | (2,850 | ) | |||||
strike price $1,515.00, expires 6/22/13 | 5 | (1,325 | ) | |||||
strike price $1,520.00, expires 6/22/13 | 2 | (620 | ) | |||||
strike price $1,525.00, expires 6/22/13 | 12 | (4,080 | ) | |||||
strike price $1,535.00, expires 6/22/13 | 8 | (3,200 | ) | |||||
strike price $1,550.00, expires 6/22/13 | 4 | (1,996 | ) | |||||
strike price $1,580.00, expires 6/22/13 | 2 | (1,890 | ) | |||||
strike price $1,585.00, expires 6/22/13 | 2 | (1,862 | ) | |||||
strike price $1,590.00, expires 6/22/13 | 2 | (1,960 | ) | |||||
| Contracts | Value | |||||||
strike price $1,530.00, expires 7/5/13 | 4 | $(2,080 | ) | |||||
S&P 500 Index Flex, | 4 | (2 | ) | |||||
strike price $1,555.00, expires 6/11/13 | 4 | (534 | ) | |||||
strike price $1,580.00, expires 6/18/13 | 4 | (2,414 | ) | |||||
strike price $1,565.00, expires 6/25/13 | 4 | (2,764 | ) | |||||
strike price $1,580.00, expires 7/2/13 | 4 | (4,730 | ) | |||||
S&P 500 PM Index, | 3 | (1,200 | ) | |||||
strike price $1,540.00, expires 6/28/13 | 9 | (6,075 | ) | |||||
strike price $1,545.00, expires 6/28/13 | 14 | (5,348 | ) | |||||
strike price $1,550.00, expires 6/28/13 | 2 | (1,600 | ) | |||||
strike price $1,555.00, expires 6/28/13 | 6 | (3,780 | ) | |||||
strike price $1,560.00, expires 6/28/13 | 5 | (2,415 | ) | |||||
strike price $1,570.00, expires 6/28/13 | 4 | (3,240 | ) | |||||
strike price $1,575.00, expires 6/28/13 | 4 | (4,680 | ) | |||||
strike price $1,580.00, expires 6/28/13 | 8 | (9,600 | ) | |||||
strike price $1,585.00, expires 6/28/13 | 2 | (2,500 | ) | |||||
|
| |||||||
| (128,171 | ) | |||||||
|
| |||||||
| Total Options Written (premiums received—$265,219) | (285,303 | ) | ||||||
|
| |||||||
| Total Investments, net of options written (cost—$8,020,582)—97.4% | 8,047,772 | |||||||
|
| |||||||
| Other assets less other liabilities—2.6% | 215,857 | |||||||
|
| |||||||
| Net Assets—100.0% | $8,263,629 | |||||||
|
| |||||||
Notes to Schedule of Investments:
(a) All or partial amount segregated for the benefit of the counterparty as collateral for options written.
(b) Rates reflect the effective yields at purchase date.
(c) Non-income producing.
(d) Exchange traded-Chicago Board Options Exchange.
Glossary:
VIX—Volatility Index
AllianzGI Ultra Micro Cap Fund
| Shares | Value | |||||||
| Common Stock—96.5% | ||||||||
| Aerospace & Defense—1.8% | ||||||||
Astronics Corp. (a) | 12,780 | $458,674 | ||||||
Sparton Corp. (a) | 19,900 | 330,738 | ||||||
|
| |||||||
| 789,412 | ||||||||
|
| |||||||
| Air Freight & Logistics—2.0% | ||||||||
Park-Ohio Holdings Corp. (a) | 14,200 | 528,098 | ||||||
XPO Logistics, Inc. (a) | 19,200 | 319,296 | ||||||
|
| |||||||
| 847,394 | ||||||||
|
| |||||||
| Auto Components—0.9% | ||||||||
Stoneridge, Inc. (a) | 35,400 | 396,834 | ||||||
|
| |||||||
| Biotechnology—2.0% | ||||||||
Coronado Biosciences, Inc. (a) | 17,300 | 170,924 | ||||||
Repligen Corp. (a) | 59,965 | 496,510 | ||||||
Sunesis Pharmaceuticals, Inc. (a) | 37,200 | 200,508 | ||||||
|
| |||||||
| 867,942 | ||||||||
|
| |||||||
| Building Products—0.9% | ||||||||
Patrick Industries, Inc. (a) | 18,700 | 364,463 | ||||||
|
| |||||||
| Capital Markets—0.8% | ||||||||
Medley Capital Corp. | 23,593 | 343,278 | ||||||
|
| |||||||
| Chemicals—2.0% | ||||||||
American Pacific Corp. (a) | 11,500 | 319,700 | ||||||
Landec Corp. (a) | 38,100 | 534,924 | ||||||
|
| |||||||
| 854,624 | ||||||||
|
| |||||||
| Commercial Banks—2.1% | ||||||||
First Connecticut Bancorp, Inc. | 13,500 | 192,240 | ||||||
OmniAmerican Bancorp, Inc. (a) | 5,100 | 113,577 | ||||||
Park Sterling Corp. (a) | 55,700 | 325,845 | ||||||
Preferred Bank (a) | 15,800 | 255,486 | ||||||
|
| |||||||
| 887,148 | ||||||||
|
| |||||||
| Commercial Services & Supplies—0.9% | ||||||||
Ceco Environmental Corp. | 33,300 | 401,931 | ||||||
|
| |||||||
| Communications Equipment—1.9% | ||||||||
CalAmp Corp. (a) | 48,700 | 641,379 | ||||||
Meru Networks, Inc. (a) | 42,000 | 172,200 | ||||||
|
| |||||||
| 813,579 | ||||||||
|
| |||||||
| Computers & Peripherals—1.5% | ||||||||
Datalink Corp. (a) | 29,300 | 335,778 | ||||||
USA Technologies, Inc. (a) | 154,700 | 283,101 | ||||||
|
| |||||||
| 618,879 | ||||||||
|
| |||||||
| Construction & Engineering—0.9% | ||||||||
Orion Marine Group, Inc. (a) | 32,000 | 384,320 | ||||||
|
| |||||||
| Consumer Finance—0.7% | ||||||||
Regional Management Corp. (a) | 11,800 | 278,480 | ||||||
|
| |||||||
| Diversified Consumer Services—1.6% | ||||||||
Carriage Services, Inc. | 35,000 | 662,550 | ||||||
|
| |||||||
| Diversified Financial Services—1.0% | ||||||||
Marlin Business Services Corp. | 18,200 | 425,516 | ||||||
|
| |||||||
| Diversified Telecommunication Services—2.5% | ||||||||
8x8, Inc. (a) | 58,900 | 487,103 | ||||||
inContact, Inc. (a) | 79,800 | 579,348 | ||||||
|
| |||||||
| 1,066,451 | ||||||||
|
| |||||||
| Electrical Equipment—2.1% | ||||||||
Coleman Cable, Inc. | 19,300 | 358,980 | ||||||
PowerSecure International, Inc. (a) | 41,000 | 552,680 | ||||||
|
| |||||||
| 911,660 | ||||||||
|
| |||||||
| See accompanying Notes to Financial Statements | | May 31, 2013 | | Semiannual Report | 131 |
Table of Contents
Schedule of Investments
May 31, 2013 (Unaudited)
| Shares | Value | |||||||
| Electronic Equipment, Instruments & Components—0.7% | ||||||||
Key Tronic Corp. (a) | 27,894 | $316,876 | ||||||
|
| |||||||
| Energy Equipment & Services—1.5% | ||||||||
Bolt Technology Corp. | 16,400 | 267,320 | ||||||
RigNet, Inc. (a) | 14,700 | 366,618 | ||||||
|
| |||||||
| 633,938 | ||||||||
|
| |||||||
| Food Products—1.4% | ||||||||
Inventure Foods, Inc. (a) | 36,179 | 272,066 | ||||||
John B Sanfilippo & Son, Inc. | 16,500 | 319,605 | ||||||
|
| |||||||
| 591,671 | ||||||||
|
| |||||||
| Health Care Equipment & Supplies—14.8% | ||||||||
Anika Therapeutics, Inc. (a) | 29,700 | 438,372 | ||||||
Antares Pharma, Inc. (a) | 67,100 | 272,426 | ||||||
Cardiovascular Systems, Inc. (a) | 23,200 | 476,760 | ||||||
Cutera, Inc. (a) | 30,800 | 289,828 | ||||||
Cynosure, Inc., Class A (a) | 16,500 | 411,015 | ||||||
Fonar Corp. (a) | 38,400 | 253,440 | ||||||
GenMark Diagnostics, Inc. (a) | 38,600 | 575,140 | ||||||
Rochester Medical Corp. (a) | 30,500 | 434,015 | ||||||
Spectranetics Corp. (a) | 40,800 | 762,960 | ||||||
Staar Surgical Co. (a) | 32,900 | 292,810 | ||||||
SurModics, Inc. (a) | 18,200 | 432,068 | ||||||
TearLab Corp. (a) | 80,800 | 850,016 | ||||||
Trinity Biotech PLC ADR | 28,500 | 499,605 | ||||||
Vascular Solutions, Inc. (a) | 20,900 | 317,053 | ||||||
|
| |||||||
| 6,305,508 | ||||||||
|
| |||||||
| Health Care Providers & Services—5.6% | ||||||||
AMN Healthcare Services, Inc. (a) | 48,200 | 645,398 | ||||||
Capital Senior Living Corp. (a) | 28,400 | 745,500 | ||||||
Five Star Quality Care, Inc. (a) | 83,500 | 428,355 | ||||||
Providence Service Corp. (a) | 21,400 | 564,104 | ||||||
|
| |||||||
| 2,383,357 | ||||||||
|
| |||||||
| Health Care Technology—2.2% | ||||||||
HealthStream, Inc. (a) | 11,900 | 318,682 | ||||||
Merge Healthcare, Inc. (a) | 107,500 | 354,750 | ||||||
Streamline Health Solutions, Inc. (a) | 41,000 | 276,750 | ||||||
|
| |||||||
| 950,182 | ||||||||
|
| |||||||
| Hotels, Restaurants & Leisure—4.8% | ||||||||
Carrols Restaurant Group, Inc. (a) | 51,100 | 291,270 | ||||||
Diversified Restaurant Holdings, Inc. (a) | 32,100 | 236,577 | ||||||
Fiesta Restaurant Group, Inc. (a) | 22,400 | 796,768 | ||||||
Jamba, Inc. (a) | 155,900 | 466,141 | ||||||
Monarch Casino & Resort, Inc. (a) | 15,600 | 240,396 | ||||||
|
| |||||||
| 2,031,152 | ||||||||
|
| |||||||
| Household Durables—0.8% | ||||||||
Bassett Furniture Industries, Inc. | 25,400 | 349,504 | ||||||
|
| |||||||
| Household Products—0.7% | ||||||||
Orchids Paper Products Co. | 12,300 | 307,746 | ||||||
|
| |||||||
| Insurance—1.9% | ||||||||
Homeowners Choice, Inc. | 23,800 | 827,288 | ||||||
|
| |||||||
| Internet Software & Services—5.3% | ||||||||
Internap Network Services Corp. (a) | 54,300 | 433,314 | ||||||
Points International Ltd. (a) | 30,200 | 510,984 | ||||||
SPS Commerce, Inc. (a) | 13,800 | 744,786 | ||||||
support.com, Inc. (a) | 87,800 | 419,684 | ||||||
Zix Corp. (a) | 41,100 | 163,989 | ||||||
|
| |||||||
| 2,272,757 | ||||||||
|
| |||||||
| Shares | Value | |||||||
| IT Services—1.2% | ||||||||
Computer Task Group, Inc. | 22,300 | $497,736 | ||||||
|
| |||||||
| Leisure Equipment & Products—1.7% | ||||||||
Nautilus, Inc. (a) | 88,700 | 708,713 | ||||||
|
| |||||||
| Life Sciences Tools & Services—2.1% | ||||||||
Albany Molecular Research, Inc. (a) | 53,500 | 588,500 | ||||||
NeoGenomics, Inc. (a) | 91,800 | 326,808 | ||||||
|
| |||||||
| 915,308 | ||||||||
|
| |||||||
| Machinery—1.6% | ||||||||
Manitex International, Inc. (a) | 42,500 | 461,125 | ||||||
Xerium Technologies, Inc. (a) | 23,800 | 234,906 | ||||||
|
| |||||||
| 696,031 | ||||||||
|
| |||||||
| Media—2.8% | ||||||||
Carmike Cinemas, Inc. (a) | 20,900 | 370,348 | ||||||
Entravision Communications Corp., Class A | 95,600 | 442,628 | ||||||
ReachLocal, Inc. (a) | 26,500 | 368,350 | ||||||
|
| |||||||
| 1,181,326 | ||||||||
|
| |||||||
| Oil, Gas & Consumable Fuels—2.2% | ||||||||
Emerald Oil, Inc. (a) | 43,400 | 265,174 | ||||||
Evolution Petroleum Corp. (a) | 27,200 | 288,592 | ||||||
StealthGas, Inc. (a) | 36,600 | 386,862 | ||||||
|
| |||||||
| 940,628 | ||||||||
|
| |||||||
| Personal Products—0.8% | ||||||||
Female Health Co. | 35,500 | 330,505 | ||||||
|
| |||||||
| Pharmaceuticals—2.0% | ||||||||
AcelRx Pharmaceuticals, Inc. (a) | 20,100 | 179,091 | ||||||
Lannett Co., Inc. (a) | 22,900 | 262,663 | ||||||
Santarus, Inc. (a) | 18,000 | 400,860 | ||||||
|
| |||||||
| 842,614 | ||||||||
|
| |||||||
| Professional Services—3.1% | ||||||||
Barrett Business Services, Inc. | 13,700 | 799,121 | ||||||
GP Strategies Corp. (a) | 20,600 | 515,206 | ||||||
|
| |||||||
| 1,314,327 | ||||||||
|
| |||||||
| Road & Rail—2.3% | ||||||||
Celadon Group, Inc. | 14,200 | 277,042 | ||||||
Saia, Inc. (a) | 14,700 | 702,440 | ||||||
|
| |||||||
| 979,482 | ||||||||
|
| |||||||
| Semiconductors & Semiconductor Equipment—3.3% | ||||||||
MaxLinear, Inc., Class A (a) | 54,800 | 345,788 | ||||||
PDF Solutions, Inc. (a) | 40,900 | 749,697 | ||||||
Rudolph Technologies, Inc. (a) | 24,700 | 302,822 | ||||||
|
| |||||||
| 1,398,307 | ||||||||
|
| |||||||
| Software—0.9% | ||||||||
ePlus, Inc. | 8,100 | 402,813 | ||||||
|
| |||||||
| Specialty Retail—3.0% | ||||||||
Destination Maternity Corp. | 16,600 | 413,506 | ||||||
Kirkland’s, Inc. (a) | 20,000 | 299,200 | ||||||
MarineMax, Inc. (a) | 27,700 | 318,273 | ||||||
Pacific Sunwear of California, Inc. (a) | 79,400 | 261,226 | ||||||
|
| |||||||
| 1,292,205 | ||||||||
|
| |||||||
| Thrifts & Mortgage Finance—3.1% | ||||||||
BofI Holding, Inc. (a) | 13,600 | 636,752 | ||||||
HomeStreet, Inc. | 11,800 | 269,748 | ||||||
Tree.com, Inc. | 20,400 | 402,084 | ||||||
|
| |||||||
| 1,308,584 | ||||||||
|
| |||||||
| Trading Companies & Distributors—1.1% | ||||||||
Aceto Corp. | 36,500 | 464,645 | ||||||
|
| |||||||
| Total Common Stock (cost—$31,362,684) | 41,157,664 | |||||||
|
| |||||||
| Units | Value | |||||||
| Warrants—0.0% | ||||||||
| Oil, Gas & Consumable Fuels—0.0% | ||||||||
Magnum Hunter Resources Corp., | 1,960 | $196 | ||||||
|
| |||||||
| Principal Amount (000s) | ||||||||
| Repurchase Agreements—3.4% | ||||||||
State Street Bank & Trust Co., dated 5/31/13, 0.01%, due 6/3/13, proceeds $1,471,001; collateralized by Federal Home Loan Bank, 3.30%, due 8/27/32, valued at $1,500,581 including accrued interest |
| |||||||
(cost—$1,471,000) | $1,471 | 1,471,000 | ||||||
|
| |||||||
| Total Investments (cost—$32,833,684)—99.9% | 42,628,860 | |||||||
|
| |||||||
| Other assets less liabilities—0.1% | 24,017 | |||||||
|
| |||||||
| Net Assets—100.0% | $42,652,877 | |||||||
|
| |||||||
Notes to Schedule of Investments:
(a) Non-income producing.
Glossary:
ADR—American Depositary Receipt
| 132 | Semiannual Report | | May 31, 2013 | | See accompanying Notes to Financial Statements |
Table of Contents
Schedule of Investments
May 31, 2013 (Unaudited)
AllianzGI U.S. Emerging Growth Fund
| Shares | Value | |||||||
| Common Stock—99.1% | ||||||||
| Aerospace & Defense—0.9% | ||||||||
Triumph Group, Inc. | 3,300 | $256,245 | ||||||
|
| |||||||
| Airlines—0.9% | ||||||||
Spirit Airlines, Inc. (a) | 8,500 | 258,655 | ||||||
|
| |||||||
| Auto Components—1.4% | ||||||||
American Axle & Manufacturing Holdings, Inc. (a) | 12,500 | 222,375 | ||||||
Gentherm, Inc. (a) | 9,700 | 178,674 | ||||||
|
| |||||||
| 401,049 | ||||||||
|
| |||||||
| Automobiles—0.7% | ||||||||
Winnebago Industries, Inc. (a) | 10,200 | 211,752 | ||||||
|
| |||||||
| Biotechnology—2.5% | ||||||||
Alkermes PLC (a) | 6,200 | 193,750 | ||||||
Cubist Pharmaceuticals, Inc. (a) | 3,000 | 164,850 | ||||||
NPS Pharmaceuticals, Inc. (a) | 15,100 | 237,825 | ||||||
Onyx Pharmaceuticals, Inc. (a) | 1,600 | 152,720 | ||||||
|
| |||||||
| 749,145 | ||||||||
|
| |||||||
| Building Products—0.3% | ||||||||
Ply Gem Holdings, Inc. (a) | 4,300 | 99,330 | ||||||
|
| |||||||
| Chemicals—3.6% | ||||||||
Axiall Corp. | 4,000 | 172,600 | ||||||
Chemtura Corp. (a) | 9,100 | 208,663 | ||||||
HB Fuller Co. | 5,700 | 236,949 | ||||||
Olin Corp. | 8,000 | 199,440 | ||||||
PolyOne Corp. | 9,386 | 241,126 | ||||||
|
| |||||||
| 1,058,778 | ||||||||
|
| |||||||
| Commercial Banks—4.7% | ||||||||
Cathay General Bancorp | 9,700 | 196,813 | ||||||
FirstMerit Corp. | 12,634 | 238,404 | ||||||
PrivateBancorp, Inc. | 13,000 | 251,680 | ||||||
Sterling Financial Corp. | 8,600 | 194,532 | ||||||
Susquehanna Bancshares, Inc. | 17,300 | 207,773 | ||||||
Western Alliance Bancorp (a) | 21,300 | 313,110 | ||||||
|
| |||||||
| 1,402,312 | ||||||||
|
| |||||||
| Commercial Services & Supplies—0.6% | ||||||||
Steelcase, Inc., Class A | 13,200 | 182,688 | ||||||
|
| |||||||
| Communications Equipment—1.4% | ||||||||
ARRIS Group, Inc. (a) | 13,600 | 205,768 | ||||||
EchoStar Corp., Class A (a) | 5,500 | 218,405 | ||||||
|
| |||||||
| 424,173 | ||||||||
|
| |||||||
| Computers & Peripherals—1.4% | ||||||||
Electronics for Imaging, Inc. (a) | 7,300 | 203,597 | ||||||
Synaptics, Inc. (a) | 4,800 | 198,048 | ||||||
|
| |||||||
| 401,645 | ||||||||
|
| |||||||
| Construction & Engineering—1.5% | ||||||||
Dycom Industries, Inc. (a) | 8,800 | 200,200 | ||||||
Tutor Perini Corp. (a) | 12,800 | 237,056 | ||||||
|
| |||||||
| 437,256 | ||||||||
|
| |||||||
| Construction Materials—0.7% | ||||||||
Eagle Materials, Inc. | 2,800 | 206,500 | ||||||
|
| |||||||
| Consumer Finance—1.3% | ||||||||
First Cash Financial Services, Inc. (a) | 3,200 | 172,192 | ||||||
Portfolio Recovery Associates, Inc. (a) | 1,400 | 213,178 | ||||||
|
| |||||||
| 385,370 | ||||||||
|
| |||||||
| Distributors—0.9% | ||||||||
Core-Mark Holding Co., Inc. | 4,300 | 254,517 | ||||||
|
| |||||||
| Diversified Telecommunication Services—0.7% | ||||||||
Premiere Global Services, Inc. (a) | 17,600 | 212,080 | ||||||
|
| |||||||
| Shares | Value | |||||||
| Energy Equipment & Services—4.6% | ||||||||
Basic Energy Services, Inc. (a) | 14,300 | $190,905 | ||||||
Geospace Technologies Corp. (a) | 2,400 | 208,464 | ||||||
Helix Energy Solutions Group, Inc. (a) | 9,900 | 236,214 | ||||||
Hercules Offshore, Inc. (a) | 30,500 | 210,755 | ||||||
Hornbeck Offshore Services, Inc. (a) | 5,300 | 275,706 | ||||||
TETRA Technologies, Inc. (a) | 24,500 | 255,045 | ||||||
|
| |||||||
| 1,377,089 | ||||||||
|
| |||||||
| Food Products—2.0% | ||||||||
B&G Foods, Inc. | 6,200 | 178,436 | ||||||
Boulder Brands, Inc. (a) | 18,200 | 190,918 | ||||||
Hain Celestial Group, Inc. (a) | 3,200 | 213,184 | ||||||
|
| |||||||
| 582,538 | ||||||||
|
| |||||||
| Health Care Equipment & Supplies—1.7% | ||||||||
Antares Pharma, Inc. (a) | 38,500 | 156,310 | ||||||
Cynosure, Inc., Class A (a) | 6,500 | 161,915 | ||||||
Endologix, Inc. (a) | 14,900 | 200,256 | ||||||
|
| |||||||
| 518,481 | ||||||||
|
| |||||||
| Health Care Providers & Services—3.5% | ||||||||
Acadia Healthcare Co., Inc. (a) | 7,200 | 240,408 | ||||||
Centene Corp. (a) | 3,600 | 178,200 | ||||||
Hanger, Inc. (a) | 6,800 | 216,988 | ||||||
MWI Veterinary Supply, Inc. (a) | 1,200 | 145,812 | ||||||
Team Health Holdings, Inc. (a) | 6,800 | 265,676 | ||||||
|
| |||||||
| 1,047,084 | ||||||||
|
| |||||||
| Hotels, Restaurants & Leisure—3.1% | ||||||||
Bally Technologies, Inc. (a) | 3,600 | 205,020 | ||||||
Marriott Vacations Worldwide Corp. (a) | 4,400 | 194,700 | ||||||
Six Flags Entertainment Corp. | 4,000 | 298,280 | ||||||
Sonic Corp. (a) | 17,700 | 232,401 | ||||||
|
| |||||||
| 930,401 | ||||||||
|
| |||||||
| Household Durables—2.2% | ||||||||
KB Home | 9,400 | 208,304 | ||||||
Meritage Homes Corp. (a) | 4,400 | 208,384 | ||||||
Ryland Group, Inc. | 5,300 | 239,984 | ||||||
|
| |||||||
| 656,672 | ||||||||
|
| |||||||
| Insurance—2.3% | ||||||||
Amtrust Financial Services, Inc. | 6,500 | 214,695 | ||||||
Hilltop Holdings, Inc. (a) | 13,400 | 214,400 | ||||||
Stewart Information Services Corp. | 8,700 | 240,903 | ||||||
|
| |||||||
| 669,998 | ||||||||
|
| |||||||
| Internet Software & Services—2.2% | ||||||||
Blucora, Inc. (a) | 12,400 | 226,300 | ||||||
Internap Network Services Corp. (a) | 22,200 | 177,156 | ||||||
Web.com Group, Inc. (a) | 11,700 | 245,583 | ||||||
|
| |||||||
| 649,039 | ||||||||
|
| |||||||
| IT Services—1.4% | ||||||||
MAXIMUS, Inc. | 3,300 | 246,279 | ||||||
WEX, Inc. (a) | 2,300 | 169,901 | ||||||
|
| |||||||
| 416,180 | ||||||||
|
| |||||||
| Leisure Equipment & Products—1.3% | ||||||||
Arctic Cat, Inc. | 4,000 | 187,560 | ||||||
Brunswick Corp. | 5,500 | 184,635 | ||||||
|
| |||||||
| 372,195 | ||||||||
|
| |||||||
| Life Sciences Tools & Services—1.9% | ||||||||
Albany Molecular Research, Inc. (a) | 12,100 | 133,100 | ||||||
ICON PLC (a) | 6,700 | 230,078 | ||||||
Parexel International Corp. (a) | 4,700 | 214,743 | ||||||
|
| |||||||
| 577,921 | ||||||||
|
| |||||||
| Shares | Value | |||||||
| Machinery—5.0% | ||||||||
Chart Industries, Inc. (a) | 2,600 | $252,928 | ||||||
Manitowoc Co., Inc. | 14,300 | 300,443 | ||||||
Middleby Corp. (a) | 1,300 | 212,537 | ||||||
Terex Corp. (a) | 6,300 | 225,981 | ||||||
Trimas Corp. (a) | 7,400 | 238,650 | ||||||
Wabash National Corp. (a) | 23,700 | 248,850 | ||||||
|
| |||||||
| 1,479,389 | ||||||||
|
| |||||||
| Media—2.2% | ||||||||
Imax Corp. (a) | 8,000 | 207,280 | ||||||
Lions Gate Entertainment Corp. (a) | 15,100 | 434,880 | ||||||
|
| |||||||
| 642,160 | ||||||||
|
| |||||||
| Metals & Mining—2.3% | ||||||||
Materion Corp. | 7,400 | 220,520 | ||||||
U.S. Silica Holdings, Inc. | 11,000 | 242,990 | ||||||
Worthington Industries, Inc. | 6,300 | 216,594 | ||||||
|
| |||||||
| 680,104 | ||||||||
|
| |||||||
| Oil, Gas & Consumable Fuels—4.0% | ||||||||
Bonanza Creek Energy, Inc. (a) | 8,800 | 326,920 | ||||||
Diamondback Energy, Inc. (a) | 7,100 | 239,767 | ||||||
Kodiak Oil & Gas Corp. (a) | 23,300 | 204,574 | ||||||
Oasis Petroleum, Inc. (a) | 5,800 | 215,528 | ||||||
Rex Energy Corp. (a) | 11,800 | 195,998 | ||||||
|
| |||||||
| 1,182,787 | ||||||||
|
| |||||||
| Paper & Forest Products—1.0% | ||||||||
KapStone Paper and Packaging Corp. | 10,100 | 293,001 | ||||||
|
| |||||||
| Pharmaceuticals—5.3% | ||||||||
Akorn, Inc. (a) | 15,300 | 222,309 | ||||||
Medicines Co. (a) | 6,000 | 193,260 | ||||||
Nektar Therapeutics (a) | 18,400 | 174,248 | ||||||
Pacira Pharmaceuticals, Inc. (a) | 9,100 | 266,630 | ||||||
Salix Pharmaceuticals Ltd. (a) | 3,600 | 218,412 | ||||||
Santarus, Inc. (a) | 13,500 | 300,645 | ||||||
ViroPharma, Inc. (a) | 7,300 | 200,750 | ||||||
|
| |||||||
| 1,576,254 | ||||||||
|
| |||||||
| Professional Services—2.0% | ||||||||
Huron Consulting Group, Inc. (a) | 4,600 | 205,666 | ||||||
On Assignment, Inc. (a) | 7,600 | 197,904 | ||||||
WageWorks, Inc. (a) | 6,500 | 188,305 | ||||||
|
| |||||||
| 591,875 | ||||||||
|
| |||||||
| Road & Rail—4.6% | ||||||||
Arkansas Best Corp. | 7,700 | 146,993 | ||||||
Avis Budget Group, Inc. (a) | 6,800 | 225,488 | ||||||
Genesee & Wyoming, Inc., Class A (a) | 2,700 | 240,435 | ||||||
Roadrunner Transportation Systems, Inc. (a) | 10,200 | 282,540 | ||||||
Ryder System, Inc. | 4,000 | 252,160 | ||||||
Swift Transportation Co. (a) | 13,600 | 229,024 | ||||||
|
| |||||||
| 1,376,640 | ||||||||
|
| |||||||
| Semiconductors & Semiconductor Equipment—3.7% | ||||||||
Kulicke & Soffa Industries, Inc. (a) | 17,100 | 212,040 | ||||||
Lattice Semiconductor Corp. (a) | 36,000 | 185,400 | ||||||
Magnachip Semiconductor Corp. (a) | 11,200 | 207,200 | ||||||
RF Micro Devices, Inc. (a) | 43,600 | 240,672 | ||||||
Semtech Corp. (a) | 6,600 | 241,164 | ||||||
|
| |||||||
| 1,086,476 | ||||||||
|
| |||||||
| Software—7.0% | ||||||||
ACI Worldwide, Inc. (a) | 3,500 | 162,785 | ||||||
Aspen Technology, Inc. (a) | 8,900 | 272,518 | ||||||
| See accompanying Notes to Financial Statements | | May 31, 2013 | | Semiannual Report | 133 |
Table of Contents
Schedule of Investments
May 31, 2013 (Unaudited)
| Shares | Value | |||||||
Cadence Design Systems, Inc. (a) | 15,000 | $226,950 | ||||||
Guidewire Software, Inc. (a) | 5,700 | 233,472 | ||||||
Mentor Graphics Corp. | 15,200 | 288,648 | ||||||
PTC, Inc. (a) | 8,000 | 200,880 | ||||||
Synchronoss Technologies, Inc. (a) | 9,000 | 282,150 | ||||||
Tangoe, Inc. (a) | 12,800 | 190,848 | ||||||
Ultimate Software Group, Inc. (a) | 1,900 | 211,470 | ||||||
|
| |||||||
| 2,069,721 | ||||||||
|
| |||||||
| Specialty Retail—3.2% | ||||||||
Conn’s, Inc. (a) | 7,800 | 383,994 | ||||||
Genesco, Inc. (a) | 2,100 | 141,918 | ||||||
GNC Holdings, Inc., Class A | 5,100 | 229,653 | ||||||
Lithia Motors, Inc., Class A | 3,800 | 197,942 | ||||||
|
| |||||||
| 953,507 | ||||||||
|
| |||||||
| Textiles, Apparel & Luxury Goods—1.3% | ||||||||
Deckers Outdoor Corp. (a) | 3,400 | 182,512 | ||||||
Movado Group, Inc. | 5,800 | 209,380 | ||||||
|
| |||||||
| 391,892 | ||||||||
|
| |||||||
| Thrifts & Mortgage Finance—3.5% | ||||||||
EverBank Financial Corp. | 14,100 | 221,370 | ||||||
Nationstar Mortgage Holdings, Inc. (a) | 8,800 | 358,248 | ||||||
Ocwen Financial Corp. (a) | 7,000 | 299,460 | ||||||
Walker & Dunlop, Inc. (a) | 8,400 | 159,348 | ||||||
|
| |||||||
| 1,038,426 | ||||||||
|
| |||||||
| Trading Companies & Distributors—3.4% | ||||||||
Air Lease Corp. | 8,300 | 232,400 | ||||||
Aircastle Ltd. | 15,200 | 240,464 | ||||||
CAI International, Inc. (a) | 7,500 | 191,850 | ||||||
H&E Equipment Services, Inc. | 7,500 | 167,850 | ||||||
Rush Enterprises, Inc., Class A (a) | 7,300 | 187,610 | ||||||
|
| |||||||
| 1,020,174 | ||||||||
|
| |||||||
| Transportation Infrastructure—0.9% | ||||||||
Macquarie Infrastructure Co. LLC | 4,900 | 266,952 | ||||||
|
| |||||||
| Total Common Stock (cost—$21,757,715) | 29,388,451 | |||||||
|
| |||||||
| Units | ||||||||
| Warrants—0.0% | ||||||||
| Oil, Gas & Consumable Fuels—0.0% | ||||||||
Magnum Hunter Resources Corp., | 2,110 | 211 | ||||||
|
| |||||||
| Total Investments (cost—$21,757,715)—99.1% | 29,388,662 | |||||||
|
| |||||||
| Other assets less liabilities—0.9% | 280,102 | |||||||
|
| |||||||
| Net Assets—100.0% | $29,668,764 | |||||||
|
| |||||||
Notes to Schedule of Investments:
(a) Non-income producing.
AllianzGI U.S. Equity Hedged Fund
| Shares | Value | |||||||
| Common Stock (a)—93.2% | ||||||||
| Aerospace & Defense—2.3% | ||||||||
Boeing Co. | 179 | $17,725 | ||||||
General Dynamics Corp. | 88 | 6,785 | ||||||
Honeywell International, Inc. | 206 | 16,163 | ||||||
L-3 Communications Holdings, Inc. | 23 | 1,957 | ||||||
Lockheed Martin Corp. | 71 | 7,514 | ||||||
Northrop Grumman Corp. | 62 | 5,108 | ||||||
Precision Castparts Corp. | 39 | 8,343 | ||||||
Raytheon Co. | 85 | 5,664 | ||||||
Rockwell Collins, Inc. | 36 | 2,331 | ||||||
Textron, Inc. | 72 | 1,941 | ||||||
United Technologies Corp. | 222 | 21,068 | ||||||
|
| |||||||
| 94,599 | ||||||||
|
| |||||||
| Air Freight & Logistics—0.7% | ||||||||
C.H. Robinson Worldwide, Inc. | 42 | 2,381 | ||||||
Expeditors International of Washington, Inc. | 55 | 2,147 | ||||||
FedEx Corp. | 77 | 7,418 | ||||||
United Parcel Service, Inc., Class B | 188 | 16,149 | ||||||
|
| |||||||
| 28,095 | ||||||||
|
| |||||||
| Airlines—0.1% | ||||||||
Southwest Airlines Co. | 192 | 2,721 | ||||||
|
| |||||||
| Auto Components—0.3% | ||||||||
BorgWarner, Inc. (b) | 30 | 2,432 | ||||||
Delphi Automotive PLC | 77 | 3,758 | ||||||
Goodyear Tire & Rubber Co. (b) | 64 | 969 | ||||||
Johnson Controls, Inc. | 180 | 6,725 | ||||||
|
| |||||||
| 13,884 | ||||||||
|
| |||||||
| Automobiles���0.5% | ||||||||
Ford Motor Co. | 1,031 | 16,166 | ||||||
Harley-Davidson, Inc. | 60 | 3,273 | ||||||
|
| |||||||
| 19,439 | ||||||||
|
| |||||||
| Beverages—2.2% | ||||||||
Beam, Inc. | 42 | 2,723 | ||||||
Brown-Forman Corp., Class B | 40 | 2,753 | ||||||
Coca-Cola Co. | 1,008 | 40,310 | ||||||
Coca-Cola Enterprises, Inc. | 70 | 2,601 | ||||||
Constellation Brands, Inc., Class A (b) | 40 | 2,120 | ||||||
Dr. Pepper Snapple Group, Inc. | 54 | 2,483 | ||||||
Molson Coors Brewing Co., Class B | 41 | 2,026 | ||||||
Monster Beverage Corp. (b) | 38 | 2,074 | ||||||
PepsiCo, Inc. | 406 | 32,793 | ||||||
|
| |||||||
| 89,883 | ||||||||
|
| |||||||
| Biotechnology—1.9% | ||||||||
Alexion Pharmaceuticals, Inc. (b) | 52 | 5,072 | ||||||
Amgen, Inc. | 197 | 19,805 | ||||||
Biogen Idec, Inc. (b) | 62 | 14,724 | ||||||
Celgene Corp. (b) | 111 | 13,725 | ||||||
Gilead Sciences, Inc. (b) | 401 | 21,847 | ||||||
Regeneron Pharmaceuticals, Inc. (b) | 20 | 4,837 | ||||||
|
| |||||||
| 80,010 | ||||||||
|
| |||||||
| Building Products—0.0% | ||||||||
Masco Corp. | 94 | 1,976 | ||||||
|
| |||||||
| Capital Markets—2.1% | ||||||||
Ameriprise Financial, Inc. | 54 | 4,402 | ||||||
Bank of New York Mellon Corp. | 306 | 9,198 | ||||||
BlackRock, Inc. | 32 | 8,934 | ||||||
Charles Schwab Corp. | 289 | 5,740 | ||||||
E*TRADE Financial Corp. (b) | 75 | 872 | ||||||
Franklin Resources, Inc. | 37 | 5,728 | ||||||
Goldman Sachs Group, Inc. | 115 | 18,639 | ||||||
| Shares | Value | |||||||
Invesco Ltd. | 116 | $3,914 | ||||||
Legg Mason, Inc. | 30 | 1,051 | ||||||
Morgan Stanley | 361 | 9,350 | ||||||
Northern Trust Corp. | 57 | 3,315 | ||||||
State Street Corp. | 120 | 7,942 | ||||||
T Rowe Price Group, Inc. | 68 | 5,158 | ||||||
|
| |||||||
| 84,243 | ||||||||
|
| |||||||
| Chemicals—2.3% | ||||||||
Air Products & Chemicals, Inc. | 55 | 5,193 | ||||||
Airgas, Inc. | 18 | 1,852 | ||||||
CF Industries Holdings, Inc. | 16 | 3,055 | ||||||
Dow Chemical Co. | 317 | 10,924 | ||||||
Eastman Chemical Co. | 41 | 2,940 | ||||||
Ecolab, Inc. | 70 | 5,913 | ||||||
EI du Pont de Nemours & Co. | 246 | 13,724 | ||||||
FMC Corp. | 36 | 2,258 | ||||||
International Flavors & Fragrances, Inc. | 21 | 1,686 | ||||||
LyondellBasell Industries NV, Class A | 100 | 6,665 | ||||||
Monsanto Co. | 141 | 14,190 | ||||||
Mosaic Co. | 73 | 4,440 | ||||||
PPG Industries, Inc. | 38 | 5,837 | ||||||
Praxair, Inc. | 78 | 8,918 | ||||||
Sherwin-Williams Co. | 22 | 4,148 | ||||||
Sigma-Aldrich Corp. | 31 | 2,593 | ||||||
|
| |||||||
| 94,336 | ||||||||
|
| |||||||
| Commercial Banks—2.7% | ||||||||
BB&T Corp. | 184 | 6,057 | ||||||
Comerica, Inc. | 49 | 1,935 | ||||||
Fifth Third Bancorp | 231 | 4,204 | ||||||
First Horizon National Corp. | 64 | 735 | ||||||
Huntington Bancshares, Inc. | 222 | 1,721 | ||||||
KeyCorp | 243 | 2,620 | ||||||
M&T Bank Corp. | 32 | 3,357 | ||||||
PNC Financial Services Group, Inc. | 139 | 9,958 | ||||||
Regions Financial Corp. | 372 | 3,396 | ||||||
SunTrust Banks, Inc. | 142 | 4,557 | ||||||
U.S. Bancorp | 490 | 17,179 | ||||||
Wells Fargo & Co. | 1,288 | 52,228 | ||||||
Zions Bancorporation | 48 | 1,346 | ||||||
|
| |||||||
| 109,293 | ||||||||
|
| |||||||
| Commercial Services & Supplies—0.5% | ||||||||
ADT Corp. (b) | 58 | 2,354 | ||||||
Avery Dennison Corp. | 26 | 1,131 | ||||||
Cintas Corp. | 27 | 1,233 | ||||||
Iron Mountain, Inc. | 44 | 1,577 | ||||||
Pitney Bowes, Inc. | 53 | 778 | ||||||
Republic Services, Inc. | 78 | 2,660 | ||||||
Stericycle, Inc. (b) | 23 | 2,524 | ||||||
Tyco International Ltd. | 123 | 4,159 | ||||||
Waste Management, Inc. | 115 | 4,822 | ||||||
|
| |||||||
| 21,238 | ||||||||
|
| |||||||
| Communications Equipment—1.8% | ||||||||
Cisco Systems, Inc. | 1,402 | 33,760 | ||||||
F5 Networks, Inc. (b) | 21 | 1,747 | ||||||
Harris Corp. | 29 | 1,454 | ||||||
JDS Uniphase Corp. (b) | 62 | 845 | ||||||
Juniper Networks, Inc. (b) | 136 | 2,411 | ||||||
Motorola Solutions, Inc. | 73 | 4,231 | ||||||
QUALCOMM, Inc. | 452 | 28,693 | ||||||
|
| |||||||
| 73,141 | ||||||||
|
| |||||||
| Computers & Peripherals—3.8% | ||||||||
Apple, Inc. | 247 | 111,071 | ||||||
Dell, Inc. | 384 | 5,127 | ||||||
EMC Corp. (b) | 554 | 13,717 | ||||||
Hewlett-Packard Co. | 514 | 12,552 | ||||||
NetApp, Inc. (b) | 95 | 3,565 | ||||||
SanDisk Corp. (b) | 64 | 3,777 | ||||||
Seagate Technology PLC | 84 | 3,619 | ||||||
| 134 | Semiannual Report | | May 31, 2013 | | See accompanying Notes to Financial Statements |
Table of Contents
Schedule of Investments
May 31, 2013 (Unaudited)
| Shares | Value | |||||||
Western Digital Corp. | 57 | $3,609 | ||||||
|
| |||||||
| 157,037 | ||||||||
|
| |||||||
| Construction & Engineering—0.2% | ||||||||
Fluor Corp. | 43 | 2,718 | ||||||
Jacobs Engineering Group, Inc. (b) | 35 | 1,995 | ||||||
Quanta Services, Inc. (b) | 56 | 1,589 | ||||||
|
| |||||||
| 6,302 | ||||||||
|
| |||||||
| Construction Materials—0.0% | ||||||||
Vulcan Materials Co. | 33 | 1,768 | ||||||
|
| |||||||
| Consumer Finance—0.9% | ||||||||
American Express Co. | 253 | 19,155 | ||||||
Capital One Financial Corp. | 154 | 9,383 | ||||||
Discover Financial Services | 131 | 6,211 | ||||||
SLM Corp. | 119 | 2,825 | ||||||
|
| |||||||
| 37,574 | ||||||||
|
| |||||||
| Containers & Packaging—0.1% | ||||||||
Ball Corp. | 39 | 1,683 | ||||||
Bemis Co., Inc. | 27 | 1,057 | ||||||
Owens-Illinois, Inc. (b) | 43 | 1,181 | ||||||
Sealed Air Corp. | 52 | 1,249 | ||||||
|
| |||||||
| 5,170 | ||||||||
|
| |||||||
| Distribution/Wholesale—0.0% | ||||||||
Fossil Group, Inc. (b) | 13 | 1,381 | ||||||
|
| |||||||
| Distributors—0.1% | ||||||||
Genuine Parts Co. | 41 | 3,187 | ||||||
|
| |||||||
| Diversified Consumer Services—0.1% | ||||||||
Apollo Group, Inc., Class A (b) | 26 | 520 | ||||||
H&R Block, Inc. | 72 | 2,107 | ||||||
|
| |||||||
| 2,627 | ||||||||
|
| |||||||
| Diversified Financial Services—3.8% | ||||||||
Bank of America Corp. | 2,843 | 38,835 | ||||||
Citigroup, Inc. | 799 | 41,540 | ||||||
CME Group, Inc. | 81 | 5,502 | ||||||
IntercontinentalExchange, Inc. (b) | 19 | 3,253 | ||||||
JPMorgan Chase & Co. | 1,007 | 54,972 | ||||||
Leucadia National Corp. | 77 | 2,416 | ||||||
McGraw Hill Financial, Inc. | 74 | 4,037 | ||||||
Moody’s Corp. | 50 | 3,322 | ||||||
NASDAQ OMX Group, Inc. | 30 | 944 | ||||||
NYSE Euronext | 64 | 2,575 | ||||||
|
| |||||||
| 157,396 | ||||||||
|
| |||||||
| Diversified Telecommunication Services—2.3% | ||||||||
AT&T, Inc. | 1,444 | 50,525 | ||||||
CenturyLink, Inc. | 165 | 5,635 | ||||||
Frontier Communications Corp. | 263 | 1,089 | ||||||
Verizon Communications, Inc. | 751 | 36,408 | ||||||
Windstream Corp. | 156 | 1,253 | ||||||
|
| |||||||
| 94,910 | ||||||||
|
| |||||||
| Electric Utilities—1.7% | ||||||||
American Electric Power Co., Inc. | 129 | 5,911 | ||||||
Duke Energy Corp. | 185 | 12,382 | ||||||
Edison International | 87 | 3,997 | ||||||
Entergy Corp. | 47 | 3,237 | ||||||
Exelon Corp. | 225 | 7,052 | ||||||
FirstEnergy Corp. | 111 | 4,330 | ||||||
NextEra Energy, Inc. | 112 | 8,469 | ||||||
Northeast Utilities | 83 | 3,459 | ||||||
Pepco Holdings, Inc. | 65 | 1,350 | ||||||
Pinnacle West Capital Corp. | 28 | 1,581 | ||||||
PPL Corp. | 154 | 4,574 | ||||||
Southern Co. | 228 | 10,009 | ||||||
Xcel Energy, Inc. | 129 | 3,705 | ||||||
|
| |||||||
| 70,056 | ||||||||
|
| |||||||
| Shares | Value | |||||||
| Electrical Equipment—0.6% | ||||||||
Eaton Corp. PLC | 124 | $8,191 | ||||||
Emerson Electric Co. | 191 | 10,975 | ||||||
Rockwell Automation, Inc. | 37 | 3,257 | ||||||
Roper Industries, Inc. | 26 | 3,230 | ||||||
|
| |||||||
| 25,653 | ||||||||
|
| |||||||
| Electronic Equipment, Instruments & Components—0.4% | ||||||||
Amphenol Corp., Class A | 42 | 3,272 | ||||||
Corning, Inc. | 387 | 5,948 | ||||||
FLIR Systems, Inc. | 38 | 926 | ||||||
Jabil Circuit, Inc. | 48 | 963 | ||||||
Molex, Inc. | 37 | 1,085 | ||||||
TE Connectivity Ltd. | 111 | 4,927 | ||||||
|
| |||||||
| 17,121 | ||||||||
|
| |||||||
| Energy Equipment & Services—1.7% | ||||||||
Baker Hughes, Inc. | 117 | 5,321 | ||||||
Cameron International Corp. (b) | 65 | 3,957 | ||||||
Diamond Offshore Drilling, Inc. | 18 | 1,239 | ||||||
Ensco PLC, Class A | 61 | 3,670 | ||||||
FMC Technologies, Inc. (b) | 62 | 3,451 | ||||||
Halliburton Co. | 245 | 10,253 | ||||||
Helmerich & Payne, Inc. | 28 | 1,729 | ||||||
Nabors Industries Ltd. | 77 | 1,233 | ||||||
National Oilwell Varco, Inc. | 113 | 7,944 | ||||||
Noble Corp. | 66 | 2,557 | ||||||
Rowan Cos. PLC, Class A (b) | 32 | 1,064 | ||||||
Schlumberger Ltd. | 349 | 25,487 | ||||||
|
| |||||||
| 67,905 | ||||||||
|
| |||||||
| Food & Staples Retailing—2.2% | ||||||||
Costco Wholesale Corp. | 115 | 12,612 | ||||||
CVS Caremark Corp. | 324 | 18,656 | ||||||
Kroger Co. | 137 | 4,613 | ||||||
Safeway, Inc. | 63 | 1,449 | ||||||
Sysco Corp. | 155 | 5,239 | ||||||
Wal-Mart Stores, Inc. | 439 | 32,855 | ||||||
Walgreen Co. | 226 | 10,794 | ||||||
Whole Foods Market, Inc. | 91 | 4,719 | ||||||
|
| |||||||
| 90,937 | ||||||||
|
| |||||||
| Food Products—1.7% | ||||||||
Archer-Daniels-Midland Co. | 174 | 5,608 | ||||||
Campbell Soup Co. | 47 | 2,012 | ||||||
ConAgra Foods, Inc. | 110 | 3,706 | ||||||
General Mills, Inc. | 171 | 8,051 | ||||||
Hershey Co. | 40 | 3,564 | ||||||
HJ Heinz Co. | 84 | 6,078 | ||||||
Hormel Foods Corp. | 36 | 1,434 | ||||||
JM Smucker Co. | 28 | 2,827 | ||||||
Kellogg Co. | 65 | 4,033 | ||||||
Kraft Foods Group, Inc. | 156 | 8,600 | ||||||
McCormick & Co., Inc. | 35 | 2,418 | ||||||
Mead Johnson Nutrition Co. | 54 | 4,378 | ||||||
Mondelez International, Inc., Class A | 468 | 13,787 | ||||||
Tyson Foods, Inc., Class A | 75 | 1,875 | ||||||
|
| |||||||
| 68,371 | ||||||||
|
| |||||||
| Gas Utilities—0.1% | ||||||||
AGL Resources, Inc. | 30 | 1,270 | ||||||
ONEOK, Inc. | 54 | 2,438 | ||||||
|
| |||||||
| 3,708 | ||||||||
|
| |||||||
| Health Care Equipment & Supplies—2.0% | ||||||||
Abbott Laboratories | 413 | 15,145 | ||||||
Baxter International, Inc. | 144 | 10,128 | ||||||
Becton Dickinson and Co. | 52 | 5,128 | ||||||
Boston Scientific Corp. (b) | 358 | 3,308 | ||||||
CareFusion Corp. (b) | 59 | 2,168 | ||||||
Covidien PLC | 124 | 7,886 | ||||||
CR Bard, Inc. | 20 | 2,062 | ||||||
DENTSPLY International, Inc. | 38 | 1,587 | ||||||
| Shares | Value | |||||||
Edwards Lifesciences Corp. (b) | 30 | $1,994 | ||||||
Intuitive Surgical, Inc. (b) | 10 | 4,975 | ||||||
Medtronic, Inc. | 266 | 13,569 | ||||||
St. Jude Medical, Inc. | 75 | 3,242 | ||||||
Stryker Corp. | 76 | 5,046 | ||||||
Varian Medical Systems, Inc. (b) | 28 | 1,876 | ||||||
Zimmer Holdings, Inc. | 44 | 3,454 | ||||||
|
| |||||||
| 81,568 | ||||||||
|
| |||||||
| Health Care Providers & Services—1.8% | ||||||||
Aetna, Inc. | 100 | 6,038 | ||||||
AmerisourceBergen Corp. | 61 | 3,299 | ||||||
Cardinal Health, Inc. | 90 | 4,226 | ||||||
Cigna Corp. | 76 | 5,160 | ||||||
DaVita HealthCare Partners, Inc. (b) | 22 | 2,730 | ||||||
Express Scripts Holding Co. (b) | 216 | 13,418 | ||||||
Humana, Inc. | 42 | 3,393 | ||||||
Laboratory Corp. of America Holdings (b) | 24 | 2,388 | ||||||
McKesson Corp. | 61 | 6,945 | ||||||
Patterson Cos., Inc. | 22 | 860 | ||||||
Quest Diagnostics, Inc. | 42 | 2,597 | ||||||
Tenet Healthcare Corp. (b) | 27 | 1,279 | ||||||
UnitedHealth Group, Inc. | 269 | 16,847 | ||||||
WellPoint, Inc. | 80 | 6,158 | ||||||
|
| |||||||
| 75,338 | ||||||||
|
| |||||||
| Health Care Technology—0.1% | ||||||||
Cerner Corp. (b) | 39 | 3,833 | ||||||
|
| |||||||
| Hotels, Restaurants & Leisure—1.6% | ||||||||
Carnival Corp. | 117 | 3,873 | ||||||
Chipotle Mexican Grill, Inc. (b) | 8 | 2,888 | ||||||
Darden Restaurants, Inc. | 33 | 1,709 | ||||||
International Game Technology | 70 | 1,252 | ||||||
Marriott International, Inc., Class A | 64 | 2,689 | ||||||
McDonald’s Corp. | 264 | 25,494 | ||||||
Starbucks Corp. | 197 | 12,425 | ||||||
Starwood Hotels & Resorts Worldwide, Inc. | 50 | 3,415 | ||||||
Wyndham Worldwide Corp. | 36 | 2,092 | ||||||
Wynn Resorts Ltd. | 21 | 2,854 | ||||||
Yum! Brands, Inc. | 119 | 8,062 | ||||||
|
| |||||||
| 66,753 | ||||||||
|
| |||||||
| Household Durables—0.3% | ||||||||
DR Horton, Inc. | 74 | 1,802 | ||||||
Garmin Ltd. | 28 | 978 | ||||||
Harman International Industries, Inc. | 18 | 956 | ||||||
Leggett & Platt, Inc. | 38 | 1,216 | ||||||
Lennar Corp., Class A | 43 | 1,691 | ||||||
Newell Rubbermaid, Inc. | 76 | 2,055 | ||||||
PulteGroup, Inc. (b) | 90 | 1,943 | ||||||
Whirlpool Corp. | 21 | 2,683 | ||||||
|
| |||||||
| 13,324 | ||||||||
|
| |||||||
| Household Products—2.0% | ||||||||
Clorox Co. | 35 | 2,908 | ||||||
Colgate-Palmolive Co. | 232 | 13,419 | ||||||
Kimberly-Clark Corp. | 102 | 9,876 | ||||||
Procter & Gamble Co. | 718 | 55,114 | ||||||
|
| |||||||
| 81,317 | ||||||||
|
| |||||||
| Independent Power Producers & Energy Traders—0.1% | ||||||||
AES Corp. | 163 | 1,989 | ||||||
NRG Energy, Inc. | 85 | 2,169 | ||||||
|
| |||||||
| 4,158 | ||||||||
|
| |||||||
| Industrial Conglomerates—2.2% | ||||||||
3M Co. | 167 | 18,415 | ||||||
Danaher Corp. | 153 | 9,458 | ||||||
General Electric Co. | 2,733 | 63,734 | ||||||
|
| |||||||
| 91,607 | ||||||||
|
| |||||||
| See accompanying Notes to Financial Statements | | May 31, 2013 | | Semiannual Report | 135 |
Table of Contents
Schedule of Investments
May 31, 2013 (Unaudited)
| Shares | Value | |||||||
| Insurance—4.0% | ||||||||
ACE Ltd. | 90 | $8,071 | ||||||
Aflac, Inc. | 123 | 6,850 | ||||||
Allstate Corp. | 125 | 6,030 | ||||||
American International Group, Inc. (b) | 388 | 17,250 | ||||||
Aon PLC | 82 | 5,221 | ||||||
Assurant, Inc. | 21 | 1,045 | ||||||
Berkshire Hathaway, Inc., Class B (b) | 479 | 54,640 | ||||||
Chubb Corp. | 68 | 5,923 | ||||||
Cincinnati Financial Corp. | 39 | 1,846 | ||||||
Genworth Financial, Inc., Class A (b) | 130 | 1,405 | ||||||
Hartford Financial Services Group, Inc. | 114 | 3,492 | ||||||
Lincoln National Corp. | 72 | 2,567 | ||||||
Loews Corp. | 81 | 3,711 | ||||||
Marsh & McLennan Cos., Inc. | 144 | 5,763 | ||||||
MetLife, Inc. | 288 | 12,732 | ||||||
Principal Financial Group, Inc. | 73 | 2,763 | ||||||
Progressive Corp. | 146 | 3,722 | ||||||
Prudential Financial, Inc. | 122 | 8,414 | ||||||
Torchmark Corp. | 24 | 1,548 | ||||||
Travelers Cos., Inc. | 100 | 8,372 | ||||||
Unum Group | 72 | 2,051 | ||||||
XL Group PLC | 78 | 2,452 | ||||||
|
| |||||||
| 165,868 | ||||||||
|
| |||||||
| Internet & Catalog Retail—1.0% | ||||||||
Amazon.com, Inc. (b) | 96 | 25,827 | ||||||
Expedia, Inc. | 24 | 1,379 | ||||||
Netflix, Inc. (b) | 14 | 3,168 | ||||||
priceline.com, Inc. (b) | 12 | 9,647 | ||||||
TripAdvisor, Inc. (b) | 29 | 1,870 | ||||||
|
| |||||||
| 41,891 | ||||||||
|
| |||||||
| Internet Software & Services—2.2% | ||||||||
Akamai Technologies, Inc. (b) | 47 | 2,168 | ||||||
eBay, Inc. (b) | 307 | 16,609 | ||||||
Google, Inc., Class A (b) | 71 | 61,799 | ||||||
VeriSign, Inc. (b) | 40 | 1,882 | ||||||
Yahoo!, Inc. (b) | 255 | 6,706 | ||||||
|
| |||||||
| 89,164 | ||||||||
|
| |||||||
| IT Services—3.5% | ||||||||
Accenture PLC, Class A | 170 | 13,959 | ||||||
Automatic Data Processing, Inc. | 128 | 8,796 | ||||||
Cognizant Technology Solutions Corp., Class A (b) | 80 | 5,172 | ||||||
Computer Sciences Corp. | 40 | 1,784 | ||||||
Fidelity National Information Services, Inc. | 77 | 3,457 | ||||||
Fiserv, Inc. (b) | 35 | 3,051 | ||||||
International Business Machines Corp. | 276 | 57,414 | ||||||
Mastercard, Inc., Class A | 27 | 15,397 | ||||||
Paychex, Inc. | 85 | 3,165 | ||||||
SAIC, Inc. | 75 | 1,087 | ||||||
Teradata Corp. (b) | 43 | 2,397 | ||||||
Total System Services, Inc. | 42 | 987 | ||||||
Visa, Inc., Class A | 136 | 24,227 | ||||||
Western Union Co. | 150 | 2,457 | ||||||
|
| |||||||
| 143,350 | ||||||||
|
| |||||||
| Leisure Equipment & Products—0.1% | ||||||||
Hasbro, Inc. | 30 | 1,335 | ||||||
Mattel, Inc. | 91 | 4,072 | ||||||
|
| |||||||
| 5,407 | ||||||||
|
| |||||||
| Life Sciences Tools & Services—0.5% | ||||||||
Agilent Technologies, Inc. | 92 | 4,181 | ||||||
Life Technologies Corp. (b) | 45 | 3,335 | ||||||
PerkinElmer, Inc. | 29 | 908 | ||||||
Thermo Fisher Scientific, Inc. | 94 | 8,300 | ||||||
| Shares | Value | |||||||
Waters Corp. (b) | 22 | $2,128 | ||||||
|
| |||||||
| 18,852 | ||||||||
|
| |||||||
| Machinery—1.7% | ||||||||
Caterpillar, Inc. | 173 | 14,843 | ||||||
Cummins, Inc. | 46 | 5,503 | ||||||
Deere & Co. | 102 | 8,885 | ||||||
Dover Corp. | 46 | 3,600 | ||||||
Flowserve Corp. | 12 | 2,018 | ||||||
Illinois Tool Works, Inc. | 110 | 7,714 | ||||||
Ingersoll-Rand PLC | 73 | 4,200 | ||||||
Joy Global, Inc. | 28 | 1,514 | ||||||
PACCAR, Inc. | 93 | 4,985 | ||||||
Pall Corp. | 29 | 1,978 | ||||||
Parker Hannifin Corp. | 39 | 3,891 | ||||||
Pentair Ltd. | 55 | 3,203 | ||||||
Snap-on, Inc. | 15 | 1,366 | ||||||
Stanley Black & Decker, Inc. | 42 | 3,327 | ||||||
Xylem, Inc. | 49 | 1,379 | ||||||
|
| |||||||
| 68,406 | ||||||||
|
| |||||||
| Media—3.3% | ||||||||
Cablevision Systems Corp., Class A | 57 | 862 | ||||||
CBS Corp., Class B | 154 | 7,623 | ||||||
Comcast Corp., Class A | 694 | 27,864 | ||||||
DIRECTV (b) | 151 | 9,231 | ||||||
Discovery Communications, Inc., Class A (b) | 64 | 5,047 | ||||||
Gannett Co., Inc. | 60 | 1,290 | ||||||
Interpublic Group of Cos., Inc. | 110 | 1,564 | ||||||
News Corp., Class A | 526 | 16,890 | ||||||
Omnicom Group, Inc. | 68 | 4,225 | ||||||
Scripps Networks Interactive, Inc., Class A | 23 | 1,549 | ||||||
Time Warner Cable, Inc. | 78 | 7,450 | ||||||
Time Warner, Inc. | 246 | 14,359 | ||||||
Viacom, Inc., Class B | 120 | 7,907 | ||||||
Walt Disney Co. | 475 | 29,963 | ||||||
Washington Post Co., Class B | 1 | 467 | ||||||
|
| |||||||
| 136,291 | ||||||||
|
| |||||||
| Metals & Mining—0.5% | ||||||||
Alcoa, Inc. | 282 | 2,397 | ||||||
Allegheny Technologies, Inc. | 28 | 772 | ||||||
Cliffs Natural Resources, Inc. | 40 | 722 | ||||||
Freeport-McMoRan Copper & Gold, Inc. | 274 | 8,508 | ||||||
Newmont Mining Corp. | 131 | 4,491 | ||||||
Nucor Corp. | 83 | 3,694 | ||||||
U.S. Steel Corp. | 38 | 672 | ||||||
|
| |||||||
| 21,256 | ||||||||
|
| |||||||
| Multi-line Retail—0.8% | ||||||||
Dollar General Corp. (b) | 80 | 4,224 | ||||||
Dollar Tree, Inc. (b) | 60 | 2,883 | ||||||
Family Dollar Stores, Inc. | 25 | 1,529 | ||||||
JC Penney Co., Inc. | 38 | 668 | ||||||
Kohl’s Corp. | 56 | 2,879 | ||||||
Macy’s, Inc. | 104 | 5,027 | ||||||
Nordstrom, Inc. | 39 | 2,294 | ||||||
Target Corp. | 172 | 11,954 | ||||||
|
| |||||||
| 31,458 | ||||||||
|
| |||||||
| Multi-Utilities—1.1% | ||||||||
Ameren Corp. | 64 | 2,179 | ||||||
CenterPoint Energy, Inc. | 113 | 2,619 | ||||||
CMS Energy Corp. | 70 | 1,887 | ||||||
Consolidated Edison, Inc. | 77 | 4,394 | ||||||
Dominion Resources, Inc. | 152 | 8,596 | ||||||
DTE Energy Co. | 45 | 2,997 | ||||||
Integrys Energy Group, Inc. | 21 | 1,208 | ||||||
NiSource, Inc. | 82 | 2,356 | ||||||
PG&E Corp. | 116 | 5,210 | ||||||
| Shares | Value | |||||||
Public Service Enterprise Group, Inc. | 134 | $4,427 | ||||||
SCANA Corp. | 37 | 1,866 | ||||||
Sempra Energy | 60 | 4,878 | ||||||
TECO Energy, Inc. | 54 | 951 | ||||||
Wisconsin Energy Corp. | 60 | 2,449 | ||||||
|
| |||||||
| 46,017 | ||||||||
|
| |||||||
| Office Electronics—0.1% | ||||||||
Xerox Corp. | 322 | 2,830 | ||||||
|
| |||||||
| Oil, Gas & Consumable Fuels—8.2% | ||||||||
Anadarko Petroleum Corp. | 132 | 11,546 | ||||||
Apache Corp. | 103 | 8,459 | ||||||
Cabot Oil & Gas Corp. | 56 | 3,940 | ||||||
Chesapeake Energy Corp. | 137 | 2,992 | ||||||
Chevron Corp. | 511 | 62,725 | ||||||
ConocoPhillips | 321 | 19,690 | ||||||
CONSOL Energy, Inc. | 60 | 2,081 | ||||||
Denbury Resources, Inc. (b) | 98 | 1,798 | ||||||
Devon Energy Corp. | 99 | 5,628 | ||||||
EOG Resources, Inc. | 72 | 9,295 | ||||||
EQT Corp. | 40 | 3,195 | ||||||
Exxon Mobil Corp. | 1,178 | 106,574 | ||||||
Hess Corp. | 78 | 5,258 | ||||||
Kinder Morgan, Inc. | 166 | 6,305 | ||||||
Marathon Oil Corp. | 186 | 6,397 | ||||||
Marathon Petroleum Corp. | 88 | 7,260 | ||||||
Murphy Oil Corp. | 47 | 2,976 | ||||||
Newfield Exploration Co. (b) | 36 | 857 | ||||||
Noble Energy, Inc. | 95 | 5,477 | ||||||
Occidental Petroleum Corp. | 213 | 19,611 | ||||||
Peabody Energy Corp. | 71 | 1,397 | ||||||
Phillips 66 | 163 | 10,851 | ||||||
Pioneer Natural Resources Co. | 35 | 4,854 | ||||||
QEP Resources, Inc. | 47 | 1,333 | ||||||
Range Resources Corp. | 43 | 3,233 | ||||||
Southwestern Energy Co. (b) | 93 | 3,505 | ||||||
Spectra Energy Corp. | 176 | 5,380 | ||||||
Tesoro Corp. | 36 | 2,219 | ||||||
Valero Energy Corp. | 145 | 5,891 | ||||||
Williams Cos., Inc. | 180 | 6,332 | ||||||
WPX Energy, Inc. (b) | 53 | 1,021 | ||||||
|
| |||||||
| 338,080 | ||||||||
|
| |||||||
| Paper & Forest Products—0.2% | ||||||||
International Paper Co. | 116 | 5,353 | ||||||
MeadWestvaco Corp. | 46 | 1,610 | ||||||
|
| |||||||
| 6,963 | ||||||||
|
| |||||||
| Personal Products—0.2% | ||||||||
Avon Products, Inc. | 114 | 2,687 | ||||||
Estee Lauder Cos., Inc., Class A | 63 | 4,270 | ||||||
|
| |||||||
| 6,957 | ||||||||
|
| |||||||
| Pharmaceuticals—5.4% | ||||||||
AbbVie, Inc. | 415 | 17,716 | ||||||
Actavis, Inc. (b) | 33 | 4,069 | ||||||
Allergan, Inc. | 81 | 8,059 | ||||||
Bristol-Myers Squibb Co. | 431 | 19,830 | ||||||
Eli Lilly & Co. | 263 | 13,981 | ||||||
Forest Laboratories, Inc. (b) | 62 | 2,464 | ||||||
Hospira, Inc. (b) | 43 | 1,491 | ||||||
Johnson & Johnson | 735 | 61,872 | ||||||
Merck & Co., Inc. | 794 | 37,080 | ||||||
Mylan, Inc. (b) | 104 | 3,170 | ||||||
Perrigo Co. | 23 | 2,666 | ||||||
Pfizer, Inc. | 1,890 | 51,465 | ||||||
|
| |||||||
| 223,863 | ||||||||
|
| |||||||
| Professional Services—0.1% | ||||||||
Dun & Bradstreet Corp. | 10 | 981 | ||||||
Equifax, Inc. | 31 | 1,888 | ||||||
Robert Half International, Inc. | 37 | 1,286 | ||||||
|
| |||||||
| 4,155 | ||||||||
|
| |||||||
| 136 | Semiannual Report | | May 31, 2013 | | See accompanying Notes to Financial Statements |
Table of Contents
Schedule of Investments
May 31, 2013 (Unaudited)
| Shares | Value | |||||||
| Real Estate Investment Trust—2.0% | ||||||||
American Tower Corp. | 104 | $8,095 | ||||||
Apartment Investment & Management Co., Class A | 38 | 1,150 | ||||||
AvalonBay Communities, Inc. | 29 | 3,847 | ||||||
Boston Properties, Inc. | 40 | 4,263 | ||||||
Equity Residential | 84 | 4,750 | ||||||
HCP, Inc. | 119 | 5,638 | ||||||
Health Care REIT, Inc. | 74 | 5,034 | ||||||
Host Hotels & Resorts, Inc. | 192 | 3,416 | ||||||
Kimco Realty Corp. | 108 | 2,392 | ||||||
Macerich Co. | 36 | 2,337 | ||||||
Plum Creek Timber Co., Inc. | 43 | 2,051 | ||||||
Prologis, Inc. | 130 | 5,239 | ||||||
Public Storage | 38 | 5,769 | ||||||
Simon Property Group, Inc. | 82 | 13,648 | ||||||
Ventas, Inc. | 77 | 5,496 | ||||||
Vornado Realty Trust | 44 | 3,518 | ||||||
Weyerhaeuser Co. | 143 | 4,264 | ||||||
|
| |||||||
| 80,907 | ||||||||
|
| |||||||
| Real Estate Management & Development—0.0% | ||||||||
CBRE Group, Inc., Class A (b) | 80 | 1,854 | ||||||
|
| |||||||
| Road & Rail—0.9% | ||||||||
CSX Corp. | 268 | 6,756 | ||||||
Kansas City Southern | 29 | 3,210 | ||||||
Norfolk Southern Corp. | 83 | 6,357 | ||||||
Ryder System, Inc. | 13 | 820 | ||||||
Union Pacific Corp. | 123 | 19,018 | ||||||
|
| |||||||
| 36,161 | ||||||||
|
| |||||||
| Semiconductors & Semiconductor Equipment—1.9% | ||||||||
Advanced Micro Devices, Inc. (b) | 160 | 640 | ||||||
Altera Corp. | 84 | 2,788 | ||||||
Analog Devices, Inc. | 81 | 3,720 | ||||||
Applied Materials, Inc. | 316 | 4,803 | ||||||
Broadcom Corp., Class A | 138 | 4,956 | ||||||
First Solar, Inc. (b) | 15 | 816 | ||||||
Intel Corp. | 1,300 | 31,564 | ||||||
KLA-Tencor Corp. | 44 | 2,477 | ||||||
Lam Research Corp. (b) | 43 | 2,012 | ||||||
Linear Technology Corp. | 61 | 2,287 | ||||||
LSI Corp. (b) | 145 | 1,073 | ||||||
Microchip Technology, Inc. | 52 | 1,897 | ||||||
Micron Technology, Inc. (b) | 269 | 3,142 | ||||||
NVIDIA Corp. | 164 | 2,376 | ||||||
Teradyne, Inc. (b) | 50 | 897 | ||||||
Texas Instruments, Inc. | 290 | 10,408 | ||||||
Xilinx, Inc. | 68 | 2,764 | ||||||
|
| |||||||
| 78,620 | ||||||||
|
| |||||||
| Software—3.3% | ||||||||
Adobe Systems, Inc. (b) | 132 | 5,664 | ||||||
Autodesk, Inc. (b) | 59 | 2,226 | ||||||
BMC Software, Inc. (b) | 35 | 1,585 | ||||||
CA, Inc. | 88 | 2,403 | ||||||
Citrix Systems, Inc. (b) | 49 | 3,153 | ||||||
Electronic Arts, Inc. (b) | 79 | 1,816 | ||||||
Intuit, Inc. | 74 | 4,325 | ||||||
Microsoft Corp. | 1,981 | 69,097 | ||||||
Oracle Corp. | 971 | 32,781 | ||||||
Red Hat, Inc. (b) | 50 | 2,412 | ||||||
Salesforce.com, Inc. (b) | 143 | 6,053 | ||||||
Symantec Corp. (b) | 181 | 4,053 | ||||||
|
| |||||||
| 135,568 | ||||||||
|
| |||||||
| Specialty Retail—2.2% | ||||||||
Abercrombie & Fitch Co., Class A | 21 | 1,052 | ||||||
AutoNation, Inc. (b) | 10 | 463 | ||||||
AutoZone, Inc. (b) | 9 | 3,680 | ||||||
Bed Bath & Beyond, Inc. (b) | 60 | 4,095 | ||||||
Best Buy Co., Inc. | 71 | 1,956 | ||||||
CarMax, Inc. (b) | 60 | 2,806 | ||||||
| Shares | Value | |||||||
GameStop Corp., Class A | 31 | $1,028 | ||||||
Gap, Inc. | 78 | 3,163 | ||||||
Home Depot, Inc. | 393 | 30,913 | ||||||
L Brands, Inc. | 63 | 3,151 | ||||||
Lowe’s Cos., Inc. | 292 | 12,296 | ||||||
O’Reilly Automotive, Inc. (b) | 29 | 3,158 | ||||||
PetSmart, Inc. | 28 | 1,890 | ||||||
Ross Stores, Inc. | 59 | 3,794 | ||||||
Staples, Inc. | 178 | 2,670 | ||||||
Tiffany & Co. | 31 | 2,411 | ||||||
TJX Cos., Inc. | 192 | 9,717 | ||||||
Urban Outfitters, Inc. (b) | 28 | 1,174 | ||||||
|
| |||||||
| 89,417 | ||||||||
|
| |||||||
| Textiles, Apparel & Luxury Goods—0.6% | ||||||||
Coach, Inc. | 74 | 4,311 | ||||||
NIKE, Inc., Class B | 192 | 11,839 | ||||||
PVH Corp. | 21 | 2,419 | ||||||
Ralph Lauren Corp. | 15 | 2,626 | ||||||
V.F. Corp. | 23 | 4,229 | ||||||
|
| |||||||
| 25,424 | ||||||||
|
| |||||||
| Thrifts & Mortgage Finance—0.1% | ||||||||
Hudson City Bancorp, Inc. | 125 | 1,063 | ||||||
People’s United Financial, Inc. | 90 | 1,238 | ||||||
|
| |||||||
| 2,301 | ||||||||
|
| |||||||
| Tobacco—1.6% | ||||||||
Altria Group, Inc. | 529 | 19,097 | ||||||
Lorillard, Inc. | 100 | 4,244 | ||||||
Philip Morris International, Inc. | 433 | 39,364 | ||||||
Reynolds American, Inc. | 85 | 4,089 | ||||||
|
| |||||||
| 66,794 | ||||||||
|
| |||||||
| Trading Companies & Distributors—0.2% | ||||||||
Fastenal Co. | 72 | 3,757 | ||||||
WW Grainger, Inc. | 15 | 3,862 | ||||||
|
| |||||||
| 7,619 | ||||||||
|
| |||||||
| Wireless Telecommunication Services—0.3% | ||||||||
Crown Castle International Corp. (b) | 77 | 5,486 | ||||||
Sprint Nextel Corp. (b) | 791 | 5,775 | ||||||
|
| |||||||
| 11,261 | ||||||||
|
| |||||||
| Total Common Stock (cost—$3,369,942) | 3,828,593 | |||||||
|
| |||||||
| Principal Amount (000s) | ||||||||
| Repurchase Agreements—10.5% | ||||||||
State Street Bank & Trust Co., dated 5/31/13, 0.01%, due 6/3/13, proceeds $433,000; collateralized by Federal Home Loan Bank, 5.50%, due 7/15/36, valued at $442,444 including accrued interest |
| |||||||
(cost—$433,000) | $433 | 433,000 | ||||||
|
| |||||||
| Contracts | ||||||||
| Options Purchased (b)(c)—0.8% | ||||||||
| Put Options—0.8% | ||||||||
S&P 500 Index, | ||||||||
strike price $1,375.00, expires 9/21/13 | 4 | 3,280 | ||||||
strike price $1,300.00, expires 12/21/13 | 7 | 7,840 | ||||||
strike price $1,275.00, expires 1/18/14 | 7 | 9,485 | ||||||
strike price $1,400.00, expires 3/22/14 | 2 | 6,450 | ||||||
| Contracts | Value | |||||||
strike price $1,475.00, expires 6/21/14 | 1 | $6,980 | ||||||
S&P 500 PM Index, | ||||||||
strike price $1,300.00, expires 6/28/13 | 2 | 40 | ||||||
|
| |||||||
| Total Options Purchased (cost—$136,278) | 34,075 | |||||||
|
| |||||||
| Total Investments, before options written (cost—$3,939,220)—104.5% | 4,295,668 | |||||||
|
| |||||||
| Options Written (b)(c)—(0.2)% | ||||||||
| Call Options—(0.2)% | ||||||||
S&P 500 PM Index, | 23 | (8,510 | ) | |||||
|
| |||||||
| Total Investments, net of options written (cost—$3,930,741)—104.3% | 4,287,158 | |||||||
|
| |||||||
| Other liabilities in excess of other assets—(4.3)% | (177,937 | ) | ||||||
|
| |||||||
| Net Assets—100.0% | $4,109,221 | |||||||
|
| |||||||
Notes to Schedule of Investments:
(a) All or partial amount segregated for the benefit of the counterparty as collateral for option written.
(b) Non-income producing.
(c) Exchange traded-Chicago Board Options Exchange.
| See accompanying Notes to Financial Statements | | May 31, 2013 | | Semiannual Report | 137 |
Table of Contents
Statements of Assets and Liabilities
May 31, 2013 (Unaudited)
| AllianzGI Retirement 2015 | AllianzGI Retirement 2020 | AllianzGI Retirement 2025 | AllianzGI Retirement 2030 | AllianzGI Retirement 2035 | ||||||||||||||||||
| Assets: | ||||||||||||||||||||||
| Investments, at value | $ | 1,240,028 | $ | 1,807,660 | $ | 1,691,024 | $ | 2,457,534 | �� | $ | 2,078,692 | |||||||||||
| Investments in Affiliates, at value | 22,578,210 | 32,228,081 | 31,042,516 | 37,170,641 | 24,509,198 | |||||||||||||||||
| Repurchase agreements, at value | — | — | 279,000 | 267,000 | — | |||||||||||||||||
| Cash | — | — | 234 | 181 | — | |||||||||||||||||
| Receivable for investments in Affiliates sold | 176,445 | 499,521 | — | — | 352,296 | |||||||||||||||||
| Receivable for Fund shares sold | 4,598 | 26,197 | 8,974 | 54,330 | 8,117 | |||||||||||||||||
| Receivable from Investment Manager | 1,409 | 1,443 | 1,630 | 4,610 | 2,524 | |||||||||||||||||
| Prepaid expenses | — | — | — | — | — | |||||||||||||||||
Total Assets | 24,000,690 | 34,562,902 | 33,023,378 | 39,954,296 | 26,950,827 | |||||||||||||||||
| Liabilities: | ||||||||||||||||||||||
| Payable for investments purchased | — | — | — | — | — | |||||||||||||||||
| Payable for investments in Affiliates purchased | — | — | — | — | — | |||||||||||||||||
| Payable for Fund shares redeemed | 27,542 | 1,324 | 49,353 | — | 1 | |||||||||||||||||
| Payable to custodian for cash overdraft | 5,092 | 258,218 | — | — | 166,922 | |||||||||||||||||
| Administration fees payable | 3,405 | 5,278 | 5,509 | 5,728 | 3,774 | |||||||||||||||||
| Distribution fees payable | 2,149 | 2,272 | 2,291 | 2,714 | 2,263 | |||||||||||||||||
| Servicing fees payable | 1,648 | 2,388 | 2,875 | 2,584 | 1,344 | |||||||||||||||||
| Accrued expenses | — | — | — | — | — | |||||||||||||||||
Total Liabilities | 39,836 | 269,480 | 60,028 | 11,026 | 174,304 | |||||||||||||||||
| Net Assets | $ | 23,960,854 | $ | 34,293,422 | $ | 32,963,350 | $ | 39,943,270 | $ | 26,776,523 | ||||||||||||
| Net Assets Consist of: | ||||||||||||||||||||||
| Shares of beneficial interest: | ||||||||||||||||||||||
Par value ($0.00001 per share) | $ | 12 | $ | 18 | $ | 20 | $ | 20 | $ | 15 | ||||||||||||
Paid-in-capital in excess of par | 22,953,151 | 33,410,195 | 32,724,706 | 38,491,402 | 26,111,369 | |||||||||||||||||
| Undistributed (dividends in excess of) net investment income | (758 | ) | 49,134 | 15,745 | 53,294 | 28,188 | ||||||||||||||||
| Accumulated net realized gain (loss) | 22,321 | 171,411 | 156,355 | 65,252 | 93,125 | |||||||||||||||||
| Net unrealized appreciation | 986,128 | 662,664 | 66,524 | 1,333,302 | 543,826 | |||||||||||||||||
| Net Assets | $ | 23,960,854 | $ | 34,293,422 | $ | 32,963,350 | $ | 39,943,270 | $ | 26,776,523 | ||||||||||||
| Cost of Investments | $ | 1,195,422 | $ | 1,780,914 | $ | 1,683,219 | $ | 2,411,818 | $ | 2,068,992 | ||||||||||||
| Cost of Investments in Affiliates | $ | 21,636,688 | $ | 31,592,163 | $ | 30,983,797 | $ | 35,883,055 | $ | 23,975,072 | ||||||||||||
| Cost of Repurchase Agreements | $ | — | $ | — | $ | 279,000 | $ | 267,000 | $ | — | ||||||||||||
| 138 | Semiannual Report | | May 31, 2013 | | See accompanying Notes to Financial Statements |
Table of Contents
| AllianzGI Retirement 2040 | AllianzGI Retirement 2045 | AllianzGI Retirement 2050 | AllianzGI Retirement 2055 | AllianzGI Retirement Income | AllianzGI Global Allocation | AllianzGI Global Growth Allocation | ||||||||||||||||||||||
| $ | 2,149,438 | $ | 945,664 | $ | 640,739 | $ | 236,084 | $ | 1,621,729 | $ | 13,421,232 | $ | 504,839 | |||||||||||||||
| 22,481,347 | 10,001,218 | 10,849,784 | 4,007,075 | 29,248,642 | 194,887,952 | 7,958,847 | ||||||||||||||||||||||
| 125,000 | — | — | — | 297,000 | 707,000 | — | ||||||||||||||||||||||
| 757 | 96,916 | 56,520 | 32,958 | 674 | 950 | 65,210 | ||||||||||||||||||||||
| 47,749 | — | 24,429 | — | — | — | 171,154 | ||||||||||||||||||||||
| 27,461 | 4,473 | 39,491 | 2,563 | 16,218 | 257,029 | — | ||||||||||||||||||||||
| 2,588 | 1,201 | 1,766 | 595 | 2,559 | 19,467 | 19,885 | ||||||||||||||||||||||
| — | — | — | — | — | 47,592 | 55,627 | ||||||||||||||||||||||
| 24,834,340 | 11,049,472 | 11,612,729 | 4,279,275 | 31,186,822 | 209,341,222 | 8,775,562 | ||||||||||||||||||||||
| — | — | — | — | 30,000 | 280,000 | — | ||||||||||||||||||||||
| — | — | — | — | 45,000 | — | 172,044 | ||||||||||||||||||||||
| — | — | — | — | 73,709 | 64,509 | — | ||||||||||||||||||||||
| — | — | — | — | — | — | — | ||||||||||||||||||||||
| 3,260 | 1,489 | 999 | 227 | 4,906 | — | — | ||||||||||||||||||||||
| 1,544 | 373 | 460 | 65 | 4,419 | 48,044 | 981 | ||||||||||||||||||||||
| 1,412 | 712 | 330 | 27 | 2,766 | 31,182 | 562 | ||||||||||||||||||||||
| — | — | — | — | — | 140,214 | 62,687 | ||||||||||||||||||||||
| 6,216 | 2,574 | 1,789 | 319 | 160,800 | 563,949 | 236,274 | ||||||||||||||||||||||
| $ | 24,828,124 | $ | 11,046,898 | $ | 11,610,940 | $ | 4,278,956 | $ | 31,026,022 | $ | 208,777,273 | $ | 8,539,288 | |||||||||||||||
| $ | 12 | $ | 6 | $ | 6 | $ | 2 | $ | 16 | $ | 182 | $ | 4 | |||||||||||||||
| 23,263,722 | 10,323,191 | 10,288,527 | 3,745,697 | 29,656,058 | 197,421,008 | 7,011,771 | ||||||||||||||||||||||
| | 53,411 | | 18,343 | 30,064 | 11,501 | (328,969 | ) | (2,186,013 | ) | 2,384 | ||||||||||||||||||
| 7,849 | 54,303 | (28,834 | ) | 55,731 | 352,607 | (13,329,188 | ) | 221,442 | ||||||||||||||||||||
| 1,503,130 | 651,055 | 1,321,177 | 466,025 | 1,346,310 | 26,871,284 | 1,303,687 | ||||||||||||||||||||||
| $ | 24,828,124 | $ | 11,046,898 | $ | 11,610,940 | $ | 4,278,956 | $ | 31,026,022 | $ | 208,777,273 | $ | 8,539,288 | |||||||||||||||
| $ | 2,086,839 | $ | 905,999 | $ | 577,414 | $ | 199,125 | $ | 1,543,686 | $ | 12,174,709 | $ | 443,619 | |||||||||||||||
| $ | 21,040,816 | $ | 9,389,828 | $ | 9,591,932 | $ | 3,578,009 | $ | 27,980,375 | $ | 169,263,191 | $ | 6,716,380 | |||||||||||||||
| $ | 125,000 | $ | — | $ | — | $ | — | $ | 297,000 | $ | 707,000 | $ | — | |||||||||||||||
| See accompanying Notes to Financial Statements | | May 31, 2013 | | Semiannual Report | 139 |
Table of Contents
Statements of Assets and Liabilities (cont’d)
May 31, 2013 (Unaudited)
| AllianzGI Retirement 2015 | AllianzGI Retirement 2020 | AllianzGI Retirement 2025 | AllianzGI Retirement 2030 | AllianzGI Retirement 2035 | ||||||||||||||||||
| Net Assets: | ||||||||||||||||||||||
| Class A | $ | 5,067,363 | $ | 9,247,308 | $ | 12,380,267 | $ | 9,471,137 | $ | 5,120,647 | ||||||||||||
| Class B | — | — | — | — | — | |||||||||||||||||
| Class C | 1,660,865 | 557,723 | — | 785,470 | — | |||||||||||||||||
| Class D | 247,109 | 247,198 | — | 552,278 | — | |||||||||||||||||
| Class R | 335,673 | 1,034,315 | 817,790 | 1,232,352 | 924,456 | |||||||||||||||||
| Class P | 4,579,308 | 8,533,856 | 4,729,132 | 8,455,906 | 5,447,976 | |||||||||||||||||
| Institutional Class | — | — | — | — | — | |||||||||||||||||
| Class R6 | 8,091,965 | 7,509,220 | 4,789,640 | 10,526,735 | 5,514,890 | |||||||||||||||||
| Administrative Class | 3,978,571 | 7,163,802 | 10,246,521 | 8,919,392 | 9,768,554 | |||||||||||||||||
| Shares Issued and Outstanding: | ||||||||||||||||||||||
| Class A | 262,361 | 485,901 | 746,501 | 473,914 | 295,685 | |||||||||||||||||
| Class B | — | — | — | — | — | |||||||||||||||||
| Class C | 87,128 | 29,446 | — | 39,625 | — | |||||||||||||||||
| Class D | 12,803 | 12,950 | — | 27,510 | — | |||||||||||||||||
| Class R | 17,427 | 54,403 | 49,465 | 61,595 | 53,552 | |||||||||||||||||
| Class P | 235,289 | 444,227 | 283,958 | 418,224 | 313,143 | |||||||||||||||||
| Institutional Class | — | — | — | — | — | |||||||||||||||||
| Class R6 | 415,346 | 390,392 | 287,337 | 519,879 | 316,727 | |||||||||||||||||
| Administrative Class | 204,723 | 374,515 | 615,638 | 442,022 | 562,320 | |||||||||||||||||
| Net Asset Value and Redemption Price Per Share:* | ||||||||||||||||||||||
| Class A | $ | 19.31 | $ | 19.03 | $ | 16.58 | $ | 19.98 | $ | 17.32 | ||||||||||||
| Class B | — | — | — | — | — | |||||||||||||||||
| Class C | 19.06 | 18.94 | — | 19.82 | — | |||||||||||||||||
| Class D | 19.30 | 19.09 | — | 20.08 | — | |||||||||||||||||
| Class R | 19.26 | 19.01 | 16.53 | 20.01 | 17.26 | |||||||||||||||||
| Class P | 19.46 | 19.21 | 16.65 | 20.22 | 17.40 | |||||||||||||||||
| Institutional Class | — | — | — | — | — | |||||||||||||||||
| Class R6 | 19.48 | 19.24 | 16.67 | 20.25 | 17.41 | |||||||||||||||||
| Administrative Class | 19.43 | 19.13 | 16.64 | 20.18 | 17.37 | |||||||||||||||||
| * | Net asset value and redemption price per share may not recalculate exactly due to rounding. |
| 140 | Semiannual Report | | May 31, 2013 | | See accompanying Notes to Financial Statements |
Table of Contents
| AllianzGI Retirement 2040 | AllianzGI Retirement 2045 | AllianzGI Retirement 2050 | AllianzGI Retirement 2055 | AllianzGI Retirement Income | AllianzGI Global Allocation | AllianzGI Global Growth Allocation | ||||||||||||||||||||||
| $ | 4,953,959 | $ | 2,998,324 | $ | 756,995 | $ | 72,935 | $ | 4,954,209 | $ | 70,384,496 | $ | 1,219,225 | |||||||||||||||
| — | — | — | — | — | 3,677,115 | — | ||||||||||||||||||||||
| 268,786 | — | 69,201 | — | 5,613,675 | 69,406,510 | 1,261,500 | ||||||||||||||||||||||
| 223,670 | — | 221,375 | — | 1,829,708 | 334,312 | 242,907 | ||||||||||||||||||||||
| 1,060,189 | 321,929 | 493,107 | 55,210 | 141,531 | 15,891 | 19,964 | ||||||||||||||||||||||
| 4,326,198 | 2,290,893 | 1,288,982 | 115,027 | 6,814,899 | 1,342,079 | 38,638 | ||||||||||||||||||||||
| — | — | — | — | — | 61,876,224 | 5,738,795 | ||||||||||||||||||||||
| 9,124,223 | 4,111,226 | 8,046,011 | 3,960,358 | 9,407,917 | — | — | ||||||||||||||||||||||
| 4,871,099 | 1,324,526 | 735,269 | 75,426 | 2,264,083 | 1,740,646 | 18,259 | ||||||||||||||||||||||
| 243,349 | 170,128 | 37,326 | 4,188 | 261,081 | 6,156,636 | 52,840 | ||||||||||||||||||||||
| — | — | — | — | — | 315,676 | — | ||||||||||||||||||||||
| 13,298 | — | 3,432 | — | 299,055 | 6,002,327 | 55,415 | ||||||||||||||||||||||
| 10,997 | — | 10,898 | — | 96,003 | 29,350 | 10,578 | ||||||||||||||||||||||
| 52,316 | 18,333 | 24,381 | 3,180 | 7,242 | 1,396 | 867 | ||||||||||||||||||||||
| 211,028 | 129,479 | 63,030 | 6,581 | 354,662 | 117,368 | 1,675 | ||||||||||||||||||||||
| — | — | — | — | — | 5,463,395 | 248,644 | ||||||||||||||||||||||
| 444,579 | 232,139 | 392,943 | 226,349 | 499,007 | — | — | ||||||||||||||||||||||
| 238,438 | 75,019 | 36,041 | 4,324 | 118,070 | 149,008 | 792 | ||||||||||||||||||||||
| $ | 20.36 | $ | 17.62 | $ | 20.28 | $ | 17.42 | $ | 18.98 | $ | 11.43 | $ | 23.07 | |||||||||||||||
| — | — | — | — | — | 11.65 | — | ||||||||||||||||||||||
| 20.21 | — | 20.16 | — | 18.77 | 11.56 | 22.76 | ||||||||||||||||||||||
| 20.34 | — | 20.31 | — | 19.06 | 11.39 | 22.96 | ||||||||||||||||||||||
| 20.26 | 17.56 | 20.22 | 17.36 | 19.54 | 11.38 | 23.02 | ||||||||||||||||||||||
| 20.50 | 17.69 | 20.45 | 17.48 | 19.22 | 11.43 | 23.06 | ||||||||||||||||||||||
| — | — | — | — | — | 11.33 | 23.08 | ||||||||||||||||||||||
| 20.52 | 17.71 | 20.48 | 17.50 | 18.85 | — | — | ||||||||||||||||||||||
| 20.43 | 17.66 | 20.40 | 17.44 | 19.18 | 11.68 | 23.04 | ||||||||||||||||||||||
| See accompanying Notes to Financial Statements | | May 31, 2013 | | Semiannual Report | 141 |
Table of Contents
Statements of Assets and Liabilities (cont’d)
May 31, 2013 (Unaudited)
| AllianzGI Behavioral Advantage Large Cap | AllianzGI China Equity | AllianzGI Convertible | AllianzGI Disciplined Equity | AllianzGI Dynamic Emerging Multi-Asset | ||||||||||||||||||
| Assets: | ||||||||||||||||||||||
| Investments, at value | $ | 36,674,730 | $ | 3,210,098 | $ | 1,563,882,716 | $ | 51,530,898 | $ | 2,005,341 | ||||||||||||
| Investments in Affiliates, at value | — | 815,496 | — | — | 2,351,602 | |||||||||||||||||
| Repurchase agreements, at value | — | 107,000 | 53,103,000 | 1,246,000 | 1,006,000 | |||||||||||||||||
| Cash | 13,276 | 57 | 232 | 454 | 595 | |||||||||||||||||
| Foreign currency, at value | — | 1,324 | — | — | — | |||||||||||||||||
| Dividends and interest receivable (net of foreign taxes) | 86,463 | 11,293 | 8,366,539 | 92,346 | 2,223 | |||||||||||||||||
| Receivable for investments sold | 38,093 | — | 9,036,319 | 120,431 | — | |||||||||||||||||
| Receivable for investments in Affiliates sold | — | — | — | — | — | |||||||||||||||||
| Receivable for Fund shares sold | 3,005 | 100 | 2,468,797 | 14,916 | — | |||||||||||||||||
| Receivable from Investment Manager | 782 | 14,511 | — | — | 68,696 | |||||||||||||||||
| Tax reclaims receivable | — | — | — | — | — | |||||||||||||||||
| Dividends receivable from Affiliates | — | — | — | — | — | |||||||||||||||||
| Receivable for variation margin on futures contracts | — | — | — | — | 190,358 | |||||||||||||||||
| Prepaid expenses | 20,639 | 50,802 | 64,154 | 20,357 | 4,901 | |||||||||||||||||
Total Assets | 36,836,988 | 4,210,681 | 1,636,921,757 | 53,025,402 | 5,629,716 | |||||||||||||||||
| Liabilities: | ||||||||||||||||||||||
| Payable for investments purchased | — | — | 33,080,107 | 138,350 | 407,730 | |||||||||||||||||
| Payable for Fund shares redeemed | 24,665 | — | 2,718,721 | 45,686 | — | |||||||||||||||||
| Payable for variation margin on futures contracts | — | — | — | — | 176,712 | |||||||||||||||||
| Investment management fees payable | — | — | 743,031 | 11,348 | — | |||||||||||||||||
| Distribution fees payable | 53 | 32 | 54,294 | 614 | 16 | |||||||||||||||||
| Servicing fees payable | 124 | 102 | 47,782 | 2,461 | 11 | |||||||||||||||||
| Unrealized depreciation of forward foreign currency contracts | — | — | — | — | — | |||||||||||||||||
| Offering costs payable | — | — | — | — | 59,999 | |||||||||||||||||
| Accrued expenses | 37,579 | 44,577 | 283,104 | 62,460 | 25,394 | |||||||||||||||||
Total Liabilities | 62,421 | 44,711 | 36,927,039 | 260,919 | 669,862 | |||||||||||||||||
| Net Assets | $ | 36,774,567 | $ | 4,165,970 | $ | 1,599,994,718 | $ | 52,764,483 | $ | 4,959,854 | ||||||||||||
| Net Assets Consist of: | ||||||||||||||||||||||
| Shares of beneficial interest: | ||||||||||||||||||||||
Par value ($0.00001 per share) | $ | 18 | $ | 3 | $ | 496 | $ | 29 | $ | 3 | ||||||||||||
Paid-in-capital in excess of par | 31,390,058 | 4,294,948 | 1,366,082,523 | 43,040,126 | 5,241,680 | |||||||||||||||||
| Undistributed (dividends in excess of) net investment income | 158,118 | (55,585 | ) | 5,023,584 | 293,828 | 35,262 | ||||||||||||||||
| Accumulated net realized gain (loss) | 603,377 | (232,207 | ) | (1,819,912 | ) | 220,843 | (21,773 | ) | ||||||||||||||
| Net unrealized appreciation (depreciation) | 4,622,996 | 158,811 | 230,708,027 | 9,209,657 | (295,318 | ) | ||||||||||||||||
| Net Assets | $ | 36,774,567 | $ | 4,165,970 | $ | 1,599,994,718 | $ | 52,764,483 | $ | 4,959,854 | ||||||||||||
| Cost of Investments | $ | 32,051,734 | $ | 3,224,738 | $ | 1,333,174,689 | $ | 42,321,241 | $ | 2,005,442 | ||||||||||||
| Cost of Investments in Affiliates | $ | — | $ | 642,046 | $ | — | $ | — | $ | 2,466,226 | ||||||||||||
| Cost of Repurchase Agreements | $ | — | $ | 107,000 | $ | 53,103,000 | $ | 1,246,000 | $ | 1,006,000 | ||||||||||||
| Cost of Foreign Currency | $ | — | $ | 1,324 | $ | — | $ | — | $ | — | ||||||||||||
| 142 | Semiannual Report | | May 31, 2013 | | See accompanying Notes to Financial Statements |
Table of Contents
| AllianzGI Global Managed Volatility | AllianzGI Global Water | AllianzGI High Yield Bond | AllianzGI International Small-Cap | AllianzGI Micro Cap | AllianzGI Multi-Asset Real Return | AllianzGI NFJ Emerging Markets Value | ||||||||||||||||||||||
| $ | 15,629,796 | $ | 153,771,811 | $ | 388,964,876 | $ | 76,000,366 | $ | 34,705,962 | $ | 2,716,439 | $ | 6,274,798 | |||||||||||||||
| — | 6,735,145 | — | 19,182,059 | — | 2,153,665 | — | ||||||||||||||||||||||
| 486,000 | 12,013,000 | 5,520,000 | 1,836,000 | 903,000 | — | 146,000 | ||||||||||||||||||||||
| 825 | 153 | 33 | 697 | 197 | 44,785 | 1,071 | ||||||||||||||||||||||
| 8,233 | 787,207 | — | 78,229 | — | 243 | 83,691 | ||||||||||||||||||||||
| 65,893 | 655,487 | 7,496,463 | 269,738 | 12,832 | 11,200 | 48,878 | ||||||||||||||||||||||
| 12 | — | 3,067,500 | 516,971 | 268,720 | 213,771 | 10,025 | ||||||||||||||||||||||
| — | — | — | 208,088 | — | — | — | ||||||||||||||||||||||
| 15,000 | 949,889 | 596,723 | 27,922 | 74,635 | — | 400 | ||||||||||||||||||||||
| 26,716 | — | — | — | — | 73,337 | 50,724 | ||||||||||||||||||||||
| 5,579 | 94,805 | — | 48,737 | — | 411 | 45 | ||||||||||||||||||||||
| — | — | — | 14,235 | — | — | — | ||||||||||||||||||||||
| — | — | — | — | — | 19,655 | — | ||||||||||||||||||||||
| 20,693 | 37,993 | 56,698 | 58,265 | 20,143 | 4,902 | 4,595 | ||||||||||||||||||||||
| 16,258,747 | 175,045,490 | 405,702,293 | 98,241,307 | 35,985,489 | 5,238,408 | 6,620,227 | ||||||||||||||||||||||
| 316,586 | 855,132 | 4,203,110 | 391,783 | 170,352 | — | 30,378 | ||||||||||||||||||||||
| 4,977 | 601,225 | 1,028,957 | 36,549 | 394,929 | — | — | ||||||||||||||||||||||
| — | — | — | — | — | — | — | ||||||||||||||||||||||
| — | 135,486 | 165,157 | 60,064 | 24,108 | — | — | ||||||||||||||||||||||
| 59 | 22,276 | 25,903 | 746 | — | 9 | 7 | ||||||||||||||||||||||
| 64 | 28,544 | 47,025 | 875 | 80 | 13 | 103 | ||||||||||||||||||||||
| | — | | 5,019 | — | — | — | — | — | ||||||||||||||||||||
| 4,640 | — | — | — | — | 60,430 | 36,053 | ||||||||||||||||||||||
| 63,959 | 202,586 | 56,311 | 220,523 | 51,443 | 19,057 | 7,160 | ||||||||||||||||||||||
| 390,285 | 1,850,268 | 5,526,463 | 710,540 | 640,912 | 79,509 | 73,701 | ||||||||||||||||||||||
| $ | 15,868,462 | $ | 173,195,222 | $ | 400,175,830 | $ | 97,530,767 | $ | 35,344,577 | $ | 5,158,899 | $ | 6,546,526 | |||||||||||||||
| $ | 9 | $ | 155 | $ | 390 | $ | 26 | $ | 27 | $ | 3 | $ | 4 | |||||||||||||||
| 14,215,878 | 173,732,914 | 378,795,518 | 76,751,405 | 32,430,720 | 5,106,940 | 6,410,033 | ||||||||||||||||||||||
| | 101,313 | | 885,830 | (1,216,577 | ) | 312,464 | (489,871 | ) | 40,875 | 83,748 | ||||||||||||||||||
| 591,988 | (21,254,726 | ) | 3,769,659 | 2,565,417 | (7,496,822 | ) | 10,845 | 28,655 | ||||||||||||||||||||
| 959,274 | 19,831,049 | 18,826,840 | 17,901,455 | 10,900,523 | 236 | 24,086 | ||||||||||||||||||||||
| $ | 15,868,462 | $ | 173,195,222 | $ | 400,175,830 | $ | 97,530,767 | $ | 35,344,577 | $ | 5,158,899 | $ | 6,546,526 | |||||||||||||||
| $ | 14,668,193 | $ | 134,787,653 | $ | 370,138,036 | $ | 63,302,054 | $ | 23,805,439 | $ | 2,714,565 | $ | 6,249,750 | |||||||||||||||
| $ | — | $ | 5,894,932 | $ | — | $ | 13,964,453 | $ | — | $ | 2,156,833 | $ | — | |||||||||||||||
| $ | 486,000 | $ | 12,013,000 | $ | 5,520,000 | $ | 1,836,000 | $ | 903,000 | $ | — | $ | 146,000 | |||||||||||||||
| $ | 8,225 | $ | 785,274 | $ | — | $ | 78,282 | $ | — | $ | 245 | $ | 83,678 | |||||||||||||||
| See accompanying Notes to Financial Statements | | May 31, 2013 | | Semiannual Report | 143 |
Table of Contents
Statements of Assets and Liabilities (cont’d)
May 31, 2013 (Unaudited)
| AllianzGI Behavioral Advantage Large Cap | AllianzGI China Equity | AllianzGI Convertible | AllianzGI Disciplined Equity | AllianzGI Dynamic Emerging Multi-Asset | ||||||||||||||||||
| Net Assets: | ||||||||||||||||||||||
| Class A | $ | 259,065 | $ | 128,720 | $ | 148,895,784 | $ | 10,394,849 | $ | 9,451 | ||||||||||||
| Class C | 89,391 | 48,235 | 53,916,727 | 997,924 | 24,413 | |||||||||||||||||
| Class D | 101,872 | 245,031 | 45,451,446 | 211,019 | 16,664 | |||||||||||||||||
| Class R | — | — | 410,925 | — | — | |||||||||||||||||
| Class P | 14,977 | 26,621 | 75,239,440 | 34,385 | 9,458 | |||||||||||||||||
| Institutional Class | 36,309,262 | 3,717,363 | 1,262,531,913 | 41,126,306 | 4,899,868 | |||||||||||||||||
| Administrative Class | — | — | 13,548,483 | — | — | |||||||||||||||||
| Shares Issued and Outstanding: | ||||||||||||||||||||||
| Class A | 12,461 | 8,458 | 4,605,046 | 578,819 | 667 | |||||||||||||||||
| Class C | 4,352 | 3,170 | 1,666,061 | 56,082 | 1,728 | |||||||||||||||||
| Class D | 4,946 | 16,092 | 1,407,728 | 11,527 | 1,175 | |||||||||||||||||
| Class R | — | — | 12,725 | — | — | |||||||||||||||||
| Class P | 720 | 1,737 | 2,332,089 | 1,894 | 667 | |||||||||||||||||
| Institutional Class | 1,747,224 | 245,143 | 39,200,425 | 2,269,444 | 345,224 | |||||||||||||||||
| Administrative Class | — | — | 420,012 | — | — | |||||||||||||||||
| Net Asset Value and Redemption Price Per Share:* | ||||||||||||||||||||||
| Class A | $ | 20.79 | $ | 15.22 | $ | 32.33 | $ | 17.96 | $ | 14.18 | ||||||||||||
| Class C | 20.54 | 15.22 | 32.36 | 17.79 | 14.13 | |||||||||||||||||
| Class D | 20.60 | 15.23 | 32.29 | 18.31 | 14.18 | |||||||||||||||||
| Class R | — | — | 32.29 | — | — | |||||||||||||||||
| Class P | 20.79 | 15.32 | 32.26 | 18.15 | 14.19 | |||||||||||||||||
| Institutional Class | 20.78 | 15.16 | 32.21 | 18.12 | 14.19 | |||||||||||||||||
| Administrative Class | — | — | 32.26 | — | — | |||||||||||||||||
| * | Net asset value and redemption price per share may not recalculate exactly due to rounding. |
| 144 | Semiannual Report | | May 31, 2013 | | See accompanying Notes to Financial Statements |
Table of Contents
| AllianzGI Global Managed Volatility | AllianzGI Global Water | AllianzGI High Yield Bond | AllianzGI International Small-Cap | AllianzGI Micro Cap | AllianzGI Multi-Asset Real Return | AllianzGI NFJ Emerging Markets Value | ||||||||||||||||||||||
| $ | 134,062 | $ | 87,291,488 | $ | 112,835,261 | $ | 3,386,157 | $ | 403,407 | $ | 38,584 | $ | 20,864 | |||||||||||||||
| 92,058 | 35,908,765 | 29,806,835 | 576,198 | — | 15,791 | 10,507 | ||||||||||||||||||||||
| 81,817 | 14,500,566 | 74,415,312 | 134,565 | — | 10,095 | 469,078 | ||||||||||||||||||||||
| — | — | 2,377,565 | 15,585 | — | — | — | ||||||||||||||||||||||
| 12,011 | 29,544,463 | 14,876,923 | 29,649,292 | 992,126 | 10,101 | 10,550 | ||||||||||||||||||||||
| 15,548,514 | 5,949,940 | 135,423,924 | 63,755,299 | 33,949,044 | 5,084,328 | 6,035,527 | ||||||||||||||||||||||
| — | — | 30,440,010 | 13,671 | — | — | — | ||||||||||||||||||||||
| 7,798 | 7,803,219 | 10,806,086 | 90,959 | 31,139 | 2,548 | 1,319 | ||||||||||||||||||||||
| 5,437 | 3,276,669 | 2,858,103 | 15,613 | — | 1,046 | 667 | ||||||||||||||||||||||
| 4,780 | 1,299,353 | 7,315,581 | 3,536 | — | 667 | 29,659 | ||||||||||||||||||||||
| — | — | 234,360 | 417 | — | — | — | ||||||||||||||||||||||
| 697 | 2,626,324 | 1,467,498 | 801,463 | 76,586 | 667 | 667 | ||||||||||||||||||||||
| 902,452 | 534,834 | 13,320,985 | 1,688,750 | 2,609,862 | 335,401 | 381,260 | ||||||||||||||||||||||
| — | — | 3,004,355 | 363 | — | — | — | ||||||||||||||||||||||
| $ | 17.19 | $ | 11.19 | $ | 10.44 | $ | 37.23 | $ | 12.95 | $ | 15.14 | $ | 15.81 | |||||||||||||||
| 16.93 | 10.96 | 10.43 | 36.91 | — | 15.09 | 15.76 | ||||||||||||||||||||||
| 17.12 | 11.16 | 10.17 | 38.06 | — | 15.14 | 15.82 | ||||||||||||||||||||||
| — | — | 10.14 | 37.38 | — | — | — | ||||||||||||||||||||||
| 17.24 | 11.25 | 10.14 | 36.99 | 12.95 | 15.15 | 15.82 | ||||||||||||||||||||||
| 17.23 | 11.12 | 10.17 | 37.75 | 13.01 | 15.16 | 15.83 | ||||||||||||||||||||||
| — | — | 10.13 | 37.67 | — | — | — | ||||||||||||||||||||||
| See accompanying Notes to Financial Statements | | May 31, 2013 | | Semiannual Report | 145 |
Table of Contents
Statements of Assets and Liabilities (cont’d)
May 31, 2013 (Unaudited)
| AllianzGI NFJ Global Dividend Value | AllianzGI NFJ International Small-Cap Value | AllianzGI NFJ International Value II | AllianzGI Redwood | AllianzGI Short Duration High Income | ||||||||||||||||||
| Assets: | ||||||||||||||||||||||
| Investments, at value | $ | 68,479,753 | $ | 8,050,242 | $ | 3,777,634 | $ | 6,584,908 | $ | 420,890,293 | ||||||||||||
| Repurchase agreements, at value | 317,000 | 204,000 | — | 2,531,000 | 32,236,000 | |||||||||||||||||
| Cash | 330 | 996 | 97,496 | 449 | 9,565 | |||||||||||||||||
| Foreign currency, at value | 83,114 | 15,688 | 5,769 | — | — | |||||||||||||||||
| Dividends and interest receivable (net of foreign taxes) | 353,336 | 39,217 | 23,315 | 3,174 | 5,245,615 | |||||||||||||||||
| Receivable for investments sold | 749,406 | 190,442 | — | 176,900 | — | |||||||||||||||||
| Deposits with brokers for options collateral | — | — | — | — | — | |||||||||||||||||
| Receivable for Fund shares sold | 24,997 | 50 | — | — | 3,444,891 | |||||||||||||||||
| Receivable from Investment Manager | — | 79,840 | 18,237 | 12,391 | — | |||||||||||||||||
| Tax reclaims receivable | 14,578 | 3,851 | 3,152 | — | — | |||||||||||||||||
| Prepaid expenses | 20,867 | 50,800 | 21,124 | 20,848 | 26,153 | |||||||||||||||||
Total Assets | 70,043,381 | 8,635,126 | 3,946,727 | 9,329,670 | 461,852,517 | |||||||||||||||||
| Liabilities: | ||||||||||||||||||||||
| Payable for investments purchased | — | 86,710 | 6,118 | 135,261 | 26,947,065 | |||||||||||||||||
| Payable for Fund shares redeemed | 76,934 | — | — | — | 2,463,566 | |||||||||||||||||
| Options written, at value | — | — | — | 1,618,440 | — | |||||||||||||||||
| Investment management fees payable | 36,800 | — | — | — | 166,948 | |||||||||||||||||
| Distribution fees payable | 2,857 | 17 | 11 | 33 | 9,775 | |||||||||||||||||
| Servicing fees payable | 3,150 | 436 | 21 | 269 | 41,490 | |||||||||||||||||
| Offering costs payable | — | 63,963 | 241 | — | — | |||||||||||||||||
| Accrued expenses | 54,924 | 21,071 | 53,799 | 62,819 | 52,883 | |||||||||||||||||
Total Liabilities | 174,665 | 172,197 | 60,190 | 1,816,822 | 29,681,727 | |||||||||||||||||
| Net Assets | $ | 69,868,716 | $ | 8,462,929 | $ | 3,886,537 | $ | 7,512,848 | $ | 432,170,790 | ||||||||||||
| Net Assets Consist of: | ||||||||||||||||||||||
| Shares of beneficial interest: | ||||||||||||||||||||||
Par value ($0.00001 per share) | $ | 34 | $ | 4 | $ | 2 | $ | 5 | $ | 271 | ||||||||||||
Paid-in-capital in excess of par | 63,048,401 | 7,410,785 | 3,321,098 | 7,207,863 | 431,181,545 | |||||||||||||||||
| Undistributed (dividends in excess of) net investment income | 612,875 | 58,264 | 20,788 | (29,863 | ) | (830,073 | ) | |||||||||||||||
| Accumulated net realized gain (loss) | 1,527,652 | 181,417 | 99,377 | (394,236 | ) | (441,541 | ) | |||||||||||||||
| Net unrealized appreciation | 4,679,754 | 812,459 | 445,272 | 729,079 | 2,260,588 | |||||||||||||||||
| Net Assets | $ | 69,868,716 | $ | 8,462,929 | $ | 3,886,537 | $ | 7,512,848 | $ | 432,170,790 | ||||||||||||
| Cost of Investments | $ | 63,796,566 | $ | 7,236,809 | $ | 3,331,818 | $ | 5,706,392 | $ | 418,629,705 | ||||||||||||
| Cost of Repurchase Agreements | $ | 317,000 | $ | 204,000 | $ | — | $ | 2,531,000 | $ | 32,236,000 | ||||||||||||
| Cost of Foreign Currency | $ | 83,487 | $ | 15,785 | $ | 5,776 | $ | — | $ | — | ||||||||||||
| Premiums Received for Options Written | $ | — | $ | — | $ | — | $ | 1,469,003 | $ | — | ||||||||||||
| 146 | Semiannual Report | | May 31, 2013 | | See accompanying Notes to Financial Statements |
Table of Contents
AllianzGI | AllianzGI Ultra Micro Cap | AllianzGI U.S. Emerging Growth | AllianzGI U.S. Equity Hedged | |||||||||||||
| $ | 7,806,075 | $ | 41,157,860 | $ | 29,388,662 | $ | 3,862,668 | |||||||||
| 527,000 | 1,471,000 | — | 433,000 | |||||||||||||
| 950 | 863 | 11,231 | 183 | |||||||||||||
| — | — | — | — | |||||||||||||
| — |
| 16,984 | 12,947 | 7,852 | |||||||||||
| 10,833 | 406,572 | 661,023 | 8,480 | |||||||||||||
| 235,676 | — | — | 15,613 | |||||||||||||
| — | 383,595 | 10,785 | — | |||||||||||||
| 53,987 | — | — | 62,608 | |||||||||||||
| — | — | — | 5 | |||||||||||||
| 5,578 | 18,672 | 32,768 | 4,901 | |||||||||||||
| 8,640,099 | 43,455,546 | 30,117,416 | 4,395,310 | |||||||||||||
| 8,587 | 696,176 | 324,143 | 218,250 | |||||||||||||
| — | 13,217 | 64,331 | — | |||||||||||||
| 285,303 | — | — | 8,510 | |||||||||||||
| — | 49,687 | 6,117 | — | |||||||||||||
| 6 | — | 213 | 6 | |||||||||||||
| 177 | 3,755 | 668 | 56 | |||||||||||||
| 47,446 | — | — | 46,641 | |||||||||||||
| 34,951 | 39,834 | 53,180 | 12,626 | |||||||||||||
| 376,470 | 802,669 | 448,652 | 286,089 | |||||||||||||
| $ | 8,263,629 | $ | 42,652,877 | $ | 29,668,764 | $ | 4,109,221 | |||||||||
| $ | 5 | $ | 22 | $ | 19 | $ | 3 | |||||||||
| 8,160,749 | 33,684,850 | 21,291,392 | 3,812,740 | |||||||||||||
| (55,766 | ) | (339,616 | ) | (90,090 | ) | 19,564 | |||||||||
| 131,451 | (487,555 | ) | 836,496 | (79,503 | ) | |||||||||||
| 27,190 | 9,795,176 | 7,630,947 | 356,417 | |||||||||||||
| $ | 8,263,629 | $ | 42,652,877 | $ | 29,668,764 | $ | 4,109,221 | |||||||||
| $ | 7,758,801 | $ | 31,362,684 | $ | 21,757,715 | $ | 3,506,220 | |||||||||
| $ | 527,000 | $ | 1,471,000 | $ | — | $ | 433,000 | |||||||||
| $ | — | $ | — | $ | — | $ | — | |||||||||
| $ | 265,219 | $ | — | $ | — | $ | 8,479 | |||||||||
| See accompanying Notes to Financial Statements | | May 31, 2013 | | Semiannual Report | 147 |
Table of Contents
Statements of Assets and Liabilities (cont’d)
May 31, 2013 (Unaudited)
| AllianzGI NFJ Global Dividend Value | AllianzGI NFJ International Small-Cap Value | AllianzGI NFJ International Value II | AllianzGI Redwood | AllianzGI Short Duration High Income | ||||||||||||||||||
| Net Assets: | ||||||||||||||||||||||
| Class A | $ | 9,669,185 | $ | 1,239,059 | $ | 68,959 | $ | 1,055,796 | $ | 144,565,718 | ||||||||||||
| Class C | 4,500,317 | 27,809 | 16,246 | 51,386 | 47,403,099 | |||||||||||||||||
| Class D | 592,656 | 754,374 | 12,002 | 82,001 | 15,365,798 | |||||||||||||||||
| Class R | — | — | — | — | — | |||||||||||||||||
| Class P | 1,349,786 | 12,805 | 12,013 | 136,362 | 101,817,011 | |||||||||||||||||
| Institutional Class | 53,756,772 | 6,428,882 | 3,777,317 | 6,187,303 | 123,019,164 | |||||||||||||||||
| Shares Issued and Outstanding: | ||||||||||||||||||||||
| Class A | 470,264 | 65,990 | 3,965 | 67,256 | 9,064,732 | |||||||||||||||||
| Class C | 221,424 | 1,476 | 937 | 3,346 | 2,977,146 | |||||||||||||||||
| Class D | 28,544 | 40,172 | 689 | 5,232 | 963,558 | |||||||||||||||||
| Class R | — | — | — | — | — | |||||||||||||||||
| Class P | 65,274 | 677 | 689 | 8,691 | 6,385,903 | |||||||||||||||||
| Institutional Class | 2,626,720 | 339,876 | 216,506 | 393,857 | 7,705,792 | |||||||||||||||||
| Net Asset Value and Redemption Price Per Share:* | ||||||||||||||||||||||
| Class A | $ | 20.56 | $ | 18.78 | $ | 17.39 | $ | 15.70 | $ | 15.95 | ||||||||||||
| Class C | 20.32 | 18.84 | 17.33 | 15.36 | 15.92 | |||||||||||||||||
| Class D | 20.76 | 18.78 | 17.41 | 15.67 | 15.95 | |||||||||||||||||
| Class R | — | — | — | — | — | |||||||||||||||||
| Class P | 20.68 | 18.91 | 17.44 | 15.69 | 15.94 | |||||||||||||||||
| Institutional Class | 20.47 | 18.92 | 17.45 | 15.71 | 15.96 | |||||||||||||||||
| * | Net asset value and redemption price per share may not recalculate exactly due to rounding. |
| 148 | Semiannual Report | | May 31, 2013 | | See accompanying Notes to Financial Statements |
Table of Contents
AllianzGI | AllianzGI Ultra Micro Cap | AllianzGI U.S. Emerging Growth | AllianzGI U.S. Equity Hedged | |||||||||||||
| $ | 10,135 | $ | 19,251,189 | $ | 3,192,298 | $ | 199,991 | |||||||||
| 10,098 | — | 323,131 | 10,824 | |||||||||||||
| 816,405 | — | 67,953 | 214,915 | |||||||||||||
| — | — | 19,360 | — | |||||||||||||
| 10,143 | 390,268 | 33,974 | 10,872 | |||||||||||||
| 7,416,848 | 23,011,420 | 26,032,048 | 3,672,619 | |||||||||||||
| 667 | 976,218 | 200,765 | 12,278 | |||||||||||||
| 667 | — | 20,688 | 667 | |||||||||||||
| 53,702 | — | 4,272 | 13,189 | |||||||||||||
| — | — | 1,224 | — | |||||||||||||
| 667 | 19,759 | 2,122 | 667 | |||||||||||||
| 487,239 | 1,161,137 | 1,622,213 | 225,087 | |||||||||||||
| $ | 15.20 | $ | 19.72 | $ | 15.90 | $ | 16.29 | |||||||||
| 15.15 | — | 15.62 | 16.24 | |||||||||||||
| 15.20 | — | 15.91 | 16.29 | |||||||||||||
| — | — | 15.82 | — | |||||||||||||
| 15.21 | 19.75 | 16.01 | 16.31 | |||||||||||||
| 15.22 | 19.82 | 16.05 | 16.32 | |||||||||||||
| See accompanying Notes to Financial Statements | | May 31, 2013 | | Semiannual Report | 149 |
Table of Contents
Six Months ended May 31, 2013 (Unaudited)
| AllianzGI Retirement 2015 | AllianzGI Retirement 2020 | AllianzGI Retirement 2025 | AllianzGI Retirement 2030 | AllianzGI Retirement 2035 | ||||||||||||||||||
| Investment Income: | ||||||||||||||||||||||
| Dividends from investments in Affiliates | $ | 343,205 | $ | 423,331 | $ | 370,915 | $ | 473,152 | $ | 265,706 | ||||||||||||
| Dividends, net of foreign withholding taxes | 28,042 | 32,902 | 27,727 | 44,568 | 29,389 | |||||||||||||||||
| Interest | 10 | 16 | 16 | 17 | 11 | |||||||||||||||||
| Contribution from Investment Manager (See Note 6) | — | — | — | 2,924 | 991 | |||||||||||||||||
Total Investment Income | 371,257 | 456,249 | 398,658 | 520,661 | 296,097 | |||||||||||||||||
| Expenses: | ||||||||||||||||||||||
| Investment management | 5,401 | 6,902 | 5,861 | 5,173 | 3,034 | |||||||||||||||||
| Administration | 20,102 | 26,654 | 25,530 | 24,235 | 13,451 | |||||||||||||||||
| Distribution — Class B | — | — | — | — | — | |||||||||||||||||
| Distribution — Class C | 7,210 | 1,594 | — | 2,600 | — | |||||||||||||||||
| Distribution — Class R | 602 | 1,254 | 1,252 | 1,622 | 1,131 | |||||||||||||||||
| Administrative servicing — Class P | — | — | — | — | — | |||||||||||||||||
| Servicing — Class A | 6,922 | 11,902 | 14,605 | 11,442 | 6,155 | |||||||||||||||||
| Servicing — Class B | — | — | — | — | — | |||||||||||||||||
| Servicing — Class C | 2,403 | 532 | — | 867 | — | |||||||||||||||||
| Servicing — Class D | 974 | 333 | — | 611 | — | |||||||||||||||||
| Servicing — Class R | 602 | 1,254 | 1,252 | 1,622 | 1,131 | |||||||||||||||||
| Distribution and/or servicing — Administrative Class | 1,271 | 2,016 | 2,325 | 1,932 | 2,135 | |||||||||||||||||
| Sub-transfer agent — Class A | — | — | — | — | — | |||||||||||||||||
| Sub-transfer agent — Class B | — | — | — | — | — | |||||||||||||||||
| Sub-transfer agent — Class C | — | — | — | — | — | |||||||||||||||||
| Sub-transfer agent — Class D | — | — | — | — | — | |||||||||||||||||
| Sub-transfer agent — Class R | — | — | — | — | — | |||||||||||||||||
| Sub-transfer agent — Institutional Class | — | — | — | — | — | |||||||||||||||||
| Sub-transfer agent — Administrative Class | — | — | — | — | — | |||||||||||||||||
| Trustees | — | — | — | — | — | |||||||||||||||||
| Custodian and accounting agent | — | — | — | — | — | |||||||||||||||||
| Shareholder communications | — | — | — | — | — | |||||||||||||||||
| Transfer agent | — | — | — | — | — | |||||||||||||||||
| Legal | — | — | — | — | — | |||||||||||||||||
| Insurance | — | — | — | — | — | |||||||||||||||||
| Audit and tax services | — | — | — | — | — | |||||||||||||||||
| Registration | — | — | — | — | — | |||||||||||||||||
| Miscellaneous | — | 14 | 73 | 202 | 158 | |||||||||||||||||
Total Expenses | 45,487 | 52,455 | 50,898 | 50,306 | 27,195 | |||||||||||||||||
Less: Fee Waiver/Reimbursement from Investment Manager | (14,728 | ) | (15,828 | ) | (14,809 | ) | (21,467 | ) | (10,940 | ) | ||||||||||||
Net Expenses | 30,759 | 36,627 | 36,089 | 28,839 | 16,255 | |||||||||||||||||
| Net Investment Income | 340,498 | 419,622 | 362,569 | 491,822 | 279,842 | |||||||||||||||||
| Realized and Change in Unrealized Gain (Loss): | ||||||||||||||||||||||
| Net realized gain (loss) on: | ||||||||||||||||||||||
Investments | 32,053 | 13,077 | (10,224 | ) | (4,672 | ) | 317 | |||||||||||||||
Investments in Affiliates | (113,468 | ) | (158,861 | ) | (135,456 | ) | (197,213 | ) | (101,178 | ) | ||||||||||||
| Net capital gain distributions received from underlying Affiliated funds | 330,844 | 351,075 | 315,576 | 381,918 | 207,002 | |||||||||||||||||
| Net change in unrealized appreciation/depreciation of: | ||||||||||||||||||||||
Investments | (42,399 | ) | (31,998 | ) | (12,678 | ) | (9,813 | ) | (9,228 | ) | ||||||||||||
Investments in Affiliates | (221,209 | ) | (152,113 | ) | (167,175 | ) | 330,052 | 301,664 | ||||||||||||||
| Net Realized and Change in Unrealized Gain (Loss) | (14,179 | ) | 21,180 | (9,957 | ) | 500,272 | 398,577 | |||||||||||||||
| Net Increase in Net Assets Resulting from Investment Operations | $ | 326,319 | $ | 440,802 | $ | 352,612 | $ | 992,094 | $ | 678,419 | ||||||||||||
| 150 | Semiannual Report | | May 31, 2013 | | See accompanying Notes to Financial Statements |
Table of Contents
| AllianzGI Retirement 2040 | AllianzGI Retirement 2045 | AllianzGI Retirement 2050 | AllianzGI Retirement 2055 | AllianzGI Retirement Income | AllianzGI Global Allocation | AllianzGI Global Growth Allocation | ||||||||||||||||||||||
| $ | 286,462 | $ | 142,557 | $ | 151,883 | $ | 64,240 | $ | 499,970 | $ | 3,816,120 | $ | 122,620 | |||||||||||||||
| 35,942 | 17,677 | 15,139 | 6,474 | 41,328 | 326,538 | 12,763 | ||||||||||||||||||||||
| 11 | 2 | 2 | — | 12 | 17 | 1 | ||||||||||||||||||||||
| 1,996 | 927 | 4,355 | 2,025 | 534 | — | — | ||||||||||||||||||||||
| 324,411 | 161,163 | 171,379 | 72,739 | 541,844 | 4,142,675 | 135,384 | ||||||||||||||||||||||
| 2,692 | 1,275 | 388 | 31 | 5,173 | 891,121 | 33,467 | ||||||||||||||||||||||
| 12,546 | 6,051 | 2,217 | 168 | 25,642 | — | — | ||||||||||||||||||||||
| — | — | — | — | — | 15,068 | — | ||||||||||||||||||||||
| 874 | — | 245 | — | 24,199 | 266,149 | 4,963 | ||||||||||||||||||||||
| 1,196 | 401 | 555 | 59 | 177 | 20 | 27 | ||||||||||||||||||||||
| — | — | — | — | — | 663 | 14 | ||||||||||||||||||||||
| 5,706 | 3,327 | 860 | 67 | 6,502 | 88,664 | 1,135 | ||||||||||||||||||||||
| — | — | — | — | — | 5,023 | — | ||||||||||||||||||||||
| 291 | — | 82 | — | 8,066 | 88,716 | 1,654 | ||||||||||||||||||||||
| 291 | — | 260 | — | 2,141 | 373 | 204 | ||||||||||||||||||||||
| 1,196 | 401 | 555 | 59 | 177 | 20 | 27 | ||||||||||||||||||||||
| 1,154 | 395 | 183 | 28 | 512 | 2,138 | 22 | ||||||||||||||||||||||
| — | — | — | — | — | 19,021 | 192 | ||||||||||||||||||||||
| — | — | — | — | — | 3,084 | — | ||||||||||||||||||||||
| — | — | — | — | — | 11,705 | 317 | ||||||||||||||||||||||
| — | — | — | — | — | 90 | 60 | ||||||||||||||||||||||
| — | — | — | — | — | — | 16 | ||||||||||||||||||||||
| — | — | — | — | — | 20,320 | 1,653 | ||||||||||||||||||||||
| — | — | — | — | — | 526 | — | ||||||||||||||||||||||
| — | — | — | — | — | 27,759 | 681 | ||||||||||||||||||||||
| — | — | — | — | — | 25,047 | 29,289 | ||||||||||||||||||||||
| — | — | — | — | — | 20,146 | 4,355 | ||||||||||||||||||||||
| — | — | — | — | — | 36,023 | 4,445 | ||||||||||||||||||||||
| — | — | — | — | — | 14,468 | 8,011 | ||||||||||||||||||||||
| — | — | — | — | — | 4,809 | 2,388 | ||||||||||||||||||||||
| — | — | — | — | — | 21,716 | 12,897 | ||||||||||||||||||||||
| — | — | — | — | — | 33,040 | 30,919 | ||||||||||||||||||||||
| 178 | 76 | 31 | 2 | — | 2,615 | 2,461 | ||||||||||||||||||||||
| 26,124 | 11,926 | 5,376 | 414 | 72,589 | 1,598,324 | 139,197 | ||||||||||||||||||||||
| | (10,458 | ) | (5,148 | ) | (2,082 | ) | (156 | ) | (17,202 | ) | (961,506 | ) | (125,595 | ) | ||||||||||||||
| 15,666 | 6,778 | 3,294 | 258 | 55,387 | 636,818 | 13,602 | ||||||||||||||||||||||
| 308,745 | 154,385 | 168,085 | 72,481 | 486,457 | 3,505,857 | 121,782 | ||||||||||||||||||||||
| 1,072 | 166 | 3,120 | 2,289 | 47,829 | 112,234 | 9,906 | ||||||||||||||||||||||
| (87,291 | ) | (38,733 | ) | (39,691 | ) | 7,621 | (24,578 | ) | 2,235,141 | 179,001 | ||||||||||||||||||
| | 216,828 | | 103,582 | 125,036 | 45,517 | 485,852 | 3,013,104 | 103,628 | ||||||||||||||||||||
| 19,095 | 14,432 | 18,572 | 8,357 | (53,751 | ) | 172,238 | 9,165 | |||||||||||||||||||||
| 614,864 | 343,375 | 429,166 | 159,926 | (388,070 | ) | 3,595,533 | 211,419 | |||||||||||||||||||||
| 764,568 | 422,822 | 536,203 | 223,710 | 67,282 | 9,128,250 | 513,119 | ||||||||||||||||||||||
| $ | 1,073,313 | $ | 577,207 | $ | 704,288 | $ | 296,191 | $ | 553,739 | $ | 12,634,107 | $ | 634,901 | |||||||||||||||
| See accompanying Notes to Financial Statements | | May 31, 2013 | | Semiannual Report | 151 |
Table of Contents
Statements of Operations (cont’d)
Six Months ended May 31, 2013 (Unaudited)
| AllianzGI Behavioral Advantage Large Cap | AllianzGI China Equity | AllianzGI Convertible | AllianzGI Disciplined Equity | AllianzGI Dynamic Emerging Multi-Asset (1) | ||||||||||||||||||
| Investment Income: | ||||||||||||||||||||||
| Interest | $ | 26 | $ | 5 | $ | 11,229,107 | $ | 63 | $ | 459 | ||||||||||||
| Dividends, net of foreign withholding taxes | 293,648 | 13,790 | 5,602,203 | 520,826 | — | |||||||||||||||||
| Dividends from investments in Affiliates | — | 1,288 | — | — | 63,276 | |||||||||||||||||
| Miscellaneous | 1 | 3 | 202,812 | — | — | |||||||||||||||||
Total Investment Income | 293,675 | 15,086 | 17,034,122 | 520,889 | 63,735 | |||||||||||||||||
| Expenses: | ||||||||||||||||||||||
| Investment management | 51,076 | 23,590 | 3,681,216 | 152,469 | 20,915 | |||||||||||||||||
| Distribution — Class C | 272 | 245 | 166,931 | 3,663 | 84 | |||||||||||||||||
| Distribution — Class R | — | — | 333 | — | — | |||||||||||||||||
| Administrative servicing — Class P | 7 | 13 | 30,554 | 16 | — | |||||||||||||||||
| Servicing — Class A | 134 | 170 | 136,991 | 11,867 | 12 | |||||||||||||||||
| Servicing — Class C | 91 | 81 | 55,644 | 1,221 | 28 | |||||||||||||||||
| Servicing — Class D | 374 | 463 | 51,058 | 294 | 15 | |||||||||||||||||
| Servicing — Class R | — | — | 333 | — | — | |||||||||||||||||
| Distribution and/or servicing — Administrative Class | — | — | 3,889 | — | — | |||||||||||||||||
| Sub-transfer agent — Class A | 14 | 157 | 31,694 | 9,863 | — | |||||||||||||||||
| Sub-transfer agent — Class C | 7 | 254 | 10,808 | 155 | — | |||||||||||||||||
| Sub-transfer agent — Class D | 26 | 10,276 | 27,455 | 1,524 | — | |||||||||||||||||
| Sub-transfer agent — Class R | — | — | 307 | — | — | |||||||||||||||||
| Sub-transfer agent — Institutional Class | 15 | 11 | 10,331 | 113 | — | |||||||||||||||||
| Sub-transfer agent — Administrative Class | — | — | 54 | — | — | |||||||||||||||||
| Legal | 2,992 | 6,024 | 52,707 | 4,291 | 4,941 | |||||||||||||||||
| Trustees | 1,791 | 466 | 108,867 | 4,968 | 577 | |||||||||||||||||
| Audit and tax services | 12,580 | 12,339 | 31,349 | 19,587 | 22,703 | |||||||||||||||||
| Registration | 16,364 | 15,261 | 73,827 | 14,886 | 3,879 | |||||||||||||||||
| Custodian and accounting agent | 51,369 | 40,498 | 73,724 | 34,078 | 30,660 | |||||||||||||||||
| Shareholder communications | 5,481 | 5,426 | 41,177 | 5,584 | 4,429 | |||||||||||||||||
| Transfer agent | 2,862 | 2,872 | 37,390 | 6,666 | 1,362 | |||||||||||||||||
| Organizational | — | — | — | — | 20,237 | |||||||||||||||||
| Offering | — | — | — | — | 59,999 | |||||||||||||||||
| Insurance | 2,497 | 2,333 | 11,631 | 3,013 | — | |||||||||||||||||
| Miscellaneous | 2,652 | 2,733 | 6,220 | 2,938 | 2,474 | |||||||||||||||||
Total Expenses | 150,604 | 123,212 | 4,644,490 | 277,196 | 172,315 | |||||||||||||||||
Less: Fee Waiver/Reimbursement from Investment Manager | (79,327 | ) | (90,963 | ) | — | (82,256 | ) | (143,842 | ) | |||||||||||||
Net Expenses | 71,277 | 32,249 | 4,644,490 | 194,940 | 28,473 | |||||||||||||||||
| Net Investment Income (Loss) | 222,398 | (17,163 | ) | 12,389,632 | 325,949 | 35,262 | ||||||||||||||||
| Realized and Change in Unrealized Gain (Loss): | ||||||||||||||||||||||
| Net realized gain (loss) on: | ||||||||||||||||||||||
Investments | 604,087 | (46,146 | ) | 29,329,810 | 465,701 | 81 | ||||||||||||||||
Investments in Affiliates | — | 2,153 | — | — | (12,904 | ) | ||||||||||||||||
Futures contracts | — | — | — | — | (8,950 | ) | ||||||||||||||||
Foreign currency transactions | — | (70 | ) | — | — | — | ||||||||||||||||
| Payments from Affiliates (See Note 12) | — | 34,556 | — | — | — | |||||||||||||||||
| Net change in unrealized appreciation/depreciation of: | ||||||||||||||||||||||
Investments | 3,039,915 | 31,812 | 137,098,006 | 5,099,977 | (101 | ) | ||||||||||||||||
Investments in Affiliates | — | 184,611 | — | — | (114,624 | ) | ||||||||||||||||
Futures contracts | — | — | — | — | (177,188 | ) | ||||||||||||||||
Foreign currency transactions | — | 2 | — | — | (3,405 | ) | ||||||||||||||||
| Net Realized and Change in Unrealized Gain (Loss) | 3,644,002 | 206,918 | 166,427,816 | 5,565,678 | (317,091 | ) | ||||||||||||||||
| Net Increase (Decrease) in Net Assets Resulting from Investment Operations | $ | 3,866,400 | $ | 189,755 | $ | 178,817,448 | $ | 5,891,627 | $ | (281,829 | ) | |||||||||||
| (1) | Commencement of operations, December 17, 2012 |
| (2) | Commencement of operations, December 18, 2012 |
| 152 | Semiannual Report | | May 31, 2013 | | See accompanying Notes to Financial Statements |
Table of Contents
| AllianzGI Global Managed Volatility | AllianzGI Global Water | AllianzGI High Yield Bond | AllianzGI International Small-Cap | AllianzGI Micro Cap | AllianzGI Multi-Asset Real Return (1) | AllianzGI NFJ Emerging Markets Value (2) | ||||||||||||||||||||||
| $ | 12 | $ | 486 | $ | 14,002,597 | $ | 204 | $ | 43 | $ | 13,528 | $ | 13 | |||||||||||||||
| 324,735 | 2,174,920 | — | 914,840 | 100,262 | 32,240 | 114,519 | ||||||||||||||||||||||
| — | 49,825 | — | 207,367 | — | 9,936 | — | ||||||||||||||||||||||
| 1 | — | 38,363 | — | — | — | — | ||||||||||||||||||||||
| 324,748 | 2,225,231 | 14,040,960 | 1,122,411 | 100,305 | 55,704 | 114,532 | ||||||||||||||||||||||
| 31,108 | 651,560 | 907,706 | 572,133 | 195,141 | 17,723 | 22,540 | ||||||||||||||||||||||
| 252 | 113,449 | 115,684 | 2,090 | — | 37 | 36 | ||||||||||||||||||||||
| — | — | 2,853 | 18 | — | — | — | ||||||||||||||||||||||
| 5 | 10,891 | 8,331 | 14,729 | 385 | — | — | ||||||||||||||||||||||
| 82 | 87,815 | 140,729 | 3,809 | 308 | 25 | 14 | ||||||||||||||||||||||
| 84 | 37,816 | 38,561 | 697 | — | 12 | 11 | ||||||||||||||||||||||
| 83 | 13,091 | 71,711 | 148 | — | 12 | 479 | ||||||||||||||||||||||
| — | — | 2,853 | 18 | — | — | — | ||||||||||||||||||||||
| — | — | 36,222 | 16 | — | — | — | ||||||||||||||||||||||
| 26 | 25,841 | 10,054 | 5,021 | 33 | — | — | ||||||||||||||||||||||
| 2 | 11,686 | 6,811 | 157 | — | — | — | ||||||||||||||||||||||
| 8 | 2,264 | 18,144 | 297 | — | — | 253 | ||||||||||||||||||||||
| — | — | 1,706 | — | — | — | — | ||||||||||||||||||||||
| 3,191 | 52 | 1,745 | 5,263 | 15,631 | — | — | ||||||||||||||||||||||
| — | — | 7 | 1 | — | — | — | ||||||||||||||||||||||
| 7,228 | 16,685 | 21,724 | 9,243 | 4,702 | 4,885 | 9,104 | ||||||||||||||||||||||
| 1,418 | 11,491 | 36,755 | 13,116 | 3,304 | 543 | 2,562 | ||||||||||||||||||||||
| 16,617 | 21,944 | 22,627 | 14,946 | 16,026 | 23,897 | 15,928 | ||||||||||||||||||||||
| 38,495 | 27,584 | 53,821 | 43,861 | 21,899 | 5,223 | 5,044 | ||||||||||||||||||||||
| 72,857 | 57,239 | 41,272 | 111,549 | 33,274 | 33,632 | 54,066 | ||||||||||||||||||||||
| 10,324 | 16,003 | 17,626 | 20,018 | 10,019 | 3,966 | 2,897 | ||||||||||||||||||||||
| 3,052 | 8,505 | 16,893 | 8,014 | 5,350 | 1,357 | 3,047 | ||||||||||||||||||||||
| — | — | — | — | — | 21,330 | 8,934 | ||||||||||||||||||||||
| 4,640 | — | — | — | — | 60,430 | 36,053 | ||||||||||||||||||||||
| 2,491 | 3,741 | 5,716 | 3,849 | 3,028 | — | — | ||||||||||||||||||||||
| 3,254 | 6,934 | 2,735 | 4,380 | 2,516 | 2,401 | 2,653 | ||||||||||||||||||||||
| 195,217 | 1,124,591 | 1,582,286 | 833,373 | 311,616 | 175,473 | 163,621 | ||||||||||||||||||||||
| | (147,970 | ) | — | (1,089 | ) | (124,247 | ) | (70,489 | ) | (160,644 | ) | (133,536 | ) | |||||||||||||||
| 47,247 | 1,124,591 | 1,581,197 | 709,126 | 241,127 | 14,829 | 30,085 | ||||||||||||||||||||||
| 277,501 | 1,100,640 | 12,459,763 | 413,285 | (140,822 | ) | 40,875 | 84,447 | |||||||||||||||||||||
| 547,952 | 2,587,645 | 3,319,016 | 12,853,537 | 1,196,314 | 11,284 | 39,921 | ||||||||||||||||||||||
| — | 176,863 | — | 2,194,727 | — | (3,103 | ) | — | |||||||||||||||||||||
| — | — | — | — | — | 2,550 | — | ||||||||||||||||||||||
| (5,830 | ) | (72,436 | ) | — | (114,854 | ) | — | 114 | (11,266 | ) | ||||||||||||||||||
| — | — | — | — | — | — | — | ||||||||||||||||||||||
| 324,451 | 7,068,140 | 6,941,600 | (440,378 | ) | 4,745,944 | 1,874 | 25,048 | |||||||||||||||||||||
| — | 785,692 | — | 3,162,809 | — | (3,168 | ) | — | |||||||||||||||||||||
| — | — | — | — | — | 1,630 | — | ||||||||||||||||||||||
| (542 | ) | 8,339 | — | 1,126 | — | (100 | ) | (962 | ) | |||||||||||||||||||
| 866,031 | 10,554,243 | 10,260,616 | 17,656,967 | 5,942,258 | 11,081 | 52,741 | ||||||||||||||||||||||
| $ | 1,143,532 | $ | 11,654,883 | $ | 22,720,379 | $ | 18,070,252 | $ | 5,801,436 | $ | 51,956 | $ | 137,188 | |||||||||||||||
| See accompanying Notes to Financial Statements | | May 31, 2013 | | Semiannual Report | 153 |
Table of Contents
Statements of Operations (cont’d)
Six Months ended May 31, 2013 (Unaudited)
| AllianzGI NFJ Global Dividend Value | AllianzGI NFJ International Small-Cap Value | AllianzGI NFJ International Value II | AllianzGI Redwood | AllianzGI Short Duration High Income | ||||||||||||||||||
| Investment Income: | ||||||||||||||||||||||
| Interest | $ | 76 | $ | 14 | $ | 2 | $ | 130 | $ | 7,311,321 | ||||||||||||
| Dividends, net of foreign withholding taxes | 1,553,715 | 139,416 | 73,165 | 81,537 | — | |||||||||||||||||
| Miscellaneous | — | 140 | 109 | — | 184,686 | |||||||||||||||||
Total Investment Income | 1,553,791 | 139,570 | 73,276 | 81,667 | 7,496,007 | |||||||||||||||||
| Expenses: | ||||||||||||||||||||||
| Investment management | 251,959 | �� | 33,714 | 17,092 | 43,715 | 733,534 | ||||||||||||||||
| Distribution — Class C | 15,717 | 78 | 52 | 191 | 46,786 | |||||||||||||||||
| Distribution — Class R | — | — | — | — | — | |||||||||||||||||
| Administrative servicing — Class P | 590 | — | 5 | 69 | 37,692 | |||||||||||||||||
| Servicing — Class A | 11,019 | 1,478 | 71 | 1,587 | 130,267 | |||||||||||||||||
| Servicing — Class C | 5,239 | 26 | 18 | 64 | 46,786 | |||||||||||||||||
| Servicing — Class D | 655 | 677 | 15 | 107 | 16,692 | |||||||||||||||||
| Servicing — Class R | — | — | — | — | — | |||||||||||||||||
| Sub-transfer agent — Class A | 1,584 | 3 | — | 93 | 9,328 | |||||||||||||||||
| Sub-transfer agent — Class C | 888 | — | — | 15 | 3,314 | |||||||||||||||||
| Sub-transfer agent — Class D | 490 | 379 | — | 1,552 | 3,721 | |||||||||||||||||
| Sub-transfer agent — Institutional Class | 1,197 | 1,277 | 972 | 100 | 1,210 | |||||||||||||||||
| Legal | 5,126 | 4,676 | 4,768 | 7,601 | 20,832 | |||||||||||||||||
| Trustees | 5,531 | 493 | 199 | 1,091 | 20,251 | |||||||||||||||||
| Audit and tax services | 12,942 | 12,353 | 15,675 | 12,817 | 15,358 | |||||||||||||||||
| Registration | 16,611 | 14,900 | 34,415 | 40,181 | 58,892 | |||||||||||||||||
| Custodian and accounting agent | 51,933 | 60,918 | 51,965 | 39,214 | 36,744 | |||||||||||||||||
| Shareholder communications | 5,596 | 4,045 | 3,605 | 6,099 | 9,942 | |||||||||||||||||
| Transfer agent | 6,011 | 2,351 | 2,103 | 5,638 | 21,947 | |||||||||||||||||
| Organizational | — | — | — | — | — | |||||||||||||||||
| Offering | — | 63,963 | 241 | — | — | |||||||||||||||||
| Insurance | 2,966 | 2,304 | 2,303 | 2,463 | 3,074 | |||||||||||||||||
| Miscellaneous | 8,735 | 2,858 | 2,479 | 2,661 | 2,023 | |||||||||||||||||
Total Expenses | 404,789 | 206,493 | 135,978 | 165,258 | 1,218,393 | |||||||||||||||||
Less: Fee Waiver/Reimbursement from Investment Manager | (65,426 | ) | (161,227 | ) | (115,495 | ) | (102,289 | ) | (21,449 | ) | ||||||||||||
Net Expenses | 339,363 | 45,266 | 20,483 | 62,969 | 1,196,944 | |||||||||||||||||
| Net Investment Income (Loss) | 1,214,428 | 94,304 | 52,793 | 18,698 | 6,299,063 | |||||||||||||||||
| Realized and Change in Unrealized Gain (Loss): | ||||||||||||||||||||||
| Net realized gain (loss) on: | ||||||||||||||||||||||
Investments | 2,127,642 | 179,536 | 131,378 | 546,126 | (342,003 | ) | ||||||||||||||||
Options written | — | — | — | (202,696 | ) | — | ||||||||||||||||
Foreign currency transactions | (21,844 | ) | 109 | (723 | ) | (1 | ) | — | ||||||||||||||
| Net change in unrealized appreciation/depreciation of: | ||||||||||||||||||||||
Investments | 4,949,501 | 428,029 | 156,172 | 629,976 | (219,707 | ) | ||||||||||||||||
Options written | — | — | — | (682,659 | ) | — | ||||||||||||||||
Foreign currency transactions | 1,712 | (681 | ) | (257 | ) | 1 | — | |||||||||||||||
| Net Realized and Change in Unrealized Gain (Loss) | 7,057,011 | 606,993 | 286,570 | 290,747 | (561,710 | ) | ||||||||||||||||
| Net Increase in Net Assets Resulting from Investment Operations | $ | 8,271,439 | $ | 701,297 | $ | 339,363 | $ | 309,445 | $ | 5,737,353 | ||||||||||||
| (1) | Commencement of operations, December 3, 2012. |
| 154 | Semiannual Report | | May 31, 2013 | | See accompanying Notes to Financial Statements |
Table of Contents
| AllianzGI Structured Alpha (1) | AllianzGI Ultra Micro Cap | AllianzGI U.S. Emerging Growth | AllianzGI U.S. Equity Hedged (1) | |||||||||||||
| $ | 2,858 | $ | 63 | $ | 44 | $ | 11 | |||||||||
| — | 125,512 | 129,242 | 37,147 | |||||||||||||
| 775 | — | — | 1 | |||||||||||||
| 3,633 | 125,575 | 129,286 | 37,159 | |||||||||||||
| 44,402 | 217,381 | 114,078 | 11,999 | |||||||||||||
| 37 | — | 1,088 | 38 | |||||||||||||
| — | — | 15 | — | |||||||||||||
| — | 151 | 12 | — | |||||||||||||
| 13 | 15,278 | 2,459 | 21 | |||||||||||||
| 13 | — | 363 | 13 | |||||||||||||
| 722 | — | 81 | 184 | |||||||||||||
| — | — | 15 | — | |||||||||||||
| — | 974 | 1,021 | — | |||||||||||||
| — | — | 60 | — | |||||||||||||
| 682 | — | 11 | 681 | |||||||||||||
| — | 10,296 | 1,419 | — | |||||||||||||
| 10,589 | 5,450 | 3,695 | 6,923 | |||||||||||||
| 1,238 | 1,696 | 2,730 | 706 | |||||||||||||
| 13,779 | 12,409 | 13,279 | 13,779 | |||||||||||||
| 5,330 | 22,406 | 40,670 | 5,389 | |||||||||||||
| 48,766 | 33,949 | 41,377 | 51,859 | |||||||||||||
| 8,282 | 9,518 | 5,146 | 6,121 | |||||||||||||
| 2,404 | 3,789 | 6,156 | 1,645 | |||||||||||||
| 11,386 | — | — | 16,784 | |||||||||||||
| 47,446 | — | — | 46,641 | |||||||||||||
| — | 2,512 | 2,592 | — | |||||||||||||
| 2,230 | 2,241 | 2,823 | 2,821 | |||||||||||||
| 197,319 | 338,050 | 239,090 | 165,604 | |||||||||||||
| | (137,920 | ) | (31,712 | ) | (87,783 | ) | (148,009 | ) | ||||||||
| 59,399 | 306,338 | 151,307 | 17,595 | |||||||||||||
| (55,766 | ) | (180,763 | ) | (22,021 | ) | 19,564 | ||||||||||
| (185,456 | ) | (444,706 | ) | 1,026,044 | (38,405 | ) | ||||||||||
| 316,907 | — | — | (41,098 | ) | ||||||||||||
| — | — | — | — | |||||||||||||
| 47,274 | 7,250,681 | 4,142,979 | 356,448 | |||||||||||||
| (20,084 | ) | — | — | (31 | ) | |||||||||||
| — | — | — | — | |||||||||||||
| 158,641 | 6,805,975 | 5,169,023 | 276,914 | |||||||||||||
| $ | 102,875 | | $ | 6,625,212 | $ | 5,147,002 | $ | 296,478 | ||||||||
| See accompanying Notes to Financial Statements | | May 31, 2013 | | Semiannual Report | 155 |
Table of Contents
Statements of Changes in Net Assets
| AllianzGI Retirement 2015 | AllianzGI Retirement 2020 | |||||||||||||||||
| Six Months ended May 31, 2013 (Unaudited) | Year ended November 30, 2012 | Six Months ended May 31, 2013 (Unaudited) | Year ended November 30, 2012 | |||||||||||||||
| Increase in Net Assets from: | ||||||||||||||||||
Investment Operations: | ||||||||||||||||||
| Net investment income | $ | 340,498 | $ | 291,980 | $ | 419,622 | $ | 225,127 | ||||||||||
| Net realized gain | 249,429 | 171,617 | 205,291 | 93,268 | ||||||||||||||
| Net change in unrealized appreciation/depreciation | (263,608 | ) | 565,732 | (184,111 | ) | 396,728 | ||||||||||||
| Net increase in net assets resulting from investment operations | 326,319 | 1,029,329 | 440,802 | 715,123 | ||||||||||||||
| Dividends and Distributions to Shareholders from: | ||||||||||||||||||
| Net investment income: | ||||||||||||||||||
Class A | (151,229 | ) | (57,065 | ) | (216,157 | ) | (12,596 | ) | ||||||||||
Class C | (38,226 | ) | (71,142 | ) | (2,686 | ) | (22,396 | ) | ||||||||||
Class D | (36,338 | ) | (9,370 | ) | (6,077 | ) | (3,794 | ) | ||||||||||
Class R | (13,152 | ) | (483 | ) | (22,640 | ) | (469 | ) | ||||||||||
Class P | (110,299 | ) | (553 | ) | (124,213 | ) | (1,453 | ) | ||||||||||
Class R6 | (219,816 | ) | (238,384 | ) | (176,616 | ) | (203,293 | ) | ||||||||||
Administrative Class | (397 | ) | (526 | ) | (3,255 | ) | (513 | ) | ||||||||||
| Net realized capital gains: | ||||||||||||||||||
Class A | — | (31,768 | ) | (19,386 | ) | (13,533 | ) | |||||||||||
Class C | — | (47,896 | ) | (856 | ) | (28,097 | ) | |||||||||||
Class D | — | (5,211 | ) | (611 | ) | (4,203 | ) | |||||||||||
Class R | — | (287 | ) | (2,143 | ) | (552 | ) | |||||||||||
Class P | — | (289 | ) | (11,058 | ) | (1,485 | ) | |||||||||||
Class R6 | — | (121,636 | ) | (15,572 | ) | (204,080 | ) | |||||||||||
Administrative Class | — | (288 | ) | (291 | ) | (555 | ) | |||||||||||
| Total Dividends and Distributions to Shareholders | (569,457 | ) | (584,898 | ) | (601,561 | ) | (497,019 | ) | ||||||||||
| Fund Share Transactions: | ||||||||||||||||||
| Net proceeds from the sale of shares | 11,841,252 | 11,139,034 | 25,028,534 | 10,147,334 | ||||||||||||||
| Issued in reinvestment of dividends and distributions | 563,101 | 581,764 | 601,563 | 497,019 | ||||||||||||||
| Cost of shares redeemed | (5,909,705 | ) | (4,545,183 | ) | (6,775,052 | ) | (1,625,697 | ) | ||||||||||
| Net increase from Fund share transactions | 6,494,648 | 7,175,615 | 18,855,045 | 9,018,656 | ||||||||||||||
| Total Increase in Net Assets | 6,251,510 | 7,620,046 | 18,694,286 | 9,236,760 | ||||||||||||||
| Net Assets: | ||||||||||||||||||
| Beginning of period | 17,709,344 | 10,089,298 | 15,599,136 | 6,362,376 | ||||||||||||||
| End of period* | $ | 23,960,854 | $ | 17,709,344 | $ | 34,293,422 | $ | 15,599,136 | ||||||||||
| * Including undistributed (dividends in excess of) net investment income of: | $ | (758 | ) | $ | 228,201 | $ | 49,134 | $ | 181,156 | |||||||||
| ** | Commencement of operations. |
| 156 | Semiannual Report | | May 31, 2013 | | See accompanying Notes to Financial Statements |
Table of Contents
| AllianzGI Retirement 2025 | AllianzGI Retirement 2030 | |||||||||||||||
| Six Months ended May 31, 2013 (Unaudited) | Period from December 19, 2011** through November 30, 2012 | Six Months ended May 31, 2013 (Unaudited) | Year ended November 30, 2012 | |||||||||||||
| $ | 362,569 | $ | 129,165 | $ | 491,822 | $ | 302,661 | |||||||||
| 169,896 | 42,152 | 180,033 | 25,727 | |||||||||||||
| (179,853 | ) | 246,377 | 320,239 | 552,230 | ||||||||||||
| 352,612 | 417,694 | 992,094 | 880,618 | |||||||||||||
| (236,114 | ) | (96 | ) | (221,948 | ) | (15,954 | ) | |||||||||
| — | — | (10,874 | ) | (18,081 | ) | |||||||||||
| — | — | (10,072 | ) | (13,093 | ) | |||||||||||
| (21,077 | ) | (95 | ) | (29,886 | ) | (468 | ) | |||||||||
| (92,938 | ) | (97 | ) | (144,236 | ) | (707 | ) | |||||||||
| (106,062 | ) | (29,182 | ) | (263,982 | ) | (219,827 | ) | |||||||||
| (233 | ) | (96 | ) | (420 | ) | (514 | ) | |||||||||
| (23,221 | ) | — | (16,312 | ) | (27,599 | ) | ||||||||||
| — | — | (1,180 | ) | (39,417 | ) | |||||||||||
| — | — | (815 | ) | (22,549 | ) | |||||||||||
| (2,346 | ) | — | (2,130 | ) | (866 | ) | ||||||||||
| (9,454 | ) | — | (10,211 | ) | (1,119 | ) | ||||||||||
| (10,681 | ) | — | (18,688 | ) | (345,660 | ) | ||||||||||
| (27 | ) | — | (32 | ) | (870 | ) | ||||||||||
| (502,153 | ) | (29,566 | ) | (730,786 | ) | (706,724 | ) | |||||||||
| 26,139,119 | 8,735,103 | 23,218,275 | 20,924,021 | |||||||||||||
| 493,967 | 29,566 | 728,194 | 704,116 | |||||||||||||
| (4,397,934 | ) | (1,315,058 | ) | (11,484,824 | ) | (1,933,800 | ) | |||||||||
| 22,235,152 | 7,449,611 | 12,461,645 | 19,694,337 | |||||||||||||
| 22,085,611 | 7,837,739 | 12,722,953 | 19,868,231 | |||||||||||||
| 10,877,739 | 3,040,000 | 27,220,317 | 7,352,086 | |||||||||||||
| $ | 32,963,350 | $ | 10,877,739 | $ | 39,943,270 | $ | 27,220,317 | |||||||||
| $ | 15,745 | $ | 109,600 | $ | 53,294 | $ | 242,890 | |||||||||
| See accompanying Notes to Financial Statements | | May 31, 2013 | | Semiannual Report | 157 |
Table of Contents
Statements of Changes in Net Assets (cont’d)
| AllianzGI Retirement 2035 | AllianzGI Retirement 2040 | |||||||||||||||||
| Six Months ended May 31, 2013 (Unaudited) | Period from December 19, 2011** through November 30, 2012 | Six Months ended May 31, 2013 (Unaudited) | Year ended November 30, 2012 | |||||||||||||||
| Increase in Net Assets from: | ||||||||||||||||||
Investment Operations: | ||||||||||||||||||
| Net investment income | $ | 279,842 | $ | 125,065 | $ | 308,745 | $ | 209,848 | ||||||||||
| Net realized gain (loss) | 106,141 | 42,428 | 130,609 | (33,833 | ) | |||||||||||||
| Net change in unrealized appreciation/depreciation | 292,436 | 251,390 | 633,959 | 478,048 | ||||||||||||||
| Net increase in net assets resulting from investment operations | 678,419 | 418,883 | 1,073,313 | 654,063 | ||||||||||||||
| Dividends and Distributions to Shareholders from: | ||||||||||||||||||
| Net investment income: | ||||||||||||||||||
Class A | (101,742 | ) | (116 | ) | (100,875 | ) | (5,161 | ) | ||||||||||
Class C | — | — | (4,540 | ) | (2,456 | ) | ||||||||||||
Class D | — | — | (5,385 | ) | (6,323 | ) | ||||||||||||
Class R | (19,990 | ) | (115 | ) | (22,878 | ) | (472 | ) | ||||||||||
Class P | (102,453 | ) | (117 | ) | (64,785 | ) | (550 | ) | ||||||||||
Class R6 | (127,515 | ) | (35,326 | ) | (214,057 | ) | (197,775 | ) | ||||||||||
Administrative Class | (260 | ) | (117 | ) | (654 | ) | (520 | ) | ||||||||||
| Net realized capital gains: | ||||||||||||||||||
Class A | (12,647 | ) | — | (7,526 | ) | (13,171 | ) | |||||||||||
Class C | — | — | (430 | ) | (7,625 | ) | ||||||||||||
Class D | — | — | (469 | ) | (16,614 | ) | ||||||||||||
Class R | (2,705 | ) | — | (1,642 | ) | (1,289 | ) | |||||||||||
Class P | (12,960 | ) | — | (4,734 | ) | (1,297 | ) | |||||||||||
Class R6 | (16,130 | ) | — | (15,641 | ) | (455,039 | ) | |||||||||||
Administrative Class | (36 | ) | — | (51 | ) | (1,294 | ) | |||||||||||
| Total Dividends and Distributions to Shareholders | (396,438 | ) | (35,791 | ) | (443,667 | ) | (709,586 | ) | ||||||||||
| Fund Share Transactions: | ||||||||||||||||||
| Net proceeds from the sale of shares | 17,248,183 | 7,228,730 | 13,074,602 | 7,975,210 | ||||||||||||||
| Issued in reinvestment of dividends and distributions | 393,825 | 35,791 | 440,827 | 709,035 | ||||||||||||||
| Cost of shares redeemed | (1,378,283 | ) | (456,796 | ) | (2,662,094 | ) | (1,068,168 | ) | ||||||||||
| Net increase from Fund share transactions | 16,263,725 | 6,807,725 | 10,853,335 | 7,616,077 | ||||||||||||||
| Total Increase in Net Assets | 16,545,706 | 7,190,817 | 11,482,981 | 7,560,554 | ||||||||||||||
| Net Assets: | ||||||||||||||||||
| Beginning of period | 10,230,817 | 3,040,000 | 13,345,143 | 5,784,589 | ||||||||||||||
| End of period* | $ | 26,776,523 | $ | 10,230,817 | $ | 24,828,124 | $ | 13,345,143 | ||||||||||
| * Including undistributed net investment income of: | $ | 28,188 | $ | 100,306 | $ | 53,411 | $ | 157,840 | ||||||||||
| ** | Commencement of operations. |
| 158 | Semiannual Report | | May 31, 2013 | | See accompanying Notes to Financial Statements |
Table of Contents
| AllianzGI Retirement 2045 | AllianzGI Retirement 2050 | |||||||||||||||
| Six Months ended May 31, 2013 (Unaudited) | Period from December 19, 2011** through November 30, 2012 | Six Months ended May 31, 2013 (Unaudited) | Year ended November 30, 2012 | |||||||||||||
| $ | 154,385 | $ | 113,082 | $ | 168,085 | $ | 191,524 | |||||||||
| 65,015 | 40,903 | 88,465 | (35,872 | ) | ||||||||||||
| 357,807 | 293,248 | 447,738 | 469,394 | |||||||||||||
| 577,207 | 447,233 | 704,288 | 625,046 | |||||||||||||
| (62,334 | ) | (145 | ) | (16,717 | ) | (3,920 | ) | |||||||||
| — | — | (1,272 | ) | (1,430 | ) | |||||||||||
| — | — | (5,883 | ) | (6,972 | ) | |||||||||||
| (7,644 | ) | (144 | ) | (11,240 | ) | (580 | ) | |||||||||
| (43,843 | ) | (146 | ) | (24,444 | ) | (594 | ) | |||||||||
| (101,568 | ) | (43,892 | ) | (208,847 | ) | (204,871 | ) | |||||||||
| (308 | ) | (145 | ) | (511 | ) | (564 | ) | |||||||||
| (11,766 | ) | — | (1,871 | ) | (9,167 | ) | ||||||||||
| — | — | (209 | ) | (4,374 | ) | |||||||||||
| — | — | (706 | ) | (17,251 | ) | |||||||||||
| (1,539 | ) | — | (1,253 | ) | (1,526 | ) | ||||||||||
| (8,225 | ) | — | (2,589 | ) | (1,363 | ) | ||||||||||
| (19,054 | ) | — | (22,121 | ) | (459,370 | ) | ||||||||||
| (63 | ) | — | (58 | ) | (1,360 | ) | ||||||||||
| (256,344 | ) | (44,472 | ) | (297,721 | ) | (713,342 | ) | |||||||||
| 5,200,487 | 2,489,529 | 3,088,635 | 4,166,132 | |||||||||||||
| 256,223 | 44,472 | 297,721 | 713,342 | |||||||||||||
| (413,740 | ) | (293,697 | ) | (1,383,506 | ) | (1,093,654 | ) | |||||||||
| 5,042,970 | 2,240,304 | 2,002,850 | 3,785,820 | |||||||||||||
| 5,363,833 | 2,643,065 | 2,409,417 | 3,697,524 | |||||||||||||
| 5,683,065 | 3,040,000 | 9,201,523 | 5,503,999 | |||||||||||||
| $ | 11,046,898 | $ | 5,683,065 | $ | 11,610,940 | $ | 9,201,523 | |||||||||
| $ | 18,343 | $ | 79,655 | $ | 30,064 | $ | 130,893 | |||||||||
| See accompanying Notes to Financial Statements | | May 31, 2013 | | Semiannual Report | 159 |
Table of Contents
Statements of Changes in Net Assets (cont’d)
| AllianzGI Retirement 2055 | AllianzGI Retirement Income | |||||||||||||||||
| Six Months ended May 31, 2013 (Unaudited) | Period from December 19, 2011** through November 30, 2012 | Six Months ended May 31, 2013 (Unaudited) | Year ended November 30, 2012 | |||||||||||||||
| Increase (Decrease) in Net Assets from: | ||||||||||||||||||
Investment Operations: | ||||||||||||||||||
| Net investment income | $ | 72,481 | $ | 102,932 | $ | 486,457 | $ | 449,528 | ||||||||||
| Net realized gain | 55,427 | 71,460 | 509,103 | 244,472 | ||||||||||||||
| Net change in unrealized appreciation/depreciation | 168,283 | 297,742 | (441,821 | ) | 1,073,957 | |||||||||||||
| Net increase in net assets resulting from investment operations | 296,191 | 472,134 | 553,739 | 1,767,957 | ||||||||||||||
| Dividends and Distributions to Shareholders from: | ||||||||||||||||||
| Net investment income: | ||||||||||||||||||
Class A | (842 | ) | (147 | ) | (143,645 | ) | (149,411 | ) | ||||||||||
Class B | — | — | — | — | ||||||||||||||
Class C | — | — | (151,581 | ) | (171,622 | ) | ||||||||||||
Class D | — | — | (43,379 | ) | (27,507 | ) | ||||||||||||
Class R | (1,333 | ) | (146 | ) | (3,013 | ) | (494 | ) | ||||||||||
Class P | (2,203 | ) | (148 | ) | (158,315 | ) | (21,861 | ) | ||||||||||
Institutional Class | — | — | — | — | ||||||||||||||
Class R6 | (124,983 | ) | (44,398 | ) | (315,512 | ) | (202,728 | ) | ||||||||||
Administrative Class | (386 | ) | (147 | ) | (1,765 | ) | (453 | ) | ||||||||||
| Net realized capital gains: | ||||||||||||||||||
Class A | (406 | ) | — | (13,334 | ) | (51,906 | ) | |||||||||||
Class C | — | — | (16,680 | ) | (72,498 | ) | ||||||||||||
Class D | — | — | (3,795 | ) | (4,355 | ) | ||||||||||||
Class R | (670 | ) | — | (295 | ) | (182 | ) | |||||||||||
Class P | (1,024 | ) | — | (11,351 | ) | (149 | ) | |||||||||||
Institutional Class | — | — | — | — | ||||||||||||||
Class R6 | (58,117 | ) | — | (25,296 | ) | (54,101 | ) | |||||||||||
Administrative Class | (191 | ) | — | (145 | ) | (148 | ) | |||||||||||
| Total Dividends and Distributions to Shareholders | (190,155 | ) | (44,986 | ) | (888,106 | ) | (757,415 | ) | ||||||||||
| Fund Share Transactions: | ||||||||||||||||||
| Net proceeds from the sale of shares | 363,753 | 122,054 | 8,504,522 | 17,455,299 | ||||||||||||||
| Issued in reinvestment of dividends and distributions | 190,157 | 44,986 | 876,235 | 754,100 | ||||||||||||||
| Cost of shares redeemed | (10,441 | ) | (4,737 | ) | (7,642,625 | ) | (5,120,060 | ) | ||||||||||
| Net increase (decrease) from Fund share transactions | 543,469 | 162,303 | 1,738,132 | 13,089,339 | ||||||||||||||
| Total Increase (Decrease) in Net Assets | 649,505 | 589,451 | 1,403,765 | 14,099,881 | ||||||||||||||
| Net Assets: | ||||||||||||||||||
| Beginning of period | 3,629,451 | 3,040,000 | 29,622,257 | 15,522,376 | ||||||||||||||
| End of period* | $ | 4,278,956 | $ | 3,629,451 | $ | 31,026,022 | $ | 29,622,257 | ||||||||||
| * Including undistributed (dividends in excess of) net investment income of: | $ | 11,501 | $ | 68,767 | $ | (328,969 | ) | $ | 1,784 | |||||||||
| ** | Commencement of operations. |
| 160 | Semiannual Report | | May 31, 2013 | | See accompanying Notes to Financial Statements |
Table of Contents
| AllianzGI Global Allocation | AllianzGI Global Growth Allocation | |||||||||||||||
| Six Months ended May 31, 2013 (Unaudited) | Year ended November 30, 2012 | Six Months ended May 31, 2013 (Unaudited) | Year ended November 30, 2012 | |||||||||||||
| $ | 3,505,857 | $ | 4,405,399 | $ | 121,782 | $ | 159,949 | |||||||||
| 5,360,479 | 10,319,153 | 292,535 | 82,215 | |||||||||||||
| 3,767,771 | 6,093,406 | 220,584 | 535,388 | |||||||||||||
| 12,634,107 | 20,817,958 | 634,901 | 777,552 | |||||||||||||
| (1,997,127 | ) | (2,180,819 | ) | (23,226 | ) | (32,138 | ) | |||||||||
| (97,998 | ) | (163,741 | ) | — | — | |||||||||||
| (1,719,860 | ) | (1,664,380 | ) | (28,575 | ) | (29,927 | ) | |||||||||
| (8,063 | ) | (6,563 | ) | (3,362 | ) | (1,219 | ) | |||||||||
| (420 | ) | (390 | ) | (517 | ) | (1,149 | ) | |||||||||
| (40,619 | ) | (44,661 | ) | (513 | ) | (527 | ) | |||||||||
| (1,780,789 | ) | (1,686,045 | ) | (156,839 | ) | (160,415 | ) | |||||||||
| — | — | — | — | |||||||||||||
| (46,994 | ) | (47,630 | ) | (487 | ) | (503 | ) | |||||||||
| — | — | (8,115 | ) | (15,585 | ) | |||||||||||
| — | — | (12,803 | ) | (17,748 | ) | |||||||||||
| — | — | (1,079 | ) | (792 | ) | |||||||||||
| — | — | (227 | ) | (538 | ) | |||||||||||
| — | — | (164 | ) | (227 | ) | |||||||||||
| — | — | (48,529 | ) | (67,100 | ) | |||||||||||
| — | — | — | — | |||||||||||||
| — | — | (163 | ) | (226 | ) | |||||||||||
| (5,691,870 | ) | (5,794,229 | ) | (284,599 | ) | (328,094 | ) | |||||||||
| 13,496,338 | 25,272,781 | 1,081,378 | 644,060 | |||||||||||||
| 5,062,161 | 5,117,122 | 284,599 | 328,094 | |||||||||||||
| (23,348,382 | ) | (52,210,302 | ) | (480,260 | ) | (1,228,147 | ) | |||||||||
| (4,789,883 | ) | (21,820,399 | ) | 885,717 | (255,993 | ) | ||||||||||
| 2,152,354 | (6,796,670 | ) | 1,236,019 | 193,465 | ||||||||||||
| 206,624,919 | 213,421,589 | 7,303,269 | 7,109,804 | |||||||||||||
| $ | 208,777,273 | $ | 206,624,919 | $ | 8,539,288 | $ | 7,303,269 | |||||||||
| $ | (2,186,013 | ) | $ | — | $ | 2,384 | $ | 94,121 | ||||||||
| See accompanying Notes to Financial Statements | | May 31, 2013 | | Semiannual Report | 161 |
Table of Contents
Statements of Changes in Net Assets (cont’d)
| AllianzGI Behavioral Advantage Large Cap | AllianzGI China Equity | |||||||||||||||||
| Six Months ended May 31, 2013 (Unaudited) | Year ended November 30, 2012 | Six Months ended May 31, 2013 (Unaudited) | Year ended November 30, 2012 | |||||||||||||||
| Increase (Decrease) in Net Assets from: | ||||||||||||||||||
Investment Operations: | ||||||||||||||||||
| Net investment income (loss) | $ | 222,398 | $ | 249,211 | $ | (17,163 | ) | $ | 52,748 | |||||||||
| Net realized gain (loss) | 604,087 | 1,038,733 | (9,507 | ) | (115,511 | ) | ||||||||||||
| Net change in unrealized appreciation/depreciation | 3,039,915 | 911,429 | 216,425 | 392,003 | ||||||||||||||
| Net increase in net assets resulting from investment operations | 3,866,400 | 2,199,373 | 189,755 | 329,240 | ||||||||||||||
| Dividends and Distributions to Shareholders from: | ||||||||||||||||||
| Net investment income: | ||||||||||||||||||
Class A | (538 | ) | (39 | ) | (2,022 | ) | (1,389 | ) | ||||||||||
Class C | (753 | ) | (15 | ) | (1 | ) | (3 | ) | ||||||||||
Class D | (3,323 | ) | (39 | ) | (11,196 | ) | (1 | ) | ||||||||||
Class R | — | — | — | — | ||||||||||||||
Class P | (187 | ) | (44 | ) | (226 | ) | (1,768 | ) | ||||||||||
Institutional Class | (298,276 | ) | (47,353 | ) | (76,243 | ) | (49,266 | ) | ||||||||||
Administrative Class | — | — | — | — | ||||||||||||||
| Net realized capital gains: | ||||||||||||||||||
Class A | (2,815 | ) | — | — | (15,652 | ) | ||||||||||||
Class C | (3,712 | ) | — | — | (8,710 | ) | ||||||||||||
Class D | (3,963 | ) | — | — | (18,776 | ) | ||||||||||||
Class R | — | — | — | — | ||||||||||||||
Class P | (732 | ) | — | — | (9,873 | ) | ||||||||||||
Institutional Class | (1,027,857 | ) | — | — | (254,826 | ) | ||||||||||||
Administrative Class | — | — | — | — | ||||||||||||||
| Total Dividends and Distributions to Shareholders | (1,342,156 | ) | (47,490 | ) | (89,688 | ) | (360,264 | ) | ||||||||||
| Fund Share Transactions: | ||||||||||||||||||
| Net proceeds from the sale of shares | 17,236,145 | 4,528,061 | 694,458 | 917,162 | ||||||||||||||
| Issued in reinvestment of dividends and distributions | 1,341,293 | 47,490 | 89,687 | 360,263 | ||||||||||||||
| Cost of shares redeemed | (1,643,623 | ) | (159,202 | ) | (787,697 | ) | (1,047,673 | ) | ||||||||||
| Net increase (decrease) from Fund share transactions | 16,933,815 | 4,416,349 | (3,552 | ) | 229,752 | |||||||||||||
| Total Increase (Decrease) in Net Assets | 19,458,059 | 6,568,232 | 96,515 | 198,728 | ||||||||||||||
| Net Assets: | ||||||||||||||||||
| Beginning of period | 17,316,508 | 10,748,276 | 4,069,455 | 3,870,727 | ||||||||||||||
| End of period* | $ | 36,774,567 | $ | 17,316,508 | $ | 4,165,970 | $ | 4,069,455 | ||||||||||
| * Including undistributed (dividends in excess of) net investment income of: | $ | 158,118 | $ | 238,797 | $ | (55,585 | ) | $ | 51,266 | |||||||||
| 162 | Semiannual Report | | May 31, 2013 | | See accompanying Notes to Financial Statements |
Table of Contents
| AllianzGI Convertible | AllianzGI Disciplined Equity | |||||||||||||||
| Six Months ended May 31, 2013 (Unaudited) | Year ended November 30, 2012 | Six Months ended May 31, 2013 (Unaudited) | Year ended November 30, 2012 | |||||||||||||
| $ | 12,389,632 | $ | 17,987,980 | $ | 325,949 | $ | 545,985 | |||||||||
| 29,329,810 | (24,726,040 | ) | 465,701 | 278,407 | ||||||||||||
| 137,098,006 | 78,802,828 | 5,099,977 | 3,368,533 | |||||||||||||
| 178,817,448 | 72,064,768 | 5,891,627 | 4,192,925 | |||||||||||||
| (862,549 | ) | (2,015,209 | ) | (96,842 | ) | (56,910 | ) | |||||||||
| (196,531 | ) | (585,455 | ) | — | (1,298 | ) | ||||||||||
| (312,304 | ) | (980,818 | ) | (2,079 | ) | (1 | ) | |||||||||
| (1,059 | ) | (2,157 | ) | — | — | |||||||||||
| (523,574 | ) | (1,141,904 | ) | (334 | ) | (234 | ) | |||||||||
| (9,461,995 | ) | (17,698,999 | ) | (473,396 | ) | (427,735 | ) | |||||||||
| (19,217 | ) | (47,609 | ) | — | — | |||||||||||
| — | (3,327,365 | ) | (91,837 | ) | (89,030 | ) | ||||||||||
| — | (1,535,854 | ) | (12,135 | ) | (17,020 | ) | ||||||||||
| — | (1,713,294 | ) | (2,667 | ) | (2,062 | ) | ||||||||||
| — | (2,090 | ) | — | — | ||||||||||||
| — | (1,991,676 | ) | (337 | ) | (369 | ) | ||||||||||
| — | (29,557,779 | ) | (411,973 | ) | (562,599 | ) | ||||||||||
| — | (75,989 | ) | — | — | ||||||||||||
| (11,377,229 | ) | (60,676,198 | ) | (1,091,600 | ) | (1,157,258 | ) | |||||||||
| 567,826,207 | 501,808,437 | 8,662,741 | 15,398,500 | |||||||||||||
| 6,427,436 | 25,600,520 | 950,839 | 1,053,865 | |||||||||||||
| (169,272,391 | ) | (194,516,607 | ) | (8,038,675 | ) | (20,962,407 | ) | |||||||||
| 404,981,252 | 332,892,350 | 1,574,905 | (4,510,042 | ) | ||||||||||||
| 572,421,471 | 344,280,920 | 6,374,932 | (1,474,375 | ) | ||||||||||||
| 1,027,573,247 | 683,292,327 | 46,389,551 | 47,863,926 | |||||||||||||
| $ | 1,599,994,718 | $ | 1,027,573,247 | $ | 52,764,483 | $ | 46,389,551 | |||||||||
| $ | 5,023,584 | $ | 4,011,181 | $ | 293,828 | $ | 540,530 | |||||||||
| See accompanying Notes to Financial Statements | | May 31, 2013 | | Semiannual Report | 163 |
Table of Contents
Statements of Changes in Net Assets (cont’d)
| AllianzGI Dynamic Emerging Multi-Asset | AllianzGI Global Managed Volatility | |||||||||||||
| Period from December 17, 2012** through May 31, 2013 (Unaudited) | Six Months ended May 31, 2013 (Unaudited) | Period from December 19, 2011** through November 30, 2012 | ||||||||||||
| Increase (Decrease) in Net Assets from: | ||||||||||||||
Investment Operations: | ||||||||||||||
| Net investment income | $ | 35,262 | $ | 277,501 | $ | 378,521 | ||||||||
| Net realized gain (loss) | (21,773 | ) | 542,122 | 180,877 | ||||||||||
| Net change in unrealized appreciation/depreciation | (295,318 | ) | 323,909 | 635,365 | ||||||||||
| Net increase (decrease) in net assets resulting from investment operations | (281,829 | ) | 1,143,532 | 1,194,763 | ||||||||||
| Dividends and Distributions to Shareholders from: | ||||||||||||||
| Net investment income: | ||||||||||||||
Class A | — | (1,932 | ) | — | ||||||||||
Class C | — | (1,901 | ) | — | ||||||||||
Class D | — | (1,640 | ) | — | ||||||||||
Class R | — | — | — | |||||||||||
Class P | — | (439 | ) | — | ||||||||||
Institutional Class | — | (619,585 | ) | — | ||||||||||
Administrative Class | — | — | — | |||||||||||
| Net realized capital gains: | ||||||||||||||
Class A | — | (200 | ) | — | ||||||||||
Class C | — | (181 | ) | — | ||||||||||
Class D | — | (154 | ) | — | ||||||||||
Class R | — | — | — | |||||||||||
Class P | — | (45 | ) | — | ||||||||||
Institutional Class | — | (60,505 | ) | — | ||||||||||
Administrative Class | — | — | — | |||||||||||
| Total Dividends and Distributions to Shareholders | — | (686,582 | ) | — | ||||||||||
| Fund Share Transactions: | ||||||||||||||
| Net proceeds from the sale of shares | 201,683 | 2,926,389 | 13,367,378 | |||||||||||
| Issued in reorganization | — | — | — | |||||||||||
| Issued in reinvestment of dividends and distributions | — | 686,582 | — | |||||||||||
| Cost of shares redeemed | — | (2,897,935 | ) | (1,905,665 | ) | |||||||||
| Net increase from Fund share transactions | — | 715,036 | 11,461,713 | |||||||||||
| Total Increase (Decrease) in Net Assets | (80,146 | ) | 1,171,986 | 12,656,476 | ||||||||||
| Net Assets: | ||||||||||||||
| Beginning of period | 5,040,000 | 14,696,476 | 2,040,000 | |||||||||||
| End of period* | $ | 4,959,854 | $ | 15,868,462 | $ | 14,696,476 | ||||||||
| * Including undistributed (dividends in excess of) net investment income of: | $ | 35,262 | $ | 101,313 | $ | 449,309 | ||||||||
| ** | Commencement of operations. |
| 164 | Semiannual Report | | May 31, 2013 | | See accompanying Notes to Financial Statements |
Table of Contents
| AllianzGI Global Water | AllianzGI High Yield Bond | |||||||||||||||
| Six Months ended May 31, 2013 (Unaudited) | Year ended November 30, 2012 | Six Months ended May 31, 2013 (Unaudited) | Year ended November 30, 2012 | |||||||||||||
| $ | 1,100,640 | $ | 1,108,008 | $ | 12,459,763 | $ | 19,156,758 | |||||||||
| 2,692,072 | 2,908,977 | 3,319,016 | 447,523 | |||||||||||||
| 7,862,171 | 8,675,907 | 6,941,600 | �� | 13,824,567 | ||||||||||||
| 11,654,883 | 12,692,892 | 22,720,379 | 33,428,848 | |||||||||||||
| (679,198 | ) | (159,470 | ) | (3,742,015 | ) | (6,918,261 | ) | |||||||||
| (121,278 | ) | (23 | ) | (907,218 | ) | (1,584,093 | ) | |||||||||
| (75,427 | ) | (22,679 | ) | (1,990,898 | ) | (1,993,016 | ) | |||||||||
| — | — | (75,502 | ) | (103,666 | ) | |||||||||||
| (186,883 | ) | (118,625 | ) | (575,785 | ) | (1,492,942 | ) | |||||||||
| (56,569 | ) | (10,656 | ) | (4,616,312 | ) | (7,591,258 | ) | |||||||||
| — | — | (999,674 | ) | (2,177 | ) | |||||||||||
| — | — | — | (894,484 | ) | ||||||||||||
| — | — | — | (187,117 | ) | ||||||||||||
| — | — | — | (292,429 | ) | ||||||||||||
| — | — | — | (4,888 | ) | ||||||||||||
| — | — | — | (174,361 | ) | ||||||||||||
| — | — | — | (1,008,410 | ) | ||||||||||||
| — | — | — | (159 | ) | ||||||||||||
| (1,119,355 | ) | (311,453 | ) | (12,907,404 | ) | (22,247,261 | ) | |||||||||
| 67,145,391 | 33,336,675 | 152,984,142 | 224,765,901 | |||||||||||||
| — | 35,766,152 | — | — | |||||||||||||
| 655,954 | 180,055 | 9,820,470 | 15,386,434 | |||||||||||||
| (16,416,575 | ) | (40,931,141 | ) | (126,966,377 | ) | (72,592,251 | ) | |||||||||
| 51,384,770 | 28,351,741 | 35,838,235 | 167,560,084 | |||||||||||||
| 61,920,298 | 40,733,180 | 45,651,210 | 178,741,671 | |||||||||||||
| 111,274,924 | 70,541,744 | 354,524,620 | 175,782,949 | |||||||||||||
| $ | 173,195,222 | $ | 111,274,924 | $ | 400,175,830 | $ | 354,524,620 | |||||||||
| $ | 885,830 | $ | 904,545 | $ | (1,216,577 | ) | $ | (768,936 | ) | |||||||
| See accompanying Notes to Financial Statements | | May 31, 2013 | | Semiannual Report | 165 |
Table of Contents
Statements of Changes in Net Assets (cont’d)
| AllianzGI International Small-Cap | AllianzGI Micro Cap | |||||||||||||||||
| Six Months ended May 31, 2013 (Unaudited) | Year ended November 30, 2012 | Six Months ended May 31, 2013 (Unaudited) | Year ended November 30, 2012 | |||||||||||||||
| Increase (Decrease) in Net Assets from: | ||||||||||||||||||
Investment Operations: | ||||||||||||||||||
| Net investment income (loss) | $ | 413,285 | $ | 928,006 | $ | (140,822 | ) | $ | (391,745 | ) | ||||||||
| Net realized gain | 14,933,410 | 8,119,668 | 1,196,314 | 4,653,245 | ||||||||||||||
| Net change in unrealized appreciation/depreciation | 2,723,557 | 9,040,535 | 4,745,944 | 1,455,027 | ||||||||||||||
| Net increase in net assets resulting from investment operations | 18,070,252 | 18,088,209 | 5,801,436 | 5,716,527 | ||||||||||||||
| Dividends and Distributions to Shareholders from: | ||||||||||||||||||
| Net investment income: | ||||||||||||||||||
Class A | (2 | ) | (100,572 | ) | — | — | ||||||||||||
Class C | (322 | ) | (3,974 | ) | — | — | ||||||||||||
Class D | (5 | ) | (1 | ) | — | — | ||||||||||||
Class R | (74 | ) | (72 | ) | — | — | ||||||||||||
Class P | (241,569 | ) | (180,329 | ) | — | — | ||||||||||||
Institutional Class | (814,869 | ) | (1,031,247 | ) | — | — | ||||||||||||
Administrative Class | (1 | ) | (101 | ) | — | — | ||||||||||||
| Net realized capital gains: | ||||||||||||||||||
Class A | — | — | (9,718 | ) | — | |||||||||||||
Class P | — | — | (23,970 | ) | (68,342 | ) | ||||||||||||
Institutional Class | — | — | (1,945,146 | ) | (7,380,186 | ) | ||||||||||||
| Total Dividends and Distributions to Shareholders | (1,056,842 | ) | (1,316,296 | ) | (1,978,834 | ) | (7,448,528 | ) | ||||||||||
| Fund Share Transactions: | ||||||||||||||||||
| Net proceeds from the sale of shares | 24,891,472 | 31,921,965 | 5,639,942 | 4,810,405 | ||||||||||||||
| Issued in reinvestment of dividends and distributions | 1,046,166 | 1,265,756 | 1,975,841 | 7,445,633 | ||||||||||||||
| Cost of shares redeemed | (66,156,974 | ) | (54,039,108 | ) | (3,903,963 | ) | (29,653,403 | ) | ||||||||||
| Net increase (decrease) from Fund share transactions | (40,219,336 | ) | (20,851,387 | ) | 3,711,820 | (17,397,365 | ) | |||||||||||
| Total Increase (Decrease) in Net Assets | (23,205,926 | ) | (4,079,474 | ) | 7,534,422 | (19,129,366 | ) | |||||||||||
| Net Assets: | ||||||||||||||||||
| Beginning of period | 120,736,693 | 124,816,167 | 27,810,155 | 46,939,521 | ||||||||||||||
| End of period* | $ | 97,530,767 | $ | 120,736,693 | $ | 35,344,577 | $ | 27,810,155 | ||||||||||
| * Including undistributed (dividends in excess of) net investment income of: | $ | 312,464 | $ | 956,021 | $ | (489,871 | ) | $ | (349,049 | ) | ||||||||
| 166 | Semiannual Report | | May 31, 2013 | | See accompanying Notes to Financial Statements |
Table of Contents
| AllianzGI Multi-Asset Real Return | AllianzGI NFJ Emerging Markets Value | |||||||
| Period from December 17, 2012** through May 31, 2013 (Unaudited) | Period from December 18, 2012** through May 31, 2013 (Unaudited) | |||||||
| $ | 40,875 | $ | 84,447 | |||||
| 10,845 | 28,655 | |||||||
| 236 | 24,086 | |||||||
| 51,956 | 137,188 | |||||||
| — | (1 | ) | ||||||
| — | (1 | ) | ||||||
| — | (6 | ) | ||||||
| — | — | |||||||
| — | (1 | ) | ||||||
| — | (690 | ) | ||||||
| — | — | |||||||
| — | — | |||||||
| — | — | |||||||
| — | — | |||||||
| — | (699 | ) | ||||||
| 66,943 | 3,628,995 | |||||||
| — | 699 | |||||||
| — | (259,657 | ) | ||||||
| — | 3,370,037 | |||||||
| 118,899 | 3,506,526 | |||||||
| 5,040,000 | 3,040,000 | |||||||
| $ | 5,158,899 | $ | 6,546,526 | |||||
| $ | 40,875 | $ | 83,748 | |||||
| See accompanying Notes to Financial Statements | | May 31, 2013 | | Semiannual Report | 167 |
Table of Contents
Statements of Changes in Net Assets (cont’d)
| AllianzGI NFJ Global Dividend Value | AllianzGI NFJ International Small-Cap Value | |||||||||||||||||
| Six Months ended May 31, 2013 (Unaudited) | Year ended November 30, 2012 | Six Months ended May 31, 2013 (Unaudited) | Period from June 1, 2012** through November 30, 2012 | |||||||||||||||
| Increase (Decrease) in Net Assets from: | ||||||||||||||||||
Investment Operations: | ||||||||||||||||||
| Net investment income | $ | 1,214,428 | $ | 1,399,049 | $ | 94,304 | $ | 34,713 | ||||||||||
| Net realized gain (loss) | 2,105,798 | (259,457 | ) | 179,645 | 17,869 | |||||||||||||
| Net change in unrealized appreciation/depreciation | 4,951,213 | 1,822,302 | 427,348 | 385,111 | ||||||||||||||
| Net increase in net assets resulting from investment operations | 8,271,439 | 2,961,894 | 701,297 | 437,693 | ||||||||||||||
| Dividends and Distributions to Shareholders from: | ||||||||||||||||||
| Net investment income: | ||||||||||||||||||
Class A | (122,714 | ) | (112,742 | ) | (17,771 | ) | — | |||||||||||
Class C | (42,568 | ) | (57,894 | ) | (70 | ) | — | |||||||||||
Class D | (7,112 | ) | (6,952 | ) | (2,869 | ) | — | |||||||||||
Class P | (16,933 | ) | (24,905 | ) | (126 | ) | — | |||||||||||
Institutional Class | (739,567 | ) | (866,190 | ) | (42,266 | ) | — | |||||||||||
| Net realized capital gains: | ||||||||||||||||||
Class A | (8,954 | ) | (129,190 | ) | (5,301 | ) | — | |||||||||||
Class C | (4,711 | ) | (63,153 | ) | (57 | ) | — | |||||||||||
Class D | (574 | ) | (10,855 | ) | (607 | ) | — | |||||||||||
Class P | (1,260 | ) | (15,512 | ) | (57 | ) | — | |||||||||||
Institutional Class | (52,046 | ) | (451,910 | ) | (17,772 | ) | — | |||||||||||
| Total Dividends and Distributions to Shareholders | (996,439 | ) | (1,739,303 | ) | (86,896 | ) | — | |||||||||||
| Fund Share Transactions: | ||||||||||||||||||
| Net proceeds from the sale of shares | 16,880,228 | 32,302,365 | 3,152,701 | 1,240,897 | ||||||||||||||
| Issued in reinvestment of dividends and distributions | 925,855 | 1,722,517 | 86,342 | — | ||||||||||||||
| Cost of shares redeemed | (7,299,635 | ) | (14,833,633 | ) | (97,212 | ) | (11,893 | ) | ||||||||||
| Net increase (decrease) from Fund share transactions | 10,506,448 | 19,191,249 | 3,141,831 | 1,229,004 | ||||||||||||||
| Total Increase (Decrease) in Net Assets | 17,781,448 | 20,413,840 | 3,756,232 | 1,666,697 | ||||||||||||||
| Net Assets: | ||||||||||||||||||
| Beginning of period | 52,087,268 | 31,673,428 | 4,706,697 | 3,040,000 | ||||||||||||||
| End of period* | $ | 69,868,716 | $ | 52,087,268 | $ | 8,462,929 | $ | 4,706,697 | ||||||||||
| * Including undistributed (dividends in excess of) net investment income of: | $ | 612,875 | $ | 327,341 | $ | 58,264 | $ | 27,062 | ||||||||||
| ** | Commencement of operations. |
| 168 | Semiannual Report | | May 31, 2013 | | See accompanying Notes to Financial Statements |
Table of Contents
| AllianzGI NFJ International Value II | AllianzGI Redwood | |||||||||||||||
| Six Months ended May 31, 2013 (Unaudited) | Period from November 30, 2012 | Six Months ended May 31, 2013 (Unaudited) | Year ended November 30, 2012 | |||||||||||||
| $ | 52,793 | $ | 84,060 | $ | 18,698 | $ | 16,600 | |||||||||
| 130,655 | (22,300 | ) | 343,429 | (89,636 | ) | |||||||||||
| 155,915 | 289,357 | (52,682 | ) | 556,507 | ||||||||||||
| 339,363 | 351,117 | 309,445 | 483,471 | |||||||||||||
| (668 | ) | (179 | ) | (2 | ) | — | ||||||||||
| (115 | ) | (122 | ) | (105 | ) | — | ||||||||||
| (136 | ) | (174 | ) | (1 | ) | — | ||||||||||
| (143 | ) | (190 | ) | (698 | ) | — | ||||||||||
| (57,743 | ) | (59,335 | ) | (47,755 | ) | — | ||||||||||
| (70 | ) | — | — | — | ||||||||||||
| (16 | ) | — | — | — | ||||||||||||
| (16 | ) | — | — | — | ||||||||||||
| (16 | ) | — | — | — | ||||||||||||
| (6,282 | ) | — | — | — | ||||||||||||
| (65,205 | ) | (60,000 | ) | (48,561 | ) | — | ||||||||||
| 185,087 | 1,086,478 | 183,676 | 1,597,540 | |||||||||||||
| 65,204 | 60,000 | 46,621 | — | |||||||||||||
| (1,115,507 | ) | — | (2,933,364 | ) | (1,611,677 | ) | ||||||||||
| (865,216 | ) | 1,146,478 | (2,703,067 | ) | (14,137 | ) | ||||||||||
| (591,058 | ) | 1,437,595 | (2,442,183 | ) | 469,334 | |||||||||||
| 4,477,595 | 3,040,000 | 9,955,031 | 9,485,697 | |||||||||||||
| $ | 3,886,537 | $ | 4,477,595 | $ | 7,512,848 | $ | 9,955,031 | |||||||||
| $ | 20,788 | $ | 26,800 | $ | (29,863 | ) | $ | — | ||||||||
| See accompanying Notes to Financial Statements | | May 31, 2013 | | Semiannual Report | 169 |
Table of Contents
Statements of Changes in Net Assets (cont’d)
| AllianzGI Short Duration High Income | AllianzGI Structured Alpha | |||||||||||||
| Six Months ended May 31, 2013 (Unaudited) | Year ended November 30, 2012 | Period from December 3, 2012** through May 31, 2013 (Unaudited) | ||||||||||||
| Increase (Decrease) in Net Assets from: | ||||||||||||||
Investment Operations: | ||||||||||||||
| Net investment income (loss) | $ | 6,299,063 | $ | 3,043,419 | $ | (55,766 | ) | |||||||
| Net realized gain (loss) | (342,003 | ) | 3,180 | 131,451 | ||||||||||
| Net change in unrealized appreciation/depreciation | (219,707 | ) | 2,385,290 | 27,190 | ||||||||||
| Net increase in net assets resulting from investment operations | 5,737,353 | 5,431,889 | 102,875 | |||||||||||
| Dividends and Distributions to Shareholders from: | ||||||||||||||
| Net investment income: | ||||||||||||||
Class A | (2,394,015 | ) | (887,963 | ) | — | |||||||||
Class C | (822,648 | ) | (350,812 | ) | — | |||||||||
Class D | (307,137 | ) | (92,689 | ) | — | |||||||||
Class P | (1,801,004 | ) | (559,410 | ) | — | |||||||||
Institutional Class | (1,825,464 | ) | (1,203,971 | ) | — | |||||||||
| Net realized capital gains: | ||||||||||||||
Class A | (27,576 | ) | — | — | ||||||||||
Class C | (9,938 | ) | — | — | ||||||||||
Class D | (3,477 | ) | — | — | ||||||||||
Class R | — | — | — | |||||||||||
Class P | (18,635 | ) | — | — | ||||||||||
Institutional Class | (13,278 | ) | — | — | ||||||||||
| Total Dividends and Distributions to Shareholders | (7,223,172 | ) | (3,094,845 | ) | — | |||||||||
| Fund Share Transactions: | ||||||||||||||
| Net proceeds from the sale of shares | 278,027,344 | 220,400,915 | 2,130,418 | |||||||||||
| Issued in reinvestment of dividends and distributions | 5,772,429 | 2,687,529 | — | |||||||||||
| Cost of shares redeemed | (60,902,515 | ) | (24,573,552 | ) | (9,664 | ) | ||||||||
| Net increase (decrease) from Fund share transactions | 222,897,258 | 198,514,892 | 2,120,754 | |||||||||||
| Total Increase (Decrease) in Net Assets | 221,411,439 | 200,851,936 | 2,223,629 | |||||||||||
| Net Assets: | ||||||||||||||
| Beginning of period | 210,759,351 | 9,907,415 | 6,040,000 | |||||||||||
| End of period* | $ | 432,170,790 | $ | 210,759,351 | $ | 8,263,629 | ||||||||
| * Including undistributed (dividends in excess of) net investment income of: | $ | (830,073 | ) | $ | 21,132 | $ | (55,766 | ) | ||||||
| 170 | Semiannual Report | | May 31, 2013 | | See accompanying Notes to Financial Statements |
Table of Contents
| AllianzGI Ultra Micro Cap | AllianzGI U.S. Emerging Growth | AllianzGI U.S. Equity Hedged | ||||||||||||||||||
| Six Months ended May 31, 2013 (Unaudited) | Year ended November 30, 2012 | Six Months ended May 31, 2013 (Unaudited) | Year ended November 30, 2012 | Period from May 31, 2013 | ||||||||||||||||
| $ | (180,763 | ) | $ | (170,038 | ) | $ | (22,021 | ) | $ | (66,877 | ) | $ | 19,564 | |||||||
| (444,706 | ) | 226,071 | 1,026,044 | 618,019 | (79,503 | ) | ||||||||||||||
| 7,250,681 | 2,002,815 | 4,142,979 | 1,044,887 | 356,417 | ||||||||||||||||
| 6,625,212 | 2,058,848 | 5,147,002 | 1,596,029 | 296,478 | ||||||||||||||||
| — | — | — | — | — | ||||||||||||||||
| — | — | — | — | — | ||||||||||||||||
| — | — | — | — | — | ||||||||||||||||
| — | — | — | — | — | ||||||||||||||||
| — | — | — | — | — | ||||||||||||||||
| — | — | (26,949 | ) | (62,966 | ) | — | ||||||||||||||
| — | — | (4,127 | ) | (9,981 | ) | — | ||||||||||||||
| — | — | (1,115 | ) | (2,039 | ) | — | ||||||||||||||
| — | — | (203 | ) | (718 | ) | — | ||||||||||||||
| — | (3,948 | ) | (364 | ) | (1,158 | ) | — | |||||||||||||
| — | (162,280 | ) | (395,789 | ) | (1,343,785 | ) | — | |||||||||||||
| — | (166,228 | ) | (428,547 | ) | (1,420,647 | ) | — | |||||||||||||
| 29,029,794 | 10,866,722 | 7,326,429 | 5,642,860 | 778,965 | ||||||||||||||||
| — | 166,228 | 405,015 | 1,356,907 | — | ||||||||||||||||
| (9,412,285 | ) | (6,502,684 | ) | (4,594,293 | ) | (7,247,415 | ) | (6,222 | ) | |||||||||||
| 19,617,509 | 4,530,266 | 3,137,151 | (247,648 | ) | 772,743 | |||||||||||||||
| 26,242,721 | 6,422,886 | 7,855,606 | (72,266 | ) | 1,069,221 | |||||||||||||||
| 16,410,156 | 9,987,270 | 21,813,158 | 21,885,424 | 3,040,000 | ||||||||||||||||
| $ | 42,652,877 | $ | 16,410,156 | $ | 29,668,764 | $ | 21,813,158 | $ | 4,109,221 | |||||||||||
| $ | (339,616 | ) | $ | (158,853 | ) | $ | (90,090 | ) | $ | (68,069 | ) | $ | 19,564 | |||||||
| See accompanying Notes to Financial Statements | | May 31, 2013 | | Semiannual Report | 171 |
Table of Contents
For a Share Outstanding for the Period ended:
| Net Asset Value, Beginning of Period | Net Investment Income (a) | Net Realized and Change in Unrealized Gain (Loss) | Total from Investment Operations | Dividends from Net Investment Income | Distributions from Net Realized Capital Gains | |||||||||||||||||||||
| AllianzGI Retirement 2015: | ||||||||||||||||||||||||||
| Class A | ||||||||||||||||||||||||||
5/31/2013+ | $ | 19.52 | $ | 0.31 | $ | 0.03 | $ | 0.34 | $ | (0.55 | ) | $ | — | |||||||||||||
11/30/2012 | 18.86 | 0.48 | 1.27 | 1.75 | (0.70 | ) | (0.39 | ) | ||||||||||||||||||
11/30/2011 | 19.28 | 0.38 | 0.23 | 0.61 | (0.74 | ) | (0.29 | ) | ||||||||||||||||||
11/30/2010 | 18.38 | 0.48 | 1.22 | 1.70 | (0.68 | ) | (0.12 | ) | ||||||||||||||||||
12/29/2008* - 11/30/2009 | 15.00 | 0.53 | 2.85 | 3.38 | — | — | ||||||||||||||||||||
| Class C | ||||||||||||||||||||||||||
5/31/2013+ | $ | 19.15 | $ | 0.25 | $ | 0.01 | $ | 0.26 | $ | (0.35 | ) | $ | — | |||||||||||||
11/30/2012 | 18.53 | 0.35 | 1.24 | 1.59 | (0.58 | ) | (0.39 | ) | ||||||||||||||||||
11/30/2011 | 19.09 | 0.31 | 0.14 | 0.45 | (0.72 | ) | (0.29 | ) | ||||||||||||||||||
11/30/2010 | 18.25 | 0.36 | 1.19 | 1.55 | (0.59 | ) | (0.12 | ) | ||||||||||||||||||
12/29/2008* - 11/30/2009 | 15.00 | 0.40 | 2.85 | 3.25 | — | — | ||||||||||||||||||||
| Class D | ||||||||||||||||||||||||||
5/31/2013+ | $ | 19.52 | $ | 0.44 | $ | (0.12 | ) | $ | 0.32 | $ | (0.54 | ) | $ | — | ||||||||||||
11/30/2012 | 18.87 | 0.41 | 1.34 | 1.75 | (0.71 | ) | (0.39 | ) | ||||||||||||||||||
11/30/2011 | 19.30 | 0.58 | — | 0.58 | (0.72 | ) | (0.29 | ) | ||||||||||||||||||
11/30/2010 | 18.40 | 0.52 | 1.18 | 1.70 | (0.68 | ) | (0.12 | ) | ||||||||||||||||||
12/29/2008* - 11/30/2009 | 15.00 | 0.53 | 2.87 | 3.40 | — | — | ||||||||||||||||||||
| Class R | ||||||||||||||||||||||||||
5/31/2013+ | $ | 19.50 | $ | 0.27 | $ | 0.02 | $ | 0.29 | $ | (0.53 | ) | $ | — | |||||||||||||
11/30/2012 | 18.85 | 0.19 | 1.51 | 1.70 | (0.66 | ) | (0.39 | ) | ||||||||||||||||||
11/30/2011 | 19.27 | 0.55 | — | 0.55 | (0.68 | ) | (0.29 | ) | ||||||||||||||||||
11/30/2010 | 18.35 | 0.53 | 1.13 | 1.66 | (0.62 | ) | (0.12 | ) | ||||||||||||||||||
12/29/2008* - 11/30/2009 | 15.00 | 0.47 | 2.88 | 3.35 | — | — | ||||||||||||||||||||
| Class P | ||||||||||||||||||||||||||
5/31/2013+ | $ | 19.66 | $ | 0.32 | $ | 0.05 | $ | 0.37 | $ | (0.57 | ) | $ | — | |||||||||||||
11/30/2012 | 18.97 | 0.34 | 1.49 | 1.83 | (0.75 | ) | (0.39 | ) | ||||||||||||||||||
11/30/2011 | 19.37 | 0.65 | (0.01 | ) | 0.64 | (0.75 | ) | (0.29 | ) | |||||||||||||||||
11/30/2010 | 18.43 | 0.61 | 1.13 | 1.74 | (0.68 | ) | (0.12 | ) | ||||||||||||||||||
12/29/2008* - 11/30/2009 | 15.00 | 0.53 | 2.90 | 3.43 | — | — | ||||||||||||||||||||
| Class R6 | ||||||||||||||||||||||||||
5/31/2013+ | $ | 19.68 | $ | 0.33 | $ | 0.04 | $ | 0.37 | $ | (0.57 | ) | $ | — | |||||||||||||
11/30/2012 | 18.99 | 0.54 | 1.31 | 1.85 | (0.77 | ) | (0.39 | ) | ||||||||||||||||||
11/30/2011 | 19.39 | 0.66 | — | 0.66 | (0.77 | ) | (0.29 | ) | ||||||||||||||||||
11/30/2010 | 18.45 | 0.61 | 1.14 | 1.75 | (0.69 | ) | (0.12 | ) | ||||||||||||||||||
12/29/2008* - 11/30/2009 | 15.00 | 0.55 | 2.90 | 3.45 | — | — | ||||||||||||||||||||
| Administrative Class | ||||||||||||||||||||||||||
5/31/2013+ | $ | 19.60 | $ | 0.08 | $ | 0.26 | $ | 0.34 | $ | (0.51 | ) | $ | — | |||||||||||||
11/30/2012 | 18.94 | 0.48 | 1.29 | 1.77 | (0.72 | ) | (0.39 | ) | ||||||||||||||||||
11/30/2011 | 19.34 | 0.61 | — | 0.61 | (0.72 | ) | (0.29 | ) | ||||||||||||||||||
11/30/2010 | 18.40 | 0.58 | 1.14 | 1.72 | (0.66 | ) | (0.12 | ) | ||||||||||||||||||
12/29/2008* - 11/30/2009 | 15.00 | 0.51 | 2.89 | 3.40 | — | — | ||||||||||||||||||||
| + | unaudited |
| * | Commencement of operations. |
| (a) | Calculated on average shares outstanding during the period. |
| (b) | Total return is calculated assuming a purchase of a share on the first day of the period and a sale of a share on the last day of each period reported. Dividends and distributions, if any, are assumed, for purposes of this calculation, to be reinvested. Total return does not reflect sales charges and includes the effect of fee waivers and reimbursements. Total return may reflect adjustments to conform to generally accepted accounting principles. Total return for a period of less than one year is not annualized. |
| (c) | Does not include expenses of the investment companies in which the Fund invests. |
| (d) | Annualized. |
| 172 | Semiannual Report | | May 31, 2013 | | See accompanying Notes to Financial Statements |
Table of Contents
| Total Dividends and Distributions | Net Asset Value, End of Period | Total Return (b) | Net Assets, End of Period (000s) | Ratio of Expenses to Average Net Assets with Fee Waiver/ Reimbursement (c) | Ratio of Expenses to Average Net Assets without Fee Waiver/ Reimbursement (c) | Ratio of Net Investment Income to Average Net Assets (c) | Portfolio Turnover Rate | |||||||||||||||||||||||||
| $ | (0.55 | ) | $ | 19.31 | 1.78 | % | $ | 5,067 | 0.41 | %(d) | 0.60 | %(d) | 3.17 | %(d) | 36 | % | ||||||||||||||||
| (1.09 | ) | 19.52 | 9.88 | 1,798 | 0.40 | 0.60 | 2.57 | 70 | ||||||||||||||||||||||||
| (1.03 | ) | 18.86 | 3.27 | 1,564 | �� | 0.47 | 2.06 | 2.03 | 108 | |||||||||||||||||||||||
| (0.80 | ) | 19.28 | 9.67 | 229 | 0.50 | 5.47 | 2.62 | 24 | ||||||||||||||||||||||||
| — | 18.38 | 22.53 | 78 | 0.50 | (d) | 9.98 | (d) | 3.36 | (d) | 21 | ||||||||||||||||||||||
| $ | (0.35 | ) | $ | 19.06 | 1.38 | % | $ | 1,661 | 1.16 | %(d) | 1.35 | %(d) | 2.57 | %(d) | 36 | % | ||||||||||||||||
| (0.97 | ) | 19.15 | 9.08 | 2,049 | 1.15 | 1.35 | 1.91 | 70 | ||||||||||||||||||||||||
| (1.01 | ) | 18.53 | 2.44 | 2,347 | 1.22 | 2.66 | 1.65 | 108 | ||||||||||||||||||||||||
| (0.71 | ) | 19.09 | 8.88 | 305 | 1.25 | 7.23 | 1.99 | 24 | ||||||||||||||||||||||||
| — | 18.25 | 21.67 | 71 | 1.25 | (d) | 8.61 | (d) | 2.61 | (d) | 21 | ||||||||||||||||||||||
| $ | (0.54 | ) | $ | 19.30 | 1.69 | % | $ | 247 | 0.51 | %(d) | 0.60 | %(d) | 4.54 | %(d) | 36 | % | ||||||||||||||||
| (1.10 | ) | 19.52 | 9.82 | 1,290 | 0.50 | 0.60 | 2.19 | 70 | ||||||||||||||||||||||||
| (1.01 | ) | 18.87 | 3.20 | 251 | 0.50 | 2.22 | 3.07 | 108 | ||||||||||||||||||||||||
| (0.80 | ) | 19.30 | 9.62 | 204 | 0.50 | 5.74 | 2.84 | 24 | ||||||||||||||||||||||||
| — | 18.40 | 22.67 | 91 | 0.50 | (d) | 8.84 | (d) | 3.36 | (d) | 21 | ||||||||||||||||||||||
| $ | (0.53 | ) | $ | 19.26 | 1.60 | % | $ | 336 | 0.76 | %(d) | 0.85 | %(d) | 2.76 | %(d) | 36 | % | ||||||||||||||||
| (1.05 | ) | 19.50 | 9.50 | 469 | 0.75 | 0.85 | 1.01 | 70 | ||||||||||||||||||||||||
| (0.97 | ) | 18.85 | 2.94 | 14 | 0.75 | 2.46 | 2.91 | 108 | ||||||||||||||||||||||||
| (0.74 | ) | 19.27 | 9.43 | 13 | 0.75 | 5.77 | 2.87 | 24 | ||||||||||||||||||||||||
| — | 18.35 | 22.33 | 12 | 0.75 | (d) | 7.76 | (d) | 3.11 | (d) | 21 | ||||||||||||||||||||||
| $ | (0.57 | ) | $ | 19.46 | 1.92 | % | $ | 4,579 | 0.11 | %(d) | 0.20 | %(d) | 3.31 | %(d) | 36 | % | ||||||||||||||||
| (1.14 | ) | 19.66 | 10.27 | 3,845 | 0.10 | 0.20 | 1.78 | 70 | ||||||||||||||||||||||||
| (1.04 | ) | 18.97 | 3.44 | 14 | 0.25 | 2.00 | 3.41 | 108 | ||||||||||||||||||||||||
| (0.80 | ) | 19.37 | 9.88 | 14 | 0.30 | 5.38 | 3.32 | 24 | ||||||||||||||||||||||||
| — | 18.43 | 22.87 | 12 | 0.30 | (d) | 6.52 | (d) | 3.56 | (d) | 21 | ||||||||||||||||||||||
| $ | (0.57 | ) | $ | 19.48 | 2.00 | % | $ | 8,092 | 0.01 | %(d) | 0.13 | %(d) | 3.38 | %(d) | 36 | % | ||||||||||||||||
| (1.16 | ) | 19.68 | 10.31 | 8,243 | — | 0.15 | 2.84 | 70 | ||||||||||||||||||||||||
| (1.06 | ) | 18.99 | 3.53 | 5,885 | 0.15 | 1.90 | 3.48 | 108 | ||||||||||||||||||||||||
| (0.81 | ) | 19.39 | 10.02 | 5,553 | 0.20 | 5.26 | 3.32 | 24 | ||||||||||||||||||||||||
| — | 18.45 | 23.00 | 4,306 | 0.20 | (d) | 6.42 | (d) | 3.66 | (d) | 21 | ||||||||||||||||||||||
| $ | (0.51 | ) | $ | 19.43 | 1.77 | % | $ | 3,979 | 0.36 | %(d) | 0.45 | %(d) | 0.88 | %(d) | 36 | % | ||||||||||||||||
| (1.11 | ) | 19.60 | 9.97 | 15 | 0.35 | 0.45 | 2.57 | 70 | ||||||||||||||||||||||||
| (1.01 | ) | 18.94 | 3.23 | 14 | 0.42 | 2.17 | 3.23 | 108 | ||||||||||||||||||||||||
| (0.78 | ) | 19.34 | 9.75 | 13 | 0.45 | 5.54 | 3.17 | 24 | ||||||||||||||||||||||||
| — | 18.40 | 22.67 | 12 | 0.45 | (d) | 6.67 | (d) | 3.41 | (d) | 21 | ||||||||||||||||||||||
| See accompanying Notes to Financial Statements | | May 31, 2013 | | Semiannual Report | 173 |
Table of Contents
Financial Highlights (cont’d)
For a Share Outstanding for the Period ended:
| Net Asset Value, Beginning of Period | Net Investment Income (a) | Net Realized and Change in Unrealized Gain (Loss) | Total from Investment Operations | Dividends from Net Investment Income | Distributions from Net Realized Capital Gains | |||||||||||||||||||||
| AllianzGI Retirement 2020: | ||||||||||||||||||||||||||
| Class A | ||||||||||||||||||||||||||
5/31/2013+ | $ | 19.15 | $ | 0.30 | $ | 0.10 | $ | 0.40 | $ | (0.48 | ) | $ | (0.04 | ) | ||||||||||||
11/30/2012 | 18.82 | 0.44 | 1.34 | 1.78 | (0.70 | ) | (0.75 | ) | ||||||||||||||||||
11/30/2011 | 19.43 | 0.49 | 0.04 | 0.53 | (0.83 | ) | (0.31 | ) | ||||||||||||||||||
11/30/2010 | 18.58 | 0.52 | 1.18 | 1.70 | (0.66 | ) | (0.19 | ) | ||||||||||||||||||
12/29/2008* - 11/30/2009 | 15.00 | 0.53 | 3.05 | 3.58 | — | — | ||||||||||||||||||||
| Class C | ||||||||||||||||||||||||||
5/31/2013+ | $ | 18.78 | $ | 0.22 | $ | 0.12 | $ | 0.34 | $ | (0.14 | ) | $ | (0.04 | ) | ||||||||||||
11/30/2012 | 18.53 | 0.37 | 1.23 | 1.60 | (0.60 | ) | (0.75 | ) | ||||||||||||||||||
11/30/2011 | 19.21 | 0.30 | 0.09 | 0.39 | (0.76 | ) | (0.31 | ) | ||||||||||||||||||
11/30/2010 | 18.46 | 0.32 | 1.22 | 1.54 | (0.60 | ) | (0.19 | ) | ||||||||||||||||||
12/29/2008* - 11/30/2009 | 15.00 | 0.40 | 3.06 | 3.46 | — | — | ||||||||||||||||||||
| Class D | ||||||||||||||||||||||||||
5/31/2013+ | $ | 19.16 | $ | 0.32 | $ | 0.08 | $ | 0.40 | $ | (0.43 | ) | $ | (0.04 | ) | ||||||||||||
11/30/2012 | 18.84 | 0.39 | 1.36 | 1.75 | (0.68 | ) | (0.75 | ) | ||||||||||||||||||
11/30/2011 | 19.43 | 0.72 | (0.19 | ) | 0.53 | (0.81 | ) | (0.31 | ) | |||||||||||||||||
11/30/2010 | 18.59 | 0.52 | 1.17 | 1.69 | (0.66 | ) | (0.19 | ) | ||||||||||||||||||
12/29/2008* - 11/30/2009 | 15.00 | 0.53 | 3.06 | 3.59 | — | — | ||||||||||||||||||||
| Class R | ||||||||||||||||||||||||||
5/31/2013+ | $ | 19.14 | $ | 0.28 | $ | 0.09 | $ | 0.37 | $ | (0.46 | ) | $ | (0.04 | ) | ||||||||||||
11/30/2012 | 18.81 | 0.18 | 1.54 | 1.72 | (0.64 | ) | (0.75 | ) | ||||||||||||||||||
11/30/2011 | 19.40 | 0.53 | (0.05 | ) | 0.48 | (0.76 | ) | (0.31 | ) | |||||||||||||||||
11/30/2010 | 18.55 | 0.55 | 1.09 | 1.64 | (0.60 | ) | (0.19 | ) | ||||||||||||||||||
12/29/2008* - 11/30/2009 | 15.00 | 0.47 | 3.08 | 3.55 | — | — | ||||||||||||||||||||
| Class P | ||||||||||||||||||||||||||
5/31/2013+ | $ | 19.30 | $ | 0.27 | $ | 0.17 | $ | 0.44 | $ | (0.49 | ) | $ | (0.04 | ) | ||||||||||||
11/30/2012 | 18.94 | 0.37 | 1.47 | 1.84 | (0.73 | ) | (0.75 | ) | ||||||||||||||||||
11/30/2011 | 19.51 | 0.42 | 0.16 | 0.58 | (0.84 | ) | (0.31 | ) | ||||||||||||||||||
11/30/2010 | 18.62 | 0.64 | 1.10 | 1.74 | (0.66 | ) | (0.19 | ) | ||||||||||||||||||
12/29/2008* - 11/30/2009 | 15.00 | 0.54 | 3.08 | 3.62 | — | — | ||||||||||||||||||||
| Class R6 | ||||||||||||||||||||||||||
5/31/2013+ | $ | 19.32 | $ | 0.35 | $ | 0.10 | $ | 0.45 | $ | (0.49 | ) | $ | (0.04 | ) | ||||||||||||
11/30/2012 | 18.96 | 0.55 | 1.31 | 1.86 | (0.75 | ) | (0.75 | ) | ||||||||||||||||||
11/30/2011 | 19.53 | 0.64 | (0.04 | ) | 0.60 | (0.86 | ) | (0.31 | ) | |||||||||||||||||
11/30/2010 | 18.64 | 0.64 | 1.12 | 1.76 | (0.68 | ) | (0.19 | ) | ||||||||||||||||||
12/29/2008* - 11/30/2009 | 15.00 | 0.55 | 3.09 | 3.64 | — | — | ||||||||||||||||||||
| Administrative Class | ||||||||||||||||||||||||||
5/31/2013+ | $ | 19.25 | $ | 0.09 | $ | 0.32 | $ | 0.41 | $ | (0.49 | ) | $ | (0.04 | ) | ||||||||||||
11/30/2012 | 18.90 | 0.51 | 1.28 | 1.79 | (0.69 | ) | (0.75 | ) | ||||||||||||||||||
11/30/2011 | 19.48 | 0.59 | (0.05 | ) | 0.54 | (0.81 | ) | (0.31 | ) | |||||||||||||||||
11/30/2010 | 18.60 | 0.61 | 1.10 | 1.71 | (0.64 | ) | (0.19 | ) | ||||||||||||||||||
12/29/2008* - 11/30/2009 | 15.00 | 0.52 | 3.08 | 3.60 | — | — | ||||||||||||||||||||
| + | unaudited |
| * | Commencement of operations. |
| (a) | Calculated on average shares outstanding during the period. |
| (b) | Total return is calculated assuming a purchase of a share on the first day of the period and a sale of a share on the last day of each period reported. Dividends and distributions, if any, are assumed, for purposes of this calculation, to be reinvested. Total return does not reflect sales charges and includes the effect of fee waivers and reimbursements. Total return may reflect adjustments to conform to generally accepted accounting principles. Total return for a period of less than one year is not annualized. |
| (c) | Does not include expenses of the investment companies in which the Fund invests. |
| (d) | Annualized. |
| (e) | See Note 6 in the Notes to Financial Statements. |
| 174 | Semiannual Report | | May 31, 2013 | | See accompanying Notes to Financial Statements |
Table of Contents
| Total Dividends and Distributions | Net Asset Value, End of Period | Total Return (b) | Net Assets, End of Period (000s) | Ratio of Expenses to Average Net Assets with Fee Waiver/ Reimbursement (c) | Ratio of Expenses to Average Net Assets without Fee Waiver/ Reimbursement (c) | Ratio of Net Investment Income to Average Net Assets (c) | Portfolio Turnover Rate | |||||||||||||||||||||||||
| $ | (0.52 | ) | $ | 19.03 | 2.18 | % | $ | 9,247 | 0.43 | %(d) | 0.60 | %(d) | 3.16 | %(d) | 33 | % | ||||||||||||||||
| (1.45 | ) | 19.15 | 10.23 | 985 | 0.38 | 0.60 | 2.40 | 55 | ||||||||||||||||||||||||
| (1.14 | ) | 18.82 | 2.82 | 351 | 0.48 | 2.71 | 2.56 | 56 | ||||||||||||||||||||||||
| (0.85 | ) | 19.43 | 9.60 | 154 | 0.53 | 6.52 | 2.79 | 23 | ||||||||||||||||||||||||
| — | 18.58 | 23.87 | 40 | 0.53 | (d) | 10.16 | (d) | 3.38 | (d) | 25 | ||||||||||||||||||||||
| $ | (0.18 | ) | $ | 18.94 | 1.82 | % | $ | 558 | 1.18 | %(d) | 1.35 | %(d) | 2.32 | %(d) | 33 | % | ||||||||||||||||
| (1.35 | ) | 18.78 | 9.29 | 364 | 1.13 | 1.35 | 2.07 | 55 | ||||||||||||||||||||||||
| (1.07 | ) | 18.53 | 2.07 | 669 | 1.23 | 3.40 | 1.61 | 56 | ||||||||||||||||||||||||
| (0.79 | ) | 19.21 | 8.72 | 204 | 1.28 | 8.05 | 1.72 | 23 | ||||||||||||||||||||||||
| — | 18.46 | 23.07 | 30 | 1.28 | (d) | 10.57 | (d) | 2.63 | (d) | 25 | ||||||||||||||||||||||
| $ | (0.47 | ) | $ | 19.09 | 2.16 | % | $ | 247 | 0.53 | %(d) | 0.60 | %(d) | 3.34 | %(d) | 33 | % | ||||||||||||||||
| (1.43 | ) | 19.16 | 10.02 | 266 | 0.48 | 0.60 | 2.12 | 55 | ||||||||||||||||||||||||
| (1.12 | ) | 18.84 | 2.85 | 115 | 0.52 | 2.91 | 3.80 | 56 | ||||||||||||||||||||||||
| (0.85 | ) | 19.43 | 9.54 | 187 | 0.53 | 5.95 | 2.80 | 23 | ||||||||||||||||||||||||
| — | 18.59 | 23.93 | 65 | 0.53 | (d) | 10.35 | (d) | 3.38 | (d) | 25 | ||||||||||||||||||||||
| $ | (0.50 | ) | $ | 19.01 | 1.99 | % | $ | 1,034 | 0.78 | %(d) | 0.85 | %(d) | 2.91 | %(d) | 33 | % | ||||||||||||||||
| (1.39 | ) | 19.14 | 9.84 | 938 | 0.73 | 0.85 | 0.97 | 55 | ||||||||||||||||||||||||
| (1.07 | ) | 18.81 | 2.57 | 14 | 0.77 | 3.09 | 2.77 | 56 | ||||||||||||||||||||||||
| (0.79 | ) | 19.40 | 9.25 | 13 | 0.78 | 6.30 | 2.99 | 23 | ||||||||||||||||||||||||
| — | 18.55 | 23.67 | 12 | 0.78 | (d) | 8.76 | (d) | 3.13 | (d) | 25 | ||||||||||||||||||||||
| $ | (0.53 | ) | $ | 19.21 | 2.34 | % | $ | 8,534 | 0.13 | %(d) | 0.20 | %(d) | 2.80 | %(d) | 33 | % | ||||||||||||||||
| (1.48 | ) | 19.30 | 10.55 | 5,323 | 0.08 | 0.20 | 1.95 | 55 | ||||||||||||||||||||||||
| (1.15 | ) | 18.94 | 3.07 | 42 | 0.17 | 1.39 | 2.24 | 56 | ||||||||||||||||||||||||
| (0.85 | ) | 19.51 | 9.81 | 14 | 0.33 | 5.93 | 3.44 | 23 | ||||||||||||||||||||||||
| — | 18.62 | 24.13 | 13 | 0.33 | (d) | 6.56 | (d) | 3.58 | (d) | 25 | ||||||||||||||||||||||
| $ | (0.53 | ) | $ | 19.24 | 2.36 | % | $ | 7,509 | 0.03 | %(d) | 0.13 | %(d) | 3.64 | %(d) | 33 | % | ||||||||||||||||
| (1.50 | ) | 19.32 | 10.62 | 7,708 | 0.00 | (e) | 0.15 | 2.98 | 55 | |||||||||||||||||||||||
| (1.17 | ) | 18.96 | 3.16 | 5,157 | 0.17 | 2.51 | 3.34 | 56 | ||||||||||||||||||||||||
| (0.87 | ) | 19.53 | 9.90 | 4,834 | 0.23 | 5.80 | 3.44 | 23 | ||||||||||||||||||||||||
| — | 18.64 | 24.27 | 3,654 | 0.23 | (d) | 6.46 | (d) | 3.68 | (d) | 25 | ||||||||||||||||||||||
| $ | (0.53 | ) | $ | 19.13 | 2.23 | % | $ | 7,164 | 0.38 | %(d) | 0.45 | %(d) | 0.96 | %(d) | 33 | % | ||||||||||||||||
| (1.44 | ) | 19.25 | 10.20 | 15 | 0.33 | 0.45 | 2.73 | 55 | ||||||||||||||||||||||||
| (1.12 | ) | 18.90 | 2.87 | 14 | 0.44 | 2.78 | 3.09 | 56 | ||||||||||||||||||||||||
| (0.83 | ) | 19.48 | 9.63 | 14 | 0.48 | 6.08 | 3.29 | 23 | ||||||||||||||||||||||||
| — | 18.60 | 24.00 | 12 | 0.48 | (d) | 6.71 | (d) | 3.43 | (d) | 25 | ||||||||||||||||||||||
| See accompanying Notes to Financial Statements | | May 31, 2013 | | Semiannual Report | 175 |
Table of Contents
Financial Highlights (cont’d)
For a Share Outstanding for the Period ended:
| Net Asset Value, Beginning of Period | Net Investment Income (a) | Net Realized and Change in Unrealized Gain | Total from Investment Operations | Dividends from Net Investment Income | Distributions from Net Realized Capital Gains | |||||||||||||||||||||
| AllianzGI Retirement 2025: | ||||||||||||||||||||||||||
| Class A | ||||||||||||||||||||||||||
5/31/2013+ | $ | 16.63 | $ | 0.25 | $ | 0.14 | $ | 0.39 | $ | (0.40 | ) | $ | (0.04 | ) | ||||||||||||
12/19/2011* - 11/30/2012 | 15.00 | 0.34 | 1.43 | 1.77 | (0.14 | ) | — | |||||||||||||||||||
| Class R | ||||||||||||||||||||||||||
5/31/2013+ | $ | 16.57 | $ | 0.29 | $ | 0.07 | $ | 0.36 | $ | (0.36 | ) | $ | (0.04 | ) | ||||||||||||
12/19/2011* - 11/30/2012 | 15.00 | 0.18 | 1.53 | 1.71 | (0.14 | ) | — | |||||||||||||||||||
| Class P | ||||||||||||||||||||||||||
5/31/2013+ | $ | 16.67 | $ | 0.29 | $ | 0.13 | $ | 0.42 | $ | (0.40 | ) | $ | (0.04 | ) | ||||||||||||
12/19/2011* - 11/30/2012 | 15.00 | 0.38 | 1.44 | 1.82 | (0.15 | ) | — | |||||||||||||||||||
| Class R6 | ||||||||||||||||||||||||||
5/31/2013+ | $ | 16.68 | $ | 0.31 | $ | 0.12 | $ | 0.43 | $ | (0.40 | ) | $ | (0.04 | ) | ||||||||||||
12/19/2011* - 11/30/2012 | 15.00 | 0.45 | 1.38 | 1.83 | (0.15 | ) | — | |||||||||||||||||||
| Administrative Class | ||||||||||||||||||||||||||
5/31/2013+ | $ | 16.62 | $ | 0.06 | $ | 0.35 | $ | 0.41 | $ | (0.35 | ) | $ | (0.04 | ) | ||||||||||||
12/19/2011* - 11/30/2012 | 15.00 | 0.41 | 1.35 | 1.76 | (0.14 | ) | — | |||||||||||||||||||
| + | unaudited |
| * | Commencement of operations. |
| (a) | Calculated on average shares outstanding during the period. |
| (b) | Total return is calculated assuming a purchase of a share on the first day of the period and a sale of a share on the last day of each period reported. Dividends and distributions, if any, are assumed, for purposes of this calculation, to be reinvested. Total return does not reflect sales charges and includes the effect of fee waivers and reimbursements. Total return may reflect adjustments to conform to generally accepted accounting principles. Total return for a period of less than one year is not annualized. |
| (c) | Does not include expenses of the investment companies in which the Fund invests. |
| (d) | Annualized. |
| (e) | See Note 6 in the Notes to Financial Statements. |
| 176 | Semiannual Report | | May 31, 2013 | | See accompanying Notes to Financial Statements |
Table of Contents
| Total Dividends and Distributions | Net Asset Value, End of Period | Total Return (b) | Net Assets, End of Period (000s) | Ratio of Expenses to Average Net Assets with Fee Waiver/ Reimbursement (c) | Ratio of Expenses to Average Net Assets without Fee Waiver/ Reimbursement (c) | Ratio of Net Investment Income to Average Net Assets (c) | Portfolio Turnover Rate | |||||||||||||||||||||||||
| $ | (0.44 | ) | $ | 16.58 | 2.43 | % | $ | 12,380 | 0.43 | %(d) | 0.60 | %(d) | 3.05 | %(d) | 24 | % | ||||||||||||||||
| (0.14 | ) | 16.63 | 11.86 | 335 | 0.38 | (d) | 0.60 | (d) | 2.22 | (d) | 55 | |||||||||||||||||||||
| $ | (0.40 | ) | $ | 16.53 | 2.23 | % | $ | 818 | 0.78 | %(d) | 0.85 | %(d) | 3.52 | %(d) | 24 | % | ||||||||||||||||
| (0.14 | ) | 16.57 | 11.51 | 1,284 | 0.73 | (d) | 0.85 | (d) | 1.19 | (d) | 55 | |||||||||||||||||||||
| $ | (0.44 | ) | $ | 16.65 | 2.55 | % | $ | 4,729 | 0.13 | %(d) | 0.20 | %(d) | 3.50 | %(d) | �� | 24 | % | |||||||||||||||
| (0.15 | ) | 16.67 | 12.21 | 3,873 | 0.08 | (d) | 0.20 | (d) | 2.47 | (d) | 55 | |||||||||||||||||||||
| $ | (0.44 | ) | $ | 16.67 | 2.64 | % | $ | 4,790 | 0.03 | %(d) | 0.13 | %(d) | 3.66 | %(d) | 24 | % | ||||||||||||||||
| (0.15 | ) | 16.68 | 12.28 | 5,375 | — | (d)(e) | 0.15 | (d) | 2.94 | (d) | 55 | |||||||||||||||||||||
| $ | (0.39 | ) | $ | 16.64 | 2.50 | % | $ | 10,246 | 0.38 | %(d) | 0.45 | %(d) | 0.77 | %(d) | 24 | % | ||||||||||||||||
| (0.14 | ) | 16.62 | 11.86 | 11 | 0.33 | (d) | 0.45 | (d) | 2.72 | (d) | 55 | |||||||||||||||||||||
| See accompanying Notes to Financial Statements | | May 31, 2013 | | Semiannual Report | 177 |
Table of Contents
Financial Highlights (cont’d)
For a Share Outstanding for the Period ended:
| Net Asset Value, Beginning of Period | Net Investment Income (a) | Net Realized and Change in Unrealized Gain (Loss) | Total from Investment Operations | Dividends from Net Investment Income | Distributions from Net Realized Capital Gains | |||||||||||||||||||||
| AllianzGI Retirement 2030: | ||||||||||||||||||||||||||
| Class A | ||||||||||||||||||||||||||
5/31/2013+ | $ | 19.80 | $ | 0.32 | $ | 0.44 | $ | 0.76 | $ | (0.54 | ) | $ | (0.04 | ) | ||||||||||||
11/30/2012 | 19.77 | 0.29 | 1.61 | 1.90 | (0.70 | ) | (1.17 | ) | ||||||||||||||||||
11/30/2011 | 20.78 | 0.50 | (0.10 | ) | 0.40 | (0.85 | ) | (0.56 | ) | |||||||||||||||||
11/30/2010 | 19.36 | 0.50 | 1.59 | 2.09 | (0.51 | ) | (0.16 | ) | ||||||||||||||||||
12/29/2008* - 11/30/2009 | 15.00 | 0.41 | 3.95 | 4.36 | — | — | ||||||||||||||||||||
| Class C | ||||||||||||||||||||||||||
5/31/2013+ | $ | 19.53 | $ | 0.24 | $ | 0.44 | $ | 0.68 | $ | (0.35 | ) | $ | (0.04 | ) | ||||||||||||
11/30/2012 | 19.51 | 0.43 | 1.30 | 1.73 | (0.54 | ) | (1.17 | ) | ||||||||||||||||||
11/30/2011 | 20.59 | 0.37 | (0.09 | ) | 0.28 | (0.80 | ) | (0.56 | ) | |||||||||||||||||
11/30/2010 | 19.28 | 0.26 | 1.66 | 1.92 | (0.45 | ) | (0.16 | ) | ||||||||||||||||||
12/29/2008* - 11/30/2009 | 15.00 | 0.28 | 4.00 | 4.28 | — | — | ||||||||||||||||||||
| Class D | ||||||||||||||||||||||||||
5/31/2013+ | $ | 19.84 | $ | 0.35 | $ | 0.41 | $ | 0.76 | $ | (0.48 | ) | $ | (0.04 | ) | ||||||||||||
11/30/2012 | 19.82 | 0.52 | 1.36 | 1.88 | (0.69 | ) | (1.17 | ) | ||||||||||||||||||
11/30/2011 | 20.82 | 0.53 | (0.12 | ) | 0.41 | (0.85 | ) | (0.56 | ) | |||||||||||||||||
11/30/2010 | 19.40 | 0.47 | 1.62 | 2.09 | (0.51 | ) | (0.16 | ) | ||||||||||||||||||
12/29/2008* - 11/30/2009 | 15.00 | 0.41 | 3.99 | 4.40 | — | — | ||||||||||||||||||||
| Class R | ||||||||||||||||||||||||||
5/31/2013+ | $ | 19.85 | $ | 0.28 | $ | 0.45 | $ | 0.73 | $ | (0.53 | ) | $ | (0.04 | ) | ||||||||||||
11/30/2012 | 19.81 | 0.18 | 1.67 | 1.85 | (0.64 | ) | (1.17 | ) | ||||||||||||||||||
11/30/2011 | 20.80 | 0.52 | (0.15 | ) | 0.37 | (0.80 | ) | (0.56 | ) | |||||||||||||||||
11/30/2010 | 19.37 | 0.49 | 1.54 | 2.03 | (0.44 | ) | (0.16 | ) | ||||||||||||||||||
12/29/2008* - 11/30/2009 | 15.00 | 0.34 | 4.03 | 4.37 | — | — | ||||||||||||||||||||
| Class P | ||||||||||||||||||||||||||
5/31/2013+ | $ | 20.02 | $ | 0.30 | $ | 0.50 | $ | 0.80 | $ | (0.56 | ) | $ | (0.04 | ) | ||||||||||||
11/30/2012 | 19.95 | 0.41 | 1.57 | 1.98 | (0.74 | ) | (1.17 | ) | ||||||||||||||||||
11/30/2011 | 20.92 | 0.58 | (0.12 | ) | 0.46 | (0.87 | ) | (0.56 | ) | |||||||||||||||||
11/30/2010 | 19.45 | 0.58 | 1.56 | 2.14 | (0.51 | ) | (0.16 | ) | ||||||||||||||||||
12/29/2008* - 11/30/2009 | 15.00 | 0.41 | 4.04 | 4.45 | — | — | ||||||||||||||||||||
| Class R6 | ||||||||||||||||||||||||||
5/31/2013+ | $ | 20.04 | $ | 0.38 | $ | 0.43 | $ | 0.81 | $ | (0.56 | ) | $ | (0.04 | ) | ||||||||||||
11/30/2012 | 19.97 | 0.61 | 1.38 | 1.99 | (0.75 | ) | (1.17 | ) | ||||||||||||||||||
11/30/2011 | 20.94 | 0.62 | (0.14 | ) | 0.48 | (0.89 | ) | (0.56 | ) | |||||||||||||||||
11/30/2010 | 19.47 | 0.59 | 1.56 | 2.15 | (0.52 | ) | (0.16 | ) | ||||||||||||||||||
12/29/2008* - 11/30/2009 | 15.00 | 0.43 | 4.04 | 4.47 | — | — | ||||||||||||||||||||
| Administrative Class | ||||||||||||||||||||||||||
5/31/2013+ | $ | 19.96 | $ | 0.08 | $ | 0.70 | $ | 0.78 | $ | (0.52 | ) | $ | (0.04 | ) | ||||||||||||
11/30/2012 | 19.91 | 0.57 | 1.35 | 1.92 | (0.70 | ) | (1.17 | ) | ||||||||||||||||||
11/30/2011 | 20.88 | 0.58 | (0.14 | ) | 0.44 | (0.85 | ) | (0.56 | ) | |||||||||||||||||
11/30/2010 | 19.43 | 0.55 | 1.54 | 2.09 | (0.48 | ) | (0.16 | ) | ||||||||||||||||||
12/29/2008* - 11/30/2009 | 15.00 | 0.39 | 4.04 | 4.43 | — | — | ||||||||||||||||||||
| + | unaudited |
| * | Commencement of operations. |
| (a) | Calculated on average shares outstanding during the period. |
| (b) | Total return is calculated assuming a purchase of a share on the first day of the period and a sale of a share on the last day of each period reported. Dividends and distributions, if any, are assumed, for purposes of this calculation, to be reinvested. Total return does not reflect sales charges and includes the effect of fee waivers and reimbursements. Total return may reflect adjustments to conform to generally accepted accounting principles. Total return for a period of less than one year is not annualized. |
| (c) | Does not include expenses of the investment companies in which the Fund invests. |
| (d) | Annualized. |
| (e) | See Note 6 in the Notes to Financial Statements. |
| 178 | Semiannual Report | | May 31, 2013 | | See accompanying Notes to Financial Statements |
Table of Contents
| Total Dividends and Distributions | Net Asset Value, End of Period | Total Return (b) | Net Assets, End of Period (000s) | Ratio of Expenses to Average Net Assets with Fee Waiver/ Reimbursement (c) | Ratio of Expenses to Average Net Assets without Fee Waiver/ Reimbursement (c) | Ratio of Net Investment Income to Average Net Assets (c) | Portfolio Turnover Rate | |||||||||||||||||||||||||
| $ | (0.58 | ) | $ | 19.98 | 3.94 | % | $ | 9,471 | 0.34 | %(d) | 0.60 | %(d) | 3.25 | %(d) | 27 | % | ||||||||||||||||
| (1.87 | ) | 19.80 | 10.68 | 10,692 | 0.29 | 0.60 | 1.48 | 47 | ||||||||||||||||||||||||
| (1.41 | ) | 19.77 | 1.76 | 460 | 0.45 | 2.50 | 2.43 | 52 | ||||||||||||||||||||||||
| (0.67 | ) | 20.78 | 11.07 | 286 | 0.63 | 5.46 | 2.57 | 33 | ||||||||||||||||||||||||
| — | 19.36 | 29.07 | 179 | 0.63 | (d) | 9.16 | (d) | 2.47 | (d) | 11 | ||||||||||||||||||||||
| $ | (0.39 | ) | $ | 19.82 | 3.55 | % | $ | 786 | 1.09 | %(d) | 1.35 | %(d) | 2.48 | %(d) | 27 | % | ||||||||||||||||
| (1.71 | ) | 19.53 | 9.80 | 605 | 1.04 | 1.35 | 2.26 | 47 | ||||||||||||||||||||||||
| (1.36 | ) | 19.51 | 1.20 | 654 | 1.21 | 3.34 | 1.84 | 52 | ||||||||||||||||||||||||
| (0.61 | ) | 20.59 | 10.17 | 542 | 1.38 | 7.39 | 1.32 | 33 | ||||||||||||||||||||||||
| — | 19.28 | 28.53 | 78 | 1.38 | (d) | 9.74 | (d) | 1.72 | (d) | 11 | ||||||||||||||||||||||
| $ | (0.52 | ) | $ | 20.08 | 3.87 | % | $ | 552 | 0.44 | %(d) | 0.60 | %(d) | 3.52 | %(d) | 27 | % | ||||||||||||||||
| (1.86 | ) | 19.84 | 10.48 | 519 | 0.39 | 0.60 | 2.69 | 47 | ||||||||||||||||||||||||
| (1.41 | ) | 19.82 | 1.89 | 377 | 0.48 | 2.51 | 2.59 | 52 | ||||||||||||||||||||||||
| (0.67 | ) | 20.82 | 11.04 | 295 | 0.63 | 5.63 | 2.41 | 33 | ||||||||||||||||||||||||
| — | 19.40 | 29.33 | 123 | 0.63 | (d) | 8.98 | (d) | 2.47 | (d) | 11 | ||||||||||||||||||||||
| $ | (0.57 | ) | $ | 20.01 | 3.82 | % | $ | 1,232 | 0.69 | %(d) | 0.85 | %(d) | 2.83 | %(d) | 27 | % | ||||||||||||||||
| (1.81 | ) | 19.85 | 10.23 | 1,103 | 0.64 | 0.85 | 0.95 | 47 | ||||||||||||||||||||||||
| (1.36 | ) | 19.81 | 1.66 | 14 | 0.74 | 2.82 | 2.54 | 52 | ||||||||||||||||||||||||
| (0.60 | ) | 20.80 | 10.73 | 14 | 0.88 | 5.79 | 2.53 | 33 | ||||||||||||||||||||||||
| — | 19.37 | 29.13 | 13 | 0.88 | (d) | 7.74 | (d) | 2.22 | (d) | 11 | ||||||||||||||||||||||
| $ | (0.60 | ) | $ | 20.22 | 4.11 | % | $ | 8,456 | 0.04 | %(d) | 0.20 | %(d) | 2.99 | %(d) | 27 | % | ||||||||||||||||
| (1.91 | ) | 20.02 | 10.97 | 5,103 | — | (e) | 0.20 | 2.06 | 47 | |||||||||||||||||||||||
| (1.43 | ) | 19.95 | 2.13 | 19 | 0.22 | 2.27 | 2.84 | 52 | ||||||||||||||||||||||||
| (0.67 | ) | 20.92 | 11.27 | 14 | 0.43 | 5.41 | 2.97 | 33 | ||||||||||||||||||||||||
| — | 19.45 | 29.67 | 13 | 0.43 | (d) | 6.37 | (d) | 2.67 | (d) | 11 | ||||||||||||||||||||||
| $ | (0.60 | ) | $ | 20.25 | 4.16 | % | $ | 10,527 | — | %(d)(e) | 0.10 | %(d) | 3.76 | %(d) | 27 | % | ||||||||||||||||
| (1.92 | ) | 20.04 | 11.07 | 9,182 | — | (e) | 0.15 | 3.14 | 47 | |||||||||||||||||||||||
| (1.45 | ) | 19.97 | 2.23 | 5,813 | 0.13 | 2.24 | 3.04 | 52 | ||||||||||||||||||||||||
| (0.68 | ) | 20.94 | 11.35 | 5,145 | 0.33 | 5.29 | 3.02 | 33 | ||||||||||||||||||||||||
| — | 19.47 | 29.80 | 4,163 | 0.33 | (d) | 6.27 | (d) | 2.77 | (d) | 11 | ||||||||||||||||||||||
| $ | (0.56 | ) | $ | 20.18 | 4.03 | % | $ | 8,919 | 0.29 | %(d) | 0.45 | %(d) | 0.82 | %(d) | 27 | % | ||||||||||||||||
| (1.87 | ) | 19.96 | 10.60 | 16 | 0.24 | 0.45 | 2.95 | 47 | ||||||||||||||||||||||||
| (1.41 | ) | 19.91 | 1.99 | 15 | 0.41 | 2.52 | 2.85 | 52 | ||||||||||||||||||||||||
| (0.64 | ) | 20.88 | 11.04 | 14 | 0.58 | 5.55 | 2.82 | 33 | ||||||||||||||||||||||||
| — | 19.43 | 29.53 | 13 | 0.58 | (d) | 6.52 | (d) | 2.52 | (d) | 11 | ||||||||||||||||||||||
| See accompanying Notes to Financial Statements | | May 31, 2013 | | Semiannual Report | 179 |
Table of Contents
Financial Highlights (cont’d)
For a Share Outstanding for the Period ended:
| Net Asset Value, Beginning of Period | Net Investment Income (a) | Net Realized and Change in Unrealized Gain | Total from Investment Operations | Dividends from Net Investment Income | Distributions from Net Realized Capital Gains | |||||||||||||||||||||
| AllianzGI Retirement 2035: | ||||||||||||||||||||||||||
| Class A | ||||||||||||||||||||||||||
5/31/2013+ | $ | 16.94 | $ | 0.26 | $ | 0.59 | $ | 0.85 | $ | (0.42 | ) | $ | (0.05 | ) | ||||||||||||
12/19/2011* - 11/30/2012 | 15.00 | 0.37 | 1.74 | 2.11 | (0.17 | ) | — | |||||||||||||||||||
| Class R | ||||||||||||||||||||||||||
5/31/2013+ | $ | 16.89 | $ | 0.26 | $ | 0.55 | $ | 0.81 | $ | (0.39 | ) | $ | (0.05 | ) | ||||||||||||
12/19/2011* - 11/30/2012 | 15.00 | 0.16 | 1.90 | 2.06 | (0.17 | ) | — | |||||||||||||||||||
| Class P | ||||||||||||||||||||||||||
5/31/2013+ | $ | 16.99 | $ | 0.30 | $ | 0.58 | $ | 0.88 | $ | (0.42 | ) | $ | (0.05 | ) | ||||||||||||
12/19/2011* - 11/30/2012 | 15.00 | 0.38 | 1.79 | 2.17 | (0.18 | ) | — | |||||||||||||||||||
| Class R6 | ||||||||||||||||||||||||||
5/31/2013+ | $ | 17.00 | $ | 0.33 | $ | 0.55 | $ | 0.88 | $ | (0.42 | ) | $ | (0.05 | ) | ||||||||||||
12/19/2011* - 11/30/2012 | 15.00 | 0.46 | 1.72 | 2.18 | (0.18 | ) | — | |||||||||||||||||||
| Administrative Class | ||||||||||||||||||||||||||
5/31/2013+ | $ | 16.94 | $ | 0.06 | $ | 0.80 | $ | 0.86 | $ | (0.38 | ) | $ | (0.05 | ) | ||||||||||||
12/19/2011* - 11/30/2012 | 15.00 | 0.42 | 1.69 | 2.11 | (0.17 | ) | — | |||||||||||||||||||
| + | unaudited |
| * | Commencement of operations. |
| (a) | Calculated on average shares outstanding during the period. |
| (b) | Total return is calculated assuming a purchase of a share on the first day of the period and a sale of a share on the last day of each period reported. Dividends and distributions, if any, are assumed, for purposes of this calculation, to be reinvested. Total return does not reflect sales charges and includes the effect of fee waivers and reimbursements. Total return may reflect adjustments to conform to generally accepted accounting principles. Total return for a period of less than one year is not annualized. |
| (c) | Does not include expenses of the investment companies in which the Fund invests. |
| (d) | Annualized. |
| (e) | See Note 6 in the Notes to Financial Statements. |
| 180 | Semiannual Report | | May 31, 2013 | | See accompanying Notes to Financial Statements |
Table of Contents
| Total Dividends and Distributions | Net Asset Value, End of Period | Total Return (b) | Net Assets, End of Period (000s) | Ratio of Expenses to Average Net Assets with Fee Waiver/ Reimbursement (c) | Ratio of Expenses to Average Net Assets without Fee Waiver/ Reimbursement (c) | Ratio of Net Investment Income to Average Net Assets (c) | Portfolio Turnover Rate | |||||||||||||||||||||||||
| $ | (0.47 | ) | $ | 17.32 | 5.14 | % | $ | 5,121 | 0.36 | %(d) | 0.60 | %(d) | 3.10 | %(d) | 19 | % | ||||||||||||||||
| (0.17 | ) | 16.94 | 14.23 | 104 | 0.30 | (d) | 0.60 | (d) | 2.36 | (d) | 38 | |||||||||||||||||||||
| $ | (0.44 | ) | $ | 17.26 | 4.95 | % | $ | 924 | 0.71 | %(d) | 0.85 | %(d) | 3.10 | %(d) | 19 | % | ||||||||||||||||
| (0.17 | ) | 16.89 | 13.88 | 893 | 0.65 | (d) | 0.85 | (d) | 1.04 | (d) | 38 | |||||||||||||||||||||
| $ | (0.47 | ) | $ | 17.40 | 5.33 | % | $ | 5,448 | 0.06 | %(d) | 0.20 | %(d) | 3.55 | %(d) | 19 | % | ||||||||||||||||
| (0.18 | ) | 16.99 | 14.58 | 4,090 | — | (d) | 0.20 | (d) | 2.43 | (d) | 38 | |||||||||||||||||||||
| $ | (0.47 | ) | $ | 17.41 | 5.33 | % | $ | 5,515 | — | %(d)(e) | 0.10 | %(d) | 3.84 | %(d) | 19 | % | ||||||||||||||||
| (0.18 | ) | 17.00 | 14.65 | 5,132 | — | (d)(e) | 0.15 | (d) | 3.00 | (d) | 38 | |||||||||||||||||||||
| $ | (0.43 | ) | $ | 17.37 | 5.21 | % | $ | 9,769 | 0.31 | %(d) | 0.45 | %(d) | 0.71 | %(d) | 19 | % | ||||||||||||||||
| (0.17 | ) | 16.94 | 14.23 | 12 | 0.25 | (d) | 0.45 | (d) | 2.76 | (d) | 38 | |||||||||||||||||||||
| See accompanying Notes to Financial Statements | | May 31, 2013 | | Semiannual Report | 181 |
Table of Contents
Financial Highlights (cont’d)
For a Share Outstanding for the Period ended:
| Net Asset Value, Beginning of Period | Net Investment Income (a) | Net Realized and Change in Unrealized Gain (Loss) | Total from Investment Operations | Dividends from Net Investment Income | Distributions from Net Realized Capital Gains | |||||||||||||||||||||
| AllianzGI Retirement 2040: | ||||||||||||||||||||||||||
| Class A | ||||||||||||||||||||||||||
5/31/2013+ | $ | 19.71 | $ | 0.31 | $ | 0.91 | $ | 1.22 | $ | (0.53 | ) | $ | (0.04 | ) | ||||||||||||
11/30/2012 | 20.22 | 0.29 | 1.61 | 1.90 | (0.69 | ) | (1.72 | ) | ||||||||||||||||||
11/30/2011 | 21.88 | 0.52 | (0.27 | ) | 0.25 | (0.97 | ) | (0.94 | ) | |||||||||||||||||
11/30/2010 | 20.08 | 0.73 | 1.71 | 2.44 | (0.49 | ) | (0.15 | ) | ||||||||||||||||||
12/29/2008* - 11/30/2009 | 15.00 | 0.30 | 4.78 | 5.08 | — | — | ||||||||||||||||||||
| Class C | ||||||||||||||||||||||||||
5/31/2013+ | $ | 19.53 | $ | 0.25 | $ | 0.89 | $ | 1.14 | $ | (0.42 | ) | $ | (0.04 | ) | ||||||||||||
11/30/2012 | 20.07 | 0.31 | 1.43 | 1.74 | (0.56 | ) | (1.72 | ) | ||||||||||||||||||
11/30/2011 | 21.65 | 0.27 | (0.18 | ) | 0.09 | (0.73 | ) | (0.94 | ) | |||||||||||||||||
11/30/2010 | 19.92 | 0.57 | 1.69 | 2.26 | (0.38 | ) | (0.15 | ) | ||||||||||||||||||
12/29/2008* - 11/30/2009 | 15.00 | 0.19 | 4.73 | 4.92 | — | — | ||||||||||||||||||||
| Class D | ||||||||||||||||||||||||||
5/31/2013+ | $ | 19.61 | $ | 0.36 | $ | 0.86 | $ | 1.22 | $ | (0.45 | ) | $ | (0.04 | ) | ||||||||||||
11/30/2012 | 20.16 | 0.41 | 1.44 | 1.85 | (0.68 | ) | (1.72 | ) | ||||||||||||||||||
11/30/2011 | 21.88 | 0.76 | (0.51 | ) | 0.25 | (1.03 | ) | (0.94 | ) | |||||||||||||||||
11/30/2010 | 20.05 | 0.52 | 1.92 | 2.44 | (0.46 | ) | (0.15 | ) | ||||||||||||||||||
12/29/2008* - 11/30/2009 | 15.00 | 0.32 | 4.73 | 5.05 | — | — | ||||||||||||||||||||
| Class R | ||||||||||||||||||||||||||
5/31/2013+ | $ | 19.63 | $ | 0.30 | $ | 0.89 | $ | 1.19 | $ | (0.52 | ) | $ | (0.04 | ) | ||||||||||||
11/30/2012 | 20.16 | 0.16 | 1.66 | 1.82 | (0.63 | ) | (1.72 | ) | ||||||||||||||||||
11/30/2011 | 21.85 | 0.56 | (0.36 | ) | 0.20 | (0.95 | ) | (0.94 | ) | |||||||||||||||||
11/30/2010 | 20.03 | 0.59 | 1.80 | 2.39 | (0.42 | ) | (0.15 | ) | ||||||||||||||||||
12/29/2008* - 11/30/2009 | 15.00 | 0.26 | 4.77 | 5.03 | — | — | ||||||||||||||||||||
| Class P | ||||||||||||||||||||||||||
5/31/2013+ | $ | 19.82 | $ | 0.28 | $ | 0.98 | $ | 1.26 | $ | (0.54 | ) | $ | (0.04 | ) | ||||||||||||
11/30/2012 | 20.31 | 0.39 | 1.57 | 1.96 | (0.73 | ) | (1.72 | ) | ||||||||||||||||||
11/30/2011 | 21.97 | 0.67 | (0.36 | ) | 0.31 | (1.03 | ) | (0.94 | ) | |||||||||||||||||
11/30/2010 | 20.12 | 0.68 | 1.80 | 2.48 | (0.48 | ) | (0.15 | ) | ||||||||||||||||||
12/29/2008* - 11/30/2009 | 15.00 | 0.33 | 4.79 | 5.12 | — | — | ||||||||||||||||||||
| Class R6 | ||||||||||||||||||||||||||
5/31/2013+ | $ | 19.83 | $ | 0.38 | $ | 0.89 | $ | 1.27 | $ | (0.54 | ) | $ | (0.04 | ) | ||||||||||||
11/30/2012 | 20.33 | 0.56 | 1.41 | 1.97 | (0.75 | ) | (1.72 | ) | ||||||||||||||||||
11/30/2011 | 22.00 | 0.68 | (0.36 | ) | 0.32 | (1.05 | ) | (0.94 | ) | |||||||||||||||||
11/30/2010 | 20.13 | 0.70 | 1.82 | 2.52 | (0.50 | ) | (0.15 | ) | ||||||||||||||||||
12/29/2008* - 11/30/2009 | 15.00 | 0.35 | 4.78 | 5.13 | — | — | ||||||||||||||||||||
| Administrative Class | ||||||||||||||||||||||||||
5/31/2013+ | $ | 19.75 | $ | 0.08 | $ | 1.15 | $ | 1.23 | $ | (0.51 | ) | $ | (0.04 | ) | ||||||||||||
11/30/2012 | 20.26 | 0.52 | 1.38 | 1.90 | (0.69 | ) | (1.72 | ) | ||||||||||||||||||
11/30/2011 | 21.93 | 0.63 | (0.36 | ) | 0.27 | (1.00 | ) | (0.94 | ) | |||||||||||||||||
11/30/2010 | 20.09 | 0.65 | 1.80 | 2.45 | (0.46 | ) | (0.15 | ) | ||||||||||||||||||
12/29/2008* - 11/30/2009 | 15.00 | 0.31 | 4.78 | 5.09 | — | — | ||||||||||||||||||||
| * | Commencement of operations. |
| + | unaudited |
| (a) | Calculated on average shares outstanding during the period. |
| (b) | Total return is calculated assuming a purchase of a share on the first day of the period and a sale of a share on the last day of each period reported. Dividends and distributions, if any, are assumed, for purposes of this calculation, to be reinvested. Total return does not reflect sales charges and includes the effect of fee waivers and reimbursements. Total return may reflect adjustments to conform to generally accepted accounting principles. Total return for a period of less than one year is not annualized. |
| (c) | Does not include expenses of the investment companies in which the Fund invests. |
| (d) | Annualized. |
| (e) | See Note 6 in the Notes to Financial Statements. |
| 182 | Semiannual Report | | May 31, 2013 | | See accompanying Notes to Financial Statements |
Table of Contents
| Total Dividends and Distributions | Net Asset Value, End of Period | Total Return (b) | Net Assets, End of Period (000s) | Ratio of Expenses to Average Net Assets with Fee Waiver/ Reimbursement (c) | Ratio of Expenses to Average Net Assets without Fee Waiver/ Reimbursement (c) | Ratio of Net Investment Income to Average Net Assets (c) | Portfolio Turnover Rate | |||||||||||||||||||||||||
| $ | (0.57 | ) | $ | 20.36 | 6.41 | % | $ | 4,954 | 0.35 | %(d) | 0.60 | %(d) | 3.08 | %(d) | 18 | % | ||||||||||||||||
| (2.41 | ) | 19.71 | 10.61 | 1,915 | 0.28 | 0.60 | 1.52 | 45 | ||||||||||||||||||||||||
| (1.91 | ) | 20.22 | 0.81 | 151 | 0.42 | 2.96 | 2.42 | 53 | ||||||||||||||||||||||||
| (0.64 | ) | 21.88 | 12.48 | 79 | 0.56 | 5.99 | 3.57 | 44 | ||||||||||||||||||||||||
| — | 20.08 | 33.87 | 23 | 0.56 | (d) | 11.53 | (d) | 1.93 | (d) | 13 | ||||||||||||||||||||||
| $ | (0.46 | ) | $ | 20.21 | 5.95 | % | $ | 269 | 1.10 | %(d) | 1.35 | %(d) | 2.48 | %(d) | 18 | % | ||||||||||||||||
| (2.28 | ) | 19.53 | 9.80 | 195 | 1.03 | 1.35 | 1.66 | 45 | ||||||||||||||||||||||||
| (1.67 | ) | 20.07 | 0.07 | 87 | 1.15 | 3.56 | 1.30 | 53 | ||||||||||||||||||||||||
| (0.53 | ) | 21.65 | 11.61 | 22 | 1.31 | 6.66 | 2.82 | 44 | ||||||||||||||||||||||||
| — | 19.92 | 32.80 | 42 | 1.31 | (d) | 11.89 | (d) | 1.18 | (d) | 13 | ||||||||||||||||||||||
| $ | (0.49 | ) | $ | 20.34 | 6.35 | % | $ | 224 | 0.45 | %(d) | 0.60 | %(d) | 3.63 | %(d) | 18 | % | ||||||||||||||||
| (2.40 | ) | 19.61 | 10.42 | 245 | 0.38 | 0.60 | 2.16 | 45 | ||||||||||||||||||||||||
| (1.97 | ) | 20.16 | 0.77 | 187 | 0.46 | 3.00 | 3.57 | 53 | ||||||||||||||||||||||||
| (0.61 | ) | 21.88 | 12.49 | 177 | 0.56 | 6.58 | 2.51 | 44 | ||||||||||||||||||||||||
| — | 20.05 | 33.67 | 45 | 0.56 | (d) | 10.43 | (d) | 1.93 | (d) | 13 | ||||||||||||||||||||||
| $ | (0.56 | ) | $ | 20.26 | 6.19 | % | $ | 1,060 | 0.70 | %(d) | 0.85 | %(d) | 2.97 | %(d) | 18 | % | ||||||||||||||||
| (2.35 | ) | 19.63 | 10.24 | 848 | 0.63 | 0.85 | 0.87 | 45 | ||||||||||||||||||||||||
| (1.89 | ) | 20.16 | 0.54 | 15 | 0.70 | 3.22 | 2.63 | 53 | ||||||||||||||||||||||||
| (0.57 | ) | 21.85 | 12.19 | 15 | 0.81 | 6.50 | 2.90 | 44 | ||||||||||||||||||||||||
| — | 20.03 | 33.53 | 14 | 0.81 | (d) | 10.01 | (d) | 1.68 | (d) | 13 | ||||||||||||||||||||||
| $ | (0.58 | ) | $ | 20.50 | 6.54 | % | $ | 4,326 | 0.05 | %(d) | 0.20 | %(d) | 2.81 | %(d) | 18 | % | ||||||||||||||||
| (2.45 | ) | 19.82 | 10.99 | 2,343 | — | (e) | 0.20 | 2.00 | 45 | |||||||||||||||||||||||
| (1.97 | ) | 20.31 | 1.06 | 15 | 0.21 | 2.75 | 3.11 | 53 | ||||||||||||||||||||||||
| (0.63 | ) | 21.97 | 12.64 | 15 | 0.36 | 6.10 | 3.35 | 44 | ||||||||||||||||||||||||
| — | 20.12 | 34.13 | 13 | 0.36 | (d) | 6.43 | (d) | 2.13 | (d) | 13 | ||||||||||||||||||||||
| $ | (0.58 | ) | $ | 20.52 | 6.59 | % | $ | 9,124 | — | %(d)(e) | 0.10 | %(d) | 3.73 | %(d) | 18 | % | ||||||||||||||||
| (2.47 | ) | 19.83 | 11.04 | 7,782 | — | (e) | 0.15 | 2.95 | 45 | |||||||||||||||||||||||
| (1.99 | ) | 20.33 | 1.11 | 5,315 | 0.10 | 2.65 | 3.15 | 53 | ||||||||||||||||||||||||
| (0.65 | ) | 22.00 | 12.83 | 4,769 | 0.26 | 5.98 | 3.43 | 44 | ||||||||||||||||||||||||
| — | 20.13 | 34.20 | 4,100 | 0.26 | (d) | 6.33 | (d) | 2.23 | (d) | 13 | ||||||||||||||||||||||
| $ | (0.55 | ) | $ | 20.43 | 6.40 | % | $ | 4,871 | 0.30 | %(d) | 0.45 | %(d) | 0.77 | %(d) | 18 | % | ||||||||||||||||
| (2.41 | ) | 19.75 | 10.67 | 17 | 0.23 | 0.45 | 2.72 | 45 | ||||||||||||||||||||||||
| (1.94 | ) | 20.26 | 0.87 | 15 | 0.38 | 2.93 | 2.94 | 53 | ||||||||||||||||||||||||
| (0.61 | ) | 21.93 | 12.48 | 15 | 0.51 | 6.24 | 3.20 | 44 | ||||||||||||||||||||||||
| — | 20.09 | 33.93 | 13 | 0.51 | (d) | 6.58 | (d) | 1.98 | (d) | 13 | ||||||||||||||||||||||
| See accompanying Notes to Financial Statements | | May 31, 2013 | | Semiannual Report | 183 |
Table of Contents
Financial Highlights (cont’d)
For a Share Outstanding for the Period ended:
| Net Asset Value, Beginning of Period | Net Investment Income (a) | Net Realized and Change in Unrealized Gain | Total from Investment Operations | Dividends from Net Investment Income | Distributions from Net Realized Capital Gains | |||||||||||||||||||||
| AllianzGI Retirement 2045: | ||||||||||||||||||||||||||
| Class A | ||||||||||||||||||||||||||
5/31/2013+ | $ | 17.02 | $ | 0.27 | $ | 0.88 | $ | 1.15 | $ | (0.46 | ) | $ | (0.09 | ) | ||||||||||||
12/19/2011* - 11/30/2012 | 15.00 | 0.32 | 1.92 | 2.24 | (0.22 | ) | — | |||||||||||||||||||
| Class R | ||||||||||||||||||||||||||
5/31/2013+ | $ | 16.96 | $ | 0.26 | $ | 0.86 | $ | 1.12 | $ | (0.43 | ) | $ | (0.09 | ) | ||||||||||||
12/19/2011* - 11/30/2012 | 15.00 | 0.16 | 2.02 | 2.18 | (0.22 | ) | — | |||||||||||||||||||
| Class P | ||||||||||||||||||||||||||
5/31/2013+ | $ | 17.06 | $ | 0.30 | $ | 0.88 | $ | 1.18 | $ | (0.46 | ) | $ | (0.09 | ) | ||||||||||||
12/19/2011* - 11/30/2012 | 15.00 | 0.39 | 1.89 | 2.28 | (0.22 | ) | — | |||||||||||||||||||
| Class R6 | ||||||||||||||||||||||||||
5/31/2013+ | $ | 17.07 | $ | 0.33 | $ | 0.86 | $ | 1.19 | $ | (0.46 | ) | $ | (0.09 | ) | ||||||||||||
12/19/2011* - 11/30/2012 | 15.00 | 0.50 | 1.79 | 2.29 | (0.22 | ) | — | |||||||||||||||||||
| Administrative Class | ||||||||||||||||||||||||||
5/31/2013+ | $ | 17.01 | $ | 0.07 | $ | 1.09 | $ | 1.16 | $ | (0.42 | ) | $ | (0.09 | ) | ||||||||||||
12/19/2011* - 11/30/2012 | 15.00 | 0.44 | 1.79 | 2.23 | (0.22 | ) | — | |||||||||||||||||||
| * | Commencement of operations. |
| + | unaudited |
| (a) | Calculated on average shares outstanding during the period. |
| (b) | Total return is calculated assuming a purchase of a share on the first day of the period and a sale of a share on the last day of each period reported. Dividends and distributions, if any, are assumed, for purposes of this calculation, to be reinvested. Total return does not reflect sales charges and includes the effect of fee waivers and reimbursements. Total return may reflect adjustments to conform to generally accepted accounting principles. Total return for a period of less than one year is not annualized. |
| (c) | Does not include expenses of the investment companies in which the Fund invests. |
| (d) | Annualized. |
| (e) | See Note 6 in the Notes to Financial Statements. |
| 184 | Semiannual Report | | May 31, 2013 | | See accompanying Notes to Financial Statements |
Table of Contents
| Total Dividends and Distributions | Net Asset Value, End of Period | Total Return (b) | Net Assets, End of Period (000s) | Ratio of Expenses to Average Net Assets with Fee Waiver/ Reimbursement (c) | Ratio of Expenses to Average Net Assets without Fee Waiver/ Reimbursement (c) | Ratio of Net Investment Income to Average Net Assets (c) | Portfolio Turnover Rate | |||||||||||||||||||||||||
| $ | (0.55 | ) | $ | 17.62 | 6.94 | % | $ | 2,998 | 0.35 | %(d) | 0.60 | %(d) | 3.18 | %(d) | 20 | % | ||||||||||||||||
| (0.22 | ) | 17.02 | 15.09 | 61 | 0.29 | (d) | 0.60 | (d) | 2.08 | (d) | 38 | |||||||||||||||||||||
| $ | (0.52 | ) | $ | 17.56 | 6.78 | % | $ | 322 | 0.70 | %(d) | 0.85 | %(d) | 2.98 | %(d) | 20 | % | ||||||||||||||||
| (0.22 | ) | 16.96 | 14.67 | 293 | 0.64 | (d) | 0.85 | (d) | 1.07 | (d) | 38 | |||||||||||||||||||||
| $ | (0.55 | ) | $ | 17.69 | 7.12 | % | $ | 2,291 | 0.05 | %(d) | 0.20 | %(d) | 3.51 | %(d) | 20 | % | ||||||||||||||||
| (0.22 | ) | 17.06 | 15.37 | 1,584 | — | (d)(e) | 0.20 | (d) | 2.46 | (d) | 38 | |||||||||||||||||||||
| $ | (0.55 | ) | $ | 17.71 | 7.18 | % | $ | 4,111 | — | %(d)(e) | 0.10 | %(d) | 3.78 | %(d) | 20 | % | ||||||||||||||||
| (0.22 | ) | 17.07 | 15.44 | 3,733 | — | (d)(e) | 0.15 | (d) | 3.23 | (d) | 38 | |||||||||||||||||||||
| $ | (0.51 | ) | $ | 17.66 | 6.95 | % | $ | 1,325 | 0.30 | %(d) | 0.45 | %(d) | 0.82 | %(d) | 20 | % | ||||||||||||||||
| (0.22 | ) | 17.01 | 15.02 | 12 | 0.24 | (d) | 0.45 | (d) | 2.84 | (d) | 38 | |||||||||||||||||||||
| See accompanying Notes to Financial Statements | | May 31, 2013 | | Semiannual Report | 185 |
Table of Contents
Financial Highlights (cont’d)
For a Share Outstanding for the Period ended:
Net Asset | Net Investment Income (a) | Net Realized and Change in Unrealized Gain (Loss) | Total from Investment Operations | Dividends from Net Investment Income | Distributions from Net Realized Capital Gains | |||||||||||||||||||||
| AllianzGI Retirement 2050: | ||||||||||||||||||||||||||
| Class A | ||||||||||||||||||||||||||
5/31/2013+ | $ | 19.48 | $ | 0.29 | $ | 1.18 | $ | 1.47 | $ | (0.60 | ) | $ | (0.07 | ) | ||||||||||||
11/30/2012 | 20.16 | 0.28 | 1.59 | 1.87 | (0.76 | ) | (1.79 | ) | ||||||||||||||||||
11/30/2011 | 22.00 | 0.61 | (0.34 | ) | 0.27 | (1.09 | ) | (1.02 | ) | |||||||||||||||||
11/30/2010 | 20.07 | 0.62 | 1.93 | 2.55 | (0.43 | ) | (0.19 | ) | ||||||||||||||||||
12/29/2008* - 11/30/2009 | 15.00 | 0.31 | 4.76 | 5.07 | — | — | ||||||||||||||||||||
| Class C | ||||||||||||||||||||||||||
5/31/2013+ | $ | 19.25 | $ | 0.25 | $ | 1.14 | $ | 1.39 | $ | (0.41 | ) | $ | (0.07 | ) | ||||||||||||
11/30/2012 | 19.92 | 0.27 | 1.44 | 1.71 | (0.59 | ) | (1.79 | ) | ||||||||||||||||||
11/30/2011 | 21.85 | 0.44 | (0.34 | ) | 0.10 | (1.01 | ) | (1.02 | ) | |||||||||||||||||
11/30/2010 | 19.96 | 0.43 | 1.96 | 2.39 | (0.31 | ) | (0.19 | ) | ||||||||||||||||||
12/29/2008* - 11/30/2009 | 15.00 | 0.18 | 4.78 | 4.96 | — | — | ||||||||||||||||||||
| Class D | ||||||||||||||||||||||||||
5/31/2013+ | $ | 19.48 | $ | 0.33 | $ | 1.13 | $ | 1.46 | $ | (0.56 | ) | $ | (0.07 | ) | ||||||||||||
11/30/2012 | 20.15 | 0.48 | 1.37 | 1.85 | (0.73 | ) | (1.79 | ) | ||||||||||||||||||
11/30/2011 | 22.01 | 0.59 | (0.34 | ) | 0.25 | (1.09 | ) | (1.02 | ) | |||||||||||||||||
11/30/2010 | 20.09 | 0.62 | 1.93 | 2.55 | (0.44 | ) | (0.19 | ) | ||||||||||||||||||
12/29/2008* - 11/30/2009 | 15.00 | 0.32 | 4.77 | 5.09 | — | — | ||||||||||||||||||||
| Class R | ||||||||||||||||||||||||||
5/31/2013+ | $ | 19.47 | $ | 0.26 | $ | 1.16 | $ | 1.42 | $ | (0.60 | ) | $ | (0.07 | ) | ||||||||||||
11/30/2012 | 20.12 | 0.18 | 1.64 | 1.82 | (0.68 | ) | (1.79 | ) | ||||||||||||||||||
11/30/2011 | 21.97 | 0.58 | (0.37 | ) | 0.21 | (1.04 | ) | (1.02 | ) | |||||||||||||||||
11/30/2010 | 20.06 | 0.61 | 1.88 | 2.49 | (0.39 | ) | (0.19 | ) | ||||||||||||||||||
12/29/2008* - 11/30/2009 | 15.00 | 0.26 | 4.80 | 5.06 | — | — | ||||||||||||||||||||
| Class P | ||||||||||||||||||||||||||
5/31/2013+ | $ | 19.64 | $ | 0.32 | $ | 1.19 | $ | 1.51 | $ | (0.63 | ) | $ | (0.07 | ) | ||||||||||||
11/30/2012 | 20.27 | 0.38 | 1.56 | 1.94 | (0.78 | ) | (1.79 | ) | ||||||||||||||||||
11/30/2011 | 22.10 | 0.69 | (0.39 | ) | 0.30 | (1.11 | ) | (1.02 | ) | |||||||||||||||||
11/30/2010 | 20.14 | 0.71 | 1.89 | 2.60 | (0.45 | ) | (0.19 | ) | ||||||||||||||||||
12/29/2008* - 11/30/2009 | 15.00 | 0.33 | 4.81 | 5.14 | — | — | ||||||||||||||||||||
| Class R6 | ||||||||||||||||||||||||||
5/31/2013+ | $ | 19.66 | $ | 0.36 | $ | 1.16 | $ | 1.52 | $ | (0.63 | ) | $ | (0.07 | ) | ||||||||||||
11/30/2012 | 20.30 | 0.58 | 1.38 | 1.96 | (0.81 | ) | (1.79 | ) | ||||||||||||||||||
11/30/2011 | 22.12 | 0.69 | (0.35 | ) | 0.34 | (1.14 | ) | (1.02 | ) | |||||||||||||||||
11/30/2010 | 20.16 | 0.73 | 1.89 | 2.62 | (0.47 | ) | (0.19 | ) | ||||||||||||||||||
12/29/2008* - 11/30/2009 | 15.00 | 0.34 | 4.82 | 5.16 | — | — | ||||||||||||||||||||
| Administrative Class | ||||||||||||||||||||||||||
5/31/2013+ | $ | 19.58 | $ | 0.09 | $ | 1.39 | $ | 1.48 | $ | (0.59 | ) | $ | (0.07 | ) | ||||||||||||
11/30/2012 | 20.23 | 0.53 | 1.36 | 1.89 | (0.75 | ) | (1.79 | ) | ||||||||||||||||||
11/30/2011 | 22.06 | 0.65 | (0.38 | ) | 0.27 | (1.08 | ) | (1.02 | ) | |||||||||||||||||
11/30/2010 | 20.11 | 0.68 | 1.89 | 2.57 | (0.43 | ) | (0.19 | ) | ||||||||||||||||||
12/29/2008* - 11/30/2009 | 15.00 | 0.30 | 4.81 | 5.11 | — | — | ||||||||||||||||||||
| * | Commencement of operations. |
| + | unaudited |
| (a) | Calculated on average shares outstanding during the period. |
| 186 | Semiannual Report | | May 31, 2013 | | See accompanying Notes to Financial Statements |
Table of Contents
| Total Dividends and Distributions | Net Asset Value, End of Period | Total Return (b) | Net Assets, End of Period (000s) | Ratio of Expenses to Average Net Assets with Fee Waiver/ Reimbursement (c) | Ratio of Expenses to Average Net Assets without Fee Waiver/ Reimbursement (c) | Ratio of Net Investment Income to Average Net Assets (c) | Portfolio Turnover Rate | |||||||||||||||||||||||||
| $ | (0.67 | ) | $ | 20.28 | 7.75 | % | $ | 757 | 0.28 | %(d) | 0.60 | %(d) | 2.89 | %(d) | 24 | % | ||||||||||||||||
| (2.55 | ) | 19.48 | 10.64 | 1,371 | 0.26 | 0.60 | 1.45 | 47 | ||||||||||||||||||||||||
| (2.11 | ) | 20.16 | 0.80 | 71 | 0.41 | 2.92 | 2.85 | 51 | ||||||||||||||||||||||||
| (0.62 | ) | 22.00 | 13.02 | 57 | 0.56 | 6.28 | 3.05 | 37 | ||||||||||||||||||||||||
| — | 20.07 | 33.80 | 30 | 0.56 | (d) | 9.92 | (d) | 1.91 | (d) | 11 | ||||||||||||||||||||||
| $ | (0.48 | ) | $ | 20.16 | 7.35 | % | $ | 69 | 1.03 | %(d) | 1.35 | %(d) | 2.53 | %(d) | 24 | % | ||||||||||||||||
| (2.38 | ) | 19.25 | 9.78 | 60 | 1.01 | 1.35 | 1.44 | 47 | ||||||||||||||||||||||||
| (2.03 | ) | 19.92 | (0.01 | ) | 48 | 1.17 | 3.70 | 2.09 | 51 | |||||||||||||||||||||||
| (0.50 | ) | 21.85 | 12.21 | 35 | 1.31 | 7.37 | 2.11 | 37 | ||||||||||||||||||||||||
| — | 19.96 | 33.07 | 13 | 1.31 | (d) | 10.64 | (d) | 1.16 | (d) | 11 | ||||||||||||||||||||||
| $ | (0.63 | ) | $ | 20.31 | 7.68 | % | $ | 222 | 0.38 | %(d) | 0.60 | %(d) | 3.34 | %(d) | 24 | % | ||||||||||||||||
| (2.52 | ) | 19.48 | 10.51 | 202 | 0.36 | 0.60 | 2.55 | 47 | ||||||||||||||||||||||||
| (2.11 | ) | 20.15 | 0.75 | 189 | 0.44 | 3.02 | 2.74 | 51 | ||||||||||||||||||||||||
| (0.63 | ) | 22.01 | 12.99 | 166 | 0.56 | 6.36 | 3.04 | 37 | ||||||||||||||||||||||||
| — | 20.09 | 33.93 | 91 | 0.56 | (d) | 11.64 | (d) | 1.91 | (d) | 11 | ||||||||||||||||||||||
| $ | (0.67 | ) | $ | 20.22 | 7.56 | % | $ | 493 | 0.63 | %(d) | 0.85 | %(d) | 2.63 | %(d) | 24 | % | ||||||||||||||||
| (2.47 | ) | 19.47 | 10.30 | 359 | 0.61 | 0.85 | 0.96 | 47 | ||||||||||||||||||||||||
| (2.06 | ) | 20.12 | 0.51 | 17 | 0.69 | 3.21 | 2.71 | 51 | ||||||||||||||||||||||||
| (0.58 | ) | 21.97 | 12.75 | 17 | 0.81 | 6.49 | 2.98 | 37 | ||||||||||||||||||||||||
| — | 20.06 | 33.73 | 13 | 0.81 | (d) | 10.14 | (d) | 1.66 | (d) | 11 | ||||||||||||||||||||||
| $ | (0.70 | ) | $ | 20.45 | 7.92 | % | $ | 1,289 | — | %(d)(e) | 0.20 | %(d) | 3.16 | %(d) | 24 | % | ||||||||||||||||
| (2.57 | ) | 19.64 | 11.00 | 762 | — | (e) | 0.20 | 1.98 | 47 | |||||||||||||||||||||||
| (2.13 | ) | 20.27 | 0.96 | 15 | 0.19 | 2.75 | 3.21 | 51 | ||||||||||||||||||||||||
| (0.64 | ) | 22.10 | 13.26 | 15 | 0.36 | 6.08 | 3.48 | 37 | ||||||||||||||||||||||||
| — | 20.14 | 34.27 | 14 | 0.36 | (d) | 7.10 | (d) | 2.11 | (d) | 11 | ||||||||||||||||||||||
| $ | (0.70 | ) | $ | 20.48 | 7.97 | % | $ | 8,046 | — | %(d)(e) | 0.10 | %(d) | 3.56 | %(d) | 24 | % | ||||||||||||||||
| (2.60 | ) | 19.66 | 11.06 | 6,431 | — | (e) | 0.15 | 3.03 | 47 | |||||||||||||||||||||||
| (2.16 | ) | 20.30 | 1.11 | 5,149 | 0.09 | 2.65 | 3.22 | 51 | ||||||||||||||||||||||||
| (0.66 | ) | 22.12 | 13.34 | 4,619 | 0.26 | 5.97 | 3.56 | 37 | ||||||||||||||||||||||||
| — | 20.16 | 34.40 | 3,963 | 0.26 | (d) | 7.00 | (d) | 2.21 | (d) | 11 | ||||||||||||||||||||||
| $ | (0.66 | ) | $ | 20.40 | 7.83 | % | $ | 735 | 0.23 | %(d) | 0.45 | %(d) | 0.90 | %(d) | 24 | % | ||||||||||||||||
| (2.54 | ) | 19.58 | 10.62 | 17 | 0.21 | 0.45 | 2.77 | 47 | ||||||||||||||||||||||||
| (2.10 | ) | 20.23 | 0.82 | 15 | 0.37 | 2.93 | 3.04 | 51 | ||||||||||||||||||||||||
| (0.62 | ) | 22.06 | 13.09 | 15 | 0.51 | 6.23 | 3.32 | 37 | ||||||||||||||||||||||||
| — | 20.11 | 34.07 | 14 | 0.51 | (d) | 7.25 | (d) | 1.96 | (d) | 11 | ||||||||||||||||||||||
| (b) | Total return is calculated assuming a purchase of a share on the first day of the period and a sale of a share on the last day of each period reported. Dividends and distributions, if any, are assumed, for purposes of this calculation, to be reinvested. Total return does not reflect sales charges and includes the effect of fee waivers and reimbursements. Total return may reflect adjustments to conform to generally accepted accounting principles. Total return for a period of less than one year is not annualized. |
| (c) | Does not include expenses of the investment companies in which the Fund invests. |
| (d) | Annualized. |
| (e) | See Note 6 in the Notes to Financial Statements. |
| See accompanying Notes to Financial Statements | | May 31, 2013 | | Semiannual Report | 187 |
Table of Contents
Financial Highlights (cont’d)
For a Share Outstanding for the Period ended:
Net Asset | Net Investment Income (a) | Net Realized and Change in Unrealized Gain | Total from Investment Operations | Dividends from Net Investment Income | Distributions from Net Realized Capital Gains | |||||||||||||||||||||
| AllianzGI Retirement 2055: | ||||||||||||||||||||||||||
| Class A | ||||||||||||||||||||||||||
5/31/2013+ | $ | 17.02 | $ | 0.17 | $ | 1.10 | $ | 1.27 | $ | (0.59 | ) | $ | (0.28 | ) | ||||||||||||
12/19/2011* - 11/30/2012 | 15.00 | 0.44 | 1.80 | 2.24 | (0.22 | ) | — | |||||||||||||||||||
| Class R | ||||||||||||||||||||||||||
5/31/2013+ | $ | 16.97 | $ | 0.23 | $ | 1.00 | $ | 1.23 | $ | (0.56 | ) | $ | (0.28 | ) | ||||||||||||
12/19/2011* - 11/30/2012 | 15.00 | 0.31 | 1.88 | 2.19 | (0.22 | ) | — | |||||||||||||||||||
| Class P | ||||||||||||||||||||||||||
5/31/2013+ | $ | 17.08 | $ | 0.26 | $ | 1.03 | $ | 1.29 | $ | (0.61 | ) | $ | (0.28 | ) | ||||||||||||
12/19/2011* - 11/30/2012 | 15.00 | 0.43 | 1.87 | 2.30 | (0.22 | ) | — | |||||||||||||||||||
| Class R6 | ||||||||||||||||||||||||||
5/31/2013+ | $ | 17.09 | $ | 0.32 | $ | 0.98 | $ | 1.30 | $ | (0.61 | ) | $ | (0.28 | ) | ||||||||||||
12/19/2011* - 11/30/2012 | 15.00 | 0.50 | 1.81 | 2.31 | (0.22 | ) | — | |||||||||||||||||||
| Administrative Class | ||||||||||||||||||||||||||
5/31/2013+ | $ | 17.03 | $ | 0.18 | $ | 1.08 | $ | 1.26 | $ | (0.57 | ) | $ | (0.28 | ) | ||||||||||||
12/19/2011* - 11/30/2012 | 15.00 | 0.44 | 1.81 | 2.25 | (0.22 | ) | — | |||||||||||||||||||
| * | Commencement of operations. |
| + | unaudited |
| (a) | Calculated on average shares outstanding during the period. |
| 188 | Semiannual Report | | May 31, 2013 | | See accompanying Notes to Financial Statements |
Table of Contents
| Total Dividends and Distributions | Net Asset Value, End of Period | Total Return (b) | Net Assets, End of Period (000s) | Ratio of Expenses to Average Net Assets with Fee Waiver/ Reimbursement (c) | Ratio of Expenses to Average Net Assets without Fee Waiver/ Reimbursement (c) | Ratio of Net Investment Income to Average Net Assets (c) | Portfolio Turnover Rate | |||||||||||||||||||||||||
| $ | (0.87 | ) | $ | 17.42 | 7.79 | % | $ | 73 | 0.29 | %(d) | 0.60 | %(d) | 2.01 | %(d) | 19 | % | ||||||||||||||||
| (0.22 | ) | 17.02 | 15.10 | 11 | 0.27 | (d) | 0.60 | (d) | 2.82 | (d) | 31 | |||||||||||||||||||||
| $ | (0.84 | ) | $ | 17.36 | 7.60 | % | $ | 55 | 0.64 | %(d) | 0.85 | %(d) | 2.71 | %(d) | 19 | % | ||||||||||||||||
| (0.22 | ) | 16.97 | 14.75 | 39 | 0.62 | (d) | 0.85 | (d) | 1.99 | (d) | 31 | |||||||||||||||||||||
| $ | (0.89 | ) | $ | 17.48 | 7.91 | % | $ | 115 | — | %(d)(e) | 0.20 | %(d) | 3.10 | %(d) | 19 | % | ||||||||||||||||
| (0.22 | ) | 17.08 | 15.52 | 59 | — | (d)(e) | 0.20 | (d) | 2.77 | (d) | 31 | |||||||||||||||||||||
| $ | (0.89 | ) | $ | 17.50 | 8.03 | % | $ | 3,960 | — | %(d)(e) | 0.10 | %(d) | 3.70 | %(d) | 19 | % | ||||||||||||||||
| (0.22 | ) | 17.09 | 15.52 | 3,509 | — | (d)(e) | 0.15 | (d) | 3.21 | (d) | 31 | |||||||||||||||||||||
| $ | (0.85 | ) | $ | 17.44 | 7.76 | % | $ | 76 | 0.24 | %(d) | 0.45 | %(d) | 2.12 | %(d) | 19 | % | ||||||||||||||||
| (0.22 | ) | 17.03 | 15.17 | 11 | 0.22 | (d) | 0.46 | (d) | 2.87 | (d) | 31 | |||||||||||||||||||||
| (b) | Total return is calculated assuming a purchase of a share on the first day of the period and a sale of a share on the last day of each period reported. Dividends and distributions, if any, are assumed, for purposes of this calculation, to be reinvested. Total return does not reflect sales charges and includes the effect of fee waivers and reimbursements. Total return may reflect adjustments to conform to generally accepted accounting principles. Total return for a period of less than one year is not annualized. |
| (c) | Does not include expenses of the investment companies in which the Fund invests. |
| (d) | Annualized. |
| (e) | See Note 6 in the Notes to Financial Statements. |
| See accompanying Notes to Financial Statements | | May 31, 2013 | | Semiannual Report | 189 |
Table of Contents
Financial Highlights (cont’d)
For a Share Outstanding for the Period ended:
| Net Asset Value, Beginning of Period | Net Investment Income (a) | Net Realized and Change in Unrealized Gain (Loss) | Total from Investment Operations | Dividends from Net Investment Income | Distributions from Net Realized Capital Gains | |||||||||||||||||||||
| AllianzGI Retirement Income: | ||||||||||||||||||||||||||
| Class A | ||||||||||||||||||||||||||
5/31/2013+ | $ | 19.20 | $ | 0.32 | $ | 0.02 | $ | 0.34 | $ | (0.51 | ) | $ | (0.05 | ) | ||||||||||||
11/30/2012 | 18.27 | 0.48 | 1.23 | 1.71 | (0.58 | ) | (0.20 | ) | ||||||||||||||||||
11/30/2011 | 18.52 | 0.37 | 0.25 | 0.62 | (0.67 | ) | (0.20 | ) | ||||||||||||||||||
11/30/2010 | 17.81 | 0.47 | 1.05 | 1.52 | (0.61 | ) | (0.20 | ) | ||||||||||||||||||
12/29/2008* - 11/30/2009 | 15.00 | 0.53 | 2.71 | 3.24 | (0.43 | ) | — | |||||||||||||||||||
| Class C | ||||||||||||||||||||||||||
5/31/2013+ | $ | 18.99 | $ | 0.24 | $ | 0.02 | $ | 0.26 | $ | (0.43 | ) | $ | (0.05 | ) | ||||||||||||
11/30/2012 | 18.09 | 0.31 | 1.24 | 1.55 | (0.45 | ) | (0.20 | ) | ||||||||||||||||||
11/30/2011 | 18.36 | 0.27 | 0.21 | 0.48 | (0.55 | ) | (0.20 | ) | ||||||||||||||||||
11/30/2010 | 17.83 | 0.28 | 1.11 | 1.39 | (0.66 | ) | (0.20 | ) | ||||||||||||||||||
12/29/2008* - 11/30/2009 | 15.00 | 0.41 | 2.72 | 3.13 | (0.30 | ) | — | |||||||||||||||||||
| Class D | ||||||||||||||||||||||||||
5/31/2013+ | $ | 19.29 | $ | 0.28 | $ | 0.05 | $ | 0.33 | $ | (0.51 | ) | $ | (0.05 | ) | ||||||||||||
11/30/2012 | 18.36 | 0.30 | 1.41 | 1.71 | (0.58 | ) | (0.20 | ) | ||||||||||||||||||
11/30/2011 | 18.60 | 0.49 | 0.13 | 0.62 | (0.66 | ) | (0.20 | ) | ||||||||||||||||||
11/30/2010 | 17.83 | 0.49 | 1.04 | 1.53 | (0.56 | ) | (0.20 | ) | ||||||||||||||||||
12/29/2008* - 11/30/2009 | 15.00 | 0.52 | 2.72 | 3.24 | (0.41 | ) | — | |||||||||||||||||||
| Class R | ||||||||||||||||||||||||||
5/31/2013+ | $ | 19.74 | $ | 0.32 | $ | (0.01 | ) | $ | 0.31 | $ | (0.46 | ) | $ | (0.05 | ) | |||||||||||
11/30/2012 | 18.77 | 0.24 | 1.45 | 1.69 | (0.52 | ) | (0.20 | ) | ||||||||||||||||||
11/30/2011 | 18.73 | 0.53 | 0.05 | 0.58 | (0.34 | ) | (0.20 | ) | ||||||||||||||||||
11/30/2010 | 17.86 | 0.49 | 1.01 | 1.50 | (0.43 | ) | (0.20 | ) | ||||||||||||||||||
12/29/2008* - 11/30/2009 | 15.00 | 0.47 | 2.74 | 3.21 | (0.35 | ) | — | |||||||||||||||||||
| Class P | ||||||||||||||||||||||||||
5/31/2013+ | $ | 19.44 | $ | 0.27 | $ | 0.10 | $ | 0.37 | $ | (0.54 | ) | $ | (0.05 | ) | ||||||||||||
11/30/2012 | 18.49 | 0.32 | 1.48 | 1.80 | (0.65 | ) | (0.20 | ) | ||||||||||||||||||
11/30/2011 | 18.41 | 0.63 | 0.03 | 0.66 | (0.38 | ) | (0.20 | ) | ||||||||||||||||||
11/30/2010 | 17.85 | 0.57 | 0.99 | 1.56 | (0.80 | ) | (0.20 | ) | ||||||||||||||||||
12/29/2008* - 11/30/2009 | 15.00 | 0.54 | 2.74 | 3.28 | (0.43 | ) | — | |||||||||||||||||||
| Class R6 | ||||||||||||||||||||||||||
5/31/2013+ | $ | 19.08 | $ | 0.34 | $ | 0.03 | $ | 0.37 | $ | (0.55 | ) | $ | (0.05 | ) | ||||||||||||
11/30/2012 | 18.16 | 0.49 | 1.28 | 1.77 | (0.65 | ) | (0.20 | ) | ||||||||||||||||||
11/30/2011 | 18.40 | 0.65 | 0.02 | 0.67 | (0.71 | ) | (0.20 | ) | ||||||||||||||||||
11/30/2010 | 17.85 | 0.57 | 1.01 | 1.58 | (0.83 | ) | (0.20 | ) | ||||||||||||||||||
12/29/2008* - 11/30/2009 | 15.00 | 0.55 | 2.74 | 3.29 | (0.44 | ) | — | |||||||||||||||||||
| Administrative Class | ||||||||||||||||||||||||||
5/31/2013+ | $ | 19.41 | $ | 0.10 | $ | 0.25 | $ | 0.35 | $ | (0.53 | ) | $ | (0.05 | ) | ||||||||||||
11/30/2012 | 18.46 | 0.49 | 1.26 | 1.75 | (0.60 | ) | (0.20 | ) | ||||||||||||||||||
11/30/2011 | 18.40 | 0.59 | 0.03 | 0.62 | (0.36 | ) | (0.20 | ) | ||||||||||||||||||
11/30/2010 | 17.83 | 0.54 | 0.99 | 1.53 | (0.76 | ) | (0.20 | ) | ||||||||||||||||||
12/29/2008* - 11/30/2009 | 15.00 | 0.52 | 2.74 | 3.26 | (0.43 | ) | — | |||||||||||||||||||
| + | unaudited |
| * | Commencement of operations. |
| (a) | Calculated on average shares outstanding during the period. |
| 190 | Semiannual Report | | May 31, 2013 | | See accompanying Notes to Financial Statements |
Table of Contents
| Total Dividends and Distributions | Net Asset Value, End of Period | Total Return (b) | Net Assets, End of Period (000s) | Ratio of Expenses to Average Net Assets with Fee Waiver/ Reimbursement (c) | Ratio of Expenses to Average Net Assets without Fee Waiver/ Reimbursement (c) | Ratio of Net Investment Income to Average Net Assets (c) | Portfolio Turnover Rate | |||||||||||||||||||||||||
| $ | (0.56 | ) | $ | 18.98 | 1.74 | % | $ | 4,954 | 0.39 | %(d) | 0.60 | %(d) | 3.36 | %(d) | 35 | % | ||||||||||||||||
| (0.78 | ) | 19.20 | 9.68 | 4,891 | 0.40 | 0.60 | 2.57 | 51 | ||||||||||||||||||||||||
| (0.87 | ) | 18.27 | 3.45 | 4,427 | 0.46 | 1.60 | 2.01 | 74 | ||||||||||||||||||||||||
| (0.81 | ) | 18.52 | 8.86 | 595 | 0.52 | 5.29 | 2.65 | 22 | ||||||||||||||||||||||||
| (0.43 | ) | 17.81 | 21.95 | 256 | 0.52 | (d) | 8.79 | (d) | 3.42 | (d) | 26 | |||||||||||||||||||||
| $ | (0.48 | ) | $ | 18.77 | 1.39 | % | $ | 5,614 | 1.14 | %(d) | 1.35 | %(d) | 2.59 | %(d) | 35 | % | ||||||||||||||||
| (0.65 | ) | 18.99 | 8.84 | 6,935 | 1.15 | 1.35 | 1.70 | 51 | ||||||||||||||||||||||||
| (0.75 | ) | 18.09 | 2.71 | 5,820 | 1.22 | 2.48 | 1.50 | 74 | ||||||||||||||||||||||||
| (0.86 | ) | 18.36 | 8.09 | 1,398 | 1.27 | 6.16 | 1.56 | 22 | ||||||||||||||||||||||||
| (0.30 | ) | 17.83 | 21.11 | 133 | 1.27 | (d) | 10.38 | (d) | 2.67 | (d) | 26 | |||||||||||||||||||||
| $ | (0.56 | ) | $ | 19.06 | 1.74 | % | $ | 1,830 | 0.49 | %(d) | 0.60 | %(d) | 2.90 | %(d) | 35 | % | ||||||||||||||||
| (0.78 | ) | 19.29 | 9.53 | 1,553 | 0.50 | 0.60 | 1.59 | 51 | ||||||||||||||||||||||||
| (0.86 | ) | 18.36 | 3.42 | 326 | 0.51 | 2.21 | 2.65 | 74 | ||||||||||||||||||||||||
| (0.76 | ) | 18.60 | 8.89 | 179 | 0.52 | 5.75 | 2.75 | 22 | ||||||||||||||||||||||||
| (0.41 | ) | 17.83 | 21.93 | 73 | 0.52 | (d) | 8.81 | (d) | 3.42 | (d) | 26 | |||||||||||||||||||||
| $ | (0.51 | ) | $ | 19.54 | 1.57 | % | $ | 141 | 0.74 | %(d) | 0.85 | %(d) | 3.29 | %(d) | 35 | % | ||||||||||||||||
| (0.72 | ) | 19.74 | 9.28 | 183 | 0.75 | 0.85 | 1.29 | 51 | ||||||||||||||||||||||||
| (0.54 | ) | 18.77 | 3.18 | 17 | 0.76 | 4.59 | 2.82 | 74 | ||||||||||||||||||||||||
| (0.63 | ) | 18.73 | 8.61 | 15 | 0.77 | 5.62 | 2.70 | 22 | ||||||||||||||||||||||||
| (0.35 | ) | 17.86 | 21.72 | 12 | 0.77 | (d) | 7.31 | (d) | 3.17 | (d) | 26 | |||||||||||||||||||||
| $ | (0.59 | ) | $ | 19.22 | 1.88 | % | $ | 6,815 | 0.09 | %(d) | 0.20 | %(d) | 2.77 | %(d) | 35 | % | ||||||||||||||||
| (0.85 | ) | 19.44 | 10.05 | 4,751 | 0.10 | 0.20 | 1.71 | 51 | ||||||||||||||||||||||||
| (0.58 | ) | 18.49 | 3.69 | 14 | 0.26 | 4.47 | 3.38 | 74 | ||||||||||||||||||||||||
| (1.00 | ) | 18.41 | 9.13 | 13 | 0.32 | 5.13 | 3.20 | 22 | ||||||||||||||||||||||||
| (0.43 | ) | 17.85 | 22.19 | 12 | 0.32 | (d) | 6.06 | (d) | 3.62 | (d) | 26 | |||||||||||||||||||||
| $ | (0.60 | ) | $ | 18.85 | 1.97 | % | $ | 9,408 | — | %(d)(e) | 0.10 | %(d) | 3.62 | %(d) | 35 | % | ||||||||||||||||
| (0.85 | ) | 19.08 | 10.11 | 11,294 | — | (e) | 0.15 | 2.64 | 51 | |||||||||||||||||||||||
| (0.91 | ) | 18.16 | 3.77 | 4,904 | 0.16 | 1.81 | 3.53 | 74 | ||||||||||||||||||||||||
| (1.03 | ) | 18.40 | 9.24 | 4,803 | 0.22 | 5.04 | 3.22 | 22 | ||||||||||||||||||||||||
| (0.44 | ) | 17.85 | 22.30 | 3,779 | 0.22 | (d) | 5.96 | (d) | 3.72 | (d) | 26 | |||||||||||||||||||||
| $ | (0.58 | ) | $ | 19.18 | 1.82 | % | $ | 2,264 | 0.34 | %(d) | 0.45 | %(d) | 1.05 | %(d) | 35 | % | ||||||||||||||||
| (0.80 | ) | 19.41 | 9.71 | 15 | 0.35 | 0.45 | 2.59 | 51 | ||||||||||||||||||||||||
| (0.56 | ) | 18.46 | 3.49 | 14 | 0.44 | 4.65 | 3.21 | 74 | ||||||||||||||||||||||||
| (0.96 | ) | 18.40 | 8.94 | 13 | 0.47 | 5.28 | 3.05 | 22 | ||||||||||||||||||||||||
| (0.43 | ) | 17.83 | 22.03 | 12 | 0.47 | (d) | 6.21 | (d) | 3.47 | (d) | 26 | |||||||||||||||||||||
| (b) | Total return is calculated assuming a purchase of a share on the first day of the period and a sale of a share on the last day of each period reported. Dividends and distributions, if any, are assumed, for purposes of this calculation, to be reinvested. Total return does not reflect sales charges and includes the effect of fee waivers and reimbursements. Total return may reflect adjustments to conform to generally accepted accounting principles. Total return for a period of less than one year is not annualized. |
| (c) | Does not include expenses of the investment companies in which the Fund invests. |
| (d) | Annualized. |
| (e) | See Note 6 in the Notes to Financial Statements. |
| See accompanying Notes to Financial Statements | | May 31, 2013 | | Semiannual Report | 191 |
Table of Contents
Financial Highlights (cont’d)
For a Share Outstanding for the Period ended:
| Net Asset Value, Beginning of Period | Net Investment Income (a) | Net Realized and Change in Unrealized Gain (Loss) | Total from Investment Operations | Dividends from Net Investment Income | Distributions from Net Realized Capital Gains | Distributions from Return of Capital | ||||||||||||||||||||||||
| AllianzGI Global Allocation: | ||||||||||||||||||||||||||||||
| Class A | ||||||||||||||||||||||||||||||
5/31/2013+ | $ | 11.07 | $ | 0.20 | $ | 0.48 | $ | 0.68 | $ | (0.32 | ) | $ | — | $ | — | |||||||||||||||
11/30/2012 | 10.30 | 0.25 | 0.84 | 1.09 | (0.32 | ) | — | — | ||||||||||||||||||||||
11/30/2011 | 10.58 | 0.25 | (0.14 | ) | 0.11 | (0.39 | ) | — | — | |||||||||||||||||||||
11/30/2010 | 9.84 | 0.26 | 0.85 | 1.11 | (0.37 | ) | — | — | ||||||||||||||||||||||
7/1/2009** - 11/30/2009 | 8.45 | 0.08 | 1.35 | 1.43 | (0.04 | ) | — | — | ||||||||||||||||||||||
6/30/2009 | 10.62 | 0.30 | (1.98 | ) | (1.68 | ) | (0.40 | ) | — | (0.09 | ) | |||||||||||||||||||
6/30/2008 | 12.57 | 0.33 | (0.96 | ) | (0.63 | ) | (0.86 | ) | (0.32 | ) | (0.14 | ) | ||||||||||||||||||
| Class B | ||||||||||||||||||||||||||||||
5/31/2013+ | $ | 11.27 | $ | 0.17 | $ | 0.48 | $ | 0.65 | $ | (0.27 | ) | $ | — | $ | — | |||||||||||||||
11/30/2012 | 10.48 | 0.21 | 0.81 | 1.02 | (0.23 | ) | — | — | ||||||||||||||||||||||
11/30/2011 | 10.74 | 0.22 | (0.20 | ) | 0.02 | (0.28 | ) | — | — | |||||||||||||||||||||
11/30/2010 | 9.92 | 0.22 | 0.83 | 1.05 | (0.23 | ) | — | — | ||||||||||||||||||||||
7/1/2009** - 11/30/2009 | 8.53 | 0.05 | 1.36 | 1.41 | (0.02 | ) | — | — | ||||||||||||||||||||||
6/30/2009 | 10.70 | 0.23 | (1.99 | ) | (1.76 | ) | (0.33 | ) | — | (0.08 | ) | |||||||||||||||||||
6/30/2008 | 12.57 | 0.24 | (0.96 | ) | (0.72 | ) | (0.69 | ) | (0.32 | ) | (0.14 | ) | ||||||||||||||||||
| Class C | ||||||||||||||||||||||||||||||
5/31/2013+ | $ | 11.19 | $ | 0.16 | $ | 0.49 | $ | 0.65 | $ | (0.28 | ) | $ | — | $ | — | |||||||||||||||
11/30/2012 | 10.41 | 0.17 | 0.85 | 1.02 | (0.24 | ) | — | — | ||||||||||||||||||||||
11/30/2011 | 10.69 | 0.18 | (0.16 | ) | 0.02 | (0.30 | ) | — | — | |||||||||||||||||||||
11/30/2010 | 9.89 | 0.19 | 0.85 | 1.04 | (0.24 | ) | — | — | ||||||||||||||||||||||
7/1/2009** - 11/30/2009 | 8.50 | 0.05 | 1.36 | 1.41 | (0.02 | ) | — | — | ||||||||||||||||||||||
6/30/2009 | 10.68 | 0.24 | (2.01 | ) | (1.77 | ) | (0.33 | ) | — | (0.08 | ) | |||||||||||||||||||
6/30/2008 | 12.55 | 0.24 | (0.95 | ) | (0.71 | ) | (0.70 | ) | (0.32 | ) | (0.14 | ) | ||||||||||||||||||
| Class D | ||||||||||||||||||||||||||||||
5/31/2013+ | $ | 11.03 | $ | 0.18 | $ | 0.50 | $ | 0.68 | $ | (0.32 | ) | $ | — | $ | — | |||||||||||||||
11/30/2012 | 10.27 | 0.24 | 0.84 | 1.08 | (0.32 | ) | — | — | ||||||||||||||||||||||
11/30/2011 | 10.56 | 0.17 | (0.06 | ) | 0.11 | (0.40 | ) | — | — | |||||||||||||||||||||
11/30/2010 | 9.83 | 0.23 | 0.87 | 1.10 | (0.37 | ) | — | — | ||||||||||||||||||||||
7/1/2009** - 11/30/2009 | 8.44 | 0.08 | 1.35 | 1.43 | (0.04 | ) | — | — | ||||||||||||||||||||||
5/4/2009* - 6/30/2009 | 8.20 | 0.02 | 0.27 | 0.29 | (0.04 | ) | — | (0.01 | ) | |||||||||||||||||||||
| + | unaudited |
| * | Commencement of operations. |
| ** | On April 14, 2009, the Board of Trustees approved a change in the Fund’s fiscal year from June 30 to November 30. |
| (a) | Calculated on average shares outstanding during the period. |
| (b) | Effective May 1, 2009, Fund redemption fees were eliminated. |
| (c) | Total return is calculated assuming a purchase of a share on the first day of the period and a sale of a share on the last day of each period reported. Dividends and distributions, if any, are assumed, for purposes of this calculation, to be reinvested. Total return does not reflect sales charges and includes the effect of fee waivers and reimbursements. Total return may reflect adjustments to conform to generally accepted accounting principles. Total return for a period of less than one year is not annualized. |
| (d) | Does not include expenses of the investment companies in which the Fund invests. |
| (e) | Annualized. |
| (f) | Less than $0.01 per share. |
| 192 | Semiannual Report | | May 31, 2013 | | See accompanying Notes to Financial Statements |
Table of Contents
| Total Dividends and Distributions | Fund Redemption Fees (a)(b) | Net Asset Value, End of Period | Total Return (c) | Net Assets, End of Period (000s) | Ratio of Expenses to Average Net Assets with Fee Waiver/ Reimbursement (d) | Ratio of Expenses to Average Net Assets without Fee Waiver/ Reimbursement (d) | Ratio of Net Investment Income to Average Net Assets (d) | Portfolio Turnover Rate | ||||||||||||||||||||||||||||
| $ | (0.32 | ) | $ | — | $ | 11.43 | 6.33 | % | $ | 70,384 | 0.42 | %(e) | 1.33 | %(e) | 3.54 | %(e) | 21 | % | ||||||||||||||||||
| (0.32 | ) | — | 11.07 | 10.64 | 70,312 | 0.43 | 1.38 | 2.32 | 57 | |||||||||||||||||||||||||||
| (0.39 | ) | — | 10.30 | 0.95 | 73,816 | 0.47 | 1.35 | 2.32 | 64 | |||||||||||||||||||||||||||
| (0.37 | ) | — | 10.58 | 11.56 | 72,415 | 0.51 | 1.42 | 2.58 | 46 | |||||||||||||||||||||||||||
| (0.04 | ) | — | 9.84 | 16.93 | 57,225 | 0.52 | (e) | 1.39 | (e) | 1.98 | (e) | 11 | ||||||||||||||||||||||||
| (0.49 | ) | — | (f) | 8.45 | (15.51 | ) | 47,224 | 0.63 | 0.76 | 3.51 | 69 | |||||||||||||||||||||||||
| (1.32 | ) | — | (f) | 10.62 | (5.45 | ) | 63,265 | 0.65 | 0.65 | 2.74 | 17 | |||||||||||||||||||||||||
| $ | (0.27 | ) | $ | — | $ | 11.65 | 5.87 | % | $ | 3,677 | 1.16 | %(e) | 2.18 | %(e) | 2.99 | %(e) | 21 | % | ||||||||||||||||||
| (0.23 | ) | — | 11.27 | 9.90 | 4,307 | 1.19 | 2.09 | 1.96 | 57 | |||||||||||||||||||||||||||
| (0.28 | ) | — | 10.48 | 0.15 | 9,467 | 1.22 | 2.10 | 1.95 | 64 | |||||||||||||||||||||||||||
| (0.23 | ) | — | 10.74 | 10.86 | 18,030 | 1.26 | 2.19 | 2.13 | 46 | |||||||||||||||||||||||||||
| (0.02 | ) | — | 9.92 | 16.44 | 31,698 | 1.27 | (e) | 2.11 | (e) | 1.23 | (e) | 11 | ||||||||||||||||||||||||
| (0.41 | ) | — | (f) | 8.53 | (16.12 | ) | 29,177 | 1.39 | 1.50 | 2.67 | 69 | |||||||||||||||||||||||||
| (1.15 | ) | — | (f) | 10.70 | (6.07 | ) | 60,519 | 1.40 | 1.40 | 2.03 | 17 | |||||||||||||||||||||||||
| $ | (0.28 | ) | $ | — | $ | 11.56 | 5.86 | % | $ | 69,407 | 1.16 | %(e) | 2.06 | %(e) | 2.84 | %(e) | 21 | % | ||||||||||||||||||
| (0.24 | ) | — | 11.19 | 9.90 | 71,375 | 1.18 | 2.11 | 1.59 | 57 | |||||||||||||||||||||||||||
| (0.30 | ) | — | 10.41 | 0.15 | 78,367 | 1.22 | 2.09 | 1.64 | 64 | |||||||||||||||||||||||||||
| (0.24 | ) | — | 10.69 | 10.65 | 87,546 | 1.26 | 2.16 | 1.93 | 46 | |||||||||||||||||||||||||||
| (0.02 | ) | — | 9.89 | 16.62 | 89,277 | 1.27 | (e) | 2.14 | (e) | 1.23 | (e) | 11 | ||||||||||||||||||||||||
| (0.41 | ) | — | (f) | 8.50 | (16.21 | ) | 80,857 | 1.39 | 1.50 | 2.74 | 69 | |||||||||||||||||||||||||
| (1.16 | ) | — | (f) | 10.68 | (6.10 | ) | 138,659 | 1.40 | 1.40 | 1.99 | 17 | |||||||||||||||||||||||||
| $ | (0.32 | ) | $ | — | $ | 11.39 | 6.25 | % | $ | 334 | 0.42 | %(e) | 1.34 | %(e) | 3.29 | %(e) | 21 | % | ||||||||||||||||||
| (0.32 | ) | — | 11.03 | 10.68 | 266 | 0.46 | 1.33 | 2.25 | 57 | |||||||||||||||||||||||||||
| (0.40 | ) | — | 10.27 | 0.95 | 197 | 0.45 | 1.38 | 1.56 | 64 | |||||||||||||||||||||||||||
| (0.37 | ) | — | 10.56 | 11.48 | 34 | 0.51 | 1.41 | 2.28 | 46 | |||||||||||||||||||||||||||
| (0.04 | ) | — | 9.83 | 16.95 | 13 | 0.52 | (e) | 1.38 | (e) | 1.98 | (e) | 11 | ||||||||||||||||||||||||
| (0.05 | ) | — | 8.44 | 3.55 | 10 | 0.52 | (e) | 1.34 | (e) | 1.85 | (e) | 69 | ||||||||||||||||||||||||
| See accompanying Notes to Financial Statements | | May 31, 2013 | | Semiannual Report | 193 |
Table of Contents
Financial Highlights (cont’d)
For a Share Outstanding for the Period ended:
| Net Asset Value, Beginning of Period | Net Investment Income (a) | Net Realized and Change in Unrealized Gain (Loss) | Total from Investment Operations | Dividends from Net Investment Income | Distributions from Net Realized Capital Gains | Distributions from Return of Capital | ||||||||||||||||||||||||
| AllianzGI Global Allocation (cont’d) | ||||||||||||||||||||||||||||||
| Class R | ||||||||||||||||||||||||||||||
5/31/2013+ | $ | 11.02 | $ | 0.18 | $ | 0.49 | $ | 0.67 | $ | (0.31 | ) | $ | — | $ | — | |||||||||||||||
11/30/2012 | 10.26 | 0.21 | 0.84 | 1.05 | (0.29 | ) | — | — | ||||||||||||||||||||||
11/30/2011 | 10.54 | 0.23 | (0.15 | ) | 0.08 | (0.36 | ) | — | — | |||||||||||||||||||||
11/30/2010 | 9.81 | 0.24 | 0.84 | 1.08 | (0.35 | ) | — | — | ||||||||||||||||||||||
7/1/2009** - 11/30/2009 | 8.44 | 0.07 | 1.34 | 1.41 | (0.04 | ) | — | — | ||||||||||||||||||||||
5/4/2009* - 6/30/2009 | 8.20 | 0.02 | 0.27 | 0.29 | (0.04 | ) | — | (0.01 | ) | |||||||||||||||||||||
| Class P | ||||||||||||||||||||||||||||||
5/31/2013+ | $ | 11.07 | $ | 0.22 | $ | 0.47 | $ | 0.69 | $ | (0.33 | ) | $ | — | $ | — | |||||||||||||||
11/30/2012 | 10.28 | 0.29 | 0.81 | 1.10 | (0.31 | ) | — | — | ||||||||||||||||||||||
11/30/2011 | 10.56 | 0.27 | (0.14 | ) | 0.13 | (0.41 | ) | — | — | |||||||||||||||||||||
11/30/2010 | 9.84 | 0.26 | 0.86 | 1.12 | (0.40 | ) | — | — | ||||||||||||||||||||||
7/1/2009** - 11/30/2009 | 8.44 | 0.08 | 1.36 | 1.44 | (0.04 | ) | — | — | ||||||||||||||||||||||
5/4/2009* - 6/30/2009 | 8.20 | 0.03 | 0.26 | 0.29 | (0.04 | ) | — | (0.01 | ) | |||||||||||||||||||||
| Institutional Class | ||||||||||||||||||||||||||||||
5/31/2013+ | $ | 10.97 | $ | 0.21 | $ | 0.48 | $ | 0.69 | $ | (0.33 | ) | $ | — | $ | — | |||||||||||||||
11/30/2012 | 10.21 | 0.26 | 0.84 | 1.10 | (0.34 | ) | — | — | ||||||||||||||||||||||
11/30/2011 | 10.48 | 0.27 | (0.13 | ) | 0.14 | (0.41 | ) | — | — | |||||||||||||||||||||
11/30/2010 | 9.77 | 0.29 | 0.83 | 1.12 | (0.41 | ) | — | — | ||||||||||||||||||||||
7/1/2009** - 11/30/2009 | 8.38 | 0.09 | 1.34 | 1.43 | (0.04 | ) | — | — | ||||||||||||||||||||||
6/30/2009 | 10.55 | 0.33 | (1.97 | ) | (1.64 | ) | (0.43 | ) | — | (0.10 | ) | |||||||||||||||||||
6/30/2008 | 12.54 | 0.36 | (0.91 | ) | (0.55 | ) | (0.98 | ) | (0.32 | ) | (0.14 | ) | ||||||||||||||||||
| Administrative Class | ||||||||||||||||||||||||||||||
5/31/2013+ | $ | 11.30 | $ | 0.20 | $ | 0.50 | $ | 0.70 | $ | (0.32 | ) | $ | — | $ | — | |||||||||||||||
11/30/2012 | 10.51 | 0.26 | 0.84 | 1.10 | (0.31 | ) | — | — | ||||||||||||||||||||||
11/30/2011 | 10.78 | 0.13 | (0.01 | ) | 0.12 | (0.39 | ) | — | — | |||||||||||||||||||||
11/30/2010 | 9.83 | 0.27 | 0.86 | 1.13 | (0.18 | ) | — | — | ||||||||||||||||||||||
7/1/2009** - 11/30/2009 | 8.44 | 0.08 | 1.35 | 1.43 | (0.04 | ) | — | — | ||||||||||||||||||||||
5/4/2009* - 6/30/2009 | 8.20 | 0.03 | 0.26 | 0.29 | (0.04 | ) | — | (0.01 | ) | |||||||||||||||||||||
| + | unaudited |
| * | Commencement of operations. |
| ** | On April 14, 2009, the Board of Trustees approved a change in the Fund’s fiscal year from June 30 to November 30. |
| (a) | Calculated on average shares outstanding during the period. |
| (b) | Effective May 1, 2009, Fund redemption fees were eliminated. |
| (c) | Total return is calculated assuming a purchase of a share on the first day of the period and a sale of a share on the last day of each period reported. Dividends and distributions, if any, are assumed, for purposes of this calculation, to be reinvested. Total return does not reflect sales charges and includes the effect of fee waivers and reimbursements. Total return may reflect adjustments to conform to generally accepted accounting principles. Total return for a period of less than one year is not annualized. |
| (d) | Does not include expenses of the investment companies in which the Fund invests. |
| (e) | Annualized. |
| (f) | Less than $0.01 per share. |
| 194 | Semiannual Report | | May 31, 2013 | | See accompanying Notes to Financial Statements |
Table of Contents
| Total Dividends and Distributions | Fund Redemption Fees (a)(b) | Net Asset Value, End of Period | Total Return (c) | Net Assets, End of Period (000s) | Ratio of Expenses to Average Net Assets with Fee Waiver/ Reimbursement (d) | Ratio of Expenses to Average Net Assets without Fee Waiver/ Reimbursement (d) | Ratio of Net Investment Income to Average Net Assets (d) | Portfolio Turnover Rate | ||||||||||||||||||||||||||||
| $ | (0.31 | ) | $ | — | $ | 11.38 | 6.15 | % | $ | 16 | 0.63 | %(e) | 1.54 | %(e) | 3.28 | %(e) | 21 | % | ||||||||||||||||||
| (0.29 | ) | — | 11.02 | 10.44 | 15 | 0.67 | 1.56 | 2.02 | 57 | |||||||||||||||||||||||||||
| (0.36 | ) | — | 10.26 | 0.73 | 14 | 0.72 | 1.59 | 2.11 | 64 | |||||||||||||||||||||||||||
| (0.35 | ) | — | 10.54 | 11.30 | 13 | 0.76 | 1.64 | 2.38 | 46 | |||||||||||||||||||||||||||
| (0.04 | ) | — | 9.81 | 16.78 | 12 | 0.77 | (e) | 1.63 | (e) | 1.73 | (e) | 11 | ||||||||||||||||||||||||
| (0.05 | ) | — | 8.44 | 3.52 | 10 | 0.77 | (e) | 1.68 | (e) | 1.61 | (e) | 69 | ||||||||||||||||||||||||
| $ | (0.33 | ) | $ | — | $ | 11.43 | 6.33 | % | $ | 1,342 | 0.23 | %(e) | 1.13 | %(e) | 3.83 | %(e) | 21 | % | ||||||||||||||||||
| (0.31 | ) | — | 11.07 | 10.91 | 1,340 | 0.25 | 1.37 | 2.75 | 57 | |||||||||||||||||||||||||||
| (0.41 | ) | — | 10.28 | 1.13 | 1,996 | 0.27 | 1.22 | 2.52 | 64 | |||||||||||||||||||||||||||
| (0.40 | ) | — | 10.56 | 11.77 | 6,433 | 0.31 | 1.39 | 2.54 | 46 | |||||||||||||||||||||||||||
| (0.04 | ) | — | 9.84 | 16.99 | 1,658 | 0.31 | (e) | 1.21 | (e) | 2.19 | (e) | 11 | ||||||||||||||||||||||||
| (0.05 | ) | — | 8.44 | 3.55 | 1,477 | 0.27 | (e) | 1.37 | (e) | 2.04 | (e) | 69 | ||||||||||||||||||||||||
| $ | (0.33 | ) | $ | — | $ | 11.33 | 6.35 | % | $ | 61,876 | 0.16 | %(e) | 1.10 | %(e) | 3.70 | %(e) | 21 | % | ||||||||||||||||||
| (0.34 | ) | — | 10.97 | 11.01 | 57,357 | 0.15 | 1.14 | 2.47 | 57 | |||||||||||||||||||||||||||
| (0.41 | ) | — | 10.21 | 1.31 | 47,916 | 0.16 | 1.12 | 2.50 | 64 | |||||||||||||||||||||||||||
| (0.41 | ) | — | 10.48 | 11.88 | 37,093 | 0.21 | 1.15 | 2.91 | 46 | |||||||||||||||||||||||||||
| (0.04 | ) | — | 9.77 | 17.14 | 31,841 | 0.20 | (e) | 1.11 | (e) | 2.30 | (e) | 11 | ||||||||||||||||||||||||
| (0.53 | ) | — | (f) | 8.38 | (15.16 | ) | 16,150 | 0.13 | 0.30 | 3.89 | 69 | |||||||||||||||||||||||||
| (1.44 | ) | — | (f) | 10.55 | (4.85 | ) | 15,564 | 0.10 | 0.10 | 3.04 | 17 | |||||||||||||||||||||||||
| $ | (0.32 | ) | $ | — | $ | 11.68 | 6.29 | % | $ | 1,741 | 0.41 | %(e) | 1.34 | %(e) | 3.48 | %(e) | 21 | % | ||||||||||||||||||
| (0.31 | ) | — | 11.30 | 10.70 | 1,653 | 0.40 | 1.42 | 2.35 | 57 | |||||||||||||||||||||||||||
| (0.39 | ) | — | 10.51 | 1.05 | 1,649 | 0.41 | 1.36 | 1.19 | 64 | |||||||||||||||||||||||||||
| (0.18 | ) | — | 10.78 | 11.62 | 14 | 0.46 | 1.37 | 2.68 | 46 | |||||||||||||||||||||||||||
| (0.04 | ) | — | 9.83 | 17.07 | 12 | 0.52 | (e) | 1.36 | (e) | 1.98 | (e) | 11 | ||||||||||||||||||||||||
| (0.05 | ) | — | 8.44 | 3.57 | 10 | 0.32 | (e) | 1.20 | (e) | 2.05 | (e) | 69 | ||||||||||||||||||||||||
| See accompanying Notes to Financial Statements | | May 31, 2013 | | Semiannual Report | 195 |
Table of Contents
Financial Highlights (cont’d)
For a Share Outstanding for the Period ended:
| Net Asset Value, Beginning of Period | Net Investment Income (a) | Net Realized and Change in Unrealized Gain (Loss) | Total from Investment Operations | Dividends from Net Investment Income | Distributions from Net Realized Capital Gains | |||||||||||||||||||||
| AllianzGI Global Growth Allocation: | ||||||||||||||||||||||||||
| Class A | ||||||||||||||||||||||||||
5/31/2013+ | $ | 22.04 | $ | 0.34 | $ | 1.51 | $ | 1.85 | $ | (0.61 | ) | $ | (0.21 | ) | ||||||||||||
11/30/2012 | 20.72 | 0.51 | 1.71 | 2.22 | (0.59 | ) | (0.31 | ) | ||||||||||||||||||
11/30/2011 | 22.03 | 0.45 | (0.33 | ) | 0.12 | (0.91 | ) | (0.52 | ) | |||||||||||||||||
11/30/2010 | 19.96 | 0.47 | 2.09 | 2.56 | (0.35 | ) | (0.14 | ) | ||||||||||||||||||
4/27/2009* - 11/30/2009 | 15.00 | 0.17 | 4.79 | 4.96 | — | — | ||||||||||||||||||||
| Class C | ||||||||||||||||||||||||||
5/31/2013+ | $ | 21.71 | $ | 0.27 | $ | 1.47 | $ | 1.74 | $ | (0.48 | ) | $ | (0.21 | ) | ||||||||||||
11/30/2012 | 20.49 | 0.30 | 1.74 | 2.04 | (0.51 | ) | (0.31 | ) | ||||||||||||||||||
11/30/2011 | 21.81 | 0.24 | (0.28 | ) | (0.04 | ) | (0.76 | ) | (0.52 | ) | ||||||||||||||||
11/30/2010 | 19.87 | 0.44 | 1.96 | 2.40 | (0.32 | ) | (0.14 | ) | ||||||||||||||||||
4/27/2009* - 11/30/2009 | 15.00 | 0.09 | 4.78 | 4.87 | — | — | ||||||||||||||||||||
| Class D | ||||||||||||||||||||||||||
5/31/2013+ | $ | 22.00 | $ | 0.27 | $ | 1.57 | $ | 1.84 | $ | (0.67 | ) | $ | (0.21 | ) | ||||||||||||
11/30/2012 | 20.78 | 0.37 | 1.85 | 2.22 | (0.69 | ) | (0.31 | ) | ||||||||||||||||||
11/30/2011 | 22.06 | 0.48 | (0.36 | ) | 0.12 | (0.88 | ) | (0.52 | ) | |||||||||||||||||
11/30/2010 | 19.96 | 0.63 | 1.94 | 2.57 | (0.33 | ) | (0.14 | ) | ||||||||||||||||||
4/27/2009* - 11/30/2009 | 15.00 | 0.17 | 4.79 | 4.96 | — | — | ||||||||||||||||||||
| Class R | ||||||||||||||||||||||||||
5/31/2013+ | $ | 21.90 | $ | 0.35 | $ | 1.47 | $ | 1.82 | $ | (0.49 | ) | $ | (0.21 | ) | ||||||||||||
11/30/2012 | 20.73 | 0.39 | 1.77 | 2.16 | (0.68 | ) | (0.31 | ) | ||||||||||||||||||
11/30/2011 | 22.01 | 0.40 | (0.34 | ) | 0.06 | (0.82 | ) | (0.52 | ) | |||||||||||||||||
11/30/2010 | 19.93 | 0.62 | 1.91 | 2.53 | (0.31 | ) | (0.14 | ) | ||||||||||||||||||
4/27/2009* - 11/30/2009 | 15.00 | 0.14 | 4.79 | 4.93 | — | — | ||||||||||||||||||||
| Class P | ||||||||||||||||||||||||||
5/31/2013+ | $ | 22.08 | $ | 0.28 | $ | 1.58 | $ | 1.86 | $ | (0.67 | ) | $ | (0.21 | ) | ||||||||||||
11/30/2012 | 20.85 | 0.49 | 1.77 | 2.26 | (0.72 | ) | (0.31 | ) | ||||||||||||||||||
11/30/2011 | 22.12 | 0.63 | (0.48 | ) | 0.15 | (0.90 | ) | (0.52 | ) | |||||||||||||||||
11/30/2010 | 19.99 | 0.71 | 1.91 | 2.62 | (0.35 | ) | (0.14 | ) | ||||||||||||||||||
4/27/2009* - 11/30/2009 | 15.00 | 0.19 | 4.80 | 4.99 | — | — | ||||||||||||||||||||
| Institutional Class | ||||||||||||||||||||||||||
5/31/2013+ | $ | 22.10 | $ | 0.37 | $ | 1.51 | $ | 1.88 | $ | (0.69 | ) | $ | (0.21 | ) | ||||||||||||
11/30/2012 | 20.87 | 0.51 | 1.78 | 2.29 | (0.75 | ) | (0.31 | ) | ||||||||||||||||||
11/30/2011 | 22.14 | 0.65 | (0.48 | ) | 0.17 | (0.92 | ) | (0.52 | ) | |||||||||||||||||
11/30/2010 | 20.00 | 0.73 | 1.91 | 2.64 | (0.36 | ) | (0.14 | ) | ||||||||||||||||||
4/27/2009* - 11/30/2009 | 15.00 | 0.20 | 4.80 | 5.00 | — | — | ||||||||||||||||||||
| Administrative Class | ||||||||||||||||||||||||||
5/31/2013+ | $ | 22.04 | $ | 0.35 | $ | 1.50 | $ | 1.85 | $ | (0.64 | ) | $ | (0.21 | ) | ||||||||||||
11/30/2012 | 20.81 | 0.46 | 1.77 | 2.23 | (0.69 | ) | (0.31 | ) | ||||||||||||||||||
11/30/2011 | 22.08 | 0.59 | (0.47 | ) | 0.12 | (0.87 | ) | (0.52 | ) | |||||||||||||||||
11/30/2010 | 19.97 | 0.68 | 1.90 | 2.58 | (0.33 | ) | (0.14 | ) | ||||||||||||||||||
4/27/2009* - 11/30/2009 | 15.00 | 0.17 | 4.80 | 4.97 | — | — | ||||||||||||||||||||
| + | unaudited |
| * | Commencement of operations. |
| (a) | Calculated on average shares outstanding during the period. |
| 196 | Semiannual Report | | May 31, 2013 | | See accompanying Notes to Financial Statements |
Table of Contents
| Total Dividends and Distributions | Net Asset Value, End of Period | Total Return (b) | Net Assets, End of Period (000s) | Ratio of Expenses to Average Net Assets with Fee Waiver/ Reimbursement (c) | Ratio of Expenses to Average Net Assets without Fee Waiver/ Reimbursement (c) | Ratio of Net Investment Income to Average Net Assets (c) | Portfolio Turnover Rate | |||||||||||||||||||||||||
| $ | (0.82 | ) | $ | 23.07 | 8.70 | % | $ | 1,219 | 0.40 | %(d) | 3.57 | %(d) | 3.02 | %(d) | 54 | % | ||||||||||||||||
| (0.90 | ) | 22.04 | 11.17 | 841 | 0.41 | 4.12 | 2.40 | 51 | ||||||||||||||||||||||||
| (1.43 | ) | 20.72 | 0.17 | 1,283 | 0.47 | 3.23 | 2.02 | 85 | ||||||||||||||||||||||||
| (0.49 | ) | 22.03 | 13.08 | 815 | 0.54 | 5.64 | 2.29 | 66 | ||||||||||||||||||||||||
| — | 19.96 | 33.07 | 41 | 0.54 | (d) | 6.46 | (d) | 1.57 | (d) | 6 | ||||||||||||||||||||||
| $ | (0.69 | ) | $ | 22.76 | 8.24 | % | $ | 1,261 | 1.18 | %(d) | 4.29 | %(d) | 2.38 | %(d) | 54 | % | ||||||||||||||||
| (0.82 | ) | 21.71 | 10.34 | 1,277 | 1.18 | 4.65 | 1.44 | 51 | ||||||||||||||||||||||||
| (1.28 | ) | 20.49 | (0.53 | ) | 1,241 | 1.20 | 4.46 | 1.13 | 85 | |||||||||||||||||||||||
| (0.46 | ) | 21.81 | 12.34 | 497 | 1.29 | 6.28 | 2.18 | 66 | ||||||||||||||||||||||||
| — | 19.87 | 32.47 | 181 | 1.29 | (d) | 7.21 | (d) | 0.82 | (d) | 6 | ||||||||||||||||||||||
| $ | (0.88 | ) | $ | 22.96 | 8.71 | % | $ | 243 | 0.40 | %(d) | 3.74 | %(d) | 2.40 | %(d) | 54 | % | ||||||||||||||||
| (1.00 | ) | 22.00 | 11.13 | 105 | 0.41 | 3.95 | 1.73 | 51 | ||||||||||||||||||||||||
| (1.40 | ) | 20.78 | 0.19 | 37 | 0.45 | 3.60 | 2.20 | 85 | ||||||||||||||||||||||||
| (0.47 | ) | 22.06 | 13.15 | 22 | 0.54 | 5.48 | 3.05 | 66 | ||||||||||||||||||||||||
| — | 19.96 | 33.07 | 13 | 0.54 | (d) | 6.46 | (d) | 1.57 | (d) | 6 | ||||||||||||||||||||||
| $ | (0.70 | ) | $ | 23.02 | 8.54 | % | $ | 20 | 0.63 | %(d) | 3.83 | %(d) | 3.15 | %(d) | 54 | % | ||||||||||||||||
| (0.99 | ) | 21.90 | 10.89 | 38 | 0.65 | 4.16 | 1.87 | 51 | ||||||||||||||||||||||||
| (1.34 | ) | 20.73 | (0.08 | ) | 36 | 0.71 | 3.90 | 1.84 | 85 | |||||||||||||||||||||||
| (0.45 | ) | 22.01 | 12.91 | 15 | 0.79 | 5.61 | 3.04 | 66 | ||||||||||||||||||||||||
| — | 19.93 | 32.87 | 13 | 0.79 | (d) | 6.71 | (d) | 1.32 | (d) | 6 | ||||||||||||||||||||||
| $ | (0.88 | ) | $ | 23.06 | 8.79 | % | $ | 39 | 0.23 | %(d) | 3.55 | %(d) | 2.50 | %(d) | 54 | % | ||||||||||||||||
| (1.03 | ) | 22.08 | 11.35 | 17 | 0.23 | 3.67 | 2.32 | 51 | ||||||||||||||||||||||||
| (1.42 | ) | 20.85 | 0.34 | 15 | 0.27 | 3.26 | 2.84 | 85 | ||||||||||||||||||||||||
| (0.49 | ) | 22.12 | 13.38 | 15 | 0.34 | 5.21 | 3.48 | 66 | ||||||||||||||||||||||||
| — | 19.99 | 33.27 | 13 | 0.34 | (d) | 6.31 | (d) | 1.77 | (d) | 6 | ||||||||||||||||||||||
| $ | (0.90 | ) | $ | 23.08 | 8.84 | % | $ | 5,739 | 0.13 | %(d) | 3.34 | %(d) | 3.30 | %(d) | 54 | % | ||||||||||||||||
| (1.06 | ) | 22.10 | 11.51 | 5,008 | 0.13 | 3.84 | 2.42 | 51 | ||||||||||||||||||||||||
| (1.44 | ) | 20.87 | 0.43 | 4,483 | 0.17 | 3.16 | 2.95 | 85 | ||||||||||||||||||||||||
| (0.50 | ) | 22.14 | 13.49 | 4,484 | 0.24 | 5.11 | 3.58 | 66 | ||||||||||||||||||||||||
| — | 20.00 | 33.33 | 3,920 | 0.24 | (d) | 6.21 | (d) | 1.87 | (d) | 6 | ||||||||||||||||||||||
| $ | (0.85 | ) | $ | 23.04 | 8.74 | % | $ | 18 | 0.38 | %(d) | 3.52 | %(d) | 3.10 | %(d) | 54 | % | ||||||||||||||||
| (1.00 | ) | 22.04 | 11.20 | 17 | 0.38 | 3.82 | 2.17 | 51 | ||||||||||||||||||||||||
| (1.39 | ) | 20.81 | 0.20 | 15 | 0.42 | 3.41 | 2.69 | 85 | ||||||||||||||||||||||||
| (0.47 | ) | 22.08 | 13.20 | 15 | 0.49 | 5.36 | 3.33 | 66 | ||||||||||||||||||||||||
| — | 19.97 | 33.13 | 13 | 0.49 | (d) | 6.46 | (d) | 1.62 | (d) | 6 | ||||||||||||||||||||||
| (b) | Total return is calculated assuming a purchase of a share on the first day of the period and a sale of a share on the last day of each period reported. Dividends and distributions, if any, are assumed, for purposes of this calculation, to be reinvested. Total return does not reflect sales charges and includes the effect of fee waivers and reimbursements. Total return may reflect adjustments to conform to generally accepted accounting principles. Total return for a period of less than one year is not annualized. |
| (c) | Does not include expenses of the investment companies in which the Fund invests. |
| (d) | Annualized. |
| See accompanying Notes to Financial Statements | | May 31, 2013 | | Semiannual Report | 197 |
Table of Contents
Financial Highlights (cont’d)
For a Share Outstanding for the Period ended:
| Net Asset Value, Beginning of Period | Net Investment Income (Loss) (a) | Net Realized and Change in Unrealized Gain (Loss) | Total from Investment Operations | Dividends from Net Investment Income | Distributions from Net Realized Capital Gains | |||||||||||||||||||||
| AllianzGI Behavioral Advantage Large Cap: | ||||||||||||||||||||||||||
| Class A | ||||||||||||||||||||||||||
5/31/2013+ | $ | 19.04 | $ | 0.16 | $ | 2.88 | $ | 3.04 | $ | (0.20 | ) | $ | (1.09 | ) | ||||||||||||
11/30/2012 | 16.05 | 0.29 | 2.76 | 3.05 | (0.06 | ) | — | |||||||||||||||||||
9/8/2011* - 11/30/2011 | 15.00 | 0.04 | 1.01 | 1.05 | — | — | ||||||||||||||||||||
| Class C | ||||||||||||||||||||||||||
5/31/2013+ | $ | 18.90 | $ | 0.07 | $ | 2.87 | $ | 2.94 | $ | (0.21 | ) | $ | (1.09 | ) | ||||||||||||
11/30/2012 | 16.02 | 0.16 | 2.74 | 2.90 | (0.02 | ) | — | |||||||||||||||||||
9/8/2011* - 11/30/2011 | 15.00 | 0.01 | 1.01 | 1.02 | — | — | ||||||||||||||||||||
| Class D | ||||||||||||||||||||||||||
5/31/2013+ | $ | 19.04 | $ | 0.11 | $ | 2.90 | $ | 3.01 | $ | (0.36 | ) | $ | (1.09 | ) | ||||||||||||
11/30/2012 | 16.05 | 0.28 | 2.77 | 3.05 | (0.06 | ) | — | |||||||||||||||||||
9/8/2011* - 11/30/2011 | 15.00 | 0.04 | 1.01 | 1.05 | — | — | ||||||||||||||||||||
| Class P | ||||||||||||||||||||||||||
5/31/2013+ | $ | 19.09 | $ | 0.17 | $ | 2.88 | $ | 3.05 | $ | (0.26 | ) | $ | (1.09 | ) | ||||||||||||
11/30/2012 | 16.05 | 0.32 | 2.79 | 3.11 | (0.07 | ) | — | |||||||||||||||||||
9/8/2011* - 11/30/2011 | 15.00 | 0.05 | 1.00 | 1.05 | — | — | ||||||||||||||||||||
| Institutional Class | ||||||||||||||||||||||||||
5/31/2013+ | $ | 19.10 | $ | 0.17 | $ | 2.90 | $ | 3.07 | $ | (0.30 | ) | $ | (1.09 | ) | ||||||||||||
11/30/2012 | 16.06 | 0.34 | 2.77 | 3.11 | (0.07 | ) | — | |||||||||||||||||||
9/8/2011* - 11/30/2011 | 15.00 | 0.05 | 1.01 | 1.06 | — | — | ||||||||||||||||||||
| AllianzGI China Equity: | ||||||||||||||||||||||||||
| Class A | ||||||||||||||||||||||||||
5/31/2013+ | $ | 14.78 | $ | (0.08 | ) | $ | 0.73 | $ | 0.65 | $ | (0.21 | ) | $ | — | ||||||||||||
11/30/2012 | 15.01 | 0.16 | 0.91 | 1.07 | (0.10 | ) | (1.20 | ) | ||||||||||||||||||
11/30/2011 | 19.81 | 0.60 | (4.58 | ) | (3.98 | ) | — | (d) | (0.82 | ) | ||||||||||||||||
6/7/2010* - 11/30/2010 | 15.00 | (0.09 | ) | 4.90 | 4.81 | — | — | |||||||||||||||||||
| Class C | ||||||||||||||||||||||||||
5/31/2013+ | $ | 14.63 | $ | (0.15 | ) | $ | 0.74 | $ | 0.59 | $ | — | (d) | $ | — | ||||||||||||
11/30/2012 | 14.88 | 0.06 | 0.89 | 0.95 | — | (d) | (1.20 | ) | ||||||||||||||||||
11/30/2011 | 19.78 | (0.10 | ) | (3.98 | ) | (4.08 | ) | — | (d) | (0.82 | ) | |||||||||||||||
6/7/2010* - 11/30/2010 | 15.00 | (0.17 | ) | 4.95 | 4.78 | — | — | |||||||||||||||||||
| Class D | ||||||||||||||||||||||||||
5/31/2013+ | $ | 14.91 | $ | (0.09 | ) | $ | 0.76 | $ | 0.67 | $ | (0.35 | ) | $ | — | ||||||||||||
11/30/2012 | 15.04 | 0.16 | 0.91 | 1.07 | — | (d) | (1.20 | ) | ||||||||||||||||||
11/30/2011 | 19.84 | 0.02 | (3.99 | ) | (3.97 | ) | (0.01 | ) | (0.82 | ) | ||||||||||||||||
6/7/2010* - 11/30/2010 | 15.00 | (0.08 | ) | 4.92 | 4.84 | — | — | |||||||||||||||||||
| Class P | ||||||||||||||||||||||||||
5/31/2013+ | $ | 14.78 | $ | (0.06 | ) | $ | 0.73 | $ | 0.67 | $ | (0.13 | ) | $ | — | ||||||||||||
11/30/2012 | 15.10 | 0.01 | 1.08 | 1.09 | (0.21 | ) | (1.20 | ) | ||||||||||||||||||
11/30/2011 | 19.87 | 0.12 | (4.06 | ) | (3.94 | ) | (0.01 | ) | (0.82 | ) | ||||||||||||||||
6/7/2010* - 11/30/2010 | 15.00 | (0.02 | ) | 4.89 | 4.87 | — | — | |||||||||||||||||||
| Institutional Class | ||||||||||||||||||||||||||
5/31/2013+ | $ | 14.81 | $ | (0.06 | ) | $ | 0.73 | $ | 0.67 | $ | (0.32 | ) | $ | — | ||||||||||||
11/30/2012 | 15.12 | 0.20 | 0.90 | 1.10 | (0.21 | ) | (1.20 | ) | ||||||||||||||||||
11/30/2011 | 19.88 | 0.18 | (4.10 | ) | (3.92 | ) | (0.02 | ) | (0.82 | ) | ||||||||||||||||
6/7/2010* - 11/30/2010 | 15.00 | (0.01 | ) | 4.89 | 4.88 | — | — | |||||||||||||||||||
| + | unaudited |
| * | Commencement of operations. |
| (a) | Calculated on average shares outstanding during the period. |
| (b) | Total return is calculated assuming a purchase of a share on the first day of the period and a sale of a share on the last day of each period reported. Dividends and distributions, if any, are assumed, for purposes of this calculation, to be reinvested. Total return does not reflect sales charges and includes the effect of fee waivers and reimbursements. Total return may reflect adjustments to conform to generally accepted accounting principles. Total return for a period of less than one year is not annualized. |
| 198 | Semiannual Report | | May 31, 2013 | | See accompanying Notes to Financial Statements |
Table of Contents
| Total Dividends and Distributions | Net Asset Value, End of Period | Total Return (b) | Net Assets, End of Period (000s) | Ratio of Expenses to Average Net Assets with Fee Waiver/ Reimbursement | Ratio of Expenses to Average Net Assets without Fee Waiver/ Reimbursement | Ratio of Net Investment Income (Loss) to Average Net Assets | Portfolio Turnover Rate | |||||||||||||||||||||||||
| $ | (1.29 | ) | $ | 20.79 | 17.11 | % | $ | 259 | 0.86 | %(c) | 1.40 | %(c) | 1.62 | %(c) | 24 | % | ||||||||||||||||
| (0.06 | ) | 19.04 | 19.07 | 49 | 0.90 | 2.76 | 1.59 | 76 | ||||||||||||||||||||||||
| — | 16.05 | 7.00 | 11 | 0.90 | (c) | 2.84 | (c) | 1.14 | (c) | — | (f) | |||||||||||||||||||||
| $ | (1.30 | ) | $ | 20.54 | 16.69 | % | $ | 90 | 1.62 | %(c) | 2.22 | %(c) | 0.74 | %(c) | 24 | % | ||||||||||||||||
| (0.02 | ) | 18.90 | 18.15 | 64 | 1.65 | 3.62 | 0.89 | 76 | ||||||||||||||||||||||||
| — | 16.02 | 6.80 | 10 | 1.65 | (c) | 3.59 | (c) | 0.38 | (c) | — | (f) | |||||||||||||||||||||
| $ | (1.45 | ) | $ | 20.60 | 17.08 | % | $ | 102 | 0.87 | %(c) | 1.49 | %(c) | 1.20 | %(c) | 24 | % | ||||||||||||||||
| (0.06 | ) | 19.04 | 19.07 | 19 | 0.90 | 2.61 | 1.55 | 76 | ||||||||||||||||||||||||
| — | 16.05 | 7.00 | 11 | 0.90 | (c) | 2.84 | (c) | 1.14 | (c) | — | (f) | |||||||||||||||||||||
| $ | (1.35 | ) | $ | 20.79 | 17.20 | % | $ | 15 | 0.65 | %(c) | 1.33 | %(c) | 1.71 | %(c) | 24 | % | ||||||||||||||||
| (0.07 | ) | 19.09 | 19.43 | 13 | 0.65 | 2.38 | 1.76 | 76 | ||||||||||||||||||||||||
| — | 16.05 | 7.00 | 11 | 0.65 | (c) | 2.70 | (c) | 1.39 | (c) | — | (f) | |||||||||||||||||||||
| $ | (1.39 | ) | $ | 20.78 | 17.31 | % | $ | 36,309 | 0.55 | %(c) | 1.17 | %(c) | 1.75 | %(c) | 24 | % | ||||||||||||||||
| (0.07 | ) | 19.10 | 19.46 | 17,172 | 0.55 | 2.32 | 1.88 | 76 | ||||||||||||||||||||||||
| — | 16.06 | 7.07 | 10,705 | 0.55 | (c) | 2.58 | (c) | 1.48 | (c) | — | (f) | |||||||||||||||||||||
| $ | (0.21 | ) | $ | 15.22 | (e) | 4.40 | %(e) | $ | 129 | 1.73 | %(c) | 5.64 | %(c) | (1.05 | )%(c) | 17 | % | |||||||||||||||
| (1.30 | ) | 14.78 | 8.35 | 137 | 1.72 | 6.54 | 1.15 | 36 | ||||||||||||||||||||||||
| (0.82 | ) | 15.01 | (20.45 | ) | 191 | 1.73 | 5.29 | 3.25 | 132 | |||||||||||||||||||||||
| — | 19.81 | 32.07 | 239 | 1.90 | (c) | 8.21 | (c) | (0.99 | )(c) | 21 | ||||||||||||||||||||||
| $ | — | (d) | $ | 15.22 | (e) | 4.03 | %(e) | $ | 48 | 2.56 | %(c) | 6.95 | %(c) | (2.02 | )%(c) | 17 | % | |||||||||||||||
| (1.20 | ) | 14.63 | 7.49 | 55 | 2.52 | 8.46 | 0.43 | 36 | ||||||||||||||||||||||||
| (0.82 | ) | 14.88 | (21.02 | ) | 108 | 2.56 | 6.74 | (0.56 | ) | 132 | ||||||||||||||||||||||
| — | 19.78 | 31.87 | 387 | 2.65 | (c) | 8.88 | (c) | (1.88 | )(c) | 21 | ||||||||||||||||||||||
| $ | (0.35 | ) | $ | 15.23 | (e) | 4.46 | %(e) | $ | 245 | 1.77 | %(c) | 10.81 | %(c) | (1.22 | )%(c) | 17 | % | |||||||||||||||
| (1.20 | ) | 14.91 | 8.26 | 362 | 1.74 | 15.31 | 1.14 | 36 | ||||||||||||||||||||||||
| (0.83 | ) | 15.04 | (20.40 | ) | 232 | 1.77 | 6.76 | 0.14 | 132 | |||||||||||||||||||||||
| — | 19.84 | 32.27 | 386 | 1.90 | (c) | 8.10 | (c) | (0.91 | )(c) | 21 | ||||||||||||||||||||||
| $ | (0.13 | ) | $ | 15.32 | (e) | 4.54 | %(e) | $ | 27 | 1.51 | %(c) | 5.31 | %(c) | (0.79 | )%(c) | 17 | % | |||||||||||||||
| (1.41 | ) | 14.78 | 8.51 | 25 | 1.50 | 5.74 | 0.08 | 36 | ||||||||||||||||||||||||
| (0.83 | ) | 15.10 | (20.18 | ) | 124 | 1.51 | 8.18 | 0.79 | 132 | |||||||||||||||||||||||
| — | 19.87 | 32.47 | 13 | 1.65 | (c) | 8.13 | (c) | (0.19 | )(c) | 21 | ||||||||||||||||||||||
| $ | (0.32 | ) | $ | 15.16 | (e) | 4.54 | %(e) | $ | 3,717 | 1.45 | %(c) | 5.22 | %(c) | (0.73 | )%(c) | 17 | % | |||||||||||||||
| (1.41 | ) | 14.81 | 8.64 | 3,490 | 1.43 | 6.19 | 1.41 | 36 | ||||||||||||||||||||||||
| (0.84 | ) | 15.12 | (20.11 | ) | 3,216 | 1.45 | 5.96 | 1.04 | 132 | |||||||||||||||||||||||
| — | 19.88 | 32.53 | 3,923 | 1.55 | (c) | 8.01 | (c) | (0.08 | )(c) | 21 | ||||||||||||||||||||||
| (c) | Annualized. |
| (d) | Less than $(0.01) per share. |
| (e) | Payments from Affiliates increased the net asset value and the total return by $0.12 and 0.82%, respectively. |
| (f) | Less than 1%. |
| See accompanying Notes to Financial Statements | | May 31, 2013 | | Semiannual Report | 199 |
Table of Contents
Financial Highlights (cont’d)
For a Share Outstanding for the Period ended:
| Net Asset Value, Beginning of Period | Net Investment Income (a) | Net Realized and Change in Unrealized Gain (Loss) | Total from Investment Operations | Dividends from Net Investment Income | Distributions from Net Realized Capital Gains | |||||||||||||||||||||
| AllianzGI Convertible: | ||||||||||||||||||||||||||
| Class A | ||||||||||||||||||||||||||
5/31/2013+ | $ | 28.27 | $ | 0.26 | $ | 4.05 | $ | 4.31 | $ | (0.25 | ) | $ | — | |||||||||||||
11/30/2012 | 28.11 | 0.53 | 1.95 | 2.48 | (0.75 | ) | (1.57 | ) | ||||||||||||||||||
11/30/2011 | 28.21 | 0.55 | 0.01 | 0.56 | (0.66 | ) | — | |||||||||||||||||||
4/12/2010* - 11/30/2010 | 26.22 | 0.38 | 1.82 | 2.20 | (0.21 | ) | — | |||||||||||||||||||
| Class C | ||||||||||||||||||||||||||
5/31/2013+ | $ | 28.30 | $ | 0.14 | $ | 4.06 | $ | 4.20 | $ | (0.14 | ) | $ | — | |||||||||||||
11/30/2012 | 28.15 | 0.32 | 1.96 | 2.28 | (0.56 | ) | (1.57 | ) | ||||||||||||||||||
11/30/2011 | 28.30 | 0.34 | 0.03 | 0.37 | (0.52 | ) | — | |||||||||||||||||||
4/12/2010* - 11/30/2010 | 26.22 | 0.24 | 1.84 | 2.08 | – (d | ) | — | |||||||||||||||||||
| Class D | ||||||||||||||||||||||||||
5/31/2013+ | $ | 28.22 | $ | 0.25 | $ | 4.05 | $ | 4.30 | $ | (0.23 | ) | $ | — | |||||||||||||
11/30/2012 | 28.08 | 0.51 | 1.95 | 2.46 | (0.75 | ) | (1.57 | ) | ||||||||||||||||||
11/30/2011 | 28.16 | 0.54 | 0.03 | 0.57 | (0.65 | ) | — | |||||||||||||||||||
4/12/2010* - 11/30/2010 | 26.22 | 0.40 | 1.79 | 2.19 | (0.25 | ) | — | |||||||||||||||||||
| Class R | ||||||||||||||||||||||||||
5/31/2013+ | $ | 28.20 | $ | 0.20 | $ | 4.05 | $ | 4.25 | $ | (0.16 | ) | $ | — | |||||||||||||
11/30/2012 | 28.08 | 0.43 | 1.95 | 2.38 | (0.69 | ) | (1.57 | ) | ||||||||||||||||||
11/30/2011 | 28.17 | 0.48 | 0.02 | 0.50 | (0.59 | ) | — | |||||||||||||||||||
4/12/2010* - 11/30/2010 | 26.22 | 0.33 | 1.82 | 2.15 | (0.20 | ) | — | |||||||||||||||||||
| Class P | ||||||||||||||||||||||||||
5/31/2013+ | $ | 28.20 | $ | 0.29 | $ | 4.04 | $ | 4.33 | $ | (0.27 | ) | $ | — | |||||||||||||
11/30/2012 | 28.04 | 0.58 | 1.94 | 2.52 | (0.79 | ) | (1.57 | ) | ||||||||||||||||||
11/30/2011 | 28.12 | 0.60 | 0.01 | 0.61 | (0.69 | ) | — | |||||||||||||||||||
6/7/2010* - 11/30/2010 | 24.02 | 0.27 | 4.11 | 4.38 | (0.28 | ) | — | |||||||||||||||||||
| Institutional Class | ||||||||||||||||||||||||||
5/31/2013+ | $ | 28.16 | $ | 0.30 | $ | 4.05 | $ | 4.35 | $ | (0.30 | ) | $ | — | |||||||||||||
11/30/2012 | 28.00 | 0.62 | 1.94 | 2.56 | (0.83 | ) | (1.57 | ) | ||||||||||||||||||
11/30/2011 | 28.08 | 0.63 | 0.01 | 0.64 | (0.72 | ) | — | |||||||||||||||||||
11/30/2010 | 23.92 | 0.62 | 4.20 | 4.82 | (0.66 | ) | — | |||||||||||||||||||
4/1/2009** - 11/30/2009 | 19.01 | 0.50 | 4.77 | 5.27 | (0.36 | ) | — | |||||||||||||||||||
3/31/2009 | 24.88 | 0.43 | (5.73 | ) | (5.30 | ) | (0.43 | ) | (0.14 | ) | ||||||||||||||||
3/31/2008 | 24.35 | 0.37 | 0.58 | 0.95 | (0.32 | ) | (0.10 | ) | ||||||||||||||||||
| Administrative Class | ||||||||||||||||||||||||||
5/31/2013+ | $ | 28.20 | $ | 0.26 | $ | 4.05 | $ | 4.31 | $ | (0.25 | ) | $ | — | |||||||||||||
11/30/2012 | 28.04 | 0.55 | 1.94 | 2.49 | (0.76 | ) | (1.57 | ) | ||||||||||||||||||
11/30/2011 | 28.14 | 0.55 | 0.01 | 0.56 | (0.66 | ) | — | |||||||||||||||||||
4/12/2010* - 11/30/2010 | 26.22 | 0.37 | 1.83 | 2.20 | (0.28 | ) | — | |||||||||||||||||||
| + | unaudited |
| * | Commencement of operations. |
| ** | On November 13, 2009, the Board of Trustees approved a change in the Fund’s fiscal year from March 31 to November 30. |
| (a) | Calculated on average shares outstanding during the period. |
| (b) | Total return is calculated assuming a purchase of a share on the first day of the period and a sale of a share on the last day of each period reported. Dividends and distributions, if any, are assumed, for purposes of this calculation, to be reinvested. Total return does not reflect sales charges and includes the effect of fee waivers and reimbursements. Total return may reflect adjustments to conform to generally accepted accounting principles. Total return for a period of less than one year is not annualized. |
| 200 | Semiannual Report | | May 31, 2013 | | See accompanying Notes to Financial Statements |
Table of Contents
| Total Dividends and Distributions | Net Asset Value, End of Period | Total Return (b) | Net Assets, End of Period (000s) | Ratio of Expenses to Average Net Assets with Fee Waiver/ Reimbursement | Ratio of Expenses to Average Net Assets without Fee Waiver/ Reimbursement | Ratio of Net Investment Income to Average Net Assets | Portfolio Turnover Rate | |||||||||||||||||||||||||
| $ | (0.25 | ) | $ | 32.33 | 15.36 | % | $ | 148,896 | 0.95 | %(c) | 0.95 | %(c) | 1.69 | %(c) | 39 | % | ||||||||||||||||
| (2.32 | ) | 28.27 | 9.64 | 94,347 | 1.01 | 1.01 | 1.91 | 108 | ||||||||||||||||||||||||
| (0.66 | ) | 28.11 | 1.95 | 64,857 | 0.97 | 0.97 | 1.89 | 129 | ||||||||||||||||||||||||
| (0.21 | ) | 28.21 | 8.46 | 10,500 | 0.96 | (c) | 0.97 | (c) | 2.25 | (c) | 116 | |||||||||||||||||||||
| $ | (0.14 | ) | $ | 32.36 | 14.94 | % | $ | 53,917 | 1.69 | %(c) | 1.69 | %(c) | 0.95 | %(c) | 39 | % | ||||||||||||||||
| (2.13 | ) | 28.30 | 8.81 | 36,917 | 1.76 | 1.76 | 1.16 | 108 | ||||||||||||||||||||||||
| (0.52 | ) | 28.15 | 1.26 | 27,465 | 1.74 | 1.74 | 1.17 | 129 | ||||||||||||||||||||||||
| — | (d) | 28.30 | 7.94 | 227 | 1.77 | (c) | 1.77 | (c) | 1.40 | (c) | 116 | |||||||||||||||||||||
| $ | (0.23 | ) | $ | 32.29 | 15.34 | % | $ | 45,451 | 1.02 | %(c) | 1.02 | %(c) | 1.64 | %(c) | 39 | % | ||||||||||||||||
| (2.32 | ) | 28.22 | 9.57 | 35,886 | 1.06 | 1.06 | 1.85 | 108 | ||||||||||||||||||||||||
| (0.65 | ) | 28.08 | 1.99 | 30,176 | 0.98 | 0.98 | 1.83 | 129 | ||||||||||||||||||||||||
| (0.25 | ) | 28.16 | 8.46 | 2,180 | 0.93 | (c) | 0.94 | (c) | 2.31 | (c) | 116 | |||||||||||||||||||||
| $ | (0.16 | ) | $ | 32.29 | 15.19 | % | $ | 411 | 1.37 | %(c) | 1.37 | %(c) | 1.32 | %(c) | 39 | % | ||||||||||||||||
| (2.26 | ) | 28.20 | 9.25 | 210 | 1.36 | 1.36 | 1.58 | 108 | ||||||||||||||||||||||||
| (0.59 | ) | 28.08 | 1.76 | 37 | 1.22 | 1.22 | 1.67 | 129 | ||||||||||||||||||||||||
| (0.20 | ) | 28.17 | 8.29 | 11 | 1.25 | (c) | 1.26 | (c) | 1.97 | (c) | 116 | |||||||||||||||||||||
| $ | (0.27 | ) | $ | 32.26 | 15.49 | % | $ | 75,239 | 0.74 | %(c) | 0.74 | %(c) | 1.89 | %(c) | 39 | % | ||||||||||||||||
| (2.36 | ) | 28.20 | 9.84 | 53,368 | 0.80 | 0.86 | 2.12 | 108 | ||||||||||||||||||||||||
| (0.69 | ) | 28.04 | 2.14 | 37,551 | 0.80 | 0.83 | 2.07 | 129 | ||||||||||||||||||||||||
| (0.28 | ) | 28.12 | 18.34 | 21,417 | 0.84 | (c) | 0.87 | (c) | 2.35 | (c) | 116 | |||||||||||||||||||||
| $ | (0.30 | ) | $ | 32.21 | 15.58 | % | $ | 1,262,532 | 0.64 | %(c) | 0.64 | %(c) | 2.00 | %(c) | 39 | % | ||||||||||||||||
| (2.40 | ) | 28.16 | 10.00 | 804,646 | 0.67 | 0.67 | 2.26 | 108 | ||||||||||||||||||||||||
| (0.72 | ) | 28.00 | 2.24 | 521,854 | 0.70 | 0.70 | 2.16 | 129 | ||||||||||||||||||||||||
| (0.66 | ) | 28.08 | 20.46 | 471,226 | 0.77 | 0.80 | 2.42 | 116 | ||||||||||||||||||||||||
| (0.36 | ) | 23.92 | 27.85 | 64,996 | 1.00 | (c)(e) | 1.00 | (c) | 3.34 | (c) | 84 | |||||||||||||||||||||
| (0.57 | ) | 19.01 | (21.30 | ) | 20,664 | 1.03 | (e) | 1.03 | 1.86 | 91 | ||||||||||||||||||||||
| (0.42 | ) | 24.88 | 3.84 | 47,773 | 1.03 | (e) | 1.03 | 1.45 | 98 | |||||||||||||||||||||||
| $ | (0.25 | ) | $ | 32.26 | 15.42 | % | $ | 13,549 | 0.92 | %(c) | 0.92 | %(c) | 1.77 | %(c) | 39 | % | ||||||||||||||||
| (2.33 | ) | 28.20 | 9.70 | 2,199 | 0.92 | 0.92 | 2.00 | 108 | ||||||||||||||||||||||||
| (0.66 | ) | 28.04 | 2.00 | 1,352 | 0.97 | 0.97 | 1.90 | 129 | ||||||||||||||||||||||||
| (0.28 | ) | 28.14 | 8.45 | 11 | 0.98 | (c) | 0.99 | (c) | 2.23 | (c) | 116 | |||||||||||||||||||||
| (c) | Annualized. |
| (d) | Less than $(0.01) per share. |
| (e) | Ratio of expenses to average net assets net of reimbursement/recoupment offset was 0.99%, 0.98% and 0.89% for the period ended November 30, 2009 and the years ended March 31, 2009 and March 31, 2008, respectively. |
| See accompanying Notes to Financial Statements | | May 31, 2013 | | Semiannual Report | 201 |
Table of Contents
Financial Highlights (cont’d)
For a Share Outstanding for the Period ended:
| Net Asset Value, Beginning of Period | Net Investment Income (Loss) (a) | Net Realized and Change in Unrealized Gain (Loss) | Total from Investment Operations | �� | Dividends from Net Investment Income | Distributions from Net Realized Capital Gains | ||||||||||||||||||||
| AllianzGI Disciplined Equity: | ||||||||||||||||||||||||||
| Class A | ||||||||||||||||||||||||||
5/31/2013+ | $ | 16.38 | $ | 0.09 | $ | 1.86 | $ | 1.95 | $ | (0.19 | ) | $ | (0.18 | ) | ||||||||||||
11/30/2012 | 15.34 | 0.16 | 1.27 | 1.43 | (0.15 | ) | (0.24 | ) | ||||||||||||||||||
11/30/2011 | 15.11 | 0.14 | 0.59 | 0.73 | (0.08 | ) | (0.42 | ) | ||||||||||||||||||
11/30/2010 | 14.53 | 0.08 | 1.09 | 1.17 | (0.05 | ) | (0.54 | ) | ||||||||||||||||||
11/30/2009 | 10.58 | 0.08 | 4.11 | 4.19 | (0.06 | ) | (0.18 | ) | ||||||||||||||||||
7/15/2008* - 11/30/2008 | 15.00 | 0.04 | (4.46 | ) | (4.42 | ) | — | — | ||||||||||||||||||
| Class C | ||||||||||||||||||||||||||
5/31/2013+ | $ | 16.11 | $ | 0.03 | $ | 1.83 | $ | 1.86 | $ | — | (d) | $ | (0.18 | ) | ||||||||||||
11/30/2012 | 15.07 | 0.03 | 1.27 | 1.30 | (0.02 | ) | (0.24 | ) | ||||||||||||||||||
11/30/2011 | 14.89 | 0.01 | 0.59 | 0.60 | — | (d) | (0.42 | ) | ||||||||||||||||||
11/30/2010 | 14.39 | (0.03 | ) | 1.07 | 1.04 | — | (d) | (0.54 | ) | |||||||||||||||||
11/30/2009 | 10.56 | (0.02 | ) | 4.09 | 4.07 | (0.06 | ) | (0.18 | ) | |||||||||||||||||
7/15/2008* - 11/30/2008 | 15.00 | 0.02 | (4.46 | ) | (4.44 | ) | — | — | ||||||||||||||||||
| Class D | ||||||||||||||||||||||||||
5/31/2013+ | $ | 16.65 | $ | 0.10 | $ | 1.88 | $ | 1.98 | $ | (0.14 | ) | $ | (0.18 | ) | ||||||||||||
11/30/2012 | 15.43 | 0.16 | 1.30 | 1.46 | — | (d) | (0.24 | ) | ||||||||||||||||||
11/30/2011 | 15.12 | 0.12 | 0.61 | 0.73 | — | (d) | (0.42 | ) | ||||||||||||||||||
11/30/2010 | 14.57 | 0.09 | 1.07 | 1.16 | (0.07 | ) | (0.54 | ) | ||||||||||||||||||
11/30/2009 | 10.58 | 0.08 | 4.13 | 4.21 | (0.04 | ) | (0.18 | ) | ||||||||||||||||||
7/15/2008* - 11/30/2008 | 15.00 | 0.04 | (4.46 | ) | (4.42 | ) | — | — | ||||||||||||||||||
| Class P | ||||||||||||||||||||||||||
5/31/2013+ | $ | 16.53 | $ | 0.11 | $ | 1.87 | $ | 1.98 | $ | (0.18 | ) | $ | (0.18 | ) | ||||||||||||
11/30/2012 | 15.46 | 0.19 | 1.27 | 1.46 | (0.15 | ) | (0.24 | ) | ||||||||||||||||||
11/30/2011 | 15.21 | 0.17 | 0.60 | 0.77 | (0.10 | ) | (0.42 | ) | ||||||||||||||||||
11/30/2010 | 14.60 | 0.12 | 1.09 | 1.21 | (0.06 | ) | (0.54 | ) | ||||||||||||||||||
11/30/2009 | 10.59 | 0.11 | 4.13 | 4.24 | (0.05 | ) | (0.18 | ) | ||||||||||||||||||
7/15/2008* - 11/30/2008 | 15.00 | 0.05 | (4.46 | ) | (4.41 | ) | — | — | ||||||||||||||||||
| Institutional Class | ||||||||||||||||||||||||||
5/31/2013+ | $ | 16.52 | $ | 0.12 | $ | 1.87 | $ | 1.99 | $ | (0.21 | ) | $ | (0.18 | ) | ||||||||||||
11/30/2012 | 15.46 | 0.20 | 1.28 | 1.48 | (0.18 | ) | (0.24 | ) | ||||||||||||||||||
11/30/2011 | 15.21 | 0.18 | 0.60 | 0.78 | (0.11 | ) | (0.42 | ) | ||||||||||||||||||
11/30/2010 | 14.60 | 0.13 | 1.10 | 1.23 | (0.08 | ) | (0.54 | ) | ||||||||||||||||||
11/30/2009 | 10.60 | 0.12 | 4.12 | 4.24 | (0.06 | ) | (0.18 | ) | ||||||||||||||||||
7/15/2008* - 11/30/2008 | 15.00 | 0.06 | (4.46 | ) | (4.40 | ) | — | — | ||||||||||||||||||
| + | unaudited |
| * | Commencement of operations. |
| (a) | Calculated on average shares outstanding during the period. |
| (b) | Total return is calculated assuming a purchase of a share on the first day of the period and a sale of a share on the last day of each period reported. Dividends and distributions, if any, are assumed, for purposes of this calculation, to be reinvested. Total return does not reflect sales charges and includes the effect of fee waivers and reimbursements. Total return may reflect adjustments to conform to generally accepted accounting principles. Total return for a period of less than one year is not annualized. |
| (c) | Annualized. |
| (d) | Less than $(0.01) per share. |
| 202 | Semiannual Report | | May 31, 2013 | | See accompanying Notes to Financial Statements |
Table of Contents
| Total Dividends and Distributions | Net Asset Value, End of Period | Total Return (b) | Net Assets, End of Period (000s) | Ratio of Expenses to Average Net Assets with Fee Waiver/ Reimbursement | Ratio of Expenses to Average Net Assets without Fee Waiver/ Reimbursement | Ratio of Net Investment Income (Loss) to Average Net Assets | Portfolio Turnover Rate | |||||||||||||||||||||||||
| $ | (0.37 | ) | $ | 17.96 | 12.13 | % | $ | 10,395 | 0.95 | %(c) | 1.44 | %(c) | 1.10 | %(c) | 17 | % | ||||||||||||||||
| (0.39 | ) | 16.38 | 9.60 | 8,211 | 1.04 | 1.41 | 0.99 | 23 | ||||||||||||||||||||||||
| (0.50 | ) | 15.34 | 4.83 | 5,632 | 1.27 | 1.50 | 0.90 | 30 | ||||||||||||||||||||||||
| (0.59 | ) | 15.11 | 8.38 | 1,740 | 1.34 | 2.24 | 0.53 | 30 | ||||||||||||||||||||||||
| (0.24 | ) | 14.53 | 40.58 | 1,686 | 1.34 | 3.97 | 0.63 | 34 | ||||||||||||||||||||||||
| — | 10.58 | (29.47 | ) | 60 | 1.34 | (c) | 10.22 | (c) | 0.80 | (c) | 18 | |||||||||||||||||||||
| $ | (0.18 | ) | $ | 17.79 | 11.68 | % | $ | 998 | 1.70 | %(c) | 2.01 | %(c) | 0.34 | %(c) | 17 | % | ||||||||||||||||
| (0.26 | ) | 16.11 | 8.80 | 1,078 | 1.80 | 2.24 | 0.21 | 23 | ||||||||||||||||||||||||
| (0.42 | ) | 15.07 | 4.04 | 1,075 | 2.03 | 2.25 | 0.08 | 30 | ||||||||||||||||||||||||
| (0.54 | ) | 14.89 | 7.51 | 615 | 2.09 | 2.92 | (0.23 | ) | 30 | |||||||||||||||||||||||
| (0.24 | ) | 14.39 | 39.51 | 628 | 2.09 | 4.72 | (0.12 | ) | 34 | |||||||||||||||||||||||
| — | 10.56 | (29.60 | ) | 53 | 2.09 | (c) | 10.97 | (c) | 0.47 | (c) | 18 | |||||||||||||||||||||
| $ | (0.32 | ) | $ | 18.31 | 12.11 | % | $ | 211 | 0.95 | %(c) | 2.52 | %(c) | 1.10 | %(c) | 17 | % | ||||||||||||||||
| (0.24 | ) | 16.65 | 9.65 | 245 | 1.03 | 4.91 | 0.99 | 23 | ||||||||||||||||||||||||
| (0.42 | ) | 15.43 | 4.84 | 131 | 1.28 | 4.15 | 0.72 | 30 | ||||||||||||||||||||||||
| (0.61 | ) | 15.12 | 8.29 | 362 | 1.34 | 2.68 | 0.59 | 30 | ||||||||||||||||||||||||
| (0.22 | ) | 14.57 | 40.66 | 59 | 1.34 | 3.98 | 0.63 | 34 | ||||||||||||||||||||||||
| — | 10.58 | (29.47 | ) | 7 | 1.34 | (c) | 10.22 | (c) | 0.79 | (c) | 18 | |||||||||||||||||||||
| $ | (0.36 | ) | $ | 18.15 | 12.21 | % | $ | 34 | 0.80 | %(c) | 1.08 | %(c) | 1.25 | %(c) | 17 | % | ||||||||||||||||
| (0.39 | ) | 16.53 | 9.73 | 31 | 0.87 | 1.29 | 1.16 | 23 | ||||||||||||||||||||||||
| (0.52 | ) | 15.46 | 5.05 | 23 | 1.06 | 1.36 | 1.06 | 30 | ||||||||||||||||||||||||
| (0.60 | ) | 15.21 | 8.63 | 11 | 1.08 | 2.04 | 0.79 | 30 | ||||||||||||||||||||||||
| (0.23 | ) | 14.60 | 41.03 | 10 | 1.08 | 3.73 | 0.89 | 34 | ||||||||||||||||||||||||
| — | 10.59 | (29.40 | ) | 7 | 1.08 | (c) | 9.96 | (c) | 1.05 | (c) | 18 | |||||||||||||||||||||
| $ | (0.39 | ) | $ | 18.12 | 12.28 | % | $ | 41,126 | 0.70 | %(c) | 0.98 | %(c) | 1.35 | %(c) | 17 | % | ||||||||||||||||
| (0.42 | ) | 16.52 | 9.87 | 36,825 | 0.79 | 1.12 | 1.22 | 23 | ||||||||||||||||||||||||
| (0.53 | ) | 15.46 | 5.15 | 41,003 | 0.96 | 1.22 | 1.17 | 30 | ||||||||||||||||||||||||
| (0.62 | ) | 15.21 | 8.78 | 17,734 | 0.98 | 1.93 | 0.92 | 30 | ||||||||||||||||||||||||
| (0.24 | ) | 14.60 | 40.98 | 11,087 | 0.98 | 3.63 | 0.99 | 34 | ||||||||||||||||||||||||
| — | 10.60 | (29.33 | ) | 2,119 | 0.98 | (c) | 9.86 | (c) | 1.15 | (c) | 18 | |||||||||||||||||||||
| See accompanying Notes to Financial Statements | | May 31, 2013 | | Semiannual Report | 203 |
Table of Contents
Financial Highlights (cont’d)
For a Share Outstanding for the Period ended:
| Net Asset Value, Beginning of Period | Net Investment Income (a) | Net Realized and Change in Unrealized Gain (Loss) | Total from Investment Operations | Dividends from Net Investment Income | Distributions from Net Realized Capital Gains | |||||||||||||||||||||
| AllianzGI Dynamic Emerging Multi-Asset: | ||||||||||||||||||||||||||
| Class A | ||||||||||||||||||||||||||
12/17/2012* - 5/31/2013+ | $ | 15.00 | $ | 0.09 | $ | (0.91 | ) | $ | (0.82 | ) | $ | — | $ | — | ||||||||||||
| Class C | ||||||||||||||||||||||||||
12/17/2012* - 5/31/2013+ | $ | 15.00 | $ | 0.04 | $ | (0.91 | ) | $ | (0.87 | ) | $ | — | $ | — | ||||||||||||
| Class D | ||||||||||||||||||||||||||
12/17/2012* - 5/31/2013+ | $ | 15.00 | $ | 0.08 | $ | (0.90 | ) | $ | (0.82 | ) | $ | — | $ | — | ||||||||||||
| Class P | ||||||||||||||||||||||||||
12/17/2012* - 5/31/2013+ | $ | 15.00 | $ | 0.10 | $ | (0.91 | ) | $ | (0.81 | ) | $ | — | $ | — | ||||||||||||
| Institutional Class | ||||||||||||||||||||||||||
12/17/2012* - 5/31/2013+ | $ | 15.00 | $ | 0.10 | $ | (0.91 | ) | $ | (0.81 | ) | $ | — | $ | — | ||||||||||||
| AllianzGI Global Managed Volatility: | ||||||||||||||||||||||||||
| Class A | ||||||||||||||||||||||||||
5/31/2013+ | $ | 16.68 | $ | 0.26 | $ | 0.97 | $ | 1.23 | $ | (0.65 | ) | $ | (0.07 | ) | ||||||||||||
12/19/2011* - 11/30/2012 | 15.00 | 0.39 | 1.29 | 1.68 | — | — | ||||||||||||||||||||
| Class C | ||||||||||||||||||||||||||
5/31/2013+ | $ | 16.56 | $ | 0.20 | $ | 0.94 | $ | 1.14 | $ | (0.70 | ) | $ | (0.07 | ) | ||||||||||||
12/19/2011* - 11/30/2012 | 15.00 | 0.33 | 1.23 | 1.56 | — | — | ||||||||||||||||||||
| Class D | ||||||||||||||||||||||||||
5/31/2013+ | $ | 16.68 | $ | 0.28 | $ | 0.94 | $ | 1.22 | $ | (0.71 | ) | $ | (0.07 | ) | ||||||||||||
12/19/2011* - 11/30/2012 | 15.00 | 0.39 | 1.29 | 1.68 | — | — | ||||||||||||||||||||
| Class P | ||||||||||||||||||||||||||
5/31/2013+ | $ | 16.71 | $ | 0.30 | $ | 0.96 | $ | 1.26 | $ | (0.66 | ) | $ | (0.07 | ) | ||||||||||||
12/19/2011* - 11/30/2012 | 15.00 | 0.48 | 1.23 | 1.71 | — | — | ||||||||||||||||||||
| Institutional Class | ||||||||||||||||||||||||||
5/31/2013+ | $ | 16.73 | $ | 0.31 | $ | 0.95 | $ | 1.26 | $ | (0.69 | ) | $ | (0.07 | ) | ||||||||||||
12/19/2011* - 11/30/2012 | 15.00 | 0.49 | 1.24 | 1.73 | — | — | ||||||||||||||||||||
| + | unaudited |
| * | Commencement of operations. |
| (a) | Calculated on average shares outstanding during the period. |
| (b) | Total return is calculated assuming a purchase of a share on the first day of the period and a sale of a share on the last day of each period reported. Dividends and distributions, if any, are assumed, for purposes of this calculation, to be reinvested. Total return does not reflect sales charges and includes the effect of fee waivers and reimbursements. Total return may reflect adjustments to conform to generally accepted accounting principles. Total return for a period of less than one year is not annualized. |
| (c) | Annualized. |
| (d) | Does not include expenses of the investment companies in which the Fund invests. |
| 204 | Semiannual Report | | May 31, 2013 | | See accompanying Notes to Financial Statements |
Table of Contents
| Total Dividends and Distributions | Net Asset Value, End of Period | Total Return (b) | Net Assets, End of Period (000s) | Ratio of Expenses to Average Net Assets with Fee Waiver/ Reimbursement | Ratio of Expenses to Average Net Assets without Fee Waiver/ Reimbursement | Ratio of Net Investment Income to Average Net Assets | Portfolio Turnover Rate | |||||||||||||||||||||||||
| $ | — | $ | 14.18 | (5.47 | )% | $ | 9 | 1.47 | %(c)(d) | 5.72 | %(c)(d) | 1.27 | %(c)(d) | 17 | % | |||||||||||||||||
| $ | — | $ | 14.13 | (5.80 | )% | $ | 24 | 2.22 | %(c)(d) | 6.48 | %(c)(d) | 0.57 | %(c)(d) | 17 | % | |||||||||||||||||
| $ | — | $ | 14.18 | (5.47 | )% | $ | 17 | 1.47 | %(c)(d) | 5.74 | %(c)(d) | 1.21 | %(c)(d) | 17 | % | |||||||||||||||||
| $ | — | $ | 14.19 | (5.40 | )% | $ | 10 | 1.32 | %(c)(d) | 5.46 | %(c)(d) | 1.43 | %(c)(d) | 17 | % | |||||||||||||||||
| $ | — | $ | 14.19 | (5.40 | )% | $ | 4,900 | 1.22 | %(c)(d) | 5.46 | %(c)(d) | 1.52 | %(c)(d) | 17 | % | |||||||||||||||||
| $ | (0.72 | ) | $ | 17.19 | 7.64 | % | $ | 134 | 0.95 | %(c) | 2.82 | %(c) | 3.02 | %(c) | 45 | % | ||||||||||||||||
| — | 16.68 | 11.20 | 50 | 0.95 | (c) | 3.24 | (c) | 2.56 | (c) | 92 | ||||||||||||||||||||||
| $ | (0.77 | ) | $ | 16.93 | 7.22 | % | $ | 92 | 1.67 | %(c) | 3.50 | %(c) | 2.38 | %(c) | 45 | % | ||||||||||||||||
| — | 16.56 | 10.40 | 12 | 1.70 | (c) | 4.02 | (c) | 2.18 | (c) | 92 | ||||||||||||||||||||||
| $ | (0.78 | ) | $ | 17.12 | 7.66 | % | $ | 82 | 0.91 | %(c) | 2.79 | %(c) | 3.24 | %(c) | 45 | % | ||||||||||||||||
| — | 16.68 | 11.20 | 38 | 0.95 | (c) | 3.37 | (c) | 2.63 | (c) | 92 | ||||||||||||||||||||||
| $ | (0.73 | ) | $ | 17.24 | 7.82 | % | $ | 12 | 0.70 | %(c) | 2.52 | %(c) | 3.50 | %(c) | 45 | % | ||||||||||||||||
| — | 16.71 | 11.40 | 11 | 0.70 | (c) | 3.11 | (c) | 3.19 | (c) | 92 | ||||||||||||||||||||||
| $ | (0.76 | ) | $ | 17.23 | 7.83 | % | $ | 15,548 | 0.60 | %(c) | 2.47 | %(c) | 3.58 | %(c) | 45 | % | ||||||||||||||||
| — | 16.73 | 11.53 | 14,585 | 0.60 | (c) | 2.98 | (c) | 3.22 | (c) | 92 | ||||||||||||||||||||||
| See accompanying Notes to Financial Statements | | May 31, 2013 | | Semiannual Report | 205 |
Table of Contents
Financial Highlights (cont’d)
For a Share Outstanding for the Period ended:
| Net Asset Value, Beginning of Period | Net Investment Income (Loss) (a) | Net Realized and Change in Unrealized Gain (Loss) | Total from Investment Operations | Dividends from Net Investment Income | ||||||||||||||||||
| AllianzGI Global Water: | ||||||||||||||||||||||
| Class A | ||||||||||||||||||||||
5/31/2013+ | $ | 10.26 | $ | 0.09 | $ | 0.96 | $ | 1.05 | $ | (0.12 | ) | |||||||||||
11/30/2012 | 8.89 | 0.12 | 1.30 | 1.42 | (0.05 | ) | ||||||||||||||||
11/30/2011 | 8.75 | 0.06 | 0.08 | 0.14 | — | (e) | ||||||||||||||||
11/30/2010 | 7.99 | 0.03 | 0.74 | 0.77 | (0.01 | ) | ||||||||||||||||
11/30/2009 | 6.28 | 0.06 | 1.84 | 1.90 | (0.19 | ) | ||||||||||||||||
3/31/2008* - 11/30/2008 | 10.00 | 0.20 | (3.92 | ) | (3.72 | ) | — | |||||||||||||||
| Class C | ||||||||||||||||||||||
5/31/2013+ | $ | 10.02 | $ | 0.05 | $ | 0.94 | $ | 0.99 | $ | (0.05 | ) | |||||||||||
11/30/2012 | 8.70 | 0.05 | 1.27 | 1.32 | — | (e) | ||||||||||||||||
11/30/2011 | 8.62 | (0.01 | ) | 0.09 | 0.08 | — | (e) | |||||||||||||||
11/30/2010 | 7.93 | (0.03 | ) | 0.72 | 0.69 | — | (e) | |||||||||||||||
11/30/2009 | 6.24 | 0.01 | 1.84 | 1.85 | (0.16 | ) | ||||||||||||||||
3/31/2008* - 11/30/2008 | 10.00 | 0.16 | (3.92 | ) | (3.76 | ) | — | |||||||||||||||
| Class D | ||||||||||||||||||||||
5/31/2013+ | $ | 10.25 | $ | 0.10 | $ | 0.94 | $ | 1.04 | $ | (0.13 | ) | |||||||||||
11/30/2012 | 8.87 | 0.10 | 1.32 | 1.42 | (0.04 | ) | ||||||||||||||||
11/30/2011 | 8.73 | 0.04 | 0.10 | 0.14 | — | (e) | ||||||||||||||||
11/30/2010 | 7.98 | 0.03 | 0.73 | 0.76 | (0.01 | ) | ||||||||||||||||
11/30/2009 | 6.27 | 0.04 | 1.86 | 1.90 | (0.19 | ) | ||||||||||||||||
3/31/2008* - 11/30/2008 | 10.00 | 0.21 | (3.94 | ) | (3.73 | ) | — | |||||||||||||||
| Class P | ||||||||||||||||||||||
5/31/2013+ | $ | 10.30 | $ | 0.11 | $ | 0.95 | $ | 1.06 | $ | (0.11 | ) | |||||||||||
11/30/2012 | 8.93 | 0.14 | 1.30 | 1.44 | (0.07 | ) | ||||||||||||||||
11/30/2011 | 8.77 | 0.07 | 0.09 | 0.16 | — | (e) | ||||||||||||||||
11/30/2010 | 7.99 | 0.05 | 0.74 | 0.79 | (0.01 | ) | ||||||||||||||||
11/30/2009 | 6.29 | 0.08 | 1.83 | 1.91 | (0.21 | ) | ||||||||||||||||
3/31/2008* - 11/30/2008 | 10.00 | 0.21 | (3.92 | ) | (3.71 | ) | — | |||||||||||||||
| Institutional Class | ||||||||||||||||||||||
5/31/2013+ | $ | 10.25 | $ | 0.12 | $ | 0.93 | $ | 1.05 | $ | (0.18 | ) | |||||||||||
11/30/2012 | 8.88 | 0.12 | 1.32 | 1.44 | (0.07 | ) | ||||||||||||||||
11/30/2011 | 8.71 | 0.08 | 0.09 | 0.17 | — | (e) | ||||||||||||||||
11/30/2010 | 7.94 | 0.05 | 0.74 | 0.79 | (0.02 | ) | ||||||||||||||||
11/30/2009 | 6.29 | 0.09 | 1.82 | 1.91 | (0.26 | ) | ||||||||||||||||
7/15/2008* - 11/30/2008 | 9.01 | 0.07 | (2.79 | ) | (2.72 | ) | — | |||||||||||||||
| + | unaudited |
| * | Commencement of operations. |
| (a) | Calculated on average shares outstanding during the period. |
| (b) | Effective May 1, 2009, Fund redemption fees were eliminated. |
| (c) | Total return is calculated assuming a purchase of a share on the first day of the period and a sale of a share on the last day of each period reported. Dividends and distributions, if any, are assumed, for purposes of this calculation, to be reinvested. Total return does not reflect sales charges and includes the effect of fee waivers and reimbursements. Total return may reflect adjustments to conform to generally accepted accounting principles. Total return for a period of less than one year is not annualized. |
| 206 | Semiannual Report | | May 31, 2013 | | See accompanying Notes to Financial Statements |
Table of Contents
| Fund Redemption Fees (a)(b) | Net Asset Value, End of Period | Total Return (c) | Net Assets, End of Period (000s) | Ratio of Expenses to Average Net Assets with Fee Waiver/ Reimbursement | Ratio of Expenses to Average Net Assets without Fee Waiver/ Reimbursement | Ratio of Net Investment Income (Loss) to Average Net Assets | Portfolio Turnover Rate | |||||||||||||||||||||||||
| $ | — | $ | 11.19 | 10.28 | % | $ | 87,291 | 1.52 | %(d) | 1.52 | %(d) | 1.70 | %(d) | 14 | % | |||||||||||||||||
| — | 10.26 | 16.12 | 59,611 | 1.57 | 1.60 | 1.27 | 73 | |||||||||||||||||||||||||
| — | 8.89 | 1.62 | 27,101 | 1.68 | 1.68 | 0.60 | 73 | |||||||||||||||||||||||||
| — | 8.75 | 9.63 | 22,774 | 1.80 | 1.80 | 0.41 | 40 | |||||||||||||||||||||||||
| — | (f) | 7.99 | 30.93 | 23,787 | 2.04 | 2.04 | 0.90 | 47 | ||||||||||||||||||||||||
| — | (f) | 6.28 | (37.20 | ) | 20,589 | 1.60 | (d)(g) | 2.10 | (d)(g) | 3.44 | (d) | 54 | ||||||||||||||||||||
| $ | — | $ | 10.96 | 9.88 | % | $ | 35,909 | 2.27 | %(d) | 2.27 | %(d) | 0.90 | %(d) | 14 | % | |||||||||||||||||
| — | 10.02 | 15.17 | 25,870 | 2.33 | 2.41 | 0.48 | 73 | |||||||||||||||||||||||||
| — | 8.70 | 0.93 | 20,842 | 2.44 | 2.44 | (0.15 | ) | 73 | ||||||||||||||||||||||||
| — | 8.62 | 8.70 | 22,225 | 2.56 | 2.60 | (0.37 | ) | 40 | ||||||||||||||||||||||||
| — | (f) | 7.93 | 30.19 | 22,393 | 2.79 | 2.79 | 0.15 | 47 | ||||||||||||||||||||||||
| — | (f) | 6.24 | (37.60 | ) | 18,727 | 2.35 | (d)(g) | 2.85 | (d)(g) | 2.73 | (d) | 54 | ||||||||||||||||||||
| $ | — | $ | 11.16 | 10.25 | % | $ | 14,501 | 1.49 | %(d) | 1.49 | %(d) | 1.89 | %(d) | 14 | % | |||||||||||||||||
| — | 10.25 | 16.09 | 5,869 | 1.64 | 2.25 | 1.02 | 73 | |||||||||||||||||||||||||
| — | 8.87 | 1.60 | 5,214 | 1.72 | 2.00 | 0.47 | 73 | |||||||||||||||||||||||||
| — | 8.73 | 9.70 | 1,157 | 1.84 | 2.74 | 0.34 | 40 | |||||||||||||||||||||||||
| — | (f) | 7.98 | 31.11 | 156 | 2.40 | 2.40 | 0.55 | 47 | ||||||||||||||||||||||||
| — | (f) | 6.27 | (37.30 | ) | 6 | 1.60 | (d)(g) | 2.10 | (d)(g) | 3.45 | (d) | 54 | ||||||||||||||||||||
| $ | — | $ | 11.25 | 10.41 | % | $ | 29,544 | 1.30 | %(d) | 1.30 | %(d) | 2.02 | %(d) | 14 | % | |||||||||||||||||
| — | 10.30 | 16.22 | 16,820 | 1.41 | 1.47 | 1.49 | 73 | |||||||||||||||||||||||||
| — | 8.93 | 1.85 | 16,118 | 1.49 | 1.52 | 0.79 | 73 | |||||||||||||||||||||||||
| — | 8.77 | 9.95 | 10,432 | 1.56 | 1.64 | 0.62 | 40 | |||||||||||||||||||||||||
| — | (f) | 7.99 | 31.26 | 12,016 | 1.78 | 1.78 | 1.16 | 47 | ||||||||||||||||||||||||
| — | (f) | 6.29 | (37.10 | ) | 8,193 | 1.35 | (d)(g) | 1.85 | (d)(g) | 3.64 | (d) | 54 | ||||||||||||||||||||
| $ | — | $ | 11.12 | 10.36 | % | $ | 5,950 | 1.20 | %(d) | 1.20 | %(d) | 2.17 | %(d) | 14 | % | |||||||||||||||||
| — | 10.25 | 16.44 | 3,105 | 1.29 | 1.29 | 1.28 | 73 | |||||||||||||||||||||||||
| — | 8.88 | 1.99 | 1,267 | 1.37 | 1.39 | 0.91 | 73 | |||||||||||||||||||||||||
| — | 8.71 | 9.96 | 1,378 | 1.46 | 1.48 | 0.61 | 40 | |||||||||||||||||||||||||
| — | (f) | 7.94 | 31.42 | 544 | 1.68 | 1.68 | 1.26 | 47 | ||||||||||||||||||||||||
| — | (f) | 6.29 | (30.19 | ) | 16 | 1.25 | (d)(g) | 1.56 | (d)(g) | 2.44 | (d) | 54 | ||||||||||||||||||||
| (d) | Annualized. |
| (e) | Less than $(0.01) per share. |
| (f) | Less than $0.01 per share. |
| (g) | Inclusive of expenses offset by custody credits earned on cash balances at the custodian bank. (See Note 1(n) in Notes to Financial Statements). |
| See accompanying Notes to Financial Statements | | May 31, 2013 | | Semiannual Report | 207 |
Table of Contents
Financial Highlights (cont’d)
For a Share Outstanding for the Period ended:
| Net Asset Value, Beginning of Period | Net Investment Income (a) | Net Realized and Change in Unrealized Gain (Loss) | Total from Investment Operations | Dividends from Net Investment Income | Distributions from Net Realized Capital Gains | |||||||||||||||||||||
| AllianzGI High Yield Bond: | ||||||||||||||||||||||||||
| Class A | ||||||||||||||||||||||||||
5/31/2013+ | $ | 10.16 | $ | 0.34 | $ | 0.29 | $ | 0.63 | $ | (0.35 | ) | $ | — | |||||||||||||
11/30/2012 | 9.69 | 0.72 | 0.61 | 1.33 | (0.73 | ) | (0.13 | ) | ||||||||||||||||||
11/30/2011 | 10.03 | 0.72 | (0.28 | ) | 0.44 | (0.78 | ) | — | ||||||||||||||||||
4/12/2010* - 11/30/2010 | 9.65 | 0.49 | 0.19 | 0.68 | (0.30 | ) | — | |||||||||||||||||||
| Class C | ||||||||||||||||||||||||||
5/31/2013+ | $ | 10.15 | $ | 0.30 | $ | 0.29 | $ | 0.59 | $ | (0.31 | ) | $ | — | |||||||||||||
11/30/2012 | 9.68 | 0.64 | 0.62 | 1.26 | (0.66 | ) | (0.13 | ) | ||||||||||||||||||
11/30/2011 | 10.02 | 0.65 | (0.29 | ) | 0.36 | (0.70 | ) | — | ||||||||||||||||||
4/12/2010* - 11/30/2010 | 9.65 | 0.45 | 0.19 | 0.64 | (0.27 | ) | — | |||||||||||||||||||
| Class D | ||||||||||||||||||||||||||
5/31/2013+ | $ | 9.91 | $ | 0.33 | $ | 0.28 | $ | 0.61 | $ | (0.35 | ) | $ | — | |||||||||||||
11/30/2012 | 9.47 | 0.70 | 0.60 | 1.30 | (0.73 | ) | (0.13 | ) | ||||||||||||||||||
11/30/2011 | 9.79 | 0.72 | (0.28 | ) | 0.44 | (0.76 | ) | — | ||||||||||||||||||
4/12/2010* - 11/30/2010 | 9.65 | 0.48 | 0.18 | 0.66 | (0.52 | ) | — | |||||||||||||||||||
| Class R | ||||||||||||||||||||||||||
5/31/2013+ | $ | 9.88 | $ | 0.32 | $ | 0.27 | $ | 0.59 | $ | (0.33 | ) | $ | — | |||||||||||||
11/30/2012 | 9.45 | 0.67 | 0.60 | 1.27 | (0.71 | ) | (0.13 | ) | ||||||||||||||||||
11/30/2011 | 9.80 | 0.68 | (0.28 | ) | 0.40 | (0.75 | ) | — | ||||||||||||||||||
4/12/2010* - 11/30/2010 | 9.65 | 0.47 | 0.18 | 0.65 | (0.50 | ) | — | |||||||||||||||||||
| Class P | ||||||||||||||||||||||||||
5/31/2013+ | $ | 9.87 | $ | 0.34 | $ | 0.28 | $ | 0.62 | $ | (0.35 | ) | $ | — | |||||||||||||
11/30/2012 | 9.44 | 0.72 | 0.58 | 1.30 | (0.74 | ) | (0.13 | ) | ||||||||||||||||||
11/30/2011 | 9.78 | 0.72 | (0.27 | ) | 0.45 | (0.79 | ) | — | ||||||||||||||||||
4/12/2010* - 11/30/2010 | 9.65 | 0.50 | 0.17 | 0.67 | (0.54 | ) | — | |||||||||||||||||||
| Institutional Class | ||||||||||||||||||||||||||
5/31/2013+ | $ | 9.90 | $ | 0.34 | $ | 0.29 | $ | 0.63 | $ | (0.36 | ) | $ | — | |||||||||||||
11/30/2012 | 9.46 | 0.73 | 0.60 | 1.33 | (0.76 | ) | (0.13 | ) | ||||||||||||||||||
11/30/2011 | 9.80 | 0.76 | (0.30 | ) | 0.46 | (0.80 | ) | — | ||||||||||||||||||
11/30/2010 | 9.17 | 0.83 | 0.61 | 1.44 | (0.81 | ) | — | |||||||||||||||||||
4/1/2009** - 11/30/2009 | 7.40 | 0.52 | 1.77 | 2.29 | (0.52 | ) | — | |||||||||||||||||||
3/31/2009 | 9.36 | 0.71 | (1.90 | ) | (1.19 | ) | (0.77 | ) | — | |||||||||||||||||
3/31/2008 | 10.27 | 0.76 | (0.86 | ) | (0.10 | ) | (0.81 | ) | — | |||||||||||||||||
| Administrative Class | ||||||||||||||||||||||||||
5/31/2013+ | $ | 9.87 | $ | 0.33 | $ | 0.28 | $ | 0.61 | $ | (0.35 | ) | $ | — | |||||||||||||
11/30/2012 | 9.43 | 0.70 | 0.61 | 1.31 | (0.74 | ) | (0.13 | ) | ||||||||||||||||||
11/30/2011 | 9.78 | 0.72 | (0.30 | ) | 0.42 | (0.77 | ) | — | ||||||||||||||||||
4/12/2010* - 11/30/2010 | 9.65 | 0.49 | 0.17 | 0.66 | (0.53 | ) | — | |||||||||||||||||||
| + | unaudited |
| * | Commencement of operations. |
| ** | On November 13, 2009, the Board of Trustees approved a change in the Fund’s fiscal year from March 31 to November 30. |
| (a) | Calculated on average shares outstanding during the period. |
| (b) | Total return is calculated assuming a purchase of a share on the first day of the period and a sale of a share on the last day of each period reported. Dividends and distributions, if any, are assumed, for purposes of this calculation, to be reinvested. Total return does not reflect sales charges and includes the effect of fee waivers and reimbursements. Total return may reflect adjustments to conform to generally accepted accounting principles. Total return for a period of less than one year is not annualized. |
| (c) | Annualized. |
| (d) | Ratio of expenses to average net assets net of reimbursement/recoupment offset was 0.61%, 0.61% and 0.57% for the period ended November 30, 2009 and the years ended March 31, 2009 and March 31, 2008, respectively. |
| 208 | Semiannual Report | | May 31, 2013 | | See accompanying Notes to Financial Statements |
Table of Contents
| Total Dividends and Distributions | Net Asset Value, End of Period | Total Return (b) | Net Assets, End of Period (000s) | Ratio of Expenses to Average Net Assets with Fee Waiver/ Reimbursement | Ratio of Expenses to Average Net Assets without Fee Waiver/ Reimbursement | Ratio of Net Investment Income to Average Net Assets | Portfolio Turnover Rate | |||||||||||||||||||||||||
| $ | (0.35 | ) | $ | 10.44 | 6.22 | % | $ | 112,835 | 0.86 | %(c) | 0.86 | %(c) | 6.56 | %(c) | 54 | % | ||||||||||||||||
| (0.86 | ) | 10.16 | 14.34 | 109,668 | 0.89 | 0.90 | 7.21 | 86 | ||||||||||||||||||||||||
| (0.78 | ) | 9.69 | 4.29 | 61,339 | 1.05 | 1.05 | 7.19 | 168 | ||||||||||||||||||||||||
| (0.30 | ) | 10.03 | 7.07 | 1,296 | 1.11 | (c) | 1.47 | (c) | 7.70 | (c) | 144 | |||||||||||||||||||||
| $ | (0.31 | ) | $ | 10.43 | 5.82 | % | $ | 29,807 | 1.64 | %(c) | 1.64 | %(c) | 5.78 | %(c) | 54 | % | ||||||||||||||||
| (0.79 | ) | 10.15 | 13.54 | 30,692 | 1.68 | 1.68 | 6.43 | 86 | ||||||||||||||||||||||||
| (0.70 | ) | 9.68 | 3.53 | 12,443 | 1.82 | 1.87 | 6.56 | 168 | ||||||||||||||||||||||||
| (0.27 | ) | 10.02 | 6.73 | 311 | 1.87 | (c) | 2.21 | (c) | 7.12 | (c) | 144 | |||||||||||||||||||||
| $ | (0.35 | ) | $ | 10.17 | 6.18 | % | $ | 74,415 | 0.91 | %(c) | 0.91 | %(c) | 6.52 | %(c) | 54 | % | ||||||||||||||||
| (0.86 | ) | 9.91 | 14.33 | 43,921 | 0.96 | 1.07 | 7.14 | 86 | ||||||||||||||||||||||||
| (0.76 | ) | 9.47 | 4.42 | 20,378 | 1.07 | 1.12 | 7.36 | 168 | ||||||||||||||||||||||||
| (0.52 | ) | 9.79 | 7.09 | 169 | 1.11 | (c) | 1.47 | (c) | 7.84 | (c) | 144 | |||||||||||||||||||||
| $ | (0.33 | ) | $ | 10.14 | 6.07 | % | $ | 2,378 | 1.15 | %(c) | 1.25 | %(c) | 6.28 | %(c) | 54 | % | ||||||||||||||||
| (0.84 | ) | 9.88 | 14.05 | 2,111 | 1.15 | 1.25 | 6.95 | 86 | ||||||||||||||||||||||||
| (0.75 | ) | 9.45 | 4.02 | 342 | 1.33 | 1.37 | 7.23 | 168 | ||||||||||||||||||||||||
| (0.50 | ) | 9.80 | 6.97 | 11 | 1.36 | (c) | 1.63 | (c) | 7.74 | (c) | 144 | |||||||||||||||||||||
| $ | (0.35 | ) | $ | 10.14 | 6.38 | % | $ | 14,877 | 0.69 | %(c) | 0.69 | %(c) | 6.72 | %(c) | 54 | % | ||||||||||||||||
| (0.87 | ) | 9.87 | 14.48 | 19,497 | 0.74 | 0.79 | 7.39 | 86 | ||||||||||||||||||||||||
| (0.79 | ) | 9.44 | 4.57 | 11,096 | 0.88 | 0.88 | 7.49 | 168 | ||||||||||||||||||||||||
| (0.54 | ) | 9.78 | 7.22 | 11 | 0.97 | (c) | 1.14 | (c) | 8.13 | (c) | 144 | |||||||||||||||||||||
| $ | (0.36 | ) | $ | 10.17 | 6.44 | % | $ | 135,424 | 0.60 | %(c) | 0.60 | %(c) | 6.82 | %(c) | 54 | % | ||||||||||||||||
| (0.89 | ) | 9.90 | 14.68 | 121,362 | 0.63 | 0.63 | 7.47 | 86 | ||||||||||||||||||||||||
| (0.80 | ) | 9.46 | 4.66 | 70,174 | 0.61 | 0.77 | 7.65 | 168 | ||||||||||||||||||||||||
| (0.81 | ) | 9.80 | 16.23 | 93,782 | 0.63 | 0.93 | 8.65 | 144 | ||||||||||||||||||||||||
| (0.52 | ) | 9.17 | 31.50 | 69,667 | 0.61 | (c) | 0.61 | (c)(d) | 9.08 | (c) | 120 | |||||||||||||||||||||
| (0.77 | ) | 7.40 | (13.01 | ) | 49,233 | 0.64 | 0.64 | (d) | 8.56 | 55 | ||||||||||||||||||||||
| (0.81 | ) | 9.36 | (1.06 | ) | 50,271 | 0.63 | 0.63 | (d) | 7.66 | 81 | ||||||||||||||||||||||
| $ | (0.35 | ) | $ | 10.13 | 6.23 | % | $ | 30,440 | 0.85 | %(c) | 0.85 | %(c) | 6.58 | %(c) | 54 | % | ||||||||||||||||
| (0.87 | ) | 9.87 | 14.54 | 27,274 | 0.90 | 1.14 | 8.92 | 86 | ||||||||||||||||||||||||
| (0.77 | ) | 9.43 | 4.27 | 11 | 1.03 | 1.03 | 7.25 | 168 | ||||||||||||||||||||||||
| (0.53 | ) | 9.78 | 7.12 | 11 | 1.12 | (c) | 1.28 | (c) | 7.98 | (c) | 144 | |||||||||||||||||||||
| See accompanying Notes to Financial Statements | | May 31, 2013 | | Semiannual Report | 209 |
Table of Contents
Financial Highlights (cont’d)
For a Share Outstanding for the Period ended:
| Net Asset Value, Beginning of Period | Net Investment Income (Loss) (a) | Net Realized and Change in Unrealized Gain (Loss) | Total from Investment Operations | Dividends from Net Investment Income | Distributions from Net Realized Capital Gains | |||||||||||||||||||||
| AllianzGI International Small-Cap: | ||||||||||||||||||||||||||
| Class A | ||||||||||||||||||||||||||
5/31/2013+ | $ | 31.89 | $ | 0.13 | $ | 5.21 | $ | 5.34 | $ | — | (c) | $ | — | |||||||||||||
11/30/2012 | 28.31 | 0.16 | 4.06 | 4.22 | (0.64 | ) | — | |||||||||||||||||||
11/30/2011 | 31.36 | 0.12 | (2.56 | ) | (2.44 | ) | (0.61 | ) | — | |||||||||||||||||
4/12/2010* - 11/30/2010 | 28.30 | (0.01 | ) | 3.07 | 3.06 | — | — | |||||||||||||||||||
| Class C | ||||||||||||||||||||||||||
5/31/2013+ | $ | 31.75 | $ | (0.01 | ) | $ | 5.19 | $ | 5.18 | $ | (0.02 | ) | $ | — | ||||||||||||
11/30/2012 | 28.01 | (0.07 | ) | 4.04 | 3.97 | (0.23 | ) | — | ||||||||||||||||||
11/30/2011 | 31.22 | 0.06 | (2.72 | ) | (2.66 | ) | (0.55 | ) | — | |||||||||||||||||
4/12/2010* - 11/30/2010 | 28.30 | (0.24 | ) | 3.16 | 2.92 | — | — | |||||||||||||||||||
| Class D | ||||||||||||||||||||||||||
5/31/2013+ | $ | 32.60 | $ | 0.14 | $ | 5.32 | $ | 5.46 | $ | — | (c) | $ | — | |||||||||||||
11/30/2012 | 28.33 | 0.24 | 4.03 | 4.27 | — | (c) | — | |||||||||||||||||||
11/30/2011 | 31.37 | 0.07 | (2.53 | ) | (2.46 | ) | (0.58 | ) | — | |||||||||||||||||
4/12/2010* - 11/30/2010 | 28.30 | 0.04 | 3.03 | 3.07 | — | — | ||||||||||||||||||||
| Class R | ||||||||||||||||||||||||||
5/31/2013+ | $ | 32.25 | $ | 0.09 | $ | 5.23 | $ | 5.32 | $ | (0.19 | ) | $ | — | |||||||||||||
11/30/2012 | 28.27 | 0.08 | 4.10 | 4.18 | (0.20 | ) | — | |||||||||||||||||||
11/30/2011 | 31.32 | 0.16 | (2.70 | ) | (2.54 | ) | (0.51 | ) | — | |||||||||||||||||
4/12/2010* - 11/30/2010 | 28.30 | 0.05 | 2.97 | 3.02 | — | — | ||||||||||||||||||||
| Class P | ||||||||||||||||||||||||||
5/31/2013+ | $ | 31.92 | $ | 0.14 | $ | 5.19 | $ | 5.33 | $ | (0.26 | ) | $ | — | |||||||||||||
11/30/2012 | 27.86 | 0.20 | 4.05 | 4.25 | (0.19 | ) | — | |||||||||||||||||||
11/30/2011 | 30.35 | 0.30 | (2.67 | ) | (2.37 | ) | (0.12 | ) | — | |||||||||||||||||
11/30/2010 | 25.86 | 0.20 | 4.45 | 4.65 | (0.16 | ) | — | |||||||||||||||||||
4/1/2009** - 11/30/2009 | 16.29 | 0.14 | 9.43 | 9.57 | — | — | ||||||||||||||||||||
3/31/2009 | 40.10 | 0.33 | (19.44 | ) | (19.11 | ) | — | (4.70 | ) | |||||||||||||||||
3/31/2008 | 57.36 | 0.14 | 3.43 | 3.57 | (1.27 | ) | (19.56 | ) | ||||||||||||||||||
| Institutional Class | ||||||||||||||||||||||||||
5/31/2013+ | $ | 32.60 | $ | 0.12 | $ | 5.33 | $ | 5.45 | $ | (0.30 | ) | $ | — | |||||||||||||
11/30/2012 | 28.58 | 0.24 | 4.15 | 4.39 | (0.37 | ) | — | |||||||||||||||||||
11/30/2011 | 31.45 | 0.37 | (2.74 | ) | (2.37 | ) | (0.50 | ) | — | |||||||||||||||||
11/30/2010 | 26.91 | 0.24 | 4.94 | 5.18 | (0.64 | ) | — | |||||||||||||||||||
4/1/2009** - 11/30/2009 | 16.93 | 0.17 | 9.81 | 9.98 | — | — | ||||||||||||||||||||
3/31/2009 | 41.28 | 0.34 | (19.99 | ) | (19.65 | ) | — | (4.70 | ) | |||||||||||||||||
3/31/2008 | 57.63 | 0.39 | 3.17 | 3.56 | (0.35 | ) | (19.56 | ) | ||||||||||||||||||
| Administrative Class | ||||||||||||||||||||||||||
5/31/2013+ | $ | 32.27 | $ | 0.13 | $ | 5.27 | $ | 5.40 | $ | — | (c) | $ | — | |||||||||||||
11/30/2012 | 28.34 | 0.57 | 3.64 | 4.21 | (0.28 | ) | — | |||||||||||||||||||
11/30/2011 | 31.37 | 0.24 | (2.70 | ) | (2.46 | ) | (0.57 | ) | — | |||||||||||||||||
4/12/2010* - 11/30/2010 | 28.30 | 0.09 | 2.98 | 3.07 | — | — | ||||||||||||||||||||
| + | unaudited |
| * | Commencement of operations. |
| ** | On November 13, 2009, the Board of Trustees approved a change in the Fund’s fiscal year from March 31 to November 30. |
| (a) | Calculated on average shares outstanding during the period. |
| (b) | Total return is calculated assuming a purchase of a share on the first day of the period and a sale of a share on the last day of each period reported. Dividends and distributions, if any, are assumed, for purposes of this calculation, to be reinvested. Total return does not reflect sales charges and includes the effect of fee waivers and reimbursements. Total return may reflect adjustments to conform to generally accepted accounting principles. Total return for a period of less than one year is not annualized. |
| 210 | Semiannual Report | | May 31, 2013 | | See accompanying Notes to Financial Statements |
Table of Contents
| Total Dividends and Distributions | Net Asset Value, End of Period | Total Return (b) | Net Assets, End of Period (000s) | Ratio of Expenses to Average Net Assets with Fee Waiver/ Reimbursement | Ratio of Expenses to Average Net Assets without Fee Waiver/ Reimbursement | Ratio of Net Investment Income (Loss) to Average Net Assets | Portfolio Turnover Rate | |||||||||||||||||||||||||
| $ | — | (c) | $ | 37.23 | 16.75 | % | $ | 3,386 | 1.45 | %(d) | 2.00 | %(d) | 0.76 | %(d) | 50 | % | ||||||||||||||||
| (0.64 | ) | 31.89 | 15.13 | 2,773 | 1.50 | 1.76 | 0.53 | 117 | ||||||||||||||||||||||||
| (0.61 | ) | 28.31 | (8.03 | ) | 4,103 | 1.60 | 1.83 | 0.40 | 66 | |||||||||||||||||||||||
| — | 31.36 | 10.81 | 97 | 1.66 | (d) | 1.70 | (d) | (0.07 | )(d) | 57 | ||||||||||||||||||||||
| $ | (0.02 | ) | $ | 36.91 | 16.32 | % | $ | 576 | 2.20 | %(d) | 2.48 | %(d) | (0.06 | )%(d) | 50 | % | ||||||||||||||||
| (0.23 | ) | 31.75 | 14.26 | 531 | 2.26 | 2.37 | (0.24 | ) | 117 | |||||||||||||||||||||||
| (0.55 | ) | 28.01 | (8.75 | ) | 455 | 2.34 | 2.86 | 0.19 | 66 | |||||||||||||||||||||||
| — | 31.22 | 10.32 | 176 | 2.44 | (d) | 2.48 | (d) | (1.23 | )(d) | 57 | ||||||||||||||||||||||
| $ | — | (c) | $ | 38.06 | 16.75 | % | $ | 135 | 1.45 | %(d) | 2.18 | %(d) | 0.81 | %(d) | 50 | % | ||||||||||||||||
| — | (c) | 32.60 | 15.07 | 112 | 1.56 | 5.66 | 0.77 | 117 | ||||||||||||||||||||||||
| (0.58 | ) | 28.33 | (8.08 | ) | 1,440 | 1.61 | 2.83 | 0.22 | 66 | |||||||||||||||||||||||
| — | 31.37 | 10.85 | 38 | 1.66 | (d) | 1.83 | (d) | 0.22 | (d) | 57 | ||||||||||||||||||||||
| $ | (0.19 | ) | $ | 37.38 | 16.59 | % | $ | 16 | 1.70 | %(d) | 1.93 | %(d) | 0.54 | %(d) | 50 | % | ||||||||||||||||
| (0.20 | ) | 32.25 | 14.86 | 12 | 1.74 | 1.90 | 0.26 | 117 | ||||||||||||||||||||||||
| (0.51 | ) | 28.27 | (8.32 | ) | 10 | 1.82 | 1.84 | 0.51 | 66 | |||||||||||||||||||||||
| — | 31.32 | 10.67 | 11 | 1.91 | (d) | 2.35 | (d) | 0.27 | (d) | 57 | ||||||||||||||||||||||
| $ | (0.26 | ) | $ | 36.99 | 16.82 | % | $ | 29,649 | 1.30 | %(d) | 1.52 | %(d) | 0.82 | %(d) | 50 | % | ||||||||||||||||
| (0.19 | ) | 31.92 | 15.32 | 28,996 | 1.31 | 1.52 | 0.68 | 117 | ||||||||||||||||||||||||
| (0.12 | ) | 27.86 | (7.86 | ) | 34,772 | 1.32 | 1.47 | 0.95 | 66 | |||||||||||||||||||||||
| (0.16 | ) | 30.35 | 18.12 | 46,636 | 1.37 | 1.77 | 0.74 | 57 | ||||||||||||||||||||||||
| — | 25.86 | 58.75 | 66,137 | 1.41 | (d) | 1.41 | (d)(e) | 0.90 | (d) | 64 | ||||||||||||||||||||||
| (4.70 | ) | 16.29 | (48.16 | ) | 39,680 | 1.44 | 1.44 | (e) | 1.14 | 106 | ||||||||||||||||||||||
| (20.83 | ) | 40.10 | 2.74 | 113,239 | 1.44 | 1.44 | (e) | 0.26 | 86 | |||||||||||||||||||||||
| $ | (0.30 | ) | $ | 37.75 | 16.85 | % | $ | 63,755 | 1.20 | %(d) | 1.41 | %(d) | 0.69 | %(d) | 50 | % | ||||||||||||||||
| (0.37 | ) | 32.60 | 15.50 | 88,301 | 1.20 | 1.38 | 0.80 | 117 | ||||||||||||||||||||||||
| (0.50 | ) | 28.58 | (7.74 | ) | 84,026 | 1.20 | 1.34 | 1.14 | 66 | |||||||||||||||||||||||
| (0.64 | ) | 31.45 | 18.22 | 89,186 | 1.23 | 1.70 | 0.86 | 57 | ||||||||||||||||||||||||
| — | 26.91 | 58.95 | 14,224 | 1.26 | (d) | 1.26 | (d)(f) | 1.09 | (d) | 64 | ||||||||||||||||||||||
| (4.70 | ) | 16.93 | (48.08 | ) | 6,828 | 1.29 | 1.29 | (f) | 1.27 | 106 | ||||||||||||||||||||||
| (19.91 | ) | 41.28 | 2.90 | 8,213 | 1.27 | 1.27 | (f) | 0.57 | 86 | |||||||||||||||||||||||
| $ | — | (c) | $ | 37.67 | 16.74 | % | $ | 14 | 1.45 | %(d) | 1.68 | %(d) | 0.74 | %(d) | 50 | % | ||||||||||||||||
| (0.28 | ) | 32.27 | 14.96 | 12 | 1.56 | 1.64 | 1.94 | 117 | ||||||||||||||||||||||||
| (0.57 | ) | 28.34 | (8.09 | ) | 10 | 1.57 | 1.59 | 0.75 | 66 | |||||||||||||||||||||||
| — | 31.37 | 10.85 | 11 | 1.66 | (d) | 2.04 | (d) | 0.53 | (d) | 57 | ||||||||||||||||||||||
| (c) | Less than $(0.01) per share. |
| (d) | Annualized. |
| (e) | Ratio of expenses to average net assets net of reimbursement/recoupment offset was 1.41%, 1.17% and 1.13% for the period ended November 30, 2009 and the years ended March 31, 2009 and March 31, 2008, respectively. |
| (f) | Ratio of expenses to average net assets net of reimbursement/recoupment offset was 1.26%, 1.01% and 1.00% for the period ended November 30, 2009 and the years ended March 31, 2009 and March 31, 2008, respectively. |
| See accompanying Notes to Financial Statements | | May 31, 2013 | | Semiannual Report | 211 |
Table of Contents
Financial Highlights (cont’d)
For a Share Outstanding for the Period ended:
| Net Asset Value, Beginning of Period | Net Investment Income (Loss) (a) | Net Realized and Change in Unrealized Gain (Loss) | Total from Investment Operations | Dividends from Net Investment Income | Distributions from Net Realized Capital Gains | |||||||||||||||||||||
| AllianzGI Micro Cap: | ||||||||||||||||||||||||||
| Class A | �� | |||||||||||||||||||||||||
5/31/2013+ | $ | 11.62 | $ | (0.08 | ) | $ | 2.25 | $ | 2.17 | $ | — | $ | (0.84 | ) | ||||||||||||
12/19/2011* - 11/30/2012 | 9.84 | (0.07 | ) | 1.85 | 1.78 | — | — | |||||||||||||||||||
| Class P | ||||||||||||||||||||||||||
5/31/2013+ | $ | 11.61 | $ | (0.07 | ) | $ | 2.25 | $ | 2.18 | $ | — | $ | (0.84 | ) | ||||||||||||
11/30/2012 | 12.20 | (0.10 | ) | 1.47 | 1.37 | — | (1.96 | ) | ||||||||||||||||||
12/27/2010* - 11/30/2011 | 14.20 | (0.15 | ) | (1.64 | ) | (1.79 | ) | — | (0.21 | ) | ||||||||||||||||
| Institutional Class | ||||||||||||||||||||||||||
5/31/2013+ | $ | 11.65 | $ | (0.05 | ) | $ | 2.25 | $ | 2.20 | $ | — | $ | (0.84 | ) | ||||||||||||
11/30/2012 | 12.22 | (0.10 | ) | 1.49 | 1.39 | — | (1.96 | ) | ||||||||||||||||||
11/30/2011 | 13.80 | (0.17 | ) | (0.16 | ) | (0.33 | ) | — | (1.25 | ) | ||||||||||||||||
11/30/2010 | 10.44 | (0.15 | ) | 3.51 | 3.36 | — | — | |||||||||||||||||||
4/1/2009** - 11/30/2009 | 7.58 | (0.07 | ) | 2.93 | 2.86 | — | — | |||||||||||||||||||
3/31/2009 | 11.60 | (0.07 | ) | (3.95 | ) | (4.02 | ) | — | — | (e) | ||||||||||||||||
3/31/2008 | 15.33 | (0.18 | ) | (1.49 | ) | (1.67 | ) | — | (2.06 | ) | ||||||||||||||||
| AllianzGI Multi-Asset Real Return: | ||||||||||||||||||||||||||
| Class A | ||||||||||||||||||||||||||
12/17/2012* - 5/31/2013+ | $ | 15.00 | $ | 0.11 | $ | 0.03 | $ | 0.14 | $ | — | $ | — | ||||||||||||||
| Class C | ||||||||||||||||||||||||||
12/17/2012* - 5/31/2013+ | $ | 15.00 | $ | 0.05 | $ | 0.04 | $ | 0.09 | $ | — | $ | — | ||||||||||||||
| Class D | ||||||||||||||||||||||||||
12/17/2012* - 5/31/2013+ | $ | 15.00 | $ | 0.10 | $ | 0.04 | $ | 0.14 | $ | — | $ | — | ||||||||||||||
| Class P | ||||||||||||||||||||||||||
12/17/2012* - 5/31/2013+ | $ | 15.00 | $ | 0.11 | $ | 0.04 | $ | 0.15 | $ | — | $ | — | ||||||||||||||
| Institutional Class | ||||||||||||||||||||||||||
12/17/2012* - 5/31/2013+ | $ | 15.00 | $ | 0.12 | $ | 0.04 | $ | 0.16 | $ | — | $ | — | ||||||||||||||
| AllianzGI NFJ Emerging Markets Value: | ||||||||||||||||||||||||||
| Class A | ||||||||||||||||||||||||||
12/18/2012* - 5/31/2013+ | $ | 15.00 | $ | 0.25 | $ | 0.56 | $ | 0.81 | $ | — | (e) | $ | — | |||||||||||||
| Class C | ||||||||||||||||||||||||||
12/18/2012* - 5/31/2013+ | $ | 15.00 | $ | 0.16 | $ | 0.60 | $ | 0.76 | $ | — | (e) | $ | — | |||||||||||||
| Class D | ||||||||||||||||||||||||||
12/18/2012* - 5/31/2013+ | $ | 15.00 | $ | 0.21 | $ | 0.61 | $ | 0.82 | $ | — | (e) | $ | — | |||||||||||||
| Class P | ||||||||||||||||||||||||||
12/18/2012* - 5/31/2013+ | $ | 15.00 | $ | 0.22 | $ | 0.60 | $ | 0.82 | $ | — | (e) | $ | — | |||||||||||||
| Institutional Class | ||||||||||||||||||||||||||
12/18/2012* - 5/31/2013+ | $ | 15.00 | $ | 0.27 | $ | 0.56 | $ | 0.83 | $ | — | (e) | $ | — | |||||||||||||
| + | unaudited |
| * | Commencement of operations. |
| ** | On November 13, 2009, the Board of Trustees approved a change in the Fund’s fiscal year from March 31 to November 30. |
| (a) | Calculated on average shares outstanding during the period. |
| (b) | Total return is calculated assuming a purchase of a share on the first day of the period and a sale of a share on the last day of each period reported. Dividends and distributions, if any, are assumed, for purposes of this calculation, to be reinvested. Total return does not reflect sales charges and includes the effect of fee waivers and reimbursements. Total return may reflect adjustments to conform to generally accepted accounting principles. Total return for a period of less than one year is not annualized. |
| 212 | Semiannual Report | | May 31, 2013 | | See accompanying Notes to Financial Statements |
Table of Contents
| Total Dividends and Distributions | Net Asset Value, End of Period | Total Return (b) | Net Assets, End of Period (000s) | Ratio of Expenses to Average Net Assets with Fee Waiver/ Reimbursement | Ratio of Expenses to Average Net Assets without Fee Waiver/ Reimbursement | Ratio of Net Investment Income (Loss) to Average Net Assets | Portfolio Turnover Rate | |||||||||||||||||||||||||
| $ | (0.84 | ) | $ | 12.95 | 20.27 | % | $ | 404 | 1.81 | %(c) | 2.18 | %(c) | (1.27 | )%(c) | 29 | % | ||||||||||||||||
| — | 11.62 | 18.09 | 135 | 1.82 | (c) | 2.18 | (c) | (0.62 | )(c) | 62 | ||||||||||||||||||||||
| $ | (0.84 | ) | $ | 12.95 | 20.47 | % | $ | 992 | 1.64 | %(c) | 2.00 | %(c) | (1.15 | )%(c) | 29 | % | ||||||||||||||||
| (1.96 | ) | 11.61 | 13.90 | 332 | 1.65 | 1.99 | (0.85 | ) | 62 | |||||||||||||||||||||||
| (0.21 | ) | 12.20 | (12.43 | ) | 426 | 1.65 | (c) | 1.85 | (c) | (1.35 | )(c) | 74 | ||||||||||||||||||||
| $ | (0.84 | ) | $ | 13.01 | 20.48 | % | $ | 33,949 | 1.54 | %(c) | 1.99 | %(c) | (0.89 | )%(c) | 29 | % | ||||||||||||||||
| (1.96 | ) | 11.65 | 14.09 | 27,343 | 1.54 | 1.84 | (0.90 | ) | 62 | |||||||||||||||||||||||
| (1.25 | ) | 12.22 | (2.88 | ) | 46,514 | 1.54 | 1.65 | (1.24 | ) | 74 | ||||||||||||||||||||||
| — | 13.80 | 32.18 | 57,591 | 1.57 | 1.64 | (1.25 | ) | 112 | ||||||||||||||||||||||||
| — | 10.44 | 37.73 | 53,994 | 1.55 | (c) | 1.55 | (c)(d) | (1.14 | )(c) | 86 | ||||||||||||||||||||||
| — | (e) | 7.58 | (34.63 | ) | 40,178 | 1.58 | 1.58 | (d) | (0.64 | ) | 104 | |||||||||||||||||||||
| (2.06 | ) | 11.60 | (13.25 | ) | 60,122 | 1.58 | 1.58 | (d) | (1.19 | ) | 139 | |||||||||||||||||||||
| $ | — | $ | 15.14 | 0.93 | % | $ | 39 | 0.87 | %(c)(f) | 5.81 | %(c)(f) | 1.59 | %(c)(f) | 15 | % | |||||||||||||||||
| $ | — | $ | 15.09 | 0.60 | % | $ | 16 | 1.61 | %(c)(f) | 6.50 | %(c)(f) | 0.71 | %(c)(f) | 15 | % | |||||||||||||||||
| $ | — | $ | 15.14 | 0.93 | % | $ | 10 | 0.88 | %(c)(f) | 5.72 | %(c)(f) | 1.47 | %(c)(f) | 15 | % | |||||||||||||||||
| $ | — | $ | 15.15 | 1.00 | % | $ | 10 | 0.72 | %(c)(f) | 5.47 | %(c)(f) | 1.63 | %(c)(f) | 15 | % | |||||||||||||||||
| $ | — | $ | 15.16 | 1.07 | % | $ | 5,084 | 0.62 | %(c)(f) | 5.47 | %(c)(f) | 1.73 | %(c)(f) | 15 | % | |||||||||||||||||
| $ | — | (e) | $ | 15.81 | 5.41 | % | $ | 21 | 1.56 | %(c) | 6.49 | %(c) | 3.53 | %(c) | 34 | % | ||||||||||||||||
| $ | — | (e) | $ | 15.76 | 5.07 | % | $ | 11 | 2.31 | %(c) | 7.32 | %(c) | 2.20 | %(c) | 34 | % | ||||||||||||||||
| $ | — | (e) | $ | 15.82 | 5.47 | % | $ | 469 | 1.56 | %(c) | 6.47 | %(c) | 2.99 | %(c) | 34 | % | ||||||||||||||||
| $ | — | (e) | $ | 15.82 | 5.47 | % | $ | 11 | 1.41 | %(c) | 6.32 | %(c) | 3.11 | %(c) | 34 | % | ||||||||||||||||
| $ | — | (e) | $ | 15.83 | 5.55 | % | $ | 6,035 | 1.31 | %(c) | 6.08 | %(c) | 3.82 | %(c) | 34 | % | ||||||||||||||||
| (c) | Annualized. |
| (d) | Ratio of expenses to average net assets net of reimbursement/recoupment offset was 1.63%, 0.91%, and 1.38% for the period ended November 30, 2009 and the years ended March 31, 2009 and March 31, 2008, respectively. |
| (e) | Less than $(0.01) per share. |
| (f) | Does not include expenses of the investment companies in which the Fund invests. |
| See accompanying Notes to Financial Statements | | May 31, 2013 | | Semiannual Report | 213 |
Table of Contents
Financial Highlights (cont’d)
For a Share Outstanding for the Period ended:
| Net Asset Value, Beginning of Period | Net Investment Income (a) | Net Realized and Change in Unrealized Gain (Loss) | Total from Investment Operations | Dividends from Net Investment Income | Distributions from Net Realized Capital Gains | |||||||||||||||||||||
| AllianzGI NFJ Global Dividend Value: | ||||||||||||||||||||||||||
| Class A | ||||||||||||||||||||||||||
5/31/2013+ | $ | 18.27 | $ | 0.36 | $ | 2.23 | $ | 2.59 | $ | (0.28 | ) | $ | (0.02 | ) | ||||||||||||
11/30/2012 | 17.35 | 0.56 | 1.10 | 1.66 | (0.40 | ) | (0.34 | ) | ||||||||||||||||||
11/30/2011 | 17.91 | 0.55 | (0.19 | ) | 0.36 | (0.64 | ) | (0.28 | ) | |||||||||||||||||
11/30/2010 | 18.16 | 0.43 | 0.38 | 0.81 | (0.71 | ) | (0.35 | ) | ||||||||||||||||||
6/26/2009* - 11/30/2009 | 15.00 | 0.15 | 3.04 | 3.19 | (0.03 | ) | — | |||||||||||||||||||
| Class C | ||||||||||||||||||||||||||
5/31/2013+ | $ | 18.05 | $ | 0.28 | $ | 2.21 | $ | 2.49 | $ | (0.20 | ) | $ | (0.02 | ) | ||||||||||||
11/30/2012 | 17.19 | 0.42 | 1.07 | 1.49 | (0.29 | ) | (0.34 | ) | ||||||||||||||||||
11/30/2011 | 17.76 | 0.43 | (0.20 | ) | 0.23 | (0.52 | ) | (0.28 | ) | |||||||||||||||||
11/30/2010 | 18.12 | 0.28 | 0.41 | 0.69 | (0.70 | ) | (0.35 | ) | ||||||||||||||||||
6/26/2009* - 11/30/2009 | 15.00 | 0.10 | 3.02 | 3.12 | — | (d) | — | |||||||||||||||||||
| Class D | ||||||||||||||||||||||||||
5/31/2013+ | $ | 18.44 | $ | 0.36 | $ | 2.25 | $ | 2.61 | $ | (0.27 | ) | $ | (0.02 | ) | ||||||||||||
11/30/2012 | 17.38 | 0.60 | 1.05 | 1.65 | (0.25 | ) | (0.34 | ) | ||||||||||||||||||
11/30/2011 | 17.86 | 0.61 | (0.23 | ) | 0.38 | (0.58 | ) | (0.28 | ) | |||||||||||||||||
11/30/2010 | 18.17 | 0.43 | 0.37 | 0.80 | (0.76 | ) | (0.35 | ) | ||||||||||||||||||
6/26/2009* - 11/30/2009 | 15.00 | 0.15 | 3.04 | 3.19 | (0.02 | ) | — | |||||||||||||||||||
| Class P | ||||||||||||||||||||||||||
5/31/2013+ | $ | 18.36 | $ | 0.38 | $ | 2.25 | $ | 2.63 | $ | (0.29 | ) | $ | (0.02 | ) | ||||||||||||
11/30/2012 | 17.45 | 0.60 | 1.10 | 1.70 | (0.45 | ) | (0.34 | ) | ||||||||||||||||||
11/30/2011 | 17.82 | 0.42 | (0.02 | ) | 0.40 | (0.49 | ) | (0.28 | ) | |||||||||||||||||
11/30/2010 | 18.17 | 0.46 | 0.38 | 0.84 | (0.84 | ) | (0.35 | ) | ||||||||||||||||||
6/26/2009* - 11/30/2009 | 15.00 | 0.16 | 3.04 | 3.20 | (0.03 | ) | — | |||||||||||||||||||
| Institutional Class | ||||||||||||||||||||||||||
5/31/2013+ | $ | 18.18 | $ | 0.39 | $ | 2.22 | $ | 2.61 | $ | (0.30 | ) | $ | (0.02 | ) | ||||||||||||
11/30/2012 | 17.29 | 0.60 | 1.09 | 1.69 | (0.46 | ) | (0.34 | ) | ||||||||||||||||||
11/30/2011 | 17.83 | 0.64 | (0.21 | ) | 0.43 | (0.69 | ) | (0.28 | ) | |||||||||||||||||
11/30/2010 | 18.17 | 0.41 | 0.46 | 0.87 | (0.86 | ) | (0.35 | ) | ||||||||||||||||||
6/26/2009* - 11/30/2009 | 15.00 | 0.17 | 3.03 | 3.20 | (0.03 | ) | — | |||||||||||||||||||
| AllianzGI NFJ International Small-Cap Value: | ||||||||||||||||||||||||||
| Class A | ||||||||||||||||||||||||||
5/31/2013+ | $ | 17.10 | $ | 0.21 | $ | 1.84 | $ | 2.05 | $ | (0.28 | ) | $ | (0.09 | ) | ||||||||||||
6/1/2012* - 11/30/2012 | 15.00 | 0.07 | 2.03 | 2.10 | — | — | ||||||||||||||||||||
| Class C | ||||||||||||||||||||||||||
5/31/2013+ | $ | 17.04 | $ | 0.19 | $ | 1.80 | $ | 1.99 | $ | (0.10 | ) | $ | (0.09 | ) | ||||||||||||
6/1/2012* - 11/30/2012 | 15.00 | 0.09 | 1.95 | 2.04 | — | — | ||||||||||||||||||||
| Class D | ||||||||||||||||||||||||||
5/31/2013+ | $ | 17.11 | $ | 0.24 | $ | 1.81 | $ | 2.05 | $ | (0.29 | ) | $ | (0.09 | ) | ||||||||||||
6/1/2012* - 11/30/2012 | 15.00 | 0.13 | 1.98 | 2.11 | — | — | ||||||||||||||||||||
| Class P | ||||||||||||||||||||||||||
5/31/2013+ | $ | 17.11 | $ | 0.22 | $ | 1.86 | $ | 2.08 | $ | (0.19 | ) | $ | (0.09 | ) | ||||||||||||
6/1/2012* - 11/30/2012 | 15.00 | 0.16 | 1.95 | 2.11 | — | — | ||||||||||||||||||||
| Institutional Class | ||||||||||||||||||||||||||
5/31/2013+ | $ | 17.12 | $ | 0.25 | $ | 1.84 | $ | 2.09 | $ | (0.20 | ) | $ | (0.09 | ) | ||||||||||||
6/1/2012* - 11/30/2012 | 15.00 | 0.17 | 1.95 | 2.12 | — | — | ||||||||||||||||||||
| + | unaudited |
| * | Commencement of operations. |
| (a) | Calculated on average shares outstanding during the period. |
| (b) | Total return is calculated assuming a purchase of a share on the first day of the period and a sale of a share on the last day of each period reported. Dividends and distributions, if any, are assumed, for purposes of this calculation, to be reinvested. Total return does not reflect sales charges and includes the effect of fee waivers and reimbursements. Total return may reflect adjustments to conform to generally accepted accounting principles. Total return for a period of less than one year is not annualized. |
| 214 | Semiannual Report | | May 31, 2013 | | See accompanying Notes to Financial Statements |
Table of Contents
| Total Dividends and Distributions | Net Asset Value, End of Period | Total Return (b) | Net Assets, End of Period (000s) | Ratio of Expenses to Average Net Assets with Fee Waiver/ Reimbursement | Ratio of Expenses to Average Net Assets without Fee Waiver/ Reimbursement | Ratio of Net Investment Income to Average Net Assets | Portfolio Turnover Rate | |||||||||||||||||||||||||
| $ | (0.30 | ) | $ | 20.56 | 14.29 | % | $ | 9,669 | 1.22 | %(c) | 1.44 | %(c) | 3.71 | %(c) | 17 | % | ||||||||||||||||
| (0.74 | ) | 18.27 | 9.98 | 7,355 | 1.32 | 1.71 | 3.13 | 41 | ||||||||||||||||||||||||
| (0.92 | ) | 17.35 | 1.85 | 6,821 | 1.50 | 1.92 | 3.01 | 66 | ||||||||||||||||||||||||
| (1.06 | ) | 17.91 | 4.71 | 1,469 | 1.50 | 4.55 | 2.41 | 40 | ||||||||||||||||||||||||
| (0.03 | ) | 18.16 | 21.24 | 282 | 1.50 | (c) | 9.11 | (c) | 2.04 | (c) | 22 | |||||||||||||||||||||
| $ | (0.22 | ) | $ | 20.32 | 13.88 | % | $ | 4,500 | 2.01 | %(c) | 2.20 | %(c) | 2.92 | %(c) | 17 | % | ||||||||||||||||
| (0.63 | ) | 18.05 | 9.03 | 3,948 | 2.07 | 2.46 | 2.34 | 41 | ||||||||||||||||||||||||
| (0.80 | ) | 17.19 | 1.12 | 3,020 | 2.25 | 2.71 | 2.39 | 66 | ||||||||||||||||||||||||
| (1.05 | ) | 17.76 | 3.99 | 1,210 | 2.25 | 5.11 | 1.57 | 40 | ||||||||||||||||||||||||
| — | (d) | 18.12 | 20.80 | 89 | 2.25 | (c) | 9.86 | (c) | 1.29 | (c) | 22 | |||||||||||||||||||||
| $ | (0.29 | ) | $ | 20.76 | 14.25 | % | $ | 593 | 1.32 | %(c) | 1.59 | %(c) | 3.60 | %(c) | 17 | % | ||||||||||||||||
| (0.59 | ) | 18.44 | 9.83 | 480 | 1.38 | 3.04 | 3.31 | 41 | ||||||||||||||||||||||||
| (0.86 | ) | 17.38 | 1.91 | 558 | 1.50 | 3.74 | 3.27 | 66 | ||||||||||||||||||||||||
| (1.11 | ) | 17.86 | 4.68 | 203 | 1.50 | 4.53 | 2.44 | 40 | ||||||||||||||||||||||||
| (0.02 | ) | 18.17 | 21.27 | 35 | 1.50 | (c) | 9.11 | (c) | 2.04 | (c) | 22 | |||||||||||||||||||||
| $ | (0.31 | ) | $ | 20.68 | 14.44 | % | $ | 1,350 | 1.07 | %(c) | 1.26 | %(c) | 3.85 | %(c) | 17 | % | ||||||||||||||||
| (0.79 | ) | 18.36 | 10.11 | 1,089 | 1.12 | 1.51 | 3.32 | 41 | ||||||||||||||||||||||||
| (0.77 | ) | 17.45 | 2.13 | 718 | 1.30 | 1.99 | 2.41 | 66 | ||||||||||||||||||||||||
| (1.19 | ) | 17.82 | 4.90 | 13 | 1.30 | 4.45 | 2.63 | 40 | ||||||||||||||||||||||||
| (0.03 | ) | 18.17 | 21.31 | 12 | 1.30 | (c) | 8.96 | (c) | 2.24 | (c) | 22 | |||||||||||||||||||||
| $ | (0.32 | ) | $ | 20.47 | 14.51 | % | $ | 53,757 | 0.97 | %(c) | 1.16 | %(c) | 3.97 | %(c) | 17 | % | ||||||||||||||||
| (0.80 | ) | 18.18 | 10.19 | 39,215 | 1.02 | 1.40 | 3.38 | 41 | ||||||||||||||||||||||||
| (0.97 | ) | 17.29 | 2.21 | 20,556 | 1.20 | 1.68 | 3.51 | 66 | ||||||||||||||||||||||||
| (1.21 | ) | 17.83 | 5.07 | 15,211 | 1.20 | 3.40 | 2.32 | 40 | ||||||||||||||||||||||||
| (0.03 | ) | 18.17 | 21.34 | 2,986 | 1.20 | (c) | 8.86 | (c) | 2.34 | (c) | 22 | |||||||||||||||||||||
| $ | (0.37 | ) | $ | 18.78 | 12.17 | % | $ | 1,239 | 1.46 | %(c) | 5.02 | %(c) | 2.27 | %(c) | 21 | % | ||||||||||||||||
| — | 17.10 | 14.00 | 1,049 | 1.45 | (c) | 4.22 | (c) | 0.82 | (c) | 19 | ||||||||||||||||||||||
| $ | (0.19 | ) | $ | 18.84 | 11.77 | % | $ | 28 | 2.21 | %(c) | 5.87 | %(c) | 2.04 | %(c) | 21 | % | ||||||||||||||||
| — | 17.04 | 13.60 | 11 | 2.20 | (c) | 9.92 | (c) | 1.08 | (c) | 19 | ||||||||||||||||||||||
| $ | (0.38 | ) | $ | 18.78 | 12.15 | % | $ | 754 | 1.46 | %(c) | 5.22 | %(c) | 2.66 | %(c) | 21 | % | ||||||||||||||||
| — | 17.11 | 14.07 | 84 | 1.45 | (c) | 7.85 | (c) | 1.59 | (c) | 19 | ||||||||||||||||||||||
| $ | (0.28 | ) | $ | 18.91 | 12.26 | % | $ | 13 | 1.31 | %(c) | 4.77 | %(c) | 2.39 | %(c) | 21 | % | ||||||||||||||||
| — | 17.11 | 14.07 | 12 | 1.30 | (c) | 8.92 | (c) | 1.98 | (c) | 19 | ||||||||||||||||||||||
| $ | (0.29 | ) | $ | 18.92 | 12.33 | % | $ | 6,429 | 1.21 | %(c) | 4.85 | %(c) | 2.75 | %(c) | 21 | % | ||||||||||||||||
| — | 17.12 | 14.13 | 3,551 | 1.20 | (c) | 8.90 | (c) | 2.08 | (c) | 19 | ||||||||||||||||||||||
| (c) | Annualized. |
| (d) | Less than $(0.01) per share. |
| See accompanying Notes to Financial Statements | | May 31, 2013 | | Semiannual Report | 215 |
Table of Contents
Financial Highlights (cont’d)
For a Share Outstanding for the Period ended:
| Net Asset Value, Beginning of Period | Net Investment Income (Loss) (a) | Net Realized and Change in Unrealized Gain (Loss) | Total from Investment Operations | Dividends from Net Investment Income | Distributions from Net Realized Capital Gains | |||||||||||||||||||||
| AllianzGI NFJ International Value II: | ||||||||||||||||||||||||||
| Class A | ||||||||||||||||||||||||||
5/31/2013+ | $ | 16.36 | $ | 0.22 | $ | 1.05 | $ | 1.27 | $ | (0.22 | ) | $ | (0.02 | ) | ||||||||||||
12/1/2011* - 11/30/2012 | 15.00 | 0.29 | 1.33 | 1.62 | (0.26 | ) | — | |||||||||||||||||||
| Class C | ||||||||||||||||||||||||||
5/31/2013+ | $ | 16.32 | $ | 0.16 | $ | 1.04 | $ | 1.20 | $ | (0.17 | ) | $ | (0.02 | ) | ||||||||||||
12/1/2011* - 11/30/2012 | 15.00 | 0.22 | 1.28 | 1.50 | (0.18 | ) | — | |||||||||||||||||||
| Class D | ||||||||||||||||||||||||||
5/31/2013+ | $ | 16.36 | $ | 0.21 | $ | 1.06 | $ | 1.27 | $ | (0.20 | ) | $ | (0.02 | ) | ||||||||||||
12/1/2011* - 11/30/2012 | 15.00 | 0.34 | 1.28 | 1.62 | (0.26 | ) | — | |||||||||||||||||||
| Class P | ||||||||||||||||||||||||||
5/31/2013+ | $ | 16.38 | $ | 0.22 | $ | 1.07 | $ | 1.29 | $ | (0.21 | ) | $ | (0.02 | ) | ||||||||||||
12/1/2011* - 11/30/2012 | 15.00 | 0.38 | 1.28 | 1.66 | (0.28 | ) | — | |||||||||||||||||||
| Institutional Class | ||||||||||||||||||||||||||
5/31/2013+ | $ | 16.38 | $ | 0.21 | $ | 1.10 | $ | 1.31 | $ | (0.22 | ) | $ | (0.02 | ) | ||||||||||||
12/1/2011* - 11/30/2012 | 15.00 | 0.39 | 1.29 | 1.68 | (0.30 | ) | — | |||||||||||||||||||
| AllianzGI Redwood: | ||||||||||||||||||||||||||
| Class A | ||||||||||||||||||||||||||
5/31/2013+ | $ | 15.18 | $ | 0.03 | $ | 0.49 | $ | 0.52 | $ | — | (d) | $ | — | |||||||||||||
11/30/2012 | 14.46 | — | (d) | 0.72 | 0.72 | — | — | |||||||||||||||||||
12/27/2010* - 11/30/2011 | 15.00 | (0.07 | ) | (0.47 | ) | (0.54 | ) | — | — | |||||||||||||||||
| Class C | ||||||||||||||||||||||||||
5/31/2013+ | $ | 14.95 | $ | (0.06 | ) | $ | 0.50 | $ | 0.44 | $ | (0.03 | ) | $ | — | ||||||||||||
11/30/2012 | 14.36 | (0.13 | ) | 0.72 | 0.59 | — | — | |||||||||||||||||||
12/27/2010* - 11/30/2011 | 15.00 | (0.20 | ) | (0.44 | ) | (0.64 | ) | — | — | |||||||||||||||||
| Class D | ||||||||||||||||||||||||||
5/31/2013+ | $ | 15.17 | $ | — | (e) | $ | 0.50 | $ | 0.50 | $ | — | (d) | $ | — | ||||||||||||
11/30/2012 | 14.46 | (0.03 | ) | 0.74 | 0.71 | — | — | |||||||||||||||||||
12/27/2010* - 11/30/2011 | 15.00 | (0.08 | ) | (0.46 | ) | (0.54 | ) | — | — | |||||||||||||||||
| Class P | ||||||||||||||||||||||||||
5/31/2013+ | $ | 15.24 | $ | 0.02 | $ | 0.51 | $ | 0.53 | $ | (0.08 | ) | $ | — | |||||||||||||
11/30/2012 | 14.49 | 0.02 | 0.73 | 0.75 | — | — | ||||||||||||||||||||
12/27/2010* - 11/30/2011 | 15.00 | (0.01 | ) | (0.50 | ) | (0.51 | ) | — | — | |||||||||||||||||
| Institutional Class | ||||||||||||||||||||||||||
5/31/2013+ | $ | 15.27 | $ | 0.03 | $ | 0.50 | $ | 0.53 | $ | (0.09 | ) | $ | — | |||||||||||||
11/30/2012 | 14.50 | 0.03 | 0.74 | 0.77 | — | — | ||||||||||||||||||||
12/27/2010* - 11/30/2011 | 15.00 | (0.03 | ) | (0.47 | ) | (0.50 | ) | — | — | |||||||||||||||||
| + | unaudited |
| * | Commencement of operations. |
| (a) | Calculated on average shares outstanding during the period. |
| (b) | Total return is calculated assuming a purchase of a share on the first day of the period and a sale of a share on the last day of each period reported. Dividends and distributions, if any, are assumed, for purposes of this calculation, to be reinvested. Total return does not reflect sales charges and includes the effect of fee waivers and reimbursements. Total return may reflect adjustments to conform to generally accepted accounting principles. Total return for a period of less than one year is not annualized. |
| 216 | Semiannual Report | | May 31, 2013 | | See accompanying Notes to Financial Statements |
Table of Contents
| Total Dividends and Distributions | Net Asset Value, End of Period | Total Return (b) | Net Assets, End of Period (000s) | Ratio of Expenses to Average Net Assets with Fee Waiver/ Reimbursement | Ratio of Expenses to Average Net Assets without Fee Waiver/ Reimbursement | Ratio of Net Investment Income (Loss) to Average Net Assets | Portfolio Turnover Rate | |||||||||||||||||||||||||
| $ | (0.24 | ) | $ | 17.39 | 7.85 | % | $ | 69 | 1.26 | %(c) | 6.70 | %(c) | 2.63 | %(c) | 11 | % | ||||||||||||||||
| (0.26 | ) | 16.36 | 10.99 | 49 | 1.30 | (c) | 10.98 | (c) | 1.89 | (c) | 22 | |||||||||||||||||||||
| $ | (0.19 | ) | $ | 17.33 | 7.42 | % | $ | 16 | 2.01 | %(c) | 7.50 | %(c) | 1.94 | %(c) | 11 | % | ||||||||||||||||
| (0.18 | ) | 16.32 | 10.17 | 11 | 2.05 | (c) | 10.82 | (c) | 1.45 | (c) | 22 | |||||||||||||||||||||
| $ | (0.22 | ) | $ | 17.41 | 7.84 | % | $ | 12 | 1.27 | %(c) | 6.64 | %(c) | 2.40 | %(c) | 11 | % | ||||||||||||||||
| (0.26 | ) | 16.36 | 10.97 | 11 | 1.30 | (c) | 10.07 | (c) | 2.20 | (c) | 22 | |||||||||||||||||||||
| $ | (0.23 | ) | $ | 17.44 | 7.96 | % | $ | 12 | 1.05 | %(c) | 6.49 | %(c) | 2.61 | %(c) | 11 | % | ||||||||||||||||
| (0.28 | ) | 16.38 | 11.28 | 11 | 1.05 | (c) | 9.92 | (c) | 2.45 | (c) | 22 | |||||||||||||||||||||
| $ | (0.24 | ) | $ | 17.45 | 8.05 | % | $ | 3,778 | 0.95 | %(c) | 6.35 | %(c) | 2.47 | %(c) | 11 | % | ||||||||||||||||
| (0.30 | ) | 16.38 | 11.36 | 4,396 | 0.95 | (c) | 9.93 | (c) | 2.50 | (c) | 22 | |||||||||||||||||||||
| $ | — | (d) | $ | 15.70 | 3.43 | % | $ | 1,056 | 1.60 | %(c) | 3.96 | %(c) | 0.42 | %(c) | 29 | % | ||||||||||||||||
| — | 15.18 | 4.98 | 1,791 | 1.64 | 3.57 | (0.02 | ) | 88 | ||||||||||||||||||||||||
| — | 14.46 | (3.60 | ) | 1,414 | 1.75 | (c) | 4.87 | (c) | (0.49 | )(c) | 107 | |||||||||||||||||||||
| $ | (0.03 | ) | $ | 15.36 | 2.96 | % | $ | 52 | 2.50 | %(c) | 4.80 | %(c) | (0.75 | )%(c) | 29 | % | ||||||||||||||||
| — | 14.95 | 4.11 | 50 | 2.50 | 4.50 | (0.87 | ) | 88 | ||||||||||||||||||||||||
| — | 14.36 | (4.27 | ) | 46 | 2.50 | (c) | 5.77 | (c) | (1.42 | )(c) | 107 | |||||||||||||||||||||
| $ | — | (d) | $ | 15.67 | 3.30 | % | $ | 82 | 1.75 | %(c) | 7.61 | %(c) | 0.05 | %(c) | 29 | % | ||||||||||||||||
| — | 15.17 | 4.91 | 88 | 1.75 | 10.67 | (0.22 | ) | 88 | ||||||||||||||||||||||||
| — | 14.46 | (3.60 | ) | 467 | 1.75 | (c) | 5.92 | (c) | (0.58 | )(c) | 107 | |||||||||||||||||||||
| $ | (0.08 | ) | $ | 15.69 | 3.47 | % | $ | 136 | 1.50 | %(c) | 3.83 | %(c) | 0.26 | %(c) | 29 | % | ||||||||||||||||
| — | 15.24 | 5.18 | 138 | 1.50 | 3.48 | 0.15 | 88 | |||||||||||||||||||||||||
| — | 14.49 | (3.40 | ) | 167 | 1.50 | (c) | 5.23 | (c) | (0.07 | )(c) | 107 | |||||||||||||||||||||
| $ | (0.09 | ) | $ | 15.71 | 3.51 | % | $ | 6,187 | 1.40 | %(c) | 3.70 | %(c) | 0.45 | %(c) | 29 | % | ||||||||||||||||
| — | 15.27 | 5.31 | 7,888 | 1.40 | 3.30 | 0.22 | 88 | |||||||||||||||||||||||||
| — | 14.50 | (3.33 | ) | 7,392 | 1.40 | (c) | 4.69 | (c) | (0.22 | )(c) | 107 | |||||||||||||||||||||
| (c) | Annualized. |
| (d) | Less than $(0.01) per share. |
| (e) | Less than $0.01 per share. |
| See accompanying Notes to Financial Statements | | May 31, 2013 | | Semiannual Report | 217 |
Table of Contents
Financial Highlights (cont’d)
For a Share Outstanding for the Period ended:
| Net Asset Value, Beginning of Period | Net Investment Income (Loss) (a) | Net Realized and Change in Unrealized Gain (Loss) | Total from Investment Operations | Dividends from Net Investment Income | Distributions from Net Realized Capital Gains | |||||||||||||||||||||
| AllianzGI Short Duration High Income: | ||||||||||||||||||||||||||
| Class A | ||||||||||||||||||||||||||
5/31/2013+ | $ | 15.97 | $ | 0.32 | $ | 0.04 | $ | 0.36 | $ | (0.37 | ) | $ | (0.01 | ) | ||||||||||||
11/30/2012 | 15.32 | 0.64 | 0.68 | 1.32 | (0.67 | ) | — | |||||||||||||||||||
10/3/2011* - 11/30/2011 | 15.00 | 0.12 | 0.25 | 0.37 | (0.05 | ) | — | |||||||||||||||||||
| Class C | ||||||||||||||||||||||||||
5/31/2013+ | $ | 15.94 | $ | 0.30 | $ | 0.04 | $ | 0.34 | $ | (0.35 | ) | $ | (0.01 | ) | ||||||||||||
11/30/2012 | 15.31 | 0.58 | 0.64 | 1.22 | (0.59 | ) | — | |||||||||||||||||||
10/3/2011* - 11/30/2011 | 15.00 | 0.10 | 0.25 | 0.35 | (0.04 | ) | — | |||||||||||||||||||
| Class D | ||||||||||||||||||||||||||
5/31/2013+ | $ | 15.97 | $ | 0.32 | $ | 0.04 | $ | 0.36 | $ | (0.37 | ) | $ | (0.01 | ) | ||||||||||||
11/30/2012 | 15.32 | 0.65 | 0.67 | 1.32 | (0.67 | ) | — | |||||||||||||||||||
10/3/2011* - 11/30/2011 | 15.00 | 0.12 | 0.25 | 0.37 | (0.05 | ) | — | |||||||||||||||||||
| Class P | ||||||||||||||||||||||||||
5/31/2013+ | $ | 15.96 | $ | 0.33 | $ | 0.04 | $ | 0.37 | $ | (0.38 | ) | $ | (0.01 | ) | ||||||||||||
11/30/2012 | 15.32 | 0.66 | 0.68 | 1.34 | (0.70 | ) | — | |||||||||||||||||||
10/3/2011* - 11/30/2011 | 15.00 | 0.10 | 0.28 | 0.38 | (0.06 | ) | — | |||||||||||||||||||
| Institutional Class | ||||||||||||||||||||||||||
5/31/2013+ | $ | 15.99 | $ | 0.34 | $ | 0.03 | $ | 0.37 | $ | (0.39 | ) | $ | (0.01 | ) | ||||||||||||
11/30/2012 | 15.32 | 0.70 | 0.67 | 1.37 | (0.70 | ) | — | |||||||||||||||||||
10/3/2011* - 11/30/2011 | 15.00 | 0.11 | 0.27 | 0.38 | (0.06 | ) | — | |||||||||||||||||||
| AllianzGI Structured Alpha: | ||||||||||||||||||||||||||
| Class A | ||||||||||||||||||||||||||
12/3/2012* - 5/31/2013+ | $ | 15.00 | $ | (0.13 | ) | $ | 0.33 | $ | 0.20 | $ | — | $ | — | |||||||||||||
| Class C | ||||||||||||||||||||||||||
12/3/2012* - 5/31/2013+ | $ | 15.00 | $ | (0.19 | ) | $ | 0.34 | $ | 0.15 | $ | — | $ | — | |||||||||||||
| Class D | ||||||||||||||||||||||||||
12/3/2012* - 5/31/2013+ | $ | 15.00 | $ | (0.13 | ) | $ | 0.33 | $ | 0.20 | $ | — | $ | — | |||||||||||||
| Class P | ||||||||||||||||||||||||||
12/3/2012* - 5/31/2013+ | $ | 15.00 | $ | (0.12 | ) | $ | 0.33 | $ | 0.21 | $ | — | $ | — | |||||||||||||
| Institutional Class | ||||||||||||||||||||||||||
12/3/2012* - 5/31/2013+ | $ | 15.00 | $ | (0.11 | ) | $ | 0.33 | $ | 0.22 | $ | — | $ | — | |||||||||||||
| AllianzGI Ultra Micro Cap: | ||||||||||||||||||||||||||
| Class A | ||||||||||||||||||||||||||
5/31/2013+ | $ | 15.53 | $ | (0.12 | ) | $ | 4.31 | $ | 4.19 | $ | — | $ | — | |||||||||||||
12/19/2011* - 11/30/2012 | 12.82 | (0.14 | ) | 2.85 | 2.71 | — | — | |||||||||||||||||||
| Class P | ||||||||||||||||||||||||||
5/31/2013+ | $ | 15.54 | $ | (0.09 | ) | $ | 4.30 | $ | 4.21 | $ | — | $ | — | |||||||||||||
11/30/2012 | 13.26 | (0.20 | ) | 2.71 | 2.51 | — | (0.23 | ) | ||||||||||||||||||
12/27/2010* - 11/30/2011 | 13.80 | (0.29 | ) | (0.22 | ) | (0.51 | ) | — | (0.03 | ) | ||||||||||||||||
| Institutional Class | ||||||||||||||||||||||||||
5/31/2013+ | $ | 15.59 | $ | (0.10 | ) | $ | 4.33 | $ | 4.23 | $ | — | $ | — | |||||||||||||
11/30/2012 | 13.29 | (0.19 | ) | 2.72 | 2.53 | — | (0.23 | ) | ||||||||||||||||||
11/30/2011 | 13.25 | (0.29 | ) | 1.08 | 0.79 | — | (0.75 | ) | ||||||||||||||||||
11/30/2010 | 8.93 | (0.22 | ) | 4.54 | 4.32 | — | — | |||||||||||||||||||
4/1/2009** - 11/30/2009 | 5.78 | (0.10 | ) | 3.25 | 3.15 | — | — | |||||||||||||||||||
3/31/2009 | 9.28 | (0.16 | ) | (3.34 | ) | (3.50 | ) | — | — | |||||||||||||||||
1/28/2008* - 3/31/2008 | 10.00 | (0.03 | ) | (0.69 | ) | (0.72 | ) | — | — | |||||||||||||||||
| + | unaudited |
| * | Commencement of operations. |
| ** | On November 13, 2009, the Board of Trustees approved a change in the Fund’s fiscal year from March 31 to November 30. |
| (a) | Calculated on average shares outstanding during the period. |
| 218 | Semiannual Report | | May 31, 2013 | | See accompanying Notes to Financial Statements |
Table of Contents
| Total Dividends and Distributions | Net Asset Value, End of Period | Total Return (b) | Net Assets, End of Period (000s) | Ratio of Expenses to Average Net Assets with Fee Waiver/ Reimbursement | Ratio of Expenses to Average Net Assets without Fee Waiver/ Reimbursement | Ratio of Net Investment Income (Loss) to Average Net Assets | Portfolio Turnover Rate | |||||||||||||||||||||||||
| $ | (0.38 | ) | $ | 15.95 | 2.24 | % | $ | 144,566 | 0.85 | %(c) | 0.87 | %(c) | 4.05 | %(c) | 39 | % | ||||||||||||||||
| (0.67 | ) | 15.97 | 8.78 | 80,995 | 0.89 | 1.09 | 4.09 | 51 | ||||||||||||||||||||||||
| (0.05 | ) | 15.32 | 2.50 | 532 | 0.95 | (c) | 2.99 | (c) | 4.97 | (c) | 10 | |||||||||||||||||||||
| $ | (0.36 | ) | $ | 15.92 | 2.13 | % | $ | 47,403 | 1.10 | %(c) | 1.12 | %(c) | 3.81 | %(c) | 39 | % | ||||||||||||||||
| (0.59 | ) | 15.94 | 8.18 | 28,567 | 1.29 | 1.50 | 3.73 | 51 | ||||||||||||||||||||||||
| (0.04 | ) | 15.31 | 2.36 | 1,245 | 1.70 | (c) | 3.72 | (c) | 4.26 | (c) | 10 | |||||||||||||||||||||
| $ | (0.38 | ) | $ | 15.95 | 2.24 | % | $ | 15,366 | 0.85 | %(c) | 0.91 | %(c) | 4.06 | %(c) | 39 | % | ||||||||||||||||
| (0.67 | ) | 15.97 | 8.78 | 10,018 | 0.90 | 1.18 | 4.16 | 51 | ||||||||||||||||||||||||
| (0.05 | ) | 15.32 | 2.50 | 65 | 0.95 | (c) | 2.88 | (c) | 4.95 | (c) | 10 | |||||||||||||||||||||
| $ | (0.39 | ) | $ | 15.94 | 2.32 | % | $ | 101,817 | 0.70 | %(c) | 0.70 | %(c) | 4.21 | %(c) | 39 | % | ||||||||||||||||
| (0.70 | ) | 15.96 | 8.91 | 52,932 | 0.70 | 0.92 | 4.24 | 51 | ||||||||||||||||||||||||
| (0.06 | ) | 15.32 | 2.50 | 10 | 0.70 | (c) | 2.84 | (c) | 4.22 | (c) | 10 | |||||||||||||||||||||
| $ | (0.40 | ) | $ | 15.96 | 2.31 | % | $ | 123,019 | 0.60 | %(c) | 0.61 | %(c) | 4.30 | %(c) | 39 | % | ||||||||||||||||
| (0.70 | ) | 15.99 | 9.13 | 38,247 | 0.60 | 0.89 | 4.48 | 51 | ||||||||||||||||||||||||
| (0.06 | ) | 15.32 | 2.52 | 8,055 | 0.60 | (c) | 2.72 | (c) | 4.58 | (c) | 10 | |||||||||||||||||||||
| $ | — | $ | 15.20 | 1.33 | % | $ | 10 | 1.90 | %(c) | 4.94 | %(c) | (1.81 | )%(c) | N/A | ||||||||||||||||||
| $ | — | $ | 15.15 | 1.00 | % | $ | 10 | 2.65 | %(c) | 5.70 | %(c) | (2.56 | )%(c) | N/A | ||||||||||||||||||
| $ | — | $ | 15.20 | 1.33 | % | $ | 817 | 1.90 | %(c) | 5.09 | %(c) | (1.79 | )%(c) | N/A | ||||||||||||||||||
| $ | — | $ | 15.21 | 1.40 | % | $ | 10 | 1.75 | %(c) | 4.68 | %(c) | (1.65 | )%(c) | N/A | ||||||||||||||||||
| $ | — | $ | 15.22 | 1.47 | % | $ | 7,417 | 1.65 | %(c) | 4.67 | %(c) | (1.55 | )%(c) | N/A | ||||||||||||||||||
| $ | — | $ | 19.72 | 26.98 | % | $ | 19,251 | 2.27 | %(c) | 2.42 | %(c) | (1.38 | )%(c) | 39 | % | |||||||||||||||||
| — | 15.53 | 21.14 | 6,862 | 2.36 | (c) | 3.36 | (c) | (0.96 | )(c) | 114 | ||||||||||||||||||||||
| $ | — | $ | 19.75 | 27.09 | % | $ | 390 | 2.04 | %(c) | 2.26 | %(c) | (1.01 | )%(c) | 39 | % | |||||||||||||||||
| (0.23 | ) | 15.54 | 19.26 | 252 | 2.18 | 3.08 | (1.38 | ) | 114 | |||||||||||||||||||||||
| (0.03 | ) | 13.26 | (3.64 | ) | 230 | 2.41 | (c) | 3.48 | (c) | (2.23 | )(c) | 101 | ||||||||||||||||||||
| $ | — | $ | 19.82 | 27.13 | % | $ | 23,012 | 2.00 | %(c) | 2.27 | %(c) | (1.15 | )%(c) | 39 | % | |||||||||||||||||
| (0.23 | ) | 15.59 | 19.37 | 9,296 | 2.08 | 3.15 | (1.32 | ) | 114 | |||||||||||||||||||||||
| (0.75 | ) | 13.29 | 6.04 | 9,757 | 2.24 | 3.53 | (2.06 | ) | 101 | |||||||||||||||||||||||
| — | 13.25 | 48.38 | 4,629 | 2.29 | 5.40 | (1.99 | ) | 123 | ||||||||||||||||||||||||
| — | 8.93 | 54.50 | 1,781 | 2.31 | (c) | 2.31 | (c)(d) | (1.81 | )(c) | 87 | ||||||||||||||||||||||
| — | 5.78 | (37.72 | ) | 1,084 | 2.40 | 2.40 | (d) | (2.05 | ) | 109 | ||||||||||||||||||||||
| — | 9.28 | (7.20 | ) | 886 | 2.31 | (c) | �� | 2.31 | (c)(d) | (2.10 | )(c) | 19 | ||||||||||||||||||||
| (b) | Total return is calculated assuming a purchase of a share on the first day of the period and a sale of a share on the last day of each period reported. Dividends and distributions, if any, are assumed, for purposes of this calculation, to be reinvested. Total return does not reflect sales charges and includes the effect of fee waivers and reimbursements. Total return may reflect adjustments to conform to generally accepted accounting principles. Total return for a period of less than one year is not annualized. |
| (c) | Annualized. |
| (d) | Ratio of expenses to average net assets net of reimbursement/recoupment offset was 2.22%, 2.31% and 2.15% for the period ended November 30, 2009, the year ended March 31, 2009 and the period ended March 31, 2008, respectively. |
| See accompanying Notes to Financial Statements | | May 31, 2013 | | Semiannual Report | 219 |
Table of Contents
Financial Highlights (cont’d)
For a Share Outstanding for the Period ended:
| Net Asset Value, Beginning of Period | Net Investment Income (Loss) (a) | Net Realized | Total from Investment Operations | Distributions from Net Realized Capital Gains | ||||||||||||||||||
| AllianzGI U.S. Emerging Growth: | ||||||||||||||||||||||
| Class A | ||||||||||||||||||||||
5/31/2013+ | $ | 13.25 | $ | (0.04 | ) | $ | 2.95 | $ | 2.91 | $ | (0.26 | ) | ||||||||||
11/30/2012 | 13.34 | (0.08 | ) | 0.98 | 0.90 | (0.99 | ) | |||||||||||||||
12/20/2010* - 11/30/2011 | 13.77 | (0.11 | ) | (0.32 | ) | (0.43 | ) | — | ||||||||||||||
| Class C | ||||||||||||||||||||||
5/31/2013+ | $ | 13.07 | $ | (0.09 | ) | $ | 2.90 | $ | 2.81 | $ | (0.26 | ) | ||||||||||
11/30/2012 | 13.25 | (0.18 | ) | 0.99 | 0.81 | (0.99 | ) | |||||||||||||||
12/20/2010* - 11/30/2011 | 13.77 | (0.22 | ) | (0.30 | ) | (0.52 | ) | — | ||||||||||||||
| Class D | ||||||||||||||||||||||
5/31/2013+ | $ | 13.25 | $ | (0.03 | ) | $ | 2.95 | $ | 2.92 | $ | (0.26 | ) | ||||||||||
11/30/2012 | 13.34 | (0.09 | ) | 0.99 | 0.90 | (0.99 | ) | |||||||||||||||
12/20/2010* - 11/30/2011 | 13.77 | (0.11 | ) | (0.32 | ) | (0.43 | ) | — | ||||||||||||||
| Class R | ||||||||||||||||||||||
5/31/2013+ | $ | 13.19 | $ | (0.04 | ) | $ | 2.93 | $ | 2.89 | $ | (0.26 | ) | ||||||||||
11/30/2012 | 13.31 | (0.11 | ) | 0.98 | 0.87 | (0.99 | ) | |||||||||||||||
12/20/2010* - 11/30/2011 | 13.77 | (0.15 | ) | (0.31 | ) | (0.46 | ) | — | ||||||||||||||
| Class P | ||||||||||||||||||||||
5/31/2013+ | $ | 13.32 | $ | (0.02 | ) | $ | 2.97 | $ | 2.95 | $ | (0.26 | ) | ||||||||||
11/30/2012 | 13.37 | (0.04 | ) | 0.98 | 0.94 | (0.99 | ) | |||||||||||||||
12/20/2010* - 11/30/2011 | 13.77 | (0.09 | ) | (0.31 | ) | (0.40 | ) | — | ||||||||||||||
| Institutional Class | ||||||||||||||||||||||
5/31/2013+ | $ | 13.35 | $ | (0.01 | ) | $ | 2.97 | $ | 2.96 | $ | (0.26 | ) | ||||||||||
11/30/2012 | 13.39 | (0.04 | ) | 0.99 | 0.95 | (0.99 | ) | |||||||||||||||
11/30/2011 | 12.84 | (0.07 | ) | 0.62 | 0.55 | — | ||||||||||||||||
11/30/2010 | 10.05 | (0.06 | ) | 2.85 | 2.79 | — | ||||||||||||||||
4/1/2009** - 11/30/2009 | 6.59 | (0.03 | ) | 3.49 | 3.46 | — | ||||||||||||||||
3/31/2009 | 11.45 | (0.04 | ) | (4.82 | ) | (4.86 | ) | — | ||||||||||||||
3/31/2008 | 13.09 | (0.06 | ) | (0.70 | ) | (0.76 | ) | (0.88 | ) | |||||||||||||
| AllianzGI U.S. Equity Hedged: | ||||||||||||||||||||||
| Class A | ||||||||||||||||||||||
12/3/2012* - 5/31/2013+ | $ | 15.00 | $ | 0.07 | $ | 1.22 | $ | 1.29 | $ | — | ||||||||||||
| Class C | ||||||||||||||||||||||
12/3/2012* - 5/31/2013+ | $ | 15.00 | $ | 0.01 | $ | 1.23 | $ | 1.24 | $ | — | ||||||||||||
| Class D | ||||||||||||||||||||||
12/3/2012* - 5/31/2013+ | $ | 15.00 | $ | 0.06 | $ | 1.23 | $ | 1.29 | $ | — | ||||||||||||
| Class P | ||||||||||||||||||||||
12/3/2012* - 5/31/2013+ | $ | 15.00 | $ | 0.08 | $ | 1.23 | $ | 1.31 | $ | — | ||||||||||||
| Institutional Class | ||||||||||||||||||||||
12/3/2012* - 5/31/2013+ | $ | 15.00 | $ | 0.09 | $ | 1.23 | $ | 1.32 | $ | — | ||||||||||||
| + | unaudited |
| * | Commencement of operations. |
| ** | On November 13, 2009, the Board of Trustees approved a change in the Fund’s fiscal year from March 31 to November 30. |
| (a) | Calculated on average shares outstanding during the period. |
| 220 | Semiannual Report | | May 31, 2013 | | See accompanying Notes to Financial Statements |
Table of Contents
| Total Dividends and Distributions | Net Asset Value, End of Period | Total Return (b) | Net Assets, End of Period (000s) | Ratio of Expenses to Average Net Assets with Fee Waiver/ Reimbursement | Ratio of Expenses to Average Net Assets without Fee Waiver/ Reimbursement | Ratio of Net Investment Income (Loss) to Average Net Assets | Portfolio Turnover Rate | |||||||||||||||||||||||||
| $ | (0.26 | ) | $ | 15.90 | 22.40 | % | $ | 3,192 | 1.50 | %(c) | 2.19 | %(c) | (0.58 | )%(c) | 34 | % | ||||||||||||||||
| (0.99 | ) | 13.25 | 7.67 | 1,359 | 1.50 | 2.45 | (0.59 | ) | 92 | |||||||||||||||||||||||
| — | 13.34 | (3.12 | ) | 837 | 1.50 | (c) | 2.70 | (c) | (0.92 | )(c) | 111 | |||||||||||||||||||||
| $ | (0.26 | ) | $ | 15.62 | 21.93 | % | $ | 323 | 2.21 | %(c) | 2.88 | %(c) | (1.26 | )%(c) | 34 | % | ||||||||||||||||
| (0.99 | ) | 13.07 | 6.99 | 228 | 2.22 | 3.16 | (1.35 | ) | 92 | |||||||||||||||||||||||
| — | 13.25 | (3.78 | ) | 134 | 2.25 | (c) | 3.04 | (c) | (1.60 | )(c) | 111 | |||||||||||||||||||||
| $ | (0.26 | ) | $ | 15.91 | 22.47 | % | $ | 68 | 1.46 | %(c) | 2.11 | %(c) | (0.44 | )%(c) | 34 | % | ||||||||||||||||
| (0.99 | ) | 13.25 | 7.67 | 57 | 1.49 | 2.36 | (0.65 | ) | 92 | |||||||||||||||||||||||
| — | 13.34 | (3.12 | ) | 27 | 1.50 | (c) | 2.31 | (c) | (0.86 | )(c) | 111 | |||||||||||||||||||||
| $ | (0.26 | ) | $ | 15.82 | 22.34 | % | $ | 20 | 1.67 | %(c) | 2.35 | %(c) | (0.62 | )%(c) | 34 | % | ||||||||||||||||
| (0.99 | ) | 13.19 | 7.44 | 10 | 1.70 | 2.60 | (0.84 | ) | 92 | |||||||||||||||||||||||
| — | 13.31 | (3.34 | ) | 10 | 1.75 | (c) | 2.50 | (c) | (1.14 | )(c) | 111 | |||||||||||||||||||||
| $ | (0.26 | ) | $ | 16.01 | 22.58 | % | $ | 34 | 1.25 | %(c) | 1.95 | %(c) | (0.30 | )%(c) | 34 | % | ||||||||||||||||
| (0.99 | ) | 13.32 | 7.97 | 19 | 1.25 | 2.25 | (0.27 | ) | 92 | |||||||||||||||||||||||
| — | 13.37 | (2.90 | ) | 15 | 1.25 | (c) | 2.13 | (c) | (0.65 | )(c) | 111 | |||||||||||||||||||||
| $ | (0.26 | ) | $ | 16.05 | 22.60 | % | $ | 26,032 | 1.15 | %(c) | 1.85 | %(c) | (0.12 | )%(c) | 34 | % | ||||||||||||||||
| (0.99 | ) | 13.35 | 8.05 | 20,140 | 1.15 | 2.09 | (0.29 | ) | 92 | |||||||||||||||||||||||
| — | 13.39 | 4.28 | 20,862 | 1.15 | 1.99 | (0.53 | ) | 111 | ||||||||||||||||||||||||
| — | 12.84 | 27.76 | 20,079 | 1.19 | 1.71 | (0.57 | ) | 168 | ||||||||||||||||||||||||
| — | 10.05 | 52.50 | 13,942 | 1.18 | (c) | 1.18 | (c)(d) | (0.53 | )(c) | 97 | ||||||||||||||||||||||
| — | 6.59 | (42.45 | ) | 6,591 | 1.21 | 1.21 | (d) | (0.34 | ) | 146 | ||||||||||||||||||||||
| (0.88 | ) | 11.45 | (7.01 | ) | 7,499 | 1.21 | 1.21 | (d) | (0.46 | ) | 129 | |||||||||||||||||||||
| $ | — | $ | 16.29 | 8.60 | % | $ | 200 | 1.26 | %(c) | 9.15 | %(c) | 0.97 | %(c) | 5 | % | |||||||||||||||||
| $ | — | $ | 16.24 | 8.27 | % | $ | 11 | 2.01 | %(c) | 8.70 | %(c) | 0.16 | %(c) | 5 | % | |||||||||||||||||
| $ | — | $ | 16.29 | 8.60 | % | $ | 215 | 1.26 | %(c) | 8.88 | %(c) | 0.82 | %(c) | 5 | % | |||||||||||||||||
| $ | — | $ | 16.31 | 8.73 | % | $ | 11 | 1.11 | %(c) | 7.70 | %(c) | 1.06 | %(c) | 5 | % | |||||||||||||||||
| $ | — | $ | 16.32 | 8.80 | % | $ | 3,672 | 1.01 | %(c) | 7.70 | %(c) | 1.16 | %(c) | 5 | % | |||||||||||||||||
| (b) | Total return is calculated assuming a purchase of a share on the first day of the period and a sale of a share on the last day of each period reported. Dividends and distributions, if any, are assumed, for purposes of this calculation, to be reinvested. Total return does not reflect sales charges and includes the effect of fee waivers and reimbursements. Total return may reflect adjustments to conform to generally accepted accounting principles. Total return for a period of less than one year is not annualized. |
| (c) | Annualized. |
| (d) | Ratio of expenses to average net assets net of reimbursement/recoupment offset was 1.16%, 0.90% and 0.72% for the period ended November 30, 2009, and the years ended March 31, 2009 and March 31, 2008, respectively. |
| See accompanying Notes to Financial Statements | | May 31, 2013 | | Semiannual Report | 221 |
Table of Contents
May 31, 2013 (Unaudited)
| 1. | ORGANIZATION AND SIGNIFICANT ACCOUNTING POLICIES |
Allianz Funds Multi-Strategy Trust (the “Trust”) was organized on January 10, 2008, as an open-end registered investment management company organized as a Massachusetts business trust. As of May 31, 2013, the trust currently consists of thirty-three separate investment funds, (each a “Fund” and collectively the “Funds”). Allianz Global Investors Fund Management LLC (the “Investment Manager”) serves as the Funds’ investment manager and the Funds’ sub-advisers are Allianz Global Investors U.S. LLC (“AGI U.S.”) and NFJ Investment Group LLC (“NFJ”), each an affiliate of the Investment Manager, and Fuller & Thaler Asset Management, Inc. (“Fuller & Thaler”) (collectively the “Sub-Advisers”). The Investment Manager, AGI U.S. and NFJ are indirect, wholly-owned subsidiaries of Allianz Asset Management of America L.P. (“AAM”). AAM is an indirect, wholly-owned subsidiary of Allianz SE, a publicly traded European insurance and financial services company. Currently, the Trust may offer up to eight classes of shares: A, C, D, P, R, R6, Administrative and Institutional. As of November 1, 2009, Class B shares were no longer available for purchase, except through exchanges and dividend reinvestments.
The following Funds sold and issued shares of beneficial interest to AAM during the period or six months ended May 31, 2013 and the year ended November 30, 2012:
| AllianzGI Retirement 2025/AllianzGI Retirement 2035/AllianzGI Retirement 2045/AllianzGI Retirement 2055 | ||||||||||||
| Class | Date | Shares | Amount | |||||||||
A | 12/19/11 | 667 | $ | 10,000 | ||||||||
R | 12/19/11 | 666 | 10,000 | |||||||||
P | 12/19/11 | 667 | 10,000 | |||||||||
R6 | 12/19/11 | 200,000 | 3,000,000 | |||||||||
Administrative | 12/19/11 | 667 | 10,000 | |||||||||
| 202,667 | $ | 3,040,000 | ||||||||||
| AllianzGI Dynamic Emerging Multi-Asset | ||||||||||||
| Class | Date | Shares | Amount | |||||||||
A | 12/17/12 | 667 | $ | 10,000 | ||||||||
C | 12/17/12 | 667 | 10,000 | |||||||||
D | 12/17/12 | 666 | 10,000 | |||||||||
P | 12/17/12 | 667 | 10,000 | |||||||||
Institutional | 12/17/12 | 333,333 | 5,000,000 | |||||||||
| 336,000 | $ | 5,040,000 | ||||||||||
| AllianzGI Global Managed Volatility | ||||||||||||
| Class | Date | Shares | Amount | |||||||||
A | 12/19/11 | 666 | $ | 10,000 | ||||||||
C | 12/19/11 | 667 | 10,000 | |||||||||
D | 12/19/11 | 667 | 10,000 | |||||||||
P | 12/19/11 | 667 | 10,000 | |||||||||
Institutional | 12/19/11 | 133,333 | 2,000,000 | |||||||||
| 136,000 | $ | 2,040,000 | ||||||||||
| AllianzGI Micro Cap | ||||||||||||
| Class | Date | Shares | Amount | |||||||||
A | 12/19/11 | 1,016 | $ | 10,000 | ||||||||
| AllianzGI Multi-Asset Real Return | ||||||||||||
| Class | Date | Shares | Amount | |||||||||
A | 12/17/12 | 666 | $ | 10,000 | ||||||||
C | 12/17/12 | 667 | 10,000 | |||||||||
D | 12/17/12 | 667 | 10,000 | |||||||||
P | 12/17/12 | 667 | 10,000 | |||||||||
Institutional | 12/17/12 | 333,333 | 5,000,000 | |||||||||
| 336,000 | $ | 5,040,000 | ||||||||||
| AllianzGI NFJ Emerging Markets Value | ||||||||||||
| Class | Date | Shares | Amount | |||||||||
A | 12/18/12 | 667 | $ | 10,000 | ||||||||
C | 12/18/12 | 667 | 10,000 | |||||||||
D | 12/18/12 | 666 | 10,000 | |||||||||
P | 12/18/12 | 667 | 10,000 | |||||||||
Institutional | 12/18/12 | 200,000 | 3,000,000 | |||||||||
| 202,667 | $ | 3,040,000 | ||||||||||
| AllianzGI NFJ International Small-Cap Value | ||||||||||||
| Class | Date | Shares | Amount | |||||||||
A | 6/1/12 | 667 | $ | 10,000 | ||||||||
C | 6/1/12 | 667 | 10,000 | |||||||||
D | 6/1/12 | 667 | 10,000 | |||||||||
P | 6/1/12 | 666 | 10,000 | |||||||||
Institutional | 6/1/12 | 200,000 | 3,000,000 | |||||||||
| 202,667 | $ | 3,040,000 | ||||||||||
| AllianzGI NFJ International Value II | ||||||||||||
| Class | Date | Shares | Amount | |||||||||
A | 12/1/11 | 667 | $ | 10,000 | ||||||||
C | 12/1/11 | 667 | 10,000 | |||||||||
D | 12/1/11 | 667 | 10,000 | |||||||||
P | 12/1/11 | 666 | 10,000 | |||||||||
Institutional | 12/1/11 | 200,000 | 3,000,000 | |||||||||
| 202,667 | $ | 3,040,000 | ||||||||||
| AllianzGI Structured Alpha | ||||||||||||
| Class | Date | Shares | Amount | |||||||||
A | 12/3/12 | 667 | $ | 10,000 | ||||||||
C | 12/3/12 | 667 | 10,000 | |||||||||
D | 12/3/12 | 666 | 10,000 | |||||||||
P | 12/3/12 | 667 | 10,000 | |||||||||
Institutional | 12/3/12 | 400,000 | 6,000,000 | |||||||||
| 402,667 | $ | 6,040,000 | ||||||||||
| 222 | May 31, 2013 | | Semiannual Report |
Table of Contents
| AllianzGI Ultra Micro Cap | ||||||||||||
| Class | Date | Shares | Amount | |||||||||
A | 12/19/11 | 780 | $ | 10,000 | ||||||||
| AllianzGI U.S. Equity Hedged | ||||||||||||
| Class | Date | Shares | Amount | |||||||||
A | 12/3/12 | 667 | $ | 10,000 | ||||||||
C | 12/3/12 | 667 | 10,000 | |||||||||
D | 12/3/12 | 666 | 10,000 | |||||||||
P | 12/3/12 | 667 | 10,000 | |||||||||
Institutional | 12/3/12 | 200,000 | 3,000,000 | |||||||||
| 202,667 | $ | 3,040,000 | ||||||||||
On March 1, 2013 AAM transferred all shares of beneficial interest held in the Funds to Allianz Fund Investments, Inc. (“AFI”), an indirect, wholly-owned subsidiary of Allianz SE.
The investment objective of each of AllianzGI Retirement 2015, AllianzGI Retirement 2020, AllianzGI Retirement 2025, AllianzGI Retirement 2030, AllianzGI Retirement 2035, AllianzGI Retirement 2040, AllianzGI Retirement 2045, AllianzGI Retirement 2050 and AllianzGI Retirement 2055 is to seek capital growth and preservation consistent with its asset allocation as the target date in the Fund name approaches, and thereafter current income, and secondarily, capital appreciation. AllianzGI Retirement Income’s investment objective is to seek current income and secondarily, capital appreciation. AllianzGI Global Allocation’s investment objective is to seek after-inflation capital appreciation and current income. The investment objective of AllianzGI Global Growth Allocation is to seek after-inflation capital appreciation and, secondarily, current income. AllianzGI Convertible’s investment objective is to seek maximum total return, consisting of capital appreciation and current income. The investment objective of AllianzGI Behavioral Advantage Large Cap, AllianzGI China Equity, AllianzGI Disciplined Equity, AllianzGI Dynamic Emerging Multi-Asset, AllianzGI Global Managed Volatility, AllianzGI Global Water, AllianzGI NFJ Emerging Markets Value, AllianzGI NFJ International Small-Cap Value and AllianzGI NFJ International Value II is to seek long-term capital appreciation. AllianzGI High Yield Bond’s investment objective is to seek a high level of current income and capital growth. The investment objective of AllianzGI Short Duration High Income is to seek a high level of current income. The investment objective of AllianzGI International Small-Cap, AllianzGI Micro Cap, AllianzGI Ultra Micro Cap and AllianzGI U.S. Emerging Growth is to seek maximum long-term capital appreciation. AllianzGI NFJ Global Dividend Value’s investment objective is to seek long-term growth of capital and income. The investment objective of AllianzGI Redwood is to seek long-term capital appreciation with a high degree of downside protection and reduced volatility relative to the broad U.S. equity market. The investment objective of AllianzGI Multi-Asset Real Return is to seek long-term capital appreciation emphasizing inflation-adjusted returns. The investment objective of AllianzGI Structured Alpha is to seek to generate attractive risk-adjusted absolute returns through a complete market cycle. The investment objective of AllianzGI U.S. Equity Hedged is to seek capital appreciation, with
added emphasis on the protection of capital during unfavorable market conditions. There can be no assurance that the Funds will meet their stated objectives.
The preparation of the Funds’ financial statements in accordance with accounting principles generally accepted in the United States of America requires the Funds’ management to make estimates and assumptions that affect the reported amounts and disclosures in each Fund’s financial statements. Actual results could differ from those estimates.
In the normal course of business, the Funds enter into contracts that contain a variety of representations that provide general indemnifications. The Funds’ maximum exposure under these arrangements is unknown as this would involve future claims that may be made against the Funds that have not yet occurred.
In December 2011, the Financial Accounting Standards Board issued Accounting Standards Update (“ASU”) No. 2011-11, “Disclosures About Offsetting Assets and Liabilities”, as amended in January 2013 by the issued ASU No. 2013-01, which requires enhanced disclosures that will enable users to evaluate the effect or potential effect of netting arrangements on an entity’s financial position, including the effect or potential effect of rights of setoff associated with certain financial instruments and derivative instruments. The amendments are effective for fiscal years beginning on or after January 1, 2013. Funds’ management is currently evaluating the effect that the guidance may have on the Funds’ financial statements.
The following is a summary of significant accounting policies consistently followed by the Funds:
(a) Valuation of Investments. Portfolio securities and other financial instruments for which market quotations are readily available are stated at market value. Market value is generally determined on the basis of last reported sales prices, or if no sales are reported, on the basis of quotes obtained from a quotation reporting system, established market makers, or independent pricing services. Investments in underlying funds are valued at the closing net asset value per share of each underlying fund as reported on each business day. The Funds’ investments are valued daily using prices supplied by an independent pricing service or dealer quotations, or by using the last sale price on the exchange that is the primary market for such securities, or the mean between the last quoted bid and ask price. The market value for NASDAQ National Market and Small Cap Securities may also be calculated using the NASDAQ Official Closing Price instead of the last reported sales price. Independent pricing services use information provided by market makers or estimates of market values obtained from yield data relating to investments or securities with similar characteristics. Exchange traded futures are valued at the price determined by the relevant exchange. Securities purchased on a when-issued or delayed-delivery basis are marked to market daily until settlement at the forward settlement date.
The Board of Trustees (the “Board”) has adopted procedures for valuing portfolio securities and other financial derivative instruments
| Semiannual Report | | May 31, 2013 | 223 |
Table of Contents
Notes to Financial Statements (cont’d)
May 31, 2013 (Unaudited)
in circumstances where market quotes are not readily available, and has delegated the responsibility for applying the valuation methods to the Investment Manager and the Sub-Advisers. The Trust’s Valuation Committee was established by the Board to oversee the implementation of the Funds’ valuation methods and to make fair value determinations on behalf of the Board, as instructed. Each Sub-Adviser monitors the continued appropriateness of methods applied and determines if adjustments should be made in light of market changes, events affecting the issuer, or other factors. If the Sub-Advisers determine that a valuation method may no longer be appropriate, another valuation method may be selected, or the Valuation Committee will be convened to consider the matter and take any appropriate action in accordance with procedures set forth by the Board. The Board shall review the appropriateness of the valuation methods and these methods may be amended or supplemented from time to time by the Valuation Committee.
Short-term securities maturing in 60 days or less are valued at amortized cost, if their original term to maturity was 60 days or less, or by amortizing their value on the 61st day prior to maturity, if the original term to maturity exceeded 60 days.
Investments initially valued in currencies other than the U.S. dollar are converted to the U.S. dollar using exchange rates obtained from pricing services. As a result, the net asset value (“NAV”) of each share class of a Fund may be affected by changes in the value of currencies in relation to the U.S. dollar. The value of securities traded in markets outside the United States or denominated in currencies other than the U.S. dollar may be affected significantly on a day that the New York Stock Exchange (“NYSE”) is closed.
The prices used by the Funds to value investments may differ from the value that would be realized if the investments were sold, and these differences could be material to the Funds’ financial statements. The NAV of each share class of a Fund is normally determined as of the close of regular trading (normally, 4:00 p.m. Eastern time) on the NYSE on each day the NYSE is open for business.
The prices of certain portfolio securities or financial instruments may be determined at a time prior to the close of regular trading on the NYSE. When fair-valuing the securities, the Funds may, among other things, consider significant events (which may be considered to include changes in the value of U.S. securities or securities indices) that occur after the close of the relevant market and before the time the NAV of each share class of a Fund is calculated. With respect to certain foreign securities, the Funds may fair-value securities using modeling tools provided by third-party vendors. The Funds have retained a statistical research service to assist in determining the fair value of foreign securities. This service utilizes statistics and programs based on historical performance of markets and other economic data to assist in making fair value estimates. Fair value estimates used by the Funds for foreign securities may differ from the value realized from the sale of those securities and the difference could be material to the financial statements. Fair value pricing may require subjective determinations about the value of a security or other assets, and fair
values used to determine the NAV of each share class of a Fund may differ from quoted or published prices, or from prices that are used by others, for the same investments. In addition, the use of fair value pricing may not always result in adjustments to the prices of securities or other assets held by a Fund.
(b) Fair Value Measurements. Fair value is defined as the price that would be received to sell an asset or paid to transfer a liability (i.e. the “exit price”) in an orderly transaction between market participants. The three levels of the fair value hierarchy are described below:
| n | Level 1—quoted prices in active markets for identical investments that the Funds have the ability to access |
| n | Level 2—valuations based on other significant observable inputs, which may include, but are not limited to, quoted prices for similar assets or liabilities, interest rates, yield curves, volatilities, prepayment speeds, loss severities, credit risks and default rates or other market corroborated inputs |
| n | Level 3—valuations based on significant unobservable inputs (including the Sub-Advisers’ or Valuation Committee’s own assumptions and securities whose price was determined by using a single broker’s quote) |
The inputs or methodology used for valuing securities are not necessarily an indication of the risk associated with investing in those securities. The following are certain inputs and techniques that the Funds generally use to evaluate how to classify each major category of assets and liabilities for Level 2 and Level 3, in accordance with Generally Accepted Accounting Principles (“GAAP”).
Equity Securities (Common and Preferred Stock)—Equity securities traded in inactive markets and certain foreign equity securities are valued using inputs which include broker-dealer quotes, recently executed transactions adjusted for changes in the benchmark index, or evaluated price quotes received from independent pricing services that take into account the integrity of the market sector and issuer, the individual characteristics of the security, and information received from broker-dealers and other market sources pertaining to the issuer or security. To the extent that these inputs are observable, the values of equity securities are categorized as Level 2. To the extent that these inputs are unobservable, the values are categorized as Level 3.
U.S. Treasury Obligations—U.S. Treasury obligations are valued by independent pricing services based on pricing models that evaluate the mean between the most recently quoted bid and ask prices. The models also take into consideration data received from active market makers and broker-dealers, yield curves, and the spread over comparable U.S. Treasury issues. The spreads change daily in response to market conditions and are generally obtained from the new issue market and broker-dealer sources. To the extent that these inputs are observable, the values of U.S. Treasury obligations are categorized as Level 2. To the extent that these inputs are unobservable, the values are categorized as Level 3.
Corporate Bonds & Notes—Corporate bonds & notes are generally comprised of two main categories: investment grade bonds and high yield bonds. Investment grade bonds are valued by independent
| 224 | May 31, 2013 | | Semiannual Report |
Table of Contents
pricing services using various inputs and techniques, which include broker-dealer quotations, live trading levels, recently executed transactions in securities of the issuer or comparable issuers, and option adjusted spread models that include base curve and spread curve inputs. Adjustments to individual bonds can be applied to recognize trading differences compared to other bonds issued by the same issuer. High yield bonds are valued by independent pricing services based primarily on broker-dealer quotations from relevant market makers and recently executed transactions in securities of the issuer or comparable issuers. The broker-dealer quotations received are supported by credit analysis of the issuer that takes into consideration credit quality assessments, daily trading activity, and the activity of the underlying equities, listed bonds and sector-specific trends. To the extent that these inputs are observable, the values of corporate bonds & notes are categorized as Level 2. To the extent that these inputs are unobservable, the values are categorized as Level 3.
Convertible Bonds—Convertible bonds are valued by independent pricing services based on various inputs and techniques, which include broker-dealer quotations from relevant market makers and recently executed transactions in securities of the issuer or comparable issuers. The broker-dealer quotations received are supported by credit analysis of the issuer that takes into consideration credit quality assessments, daily trading activity, and the activity of the underlying equities, listed bonds and sector-specific trends. To the extent that these inputs are observable, the values of convertible bonds are categorized as Level 2. To the extent that these inputs are unobservable, the values are categorized as Level 3.
Option Contracts—Option contracts traded over-the-counter (“OTC”) and FLexible EXchange (“FLEX”) options are valued by independent pricing services based on pricing models that incorporate various inputs such as interest rates, credit spreads, currency exchange rates and volatility measurements for in-the-money, at-the-money, and out-of-the-money contracts based on a given strike price. To the extent that these inputs are observable, the values of OTC and FLEX
option contracts are categorized as Level 2. To the extent that these inputs are unobservable, the values are categorized as Level 3.
Forward Foreign Currency Contracts—Forward foreign currency contracts are valued by independent pricing services using various inputs and techniques, which include broker-dealer quotations, actual trading information and foreign currency exchange rates gathered from leading market makers and foreign currency exchange trading centers throughout the world. To the extent that these inputs are observable, the values of forward foreign currency contracts are categorized as Level 2. To the extent that these inputs are unobservable, the values are categorized as Level 3.
Senior Loans—Senior Loans are valued by independent pricing services based on the average of quoted prices received from multiple dealers or valued relative to other benchmark securities when broker-dealer quotes are unavailable. These quoted prices are based on interest rates, yield curves, option adjusted spreads and credit spreads. To the extent that these inputs are observable, the values of Senior Loans are categorized as Level 2. To the extent that these inputs are unobservable, the values are categorized as Level 3.
The valuation techniques used by the Funds to measure fair value during the period or six months ended May 31, 2013 were intended to maximize the use of observable inputs and to minimize the use of unobservable inputs.
The Funds’ policy is to recognize transfers between levels at the end of the reporting period. An investment asset’s or liability’s level within the fair value hierarchy is based on the lowest level input, individually or in aggregate, that is significant to the fair value measurement. The objective of fair value measurement remains the same even when there is a significant decrease in the volume and level of activity for an asset or liability and regardless of the valuation techniques used. Investments categorized as Level 1 or 2 as of period end may have been transferred between Levels 1 and 2 since the prior period due to changes in the valuation method utilized in valuing the investments.
A summary of the inputs used at May 31, 2013 in valuing each Fund’s assets and liabilities is listed below (refer to the Schedules of Investments and Notes 7(a), 7(b) and 7(c) for more detailed information on Investments in Securities and Other Financial Instruments):
| AllianzGI Retirement 2015: | ||||||||||||||||
| Investments in Securities – Assets | Level 1– Quoted Prices | Level 2– Other Significant Observable Inputs | Level 3– Significant Unobservable Inputs | Value at 5/31/13 | ||||||||||||
Mutual Funds | $ | 23,818,238 | — | — | $ | 23,818,238 | ||||||||||
| AllianzGI Retirement 2020: | ||||||||||||||||
| Investments in Securities – Assets | Level 1– Quoted Prices | Level 2– Other Significant Observable Inputs | Level 3– Significant Unobservable Inputs | Value at 5/31/13 | ||||||||||||
Mutual Funds | $ | 34,035,741 | — | — | $ | 34,035,741 | ||||||||||
| Semiannual Report | | May 31, 2013 | 225 |
Table of Contents
Notes to Financial Statements (cont’d)
May 31, 2013 (Unaudited)
| AllianzGI Retirement 2025: | ||||||||||||||||
| Investments in Securities – Assets | Level 1– Quoted Prices | Level 2– Other Significant Observable Inputs | Level 3– Significant Unobservable Inputs | Value at 5/31/13 | ||||||||||||
Mutual Funds | $ | 32,733,540 | — | — | $ | 32,733,540 | ||||||||||
Repurchase Agreements | — | $ | 279,000 | — | 279,000 | |||||||||||
Totals | $ | 32,733,540 | $ | 279,000 | — | $ | 33,012,540 | |||||||||
| AllianzGI Retirement 2030: | ||||||||||||||||
| Investments in Securities – Assets | Level 1– Quoted Prices | Level 2– Other Significant Observable Inputs | Level 3– Significant Unobservable Inputs | Value at 5/31/13 | ||||||||||||
Mutual Funds | $ | 39,628,175 | — | — | $ | 39,628,175 | ||||||||||
Repurchase Agreements | — | $ | 267,000 | — | 267,000 | |||||||||||
Totals | $ | 39,628,175 | $ | 267,000 | — | $ | 39,895,175 | |||||||||
| AllianzGI Retirement 2035: | ||||||||||||||||
| Investments in Securities – Assets | Level 1– Quoted Prices | Level 2– Other Significant Observable Inputs | Level 3– Significant Unobservable Inputs | Value at 5/31/13 | ||||||||||||
Mutual Funds | $ | 26,331,290 | — | — | $ | 26,331,290 | ||||||||||
Exchange-Traded Funds | 256,600 | — | — | 256,600 | ||||||||||||
Totals | $ | 26,587,890 | — | — | $ | 26,587,890 | ||||||||||
| AllianzGI Retirement 2040: | ||||||||||||||||
| Investments in Securities – Assets | Level 1– Quoted Prices | Level 2– Other Significant Observable Inputs | Level 3– Significant Unobservable Inputs | Value at 5/31/13 | ||||||||||||
Mutual Funds | $ | 24,278,320 | — | — | $ | 24,278,320 | ||||||||||
Exchange-Traded Funds | 352,465 | — | — | 352,465 | ||||||||||||
Repurchase Agreements | — | $ | 125,000 | — | 125,000 | |||||||||||
Totals | $ | 24,630,785 | $ | 125,000 | — | $ | 24,755,785 | |||||||||
| AllianzGI Retirement 2045: | ||||||||||||||||
| Investments in Securities – Assets | Level 1– Quoted Prices | Level 2– Other Significant Observable Inputs | Level 3– Significant Unobservable Inputs | Value at 5/31/13 | ||||||||||||
Mutual Funds | $ | 10,792,606 | — | — | $ | 10,792,606 | ||||||||||
Exchange-Traded Funds | 154,276 | — | — | 154,276 | ||||||||||||
Totals | $ | 10,946,882 | — | — | $ | 10,946,882 | ||||||||||
| AllianzGI Retirement 2050: | ||||||||||||||||
| Investments in Securities – Assets | Level 1– Quoted Prices | Level 2– Other Significant Observable Inputs | Level 3– Significant Unobservable Inputs | Value at 5/31/13 | ||||||||||||
Mutual Funds | $ | 11,328,000 | — | — | $ | 11,328,000 | ||||||||||
Exchange-Traded Funds | 162,523 | — | — | 162,523 | ||||||||||||
Totals | $ | 11,490,523 | — | — | $ | 11,490,523 | ||||||||||
| 226 | May 31, 2013 | | Semiannual Report |
Table of Contents
| AllianzGI Retirement 2055: | ||||||||||||||||
| Investments in Securities – Assets | Level 1– Quoted Prices | Level 2– Other Significant Observable Inputs | Level 3– Significant Unobservable Inputs | Value at 5/31/13 | ||||||||||||
Mutual Funds | $ | 4,183,304 | — | — | $ | 4,183,304 | ||||||||||
Exchange-Traded Funds | 59,855 | — | — | 59,855 | ||||||||||||
Totals | $ | 4,243,159 | — | — | $ | 4,243,159 | ||||||||||
| AllianzGI Retirement Income: | ||||||||||||||||
| Investments in Securities – Assets | Level 1– Quoted Prices | Level 2– Other Significant Observable Inputs | Level 3– Significant Unobservable Inputs | Value at 5/31/13 | ||||||||||||
Mutual Funds | $ | 30,870,371 | — | — | $ | 30,870,371 | ||||||||||
Repurchase Agreements | — | $ | 297,000 | — | 297,000 | |||||||||||
Totals | $ | 30,870,371 | $ | 297,000 | — | $ | 31,167,371 | |||||||||
| AllianzGI Global Allocation: | ||||||||||||||||
| Investments in Securities – Assets | Level 1– Quoted Prices | Level 2– Other Significant Observable Inputs | Level 3– Significant Unobservable Inputs | Value at 5/31/13 | ||||||||||||
Mutual Funds | $ | 208,309,184 | — | — | $ | 208,309,184 | ||||||||||
Repurchase Agreements | — | $ | 707,000 | — | 707,000 | |||||||||||
Totals | $ | 208,309,184 | $ | 707,000 | — | $ | 209,016,184 | |||||||||
| AllianzGI Global Growth Allocation: | ||||||||||||||||
| Investments in Securities – Assets | Level 1– Quoted Prices | Level 2– Other Significant Observable Inputs | Level 3– Significant Unobservable Inputs | Value at 5/31/13 | ||||||||||||
Mutual Funds | $ | 8,349,611 | — | — | $ | 8,349,611 | ||||||||||
Exchange-Traded Funds | 114,075 | — | — | 114,075 | ||||||||||||
Totals | $ | 8,463,686 | — | — | $ | 8,463,686 | ||||||||||
| AllianzGI Behavioral Advantage Large Cap: | ||||||||||||||||
| Investments in Securities – Assets | Level 1– Quoted Prices | Level 2– Other Significant Observable Inputs | Level 3– Significant Unobservable Inputs | Value at 5/31/13 | ||||||||||||
Common Stock | $ | 36,593,110 | — | — | $ | 36,593,110 | ||||||||||
Exchange-Traded Funds | 81,620 | — | — | 81,620 | ||||||||||||
Totals | $ | 36,674,730 | — | — | $ | 36,674,730 | ||||||||||
| AllianzGI China Equity: | ||||||||||||||||
| Investments in Securities – Assets | Level 1– Quoted Prices | Level 2– Other Significant Observable Inputs | Level 3– Significant Unobservable Inputs | Value at 5/31/13 | ||||||||||||
Common Stock: | ||||||||||||||||
China | — | $ | 3,491,867 | — | $ | 3,491,867 | ||||||||||
Hong Kong | $ | 98,594 | 308,399 | — | 406,993 | |||||||||||
Exchange-Traded Funds | 126,734 | — | — | 126,734 | ||||||||||||
Repurchase Agreements | — | 107,000 | — | 107,000 | ||||||||||||
Totals | $ | 225,328 | $ | 3,907,266 | — | $ | 4,132,594 | |||||||||
| Semiannual Report | | May 31, 2013 | 227 |
Table of Contents
Notes to Financial Statements (cont’d)
May 31, 2013 (Unaudited)
| AllianzGI Convertible: | ||||||||||||||||
| Investments in Securities – Assets | Level 1– Quoted Prices | Level 2– Other Significant Observable Inputs | Level 3– Significant Unobservable Inputs | Value at 5/31/13 | ||||||||||||
Convertible Bonds | — | $ | 1,309,705,289 | — | $ | 1,309,705,289 | ||||||||||
Convertible Preferred Stock: | ||||||||||||||||
Advertising | — | 8,181,140 | — | 8,181,140 | ||||||||||||
Diversified Financial Services | $ | 21,039,480 | 32,296,370 | — | 53,335,850 | |||||||||||
Oil & Gas | — | 23,753,090 | — | 23,753,090 | ||||||||||||
All Other | 163,433,585 | — | — | 163,433,585 | ||||||||||||
Common Stock | 5,473,762 | — | — | 5,473,762 | ||||||||||||
Repurchase Agreements | — | 53,103,000 | — | 53,103,000 | ||||||||||||
Totals | $ | 189,946,827 | $ | 1,427,038,889 | — | $ | 1,616,985,716 | |||||||||
| AllianzGI Disciplined Equity: | ||||||||||||||||
| Investments in Securities – Assets | Level 1– Quoted Prices | Level 2– Other Significant Observable Inputs | Level 3– Significant Unobservable Inputs | Value at 5/31/13 | ||||||||||||
Common Stock | $ | 51,530,898 | — | — | $ | 51,530,898 | ||||||||||
Repurchase Agreements | — | $ | 1,246,000 | — | 1,246,000 | |||||||||||
Totals | $ | 51,530,898 | $ | 1,246,000 | — | $ | 52,776,898 | |||||||||
| AllianzGI Dynamic Emerging Multi-Asset: | ||||||||||||||||
| Investments in Securities – Assets | Level 1– Quoted Prices | Level 2– Other Significant Observable Inputs | Level 3– Significant Unobservable Inputs | Value at 5/31/13 | ||||||||||||
Mutual Funds | $ | 2,351,602 | — | — | $ | 2,351,602 | ||||||||||
Corporate Bonds & Notes | — | $ | 405,407 | — | 405,407 | |||||||||||
Short-Term Investments | — | 2,605,934 | — | 2,605,934 | ||||||||||||
| 2,351,602 | 3,011,341 | — | 5,362,943 | |||||||||||||
Other Financial Instruments* – Assets | ||||||||||||||||
Market Price | 9,127 | — | — | 9,127 | ||||||||||||
Other Financial Instruments* – Liabilities | ||||||||||||||||
Market Price | (186,315 | ) | — | — | (186,315 | ) | ||||||||||
Totals | $ | 2,174,414 | $ | 3,011,341 | — | $ | 5,185,755 | |||||||||
| AllianzGI Global Managed Volatility: | ||||||||||||||||
| Investments in Securities – Assets | Level 1– Quoted Prices | Level 2– Other Significant Observable Inputs | Level 3– Significant Unobservable Inputs | Value at 5/31/13 | ||||||||||||
Common Stock: | ||||||||||||||||
China | — | $ | 1,126,310 | — | $ | 1,126,310 | ||||||||||
France | — | 51,376 | — | 51,376 | ||||||||||||
Hong Kong | — | 828,842 | — | 828,842 | ||||||||||||
Israel | — | 223,899 | — | 223,899 | ||||||||||||
Japan | — | 1,831,885 | — | 1,831,885 | ||||||||||||
Singapore | — | 438,167 | — | 438,167 | ||||||||||||
Switzerland | — | 261,963 | — | 261,963 | ||||||||||||
United Kingdom | — | 45,997 | — | 45,997 | ||||||||||||
All Other | $ | 10,821,357 | — | — | 10,821,357 | |||||||||||
Repurchase Agreements | — | 486,000 | — | 486,000 | ||||||||||||
Totals | $ | 10,821,357 | $ | 5,294,439 | — | $ | 16,115,796 | |||||||||
| 228 | May 31, 2013 | | Semiannual Report |
Table of Contents
| AllianzGI Global Water: | ||||||||||||||||
| Investments in Securities – Assets | Level 1– Quoted Prices | Level 2– Other Significant Observable Inputs | Level 3– Significant Unobservable Inputs | Value at 5/31/13 | ||||||||||||
Common Stock: | ||||||||||||||||
Austria | — | $ | 7,173,805 | — | $ | 7,173,805 | ||||||||||
China | — | 6,218,748 | — | 6,218,748 | ||||||||||||
France | — | 10,148,074 | — | 10,148,074 | ||||||||||||
Hong Kong | — | 1,893,805 | $ | 41,712 | 1,935,517 | |||||||||||
Israel | — | 3,102,013 | — | 3,102,013 | ||||||||||||
Japan | — | 3,259,433 | — | 3,259,433 | ||||||||||||
Netherlands | — | 3,402,893 | — | 3,402,893 | ||||||||||||
Sweden | — | 5,778,503 | — | 5,778,503 | ||||||||||||
Switzerland | $ | 10,422,070 | 12,521,915 | — | 22,943,985 | |||||||||||
United Kingdom | 9,077,463 | 21,765,947 | — | 30,843,410 | ||||||||||||
All Other | 65,700,575 | — | — | 65,700,575 | ||||||||||||
Repurchase Agreements | — | 12,013,000 | — | 12,013,000 | ||||||||||||
| 85,200,108 | 87,278,136 | 41,712 | 172,519,956 | |||||||||||||
Other Financial Instruments* – Liabilities | ||||||||||||||||
Foreign Exchange Contracts | — | (5,019 | ) | — | (5,019 | ) | ||||||||||
Totals | $ | 85,200,108 | $ | 87,273,117 | $ | 41,712 | $ | 172,514,937 | ||||||||
| AllianzGI High Yield Bond: | ||||||||||||||||
| Investments in Securities – Assets | Level 1– Quoted Prices | Level 2– Other Significant Observable Inputs | Level 3– Significant Unobservable Inputs | Value at 5/31/13 | ||||||||||||
Corporate Bonds & Notes | — | $ | 388,964,876 | — | $ | 388,964,876 | ||||||||||
Repurchase Agreements | — | 5,520,000 | — | 5,520,000 | ||||||||||||
Totals | — | $ | 394,484,876 | — | $ | 394,484,876 | ||||||||||
| AllianzGI International Small-Cap: | ||||||||||||||||
| Investments in Securities – Assets | Level 1– Quoted Prices | Level 2– Other Significant Observable Inputs | Level 3– Significant Unobservable Inputs | Value at 5/31/13 | ||||||||||||
Common Stock: | ||||||||||||||||
Denmark | $ | 1,110,081 | $ | 5,943,691 | — | $ | 7,053,772 | |||||||||
Finland | 1,663,270 | — | — | 1,663,270 | ||||||||||||
France | 2,582,105 | — | — | 2,582,105 | ||||||||||||
Ireland | 1,259,949 | 2,105,557 | — | 3,365,506 | ||||||||||||
Philippines | 888,020 | 1,586,869 | — | 2,474,889 | ||||||||||||
Sweden | 1,188,947 | 3,011,892 | — | 4,200,839 | ||||||||||||
Thailand | — | — | $ | 1,852,317 | 1,852,317 | |||||||||||
All Other | — | 71,989,727 | — | 71,989,727 | ||||||||||||
Repurchase Agreements | — | 1,836,000 | — | 1,836,000 | ||||||||||||
Totals | $ | 8,692,372 | $ | 86,473,736 | $ | 1,852,317 | $ | 97,018,425 | ||||||||
| Semiannual Report | | May 31, 2013 | 229 |
Table of Contents
Notes to Financial Statements (cont’d)
May 31, 2013 (Unaudited)
| AllianzGI Micro Cap: | ||||||||||||||||
| Investments in Securities – Assets | Level 1– Quoted Prices | Level 2– Other Significant Observable Inputs | Level 3– Significant Unobservable Inputs | Value at 5/31/13 | ||||||||||||
Common Stock | $ | 34,704,966 | — | — | $ | 34,704,966 | ||||||||||
Warrants | 996 | — | — | 996 | ||||||||||||
Repurchase Agreements | — | $ | 903,000 | — | 903,000 | |||||||||||
Totals | $ | 34,705,962 | $ | 903,000 | — | $ | 35,608,962 | |||||||||
| AllianzGI Multi-Asset Real Return: | ||||||||||||||||
| Investments in Securities – Assets | Level 1– Quoted Prices | Level 2– Other Significant Observable Inputs | Level 3– Significant Unobservable Inputs | Value at 5/31/13 | ||||||||||||
Mutual Funds | $ | 2,153,665 | — | — | $ | 2,153,665 | ||||||||||
Common Stock: | ||||||||||||||||
Australia | — | $ | 165,119 | — | 165,119 | |||||||||||
Austria | — | 8,265 | — | 8,265 | ||||||||||||
France | — | 75,606 | — | 75,606 | ||||||||||||
Hong Kong | — | 249,653 | — | 249,653 | ||||||||||||
Japan | — | 177,799 | — | 177,799 | ||||||||||||
Netherlands | — | 6,686 | — | 6,686 | ||||||||||||
Singapore | — | 71,814 | — | 71,814 | ||||||||||||
Switzerland | — | 8,271 | — | 8,271 | ||||||||||||
United Kingdom | — | 66,879 | — | 66,879 | ||||||||||||
All Other | 950,715 | — | — | 950,715 | ||||||||||||
U.S. Treasury Obligations | — | 935,632 | — | 935,632 | ||||||||||||
| 3,104,380 | 1,765,724 | — | 4,870,104 | |||||||||||||
Other Financial Instruments* – Assets | ||||||||||||||||
Market Price | 1,630 | — | — | 1,630 | ||||||||||||
Totals | $ | 3,106,010 | $ | 1,765,724 | — | $ | 4,871,734 | |||||||||
| AllianzGI NFJ Emerging Markets Value: | ||||||||||||||||
| Investments in Securities – Assets | Level 1– Quoted Prices | Level 2– Other Significant Observable Inputs | Level 3– Significant Unobservable Inputs | Value at 5/31/13 | ||||||||||||
Common Stock: | ||||||||||||||||
Brazil | $ | 385,855 | — | — | $ | 385,855 | ||||||||||
Chile | 42,690 | — | — | 42,690 | ||||||||||||
China | 48,780 | $ | 1,390,042 | — | 1,438,822 | |||||||||||
Czech Republic | 42,235 | — | — | 42,235 | ||||||||||||
India | 45,314 | — | — | 45,314 | ||||||||||||
Korea (Republic of) | 85,635 | 705,785 | — | 791,420 | ||||||||||||
Mexico | — | — | $ | 39,031 | 39,031 | |||||||||||
Peru | 38,285 | — | — | 38,285 | ||||||||||||
Russian Federation | 78,930 | — | 277,758 | 356,688 | ||||||||||||
South Africa | 118,960 | 164,713 | — | 283,673 | ||||||||||||
Taiwan | 38,949 | 389,073 | — | 428,022 | ||||||||||||
Thailand | — | 1,903 | 354,098 | 356,001 | ||||||||||||
Turkey | 155,667 | 121,436 | — | 277,103 | ||||||||||||
All Other | — | 988,743 | — | 988,743 | ||||||||||||
Warrants | — | 481,638 | — | 481,638 | ||||||||||||
Preferred Stock | 279,278 | — | — | 279,278 | ||||||||||||
Repurchase Agreements | — | 146,000 | — | 146,000 | ||||||||||||
Totals | $ | 1,360,578 | $ | 4,389,333 | $ | 670,887 | $ | 6,420,798 | ||||||||
| 230 | May 31, 2013 | | Semiannual Report |
Table of Contents
| AllianzGI NFJ Global Dividend Value: | ||||||||||||||||
| Investments in Securities – Assets | Level 1– Quoted Prices | Level 2– Other Significant Observable Inputs | Level 3– Significant Unobservable Inputs | Value at 5/31/13 | ||||||||||||
Common Stock: | ||||||||||||||||
Australia | — | $ | 1,230,785 | — | $ | 1,230,785 | ||||||||||
France | — | 4,110,593 | — | 4,110,593 | ||||||||||||
Germany | — | 2,729,273 | — | 2,729,273 | ||||||||||||
Hong Kong | — | 2,411,515 | — | 2,411,515 | ||||||||||||
Israel | — | 1,299,058 | — | 1,299,058 | ||||||||||||
Japan | — | 4,078,512 | — | 4,078,512 | ||||||||||||
Korea (Republic of) | — | 4,160,122 | — | 4,160,122 | ||||||||||||
Spain | — | 1,379,966 | — | 1,379,966 | ||||||||||||
Switzerland | — | 2,747,957 | — | 2,747,957 | ||||||||||||
United Kingdom | — | 6,958,807 | — | 6,958,807 | ||||||||||||
All Other | $ | 37,373,165 | — | — | 37,373,165 | |||||||||||
Repurchase Agreements | — | 317,000 | — | 317,000 | ||||||||||||
Totals | $ | 37,373,165 | $ | 31,423,588 | — | $ | 68,796,753 | |||||||||
| AllianzGI NFJ International Small-Cap Value: | ||||||||||||||||
| Investments in Securities – Assets | Level 1– Quoted Prices | Level 2– Other Significant Observable Inputs | Level 3– Significant Unobservable Inputs | Value at 5/31/13 | ||||||||||||
Common Stock: | ||||||||||||||||
Australia | $ | 70,925 | $ | 387,958 | — | $ | 458,883 | |||||||||
Brazil | 77,592 | — | — | 77,592 | ||||||||||||
Canada | 829,707 | — | — | 829,707 | ||||||||||||
China | 87,138 | 354,893 | — | 442,031 | ||||||||||||
France | 70,056 | 349,155 | — | 419,211 | ||||||||||||
Greece | 90,774 | — | — | 90,774 | ||||||||||||
Israel | 60,312 | — | — | 60,312 | ||||||||||||
Japan | 90,671 | 1,316,295 | — | 1,406,966 | ||||||||||||
Luxembourg | 65,240 | — | — | 65,240 | ||||||||||||
New Zealand | 33,524 | 71,362 | — | 104,886 | ||||||||||||
Norway | 62,468 | 121,715 | — | 184,183 | ||||||||||||
Panama | 71,083 | — | — | 71,083 | ||||||||||||
Russian Federation | 63,282 | — | — | 63,282 | ||||||||||||
South Africa | 22,739 | — | — | 22,739 | ||||||||||||
Switzerland | 57,914 | 121,241 | — | 179,155 | ||||||||||||
United Kingdom | 261,326 | 1,340,228 | — | 1,601,554 | ||||||||||||
United States | 69,420 | — | — | 69,420 | ||||||||||||
All Other | — | 1,702,674 | — | 1,702,674 | ||||||||||||
Preferred Stock: | ||||||||||||||||
Brazil | 73,817 | — | — | 73,817 | ||||||||||||
Germany | 65,962 | 60,771 | — | 126,733 | ||||||||||||
Repurchase Agreements | — | 204,000 | — | 204,000 | ||||||||||||
Totals | $ | 2,223,950 | $ | 6,030,292 | — | $ | 8,254,242 | |||||||||
| Semiannual Report | | May 31, 2013 | 231 |
Table of Contents
Notes to Financial Statements (cont’d)
May 31, 2013 (Unaudited)
| AllianzGI NFJ International Value II: | ||||||||||||||||
| Investments in Securities – Assets | Level 1– Quoted Prices | Level 2– Other Significant Observable Inputs | Level 3– Significant Unobservable Inputs | Value at 5/31/13 | ||||||||||||
Common Stock: | ||||||||||||||||
Australia | $ | 18,106 | $ | 37,270 | — | $ | 55,376 | |||||||||
Brazil | 83,232 | — | — | 83,232 | ||||||||||||
Canada | 301,059 | — | — | 301,059 | ||||||||||||
India | 64,030 | — | — | 64,030 | ||||||||||||
Israel | 86,018 | — | — | 86,018 | ||||||||||||
Japan | 35,831 | 625,218 | — | 661,049 | ||||||||||||
Korea (Republic of) | 88,893 | — | — | 88,893 | ||||||||||||
Russian Federation | 60,868 | — | — | 60,868 | ||||||||||||
South Africa | 68,982 | — | — | 68,982 | ||||||||||||
Taiwan | 33,999 | — | — | 33,999 | ||||||||||||
Turkey | 39,187 | — | — | 39,187 | ||||||||||||
United States | 24,068 | — | — | 24,068 | ||||||||||||
All Other | — | 2,210,873 | — | 2,210,873 | ||||||||||||
Totals | $ | 904,273 | $ | 2,873,361 | — | $ | 3,777,634 | |||||||||
| AllianzGI Redwood: | ||||||||||||||||
| Investments in Securities – Assets | Level 1– Quoted Prices | Level 2– Other Significant Observable Inputs | Level 3– Significant Unobservable Inputs | Value at 5/31/13 | ||||||||||||
Common Stock | $ | 6,584,908 | $ | — | — | $ | 6,584,908 | |||||||||
Repurchase Agreements | — | 2,531,000 | — | 2,531,000 | ||||||||||||
| 6,584,908 | 2,531,000 | — | 9,115,908 | |||||||||||||
Investment in Securities – Liabilities | ||||||||||||||||
Options Written, at value: | ||||||||||||||||
Market Price | (1,618,440 | ) | — | — | (1,618,440 | ) | ||||||||||
Totals | $ | 4,966,468 | $ | 2,531,000 | — | $ | 7,497,468 | |||||||||
| AllianzGI Short Duration High Income: | ||||||||||||||||
| Investments in Securities – Assets | Level 1– Quoted Prices | Level 2– Other Significant Observable Inputs | Level 3– Significant Unobservable Inputs | Value at 5/31/13 | ||||||||||||
Corporate Bonds & Notes | — | $ | 367,740,604 | — | $ | 367,740,604 | ||||||||||
Senior Loans | — | 45,042,314 | — | 45,042,314 | ||||||||||||
Convertible Bonds | — | 8,107,375 | — | 8,107,375 | ||||||||||||
Repurchase Agreements | — | 32,236,000 | — | 32,236,000 | ||||||||||||
Totals | — | $ | 453,126,293 | — | $ | 453,126,293 | ||||||||||
| AllianzGI Structured Alpha: | ||||||||||||||||
| Investments in Securities – Assets | Level 1– Quoted Prices | Level 2– Other Significant Observable Inputs | Level 3– Significant Unobservable Inputs | Value at 5/31/13 | ||||||||||||
Short-Term Investments | — | $ | 8,126,536 | — | $ | 8,126,536 | ||||||||||
Options Purchased: | ||||||||||||||||
Market Price | $ | 77,153 | $ | 129,386 | — | 206,539 | ||||||||||
| 77,153 | 8,255,922 | — | 8,333,075 | |||||||||||||
| 232 | May 31, 2013 | | Semiannual Report |
Table of Contents
| AllianzGI Structured Alpha: | ||||||||||||||||
| Investment in Securities – Liabilities | Level 1– Quoted Prices | Level 2– Other Significant Observable Inputs | Level 3– Significant Unobservable Inputs | Value at 5/31/13 | ||||||||||||
Options Written, at value: | ||||||||||||||||
Market Price | $ | (162,123 | ) | $ | (123,180 | ) | — | $ | (285,303 | ) | ||||||
Totals | $ | (84,970 | ) | $ | 8,132,742 | — | $ | 8,047,772 | ||||||||
| AllianzGI Ultra Micro Cap: | ||||||||||||||||
| Investments in Securities – Assets | Level 1– Quoted Prices | Level 2– Other Significant Observable Inputs | Level 3– Significant Unobservable Inputs | Value at 5/31/13 | ||||||||||||
Common Stock | $ | 41,157,664 | — | — | $ | 41,157,664 | ||||||||||
Warrants | 196 | — | — | 196 | ||||||||||||
Repurchase Agreements | — | $ | 1,471,000 | — | 1,471,000 | |||||||||||
Totals | $ | 41,157,860 | $ | 1,471,000 | — | $ | 42,628,860 | |||||||||
| AllianzGI U.S. Emerging Growth: | ||||||||||||||||
| Investments in Securities – Assets | Level 1– Quoted Prices | Level 2– Other Significant Observable Inputs | Level 3– Significant Unobservable Inputs | Value at 5/31/13 | ||||||||||||
Common Stock | $ | 29,388,451 | — | — | $ | 29,388,451 | ||||||||||
Warrants | 211 | — | — | 211 | ||||||||||||
Totals | $ | 29,388,662 | — | — | $ | 29,388,662 | ||||||||||
| AllianzGI U.S. Equity Hedged: | ||||||||||||||||
| Investments in Securities – Assets | Level 1– Quoted Prices | Level 2– Other Significant Observable Inputs | Level 3– Significant Unobservable Inputs | Value at 5/31/13 | ||||||||||||
Common Stock | $ | 3,828,593 | — | — | $ | 3,828,593 | ||||||||||
Repurchase Agreements | — | $ | 433,000 | — | 433,000 | |||||||||||
Options Purchased: | ||||||||||||||||
Market Price | 34,075 | — | — | 34,075 | ||||||||||||
| 3,862,668 | 433,000 | — | 4,295,668 | |||||||||||||
Investment in Securities – Liabilities | ||||||||||||||||
Options Written, at value: | ||||||||||||||||
Market Price | (8,510 | ) | — | — | (8,510 | ) | ||||||||||
Totals | $ | 3,854,158 | $ | 433,000 | — | $ | 4,287,158 | |||||||||
At May 31, 2013, the following Funds had transfers between Levels 1 and 2:
| Transfers | ||||||||
| Level 1 to Level 2 | Level 2 to Level 1 | |||||||
AllianzGI China Equity | — | $ | 26,151 | (b) | ||||
AllianzGI Global Water | — | 9,077,463 | (b) | |||||
AllianzGI Global Managed Volatility | $ | 129,427 | (a) | — | ||||
AllianzGI International Small-Cap | 1,745,619 | (a) | 2,932,626 | (b) | ||||
AllianzGI NFJ International Small-Cap Value | 446,199 | (a) | 324,955 | (b) | ||||
AllianzGI NFJ International Value II | 69,413 | (a) | 18,106 | (b) | ||||
| (a) | This change was the result of securities trading outside the U.S. whose values were not adjusted by the application of a modeling tool at November 30, 2012, which was applied on May 31, 2013. |
| (b) | This change was the result of securities trading outside the U.S. whose values were adjusted by the application of a modeling tool at November 30, 2012, which was not applied on May 31, 2013. |
| Semiannual Report | | May 31, 2013 | 233 |
Table of Contents
Notes to Financial Statements (cont’d)
May 31, 2013 (Unaudited)
A roll forward of fair value measurements using significant unobservable inputs (Level 3) for the period or six months ended May 31, 2013, was as follows:
| AllianzGI Global Managed Volatility: | ||||||||||||||||||||||||||||||||||||
| Investments in Securities – Assets | Beginning Balance 11/30/12 | Purchases | Sales | Accrued Discount (Premiums) | Net Realized Gain (Loss) | Net Change in Unrealized Appreciation/ Depreciation | Transfers into Level 3 | Transfers out of Level 3 | Ending Balance 5/31/13 | |||||||||||||||||||||||||||
Rights: | ||||||||||||||||||||||||||||||||||||
China | $ | 2,245 | — | $ | (1,489 | ) | — | $ | 1,489 | $ | (2,245 | ) | — | — | — | |||||||||||||||||||||
| AllianzGI Global Water: | ||||||||||||||||||||||||||||||||||||
| Investments in Securities – Assets | Beginning Balance 11/30/12 | Purchases | Sales | Accrued Discount (Premiums) | Net Realized Gain (Loss) | Net Change in Unrealized Appreciation/ Depreciation | Transfers into Level 3 | Transfers out of Level 3 | Ending Balance 5/31/13 | |||||||||||||||||||||||||||
Common Stock: | ||||||||||||||||||||||||||||||||||||
Hong Kong | $ | 41,780 | — | — | — | — | $ | (68 | ) | — | — | $ | 41,712 | |||||||||||||||||||||||
| AllianzGI International Small-Cap: | ||||||||||||||||||||||||||||||||||||
| Investments in Securities – Assets | Beginning Balance 11/30/12 | Purchases | Sales | Accrued Discount (Premiums) | Net Realized Gain (Loss) | Net Change in Unrealized Appreciation/ Depreciation | Transfers into Level 3 | Transfers out of Level 3 | Ending Balance 5/31/13 | |||||||||||||||||||||||||||
Common Stock: | ||||||||||||||||||||||||||||||||||||
Thailand | $ | 1,304,215 | $ | 935,748 | $ | (818,358 | ) | — | $ | 198,317 | $ | 232,395 | — | — | $ | 1,852,317 | ||||||||||||||||||||
| AllianzGI Micro Cap: | ||||||||||||||||||||||||||||||||||||
| Investments in Securities – Assets | Beginning Balance 11/30/12 | Purchases | Sales | Accrued Discount (Premiums) | Net Realized Gain (Loss) | Net Change in Unrealized Appreciation/ Depreciation | Transfers into Level 3 | Transfers out of Level 3*** | Ending Balance 5/31/13 | |||||||||||||||||||||||||||
Warrants | — | † | — | — | — | — | $ | 996 | — | $ | (996 | ) | — | |||||||||||||||||||||||
| AllianzGI NFJ Emerging Markets Value: | ||||||||||||||||||||||||||||||||||||
| Investments in Securities – Assets | Beginning Balance 12/18/12** | Purchases | Sales | Accrued Discount (Premiums) | Net Realized Gain (Loss) | Net Change in Unrealized Appreciation/ Depreciation | Transfers into Level 3 | Transfers out of Level 3 | Ending Balance 5/31/13 | |||||||||||||||||||||||||||
Common Stock: | ||||||||||||||||||||||||||||||||||||
Mexico | — | $ | 39,594 | — | — | — | $ | (563 | ) | — | — | $ | 39,031 | |||||||||||||||||||||||
Russian Federation | — | 310,116 | — | — | — | (32,358 | ) | — | — | 277,758 | ||||||||||||||||||||||||||
Thailand | — | 354,105 | — | — | — | (7 | ) | — | — | 354,098 | ||||||||||||||||||||||||||
Totals | — | $ | 703,815 | — | — | — | $ | (32,928 | ) | — | — | $ | 670,887 | |||||||||||||||||||||||
| AllianzGI Ultra Micro Cap: | ||||||||||||||||||||||||||||||||||||
| Investments in Securities – Assets | Beginning Balance 11/30/12 | Purchases | Sales | Accrued Discount (Premiums) | Net Realized Gain (Loss) | Net Change in Unrealized Appreciation/ Depreciation | Transfers into Level 3 | Transfers out of Level 3*** | Ending Balance 5/31/13 | |||||||||||||||||||||||||||
Warrants | — | † | — | — | — | — | $ | 196 | — | $ | (196 | ) | — | |||||||||||||||||||||||
| AllianzGI U.S. Emerging Growth: | ||||||||||||||||||||||||||||||||||||
| Investments in Securities – Assets | Beginning Balance 11/30/12 | Purchases | Sales | Accrued Discount (Premiums) | Net Realized Gain (Loss) | Net Change in Unrealized Appreciation/ Depreciation | Transfers into Level 3 | Transfers out of Level 3*** | Ending Balance 5/31/13 | |||||||||||||||||||||||||||
Warrants | — | † | — | — | — | — | $ | 211 | — | $ | (211 | ) | — | |||||||||||||||||||||||
| 234 | May 31, 2013 | | Semiannual Report |
Table of Contents
The following tables present additional information about valuation techniques and inputs used for investments that are measured at fair value and categorized within Level 3 at May 31, 2013:
| AllianzGI Global Water: | ||||||||||||
| Investments in Securities – Assets | Ending Balance at 5/31/13 | Valuation Technique Used | Unobservable Inputs | Input Values | ||||||||
Common Stock | $ | 41,712 | Discount of Publicly Traded Quote | Discount Applied to Last Exchange Price | HKD 0.343 (75% Discount) | |||||||
| AllianzGI International Small-Cap: | ||||||||||||
| Investments in Securities – Assets | Ending Balance at 5/31/13 | Valuation Technique Used | Unobservable Inputs | Input Values | ||||||||
Common Stock | $ | 1,852,317 | Value of Foreign Security Traded on Foreign Exchange | Price of Non-Resident Shares on Foreign Exchange | THB 10.65-23.31 | |||||||
| AllianzGI NFJ Emerging Markets Value: | ||||||||||||||||
| Investments in Securities – Assets | Ending Balance at 5/31/13 | Valuation Technique Used | Unobservable Inputs | Input Values | ||||||||||||
Common Stock | $ | 39,031 | Indicative Bid | Ask Price | MXN | 66.50 | ||||||||||
| 277,758 | Value of Foreign Security Traded on Foreign Exchange | Price of Non-Resident Shares on Foreign Exchange | $ | 3.09-$58.81 | ||||||||||||
| 354,098 | Value of Foreign Security Traded on Foreign Exchange | Price of Non-Resident Shares on Foreign Exchange | THB | 4.01-324.50 | ||||||||||||
| † | Security fair-valued at $0. |
| * | Other financial instruments are derivatives not reflected in the Schedules of Investments, such as futures contracts and forward foreign currency contracts, which are valued at the unrealized appreciation (depreciation) of the instrument. |
| ** | Commencement of operations. |
| *** | Transferred out of Level 3 into Level 1 due to the availability of a quoted price in an active market. |
HKD—Hong Kong Dollar
MXN—Mexican Peso
THB—Thai Baht
The net change in unrealized appreciation/depreciation of Level 3 investments which AllianzGI Global Water, AllianzGI International Small-Cap and AllianzGI NFJ Emerging Markets Value held at May 31, 2013 was $(68), $326,224 and $(32,928) respectively.
Net realized gain (loss) and net change in unrealized appreciation/depreciation are reflected on the Statements of Operations.
(c) Investment Transactions and Investment Income. Investment transactions are accounted for on the trade date. Securities purchased and sold on a when-issued or delayed-delivery basis may be settled a month or more after the trade date. Realized gains and losses on investments are determined on an identified cost basis. Interest income adjusted for the accretion of discount and amortization of premiums is recorded on an accrual basis. Discounts or premiums on debt securities purchased are accreted or amortized, respectively, to interest income. Conversion premium is not amortized.
Dividend income is recorded on the ex-dividend date, except for certain dividends from foreign securities where the ex-dividend date may have passed, and then are recorded as soon after the ex-dividend date as the Funds, using reasonable diligence, become aware of such dividends. Payments received from real estate investment trust securities may be comprised of dividends, realized gains and return of
capital. The payment may initially be recorded as dividend income and may subsequently be reclassified as realized gains and/or return of capital upon receipt of information from the issuer. Payments considered return of capital reduce the cost basis of the respective security. Dividends from underlying funds are recorded as dividend income, while capital gain distributions are recorded as net capital gain distributions received from underlying funds on the Statements of Operations. Facility fees and other fees (such as origination fees) received on settlement date are amortized as income over the expected term of the senior loan. Facility fees and other fees received after settlement date relating to senior loans and consent fees relating to corporate actions are recorded as miscellaneous income upon receipt. Expenses are recorded on an accrual basis and such expenses exclude those of the underlying funds. Expenses of the underlying funds are reflected in the net asset values of those funds.
(d) Federal Income Taxes. The Funds intend to distribute all of their taxable income and to comply with the other requirements of Subchapter M of the U.S. Internal Revenue Code of 1986, as amended, applicable to regulated investment companies. Accordingly, no provision for U.S. federal income taxes is required.
Accounting for uncertainty in income taxes establishes for all entities, including pass-through entities such as the Funds, a minimum threshold
| Semiannual Report | | May 31, 2013 | 235 |
Table of Contents
Notes to Financial Statements (cont’d)
May 31, 2013 (Unaudited)
for financial statement recognition of the benefit of positions taken in filing tax returns (including whether an entity is taxable in a particular jurisdiction), and requires certain expanded tax disclosures. Funds’ management has determined that its evaluation of the positions taken in the tax returns has resulted in no material impact to the Funds’ financial statements at May 31, 2013. The federal income tax returns for the prior three years, as applicable, remain subject to examination by the Internal Revenue Service.
(e) Dividends and Distributions to Shareholders. The Funds (except AllianzGI Retirement Income, AllianzGI Global Allocation, AllianzGI Convertible, AllianzGI High Yield Bond, AllianzGI NFJ Emerging Markets Value, AllianzGI NFJ Global Dividend Value, AllianzGI NFJ International Value II and AllianzGI Short Duration High Income) declare dividends and distributions from net investment income and net realized capital gains, if any, annually. AllianzGI Retirement Income, AllianzGI Global Allocation, AllianzGI Convertible, AllianzGI NFJ Emerging Markets Value, AllianzGI NFJ Global Dividend Value and AllianzGI NFJ International Value II declare dividends from net investment income quarterly and distributions from net realized capital gains, if any, annually. AllianzGI High Yield Bond and AllianzGI Short Duration High Income declare dividends from net investment income monthly and distributions from net realized capital gains, if any, annually. The Funds record dividends and distributions to their respective shareholders on the ex-dividend date. The amount of dividends from net investment income and distributions from net realized capital gains is determined in accordance with federal income tax regulations, which may differ from GAAP. These “book-tax” differences are considered either temporary or permanent in nature. To the extent these differences are permanent in nature, such amounts are reclassified within the capital accounts based on their federal income tax treatment; temporary differences do not require reclassification. To the extent dividends and/or distributions exceed current and accumulated earnings and profits for federal income tax purposes, they are reported as dividends and/or distributions to shareholders from return of capital.
(f) Multi-Class Operations. Each class offered by the Trust has equal rights as to assets and voting privileges (except that shareholders of a class have exclusive voting rights regarding any matter relating solely to that class of shares). Income, non-class specific expenses, and realized and unrealized capital gains and losses of each Fund are allocated daily to each class of shares based on the relative net assets of each class. Class specific expenses, where applicable, include administration, administrative servicing, distribution, servicing and sub-transfer agent fees.
(g) Foreign Currency Translation. The Funds’ accounting records are maintained in U.S. dollars as follows: (1) the foreign currency market value of investments and other assets and liabilities denominated in foreign currencies are translated at the prevailing exchange rate at the end of the period; and (2) purchases and sales, income and expenses are translated at the prevailing exchange rate on the respective dates of such transactions. The resulting net foreign currency gain (loss) is included in the Funds’ Statements of Operations.
The Funds do not generally isolate that portion of the results of operations arising as a result of changes in the foreign currency exchange rates from the fluctuations arising from changes in the market prices of securities. Accordingly, such foreign currency gain (loss) is included in net realized and unrealized gain (loss) on investments. However, the Funds do isolate the effect of fluctuations in foreign currency exchange rates when determining the gain (loss) upon the sale or maturity of foreign currency denominated debt obligations pursuant to U.S. federal income tax regulations; such amount is categorized as foreign currency gain (loss) for both financial reporting and income tax reporting purposes.
(h) Foreign Withholding Taxes on Dividends. Dividend income reflected on the Statements of Operations is shown net of foreign taxes withheld on dividends from foreign securities. For the period or six months ended May 31, 2013 foreign taxes withheld were: AllianzGI Behavioral Advantage Large Cap—$423, AllianzGI China Equity—$581, AllianzGI Global Managed Volatility—$11,649, AllianzGI Global Water—$235,602, AllianzGI International Small-Cap—$113,677, AllianzGI Micro Cap—$361, AllianzGI Multi-Asset Real Return—$1,517, AllianzGI NFJ Emerging Markets Value—$12,864, AllianzGI NFJ Global Dividend Value—$94,117, AllianzGI NFJ International Small-Cap Value—$12,021, AllianzGI NFJ International Value II—$7,525, AllianzGI Redwood—$357 and AllianzGI U.S. Equity Hedged—$19.
(i) Repurchase Agreements. The Funds enter into transactions with their custodian bank or securities brokerage firms whereby they purchase securities under agreements to resell such securities at an agreed upon price and date (“repurchase agreements”). The Funds, through their custodian, take possession of securities collateralizing the repurchase agreement. Such agreements are carried at the contract amount in the financial statements, which is considered to represent fair value. Collateral pledged (the securities received), which consists primarily of U.S. government obligations and asset-backed securities, is held by the custodian bank for the benefit of the Funds until maturity of the repurchase agreement. Provisions of the repurchase agreements and the procedures adopted by the Funds require that the market value of the collateral, including accrued interest thereon, be sufficient in the event of default by the counterparty. If the counterparty defaults and the value of the collateral declines or if the counterparty enters an insolvency proceeding, realization of the collateral by the Funds may be delayed or limited.
(j) Warrants. The Funds may receive warrants. Warrants are securities that are usually issued together with a debt security or preferred stock and that give the holder the right to buy a proportionate amount of common stock at a specified price. Warrants are freely transferable and are often traded on major exchanges. Warrants normally have a life that is measured in years and entitle the holder to buy common stock of a company at a price that is usually higher than the market price at the time the warrant is issued. Warrants may entail greater risks than certain other types of investments. Generally, warrants do not carry the right to receive dividends or exercise voting rights with respect to the underlying
| 236 | May 31, 2013 | | Semiannual Report |
Table of Contents
securities, and they do not represent any rights in the assets of the issuer. In addition, their value does not necessarily change with the value of the underlying securities, and they cease to have value if they are not exercised on or before their expiration date. If the market price of the underlying stock does not exceed the exercise price during the life of the warrant, the warrant will expire worthless. Warrants may increase the potential profit or loss to be realized from the investment as compared with investing the same amount in the underlying securities. Similarly, the percentage increase or decrease in the value of an equity security warrant may be greater than the percentage increase or decrease in the value of the underlying common stock. Warrants may relate to the purchase of equity or debt securities. Debt obligations with warrants attached to purchase equity securities have many characteristics of convertible securities and their prices may, to some degree, reflect the performance of the underlying stock. Debt obligations also may be issued with warrants attached to purchase additional debt securities at the same coupon rate. A decline in interest rates would permit a Fund to sell such warrants at a profit. If interest rates rise, these warrants would generally expire with no value.
(k) Senior Loans. The Funds may purchase assignments of, and participations in, Senior Loans originated, negotiated and structured by a U.S. or foreign commercial bank, insurance company, finance company or other financial institution (the “Agent”) for a lending syndicate of financial institutions (the “Lender”). When purchasing an assignment, the Funds succeed to all the rights and obligations under the loan agreement with the same rights and obligations as the assigning Lender. Assignments may, however, be arranged through private negotiations between potential assignees and potential assignors, and the rights and obligations acquired by the purchaser of an assignment may differ from, and be more limited than, those held by the assigning Lender.
(l) U.S. Government Agencies or Government-Sponsored Enterprises. Securities issued by U.S. Government agencies or government-sponsored enterprises may not be guaranteed by the U.S. Treasury. The Government National Mortgage Association (“GNMA” or “Ginnie Mae”), a wholly-owned U.S. Government corporation, is authorized to guarantee, with the full faith and credit of the U.S. Government, the timely payment of principal and interest on securities issued by institutions approved by GNMA and backed by pools of mortgages insured by the Federal Housing Administration or guaranteed by the Department of Veterans Affairs. Government-related guarantors not backed by the full faith and credit of the U.S. Government include the Federal National Mortgage Association (“FNMA” or “Fannie Mae”) and the Federal Home Loan Mortgage Corporation (“FHLMC” or “Freddie Mac”). Pass-through securities issued by FNMA are guaranteed as to timely payment of principal and interest by FNMA, but are not backed by the full faith and credit of the U.S. Government. FHLMC guarantees the timely payment of interest and ultimate collection of principal, but its participation certificates are not backed by the full faith and credit of the U.S. Government.
(m) When-Issued/Delayed-Delivery Transactions. When-issued or delayed-delivery transactions involve a commitment to purchase or sell securities for a predetermined price or yield, with payment and delivery taking place beyond the customary settlement period. When delayed-delivery purchases are outstanding, the Funds will set aside and maintain until the settlement date in a designated account, liquid assets in an amount sufficient to meet the purchase price. When purchasing a security on a delayed-delivery basis, the Funds assume the rights and risks of ownership of the security, including the risk of price and yield fluctuations; consequently, such fluctuations are taken into account when determining the net asset value. The Funds may dispose of or renegotiate a delayed-delivery transaction after it is entered into, and may sell when-issued securities before they are delivered, which may result in a realized gain or loss. When a security is sold on a delayed-delivery basis, the Funds do not participate in future gains and losses with respect to the security.
(n) Custody Credits on Cash Balances. The Funds may benefit from an expense offset arrangement with their custodian bank, whereby uninvested cash balances may earn credits that reduce monthly custodian and accounting agent expenses. Had these cash balances been invested in income-producing securities, they would have generated income for the Funds. Cash overdraft charges, if any, are included in custodian and accounting agent fees.
| 2. | PRINCIPAL RISKS |
In the normal course of business, the Funds trade financial instruments and enter into financial transactions where risk of potential loss exists due to, among other things, changes in the market (market risk) or failure of the other party to a transaction to perform (counterparty risk). The Funds are also exposed to other risks such as, but not limited to, interest rate, foreign currency, credit and leverage risks.
Interest rate risk is the risk that fixed income securities will decline in value because of increases in interest rates. As nominal interest rates rise, the values of certain fixed income securities held by the Funds are likely to decrease. A nominal interest rate can be described as the sum of a real interest rate and an expected inflation rate. Fixed income securities with longer durations tend to be more sensitive to changes in interest rates, usually making them more volatile than securities with shorter durations. Duration is used primarily as a measure of the sensitivity of a fixed income security’s market price to interest rate (i.e. yield) movements.
Variable and floating rate securities generally are less sensitive to interest rate changes but may decline in value if their interest rates do not rise as much, or as quickly, as interest rates in general. Conversely, floating rate securities will not generally increase in value if interest rates decline. Inverse floating rate securities may decrease in value if interest rates increase. Inverse floating rate securities may also exhibit greater price volatility than a fixed rate obligation with similar credit quality. When the Funds hold variable or floating rate securities, a decrease (or, in the case of inverse floating rate securities, an increase) in market interest rates will adversely affect the income received from such securities and the NAV of the Funds’ shares.
| Semiannual Report | | May 31, 2013 | 237 |
Table of Contents
Notes to Financial Statements (cont’d)
May 31, 2013 (Unaudited)
The Funds are exposed to credit risk, which is the risk of losing money if the issuer or guarantor of a fixed income security is unable or unwilling, or is perceived (whether by market participants, rating agencies, pricing services or otherwise) as unable or unwilling, to make timely principal and/or interest payments, or to otherwise honor its obligations. Securities are subject to varying degrees of credit risk, which are often reflected in credit ratings.
To the extent the Funds directly invest in foreign currencies or in securities that trade in, and receive revenues in, foreign currencies, or in derivatives that provide exposure to foreign currencies, they will be subject to the risk that those currencies will decline in value relative to the U.S. dollar, or, in the case of hedging positions, that the U.S. dollar will decline in value relative to the currency being hedged. Currency rates in foreign countries may fluctuate significantly over short periods of time for a number of reasons, including economic growth, inflation, changes in interest rates, intervention (or the failure to intervene) by U.S. or foreign governments, central banks or supranational entities such as the International Monetary Fund, or the imposition of currency controls or other political developments in the United States or abroad. As a result, the Funds’ investments in foreign currency-denominated securities may reduce the returns of the Funds.
The Funds are subject to elements of risk not typically associated with investments in the U.S., due to concentrated investments in foreign issuers located in a specific country or region. Such concentrations will subject the Funds to additional risks resulting from future political or economic conditions in such country or region and the possible imposition of adverse governmental laws or currency exchange restrictions affecting such country or region, which could cause the securities and their markets to be less liquid and prices more volatile than those of comparable U.S. companies.
The market values of securities may decline due to general market conditions (market risk) which are not specifically related to a particular company, such as real or perceived adverse economic conditions, changes in the general outlook for corporate earnings, changes in interest or currency rates or adverse investor sentiment. They may also decline due to factors that affect a particular industry or industries, such as labor shortages or increased production costs and competitive conditions within an industry. Equity securities and equity-related investments generally have greater market price volatility than fixed income securities.
The Funds are exposed to counterparty risk, or the risk that an institution or other entity with which the Funds have unsettled or open transactions will default. The potential loss to the Funds could exceed the value of the financial assets recorded in the Funds’ financial statements. Financial assets, which potentially expose the Funds to counterparty risk, consist principally of cash due from counterparties and investments. The Sub-Advisers seek to minimize the Funds’ counterparty risk by performing reviews of each counterparty and by minimizing concentration of counterparty risk by undertaking transactions with multiple customers and counterparties on recognized and reputable exchanges. Delivery of securities sold is only
made once the Funds have received payment. Payment is made on a purchase once the securities have been delivered by the counterparty. The trade will fail if either party fails to meet its obligation.
The Funds are exposed to risks associated with leverage. Leverage may cause the value of the Funds’ shares to be more volatile than if the Funds did not use leverage. This is because leverage tends to exaggerate the effect of any increase or decrease in the value of the Funds’ portfolio securities. The Funds may engage in transactions or purchase instruments that give rise to forms of leverage. In addition, to the extent the Funds employ leverage, dividend and interest costs may not be recovered by any appreciation of the securities purchased with the leverage proceeds and could exceed the Funds’ investment returns, resulting in greater losses.
The considerations and factors surrounding the settlement of certain purchases and sales made on a delayed-delivery basis are governed by Master Securities Forward Transaction Agreements (“Master Forward Agreements”) between the Funds and select counterparties. The Master Forward Agreements maintain provisions for, among other things, initiation and confirmation, payment and transfer, events of default, termination, and maintenance of collateral.
The Funds are also a party to Master Repurchase Agreements (“Master Repo Agreements”) with select counterparties. The Master Repo Agreements maintain provisions for initiation, income payments, events of default, and maintenance of collateral.
The counterparty risk associated with certain contracts may be reduced by master netting arrangements to the extent that if an event of default occurs, all amounts with the counterparty are terminated and settled on a net basis. The Funds’ overall exposure to counterparty risk with respect to transactions subject to master netting arrangements can change substantially within a short period, as it is affected by each transaction subject to the arrangement.
| 3. | UNDERLYING FUNDS AND OTHER ACQUIRED FUNDS RISK |
AllianzGI Retirement 2015, AllianzGI Retirement 2020, AllianzGI Retirement 2025, AllianzGI Retirement 2030, AllianzGI Retirement 2035, AllianzGI Retirement 2040, AllianzGI Retirement 2045, AllianzGI Retirement 2050, AllianzGI Retirement 2055 and AllianzGI Retirement Income (collectively, the “Target Date Funds”) and AllianzGI Global Allocation and AllianzGI Global Growth Allocation intend to invest their assets primarily in series of Allianz Funds, Allianz Funds Multi-Strategy Trust, PIMCO Equity Series, PIMCO Funds and PIMCO sponsored exchange-traded Funds (“ETFs”) (together, “Underlying Funds”) and AllianzGI Dynamic Emerging Multi-Asset and AllianzGI Multi-Asset Real Return may invest their assets significantly or primarily in Underlying Funds. The Funds may also invest a portion of their assets in unaffiliated ETFs and mutual funds and pooled vehicles (together, “Other Acquired Funds”). Accordingly, the investment performance of the Funds depends upon a favorable allocation among the Underlying Funds and Other Acquired Funds as well as the ability of the Underlying Funds and Other Acquired Funds to achieve their objectives. There can be no assurance that the investment objective of
| 238 | May 31, 2013 | | Semiannual Report |
Table of Contents
any Underlying Fund or Other Acquired Fund will be achieved. The risks associated with investing in each Fund are closely related to the risks associated with the securities and other investments held by the Underlying Funds and Other Acquired Funds.
Investing in the Underlying Funds and Other Acquired Funds involves certain additional expenses and tax results that would not be present in a direct investment in the Underlying Funds or Other Acquired Funds. Each Fund’s net asset value will fluctuate in response to changes in the net asset values of the Underlying Funds and Other Acquired Funds in which it invests. The extent to which the investment performance and risks associated with each Fund correlate to those of a particular Underlying Fund or Other Acquired Fund will depend upon the extent to which each Fund’s assets are allocated from time to time for investment in the Underlying Fund or Other Acquired Fund, which will vary. Each Fund’s investment in a particular Underlying Fund may exceed 25% of its assets. To the extent that a Fund invests a significant portion of its assets in an Underlying Fund, it will be particularly sensitive to the risks associated with that Underlying Fund.
| 4. | FINANCIAL DERIVATIVE INSTRUMENTS |
Disclosure about derivatives and hedging activities requires qualitative disclosure regarding objectives and strategies for using derivatives, quantitative disclosure about fair value amounts of gains and losses on derivatives, and disclosure about credit-risk-related contingent features in derivative agreements. The disclosure requirements distinguish between derivatives, which are accounted for as “hedges”, and those that do not qualify for such accounting. Although the Funds at times use derivatives for hedging purposes, the Funds reflect derivatives at fair value and recognize changes in fair value through the Funds’ Statements of Operations, and such derivatives do not qualify for hedge accounting treatment.
Effective January 1, 2013, each of AllianzGI Retirement 2015, AllianzGI Retirement 2020, AllianzGI Retirement 2025, AllianzGI Retirement 2030, AllianzGI Retirement Income, AllianzGI Dynamic Emerging Multi-Asset and AllianzGI Multi-Asset Real Return became subject to regulation as a commodity pool under the Commodity Exchange Act pursuant to recent rule changes by the Commodity Futures Trading Commission (the “CFTC”). The Investment Manager has registered with the CFTC as a Commodity Pool Operator, the Sub-Adviser, AGI U.S., has registered with the CFTC as a Commodity Trading Adviser, and both entities are members of the National Futures Association. The CFTC has proposed amendments to its rules which, upon their compliance dates, may subject AllianzGI Retirement 2015, AllianzGI Retirement 2020, AllianzGI Retirement 2025, AllianzGI Retirement 2030, AllianzGI Retirement Income, AllianzGI Dynamic Emerging Multi-Asset, AllianzGI Multi-Asset Real Return and the Investment Manager to additional disclosure, reporting and recordkeeping rules, and compliance.
Option Transactions. The Funds purchase put and call options on securities and indices for hedging purposes, risk management purposes or otherwise as part of their investment strategies. The risks
associated with purchasing an option include the risk that the Funds pay a premium whether or not the option is exercised. Additionally, the Funds bear the risk of loss of premiums and changes in market value should the counterparty not perform under the contract. Put and call options purchased are accounted for in the same manner as portfolio securities. The cost of securities acquired through the exercise of call options is increased by the premiums paid. The proceeds from securities sold through the exercise of put options are decreased by the premiums paid.
The Funds may write (sell) put and call options on securities and indices to earn premiums, for hedging purposes, risk management purposes or otherwise as part of their investment strategies. When an option is written, the premium received is recorded as an asset with an equal liability that is subsequently marked to market to reflect the market value of the option written. These liabilities, if any, are reflected as options written in the Funds’ Statements of Assets and Liabilities. Premiums received from writing options which expire unexercised are recorded on the expiration date as a realized gain. The difference between the premium received and the amount paid on effecting a closing purchase transaction, including brokerage commissions, is also treated as a realized gain, or if the premium is less than the amount paid for the closing purchase transaction, as a realized loss. If a call option written is exercised, the premium is added to the proceeds from the sale of the underlying security in determining whether there has been a realized gain or loss. If a put option written is exercised, the premium reduces the cost basis of the security. In writing an option, the Funds bear the market risk of an unfavorable change in the price of the security underlying the written option. Exercise of a written option could result in the Funds purchasing a security at a price different from its current market value.
Futures Contracts. The Funds use futures contracts to manage their exposure to the securities markets or the movements in interest rates and currency values. A futures contract is an agreement between two parties to buy and sell a financial instrument at a set price on a future date. Upon entering into such a contract, the Funds are required to pledge to the broker an amount of cash or securities equal to the minimum “initial margin” requirements of the exchange. Pursuant to the contracts, the Funds agree to receive from or pay to the broker an amount of cash or securities equal to the daily fluctuation in the value of the contracts. Such receipts or payments are known as “variation margin” and are recorded by the Funds as unrealized appreciation or depreciation. When the contracts are closed, the Funds record a realized gain or loss equal to the difference between the value of the contracts at the time they were opened and the value at the time they were closed. Any unrealized appreciation or depreciation recorded is simultaneously reversed. The use of futures transactions involves various risks, including the risk of an imperfect correlation in the movements in the price of futures contracts, interest rates and underlying hedging assets, and possible inability or unwillingness of counterparties to meet the terms of their contracts.
Forward Foreign Currency Contracts. A forward foreign currency contract is an agreement between two parties to buy and sell a
| Semiannual Report | | May 31, 2013 | 239 |
Table of Contents
Notes to Financial Statements (cont’d)
May 31, 2013 (Unaudited)
currency at a set exchange rate on a future date. The Funds enter into forward foreign currency contracts for the purpose of hedging against foreign currency risk arising from the investment or anticipated investment in securities denominated in foreign currencies. The Funds also enter into these contracts for purposes of increasing exposure to a foreign currency or shifting exposure to foreign currency fluctuations from one country to another. The market value of a forward foreign currency contract fluctuates with changes in foreign currency exchange rates. All commitments are marked to market daily at the applicable exchange rates and any resulting unrealized appreciation or depreciation is recorded. Realized gains or losses are recorded at the time the forward contract matures or by delivery of the currency. Risks may arise upon entering into these contracts from the potential inability of counterparties to meet the terms of their contracts and from unanticipated movements in the value of a foreign currency relative to the U.S. dollar. In addition, these contracts may involve market risk in excess of the unrealized appreciation (depreciation) reflected in the Funds’ Statements of Assets and Liabilities.
The following is a summary of the Funds’ derivatives instruments categorized by risk exposure.
The effect of derivatives on the Statements of Assets and Liabilities at May 31, 2013:
| AllianzGI Dynamic Emerging Multi-Asset: | ||||
| Location | Market Price | |||
Asset derivatives: | ||||
Receivable for variation margin on futures contracts* | $ | 190,358 | ||
Liability derivatives: | ||||
Payable for variation margin on futures contracts* | $ | (176,712 | ) | |
| * | Included in net unrealized depreciation of $(177,188) on futures contracts as reported in Note 7(b). |
| AllianzGI Global Water: | ||||
| Location | Foreign Exchange Contracts | |||
Liability derivatives: | ||||
Unrealized depreciation of forward foreign currency contracts | $ | (5,019 | ) | |
| AllianzGI Multi-Asset Real Return: | ||||
| Location | Market Price | |||
Asset derivatives: | ||||
Receivable for variation margin on futures contracts* | $ | 19,655 | ||
| * | Included in net unrealized appreciation of $1,630 on futures contracts as reported in Note 7(b). |
| AllianzGI Redwood: | ||||
| Location | Market Price | |||
Liability derivatives: | ||||
Options written, at value | $ | (1,618,440 | ) | |
| AllianzGI Structured Alpha: | ||||
| Location | Market Price | |||
Asset derivatives: | ||||
Investments, at value (options purchased) | $ | 206,539 | ||
Liability derivatives: | ||||
Options written, at value | $ | (285,303 | ) | |
| AllianzGI U.S. Equity Hedged: | ||||
| Location | Market Price | |||
Asset derivatives: | ||||
Investments, at value (options purchased) | $ | 34,075 | ||
Liability derivatives: | ||||
Options written, at value | $ | (8,510 | ) | |
The effect of derivatives on the Statements of Operations for the period or six months ended May 31, 2013:
| AllianzGI China Equity: | ||||
| Location | Foreign Exchange Contracts | |||
Net realized gain on: | ||||
Foreign currency transactions | $ | 2 | ||
| AllianzGI Dynamic Emerging Multi-Asset: | ||||
| Location | Market Price | |||
Net realized loss on: | ||||
Futures contracts | $ | (8,950 | ) | |
Net change in unrealized appreciation/depreciation of: | ||||
Futures contracts | $ | (177,188 | ) | |
| AllianzGI Global Water: | ||||
| Location | Foreign Exchange Contracts | |||
Net realized loss on: | ||||
Foreign currency transactions | $ | (21,706 | ) | |
Net change in unrealized appreciation/depreciation of: | ||||
Foreign currency transactions | $ | (3,921 | ) | |
| AllianzGI International Small-Cap: | ||||
| Location | Foreign Exchange Contracts | |||
Net realized loss on: | ||||
Foreign currency transactions | $ | (3,720 | ) | |
| 240 | May 31, 2013 | | Semiannual Report |
Table of Contents
| AllianzGI Multi-Asset Real Return: | ||||
| Location | Market Price | |||
Net realized gain on: | ||||
Futures contracts | $ | 2,550 | ||
Net change in unrealized appreciation/depreciation of: | ||||
Futures contracts | $ | 1,630 | ||
| AllianzGI NFJ Emerging Markets Value: | ||||
| Location | Foreign Exchange Contracts | |||
Net realized loss on: | ||||
Foreign currency transactions | $ | (83 | ) | |
| AllianzGI Redwood: | ||||
| Location | Market Price | |||
Net realized loss on: | ||||
Options written | $ | (202,696 | ) | |
Net change in unrealized appreciation/depreciation of: | ||||
Options written | $ | (682,659 | ) | |
| AllianzGI Structured Alpha: | ||||
| Location | Market Price | |||
Net realized gain (loss) on: | ||||
Investments (options purchased) | $ | (189,043 | ) | |
Options written | 316,907 | |||
Total net realized gain | $ | 127,864 | ||
Net change in unrealized appreciation/depreciation of: | ||||
Investments (options purchased) | $ | 47,017 | ||
Options written | (20,084 | ) | ||
Total net change in unrealized appreciation/depreciation | $ | 26,933 | ||
| AllianzGI U.S. Equity Hedged: | ||||
| Location | Market Price | |||
Net realized loss on: | ||||
Investments (options purchased) | $ | (42,580 | ) | |
Options written | (41,098 | ) | ||
Total net realized loss | $ | (83,678 | ) | |
Net change in unrealized appreciation/depreciation of: | ||||
Investments (options purchased) | $ | (102,203 | ) | |
Options written | (31 | ) | ||
Total net change in unrealized | $ | (102,234 | ) | |
The average volume (measured at each fiscal quarter-end) of derivative activity during the period or six months ended May 31, 2013:
Options Contracts(1) | Options Contracts(1) | Forward Foreign Currency Contracts(2) | Futures Contracts(1) | Futures Contracts(1) | ||||||||||||||||||||
| Purchased | Sold | Long | Short | |||||||||||||||||||||
AllianzGI Dynamic Emerging Multi-Asset | — | — | — | — | 73 | 15 | ||||||||||||||||||
AllianzGI Global Water | — | — | $ | 94,047 | $ | 191,886 | — | — | ||||||||||||||||
AllianzGI Multi-Asset Real Return | — | — | — | — | — | 4 | ||||||||||||||||||
AllianzGI Redwood | — | 2,489 | — | — | — | — | ||||||||||||||||||
AllianzGI Structured Alpha | 626 | 959 | — | — | — | — | ||||||||||||||||||
AllianzGI U.S. Equity Hedged | 22 | 22 | — | — | — | — | ||||||||||||||||||
| (1) | Number of contracts |
| (2) | U.S. $ value on origination date |
| 5. | INVESTMENT MANAGER/ADMINISTRATOR/SUB-ADVISER/DISTRIBUTOR |
Investment Management Fee. Each Fund has an Investment Management Agreement (collectively the “Agreements”) with the Investment Manager. Subject to the supervision of the Trust’s Board, the Investment Manager is responsible for managing, either directly or through others selected by it, each Fund’s investment activities, business affairs and administrative matters. Pursuant to the Agreements, the Investment Manager receives an annual fee, payable monthly, at an annual rate of each Fund’s average daily net assets (the “Investment Management Fee”).
Administration Fee. The Investment Manager provides administrative services to the Target Date Funds and also bears the cost of most third-party administrative services required by the Target Date Funds, and in return it receives from each share class of each Target Date Fund a monthly administration fee based on each share class’ average daily net assets (the “Administration Fee”).
| Semiannual Report | | May 31, 2013 | 241 |
Table of Contents
Notes to Financial Statements (cont’d)
May 31, 2013 (Unaudited)
The Investment Management Fee and Administration Fee for all classes are charged at an annual rate as indicated in the following table:
| All Classes | Class A, C, D and R | Class P and Administrative | Class R6 and Institutional | |||||||||||||||||
| Management Fee | Effective Management Fee | Administration Fee | ||||||||||||||||||
AllianzGI Retirement 2015 | 0.05 | % | 0.05 | % | 0.30 | % | 0.15 | % | 0.05 | %* | ||||||||||
AllianzGI Retirement 2020 | 0.05 | 0.05 | 0.30 | 0.15 | 0.05 | * | ||||||||||||||
AllianzGI Retirement 2025 | 0.05 | 0.05 | 0.30 | 0.15 | 0.05 | * | ||||||||||||||
AllianzGI Retirement 2030 | 0.05 | 0.05 | 0.30 | 0.15 | 0.05 | * | ||||||||||||||
AllianzGI Retirement 2035 | 0.05 | 0.05 | 0.30 | 0.15 | 0.05 | * | ||||||||||||||
AllianzGI Retirement 2040 | 0.05 | 0.05 | 0.30 | 0.15 | 0.05 | * | ||||||||||||||
AllianzGI Retirement 2045 | 0.05 | 0.05 | 0.30 | 0.15 | 0.05 | * | ||||||||||||||
AllianzGI Retirement 2050 | 0.05 | 0.05 | 0.30 | 0.15 | 0.05 | * | ||||||||||||||
AllianzGI Retirement 2055 | 0.05 | 0.05 | 0.30 | 0.15 | 0.05 | * | ||||||||||||||
AllianzGI Retirement Income | 0.05 | 0.05 | 0.30 | 0.15 | 0.05 | * | ||||||||||||||
AllianzGI Global Allocation | 0.85 | 0.15 | N/A | N/A | N/A | |||||||||||||||
AllianzGI Global Growth Allocation | 0.85 | 0.15 | N/A | N/A | N/A | |||||||||||||||
AllianzGI Behavioral Advantage Large Cap | 0.40 | 0.40 | N/A | N/A | N/A | |||||||||||||||
AllianzGI China Equity | 1.10 | 1.10 | N/A | N/A | N/A | |||||||||||||||
AllianzGI Convertible | 0.57 | 0.57 | N/A | N/A | N/A | |||||||||||||||
AllianzGI Disciplined Equity | 0.60 | 0.60 | N/A | N/A | N/A | |||||||||||||||
AllianzGI Dynamic Emerging Multi-Asset | 0.90 | 0.90 | N/A | N/A | N/A | |||||||||||||||
AllianzGI Global Managed Volatility | 0.40 | 0.40 | N/A | N/A | N/A | |||||||||||||||
AllianzGI Global Water | 0.95 | 0.95 | N/A | N/A | N/A | |||||||||||||||
AllianzGI High Yield Bond | 0.48 | 0.48 | N/A | N/A | N/A | |||||||||||||||
AllianzGI International Small-Cap | 1.00 | 1.00 | N/A | N/A | N/A | |||||||||||||||
AllianzGI Micro Cap | 1.25 | 1.25 | N/A | N/A | N/A | |||||||||||||||
AllianzGI Multi-Asset Real Return | 0.75 | 0.75 | N/A | N/A | N/A | |||||||||||||||
AllianzGI NFJ Emerging Markets Value | 1.00 | 1.00 | N/A | N/A | N/A | |||||||||||||||
AllianzGI NFJ Global Dividend Value | 0.80 | 0.80 | N/A | N/A | N/A | |||||||||||||||
AllianzGI NFJ International Small-Cap Value | 0.95 | 0.95 | N/A | N/A | N/A | |||||||||||||||
AllianzGI NFJ International Value II | 0.80 | 0.80 | N/A | N/A | N/A | |||||||||||||||
AllianzGI Redwood | 1.00 | 1.00 | N/A | N/A | N/A | |||||||||||||||
AllianzGI Short Duration High Income | 0.48 | 0.48 | N/A | N/A | N/A | |||||||||||||||
AllianzGI Structured Alpha | 1.25 | 1.25 | N/A | N/A | N/A | |||||||||||||||
AllianzGI Ultra Micro Cap | 1.50 | 1.50 | N/A | N/A | N/A | |||||||||||||||
AllianzGI U.S. Emerging Growth | 0.90 | 0.90 | N/A | N/A | N/A | |||||||||||||||
AllianzGI U.S. Equity Hedged | 0.70 | 0.70 | N/A | N/A | N/A | |||||||||||||||
| * | Administration Fee rate effective April 1, 2013. Effective April 1, 2013, Institutional Class shares of the Target Date Funds were reclassified as Class R6 shares. The Administration Fee rate paid by this share class prior to April 1, 2013 was 0.10%. |
The Investment Manager has retained the Sub-Advisers to manage the Funds’ investments. Subject to the supervision of the Investment Manager, the Sub-Advisers are responsible for making all of the investment decisions for the Funds for which they serve as sub-adviser. The Investment Manager, not the Funds, pays a portion of the fees it receives as Investment Manager to the Sub-Advisers in return for their services.
| Sub-Adviser(s) | Funds | |
AGI U.S. | AllianzGI Retirement 2015, AllianzGI Retirement 2020, AllianzGI Retirement 2025, AllianzGI Retirement 2030, AllianzGI Retirement 2035, AllianzGI Retirement 2040, AllianzGI Retirement 2045, AllianzGI Retirement 2050, AllianzGI Retirement 2055, AllianzGI Retirement Income, AllianzGI Global Allocation, AllianzGI Global Growth Allocation, AllianzGI China Equity, AllianzGI Convertible, AllianzGI Disciplined Equity, AllianzGI Dynamic Emerging Multi-Asset, AllianzGI Global Managed Volatility, AllianzGI Global Water, AllianzGI High Yield Bond, AllianzGI International Small-Cap, AllianzGI Micro Cap, AllianzGI Multi-Asset Real Return, AllianzGI Redwood, AllianzGI Short Duration High Income, AllianzGI Structured Alpha, AllianzGI Ultra Micro Cap, AllianzGI U.S. Emerging Growth, AllianzGI U.S. Equity Hedged |
| 242 | May 31, 2013 | | Semiannual Report |
Table of Contents
| Sub-Adviser(s) | Funds | |
Fuller & Thaler | AllianzGI Behavioral Advantage Large Cap | |
NFJ | AllianzGI NFJ Emerging Markets Value, AllianzGI NFJ Global Dividend Value, AllianzGI NFJ International Small-Cap, AllianzGI NFJ International Value II |
Distribution and Servicing Fees. Allianz Global Investors Distributors LLC (the “Distributor”), an affiliate of AAM, the Investment Manager and the Sub-Advisers (with the exception of Fuller & Thaler), serves as the distributor of the Funds’ shares pursuant to separate Distribution Servicing Plans for Class A, B, C, D and R. The Distributor, for each of the Funds, receives (i) servicing fees of 0.25% of the average daily net assets of each of Class A, B, C, D and R in connection with services rendered to shareholders of each class and the maintenance of shareholder accounts, and (ii) distribution fees of 0.75% of the average daily net assets of each of Class B and C (with the exception of Class C for AllianzGI Short Duration High Income which is 0.25%) and 0.25% of average daily net assets of Class R in connection with the distribution of Class B, C and R shares.
Pursuant to the Distribution and Servicing Plans adopted by the A, B, C, D and R classes, the Funds compensate the Distributor for services provided and expenses incurred in connection with assistance
rendered in the sale of shares and services rendered to shareholders and for maintenance of shareholder accounts.
Pursuant to the Distribution Plan for the Administrative Class shares, the Funds are permitted to reimburse the Distributor out of the Administrative Class’ assets of each Fund offering Administrative Class shares, in an amount up to 0.25% on an annual basis of the average net assets of the Administrative Class, for payments made to financial intermediaries that provide services in connection with the distribution of shares or administration plans or programs that use fund shares as their funding medium. Unreimbursed costs may be carried forward for reimbursement for up to twelve months beyond the date in which they are incurred, subject always to the limit that no more than 0.25% of the average daily net assets attributable to the Administrative Class may be expensed.
The Distributor also receives the proceeds of the initial sales charges paid by the shareholders upon the purchase of Class A shares and contingent deferred sales charges (“CDSC”) paid by the shareholders upon certain redemptions of Class A, B and C shares. For the six months ended May 31, 2013, the Distributor received $150,508, representing commissions (sales charges) and CDSC.
| 6. | EXPENSE LIMITATION |
The Trust and the Investment Manager have entered into Expense Limitation and Management Fee Waiver Agreements as indicated below:
| Expense Limitation | ||||||||||||||||||||||||||||||||||||||||
| Management Fee Waiver %(1) | Class A | Class B | Class C | Class D | Class R | Class P | Class R6 | Institutional Class | Administrative Class | |||||||||||||||||||||||||||||||
AllianzGI Retirement 2015(2) | N/A | 0.97 | % | N/A | 1.72 | % | 1.07 | % | 1.32 | % | 0.67 | % | 0.57 | % | N/A | 0.92 | % | |||||||||||||||||||||||
AllianzGI Retirement 2020(2) | N/A | 0.99 | N/A | 1.74 | 1.09 | 1.34 | 0.69 | 0.59 | N/A | 0.94 | ||||||||||||||||||||||||||||||
AllianzGI Retirement 2025(2) | N/A | 1.01 | N/A | N/A | N/A | 1.36 | 0.71 | 0.61 | N/A | 0.96 | ||||||||||||||||||||||||||||||
AllianzGI Retirement 2030(2) | N/A | 1.03 | N/A | 1.78 | 1.13 | 1.38 | 0.73 | 0.63 | * | N/A | 0.98 | |||||||||||||||||||||||||||||
AllianzGI Retirement 2035(2) | N/A | 1.06 | N/A | N/A | N/A | 1.41 | 0.76 | 0.66 | * | N/A | 1.01 | |||||||||||||||||||||||||||||
AllianzGI Retirement 2040(2) | N/A | 1.09 | N/A | 1.84 | 1.19 | 1.44 | 0.79 | 0.69 | * | N/A | 1.04 | |||||||||||||||||||||||||||||
AllianzGI Retirement 2045(2) | N/A | 1.10 | N/A | N/A | N/A | 1.45 | 0.80 | 0.70 | * | N/A | 1.05 | |||||||||||||||||||||||||||||
AllianzGI Retirement 2050(2) | N/A | 1.10 | N/A | 1.85 | 1.20 | 1.45 | 0.80 | * | 0.70 | * | N/A | 1.05 | ||||||||||||||||||||||||||||
AllianzGI Retirement 2055(2) | N/A | 1.10 | N/A | N/A | N/A | 1.45 | 0.80 | * | 0.70 | * | N/A | 1.05 | ||||||||||||||||||||||||||||
AllianzGI Retirement Income(2) | N/A | 0.95 | N/A | 1.70 | 1.05 | 1.30 | 0.65 | 0.55 | * | N/A | 0.90 | |||||||||||||||||||||||||||||
AllianzGI Global Allocation(3) | 0.70 | % | 0.40 | 1.11 | % | 1.13 | 0.35 | 0.56 | 0.16 | N/A | 0.16 | % | 0.41 | |||||||||||||||||||||||||||
AllianzGI Global Growth Allocation(3) | 0.70 | 0.40 | N/A | 1.18 | 0.40 | 0.63 | 0.23 | N/A | 0.13 | 0.38 | ||||||||||||||||||||||||||||||
AllianzGI Behavioral Advantage Large Cap(4) | N/A | 0.83 | N/A | 1.57 | 0.81 | N/A | 0.65 | N/A | 0.55 | N/A | ||||||||||||||||||||||||||||||
AllianzGI China Equity(4) | N/A | 1.73 | N/A | 2.56 | 1.77 | N/A | 1.51 | N/A | 1.45 | N/A | ||||||||||||||||||||||||||||||
AllianzGI Convertible(4) | N/A | N/A | N/A | N/A | N/A | N/A | 0.80 | N/A | N/A | N/A | ||||||||||||||||||||||||||||||
AllianzGI Disciplined Equity(4) | N/A | 0.95 | N/A | 1.70 | 0.95 | N/A | 0.79 | N/A | 0.70 | N/A | ||||||||||||||||||||||||||||||
AllianzGI Dynamic Emerging Multi-Asset(6) | N/A | 1.45 | N/A | 2.20 | 1.45 | N/A | 1.30 | N/A | 1.20 | N/A | ||||||||||||||||||||||||||||||
AllianzGI Global Managed Volatility(4) | N/A | 0.95 | N/A | 1.63 | 0.88 | N/A | 0.70 | N/A | 0.60 | N/A | ||||||||||||||||||||||||||||||
AllianzGI Global Water(4) | N/A | 1.57 | N/A | 2.33 | 1.60 | N/A | 1.40 | N/A | 1.30 | N/A | ||||||||||||||||||||||||||||||
AllianzGI High Yield Bond(4) | N/A | N/A | N/A | N/A | 1.00 | 1.15 | N/A | N/A | N/A | 0.90 | ||||||||||||||||||||||||||||||
AllianzGI International Small-Cap(4) | N/A | 1.45 | N/A | 2.20 | 1.45 | 1.70 | 1.30 | N/A | 1.21 | 1.45 | ||||||||||||||||||||||||||||||
AllianzGI Micro Cap(4) | N/A | 1.80 | N/A | N/A | N/A | N/A | 1.63 | N/A | 1.54 | N/A | ||||||||||||||||||||||||||||||
AllianzGI Multi-Asset Real Return(6) | N/A | 0.85 | N/A | 1.60 | 0.85 | N/A | 0.70 | N/A | 0.60 | N/A | ||||||||||||||||||||||||||||||
AllianzGI NFJ Emerging Markets Value(5) | N/A | 1.55 | N/A | 2.30 | 1.55 | N/A | 1.40 | N/A | 1.30 | N/A | ||||||||||||||||||||||||||||||
| Semiannual Report | | May 31, 2013 | 243 |
Table of Contents
Notes to Financial Statements (cont’d)
May 31, 2013 (Unaudited)
| Expense Limitation | ||||||||||||||||||||||||||||||||||||||||
| Management Fee Waiver %(1) | Class A | Class B | Class C | Class D | Class R | Class P | Class R6 | Institutional Class | Administrative Class | |||||||||||||||||||||||||||||||
AllianzGI NFJ Global Dividend Value(4) | N/A | 1.20 | % | N/A | 1.99 | % | 1.30 | % | N/A | 1.04 | % | N/A | 0.95 | % | N/A | |||||||||||||||||||||||||
AllianzGI NFJ International Small-Cap Value(5) | N/A | 1.45 | N/A | 2.20 | 1.45 | N/A | 1.30 | N/A | 1.20 | N/A | ||||||||||||||||||||||||||||||
AllianzGI NFJ International Value II(4) | N/A | 1.20 | N/A | 1.95 | 1.20 | N/A | 1.05 | N/A | 0.95 | N/A | ||||||||||||||||||||||||||||||
AllianzGI Redwood(4) | N/A | 1.60 | N/A | 2.50 | 1.75 | N/A | 1.50 | N/A | 1.40 | N/A | ||||||||||||||||||||||||||||||
AllianzGI Short Duration High Income(4) | N/A | 0.85 | N/A | 1.10 | 0.85 | N/A | 0.70 | N/A | 0.61 | N/A | ||||||||||||||||||||||||||||||
AllianzGI Structured Alpha(5) | N/A | 1.90 | N/A | 2.65 | 1.90 | N/A | 1.75 | N/A | 1.65 | N/A | ||||||||||||||||||||||||||||||
AllianzGI Ultra Micro Cap(4) | N/A | 2.17 | N/A | N/A | N/A | N/A | 2.00 | N/A | 2.00 | N/A | ||||||||||||||||||||||||||||||
AllianzGI U.S. Emerging Growth(4) | N/A | 1.50 | N/A | 2.21 | 1.42 | 1.67 | 1.25 | N/A | 1.16 | N/A | ||||||||||||||||||||||||||||||
AllianzGI U.S. Equity Hedged(5) | N/A | 1.25 | N/A | 2.00 | 1.25 | N/A | 1.10 | N/A | 1.00 | N/A | ||||||||||||||||||||||||||||||
| (1) | The Investment Manager has contractually agreed to irrevocably waive a portion of its management fee with respect to the noted Funds. The waiver is calculated on the average daily net assets of each applicable Fund that are attributable to investments in either Underlying Funds or Other Acquired Funds based on the rates disclosed in the above table. This waiver with respect to investments in Underlying Funds and Other Acquired Funds for which the Investment Manager or an affiliated person thereof serves as investment adviser is terminable only by the Board of Trustees of the Trust, and the waiver with respect to investments in unaffiliated Other Acquired Funds will continue through at least March 31, 2014. This waiver does not apply to net assets of the Fund not invested in shares of Underlying Funds or Other Acquired Funds (e.g., direct investments in other securities and instruments). |
| (2) | The Investment Manager has contractually agreed, until March 31, 2014, to irrevocably waive its management and administrative fees and reimburse any additional Other Expenses or Acquired Fund Fees and Expenses, to the extent that Total Annual Fund Operating Expenses after Expense Reductions, excluding, interest, taxes, and extraordinary expenses, exceed the rates noted in the table above based on the Fund’s average net assets attributable to each share class. Under the Expense Limitation Agreement, the Investment Manager may recoup waived or reimbursed amounts for three years, provided total expenses, including such recoupment, do not exceed the annual expense limit. |
| (3) | Effective April 1, 2013, the Investment Manager has contractually agreed, until March 31, 2014, to irrevocably waive its management fee, and/or reimburse the Fund, to the extent that, after the application of the fee waiver described in footnote (1) above, Total Annual Fund Operating Expenses, excluding interest, tax, extraordinary expenses, Acquired Fund Fees and Expenses and certain credits and other expenses, exceed the rates noted in the table above based on the Fund’s average net assets attributable to each share class. Under the Expense Limitation Agreement, the Investment Manager may recoup waived or reimbursed amounts for three years, provided total expenses, including such recoupment, do not exceed the annual expense limit. |
| (4) | Effective April 1, 2013, the Investment Manager has contractually agreed, until March 31, 2014, to irrevocably waive its management fee, and/or reimburse the Fund, to the extent that, Total Annual Fund Operating Expenses, excluding interest, tax, and extraordinary expenses, and certain credits and other expenses, exceed the rates noted in the table above based upon the Fund’s average net assets attributable to each share class. Under the Expense Limitation Agreement, the Investment Manager may recoup waived or reimbursed amounts for three years, provided total expenses, including such recoupment, do not exceed the annual expense limit. |
| (5) | The Investment Manager has contractually agreed, until March 31, 2014, to irrevocably waive its management fee, and/or reimburse the Fund, to the extent that, Total Annual Fund Operating Expenses, including payment of organizational expenses, but excluding interest, tax, and extraordinary expenses, and certain credits and other expenses, exceed the rates noted in the table above based upon the Fund’s average net assets attributable to each share class. Under the Expense Limitation Agreement, the Investment Manager may recoup waived or reimbursed amounts for three years, provided total expenses, including such recoupment, do not exceed the annual expense limit. |
| (6) | The Investment Manager has contractually agreed, until March 31, 2014, to irrevocably waive its management fee, and/or reimburse the Fund, to the extent that, Total Annual Fund Operating Expenses, including payment of organizational expenses, but excluding interest, tax, extraordinary expenses, acquired fund expenses, and certain credits and other expenses, exceed the rates noted in the table above based upon the Fund’s average net assets attributable to each share class. Under the Expense Limitation Agreement, the Investment Manager may recoup waived or reimbursed amounts for three years, provided total expenses, including such recoupment, do not exceed the annual expense limit. |
| * | As a result of reimbursing expenses inclusive of Acquired Fund Fees and Expenses, the Investment Manager reimbursed amounts in excess of the respective share class’ operating expenses. The aggregate excess reimbursement is accounted for as Contribution from Investment Manager on the Statements of Operations. |
The following represents the amounts waived/reimbursed by the Investment Manager based on expense limitation agreements. The Investment Manager may recoup waived/reimbursed amounts for a period of up to three years, provided total expenses, including such recoupment, do not exceed the annual expense limit.
| Expenses Waived/Reimbursed through Year Ended November 30, | ||||||||||||||||
| 2010 | 2011 | 2012 | Total | |||||||||||||
AllianzGI Retirement 2015 | $ | 245,565 | $ | 115,844 | $ | 18,532 | $ | 379,941 | ||||||||
AllianzGI Retirement 2020 | 237,557 | 111,506 | 14,067 | 363,130 | ||||||||||||
AllianzGI Retirement 2025 | — | — | 7,439 | 7,439 | ||||||||||||
AllianzGI Retirement 2030 | 232,525 | 114,098 | 30,870 | 377,493 | ||||||||||||
AllianzGI Retirement 2035 | — | — | 10,573 | 10,573 | ||||||||||||
AllianzGI Retirement 2040 | 236,918 | 117,868 | 20,733 | 375,519 | ||||||||||||
AllianzGI Retirement 2045 | — | — | 9,262 | 9,262 | ||||||||||||
AllianzGI Retirement 2050 | 223,990 | 114,967 | 19,237 | 358,194 | ||||||||||||
AllianzGI Retirement 2055 | — | — | 8,988 | 8,988 | ||||||||||||
AllianzGI Retirement Income | 237,529 | 113,571 | 35,421 | 386,521 | ||||||||||||
| 244 | May 31, 2013 | | Semiannual Report |
Table of Contents
| Expenses Waived/Reimbursed through Year Ended November 30, | ||||||||||||||||
| 2010 | 2011 | 2012 | Total | |||||||||||||
AllianzGI Global Allocation | $ | 463,814 | $ | 467,765 | $ | 529,000 | $ | 1,460,579 | ||||||||
AllianzGI Global Growth Allocation | 211,967 | 207,323 | 211,891 | 631,181 | ||||||||||||
AllianzGI Behavioral Advantage Large Cap | — | 132,104 | 235,009 | 367,113 | ||||||||||||
AllianzGI China Equity | 190,240 | 211,250 | 217,554 | 619,044 | ||||||||||||
AllianzGI Convertible | 57,322 | 20,603 | 24,375 | 102,300 | ||||||||||||
AllianzGI Disciplined Equity | 163,381 | 126,115 | 170,173 | 459,669 | ||||||||||||
AllianzGI Global Managed Volatility | — | — | 286,597 | 286,597 | ||||||||||||
AllianzGI Global Water | 22,481 | 14,679 | 75,188 | 112,348 | ||||||||||||
AllianzGI High Yield Bond | 222,688 | 146,759 | 48,062 | 417,509 | ||||||||||||
AllianzGI International Small-Cap | 463,717 | 210,863 | 266,627 | 941,207 | ||||||||||||
AllianzGI Micro Cap | 44,624 | 64,375 | 131,890 | 240,889 | ||||||||||||
AllianzGI NFJ Global Dividend Value | 212,714 | 162,039 | 171,065 | 545,818 | ||||||||||||
AllianzGI NFJ International Small-Cap Value | — | — | 175,822 | 175,822 | ||||||||||||
AllianzGI NFJ International Value II | — | — | 302,633 | 302,633 | ||||||||||||
AllianzGI Redwood | — | 224,180 | 200,389 | 424,569 | ||||||||||||
AllianzGI Short Duration High Income | — | 71,503 | 173,560 | 245,063 | ||||||||||||
AllianzGI Ultra Micro Cap | 88,765 | 99,239 | 143,704 | 331,708 | ||||||||||||
AllianzGI U.S. Emerging Growth | 94,010 | 177,572 | 197,501 | 469,083 | ||||||||||||
| 7. | INVESTMENTS IN SECURITIES |
For the period or six months ended May 31, 2013, purchases and sales of investments, other than short-term securities and U.S. government obligations were:
| Purchases | Sales | |||||||
AllianzGI Retirement 2015 | $ | 13,794,851 | $ | 7,606,598 | ||||
AllianzGI Retirement 2020 | 26,977,988 | 8,555,076 | ||||||
AllianzGI Retirement 2025 | 27,199,480 | 5,326,877 | ||||||
AllianzGI Retirement 2030 | 20,132,601 | 8,176,646 | ||||||
AllianzGI Retirement 2035 | 19,035,905 | 3,074,658 | ||||||
AllianzGI Retirement 2040 | 13,854,383 | 3,333,744 | ||||||
AllianzGI Retirement 2045 | 6,529,660 | 1,700,254 | ||||||
AllianzGI Retirement 2050 | 4,215,119 | 2,386,189 | ||||||
AllianzGI Retirement 2055 | 1,121,565 | 731,437 | ||||||
AllianzGI Retirement Income | 12,147,748 | 10,645,433 | ||||||
AllianzGI Global Allocation | 43,171,194 | 51,772,255 | ||||||
AllianzGI Global Growth Allocation | 4,861,241 | 4,254,692 | ||||||
AllianzGI Global Managed Volatility | 7,335,663 | 6,928,257 | ||||||
AllianzGI Behavioral Advantage Large Cap | 22,026,118 | 6,232,497 | ||||||
AllianzGI China Equity | 706,603 | 829,552 | ||||||
AllianzGI Convertible | 908,516,625 | 491,246,088 | ||||||
AllianzGI Disciplined Equity | 9,109,670 | 8,172,574 | ||||||
AllianzGI Dynamic Emerging Multi-Asset | 2,850,000 | 434,146 | ||||||
AllianzGI Global Water | 60,379,072 | 18,477,916 | ||||||
AllianzGI High Yield Bond | 237,931,612 | 191,701,200 | ||||||
AllianzGI International Small-Cap | 54,165,818 | 91,736,446 | ||||||
| Purchases | Sales | |||||||
AllianzGI Micro Cap | $ | 10,469,984 | $ | 8,795,922 | ||||
AllianzGI Multi-Asset Real Return | 4,374,530 | 519,873 | ||||||
AllianzGI NFJ Emerging Markets Value | 7,834,838 | 1,624,629 | ||||||
AllianzGI NFJ Global Dividend Value | 20,765,310 | 10,304,817 | ||||||
AllianzGI NFJ International Small-Cap Value | 4,276,061 | 1,405,787 | ||||||
AllianzGI NFJ International Value II | 459,734 | 1,354,261 | ||||||
AllianzGI Redwood | 2,188,462 | 5,095,006 | ||||||
AllianzGI Short Duration High Income | 339,007,986 | 113,247,410 | ||||||
AllianzGI Structured Alpha | 152,034 | 161,862 | ||||||
AllianzGI Ultra Micro Cap | 30,479,612 | 10,904,838 | ||||||
AllianzGI U.S. Emerging Growth | 11,279,450 | 8,270,306 | ||||||
AllianzGI U.S. Equity Hedged | 3,529,077 | 163,288 | ||||||
Purchases and sales in U.S. government obligations for AllianzGI Multi-Asset Real Return were $1,204,042 and $212,487, respectively.
(a) Transactions in options written for the period or six months ended May 31, 2013:
| AllianzGI Redwood: | ||||||||
| Contracts | Premiums | |||||||
Options outstanding, November 30, 2012 | 2,802 | $ | 2,119,873 | |||||
Options written | 2,762 | 1,823,744 | ||||||
Options terminated in closing transactions | (2,505 | ) | (1,825,368 | ) | ||||
Options exercised | (980 | ) | (649,246 | ) | ||||
Options outstanding, May 31, 2013 | 2,079 | $ | 1,469,003 | |||||
| Semiannual Report | | May 31, 2013 | 245 |
Table of Contents
Notes to Financial Statements (cont’d)
May 31, 2013 (Unaudited)
| AllianzGI Structured Alpha: | ||||||||
| Contracts | Premiums | |||||||
Options outstanding, December 3, 2012† | — | — | ||||||
Options written | 3,985 | $ | 966,783 | |||||
Options terminated in closing transactions | (509 | ) | (116,118 | ) | ||||
Options expired | (2,079 | ) | (561,842 | ) | ||||
Options exercised | (86 | ) | (23,604 | ) | ||||
Options outstanding, May 31, 2013 | 1,311 | $ | 265,219 | |||||
| † | Commencement of operations |
| AllianzGI U.S. Equity Hedged: | ||||||||
| Contracts | Premiums | |||||||
Options outstanding, December 3, 2012† | — | — | ||||||
Options written | 139 | $ | 64,760 | |||||
Options terminated in closing transactions | (62 | ) | (33,873 | ) | ||||
Options expired | (54 | ) | (22,408 | ) | ||||
Options outstanding, May 31, 2013 | 23 | $ | 8,479 | |||||
| † | Commencement of operations |
(b) Futures contracts outstanding at May 31, 2013:
| AllianzGI Dynamic Emerging Multi-Asset: | ||||||||||||||||
| Type | Contracts | Market Value (000s) | Expiration Date | Unrealized Appreciation (Depreciation) | ||||||||||||
Long: BIST 30 Index | 17 | $ | 96 | 6/28/13 | $ | 1,480 | ||||||||||
BOVESPA Index | 2 | 107 | 6/12/13 | (1,648 | ) | |||||||||||
Hang Seng China Enterprises Index | 1 | 67 | 6/27/13 | (799 | ) | |||||||||||
KOSPI 200 Index | 1 | 116 | 6/13/13 | (2,257 | ) | |||||||||||
Mini MSCI Emerging Markets Index | 59 | 2,917 | 6/21/13 | (178,756 | ) | |||||||||||
Short: FTSE/JSE Top 40 Index | (2 | ) | (75 | ) | 6/20/13 | (2,855 | ) | |||||||||
Mexican Bolsa IPC Index | (3 | ) | (98 | ) | 6/21/13 | 6,172 | ||||||||||
MSCI Taiwan Index | (4 | ) | (118 | ) | 6/27/13 | 720 | ||||||||||
S&P CNX Nifty Index | (9 | ) | (108 | ) | 6/27/13 | 755 | ||||||||||
| $ | (177,188 | ) | ||||||||||||||
| AllianzGI Multi-Asset Real Return: | ||||||||||||||||
| Type | Contracts | Market Value (000s) | Expiration Date | Unrealized Appreciation | ||||||||||||
Short: Dow Jones U.S. Real Estate Index | (7 | ) | $ | (186 | ) | 6/21/13 | $ | 1,630 | ||||||||
(c) Forward foreign currency contracts outstanding at May 31, 2013:
| AllianzGI Global Water: | ||||||||||||||
| Counterparty | U.S.$ Value on Origination Date | U.S.$ Value May 31, 2013 | Unrealized Depreciation | |||||||||||
Purchased: | ||||||||||||||
593,542 Brazil Real settling 6/3/13 | State Street Bank and Trust Co. | $ | 282,142 | $ | 277,123 | $ | (5,019 | ) | ||||||
Glossary:
BIST—Borsa Istanbul
BOVESPA—Sao Paulo Stock Exchange
CNX—National Stock Exchange of India
FTSE—Financial Times Stock Exchange
JSE—Johannesburg Stock Exchange Limited
KOSPI—Korea Composite Stock Price Index
MSCI—Morgan Stanley Capital International
| 246 | May 31, 2013 | | Semiannual Report |
Table of Contents
| 8. | INCOME TAX INFORMATION |
At May 31, 2013, the aggregate cost basis and the net unrealized appreciation (depreciation) of investments (before options written) for federal income tax purposes were:
| Cost of Investments | Gross Unrealized Appreciation | Gross Unrealized Depreciation | Net Unrealized Appreciation (Depreciation) | |||||||||||||
AllianzGI Retirement 2015 | $ | 22,102,101 | $ | 747,772 | $ | 31,635 | $ | 716,137 | ||||||||
AllianzGI Retirement 2020 | 33,559,976 | 855,588 | 379,823 | 475,765 | ||||||||||||
AllianzGI Retirement 2025 | 33,071,281 | 623,093 | 681,834 | (58,741 | ) | |||||||||||
AllianzGI Retirement 2030 | 38,816,693 | 1,457,056 | 378,574 | 1,078,482 | ||||||||||||
AllianzGI Retirement 2035 | 26,112,730 | 785,265 | 310,105 | 475,160 | ||||||||||||
AllianzGI Retirement 2040 | 23,425,215 | 1,518,817 | 188,247 | 1,330,570 | ||||||||||||
AllianzGI Retirement 2045 | 10,341,945 | 680,307 | 75,370 | 604,937 | ||||||||||||
AllianzGI Retirement 2050 | 10,304,767 | 1,262,751 | 76,995 | 1,185,756 | ||||||||||||
AllianzGI Retirement 2055 | 3,782,225 | 488,390 | 27,456 | 460,934 | ||||||||||||
AllianzGI Retirement Income | 30,031,450 | 1,184,626 | 48,705 | 1,135,921 | ||||||||||||
AllianzGI Global Allocation | 182,144,900 | 27,716,281 | 844,997 | 26,871,284 | ||||||||||||
AllianzGI Global Growth Allocation | 7,212,971 | 1,254,042 | 3,327 | 1,250,715 | ||||||||||||
AllianzGI Behavioral Advantage Large Cap | 32,075,177 | 4,727,349 | 127,796 | 4,599,553 | ||||||||||||
AllianzGI China Equity | 4,029,006 | 446,510 | 342,922 | 103,588 | ||||||||||||
AllianzGI Convertible | 1,391,033,920 | 227,677,509 | 1,725,713 | 225,951,796 | ||||||||||||
AllianzGI Disciplined Equity | 43,627,630 | 9,681,353 | 532,085 | 9,149,268 | ||||||||||||
AllianzGI Dynamic Emerging Multi-Asset | 5,480,148 | — | 117,205 | (117,205 | ) | |||||||||||
AllianzGI Global Managed Volatility | 15,176,581 | 1,288,405 | 349,190 | 939,215 | ||||||||||||
AllianzGI Global Water | 153,007,935 | 21,467,412 | 1,955,391 | 19,512,021 | ||||||||||||
AllianzGI High Yield Bond | 376,999,397 | 19,737,924 | 2,252,445 | 17,485,479 | ||||||||||||
AllianzGI International Small-Cap | 79,209,761 | 18,969,468 | 1,160,804 | 17,808,664 | ||||||||||||
AllianzGI Micro Cap | 24,861,093 | 11,078,542 | 330,673 | 10,747,869 | ||||||||||||
AllianzGI Multi-Asset Real Return | 4,886,487 | 111,437 | 127,820 | (16,383 | ) | |||||||||||
AllianzGI NFJ Emerging Markets Value | 6,395,750 | 326,700 | 301,652 | 25,048 | ||||||||||||
AllianzGI NFJ Global Dividend Value | 64,570,474 | 7,668,225 | 3,441,946 | 4,226,279 | ||||||||||||
AllianzGI NFJ International Small-Cap Value | 7,441,156 | 1,017,991 | 204,905 | 813,086 | ||||||||||||
AllianzGI NFJ International Value II | 3,333,636 | 565,539 | 121,541 | 443,998 | ||||||||||||
AllianzGI Redwood | 8,251,387 | 1,082,105 | 217,584 | 864,521 | ||||||||||||
AllianzGI Short Duration High Income | 452,255,478 | 2,798,298 | 1,927,483 | 870,815 | ||||||||||||
AllianzGI Structured Alpha | 8,285,801 | 86,300 | 39,026 | 47,274 | ||||||||||||
AllianzGI Ultra Micro Cap | 33,096,070 | 9,834,610 | 301,820 | 9,532,790 | ||||||||||||
AllianzGI U.S. Emerging Growth | 21,786,997 | 7,701,103 | 99,438 | 7,601,665 | ||||||||||||
AllianzGI U.S. Equity Hedged | 3,939,520 | 495,949 | 139,801 | 356,148 | ||||||||||||
Differences, if any, between book and tax cost basis were attributable to wash sale loss deferrals and the differing treatment of bond premium amortization.
| Semiannual Report | | May 31, 2013 | 247 |
Table of Contents
Notes to Financial Statements (cont’d)
May 31, 2013 (Unaudited)
| 9. | SHARES OF BENEFICIAL INTEREST |
The Trust may issue an unlimited number of shares of beneficial interest with $0.0001 par value. Changes in shares of beneficial interest were as follows:
| AllianzGI Retirement 2015 | AllianzGI Retirement 2020 | |||||||||||||||||||||||||||||||
| Six Months ended May 31, 2013 (unaudited) | Year ended November 30, 2012 | Six Months ended May 31, 2013 (unaudited) | Year ended November 30, 2012 | |||||||||||||||||||||||||||||
| Shares | Amount | Shares | Amount | Shares | Amount | Shares | Amount | |||||||||||||||||||||||||
Shares sold: | ||||||||||||||||||||||||||||||||
Class A | 263,448 | $ | 5,131,451 | 52,210 | $ | 983,604 | 554,681 | $ | 10,577,207 | 42,059 | $ | 794,384 | ||||||||||||||||||||
Class C | 4,760 | 90,997 | 26,098 | 485,033 | 10,564 | 202,371 | 9,416 | 170,341 | ||||||||||||||||||||||||
Class D | 5,176 | 100,137 | 60,969 | 1,170,564 | 947 | 18,112 | 10,258 | 188,707 | ||||||||||||||||||||||||
Class R | 1,091 | 21,222 | 28,200 | 549,028 | 4,077 | 77,597 | 48,210 | 922,209 | ||||||||||||||||||||||||
Class P | 64,602 | 1,267,987 | 293,349 | 5,736,466 | 276,685 | 5,294,013 | 309,702 | 5,956,849 | ||||||||||||||||||||||||
Class R6 | 43,001 | 842,809 | 115,056 | 2,214,339 | 44,829 | 861,537 | 111,098 | 2,114,844 | ||||||||||||||||||||||||
Administrative Class | 222,719 | 4,386,649 | — | — | 411,395 | 7,997,697 | — | — | ||||||||||||||||||||||||
Issued in reinvestment of dividends and distributions: |
| |||||||||||||||||||||||||||||||
Class A | 7,679 | 146,212 | 4,991 | 88,833 | 12,596 | 235,543 | 1,503 | 26,129 | ||||||||||||||||||||||||
Class C | 1,957 | 36,887 | 6,593 | 115,904 | 189 | 3,542 | 2,937 | 50,493 | ||||||||||||||||||||||||
Class D | 1,909 | 36,338 | 818 | 14,582 | 356 | 6,689 | 459 | 7,997 | ||||||||||||||||||||||||
Class R | 692 | 13,152 | 43 | 770 | 1,325 | 24,783 | 58 | 1,021 | ||||||||||||||||||||||||
Class P | 5,757 | 110,299 | 47 | 841 | 7,176 | 135,272 | 168 | 2,938 | ||||||||||||||||||||||||
Class R6 | 11,467 | 219,816 | 20,135 | 360,020 | 10,185 | 192,188 | 23,292 | 407,373 | ||||||||||||||||||||||||
Administrative Class | 21 | 397 | 46 | 814 | 189 | 3,546 | 61 | 1,068 | ||||||||||||||||||||||||
Cost of shares redeemed: | ||||||||||||||||||||||||||||||||
Class A | (100,841 | ) | (1,963,695 | ) | (48,067 | ) | (900,420 | ) | (132,829 | ) | (2,535,603 | ) | (10,746 | ) | (200,147 | ) | ||||||||||||||||
Class C | (26,581 | ) | (509,570 | ) | (52,365 | ) | (964,987 | ) | (701 | ) | (13,380 | ) | (29,066 | ) | (535,060 | ) | ||||||||||||||||
Class D | (60,386 | ) | (1,164,215 | ) | (8,965 | ) | (168,667 | ) | (2,209 | ) | (42,269 | ) | (2,985 | ) | (54,936 | ) | ||||||||||||||||
Class R | (8,389 | ) | (164,820 | ) | (4,941 | ) | (95,428 | ) | (4 | ) | (80 | ) | — | — | ||||||||||||||||||
Class P | (30,645 | ) | (596,442 | ) | (98,557 | ) | (1,922,855 | ) | (115,403 | ) | (2,223,814 | ) | (36,346 | ) | (697,105 | ) | ||||||||||||||||
Class R6 | (58,033 | ) | (1,143,622 | ) | (26,134 | ) | (492,826 | ) | (63,561 | ) | (1,229,246 | ) | (7,426 | ) | (138,449 | ) | ||||||||||||||||
Administrative Class | (18,797 | ) | (367,341 | ) | — | — | (37,870 | ) | (730,660 | ) | — | — | ||||||||||||||||||||
Net increase resulting from Fund share transactions | 330,607 | $ | 6,494,648 | 369,526 | $ | 7,175,615 | 982,617 | $ | 18,855,045 | 472,652 | $ | 9,018,656 | ||||||||||||||||||||
| ** | Commencement of operations. |
| 248 | May 31, 2013 | | Semiannual Report |
Table of Contents
| AllianzGI Retirement 2025 | AllianzGI Retirement 2030 | |||||||||||||||||||||||||||||
| Six Months ended May 31, 2013 (unaudited) | Period from December 19, 2011** through November 30, 2012 | Six Months ended May 31, 2013 (unaudited) | Year ended November 30, 2012 | |||||||||||||||||||||||||||
| Shares | Amount | Shares | Amount | Shares | Amount | Shares | Amount | |||||||||||||||||||||||
| 789,724 | $ | 13,083,771 | 19,499 | $ | 322,887 | 383,360 | $ | 7,580,920 | 535,486 | $ | 10,521,899 | |||||||||||||||||||
| — | — | — | — | 11,648 | 230,194 | 5,776 | 110,521 | |||||||||||||||||||||||
| — | — | — | — | 8,157 | 163,989 | 6,680 | 129,765 | |||||||||||||||||||||||
| 13,539 | 223,918 | 100,349 | 1,664,628 | 18,457 | 366,944 | 64,558 | 1,284,337 | |||||||||||||||||||||||
| 115,027 | 1,926,502 | 284,836 | 4,742,028 | 207,353 | 4,128,768 | 293,307 | 5,899,283 | |||||||||||||||||||||||
| 23,133 | 386,525 | 122,988 | 2,005,560 | 83,522 | 1,680,745 | 151,622 | 2,978,216 | |||||||||||||||||||||||
| 621,778 | 10,518,403 | — | — | 443,737 | 9,066,715 | — | — | |||||||||||||||||||||||
| 15,455 | 251,148 | 6 | 96 | 12,297 | 237,954 | 2,371 | 42,635 | |||||||||||||||||||||||
| — | — | — | — | 601 | 11,578 | 3,220 | 57,499 | |||||||||||||||||||||||
| — | — | — | — | 547 | 10,646 | 1,883 | 33,951 | |||||||||||||||||||||||
| 1,444 | 23,423 | 6 | 95 | 1,569 | 30,446 | 74 | 1,334 | |||||||||||||||||||||||
| 6,282 | 102,392 | 6 | 97 | 7,896 | 154,447 | 101 | 1,826 | |||||||||||||||||||||||
| 7,158 | 116,743 | 1,938 | 29,182 | 14,436 | 282,670 | 31,190 | 565,487 | |||||||||||||||||||||||
| 16 | 261 | 6 | 96 | 23 | 453 | 76 | 1,384 | |||||||||||||||||||||||
| (78,850 | ) | (1,308,649 | ) | — | — | (461,708 | ) | (9,148,324 | ) | (21,160 | ) | (409,358 | ) | |||||||||||||||||
| — | — | — | — | (3,579 | ) | (70,288 | ) | (11,587 | ) | (220,202 | ) | |||||||||||||||||||
| — | — | — | — | (7,361 | ) | (147,554 | ) | (1,413 | ) | (27,113 | ) | |||||||||||||||||||
| (42,994 | ) | (714,926 | ) | (23,545 | ) | (389,169 | ) | (14,015 | ) | (284,243 | ) | (9,782 | ) | (192,903 | ) | |||||||||||||||
| (69,688 | ) | (1,169,072 | ) | (53,172 | ) | (880,856 | ) | (51,922 | ) | (1,046,242 | ) | (39,471 | ) | (784,020 | ) | |||||||||||||||
| (65,161 | ) | (1,089,319 | ) | (2,719 | ) | (45,033 | ) | (36,302 | ) | (735,887 | ) | (15,595 | ) | (300,204 | ) | |||||||||||||||
| (6,829 | ) | (115,968 | ) | — | — | (2,551 | ) | (52,286 | ) | — | — | |||||||||||||||||||
| 1,330,034 | $ | 22,235,152 | 450,198 | $ | 7,449,611 | 616,165 | $ | 12,461,645 | 997,336 | $ | 19,694,337 | |||||||||||||||||||
| Semiannual Report | | May 31, 2013 | 249 |
Table of Contents
Notes to Financial Statements (cont’d)
May 31, 2013 (Unaudited)
| AllianzGI Retirement 2035 | AllianzGI Retirement 2040 | |||||||||||||||||||||||||||||||
| Six Months ended May 31, 2013 (unaudited) | Period from December 19, 2011** through November 30, 2012 | Six Months ended May 31, 2013 (unaudited) | Year ended November 30, 2012 | |||||||||||||||||||||||||||||
| Shares | Amount | Shares | Amount | Shares | Amount | Shares | Amount | |||||||||||||||||||||||||
Shares sold: | ||||||||||||||||||||||||||||||||
Class A | 309,968 | $ | 5,243,097 | 5,452 | $ | 92,566 | 224,696 | $ | 4,430,298 | 91,090 | $ | 1,780,970 | ||||||||||||||||||||
Class C | — | — | — | — | 3,132 | 62,469 | 5,188 | 101,131 | ||||||||||||||||||||||||
Class D | — | — | — | — | 2,449 | 49,329 | 7,904 | 147,945 | ||||||||||||||||||||||||
Class R | 4,403 | 75,511 | 52,212 | 885,286 | 8,816 | 177,432 | 57,331 | 1,129,675 | ||||||||||||||||||||||||
Class P | 82,897 | 1,439,289 | 263,986 | 4,512,788 | 113,316 | 2,255,729 | 129,893 | 2,604,412 | ||||||||||||||||||||||||
Class R6 | 16,606 | 287,175 | 102,582 | 1,737,925 | 54,419 | 1,099,775 | 113,581 | 2,211,077 | ||||||||||||||||||||||||
Administrative Class | 581,201 | 10,203,111 | 10 | 165 | 243,239 | 4,999,570 | — | — | ||||||||||||||||||||||||
Issued in reinvestment of dividends and distributions: | ||||||||||||||||||||||||||||||||
Class A | 6,733 | 111,774 | 8 | 116 | 5,552 | 107,202 | 1,023 | 18,264 | ||||||||||||||||||||||||
Class C | — | — | — | — | 258 | 4,970 | 566 | 10,081 | ||||||||||||||||||||||||
Class D | — | — | — | — | 298 | 5,755 | 1,261 | 22,454 | ||||||||||||||||||||||||
Class R | 1,370 | 22,695 | 7 | 115 | 1,194 | 22,978 | 99 | 1,761 | ||||||||||||||||||||||||
Class P | 6,932 | 115,414 | 8 | 117 | 3,580 | 69,519 | 103 | 1,847 | ||||||||||||||||||||||||
Class R6 | 8,622 | 143,645 | 2,324 | 35,326 | 11,816 | 229,698 | 36,478 | 652,814 | ||||||||||||||||||||||||
Administrative Class | 17 | 297 | 8 | 117 | 36 | 705 | 102 | 1,814 | ||||||||||||||||||||||||
Cost of shares redeemed: | ||||||||||||||||||||||||||||||||
Class A | (27,143 | ) | (472,003 | ) | — | — | (84,102 | ) | (1,663,641 | ) | (2,345 | ) | (44,570 | ) | ||||||||||||||||||
Class C | — | — | — | — | (102 | ) | (2,073 | ) | (57 | ) | (1,136 | ) | ||||||||||||||||||||
Class D | — | — | — | — | (4,254 | ) | (85,320 | ) | (5,946 | ) | (115,837 | ) | ||||||||||||||||||||
Class R | (5,106 | ) | (87,391 | ) | — | — | (878 | ) | (17,640 | ) | (14,993 | ) | (293,261 | ) | ||||||||||||||||||
Class P | (17,362 | ) | (298,110 | ) | (23,985 | ) | (405,929 | ) | (24,074 | ) | (490,898 | ) | (12,542 | ) | (245,008 | ) | ||||||||||||||||
Class R6 | (10,378 | ) | (177,198 | ) | (3,029 | ) | (50,867 | ) | (14,011 | ) | (285,047 | ) | (19,134 | ) | (368,356 | ) | ||||||||||||||||
Administrative Class | (19,583 | ) | (343,581 | ) | — | — | (5,689 | ) | (117,475 | ) | — | — | ||||||||||||||||||||
Net increase resulting from Fund share transactions | 939,177 | $ | 16,263,725 | 399,583 | $ | 6,807,725 | 539,691 | $ | 10,853,335 | 389,602 | $ | 7,616,077 | ||||||||||||||||||||
| ** | Commencement of operations. |
| 250 | May 31, 2013 | | Semiannual Report |
Table of Contents
| AllianzGI Retirement 2045 | AllianzGI Retirement 2050 | |||||||||||||||||||||||||||||
| Six Months ended May 31, 2013 (unaudited) | Period from December 19, 2011** through November 30, 2012 | Six Months ended May 31, 2013 (unaudited) | Year ended November 30, 2012 | |||||||||||||||||||||||||||
| Shares | Amount | Shares | Amount | Shares | Amount | Shares | Amount | |||||||||||||||||||||||
| 166,489 | $ | 2,838,454 | 2,877 | $ | 46,824 | 19,363 | $ | 379,900 | 73,849 | $ | 1,433,418 | |||||||||||||||||||
| — | — | — | — | 251 | 4,974 | 9,809 | 183,673 | |||||||||||||||||||||||
| — | — | — | — | 1,452 | 29,244 | 4,767 | 88,925 | |||||||||||||||||||||||
| 2,168 | 37,458 | 22,789 | 388,873 | 5,535 | 109,330 | 17,496 | 343,121 | |||||||||||||||||||||||
| 48,777 | 855,248 | 102,450 | 1,769,959 | 28,517 | 573,483 | 38,703 | 772,368 | |||||||||||||||||||||||
| 6,839 | 119,679 | 16,701 | 283,073 | 62,817 | 1,255,525 | 70,281 | 1,344,627 | |||||||||||||||||||||||
| 76,313 | 1,349,648 | 49 | 800 | 35,947 | 736,179 | — | — | |||||||||||||||||||||||
| 4,451 | 73,979 | 9 | 145 | 977 | 18,588 | 742 | 13,087 | |||||||||||||||||||||||
| — | — | — | — | 78 | 1,481 | �� | 330 | 5,804 | ||||||||||||||||||||||
| — | — | — | — | 346 | 6,589 | 1,370 | 24,223 | |||||||||||||||||||||||
| 554 | 9,183 | 9 | 144 | 657 | 12,493 | 119 | 2,106 | |||||||||||||||||||||||
| 3,124 | 52,068 | 10 | 146 | 1,411 | 27,033 | 110 | 1,957 | |||||||||||||||||||||||
| 7,232 | 120,622 | 2,878 | 43,892 | 12,048 | 230,968 | 37,392 | 664,241 | |||||||||||||||||||||||
| 22 | 371 | 9 | 145 | 30 | 569 | 108 | 1,924 | |||||||||||||||||||||||
| (4,365 | ) | (76,606 | ) | — | — | (53,414 | ) | (1,040,517 | ) | (7,725 | ) | (148,446 | ) | |||||||||||||||||
| — | — | — | — | — | — | (9,438 | ) | (178,260 | ) | |||||||||||||||||||||
| — | — | — | — | (1,269 | ) | (24,873 | ) | (5,115 | ) | (97,681 | ) | |||||||||||||||||||
| (1,683 | ) | (29,207 | ) | (6,170 | ) | (103,365 | ) | (270 | ) | (5,420 | ) | (4 | ) | (82 | ) | |||||||||||||||
| (15,264 | ) | (261,897 | ) | (10,285 | ) | (174,692 | ) | (5,664 | ) | (113,079 | ) | (804 | ) | (15,836 | ) | |||||||||||||||
| (581 | ) | (10,089 | ) | (930 | ) | (15,640 | ) | (9,029 | ) | (183,107 | ) | (34,239 | ) | (653,349 | ) | |||||||||||||||
| (2,041 | ) | (35,941 | ) | — | — | (800 | ) | (16,510 | ) | — | — | |||||||||||||||||||
| 292,035 | $ | 5,042,970 | 130,396 | $ | 2,240,304 | 98,983 | $ | 2,002,850 | 197,751 | $ | 3,785,820 | |||||||||||||||||||
| Semiannual Report | | May 31, 2013 | 251 |
Table of Contents
Notes to Financial Statements (cont’d)
May 31, 2013 (Unaudited)
| AllianzGI Retirement 2055 | AllianzGI Retirement Income | |||||||||||||||||||||||||||||||
| Six Months ended May 31, 2013 (unaudited) | Period from December 19, 2011** through November 30, 2012 | Six Months ended May 31, 2013 (unaudited) | Year ended November 30, 2012 | |||||||||||||||||||||||||||||
| Shares | Amount | Shares | Amount | Shares | Amount | Shares | Amount | |||||||||||||||||||||||||
Shares sold: | ||||||||||||||||||||||||||||||||
Class A | 3,618 | $ | 61,084 | — | * | $ | 5 | 56,506 | $ | 1,084,647 | 104,477 | $ | 1,943,555 | |||||||||||||||||||
Class B | — | — | — | — | — | — | — | — | ||||||||||||||||||||||||
Class C | — | — | — | — | 21,437 | 406,051 | 142,319 | 2,594,798 | ||||||||||||||||||||||||
Class D | — | — | — | — | 29,089 | 559,170 | 75,722 | 1,405,815 | ||||||||||||||||||||||||
Class R | 796 | 13,646 | 1,702 | 29,037 | 784 | 15,457 | 12,896 | 253,995 | ||||||||||||||||||||||||
Class P | 3,096 | 53,598 | 2,890 | 50,048 | 158,509 | 3,044,651 | 254,187 | 4,933,933 | ||||||||||||||||||||||||
Institutional Class | — | — | — | — | — | — | — | — | ||||||||||||||||||||||||
Class R6 | 9,994 | 171,302 | 2,531 | 42,964 | 57,700 | 1,094,921 | 337,609 | 6,323,203 | ||||||||||||||||||||||||
Administrative Class | 3,657 | 64,123 | — | — | 117,895 | 2,299,625 | — | — | ||||||||||||||||||||||||
Issued in reinvestment of dividends and distributions: | ||||||||||||||||||||||||||||||||
Class A | 76 | 1,248 | 10 | 147 | 8,197 | 155,196 | 11,016 | 199,771 | ||||||||||||||||||||||||
Class B | — | — | — | — | — | — | — | — | ||||||||||||||||||||||||
Class C | — | — | — | — | 8,955 | 167,903 | 13,593 | 243,808 | ||||||||||||||||||||||||
Class D | — | — | — | — | 2,476 | 47,112 | 1,726 | 31,775 | ||||||||||||||||||||||||
Class R | 123 | 2,003 | 10 | 146 | 169 | 3,307 | 36 | 676 | ||||||||||||||||||||||||
Class P | 197 | 3,227 | 9 | 148 | 8,845 | 169,666 | 1,143 | 22,009 | ||||||||||||||||||||||||
Institutional Class | — | — | — | — | — | — | — | — | ||||||||||||||||||||||||
Class R6 | 11,179 | 183,101 | 2,905 | 44,398 | 17,609 | 331,140 | 14,117 | 255,459 | ||||||||||||||||||||||||
Administrative Class | 35 | 578 | 9 | 147 | 100 | 1,911 | 33 | 602 | ||||||||||||||||||||||||
Cost of shares redeemed: | ||||||||||||||||||||||||||||||||
Class A | (183 | ) | (3,126 | ) | — | — | (58,329 | ) | (1,116,637 | ) | (103,039 | ) | (1,915,362 | ) | ||||||||||||||||||
Class B | — | — | — | — | — | — | — | — | ||||||||||||||||||||||||
Class C | — | — | — | — | (96,437 | ) | (1,830,037 | ) | (112,566 | ) | (2,069,627 | ) | ||||||||||||||||||||
Class D | — | — | — | — | (16,115 | ) | (309,379 | ) | (14,652 | ) | (271,620 | ) | ||||||||||||||||||||
Class R | (22 | ) | (373 | ) | (95 | ) | (1,595 | ) | (2,970 | ) | (58,813 | ) | (4,586 | ) | (89,922 | ) | ||||||||||||||||
Class P | (167 | ) | (2,853 | ) | (111 | ) | (1,879 | ) | (57,091 | ) | (1,108,533 | ) | (11,679 | ) | (225,184 | ) | ||||||||||||||||
Institutional Class | — | — | — | — | — | — | — | — | ||||||||||||||||||||||||
Class R6 | (186 | ) | (3,306 | ) | (74 | ) | (1,263 | ) | (168,132 | ) | (3,205,539 | ) | (29,950 | ) | (548,345 | ) | ||||||||||||||||
Administrative Class | (44 | ) | (783 | ) | — | — | (703 | ) | (13,687 | ) | — | — | ||||||||||||||||||||
Net increase (decrease) resulting from Fund share transactions | 32,169 | $ | 543,469 | 9,786 | $ | 162,303 | 88,494 | $ | 1,738,132 | 692,402 | $ | 13,089,339 | ||||||||||||||||||||
| * | Actual amount rounds to less than 1 share. |
| ** | Commencement of operations. |
| 252 | May 31, 2013 | | Semiannual Report |
Table of Contents
| AllianzGI Global Allocation | AllianzGI Global Growth Allocation | |||||||||||||||||||||||||||||
| Six Months ended May 31, 2013 (unaudited) | Year ended November 30, 2012 | Six Months ended May 31, 2013 (unaudited) | Year ended November 30, 2012 | |||||||||||||||||||||||||||
| Shares | Amount | Shares | Amount | Shares | Amount | Shares | Amount | |||||||||||||||||||||||
| 230,914 | $ | 2,616,215 | 803,395 | $ | 8,530,086 | 19,481 | $ | 452,243 | 21,867 | $ | 469,277 | |||||||||||||||||||
| 3,718 | 43,110 | 26,621 | 284,226 | — | — | — | — | |||||||||||||||||||||||
| 123,985 | 1,421,143 | 300,363 | 3,252,103 | 2,654 | 58,738 | 4,425 | 93,321 | |||||||||||||||||||||||
| 5,050 | 57,268 | 43,644 | 464,935 | 6,133 | 138,754 | 2,989 | 63,234 | |||||||||||||||||||||||
| — | — | — | — | 75 | 1,690 | 386 | 8,106 | |||||||||||||||||||||||
| 60,471 | 689,344 | 55,102 | 580,264 | 879 | 20,000 | — | — | |||||||||||||||||||||||
| 769,617 | 8,607,622 | 1,142,484 | 12,047,366 | 17,947 | 409,953 | 457 | 10,122 | |||||||||||||||||||||||
| — | — | — | — | — | — | — | — | |||||||||||||||||||||||
| 5,307 | 61,636 | 10,478 | 113,801 | — | — | — | — | |||||||||||||||||||||||
| 152,541 | 1,698,055 | 176,304 | 1,848,510 | 1,457 | 31,341 | 2,392 | 47,723 | |||||||||||||||||||||||
| 8,110 | 92,016 | 13,966 | 147,978 | — | — | — | — | |||||||||||||||||||||||
| 128,020 | 1,442,920 | 130,161 | 1,378,050 | 1,944 | 41,378 | 2,407 | 47,675 | |||||||||||||||||||||||
| 726 | 8,063 | 617 | 6,529 | 208 | 4,441 | 100 | 2,010 | |||||||||||||||||||||||
| 38 | 420 | 37 | 390 | 35 | 744 | 85 | 1,687 | |||||||||||||||||||||||
| 1,639 | 18,220 | 1,087 | 11,486 | 31 | 677 | 38 | 754 | |||||||||||||||||||||||
| 159,217 | 1,755,473 | 161,048 | 1,676,549 | 9,557 | 205,368 | 11,397 | 227,516 | |||||||||||||||||||||||
| — | — | — | — | — | — | — | — | |||||||||||||||||||||||
| 4,132 | 46,994 | 4,451 | 47,630 | 30 | 650 | 36 | 729 | |||||||||||||||||||||||
| (580,649 | ) | (6,576,962 | ) | (1,790,121 | ) | (19,070,811 | ) | (6,260 | ) | (139,452 | ) | (48,005 | ) | (1,036,566 | ) | |||||||||||||||
| (78,430 | ) | (905,849 | ) | (561,222 | ) | (6,073,688 | ) | — | — | — | — | |||||||||||||||||||
| (629,244 | ) | (7,226,058 | ) | (1,576,247 | ) | (16,942,687 | ) | (8,031 | ) | (181,181 | ) | (8,532 | ) | (179,421 | ) | |||||||||||||||
| (552 | ) | (6,275 | ) | (39,293 | ) | (424,840 | ) | (530 | ) | (11,954 | ) | (95 | ) | (2,089 | ) | |||||||||||||||
| — | — | — | — | (988 | ) | (21,886 | ) | (466 | ) | (10,071 | ) | |||||||||||||||||||
| (65,851 | ) | (747,536 | ) | (129,230 | ) | (1,363,817 | ) | — | — | — | — | |||||||||||||||||||
| (695,501 | ) | (7,808,220 | ) | (766,403 | ) | (8,055,090 | ) | (5,472 | ) | (125,787 | ) | — | — | |||||||||||||||||
| — | — | — | — | — | — | — | — | |||||||||||||||||||||||
| (6,706 | ) | (77,482 | ) | (25,534 | ) | (279,369 | ) | — | — | — | — | |||||||||||||||||||
| | (403,448 | ) | $ | (4,789,883 | ) | (2,018,292 | ) | $ | (21,820,399 | ) | 39,150 | $ | 885,717 | (10,519 | ) | $ | (255,993 | ) | ||||||||||||
| Semiannual Report | | May 31, 2013 | 253 |
Table of Contents
Notes to Financial Statements (cont’d)
May 31, 2013 (Unaudited)
| AllianzGI Behavioral Advantage Large Cap | AllianzGI China Equity | |||||||||||||||||||||||||||||||
| Six Months ended May 31, 2013 (unaudited) | Year ended November 30, 2012 | Six Months ended May 31, 2013 (unaudited) | Year ended November 30, 2012 | |||||||||||||||||||||||||||||
| Shares | Amount | Shares | Amount | Shares | Amount | Shares | Amount | |||||||||||||||||||||||||
Shares sold: | ||||||||||||||||||||||||||||||||
Class A | 10,654 | $ | 210,976 | 8,663 | $ | 157,879 | 2,457 | $ | 38,110 | 1,662 | $ | 23,697 | ||||||||||||||||||||
Class C | 709 | 14,220 | 2,726 | 49,240 | 1,997 | 31,878 | 174 | 2,409 | ||||||||||||||||||||||||
Class D | 22,167 | 403,700 | 870 | 15,971 | 35,268 | 544,254 | 62,032 | 891,056 | ||||||||||||||||||||||||
Class R | — | — | — | — | — | — | — | — | ||||||||||||||||||||||||
Class P | — | — | — | — | — | — | — | — | ||||||||||||||||||||||||
Institutional Class | 837,358 | 16,607,249 | 230,416 | 4,304,971 | 5,165 | 80,216 | — | — | ||||||||||||||||||||||||
Administrative Class | — | — | — | — | — | — | — | — | ||||||||||||||||||||||||
Issued in reinvestment of dividends and distributions: | ||||||||||||||||||||||||||||||||
Class A | 138 | 2,487 | 2 | 39 | 132 | 2,021 | 1,311 | 17,041 | ||||||||||||||||||||||||
Class C | 250 | 4,466 | 1 | 15 | — | * | 1 | 678 | 8,713 | |||||||||||||||||||||||
Class D | 406 | 7,287 | 2 | 39 | 733 | 11,195 | 1,443 | 18,777 | ||||||||||||||||||||||||
Class R | — | — | — | — | — | — | — | — | ||||||||||||||||||||||||
Class P | 51 | 919 | 3 | 44 | 14 | 226 | 889 | 11,641 | ||||||||||||||||||||||||
Institutional Class | 73,533 | 1,326,134 | 2,969 | 47,353 | 5,019 | 76,244 | 23,203 | 304,091 | ||||||||||||||||||||||||
Administrative Class | — | — | — | — | — | — | — | — | ||||||||||||||||||||||||
Cost of shares redeemed: | ||||||||||||||||||||||||||||||||
Class A | (897 | ) | (16,564 | ) | (6,766 | ) | (126,456 | ) | (3,393 | ) | (53,906 | ) | (6,410 | ) | (90,196 | ) | ||||||||||||||||
Class C | (1 | ) | (20 | ) | — | — | (2,589 | ) | (38,848 | ) | (4,357 | ) | (61,122 | ) | ||||||||||||||||||
Class D | (18,620 | ) | (380,533 | ) | (546 | ) | (10,253 | ) | (44,190 | ) | (684,888 | ) | (54,602 | ) | (786,395 | ) | ||||||||||||||||
Class R | — | — | — | — | — | — | — | — | ||||||||||||||||||||||||
Class P | — | — | — | — | — | — | (7,408 | ) | (106,101 | ) | ||||||||||||||||||||||
Institutional Class | (62,554 | ) | (1,246,506 | ) | (1,164 | ) | (22,493 | ) | (687 | ) | (10,055 | ) | (294 | ) | (3,859 | ) | ||||||||||||||||
Administrative Class | — | — | — | — | — | — | — | — | ||||||||||||||||||||||||
Net increase (decrease) resulting from Fund share transactions | 863,194 | $ | 16,933,815 | 237,176 | $ | 4,416,349 | (74 | ) | $ | (3,552 | ) | 18,321 | $ | 229,752 | ||||||||||||||||||
| * | Actual amount rounds to less than 1 share. |
| ** | Commencement of operations. |
| *** | Includes 254,170 shares in the amount of $3,853,218 in connection with redemption in-kind transactions. |
| 254 | May 31, 2013 | | Semiannual Report |
Table of Contents
| AllianzGI Convertible | AllianzGI Disciplined Equity | AllianzGI Dynamic Emerging Multi-Asset | ||||||||||||||||||||||||||||||||||||
| Six Months ended May 31, 2013 (unaudited) | Year ended November 30, 2012 | Six Months ended May 31, 2013 (unaudited) | Year ended November 30, 2012 | Period from December 17, 2012** through May 31, 2013 (unaudited) | ||||||||||||||||||||||||||||||||||
| Shares | Amount | Shares | Amount | Shares | Amount | Shares | Amount | Shares | Amount | |||||||||||||||||||||||||||||
| 2,265,335 | $ | 70,009,027 | 2,933,072 | $ | 81,106,399 | 121,227 | $ | 2,057,998 | 214,724 | $ | 3,480,616 | — | $ | — | ||||||||||||||||||||||||
| 460,622 | 14,100,765 | 704,869 | 19,490,939 | 4,603 | 81,022 | 19,080 | 300,381 | 1,061 | 15,958 | |||||||||||||||||||||||||||||
| 1,445,798 | 43,926,490 | 1,706,638 | 47,285,583 | 126 | 2,205 | 15,138 | 251,934 | 509 | 7,600 | |||||||||||||||||||||||||||||
| 8,390 | 256,807 | 7,202 | 199,494 | — | — | — | — | — | — | |||||||||||||||||||||||||||||
| 973,744 | 30,007,807 | 1,373,606 | 37,680,354 | 7 | 110 | 806 | 13,558 | — | — | |||||||||||||||||||||||||||||
| 13,081,441 | 397,974,475 | 11,402,852 | 314,743,526 | 379,975 | 6,521,406 | 701,134 | 11,352,011 | 11,891 | 178,125 | |||||||||||||||||||||||||||||
| 355,910 | 11,550,836 | 47,135 | 1,302,142 | — | — | — | — | — | — | |||||||||||||||||||||||||||||
| 24,953 | 738,162 | 181,364 | 4,779,499 | 3,037 | 49,487 | 2,884 | 42,785 | — | — | |||||||||||||||||||||||||||||
| 3,441 | 101,262 | 41,555 | 1,089,546 | 669 | 10,676 | 1,252 | 18,084 | — | — | |||||||||||||||||||||||||||||
| 10,524 | 312,015 | 102,046 | 2,685,854 | 286 | 4,746 | 139 | 2,063 | — | — | |||||||||||||||||||||||||||||
| 4 | 126 | 61 | 1,590 | — | — | — | — | — | — | |||||||||||||||||||||||||||||
| 12,080 | 355,320 | 59,781 | 1,574,608 | 34 | 561 | 40 | 599 | — | — | |||||||||||||||||||||||||||||
| 166,009 | 4,901,334 | 583,498 | 15,345,825 | 53,859 | 885,369 | 66,239 | 990,334 | — | — | |||||||||||||||||||||||||||||
| 655 | 19,217 | 4,701 | 123,598 | — | — | — | — | — | — | |||||||||||||||||||||||||||||
| (1,022,735 | ) | (30,424,383 | ) | (2,084,051 | ) | (57,773,819 | ) | (46,787 | ) | (807,120 | ) | (83,415 | ) | (1,350,606 | ) | — | — | |||||||||||||||||||||
| (102,550 | ) | (3,118,516 | ) | (417,607 | ) | (11,425,166 | ) | (16,117 | ) | (267,731 | ) | (24,698 | ) | (392,892 | ) | — | — | |||||||||||||||||||||
| (1,320,331 | ) | (39,253,045 | ) | (1,611,698 | ) | (44,470,566 | ) | (3,581 | ) | (63,294 | ) | (9,051 | ) | (143,255 | ) | — | — | |||||||||||||||||||||
| (3,123 | ) | (93,547 | ) | (1,131 | ) | (30,353 | ) | — | — | — | — | — | — | |||||||||||||||||||||||||
| (546,157 | ) | (16,616,967 | ) | (880,232 | ) | (24,082,232 | ) | — | — | (504 | ) | (8,478 | ) | — | — | |||||||||||||||||||||||
| (2,617,409 | ) | (79,323,852 | ) | (2,050,409 | ) | (56,123,373 | ) | (392,998 | ) | (6,900,530 | ) | (1,190,745 | )*** | (19,067,176 | )*** | — | — | |||||||||||||||||||||
| (14,545 | ) | (442,081 | ) | (22,076 | ) | (611,098 | ) | — | — | — | — | — | — | |||||||||||||||||||||||||
| | 13,182,056 | | $ | 404,981,252 | 12,081,176 | $ | 332,892,350 | 104,340 | $ | 1,574,905 | (286,977 | ) | $ | (4,510,042 | ) | 13,461 | $ | 201,683 | ||||||||||||||||||||
| Semiannual Report | | May 31, 2013 | 255 |
Table of Contents
Notes to Financial Statements (cont’d)
May 31, 2013 (Unaudited)
| AllianzGI Global Managed Volatility | AllianzGI Global Water | |||||||||||||||||||||||||||||||
| Six Months ended May 31, 2013 (unaudited) | Period from December 19, 2011** through November 30, 2012 | Six Months ended May 31, 2013 (unaudited) | Year ended November 30, 2012 | |||||||||||||||||||||||||||||
| Shares | Amount | Shares | Amount | Shares | Amount | Shares | Amount | |||||||||||||||||||||||||
Shares sold: | ||||||||||||||||||||||||||||||||
Class A | 4,684 | $ | 84,264 | 4,671 | $ | 73,379 | 2,856,966 | $ | 31,672,075 | 1,785,664 | $ | 17,000,729 | ||||||||||||||||||||
Class C | 4,630 | 77,613 | 88 | 1,426 | 846,536 | 9,195,736 | 359,683 | 3,430,947 | ||||||||||||||||||||||||
Class D | 3,998 | 69,132 | 1,617 | 26,850 | 915,693 | 10,028,267 | 262,141 | 2,564,649 | ||||||||||||||||||||||||
Class R | — | — | — | — | — | — | — | — | ||||||||||||||||||||||||
Class P | — | — | — | — | 1,191,659 | 13,317,322 | 893,077 | 8,676,258 | ||||||||||||||||||||||||
Institutional Class | 155,718 | 2,695,380 | 854,489 | 13,265,723 | 266,410 | 2,931,991 | 173,181 | 1,664,092 | ||||||||||||||||||||||||
Administrative Class | — | — | — | — | — | — | — | — | ||||||||||||||||||||||||
Issued in reinvestment of dividends and distributions: | ||||||||||||||||||||||||||||||||
Class A | 133 | 2,133 | — | — | 40,634 | 423,408 | 10,435 | 89,740 | ||||||||||||||||||||||||
Class C | 131 | 2,082 | — | — | 5,991 | 61,406 | 1 | 9 | ||||||||||||||||||||||||
Class D | 112 | 1,794 | — | — | 7,190 | 74,782 | 2,630 | 22,592 | ||||||||||||||||||||||||
Class R | — | — | — | — | — | — | — | — | ||||||||||||||||||||||||
Class P | 30 | 484 | — | — | 3,988 | 41,753 | 6,619 | 57,058 | ||||||||||||||||||||||||
Institutional Class | 42,277 | 680,089 | — | — | 5,276 | 54,605 | 1,245 | 10,656 | ||||||||||||||||||||||||
Administrative Class | — | — | — | — | — | — | — | — | ||||||||||||||||||||||||
Issued in reorganization: | ||||||||||||||||||||||||||||||||
Class A | — | — | — | — | — | — | 2,987,721 | 28,821,196 | ||||||||||||||||||||||||
Class C | — | — | — | — | — | — | 480,744 | 4,556,642 | ||||||||||||||||||||||||
Class D | — | — | — | — | — | — | 31,837 | 306,909 | ||||||||||||||||||||||||
Class P | — | — | — | — | — | — | 202,617 | 1,960,299 | ||||||||||||||||||||||||
Institutional Class | — | — | — | — | — | — | 12,597 | 121,106 | ||||||||||||||||||||||||
Cost of shares redeemed: | ||||||||||||||||||||||||||||||||
Class A | — | — | (2,357 | ) | (38,756 | ) | (905,929 | ) | (9,911,808 | ) | (2,019,824 | ) | (19,618,166 | ) | ||||||||||||||||||
Class C | (79 | ) | (1,301 | ) | — | — | (157,560 | ) | (1,693,366 | ) | (654,447 | ) | (6,115,935 | ) | ||||||||||||||||||
Class D | (1,614 | ) | (28,926 | ) | — | — | (196,300 | ) | (2,135,947 | ) | (311,343 | ) | (2,946,036 | ) | ||||||||||||||||||
Class R | — | — | — | — | — | — | — | — | ||||||||||||||||||||||||
Class P | — | — | — | — | (202,226 | ) | (2,240,106 | ) | (1,274,642 | ) | (11,987,423) | |||||||||||||||||||||
Institutional Class | (167,505 | ) | (2,867,708 | ) | (115,860 | ) | (1,866,909 | ) | (39,936 | ) | (435,348 | ) | (26,610 | ) | (263,581 | ) | ||||||||||||||||
Administrative Class | — | — | — | — | — | — | — | — | ||||||||||||||||||||||||
Net increase (decrease) resulting from Fund share transactions | 42,515 | $ | 715,036 | 742,648 | $ | 11,461,713 | 4,638,392 | $ | 51,384,770 | 2,923,326 | $ | 28,351,741 | ||||||||||||||||||||
| * | Actual amount rounds to less than 1 share. |
| ** | Commencement of operations. |
| 256 | May 31, 2013 | | Semiannual Report |
Table of Contents
| AllianzGI High Yield Bond | AllianzGI International Small-Cap | |||||||||||||||||||||||||||||
| Six Months ended May 31, 2013 (unaudited) | Year ended November 30, 2012 | Six Months ended May 31, 2013 (unaudited) | Year ended November 30, 2012 | |||||||||||||||||||||||||||
| Shares | Amount | Shares | Amount | Shares | Amount | Shares | Amount | |||||||||||||||||||||||
| 6,686,487 | $ | 68,790,923 | 5,367,308 | $ | 53,198,341 | 12,910 | $ | 451,878 | 59,211 | $ | 1,754,533 | |||||||||||||||||||
| 353,713 | 3,670,351 | 2,212,794 | 22,044,457 | 982 | 32,240 | 3,309 | 99,101 | |||||||||||||||||||||||
| 4,426,729 | 44,972,768 | 3,231,098 | 31,698,080 | 422 | 14,970 | 15,273 | 480,715 | |||||||||||||||||||||||
| 62,590 | 631,380 | 261,930 | 2,561,399 | 56 | 1,861 | 1 | 42 | |||||||||||||||||||||||
| 281,647 | 2,839,170 | 2,530,672 | 24,596,627 | 231,703 | 7,503,563 | 182,294 | 5,151,398 | |||||||||||||||||||||||
| 2,705,990 | 27,466,187 | 6,527,366 | 63,779,751 | 475,173 | 16,886,960 | 784,615 | 23,459,676 | |||||||||||||||||||||||
| 456,216 | 4,613,363 | 2,762,875 | 26,887,246 | — | — | 30,727 | 976,500 | |||||||||||||||||||||||
| 146,067 | 1,516,535 | 284,623 | 2,835,863 | — | * | 2 | 2,028 | 58,467 | ||||||||||||||||||||||
| 63,600 | 659,788 | 121,978 | 1,214,737 | 9 | 307 | 132 | 3,798 | |||||||||||||||||||||||
| 193,082 | 1,956,718 | 234,755 | 2,280,125 | — | * | 5 | — | * | 1 | |||||||||||||||||||||
| 3,996 | 40,340 | 8,117 | 78,936 | 2 | 74 | 3 | 72 | |||||||||||||||||||||||
| 28,273 | 284,981 | 74,363 | 719,630 | 7,133 | 230,908 | 5,964 | 172,071 | |||||||||||||||||||||||
| 431,279 | 4,362,434 | 850,237 | 8,254,807 | 24,678 | 814,869 | 35,017 | 1,031,247 | |||||||||||||||||||||||
| 99,148 | 999,674 | 240 | 2,336 | — | * | 1 | 4 | 100 | ||||||||||||||||||||||
| — | — | — | — | — | — | — | — | |||||||||||||||||||||||
| — | — | — | — | — | — | — | — | |||||||||||||||||||||||
| — | — | — | — | — | — | — | — | |||||||||||||||||||||||
| — | — | — | — | — | — | — | — | |||||||||||||||||||||||
| — | — | — | — | — | — | — | — | |||||||||||||||||||||||
| (6,823,508 | ) | (70,244,631 | ) | (1,185,991 | ) | (11,854,890 | ) | (8,917 | ) | (303,151 | ) | (119,216 | ) | (3,695,341 | ) | |||||||||||||||
| (584,339 | ) | (6,074,354 | ) | (594,822 | ) | (5,935,856 | ) | (2,123 | ) | (72,123 | ) | (2,944 | ) | (88,524 | ) | |||||||||||||||
| (1,737,994 | ) | (17,637,971 | ) | (1,183,672 | ) | (11,534,678 | ) | (318 | ) | (10,496 | ) | (62,661 | ) | (1,855,558 | ) | |||||||||||||||
| (45,915 | ) | (463,423 | ) | (92,597 | ) | (908,197 | ) | (4 | ) | (132 | ) | — | — | |||||||||||||||||
| (817,903 | ) | (8,241,199 | ) | (1,805,423 | ) | (17,592,687 | ) | (345,671 | ) | (11,424,457 | ) | (528,203 | ) | (15,113,158 | ) | |||||||||||||||
| (2,076,634 | ) | (21,112,129 | ) | (2,532,861 | ) | (24,764,333 | ) | (1,519,954 | ) | (54,346,615 | ) | (1,050,453 | ) | (32,297,122 | ) | |||||||||||||||
| (315,144 | ) | (3,192,670 | ) | (165 | ) | (1,610 | ) | — | — | (30,727 | ) | (989,405 | ) | |||||||||||||||||
| | 3,537,380 | | $ | 35,838,235 | 17,072,825 | $ | 167,560,084 | (1,123,919 | ) | $ | (40,219,336 | ) | (675,626 | ) | $ | (20,851,387 | ) | |||||||||||||
| Semiannual Report | | May 31, 2013 | 257 |
Table of Contents
Notes to Financial Statements (cont’d)
May 31, 2013 (Unaudited)
AllianzGI Micro Cap | AllianzGI Multi-Asset Real Return | |||||||||||||||||||||||
| Six Months ended May 31, 2013 (unaudited) | Year ended November 30, 2012 | Period from December 17, 2012** through May 31, 2013 (unaudited) | ||||||||||||||||||||||
| Shares | Amount | Shares | Amount | Shares | Amount | |||||||||||||||||||
Shares sold: | ||||||||||||||||||||||||
Class A | 23,453 | $ | 280,622 | 14,220 | † | $ | 159,580 | † | 1,882 | $ | 29,225 | |||||||||||||
Class C | — | — | — | — | 379 | 6,000 | ||||||||||||||||||
Class D | — | — | — | — | — | — | ||||||||||||||||||
Class P | 79,078 | 943,620 | 10,231 | 116,044 | — | — | ||||||||||||||||||
Institutional Class | 364,966 | 4,415,700 | 403,866 | 4,534,781 | 2,068 | 31,718 | ||||||||||||||||||
Issued in reinvestment of dividends and distributions: | ||||||||||||||||||||||||
Class A | 753 | 7,965 | — | — | — | — | ||||||||||||||||||
Class C | — | — | — | — | — | — | ||||||||||||||||||
Class D | — | — | — | — | — | — | ||||||||||||||||||
Class P | 2,266 | 23,970 | 6,875 | 68,342 | — | — | ||||||||||||||||||
Institutional Class | 183,042 | 1,943,906 | 741,436 | 7,377,291 | — | — | ||||||||||||||||||
Cost of shares redeemed: | ||||||||||||||||||||||||
Class A | (4,651 | ) | (52,654 | ) | (2,636 | ) | (30,092 | ) | — | — | ||||||||||||||
Class C | — | — | — | — | — | — | ||||||||||||||||||
Class D | — | — | — | — | — | — | ||||||||||||||||||
Class P | (33,373 | ) | (425,522 | ) | (23,389 | ) | (253,300 | ) | — | — | ||||||||||||||
Institutional Class | (284,928 | ) | (3,425,787 | ) | (2,605,330 | ) | (29,370,011 | ) | — | — | ||||||||||||||
Net increase (decrease) resulting from Fund share transactions | 330,606 | $ | 3,711,820 | (1,454,727 | ) | $ | (17,397,365 | ) | 4,329 | $ | 66,943 | |||||||||||||
| † | Inclusive of shares sold to AAM subsequent to commencement of operations. |
| * | Actual amount rounds to less than 1 share. |
| ** | Commencement of operations. |
| 258 | May 31, 2013 | | Semiannual Report |
Table of Contents
| AllianzGI NFJ Emerging Markets Value | AllianzGI NFJ Global Dividend Value | AllianzGI NFJ International Small-Cap Value | ||||||||||||||||||||||||||||||||||||
| Period from December 18, 2012** through May 31, 2013 (unaudited) | Six Months ended May 31, 2013 (unaudited) | Year ended November 30, 2012 | Six Months ended May 31, 2013 (unaudited) | Period from June 1, 2012** through November 30, 2012 | ||||||||||||||||||||||||||||||||||
| Shares | Amount | Shares | Amount | Shares | Amount | Shares | Amount | Shares | Amount | |||||||||||||||||||||||||||||
| 652 | $ | 10,419 | 94,343 | $ | 1,837,408 | 259,744 | $ | 4,800,074 | 3,496 | $ | 64,244 | 60,682 | $ | 1,035,838 | ||||||||||||||||||||||||
| — | — | 28,348 | 553,435 | 105,088 | 1,878,626 | 1,068 | 19,997 | — | — | |||||||||||||||||||||||||||||
| 44,999 | 711,960 | 6,432 | 128,590 | 22,351 | 420,067 | 35,123 | 628,511 | 4,953 | 81,619 | |||||||||||||||||||||||||||||
| — | — | 13,819 | 275,852 | 22,328 | 413,721 | — | — | — | — | |||||||||||||||||||||||||||||
| 181,588 | 2,906,616 | 728,861 | 14,084,943 | 1,345,536 | 24,789,877 | 133,565 | 2,439,949 | 7,423 | 123,440 | |||||||||||||||||||||||||||||
| — | * | 1 | 3,509 | 67,693 | 13,951 | 236,720 | 1,291 | 22,518 | — | — | ||||||||||||||||||||||||||||
| — | * | 1 | 2,445 | 46,661 | 6,875 | 115,928 | 7 | 127 | — | — | ||||||||||||||||||||||||||||
| — | * | 6 | 393 | 7,669 | 1,051 | 17,801 | 199 | 3,476 | — | — | ||||||||||||||||||||||||||||
| — | * | 1 | 937 | 18,193 | 2,334 | 40,417 | 10 | 184 | — | — | ||||||||||||||||||||||||||||
| 44 | 690 | 40,906 | 785,639 | 76,111 | 1,311,651 | 3,427 | 60,037 | — | — | |||||||||||||||||||||||||||||
| — | — | (30,239 | ) | (604,772 | ) | (264,114 | ) | (4,756,024 | ) | (146 | ) | (2,700 | ) | — | — | |||||||||||||||||||||||
| — | — | (28,034 | ) | (534,818 | ) | (68,980 | ) | (1,235,256 | ) | (266 | ) | (5,169 | ) | — | — | |||||||||||||||||||||||
| (16,006 | ) | (253,723 | ) | (4,297 | ) | (84,250 | ) | (29,498 | ) | (525,609 | ) | (40 | ) | (750 | ) | (729 | ) | (11,893 | ) | |||||||||||||||||||
| — | — | (8,809 | ) | (170,476 | ) | (6,496 | ) | (119,915 | ) | — | — | — | — | |||||||||||||||||||||||||
| (372 | ) | (5,934 | ) | (299,755 | ) | (5,905,319 | ) | (454,010 | ) | (8,196,829 | ) | (4,539 | ) | (88,593 | ) | — | — | |||||||||||||||||||||
| 210,905 | $ | 3,370,037 | 548,859 | $ | 10,506,448 | 1,032,271 | $ | 19,191,249 | 173,195 | $ | 3,141,831 | 72,329 | $ | 1,229,004 | ||||||||||||||||||||||||
| Semiannual Report | | May 31, 2013 | 259 |
Table of Contents
Notes to Financial Statements (cont’d)
May 31, 2013 (Unaudited)
| AllianzGI NFJ International Value II | AllianzGI Redwood | |||||||||||||||||||||||||||||||
| Six Months ended May 31, 2013 (unaudited) | Period from December 1, 2011** through November 30, 2012 | Six Months ended May 31, 2013 (unaudited) | Year ended November 30, 2012 | |||||||||||||||||||||||||||||
| Shares | Amount | Shares | Amount | Shares | Amount | Shares | Amount | |||||||||||||||||||||||||
Shares sold: | ||||||||||||||||||||||||||||||||
Class A | 918 | $ | 16,009 | 2,325 | $ | 36,528 | 656 | $ | 10,000 | 33,139 | $ | 495,315 | ||||||||||||||||||||
Class C | 254 | 4,315 | — | — | — | — | 1,575 | 23,434 | ||||||||||||||||||||||||
Class D | 2 | 32 | — | — | — | * | 1 | 4,621 | 69,500 | |||||||||||||||||||||||
Class P | — | — | — | — | — | — | — | — | ||||||||||||||||||||||||
Institutional Class | 9,648 | 164,731 | 64,375 | 1,049,950 | 11,188 | 173,675 | 66,820 | 1,009,291 | ||||||||||||||||||||||||
Issued in reinvestment of dividends and distributions: | ||||||||||||||||||||||||||||||||
Class A | 44 | 738 | 11 | 179 | — | * | 2 | — | — | |||||||||||||||||||||||
Class C | 8 | 131 | 8 | 122 | 7 | 104 | — | — | ||||||||||||||||||||||||
Class D | 9 | 152 | 11 | 174 | — | * | 1 | — | — | |||||||||||||||||||||||
Class P | 10 | 159 | 13 | 190 | 46 | 698 | — | — | ||||||||||||||||||||||||
Institutional Class | 3,813 | 64,024 | 3,959 | 59,335 | 2,991 | 45,816 | — | — | ||||||||||||||||||||||||
Cost of shares redeemed: | ||||||||||||||||||||||||||||||||
Class A | — | — | — | — | (51,323 | ) | (788,515 | ) | (13,012 | ) | (195,214 | ) | ||||||||||||||||||||
Class C | — | — | — | — | (22 | ) | (346 | ) | (1,391 | ) | (20,486 | ) | ||||||||||||||||||||
Class D | — | — | — | — | (580 | ) | (9,022 | ) | (31,135 | ) | (462,986 | ) | ||||||||||||||||||||
Class P | — | — | — | — | (419 | ) | (6,524 | ) | (2,429 | ) | (36,506 | ) | ||||||||||||||||||||
Institutional Class | (65,289 | ) | (1,115,507 | ) | — | — | (136,827 | ) | (2,128,957 | ) | (59,964 | ) | (896,485 | ) | ||||||||||||||||||
Net increase (decrease) resulting from Fund share transactions | (50,583 | ) | $ | (865,216 | ) | 70,702 | $ | 1,146,478 | (174,283 | ) | $ | (2,703,067 | ) | (1,776 | ) | $ | (14,137 | ) | ||||||||||||||
| † | Inclusive of shares sold to AAM subsequent to commencement of operations. |
| * | Actual amount rounds to less than 1 share. |
| ** | Commencement of operations. |
| 260 | May 31, 2013 | | Semiannual Report |
Table of Contents
| AllianzGI Short Duration High Income | AllianzGI Structured Alpha | AllianzGI Ultra Micro Cap | ||||||||||||||||||||||||||||||||||||
| Six Months ended May 31, 2013 (unaudited) | Year ended November 30, 2012 | Period from December 3, 2012** through May 31, 2013 (unaudited) | Six Months ended May 31, 2013 (unaudited) | Year ended November 30, 2012 | ||||||||||||||||||||||||||||||||||
| Shares | Amount | Shares | Amount | Shares | Amount | Shares | Amount | Shares | Amount | |||||||||||||||||||||||||||||
| 5,262,839 | $ | 84,389,364 | 5,441,375 | $ | 86,173,327 | — | $ | — | 611,922 | $ | 10,876,875 | 479,482 | † | $ | 7,241,883 | † | ||||||||||||||||||||||
| 1,360,743 | 21,780,898 | 1,813,868 | 28,660,618 | — | — | — | — | — | — | |||||||||||||||||||||||||||||
| 451,308 | 7,233,028 | 739,468 | 11,744,664 | 53,668 | 806,510 | — | — | — | — | |||||||||||||||||||||||||||||
| 4,549,830 | 72,900,356 | 3,635,261 | 57,619,158 | — | — | 7,431 | 135,491 | 2,959 | 44,850 | |||||||||||||||||||||||||||||
| 5,713,077 | 91,723,698 | 2,305,209 | 36,203,148 | 87,239 | 1,323,908 | 995,238 | 18,017,428 | 239,726 | 3,579,989 | |||||||||||||||||||||||||||||
| 135,462 | 2,166,897 | 52,459 | 830,120 | — | — | — | — | — | — | |||||||||||||||||||||||||||||
| 40,346 | 644,239 | 19,812 | 312,191 | — | — | — | — | — | — | |||||||||||||||||||||||||||||
| 19,396 | 310,197 | 5,845 | 92,317 | — | — | — | — | — | — | |||||||||||||||||||||||||||||
| 50,800 | 812,366 | 17,060 | 269,911 | — | — | — | — | 306 | 3,948 | |||||||||||||||||||||||||||||
| 114,823 | 1,838,730 | 75,123 | 1,182,990 | — | — | — | — | 12,551 | 162,280 | |||||||||||||||||||||||||||||
| (1,405,995 | ) | (22,516,971 | ) | (456,146 | ) | (7,211,217 | ) | — | — | (77,602 | ) | (1,393,659 | ) | (37,584 | ) | (559,750 | ) | |||||||||||||||||||||
| (215,708 | ) | (3,451,859 | ) | (123,231 | ) | (1,941,690 | ) | — | — | — | — | — | — | |||||||||||||||||||||||||
| (134,595 | ) | (2,155,966 | ) | (122,129 | ) | (1,935,792 | ) | (632 | ) | (9,664 | ) | — | — | — | — | |||||||||||||||||||||||
| (1,530,548 | ) | (24,521,493 | ) | (337,169 | ) | (5,347,294 | ) | — | — | (3,866 | ) | (68,093 | ) | (4,435 | ) | (67,840 | ) | |||||||||||||||||||||
| (514,722 | ) | (8,256,226 | ) | (513,355 | ) | (8,137,559 | ) | — | — | (430,535 | ) | (7,950,533 | ) | (390,114 | ) | (5,875,094 | ) | |||||||||||||||||||||
| | 13,897,056 | | $ | 222,897,258 | 12,553,450 | $ | 198,514,892 | 140,275 | $ | 2,120,754 | 1,102,588 | $ | 19,617,509 | 302,891 | $ | 4,530,266 | ||||||||||||||||||||||
| Semiannual Report | | May 31, 2013 | 261 |
Table of Contents
Notes to Financial Statements (cont’d)
May 31, 2013 (Unaudited)
| AllianzGI U.S. Emerging Growth | AllianzGI U.S. Equity Hedged | |||||||||||||||||||||||
| Six Months ended May 31, 2013 (unaudited) | Year ended November 30, 2012 | Period from December 3, 2012** through May 31, 2013 (unaudited) | ||||||||||||||||||||||
| Shares | Amount | Shares | Amount | Shares | Amount | |||||||||||||||||||
Shares sold: | ||||||||||||||||||||||||
Class A | 106,671 | $ | 1,602,630 | 55,050 | $ | 717,877 | 11,611 | $ | 188,840 | |||||||||||||||
Class C | 6,230 | 85,733 | 10,051 | 134,400 | — | — | ||||||||||||||||||
Class D | 305 | 4,501 | 4,553 | 59,530 | 12,912 | 199,041 | ||||||||||||||||||
Class R | 421 | 6,622 | — | — | — | — | ||||||||||||||||||
Class P | 787 | 11,782 | 3,076 | 40,905 | — | — | ||||||||||||||||||
Institutional Class | 380,001 | 5,615,161 | 356,680 | 4,690,148 | 25,087 | 391,084 | ||||||||||||||||||
Issued in reinvestment of dividends and distributions: | ||||||||||||||||||||||||
Class A | 298 | 3,838 | 568 | 6,682 | — | — | ||||||||||||||||||
Class C | 325 | 4,127 | 854 | 9,981 | — | — | ||||||||||||||||||
Class D | 87 | 1,115 | 173 | 2,039 | — | — | ||||||||||||||||||
Class R | 16 | 203 | 61 | 718 | — | — | ||||||||||||||||||
Class P | 28 | 364 | 98 | 1,158 | — | — | ||||||||||||||||||
Institutional Class | 30,413 | 395,368 | 113,057 | 1,336,329 | — | — | ||||||||||||||||||
Cost of shares redeemed: | ||||||||||||||||||||||||
Class A | (8,780 | ) | (129,093 | ) | (15,766 | ) | (207,988 | ) | — | — | ||||||||||||||
Class C | (3,307 | ) | (46,870 | ) | (3,550 | ) | (45,852 | ) | — | — | ||||||||||||||
Class D | (454 | ) | (6,887 | ) | (2,453 | ) | (32,799 | ) | (389 | ) | (6,222 | ) | ||||||||||||
Class P | (106 | ) | (1,527 | ) | (2,916 | ) | (39,075 | ) | — | — | ||||||||||||||
Institutional Class | (296,971 | ) | (4,409,916 | ) | (519,499 | ) | (6,921,701 | ) | — | — | ||||||||||||||
Net increase (decrease) resulting from Fund share transactions | 215,964 | $ | 3,137,151 | 37 | $ | (247,648 | ) | 49,221 | $ | 772,743 | ||||||||||||||
| ** | Commencement of operations. |
| 10. | INVESTMENTS BY AFFILIATES AND INVESTMENTS IN AFFILIATES |
At May 31, 2013, AFI held 5% or more of the outstanding shares of the following Funds:
| Approximate Ownership | ||||
AllianzGI Retirement 2015 | 15 | % | ||
AllianzGI Retirement 2020 | 11 | % | ||
AllianzGI Retirement 2025 | 7 | % | ||
AllianzGI Retirement 2030 | 13 | % | ||
AllianzGI Retirement 2035 | 14 | % | ||
AllianzGI Retirement 2040 | 22 | % | ||
AllianzGI Retirement 2045 | 34 | % | ||
AllianzGI Retirement 2050 | 48 | % | ||
AllianzGI Retirement 2055 | 89 | % | ||
AllianzGI Retirement Income | 13 | % | ||
AllianzGI Global Growth Allocation | 65 | % | ||
AllianzGI Behavioral Advantage Large Cap | 41 | % | ||
AllianzGI China Equity | 87 | % | ||
AllianzGI Dynamic Emerging Multi-Asset | 96 | % | ||
AllianzGI Global Managed Volatility | 15 | % | ||
AllianzGI Multi-Asset Real Return | 99 | % | ||
| 262 | May 31, 2013 | | Semiannual Report |
Table of Contents
| Approximate Ownership | ||||
AllianzGI NFJ Emerging Markets Value | 49 | % | ||
AllianzGI NFJ International Value II | 94 | % | ||
AllianzGI NFJ International Small-Cap Value | 46 | % | ||
AllianzGI Redwood | 43 | % | ||
AllianzGI Structured Alpha | 74 | % | ||
AllianzGI U.S. Equity Hedged | 80 | % | ||
An affiliate includes any company in which a Sub-Adviser owns 5% or more of a company’s outstanding voting securities at any point during the fiscal period. The table below represents transactions in and earnings from these affiliated issuers during the six months ended May 31, 2013.
| AllianzGI China Equity: | ||||||||||||||||||||||||||||
| Market Value 11/30/2012 | Purchases at Cost | Proceeds from Sales | Unrealized Appreciation (Depreciation) | Market Value 5/31/2013 | Dividend Income | Net Realized Gain (Loss) | ||||||||||||||||||||||
China Everbright International Ltd. | $ | 158,064 | — | — | $ | 134,476 | $ | 270,011 | $ | 1,288 | — | |||||||||||||||||
Digital China Holdings Ltd. | 163,072 | — | $ | 21,193 | (18,739 | ) | 118,825 | — | $ | 153 | ||||||||||||||||||
Natural Beauty Bio-Technology Ltd.† | 36,119 | — | — | (9,968 | ) | 26,151 | 126 | — | ||||||||||||||||||||
Qingling Motors Co., Ltd.†† | 118,868 | $ | 20,926 | 21,371 | 626 | 151,744 | — | (1,210 | ) | |||||||||||||||||||
Tiangong International Co., Ltd.†† | 132,216 | 20,584 | 21,064 | 56,122 | 186,893 | — | 3,210 | |||||||||||||||||||||
Zhuzhou CSR Times Electric Co., Ltd. | 87,521 | — | — | 965 | 88,023 | — | — | |||||||||||||||||||||
Totals | $ | 695,860 | $ | 41,510 | $ | 63,628 | $ | 163,482 | $ | 841,647 | $ | 1,414 | $ | 2,153 | ||||||||||||||
| AllianzGI Global Water: | ||||||||||||||||||||||||||||
| Market Value 11/30/2012 | Purchases at Cost | Proceeds from Sales | Unrealized Appreciation (Depreciation) | Market Value 5/31/2013 | Dividend Income | Net Realized Gain (Loss) | ||||||||||||||||||||||
China Everbright International Ltd. | $ | 893,323 | $ | 399,409 | $ | 455,090 | $ | 622,231 | $ | 1,655,744 | $ | 10,118 | $ | 164,066 | ||||||||||||||
Rotork PLC | 1,192,890 | 3,875,721 | 133,664 | 217,982 | 5,079,401 | 39,707 | 12,797 | |||||||||||||||||||||
Totals | $ | 2,086,213 | $ | 4,275,130 | $ | 588,754 | $ | 840,213 | $ | 6,735,145 | $ | 49,825 | $ | 176,863 | ||||||||||||||
| AllianzGI International Small-Cap: | ||||||||||||||||||||||||||||
| Market Value 11/30/2012 | Purchases at Cost | Proceeds from Sales | Unrealized Appreciation (Depreciation) | Market Value 5/31/2013 | Dividend Income | Net Realized Gain (Loss) | ||||||||||||||||||||||
Aareal Bank AG | $ | 1,171,054 | $ | 593,254 | $ | 499,092 | $ | 205,000 | $ | 1,389,284 | — | $ | (33,301 | ) | ||||||||||||||
Aveva Group PLC | 1,399,640 | 45,405 | 506,183 | 252,073 | 1,071,192 | $ | 3,126 | 81,409 | ||||||||||||||||||||
Bechtle AG† | 870,688 | 35,394 | 343,791 | 183,691 | 836,968 | — | 65,954 | |||||||||||||||||||||
Burckhardt Compression Holding AG†† | 695,673 | 971,481 | 585,508 | 198,437 | 1,337,212 | — | 59,475 | |||||||||||||||||||||
China Everbright International Ltd. | 1,568,774 | — | 1,285,524 | 482,278 | 1,244,646 | 6,198 | 369,879 | |||||||||||||||||||||
Elekta AB | 1,293,140 | 43,739 | 429,862 | 225,508 | 966,529 | — | 99,971 | |||||||||||||||||||||
Interroll Holding AG | 2,078,534 | — | 2,351,595 | — | — | — | 426,239 | |||||||||||||||||||||
Pfeiffer Vacuum Technology AG | 2,024,405 | 72,266 | 616,492 | 189,187 | 1,381,736 | 42,456 | 102,188 | |||||||||||||||||||||
Rotork PLC | 1,992,127 | 74,620 | 671,694 | 577,211 | 1,569,816 | 14,177 | 257,167 | |||||||||||||||||||||
SimCorp A/S | 1,741,253 | 74,819 | 631,684 | 798,649 | 1,745,619 | 31,983 | 234,287 | |||||||||||||||||||||
Spirax-Sarco Engineering PLC†† | 2,157,486 | 81,559 | 819,227 | 481,794 | 1,830,690 | 23,081 | 181,226 | |||||||||||||||||||||
Tiangong International Co., Ltd.†† | 1,114,823 | 594,489 | 740,631 | 476,923 | 1,586,177 | — | 140,750 | |||||||||||||||||||||
Unit 4 NV†† | 1,093,721 | 44,864 | 402,007 | 648,597 | 1,012,181 | 14,235 | 68,784 | |||||||||||||||||||||
United Internet AG | — | 1,566,522 | 514,010 | 192,066 | 1,240,873 | 12,485 | (3,705 | ) | ||||||||||||||||||||
Vacon PLC†† | 1,702,558 | 78,271 | 682,865 | 514,477 | 1,663,270 | 36,523 | 176,643 | |||||||||||||||||||||
Victrex PLC | — | 1,687,038 | 487,371 | (24,594 | ) | 1,142,834 | 23,103 | (32,239 | ) | |||||||||||||||||||
Totals | $ | 20,903,876 | $ | 5,963,721 | $ | 11,567,536 | $ | 5,401,297 | $ | 20,019,027 | $ | 207,367 | $ | 2,194,727 | ||||||||||||||
| † | Not affiliated at May 31, 2013. |
| †† | Not affiliated at November 30, 2012. |
| Semiannual Report | | May 31, 2013 | 263 |
Table of Contents
Notes to Financial Statements (cont’d)
May 31, 2013 (Unaudited)
Certain additional purchases of existing portfolio holdings that were not considered affiliated in prior years, resulted in the Funds owning in excess of 5% of the outstanding shares of certain issues at May 31, 2013. The percents and market value of the affiliated transactions represented below include both acquisitions of new investments and prior year holdings that became affiliated during the fiscal period.
| AllianzGI China Equity: | ||||||||||||
| Issuer Name | Sub-Adviser’s % Holding | Market Value | Market Value as a % of Fund’s Net Assets | |||||||||
China Everbright International Ltd. | 6.87 | % | $ | 270,011 | 6.48 | % | ||||||
Digital China Holdings Ltd. | 9.98 | % | 118,825 | 2.85 | % | |||||||
Qingling Motors Co., Ltd. | 6.91 | % | 151,744 | 3.64 | % | |||||||
Tiangong International Co., Ltd. | 5.68 | % | 186,893 | 4.49 | % | |||||||
Zhuzhou CSR Times Electric Co., Ltd. | 5.26 | % | 88,023 | 2.11 | % | |||||||
Totals | $ | 815,496 | 19.57 | % | ||||||||
| AllianzGI Global Water: | ||||||||||||
| Issuer Name | Sub-Adviser’s % Holding | Market Value | Market Value as a % of Fund’s Net Assets | |||||||||
China Everbright International Ltd. | 6.87 | % | $ | 1,655,744 | 0.96 | % | ||||||
Rotork PLC | 5.79 | % | 5,079,401 | 2.93 | % | |||||||
Totals | $ | 6,735,145 | 3.89 | % | ||||||||
| AllianzGI International Small-Cap: | ||||||||||||
| Issuer Name | Sub-Adviser’s % Holding | Market Value | Market Value as a % of Fund’s Net Assets | |||||||||
Aareal Bank AG | 7.81 | % | $ | 1,389,284 | 1.42 | % | ||||||
Aveva Group PLC | 7.52 | % | 1,071,192 | 1.10 | % | |||||||
Burckhardt Compression Holding AG | 7.25 | % | 1,337,212 | 1.37 | % | |||||||
China Everbright International Ltd. | 6.87 | % | 1,244,646 | 1.28 | % | |||||||
Elekta AB | 5.69 | % | 966,529 | 0.99 | % | |||||||
Pfeiffer Vacuum Technology AG | 6.79 | % | 1,381,736 | 1.42 | % | |||||||
Rotork PLC | 5.79 | % | 1,569,816 | 1.61 | % | |||||||
SimCorp A/S | 13.65 | % | 1,745,619 | 1.79 | % | |||||||
Spirax-Sarco Engineering PLC | 5.41 | % | 1,830,690 | 1.88 | % | |||||||
Tiangong International Co., Ltd. | 5.68 | % | 1,586,177 | 1.63 | % | |||||||
Unit 4 NV | 8.90 | % | 1,012,181 | 1.04 | % | |||||||
United Internet AG | 5.50 | % | 1,240,873 | 1.27 | % | |||||||
Vacon PLC | 5.70 | % | 1,663,270 | 1.71 | % | |||||||
Victrex PLC | 5.05 | % | 1,142,834 | 1.17 | % | |||||||
Totals | $ | 19,182,059 | 19.68 | % | ||||||||
The tables below show the transactions in and earnings from affiliates for the period or six months ended May 31, 2013:
| AllianzGI Retirement 2015: | ||||||||||||||||||||||||||||
| Market Value 11/30/2012 | Purchases at Cost | Proceeds from Sales | Unrealized Appreciation (Depreciation) | Market Value 5/31/2013 | Dividend Income | Net Realized Gain (Loss) | ||||||||||||||||||||||
AllianzGI Behavioral Advantage Large Cap | — | $ | 123,327 | $ | 5,674 | $ | 2,845 | $ | 120,670 | — | $ | 172 | ||||||||||||||||
AllianzGI Disciplined Equity | $ | 177,420 | 69,441 | 145,033 | 52,305 | 120,735 | $ | 2,540 | 20,350 | |||||||||||||||||||
AllianzGI Emerging Markets Opportunities | 88,967 | 247,091 | 98,959 | 11,281 | 236,063 | 1,392 | (487 | ) | ||||||||||||||||||||
AllianzGI Global Commodity Equity | 177,999 | 92,358 | 94,242 | 37,159 | 188,957 | 1,294 | 1,161 | |||||||||||||||||||||
AllianzGI Global Managed Volatility | 266,914 | 153,138 | 76,708 | 28,383 | 351,697 | 12,588 | 1,282 | |||||||||||||||||||||
| 264 | May 31, 2013 | | Semiannual Report |
Table of Contents
| AllianzGI Retirement 2015 (cont’d) | ||||||||||||||||||||||||||||
| Market Value 11/30/2012 | Purchases at Cost | Proceeds from Sales | Unrealized Appreciation (Depreciation) | Market Value 5/31/2013 | Dividend Income | Net Realized Gain (Loss) | ||||||||||||||||||||||
AllianzGI Income & Growth | $ | 708,818 | $ | 408,349 | $ | 215,633 | $ | 111,632 | $ | 955,835 | $ | 12,407 | $ | 583 | ||||||||||||||
AllianzGI International Small-Cap | — | 509,802 | 65,830 | 27,568 | 472,785 | — | 1,245 | |||||||||||||||||||||
AllianzGI NFJ Dividend Value | 619,542 | 353,564 | 228,926 | 185,042 | 851,579 | 12,325 | 4,443 | |||||||||||||||||||||
AllianzGI NFJ Global Dividend Value | 532,280 | 281,978 | 171,275 | 98,869 | 719,136 | 9,811 | 2,650 | |||||||||||||||||||||
AllianzGI NFJ International Value | 267,507 | 141,550 | 72,219 | 34,632 | 354,099 | 2,393 | 859 | |||||||||||||||||||||
AllianzGI NFJ Mid-Cap Value | 193,553 | 196,479 | 140,519 | 41,043 | 284,552 | 5,507 | 4,170 | |||||||||||||||||||||
AllianzGI NFJ Small-Cap Value | 196,803 | 14,818 | — | 66,294 | 230,459 | 3,344 | — | |||||||||||||||||||||
AllianzGI Short Duration High Income | 353,792 | 356,838 | 107,238 | 2,960 | 600,976 | 12,280 | (217 | ) | ||||||||||||||||||||
AllianzGI U.S. Emerging Growth | 178,466 | 99,859 | 76,684 | 58,081 | 244,062 | — | 2,469 | |||||||||||||||||||||
AllianzGI U.S. Managed Volatility | 266,939 | 432,388 | 88,728 | (4,394 | ) | 596,411 | 8,931 | (6,234 | ) | |||||||||||||||||||
PIMCO 1-5 Year U.S. TIPS Index | 983,287 | 244,081 | 1,226,687 | — | — | 655 | 14,130 | |||||||||||||||||||||
PIMCO CommoditiesPLUS Strategy | 178,875 | 138,890 | 41,257 | (5,792 | ) | 265,955 | 774 | (1,415 | ) | |||||||||||||||||||
PIMCO Commodity RealReturn Strategy | 530,120 | 311,825 | 505,800 | (15,921 | ) | 262,993 | 4,875 | (67,315 | ) | |||||||||||||||||||
PIMCO Floating Income | 355,047 | 725,105 | 114,520 | 903 | 962,023 | 12,977 | (143 | ) | ||||||||||||||||||||
PIMCO Foreign Bond (U.S. Dollar-Hedged) | 1,026,478 | 943,461 | 225,321 | (2,489 | ) | 1,664,053 | 37,187 | (11,902 | ) | |||||||||||||||||||
PIMCO Income | 1,597,854 | 902,418 | 372,449 | 161,173 | 2,170,644 | 65,632 | 700 | |||||||||||||||||||||
PIMCO Long-Term U.S. Government | 352,756 | 164,985 | 490,367 | — | — | 4,440 | (20,625 | ) | ||||||||||||||||||||
PIMCO Mortgage Opportunities | — | 1,592,764 | 151,049 | 5,219 | 1,446,792 | 15,000 | (142 | ) | ||||||||||||||||||||
PIMCO RealEstateRealReturn Strategy | 89,388 | 54,191 | 26,504 | (3,039 | ) | 107,336 | 8,005 | (2,352 | ) | |||||||||||||||||||
PIMCO Real Return | 5,479,925 | 3,433,553 | 1,162,659 | 13,628 | 7,203,030 | 87,940 | (52,911 | ) | ||||||||||||||||||||
PIMCO Short-Term | 813,284 | 1,155,300 | 521,373 | 21,707 | 1,445,519 | 5,845 | (271 | ) | ||||||||||||||||||||
PIMCO Total Return | 531,816 | 320,594 | 97,434 | 12,434 | 721,849 | 15,063 | (3,668 | ) | ||||||||||||||||||||
Totals | $ | 15,967,830 | $ | 13,468,147 | $ | 6,523,088 | $ | 941,523 | $ | 22,578,210 | $ | 343,205 | $ | (113,468 | ) | |||||||||||||
| AllianzGI Retirement 2020: | ||||||||||||||||||||||||||||
| Market Value 11/30/2012 | Purchases at Cost | Proceeds from Sales | Unrealized Appreciation (Depreciation) | Market Value 5/31/2013 | Dividend Income | Net Realized Gain (Loss) | ||||||||||||||||||||||
AllianzGI Behavioral Advantage Large Cap | — | $ | 198,355 | $ | 33,041 | $ | 3,998 | $ | 169,556 | — | $ | 244 | ||||||||||||||||
AllianzGI Disciplined Equity | $ | 156,048 | 147,399 | 158,214 | 59,385 | 169,376 | $ | 2,772 | 8,721 | |||||||||||||||||||
AllianzGI Emerging Markets Opportunities | 156,511 | 419,060 | 65,307 | 28,408 | 508,125 | 3,010 | (542 | ) | ||||||||||||||||||||
AllianzGI Global Commodity Equity | 156,579 | 232,793 | 70,175 | 35,470 | 336,476 | 1,404 | 1,059 | |||||||||||||||||||||
AllianzGI Global Managed Volatility | 250,409 | 374,033 | 93,126 | 24,986 | 541,814 | 14,569 | 968 | |||||||||||||||||||||
AllianzGI Income & Growth | 623,410 | 904,244 | 228,298 | 105,981 | 1,366,626 | 14,617 | 1,017 | |||||||||||||||||||||
AllianzGI International Small-Cap | — | 717,101 | 75,273 | 36,343 | 679,429 | — | 1,258 | |||||||||||||||||||||
AllianzGI NFJ Dividend Value | 576,057 | 833,601 | 302,277 | 195,839 | 1,254,733 | 15,195 | 6,004 | |||||||||||||||||||||
AllianzGI NFJ Global Dividend Value | 577,422 | 795,894 | 235,040 | 126,291 | 1,253,458 | 14,299 | 3,689 | |||||||||||||||||||||
AllianzGI NFJ International Value | 235,297 | 325,942 | 72,549 | 23,977 | 506,675 | 2,641 | 332 | |||||||||||||||||||||
AllianzGI NFJ Mid-Cap Value | 295,861 | 583,058 | 189,038 | 84,643 | 770,920 | 10,216 | 4,524 | |||||||||||||||||||||
AllianzGI NFJ Small-Cap Value | 109,696 | 8,259 | — | 44,872 | 128,456 | 1,864 | — | |||||||||||||||||||||
AllianzGI Short Duration High Income | 388,955 | 582,041 | 107,931 | 668 | 859,378 | 16,650 | (274 | ) | ||||||||||||||||||||
AllianzGI U.S. Emerging Growth | 235,461 | 327,473 | 136,127 | 90,105 | 510,301 | — | 5,782 | |||||||||||||||||||||
AllianzGI U.S. Managed Volatility | 313,040 | 859,767 | 140,444 | (3,060 | ) | 1,020,580 | 12,925 | (7,447 | ) | |||||||||||||||||||
PIMCO 1-5 Year U.S. TIPS Index | 605,599 | 498,345 | 1,103,963 | — | — | 506 | 6,362 | |||||||||||||||||||||
PIMCO CommoditiesPLUS Strategy | 314,678 | 456,863 | 231,650 | (12,902 | ) | 510,734 | 1,631 | (19,711 | ) | |||||||||||||||||||
PIMCO Commodity RealReturn Strategy | 466,258 | 682,036 | 540,325 | (35,252 | ) | 513,703 | 5,837 | (75,154 | ) | |||||||||||||||||||
PIMCO Floating Income | 390,298 | 1,285,881 | 120,668 | (3,964 | ) | 1,547,670 | 20,158 | (436 | ) | |||||||||||||||||||
PIMCO Foreign Bond (U.S. Dollar-Hedged) | 887,222 | 1,386,447 | 289,747 | (21,025 | ) | 1,896,768 | 40,004 | (15,254 | ) | |||||||||||||||||||
| Semiannual Report | | May 31, 2013 | 265 |
Table of Contents
Notes to Financial Statements (cont’d)
May 31, 2013 (Unaudited)
| AllianzGI Retirement 2020 (cont’d) | ||||||||||||||||||||||||||||
| Market Value 11/30/2012 | Purchases at Cost | Proceeds from Sales | Unrealized Appreciation (Depreciation) | Market Value 5/31/2013 | Dividend Income | Net Realized Gain (Loss) | ||||||||||||||||||||||
PIMCO Income | $ | 1,373,997 | $ | 2,101,282 | $ | 423,842 | $ | 135,256 | $ | 3,104,049 | $ | 79,911 | $ | 534 | ||||||||||||||
PIMCO Long-Term U.S. Government | 310,262 | 336,831 | 623,253 | — | — | 5,515 | (17,134 | ) | ||||||||||||||||||||
PIMCO Mortgage Opportunities | — | 2,270,859 | 207,115 | 5,633 | 2,068,930 | 20,292 | (447 | ) | ||||||||||||||||||||
PIMCO Real Return | 4,400,634 | 7,752,666 | 1,174,937 | (271,251 | ) | 10,318,872 | 95,482 | (53,680 | ) | |||||||||||||||||||
PIMCO RealEstateRealReturn Strategy | 235,815 | 339,703 | 68,283 | (28,159 | ) | 469,766 | 26,744 | (5,923 | ) | |||||||||||||||||||
PIMCO Short-Term | 699,727 | 880,018 | 544,297 | 13,771 | 1,033,534 | 5,166 | (677 | ) | ||||||||||||||||||||
PIMCO Total Return | 311,802 | 476,426 | 73,442 | (4,095 | ) | 688,152 | 11,923 | (2,676 | ) | |||||||||||||||||||
Totals | $ | 14,071,038 | $ | 25,776,377 | $ | 7,308,362 | $ | 635,918 | $ | 32,228,081 | $ | 423,331 | $ | (158,861 | ) | |||||||||||||
| AllianzGI Retirement 2025: | ||||||||||||||||||||||||||||
| Market Value 11/30/2012 | Purchases at Cost | Proceeds from Sales | Unrealized Appreciation (Depreciation) | Market Value 5/31/2013 | Dividend Income | Net Realized Gain (Loss) | ||||||||||||||||||||||
AllianzGI Behavioral Advantage Large Cap | $ | 27,520 | $ | 417,171 | $ | 25,765 | $ | 18,330 | $ | 436,896 | $ | 845 | $ | 260 | ||||||||||||||
AllianzGI Disciplined Equity | 219,330 | 311,233 | 74,037 | 51,096 | 499,842 | 4,888 | (30 | ) | ||||||||||||||||||||
AllianzGI Emerging Markets Opportunities | 165,069 | 551,005 | 68,354 | 8,762 | 644,499 | 3,953 | (174 | ) | ||||||||||||||||||||
AllianzGI Global Commodity Equity | 142,119 | 286,483 | 110,017 | 20,659 | 334,760 | 1,603 | (857 | ) | ||||||||||||||||||||
AllianzGI Global Managed Volatility | 240,029 | 530,509 | 76,710 | 15,478 | 700,130 | 17,608 | 1,247 | |||||||||||||||||||||
AllianzGI Income & Growth | 437,458 | 982,353 | 143,065 | 55,783 | 1,334,620 | 12,515 | (27 | ) | ||||||||||||||||||||
AllianzGI International Small-Cap | 27,587 | 709,236 | 54,858 | 36,462 | 719,235 | 444 | 1,494 | |||||||||||||||||||||
AllianzGI NFJ Dividend Value | 406,807 | 875,404 | 152,444 | 140,940 | 1,257,996 | 13,076 | 1,387 | |||||||||||||||||||||
AllianzGI NFJ Global Dividend Value | 460,825 | 1,005,995 | 179,747 | 116,852 | 1,394,949 | 13,916 | 516 | |||||||||||||||||||||
AllianzGI NFJ International Value | 221,061 | 491,220 | 82,483 | 30,853 | 648,057 | 3,077 | 488 | |||||||||||||||||||||
AllianzGI NFJ Mid-Cap Value | 330,022 | 706,558 | 103,929 | 104,246 | 1,026,442 | 12,740 | 1,747 | |||||||||||||||||||||
AllianzGI Short Duration High Income | 270,714 | 617,626 | 52,270 | (1,764 | ) | 832,041 | 14,155 | 62 | ||||||||||||||||||||
AllianzGI U.S. Emerging Growth | 165,883 | 370,837 | 98,043 | 72,633 | 511,017 | — | 2,431 | |||||||||||||||||||||
AllianzGI U.S. Managed Volatility | 220,331 | 889,972 | 113,060 | (9,053 | ) | 978,303 | 12,458 | (10,294 | ) | |||||||||||||||||||
PIMCO 1-5 Year U.S. TIPS Index | 111,413 | 108,596 | 219,981 | — | — | 114 | 244 | |||||||||||||||||||||
PIMCO CommoditiesPLUS Strategy | 216,882 | 530,306 | 67,491 | (17,660 | ) | 656,746 | 1,441 | (2,334 | ) | |||||||||||||||||||
PIMCO Commodity RealReturn Strategy | 432,882 | 868,689 | 534,055 | (50,063 | ) | 657,696 | 6,597 | (69,538 | ) | |||||||||||||||||||
PIMCO Floating Income | 271,877 | 1,290,009 | 53,586 | (1,169 | ) | 1,499,917 | 17,373 | (3 | ) | |||||||||||||||||||
PIMCO Foreign Bond (U.S. Dollar-Hedged) | 563,193 | 1,308,220 | 128,926 | (54,064 | ) | 1,666,935 | 31,449 | (6,104 | ) | |||||||||||||||||||
PIMCO Income | 836,381 | 1,886,529 | 249,059 | 61,732 | 2,506,690 | 58,299 | 301 | |||||||||||||||||||||
PIMCO Long-Term U.S. Government | 214,132 | 310,190 | 500,768 | — | — | 4,567 | (17,873 | ) | ||||||||||||||||||||
PIMCO Mortgage Opportunities | — | 2,059,321 | 44,789 | 1,948 | 2,016,462 | 17,604 | (18 | ) | ||||||||||||||||||||
PIMCO Real Return | 3,006,967 | 7,144,156 | 771,903 | (481,551 | ) | 8,785,722 | 79,824 | (31,378 | ) | |||||||||||||||||||
PIMCO RealEstateRealReturn Strategy | 218,868 | 486,719 | 51,520 | (50,179 | ) | 598,064 | 31,052 | (5,749 | ) | |||||||||||||||||||
PIMCO Short-Term | 409,293 | 808,506 | 375,688 | 2,501 | 840,297 | 3,625 | (723 | ) | ||||||||||||||||||||
PIMCO Total Return | 162,156 | 371,582 | 19,528 | (14,053 | ) | 495,200 | 7,692 | (531 | ) | |||||||||||||||||||
Totals | $ | 9,778,799 | $ | 25,918,425 | $ | 4,352,076 | $ | 58,719 | $ | 31,042,516 | $ | 370,915 | $ | (135,456 | ) | |||||||||||||
| AllianzGI Retirement 2030: | ||||||||||||||||||||||||||||
| Market Value 11/30/2012 | Purchases at Cost | Proceeds from Sales | Unrealized Appreciation (Depreciation) | Market Value 5/31/2013 | Dividend Income | Net Realized Gain (Loss) | ||||||||||||||||||||||
AllianzGI Behavioral Advantage Large Cap | $ | 271,868 | $ | 372,183 | $ | 79,864 | $ | 38,029 | $ | 600,041 | $ | 4,336 | $ | (681 | ) | |||||||||||||
AllianzGI Disciplined Equity | 951,624 | 352,038 | 200,499 | 191,667 | 1,202,162 | 10,977 | (2,265 | ) | ||||||||||||||||||||
| 266 | May 31, 2013 | | Semiannual Report |
Table of Contents
| AllianzGI Retirement 2030 (cont’d) | ||||||||||||||||||||||||||||
| Market Value 11/30/2012 | Purchases at Cost | Proceeds from Sales | Unrealized Appreciation (Depreciation) | Market Value 5/31/2013 | Dividend Income | Net Realized Gain (Loss) | ||||||||||||||||||||||
AllianzGI Emerging Markets Opportunities | $ | 680,939 | $ | 617,643 | $ | 118,967 | $ | 106,592 | $ | 1,183,983 | $ | 8,456 | $ | 3,394 | ||||||||||||||
AllianzGI Global Commodity Equity | 407,083 | 202,915 | 234,939 | 60,605 | 397,506 | 2,374 | (508 | ) | ||||||||||||||||||||
AllianzGI Global Managed Volatility | 627,593 | 372,026 | 111,462 | 35,315 | 901,479 | 23,624 | 393 | |||||||||||||||||||||
AllianzGI Income & Growth | 1,222,779 | 715,706 | 214,671 | 115,813 | 1,806,522 | 18,359 | (3,535 | ) | ||||||||||||||||||||
AllianzGI International Managed Volatility | 217,545 | 127,289 | 37,163 | 12,282 | 312,685 | 8,200 | 248 | |||||||||||||||||||||
AllianzGI International Small-Cap | 272,225 | 909,859 | 65,471 | 122,499 | 1,200,441 | 2,279 | 1,200 | |||||||||||||||||||||
AllianzGI NFJ Dividend Value | 1,087,767 | 606,101 | 257,011 | 235,770 | 1,611,866 | 18,277 | 285 | |||||||||||||||||||||
AllianzGI NFJ Global Dividend Value | 1,358,644 | 780,370 | 320,082 | 186,695 | 1,991,719 | 21,603 | (751 | ) | ||||||||||||||||||||
AllianzGI NFJ International Value | 815,891 | 1,307,974 | 184,923 | 59,254 | 1,983,750 | 6,490 | 1,027 | |||||||||||||||||||||
AllianzGI NFJ Mid-Cap Value | 847,759 | 643,859 | 287,832 | 147,365 | 1,331,772 | 16,831 | 4,611 | |||||||||||||||||||||
AllianzGI NFJ Small-Cap Value | 239,739 | 18,050 | — | 99,988 | 280,739 | 4,073 | — | |||||||||||||||||||||
AllianzGI Short Duration High Income | 680,163 | 419,107 | 89,882 | 2,455 | 1,005,500 | 18,361 | 83 | |||||||||||||||||||||
AllianzGI U.S. Emerging Growth | 406,982 | 239,696 | 128,106 | 129,250 | 609,611 | — | 2,049 | |||||||||||||||||||||
AllianzGI U.S. Managed Volatility | 546,915 | 999,322 | 134,499 | (14,235 | ) | 1,385,737 | 15,958 | (12,828 | ) | |||||||||||||||||||
PIMCO CommoditiesPLUS Strategy | 817,399 | 494,797 | 261,107 | (34,989 | ) | 1,001,337 | 2,774 | (20,806 | ) | |||||||||||||||||||
PIMCO Commodity RealReturn Strategy | 1,083,795 | 660,976 | 613,263 | (93,889 | ) | 988,821 | 8,714 | (83,872 | ) | |||||||||||||||||||
PIMCO Floating Income | 818,283 | 1,118,526 | 121,454 | 846 | 1,808,292 | 25,671 | 304 | |||||||||||||||||||||
PIMCO Foreign Bond (U.S. Dollar-Hedged) | 1,253,678 | 848,822 | 212,448 | (23,797 | ) | 1,809,561 | 36,481 | (3,002 | ) | |||||||||||||||||||
PIMCO Income | 1,966,905 | 1,169,532 | 359,737 | 113,530 | 2,822,141 | 71,166 | 2,220 | |||||||||||||||||||||
PIMCO Long-Term U.S. Government | 543,251 | 63,622 | 553,577 | — | — | 1,189 | (43,865 | ) | ||||||||||||||||||||
PIMCO Mortgage Opportunities | — | 2,447,944 | 29,235 | 4,945 | 2,423,659 | 22,561 | 5 | |||||||||||||||||||||
PIMCO Real Return | 5,718,405 | 3,079,571 | 1,782,639 | (167,473 | ) | 6,556,457 | 73,913 | (33,550 | ) | |||||||||||||||||||
PIMCO RealEstateRealReturn Strategy | 546,478 | 375,474 | 114,930 | (42,502 | ) | 746,859 | 40,018 | (7,369 | ) | |||||||||||||||||||
PIMCO Short-Term | 870,367 | 476,064 | 537,815 | 3,259 | 807,023 | 3,826 | 136 | |||||||||||||||||||||
PIMCO Total Return | 272,753 | 178,010 | 34,928 | (1,688 | ) | 400,978 | 6,641 | (136 | ) | |||||||||||||||||||
Totals | $ | 24,526,830 | $ | 19,597,476 | $ | 7,086,504 | $ | 1,287,586 | $ | 37,170,641 | $ | 473,152 | $ (197,213 | ) | ||||||||||||||
| AllianzGI Retirement 2035: | ||||||||||||||||||||||||||||
| Market Value 11/30/2012 | Purchases at Cost | Proceeds from Sales | Unrealized Appreciation (Depreciation) | Market Value 5/31/2013 | Dividend Income | Net Realized Gain (Loss) | ||||||||||||||||||||||
AllianzGI Behavioral Advantage Large Cap | $ | 77,401 | $ | 623,511 | $ | 45,767 | $ | 35,425 | $ | 691,581 | $ | 2,966 | $ | 1,148 | ||||||||||||||
AllianzGI Disciplined Equity | 410,859 | 522,098 | 68,644 | 77,129 | 929,992 | 7,193 | 1,126 | |||||||||||||||||||||
AllianzGI Emerging Markets Opportunities | 310,269 | 631,119 | 3,845 | 18,272 | 933,861 | 5,972 | (18 | ) | ||||||||||||||||||||
AllianzGI Global Commodity Equity | 186,220 | 224,735 | 158,759 | 18,686 | 266,915 | 1,654 | 356 | |||||||||||||||||||||
AllianzGI Global Managed Volatility | 256,555 | 426,827 | 19,683 | 9,272 | 662,584 | 14,705 | (120 | ) | ||||||||||||||||||||
AllianzGI Income & Growth | 480,047 | 802,286 | 73,248 | 46,778 | 1,259,440 | 10,592 | 559 | |||||||||||||||||||||
AllianzGI International Managed Volatility | 122,563 | 200,994 | 8,725 | 10,332 | 314,586 | 7,061 | (13 | ) | ||||||||||||||||||||
AllianzGI International Small-Cap | 129,144 | 909,918 | 33,392 | 73,517 | 1,068,766 | 2,279 | 643 | |||||||||||||||||||||
AllianzGI NFJ Dividend Value | 516,464 | 799,121 | 101,049 | 144,722 | 1,344,756 | 12,844 | 3,337 | |||||||||||||||||||||
AllianzGI NFJ Global Dividend Value | 567,359 | 871,578 | 81,390 | 114,068 | 1,461,317 | 13,163 | 1,059 | |||||||||||||||||||||
AllianzGI NFJ International Value | 414,559 | 1,210,201 | 59,874 | 49,771 | 1,589,770 | 4,847 | (255 | ) | ||||||||||||||||||||
AllianzGI NFJ Mid-Cap Value | 465,014 | 735,503 | 76,393 | 127,067 | 1,230,182 | 14,238 | 2,539 | |||||||||||||||||||||
AllianzGI Opportunity | 158,383 | 5,285 | 170,990 | — | — | — | 9,560 | |||||||||||||||||||||
AllianzGI Short Duration High Income | 252,648 | 449,161 | 24,145 | (1,483 | ) | 673,961 | 10,503 | (190 | ) | |||||||||||||||||||
| Semiannual Report | | May 31, 2013 | 267 |
Table of Contents
Notes to Financial Statements (cont’d)
May 31, 2013 (Unaudited)
| AllianzGI Retirement 2035 (cont’d) | ||||||||||||||||||||||||||||
| Market Value 11/30/2012 | Purchases at Cost | Proceeds from Sales | Unrealized Appreciation (Depreciation) | Market Value 5/31/2013 | Dividend Income | Net Realized Gain (Loss) | ||||||||||||||||||||||
AllianzGI U.S. Emerging Growth | $ | 207,265 | $ | 328,740 | $ | 75,129 | $ | 72,811 | $ | 533,674 | — | $ | 3,340 | |||||||||||||||
AllianzGI U.S. Managed Volatility | 259,527 | 870,067 | 39,056 | (17,948 | ) | 1,067,205 | $ | 10,399 | (2,757 | ) | ||||||||||||||||||
PIMCO CommoditiesPLUS Strategy | 414,787 | 656,141 | 233,302 | (18,672 | ) | 801,184 | 2,098 | (18,606 | ) | |||||||||||||||||||
PIMCO Commodity RealReturn Strategy | 410,694 | 672,851 | 184,110 | (73,892 | ) | 810,683 | 4,675 | (27,995 | ) | |||||||||||||||||||
PIMCO Floating Income | 354,607 | 896,971 | 22,589 | 4,367 | 1,223,604 | 16,508 | (275 | ) | ||||||||||||||||||||
PIMCO Foreign Bond (U.S. Dollar-Hedged) | 414,765 | 763,721 | 49,866 | (35,179 | ) | 1,081,801 | 18,427 | (3,006 | ) | |||||||||||||||||||
PIMCO Income | 679,781 | 1,166,380 | 107,097 | 38,759 | 1,757,954 | 37,557 | (124 | ) | ||||||||||||||||||||
PIMCO Long-Term U.S. Government | 199,658 | 102,483 | 271,151 | — | — | 649 | (26,055 | ) | ||||||||||||||||||||
PIMCO Mortgage Opportunities | — | 1,400,905 | 48,553 | 14 | 1,352,011 | 11,103 | (355 | ) | ||||||||||||||||||||
PIMCO Real Return | 1,506,601 | 1,938,351 | 823,183 | (108,577 | ) | 2,427,720 | 28,508 | (42,873 | ) | |||||||||||||||||||
PIMCO RealEstateRealReturn Strategy | 201,935 | 347,014 | 15,264 | (45,450 | ) | 485,657 | 22,672 | (1,661 | ) | |||||||||||||||||||
PIMCO Short-Term | 251,990 | 262,101 | 243,021 | 1,388 | 270,175 | 1,302 | (210 | ) | ||||||||||||||||||||
PIMCO Total Return | 100,975 | 186,061 | 7,257 | (7,051 | ) | 269,819 | 3,791 | (332 | ) | |||||||||||||||||||
Totals | $ | 9,350,070 | $ | 18,004,123 | $ | 3,045,482 | $ | 534,126 | $ | 24,509,198 | $ | 265,706 | $ | (101,178 | ) | |||||||||||||
| AllianzGI Retirement 2040: | ||||||||||||||||||||||||||||
| Market Value 11/30/2012 | Purchases at Cost | Proceeds from Sales | Unrealized Appreciation (Depreciation) | Market Value 5/31/2013 | Dividend Income | Net Realized Gain (Loss) | ||||||||||||||||||||||
AllianzGI Behavioral Advantage Large Cap | $ | 167,283 | $ | 471,905 | $ | 34,212 | $ | 39,058 | $ | 643,962 | $ | 3,165 | $ | 1,120 | ||||||||||||||
AllianzGI Disciplined Equity | 666,277 | 437,761 | 85,455 | 209,331 | 1,109,169 | 9,594 | 1,520 | |||||||||||||||||||||
AllianzGI Emerging Markets Opportunities | 467,286 | 536,760 | 27,258 | 115,248 | 980,013 | 7,292 | (92 | ) | ||||||||||||||||||||
AllianzGI Global Commodity Equity | 266,534 | 188,851 | 225,109 | 53,316 | 245,863 | 1,944 | 637 | |||||||||||||||||||||
AllianzGI Global Managed Volatility | 334,683 | 287,146 | 17,992 | 29,350 | 614,237 | 15,753 | 173 | |||||||||||||||||||||
AllianzGI Income & Growth | 732,911 | 626,537 | 51,226 | 124,361 | 1,371,256 | 14,219 | 331 | |||||||||||||||||||||
AllianzGI International Managed Volatility | 334,156 | 275,724 | 8,268 | 23,392 | 612,358 | 15,712 | (2 | ) | ||||||||||||||||||||
AllianzGI International Small-Cap | 300,955 | 789,821 | 14,857 | 151,380 | 1,166,039 | 3,153 | 89 | |||||||||||||||||||||
AllianzGI NFJ Dividend Value | 799,879 | 633,398 | 118,941 | 253,849 | 1,480,258 | 17,331 | 4,174 | |||||||||||||||||||||
AllianzGI NFJ Global Dividend Value | 731,177 | 570,221 | 63,751 | 140,672 | 1,355,450 | 15,064 | 752 | |||||||||||||||||||||
AllianzGI NFJ International Value | 588,865 | 984,237 | 39,190 | 49,885 | 1,572,598 | 5,754 | (236 | ) | ||||||||||||||||||||
AllianzGI NFJ Mid-Cap Value | 268,329 | 537,602 | 92,205 | 110,688 | 934,111 | 10,900 | 2,678 | |||||||||||||||||||||
AllianzGI NFJ Small-Cap Value | 399,275 | 20,203 | — | 118,278 | 314,218 | 4,559 | — | |||||||||||||||||||||
AllianzGI Opportunity | 135,837 | 52,954 | 206,344 | — | — | — | 25,384 | |||||||||||||||||||||
AllianzGI Short Duration High Income | 332,122 | 310,921 | 12,952 | 1,686 | 627,519 | 11,597 | (38 | ) | ||||||||||||||||||||
AllianzGI U.S. Emerging Growth | 295,406 | 249,154 | 80,679 | 124,281 | 548,035 | — | 3,713 | |||||||||||||||||||||
AllianzGI U.S. Managed Volatility | 335,830 | 818,904 | 29,936 | 30,041 | 1,112,674 | 11,180 | (2,275 | ) | ||||||||||||||||||||
PIMCO CommoditiesPLUS Strategy | 601,033 | 560,721 | 246,077 | (26,947 | ) | 868,226 | 2,539 | (33,864 | ) | |||||||||||||||||||
PIMCO Commodity RealReturn Strategy | 597,287 | 589,347 | 213,046 | (90,480 | ) | 866,700 | 6,162 | (36,750 | ) | |||||||||||||||||||
PIMCO Floating Income | 533,184 | 616,940 | 20,576 | 4,770 | 1,127,347 | 20,096 | (160 | ) | ||||||||||||||||||||
PIMCO Foreign Bond (U.S. Dollar-Hedged) | 479,549 | 509,798 | 18,654 | (31,765 | ) | 931,980 | 17,776 | (945 | ) | |||||||||||||||||||
PIMCO Income | 839,573 | 735,857 | 95,339 | 46,248 | 1,504,881 | 38,452 | (39 | ) | ||||||||||||||||||||
PIMCO Long-Term U.S. Government | 265,444 | 66,305 | 298,891 | — | — | 710 | (28,322 | ) | ||||||||||||||||||||
PIMCO Mortgage Opportunities | — | 1,287,605 | 25,457 | 2,944 | 1,265,036 | 11,949 | (56 | ) | ||||||||||||||||||||
PIMCO Real Return | 933,808 | 554,814 | 661,074 | (14,807 | ) | 751,997 | 13,712 | (23,651 | ) | |||||||||||||||||||
PIMCO RealEstateRealReturn Strategy | 267,190 | 271,280 | 23,745 | (24,248 | ) | 477,420 | 24,805 | (2,189 | ) | |||||||||||||||||||
PIMCO Short-Term | 278,483 | 107,495 | 385,357 | — | — | 638 | 2,540 | |||||||||||||||||||||
PIMCO Total Return | 133,182 | 57,819 | 185,253 | — | — | 2,406 | (1,783 | ) | ||||||||||||||||||||
Totals | $ | 12,085,538 | $ | 13,150,080 | $ | 3,281,844 | $ | 1,440,531 | $ | 22,481,347 | $ | 286,462 | $ | (87,291 | ) | |||||||||||||
| 268 | May 31, 2013 | | Semiannual Report |
Table of Contents
| AllianzGI Retirement 2045: | ||||||||||||||||||||||||||||
| Market Value 11/30/2012 | Purchases at Cost | Proceeds from Sales | Unrealized Appreciation (Depreciation) | Market Value 5/31/2013 | Dividend Income | Net Realized Gain (Loss) | ||||||||||||||||||||||
AllianzGI Behavioral Advantage Large Cap | $ | 71,708 | $ | 344,373 | $ | 20,902 | $ | 25,316 | $ | 420,400 | $ | 2,430 | $ | (236 | ) | |||||||||||||
AllianzGI Disciplined Equity | 285,251 | 185,282 | 14,286 | 64,289 | 498,700 | 5,022 | 270 | |||||||||||||||||||||
AllianzGI Emerging Markets Opportunities | 201,866 | 246,377 | 15,323 | 24,938 | 436,598 | 3,791 | 10 | |||||||||||||||||||||
AllianzGI Global Commodity Equity | 126,031 | 103,561 | 106,277 | 15,534 | 131,918 | 1,115 | 499 | |||||||||||||||||||||
AllianzGI Global Managed Volatility | 170,973 | 157,877 | 9,814 | 16,861 | 325,218 | 9,867 | 128 | |||||||||||||||||||||
AllianzGI Income & Growth | 311,254 | 288,629 | 19,735 | 34,261 | 610,649 | 6,925 | (103 | ) | ||||||||||||||||||||
AllianzGI International Managed Volatility | 158,774 | 149,446 | 11,432 | 23,977 | 302,686 | 9,190 | 46 | |||||||||||||||||||||
AllianzGI International Small-Cap | 129,182 | 474,378 | 12,552 | 67,796 | 641,868 | 2,007 | 87 | |||||||||||||||||||||
AllianzGI NFJ Dividend Value | 344,176 | 285,063 | 37,770 | 104,099 | 668,660 | 8,527 | 748 | |||||||||||||||||||||
AllianzGI NFJ Global Dividend Value | 343,394 | 281,698 | 25,619 | 80,909 | 661,001 | 7,996 | (52 | ) | ||||||||||||||||||||
AllianzGI NFJ International Value | 275,893 | 477,055 | 28,882 | 50,646 | 746,164 | 3,181 | 70 | |||||||||||||||||||||
AllianzGI NFJ Mid-Cap Value | 286,475 | 236,359 | 24,275 | 89,522 | 557,442 | 8,727 | 501 | |||||||||||||||||||||
AllianzGI Opportunity | 146,685 | 21,054 | 180,141 | — | — | — | 19,245 | |||||||||||||||||||||
AllianzGI Short Duration High Income | 139,613 | 147,209 | 7,679 | 938 | 278,099 | 5,508 | (20 | ) | ||||||||||||||||||||
AllianzGI U.S. Emerging Growth | 143,975 | 124,671 | 32,490 | 51,775 | 280,831 | — | 1,059 | |||||||||||||||||||||
AllianzGI U.S. Managed Volatility | 172,232 | 416,745 | 32,558 | 3,106 | 547,522 | 7,665 | (4,437 | ) | ||||||||||||||||||||
PIMCO CommoditiesPLUS Strategy | 286,764 | 302,287 | 165,272 | (9,551 | ) | 398,803 | 1,480 | (11,689 | ) | |||||||||||||||||||
PIMCO Commodity RealReturn Strategy | 282,844 | 316,935 | 149,425 | (41,745 | ) | 393,795 | 3,302 | (22,631 | ) | |||||||||||||||||||
PIMCO Floating Income | 252,526 | 258,805 | 11,511 | 12,217 | 500,178 | 10,447 | (74 | ) | ||||||||||||||||||||
PIMCO Foreign Bond (U.S. Dollar-Hedged) | 184,478 | 196,485 | 30,082 | (13,049 | ) | 333,640 | 7,877 | (1,720 | ) | |||||||||||||||||||
PIMCO Income | 325,457 | 293,296 | 126,955 | 18,721 | 501,784 | 15,474 | 847 | |||||||||||||||||||||
PIMCO Long-Term U.S. Government | 109,407 | 61,998 | 154,050 | — | — | 366 | (15,119 | ) | ||||||||||||||||||||
PIMCO Mortgage Opportunities | — | 568,166 | 11,368 | 1,855 | 558,608 | 5,499 | (45 | ) | ||||||||||||||||||||
PIMCO Real Return | 178,041 | 112,475 | 277,801 | — | — | 2,666 | (5,285 | ) | ||||||||||||||||||||
PIMCO RealEstateRealReturn Strategy | 111,823 | 119,832 | 7,844 | (11,025 | ) | 206,654 | 12,697 | (988 | ) | |||||||||||||||||||
PIMCO Short-Term | 82,855 | 43,177 | 125,807 | — | — | 188 | 791 | |||||||||||||||||||||
PIMCO Total Return | 27,668 | 17,222 | 43,375 | — | — | 610 | (635 | ) | ||||||||||||||||||||
Totals | $ | 5,149,345 | $ | 6,230,455 | $ | 1,683,225 | $ | 611,390 | $ | 10,001,218 | $ | 142,557 | $ | (38,733 | ) | |||||||||||||
| AllianzGI Retirement 2050: | ||||||||||||||||||||||||||||
| Market Value 11/30/2012 | Purchases at Cost | Proceeds from Sales | Unrealized Appreciation (Depreciation) | Market Value 5/31/2013 | Dividend Income | Net Realized Gain (Loss) | ||||||||||||||||||||||
AllianzGI Behavioral Advantage Large Cap | $ | 115,395 | $ | 347,971 | $ | 25,907 | $ | 28,069 | $ | 465,769 | $ | 2,577 | $ | 53 | ||||||||||||||
AllianzGI Disciplined Equity | 493,555 | 91,303 | 51,394 | 174,212 | 583,217 | 5,858 | (688 | ) | ||||||||||||||||||||
AllianzGI Emerging Markets Opportunities | 378,956 | 186,240 | 54,982 | 115,473 | 516,974 | 4,595 | 2,742 | |||||||||||||||||||||
AllianzGI Global Commodity Equity | 230,151 | 43,797 | 146,131 | 44,405 | 138,848 | 1,344 | 10,035 | |||||||||||||||||||||
AllianzGI Global Managed Volatility | 273,814 | 83,857 | 23,221 | 26,188 | 342,296 | 10,465 | 15 | |||||||||||||||||||||
AllianzGI Income & Growth | 547,567 | 174,457 | 60,741 | 107,807 | 696,654 | 8,352 | (1,528 | ) | ||||||||||||||||||||
AllianzGI International Managed Volatility | 275,773 | 81,199 | 24,183 | 20,403 | 341,336 | 10,443 | 383 | |||||||||||||||||||||
AllianzGI International Small-Cap | 254,090 | 402,880 | 26,018 | 145,818 | 693,884 | 2,516 | 56 | |||||||||||||||||||||
AllianzGI NFJ Dividend Value | 583,455 | 151,950 | 62,191 | 189,394 | 762,431 | 10,165 | (514 | ) | ||||||||||||||||||||
AllianzGI NFJ Global Dividend Value | 545,455 | 138,501 | 60,782 | 95,202 | 690,797 | 8,850 | (1,166 | ) | ||||||||||||||||||||
AllianzGI NFJ International Value | 468,890 | 368,010 | 54,879 | 37,065 | 808,451 | 3,558 | 327 | |||||||||||||||||||||
AllianzGI NFJ Mid-Cap Value | 214,919 | 136,824 | 77,825 | 49,436 | 303,377 | 4,124 | 662 | |||||||||||||||||||||
AllianzGI NFJ Small-Cap Value | 292,076 | 21,991 | — | 129,020 | 342,026 | 4,963 | — | |||||||||||||||||||||
AllianzGI Opportunity | 258,127 | 35,008 | 311,444 | — | — | — | 22,316 | |||||||||||||||||||||
AllianzGI Short Duration High Income | 226,540 | 84,577 | 17,521 | 2,805 | 292,705 | 5,989 | 35 | |||||||||||||||||||||
| Semiannual Report | | May 31, 2013 | 269 |
Table of Contents
Notes to Financial Statements (cont’d)
May 31, 2013 (Unaudited)
| AllianzGI Retirement 2050 (cont’d) | ||||||||||||||||||||||||||||
| Market Value 11/30/2012 | Purchases at Cost | Proceeds from Sales | Unrealized Appreciation (Depreciation) | Market Value 5/31/2013 | Dividend Income | Net Realized Gain (Loss) | ||||||||||||||||||||||
AllianzGI U.S. Emerging Growth | $ | 269,811 | $ | 74,730 | $ | 51,495 | $ | 102,538 | $ | 349,709 | — | $ | (247 | ) | ||||||||||||||
AllianzGI U.S. Managed Volatility | 270,130 | 405,360 | 34,943 | 34,195 | 633,905 | $ | 8,132 | (2,975 | ) | |||||||||||||||||||
PIMCO CommoditiesPLUS Strategy | 466,456 | 192,018 | 201,220 | (12,413 | ) | 428,170 | 1,570 | (29,235 | ) | |||||||||||||||||||
PIMCO Commodity RealReturn Strategy | 464,102 | 197,817 | 175,101 | (48,719 | ) | 426,030 | 3,692 | (27,549 | ) | |||||||||||||||||||
PIMCO Floating Income | 413,519 | 150,851 | 38,854 | 7,363 | 526,442 | 11,421 | 224 | |||||||||||||||||||||
PIMCO Foreign Bond (U.S. Dollar-Hedged) | 285,208 | 115,393 | 32,498 | (13,078 | ) | 351,188 | 8,057 | (109 | ) | |||||||||||||||||||
PIMCO Income | 508,989 | 141,336 | 191,471 | 23,587 | 469,462 | 15,526 | 2,555 | |||||||||||||||||||||
PIMCO Long-Term U.S. Government | 186,032 | 14,401 | 182,353 | — | — | 401 | (15,412 | ) | ||||||||||||||||||||
PIMCO Mortgage Opportunities | — | 468,519 | 1,762 | 1,868 | 468,609 | 4,825 | (16 | ) | ||||||||||||||||||||
PIMCO RealEstateRealReturn Strategy | 180,691 | 73,249 | 20,522 | (2,786 | ) | 217,504 | 13,605 | (874 | ) | |||||||||||||||||||
PIMCO Short-Term | 135,200 | 11,791 | 146,755 | — | — | 204 | 1,168 | |||||||||||||||||||||
PIMCO Total Return | 45,232 | 6,743 | 50,404 | — | — | 651 | 51 | |||||||||||||||||||||
Totals | $ | 8,384,133 | $ | 4,200,773 | $ | 2,124,597 | $ | 1,257,852 | $ | 10,849,784 | $ | 151,883 | $ | (39,691 | ) | |||||||||||||
| AllianzGI Retirement 2055: | ||||||||||||||||||||||||||||
| Market Value 11/30/2012 | Purchases at Cost | Proceeds from Sales | Unrealized Appreciation (Depreciation) | Market Value 5/31/2013 | Dividend Income | Net Realized Gain (Loss) | ||||||||||||||||||||||
AllianzGI Behavioral Advantage Large Cap | $ | 45,718 | $ | 125,470 | $ | 10,520 | $ | 10,762 | $ | 171,627 | $ | 1,115 | $ | 100 | ||||||||||||||
AllianzGI Disciplined Equity | 195,968 | 19,596 | 20,918 | 41,210 | 214,904 | 2,534 | 1,202 | |||||||||||||||||||||
AllianzGI Emerging Markets Opportunities | 150,516 | 48,848 | 12,505 | 23,995 | 190,507 | 1,988 | 1,134 | |||||||||||||||||||||
AllianzGI Global Commodity Equity | 91,407 | 10,983 | 56,128 | 7,361 | 51,163 | 581 | 5,466 | |||||||||||||||||||||
AllianzGI Global Managed Volatility | 108,708 | 16,646 | 2,733 | 13,292 | 126,118 | 4,527 | 52 | |||||||||||||||||||||
AllianzGI Income & Growth | 217,407 | 30,775 | 4,358 | 21,596 | 258,360 | 3,459 | 7 | |||||||||||||||||||||
AllianzGI International Managed Volatility | 109,297 | 16,319 | 3,542 | 17,783 | 125,771 | 4,518 | 88 | |||||||||||||||||||||
AllianzGI International Small-Cap | 100,670 | 133,941 | 2,469 | 42,034 | 257,515 | 1,088 | 76 | |||||||||||||||||||||
AllianzGI NFJ Dividend Value | 231,665 | 23,338 | 9,615 | 65,776 | 280,941 | 4,251 | 497 | |||||||||||||||||||||
AllianzGI NFJ Global Dividend Value | 216,610 | 16,240 | 4,362 | 50,113 | 256,358 | 3,666 | 44 | |||||||||||||||||||||
AllianzGI NFJ International Value | 186,224 | 106,915 | 7,040 | 40,535 | 297,903 | 1,516 | 228 | |||||||||||||||||||||
AllianzGI NFJ Mid-Cap Value | 200,631 | 19,941 | 10,778 | 56,348 | 237,816 | 4,405 | 494 | |||||||||||||||||||||
AllianzGI Opportunity | 112,230 | 12,245 | 132,333 | — | — | — | 14,606 | |||||||||||||||||||||
AllianzGI Short Duration High Income | 89,479 | 18,656 | — | 1,622 | 107,856 | 2,397 | — | |||||||||||||||||||||
AllianzGI U.S. Emerging Growth | 107,141 | 18,405 | 17,688 | 33,015 | 130,699 | — | 1,221 | |||||||||||||||||||||
AllianzGI U.S. Managed Volatility | 107,216 | 146,060 | 17,256 | 6,757 | 233,582 | 3,510 | (1,445 | ) | ||||||||||||||||||||
PIMCO CommoditiesPLUS Strategy | 182,981 | 44,220 | 57,590 | (2,226 | ) | 158,957 | 679 | (2,699 | ) | |||||||||||||||||||
PIMCO Commodity RealReturn Strategy | 181,696 | 54,576 | 55,208 | (19,984 | ) | 156,984 | 1,504 | (8,667 | ) | |||||||||||||||||||
PIMCO Floating Income | 164,198 | 31,170 | 2,071 | 12,117 | 193,986 | 4,595 | 19 | |||||||||||||||||||||
PIMCO Foreign Bond (U.S. Dollar-Hedged) | 111,638 | 28,412 | 3,695 | (5,247 | ) | 129,402 | 3,377 | (148 | ) | |||||||||||||||||||
PIMCO Income | 200,583 | 26,999 | 58,742 | 10,483 | 173,156 | 6,334 | 1,312 | |||||||||||||||||||||
PIMCO Long-Term U.S. Government | 71,558 | 6,930 | 70,682 | — | — | 171 | (6,890 | ) | ||||||||||||||||||||
PIMCO Mortgage Opportunities | — | 172,526 | — | 798 | 173,324 | 1,853 | — | |||||||||||||||||||||
PIMCO RealEstateRealReturn Strategy | 71,291 | 18,236 | 3,302 | 926 | 80,146 | 5,808 | 23 | |||||||||||||||||||||
PIMCO Short-Term | 54,301 | 2,507 | 56,704 | — | — | 87 | 790 | |||||||||||||||||||||
PIMCO Total Return | 18,043 | 1,834 | 19,197 | — | — | 277 | 111 | |||||||||||||||||||||
Totals | $ | 3,327,176 | $ | 1,151,788 | $ | 639,436 | $ | 429,066 | $ | 4,007,075 | $ | 64,240 | $ | 7,621 | ||||||||||||||
| 270 | May 31, 2013 | | Semiannual Report |
Table of Contents
| AllianzGI Retirement Income: | ||||||||||||||||||||||||||||
| Market Value 11/30/2012 | Purchases at Cost | Proceeds from Sales | Unrealized Appreciation (Depreciation) | Market Value 5/31/2013 | Dividend Income | Net Realized Gain (Loss) | ||||||||||||||||||||||
AllianzGI Behavioral Advantage Large Cap | — | $ | 162,354 | $ | 11,105 | $ | 3,662 | $ | 155,290 | — | $ | 379 | ||||||||||||||||
AllianzGI Disciplined Equity | $ | 299,848 | 36,147 | 360,707 | — | — | $ | 3,768 | 85,463 | |||||||||||||||||||
AllianzGI Emerging Markets Opportunities | 151,420 | 232,328 | 81,588 | 18,815 | 302,694 | 2,140 | 148 | |||||||||||||||||||||
AllianzGI Global Commodity Equity | 301,005 | 63,946 | 169,377 | 43,246 | 213,401 | 1,937 | 3,485 | |||||||||||||||||||||
AllianzGI Global Managed Volatility | 449,151 | 104,681 | 102,750 | 48,195 | 467,648 | 18,477 | 4,193 | |||||||||||||||||||||
AllianzGI Income & Growth | 1,185,640 | 269,613 | 288,526 | 125,254 | 1,245,178 | 18,389 | 1,584 | |||||||||||||||||||||
AllianzGI International Small-Cap | — | 611,062 | 103,405 | 39,516 | 549,553 | — | 2,380 | |||||||||||||||||||||
AllianzGI NFJ Dividend Value | 1,046,435 | 197,140 | 302,935 | 256,407 | 1,093,038 | 18,298 | 11,223 | |||||||||||||||||||||
AllianzGI NFJ Global Dividend Value | 894,213 | 175,430 | 260,167 | 146,289 | 922,657 | 14,614 | 7,294 | |||||||||||||||||||||
AllianzGI NFJ International Value | 299,793 | 71,208 | 86,574 | 44,912 | 303,406 | 2,382 | 2,140 | |||||||||||||||||||||
AllianzGI NFJ Mid-Cap Value | 196,717 | 62,005 | 105,062 | 26,390 | 181,301 | 4,356 | 6,510 | |||||||||||||||||||||
AllianzGI NFJ Small-Cap Value | 245,452 | 18,481 | — | 71,247 | 287,428 | 4,171 | — | |||||||||||||||||||||
AllianzGI Short Duration High Income | 586,149 | 300,019 | 104,031 | 7,099 | 779,662 | 17,739 | (176 | ) | ||||||||||||||||||||
AllianzGI U.S. Emerging Growth | 302,787 | 81,862 | 128,490 | 74,351 | 316,775 | — | 5,585 | |||||||||||||||||||||
AllianzGI U.S. Managed Volatility | 450,207 | 472,196 | 125,080 | (3,483 | ) | 781,703 | 13,049 | (7,009 | ) | |||||||||||||||||||
PIMCO 1-5 Year U.S. TIPS Index | 1,745,967 | 199,212 | 1,944,013 | — | — | 1,025 | 29,489 | |||||||||||||||||||||
PIMCO CommoditiesPLUS Strategy | 301,215 | 70,431 | 46,202 | (8,180 | ) | 310,470 | 1,103 | (1,556 | ) | |||||||||||||||||||
PIMCO Commodity RealReturn Strategy | 742,929 | 165,717 | 514,164 | (23,977 | ) | 306,954 | 5,905 | (84,560 | ) | |||||||||||||||||||
PIMCO Floating Income | 293,788 | 571,224 | 85,435 | 5,781 | 776,675 | 9,822 | 72 | |||||||||||||||||||||
PIMCO Foreign Bond (U.S. Dollar-Hedged) | 1,907,054 | 887,928 | 299,163 | (12,827 | ) | 2,375,752 | 60,328 | (12,696 | ) | |||||||||||||||||||
PIMCO Income | 2,795,654 | 801,097 | 543,476 | 264,427 | 3,124,486 | 100,808 | 5,348 | |||||||||||||||||||||
PIMCO Long-Term U.S. Government | 608,515 | 123,366 | 693,514 | — | — | 6,583 | (27,982 | ) | ||||||||||||||||||||
PIMCO Mortgage Opportunities | — | 2,400,098 | 210,703 | 6,345 | 2,196,223 | 22,355 | 483 | |||||||||||||||||||||
PIMCO Real Return | 9,245,645 | 2,331,214 | 1,572,070 | 78,769 | 9,272,960 | 129,494 | (52,043 | ) | ||||||||||||||||||||
PIMCO RealEstateRealReturn Strategy | 144,450 | 60,104 | 36,260 | (238 | ) | 157,653 | 11,584 | (2,092 | ) | |||||||||||||||||||
PIMCO Short-Term | 1,486,946 | 1,507,981 | 800,051 | 35,628 | 2,193,520 | 9,957 | 997 | |||||||||||||||||||||
PIMCO Total Return | 879,301 | 207,727 | 108,713 | 20,639 | 934,215 | 21,686 | (3,237 | ) | ||||||||||||||||||||
Totals | $ | 26,560,281 | $ | 12,184,571 | $ | 9,083,561 | $ | 1,268,267 | $ | 29,248,642 | $ | 499,970 | $ | (24,578 | ) | |||||||||||||
| AllianzGI Global Allocation: | ||||||||||||||||||||||||||||
| Market Value 11/30/2012 | Purchases at Cost | Proceeds from Sales | Unrealized Appreciation (Depreciation) | Market Value 5/31/2013 | Dividend Income | Net Realized Gain (Loss) | ||||||||||||||||||||||
AllianzGI Behavioral Advantage Large Cap | $ | 2,622,397 | $ | 1,581,653 | $ | 556,967 | $ | 316,097 | $ | 3,970,899 | $ | 51,828 | $ | 1,551 | ||||||||||||||
AllianzGI Disciplined Equity | 6,243,274 | 284,451 | 853,640 | 2,228,778 | 6,267,976 | 78,462 | 154,630 | |||||||||||||||||||||
AllianzGI Emerging Markets Opportunities | 7,376,884 | 1,248,733 | 644,344 | 2,451,269 | 8,178,141 | 98,903 | 25,835 | |||||||||||||||||||||
AllianzGI Global Commodity Equity | 6,309,200 | 292,038 | 3,984,763 | 827,675 | 2,911,829 | 39,812 | 759,834 | |||||||||||||||||||||
AllianzGI Global Managed Volatility | 8,091,061 | 590,834 | 1,230,171 | 896,656 | 7,717,561 | 332,845 | 95,131 | |||||||||||||||||||||
AllianzGI Income & Growth | 6,253,644 | 354,349 | 683,812 | 1,287,485 | 6,320,143 | 93,746 | 52,946 | |||||||||||||||||||||
AllianzGI International Managed Volatility | 6,242,167 | 291,590 | 682,206 | 1,131,710 | 6,063,234 | 256,709 | 42,618 | |||||||||||||||||||||
AllianzGI International Small-Cap | 3,829,986 | 4,575,354 | 992,059 | 2,124,495 | 8,329,141 | 37,877 | 40,634 | |||||||||||||||||||||
AllianzGI NFJ Dividend Value | 8,389,558 | 400,266 | 1,614,932 | 1,936,104 | 8,330,175 | 142,675 | 57,134 | |||||||||||||||||||||
AllianzGI NFJ Global Dividend Value | 11,510,232 | 241,596 | 1,701,190 | 2,133,235 | 11,437,530 | 180,757 | 115,137 | |||||||||||||||||||||
AllianzGI NFJ International Value | 13,662,070 | 4,678,231 | 1,686,379 | 1,218,983 | 17,516,019 | 109,001 | 32,887 | |||||||||||||||||||||
AllianzGI NFJ Mid-Cap Value | 486,171 | 9,890 | 514,221 | 45 | 89 | 9,890 | 234,897 | |||||||||||||||||||||
AllianzGI NFJ Small-Cap Value | 6,569,371 | 494,623 | — | 3,137,275 | 7,692,855 | 111,620 | — | |||||||||||||||||||||
AllianzGI Opportunity | 1,519,079 | 65,738 | 1,687,058 | — | — | — | 825,378 | |||||||||||||||||||||
AllianzGI Short Duration High Income | 5,147,853 | 210,849 | 94,543 | 94,135 | 5,254,036 | 127,819 | (142 | ) | ||||||||||||||||||||
| Semiannual Report | | May 31, 2013 | 271 |
Table of Contents
Notes to Financial Statements (cont’d)
May 31, 2013 (Unaudited)
| AllianzGI Global Allocation (cont’d) | ||||||||||||||||||||||||||||
| Market Value 11/30/2012 | Purchases at Cost | Proceeds from Sales | Unrealized Appreciation (Depreciation) | Market Value 5/31/2013 | Dividend Income | Net Realized Gain (Loss) | ||||||||||||||||||||||
AllianzGI U.S. Emerging Growth | $ | 5,270,835 | $ | 201,623 | $ | 1,250,696 | $ | 2,096,660 | $ | 5,217,271 | — | $ | 312,771 | |||||||||||||||
AllianzGI U.S. Managed Volatility | 4,332,195 | 3,232,731 | 612,402 | 583,420 | 6,821,737 | $ | 125,568 | (33,881 | ) | |||||||||||||||||||
PIMCO CommoditiesPLUS Strategy | 3,119,003 | 234,813 | 70,552 | (374,742 | ) | 3,129,607 | 11,425 | (17,237 | ) | |||||||||||||||||||
PIMCO Commodity RealReturn Strategy | 4,107,462 | 544,967 | 1,107,900 | (470,256 | ) | 3,041,694 | 31,793 | (231,888 | ) | |||||||||||||||||||
PIMCO Floating Income | 7,237,916 | 6,718,760 | 367,337 | 110,015 | 13,628,194 | 236,877 | (238 | ) | ||||||||||||||||||||
PIMCO Foreign Bond (U.S. Dollar-Hedged) | 14,460,739 | 1,767,746 | 696,009 | 802,325 | 14,658,581 | 425,155 | (27,361 | ) | ||||||||||||||||||||
PIMCO Income | 21,677,010 | 1,530,969 | 2,675,788 | 2,275,869 | 21,047,722 | 732,000 | 53,991 | |||||||||||||||||||||
PIMCO Long-Term U.S. Government | 4,043,179 | 400,063 | 4,003,473 | — | — | 9,543 | (395,073 | ) | ||||||||||||||||||||
PIMCO Mortgage Opportunities | — | 12,981,289 | 428,283 | 66,842 | 12,620,813 | 141,864 | 965 | |||||||||||||||||||||
PIMCO Real Return | 11,094,070 | 938,157 | 11,496,407 | — | — | 116,142 | (18,933 | ) | ||||||||||||||||||||
PIMCO Short-Term | 11,273,799 | 1,186,970 | 4,015,239 | 129,792 | 8,423,615 | 51,289 | 30,260 | |||||||||||||||||||||
PIMCO Total Return | 12,334,167 | 1,354,801 | 6,908,757 | 620,894 | 6,309,090 | 262,520 | 123,295 | |||||||||||||||||||||
Totals | $ | 193,203,322 | $ | 46,413,084 | $ | 50,559,128 | $ | 25,624,761 | $ | 194,887,952 | $ | 3,816,120 | $ | 2,235,141 | ||||||||||||||
| AllianzGI Global Growth Allocation: | ||||||||||||||||||||||||||||
| Market Value 11/30/2012 | Purchases at Cost | Proceeds from Sales | Unrealized Appreciation (Depreciation) | Market Value 5/31/2013 | Dividend Income | Net Realized Gain (Loss) | ||||||||||||||||||||||
AllianzGI Behavioral Advantage Large Cap | $ | 92,616 | $ | 420,100 | $ | 22,910 | $ | 21,611 | $ | 511,526 | $ | 2,146 | $ | (125 | ) | |||||||||||||
AllianzGI Disciplined Equity | 405,317 | 43,971 | 230,586 | 99,482 | 255,789 | 5,094 | 50,632 | |||||||||||||||||||||
AllianzGI Emerging Markets Opportunities | 444,151 | 141,555 | 88,985 | 150,496 | 507,392 | 6,278 | (706 | ) | ||||||||||||||||||||
AllianzGI Global Commodity Equity | 254,362 | 150,326 | 96,428 | 59,296 | 322,370 | 1,637 | 11,290 | |||||||||||||||||||||
AllianzGI Global Managed Volatility | 285,616 | 77,000 | 33,771 | 33,198 | 337,990 | 11,750 | 1,252 | |||||||||||||||||||||
AllianzGI Income & Growth | 366,281 | 56,340 | 216,760 | 55,303 | 231,521 | 5,773 | 26,495 | |||||||||||||||||||||
AllianzGI International Managed Volatility | 219,077 | 141,227 | 27,444 | 16,560 | 337,040 | 9,081 | 967 | |||||||||||||||||||||
AllianzGI International Small-Cap | 240,635 | 132,221 | 125,749 | 138,683 | 297,615 | 2,523 | 11,088 | |||||||||||||||||||||
AllianzGI NFJ Dividend Value | 442,903 | 45,796 | 205,681 | 147,258 | 341,344 | 7,875 | 47,002 | |||||||||||||||||||||
AllianzGI NFJ Emerging Markets Value | — | 283,948 | 5,858 | 1,292 | 279,397 | — | 15 | |||||||||||||||||||||
AllianzGI NFJ Global Dividend Value | 551,939 | 52,848 | 324,208 | 63,011 | 340,792 | 9,216 | 31,839 | |||||||||||||||||||||
AllianzGI NFJ International Small Cap Value | — | 306,161 | 4,569 | (2,473 | ) | 299,175 | — | 56 | ||||||||||||||||||||
AllianzGI NFJ International Value | 698,834 | 272,093 | 503,571 | 55,171 | 510,876 | 5,741 | 17,931 | |||||||||||||||||||||
AllianzGI NFJ Mid-Cap Value | 33,196 | 53,215 | 57,817 | 1,087 | 32,126 | 735 | 10,665 | |||||||||||||||||||||
AllianzGI NFJ Small-Cap Value | 411,509 | 30,983 | — | 183,810 | 481,884 | 6,992 | — | |||||||||||||||||||||
AllianzGI Opportunity | 227,348 | 16,402 | 259,099 | — | — | — | 25,669 | |||||||||||||||||||||
AllianzGI Short Duration High Income | 145,130 | 123,537 | 96,182 | 2,759 | 172,103 | 4,080 | 32 | |||||||||||||||||||||
AllianzGI U.S. Emerging Growth | 217,669 | 130,469 | 140,171 | 131,212 | 257,993 | — | 8,486 | |||||||||||||||||||||
AllianzGI U.S. Managed Volatility | 190,333 | 461,001 | 43,804 | 38,004 | 597,653 | 5,517 | (1,639 | ) | ||||||||||||||||||||
PIMCO CommoditiesPLUS Strategy | 183,674 | 133,508 | 132,629 | (854 | ) | 170,849 | 673 | (30,031 | ) | |||||||||||||||||||
PIMCO Commodity RealReturn Strategy | 218,354 | 50,783 | 253,698 | — | — | 1,783 | (22,654 | ) | ||||||||||||||||||||
PIMCO Floating Income | 197,992 | 701,891 | 382,761 | 7,934 | 517,310 | 9,064 | (880 | ) | ||||||||||||||||||||
PIMCO Foreign Bond (U.S. Dollar-Hedged) | 260,242 | 119,173 | 369,051 | — | — | 6,645 | 380 | |||||||||||||||||||||
PIMCO Income | 521,375 | 83,482 | 227,392 | 36,599 | 388,448 | 16,006 | 5,940 | |||||||||||||||||||||
PIMCO International StocksPLUS AR Strategy (U.S. Dollar-Hedged) | — | 429,256 | 8,631 | 1,469 | 422,123 | — | 29 | |||||||||||||||||||||
PIMCO Long-Term U.S. Government | 151,333 | 12,038 | 147,010 | — | — | 356 | (14,720 | ) | ||||||||||||||||||||
PIMCO Mortgage Opportunities | — | 367,981 | 23,997 | 1,559 | 345,531 | 3,655 | (12 | ) | ||||||||||||||||||||
Totals | $ | 6,759,886 | $ | 4,837,305 | $ | 4,028,762 | $ | 1,242,467 | $ | 7,958,847 | $ | 122,620 | $ | 179,001 | ||||||||||||||
| 272 | May 31, 2013 | | Semiannual Report |
Table of Contents
| AllianzGI Dynamic Emerging Multi-Asset: | ||||||||||||||||||||||||||||
| Market Value 12/17/2012* | Purchases at Cost | Proceeds from Sales | Unrealized Appreciation (Depreciation) | Market Value 5/31/2013 | Dividend Income | Net Realized Gain (Loss) | ||||||||||||||||||||||
PIMCO Commodity RealReturn Strategy | — | $ | 253,300 | $ | 242,876 | — | — | $ | 1,300 | $ | (10,424 | ) | ||||||||||||||||
PIMCO Emerging Markets Bond | — | 2,659,976 | 191,270 | $ | (114,624 | ) | $ | 2,351,602 | 61,976 | (2,480 | ) | |||||||||||||||||
Totals | — | $ | 2,913,276 | $ | 434,146 | $ | (114,624 | ) | $ | 2,351,602 | $ | 63,276 | $ | (12,904 | ) | |||||||||||||
| AllianzGI Multi-Asset Real Return: | ||||||||||||||||||||||||||||
| Market Value 12/17/2012* | Purchases at Cost | Proceeds from Sales | Unrealized Appreciation (Depreciation) | Market Value 5/31/2013 | Dividend Income | Net Realized Gain (Loss) | ||||||||||||||||||||||
AllianzGI Global Commodity Equity | — | $ | 1,606,240 | — | $ | 19,017 | $ | 1,625,257 | $ | 6,240 | — | |||||||||||||||||
PIMCO CommoditiesPLUS Strategy | — | 1,003,696 | $ | 450,000 | (22,185 | ) | 528,408 | 3,696 | $ | (3,103 | ) | |||||||||||||||||
Totals | — | $ | 2,609,936 | $ | 450,000 | $ | (3,168 | ) | $ | 2,153,665 | $ | 9,936 | $ | (3,103 | ) | |||||||||||||
| * | Commencement of operations. |
| 11. | FUND EVENTS |
(a) Reorganization
Prior to the opening of business on February 27, 2012, AllianzGI Global Water (the “Survivor Fund”) acquired all assets and liabilities of Allianz RCM Global EcoTrendsSM (the “Target Fund”). The purpose of the transaction was to combine two funds managed by the Investment Manager with comparable investment objectives and strategies. The acquisition was accomplished by a tax-free exchange of shares of the Target Fund, valued at $35,766,152 in total, for shares of the Survivor Fund as follows:
| Shares of Target Fund | Shares of Survivor Fund | |||||||
Class A | 1,489,283 | 2,987,721 | ||||||
Class C | 241,552 | 480,744 | ||||||
Class D | 15,843 | 31,837 | ||||||
Class P | 100,556 | 202,617 | ||||||
Institutional Class | 6,191 | 12,597 | ||||||
The investment portfolio of the Target Fund, with a market value of $33,330,151 and identified cost of $33,338,052 at February 24, 2012, was the principal asset acquired by the Survivor Fund. For financial reporting purposes, assets received and shares issued by the Survivor Fund were recorded at fair value; however, the cost basis of the investments received from the Target Fund was carried forward to align ongoing reporting of the Survivor Fund’s realized and unrealized gains and losses with amounts distributable to shareholders for tax purposes. Immediately prior to the acquisition, the Survivor Fund’s net assets were $73,746,391. The Target Fund’s unrealized appreciation at acquisition date was $7,901.
See Note 9 for the changes in shares outstanding for the Survivor Fund during the year ended November 30, 2012
(b) Sub-Adviser Changes and Mergers
On December 31, 2012, the portfolio management agreement between RCM Capital Management LLC (“RCM”) and RCM Asia Pacific
Limited (“RCM AP”) terminated with respect to AllianzGI China Equity Fund. RCM assumed RCM AP’s responsibilities for the day-to-day management of AllianzGI China Equity Fund.
Effective as of the close of business on December 31, 2012, Allianz Global Investors Capital LLC was renamed Allianz Global Investors U.S. LLC (“AGI U.S.”). Effective January 1, 2013, Allianz Global Investors Solutions LLC merged into AGI U.S by means of a statutory merger (the “AGI Solutions Restructuring”). Allianz Global Investors Solutions LLC and AGI U.S. were each, and AGI U.S. continues to be, direct, wholly-owned subsidiaries of their managing member, Allianz Global Investors U.S. Holdings LLC. Upon completion of the AGI Solutions Restructuring, AGI U.S. succeeded to the advisory business of Allianz Global Investors Solutions LLC. This occurred by operation of law. On April 1, 2013, RCM and Caywood-Scholl Capital Management LLC (“Caywood”) merged into AGI U.S. by means of a statutory merger (the “RCM/Caywood Restructuring”). Upon completion of the RCM/Caywood Restructuring, AGI U.S. succeeded to the advisory businesses of RCM and Caywood. This occurred by operation of law. NFJ remains a separate registered investment adviser and wholly owned subsidiary of AGI U.S.
(c) New Funds
On December 3, 2012, each of AllianzGI Structured Alpha and AllianzGI U.S. Equity Hedged commenced operations as a series of the Trust, with each Fund offering Class A, C, D, P and Institutional Class shares.
On December 17, 2012, each of AllianzGI Dynamic Emerging Multi-Asset and AllianzGI Multi-Asset Real Return commenced operations as a series of the Trust, with each Fund offering Class A, C, D, P and Institutional Class shares.
On December 18, 2012, AllianzGI NFJ Emerging Markets Value commenced operations as a series of the Trust offering Class A, C, D, P and Institutional Class shares.
| Semiannual Report | | May 31, 2013 | 273 |
Table of Contents
Notes to Financial Statements (cont’d)
May 31, 2013 (Unaudited)
(d) Name Changes
Effective January 28, 2013, the Fund names changed as set forth below:
| Current Fund Name | Prior Fund Name | |
AllianzGI Retirement 2015 Fund | Allianz Global Investors Solutions 2015 Fund | |
AllianzGI Retirement 2020 Fund | Allianz Global Investors Solutions 2020 Fund | |
AllianzGI Retirement 2025 Fund | Allianz Global Investors Solutions 2025 Fund | |
AllianzGI Retirement 2030 Fund | Allianz Global Investors Solutions 2030 Fund | |
AllianzGI Retirement 2035 Fund | Allianz Global Investors Solutions 2035 Fund | |
AllianzGI Retirement 2040 Fund | Allianz Global Investors Solutions 2040 Fund | |
AllianzGI Retirement 2045 Fund | Allianz Global Investors Solutions 2045 Fund | |
AllianzGI Retirement 2050 Fund | Allianz Global Investors Solutions 2050 Fund | |
AllianzGI Retirement 2055 Fund | Allianz Global Investors Solutions 2055 Fund | |
AllianzGI Retirement Income Fund | Allianz Global Investors Solutions Retirement Income Fund | |
AllianzGI Global Allocation Fund | Allianz Global Investors Solutions Global Allocation Fund | |
AllianzGI Global Growth Allocation Fund | Allianz Global Investors Solutions Global Growth Allocation Fund | |
AllianzGI Behavioral Advantage Large Cap Fund | Allianz F&T Behavioral Advantage Large Cap Fund | |
AllianzGI China Equity Fund | Allianz RCM China Equity Fund | |
AllianzGI Convertible Fund | Allianz AGIC Convertible Fund | |
AllianzGI Disciplined Equity Fund | Allianz RCM Disciplined Equity Fund | |
AllianzGI Global Managed Volatility Fund | Allianz AGIC Global Managed Volatility Fund | |
AllianzGI Global Water Fund | Allianz RCM Global Water Fund | |
AllianzGI High Yield Bond Fund | Allianz AGIC High Yield Bond Fund | |
AllianzGI International Small-Cap Fund | Allianz RCM International Small-Cap Fund | |
AllianzGI Micro Cap Fund | Allianz AGIC Micro Cap Fund |
| Current Fund Name | Prior Fund Name | |
AllianzGI NFJ Global Dividend Value Fund | Allianz NFJ Global Dividend Value Fund | |
AllianzGI NFJ International Small-Cap Value Fund | Allianz NFJ International Small-Cap Value Fund | |
AllianzGI NFJ International Value II Fund | Allianz NFJ International Value II Fund | |
AllianzGI Redwood Fund | Allianz RCM Redwood Fund | |
AllianzGI Short Duration High Income Fund | Allianz RCM Short Duration High Income Fund | |
AllianzGI Ultra Micro Cap Fund | Allianz AGIC Ultra Micro Cap Fund | |
AllianzGI U.S. Emerging Growth Fund | Allianz AGIC U.S. Emerging Growth Fund |
(e) Fund Liquidations
On April 19, 2013, AllianzGI Focused Opportunity liquidated.
(f) New Share Classes
On April 1, 2013, the Institutional Class shares of the Target Date Funds were reclassified as “Class R6” shares, a new share class of the Trust. The contractual fee rate imposed on Class R6 shares under the Trust’s Administration Agreement with the Investment Manager is five basis points lower than the fee rate imposed on Institutional Class shares, resulting in a correspondingly lower total expense ratio (gross of expense waivers) for Class R6 shares. Because of a five basis point reduction in the level of the expense waiver, the net expense ratio for Class R6 shares after the reclassification remained unchanged from Institutional Class shares before the reclassification.
| 12. | PAYMENTS FROM AFFILIATES |
During the six months ended May 31, 2013, the sub-adviser for AllianzGI China Equity reimbursed the Fund $34,556 for trading errors.
| 13. | SUBSEQUENT EVENTS |
In preparing these financial statements, the Funds’ management has evaluated events and transactions for potential recognition or disclosure through the date the financial statements were issued.
On June 20, 2013, the following Funds declared net investment income dividends to shareholders, payable June 20, 2013 to shareholders of record on June 19, 2013:
| Fund Name | Class A | Class B | Class C | Class D | Class R | Class P | Class R6 | Institutional Class | Administrative Class | |||||||||||||||||||||||||||
AllianzGI Retirement Income | $ | 0.09888 | $ | NA | $ | 0.06134 | $ | 0.09220 | $ | 0.08224 | $ | 0.11323 | $ | 0.11702 | $ | NA | $ | 0.10819 | ||||||||||||||||||
AllianzGI Global Allocation | 0.05294 | 0.02932 | 0.03136 | 0.05469 | 0.04867 | 0.06019 | NA | 0.06007 | 0.05252 | |||||||||||||||||||||||||||
AllianzGI Convertible | 0.12431 | NA | 0.06452 | 0.10917 | 0.07877 | 0.14084 | NA | 0.13838 | 0.15124 | |||||||||||||||||||||||||||
AllianzGI High Yield Bond | 0.05742 | NA | 0.04996 | 0.05671 | 0.05571 | 0.05932 | NA | 0.06000 | 0.05825 | |||||||||||||||||||||||||||
AllianzGI NFJ Emerging Markets Value | 0.19425 | NA | 0.14708 | 0.16159 | NA | 0.18269 | NA | 0.18910 | NA | |||||||||||||||||||||||||||
AllianzGI NFJ Global Dividend Value | 0.11994 | NA | 0.08172 | 0.11577 | NA | 0.12983 | NA | 0.13257 | NA | |||||||||||||||||||||||||||
AllianzGI Short Duration High Income | 0.07339 | NA | 0.07071 | 0.07364 | NA | 0.07526 | NA | 0.07679 | NA | |||||||||||||||||||||||||||
| 274 | May 31, 2013 | | Semiannual Report |
Table of Contents
On July 18, 2013, the following Funds declared net investment income dividends to shareholders, payable July 18, 2013 to shareholders of record on July 17, 2013:
| Fund Name | Class A | Class C | Class D | Class R | Class P | Institutional Class | Administrative Class | |||||||||||||||||||||
AllianzGI High Yield Bond | $ | 0.05763 | $ | 0.04976 | $ | 0.05800 | $ | 0.05613 | $ | 0.05949 | $ | 0.06000 | $ | 0.05833 | ||||||||||||||
AllianzGI Short Duration High Income | 0.05969 | 0.05634 | 0.05976 | NA | 0.06168 | 0.06308 | NA | |||||||||||||||||||||
On July 1, 2013, AllianzGI Global Fundamental Strategy commenced operations as a series of the Trust, offering Class A, C, D, P and Institutional Class shares. The investment objective of the Fund is to seek to generate positive real absolute returns through a complete market cycle (rolling 3-year period) by investing in a broad range of global asset classes.
There were no other subsequent events that require recognition or disclosure.
| Semiannual Report | | May 31, 2013 | 275 |
Table of Contents
Unaudited
Matters Relating to the Trustees’ Consideration of the Investment Management and Sub-Advisory Agreements
The Investment Company Act of 1940, as amended (the “1940 Act”), requires that both the full Board of Trustees (the “Trustees”) and a majority of the Trustees who are not interested persons of the Trust (the “Independent Trustees”), voting separately, annually approve the continuation of (i) the Trust’s Amended and Restated Investment Management Agreement (the “Investment Management Agreement”) on behalf of each Renewal Fund (as defined below) with Allianz Global Investors Fund Management LLC (the “Investment Manager”), and (ii) the Sub-Advisory Agreements between the Investment Manager and the applicable sub-adviser for each Renewal Fund. The sub-advisers for the Renewal Funds include Allianz Global Investors U.S. LLC (prior to December 31, 2012, named Allianz Global Investors Capital LLC) (“AGI U.S.”), Fuller & Thaler Asset Management, Inc. (“F&T”) and NFJ Investment Group LLC (“NFJ”) (collectively, the “Sub-Advisers”).
Effective as of the close of business on December 31, 2012, Allianz Global Investors Capital LLC was renamed AGI U.S. Effective January 1, 2013, Allianz Global Investors Solutions LLC (“AGIS”) merged into AGI U.S. by means of a statutory merger (the “AGIS Restructuring”). AGIS and AGI U.S. were each, and AGI U.S. continues to be, direct, wholly-owned subsidiaries of their managing member, Allianz Global Investors U.S. Holdings LLC. Upon completion of the AGIS Restructuring, AGI U.S. succeeded to the advisory business of AGIS by operation of law.
Effective as of April 1, 2013, AGI U.S.’s affiliates RCM Capital Management LLC (“RCM”) and Caywood-Scholl Capital Management LLC (“Caywood”) merged with and into AGI U.S., and AGI U.S. succeeded to the advisory businesses of RCM and Caywood. As a result, on that date, AGI U.S. assumed the role of sub-adviser to the Renewal Funds previously sub-advised by RCM (defined below as the “Legacy RCM Funds”) and sub-sub-advised by Caywood, when AGI U.S. succeeded by operation of law to the rights and obligations of RCM under the Sub-Advisory Agreement between the Investment Manager and RCM with respect to the Legacy RCM Funds and under the Portfolio Management Agreement between RCM and Caywood with respect to the AllianzGI Short Duration High Income Fund (the “Short Duration Fund”). In approving the continuation of the Sub-Advisory Agreements with respect to the Legacy RCM Funds, the Trustees took into account both the past management of those Funds by RCM and Caywood as well as AGI U.S.’s post-merger role, which went into effect on the same date as the renewal period commenced for all of the Agreements (as defined below). The Board approved the Portfolio Management Agreement between RCM and Caywood in September 2011 for an initial two-year period and was not asked to renew the agreement at its March 2013 contract review meeting.
The 1940 Act also requires that the Trustees and the Independent Trustees initially approve any new investment management or sub-advisory agreement for a Fund. New agreements approved for Funds covered by this report relate to the organization of AllianzGI NFJ Emerging Markets Value Fund (the “NFJ Emerging Markets Value Fund”), AllianzGI Structured Alpha Fund (the “Structured Alpha
Fund”), AllianzGI U.S. Equity Hedged Fund (the “U.S. Equity Hedged Fund”), AllianzGI Dynamic Emerging Multi-Asset Fund (the “Dynamic Emerging Multi-Asset Fund”) and AllianzGI Multi-Asset Real Return Fund (the “Multi-Asset Real Return Fund” and, together with the NFJ Emerging Markets Value Fund, the Structured Alpha Fund, the U.S. Equity Hedged Fund and the Dynamic Emerging Multi-Asset Fund, the “New Funds”). At an in-person meeting held on September 11, 2012, the Board and the Independent Trustees unanimously approved, for an initial two-year term, (i) the Investment Management Agreement on behalf of the NFJ Emerging Markets Value Fund, Structured Alpha Fund and U.S. Equity Hedged Fund, each a new series of the Trust, (ii) the Sub-Advisory Agreement between the Investment Manager and NFJ for the NFJ Emerging Markets Value Fund, and (iii) the Sub-Advisory Agreement between the Investment Manager and AGI U.S. for the Structured Alpha Fund and U.S. Equity Hedged Fund. The NFJ Emerging Markets Value Fund commenced operations on December 18, 2012 and the Structured Alpha Fund and U.S. Equity Hedged Fund commenced operations on December 3, 2012. At an in-person meeting held on December 12, 2012, the Board and the Independent Trustees unanimously approved, for an initial two-year term, (i) the Investment Management Agreement on behalf of the Dynamic Emerging Multi-Asset Fund and Multi-Asset Real Return Fund, each a new series of the Trust, and (ii) the Sub-Advisory Agreement between the Investment Manager and AGI U.S. for the Dynamic Emerging Multi-Asset Fund and Multi-Asset Real Return Fund. The Dynamic Emerging Multi-Asset Fund and Multi-Asset Real Return Fund commenced operations on December 17, 2012.
The Investment Management Agreement and the Sub-Advisory Agreements are collectively referred to herein as the “Agreements.”
At an in-person meeting held on March 21, 2013, the Board and the Independent Trustees unanimously approved the continuation of the Agreements for an additional one-year period from April 1, 2013 through March 31, 2014 with respect to the AllianzGI Retirement 2015 Fund (the “2015 Fund”), AllianzGI Retirement 2020 Fund (the “2020 Fund”), AllianzGI Retirement 2025 Fund (the “2025 Fund”), AllianzGI Retirement 2030 Fund (the “2030 Fund”), AllianzGI Retirement 2035 Fund (the “2035 Fund”), AllianzGI Retirement 2040 Fund (the “2040 Fund”), AllianzGI Retirement 2045 Fund (the “2045 Fund”), AllianzGI Retirement 2050 Fund (the “2050 Fund”), AllianzGI Retirement 2055 Fund (the “2055 Fund”), AllianzGI Retirement Income Fund (the “Retirement Income Fund” and, together with the 2015 Fund, the 2020 Fund, the 2025 Fund, the 2030 Fund, the 2035 Fund, the 2040 Fund, the 2045 Fund, the 2050 Fund and the 2055 Fund, the “Retirement Funds”), AllianzGI Global Allocation Fund (the “Global Allocation Fund”), AllianzGI Global Growth Allocation Fund (the “Global Growth Allocation Fund” and, together with the Global Allocation Fund, the “Allocation Funds”), AllianzGI Convertible Fund (the “AGI Convertible Fund”), AllianzGI Focused Opportunity Fund (the “AGI Focused Opportunity Fund”)1, AllianzGI Global Managed Volatility Fund (the “AGI Managed Volatility Fund”), AllianzGI High Yield Bond
| 1 | The AGI Focused Opportunity Fund liquidated on April 19, 2013. |
| 276 | May 31, 2013 | | Semiannual Report |
Table of Contents
Fund (the “AGI High Yield Fund”), AllianzGI Micro Cap Fund (the “AGI Micro Cap Fund”), AllianzGI Ultra Micro Cap Fund (the “AGI Ultra Micro Cap Fund”), AllianzGI U.S. Emerging Growth Fund (the “AGI Emerging Fund” and, together with the AGI Convertible Fund, the AGI Focused Opportunity Fund, the AGI Managed Volatility Fund, the AGI High Yield Fund, the AGI Micro Cap Fund and the AGI Ultra Micro Cap Fund, the “AGI Funds”), AllianzGI NFJ Global Dividend Value Fund (the “NFJ Dividend Fund”), AllianzGI NFJ International Value II Fund (the “NFJ Value II Fund” and, together with the NFJ Dividend Fund, the “NFJ Funds”), AllianzGI Behavioral Advantage Large Cap Fund (the “F&T Fund”), AllianzGI China Equity Fund (the “China Fund”), AllianzGI Disciplined Equity Fund (the “Disciplined Equity Fund”), AllianzGI Global Water Fund (the “Water Fund”), AllianzGI International Small-Cap Fund (the “Small-Cap Fund”), the Short Duration Fund and AllianzGI Redwood Fund (the “Redwood Fund” and, together with the China Fund, the Disciplined Equity Fund, the Water Fund, the Small-Cap Fund and the Short Duration Fund, the “Legacy RCM Funds” and, together with the Retirement Funds, the Allocation Funds, the AGI Funds, the NFJ Funds and the F&T Fund, the “Renewal Funds” and, together with the New Funds, the “Funds”).
The material factors and conclusions that formed the basis of these approvals for the Funds are discussed below.
The Independent Trustees were assisted in their evaluation of the Agreements and the factors that they deemed to be material, including those factors described below, by independent legal counsel, from whom they received separate legal advice and with whom they met separately from Fund management during their contract review meetings.
In connection with their deliberations regarding the approval of the Agreements, the Trustees, including the Independent Trustees, considered such information and factors as they believed, in light of the legal advice furnished to them and their own business judgment, to be relevant. As described below, the Trustees considered the nature, extent and quality of the various investment management, administrative and other services to be performed by the Investment Manager and the Sub-Advisers under the Agreements.
In connection with their contract review meetings, the Trustees received and relied upon materials provided by the Investment Manager including, among other items: (i) information provided by Lipper, Inc. (“Lipper”), an independent third party, for the Renewal Funds on the investment performance of a group of funds with investment classifications and/or objectives comparable to those of the Renewal Funds identified by Lipper (the “Lipper performance universe”), the performance of applicable benchmark indices and the total return investment performance (based on net assets) of the Renewal Funds for various time periods; (ii) information provided by Morningstar Associates LLC (“Morningstar”), an independent third party, for the New Funds on the investment performance for various time periods, including annualized return performance information for certain time periods, of a group of funds with investment
classifications and/or objectives comparable to those proposed for the New Funds identified by Morningstar; (iii) information on the New Funds’ management fees and other anticipated expenses and on the Renewal Funds’ management fees and other expenses and information provided by Morningstar or Lipper, as applicable, on the management fees and other expenses of comparable funds identified by Morningstar or Lipper, as applicable; (iv) to the extent applicable, information regarding the investment performance and fees for other funds and accounts managed by the Investment Manager and the Sub-Advisers, including institutional and separate accounts, with similar investment objective(s) and policies to those of the Funds, (v) an estimate of the profitability to the Investment Manager from its relationship with the New Funds during their first year and the estimated profitability to the Investment Manager from its relationship with the Renewal Funds for the twelve months ended December 31, 2012; (vi) descriptions of various functions performed or to be performed by the Investment Manager and the Sub-Advisers for the Funds, such as portfolio management, compliance monitoring and portfolio trading practices; and (vii) information regarding the overall organization of the Investment Manager and the Sub-Advisers, including information regarding senior management, portfolio managers and other personnel providing or proposed to provide investment management, administrative and other services to the Funds.
The Trustees’ conclusions as to the approval of the Agreements were based on a comprehensive consideration of all information provided to the Trustees and not the result of any single factor. Some of the factors that figured particularly in the Trustees’ deliberations are described below, although individual Trustees may have evaluated the information presented differently from one another, giving different weights to various factors. The Trustees recognized that the fee arrangements for the Renewal Funds are the result of years of review and discussion between the Independent Trustees and the Investment Manager, that certain aspects of such arrangements may receive greater scrutiny in some years than in others, and that the Trustees’ conclusions may be based, in part, on their consideration of these same arrangements during the course of the year and in prior years. The Trustees evaluated information available to them on a Fund-by-Fund basis, and their determinations were made separately in respect of each Fund. However, they also took into account the common interests of all series of the Trust in their review. The Trustees also took into account that the Investment Manager had proposed the continuation of certain advisory fee waivers and expense caps for the Renewal Funds and had proposed to observe certain advisory fee waivers and expense caps for the New Funds. The Trustees also considered the risk profiles of the Funds.
Performance Information
Fund-specific performance results for the Renewal Funds reviewed by the Trustees are discussed below. The comparative performance information was prepared and provided by Lipper and was not
| Semiannual Report | | May 31, 2013 | 277 |
Table of Contents
Unaudited
Matters Relating to the Trustees’ Consideration of the Investment Management and Sub-Advisory Agreements (cont’d)
independently verified by the Trustees. Due to the passage of time, these performance results may differ from the performance results for more recent periods, including those shown elsewhere in this report. With respect to all Renewal Funds, the Trustees reviewed, among other information, comparative information showing performance for Class A and Institutional Class2 shares of the Renewal Funds against their respective Lipper performance universes for the one-year, three-year, five-year and ten-year periods (to the extent each such Fund had been in existence) ended November 30, 2012. For Renewal Funds that commenced operations during the Trust’s fiscal year ended November 30, 2012, the Trustees reviewed comparative information showing performance for Class A and Institutional Class shares of the Renewal Funds against their respective Lipper performance universes for the period from the Renewal Fund’s inception through November 30, 2012. Institutional Class performance relative to the median for each Renewal Fund’s Lipper performance universe is described below, and for those Renewal Funds with performance that ranked below the median for their respective Lipper performance universes, the specific quintile rankings for Institutional Class shares are also noted below with respect to the relevant periods of underperformance.
Retirement Funds and Allocation Funds. For the 2015 Fund, performance was above median for the one-year and three-year periods. For the 2020 Fund, performance was above median for the one-year period and below median (in the third quintile) for the three-year period. For the 2025 Fund, performance was below median (in the fourth quintile) for the period since the Fund’s inception. For the 2030 Fund, performance was below median for the one-year and three-year periods (in the fourth quintile and third quintile, respectively). For the 2035 Fund, performance was below median (in the fourth quintile) for the period since the Fund’s inception. For the 2040 Fund, performance was below median for the one-year and three-year periods (in the fifth quintile and third quintile, respectively). For the 2045 Fund, performance was below median (in the fifth quintile) for the period since the Fund’s inception. For the 2050 Fund, performance was below median for the one-year and three-year periods (in the fifth quintile and third quintile, respectively). For the 2055 Fund, performance was below median (in the fifth quintile) for the period since the Fund’s inception. For the Retirement Income Fund, performance was above median for the one-year and three-year periods. For the Global Growth Allocation Fund, performance was above median for the one-year and three-year periods. For the Global Allocation Fund, performance was above median for the one-year, three-year, five-year and ten-year periods.
AGI Funds. For the AGI Convertible Fund, performance was at median for the one-year period and above median for the three-year, five-year and ten-year periods. For the AGI Focused Opportunity Fund, performance was below median (in the fifth quintile) for the one-year period. For the AGI Managed Volatility Fund, performance was below
median (in the third quintile) for the period since the Fund’s inception. For the AGI High Yield Fund, performance was below median (in fourth quintile) for the one-year period and above median for the three-year, five-year and ten-year periods. For the AGI Micro Cap Fund, performance was above median for the one-year, three-year and ten-year periods and below median (in the third quintile) for the five-year period. For the AGI Ultra Micro Cap Fund, performance was above median for the one-year and three-year periods. For the AGI Emerging Fund, performance was above median for the ten-year period and below median (in the fourth quintile) for the one-year, three-year and five-year periods.
Legacy RCM Funds. For the China Fund, performance was below median (in the fourth quintile) for the one-year period. For the Disciplined Equity Fund, performance was below median for the one-year and three-year periods (in the fifth quintile and fourth quintile, respectively). For the Water Fund, performance was above median for the one-year and three-year periods. For the Small-Cap Fund, performance was above median for the one-year, five-year and ten-year periods and below median (in the third quintile) for the three-year period. For the Redwood Fund, performance was above median for the one-year period. For the Short Duration Fund, performance was below median (in the fifth quintile) for the one-year period.
NFJ Funds. For the NFJ Dividend Fund, performance was below median for the one-year and three-year periods (in the fourth quintile and third quintile, respectively). For the NFJ Value II Fund, performance was above median for the period since the Fund’s inception.
F&T Fund. For the F&T Fund, performance was above median for the one-year period.
In addition, the Trustees considered matters bearing on the Renewal Funds and their advisory arrangements at their meetings throughout the year, including a review of performance data at each regular meeting.
As part of their review, the Trustees examined the ability of the Investment Manager and the Sub-Advisers to provide high-quality investment management and other services to the Funds. Among other information, the Trustees considered the investment philosophy and research and decision making processes of the Sub-Advisers; the experience of key advisory personnel of the Sub-Advisers responsible for portfolio management of the Funds; the ability of the Investment Manager and the Sub-Advisers to attract and retain capable personnel; and the capability of the senior management and staff of the Investment Manager and the Sub-Advisers. In addition, the Trustees reviewed the quality of the Investment Manager’s and the Sub-Advisers’ services or expected services with respect to regulatory compliance and ability to comply with the investment and compliance policies and procedures of the Funds; the nature, extent and quality of certain administrative services the Investment Manager is responsible for providing to the Renewal Funds and would be responsible for
| 2 | Effective April 1, 2013, Institutional Class shares of the Retirement Funds were reclassified as Class R6 shares. References to “Institutional Class” shares of the Retirement Funds below should be construed as referring to Institutional Class shares for periods prior to April 1, 2013 and as referring to Class R6 shares for subsequent periods. |
| 278 | May 31, 2013 | | Semiannual Report |
Table of Contents
providing to the New Funds; and conditions that might affect the ability of the Investment Manager or the Sub-Advisers to provide high-quality services to the Funds in the future under the Agreements, including each organization’s respective financial condition and operational stability. Based on the foregoing, the Trustees concluded that the Sub-Advisers’ investment process, research capabilities and philosophy were well-suited to each Fund given its investment objectives and policies, and that the Investment Manager and the Sub-Advisers would be able to continue to meet and/or meet any reasonably foreseeable obligations under each Agreement.
Fee and Expense Information
In assessing the reasonableness of the Renewal Funds’ fees under the Agreements, the Trustees considered, among other information, each Renewal Fund’s management fee (or, in the case of the Retirement Funds, each Retirement Fund’s advisory fee) and the Renewal Fund’s total expense ratio as a percentage of average daily net assets and the management fees and total expense ratios of peer groups of funds based on information provided by Lipper. The Trustees also noted the management fee waiver and/or expense limitation agreements observed by the Investment Manager for the Renewal Funds that cap fees or expenses of their various share classes.
In assessing the reasonableness of the New Funds’ proposed fees under the Agreements, the Trustees considered, among other information, each New Fund’s proposed management fee and the New Fund’s expected net expense ratio as a percentage of anticipated average daily net assets, taking into account the management fee waiver and/or expense limitation agreements that the Investment Manager would observe, and the advisory fees and net expense ratios of peer groups of funds based on information provided by Morningstar. The Trustees considered how the net expense ratio of each New Fund was expected to compare to that of its Morningstar peers, and considered comparisons of each New Fund’s proposed management fee with the advisory fee of peer funds identified by Morningstar.
In comparing the Funds to their respective Lipper or Morningstar peers, as applicable, with respect to expenses, the Trustees noted that the Funds (other than the Retirement Funds) were not charged a separate administration fee, recognizing that their management fee includes a component for administrative services, while many peer funds in the Lipper and Morningstar categories have separate advisory and administration agreements with separate fees. With respect to the New Funds, the Trustees placed significant emphasis on the estimated net expense ratio of the New Funds compared to the net expense ratios of the peer funds provided by Morningstar, recognizing that the fees for investment advisory, administrative services and fund operating expenses would be subsumed within the net expense ratio of all funds. The Trustees also took into account the “unitary” administrative fee structure applicable to the Retirement Funds, under which certain third-party services that are ordinarily the financial responsibility of a mutual fund (e.g., audit, custody, accounting, legal,
transfer agency, and printing services) are, in the case of the Funds, paid for by the Investment Manager out of its administrative fee.
The Trustees also considered information showing the advisory fees charged by the Investment Manager and Sub-Advisers to other funds and accounts, including institutional and separate accounts, with similar investment objective(s) and policies to those of the Funds, if any. In comparing these fees, the Trustees considered information provided by the Investment Manager as to the generally broader and more extensive services provided to the Renewal Funds in comparison to institutional or separate accounts, the higher demands placed on the Investment Manager’s investment personnel and trading infrastructure as a result of the daily cash in-flows and out-flows of the Renewal Funds, and the impact on the Investment Manager and expenses associated with the more extensive regulatory regime to which the Renewal Funds are subject in comparison to institutional or separate accounts.
The Trustees reviewed information provided by Lipper comparing each Renewal Fund’s advisory fee or management fee, as applicable, and ratios of total expenses (less Rule 12b-1/distribution fees) to net assets (“total expense ratios”) for two share classes (Class A and Institutional Class share classes) to those of a group of comparable funds for the most recent fiscal year ended November 30, 2012. Class A shares of the applicable Lipper-selected group of comparable funds are referred to below as the “retail expense group,” and Institutional Class shares are referred to as the “institutional expense group.” The Trustees noted that the Lipper data takes into account any fee reductions or expense limitations that were in effect during a Renewal Fund’s last fiscal year. The Fund-specific fee and expense results discussed below were prepared and provided by Lipper and were not independently verified by the Trustees. The Renewal Funds’ fee and expense rankings are discussed below relative to the median of the applicable Lipper-selected group of comparable funds. A Renewal Fund whose fees and expenses were below median had fees and expenses that were less than the median fees and expenses of its peer group, while a Renewal Fund whose fees and expenses were above median had fees and expenses that were higher than the median fees and expenses of its peer group. For those Renewal Funds whose fees or expenses were higher than the median, the specific quintile rankings are also noted below with respect to the relevant above-median fee or expense categories (unless quintile rankings were not provided to the Trustees by Lipper, in which case fund rankings are provided). For example, a Renewal Fund with the highest fees and expenses relative to its peer group would rank in the fifth quintile, while a Renewal Fund with the lowest fees and expenses relative to its peer group would rank in the first quintile.
Retirement Funds and Allocation Funds. For the 2015 Fund, 2020 Fund, 2030 Fund, 2035 Fund, 2040 Fund, 2045 Fund, 2050 Fund and 2055 Fund, advisory fees and total expense ratios (taking fee waivers into account) were below median for both the retail and institutional expense groups. For the 2025 Fund, advisory fees were at median for the retail expense group and below median for the institutional
| Semiannual Report | | May 31, 2013 | 279 |
Table of Contents
Unaudited
Matters Relating to the Trustees’ Consideration of the Investment Management and Sub-Advisory Agreements (cont’d)
expense group, and total expense ratios (taking fee waivers into account) were below median for both the retail and institutional expense groups. For the Retirement Income Fund, advisory fees and total expense ratios were below median for both the retail and institutional expense groups (total expense ratios for Institutional Class shares take fee waivers into account). For the Global Growth Allocation Fund, management fees were above median (fifth out of five funds) for both the retail and institutional expense groups, and total expense ratios (taking fee waivers into account) were below median for both the retail and institutional expense groups. For the Global Allocation Fund, management fees were above median for both the retail and institutional expense groups (in the fifth quintile), and total expense ratios (taking fee waivers into account) were below median for both the retail and institutional expense groups.
AGI Funds. For the AGI Convertible Fund, management fees were below median for both the retail and institutional expense groups, total expense ratios were above median (in the fourth quintile) for the retail expense group and below median for the institutional expense group. For the AGI Focused Opportunity Fund, AGI Managed Volatility Fund, AGI High Yield Fund and AGI Emerging Fund, management fees and total expense ratios (taking fee waivers into account) were below median for both the retail and institutional expense groups. For the AGI Micro Cap Fund, management fees were above median for both the retail and institutional expense groups (in the fourth quintile for the institutional expense group and fifth out of five funds in the retail expense group), and total expense ratios (taking fee waivers into account) were above median for both the retail and institutional expense groups (in the fourth quintile for the institutional expense group and fourth out of five funds in the retail expense group). For the AGI Ultra Micro Cap Fund, management fees were above median (in the fifth quintile) for both the retail and institutional expense groups, and total expense ratios (taking fee waivers into account) were above median (in the fifth quintile) for both the retail and institutional expense groups.
Legacy RCM Funds. For the China Fund, Disciplined Equity Fund and Short Duration Fund, management fees and total expense ratios (taking fee waivers into account) were below median for both the retail and institutional expense groups. For the Water Fund, management fees were above median (in the fourth quintile) for both the retail and institutional expense groups, and total expense ratios were above median (in the fourth quintile) for both the retail and institutional expense groups (total expense ratios for Class A shares take fee waivers into account). For the Small-Cap Fund, management fees were below median for both the retail and institutional expense groups, and total expense ratios (taking fee waivers into account) were below median for the retail expense group and above median (in the fourth quintile) for the institutional expense group. For the Redwood Fund, management fees were below median for both the retail and institutional expense groups, and total expense ratios (taking fee waivers into account) were at median for the retail expense group and above median (in the fourth quintile) for the institutional expense group.
NFJ Funds. For the NFJ Dividend Fund, management fees were below median for both the retail and institutional expense groups, and total expense ratios (taking fee waivers into account) were below median for the retail expense group and at median for the institutional expense group. For the NFJ Value II Fund, management fees and total expense ratios (taking fee waivers into account) were below median for both the retail and institutional expense groups.
F&T Fund. For the F&T Fund, management fees and total expense ratios (taking fee waivers into account) were below median for both the retail and institutional expense groups.
The Trustees considered the estimated profitability to the Investment Manager of its relationship with each Renewal Fund and the estimated profitability to the Investment Manager of its relationship with each New Fund and determined that such profitability did not appear to be excessive. The Trustees considered the extent to which the Adviser and Sub-Advisers may realize economies of scale or other efficiencies in managing and supporting the Funds. The Trustees took into account that, as open-end investment companies, the Funds intend to raise additional assets, so as the assets of the Funds grow over time, certain economies of scale and other efficiencies may be realized through spreading certain fixed costs across a larger asset base or across a variety of products and services, while also taking into account the fee waiver and expense limitation arrangements observed by the Investment Manager for applicable Funds. Additionally, the Trustees considered so-called “fall-out benefits” to the Investment Manager, the Sub-Advisers and their affiliates, such as reputational value derived from serving as Investment Manager and Sub-Advisers to the Funds.
After reviewing these and other factors described herein, the Trustees concluded, within the context of their overall conclusions regarding the Agreements, that they were satisfied with the Investment Manager’s and Sub-Advisers’ responses and efforts relating to the investment performance of the Renewal Funds, including efforts to improve performance for underperforming Renewal Funds. With respect to the Renewal Funds, Trustees also concluded that the fees payable under each Agreement represent reasonable compensation in light of the nature, extent and quality of services provided by the Investment Manager or Sub-Advisers, as the case may be, and should be continued. With respect to the New Funds, the Trustees also concluded the proposed fees payable under each Agreement represent reasonable compensation in light of the nature, extent and quality of services to be provided by the Investment Manager or Sub-Advisers, as the case may be, and should be approved for an initial two-year period. Based on their evaluation of factors that they deemed to be material, including those factors described above, the Trustees,
including the Independent Trustees, unanimously concluded that the continuation of the Agreements with respect to the Renewal Funds and initial approval of the Agreements with respect to the New Funds were in the interests of the applicable Funds and their shareholders, and should be approved.
| 280 | May 31, 2013 | | Semiannual Report |
Table of Contents
Allianz Multi-Strategy Funds
Trustees
Hans W. Kertess
Chairman of the Board of Trustees
Deborah A. DeCotis
Bradford K. Gallagher
James A. Jacobson
John C. Maney
William B. Ogden, IV
Alan Rappaport
Officers
Brian S. Shlissel
President
Lawrence G. Altadonna
Treasurer, Principal Financial & Accounting Officer
Thomas J. Fuccillo
Vice President, Secretary & Chief Legal Officer
Scott Whisten
Assistant Treasurer
Richard J. Cochran
Assistant Treasurer
Orhan Dzemaili
Assistant Treasurer
Thomas L. Harter
Chief Compliance Officer
Lagan Srivastava
Assistant Secretary
Richard H. Kirk
Assistant Secretary
Paul Koo
Assistant Secretary
Morley D. Campbell
Assistant Secretary
Thomas W. Oliver
Assistant Secretary
Investment Manager
Allianz Global Investors Fund Management LLC
1633 Broadway
New York, NY 10019
Sub-Advisers
Allianz Global Investors U.S. LLC
1633 Broadway
New York, NY 10019
Fuller & Thaler Asset Management, Inc.(1)
411 Borel Avenue, Suite 300
San Mateo, CA 94402
NFJ Investment Group LLC
2100 Ross Avenue, Suite 700
Dallas, TX 75201
Distributor
Allianz Global Investors Distributors LLC
1633 Broadway
New York, NY 10019
Custodian & Accounting Agent
State Street Bank & Trust Co.
801 Pennsylvania Avenue
Kansas City, MO 64105
Shareholder Servicing and Transfer Agent
Boston Financial Data Services, Inc.
(Class A, Class B, Class C, Class D and Class R shares)
P.O. Box 8050
Boston, MA 02266-8050
(Class P, Class R6, Institutional Class and Administrative Class shares)
330 West 9th Street, 5th Floor
Kansas City, MO 64105
Independent Registered Public Accounting Firm
PricewaterhouseCoopers LLP
300 Madison Avenue
New York, NY 10017
Legal Counsel
Ropes & Gray LLP
Prudential Tower
800 Boylston Street
Boston, MA 02199
This report, including the financial information herein, is transmitted to the shareholders of the Trust for their information. It is not a prospectus, circular or representation intended for use in the purchase of shares of each Fund or any securities mentioned in this report.
The financial information included herein is taken from the records of the Funds without examination by an independent registered public accounting firm, who did not express an opinion herein.
For Account Information
Contact your financial adviser, or if you receive account statements directly from Allianz Global Investors, you can also call (800) 988-8380 for Class A, B, C, D and R shares or (800) 498-5413 for Class P, Class R6, Institutional Class and Administrative Class shares. Telephone representatives are available Monday-Friday 8:30 am to 8:00 pm Eastern Time. Or visit our website, us.allianzgi.com.
| (1) | Fuller & Thaler Asset Management, Inc. is an independently owned investment firm. |
Table of Contents
About Allianz Global Investors
Understand. Act. This two-word philosophy is at the core of what we do. To stand out as the investment partner our clients trust, we listen closely to understand their needs, then act decisively to deliver solutions. We are a diversified active investment manager with a strong parent company, a culture of risk management and $405 billion in AUM.* With 23 offices in 18 countries and over 500 investment professionals, we provide global investment and research capabilities with consultative local delivery.
For more information about any of our investment solutions or client services, call your financial advisor or visit us.allianzgi.com.
Investors should consider the investment objectives, risks, charges and expenses of the above mentioned Funds carefully before investing. This and other information is contained in the Fund’s prospectus, which may be obtained by contacting your financial advisor, by visiting us.allianzgi.com or by calling 1-800-988-8380 (retail classes: A, B, C, D & R) or 1-800-498-5413 (Class P, R6, Institutional and Administrative classes). Please read the prospectus carefully before you invest or send money.
* As of 3/31/13
Allianz Global Investors Fund Management LLC serves as the investment manager for the Allianz Funds and the Allianz Multi-Strategy Funds. Allianz Funds and the Allianz Multi-Strategy Funds are distributed by Allianz Global Investors Distributors LLC. © 2013. For information about any product, contact your financial advisor.
us.allianzgi.com
Receive this report electronically and eliminate paper mailings.
To enroll, go to us.allianzgi.com/edelivery.
| ©2013 Allianz Global Investors Distributors LLC | AZ750SA_053113 |
AGI-2013-05-30-6983
Table of Contents
| ITEM 2. | CODE OF ETHICS |
| (a) | Not required in this filing. |
| ITEM 3. | AUDIT COMMITTEE FINANCIAL EXPERT |
Not required in this filing.
| ITEM 4. | PRINCIPAL ACCOUNTANT FEES AND SERVICES |
Not required in this filing.
| ITEM 5. | AUDIT COMMITTEE OF LISTED REGISTRANT |
Disclosure not required for open-end management investment companies.
| ITEM 6. | SCHEDULE OF INVESTMENTS |
| (a) | Schedule of Investments is included as part of the report to shareholders filed under Item 1 of this form. |
| (b) | Not applicable. |
| ITEM 7. | DISCLOSURE OF PROXY VOTING POLICIES AND PROCEDURES FOR CLOSED-END MANAGEMENT INVESTMENT COMPANIES |
Disclosure not required for open-end management investment companies.
| ITEM 8. | PORTFOLIO MANAGERS OF CLOSED-END MANAGEMENT INVESTMENT COMPANIES |
Disclosure not required for open-end management investment companies.
| ITEM 9. | PURCHASES OF EQUITY SECURITIES BY CLOSED-END MANAGEMENT INVESTMENT COMPANY AND AFFILIATED COMPANIES. |
Disclosure not required for open-end management investment companies.
| ITEM 10. | SUBMISSION OF MATTERS TO A VOTE OF SECURITY HOLDERS |
There were no material changes to the procedures by which shareholders may recommend nominees to the Fund’s Board of Trustees since the Fund’s last provided disclosure in response to this item.
| ITEM 11. | CONTROLS AND PROCEDURES |
| (a) | The registrant’s President and Treasurer, Principal Financial & Accounting Officer have concluded that the registrant’s disclosure controls and procedures (as defined in Rule 30a-3(c) under the Act (17 CFR 270.30a-3(c))), are effective based on their evaluation of these controls and procedures as of a date within 90 days of the filing date of this document. |
| (b) | There were no significant changes in the registrant’s internal control over financial reporting (as defined in Rule 30a-3(d) under the Act (17 CFR 270.30a-3(d))) that occurred during the second fiscal quarter of the period covered by this report that has materially affected, or is reasonably likely to materially affect, the registrant’s internal control over financial reporting. |
| ITEM 12. | EXHIBITS |
(a)(1) Not required in this filing.
(a)(2) Exhibit 99.302 Cert. — Certification pursuant to Section 302 of the Sarbanes-Oxley Act of 2002
(a)(3) Not applicable
(b) Exhibit 99.906 Cert. — Certification pursuant to Section 906 of the Sarbanes-Oxley Act of 2002
Table of Contents
Signatures
Pursuant to the requirements of the Securities Exchange Act of 1934 and the Investment Company Act of 1940, the registrant has duly caused this report to be signed on its behalf by the undersigned, thereunto duly authorized.
(Registrant) Allianz Funds Multi-Strategy Trust
By: | /s/ Brian S. Shlissel | |
| ||
| Brian S. Shlissel, | ||
| President |
Date: July 31, 2013
By: | /s/ Lawrence G. Altadonna | |
| ||
| Lawrence G. Altadonna | ||
| Treasurer, Principal Financial & | ||
| Accounting Officer |
Date: July 31, 2013
Pursuant to the requirements of the Securities Exchange Act of 1934 and the Investment Company Act of 1940, this report has been signed below by the following persons on behalf of the registrant and in the capacities and on the dates indicated.
By: | /s/ Brian S. Shlissel | |
| ||
| Brian S. Shlissel, | ||
| President |
Date: July 31, 2013
By: | /s/ Lawrence G. Altadonna | |
| ||
| Lawrence G. Altadonna, | ||
| Treasurer, Principal Financial & | ||
| Accounting Officer |
Date: July 31, 2013