Table of Contents
UNITED STATES
SECURITIES AND EXCHANGE COMMISSION
Washington, D.C. 20549
FORM N-CSR
CERTIFIED SHAREHOLDER REPORT OF
REGISTERED MANAGEMENT INVESTMENT COMPANIES
Investment Company Act file number: 811-22167
Allianz Funds Multi-Strategy Trust
(Exact name of registrant as specified in charter)
1633 Broadway, New York, NY 10019
(Address of principal executive offices) (Zip code)
Lawrence G. Altadonna
1633 Broadway, New York, NY 10019
(Name and address of agent for service)
Registrant’s telephone number, including area code: 212-739-3371
Date of fiscal year end: November 30, 2015
Date of reporting period: May 31, 2015
Table of Contents
Item 1. Report to Shareholders

Allianz Multi-Strategy Funds
SHARE CLASSES A, B, C, D, R, P, INSTITUTIONAL, R6, ADMINISTRATIVE
Semiannual Report
May 31, 2015
AllianzGI Retirement 2015 Fund
AllianzGI Retirement 2020 Fund
AllianzGI Retirement 2025 Fund
AllianzGI Retirement 2030 Fund
AllianzGI Retirement 2035 Fund
AllianzGI Retirement 2040 Fund
AllianzGI Retirement 2045 Fund
AllianzGI Retirement 2050 Fund
AllianzGI Retirement 2055 Fund
AllianzGI Retirement Income Fund
AllianzGI Global Allocation Fund
AllianzGI Global Dynamic Allocation Fund (formerly AllianzGI Global Growth Allocation Fund)
AllianzGI Global Megatrends Fund
AllianzGI Behavioral Advantage Large Cap Fund
AllianzGI Best Styles Emerging Markets Equity Fund
AllianzGI Best Styles Global Equity Fund
AllianzGI Best Styles International Equity Fund
AllianzGI Best Styles U.S. Equity Fund
AllianzGI China Equity Fund
AllianzGI Convertible Fund
AllianzGI Emerging Markets Consumer Fund
AllianzGI Emerging Markets Debt Fund
AllianzGI Emerging Markets Small-Cap Fund
AllianzGI Europe Equity Dividend Fund
AllianzGI Global Fundamental Strategy Fund
AllianzGI Global Managed Volatility Fund
AllianzGI Global Sustainability Fund
AllianzGI Global Water Fund
AllianzGI High Yield Bond Fund
AllianzGI International Growth Fund
AllianzGI International Small-Cap Fund
AllianzGI Micro Cap Fund
AllianzGI Multi-Asset Real Return Fund
AllianzGI NFJ Emerging Markets Value Fund
AllianzGI NFJ Global Dividend Value Fund
AllianzGI NFJ International Small-Cap Value Fund
AllianzGI NFJ International Value II Fund
AllianzGI Short Duration High Income Fund
AllianzGI Structured Return Fund
AllianzGI U.S. Equity Hedged Fund
AllianzGI U.S. Small-Cap Growth Fund
AllianzGI Ultra Micro Cap Fund
This material is authorized for use only when preceded or accompanied by the current Allianz Multi-Strategy Funds prospectus. Investors should consider the investment objectives, risks, charges and expenses of each Fund carefully before investing. This and other information is contained in the Funds’ prospectuses and summary prospectuses. Please read the prospectus carefully before you invest or send money.

Receive this report electronically and eliminate paper mailings.
To enroll, go to http://us.allianzgi.com/edelivery.
Table of Contents
| 2–3 | Letter from the President | |||
| 4–105 | Fund Summaries | |||
| 106-107 | Important Information | |||
| 108-111 | Benchmark Descriptions | |||
| 112-166 | Schedules of Investments | |||
| 168-183 | Statements of Assets and Liabilities | |||
| 184-199 | Statements of Operations | |||
| 200-216 | Statements of Changes in Net Assets | |||
| 218-281 | Financial Highlights | |||
| 282-368 | Notes to Financial Statements | |||
| 369 | Shareholder Meeting Results/Changes to Board of Trustees | |||
| 370-375 | Matters Relating to the Trustees’ Consideration of the Investment Management and Sub-Advisory Agreements | |||
| 376-377 | Privacy Policy |
A Word About Risk: A fund may be subject to various risks as described in its prospectus. Some of those risks may include, but are not limited to, the following: derivatives risk, smaller company risk, non-US investment risk, focused investment risk and specific sector investment risks. Use of derivative instruments may involve certain costs and risks such as liquidity risk, interest rate risk, market risk, credit risk, counterparty risk, management risk and the risk that a fund is unable to close out a position when it is most advantageous to do so. Portfolios investing in derivatives could lose more than the principal amount invested in those instruments. Investing in foreign securities may entail risk due to foreign economic and political developments; this risk may be enhanced when investing in emerging markets. Smaller companies may be more volatile than larger companies and may entail more risk. Concentrating investments in individual sectors may add additional risk and additional volatility compared to a diversified equity portfolio. AllianzGI target-date funds seek to manage risk and return by blending two separately-managed portfolios: a return-generating portfolio for growth potential, and a defensive portfolio for principal protection. The balance grows increasingly defensive over time until the target date is reached, after which the Fund’s assets roll into a retirement income strategy. The principal values of the Funds are not guaranteed at any time, including the target date. Please refer to the Fund’s applicable current prospectus for complete details.
Table of Contents

Julian Sluyters
President & CEO
Dear Shareholder,
Despite the US economy experiencing a setback in early 2015, the US stock market posted a positive return during the six-month fiscal reporting period ended May 31, 2015. While there were expectations that bond yields would move higher — and prices lower — the US bond market generated a modest gain during the reporting period.
Six Months in Review
For the six-month fiscal reporting period ended May 31, 2015, US stocks, as measured by the Standard & Poor’s 500 Index, rose 2.97%. Two measures of stock performance in developed international and global markets, the MSCI EAFE (Europe, Australasia and Far East) Index and the MSCI World Index, returned 4.84% and 3.38%, respectively, in dollar-denominated terms. Elsewhere, the MSCI Emerging Markets Index gained 0.82%.
With respect to bonds, the Barclays US Credit Index returned 0.99%, whereas the Barclays Global High Yield Index rose 0.64%. The Barclays US Government Bond Index returned 1.06%, while the broader bond market index, as measured by the Barclays US Aggregate Bond Index, gained 1.09%. The Barclays Global Aggregate Index fell by 3.3%.
Turning to the US economy, gross domestic product (“GDP”), the value of goods and services produced in the country, the broadest measure of economic activity and the principal indicator of economic performance, expanded at an annual pace of 2.2% during the fourth quarter of 2014. The US economy then contracted during the first quarter of 2015, as the US Commerce Department reported that GDP fell at an annual pace of 0.2%.
The Federal Reserve (the “Fed”) maintained an accommodative monetary policy during the reporting period, but it appeared to move closer to its first rate hike in nine years. At its March 2015 meeting, the Fed eliminated the word “patient” from its official statement regarding when it may start raising rates. Then, at its meeting that concluded on June 17, 2015, after the reporting period had ended, the Fed said that it “…currently anticipates that, even after employment and inflation are near mandate-consistent levels, economic conditions may, for some time, warrant keeping the target federal funds rate below levels the Committee views as normal in the longer run.”
| 2 | May 31, 2015 | | Semiannual Report |
Table of Contents
Outlook
For the second time in two years, the US economy stumbled during the first quarter. In both cases, this was partially attributed to extreme winter weather. Whether we see the type of snapback in 2015 that we saw in 2014 is subject to debate. One factor that is likely to play a pivotal role is consumer spending. Despite lower oil prices, a significant job recovery and stronger personal balance sheets than a few years ago, consumer spending during the first quarter of 2015 grew at a tepid pace. In our view, we should experience an uptick in spending in the coming quarters. In terms of the Fed and the projected start of interest rate “liftoff,” we believe Federal Reserve Chair Janet Yellen will be true to her word, as she said in late May, “…if the economy continues to improve as I expect, I think it will be appropriate at some point this year to take the initial step to raise the federal funds rate target and begin the process of normalizing monetary policy… After we begin raising the federal funds rate, I anticipate that the pace of normalization is likely to be gradual.”
On behalf of Allianz Global Investors Fund Management and our Sub-Advisers, thank you for investing with us. We encourage you to consult with your financial advisor and to visit our website, us.allianzgi.com, for additional information. We remain dedicated to serving your investment needs.
Sincerely,

Julian Sluyters
President & Chief Executive Officer
Past performance is no guarantee of future results. Unless otherwise noted, index returns reflect the reinvestment of income dividends and capital gains, if any, but do not reflect fees, brokerage commissions or other expenses of investing. It is not possible to invest directly in an index.
Receive this report electronically and eliminate paper mailings.
To enroll, go to http://us.allianzgi.com/edelivery.
| Semiannual Report | | May 31, 2015 | 3 |
Table of Contents
Unaudited
For the period of December 1, 2014 through May 31, 2015, as provided by the Multi-Asset US Group.
Fund Insights
For the reporting period ended May 31, 2015, all AllianzGI Target-Date Funds produced positive absolute returns. Each of the Funds underperformed its respective benchmark index (Morningstar Lifetime Conservative series) for the period.
Market Overview
For the six-month period of December 1, 2014 through May 31, 2015, global equities outperformed global bonds with developed country equities leading emerging market equities by more than 3%. In fixed income, global bonds fell 3.3% for the period as measured by the Barclays Global Aggregate Index. However, in the US, as uncertainty about the Fed’s future policy decisions persisted, yields on the 10-year Treasury fell marginally for the period and broad US bonds returned 1.1% as measured by the Barclays US Aggregate Bond Index.
Certain themes from late 2014 persisted in the period, including the continued strength of the US dollar against most major currencies. For the period, one of the best performing assets was the trade-weighted dollar, which returned 10.2%. On the other hand, commodities, led by energy, continued to weaken: commodities remained one of the worst performing asset classes, returning -10.6% for the period as measured by the Bloomberg Commodity Index.
Mid-April marked a period of dislocations across markets. A sell-off in European bonds, most notably in German bunds, which produced swings in bond yields globally, contributed to broad market volatility. The US dollar fell against every major developed market currency and most emerging market currencies in April, while the euro appreciated by 4.6% for the month. In commodities, oil entered positive territory for the year in mid-April, contributing to the perception of stability in oil prices. These events and trends culminated in a renewed focus on inflationary—as opposed to deflationary—trends in the global economy and a pickup in inflation expectations.
Mid-April Market Volatility
The magnitude and rapid pace of the move in European bond yields in late April was unprecedented. The spike in yields was most pronounced in German bunds, with the 10-year yield increasing from a low on April 17, 2015 of 0.05% to a high of 0.78% on May 7, 2015. Several factors contributed to the move, including speculation of tapering on the part of the European Central Bank (“ECB”) on the back of stronger macroeconomic data throughout the region. Concerns about the ability of Greece to reach a deal with the Eurogroup over its obligations to the International Monetary Fund (“IMF”) and other creditors intensified through April and early May, further contributing to bond market volatility. Stronger inflation data released in mid-April, including an increase in the Eurozone Aggregate Consumer Price Index of 1.1% month over month—nearly two times the increase of the previous month—contributed to higher inflation expectations, which in turn paved the way for higher yields. The increase in yields was not limited to Europe. Through mid-May, the US yield curve steepened as rates followed European yields higher and the US 10-year Treasury hit a high for the six-month period of 2.4% on May 12, 2015.
Currencies also underwent a temporary correction in April. The trade-weighted dollar suffered its first monthly decline since July 2014. For the month, the trade-weighted dollar fell 3.8%. In connection with the spike in yields on European bonds and the more solid inflation data, the euro increased more than 6% from its low in mid-April to the end of the month. However, in May, the dollar once again strengthened against all major currencies and the euro resumed its weaker trend against the dollar, falling 2.1%.
The Return of Inflation after Disinflation
Despite significant volatility during the period including a low close to $43 in mid-March, the price of WTI crude stabilized in the $58-60/barrel range by mid-April, leading to a jump in inflation expectations. For example, in late April, one of the Fed’s preferred market based inflation gauges, the 5 year/5 year forward breakeven inflation level from the Treasury Inflation Protected Securities (“TIPS”) market moved above the 2% threshold suggesting that, while short term inflation expectations still lag, the 5-year inflation expectation had reached—and exceeded—the Fed’s inflation target. In the context of moderate global growth, stable energy prices and initial increases in core consumer price inflation, overall inflation expectations inched closer to central bank targets during the period. This may finally signal the dawn of a new era of inflation.
Portfolio Review
Effective April 1, 2015, the Funds’ benchmark index changed from the Real Return Target series (white label) to the Morningstar Lifetime Conservative series, as the portfolio managers consider Morningstar Lifetime Conservative series to be a better representation of the Funds’ investment strategies. Previously, the Real Return Target series replaced the Dow Jones Real Retirement series. This change was due to a decision by the index provider to discontinue the index. With this mid-period change, differences between the two benchmarks should be considered for purposes of performance comparison.
Relative to the benchmark index, the Funds were underweight nominal bonds and overweight US inflation linked securities, while exposure to global equities was roughly in line with the benchmark. Within fixed income, the Funds were positioned with an overweight to credit and underweight to duration. Within global equities, the Funds were also overweight developed large-cap equities outside the US and were underweight US small-cap equities. The Funds also held opportunistic asset classes such as real estate, commodities and managed futures.
In the fixed income portion of each Fund’s portfolio, performance trailed the benchmark primarily due to an emphasis on inflation linked securities, which trailed nominal treasuries over the full period. Each Fund’s portfolio benefited from the nominal portion of the portfolio, with an emphasis on credit related exposure through the AllianzGI Short Duration High Income Fund (+3%) and PIMCO Income Fund (+2%), which contributed to results.
| 4 | May 31, 2015 | | Semiannual Report |
Table of Contents
Unaudited
AllianzGI Target-Date Funds (cont’d)
In the equity portion of each Fund’s portfolio, allocation and selection effects ultimately detracted from the Funds’ overall relative result. In the US equity exposure, an underweight to small-cap equities relative to the benchmark index detracted from relative performance as small-caps outperformed the broader market. Outside the US, the Funds’ overweight to developed markets contributed to the Funds’ results. However, selection in emerging market equities detracted.
The Funds’ exposure to opportunistic asset classes, including commodities, detracted from results over the period. Partially offsetting this were positive contributions from exposure to global Real Estate Investment Trusts (REITs) and commodity-related equities, which posted positive results over the period.
In aggregate, the Funds’ emphasis on TIPS within the fixed income component and an underweight to small-cap stocks in the US detracted from relative results over the period. The AllianzGI Target-Date Funds place a strong emphasis on the Department of Labor’s guidelines for a Qualified Default Investment Alternative (“QDIA”), which contains language such as “to be diversified as to minimize the risk of large losses.” It is within this framework that the Funds continue to emphasize diversification in the portfolio construction process as well as to include commodities, real estate, convertible bonds, floating rate debt, frontier market equities, and emerging market bonds to provide potential benefits to clients’ retirement assets.
Outlook
We expect that the volatility experienced in the period will continue for the rest of 2015. Overall, we continue to expect global growth to slow in 2015 compared to 2014. Despite some softness in the US economy in the period, we expect the growth differential between the US and other developed countries to persist.
The objective of recent changes to the portfolios has been to further insulate them from risks. The Funds remain overweight US equities compared to other developed countries. Part of the international equity exposure remains dollar-hedged, reflecting our view that the USD will continue to benefit from divergent monetary policies and divergent GDP growth. We maintain the Funds’ exposure to frontier-market equities to help further diversify the portfolios.
On interest rates, the biggest question mark for 2015 continues to be the direction, magnitude and timing of short-term interest rate moves, especially in the US, and the overall steepness of the US yield curve. As a result of such uncertainty, we added some duration back into the portfolios through TIPS and US credit (investment grade and high yield). This is partly a way to express our view that core inflation expectations in the US have most likely bottomed. However, even with such changes, we remain close to benchmark duration.
We continue to see an important role for credit in the portfolios. If interest rates remain low or decline further, high yield and investment-grade credit are among the few remaining sectors that can earn income. In the event that US interest rates rise, it will likely be a result of improved economic fundamentals and pickup in inflation, which should benefit US companies. We remain overweight credit strategies that will benefit in a rising interest rate environment.
We remain underweight commodities and REITs. In commodities, we reduced exposure to energy futures during the period. We continue to hold commodity equities, however, and have benefitted during certain periods of commodity-price shocks, when commodity equities behave more like “equities” and less like “commodity futures,” as occurred in the first part of the period.
While the aforementioned risks loom large, the goal of our recent changes is to move closer to having all-weather portfolios that will be able to better withstand the ongoing volatility in oil and other commodity prices, the uncertainty surrounding short-term interest rates, and the slow overall global economic growth that may potentially impact equities. We remain vigilant and ready to respond if markets evolve in a different direction.
* The “Target-Date Funds” are the AllianzGI Retirement 2015 Fund, the AllianzGI Retirement 2020 Fund, the AllianzGI Retirement 2025 Fund, the AllianzGI Retirement 2030 Fund, the AllianzGI Retirement 2035 Fund, the AllianzGI Retirement 2040 Fund, the AllianzGI Retirement 2045 Fund, the AllianzGI Retirement 2050 Fund, and the AllianzGI Retirement 2055 Fund.
| Semiannual Report | | May 31, 2015 | 5 |
Table of Contents
Unaudited
AllianzGI Retirement 2015 Fund
Average Annual Total Return for the period ended May 31, 2015
| 6 Month* | 1 Year | 5 Year | Since Inception† | |||||||||||||||
| AllianzGI Retirement 2015 Fund Class A | 0.50% | 0.55% | 5.77% | 8.06% | ||||||||||||||
| AllianzGI Retirement 2015 Fund Class A (adjusted) | –5.03% | –4.98% | 4.58% | 7.11% | |||||||||||||
| AllianzGI Retirement 2015 Fund Class C | 0.08% | –0.22% | 4.97% | 7.24% | ||||||||||||||
| AllianzGI Retirement 2015 Fund Class C (adjusted) | –0.89% | –1.19% | 4.97% | 7.24% | |||||||||||||
| AllianzGI Retirement 2015 Fund Class D | 0.47% | 0.47% | 5.68% | 8.00% | |||||||||||||
| AllianzGI Retirement 2015 Fund Class R | 0.30% | 0.20% | 5.43% | 7.74% | |||||||||||||
| AllianzGI Retirement 2015 Fund Class P | 0.66% | 0.86% | 6.06% | 8.35% | |||||||||||||
| AllianzGI Retirement 2015 Fund Class R6 | 0.69% | 0.94% | 6.16% | 8.45% | |||||||||||||
| AllianzGI Retirement 2015 Fund Administrative Class | 0.49% | 0.54% | 5.80% | 8.10% | ||||||||||||||
| Morningstar Lifetime Conservative 2015 Index | 0.65% | 1.75% | 7.43% | 8.45% | |||||||||||||
| Real Return Target 2015 Index** | 0.30% | –0.15% | 5.67% | 7.23% | |||||||||||||
| Lipper Mixed-Asset Target 2015 Funds Average | 1.68% | 3.41% | 8.11% | 9.87% | ||||||||||||||
† The Fund began operations on 12/29/08. Benchmark return comparisons began on the fund inception date. Lipper performance comparisons began on 12/31/08.
* Cumulative return
** Effective April 1, 2015, the Funds’ benchmark index changed from the Real Return Target series (white label) to the Morningstar Lifetime Conservative series, as the Morningstar Lifetime Conservative series is considered to be a better representation of the Funds’ investment strategies. Previously, the Real Return Target series replaced the Dow Jones Real Retirement series. This change was due to a decision by the index provider to discontinue the Index. With this mid-period change, differences between the two benchmarks should be considered for purposes of performance comparison.
Performance quoted represents past performance and is no guarantee of future results. Current performance may be lower or higher than performance shown. For performance current to the most recent month-end, visit our website at us.allianzgi.com. Investment return and the principal value will fluctuate. Shares may be worth more or less than original cost when redeemed. The adjusted returns take into account the maximum initial sales charge of 5.50% on Class A shares and the contingent deferred sales charge (CDSC) of 1% on Class C shares, which may apply to shares redeemed during the first year of ownership. Returns do not reflect deduction of taxes that a shareholder would pay on fund distributions or redemption of fund shares. See pages 106 and 107 for more information. The Fund’s gross expense ratios are 1.16% for Class A shares, 1.91% for Class C shares, 1.16% for Class D shares, 1.41% for Class R shares, 0.76% for Class P shares, 0.66% for Class R6 shares and 1.01% for Administrative Class shares. These ratios do not include an expense reduction, contractually guaranteed through at least 3/31/16. The Fund’s expense ratios net of this reduction are 0.97% for Class A shares, 1.72% for Class C shares, 1.07% for Class D shares, 1.32% for Class R shares, 0.67% for Class P shares, 0.57% for Class R6 shares and 0.92% for Administrative Class shares. Expense ratio information is as of the Fund’s current prospectus dated April 1, 2015, as supplemented to date.
| 6 | May 31, 2015 | | Semiannual Report |
Table of Contents
Unaudited
AllianzGI Retirement 2015 Fund (cont’d)
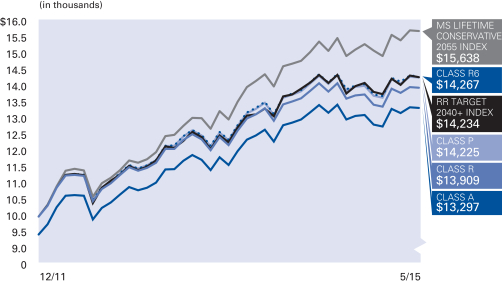
Cumulative Returns Through May 31, 2015
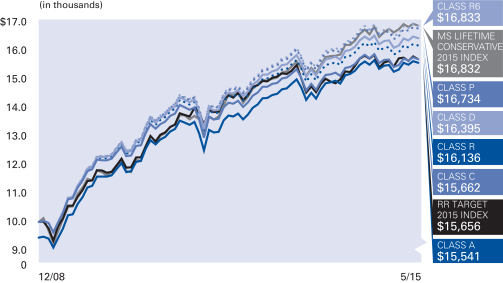
Fund Allocation (as of May 31, 2015)
| PIMCO Broad U.S. TIPS Index | 16.8% | |||
| PIMCO Income | 12.6% | |||
| AllianzGI Best Styles U.S. Equity | 12.0% | |||
| PIMCO Mortgage Opportunities | 9.1% | |||
| AllianzGI Short Duration High Income | 8.6% | |||
| PIMCO 15+ Year U.S. TIPS Index | 4.7% | |||
| PIMCO Long-Term Credit | 4.1% | |||
| AllianzGI Best Styles International Equity | 3.9% | |||
| Other | 27.8% | |||
| Cash & Equivalents — Net | 0.4% |
| Shareholder Expense Example | Actual Performance | |||||||||||||
| Class A | Class C | Class D | Class R | Class P | Class R6 | Administrative Class | ||||||||
| Beginning Account Value (12/1/14) | $1,000.00 | $1,000.00 | $1,000.00 | $1,000.00 | $1,000.00 | $1,000.00 | $1,000.00 | |||||||
| Ending Account Value (5/31/15) | $1,005.00 | $1,000.80 | $1,004.70 | $1,003.00 | $1,006.60 | $1,006.90 | $1,004.90 | |||||||
| Expenses Paid During Period | $2.50 | $6.24 | $3.00 | $4.29 | $1.05 | $0.45 | $2.25 | |||||||
| Hypothetical Performance | ||||||||||||||
| (5% return before expenses) | ||||||||||||||
| Class A | Class C | Class D | Class R | Class P | Class R6 | Administrative Class | ||||||||
| Beginning Account Value (12/1/14) | $1,000.00 | $1,000.00 | $1,000.00 | $1,000.00 | $1,000.00 | $1,000.00 | $1,000.00 | |||||||
| Ending Account Value (5/31/15) | $1,022.44 | $1,018.70 | $1,021.94 | $1,020.64 | $1,023.88 | $1,024.48 | $1,022.69 | |||||||
| Expenses Paid During Period | $2.52 | $6.29 | $3.02 | $4.33 | $1.06 | $0.45 | $2.27 | |||||||
For each class of the Fund, expenses (net of fee waiver and reimbursement, if any) are equal to the annualized expense ratio for the class (0.50% for Class A, 1.25% for Class C, 0.60% for Class D, 0.86% for Class R, 0.21% for Class P, 0.09% for Class R6 and 0.45% for Administrative Class), multiplied by the average account value over the period, multiplied by 182/365. The expense ratio does not include the expenses of the Underlying Funds, which based upon the allocation of the Fund’s assets among the Underlying Funds are indirectly borne by the shareholders of the Fund.
| Semiannual Report | | May 31, 2015 | 7 |
Table of Contents
Unaudited
AllianzGI Retirement 2020 Fund
Average Annual Total Return for the period ended May 31, 2015
| 6 Month* | 1 Year | 5 Year | Since Inception† | |||||||||||||||
| AllianzGI Retirement 2020 Fund Class A | 0.25% | 0.04% | 5.93% | 8.28% | ||||||||||||||
| AllianzGI Retirement 2020 Fund Class A (adjusted) | –5.27% | –5.46% | 4.74% | 7.33% | |||||||||||||
| AllianzGI Retirement 2020 Fund Class C | –0.15% | –0.75% | 5.11% | 7.45% | ||||||||||||||
| AllianzGI Retirement 2020 Fund Class C (adjusted) | –1.12% | –1.72% | 5.11% | 7.45% | |||||||||||||
| AllianzGI Retirement 2020 Fund Class D | 0.19% | –0.06% | 5.84% | 8.21% | |||||||||||||
| AllianzGI Retirement 2020 Fund Class R | 0.07% | –0.33% | 5.58% | 7.95% | |||||||||||||
| AllianzGI Retirement 2020 Fund Class P | 0.43% | 0.33% | 6.22% | 8.56% | |||||||||||||
| AllianzGI Retirement 2020 Fund Class R6 | 0.45% | 0.40% | 6.32% | 8.66% | |||||||||||||
| AllianzGI Retirement 2020 Fund Administrative Class | 0.26% | 0.06% | 5.96% | 8.32% | ||||||||||||||
| Morningstar Lifetime Conservative 2020 Index | 0.83% | 2.16% | 8.18% | 9.35% | |||||||||||||
| Real Return Target 2020 Index** | 0.36% | 0.00% | 5.97% | 7.64% | |||||||||||||
| Lipper Mixed-Asset Target 2020 Funds Average | 1.97% | 3.98% | 8.55% | 10.27% | ||||||||||||||
† The Fund began operations on 12/29/08. Benchmark return comparisons began on the fund inception date. Lipper performance comparisons began on 12/31/08.
* Cumulative return
** Effective April 1, 2015, the Funds’ benchmark index changed from the Real Return Target series (white label) to the Morningstar Lifetime Conservative series, as the Morningstar Lifetime Conservative series is considered to be a better representation of the Funds’ investment strategies. Previously, the Real Return Target series replaced the Dow Jones Real Retirement series. This change was due to a decision by the index provider to discontinue the Index. With this mid-period change, differences between the two benchmarks should be considered for purposes of performance comparison.
Performance quoted represents past performance and is no guarantee of future results. Current performance may be lower or higher than performance shown. For performance current to the most recent month-end, visit our website at us.allianzgi.com. Investment return and the principal value will fluctuate. Shares may be worth more or less than original cost when redeemed. The adjusted returns take into account the maximum initial sales charge of 5.50% on Class A shares and the contingent deferred sales charge (CDSC) of 1% on Class C shares, which may apply to shares redeemed during the first year of ownership. Returns do not reflect deduction of taxes that a shareholder would pay on fund distributions or redemption of fund shares. See pages 106 and 107 for more information. The Fund’s gross expense ratios are 1.17% for Class A shares, 1.92% for Class C shares, 1.17% for Class D shares, 1.42% for Class R shares, 0.77% for Class P shares, 0.67% for Class R6 shares and 1.02% for Administrative Class shares. These ratios do not include an expense reduction, contractually guaranteed through at least 3/31/16. The Fund’s expense ratios net of this reduction are 0.99% for Class A shares, 1.74% for Class C shares, 1.09% for Class D shares, 1.34% for Class R shares, 0.69% for Class P shares, 0.59% for Class R6 shares and 0.94% for Administrative Class shares. Expense ratio information is as of the Fund’s current prospectus dated April 1, 2015, as supplemented to date.
| 8 | May 31, 2015 | | Semiannual Report |
Table of Contents
Unaudited
AllianzGI Retirement 2020 Fund (cont’d)
Cumulative Returns Through May 31, 2015
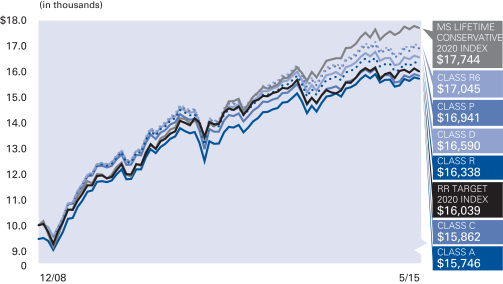
Fund Allocation (as of May 31, 2015)
| PIMCO Board U.S. TIPS Index | 16.6% | |||
| PIMCO Income | 12.4% | |||
| AllianzGI Best Styles U.S. Equity | 12.1% | |||
| PIMCO Mortgage Opportunities | 8.5% | |||
| AllianzGI Short Duration High Income | 8.5% | |||
| AllianzGI Best Styles International Equity | 4.4% | |||
| PIMCO 15+ Year U.S. TIPS Index | 4.1% | |||
| PIMCO Long-Term Credit | 3.7% | |||
| Other | 29.1% | |||
| Cash & Equivalents — Net | 0.6% |
| Shareholder Expense Example | Actual Performance | |||||||||||||
| Class A | Class C | Class D | Class R | Class P | Class R6 | Administrative Class | ||||||||
| Beginning Account Value (12/1/14) | $1,000.00 | $1,000.00 | $1,000.00 | $1,000.00 | $1,000.00 | $1,000.00 | $1,000.00 | |||||||
| Ending Account Value (5/31/15) | $1,002.50 | $998.50 | $1,001.90 | $1,000.70 | $1,004.30 | $1,004.50 | $1,002.60 | |||||||
| Expenses Paid During Period | $2.50 | $6.23 | $2.99 | $4.24 | $1.00 | $0.50 | $2.25 | |||||||
| Hypothetical Performance | ||||||||||||||
| (5% return before expenses) | ||||||||||||||
| Class A | Class C | Class D | Class R | Class P | Class R6 | Administrative Class | ||||||||
| Beginning Account Value (12/1/14) | $1,000.00 | $1,000.00 | $1,000.00 | $1,000.00 | $1,000.00 | $1,000.00 | $1,000.00 | |||||||
| Ending Account Value (5/31/15) | $1,022.44 | $1,018.70 | $1,021.94 | $1,020.69 | $1,023.93 | $1,024.43 | $1,022.69 | |||||||
| Expenses Paid During Period | $2.52 | $6.29 | $3.02 | $4.28 | $1.01 | $0.50 | $2.27 | |||||||
For each class of the Fund, expenses (net of fee waiver and reimbursement, if any) are equal to the annualized expense ratio for the class (0.50% for Class A, 1.25% for Class C, 0.60% for Class D, 0.85% for Class R, 0.20% for Class P, 0.10% for Class R6 and 0.45% for Administrative Class), multiplied by the average account value over the period, multiplied by 182/365. The expense ratio does not include the expenses of the Underlying Funds, which based upon the allocation of the Fund’s assets among the Underlying Funds are indirectly borne by the shareholders of the Fund.
| Semiannual Report | | May 31, 2015 | 9 |
Table of Contents
Unaudited
AllianzGI Retirement 2025 Fund
Average Annual Total Return for the period ended May 31, 2015
| 6 Month* | 1 Year | Since Inception† | ||||||||||||
| AllianzGI Retirement 2025 Fund Class A | 0.54% | 0.19% | 6.05% | |||||||||||
| AllianzGI Retirement 2025 Fund Class A (adjusted) | –4.99% | –5.32% | 4.32% | ||||||||||
| AllianzGI Retirement 2025 Fund Class R | 0.35% | –0.17% | 5.67% | ||||||||||
| AllianzGI Retirement 2025 Fund Class P | 0.63% | 0.46% | 6.36% | ||||||||||
| AllianzGI Retirement 2025 Fund Class R6 | 0.70% | 0.58% | 6.46% | ||||||||||
| AllianzGI Retirement 2025 Fund Administrative Class | 0.48% | 0.19% | 6.08% | |||||||||||
| Morningstar Lifetime Conservative 2025 Index | 1.08% | 2.64% | 8.93% | ||||||||||
| Real Return Target 2025 Index** | 0.43% | 0.13% | 5.17% | ||||||||||
| Lipper Mixed-Asset Target 2025 Funds Average | 2.31% | 4.72% | 10.70% | |||||||||||
† The Fund began operations on 12/19/11. Benchmark return comparisons began on the fund inception date. Lipper performance comparisons began on 12/31/11.
* Cumulative return
** Effective April 1, 2015, the Funds’ benchmark index changed from the Real Return Target series (white label) to the Morningstar Lifetime Conservative series, as the Morningstar Lifetime Conservative series is considered to be a better representation of the Funds’ investment strategies. Previously, the Real Return Target series replaced the Dow Jones Real Retirement series. This change was due to a decision by the index provider to discontinue the Index. With this mid-period change, differences between the two benchmarks should be considered for purposes of performance comparison.
Performance quoted represents past performance and is no guarantee of future results. Current performance may be lower or higher than performance shown. For performance current to the most recent month-end, visit our website at us.allianzgi.com. Investment return and the principal value will fluctuate. Shares may be worth more or less than original cost when redeemed. The adjusted returns take into account the maximum initial sales charge of 5.50% on Class A shares. Returns do not reflect deduction of taxes that a shareholder would pay on fund distributions or redemption of fund shares. See pages 106 and 107 for more information. The Fund’s gross expense ratios are 1.19% for Class A shares, 1.44% for Class R shares, 0.79% for Class P shares, 0.69% for Class R6 shares and 1.04% for Administrative Class shares. These ratios do not include an expense reduction, contractually guaranteed through at least 3/31/16. The Fund’s expense ratios net of this reduction are 1.01% for Class A shares, 1.36% for Class R shares, 0.71% for Class P shares, 0.61% for Class R6 shares and 0.96% for Administrative Class shares. Expense ratio information is as of the Fund’s current prospectus dated April 1, 2015, as supplemented to date.
| 10 | May 31, 2015 | | Semiannual Report |
Table of Contents
Unaudited
AllianzGI Retirement 2025 Fund (cont’d)
Cumulative Returns Through May 31, 2015
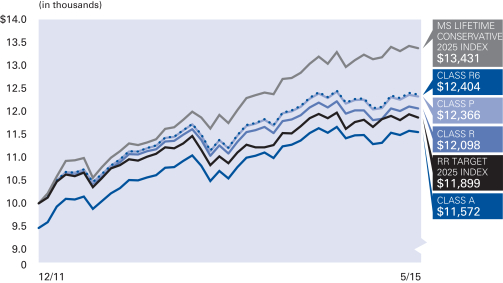
Fund Allocation (as of May 31, 2015)
| PIMCO Broad U.S. TIPS Index | 13.7% | |||
| AllianzGI Best Styles U.S. Equity | 12.6% | |||
| PIMCO Income | 11.4% | |||
| AllianzGI Short Duration High Income | 8.5% | |||
| PIMCO Mortgage Opportunities | 8.0% | |||
| AllianzGI Best Styles International Equity | 4.9% | |||
| PIMCO 15+ Year U.S. TIPS Index | 4.1% | |||
| AllianzGI NFJ Mid-Cap Value | 4.0% | |||
| Other | 31.8% | |||
| Cash & Equivalents — Net | 1.0% |
| Shareholder Expense Example | Actual Performance | |||||||||
| Class A | Class R | Class P | Class R6 | Administrative Class | ||||||
| Beginning Account Value (12/1/14) | $1,000.00 | $1,000.00 | $1,000.00 | $1,000.00 | $1,000.00 | |||||
| Ending Account Value (5/31/15) | $1,005.40 | $1,003.50 | $1,006.30 | $1,007.00 | $1,004.80 | |||||
| Expenses Paid During Period | $2.40 | $4.15 | $0.90 | $0.40 | $2.10 | |||||
| Hypothetical Performance | ||||||||||
| (5% return before expenses) | ||||||||||
| Class A | Class R | Class P | Class R6 | Administrative Class | ||||||
| Beginning Account Value (12/1/14) | $1,000.00 | $1,000.00 | $1,000.00 | $1,000.00 | $1,000.00 | |||||
| Ending Account Value (5/31/15) | $1,022.54 | $1,020.79 | $1,024.03 | $1,024.53 | $1,022.84 | |||||
| Expenses Paid During Period | $2.42 | $4.18 | $0.91 | $0.40 | $2.12 | |||||
For each class of the Fund, expenses (net of fee waiver and reimbursement, if any) are equal to the annualized expense ratio for the class (0.48% for Class A, 0.83% for Class R, 0.18% for Class P, 0.08% for Class R6 and 0.42% for Administrative Class), multiplied by the average account value over the period, multiplied by 182/365. The expense ratio does not include the expenses of the Underlying Funds, which based upon the allocation of the Fund’s assets among the Underlying Funds are indirectly borne by the shareholders of the Fund.
| Semiannual Report | | May 31, 2015 | 11 |
Table of Contents
Unaudited
AllianzGI Retirement 2030 Fund
Average Annual Total Return for the period ended May 31, 2015
| 6 Month* | 1 Year | 5 Year | Since Inception† | |||||||||||||||
| AllianzGI Retirement 2030 Fund Class A | 0.64% | 0.16% | 7.08% | 9.78% | ||||||||||||||
| AllianzGI Retirement 2030 Fund Class A (adjusted) | –4.89% | –5.34% | 5.88% | 8.82% | |||||||||||||
| AllianzGI Retirement 2030 Fund Class C | 0.24% | –0.62% | 6.29% | 9.01% | ||||||||||||||
| AllianzGI Retirement 2030 Fund Class C (adjusted) | –0.72% | –1.57% | 6.29% | 9.01% | |||||||||||||
| AllianzGI Retirement 2030 Fund Class D | 0.56% | 0.04% | 7.01% | 9.76% | |||||||||||||
| AllianzGI Retirement 2030 Fund Class R | 0.44% | –0.23% | 6.75% | 9.50% | |||||||||||||
| AllianzGI Retirement 2030 Fund Class P | 0.76% | 0.43% | 7.39% | 10.12% | |||||||||||||
| AllianzGI Retirement 2030 Fund Class R6 | 0.84% | 0.56% | 7.50% | 10.23% | |||||||||||||
| AllianzGI Retirement 2030 Fund Administrative Class | 0.66% | 0.19% | 7.15% | 9.89% | ||||||||||||||
| Morningstar Lifetime Conservative 2030 Index | 1.45% | 3.26% | 10.07% | 11.69% | |||||||||||||
| Real Return Target 2030 Index** | 0.52% | 0.26% | 7.06% | 9.09% | |||||||||||||
| Lipper Mixed-Asset Target 2030 Funds Average | 2.67% | 5.17% | 10.34% | 12.07% | ||||||||||||||
† The Fund began operations on 12/29/08. Benchmark return comparisons began on the fund inception date. Lipper performance comparisons began on 12/31/08.
* Cumulative return
** Effective April 1, 2015, the Funds’ benchmark index changed from the Real Return Target series (white label) to the Morningstar Lifetime Conservative series, as the Morningstar Lifetime Conservative series is considered to be a better representation of the Funds’ investment strategies. Previously, the Real Return Target series replaced the Dow Jones Real Retirement series. This change was due to a decision by the index provider to discontinue the Index. With this mid-period change, differences between the two benchmarks should be considered for purposes of performance comparison.
Performance quoted represents past performance and is no guarantee of future results. Current performance may be lower or higher than performance shown. For performance current to the most recent month-end, visit our website at us.allianzgi.com. Investment return and the principal value will fluctuate. Shares may be worth more or less than original cost when redeemed. The adjusted returns take into account the maximum initial sales charge of 5.50% on Class A shares and the contingent deferred sales charge (CDSC) of 1% on Class C shares, which may apply to shares redeemed during the first year of ownership. Returns do not reflect deduction of taxes that a shareholder would pay on fund distributions or redemption of fund shares. See pages 106 and 107 for more information. The Fund’s gross expense ratios are 1.24% for Class A shares, 1.99% for Class C shares, 1.24% for Class D shares, 1.49% for Class R shares, 0.84% for Class P shares, 0.74% for Class R6 shares and 1.09% for Administrative Class shares. These ratios do not include an expense reduction, contractually guaranteed through at least 3/31/16. The Fund’s expense ratios net of this reduction are 1.03% for Class A shares, 1.78% for Class C shares, 1.13% for Class D shares, 1.38% for Class R shares, 0.73% for Class P shares, 0.63% for Class R6 shares and 0.98% for Administrative Class shares. Expense ratio information is as of the Fund’s current prospectus dated April 1, 2015, as supplemented to date.
| 12 | May 31, 2015 | | Semiannual Report |
Table of Contents
Unaudited
AllianzGI Retirement 2030 Fund (cont’d)
Cumulative Returns Through May 31, 2015
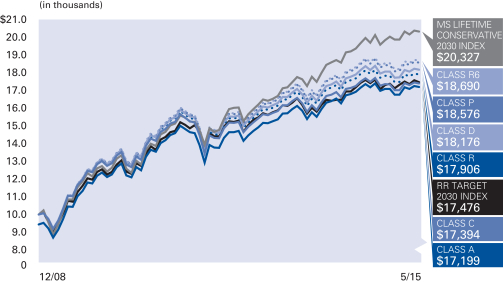
Fund Allocation (as of May 31, 2015)
| AllianzGI Best Styles U.S. Equity | 13.6% | |||
| PIMCO Broad U.S. TIPS Index | 10.5% | |||
| PIMCO Income | 9.0% | |||
| AllianzGI Short Duration High Income | 7.6% | |||
| AllianzGI Best Styles International Equity | 6.9% | |||
| PIMCO Mortgage Opportunities | 5.5% | |||
| AllianzGI NFJ Mid-Cap Value | 5.5% | |||
| PIMCO 15+ Year U.S. TIPS Index | 3.6% | |||
| Other | 36.6% | |||
| Cash & Equivalents — Net | 1.2% |
| Shareholder Expense Example | Actual Performance | |||||||||||||
| Class A | Class C | Class D | Class R | Class P | Class R6 | Administrative Class | ||||||||
| Beginning Account Value (12/1/14) | $1,000.00 | $1,000.00 | $1,000.00 | $1,000.00 | $1,000.00 | $1,000.00 | $1,000.00 | |||||||
| Ending Account Value (5/31/15) | $1,006.40 | $1,002.40 | $1,005.60 | $1,004.40 | $1,007.60 | $1,008.40 | $1,006.60 | |||||||
| Expenses Paid During Period | $2.30 | $6.04 | $2.80 | $4.05 | $0.80 | $0.30 | $2.05 | |||||||
| Hypothetical Performance | ||||||||||||||
| (5% return before expenses) | ||||||||||||||
| Class A | Class C | Class D | Class R | Class P | Class R6 | Administrative Class | ||||||||
| Beginning Account Value (12/1/14) | $1,000.00 | $1,000.00 | $1,000.00 | $1,000.00 | $1,000.00 | $1,000.00 | $1,000.00 | |||||||
| Ending Account Value (5/31/15) | $1,022.64 | $1,018.90 | $1,022.14 | $1,020.89 | $1,024.13 | $1,024.63 | $1,022.89 | |||||||
| Expenses Paid During Period | $2.32 | $6.09 | $2.82 | $4.08 | $0.81 | $0.30 | $2.07 | |||||||
For each class of the Fund, expenses (net of fee waiver and reimbursement, if any) are equal to the annualized expense ratio for the class (0.46% for Class A, 1.21% for Class C, 0.56% for Class D, 0.81% for Class R, 0.16% for Class P, 0.06% for Class R6 and 0.41% for Administrative Class), multiplied by the average account value over the period, multiplied by 182/365. The expense ratio does not include the expenses of the Underlying Funds, which based upon the allocation of the Fund’s assets among the Underlying Funds are indirectly borne by the shareholders of the Fund.
| Semiannual Report | | May 31, 2015 | 13 |
Table of Contents
Unaudited
AllianzGI Retirement 2035 Fund
Average Annual Total Return for the period ended May 31, 2015
| 6 Month* | 1 Year | Since Inception† | ||||||||||||
| AllianzGI Retirement 2035 Fund Class A | 0.98% | 0.49% | 8.47% | |||||||||||
| AllianzGI Retirement 2035 Fund Class A (adjusted) | –4.57% | –5.04% | 6.71% | ||||||||||
| AllianzGI Retirement 2035 Fund Class R | 0.79% | 0.14% | 8.10% | ||||||||||
| AllianzGI Retirement 2035 Fund Class P | 1.10% | 0.78% | 8.81% | ||||||||||
| AllianzGI Retirement 2035 Fund Class R6 | 1.18% | 0.85% | 8.91% | ||||||||||
| AllianzGI Retirement 2035 Fund Administrative Class | 0.95% | 0.47% | 8.51% | |||||||||||
| Morningstar Lifetime Conservative 2035 Index | 1.89% | 3.89% | 12.11% | ||||||||||
| Real Return Target 2035 Index** | 0.64% | 0.38% | 7.59% | ||||||||||
| Lipper Mixed-Asset Target 2035 Funds Average | 3.06% | 5.94% | 12.73% | |||||||||||
† The Fund began operations on 12/19/11. Benchmark return comparisons began on the fund inception date. Lipper performance comparisons began on 12/31/11.
* Cumulative return
** Effective April 1, 2015, the Funds’ benchmark index changed from the Real Return Target series (white label) to the Morningstar Lifetime Conservative series, as the Morningstar Lifetime Conservative series is considered to be a better representation of the Funds’ investment strategies. Previously, the Real Return Target series replaced the Dow Jones Real Retirement series. This change was due to a decision by the index provider to discontinue the Index. With this mid-period change, differences between the two benchmarks should be considered for purposes of performance comparison.
Performance quoted represents past performance and is no guarantee of future results. Current performance may be lower or higher than performance shown. For performance current to the most recent month-end, visit our website at us.allianzgi.com. Investment return and the principal value will fluctuate. Shares may be worth more or less than original cost when redeemed. The adjusted returns take into account the maximum initial sales charge of 5.50% on Class A shares. Returns do not reflect deduction of taxes that a shareholder would pay on fund distributions or redemption of fund shares. See pages 106 and 107 for more information. The Fund’s gross expense ratios are 1.27% for Class A shares, 1.52% for Class R shares, 0.87% for Class P shares, 0.77% for Class R6 shares and 1.12% for Administrative Class shares. These ratios do not include an expense reduction, contractually guaranteed through at least 3/31/16. The Fund’s expense ratios net of this reduction are 1.06% for Class A shares, 1.41% for Class R shares, 0.76% for Class P shares, 0.66% for Class R6 shares and 1.01% for Administrative Class shares. Expense ratio information is as of the Fund’s current prospectus dated April 1, 2015, as supplemented to date.
| 14 | May 31, 2015 | | Semiannual Report |
Table of Contents
Unaudited
AllianzGI Retirement 2035 Fund (cont’d)
Cumulative Returns Through May 31, 2015
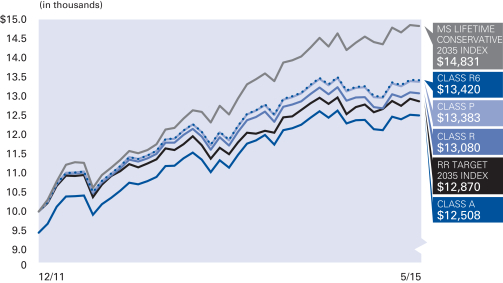
Fund Allocation (as of May 31, 2015)
| AllianzGI Best Styles U.S. Equity | 14.7% | |||
| PIMCO Income | 8.1% | |||
| PIMCO Broad U.S. TIPS Index | 7.4% | |||
| AllianzGI Best Styles International Equity | 7.4% | |||
| AllianzGI Short Duration High Income | 7.1% | |||
| AllianzGI NFJ Mid-Cap Value | 6.1% | |||
| PIMCO Mortgage Opportunities | 4.5% | |||
| AllianzGI U.S. Small-Cap Growth | 4.4% | |||
| Other | 39.8% | |||
| Cash & Equivalents — Net | 0.5% |
| Shareholder Expense Example | Actual Performance | |||||||||
| Class A | Class R | Class P | Class R6 | Administrative Class | ||||||
| Beginning Account Value (12/1/14) | $1,000.00 | $1,000.00 | $1,000.00 | $1,000.00 | $1,000.00 | |||||
| Ending Account Value (5/31/15) | $1,009.80 | $1,007.90 | $1,011.00 | $1,011.80 | $1,009.50 | |||||
| Expenses Paid During Period | $2.15 | $3.95 | $0.65 | $0.15 | $1.90 | |||||
| Hypothetical Performance | ||||||||||
| (5% return before expenses) | ||||||||||
| Class A | Class R | Class P | Class R6 | Administrative Class | ||||||
| Beginning Account Value (12/1/14) | $1,000.00 | $1,000.00 | $1,000.00 | $1,000.00 | $1,000.00 | |||||
| Ending Account Value (5/31/15) | $1,022.79 | $1,020.99 | $1,024.28 | $1,024.78 | $1,023.04 | |||||
| Expenses Paid During Period | $2.17 | $3.98 | $0.66 | $0.15 | $1.92 | |||||
For each class of the Fund, expenses (net of fee waiver and reimbursement, if any) are equal to the annualized expense ratio for the class (0.43% for Class A, 0.79% for Class R, 0.13% for Class P, 0.03% for Class R6 and 0.38% for Administrative Class), multiplied by the average account value over the period, multiplied by 182/365. The expense ratio does not include the expenses of the Underlying Funds, which based upon the allocation of the Fund’s assets among the Underlying Funds are indirectly borne by the shareholders of the Fund.
| Semiannual Report | | May 31, 2015 | 15 |
Table of Contents
Unaudited
AllianzGI Retirement 2040 Fund
Average Annual Total Return for the period ended May 31, 2015
| 6 Month* | 1 Year | 5 Year | Since Inception† | |||||||||||||||
| AllianzGI Retirement 2040 Fund Class A | 1.19% | 0.61% | 8.44% | 11.34% | ||||||||||||||
| AllianzGI Retirement 2040 Fund Class A (adjusted) | –4.38% | –4.93% | 7.22% | 10.37% | |||||||||||||
| AllianzGI Retirement 2040 Fund Class C | 0.83% | –0.16% | 7.64% | 10.49% | ||||||||||||||
| AllianzGI Retirement 2040 Fund Class C (adjusted) | –0.12% | –1.11% | 7.64% | 10.49% | |||||||||||||
| AllianzGI Retirement 2040 Fund Class D | 1.19% | 0.52% | 8.36% | 11.25% | |||||||||||||
| AllianzGI Retirement 2040 Fund Class R | 1.02% | 0.25% | 8.10% | 11.00% | |||||||||||||
| AllianzGI Retirement 2040 Fund Class P | 1.35% | 0.91% | 8.76% | 11.64% | |||||||||||||
| AllianzGI Retirement 2040 Fund Class R6 | 1.43% | 1.04% | 8.85% | 11.74% | |||||||||||||
| AllianzGI Retirement 2040 Fund Administrative Class | 1.14% | 0.56% | 8.48% | 11.38% | ||||||||||||||
| Morningstar Lifetime Conservative 2040 Index | 2.29% | 4.36% | 11.70% | 13.53% | |||||||||||||
| Real Return Target 2040 Index** | 0.79% | 0.53% | 8.41% | 10.73% | |||||||||||||
| Lipper Mixed-Asset Target 2040 Funds Average | 3.18% | 6.02% | 11.34% | 12.97% | ||||||||||||||
† The Fund began operations on 12/29/08. Benchmark return comparisons began on the fund inception date. Lipper performance comparisons began on 12/31/08.
* Cumulative return
** Effective April 1, 2015, the Funds’ benchmark index changed from the Real Return Target series (white label) to the Morningstar Lifetime Conservative series, as the Morningstar Lifetime Conservative series is considered to be a better representation of the Funds’ investment strategies. Previously, the Real Return Target series replaced the Dow Jones Real Retirement series. This change was due to a decision by the index provider to discontinue the Index. With this mid-period change, differences between the two benchmarks should be considered for purposes of performance comparison.
Performance quoted represents past performance and is no guarantee of future results. Current performance may be lower or higher than performance shown. For performance current to the most recent month-end, visit our website at us.allianzgi.com. Investment return and the principal value will fluctuate. Shares may be worth more or less than original cost when redeemed. The adjusted returns take into account the maximum initial sales charge of 5.50% on Class A shares and the contingent deferred sales charge (CDSC) of 1% on Class C shares, which may apply to shares redeemed during the first year of ownership. Returns do not reflect deduction of taxes that a shareholder would pay on fund distributions or redemption of fund shares. See pages 106 and 107 for more information. The Fund’s gross expense ratios are 1.30% for Class A shares, 2.05% for Class C shares, 1.30% for Class D shares, 1.55% for Class R shares, 0.90% for Class P shares, 0.80% for Class R6 shares and 1.15% for Administrative Class shares. These ratios do not include an expense reduction, contractually guaranteed through at least 3/31/16. The Fund’s expense ratios net of this reduction are 1.09% for Class A shares, 1.84% for Class C shares, 1.19% for Class D shares, 1.44% for Class R shares, 0.79% for Class P shares, 0.69% for Class R6 shares and 1.04% for Administrative Class shares. Expense ratio information is as of the Fund’s current prospectus dated April 1, 2015, as supplemented to date.
| 16 | May 31, 2015 | | Semiannual Report |
Table of Contents
Unaudited
AllianzGI Retirement 2040 Fund (cont’d)
Cumulative Returns Through May 31, 2015
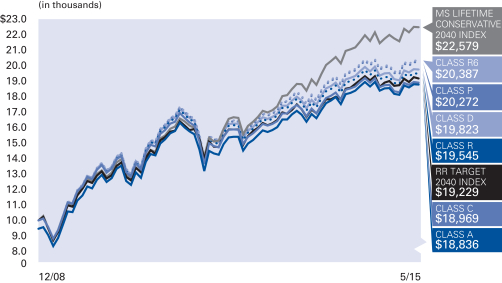
Fund Allocation (as of May 31, 2015)
| AllianzGI Best Styles U.S. Equity | 15.5% | |||
| AllianzGI Best Styles International Equity | 8.9% | |||
| AllianzGI Short Duration High Income | 6.7% | |||
| PIMCO Income | 6.0% | |||
| AllianzGI NFJ Mid-Cap Value | 6.0% | |||
| AllianzGI U.S. Small-Cap Growth | 4.5% | |||
| PIMCO CommoditiesPLUS® Strategy | 4.3% | |||
| PIMCO EqS Long/Short | 4.2% | |||
| Other | 42.6% | |||
| Cash & Equivalents — Net | 1.3% |
| Shareholder Expense Example | Actual Performance | |||||||||||||
| Class A | Class C | Class D | Class R | Class P | Class R6 | Administrative Class | ||||||||
| Beginning Account Value (12/1/14) | $1,000.00 | $1,000.00 | $1,000.00 | $1,000.00 | $1,000.00 | $1,000.00 | $1,000.00 | |||||||
| Ending Account Value (5/31/15) | $1,011.90 | $1,008.30 | $1,011.90 | $1,010.20 | $1,013.50 | $1,014.30 | $1,011.40 | |||||||
| Expenses Paid During Period | $2.06 | $5.81 | $2.56 | $3.81 | $0.55 | $0.05 | $1.81 | |||||||
| Hypothetical Performance | ||||||||||||||
| (5% return before expenses) | ||||||||||||||
| Class A | Class C | Class D | Class R | Class P | Class R6 | Administrative Class | ||||||||
| Beginning Account Value (12/1/14) | $1,000.00 | $1,000.00 | $1,000.00 | $1,000.00 | $1,000.00 | $1,000.00 | $1,000.00 | |||||||
| Ending Account Value (5/31/15) | $1,022.89 | $1,019.15 | $1,022.39 | $1,021.14 | $1,024.38 | $1,024.88 | $1,023.14 | |||||||
| Expenses Paid During Period | $2.07 | $5.84 | $2.57 | $3.83 | $0.56 | $0.05 | $1.82 | |||||||
For each class of the Fund, expenses (net of fee waiver and reimbursement, if any) are equal to the annualized expense ratio for the class (0.41% for Class A, 1.16% for Class C, 0.51% for Class D, 0.76% for Class R, 0.11% for Class P, 0.01% for Class R6 and 0.36% for Administrative Class), multiplied by the average account value over the period, multiplied by 182/365. The expense ratio does not include the expenses of the Underlying Funds, which based upon the allocation of the Fund’s assets among the Underlying Funds are indirectly borne by the shareholders of the Fund.
| Semiannual Report | | May 31, 2015 | 17 |
Table of Contents
Unaudited
AllianzGI Retirement 2045 Fund
Average Annual Total Return for the period ended May 31, 2015
| 6 Month* | 1 Year | Since Inception† | ||||||||||||
| AllianzGI Retirement 2045 Fund Class A | 1.58% | 1.10% | 10.01% | |||||||||||
| AllianzGI Retirement 2045 Fund Class A (adjusted) | –4.01% | –4.46% | 8.22% | ||||||||||
| AllianzGI Retirement 2045 Fund Class R | 1.40% | 0.71% | 9.62% | ||||||||||
| AllianzGI Retirement 2045 Fund Class P | 1.73% | 1.42% | 10.35% | ||||||||||
| AllianzGI Retirement 2045 Fund Class R6 | 1.79% | 1.53% | 10.44% | ||||||||||
| AllianzGI Retirement 2045 Fund Administrative Class | 1.53% | 1.06% | 10.01% | |||||||||||
| Morningstar Lifetime Conservative 2045 Index | 2.53% | 4.51% | 13.78% | ||||||||||
| Real Return Target 2045 Index** | 0.95% | 0.72% | 9.80% | ||||||||||
| Lipper Mixed-Asset Target 2045 Funds Average | 3.34% | 6.40% | 13.92% | |||||||||||
† The Fund began operations on 12/19/11. Benchmark return comparisons began on the fund inception date. Lipper performance comparisons began on 12/31/11.
* Cumulative return
** Effective April 1, 2015, the Funds’ benchmark index changed from the Real Return Target series (white label) to the Morningstar Lifetime Conservative series, as the Morningstar Lifetime Conservative series is considered to be a better representation of the Funds’ investment strategies. Previously, the Real Return Target series replaced the Dow Jones Real Retirement series. This change was due to a decision by the index provider to discontinue the Index. With this mid-period change, differences between the two benchmarks should be considered for purposes of performance comparison.
Performance quoted represents past performance and is no guarantee of future results. Current performance may be lower or higher than performance shown. For performance current to the most recent month-end, visit our website at us.allianzgi.com. Investment return and the principal value will fluctuate. Shares may be worth more or less than original cost when redeemed. The adjusted returns take into account the maximum initial sales charge of 5.50% on Class A shares. Returns do not reflect deduction of taxes that a shareholder would pay on fund distributions or redemption of fund shares. See pages 106 and 107 for more information. The Fund’s gross expense ratios are 1.33% for Class A shares, 1.58% for Class R shares, 0.93% for Class P shares, 0.83% for Class R6 shares and 1.18% for Administrative Class shares. These ratios do not include an expense reduction, contractually guaranteed through at least 3/31/16. The Fund’s expense ratios net of this reduction are 1.10% for Class A shares, 1.45% for Class R shares, 0.80% for Class P shares, 0.70% for Class R6 shares and 1.05% for Administrative Class shares. Expense ratio information is as of the Fund’s current prospectus dated April 1, 2015, as supplemented to date.
| 18 | May 31, 2015 | | Semiannual Report |
Table of Contents
Unaudited
AllianzGI Retirement 2045 Fund (cont’d)
Cumulative Returns Through May 31, 2015
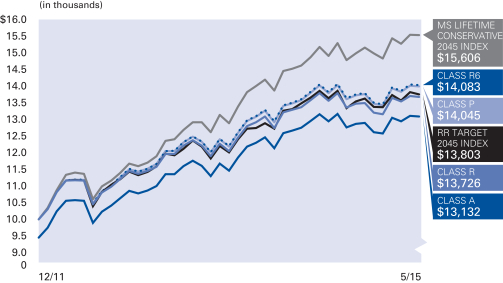
Fund Allocation (as of May 31, 2015)
| AllianzGI Best Styles U.S. Equity | 16.2% | |||
| AllianzGI Best Styles International Equity | 11.3% | |||
| AllianzGI NFJ Mid-Cap Value | 7.3% | |||
| PIMCO Income | 7.1% | |||
| PIMCO StocksPLUS® International (U.S. Dollar-Hedged) | 5.1% | |||
| AllianzGI U.S. Small-Cap Growth | 4.9% | |||
| PIMCO CommoditiesPLUS® Strategy | 4.4% | |||
| PIMCO EqS Long/Short | 4.3% | |||
| Other | 38.4% | |||
| Cash & Equivalents — Net | 1.0% |
| Shareholder Expense Example | Actual Performance | |||||||||
| Class A | Class R | Class P | Class R6 | Administrative Class | ||||||
| Beginning Account Value (12/1/14) | $1,000.00 | $1,000.00 | $1,000.00 | $1,000.00 | $1,000.00 | |||||
| Ending Account Value (5/31/15) | $1,015.80 | $1,014.00 | $1,017.30 | $1,017.90 | $1,015.30 | |||||
| Expenses Paid During Period | $2.01 | $3.77 | $0.50 | $— | $1.76 | |||||
| Hypothetical Performance | ||||||||||
| (5% return before expenses) | ||||||||||
| Class A | Class R | Class P | Class R6 | Administrative Class | ||||||
| Beginning Account Value (12/1/14) | $1,000.00 | $1,000.00 | $1,000.00 | $1,000.00 | $1,000.00 | |||||
| Ending Account Value (5/31/15) | $1,022.94 | $1,021.19 | $1,024.43 | $1,024.93 | $1,023.19 | |||||
| Expenses Paid During Period | $2.02 | $3.78 | $0.50 | $— | $1.77 | |||||
For each class of the Fund, expenses (net of fee waiver and reimbursement, if any) are equal to the annualized expense ratio for the class (0.40% for Class A, 0.75% for Class R, 0.10% for Class P, 0.00% for Class R6 and 0.35% for Administrative Class), multiplied by the average account value over the period, multiplied by 182/365. The expense ratio does not include the expenses of the Underlying Funds, which based upon the allocation of the Fund’s assets among the Underlying Funds are indirectly borne by the shareholders of the Fund.
| Semiannual Report | | May 31, 2015 | 19 |
Table of Contents
Unaudited
AllianzGI Retirement 2050 Fund
Average Annual Total Return for the period ended May 31, 2015
| 6 Month* | 1 Year | 5 Year | Since Inception† | |||||||||||||||
| AllianzGI Retirement 2050 Fund Class A | 1.53% | 0.91% | 9.13% | 11.88% | ||||||||||||||
| AllianzGI Retirement 2050 Fund Class A (adjusted) | –4.06% | –4.64% | 7.90% | 10.90% | |||||||||||||
| AllianzGI Retirement 2050 Fund Class C | 1.20% | 0.16% | 8.30% | 11.06% | ||||||||||||||
| AllianzGI Retirement 2050 Fund Class C (adjusted) | 0.25% | –0.77% | 8.30% | 11.06% | |||||||||||||
| AllianzGI Retirement 2050 Fund Class D | 1.55% | 0.84% | 9.05% | 11.83% | |||||||||||||
| AllianzGI Retirement 2050 Fund Class R | 1.39% | 0.54% | 8.78% | 11.57% | |||||||||||||
| AllianzGI Retirement 2050 Fund Class P | 1.71% | 1.24% | 9.44% | 12.20% | |||||||||||||
| AllianzGI Retirement 2050 Fund Class R6 | 1.75% | 1.32% | 9.54% | 12.30% | |||||||||||||
| AllianzGI Retirement 2050 Fund Administrative Class | 1.53% | 0.96% | 9.18% | 11.95% | ||||||||||||||
| Morningstar Lifetime Conservative 2050 Index | 2.60% | 4.44% | 12.00% | 13.91% | |||||||||||||
| Real Return Target 2050 Index** | 1.15% | 1.00% | 9.30% | 11.66% | |||||||||||||
| Lipper Mixed-Asset Target 2050 Funds Average | 3.36% | 6.34% | 11.65% | 13.23% | ||||||||||||||
† The Fund began operations on 12/29/08. Benchmark return comparisons began on the fund inception date. Lipper performance comparisons began on 12/31/08.
* Cumulative return
** Effective April 1, 2015, the Funds’ benchmark index changed from the Real Return Target series (white label) to the Morningstar Lifetime Conservative series, as the Morningstar Lifetime Conservative series is considered to be a better representation of the Funds’ investment strategies. Previously, the Real Return Target series replaced the Dow Jones Real Retirement series. This change was due to a decision by the index provider to discontinue the Index. With this mid-period change, differences between the two benchmarks should be considered for purposes of performance comparison.
Performance quoted represents past performance and is no guarantee of future results. Current performance may be lower or higher than performance shown. For performance current to the most recent month-end, visit our website at us.allianzgi.com. Investment return and the principal value will fluctuate. Shares may be worth more or less than original cost when redeemed. The adjusted returns take into account the maximum initial sales charge of 5.50% on Class A shares and the contingent deferred sales charge (CDSC) of 1% on Class C shares, which may apply to shares redeemed during the first year of ownership. Returns do not reflect deduction of taxes that a shareholder would pay on fund distributions or redemption of fund shares. See pages 106 and 107 for more information. The Fund’s gross expense ratios are 1.35% for Class A shares, 2.10% for Class C shares, 1.35% for Class D shares, 1.60% for Class R shares, 0.95% for Class P shares, 0.85% for Class R6 shares and 1.20% for Administrative Class shares. These ratios do not include an expense reduction, contractually guaranteed through at least 3/31/16. The Fund’s expense ratios net of this reduction are 1.10% for Class A shares, 1.85% for Class C shares, 1.20% for Class D shares, 1.45% for Class R shares, 0.80% for Class P shares, 0.70% for Class R6 shares and 1.05% for Administrative Class shares. Expense ratio information is as of the Fund’s current prospectus dated April 1, 2015, as supplemented to date.
| 20 | May 31, 2015 | | Semiannual Report |
Table of Contents
Unaudited
AllianzGI Retirement 2050 Fund (cont’d)
Cumulative Returns Through May 31, 2015
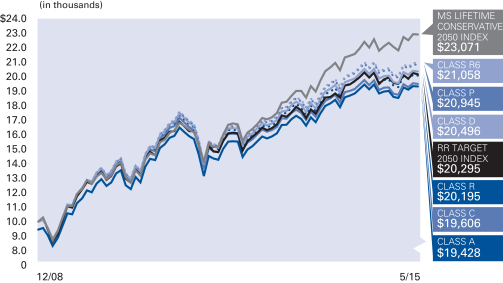
Fund Allocation (as of May 31, 2015)
| AllianzGI Best Styles U.S. Equity | 17.1% | |||
| AllianzGI Best Styles International Equity | 11.9% | |||
| AllianzGI NFJ Mid-Cap Value | 7.8% | |||
| PIMCO StocksPLUS® International (U.S. Dollar-Hedged) | 5.1% | |||
| AllianzGI U.S. Small-Cap Growth | 5.0% | |||
| AllianzGI U.S. Managed Volatility | 5.0% | |||
| PIMCO CommoditiesPLUS® Strategy | 5.0% | |||
| PIMCO EqS Long/Short | 4.5% | |||
| Other | 37.2% | |||
| Cash & Equivalents — Net | 1.4% |
| Shareholder Expense Example | Actual Performance | |||||||||||||
| Class A | Class C | Class D | Class R | Class P | Class R6 | Administrative Class | ||||||||
| Beginning Account Value (12/1/14) | $1,000.00 | $1,000.00 | $1,000.00 | $1,000.00 | $1,000.00 | $1,000.00 | $1,000.00 | |||||||
| Ending Account Value (5/31/15) | $1,015.30 | $1,012.00 | $1,015.50 | $1,013.90 | $1,017.10 | $1,017.50 | $1,015.30 | |||||||
| Expenses Paid During Period | $1.81 | $5.57 | $2.31 | $3.56 | $0.30 | $— | $1.56 | |||||||
| Hypothetical Performance | ||||||||||||||
| (5% return before expenses) | ||||||||||||||
| Class A | Class C | Class D | Class R | Class P | Class R6 | Administrative Class | ||||||||
| Beginning Account Value (12/1/14) | $1,000.00 | $1,000.00 | $1,000.00 | $1,000.00 | $1,000.00 | $1,000.00 | $1,000.00 | |||||||
| Ending Account Value (5/31/15) | $1,023.14 | $1,019.40 | $1,022.64 | $1,021.39 | $1,024.63 | $1,024.93 | $1,023.39 | |||||||
| Expenses Paid During Period | $1.82 | $5.59 | $2.32 | $3.58 | $0.30 | $— | $1.56 | |||||||
For each class of the Fund, expenses (net of fee waiver and reimbursement, if any) are equal to the annualized expense ratio for the class (0.36% for Class A, 1.11% for Class C, 0.46% for Class D, 0.71% for Class R, 0.06% for Class P, 0.00% for Class R6 and 0.31% for Administrative Class), multiplied by the average account value over the period, multiplied by 182/365. The expense ratio does not include the expenses of the Underlying Funds, which based upon the allocation of the Fund’s assets among the Underlying Funds are indirectly borne by the shareholders of the Fund.
| Semiannual Report | | May 31, 2015 | 21 |
Table of Contents
Unaudited
AllianzGI Retirement 2055 Fund
Average Annual Total Return for the period ended May 31, 2015
| 6 Month* | 1 Year | Since Inception† | ||||||||||||
| AllianzGI Retirement 2055 Fund Class A | 1.62% | 0.97% | 10.40% | |||||||||||
| AllianzGI Retirement 2055 Fund Class A (adjusted) | –3.97% | –4.58% | 8.61% | ||||||||||
| AllianzGI Retirement 2055 Fund Class R | 1.45% | 0.65% | 10.04% | ||||||||||
| AllianzGI Retirement 2055 Fund Class P | 1.79% | 1.31% | 10.76% | ||||||||||
| AllianzGI Retirement 2055 Fund Class R6 | 1.78% | 1.36% | 10.84% | ||||||||||
| AllianzGI Retirement 2055 Fund Administrative Class | 1.58% | 0.94% | 10.44% | |||||||||||
| Morningstar Lifetime Conservative 2055 Index | 2.61% | 4.29% | 13.85% | ||||||||||
| Real Return Target 2040+ Index** | 1.26% | 1.15% | 10.78% | ||||||||||
| Lipper Mixed-Asset Target 2055+ Funds Average | 3.49% | 6.54% | 14.20% | |||||||||||
† The Fund began operations on 12/19/11. Benchmark return comparisons began on the fund inception date. Lipper performance comparisons began on 12/31/11.
* Cumulative return
** Effective April 1, 2015, the Funds’ benchmark index changed from the Real Return Target series (white label) to the Morningstar Lifetime Conservative series, as the Morningstar Lifetime Conservative series is considered to be a better representation of the Funds’ investment strategies. Previously, the Real Return Target series replaced the Dow Jones Real Retirement series. This change was due to a decision by the index provider to discontinue the Index. With this mid-period change, differences between the two benchmarks should be considered for purposes of performance comparison.
Performance quoted represents past performance and is no guarantee of future results. Current performance may be lower or higher than performance shown. For performance current to the most recent month-end, visit our website at us.allianzgi.com. Investment return and the principal value will fluctuate. Shares may be worth more or less than original cost when redeemed. The adjusted returns take into account the maximum initial sales charge of 5.50% on Class A shares. Returns do not reflect deduction of taxes that a shareholder would pay on fund distributions or redemption of fund shares. See pages 106 and 107 for more information. The Fund’s gross expense ratios are 1.35% for Class A shares, 1.60% for Class R shares, 0.95% for Class P shares, 0.85% for Class R6 shares and 1.20% for Administrative Class shares. These ratios do not include an expense reduction, contractually guaranteed through at least 3/31/16. The Fund’s expense ratios net of this reduction are 1.10% for Class A shares, 1.45% for Class R shares, 0.80% for Class P shares, 0.70% for Class R6 shares and 1.05% for Administrative Class shares. Expense ratio information is as of the Fund’s current prospectus dated April 1, 2015, as supplemented to date.
| 22 | May 31, 2015 | | Semiannual Report |
Table of Contents
Unaudited
AllianzGI Retirement 2055 Fund (cont’d)
Cumulative Returns Through May 31, 2015
Fund Allocation (as of May 31, 2015)
| AllianzGI Best Styles U.S. Equity | 18.1% | |||
| AllianzGI Best Styles International Equity | 11.9% | |||
| AllianzGI NFJ Mid-Cap Value | 8.0% | |||
| PIMCO StocksPLUS® International (U.S. Dollar-Hedged) | 6.1% | |||
| AllianzGI U.S. Small-Cap Growth | 5.1% | |||
| AllianzGI U.S. Managed Volatility | 5.0% | |||
| PIMCO CommoditiesPLUS® Strategy | 5.0% | |||
| PIMCO EqS Long/Short | 4.5% | |||
| Other | 35.0% | |||
| Cash & Equivalents — Net | 1.3% |
| Shareholder Expense Example | Actual Performance | |||||||||
| Class A | Class R | Class P | Class R6 | Administrative Class | ||||||
| Beginning Account Value (12/1/14) | $1,000.00 | $1,000.00 | $1,000.00 | $1,000.00 | $1,000.00 | |||||
| Ending Account Value (5/31/15) | $1,016.20 | $1,014.50 | $1,017.90 | $1,017.80 | $1,015.80 | |||||
| Expenses Paid During Period | $1.86 | $3.62 | $0.35 | $— | $1.61 | |||||
| Hypothetical Performance | ||||||||||
| (5% return before expenses) | ||||||||||
| Class A | Class R | Class P | Class R6 | Administrative Class | ||||||
| Beginning Account Value (12/1/14) | $1,000.00 | $1,000.00 | $1,000.00 | $1,000.00 | $1,000.00 | |||||
| Ending Account Value (5/31/15) | $1,023.09 | $1,021.34 | $1,024.58 | $1,024.93 | $1,023.34 | |||||
| Expenses Paid During Period | $1.87 | $3.63 | $0.35 | $— | $1.61 | |||||
For each class of the Fund, expenses (net of fee waiver and reimbursement, if any) are equal to the annualized expense ratio for the class (0.37% for Class A, 0.72% for Class R, 0.07% for Class P, 0.00% for Class R6 and 0.32% for Administrative Class), multiplied by the average account value over the period, multiplied by 182/365. The expense ratio does not include the expenses of the Underlying Funds, which based upon the allocation of the Fund’s assets among the Underlying Funds are indirectly borne by the shareholders of the Fund.
| Semiannual Report | | May 31, 2015 | 23 |
Table of Contents
Unaudited
AllianzGI Retirement Income Fund
For the period of December 1, 2014 through May 31, 2015, as provided by the US Multi-Asset Group.
Fund Insights
For the reporting period ended May 31, 2015, Class A shares at NAV of the AllianzGI Retirement Income Fund (the “Fund”) returned 0.57%, outperforming the Morningstar Lifetime Conservative Income Index (the “benchmark index”), which returned 0.38%.
Market Overview
For the six-month period of December 1, 2014 through May 31, 2015, global equities outperformed global bonds with developed country equities leading emerging market equities by more than 3%. In fixed income, global bonds fell 3.3% for the period as measured by the Barclays Global Aggregate Index. However, in the US, as uncertainty about the Fed’s future policy decisions persisted, yields on the 10-year Treasury fell marginally for the period and broad US bonds returned 1.1% as measured by the Barclays US Aggregate Bond Index.
Certain themes from late 2014 persisted in the period, including the continued strength of the US dollar against most major currencies. For the period, one of the best performing assets was the trade-weighted dollar, which returned 10.2%. On the other hand, commodities, led by energy, continued to weaken: commodities remained one of the worst performing asset classes returning, -10.6% for the period as measured by the Bloomberg Commodity Index.
Mid-April marked a period of dislocations across markets. A sell-off in European bonds, most notably in German bunds, which produced swings in bond yields globally, contributed to broad market volatility. The US dollar fell against every major developed market currency and most emerging market currencies in April, while the euro appreciated by 4.6% for the month. In commodities, oil entered positive territory for the year in mid-April, contributing to the perception of stability in oil prices. These events and trends culminated in a renewed focus on inflationary—as opposed to deflationary—trends in the global economy and a pickup in inflation expectations.
Mid-April Market Volatility
The magnitude and rapid pace of the move in European bond yields in late April was unprecedented. The spike in yields was most pronounced in German bunds, with the 10-year yield increasing from a low on April 17, 2015 of 0.05% to a high of 0.78% on May 7, 2015. Several factors contributed to the move, including speculation of tapering on the part of the ECB on the back of stronger macroeconomic data throughout the region. Concerns about the ability of Greece to reach a deal with the Eurogroup over its obligations to the IMF and other creditors intensified through April and early May, further contributing to bond market volatility. Stronger inflation data released in mid-April, including an increase in the Eurozone Aggregate Consumer Price Index of 1.1% month over month—nearly two times the increase of the previous month—contributed to higher inflation expectations, which in turn paved the way for higher yields. The increase in yields was not limited to Europe. Through mid-May, the US yield curve steepened as rates followed European yields higher and the US 10-year Treasury hit a high for the six-month period of 2.4% on May 12, 2015.
Currencies also underwent a temporary correction in April. The trade-weighted dollar suffered its first monthly decline since July 2014. For the month, the trade-weighted dollar fell 3.8%. In connection with the spike in yields on European bonds and the more solid inflation data, the euro increased more than 6% from its low in mid-April to the end of the month. However, in May, the dollar once again strengthened versus all major currencies and the euro resumed its weaker trend against the dollar, falling 2.1%.
The Return of Inflation after Disinflation
Despite significant volatility during the period including a low close to $43 in mid-March, the price of WTI crude stabilized in the $58-60/barrel range by mid-April, leading to a jump in inflation expectations. For example, in late April, one of the Fed’s preferred market based inflation gauges, the 5 year/5 year forward breakeven inflation level from the TIPS market moved above the 2% threshold suggesting that, while short term inflation expectations still lag, the 5-year inflation expectation had reached—and exceeded—the Fed’s inflation target. In the context of moderate global growth, stable energy prices and initial increases in core consumer price inflation, overall inflation expectations inched closer to central bank targets during the period. This may finally signal the dawn of a new era of inflation.
Portfolio Review
Effective April 1, 2015, the Fund’s benchmark index changed from the Real Return Target Today Index to the Morningstar Lifetime Conservative Income Index as the portfolio managers consider Morningstar Lifetime Conservative Income Index to be a better representation of the Fund’s investment strategy. Previously, the Real Return Target Today Index replaced the Dow Jones Real Return Target Today Index. This change was due to a decision by the index provider to discontinue the index. With this mid-period change, differences between the two benchmarks should be considered for purposes of performance comparison.
During the six-month period ending May 31, 2015, and relative to the benchmark, the Fund was positioned with a roughly neutral weight to fixed income, an overweight to global equities, and an underweight to cash/equivalents. During the period, the Fund also held opportunistic asset classes such as real estate and managed futures. Within the fixed income exposure, the Fund favored US inflation linked securities with a modest overweight and conversely was underweight nominal bonds. Within global equities, the Fund favored large-cap equities outside the US with an overweight and was conversely underweight US small-cap equities.
In the fixed income portion of the portfolio, performance ended roughly in-line with the benchmark index. Results benefited from an emphasis on credit related exposures gained in part through the AllianzGI Short Duration High Income Fund (+3%) and PIMCO Income Fund (+2%). The Fund also benefited from the non-US fixed income exposure, outpacing the return of the benchmark index’s non-US fixed income holdings. This contribution was partially offset by the inflation linked exposure. The modest overweight to inflation linked securities was a headwind for the period as the Barclays US TIPS Index’s returned 0.19%, trailing the 1.09% return of the Barclays US Aggregate Bond Index.
| 24 | May 31, 2015 | | Semiannual Report |
Table of Contents
Unaudited
AllianzGI Retirement Income Fund (cont’d)
In the equity portion of the portfolio, performance ended roughly in line with the benchmark index. Results benefited from an overweight to developed markets outside the US. This contribution to results was conversely limited by an underweight to the strong performance of small-cap equities in the US, as reflected by the 6.94% return of the Russell 2000 Index. Selections in emerging market equities also impacted returns in the segment.
The Fund’s exposure to opportunistic asset classes contributed to results over the period. The off-benchmark positions in global real estate and commodity related equities respectively returned 1.0% and 4.5%, contributing to the overall result. The Fund also included exposure to commodities which generally declined over the period. However, relative to the benchmark index, the Fund was underweight this asset class, contributing to relative results over the period.
In aggregate, the Fund’s equity and fixed income positioning ended roughly in-line with the benchmark index returns, while positioning in the Fund’s opportunistic exposure and an underweight to cash/equivalents contributed to the period’s favorable relative result. The AllianzGI Target-Date Funds place a strong emphasis on the Department of Labor’s guidelines for a Qualified Default Investment Alternative (“QDIA”), which contains language such as “to be diversified as to minimize the risk of large losses.” It is within this framework that the Funds continue to include commodities, real estate, convertible bonds, floating rate debt, frontier market equities, and emerging market bonds to help provide diversification benefits to clients’ retirement assets.
Outlook
We expect that the volatility experienced in the period will continue for the rest of 2015. Overall, we continue to expect global growth to slow in 2015 compared to 2014. Despite some softness in the US economy in the first quarter, we expect the growth differential between the US and other developed countries to persist.
The objective of recent changes to the portfolios has been to further insulate them from risks. The Funds remain overweight US equities compared to other developed countries. Part of the international equity exposure remains dollar-hedged, reflecting our view that the USD will continue to benefit from divergent monetary policies and divergent GDP growth. We maintain the Fund’s exposure to frontier-market equities to help further diversify the portfolios.
On interest rates, the biggest question mark for 2015 continues to be the direction, magnitude and timing of short-term interest rate moves, especially in the US, and the overall steepness of the US yield curve. As a result of such uncertainty, we added some duration back into the portfolios through TIPS and US credit (investment grade and high yield). This is partly a way to express our view that core inflation expectations in the US have most likely bottomed. However, even with such changes, we remain close to benchmark duration.
We continue to see an important role for credit in the portfolios. If interest rates remain low or decline further, high yield and investment-grade credit are among the few remaining sectors that can earn income. In the event that US interest rates rise, it will likely be a result of improved economic fundamentals and pickup in inflation, which should benefit US companies. We remain overweight credit strategies that will benefit in a rising interest rate environment.
We remain underweight commodities and REITs. In commodities, we reduced exposure to energy futures during the period. We continue to hold commodity equities, and have benefitted during certain periods of commodity-price shocks, when commodity equities behave more like “equities” and less like “commodity futures,” as occurred in the first part of the period.
While the aforementioned risks loom large, the goal of our recent changes is to move closer to having all-weather portfolios that will be able to better withstand the ongoing volatility in oil and other commodity prices, the uncertainty surrounding short-term interest rates, and the slow overall global economic growth that may potentially impact equities. We remain vigilant and ready to respond if markets evolve in a different direction.
| Semiannual Report | | May 31, 2015 | 25 |
Table of Contents
Unaudited
AllianzGI Retirement Income Fund (cont’d)
Average Annual Total Return for the period ended May 31, 2015
| 6 Month* | 1 Year | 5 Year | Since Inception† | |||||||||||||||
| AllianzGI Retirement Income Fund Class A | 0.57% | 0.66% | 5.57% | 7.79% | ||||||||||||||
| AllianzGI Retirement Income Fund Class A (adjusted) | –4.96% | –4.88% | 4.38% | 6.84% | |||||||||||||
| AllianzGI Retirement Income Fund Class C | 0.19% | –0.13% | 4.78% | 6.99% | ||||||||||||||
| AllianzGI Retirement Income Fund Class C (adjusted) | –0.77% | –1.07% | 4.78% | 6.99% | |||||||||||||
| AllianzGI Retirement Income Fund Class D | 0.51% | 0.55% | 5.49% | 7.72% | |||||||||||||
| AllianzGI Retirement Income Fund Class R | 0.38% | 0.29% | 5.22% | 7.46% | |||||||||||||
| AllianzGI Retirement Income Fund Class P | 0.70% | 0.94% | 5.88% | 8.08% | |||||||||||||
| AllianzGI Retirement Income Fund Class R6 | 0.77% | 1.07% | 5.97% | 8.19% | |||||||||||||
| AllianzGI Retirement Income Fund Administrative Class | 0.31% | 0.42% | 5.57% | 7.81% | ||||||||||||||
| Morningstar Lifetime Conservative Income Index | 0.38% | 0.77% | 5.36% | 6.28% | |||||||||||||
| Real Return Target Today Index** | 0.30% | –0.16% | 5.59% | 7.08% | |||||||||||||
| Lipper Mixed-Asset Target Today Funds Average | 1.23% | 2.45% | 5.93% | 7.55% | ||||||||||||||
† The Fund began operations on 12/29/08. Benchmark return comparisons began on the fund inception date. Lipper performance comparisons began on 12/31/08.
* Cumulative return
** Effective April 1, 2015, the Funds’ benchmark index changed from the Real Return Target series (white label) to the Morningstar Lifetime Conservative series, as the Morningstar Lifetime Conservative series is considered to be a better representation of the Funds’ investment strategies. Previously, the Real Return Target series replaced the Dow Jones Real Retirement series. This change was due to a decision by the index provider to discontinue the Index. With this mid-period change, differences between the two benchmarks should be considered for purposes of performance comparison.
Performance quoted represents past performance and is no guarantee of future results. Current performance may be lower or higher than performance shown. For performance current to the most recent month-end, visit our website at us.allianzgi.com. Investment return and the principal value will fluctuate. Shares may be worth more or less than original cost when redeemed. The adjusted returns take into account the maximum initial sales charge of 5.50% on Class A shares and the contingent deferred sales charge (CDSC) of 1% on Class C shares, which may apply to shares redeemed during the first year of ownership. Returns do not reflect deduction of taxes that a shareholder would pay on fund distributions or redemption of fund shares. See pages 106 and 107 for more information. The Fund’s gross expense ratios are 1.15% for Class A shares, 1.90% for Class C shares, 1.15% for Class D shares, 1.40% for Class R shares, 0.75% for Class P shares, 0.65% for Class R6 shares and 1.00% for Administrative Class shares. These ratios do not include an expense reduction, contractually guaranteed through at least 3/31/16. The Fund’s expense ratios net of this reduction are 0.95% for Class A shares, 1.70% for Class C shares, 1.05% for Class D shares, 1.30% for Class R shares, 0.65% for Class P shares, 0.55% for Class R6 shares and 0.90% for Administrative Class shares. Expense ratio information is as of the Fund’s current prospectus dated April 1, 2015, as supplemented to date.
| 26 | May 31, 2015 | | Semiannual Report |
Table of Contents
Unaudited
AllianzGI Retirement Income Fund (cont’d)
Cumulative Returns Through May 31, 2015
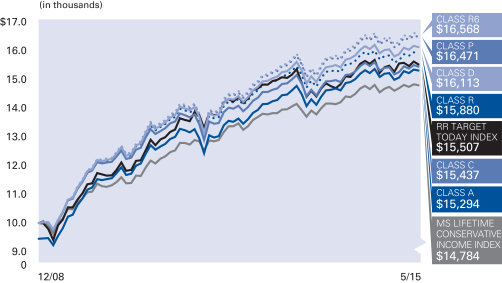
Fund Allocation (as of May 31, 2015)
| PIMCO Broad U.S. TIPS Index | 16.8% | |||
| PIMCO Income | 14.6% | |||
| AllianzGI Best Styles U.S. Equity | 11.0% | |||
| PIMCO Mortgage Opportunities | 10.0% | |||
| AllianzGI Short Duration High Income | 8.5% | |||
| PIMCO 15+ Year U.S. TIPS Index | 4.5% | |||
| PIMCO Long-Term Credit | 4.1% | |||
| AllianzGI Best Styles International Equity | 4.0% | |||
| Other | 25.4% | |||
| Cash & Equivalents — Net | 1.1% |
| Shareholder Expense Example | Actual Performance | |||||||||||||
| Class A | Class C | Class D | Class R | Class P | Class R6 | Administrative Class | ||||||||
| Beginning Account Value (12/1/14) | $1,000.00 | $1,000.00 | $1,000.00 | $1,000.00 | $1,000.00 | $1,000.00 | $1,000.00 | |||||||
| Ending Account Value (5/31/15) | $1,005.70 | $1,001.90 | $1,005.10 | $1,003.80 | $1,007.00 | $1,007.70 | $1,003.10 | |||||||
| Expenses Paid During Period | $2.35 | $6.09 | $2.85 | $4.10 | $0.85 | $0.35 | $2.00 | |||||||
| Hypothetical Performance | ||||||||||||||
| (5% return before expenses) | ||||||||||||||
| Class A | Class C | Class D | Class R | Class P | Class R6 | Administrative Class | ||||||||
| Beginning Account Value (12/1/14) | $1,000.00 | $1,000.00 | $1,000.00 | $1,000.00 | $1,000.00 | $1,000.00 | $1,000.00 | |||||||
| Ending Account Value (5/31/15) | $1,022.59 | $1,018.85 | $1,022.09 | $1,020.84 | $1,024.08 | $1,024.58 | $1,022.94 | |||||||
| Expenses Paid During Period | $2.37 | $6.14 | $2.87 | $4.13 | $0.86 | $0.35 | $2.02 | |||||||
For each class of the Fund, expenses (net of fee waiver and reimbursement, if any) are equal to the annualized expense ratio for the class (0.47% for Class A, 1.22% for Class C, 0.57% for Class D, 0.82% for Class R, 0.17% for Class P, 0.07% for Class R6 and 0.40% for Administrative Class), multiplied by the average account value over the period, multiplied by 182/365. The expense ratio does not include the expenses of the Underlying Funds, which based upon the allocation of the Fund’s assets among the Underlying Funds are indirectly borne by the shareholders of the Fund.
| Semiannual Report | | May 31, 2015 | 27 |
Table of Contents
Unaudited
AllianzGI Global Allocation Fund
For the period of December 1, 2014 through May 31, 2015, as provided by the Multi-Asset US Group.
Fund Insights
For the reporting period ended May 31, 2015, Class A shares at NAV of the AllianzGI Global Allocation Fund (the “Fund”) returned 2.40%, in line with the 60% MSCI AC World Index and 40% Barclays US Aggregate Bond Index (the “benchmark index”), which returned 2.39%.
Market Overview
For the six-month period of December 1, 2014 through May 31, 2015, global equities outperformed global bonds with developed country equities leading emerging market equities by more than 3%. In fixed income, global bonds fell 3.3% for the period as measured by the Barclays Global Aggregate Index. However, in the US, as uncertainty about the Fed’s future policy decisions persisted, yields on the 10-year Treasury fell marginally for the period and broad US bonds returned 1.1% as measured by the Barclays US Aggregate Bond Index.
Certain themes from late 2014 persisted in the period, including the continued strength of the US dollar against most major currencies. For the period, one of the best performing assets was the trade-weighted dollar, which returned 10.2%. On the other hand, commodities, led by energy continued to weaken: commodities remained one of the worst performing asset classes, returning -10.6% for the period as measured by the Bloomberg Commodity Index.
The Fund was well positioned to take advantage of these themes, given its global and diversified profile and its flexible approach to asset allocation. During the period, the Fund benefitted from increased exposure to global equities while maintaining long exposure to the trade-weighted US dollar.
Mid-April marked a period of dislocations across markets. A sell-off in European bonds, most notably in German bunds, which produced swings in bond yields globally, contributed to broad market volatility. The US dollar fell against every major developed market currency and most emerging market currencies in April, while the euro appreciated by 4.6% for the month. In commodities, oil entered positive territory for the year in mid-April, contributing to the perception of stability in oil prices. These events and trends culminated in a renewed focus on inflationary—as opposed to deflationary—trends in the global economy and a pickup in inflation expectations.
Mid-April Market Volatility
The magnitude and rapid pace of the move in European bond yields in late April was unprecedented. The spike in yields was most pronounced in German bunds, with the 10-year yield increasing from a low on April 17 of 0.05% to a high of 0.78% on May 7. Several factors contributed to the move, including speculation of tapering on the part of the ECB on the back of stronger macroeconomic data throughout the region. Concerns about the ability of Greece to reach a deal with the Eurogroup over its obligations to the IMF and other creditors intensified through April and early May further contributing to bond market volatility. Stronger inflation data released in mid-April, including an increase in the Eurozone Aggregate Consumer Price Index of 1.1% month over month—nearly two times the increase of the previous month—contributed to higher inflation expectations, which in turn paved the way for higher yields. The increase in yields was not limited to Europe. Through mid-May, the US yield curve steepened as rates followed higher European yields and the US 10-year Treasury hit a high for the six-month period of 2.4% on May 12.
Currencies also underwent a temporary correction in April. The trade-weighted dollar suffered its first monthly decline since July 2014. For the month, the trade-weighted dollar fell 3.8%. In connection with the spike in yields on European bonds and the more solid inflation data, the euro increased more than 6% from its low in mid-April to the end of the month. However, in May, the dollar once again strengthened versus all major currencies and the euro resumed its weaker trend against the dollar, falling 2.1%.
The Return of Inflation after Disinflation
Despite significant volatility during the period including a low close to $43 in mid-March, the price of WTI crude stabilized in the $58-60/barrel range by mid-April, leading to a jump in inflation expectations. As a result, inflation expectations jumped. For example, in late April, one of the Fed’s preferred market based inflation gauges, the 5 year/5 year forward breakeven inflation level from the TIPS market moved above the 2% threshold suggesting that, while short term inflation expectations still lag, the 5-year inflation expectation had reached—and exceeded—the Fed’s inflation target. In the context of moderate global growth, stable energy prices and initial increases in core consumer price inflation, overall inflation expectations inched closer to central bank targets during the period. This may finally signal the dawn of a new era of inflation.
Portfolio Review
The Fund maintained its broad and global diversification during the reporting period while taking active positions both across and within asset classes. Across asset classes, the Fund was overweight global equities and fixed income for the majority of the period. Outside of the Fund’s primary asset class exposures, the Fund also had exposure to TIPS and US small-cap equities, and modest exposure to REITs and commodities which were added later in the reporting period.
The Fund’s overweight to equities included a preference for developed markets, particularly outside the US, an overweight which was increased throughout the period. In addition, the Fund was long the trade-weighted US dollar and short the euro. The Fund’s fixed income positioning favored US corporate debt over US government bonds, and included exposure to TIPS throughout the period. While the Fund started the period with a modest underweight to government bonds, this active weight increased throughout the period and ended roughly in line with the benchmark index.
The Fund’s overall relative results benefitted from a combination of allocation and selection effects, primarily in the equity portion of the portfolio. Favorable contributors included the overweight to developed equities, primarily outside the US as the MSCI EAFE Index was up 4.84%, outpacing both the
| 28 | May 31, 2015 | | Semiannual Report |
Table of Contents
Unaudited
AllianzGI Global Allocation Fund (cont’d)
S&P 500 Index (+2.97%) and the MSCI Emerging Market Index (+0.82%) in USD terms over the period. The Fund’s equity exposure was primarily achieved through the AllianzGI Best Styles Global Equity Fund, which outperformed its benchmark index, further contributing to results over the period.
These favorable contributors to the Fund’s relative result were partially offset by the Fund’s relative duration position based on its holdings of US Treasury Bonds. Within equities, exposure to emerging market equities, which trailed developed markets over the period, also detracted from relative performance as the Fund moved from an underweight to a modest overweight in the asset class over the period.
Positioning in the Fund’s opportunistic asset classes contributed to the Fund’s overall performance, including US and international small-cap equities. During the period, US small-cap equities outperformed US large cap equities by more than 3.5%. In aggregate, the Fund’s overweight to developed equities outside the US was a top contributor, while positioning in US Treasuries detracted from the Fund’s relative result. As of the end of the period, the Fund remained overweight to developed markets outside the US, and continued to express a preference for corporate issues and TIPS in the fixed-income portion of the portfolio.
Outlook
In 2015, the seventh year of financial repression, we expect investment returns to remain low. Central banks around the developed world have committed to further monetary expansion as expected, although the significant levels of Quantitative Easing (“QE”) in Japan and Europe have been largely discounted by the markets.
In the US, we continue to expect short-term rates to remain lower for longer, but we recognize that Federal Open Market Committee’s (“FOMC”) voters have said that they will adjust policy as they consider new economic data. We also expect that inflation expectations will continue to move up incrementally and will likely push long-term rates above current levels. Therefore, we expect that 2015 could continue to be a volatile year.
Currently, the Fund is overweight US and developed non-US equities and underweight emerging market equities. We use enhanced-beta, low-tracking-error equity strategies in global equities to aim to take advantage of the outperformance of momentum- and value-related factors. There is also equity exposure through US and international managed volatility strategies. On the fixed-income side, the Fund’s biggest underweight is to US hard duration. Given that inflation expectations have likely approached a bottom, we have added off-benchmark exposure to TIPS, which we expect to benefit as inflation expectations rise again. The Fund has exposure to high-yield and short-term high-yield bonds as a way to attempt to generate income; it also has exposure to long-term corporate bonds, which have had a higher yield than like-duration Treasuries.
Beginning in the first quarter, the Fund uses a broader range of investments and a more tactical approach across markets. There is also a greater focus on mitigating downside risk. We believe that these adjustments will benefit the Fund going forward.
| Semiannual Report | | May 31, 2015 | 29 |
Table of Contents
Unaudited
AllianzGI Global Allocation Fund (cont’d)
Average Annual Total Return for the period ended May 31, 2015
| 6 Month* | 1 Year | 5 Year | 10 Year | Since Inception† | ||||||||||||||||||
| AllianzGI Global Allocation Fund Class A | 2.40% | 2.36% | 8.32% | 5.83% | 6.00% | |||||||||||||||||
| AllianzGI Global Allocation Fund Class A (adjusted) | –3.23% | –3.27% | 7.10% | 5.23% | 5.64% | ||||||||||||||||
| AllianzGI Global Allocation Fund Class B | 1.93% | 1.58% | 7.52% | 5.28% | 5.67% | |||||||||||||||||
| AllianzGI Global Allocation Fund Class B (adjusted) | –2.97% | –3.29% | 7.22% | 5.28% | 5.67% | ||||||||||||||||
| AllianzGI Global Allocation Fund Class C | 2.00% | 1.59% | 7.51% | 5.05% | 5.22% | |||||||||||||||||
| AllianzGI Global Allocation Fund Class C (adjusted) | 1.02% | 0.61% | 7.51% | 5.05% | 5.22% | ||||||||||||||||
| AllianzGI Global Allocation Fund Class D | 2.34% | 2.31% | 8.31% | 5.83% | 6.00% | ||||||||||||||||
| AllianzGI Global Allocation Fund Class R | 2.25% | 2.22% | 8.09% | 5.60% | 5.76% | ||||||||||||||||
| AllianzGI Global Allocation Fund Class P | 2.52% | 2.61% | 8.53% | 6.05% | 6.23% | ||||||||||||||||
| AllianzGI Global Allocation Fund Institutional Class | 2.47% | 2.55% | 8.58% | 6.23% | 6.46% | |||||||||||||||||
| AllianzGI Global Allocation Fund Administrative Class | 2.31% | 2.28% | 8.32% | 5.86% | 6.05% | |||||||||||||||||
| MSCI AC World Index | 3.11% | 5.08% | 11.76% | 6.77% | 5.91% | ||||||||||||||||
| 60% MSCI AC World Index/40% Barclays US Aggregate Bond Index | 2.39% | 4.36% | 8.82% | 6.26% | 5.96% | ||||||||||||||||
| Barclays US Aggregate Bond Index | 1.09% | 3.03% | 3.90% | 4.61% | 5.15% | ||||||||||||||||
| Lipper Mixed-Asset Target Allocation Moderate Funds Average | 1.96% | 4.08% | 9.03% | 5.65% | 5.69% | |||||||||||||||||
† The Fund began operations on 9/30/98. Benchmark return comparisons began on the fund inception date. Lipper performance comparisons began on 9/30/98.
* Cumulative return
Performance quoted represents past performance and is no guarantee of future results. Current performance may be lower or higher than performance shown. For performance current to the most recent month-end, visit our website at us.allianzgi.com. Investment return and the principal value will fluctuate. Shares may be worth more or less than original cost when redeemed. The adjusted returns take into account the maximum sales charge of 5.50% on Class A shares, 5% contingent deferred sales charge (CDSC) on Class B shares and 1% CDSC on Class C shares. Returns do not reflect deduction of taxes that a shareholder would pay on fund distributions or redemption of fund shares. See pages 106 and 107 for more information. The Fund’s gross expense ratios are 1.64% for Class A shares, 2.40% for Class B shares, 2.38% for Class C shares, 1.67% for Class D shares, 1.83% for Class R shares, 1.42% for Class P shares, 1.41% for Institutional Class shares and 1.57% for Administrative Class shares. These ratios do not include an expense reduction, contractually guaranteed through at least 3/31/16. The Fund’s expense ratios net of this reduction are 1.09% for Class A shares, 1.81% for Class B shares, 1.83% for Class C shares, 1.09% for Class D shares, 1.26% for Class R shares, 0.86% for Class P shares, 0.85% for Institutional Class shares and 1.10% for Administrative Class shares. Expense ratio information is as of the Fund’s current prospectus dated April 1, 2015, as supplemented to date.
| 30 | May 31, 2015 | | Semiannual Report |
Table of Contents
Unaudited
AllianzGI Global Allocation Fund (cont’d)
Cumulative Returns Through May 31, 2015
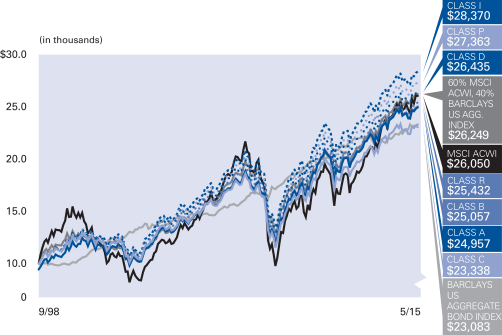
Fund Allocation (as of May 31, 2015)
| AllianzGI Best Styles Global Equity | 52.9% | |||
| PIMCO Income | 8.4% | |||
| AllianzGI Short Duration High Income | 7.0% | |||
| AllianzGI U.S. Managed Volatility | 5.5% | |||
| Schwab U.S. TIPS | 4.9% | |||
| AllianzGI International Managed Volatility | 4.6% | |||
| PIMCO Investment Grade Corporate Bond | 4.3% | |||
| PIMCO 7-15 Year U.S. Treasury Index | 2.0% | |||
| Other | 4.5% | |||
| Cash & Equivalents — Net | 5.9% |
| Shareholder Expense Example | Actual Performance | |||||||||||||||
| Class A | Class B | Class C | Class D | Class R | Class P | Institutional Class | Administrative Class | |||||||||
| Beginning Account Value (12/1/14) | $1,000.00 | $1,000.00 | $1,000.00 | $1,000.00 | $1,000.00 | $1,000.00 | $1,000.00 | $1,000.00 | ||||||||
| Ending Account Value (5/31/15) | $1,024.00 | $1,019.30 | $1,020.00 | $1,023.40 | $1,022.50 | $1,025.20 | $1,024.70 | $1,023.10 | ||||||||
| Expenses Paid During Period | $2.47 | $5.99 | $6.14 | $2.52 | $3.33 | $1.31 | $1.26 | $2.57 | ||||||||
| Hypothetical Performance | ||||||||||||||||
| (5% return before expenses) | ||||||||||||||||
| Class A | Class B | Class C | Class D | Class R | Class P | Institutional Class | Administrative Class | |||||||||
| Beginning Account Value (12/1/14) | $1,000.00 | $1,000.00 | $1,000.00 | $1,000.00 | $1,000.00 | $1,000.00 | $1,000.00 | $1,000.00 | ||||||||
| Ending Account Value (5/31/15) | $1,022.49 | $1,019.00 | $1,018.85 | $1,022.44 | $1,021.64 | $1,023.64 | $1,023.68 | $1,022.39 | ||||||||
| Expenses Paid During Period | $2.47 | $5.99 | $6.14 | $2.52 | $3.33 | $1.31 | $1.26 | $2.57 | ||||||||
For each class of the Fund, expenses (net of fee waiver and reimbursement, if any) are equal to the annualized expense ratio for the class (0.49% for Class A, 1.19% for Class B, 1.22% for Class C, 0.50% for Class D, 0.66% for Class R, 0.26% for Class P, 0.25% for Institutional Class and 0.51% for Administrative Class), multiplied by the average account value over the period, multiplied by 182/365. The expense ratio does not include the expenses of the Underlying Funds, which based upon the allocation of the Fund’s assets among the Underlying Funds are indirectly borne by the shareholders of the Fund.
| Semiannual Report | | May 31, 2015 | 31 |
Table of Contents
Unaudited
AllianzGI Global Dynamic Allocation Fund (formerly AllianzGI Global Growth Allocation Fund)
For the period of December 1, 2014 through May 31, 2015, as provided by the Multi-Asset US Group.
Fund Insights
For the reporting period ended May 31, 2015, Class A shares at NAV of the AllianzGI Global Dynamic Allocation Fund (the “Fund”) returned 1.66%, underperforming the 60% MSCI AC World Index 40% Barclays US Aggregate Bond Index (the “benchmark index”), which returned 2.39%.
Market Overview
For the six-month period of December 1, 2014 through May 31, 2015, global equities outperformed global bonds with developed country equities leading emerging market equities by more than 3%. In fixed income, global bonds fell 3.3% for the period as measured by the Barclays Global Aggregate Index. However, in the US, as uncertainty about the Fed’s future policy decisions persisted, yields on the 10-year Treasury fell marginally for the period and broad US bonds returned 1.1% as measured by the Barclays US Aggregate Bond Index.
Certain themes from late 2014 persisted in the period, including the continued strength of the US dollar against most major currencies. For the period, one of the best performing assets was the trade-weighted dollar, which returned 10.2%. On the other hand, commodities, led by energy, continued to weaken: commodities remained one of the worst performing asset classes, returning -10.6% for the period as measured by the Bloomberg Commodity Index.
The Fund was well positioned to take advantage of these themes given its global and diversified profile and its flexible approach to asset allocation. During the period, the Fund benefitted from increasing its exposure to developed equities, especially outside of the US, from investing in currency-hedged instruments and from avoiding exposure to commodities. On the fixed income side, given the uncertainty around US interest rates, the Fund gradually increased then shortened its duration and ended the period with an underweight.
Mid-April marked a period of dislocations across markets. A sell-off in European bonds, most notably in German bunds, which produced swings in bond yields globally, contributed to broad market volatility. The US dollar fell against every major developed market currency and most emerging market currencies in April, while the euro appreciated by 4.6% for the month. In commodities, oil entered positive territory for the year in mid-April, contributing to the perception of stability in oil prices. These events and trends culminated in a renewed focus on inflationary—as opposed to deflationary—trends in the global economy and a pickup in inflation expectations.
Mid-April Market Volatility
The magnitude and rapid pace of the move in European bond yields in late April was unprecedented. The spike in yields was most pronounced in German bunds, with the 10-year yield increasing from a low on April 17, 2015 of 0.05% to a high of 0.78% on May 7, 2015. Several factors contributed to the move, including talks of tapering from the ECB on the back of stronger macroeconomic data throughout the region. Concerns about the ability of Greece to reach a deal with the Eurogroup over its obligations to the IMF and other creditors intensified through April and early May, further contributing to bond market volatility. Stronger inflation data released in mid-April, including an increase in the Eurozone Aggregate Consumer Price Index of 1.1% month over month—nearly two times the increase of the previous month—contributed to higher inflation expectations, which in turn paved the way for higher yields. The increase in yields was not limited to Europe. Through mid-May, the US yield curve steepened as rates followed higher European yields and the US 10-year Treasury hit a high for the six-month period of 2.4% on May 12, 2015.
Currencies also underwent a temporary correction in April. The trade-weighted dollar suffered its first monthly decline since July 2014. For the month, the trade-weighted dollar fell 3.8%. In connection with the spike in yields on European bonds and the more solid inflation data, the euro increased more than 6% from its low in mid-April to the end of the month. However, in May, the dollar once again strengthened versus all major currencies and the euro resumed its weaker trend against the dollar, falling 2.1%.
The Return of Inflation after Disinflation
Despite significant volatility during the period including a low close to $43 in mid-March, the price of WTI crude stabilized in the $58-60/barrel range by mid-April, leading to a jump in inflation expectations. For example, in late April, one of the Fed’s preferred market based inflation gauges, the 5 year/5 year forward breakeven inflation level from the TIPS market moved above the 2% threshold suggesting that, while short term inflation expectations still lag, the 5-year inflation expectation had reached—and exceeded—the Fed’s inflation target. In the context of moderate global growth, stable energy prices and initial increases in core consumer price inflation, overall inflation expectations inched closer to central bank targets during the period. This may finally signal the dawn of a new era of inflation.
Portfolio Review
Effective January 1, 2015, the Fund’s benchmark changed from a custom-blended index comprised of 80% MSCI AC World Index and 20% Barclays US Aggregate Bond Index, to a custom-blended index comprised of 60% MSCI AC World Index and 40% Barclays US Aggregate Bond Index. In accordance with SEC Regulations, the custom 80/20 blend will continue to be displayed in the prospectus for one year following the change.
The Fund maintained its broad and global diversification during the reporting period while taking active positions both across and within asset classes. Across asset classes, the Fund was overweight global equities and underweight fixed income throughout the period. Outside of the benchmark index’s primary asset class exposure, the Fund also had positions in US small-cap equities, REITs and emerging market bonds, which were added later in the reporting period.
| 32 | May 31, 2015 | | Semiannual Report |
Table of Contents
Unaudited
AllianzGI Global Dynamic Allocation Fund (formerly AllianzGI Global Growth Allocation Fund) (cont’d)
The Fund’s overweight to equities included a preference for developed markets, particularly outside the US, an overweight which was increased throughout the period. In addition, the Fund favored the USD relative to foreign currencies, expressed with a hedge against the euro. In the Fund’s fixed income exposure, US corporate debt was favored over US government bonds and mortgage backed securities, a preference which was maintained over the period and which resulted in an overall underweight to duration.
The Fund’s overall result for the period included a combination of allocation and selection effects. With the previous blended benchmark index’s greater emphasis on global equities, the Fund’s corresponding global equity exposure for the month of December was above the current blended benchmark’s equity weight. Consequently, when comparing the Fund’s performance in December to the current blended benchmark index, a trailing result for that month can be traced to underperformance of global equities as the MSCI AC World Index returned (-1.9%) in December, as compared to the Barclays US Aggregate Bond Index which was conversely positive (+0.1%). With the current benchmark index and investment strategy in place from the start of the year, the Fund began with a roughly neutral weight to equities, and an underweight to fixed income. Exposure to equities was increased over the period with a preference for developed markets particularly outside the US. This preference contributed positively to relative results as the MSCI EAFE Index climbed 8.6%, outpacing both the S&P 500 Index (+3.2%) and the MSCI Emerging Market Index (+5.7%) in USD terms over the YTD period. Conversely, an underweight to emerging market equities detracted from relative results.
Additional detractors from the Fund’s relative result included effects in the fixed income portion of the Fund, where positioning to US government bonds relative to the current benchmark index detracted from relative results. For the first month of the full period, the Fund’s blended benchmark had a reduced emphasis on fixed income. As bonds performed well over this period, the Fund’s underweight to fixed income relative to the current benchmark detracted from results in December. For the YTD period, the positioning effects in the fixed income portion of the Fund were ultimately positive, as selection effects in the Fund’s corporate bond exposure included favorable performance from the PIMCO Investment Grade Corporate Bond Fund.
In aggregate, the benchmark index and investment strategy change during the reporting period influenced results for the six-month period as compared to the current benchmark index. Since the change, the Fund has delivered favorable relative results, benefiting from an overweight to the strong performance of developed market equities particularly outside the US, and positive selection effects in the fixed income portfolio. As of the end of the period, the Fund remained overweight equities, and continued to underweight US government bonds.
Outlook
In 2015, the seventh year of financial repression, we expect investment returns to remain low. Central banks around the developed world have committed to further monetary expansion as expected, although the significant levels of QE in Japan and Europe have been largely discounted by the markets.
In the US, we continue to expect short-term rates to remain lower for longer, but we recognize that FOMC voters have said that they will adjust policy as they consider new economic data. We also expect that inflation expectations will continue to move up incrementally and will likely push long-term rates above current levels. Therefore, we expect that 2015 could continue to be a volatile year.
Currently, the Fund is overweight US, non-US and emerging-market equities. We use enhanced-beta, low-tracking-error equity strategies in global equities to aim to take advantage of the outperformance of momentum- and value-related factors. There is also equity exposure through US and international managed volatility strategies. On the fixed-income side, the Fund is underweight US Treasuries. The Fund has exposure to short-term high-yield bonds as a way to attempt to generate income; it also has exposure to long-term corporate bonds, which have had a higher yield than like-duration Treasuries.
Beginning in the first quarter, the Fund uses a broader range of investments and a more tactical approach across markets. There is also a greater focus on mitigating downside risk. We believe that these adjustments will benefit the Fund going forward.
| Semiannual Report | | May 31, 2015 | 33 |
Table of Contents
Unaudited
AllianzGI Global Dynamic Allocation Fund (formerly AllianzGI Global Growth Allocation Fund) (cont’d)
Average Annual Total Return for the period ended May 31, 2015
| 6 Month* | 1 Year | 5 Year | Since Inception† | |||||||||||||||
| AllianzGI Global Dynamic Allocation Fund Class A | 1.66% | 0.04% | 9.22% | 12.51% | ||||||||||||||
| AllianzGI Global Dynamic Allocation Fund Class A (adjusted) | –3.93% | –5.47% | 7.99% | 11.47% | |||||||||||||
| AllianzGI Global Dynamic Allocation Fund Class C | 1.27% | –0.75% | 8.39% | 11.68% | ||||||||||||||
| AllianzGI Global Dynamic Allocation Fund Class C (adjusted) | 0.38% | –1.61% | 8.39% | 11.68% | |||||||||||||
| AllianzGI Global Dynamic Allocation Fund Class D | 1.66% | 0.03% | 9.21% | 12.52% | |||||||||||||
| AllianzGI Global Dynamic Allocation Fund Class R | 1.56% | –0.17% | 8.96% | 12.26% | |||||||||||||
| AllianzGI Global Dynamic Allocation Fund Class P | 1.74% | 0.20% | 9.40% | 12.72% | |||||||||||||
| AllianzGI Global Dynamic Allocation Fund Institutional Class | 1.80% | 0.31% | 9.52% | 12.84% | ||||||||||||||
| AllianzGI Global Dynamic Allocation Fund Administrative Class | 1.70% | 0.07% | 9.25% | 12.56% | ||||||||||||||
| MSCI AC World Index | 3.11% | 5.08% | 11.76% | 14.22% | |||||||||||||
| Barclays US Aggregate Bond Index | 1.09% | 3.03% | 3.90% | 4.66% | |||||||||||||
| 60% MSCI AC World Index 40% Barclays US Aggregate Bond Index** | 2.39% | 4.36% | 8.82% | 10.61% | |||||||||||||
| Lipper Global Flexible Portfolio Funds Average | 1.29% | 2.02% | 8.63% | 11.29% | ||||||||||||||
† The Fund began operations on 4/27/09. Benchmark return comparisons began on the fund inception date. Lipper performance comparisons began on 4/30/09.
* Cumulative return
** Prior to certain changes to the Fund’s principal investment strategies that went into effect January 1, 2015, the Fund disclosed a custom secondary benchmark with a different blend of these two broad-based market indices (80% MSCI ACWI and 20% Barclays U.S. Aggregate Bond Index).
Performance quoted represents past performance and is no guarantee of future results. Current performance may be lower or higher than performance shown. For performance current to the most recent month-end, visit our website at us.allianzgi.com. Investment return and the principal value will fluctuate. Shares may be worth more or less than original cost when redeemed. The adjusted returns take into account the maximum initial sales charge of 5.50% on Class A shares and the contingent deferred sales charge (CDSC) of 1% on Class C shares, which may apply to shares redeemed during the first year of ownership. Returns do not reflect deduction of taxes that a shareholder would pay on fund distributions or redemption of fund shares. See pages 106 and 107 for more information. The Fund’s gross expense ratios are 4.72% for Class A shares, 5.50% for Class C shares, 4.70% for Class D shares, 5.18% for Class R shares, 4.59% for Class P shares, 4.49% for Institutional Class shares and 4.74% for Administrative Class shares. These ratios do not include an expense reduction, contractually guaranteed through at least 3/31/16. The Fund’s expense ratios net of this reduction are 1.10% for Class A shares, 1.83% for Class C shares, 1.10% for Class D shares, 1.35% for Class R shares, 0.95% for Class P shares, 0.85% for Institutional Class shares and 1.10% for Administrative Class shares. Expense ratio information is as of the Fund’s current prospectus dated April 1, 2015, as supplemented to date.
| 34 | May 31, 2015 | | Semiannual Report |
Table of Contents
Unaudited
AllianzGI Global Dynamic Allocation Fund (formerly AllianzGI Global Growth Allocation Fund) (cont’d)
Cumulative Returns Through May 31, 2015
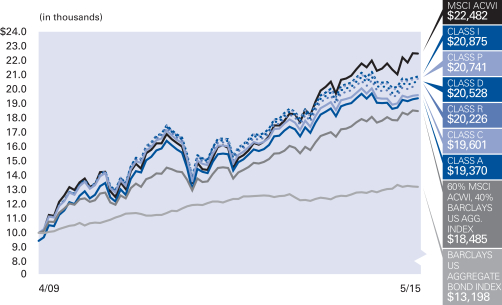
Asset Allocation (as of May 31, 2015)
| Mutual Funds | 68.8% | |||
| Exchange-Traded Funds | 8.4% | |||
| U.S. Treasury Obligations | 6.4% | |||
| U.S. Government Agency Securities | 0.5% | |||
| Cash & Equivalents — Net | 15.9% |
| Shareholder Expense Example | Actual Performance | |||||||||||||
| Class A | Class C | Class D | Class R | Class P | Institutional Class | Administrative Class | ||||||||
| Beginning Account Value (12/1/14) | $1,000.00 | $1,000.00 | $1,000.00 | $1,000.00 | $1,000.00 | $1,000.00 | $1,000.00 | |||||||
| Ending Account Value (5/31/15) | $1,016.60 | $1,012.70 | $1,016.60 | $1,015.60 | $1,017.40 | $1,018.00 | $1,017.00 | |||||||
| Expenses Paid During Period | $2.66 | $6.47 | $2.51 | $3.87 | $1.86 | $1.46 | $2.56 | |||||||
| Hypothetical Performance | ||||||||||||||
| (5% return before expenses) | ||||||||||||||
| Class A | Class C | Class D | Class R | Class P | Institutional Class | Administrative Class | ||||||||
| Beginning Account Value (12/1/14) | $1,000.00 | $1,000.00 | $1,000.00 | $1,000.00 | $1,000.00 | $1,000.00 | $1,000.00 | |||||||
| Ending Account Value (5/31/15) | $1,022.29 | $1,018.50 | $1,022.44 | $1,021.09 | $1,023.09 | $1,023.49 | $1,022.39 | |||||||
| Expenses Paid During Period | $2.67 | $6.49 | $2.52 | $3.88 | $1.87 | $1.46 | $2.57 | |||||||
For each class of the Fund, expenses (net of fee waiver and reimbursement, if any) are equal to the annualized expense ratio for the class (0.53% for Class A, 1.29% for Class C, 0.50% for Class D, 0.77% for Class R, 0.37% for Class P, 0.29% for Institutional Class and 0.51% for Administrative Class), multiplied by the average account value over the period, multiplied by 182/365. The expense ratio does not include the expenses of the Underlying Funds, which based upon the allocation of the Fund’s assets among the Underlying Funds are indirectly borne by the shareholders of the Fund.
| Semiannual Report | | May 31, 2015 | 35 |
Table of Contents
Unaudited
AllianzGI Global Megatrends Fund
From inception on February 2, 2015 through May 31, 2015, as provided by John Schroer, CFA, Portfolio Manager.
Fund Insights
For the period since the Fund’s inception on February 2, 2015 through May 31, 2015, Class A shares at NAV of the AllianzGI Global Megatrends Fund (the “Fund”) returned 7.00%, outperforming the MSCI AC World Index (the “benchmark index”), which returned 5.83%.
Portfolio Review
The Fund is allocated to five underlying strategies with a target allocation weighting of 20% to each strategy. Below is a summary of the underlying sleeves since inception of the Global Megatrends Fund.
AllianzGI Emerging Markets Consumer:
For the period since the Fund’s inception on February 2, 2015 through May 31, 2015, the AllianzGI Emerging Markets Consumer sleeve (the “sleeve”) returned 2.49%, underperforming the MSCI Emerging Markets Index, which returned 4.80%.
The sleeve lagged the MSCI Emerging Markets Index during the reporting period due to more conservative stock selection. Selections in the consumer discretionary sector contributed to overall results, as did bottom-up stock picking in the industrials sector, due exclusively to the airline industry. The exclusion of the materials, energy and utilities sectors also contributed to results due to lackluster commodity-related demand. Conversely, a relative underweight coupled with stock picking in the information technology sector detracted from results, as did stock selection in the health care sector.
From a country standpoint, globally branded companies from developed markets, including the United States and France contributed to performance, as did consumer-related exposure in Mexico and Brazil. Meanwhile, an underweight allocation and avoidance of pro-cyclical stocks in China offset results, with stock selection in South Korea and Indonesia also lagging the more broadly based benchmark index.
AllianzGI Global Natural Resources:
For the period since the Fund’s inception on February 2, 2015 through May 31, 2015, the AllianzGI Global Natural Resources sleeve (the “sleeve”) returned 4.86%, rebounding from the recent lows in crude oil prices seen in March 2015. The Custom Commodity Equity Benchmark returned 4.11%.
From June 2014 through December 2014, the price of crude oil as measured by West Texas Intermediate (“WTI”) dropped over 50%. The sleeve maintains significant exposure to the energy sector and the fact that crude prices rebounded over 30% since March from what we believed were oversold conditions, helped propel the sleeve to a gain. We remain constructive on the outlook for crude oil through the remainder of 2015, looking for a continued steady rebound in WTI. Long-term we believe higher energy prices are sustainable given global demand growth.
AllianzGI Global Water:
For the period since the Fund’s inception on February 2, 2015 through May 31, 2015, the AllianzGI Global Water sleeve (the “sleeve”) returned 5.46%, underperforming the S&P Global Water Index, which returned 5.67%.
We see encouraging signs that funding for public infrastructure to target water supply is rising again, after many years of austerity. Water Merger & Acquisitions (“M&A”) continues to be an active theme as companies try to participate in the structural attractiveness of water technology.
We expect investments in water infrastructure to continue to accelerate as municipalities stop postponing investments needed to address the further deterioration of the existing networks in the US and Europe. Core holdings of the sleeve remain the leading water pump companies and companies with differentiated products needed for water infrastructure operations.
AllianzGI Health Sciences:
For the period since the Fund’s inception on February 2, 2015 through May 31, 2015, the AllianzGI Health Sciences sleeve (the “sleeve”) returned 14.56% as global health care stocks rose solidly in the first five months of the year. The MSCI World Healthcare and Consumer Blended benchmark returned 7.39%.
Global health care stocks as measured by the MSCI World Healthcare Index have delivered strong gains over the past several years, helped by heightened M&A activity, strong pipelines and new drug introductions to the marketplace. Despite the multi-year run we remain very constructive on the sector, as valuations remain reasonable and many health care stocks are supported by solid earnings streams. We continue to focus on companies that are delivering innovative and profitable drug treatments and cost-effective health care solutions.
AllianzGI Technology:
For the period since the Fund’s inception on February 2, 2015 through May 31, 2015, the AllianzGI Technology sleeve (the “sleeve”) returned 10.73%, as technology stocks have produced strong returns in the first five months of the year. The S&P North American Technology Sector Index returned 9.06%.
Technology is expanding its reach into more industries with new technologies that are providing more efficient and productive methods of doing things for businesses and consumers. Corporations and governments are starting to adopt these next generation solutions on a broader scale, and we expect this trend to continue. Despite the recent rally in technology stocks, we remain positive on the sector as valuations remain reasonable and many technology stocks are supported by solid earnings and cash flow streams. We continue to focus on high quality companies that are market leaders in delivering innovative solutions.
| 36 | May 31, 2015 | | Semiannual Report |
Table of Contents
Unaudited
AllianzGI Global Megatrends Fund (cont’d)
Cumulative Return for the period ended May 31, 2015
| Since Inception† | ||||||
| AllianzGI Global Megatrends Fund Class A | 7.00% | |||||
| AllianzGI Global Megatrends Fund Class A (adjusted) | 1.12% | ||||
| AllianzGI Global Megatrends Fund Class P | 7.07% | ||||
| AllianzGI Global Megatrends Fund Institutional Class | 7.07% | |||||
| MSCI AC World Index | 5.83% | ||||
| Lipper Commodities General Funds Average | 0.16% | |||||
† The Fund began operations on 2/2/15. Benchmark return comparisons began on the fund inception date. Lipper performance comparisons began on 1/31/15.
Performance quoted represents past performance and is no guarantee of future results. Current performance may be lower or higher than performance shown. For performance current to the most recent month-end, visit our website at us.allianzgi.com. Investment return and the principal value will fluctuate. Shares may be worth more or less than original cost when redeemed. The adjusted returns take into account the maximum initial sales charge of 5.50% on Class A shares. Returns do not reflect deduction of taxes that a shareholder would pay on fund distributions or redemption of fund shares. See pages 106 and 107 for more information. The Fund’s gross expense ratios are 8.25% for Class A shares, 8.10% for Class P shares and 8.00% for Institutional Class shares. These ratios do not include an expense reduction, contractually guaranteed through at least 3/31/16. The Fund’s expense ratios net of this reduction are 1.30% for Class A shares, 1.15% for Class P shares and 1.05% for Institutional Class shares. Expense ratio information is as of the Fund’s current prospectus dated April 1, 2015, as supplemented to date.
Cumulative Returns Through May 31, 2015
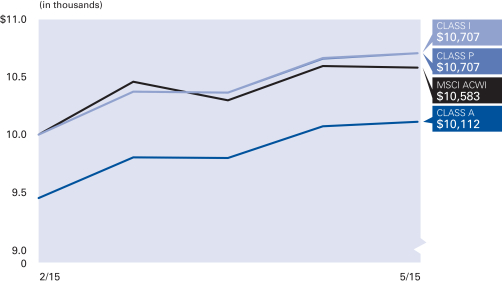
Fund Allocation (as of May 31, 2015)
| AllianzGI Health Sciences | 21.3% | |||
| AllianzGI Technology | 20.5% | |||
| AllianzGI Global Water | 19.4% | |||
| AllianzGI Global Natural Resources | 19.2% | |||
| AllianzGI Emerging Markets Consumer | 18.9% | |||
| Cash & Equivalents — Net | 0.7% |
| Semiannual Report | | May 31, 2015 | 37 |
Table of Contents
Unaudited
AllianzGI Global Megatrends Fund (cont’d)
| Shareholder Expense Example | Actual Performance | |||||
| Class A | Class P | Institutional Class | ||||
| Beginning Account Value (2/2/15) | $1,000.00 | $1,000.00 | $1,000.00 | |||
| Ending Account Value (5/31/15) | $1,070.00 | $1,070.70 | $1,070.70 | |||
| Expenses Paid During Period | $0.47 | $— | $— | |||
| Hypothetical Performance | ||||||
| (5% return before expenses) | ||||||
| Class A | Class P | Institutional Class | ||||
| Beginning Account Value (12/1/14) | $1,000.00 | $1,000.00 | $1,000.00 | |||
| Ending Account Value (5/31/15) | $1,024.23 | $1,024.93 | $1,024.93 | |||
| Expenses Paid During Period | $0.71 | $— | $— | |||
The Fund commenced operations on February 2, 2015. The Actual expense example is based on the period since inception; the Hypothetical expense example is based on the period beginning December 1, 2014. If the Hypothetical expense example had been based on the period since inception, the Ending Account Value and Expenses Paid During Period would have been: $1,015.71 and $0.46, respectively, for Class A; $1,016.16 and $0.00, respectively, for Class P; and $1,016.16 and $0.00, respectively, for Institutional Class.
For each class of the Fund, expenses (net of fee waiver and reimbursement, if any) are equal to the annualized expense ratio for the class (0.14% for Class A, 0.00% for Class P and 0.00% for Institutional Class), multiplied by the average account value over the period, multiplied by 118/365 for the Actual expense example and 182/365 for the Hypothetical expense example. The expense ratio does not include the expenses of the Underlying Funds, which based upon the allocation of the Fund’s assets among the Underlying Funds are indirectly borne by the shareholders of the Fund.
| 38 | May 31, 2015 | | Semiannual Report |
Table of Contents
(THIS PAGE INTENTIONALLY LEFT BLANK)
| Semiannual Report | | May 31, 2015 | 39 |
Table of Contents
Unaudited
AllianzGI Behavioral Advantage Large Cap Fund
For the period of December 1, 2014 through May 31, 2015, as provided by Raife Giovinazzo, CFA, PhD, Portfolio Manager.
Fund Insights
For the reporting period ended May 31, 2015, Class A shares at NAV of the AllianzGI Behavioral Advantage Large Cap Fund (the “Fund”) returned 2.99%, outperforming the S&P 500 Index (the “benchmark index”), which returned 2.97%.
Portfolio Review
Overall, this was a good six months for the Fund, and the economy continues to improve. Our performance was strong in the first quarter, but weak in April and May. We had positive sector allocation and strong stock selection.
We follow a two-step investment process: we begin with a proprietary “smart-beta” index that weights stocks proportional to size and valuation, and then we add an overlay based on behavioral finance. In our behavioral overlay, we buy stocks where investors are over-reacting to past bad performance or under-reacting to good news. For the six month period ended May 31, 2015, our proprietary smart-beta index underperformed, but our behavioral overlay outperformed. Within the behavioral overlay, our over-reaction strategies slightly underperformed, but our under-reaction strategies significantly outperformed. This was unexpected, but not unusual, as performance of each step will vary from period to period. In the long run, we expect our proprietary smart-beta index and both parts of our behavioral overlay to add alpha relative to the benchmark index.
Our stock picks were particularly strong in information technology, materials and health care. On a stock basis, UnitedHealth Group and Walt Disney were our two biggest contributors, both of which we owned primarily due to signs that investors had under-reacted to recent good performance. Our third biggest contributor was Home Depot. Our biggest detractor, however, was Walmart.
Outlook
Our short-term outlook for the stock market is typically neutral, while our long-term outlook is optimistic. In the near term, we believe the US economy is continuing recovery, and volatility is pleasantly low; however, we do see some near-term risks to the global economy from the Greek financial crisis. Over the long run, we expect the stock market to provide superior returns for investors.
Our portfolio is constructed using a “bottom-up” approach that forms an indirect view of the market, but we purposely do not try to base our portfolio on macroeconomic or “top-down” forecasts. Most recently, our bottom-up approach has built a portfolio that is slightly more conservative than average. We continue to have a very positive outlook for our stock-picking approach. Our stock selection process starts with a proprietary “smart-beta” index based on accounting-level measures of size and value, and then adds an active overlay driven by behavioral finance-based strategies. We believe our disciplined approach, used in the Fund’s stock selection and portfolio construction processes, helps to provide a repeatable source of above-benchmark index returns over the long term.
Average Annual Total Return for the period ended May 31, 2015
| 6 Month* | 1 Year | Since Inception† | ||||||||||||
| AllianzGI Behavioral Advantage Large Cap Fund Class A | 2.99% | 10.98% | 20.24% | |||||||||||
| AllianzGI Behavioral Advantage Large Cap Fund Class A (adjusted) | –2.68% | 4.88% | 18.43% | ||||||||||
| AllianzGI Behavioral Advantage Large Cap Fund Class C | 2.57% | 10.14% | 19.33% | |||||||||||
| AllianzGI Behavioral Advantage Large Cap Fund Class C (adjusted) | 1.79% | 9.31% | 19.33% | ||||||||||
| AllianzGI Behavioral Advantage Large Cap Fund Class D | 3.03% | 11.05% | 20.25% | ||||||||||
| AllianzGI Behavioral Advantage Large Cap Fund Class P | 3.04% | 11.13% | 20.47% | ||||||||||
| AllianzGI Behavioral Advantage Large Cap Fund Institutional Class | 3.14% | 11.33% | 20.62% | |||||||||||
| S&P 500 Index | 2.97% | 11.81% | 19.21% | ||||||||||
| Lipper Multi-Cap Core Funds Average | 3.71% | 9.75% | 16.69% | |||||||||||
† The Fund began operations on 9/8/11. Benchmark return comparisons began on the fund inception date. Lipper performance comparisons began on 8/31/11.
* Cumulative return
Performance quoted represents past performance and is no guarantee of future results. Current performance may be lower or higher than performance shown. For performance current to the most recent month-end, visit our website at us.allianzgi.com. Investment return and the principal value will fluctuate. Shares may be worth more or less than original cost when redeemed. The adjusted returns take into account the maximum initial sales charge of 5.50% on Class A shares and the contingent deferred sales charge (CDSC) of 1% on Class C shares, which may apply to shares redeemed during the first year of ownership. Returns do not reflect deduction of taxes that a shareholder would pay on fund distributions or redemption of fund shares. See pages 106 and 107 for more information. The Fund’s gross expense ratios are 1.02% for Class A shares, 1.83% for Class C shares, 4.22% for Class D shares, 0.81% for Class P shares and 0.76% for Institutional Class shares. These ratios do not include an expense reduction, contractually guaranteed through at least 3/31/16. The Fund’s expense ratios net of this reduction are 0.81% for Class A shares, 1.57% for Class C shares, 0.81% for Class D shares, 0.65% for Class P shares and 0.55% for Institutional Class shares. Expense ratio information is as of the Fund’s current prospectus dated April 1, 2015, as supplemented to date.
| 40 | May 31, 2015 | | Semiannual Report |
Table of Contents
Unaudited
AllianzGI Behavioral Advantage Large Cap Fund (cont’d)
Cumulative Returns Through May 31, 2015
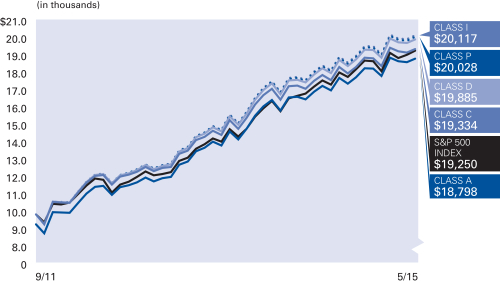
Industry Allocation (as of May 31, 2015)
| IT Services | 8.3% | |||
| Specialty Retail | 7.2% | |||
| Food and Staples Retailing | 5.4% | |||
| Insurance | 4.9% | |||
| Hotels, Restaurants & Leisure | 4.6% | |||
| Software | 4.2% | |||
| Semiconductors & Semiconductor Equipment | 4.1% | |||
| Pharmaceuticals | 3.4% | |||
| Other | 57.2% | |||
| Cash & Equivalents — Net | 0.7% |
| Shareholder Expense Example | Actual Performance | |||||||||
| Class A | Class C | Class D | Class P | Institutional Class | ||||||
| Beginning Account Value (12/1/14) | $1,000.00 | $1,000.00 | $1,000.00 | $1,000.00 | $1,000.00 | |||||
| Ending Account Value (5/31/15) | $1,029.90 | $1,025.70 | $1,030.30 | $1,030.40 | $1,031.40 | |||||
| Expenses Paid During Period | $4.10 | $7.93 | $4.10 | $3.29 | $2.79 | |||||
| Hypothetical Performance | ||||||||||
| (5% return before expenses) | ||||||||||
| Class A | Class C | Class D | Class P | Institutional Class | ||||||
| Beginning Account Value (12/1/14) | $1,000.00 | $1,000.00 | $1,000.00 | $1,000.00 | $1,000.00 | |||||
| Ending Account Value (5/31/15) | $1,020.89 | $1,017.10 | $1,020.89 | $1,021.69 | $1,022.19 | |||||
| Expenses Paid During Period | $4.08 | $7.90 | $4.08 | $3.28 | $2.77 | |||||
For each class of the Fund, expenses (net of fee waiver and reimbursement, if any) are equal to the annualized expense ratio for the class (0.81% for Class A, 1.57% for Class C, 0.81% for Class D, 0.65% for Class P and 0.55% for Institutional Class), multiplied by the average account value over the period, multiplied by 182/365.
| Semiannual Report | | May 31, 2015 | 41 |
Table of Contents
Unaudited
AllianzGI Best Styles Emerging Markets Equity Fund
From inception on December 9, 2014 through May 31, 2015, as provided by Dr. Michael Heldmann, CFA, Portfolio Manager.
Fund Insights
For the period from inception on December 9, 2014 through May 31, 2015, Class R6 shares at NAV of the AllianzGI Best Styles Emerging Markets Equity Fund (the “Fund”) returned 4.50%, underperforming the MSCI Emerging Markets Index (the “benchmark index”), which returned 4.90%.
Portfolio Review
The Fund implemented a well-diversified blend of the five long-term successful investment styles, emphasizing value, momentum, earnings change, growth and quality, and as such established a well-diversified mix of contrarian and trend-following investment styles.
In the first half of the reporting period, the Fund underperformed the benchmark index. This was a reflection of the balance of positive performance of trend following investment styles like momentum, revisions and to a lesser extent the negative performance of contrarian investment styles like dividend yield, cash yield, free-cash-flow yield and others. During the reporting period, we saw a pattern of quick moves from investor risk aversion to risk seeking, resulting in increased volatility of high-risk stocks.
Due to high volatility in market sub-segments, the Fund underperformed for the entire reporting period. However, the Fund was able to keep up with the benchmark index and outperform it in the second half of the reporting period, demonstrating the benefits of a well-diversified investment style mix.
The Fund’s strategy has only moderate leeway for sector allocation, with a maximum deviation of 4% versus the benchmark index for active sector weightings. The overall contribution from active sector allocation was consistently small for the Fund’s strategy over the reporting period. Hence the main contribution to outperformance in the second half of the reporting period came from stock selection. Stock selection was strong within the financials and industrials sectors but weaker for stocks within the materials sector.
From a regional point of view, the overall contribution from active weightings was also small. Overweighting Australian companies with a strong focus in emerging markets helped, but an underweight in Asia hurt.
The Fund holds a broad number of stocks to implement a well-diversified mix of investment styles and assigns a maximum active weighting of 1% to individual stocks. Thus, the performance impact of individual stocks is lower for the Fund as compared to concentrated portfolios. In sum, the performance contributions from stock selection was strong over the reporting period.
Cumulative Return for the period ended May 31, 2015
| Since Inception† | ||||||
| AllianzGI Best Styles Emerging Markets Equity Fund Class P | 4.42% | ||||
| AllianzGI Best Styles Emerging Markets Equity Fund Institutional Class | 4.43% | |||||
| AllianzGI Best Styles Emerging Markets Equity Fund Class R6 | 4.50% | ||||
| MSCI Emerging Markets Index | 4.90% | ||||
| Lipper Emerging Markets Fund Average | –1.07% | |||||
† The Fund began operations on 12/9/14. Benchmark return comparisons began on the fund inception date. Lipper performance comparisons began on 11/30/14.
Performance quoted represents past performance and is no guarantee of future results. Current performance may be lower or higher than performance shown. For performance current to the most recent month-end, visit our website at us.allianzgi.com. Investment return and the principal value will fluctuate. Shares may be worth more or less than original cost when redeemed. Returns do not reflect deduction of taxes that a shareholder would pay on fund distributions or redemption of fund shares. See pages 106 and 107 for more information. The Fund’s gross expense ratios are 6.14% for Class P shares, 6.04% for Institutional Class shares and 6.04% for Class R6 shares. These ratios do not include an expense reduction, contractually guaranteed through at least 3/31/16. The Fund’s expense ratios net of this reduction are 0.80% for Class P shares, 0.70% for Institutional Class shares and 0.60% for Class R6 shares. Expense ratio information is as of the Fund’s current prospectus dated April 1, 2015, as supplemented to date.
| 42 | May 31, 2015 | | Semiannual Report |
Table of Contents
Unaudited
AllianzGI Best Styles Emerging Markets Equity Fund (cont’d)
Cumulative Returns Through May 31, 2015
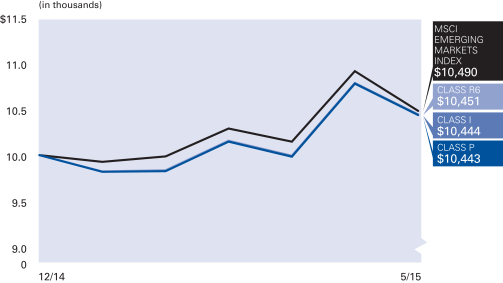
Country Allocation (as of May 31, 2015)
| China | 23.1% | |||
| Korea (Republic of) | 14.5% | |||
| Taiwan | 9.5% | |||
| South Africa | 8.8% | |||
| Brazil | 7.5% | |||
| Mexico | 3.8% | |||
| Hong Kong | 3.6% | |||
| Indonesia | 2.9% | |||
| Other | 18.4% | |||
| Cash & Equivalents — Net | 7.9% |
| Shareholder Expense Example | Actual Performance | |||||
| Class P | Institutional Class | Class R6 | ||||
| Beginning Account Value (12/9/14) | $1,000.00 | $1,000.00 | $1,000.00 | |||
| Ending Account Value (5/31/15) | $1,044.20 | $1,044.30 | $1,045.00 | |||
| Expenses Paid During Period | $3.88 | $3.39 | $2.91 | |||
| Hypothetical Performance | ||||||
| (5% return before expenses) | ||||||
| Class P | Institutional Class | Class R6 | ||||
| Beginning Account Value (12/1/14) | $1,000.00 | $1,000.00 | $1,000.00 | |||
| Ending Account Value (5/31/15) | $1,020.94 | $1,021.44 | $1,021.94 | |||
| Expenses Paid During Period | $4.03 | $3.53 | $3.02 | |||
The Fund commenced operations on December 9, 2014. The Actual expense example is based on the period since inception; the Hypothetical expense example is based on the period beginning December 1, 2014. If the Hypothetical expense example had been based on the period since inception, the Ending Account Value and Expenses Paid During Period would have been: $1,019.91 and $3.83, respectively, for Class P; $1,020.38 and $3.35, respectively, for Institutional Class; and $1,020.85 and $2.87, respectively, for Class R6.
For each class of the Fund, expenses (net of fee waiver and reimbursement, if any) are equal to the annualized expense ratio for the class (0.80% for Class P, 0.70% for Institutional Class and 0.60% for Class R6), multiplied by the average account value over the period, multiplied by 173/365 for the Actual expense example and 182/365 for the Hypothetical expense example.
| Semiannual Report | | May 31, 2015 | 43 |
Table of Contents
Unaudited
AllianzGI Best Styles Global Equity Fund
For the period of December 1, 2014 through May 31, 2015, as provided by Dr. Rainer Tafelmayer, Portfolio Manager.
Fund Insights
For the reporting period ended May 31, 2015, Class A shares at NAV of the AllianzGI Best Styles Global Equity Fund (the “Fund”) returned 5.06%, outperforming the MSCI AC World Index (the “benchmark index”), which returned 3.11%.
Portfolio Review
With respect to the whole reporting period, the Fund’s performance was 1.95% ahead of the benchmark index and exceeded expectations.
In the last month of 2014, the Fund generated stable and strong outperformance of about 0.8% over the benchmark index in sideways markets. During this time trend-following investment styles of momentum and earnings revisions were outperforming the broad market with mostly neutral contributions from the investment style value.
The first quarter of 2015 was an uninspiring quarter for style investing, and hence for the Fund, as most investment style returns were rather low. Small caps were the only major investment style to post strong returns. Consistency of investment style returns was low in the first quarter as January’s investment style winners, earnings revisions and momentum, were February’s investment style losers. This reversed again in March with earnings revisions and momentum once again becoming investment style winners. This pattern resulted in broadly neutral investment style returns. In April, the strong drawdown in trend-following investment styles was not overcompensated by positive contributions from value and small caps. On the other hand, May 2015 was very positive, as the weak investment style performance of the previous month was reversed. The trend-following investment styles of momentum, earnings revisions and growth as well as quality showed strong outperformance. Value was flat to the benchmark index, resulting in an overall outperformance of 1.3% in May.
The Fund’s strategy has only moderate leeway for sector allocation with a maximum deviation of 3% versus the benchmark index for active sector weightings. The overall contribution from active sector allocation was positive with the largest contributors coming from overweights in the health care sector and underweights in the energy sector. From a regional point of view, the overall contribution from active weightings was also positive, especially from overweights in Japanese stocks and underweights in UK stocks. The Fund holds a broad number of stocks to implement a well-diversified mix of investment styles and assigns a maximum active weighting of 1% to individual stocks. Thus, the performance impact of individual stocks is lower for the Fund as compared to concentrated portfolios, however in total the performance contributions from stock selection were strongly positive over the past six months. Sector-wise, stock selection was most successful in health care and consumer staples as well as consumer discretionary. Stock selection within regions was particularly successful in the US. Europe and Japan also contributed positively, while the contributions from stock selection in Latin America and Emerging Europe were slightly negative during the reporting period.
Cumulative Return for the period ended May 31, 2015
| 6 Month | 1 Year | Since Inception† | ||||||||||||
| AllianzGI Best Styles Global Equity Fund Class A | 5.06% | 8.57% | 10.29% | |||||||||||
| AllianzGI Best Styles Global Equity Fund Class A (adjusted) | –0.72% | 2.59% | 6.19% | ||||||||||
| AllianzGI Best Styles Global Equity Fund Class P | 5.24% | 8.81% | 10.51% | ||||||||||
| AllianzGI Best Styles Global Equity Fund Institutional Class | 5.20% | 8.86% | 10.58% | |||||||||||
| AllianzGI Best Styles Global Equity Fund Class R6 | 5.31% | 9.00% | 10.71% | ||||||||||
| MSCI AC World Index | 3.11% | 5.08% | 7.82% | ||||||||||
| Lipper Global Multi-Cap Core Funds Average | 3.79% | 5.34% | 6.80% | |||||||||||
† The Fund began operations on 12/2/2013. Benchmark return comparisons began on the fund inception date. Lipper performance comparisons began on 11/30/2013.
Performance quoted represents past performance and is no guarantee of future results. Current performance may be lower or higher than performance shown. For performance current to the most recent month-end, visit our website at us.allianzgi.com. Investment return and the principal value will fluctuate. Shares may be worth more or less than original cost when redeemed. The adjusted returns take into account the maximum initial sales charge of 5.50% on Class A Shares. Returns do not reflect deduction of taxes that a shareholder would pay on fund distributions or redemption of fund shares. See pages 106 and 107 for more information. The Fund’s gross expense ratios are 2.53% for Class A shares, 1.68% for Class P shares, 2.27% for Institutional Class shares and 1.80% for Class R6 shares. These ratios do not include an expense reduction, contractually guaranteed through at least 3/31/16. The Funds expense ratios net of this reduction are 0.75% for Class A shares, 0.60% for Class P shares, 0.50% for Institutional Class shares and 0.40% for Class R6 shares. Expense ratio information is as of the Fund’s current prospectus dated April 1, 2015, as supplemented to date.
| 44 | May 31, 2015 | | Semiannual Report |
Table of Contents
Unaudited
AllianzGI Best Styles Global Equity Fund (cont’d)
Cumulative Returns Through May 31, 2015
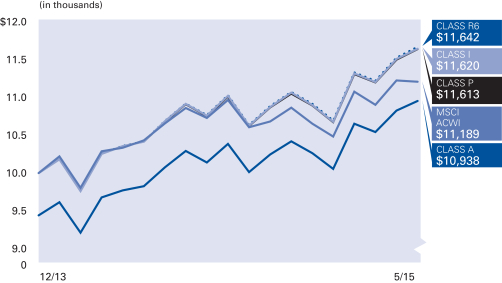
Country Allocation (as of May 31, 2015)
| United States | 49.1% | |||
| Japan | 9.8% | |||
| United Kingdom | 6.1% | |||
| Canada | 3.7% | |||
| China | 3.2% | |||
| France | 2.8% | |||
| Germany | 2.6% | |||
| Korea (Republic Of) | 1.8% | |||
| Other | 15.6% | |||
| Cash & Equivalents — Net | 5.3% |
| Shareholder Expense Example | Actual Performance | |||||||
| Class A | Class P | Institutional Class | Class R6 | |||||
| Beginning Account Value* | $1,000.00 | $1,000.00 | $1,000.00 | $1,000.00 | ||||
| Ending Account Value (5/31/15) | $1,050.60 | $1,059.30 | $1,052.00 | $1,053.10 | ||||
| Expenses Paid During Period | $3.83 | $2.71 | $2.56 | $2.05 | ||||
| Hypothetical Performance | ||||||||
| (5% return before expenses) | ||||||||
| Class A | Class P | Institutional Class | Class R6 | |||||
| Beginning Account Value (12/1/14) | $1,000.00 | $1,000.00 | $1,000.00 | $1,000.00 | ||||
| Ending Account Value (5/31/15) | $1,021.19 | $1,021.94 | $1,022.44 | $1,022.94 | ||||
| Expenses Paid During Period | $3.78 | $3.02 | $2.52 | $2.02 | ||||
* Class P commenced operations on December 22, 2014. The Actual expense example for Class P is based on the period since inception; the Actual expense example for Class A, Institutional Class and Class R6 and the Hypothetical expense example are based on the period beginning December 1, 2014. If the Hypothetical expense example for Class P had been based on the period since inception, the Ending Account Value and Expenses Paid During Period would have been: $1,019.29 and $2.66, respectively.
For each class of the Fund, expenses (net of fee waiver and reimbursement, if any) are equal to the annualized expense ratio for the class (0.75% for Class A, 0.60% for Class P, 0.50% for Institutional Class and 0.40% for Class R6), multiplied by the average account value over the period, multiplied by 182 (160 for Class P)/365 for the Actual expense example and 182/365 for the Hypothetical expense example.
| Semiannual Report | | May 31, 2015 | 45 |
Table of Contents
Unaudited
AllianzGI Best Styles International Equity Fund
From inception on December 9, 2014 through May 31, 2015, as provided by Dr. Michael Heldmann, CFA, Portfolio Manager.
Fund Insights
For the period from inception on December 9, 2014 through May 31, 2015, Class R6 shares at NAV of the AllianzGI Best Styles International Equity Fund (the “Fund”) returned 5.09%, underperforming the MSCI EAFE Index (the “benchmark index”), which returned 6.46%.
Portfolio Review
The Fund implemented a well-diversified blend of the five long-term successful investment styles, emphasizing value, momentum, earnings change, growth and quality, and as such established a well-diversified mix of contrarian and trend-following investment styles.
In the first half of the reporting period, the Fund was in line with the benchmark index. This was a reflection of the balance of the positive performance of trend following investment styles like momentum, revisions and the negative performance of contrarian investment styles like dividend yield, cash yield, free-cash-flow yield and others. During the reporting period, we saw a pattern of quick moves from investor risk aversion to risk seeking, resulting in increased volatility of high-risk stocks.
Due to the high volatility in market sub-segments, the Fund was unable to keep up with the benchmark index and underperformed it in the second half of the reporting period. This was mainly due to a negative contribution from companies in the Asia Pacific region, where in April in particular the outperformance of value did not overcompensate the losses from trend–following investment styles.
The Fund’s strategy has only moderate leeway for sector allocation with a maximum deviation of 3% versus the benchmark index for active sector weightings. The overall contribution from active sector allocation was consistently small for the Fund’s strategy over the reporting period. Stock selection was strong within the consumer discretionary sector and the health care sector, but weaker for stocks within the consumer staples and energy sectors.
The Fund holds a broad number of stocks to implement a well-diversified mix of investment styles and assigns a maximum active weighting of 1% to individual stocks. Thus, the performance impact of individual stocks is lower for the Fund as compared to concentrated portfolios.
Cumulative Return for the period ended May 31, 2015
| Since Inception† | ||||||
| AllianzGI Best Styles International Equity Fund Class P | 5.01% | ||||
| AllianzGI Best Styles International Equity Fund Institutional Class | 5.01% | |||||
| AllianzGI Best Styles International Equity Fund Class R6 | 5.09% | ||||
| MSCI EAFE Index | 6.46% | ||||
| Lipper International Multi-Cap Core Funds Average | 4.98% | |||||
† The Fund began operations on 12/9/2014. Benchmark return comparisons began on the fund inception date. Lipper performance comparisons began on 11/30/2014.
Performance quoted represents past performance and is no guarantee of future results. Current performance may be lower or higher than performance shown. For performance current to the most recent month-end, visit our website at us.allianzgi.com. Investment return and the principal value will fluctuate. Shares may be worth more or less than original cost when redeemed. Returns do not reflect deduction of taxes that a shareholder would pay on fund distributions or redemption of fund shares. See pages 106 and 107 for more information. The Fund’s gross expense ratios are 5.90% for Class P shares, 5.80% for Institutional Class shares and 5.80% for Class R6 shares. These ratios do not include an expense reduction, contractually guaranteed through at least 3/31/16. The Fund’s expense ratios net of this reduction are 0.65% for Class P shares, 0.55% for Institutional Class shares and 0.45% for Class R6 shares. Expense ratio information is as of the Fund’s current prospectus dated April 1, 2015, as supplemented to date.
| 46 | May 31, 2015 | | Semiannual Report |
Table of Contents
Unaudited
AllianzGI Best Styles International Equity Fund (cont’d)
Cumulative Returns Through May 31, 2015

Country Allocation (as of May 31, 2015)
| Japan | 23.9% | |||
| United Kingdom | 19.3% | |||
| Germany | 10.5% | |||
| Switzerland | 8.6% | |||
| France | 7.0% | |||
| Australia | 5.1% | |||
| Italy | 3.7% | |||
| Spain | 3.7% | |||
| Other | 15.9% | |||
| Cash & Equivalents — Net | 2.3% |
| Shareholder Expense Example | Actual Performance | |||||
| Class P | Institutional Class | Class R6 | ||||
| Beginning Account Value (12/9/14) | $1,000.00 | $1,000.00 | $1,000.00 | |||
| Ending Account Value (5/31/15) | $1,050.10 | $1,050.10 | $1,050.90 | |||
| Expenses Paid During Period | $3.16 | $2.67 | $2.19 | |||
| Hypothetical Performance | ||||||
| (5% return before expenses) | ||||||
| Class P | Institutional Class | Class R6 | ||||
| Beginning Account Value (12/1/14) | $1,000.00 | $1,000.00 | $1,000.00 | |||
| Ending Account Value (5/31/15) | $1,021.69 | $1,022.19 | $1,022.69 | |||
| Expenses Paid During Period | $3.28 | $2.77 | $2.27 | |||
The Fund commenced operations on December 9, 2014. The Actual expense example is based on the period since inception; the Hypothetical expense example is based on the period beginning December 1, 2014. If the Hypothetical expense example had been based on the period since inception, the Ending Account Value and Expenses Paid During Period would have been: $1,020.62 and $3.11, respectively, for Class P; $1,021.09 and $2.63, respectively, for Institutional Class; and $1,021.57 and $2.16, respectively, for Class R6.
For each class of the Fund, expenses (net of fee waiver and reimbursement, if any) are equal to the annualized expense ratio for the class (0.65% for Class P, 0.55% for Institutional Class and 0.45% for Class R6), multiplied by the average account value over the period, multiplied by 173/365 for the Actual expense example and 182/365 for the Hypothetical expense example.
| Semiannual Report | | May 31, 2015 | 47 |
Table of Contents
Unaudited
AllianzGI Best Styles U.S. Equity Fund
From inception on December 1, 2014 through May 31, 2015, as provided by Karsten Niemann, CFA, Portfolio Manager.
Fund Insights
For the period from inception on December 1, 2014 through May 31, 2015, Class R6 shares at NAV of the AllianzGI Best Styles U.S. Equity Fund (the “Fund”) returned 3.83%, outperforming the S&P 500 Index (the “benchmark index”), which returned 3.67%.
Portfolio Review
The reporting period was positive for the Fund and includes the inception date and is marked by significant flows.
Best Styles centers upon the conviction that investment styles like value or momentum carry risk premiums that can be harvested in a disciplined systematic approach, largely independent from the economic or market environment.
During the reporting period, the performance of the individual investment styles targeted by the fund displayed more volatility compared to the prior twelve months. A very noticeable and positive contributor to the excess returns of the Fund was the strong performance of smaller companies’ style from January onwards. The contribution of trend-following investment styles, momentum and earnings revisions, were neutral to the performance of the Fund as both styles strongly under-performed the market in April, erasing the positive contributions made from December to March. Also noteworthy is the performance of the value investment style. The contribution of value was neutral, but helped stabilize the excess returns due to the low correlation to other styles, especially to momentum and revision.
Stock selection proved successful within the consumer staples (especially Krogers) and health care sectors.
Cumulative Return for the period ended May 31, 2015
| Since Inception† | ||||||
| AllianzGI Best Styles U.S. Equity Fund Class P | 3.68% | ||||
| AllianzGI Best Styles U.S. Equity Fund Institutional Class | 3.82% | |||||
| AllianzGI Best Styles U.S. Equity Fund Class R6 | 3.83% | ||||
| S&P 500 Index | 3.67% | ||||
| Lipper Multi-Cap Core Funds Average | 2.70% | |||||
† The Fund began operations on 12/1/2014. Benchmark return comparisons began on the fund inception date. Lipper performance comparisons began on 11/30/2014.
Performance quoted represents past performance and is no guarantee of future results. Current performance may be lower or higher than performance shown. For performance current to the most recent month-end, visit our website at us.allianzgi.com. Investment return and the principal value will fluctuate. Shares may be worth more or less than original cost when redeemed. Returns do not reflect deduction of taxes that a shareholder would pay on fund distributions or redemption of fund shares. See pages 106 and 107 for more information. The Fund’s gross expense ratios are 8.80% for Class P shares, 8.70% for Institutional Class shares and 8.70% for Class R6 shares. These ratios do not include an expense reduction, contractually guaranteed through at least 3/31/16. The Fund’s expense ratios net of this reduction are 0.60% for Class P shares, 0.50% for Institutional Class shares and 0.40% for Class R6 shares. Expense ratio information is as of the Fund’s current prospectus dated April 1, 2015, as supplemented to date.
| 48 | May 31, 2015 | | Semiannual Report |
Table of Contents
Unaudited
AllianzGI Best Styles U.S. Equity Fund (cont’d)
Cumulative Returns Through May 31, 2015
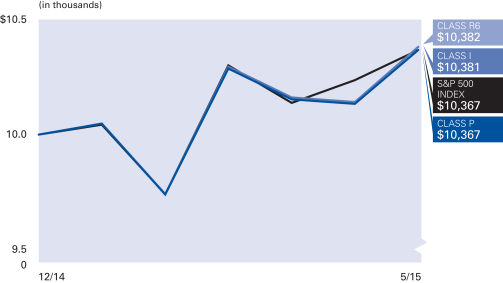
Industry Allocation (as of May 31, 2015)
| Banks | 6.2% | |||
| Health Care Providers & Services | 5.5% | |||
| Technology Hardware, Storage & Peripherals | 5.2% | |||
| Insurance | 5.0% | |||
| Oil, Gas & Consumable Fuels | 4.8% | |||
| Pharmaceuticals | 4.5% | |||
| Semiconductors & Semiconductor Equipment | 4.1% | |||
| Media | 3.4% | |||
| Other | 54.6% | |||
| Cash & Equivalents — Net | 6.7% |
| Shareholder Expense Example | Actual Performance | |||||
| Class P | Institutional Class | Class R6 | ||||
| Beginning Account Value (12/1/14) | $1,000.00 | $1,000.00 | $1,000.00 | |||
| Ending Account Value (5/31/15) | $1,036.80 | $1,038.20 | $1,038.30 | |||
| Expenses Paid During Period | $3.03 | $2.53 | $2.02 | |||
| Hypothetical Performance | ||||||
| (5% return before expenses) | ||||||
| Class P | Institutional Class | Class R6 | ||||
| Beginning Account Value (12/1/14) | $1,000.00 | $1,000.00 | $1,000.00 | |||
| Ending Account Value (5/31/15) | $1,021.94 | $1,022.44 | $1,022.94 | |||
| Expenses Paid During Period | $3.02 | $2.52 | $2.02 | |||
The Fund commenced operations on December 1, 2014. The Actual expense example is based on the period since inception; the Hypothetical expense example is based on the period beginning December 1, 2014. If the Hypothetical expense example had been based on the period since inception, the Ending Account Value and Expenses Paid During Period would have been: $1,021.82 and $3.01, respectively, for Class P; $1,022.32 and $2.51, respectively, for Institutional Class; and $1,022.81 and $2.01, respectively, for Class R6.
For each class of the Fund, expenses (net of fee waiver and reimbursement, if any) are equal to the annualized expense ratio for the class (0.60% for Class P, 0.50% for Institutional Class and 0.40% for Class R6), multiplied by the average account value over the period, multiplied by 181/365 for the Actual expense example and 182/365 for the Hypothetical expense example.
| Semiannual Report | | May 31, 2015 | 49 |
Table of Contents
Unaudited
AllianzGI China Equity Fund
For the period of December 1, 2014 through May 31, 2015, as provided by Christina Chung, CFA, Portfolio Manager.
Fund Insights
For the reporting period ended May 31, 2015, Class A shares at NAV of the AllianzGI China Equity Fund (the “Fund”) returned 28.00%, outperforming the MSCI China Index (the “benchmark index”), which returned 22.89%.
Market Environment
For the six-month period ending May 31, 2015, Chinese equities have been one of the best performing asset classes in the world. The major catalyst for such performance was the interest rate cut by the People’s Bank of China (“PBoC”) in November 2014, which was interpreted by investors as the start of an easing cycle in China. Beijing did not fail to meet investors’ expectations—since November 2014, the PBoC conducted three rounds of interest rate cuts and two rounds of reserve requirement ratio (“RRR”) cuts to support the weakening economy and inject liquidity into the market. At the same time, we have seen policy easing on the fiscal front as well. However, this was different from the post financial crisis fiscal easing package; this time around, more effort has been focused on particular industries such as water utilities and environmental protection related industries.
Portfolio Review
Both asset allocation and stock selection have contributed to the Fund’s outperformance over the period. In particular, stock selection in the financials sector contributed strongly, given the liquidity in the market, as well as the pace of financial reforms. These reforms arrived much faster than most investors had anticipated and benefitted companies such as securities firms, insurance companies and exchanges. In terms of financial reforms, the Shanghai-Hong Kong Stock Connect Scheme was launched and became fully operational in the first quarter of 2015. Now foreign investors can participate in the Chinese A-share market without obtaining the Qualified Foreign Institutional Investor quota. In contrast, stock selection in the consumer discretionary sector detracted from the Fund’s relative performance as a result of weakness in the auto sector. Although the Fund has reduced its exposure to the sector over the last six months, we continue to hold our exposure to these companies on the basis of China’s growing and more affluent middle class and the increasing momentum of domestically branded vehicles, which should drive future earnings growth.
The macroeconomic situation in China remains weak, with first quarter 2015 GDP readings at 7.0% year-over-year. Other indicators such as industrial production and export growth continue to decline. The good news is that we have seen a sequential stabilization in the economy, in areas such as retail sales and new home sales.
Average Annual Total Return for the period ended May 31, 2015
| 6 Month* | 1 Year | Since Inception† | ||||||||||||
| AllianzGI China Equity Fund Class A | 28.00% | 41.96% | 11.79% | |||||||||||
| AllianzGI China Equity Fund Class A (adjusted) | 20.96% | 34.16% | 10.53% | ||||||||||
| AllianzGI China Equity Fund Class C | 27.51% | 40.85% | 10.98% | |||||||||||
| AllianzGI China Equity Fund Class C (adjusted) | 26.51% | 39.85% | 10.98% | ||||||||||
| AllianzGI China Equity Fund Class D | 28.01% | 41.88% | 11.81% | ||||||||||
| AllianzGI China Equity Fund Class P | 28.12% | 42.22% | 12.09% | ||||||||||
| AllianzGI China Equity Fund Institutional Class | 28.17% | 42.31% | 12.18% | |||||||||||
| MSCI China Index | 22.89% | 36.22% | 9.69% | ||||||||||
| Lipper China Region Funds Average | 22.19% | 33.42% | 9.34% | |||||||||||
† The Fund began operations on 6/7/10. Benchmark return comparisons began on the fund inception date. Lipper performance comparisons began on 5/31/2010.
* Cumulative return
Performance quoted represents past performance and is no guarantee of future results. Current performance may be lower or higher than performance shown. For performance current to the most recent month-end, visit our website at us.allianzgi.com. Investment return and the principal value will fluctuate. Shares may be worth more or less than original cost when redeemed. The adjusted returns take into account the maximum initial sales charge of 5.50% on Class A shares and the contingent deferred sales charge (CDSC) of 1% on Class C shares, which may apply to shares redeemed during the first year of ownership. Returns do not reflect deduction of taxes that a shareholder would pay on fund distributions or redemption of fund shares. See pages 106 and 107 for more information. The Fund’s gross expense ratios are 5.73% for Class A shares, 6.92% for Class C shares, 9.06% for Class D shares, 4.74% for Class P shares and 5.93% for Institutional Class shares. These ratios do not include an expense reduction, contractually guaranteed through at least 3/31/16. The Fund’s expense ratios net of this reduction are 1.70% for Class A shares, 2.45% for Class C shares, 1.77% for Class D shares, 1.51% for Class P shares and 1.45% for Institutional Class shares. Expense ratio information is as of the Fund’s current prospectus dated April 1, 2015, as supplemented to date.
| 50 | May 31, 2015 | | Semiannual Report |
Table of Contents
Unaudited
AllianzGI China Equity Fund (cont’d)
Cumulative Returns Through May 31, 2015
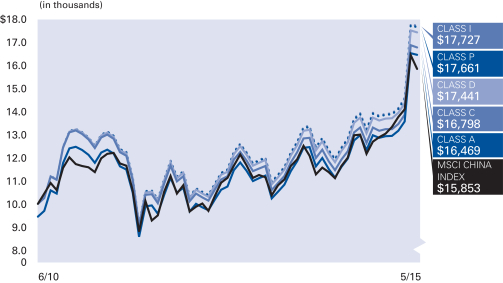
Industry Allocation (as of May 31, 2015)
| Banks | 15.0% | |||
| Insurance | 13.3% | |||
| Internet Software & Services | 5.5% | |||
| Electronic Equipment, Instruments and Components | 5.4% | |||
| Automobiles | 5.3% | |||
| Diversified Financial Services | 4.4% | |||
| Wireless Telecommunication Services | 4.3% | |||
| Real Estate Management & Development | 4.2% | |||
| Other | 34.8% | |||
| Cash & Equivalents — Net | 7.8% |
| Shareholder Expense Example | Actual Performance | |||||||||
| Class A | Class C | Class D | Class P | Institutional Class | ||||||
| Beginning Account Value (12/1/14) | $1,000.00 | $1,000.00 | $1,000.00 | $1,000.00 | $1,000.00 | |||||
| Ending Account Value (5/31/15) | $1,280.00 | $1,275.10 | $1,280.10 | $1,281.20 | $1,281.70 | |||||
| Expenses Paid During Period | $9.66 | $13.90 | $10.06 | $8.59 | $8.25 | |||||
| Hypothetical Performance | ||||||||||
| (5% return before expenses) | ||||||||||
| Class A | Class C | Class D | Class P | Institutional Class | ||||||
| Beginning Account Value (12/1/14) | $1,000.00 | $1,000.00 | $1,000.00 | $1,000.00 | $1,000.00 | |||||
| Ending Account Value (5/31/15) | $1,016.45 | $1,012.72 | $1,016.11 | $1,017.40 | $1,017.70 | |||||
| Expenses Paid During Period | $8.55 | $12.29 | $8.90 | $7.59 | $7.29 | |||||
For each class of the Fund, expenses (net of fee waiver and reimbursement, if any) are equal to the annualized expense ratio for the class (1.70% for Class A, 2.45% for Class C, 1.77% for Class D, 1.51% for Class P and 1.45% for Institutional Class), multiplied by the average account value over the period, multiplied by 182/365.
| Semiannual Report | | May 31, 2015 | 51 |
Table of Contents
Unaudited
AllianzGI Convertible Fund
For the period of December 1, 2014 through May 31, 2015, as provided by Doug Forsyth, CFA, Portfolio Manager.
Fund Insights
For the reporting period ended May 31, 2015, Class A shares at NAV of the AllianzGI Convertible Fund (the “Fund”) returned 5.67%, outperforming the BofA Merrill Lynch All Convertibles Index (the “benchmark index”), which returned 5.28%.
Market Environment
Several factors influenced the convertible market during the period. Risk assets, in general, respond to a wide variety of factors. However, when analyzing the market prices of equities and convertibles, one of the most important elements is an individual company’s operational earnings. The market has enjoyed earnings expansion since the crisis of 2008, and while this pace has not been linear, it has been on an upward trajectory. During the reporting period, a strengthening dollar, severe weather conditions in the Northeast and a West Coast US port shutdown impacted some companies’ earnings.
Energy prices continued to have an effect on the prices of high-yield energy issuers and the day-to-day volatility remained a challenge. Market participants, however, did a better job of isolating the commodity-price impact to those relevant issuers—which was not the case in the second half of 2014. Although prices moved lower overall among issuers in the energy industry, specifically among those in the exploration and production space, many issuers executed capital-market transactions. These transactions, both in new financing and in M&A activity, solidified balance sheets and extended the liquidity runway.
Treasury-rate volatility remained a factor and had a mixed impact on the convertible market. The interest rate-sensitive issuers generally underperformed the overall convertible market.
Another influential factor was the ongoing trend in economic indicators. Data generally pointed to a US economy that is slowly grinding higher. The data was arguably mixed, but the overall neutral to higher economic trend confirms the prospects for a continued low default rate for convertibles. Furthermore, mixed US economic data reinforced the message that the Fed would remain “patient” and the rate hike cycle would be gradual—a positive for risk assets.
Finally, global central banks have continued to be generally accommodative, and the Fed governors have maintained a dovish stance. We believe that the outlook for convertibles under these conditions is clearly positive. Furthermore, we believe investors need to focus on the fact that the Fed will tighten only in response to a more robust economy, which we believe contributes to a more constructive outlook for corporate profits and defaults.
Against this backdrop, convertible bonds advanced alongside stocks. They proved resilient in the face of rising yields and increased volatility in the US Treasury, as well as in the investment grade corporate bond markets.
Portfolio Review
The Fund rallied with the market during the reporting period. The attribution for the period included several positive single-name performers from a variety of sectors. The majority of the Fund’s issuers exceeded earnings expectations, which helped contribute to absolute performance.
The sector allocations that helped relative performance in the period included health care, financials and energy. Negative security selection in health care was more than offset by the Fund’s higher-than-benchmark index allocation. An underweight in the financial sector, along with a stronger issue-specific performance, were beneficial. In the energy sector, the portfolio selections lagged, but an underweight to this underperforming sector more than offset this impact.
In contrast, the Fund’s consumer staples, technology and transportation exposure weighed on relative performance during the reporting period. In particular, an overweight and negative security selection within technology negatively impacted relative performance. The Fund’s underperformance in the consumer staples and transportation sectors was a detractor.
| 52 | May 31, 2015 | | Semiannual Report |
Table of Contents
Unaudited
AllianzGI Convertible Fund (cont’d)
Average Annual Total Return for the period ended May 31, 2015
| 6 Month* | 1 Year | 5 Year | 10 Year | Since Inception† | ||||||||||||||||||
| AllianzGI Convertible Fund Class A | 5.67% | 8.12% | 13.14% | 10.07% | 10.63% | |||||||||||||||||
| AllianzGI Convertible Fund Class A (adjusted) | –0.15% | 2.17% | 11.87% | 9.46% | 10.34% | ||||||||||||||||
| AllianzGI Convertible Fund Class C | 5.27% | 7.33% | 12.32% | 9.26% | 9.80% | |||||||||||||||||
| AllianzGI Convertible Fund Class C (adjusted) | 4.29% | 6.34% | 12.32% | 9.26% | 9.80% | ||||||||||||||||
| AllianzGI Convertible Fund Class D | 5.60% | 7.98% | 13.09% | 10.05% | 10.61% | ||||||||||||||||
| AllianzGI Convertible Fund Class R | 5.49% | 7.77% | 12.77% | 9.76% | 10.33% | ||||||||||||||||
| AllianzGI Convertible Fund Class P | 5.79% | 8.38% | 13.37% | 10.30% | 10.86% | ||||||||||||||||
| AllianzGI Convertible Fund Institutional Class | 5.82% | 8.46% | 13.49% | 10.42% | 10.97% | |||||||||||||||||
| AllianzGI Convertible Fund Administrative Class | 5.68% | 8.19% | 13.20% | 10.10% | 10.64% | |||||||||||||||||
| BofA Merrill Lynch All Convertibles Index | 5.28% | 8.98% | 12.46% | 8.35% | 8.65% | ||||||||||||||||
| Lipper Convertible Securities Funds Average | 4.06% | 6.43% | 10.36% | 6.97% | 8.11% | |||||||||||||||||
† The Fund began operations on 4/19/93. Benchmark return comparisons began on the fund inception date. Lipper performance comparisons began on 4/30/93.
* Cumulative returns
Performance quoted represents past performance and is no guarantee of future results. Current performance may be lower or higher than performance shown. For performance current to the most recent month-end, visit our website at us.allianzgi.com. Investment return and the principal value will fluctuate. Shares may be worth more or less than original cost when redeemed. The adjusted returns take into account the maximum initial sales charge of 5.50% on Class A shares and the contingent deferred sales charge (CDSC) of 1% on Class C shares, which may apply to shares redeemed during the first year of ownership. Returns do not reflect deduction of taxes that a shareholder would pay on fund distributions or redemption of fund shares. See pages 106 and 107 for more information. The Fund’s expense ratios are 0.97% for Class A shares, 1.70% for Class C shares, 1.02% for Class D shares, 1.30% for Class R shares, 0.74% for Class P shares, 0.65% for Institutional Class shares and 0.89% for Administrative Class shares. Expense ratio information is as of the Fund’s current prospectus dated April 1, 2015, as supplemented to date.
Cumulative Returns Through May 31, 2015

Industry Allocation (as of May 31, 2015)
| Software | 9.9% | |||
| Biotechnology | 8.6% | |||
| Semiconductors | 8.5% | |||
| Pharmaceuticals | 6.9% | |||
| Internet | 6.4% | |||
| Healthcare — Products | 4.7% | |||
| Oil, Gas & Consumable Fuels | 4.7% | |||
| Healthcare-Services | 4.2% | |||
| Other | 43.3% | |||
| Cash & Equivalents — Net | 2.8% |
Moody’s Ratings* (as of May 31, 2015)
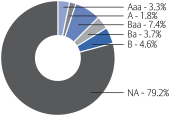
* As a percentage of total investments. Bond ratings refer to the underlying holdings of the Fund and are categorized from highest to lowest credit quality using ratings provided by Moody’s. Moody’s ratings have been selected for several reasons, including the access to information and materials provided by Moody’s, as well as the Fund’s consideration of industry practice. See “Important Information“ for more detail on the selection of Moody’s for the Fund’s ratings presentation. Bonds not rated by Moody’s and bonds that do not currently have a rating available are designated in the chart above as “NR“ and “NA”, respectively.
| Semiannual Report | | May 31, 2015 | 53 |
Table of Contents
Unaudited
AllianzGI Convertible Fund (cont’d)
| Shareholder Expense Example | Actual Performance | |||||||||||||
| Class A | Class C | Class D | Class R | Class P | Institutional Class | Administrative Class | ||||||||
| Beginning Account Value (12/1/14) | $1,000.00 | $1,000.00 | $1,000.00 | $1,000.00 | $1,000.00 | $1,000.00 | $1,000.00 | |||||||
| Ending Account Value (5/31/15) | $1,056.70 | $1,052.70 | $1,056.00 | $1,054.90 | $1,057.90 | $1,058.20 | $1,056.80 | |||||||
| Expenses Paid During Period | $4.82 | $8.70 | $5.48 | $6.56 | $3.75 | $3.28 | $4.62 | |||||||
| Hypothetical Performance | ||||||||||||||
| (5% return before expenses) | ||||||||||||||
| Class A | Class C | Class D | Class R | Class P | Institutional Class | Administrative Class | ||||||||
| Beginning Account Value (12/1/14) | $1,000.00 | $1,000.00 | $1,000.00 | $1,000.00 | $1,000.00 | $1,000.00 | $1,000.00 | |||||||
| Ending Account Value (5/31/15) | $1,020.24 | $1,016.45 | $1,019.60 | $1,018.55 | $1,021.29 | $1,021.74 | $1,020.44 | |||||||
| Expenses Paid During Period | $4.73 | $8.55 | $5.39 | $6.44 | $3.68 | $3.23 | $4.53 | |||||||
For each class of the Fund, expenses are equal to the annualized expense ratio for the class (0.94% for Class A, 1.70% for Class C, 1.07% for Class D, 1.28% for Class R, 0.73% for Class P, 0.64% for Institutional Class and 0.90% for Administrative Class), multiplied by the average account value over the period, multiplied by 182/365.
| 54 | May 31, 2015 | | Semiannual Report |
Table of Contents
(THIS PAGE INTENTIONALLY LEFT BLANK)
| Semiannual Report | | May 31, 2015 | 55 |
Table of Contents
Unaudited
AllianzGI Emerging Markets Consumer Fund
From inception on December 1, 2014 through May 31, 2015, as provided by Kunal Ghosh, Portfolio Manager.
Fund Insights
For the period from inception on December 1, 2014 through May 31, 2015, Class A shares at NAV of the AllianzGI Emerging Markets Consumer Fund (the “Fund”) returned -1.27%, underperforming the MSCI Emerging Markets Index (the “benchmark index”), which returned 2.83%.
Market Environment
During the reporting period, emerging market equities experienced moderate levels of volatility due to changing investor sentiment. In December, equities were hampered by concerns of a strong dollar and the ensuing impact on non-US markets. At the start of calendar year, this trend reversed, given the attractive growth and valuation mix of emerging market equities. Investors then focused on additional stimulus packages and a potentially accommodative US monetary policy which broadly boosted returns in April, particularly for pro-cyclical stocks, which were among the top benchmark index performers. Market performance reversed again in May as sentiment moderated.
During the reporting period, Chinese equities were among the best performers, benefitting from interest rate cuts and investor demand for local market shares. Other Asian countries, including Taiwan, the Philippines and South Korea, were also among the outperformers. Meanwhile, Greece was lower due to the potential impact from its financial calamity, while Latin American economies, including Brazil and Colombia, declined due to slowing growth in the region. Sectors were led by positive performance in information technology, industrials and health care, which were offset by declines in utilities, materials and telecommunications.
Performance impacted by allocation decisions and stock selection
The Fund lagged the benchmark index during the reporting period due to more conservative stock selection. The Fund is strategically focused on local emerging market consumption while avoiding hard-asset and export-oriented stocks, which do not capture secular growth of the rising middle class. The resulting exposure trailed the benchmark index due to investor preference for pro-cyclical stocks during the reporting period.
Selections in consumer discretionary contributed to overall results as did bottom-up stockpicking in the industrials sector, due exclusively to the airline industry. The exclusion of the materials, energy and utilities sectors also contributed to results due to lackluster commodity-related demand. Conversely, a relative underweight coupled with stockpicking in the information technology sector detracted from results, as did stock selection in the health care sector. From a country standpoint, globally-branded companies from developed markets, including the United States and France, contributed to performance, as did consumer-related exposure in Mexico and Brazil. Meanwhile, an underweight allocation and avoidance of pro-cyclical stocks in China offset results, with stock selection in South Korea and Indonesia also lagging the more broadly-based benchmark index.
The largest individual active contributor to performance was China Southern Airlines, which rallied due to higher commercial airline traffic, thanks in part to a surge in Lunar New Year travel. South Korean cosmetics company Amorepacific Corp benefitted from higher demand for skin care, make-up and fragrance products. The largest active detractor for the reporting period was Brazilian insurance provider Qualicorp SA, which was lower due to investor trepidation that the government may attempt to loosen regulations and allow greater portability among plans. Indonesian cigarette manufacturer Gudang Garam Tbk was lower following concerns that the government may raise excise taxes, which could negatively impact gross margins.
We believe investment results will be supported by secular growth in consumer-related stocks. Furthermore, we believe that our behavioral finance-focused investment process and focus on higher quality securities with strong company fundamentals will be drivers of returns for the coming quarters.
Cumulative Return for the period ended May 31, 2015
| Since Inception† | ||||||
| AllianzGI Emerging Markets Consumer Fund Class A | –1.27% | |||||
| AllianzGI Emerging Markets Consumer Fund Class A (adjusted) | –6.70% | ||||
| AllianzGI Emerging Markets Consumer Fund Institutional Class | –1.07% | ||||
| MSCI Emerging Markets Index | 2.83% | ||||
| Lipper Emerging Markets Fund Average | –1.07% | |||||
† The Fund began operations on 12/1/14. Benchmark return comparisons began on the fund inception date. Lipper performance comparisons began on 11/30/14.
Performance quoted represents past performance and is no guarantee of future results. Current performance may be lower or higher than performance shown. For performance current to the most recent month-end, visit our website at us.allianzgi.com. Investment return and the principal value will fluctuate. Shares may be worth more or less than original cost when redeemed. The adjusted returns take into account the maximum initial sales charge of 5.50% on Class A shares. Returns do not reflect deduction of taxes that a shareholder would pay on fund distributions or redemption of fund shares. See pages 106 and 107 for more information. The Fund’s gross expense ratios are 10.32% for Class A shares and 10.07% for Institutional Class shares. These ratios do not include an expense reduction, contractually guaranteed through at least 3/31/16. The Fund’s expense ratios net of this reduction are 1.65% for Class A shares and 1.30% for Institutional Class shares. Expense ratio information is as of the Fund’s current prospectus dated April 1, 2015, as supplemented to date.
| 56 | May 31, 2015 | | Semiannual Report |
Table of Contents
Unaudited
AllianzGI Emerging Markets Consumer Fund (cont’d)
Cumulative Returns Through May 31, 2015
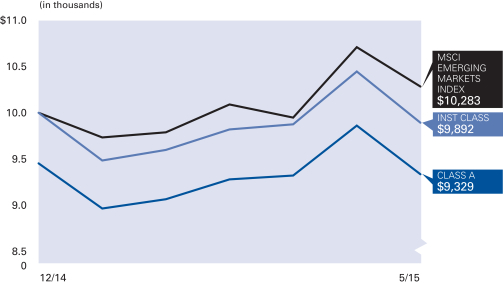
Country Allocation (as of May 31, 2015)
| China | 22.4% | |||
| Korea (Republic of) | 17.4% | |||
| Taiwan | 10.8% | |||
| India | 8.9% | |||
| South Africa | 6.5% | |||
| Brazil | 5.6% | |||
| Hong Kong | 4.2% | |||
| France | 3.9% | |||
| Other | 17.8% | |||
| Cash & Equivalents — Net | 2.5% |
| Shareholder Expense Example | Actual Performance | |||
| Class A | Institutional Class | |||
| Beginning Account Value (12/1/14) | $1,000.00 | $1,000.00 | ||
| Ending Account Value (5/31/15) | $987.30 | $989.30 | ||
| Expenses Paid During Period | $8.13 | $6.41 | ||
| Hypothetical Performance | ||||
| (5% return before expenses) | ||||
| Class A | Institutional Class | |||
| Beginning Account Value (12/1/14) | $1,000.00 | $1,000.00 | ||
| Ending Account Value (5/31/15) | $1,016.70 | $1,018.45 | ||
| Expenses Paid During Period | $8.30 | $6.54 | ||
The Fund commenced operations on December 1, 2014. The Actual expense example is based on the period since inception; the Hypothetical expense example is based on the period beginning December 1, 2014. If the Hypothetical expense example had been based on the period since inception, the Ending Account Value and Expenses Paid During Period would have been: $1,016.61 and $8.25, respectively, for Class A; and $1,018.35 and $6.51, respectively, for Institutional Class.
For each class of the Fund, expenses (net of fee waiver and reimbursement, if any) are equal to the annualized expense ratio for the class (1.65% for Class A and 1.30% for Institutional Class), multiplied by the average account value over the period, multiplied by 181/365 for the Actual expense example and 182/365 for the Hypothetical expense example.
| Semiannual Report | | May 31, 2015 | 57 |
Table of Contents
Unaudited
AllianzGI Emerging Markets Debt Fund
For the period of December 1, 2014 through May 31, 2015, as provided by Zeke Diwan, Portfolio Manager.
Fund Insights
For the reporting period ended May 31, 2015, Class A shares at NAV of the AllianzGI Emerging Markets Debt Fund (the “Fund”) returned 0.55%, outperforming the 40% JPM EMBI Global Diversified, 40% JPM CEMBI Broad Diversified, 20% JPM GBI Global EM Diversified Index (the “benchmark index”), which returned -0.55%.
Portfolio Review
Over the reporting period, the emerging markets hard currency sovereign debt universe posted a 0.89% return and hard currency corporate debt posted a 2.63% return. Relative to the US dollar, emerging markets local currencies dramatically underperformed, returning -9.42% for the period. Our weighting in local currencies throughout the reporting period averaged below 5%, whereas the blended benchmark index has a weighting of 20%. This contributed positively to our relative performance.
Throughout December 2014 and January 2015, the emerging market debt universe continued to be negatively impacted by a seasonal lack of liquidity, as well as the down-trade in commodity prices, in particular the continued sell-off in crude oil prices. Net oil exporters, including Venezuela, Russia, Nigeria, Iraq, Azerbaijan, Kazakhstan and Malaysia fared poorly. Negative risk sentiment was compounded by specific, idiosyncratic risks in benchmark index countries. Venezuela, impacted by oil, continues to fail to implement macro adjustments. The conflict between Russia and the Ukraine weighed on both economies, due to the Ukraine verging on default, and the embargo against Russia driving the economy into recession.
The corruption scandal at Petrobras in Brazil led to spread widening across Brazilian sovereign and corporate credits. Our portfolio was negatively impacted by holdings in Brazilian assets, including sovereign/quasi-sovereign names and exposure to OAS, a company implicated in the Petrobras ‘car wash’ investigation. Malaysia was also impacted by a corruption investigation of the state development bank.
The Fund was positioned favorably with over weights, primarily in oil importers, including India, Indonesia, Pakistan, Morocco and the Dominican Republic. These holdings saw positive gains as the market ultimately differentiated between oil importers and exporters, and improvements began to show in importers’ fiscal balance sheets. Holdings in KazMunayGas detracted from performance, and these holdings were paired during 1Q and early 2Q 2015. Holdings in PDVSA and Peru similarly came under pressure, contributing negatively to performance.
Political considerations played an important role in our positioning throughout the spring of 2015. The Fund avoided sovereign risk in Nigeria and Turkey in advance of Presidential elections, while underweighted positioning in Zambia yielded outperformance as the debt of these countries came under pressure. Conversely, we increased exposure in Argentine debt as the country heads to elections in the second half of this year and sentiment improves. The improved sentiment comes on the back of an anticipated regime change, subsequent economic reforms and a potential settlement with hold-out creditors on defaulted securities following elections.
Other improvements in idiosyncratic factors came into play in March 2015. Russia enacted a $50 billion repo facility in the markets, providing liquidity to banks, who, in turn, invested in sovereign and quasi-sovereign bonds, dramatically re-pricing the Russian secondary market. Our positioning in quasi-sovereign and corporate Russian credits benefited from strong relative gains as the market tightened.
Asian markets benefited from a number of factors. A majority of countries in the region are net oil importers, thus profiting from lower oil prices. Growth relative to the rest of emerging markets continues to be led by China, and an absence of net issuance in Central Europe and Latin America, due to the exclusion of Russia and Brazil from the primary markets, led to capital repositioning into Asia. Chinese property developers, a significant sector in the market, benefited from a 100 basis points reduction in the RRR by China’s central bank. Additionally, easing measures were announced that included reduction in the down-payment ratio and business tax on secondary house transactions, which improved sentiment in this investment area and thus benefitted holdings in our portfolio.
Sentiment continued to improve in emerging markets in April and May as oil prices stabilized around $60 per barrel. Tail-risks were reduced in Russia, as fighting in Eastern Ukraine lulled somewhat. Petrobras released audited financials, alleviating investors’ worst-case concerns, and followed with financing raises from Chinese investors as well as the issuance of a $2.5 billion hundred-year bond.
Performance Note
Our flexible approach to investment enables us to allocate across six defined alpha sub-strategies: the sovereign and quasi-sovereign, local currency, corporate credit, arbitrage, income and momentum strategies. Through dynamic management, we aim to allocate risk across these strategies within the portfolio in order to achieve maximized returns on a risk adjusted basis. While the blended benchmark index is offered for relative comparison, the Fund is managed on a total return rather than a benchmark index basis.
| 58 | May 31, 2015 | | Semiannual Report |
Table of Contents
Unaudited
AllianzGI Emerging Markets Debt Fund (cont’d)
Cumulative Return for the period ended May 31, 2015
| 6 Month* | Since Inception† | |||||||||
| AllianzGI Emerging Markets Debt Fund Class A | 0.55% | 0.01% | ||||||||
| AllianzGI Emerging Markets Debt Fund Class A (adjusted) | –3.22% | –3.74% | |||||||
| AllianzGI Emerging Markets Debt Fund Class C | 0.15% | –0.52% | ||||||||
| AllianzGI Emerging Markets Debt Fund Class C (adjusted) | –0.84% | –1.50% | |||||||
| AllianzGI Emerging Markets Debt Fund Class P | 0.63% | 0.09% | |||||||
| AllianzGI Emerging Markets Debt Fund Institutional Class | 0.69% | 0.22% | |||||||
| 40% JPM EMBI Global Div, 40% JPM CEMBI Broad Div, 20% JPM GBI Global EM Div | –0.55% | –0.29% | |||||||
† The Fund began operations on 9/15/14. Benchmark return comparisons began on the fund inception date. Lipper performance comparisons began on 9/30/14.
* Cumulative return
Performance quoted represents past performance and is no guarantee of future results. Current performance may be lower or higher than performance shown. For performance current to the most recent month-end, visit our website at us.allianzgi.com. Investment return and the principal value will fluctuate. Shares may be worth more or less than original cost when redeemed. The adjusted returns take into account the maximum initial sales charge of 3.75% on Class A shares and the contingent deferred sales charge (CDSC) of 1% on Class C shares, which may apply to shares redeemed during the first year of ownership. Returns do not reflect deduction of taxes that a shareholder would pay on fund distributions or redemption of fund shares. See pages 106 and 107 for more information. The Fund’s gross expense ratios are 2.10% for Class A shares, 2.84% for Class C shares, 1.87% for Class P shares and 1.84% for Institutional Class shares. These ratios do not include an expense reduction, contractually guaranteed through at least 3/31/16. The Fund’s expense ratios net of this reduction are 1.20% for Class A shares, 1.95% for Class C shares, 1.05% for Class P shares and 0.95% for Institutional Class shares. Expense ratio information is as of the Fund’s current prospectus dated April 1, 2015, as supplemented to date.
Cumulative Returns Through May 31, 2015
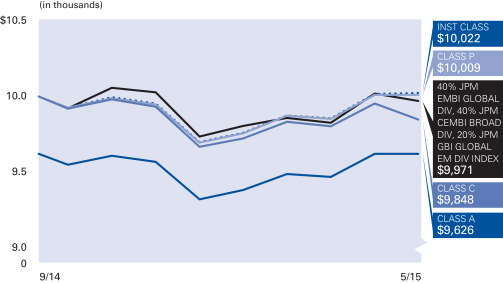
Country Allocation (as of May 31, 2015)
| Mexico | 8.3% | |||
| China | 7.6% | |||
| Brazil | 7.3% | |||
| South Africa | 5.5% | |||
| India | 4.8% | |||
| Indonesia | 4.7% | |||
| Russian Federation | 4.5% | |||
| Peru | 4.2% | |||
| Other | 50.2% | |||
| Cash & Equivalents — Net | 2.9% |
Moody’s Ratings* (as of May 31, 2015)
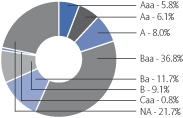
* As a percentage of total investments. Bond ratings refer to the underlying holdings of the Fund and are categorized from highest to lowest credit quality using ratings provided by Moody’s. Moody’s ratings have been selected for several reasons, including the access to information and materials provided by Moody’s, as well as the Fund’s consideration of industry practice. See “Important Information“ for more detail on the selection of Moody’s for the Fund’s ratings presentation. Bonds not rated by Moody’s and bonds that do not currently have a rating available are designated in the chart above as “NR“ and “NA”, respectively.
| Semiannual Report | | May 31, 2015 | 59 |
Table of Contents
Unaudited
AllianzGI Emerging Markets Debt Fund (cont’d)
| Shareholder Expense Example | Actual Performance | |||||||
| Class A | Class C | Class P | Institutional Class | |||||
| Beginning Account Value (12/1/14) | $1,000.00 | $1,000.00 | $1,000.00 | $1,000.00 | ||||
| Ending Account Value (5/31/15) | $1,005.50 | $1,001.50 | $1,006.30 | $1,006.90 | ||||
| Expenses Paid During Period | $6.20 | $9.93 | $5.45 | $4.95 | ||||
| Hypothetical Performance | ||||||||
| (5% return before expenses) | ||||||||
| Class A | Class C | Class P | Institutional Class | |||||
| Beginning Account Value (12/1/14) | $1,000.00 | $1,000.00 | $1,000.00 | $1,000.00 | ||||
| Ending Account Value (5/31/15) | $1,018.75 | $1,015.01 | $1,019.50 | $1,020.00 | ||||
| Expenses Paid During Period | $6.24 | $10.00 | $5.49 | $4.99 | ||||
For each class of the Fund, expenses (net of fee waiver and reimbursement, if any) are equal to the annualized expense ratio for the class (1.24% for Class A, 1.99% for Class C, 1.09% for Class P and 0.99% for Institutional Class), multiplied by the average account value over the period, multiplied by 182/365.
| 60 | May 31, 2015 | | Semiannual Report |
Table of Contents
(THIS PAGE INTENTIONALLY LEFT BLANK)
| Semiannual Report | | May 31, 2015 | 61 |
Table of Contents
Unaudited
AllianzGI Emerging Markets Small-Cap Fund
From inception on December 1, 2014 through May 31, 2015, as provided by Kunal Ghosh, Portfolio Manager.
Fund Insights
For the period from inception on December 1, 2014 through May 31, 2015, Class A shares at NAV of the AllianzGI Emerging Markets Small-Cap Fund (the “Fund”) returned 12.01%, outperforming the MSCI Emerging Markets Small Cap Index (the “benchmark index”), which returned 11.79%.
Market Environment
During the reporting period, emerging market equities experienced moderate levels of volatility due to changing investor sentiment. In December, equities were hampered by concerns of a strong dollar and the ensuing impact on non-US markets. At the start of the calendar year, this trend reversed, given the attractive growth and valuation mix of emerging market equities. Investors then focused on additional stimulus packages and a potentially accommodative US monetary policy which broadly boosted returns in April, particularly for pro-cyclical stocks, which were among the top benchmark index performers. Market performance reversed again in May as sentiment moderated.
During the reporting period, Chinese equities were among the best performers, benefitting from interest rate cuts and investor demand for local market shares. Other Asian countries, including Taiwan, the Philippines and South Korea, were also among the outperformers. Meanwhile, Greece was lower due to the potential impact from its financial calamity, while Latin American economies, including Brazil and Colombia, declined due to slowing growth in the region. Sectors were led by positive performance in information technology, industrials and health care, which were offset by declines in utilities, materials and telecommunications.
Performance driven by positive stock selection
The Fund benefitted from the vast inefficiencies in emerging market small-cap equities. Positive stock selection and allocation decisions at both the country and sector level contributed to performance during the reporting period.
Specifically, stockpicking in industrials added meaningfully to results due to selections in transportation infrastructure, airlines and construction & engineering industries, which benefitting from pro-cyclical demand. Bottom-up selections in consumer discretionary, financials and materials also proved advantageous. Conversely, stock selection in utilities and information technology lagged the benchmark index. From a country standpoint, overweight allocations and positive stockpicking in China and South Korea contributed to results, as did bottom-up selections in Brazil. Meanwhile, selections in Taiwan and Poland moderated results during the reporting period.
The largest individual active contributor to performance was China Southern Airlines, which rallied due to higher commercial airline traffic, thanks in part to a surge in Lunar New Year travel. Shares of Chinese transportation infrastructure company Xiamen International Port Co. Ltd. advanced due to government stimulus packages and positive investor sentiment. The largest active detractor for the reporting period was Polish electric utility Tauron Polska Energia SA, which was lower on concerns about earnings before interest, taxes, depreciation and amortization (“EBITDA”) margin declines. Shares of United Laboratories International declined for the quarter following Wall Street analyst’s concerns of moderation in sales growth and declining gross margins.
We believe investment results will be supported by earnings growth and that our behavioral finance-focused investment process and focus on higher quality securities with strong company fundamentals will be a driver of returns for the coming periods.
Cumulative Return for the period ended May 31, 2015
| Since Inception† | ||||||
| AllianzGI Emerging Markets Small-Cap Fund Class A | 12.01% | |||||
| AllianzGI Emerging Markets Small-Cap Fund Class A (adjusted) | 5.85% | ||||
| AllianzGI Emerging Markets Small-Cap Fund Institutional Class | 12.16% | ||||
| MSCI Emerging Markets Small Cap Index | 11.79% | ||||
| Lipper Emerging Markets Hard Currency Debt Funds Average | –1.07% | |||||
† The Fund began operations on 12/1/14. Benchmark return comparisons began on the fund inception date. Lipper performance comparisons began on 11/30/14.
Performance quoted represents past performance and is no guarantee of future results. Current performance may be lower or higher than performance shown. For performance current to the most recent month-end, visit our website at us.allianzgi.com. Investment return and the principal value will fluctuate. Shares may be worth more or less than original cost when redeemed. The adjusted returns take into account the maximum initial sales charge of 5.50% on Class A shares. Returns do not reflect deduction of taxes that a shareholder would pay on fund distributions or redemption of fund shares. See pages 106 and 107 for more information. The Fund’s gross expense ratios are 10.34% for Class A shares and 10.09% for Institutional Class shares. These ratios do not include an expense reduction, contractually guaranteed through at least 3/31/16. The Fund’s expense ratios net of this reduction are 1.85% for Class A shares and 1.50% for Institutional Class shares. Expense ratio information is as of the Fund’s current prospectus dated April 1, 2015, as supplemented to date.
| 62 | May 31, 2015 | | Semiannual Report |
Table of Contents
Unaudited
AllianzGI Emerging Markets Small-Cap Fund (cont’d)
Cumulative Returns Through May 31, 2015
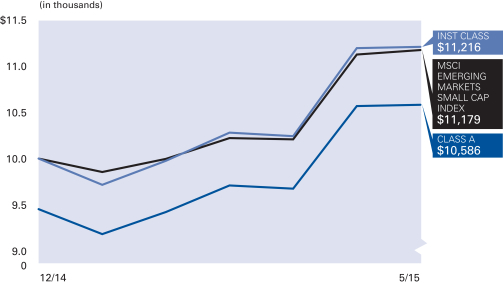
Country Allocation (as of May 31, 2015)
| Taiwan | 20.2% | |||
| Korea (Republic of) | 20.1% | |||
| China | 17.9% | |||
| South Africa | 8.5% | |||
| Hong Kong | 5.1% | |||
| Thailand | 4.4% | |||
| Poland | 3.8% | |||
| Malaysia | 2.8% | |||
| Other | 14.9% | |||
| Cash & Equivalents — Net | 2.3% |
| Shareholder Expense Example | Actual Performance | |||
| Class A | Institutional Class | |||
| Beginning Account Value (12/1/14) | $1,000.00 | $1,000.00 | ||
| Ending Account Value (5/31/15) | $1,120.10 | $1,121.60 | ||
| Expenses Paid During Period | $9.72 | $7.89 | ||
| Hypothetical Performance | ||||
| (5% return before expenses) | ||||
| Class A | Institutional Class | |||
| Beginning Account Value (12/1/14) | $1,000.00 | $1,000.00 | ||
| Ending Account Value (5/31/15) | $1,015.71 | $1,017.45 | ||
| Expenses Paid During Period | $9.30 | $7.54 | ||
The Fund commenced operations on December 1, 2014. The Actual expense example is based on the period since inception; the Hypothetical expense example is based on the period beginning December 1, 2014. If the Hypothetical expense example had been based on the period since inception, the Ending Account Value and Expenses Paid During Period would have been: $1,015.62 and $9.25, respectively, for Class A; and $1,017.36 and $7.50, respectively, for Institutional Class.
For each class of the Fund, expenses (net of fee waiver and reimbursement, if any) are equal to the annualized expense ratio for the class (1.85% for Class A and 1.50% for Institutional Class), multiplied by the average account value over the period, multiplied by 181/365 for the Actual expense example and 182/365 for the Hypothetical expense example.
| Semiannual Report | | May 31, 2015 | 63 |
Table of Contents
Unaudited
AllianzGI Europe Equity Dividend Fund
From inception on February 2, 2015 through May 31, 2015, as provided by Neil Dwane, CFA, and Joerg de Vries-Hippen, CFA, Co-Portfolio Managers.
Fund Insights
For the period from inception on February 2, 2015 through May 31, 2015, Class A shares at NAV of the AllianzGI Europe Equity Dividend Fund (the “Fund”) returned 1.80%, underperforming the MSCI Europe Total Return (NET) Index (the “benchmark index”), which returned 6.43%.
Market Environment
European companies posted absolute gains over the course of the reporting period. Smaller European companies registered the strongest gains, posting double-digit absolute gains.
The ECB’s launch of its Quantitative Easing (“QE”) program, the weak euro, improving euro-zone economic data, the more dovish-than-expected Fed meeting in March, the rate cut in China and the Minsk II ceasefire agreement all provided tailwinds for equity markets in the first quarter of 2015. Weakening economic data in the US and China, the lackluster US earnings season, the Swiss National Bank (“SNB”) scrapping the euro cap on the franc and the win of left-wing party Syriza in the Greek election temporarily put pressure on equity markets. Share prices vaulted to new all-time highs in May amid a wave of monetary easing from the world’s central banks. Policymakers in more than 20 countries have slashed borrowing costs in an effort to spur growth and fight weak—and in some cases negative—inflation. The ECB offered the biggest tailwind for equity markets. In January, the ECB announced the launch of its QE program of €60bn a month from March 2015 to September 2016, which began on March 9th. The ECB raised its 2015 GDP growth forecast for the euro zone from 1.0% to 1.5%. Against the backdrop of ECB’s QE program, global investors steadily increased their exposure to European equities. Towards the end of the reporting period worries over a deadlock in Greece’s attempts to strike a deal with its international creditors unsettled investors. Greece made a payment to the International Monetary Fund (“IMF”) in mid-May, but investors are worried that Greece might not be able to make the next payment due in early June. Market participants were also worried about the upcoming elections in the UK, however, the pro-business conservatives won a further five years in power. The sell-off in eurozone bond markets continued in the first half of May due to heavy debt supply, less pessimism about the eurozone economy and easing downward pressure on inflation.
Portfolio Review
Stock selection contributed negatively to the Fund’s active performance. Selection detracted most within the financials, utilities and health care sectors. Country structure detracted from active performance due to an overweight in the UK and an underweight in Switzerland, Denmark and the Netherlands. Sector structure was the main detractor from performance due to an overweight in the energy and utilities sectors and an underweight in the health care sector.
During the reporting period, the Fund’s largest overweights relative to the benchmark index were in the energy and telecom services sectors, while the largest underweights were in the health care sector followed by the materials sector. With regard to country exposure, the largest overweights were in the UK and Norway, while the largest underweights were in Switzerland and Germany.
The strongest stock contributors to performance were the positions in Nokian Renkaat (Finland), Drillisch (Germany) and Freenet (Germany), whilst the positions in Munich Re (Germany), Centrica (UK) and Total (France) were the largest detractors. Finnish tire producer Nokian Renkaat benefitted from a stabilization of the situation in Russia, which is an important market for the company. Drillisch, a German telecom-reseller, and Freenet, an internet and telecom services company, benefitted from a combination of good results, market consolidation and fading concerns about the companies’ market positions. Munich Re, the world’s leading re-insurance company, suffered from softer pricing within the sector. UK utility Centrica disappointed on results. In line with the other oil and gas companies, French integrated oil company Total was weighed down by a sideward move in the oil price.
Cumulative Return for the period ended May 31, 2015
| Since Inception† | ||||||
| AllianzGI Europe Equity Dividend Fund Class A | 1.80% | |||||
| AllianzGI Europe Equity Dividend Fund Class A (adjusted) | –3.80% | ||||
| AllianzGI Europe Equity Dividend Fund Class C | 1.60% | |||||
| AllianzGI Europe Equity Dividend Fund Class C (adjusted) | 0.60% | ||||
| AllianzGI Europe Equity Dividend Fund Class P | 1.87% | ||||
| AllianzGI Europe Equity Dividend Fund Institutional Class | 1.87% | ||||
| MSCI Europe Total Return (Net) Index | 6.43% | ||||
Lipper European Region Fund Average | 8.69% | |||||
† The Fund began operations on 2/2/15. Benchmark return comparisons began on the fund inception date. Lipper performance comparisons began on 1/31/15.
Performance quoted represents past performance and is no guarantee of future results. Current performance may be lower or higher than performance shown. For performance current to the most recent month-end, visit our website at us.allianzgi.com. Investment return and the principal value will fluctuate. Shares may be worth more or less than original cost when redeemed. The adjusted returns take into account the maximum initial sales charge of 5.50% on Class A shares and the contingent deferred sales charge (CDSC) of 1% on Class C shares, which may apply to shares redeemed during the first year of ownership. Returns do not reflect deduction of taxes that a shareholder would pay on fund distributions or redemption of fund shares. See pages 106 and 107 for more information. The Fund’s gross expense ratios are 10.59% for Class A shares, 11.34% for Class C shares, 10.44% for Class P shares and 10.34% for Institutional Class shares. These ratios do not include an expense reduction, contractually guaranteed through at least 3/31/16. The Fund’s expense ratios net of this reduction are 1.20% for Class A shares, 1.95% for Class C shares, 1.05% for Class P shares and 0.95% for Institutional Class shares. Expense ratio information is as of the Fund’s current prospectus dated April 1, 2015, as supplemented to date.
| 64 | May 31, 2015 | | Semiannual Report |
Table of Contents
Unaudited
AllianzGI Europe Equity Dividend Fund (cont’d)
Cumulative Returns Through May 31, 2015
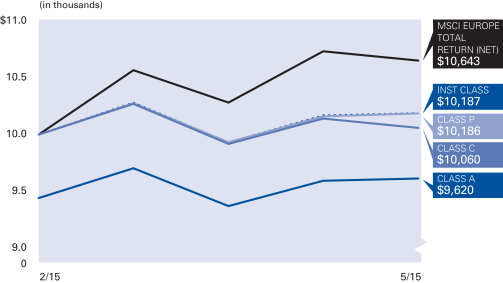
Country Allocation (as of May 31, 2015)
| United Kingdom | 38.7% | |||
| France | 14.7% | |||
| Germany | 8.7% | |||
| Norway | 6.4% | |||
| Spain | 5.7% | |||
| Sweden | 5.0% | |||
| Switzerland | 3.6% | |||
| Netherlands | 3.5% | |||
| Other | 9.8% | |||
| Cash & Equivalents-Net | 3.9% |
| Shareholder Expense Example | Actual Performance | |||||||
| Class A | Class C | Class P | Institutional Class | |||||
| Beginning Account Value (2/2/15) | $1,000.00 | $1,000.00 | $1,000.00 | $1,000.00 | ||||
| Ending Account Value (5/31/15) | $1,018.00 | $1,016.00 | $1,018.70 | $1,018.70 | ||||
| Expenses Paid During Period | $3.91 | $6.35 | $3.43 | $3.10 | ||||
| Hypothetical Performance | ||||||||
| (5% return before expenses) | ||||||||
| Class A | Class C | Class P | Institutional Class | |||||
| Beginning Account Value (12/1/14) | $1,000.00 | $1,000.00 | $1,000.00 | $1,000.00 | ||||
| Ending Account Value (5/31/15) | $1,018.95 | $1,015.21 | $1,019.70 | $1,020.19 | ||||
| Expenses Paid During Period | $6.04 | $9.80 | $5.29 | $4.78 | ||||
The Fund commenced operations on February 2, 2015. The Actual expense example is based on the period since inception; the Hypothetical expense example is based on the period beginning December 1, 2014. If the Hypothetical expense example had been based on the period since inception, the Ending Account Value and Expenses Paid During Period would have been: $1,012.28 and $3.90, respectively, for Class A; $1,009.86 and $6.34, respectively, for Class C; $1,012.77 and $3.42, respectively, for Class P; and $1,013.09 and $3.09, respectively, for Institutional Class.
For each class of the Fund, expenses (net of fee waiver and reimbursement, if any) are equal to the annualized expense ratio for the class (1.20% for Class A, 1.95% for Class C, 1.05% for Class P and 0.95% for Institutional Class), multiplied by the average account value over the period, multiplied by 118/365 for the Actual expense example and 182/365 for the Hypothetical expense example.
| Semiannual Report | | May 31, 2015 | 65 |
Table of Contents
Unaudited
AllianzGI Global Fundamental Strategy Fund
For the period of December 1, 2014 through May 31, 2015, as provided by Andreas Utermann, Portfolio Manager.
Fund Insights
For the period ended May 31, 2015, Class A shares at NAV of the AllianzGI Global Fundamental Strategy Fund (the “Fund”), returned 0.90%, outperforming the USD Overnight LIBOR, which returned 0.06%.
Market Environment
During this six-month period, global equity markets recovered well from their initial negative start. US markets were affected by the strong dollar, an economic slowdown in the first quarter of the year and are lagging almost every major stock market. As expected, the ECB introduced QE on March 9, 2015, which inflated European bond prices and drove yields down. This expansionary policy put extreme pressure on the euro and was compounded by the election success of the anti-austerity Syriza party in the Greek elections. Investors are still unsettled by the situation in Greece, although so far all payments to the IMF have been made on time.
Italy, Spain and France have all reported positive growth during the past six months, however, economic data from Germany in May was weak.
Portfolio Review
The Fund performed well during this period. Some investments proved to be very profitable and the sale of our holdings in the German real estate market returned a healthy profit. Other positive contributors were tech stocks and Italian government bonds. We continue to overwrite equity positions with derivatives—selling call positions in the Fund on various names like Amazon, Microsoft and Apple.
On the negative side, the oil, materials and cyclicals sectors had a difficult first half of the year and dragged performance down. Oil has recently begun to pick up again and our holdings showed double-digit returns in April.
During the reporting period, emerging markets local currency bonds did not contribute as strongly to performance as in the previous period. Though emerging markets bonds and currencies are not performing well in the current low-rate environment, they are still attractive for long-term investors. Nominal returns seem attractive and many local currencies are undervalued.
At the close of the reporting period, the Fund held approximately 49% of the portfolio in fixed income securities, 36% in equities and the remaining holdings in cash and derivatives.
We continue to believe that emerging markets will turn around this year, as we believe there are signs of the early stages of recovery in some countries. We have been wary of government bonds and duration and this position is being vindicated. Having a reasonably short duration position did not have a negative impact on our return-oriented fund. We continue to maintain our stance that emerging markets and cyclical equities are valuable investments within the context of a recovering global economy. Although these holdings are currently lagging other asset classes, we believe that they will satisfy our minimum yield and risk criteria over the mid to longer term. The strength of the USD is likely to re-distribute global growth. The US is already showing signs of a weakening economy, while Europe is making strong advances on the back of a weaker euro. We believe it is likely that the emerging markets will benefit from currency depreciation at some point later in the cycle.
Average Annual Total Return for the period ended May 31, 2015
| 6 Month* | 1 Year | Since Inception† | ||||||||||||
| AllianzGI Global Fundamental Strategy Fund Class A | 0.90% | 0.03% | 4.38% | |||||||||||
| AllianzGI Global Fundamental Strategy Fund Class A (adjusted) | –4.65% | –5.47% | 1.34% | ||||||||||
| AllianzGI Global Fundamental Strategy Fund Class C | 0.48% | –0.77% | 3.57% | |||||||||||
| AllianzGI Global Fundamental Strategy Fund Class C (adjusted) | –0.50% | –1.74% | 3.57% | ||||||||||
| AllianzGI Global Fundamental Strategy Fund Class D | 0.88% | 0.01% | 4.37% | ||||||||||
| AllianzGI Global Fundamental Strategy Fund Class P | 0.88% | 0.13% | 4.51% | ||||||||||
| AllianzGI Global Fundamental Strategy Fund Institutional Class | 0.99% | 0.24% | 4.63% | ||||||||||
| USD Overnight LIBOR | 0.06% | 0.11% | 0.10% | ||||||||||
| 70% MSCI ACWI/30% Barclays Global Aggregate Index | 1.19% | 1.69% | 8.90% | ||||||||||
| USD Overnight LIBOR + 4% | 2.10% | 4.24% | 4.24% | ||||||||||
| Lipper Absolute Return Funds Average | 1.29% | 2.19% | 3.29% | |||||||||||
† The Fund began operations on 7/1/13. Benchmark return comparisons began on the fund inception date. Lipper performance comparisons began on 6/30/13.
* Cumulative return
Performance quoted represents past performance and is no guarantee of future results. Current performance may be lower or higher than performance shown. For performance current to the most recent month-end, visit our website at us.allianzgi.com. Investment return and the principal value will fluctuate. Shares may be worth more or less than original cost when redeemed. The adjusted returns take into account the maximum initial sales charge of 5.50% on Class A shares and the contingent deferred sales charge (CDSC) of 1% on Class C shares, which may apply to shares redeemed during the first year of ownership. Returns do not reflect deduction of taxes that a shareholder would pay on fund distributions or redemption of fund shares. See pages 106 and 107 for more information. The Fund’s gross expense ratios are 2.36% for Class A shares, 3.14% for Class C shares, 2.95% for Class D shares, 2.14% for Class P shares and 2.15% for Institutional Class shares. These ratios do not include an expense reduction, contractually guaranteed through at least 3/31/16. The Fund’s expense ratios net of this reduction are 1.25% for Class A shares, 2.00% for Class C shares, 1.25% for Class D shares, 1.10% for Class P shares and 1.00% for Institutional Class shares. Expense ratio information is as of the Fund’s current prospectus dated April 1, 2015, as supplemented to date.
| 66 | May 31, 2015 | | Semiannual Report |
Table of Contents
Unaudited
AllianzGI Global Fundamental Strategy Fund (cont’d)
Cumulative Returns Through May 31, 2015
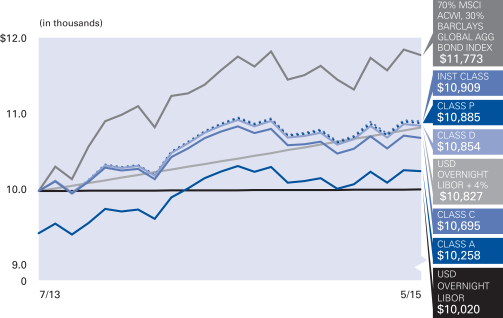
Country Allocation (as of May 31, 2015)
| United States | 22.7% | |||
| Supranational | 8.9% | |||
| Germany | 8.1% | |||
| Italy | 5.5% | |||
| Switzerland | 4.8% | |||
| United Kingdom | 4.5% | |||
| Indonesia | 3.6% | |||
| Mexico | 3.3% | |||
| Other | 22.8% | |||
| Cash & Equivalents — Net (including Options Purchased and Written) | 15.8% |
Moody’s Ratings* (as of May 31, 2015)
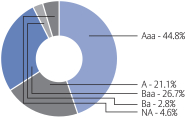
* As a percentage of fixed-income investments. Bond ratings refer to the underlying holdings of the Fund and are categorized from highest to lowest credit quality using ratings provided by Moody’s. Moody’s ratings have been selected for several reasons, including the access to information and materials provided by Moody’s, as well as the Fund’s consideration of industry practice. See “Important Information” for more detail on the selection of Moody’s for the Fund’s ratings presentation. Bonds not rated by Moody’s and bonds that do not currently have a rating available are designated in the chart above as “NR” and “NA”, respectively.
| Shareholder Expense Example | Actual Performance | |||||||||
| Class A | Class C | Class D | Class P | Institutional Class | ||||||
| Beginning Account Value (12/1/14) | $1,000.00 | $1,000.00 | $1,000.00 | $1,000.00 | $1,000.00 | |||||
| Ending Account Value (5/31/15) | $1,009.00 | $1,004.80 | $1,008.80 | $1,008.80 | $1,009.90 | |||||
| Expenses Paid During Period | $6.26 | $10.00 | $6.26 | $5.51 | $5.01 | |||||
| Hypothetical Performance | ||||||||||
| (5% return before expenses) | ||||||||||
| Class A | Class C | Class D | Class P | Institutional Class | ||||||
| Beginning Account Value (12/1/14) | $1,000.00 | $1,000.00 | $1,000.00 | $1,000.00 | $1,000.00 | |||||
| Ending Account Value (5/31/15) | $1,018.70 | $1,014.96 | $1,018.70 | $1,019.45 | $1,019.95 | |||||
| Expenses Paid During Period | $6.29 | $10.05 | $6.29 | $5.54 | $5.04 | |||||
For each class of the Fund, expenses (net of fee waiver and reimbursement, if any) are equal to the annualized expense ratio for the class (1.25% for Class A, 2.00% for Class C, 1.25% for Class D, 1.10% for Class P and 1.00% for Institutional Class), multiplied by the average account value over the period, multiplied by 182/365.
| Semiannual Report | | May 31, 2015 | 67 |
Table of Contents
Unaudited
AllianzGI Global Managed Volatility Fund
For the period from December 1, 2014 to May 31, 2015, as provided by Steve Tael, Ph.D., CFA, Portfolio Manager.
Fund Insights
For the reporting period ended May 31, 2015, Class A shares at NAV of the AllianzGI Global Managed Volatility Fund (the “Fund”) returned 0.32%, underperforming the MSCI World Index (the “benchmark index”), which returned 3.38%.
Market Environment
During the reporting period, developed market stocks advanced as investors weighed the eventual Fed interest rate hike with the ECB’s and the Bank of Japan’s (“BOJ”) continued quantitative easing (“QE”) policies.
The continuation of QE in Japan led equities in that market to be the star benchmark index performers. Countries composing smaller benchmark index weights, including Denmark and Israel, also performed well for the benchmark index. The United States, which represents the largest weight in the benchmark index, performed near the middle of the pack in terms of returns. Canadian and Spanish equities in the benchmark index trailed the broader benchmark index.
Sector performance was mostly positive for the period. The health care and consumer discretionary sectors contributed positively to the benchmark index, while the energy and utilities sectors were the only two to contribute negatively to benchmark index performance.
We anticipate continued “risk on/risk off” periods for the foreseeable future, as volatility and market risk remain given divergences in the global macroeconomic environment. As in previous periods, we anticipate that macro events will likely continue to have significant influence on equity markets.
Portfolio Review
The managed volatility investment process takes advantage of the fact that stocks can have complementary risk characteristics, and creates a portfolio with lower expected risk than the benchmark index over time. Our expectation is that this lower risk profile will result in outperformance over time by minimizing the impact of market downturns and allowing our clients to benefit through the role of compounding.
An important driver of the Fund’s performance relative to the benchmark index was country selection. The Fund’s underweight in Japan and overweight in Canada, relative to the benchmark index, were negative contributors to the Fund’s performance. The Fund was underweight Japanese equities during a period of significant policy stimulus and positive performance of Japanese equities overall. With regards to Canadian equities, the oil and gas and financial services industries account for a significant portion of the Canadian equity market capitalization. The rapid fall of oil and gas prices and an indebted Canadian consumer dragged down the performance of Canadian equities. The Fund’s underweight in United Kingdom equities relative to the benchmark index was a positive contributor to the Fund’s performance. The run up to the May 2015 general election generated significant uncertainty over whether a single party would have a clear majority to govern.
Average Annual Total Return for the period ended May 31, 2015
| 6 Month* | 1 Year | Since Inception† | ||||||||||||
| AllianzGI Global Managed Volatility Fund Class A | 0.32% | 5.19% | 10.10% | |||||||||||
| AllianzGI Global Managed Volatility Fund Class A (adjusted) | –5.19% | -0.59% | 8.31% | ||||||||||
| AllianzGI Global Managed Volatility Fund Class C | 0.03% | 4.53% | 9.33% | |||||||||||
| AllianzGI Global Managed Volatility Fund Class C (adjusted) | –0.87% | 3.60% | 9.33% | ||||||||||
| AllianzGI Global Managed Volatility Fund Class D | 0.31% | 5.17% | 10.11% | ||||||||||
| AllianzGI Global Managed Volatility Fund Class P | 0.42% | 5.43% | 10.37% | ||||||||||
| AllianzGI Global Managed Volatility Fund Institutional Class | 0.50% | 5.52% | 10.46% | ||||||||||
| MSCI World Index | 3.38% | 5.70% | 16.37% | ||||||||||
| MSCI World Minimum Volatility Index | 4.00% | 10.50% | 13.40% | ||||||||||
| Lipper Global Multi-Cap Value Funds Average | 2.96% | 2.21% | 12.75% | |||||||||||
† The Fund began operations on 12/19/11. Benchmark return comparisons began on the fund inception date. Lipper performance comparisons began on 12/31/11.
* Cumulative return
Performance quoted represents past performance and is no guarantee of future results. Current performance may be lower or higher than performance shown. For performance current to the most recent month-end, visit our website at us.allianzgi.com. Investment return and the principal value will fluctuate. Shares may be worth more or less than original cost when redeemed. The adjusted returns take into account the maximum initial sales charge of 5.50% on Class A shares and the contingent deferred sales charge (CDSC) of 1% on Class C shares, which may apply to shares redeemed during the first year of ownership. Returns do not reflect deduction of taxes that a shareholder would pay on fund distributions or redemption of fund shares. See pages 106 and 107 for more information. The Fund’s gross expense ratios are 2.68% for Class A shares, 3.39% for Class C shares, 2.79% for Class D shares, 2.38% for Class P shares and 2.30% for Institutional Class shares. These ratios do not include an expense reduction, contractually guaranteed through at least 3/31/16. The Fund’s expense ratios net of this reduction are 1.02% for Class A shares, 1.71% for Class C shares, 0.98% for Class D shares, 0.78% for Class P shares and 0.69% for Institutional Class shares. Expense ratio information is as of the Fund’s current prospectus dated April 1, 2015, as supplemented to date.
| 68 | May 31, 2015 | | Semiannual Report |
Table of Contents
Unaudited
AllianzGI Global Managed Volatility Fund (cont’d)
Cumulative Returns Through May 31, 2015
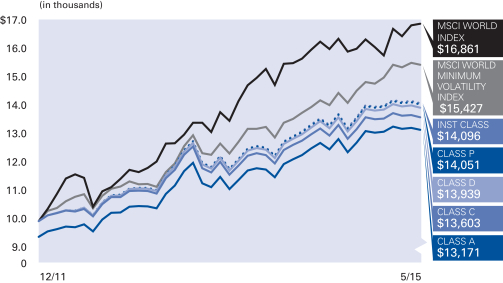
Country Allocation (as of May 31, 2015)
| United States | 58.0% | |||
| Canada | 9.4% | |||
| Japan | 5.4% | |||
| Hong Kong | 4.0% | |||
| Singapore | 3.9% | |||
| Australia | 3.4% | |||
| Germany | 3.2% | |||
| Israel | 2.5% | |||
| Other | 6.2% | |||
| Cash & Equivalents – Net | 4.0% |
| Shareholder Expense Example | Actual Performance | |||||||||
| Class A | Class C | Class D | Class P | Institutional Class | ||||||
| Beginning Account Value (12/1/14) | $1,000.00 | $1,000.00 | $1,000.00 | $1,000.00 | $1,000.00 | |||||
| Ending Account Value (5/31/15) | $1,003.20 | $1,000.30 | $1,003.10 | $1,004.20 | $1,005.00 | |||||
| Expenses Paid During Period | $4.74 | $8.13 | $4.64 | $3.50 | $3.00 | |||||
| Hypothetical Performance | ||||||||||
| (5% return before expenses) | ||||||||||
| Class A | Class C | Class D | Class P | Institutional Class | ||||||
| Beginning Account Value (12/1/14) | $1,000.00 | $1,000.00 | $1,000.00 | $1,000.00 | $1,000.00 | |||||
| Ending Account Value (5/31/15) | $1,020.19 | $1,016.80 | $1,020.29 | $1,021.44 | $1,021.94 | |||||
| Expenses Paid During Period | $4.78 | $8.20 | $4.68 | $3.53 | $3.02 | |||||
For each class of the Fund, expenses (net of fee waiver and reimbursement, if any) are equal to the annualized expense ratio for the class (0.95% for Class A, 1.63% for Class C, 0.93% for Class D, 0.70% for Class P and 0.60% for Institutional Class), multiplied by the average account value over the period, multiplied by 182/365.
| Semiannual Report | | May 31, 2015 | 69 |
Table of Contents
Unaudited
AllianzGI Global Sustainability Fund
From inception on December 9, 2014 through May 31, 2015, as provided by Paul Schofield, Portfolio Manager.
Fund Insights
For the period from inception on December 9, 2014 through May 31, 2015, Class A shares at NAV of the AllianzGI Global Sustainability Fund (the “Fund”) returned 3.87%, underperforming the MSCI AC World Index (the “benchmark index”), which returned 4.45%.
Market Environment
Global equities continued to post modest gains, underpinned by accommodative monetary policies, particularly in Europe and Japan. Uncertainty over the timing of a Fed interest rate hike remained. Nevertheless, in April, bond markets began to sell off in the US and Europe. Among developed markets, Japan led the way higher, followed by the Eurozone. In emerging markets China outperformed.
In the US, weak first quarter corporate earnings announcements initially weighed on equities, but they soon recovered as the weakness was mainly due to the stronger dollar and lower oil prices. April industrial production declined for the fifth consecutive month and retail sales once again disappointed. However, the labor market remained buoyant with 223,000 new jobs created in April and the unemployment rate fell to a seven year low of 5.4%. Core consumer price inflation rose 0.3% month-on-month, increasing the odds that the Fed will raise interest rates later this year.
In Europe, euro-zone first quarter GDP was mixed. Germany’s disappointing growth of 0.3% quarter-on-quarter was offset by better-than-expected growth from France and Italy. The ECB boosted sentiments by announcing its frontload bond purchases, due to low market liquidity in the summer months. However, the ongoing stalemate between Greece and its international creditors to restructure its debt obligations was an ongoing concern.
In Japan, the Nikkei 225 Index reached a 15-year high, aided by positive macroeconomic indicators and solid earnings announcements. Equity markets in China continued to move higher, although volatility increased due to concerns that the liquidity-fueled buying frenzy was creating a bubble.
Portfolio Review
Stock selection was positive in the consumer staples, consumer discretionary and energy sectors. An underweight in the utilities sector and an overweight in the health care sector also contributed positively, while stock selection in the financials and health care sectors detracted. From a country stock selection perspective, Spain and the UK were positive contributors, while stockpicking in Japan detracted.
Starbucks was the top contributor for the second quarter of the 2015 fiscal year, as earnings per share rose 18% year-on-year, driven by strong same-store-sales growth of 7% globally. The company continues to have multiple growth opportunities in the times ahead. The roll out of their mobile “order and pay” feature is proceeding smoothly and Starbucks aims to double food revenue to over $4 billion over the next five years. The company also has a target of doubling its store count in China by 2019.
American Express was the top detractor. The company lost a major US corporate customer which will present a short-term headwind but we believe the company continues to be well-positioned in the longer term. The card payments market remains robust and first quarter 2015 results showed a 7% increase in card spending (in constant currency). In addition, we believe the American Express brand and closed loop network have major competitive advantages and the company has good management with a deep bench.
Outlook
The ongoing rise in asset prices continues unabated, supported by abundant liquidity and the receding concerns over the pace, size and impact of the Fed’s tightening. This steady build-up in valuations is occurring against a backdrop of uncertainty over the strength of the global economy, weak earnings growth, and significant political noise and rising concerns over central banks’ exit strategies from quantitative easing. In short, some caution is warranted. If interest rates eventually rise as a result of improving global economic momentum, we believe markets are likely to grow into current valuations through higher corporate earnings. We believe that this implies that market gains over the near term are likely to be muted and active management is required to augment returns.
Cumulative Return for the period ended May 31, 2015
| Since Inception† | ||||||
| AllianzGI Global Sustainability Fund Class A | 3.87% | |||||
| AllianzGI Global Sustainability Fund Class A (adjusted) | –1.85% | ||||
| AllianzGI Global Sustainability Fund Class P | 3.93% | ||||
| AllianzGI Global Sustainability Fund Institutional Class | 4.00% | ||||
| MSCI AC World Index | 4.45% | ||||
| Dow Jones Sustainability World Total Return Index | 2.05% | ||||
| Lipper Global Multi-Cap Growth Fund Average | 4.44% | |||||
† The Fund began operations on 12/9/14. Benchmark return comparisons began on the fund inception date. Lipper performance comparisons began on 11/30/14.
Performance quoted represents past performance and is no guarantee of future results. Current performance may be lower or higher than performance shown. For performance current to the most recent month-end, visit our website at us.allianzgi.com. Investment return and the principal value will fluctuate. Shares may be worth more or less than original cost when redeemed. The adjusted returns take into account the maximum initial sales charge of 5.50% on Class A shares. Returns do not reflect deduction of taxes that a shareholder would pay on fund distributions or redemption of fund shares. See pages 106 and 107 for more information. The Fund’s gross expense ratios are 10.02% for Class A shares, 9.87% for Class P shares and 9.77% for Institutional Class shares. These ratios do not include an expense reduction, contractually guaranteed through at least 3/31/16. The Fund’s expense ratios net of this reduction are 1.20% for Class A shares, 1.05% for Class P shares and 0.95% for Institutional Class shares. Expense ratio information is as of the Fund’s current prospectus dated April 1, 2015, as supplemented to date.
| 70 | May 31, 2015 | | Semiannual Report |
Table of Contents
Unaudited
AllianzGI Global Sustainability Fund (cont’d)
Cumulative Returns Through May 31, 2015
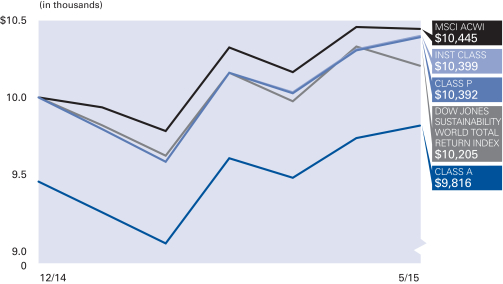
Country Allocation (as of May 31, 2015)
| United States | 44.0% | |||
| United Kingdom | 14.7% | |||
| Germany | 7.3% | |||
| Switzerland | 5.8% | |||
| Japan | 4.1% | |||
| Spain | 4.0% | |||
| Sweden | 3.5% | |||
| Australia | 3.4% | |||
| Other | 8.7% | |||
| Cash & Equivalents — Net | 4.5% |
| Shareholder Expense Example | Actual Performance | |||||
| Class A | Class P | Institutional Class | ||||
| Beginning Account Value (12/9/14) | $1,000.00 | $1,000.00 | $1,000.00 | |||
| Ending Account Value (5/31/15) | $1,038.70 | $1,039.30 | $1,040.00 | |||
| Expenses Paid During Period | $5.80 | $5.07 | $4.59 | |||
| Hypothetical Performance | ||||||
| (5% return before expenses) | ||||||
| Class A | Class P | Institutional Class | ||||
| Beginning Account Value (12/1/14) | $1,000.00 | $1,000.00 | $1,000.00 | |||
| Ending Account Value (5/31/15) | $1,018.95 | $1,019.70 | $1,020.19 | |||
| Expenses Paid During Period | $6.04 | $5.29 | $4.78 | |||
The Fund commenced operations on December 9, 2014. The Actual expense example is based on the period since inception; the Hypothetical expense example is based on the period beginning December 1, 2014. If the Hypothetical expense example had been based on the period since inception, the Ending Account Value and Expenses Paid During Period would have been: $1,018.01 and $5.74, respectively, for Class A; $1,018.72 and $5.02, respectively, for Class P; and $1,019.20 and $4.55, respectively, for Institutional Class.
For each class of the Fund, expenses (net of fee waiver and reimbursement, if any) are equal to the annualized expense ratio for the class (1.20% for Class A, 1.05% for Class P and 0.95% for Institutional Class), multiplied by the average account value over the period, multiplied by 173/365 for the Actual expense example and 182/365 for the Hypothetical expense example.
| Semiannual Report | | May 31, 2015 | 71 |
Table of Contents
Unaudited
AllianzGI Global Water Fund
For the period from December 1, 2014 through May 31, 2015, as provided by Andreas Fruschki, CFA, Portfolio Manager.
Fund Insights
For the reporting period ended May 31, 2015, Class A shares at NAV of the AllianzGI Global Water Fund (the “Fund”) returned 4.57%, outperforming the S&P Global Water Index (the “benchmark index”), which returned 4.55%.
Portfolio Review
The performance of water-related stocks as measured by the benchmark index’s absolute performance was strong over the period and the Fund outperformed the benchmark index, the S&P 500 Index and the MSCI AC World Index.
The best performing stocks during the period included Georg Fischer and Uponor, both leaders in modern light-weight water pipes, and Beijing Enterprises Water, a company actively working to improve China’s water quality.
Stocks that detracted from performance for the period included those active in water technology, such as Franklin Electric, Xylem, Watts Water, Arcadis and Mueller Water. The fight against water shortages and the increase in droughts has made investments in water infrastructure high on the list of priorities. Meanwhile, the demand for water technology products from clients in oil and gas or mining exploration has declined recently, due to the depressed prices of oil. Global growth is still too low to encourage investments in new projects of any kind, leading to the diminishing demand for water pumps, pipes and services.
On the positive side, after many years of austerity, we are beginning to see encouraging signs of increases in funding for public infrastructure that targets water supply. Brazil and China have both announced large infrastructure plans, California is aiming to invest in water supply and water efficiency programs and Europe’s slow recovery should also allow for more public funding.
Water M&A continues to be an active theme as companies—such as Danaher acquiring Pall Corp, a leader in water filtration (both owned in the Fund)—try to participate in the structural attractiveness of water technology. We expect consolidation to continue in the still fragmented water industry.
Outlook
We expect investments in water infrastructure to continue to accelerate as municipalities stop postponing investments needed to address the further deterioration of the existing networks in the US and Europe. Core holdings of the Fund remain the leading water pump companies and companies with differentiated products needed for water infrastructure operations. We continue to focus on bottom-up stock-picking, as well as screening for the leading players along the water supply chain with products to enhance water supply, improve water efficiency or water quality.
Due to further urbanization, increased farmland irrigation needs and higher per capita consumption preferences, water demand continues to rise. We expect increased water prices as well as an increase in the attractiveness of investments in products that enhance water efficiency or water supply availability.
Average Annual Total Return for the period ended May 31, 2015
| 6 Month* | 1 Year | 5 Year | Since Inception† | |||||||||||||||
| AllianzGI Global Water Fund Class A | 4.57% | 0.46% | 12.98% | 4.76% | ||||||||||||||
| AllianzGI Global Water Fund Class A (adjusted) | –1.18% | –5.06% | 11.71% | 3.94% | |||||||||||||
| AllianzGI Global Water Fund Class C | 4.14% | –0.31% | 12.12% | 3.97% | ||||||||||||||
| AllianzGI Global Water Fund Class C (adjusted) | 3.14% | –1.31% | 12.12% | 3.97% | |||||||||||||
| AllianzGI Global Water Fund Class D | 4.53% | 0.40% | 12.94% | 4.71% | |||||||||||||
| AllianzGI Global Water Fund Class P | 4.66% | 0.73% | 13.24% | 5.00% | |||||||||||||
| AllianzGI Global Water Fund Institutional Class | 4.73% | 0.74% | 13.37% | 5.09% | |||||||||||||
| MSCI AC World Index | 3.11% | 5.08% | 11.76% | 4.79% | |||||||||||||
| S&P Global Water Index | 4.55% | 1.99% | 14.80% | 6.94% | |||||||||||||
| Lipper Global Natural Resources Funds Average | –0.79% | –17.43% | 1.75% | –3.82% | ||||||||||||||
† The Fund began operations on 3/31/08. Benchmark return comparisons began on the fund inception date. Lipper performance comparisons began on 3/31/08.
* Cumulative return
Performance quoted represents past performance and is no guarantee of future results. Current performance may be lower or higher than performance shown. For performance current to the most recent month-end, visit our website at us.allianzgi.com. Investment return and the principal value will fluctuate. Shares may be worth more or less than original cost when redeemed. The adjusted returns take into account the maximum initial sales charge of 5.50% on Class A shares and the contingent deferred sales charge (CDSC) of 1% on Class C shares, which may apply to shares redeemed during the first year of ownership. Returns do not reflect deduction of taxes that a shareholder would pay on fund distributions or redemption of fund shares. See pages 106 and 107 for more information. The Fund’s expense ratios are 1.46% for Class A shares, 2.22% for Class C shares, 1.49% for Class D shares, 1.21% for Class P shares and 1.15% for Institutional Class shares. Expense ratio information is as of the Fund’s current prospectus dated April 1, 2015, as supplemented to date.
| 72 | May 31, 2015 | | Semiannual Report |
Table of Contents
Unaudited
AllianzGI Global Water Fund (cont’d)
Cumulative Returns Through May 31, 2015
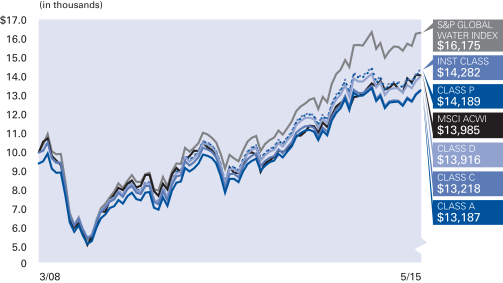
Country Allocation (as of May 31, 2015)
United States | 39.6% | |||
United Kingdom | 12.3% | |||
Switzerland | 8.6% | |||
France | 5.2% | |||
Hong Kong | 4.7% | |||
China | 4.4% | |||
Japan | 3.9% | |||
Germany | 3.9% | |||
Other | 10.5% | |||
Cash & Equivalents — Net | 6.9% |
| Shareholder Expense Example | Actual Performance | |||||||||
| Class A | Class C | Class D | Class P | Institutional Class | ||||||
| Beginning Account Value (12/1/14) | $1,000.00 | $1,000.00 | $1,000.00 | $1,000.00 | $1,000.00 | |||||
| Ending Account Value (5/31/15) | $1,045.70 | $1,041.40 | $1,045.30 | $1,046.60 | $1,047.30 | |||||
| Expenses Paid During Period | $7.29 | $11.25 | $7.55 | $6.12 | $5.77 | |||||
| Hypothetical Performance | ||||||||||
| (5% return before expenses) | ||||||||||
| Class A | Class C | Class D | Class P | Institutional Class | ||||||
| Beginning Account Value (12/1/14) | $1,000.00 | $1,000.00 | $1,000.00 | $1,000.00 | $1,000.00 | |||||
| Ending Account Value (5/31/15) | $1,017.80 | $1,013.91 | $1,017.55 | $1,018.95 | $1,019.30 | |||||
| Expenses Paid During Period | $7.19 | $11.10 | $7.44 | $6.04 | $5.69 | |||||
For each class of the Fund, expenses are equal to the annualized expense ratio for the class (1.43% for Class A, 2.21% for Class C, 1.48% for Class D, 1.20% for Class P and 1.13% for Institutional Class), multiplied by the average account value over the period, multiplied by 182/365.
| Semiannual Report | | May 31, 2015 | 73 |
Table of Contents
Unaudited
AllianzGI High Yield Bond Fund
For the period of December 1, 2014 through May 31, 2015, as provided by Doug Forsyth, CFA, Portfolio Manager.
Fund Insights
For the reporting period ended May 31, 2015, Class A shares at NAV of the AllianzGI High Yield Bond Fund (the “Fund”) returned 2.25%, underperforming the BofA Merrill Lynch High Yield Master II Index (the “benchmark index”), which returned 2.55%.
Market Environment
In the beginning of the reporting period, there were several factors that influenced the high-yield market. Investors digested non-earnings-related influences, including the strengthening US dollar, harsh winter weather conditions that plagued the Northeast and the West Coast port shutdown. The impact of these factors was to be accepted as short-lived, since they should not affect the positive financial condition of the core credit market. Energy prices continued to have an effect on the prices of high-yield energy issuers and the day-to-day volatility remained a challenge. Market participants, however, did a better job of isolating the commodity-price impact to those relevant issuers than was the case in the second half of 2014. Although prices moved lower overall among issuers in the energy industry, specifically among those in the exploration and production space, many issuers executed capital-market transactions. These transactions, both in new financing and in merger and acquisition activity, solidified balance sheets and extended the liquidity runway. Treasury-rate volatility remained a factor and the impact on the high-yield market was mixed. In addition, indicators generally pointed to a US economy that is slowly grinding higher. The data was arguably mixed, but the overall neutral to higher economic trends confirms the prospects for a continued low default rate for high-yield bonds. Finally, global central banks continued to be generally accommodative, and the Fed governors’ comments have maintained a dovish stance.
In the final months of the period, high-yield bonds continued to move higher and advanced alongside stocks, while providing diversification benefits as yields rose for US government bonds and US investment grade corporate bonds. The asset class proved resilient in the face of rising rates and increased volatility in the treasury market. The high-yield market was aided by strength in energy issuers, which traded up concurrent with the rise in the price of crude oil. In addition, a better-than-feared start to the first-quarter earnings season had a positive impact on investor sentiment. Finally, mixed US economic data reinforced the message that the Fed would remain “patient” and the rate hike cycle would be gradual—a positive for risk assets.
Portfolio Review
The Fund gained along with the market for the six-month period but performance lagged the benchmark index return. In the beginning of the reporting period, BB rated bonds outperformed the lower-quality credit categories as lower-coupon, tighter-spread issues benefited from declining US treasury yields. Consequently, the portfolio was held back by an underweight in these issues. Conversely, the environment toward the end of the reporting period set up well for the portfolio’s positioning as the 10-year treasury sold off and yields increased. A higher-than-benchmark index weight in B rated issues, which outperformed the BB and CCC rated credit categories, had a positive impact on relative performance.
Industry allocations that helped relative performance during the period included metals/mining ex steel, health care and telecom-wireline integrated and services. An underweight in metals/mining ex steel, which trailed the overall market, was a positive impact on relative performance. Positive security selection in the health care and telecom-wireline integrated and services industries also beneficial.
Industry allocations that detracted from relative performance during the period included diversified media, diversified financial services and capital goods. All three of the aforementioned industries exhibited weaker-than-peer performance.
Average Annual Total Return for the period ended May 31, 2015
| 6 Month* | 1 Year | 5 Year | 10 Year | Since Inception† | ||||||||||||||||||
AllianzGI High Yield Bond Fund Class A | 2.25% | 0.42% | 8.28% | 7.46% | 7.74% | |||||||||||||||||
| AllianzGI High Yield Bond Fund Class A (adjusted) | –1.59% | –3.34% | 7.46% | 7.05% | 7.53% | ||||||||||||||||
AllianzGI High Yield Bond Fund Class C | 1.99% | –0.18% | 7.53% | 6.69% | 6.96% | |||||||||||||||||
| AllianzGI High Yield Bond Fund Class C (adjusted) | 1.00% | –1.13% | 7.53% | 6.69% | 6.96% | ||||||||||||||||
| AllianzGI High Yield Bond Fund Class D | 2.31% | 0.44% | 8.26% | 7.45% | 7.74% | ||||||||||||||||
| AllianzGI High Yield Bond Fund Class R | 2.09% | –0.12% | 7.97% | 7.17% | 7.46% | ||||||||||||||||
| AllianzGI High Yield Bond Fund Class P | 2.46% | 0.82% | 8.55% | 7.67% | 7.93% | ||||||||||||||||
| AllianzGI High Yield Bond Fund Institutional Class | 2.49% | 0.78% | 8.68% | 7.90% | 8.22% | ||||||||||||||||
AllianzGI High Yield Bond Fund Administrative Class | 2.37% | 0.44% | 8.34% | 7.49% | 7.76% | |||||||||||||||||
| BofA Merrill Lynch High Yield Master II Index | 2.55% | 1.84% | 9.03% | 8.12% | 7.42% | ||||||||||||||||
Lipper High Yield Fund Average | 2.01% | 0.85% | 8.10% | 6.88% | 6.43% | |||||||||||||||||
† The Fund began operations on 7/31/96. Benchmark return comparisons began on the fund inception date. Lipper performance comparisons began on 7/31/96.
* Cumulative return
Performance quoted represents past performance and is no guarantee of future results. Current performance may be lower or higher than performance shown. For performance current to the most recent month-end, visit our website at us.allianzgi.com. Investment return and the principal value will fluctuate. Shares may be worth more or less than original cost when redeemed. The adjusted returns take into account the maximum initial sales charge of 3.75% on Class A shares and the contingent deferred sales charge (CDSC) of 1% on Class C shares, which may apply to shares redeemed during the first year of ownership. Returns do not reflect deduction of taxes that a shareholder would pay on fund distributions or redemption of fund shares. See pages 106 and 107 for more information. The Fund’s expense ratios are 0.94% for Class A shares, 1.67% for Class C shares, 1.01% for Class D shares, 1.45% for Class R shares, 0.71% for Class P shares, 0.64% for Institutional Class shares and 0.97% for Administrative Class shares. Expense ratio information is as of the Fund’s current prospectus dated April 1, 2015, as supplemented to date.
| 74 | May 31, 2015 | | Semiannual Report |
Table of Contents
Unaudited
AllianzGI High Yield Bond Fund (cont’d)
Cumulative Returns Through May 31, 2015
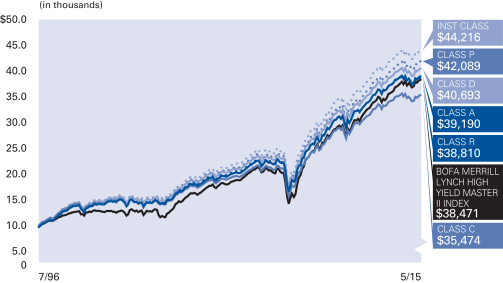
Industry Allocation (as of May 31, 2015)
| Oil, Gas & Consumable Fuels | 10.1% | |||
| Telecommunications | 8.7% | |||
| Media | 7.5% | |||
| Commercial Services | 7.0% | |||
| Diversified Financial Services | 5.5% | |||
| Healthcare-Services | 4.3% | |||
| Retail | 4.2% | |||
| Semiconductors | 3.8% | |||
| Other | 45.4% | |||
| Cash & Equivalents — Net | 3.5% |
Moody’s Ratings* (as of May 31, 2015 )
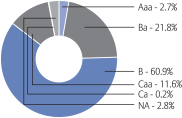
* As a percentage of total investments. Bond ratings refer to the underlying holdings of the Fund and are categorized from highest to lowest credit quality using ratings provided by Moody’s. Moody’s ratings have been selected for several reasons, including the access to information and materials provided by Moody’s, as well as the Fund’s consideration of industry practice. See “Important Information” for more detail on the selection of Moody’s for the Fund’s ratings presentation. Bonds not rated by Moody’s and bonds that do not currently have a rating available are designated in the chart above as “NR” and “NA”, respectively.
| Shareholder Expense Example | Actual Performance | |||||||||||||
| Class A | Class C | Class D | Class R | Class P | Institutional Class | Administrative Class | ||||||||
| Beginning Account Value (12/1/14) | $1,000.00 | $1,000.00 | $1,000.00 | $1,000.00 | $1,000.00 | $1,000.00 | $1,000.00 | |||||||
| Ending Account Value (5/31/15) | $1,022.50 | $1,019.90 | $1,023.10 | $1,020.90 | $1,024.60 | $1,024.90 | $1,023.70 | |||||||
| Expenses Paid During Period | $4.59 | $8.26 | $5.04 | $5.95 | $3.48 | $3.03 | $4.49 | |||||||
| Hypothetical Performance | ||||||||||||||
| (5% return before expenses) | ||||||||||||||
| Class A | Class C | Class D | Class R | Class P | Institutional Class | Administrative Class | ||||||||
| Beginning Account Value (12/1/14) | $1,000.00 | $1,000.00 | $1,000.00 | $1,000.00 | $1,000.00 | $1,000.00 | $1,000.00 | |||||||
| Ending Account Value (5/31/15) | $1,020.39 | $1,016.75 | $1,019.95 | $1,019.05 | $1,021.49 | $1,021.94 | $1,020.49 | |||||||
| Expenses Paid During Period | $4.58 | $8.25 | $5.04 | $5.94 | $3.48 | $3.02 | $4.48 | |||||||
For each class of the Fund, expenses are equal to the annualized expense ratio for the class (0.91% for Class A, 1.64% for Class C, 1.00% for Class D, 1.18% for Class R, 0.69% for Class P, 0.60% for Institutional Class and 0.89% for Administrative Class), multiplied by the average account value over the period, multiplied by 182/365.
| Semiannual Report | | May 31, 2015 | 75 |
Table of Contents
Unaudited
AllianzGI International Growth Fund
From inception on February 2, 2015 through May 31, 2015, as provided by the Europe Equity Growth Team.
Fund Insights
For the period from inception on February 2, 2015 through May 31, 2015, Class A shares at NAV of the AllianzGI International Growth Fund (the “Fund”) returned 6.40%, underperforming the MSCI AC World Index ex-USA Growth Total Return (Net) (the “benchmark index”), which returned 7.08%.
Portfolio Review
During the reporting period, the ECB introduced quantitative easing, which fueled European equity markets at the start of the calendar year. This, however, was not necessarily the only driver for the Fund performance as the Fund’s securities are characterized by strong earnings profiles and attractive balance sheets. Separately, currency shifts led to volatility in ex-European markets during the reporting period, driven by growing speculation of US interest rate hikes.
Stock selection overall was positive and contributed to the Fund’s performance, whereas sector allocation detracted. Stock selection within the information technology, health care and consumer staples sectors was additive to performance. Conversely, stock picking within the consumer discretionary and industrials sectors detracted. This was due to the fact that Switzerland unpegged the Swiss Franc from the euro in early 2015 which led to a market correction in Swiss stocks with significant euro exposure (exporters). In terms of sector allocation, an overweight in consumer staples and an underweight in financials detracted.
With respect to individual stocks, positions in Ambu, Sysmex, LG Household & Health, Infineon, Novo Nordisk and Simcorp were the largest contributors to performance on both an absolute and relative level. Biostime, Hexpol, Keyence and Sundrug were also additive.
On the other hand, shares of Elekta, Canadian National Railway and Hugo Boss detracted from relative performance and underwent a period of share-price correction. Bank NS Halifax, Schneider Electric and Richemont also underperformed with moderate losses.
During the reporting period, we purchased shares of UBS, Restaurant Brands, Rotork, Imi, Nippon Paint, Odontoprev, Norma Richelieu Hardware, Jollibee Foods and Ambu. We sold our position in Lawson, Magnit and Spectris.
Cumulative Return for the period ended May 31, 2015
| Since Inception† | ||||||
| AllianzGI International Growth Fund Class A | 6.40% | |||||
| AllianzGI International Growth Fund Class A (adjusted) | 0.55% | ||||
| AllianzGI International Growth Fund Institutional Class | 6.47% | ||||
| MSCI ACWI ex-US | 6.59% | ||||
| MSCI AC World Index Ex USA Growth Total Return (Net) | 7.08% | ||||
| Lipper International Multi-Cap Growth Fund Average | 8.56% | |||||
† The Fund began operations on 2/2/2015. Benchmark return comparisons began on the fund inception date. Lipper performance comparisons began on 1/31/15.
Performance quoted represents past performance and is no guarantee of future results. Current performance may be lower or higher than performance shown. For performance current to the most recent month-end, visit our website at us.allianzgi.com. Investment return and the principal value will fluctuate. Shares may be worth more or less than original cost when redeemed. The adjusted returns take into account the maximum initial sales charge of 5.50% on Class A Shares. Returns do not reflect deduction of taxes that a shareholder would pay on fund distributions or redemption of fund shares. See pages 106 and 107 for more information. The Fund’s gross expense ratios are 10.59% for Class A shares and 10.34% for Institutional Class shares. These ratios do not include an expense reduction, contractually guaranteed through at least 3/31/16. The Fund’s expense ratios net of this reduction are 1.20% for Class A shares and 0.95% for Institutional Class shares. Expense ratio information is as of the Fund’s current prospectus dated April 1, 2015, as supplemented to date.
| 76 | May 31, 2015 | | Semiannual Report |
Table of Contents
Unaudited
AllianzGI International Growth Fund (cont’d)
Cumulative Returns Through May 31, 2015
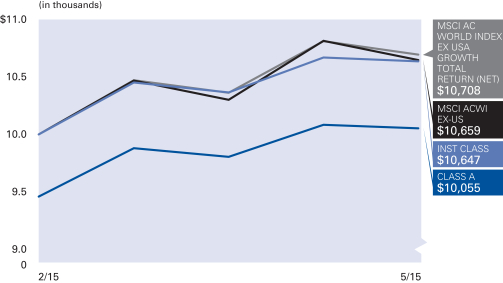
Country Allocation (as of May 31, 2015)
| United Kingdom | 15.9% | |||
| France | 9.6% | |||
| Germany | 9.4% | |||
| Japan | 8.9% | |||
| Denmark | 7.6% | |||
| Sweden | 7.1% | |||
| Switzerland | 6.7% | |||
| Brazil | 6.2% | |||
| Other | 26.9% | |||
| Cash & Equivalents — Net | 1.7% |
| Shareholder Expense Example | Actual Performance | |||
| Class A | Institutional Class | |||
| Beginning Account Value (2/2/15) | $1,000.00 | $1,000.00 | ||
| Ending Account Value (5/31/15) | $1,064.00 | $1,064.70 | ||
| Expenses Paid During Period | $4.00 | $3.17 | ||
| Hypothetical Performance | ||||
| (5% return before expenses) | ||||
| Class A | Institutional Class | |||
| Beginning Account Value (12/1/14) | $1,000.00 | $1,000.00 | ||
| Ending Account Value (5/31/15) | $1,018.95 | $1,020.19 | ||
| Expenses Paid During Period | $6.04 | $4.78 | ||
The Fund commenced operations on February 2, 2015. The Actual expense example is based on the period since inception; the Hypothetical expense example is based on the period beginning December 1, 2014. If the Hypothetical expense example had been based on the period since inception, the Ending Account Value and Expenses Paid During Period would have been: $1,012.28 and $3.90, respectively, for Class A; and $1,013.09 and $3.09, respectively, for Institutional Class.
For each class of the Fund, expenses (net of fee waiver and reimbursement, if any) are equal to the annualized expense ratio for the class (1.20% for Class A and 0.95% for Institutional Class), multiplied by the average account value over the period, multiplied by 118/365 for the Actual expense example and 182/365 for the Hypothetical expense example.
| Semiannual Report | | May 31, 2015 | 77 |
Table of Contents
Unaudited
AllianzGI International Small-Cap Fund
For the period of December 1, 2014 through May 31, 2015, as provided by Andrew Neville, Portfolio Manager.
Fund Insights
For the reporting period ended May 31, 2015, Class A shares at NAV of the AllianzGI International Small-Cap Fund (the “Fund”) returned 15.41%, outperforming the MSCI World ex USA Small Cap Index (the “benchmark index”), which returned 9.13%.
Market Environment
International Smaller Companies posted strong absolute gains over the course of the reporting period. European and Japanese smaller companies registered the strongest gains, posting double-digit absolute gains. Smaller companies from the Asia ex Japan region also performed positively but lagged their counterparts from the other regions.
The ECB’s launch of its QE program, the weak euro, improving euro-zone economic data, the more dovish-than-expected Fed meeting in March, the rate cut in China and the Minsk II ceasefire agreement provided tailwinds for equity markets in the first quarter of 2015. Weakening economic data in the US and China, the lackluster US earnings season, the SNB scrapping the euro cap on the franc and the win of left-wing party Syriza in the Greek election temporarily put pressure on equity markets. Share prices vaulted to new all-time highs in May amid a wave of monetary easing from the world’s central banks. Policymakers in more than 20 countries have slashed borrowing costs in an effort to spur growth and fight weak—and in some cases negative—inflation. The ECB offered the biggest tailwind for equity markets. In January, the ECB announced the launch of its QE program of €60bn a month from March 2015 to September 2016, which began on March 9th. The ECB raised its 2015 GDP growth forecast for the euro zone from 1.0% to 1.5%. Against the backdrop of ECB’s QE program, global investors steadily increased their exposure to European equities. Towards the end of the reporting period, Greece’s nontransparent financial situation made the markets increasingly nervous. Market participants were also worried about the upcoming elections in the UK, however, the pro-business conservatives won a further five years in power.
During February, in China, the central bank made a system-wide cut to the reserve requirement ratio for big banks. In March, China’s central bank cut its benchmark one-year rate, the second cut over the last four months. Annual consumer price inflation in China fell to a five-year low. The Chinese stock market surged to a seven-year high. In late March, the government announced a relaxation in the requirement for China’s mutual funds to invest in Hong Kong stocks via Stock Connect. Reports on Japan’s economy were mixed, with labor conditions continuing to strengthen, job openings hitting an eight-year high and unemployment falling to the lowest level since 1997. While hiring has improved, consumer spending remains tepid. The Bank of Japan delayed the 2% inflation target timing from fiscal year 2015 to the first half of fiscal year 2016 and left the current monetary policy unchanged.
Portfolio Review
Stock selection was the main driver of the Fund’s relative performance. All three regional sleeve portfolios achieved strong relative returns versus their regional market. Sector-wise, selection contributed positively in all sectors except consumer discretionary and energy. Sector structure also contributed positively due to the underweight positions in the energy and utilities sectors and the overweight in the information technology sector.
During the reporting period, the Fund’s largest overweights relative to the benchmark index were in the information technology, industrials and consumer staples sectors, while the largest underweights were in the financials sector followed by the materials and energy sectors. Geographically the largest overweights were in China and France, while the largest underweights were in Canada and the UK.
The strongest stock contributors to performance were the positions in AMS AG (Switzerland), Axis (Sweden) and Sartorius Stedim Biotech (France), while the positions in Topdanmark (Denmark), Aareal Bank (Germany) and Cancom (Germany) were the largest detractors. AMS develops and manufactures high performance analog semiconductors and has benefitted from sustained high growth rates due to increasing demand for electronics devices and requirements in new application areas. Axis is a leading global provider of digital surveillance cameras. The company received a takeover bid by Canon. Sartorius Stedim is one of the world’s leading providers of laboratory and process technologies and equipment with clear focus on the attractive biopharma market, where it benefits from growth driven by global trends like aging population and an increase in chronic diseases.
| 78 | May 31, 2015 | | Semiannual Report |
Table of Contents
Unaudited
AllianzGI International Small-Cap Fund (cont’d)
Average Annual Total Return for the period ended May 31, 2015
| 6 Month* | 1 Year | 5 Year | 10 Year | Since Inception† | ||||||||||||||||||
| AllianzGI International Small-Cap Fund Class A | 15.41% | 6.75% | 14.22% | 10.08% | 12.69% | |||||||||||||||||
| AllianzGI International Small-Cap Fund Class A (adjusted) | 9.07% | 0.87% | 12.93% | 9.46% | 12.32% | ||||||||||||||||
| AllianzGI International Small-Cap Fund Class C | 14.98% | 5.96% | 13.38% | 9.27% | 11.85% | |||||||||||||||||
| AllianzGI International Small-Cap Fund Class C (adjusted) | 13.98% | 5.03% | 13.38% | 9.27% | 11.85% | ||||||||||||||||
| AllianzGI International Small-Cap Fund Class D | 15.43% | 6.75% | 14.21% | 10.08% | 12.68% | ||||||||||||||||
| AllianzGI International Small-Cap Fund Class R | 15.28% | 6.48% | 13.94% | 9.81% | 12.41% | ||||||||||||||||
| AllianzGI International Small-Cap Fund Class P | 15.52% | 6.93% | 14.44% | 10.34% | 13.02% | ||||||||||||||||
| AllianzGI International Small-Cap Fund Institutional Class | 15.56% | 7.00% | 14.56% | 10.47% | 13.12% | ||||||||||||||||
| MSCI World ex USA Small Cap Index | 9.13% | –0.31% | 11.22% | 6.73% | 7.96% | ||||||||||||||||
| MSCI EAFE Small Cap Index | 10.95% | 2.00% | 12.59% | 7.01% | 8.03% | ||||||||||||||||
| Lipper International Small/Mid-Cap Growth Funds Average | 8.98% | 1.15% | 12.77% | 8.52% | 9.36% | |||||||||||||||||
† The Fund began operations on 12/31/97. Benchmark return comparisons began on the fund inception date. Lipper performance comparisons began on 12/31/97.
* Cumulative return
Performance quoted represents past performance and is no guarantee of future results. Current performance may be lower or higher than performance shown. For performance current to the most recent month-end, visit our website at us.allianzgi.com. Investment return and the principal value will fluctuate. Shares may be worth more or less than original cost when redeemed. The adjusted returns take into account the maximum initial sales charge of 5.50% on Class A shares and the contingent deferred sales charge (CDSC) of 1% on Class C shares, which may apply to shares redeemed during the first year of ownership. Returns do not reflect deduction of taxes that a shareholder would pay on fund distributions or redemption of fund shares. See pages 106 and 107 for more information. The Fund’s gross expense ratios are 1.76% for Class A shares, 2.45% for Class C shares, 1.71% for Class D shares, 2.10% for Class R shares, 1.54% for Class P shares and 1.46% for Institutional Class shares. These ratios do not include an expense reduction, contractually guaranteed through at least 3/31/16. The Fund’s expense ratios net of this reduction are 1.45% for Class A shares, 2.19% for Class C shares, 1.45% for Class D shares, 1.70% for Class R shares, 1.28% for Class P shares and 1.21% for Institutional Class shares. Expense ratio information is as of the Fund’s current prospectus dated April 1, 2015, as supplemented to date.
Cumulative Returns Through May 31, 2015
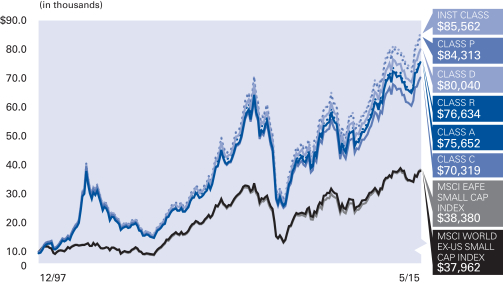
Country Allocation (as of May 31, 2015)
| Japan | 26.8% | |||
| United Kingdom | 12.6% | |||
| France | 6.1% | |||
| Sweden | 6.0% | |||
| Germany | 5.6% | |||
| Spain | 5.2% | |||
| Switzerland | 3.7% | |||
| Italy | 3.2% | |||
| Other | 23.4% | |||
| Cash & Equivalents — Net | 7.4% |
| Semiannual Report | | May 31, 2015 | 79 |
Table of Contents
Unaudited
AllianzGI International Small-Cap Fund (cont’d)
| Shareholder Expense Example | Actual Performance | |||||||||||
| Class A | Class C | Class D | Class R | Class P | Institutional Class | |||||||
| Beginning Account Value (12/1/14) | $1,000.00 | $1,000.00 | $1,000.00 | $1,000.00 | $1,000.00 | $1,000.00 | ||||||
| Ending Account Value (5/31/15) | $1,154.10 | $1,149.80 | $1,154.30 | $1,152.80 | $1,155.20 | $1,155.60 | ||||||
| Expenses Paid During Period | $7.79 | $11.74 | $7.79 | $9.12 | $6.88 | $6.50 | ||||||
| Hypothetical Performance | ||||||||||||
| (5% return before expenses) | ||||||||||||
| Class A | Class C | Class D | Class R | Class P | Institutional Class | |||||||
| Beginning Account Value (12/1/14) | $1,000.00 | $1,000.00 | $1,000.00 | $1,000.00 | $1,000.00 | $1,000.00 | ||||||
| Ending Account Value (5/31/15) | $1,017.70 | $1,014.01 | $1,017.70 | $1,016.45 | $1,018.55 | $1,018.90 | ||||||
| Expenses Paid During Period | $7.29 | $11.00 | $7.29 | $8.55 | $6.44 | $6.09 | ||||||
For each class of the Fund, expenses (net of fee waiver and reimbursement, if any) are equal to the annualized expense ratio for the class (1.45% for Class A, 2.19% for Class C, 1.45% for Class D, 1.70% for Class R, 1.28% for Class P and 1.21% for Institutional Class), multiplied by the average account value over the period, multiplied by 182/365.
| 80 | May 31, 2015 | | Semiannual Report |
Table of Contents
(THIS PAGE INTENTIONALLY LEFT BLANK)
| Semiannual Report | | May 31, 2015 | 81 |
Table of Contents
Unaudited
AllianzGI Micro Cap Fund
For the period of December 1, 2014 through May 31, 2015, as provided by John McCraw, Portfolio Manager.
Fund Insights
For the reporting period ended May 31, 2015, Class A shares at NAV of the AllianzGI Micro Cap Fund (the “Fund”) returned 11.81%, underperforming the Russell Microcap Growth Index (the “benchmark index”), which returned 14.28%.
Market Environment
Overall, US stocks closed higher despite episodes of equity market volatility.
Early in the period, the decline in the price of crude oil accelerated and spilled into the broader market; however, stocks found their footing and moved higher towards year end with oil prices stabilizing. The FOMC meeting and subsequent communication to remain “patient” as it relates to future interest rate increases was a positive catalyst for the market. Lastly, a stronger-than-expected final third-quarter GDP report helped lift investor sentiment.
In the months that followed, volatility in the energy and currency markets as well as global macro-related headlines had an impact on day-to-day stock prices; however, Fed commentary and uncertainty surrounding the path of monetary policy arguably had a greater influence on investor sentiment. Aggressive actions by the ECB and other overseas central banks did not directly impact the stock market, but they reinforced the fact that the global landscape remains highly accommodative. Separately, fourth-quarter earnings and corporate actions including share buybacks, dividend increases and merger and acquisition activities, supported a positive fundamental backdrop, while mixed economic reports signaled continued modest growth in the US.
As the end of the reporting period neared, equity prices weakened concurrent with a move higher in volatility and government bond yields, but stabilized and rebounded as US Treasury Securities rallied up to the end of the period. On the economic front, reports were mixed, suggesting that the Fed would remain patient and the rate hike cycle would be gradual—a positive for risk assets. With respect to corporate profits, first-quarter earnings reported a meager gain, but were impressive nonetheless given Wall Street’s estimates heading into April. Ultimately, stocks proved resilient in the face of interest rate volatility, macro uncertainties abroad and slower growth.
Against this backdrop, the Russell Microcap Index returned 9.07% and outperformed the Russell 2000 Index, which returned 6.94%. Within the microcap universe, growth-oriented stocks bested value-oriented stocks. Specific to the benchmark index, sector performance was predominantly positive. Health care and information technology were the strongest-performing sectors, followed by utilities and financials. In contrast, the energy sector declined the most, followed by the consumer staples and materials sectors.
Portfolio Review
The Fund underperformed the benchmark index over the reporting period. From an attribution perspective, asset allocation effects were the primary drivers of relative underperformance whereas security selection impacts were negligible. For example, stock picking was positive in the industrials, consumer discretionary and materials sectors, but was offset by negative security selection in information technology, health care and consumer staples. Separately, an underweight in the health care sector and an overweight in the industrials sector hindered performance; however, an underweight in the consumer staples sector was partially offsetting.
Average Annual Total Return for the period ended May 31, 2015
| 6 Month* | 1 Year | 5 Year | 10 Year | Since Inception† | ||||||||||||||||||
| AllianzGI Micro Cap Fund Class A | 11.81% | 11.52% | 15.96% | 9.73% | 11.77% | |||||||||||||||||
| AllianzGI Micro Cap Fund Class A (adjusted) | 5.66% | 5.38% | 14.66% | 9.11% | 11.45% | ||||||||||||||||
| AllianzGI Micro Cap Fund Class P | 11.85% | 11.63% | 16.14% | 9.94% | 12.00% | ||||||||||||||||
| AllianzGI Micro Cap Fund Institutional Class | 11.79% | 11.58% | 16.23% | 10.04% | 12.11% | ||||||||||||||||
| Russell Microcap Growth Index | 14.28% | 18.51% | 17.43% | 8.33% | 7.29% | ||||||||||||||||
| Lipper Small-Cap Growth Funds Average | 8.31% | 14.73% | 16.15% | 9.13% | 9.46% | |||||||||||||||||
† The Fund began operations on 7/12/95. Benchmark return comparisons began on the fund inception date. Lipper performance comparisons began on 6/30/95.
* Cumulative return
Performance quoted represents past performance and is no guarantee of future results. Current performance may be lower or higher than performance shown. For performance current to the most recent month-end, visit our website at us.allianzgi.com. Investment return and the principal value will fluctuate. Shares may be worth more or less than original cost when redeemed. The adjusted returns take into account the maximum initial sales charge of 5.50% on Class A shares. Returns do not reflect deduction of taxes that a shareholder would pay on fund distributions or redemption of fund shares. See pages 106 and 107 for more information. The Fund’s gross expense ratios are 2.11% for Class A shares, 1.82% for Class P shares and 1.81% for Institutional Class shares. This ratio does not include an expense reduction, contractually guaranteed through at least 3/31/16. The Fund’s expense ratios net of this reduction are 1.63% for Class A shares, 1.55% for Class P shares and 1.55% for Institutional Class shares. Expense ratio information is as of the Fund’s current prospectus dated April 1, 2015, as supplemented to date.
| 82 | May 31, 2015 | | Semiannual Report |
Table of Contents
Unaudited
AllianzGI Micro Cap Fund (cont’d)
Cumulative Returns Through May 31, 2015

Industry Allocation (as of May 31, 2015)
| Biotechnology | 10.0% | |||
| Pharmaceuticals | 7.7% | |||
| Health Care Equipment & Supplies | 6.9% | |||
| Health Care Providers & Services | 5.9% | |||
| Internet Software & Services | 5.2% | |||
| Building Products | 4.6% | |||
| Semiconductors & Semiconductor Equipment | 4.6% | |||
| Banks | 4.4% | |||
| Other | 47.3% | |||
| Cash & Equivalents — Net | 3.4% |
| Shareholder Expense Example | Actual Performance | |||||
| Class A | Class P | Institutional Class | ||||
| Beginning Account Value (12/1/14) | $1,000.00 | $1,000.00 | $1,000.00 | |||
| Ending Account Value (5/31/15) | $1,118.10 | $1,118.50 | $1,117.90 | |||
| Expenses Paid During Period | $8.55 | $7.87 | $8.13 | |||
| Hypothetical Performance | ||||||
| (5% return before expenses) | ||||||
| Class A | Class P | Institutional Class | ||||
| Beginning Account Value (12/1/14) | $1,000.00 | $1,000.00 | $1,000.00 | |||
| Ending Account Value (5/31/15) | $1,016.85 | $1,017.50 | $1,017.25 | |||
| Expenses Paid During Period | $8.15 | $7.49 | $7.75 | |||
For each class of the Fund, expenses (net of fee waiver and reimbursement, if any) are equal to the annualized expense ratio for the class (1.62% for Class A, 1.49% for Class P and 1.54% for Institutional Class), multiplied by the average account value over the period, multiplied by 182/365.
| Semiannual Report | | May 31, 2015 | 83 |
Table of Contents
Unaudited
AllianzGI Multi-Asset Real Return Fund
For the period of December 1, 2014 through May 31, 2015, as provided by the Multi-Asset US Group.
Fund Insights
For the reporting period ended May 31, 2015, Class A shares at NAV of the AllianzGI Multi-Asset Real Return Fund (the “Fund”) returned -2.07%, underperforming the Barclays US Government Inflation-Linked Bond Index (the “benchmark index”), which returned 0.20%.
Market Overview
For the six-month period of December 1, 2014 through May 31, 2015, global equities outperformed global bonds with developed country equities leading emerging market equities by more than 3%. In fixed income, global bonds fell 3.3% for the period as measured by the Barclays Global Aggregate Index. However, in the US, as uncertainty about the Fed’s future policy decisions persisted, yields on the 10-year Treasury fell marginally for the period and broad US bonds returned 1.1% as measured by the Barclays US Aggregate Bond Index.
Certain themes from late 2014 persisted in the period, including the continued strength of the US dollar against most major currencies. For the period, one of the best performing assets was the trade-weighted dollar, which returned 10.2%. On the other hand, commodities, led by energy, continued to weaken: commodities remained one of the worst performing asset classes returning -10.6% for the period as measured by the Bloomberg Commodity Index.
Mid-April marked a period of dislocation across markets. A sell-off in European bonds, most notably in German bunds, which produced swings in bond yields globally contributed to broad market volatility. The US dollar fell against every major developed market currency and most emerging market currencies in April, while the euro appreciated by 4.6% for the month. In commodities, oil entered positive territory for the year in mid-April, contributing to the perception of stability in oil prices. These events and trends culminated in a renewed focus on inflationary—as opposed to deflationary—trends in the global economy and a pickup in inflation expectations.
Mid-April Market Volatility
The magnitude and rapid pace of the move in European bond yields in late April was unprecedented. The spike in yields was most pronounced in German bunds, with the 10-year yield increasing from a low on April 17, 2015 of 0.05% to a high of 0.78% on May 7, 2015. Several factors contributed to the move, including speculation of tapering on the part of the ECB on the back of stronger macroeconomic data throughout the region. Concerns about the ability of Greece to reach a deal with the Eurogroup over its obligations to the IMF and other creditors intensified through April and early May, further contributing to bond market volatility. Stronger inflation data released in mid-April, including an increase in the Eurozone Aggregate Consumer Price Index of 1.1% month over month—nearly two times the increase of the previous month—contributed to higher inflation expectations, which in turn paved the way for higher yields. The increase in yields was not limited to Europe. Through mid-May, the US yield curve steepened as rates followed European yields higher and the US 10-year Treasury hit a high for the six-month period of 2.4% on May 12, 2015.
Currencies also underwent a temporary correction in April. The trade-weighted dollar suffered its first monthly decline since July 2014. For the month, the trade-weighted dollar fell 3.8%. In connection with the spike in yields on European bonds and the more solid inflation data, the euro increased more than 6% from its low in mid-April to the end of the month. However, in May, the dollar once again strengthened against all major currencies and the euro resumed its weaker trend against the dollar, falling 2.1%.
The Return of Inflation after Disinflation
Despite significant volatility during the period including a low close to $43 in mid-March, the price of WTI crude stabilized in the $58-60/barrel range by mid-April, leading to a jump in inflation expectations. For example, in late April, one of the Fed’s preferred market based inflation gauges, the 5 year/5 year forward breakeven inflation level from the TIPS market, moved above the 2% threshold, suggesting that, while short term inflation expectations still lag, the 5-year inflation expectation had reached—and exceeded—the Fed’s inflation target. In the context of moderate global growth, stable energy prices and initial increases in core consumer price inflation, overall inflation expectations inched closer to central banks’ targets during the period. This may finally signal the dawn of a new era of inflation.
Portfolio Review
Inflation related asset classes had mixed results over the period, as reflected by declining commodity prices with the 10.6% fall in the Bloomberg Commodity Index. Conversely, stocks of commodity related companies rose 2.4% and global real estate returned 1.5% based on the MSCI World/Real Estate Index. TIPS posted modest gains as the Barclays US Government Inflation-Linked Bond Index returned 0.2%. Over the period, the Fund’s custom blended benchmark index, an equal weighted combination of these four inflation related asset classes, declined 1.6%.
The diverging asset class returns were influenced by the strengthening US dollar and supply/demand imbalances specifically in the energy markets. While the US dollar appreciated against most major currencies, commodities denominated in dollars became less expensive from a USD based perspective, translating into lower commodity prices for USD based investors. In addition, supply/demand imbalances further contributed to declines in the energy markets as the price of crude oil (WTI) fell briefly to $43/bbl, the lowest level since March 2009. Global REITs continued to exhibit strength amidst a backdrop of low borrowing rates and continued strong demand.
The modestly positive return provided by TIPS included declining real yields, particularly at the front end of the term structure. The shorter dated 5-year TIPS constant maturity Index ended with a yield of -0.08% (down from 0.13% at the beginning of the period) after spending the latter half of the period in negative territory. TIPS priced in modestly higher inflation expectations over the period, as breakeven inflation rose particularly at the front end of the curve. The 5-year breakeven rate ended the period at 1.57% (up from 1.39% at the beginning of the period), while the 10 year breakeven rate ended roughly flat at 1.80%.
At the start of the period and relative to the internal custom blended benchmark index, the portfolio was overweight global REITs. This position was gradually reduced to below benchmark index weight by the end of the quarter. In contrast, the portfolio had entered the period with underweights to the remaining core asset classes: commodities, commodity equities and TIPS. Over the period, exposure to commodities was increased to roughly benchmark index weight, while the portfolio remained underweight TIPS and commodity related equities for the majority of the period. Outside of these core exposures, the portfolio held additional asset classes over the period, including emerging market bonds, a hedge against the euro and large-cap US equities.
| 84 | May 31, 2015 | | Semiannual Report |
Table of Contents
Unaudited
AllianzGI Multi-Asset Real Return Fund (cont’d)
The Fund’s relative performance benefited from an overweight to global real estate, which continued to advance against a backdrop of low borrowing rates and strong demand. Performance was also helped by an underweight to commodities. Mitigating these positive contributions to relative performance was the Fund’s underweight position to TIPS and commodity related equities as these asset classes posted positive returns over the period.
At the end of the period, the Fund’s exposure to commodities was roughly in line with the benchmark index, while the other primary inflation related asset classes, global real estate, commodity related equities and TIPS, were underweighted in the portfolio. Offsetting these underweight positions were the Fund’s cash/equivalent holdings and opportunistic asset class exposures, including equity exposure in the US, Europe and emerging markets. Duration continued to be a concern for US Treasury bonds, so the portfolio continued to hedge the duration on its fixed income holdings via Treasury futures.
Outlook
The stimulative measures pursued by central banks over the past several years have well known and notable repercussions to potential future inflation risks. In addition to the US’s efforts to spark inflation by keeping interest rates low, actions of central banks outside the US have been providing further fuel to the risks of future inflation. For example, this year, the ECB has planned asset purchases in excess of their scheduled net new issuance of euro-zone government bonds. We believe that the current backdrop of global central bank easing, persistent weakness in certain commodity prices, and dollar strength creates a potentially favorable entry point for long term investors to gain exposure to a diversified and actively managed portfolio of inflation hedging asset classes.
Average Annual Total Return for the period ended May 31, 2015
| 6 Month* | 1 Year | Since Inception† | ||||||||||||
| AllianzGI Multi-Asset Real Return Fund Class A | –2.07% | –9.31% | –0.27% | |||||||||||
| AllianzGI Multi-Asset Real Return Fund Class A (adjusted) | –7.46% | –14.29% | –2.54% | ||||||||||
| AllianzGI Multi-Asset Real Return Fund Class C | –2.43% | –9.94% | –0.97% | |||||||||||
| AllianzGI Multi-Asset Real Return Fund Class C (adjusted) | –3.40% | –10.83% | –0.97% | ||||||||||
| AllianzGI Multi-Asset Real Return Fund Class D | –2.08% | –9.30% | –0.27% | ||||||||||
| AllianzGI Multi-Asset Real Return Fund Class P | –2.03% | –9.19% | –0.13% | ||||||||||
| AllianzGI Multi-Asset Real Return Fund Institutional Class | –1.96% | –9.06% | –0.02% | ||||||||||
| Barclays US Government Inflation-Linked Bond Index | 0.20% | –0.30% | –1.76% | ||||||||||
| Custom Real Asset Benchmark** | –1.57% | –6.40% | –0.34% | |||||||||||
| Lipper Alternative Global Macro Portfolio Funds Average | 0.64% | 0.17% | 2.86% | |||||||||||
† The Fund began operations on 12/17/12. Benchmark return comparisons began on the fund inception date. Lipper performance comparisons began on 12/31/12.
* Cumulative return
** The Custom Real Asset Benchmark is comprised of 25% Dow Jones UBS Commodity Total Return Index, 25% MSCI World Real Estate Index, 25% Barclays US Government Inflation-Linked Bond Index, 6.25% DAX Global Agribusiness Index, 7.5% MSCI World Energy Index, 6.25% MSCI World Materials Index and 5% MSCI ACWI Industrials (equal-weighted) Index.
Performance quoted represents past performance and is no guarantee of future results. Current performance may be lower or higher than performance shown. For performance current to the most recent month-end, visit our website at us.allianzgi.com. Investment return and the principal value will fluctuate. Shares may be worth more or less than original cost when redeemed. The adjusted returns take into account the maximum initial sales charge of 5.50% on Class A shares and the contingent deferred sales charge (CDSC) of 1% on Class C shares, which may apply to shares redeemed during the first year of ownership. Returns do not reflect deduction of taxes that a shareholder would pay on fund distributions or redemption of fund shares. See pages 106 and 107 for more information. The Fund’s gross expense ratios are 5.08% for Class A shares, 5.93% for Class C shares, 61.23% for Class D shares, 4.97% for Class P shares and 4.95% for Institutional Class shares. These ratios do not include an expense reduction, contractually guaranteed through at least 3/31/16. The Fund’s expense ratios net of this reduction are 1.32% for Class A shares, 2.07% for Class C shares, 1.32% for Class D shares, 1.17% for Class P shares and 1.07% for Institutional Class shares. Expense ratio information is as of the Fund’s current prospectus dated April 1, 2015, as supplemented to date.
Cumulative Returns Through May 31, 2015
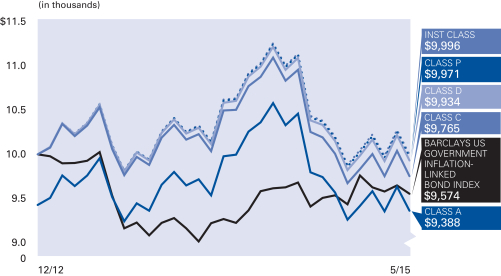
Asset Allocation (as of May 31, 2015)
| Mutual Funds | 50.3% | |||
| Common Stock | 26.3% | |||
| U.S. Treasury Obligations | 11.0% | |||
| Exchange-Traded Funds | 0.6% | |||
| Cash & Equivalents — Net | 11.8% |
| Semiannual Report | | May 31, 2015 | 85 |
Table of Contents
Unaudited
AllianzGI Multi-Asset Real Return Fund (cont’d)
| Shareholder Expense Example | Actual Performance | |||||||||
| Class A | Class C | Class D | Class P | Institutional Class | ||||||
| Beginning Account Value (12/1/14) | $1,000.00 | $1,000.00 | $1,000.00 | $1,000.00 | $1,000.00 | |||||
| Ending Account Value (5/31/15) | $979.30 | $975.70 | $979.20 | $979.70 | $980.40 | |||||
| Expenses Paid During Period | $4.19 | $7.88 | $4.19 | $3.45 | $2.96 | |||||
| Hypothetical Performance | ||||||||||
| (5% return before expenses) | ||||||||||
| Class A | Class C | Class D | Class P | Institutional Class | ||||||
| Beginning Account Value (12/1/14) | $1,000.00 | $1,000.00 | $1,000.00 | $1,000.00 | $1,000.00 | |||||
| Ending Account Value (5/31/15) | $1,020.69 | $1,016.95 | $1,020.69 | $1,021.44 | $1,021.94 | |||||
| Expenses Paid During Period | $4.28 | $8.05 | $4.28 | $3.53 | $3.02 | |||||
For each class of the Fund, expenses (net of fee waiver and reimbursement, if any) are equal to the annualized expense ratio for the class (0.85% for Class A, 1.60% for Class C, 0.85% for Class D, 0.70% for Class P and 0.60% for Institutional Class), multiplied by the average account value over the period, multiplied by 182/365. The expense ratio does not include the expenses of the Underlying Funds, which based upon the allocation of the Fund’s assets among the Underlying Funds are indirectly borne by the shareholders of the Fund.
| 86 | May 31, 2015 | | Semiannual Report |
Table of Contents
(THIS PAGE INTENTIONALLY LEFT BLANK)
| Semiannual Report | | May 31, 2015 | 87 |
Table of Contents
Unaudited
AllianzGI NFJ Emerging Markets Value Fund
For the period of December 1, 2014 through May 31, 2015, as provided by Krysta Hill, Product Specialist Associate, and reviewed by Morley D. Campbell, CFA, Portfolio Manager/Analyst.
Fund Insights
For the reporting period ended May 31, 2015, Class A shares at NAV of the AllianzGI NFJ Emerging Markets Value Fund (the “Fund”) returned 3.37%, outperforming the MSCI Emerging Markets Index (the “benchmark index”), which returned 0.82%.
Market Environment
The benchmark index appreciated 0.82% over a choppy, six-month reporting period, as strength from February and April was somewhat offset by weakness from December and May. The emerging markets equities generally trailed developed international as well as US-based equities, which climbed 4.84% and 2.97%, respectively, as measured by the MSCI EAFE and S&P 500 Indices. Emerging economies experienced some weakness toward the end of 2014, as the benchmark index fell 4.56% in the month of December, with results dampened in part by the sharp decline in oil prices. During the early months of 2015, the emerging markets were boosted in part by lending rate cuts in China, India, Indonesia, South Korea and Thailand. The benchmark index returned 7.72% in April as comments from the Fed deferred a rate increase until data indicates a more robust economic recovery and as monetary easing in China boosted equities’ performance there. However, the benchmark index swung to a loss in May—down 3.99%—with many local emerging markets currencies down against the US dollar and weak commodity prices negatively impacting more commodity-sensitive countries. Of the 23 countries in the benchmark index, just seven delivered a positive total return for the period, led by double-digit performance from China and Hungary. Conversely, Greece, Colombia, Brazil, Turkey, Qatar and United Arab Emirates fell to a double-digit loss over the reporting period. Four of ten economic sectors in the benchmark index were positive over the trailing six-month period, led by information technology, industrials and health care names. In contrast, the utilities, materials and telecom services sectors were the poorest-performers, declining 4.34%, 3.78% and 3.27%, respectively.
Portfolio Review
The Fund’s outperformance versus the benchmark index was due to favorable stock selection and country allocation, while sector allocation was marginally negative over the reporting period.
Stock selection added value across the industrials, materials and consumer discretionary sectors. This was only slightly offset by the Fund’s holdings in the financials, consumer staples and utilities sectors.
By country, selection was strong in China, Turkey and Brazil but somewhat dampened by weaker selection in India, South Korea and the Philippines.
From a sector allocation perspective, underweight positions in the telecom services and consumer staples sectors contributed to results. The Fund’s overweight in utilities and underweight in information technology detracted during the reporting period.
Overweight positions in Hong Kong and Norway contributed to relative performance, while an underweight in China and an overweight in Turkey muted results during the period.
Sector weight deviations are a result of NFJ’s bottom-up investment process. On average during the reporting period, the Fund’s largest overweights relative to the benchmark index were in the consumer discretionary and utilities sectors, whereas the largest relative underweights were in the telecom services and consumer staples sectors.
Average Annual Total Return for the period ended May 31, 2015
| 6 Month* | 1 Year | Since Inception† | ||||||||||||
| AllianzGI NFJ Emerging Markets Value Fund Class A | 3.37% | 2.36% | 4.31% | |||||||||||
| AllianzGI NFJ Emerging Markets Value Fund Class A (adjusted) | –2.32% | –3.27% | 1.93% | ||||||||||
| AllianzGI NFJ Emerging Markets Value Fund Class C | 3.02% | 1.57% | 3.52% | |||||||||||
| AllianzGI NFJ Emerging Markets Value Fund Class C (adjusted) | 2.03% | 0.60% | 3.52% | ||||||||||
| AllianzGI NFJ Emerging Markets Value Fund Class D | 3.45% | 2.37% | 4.33% | ||||||||||
| AllianzGI NFJ Emerging Markets Value Fund Class P | 3.47% | 2.54% | 4.48% | ||||||||||
| AllianzGI NFJ Emerging Markets Value Fund Institutional Class | 3.53% | 2.56% | 4.57% | ||||||||||
| MSCI Emerging Markets Index | 0.82% | –0.01% | 0.66% | ||||||||||
| Lipper Emerging Markets Funds Average | –1.07% | –2.57% | 0.21% | |||||||||||
† The Fund began operations on 12/18/12. Benchmark return comparisons began on the fund inception date. Lipper performance comparisons began on 12/31/12.
* Cumulative return
Performance quoted represents past performance and is no guarantee of future results. Current performance may be lower or higher than performance shown. For performance current to the most recent month-end, visit our website at us.allianzgi.com. Investment return and the principal value will fluctuate. Shares may be worth more or less than original cost when redeemed. The adjusted returns take into account the maximum initial sales charge of 5.50% on Class A shares and the contingent deferred sales charge (CDSC) of 1% on Class C shares, which may apply to shares redeemed during the first year of ownership. Returns do not reflect deduction of taxes that a shareholder would pay on fund distributions or redemption of fund shares. See pages 106 and 107 for more information. The Fund’s gross expense ratios are 4.86% for Class A shares, 5.60% for Class C shares, 5.76% for Class D shares, 4.64% for Class P shares and 4.63% for Institutional Class shares. These ratios do not include an expense reduction, contractually guaranteed through at least 3/31/16. The Fund’s expense ratios net of this reduction are 1.55% for Class A shares, 2.30% for Class C shares, 1.55% for Class D shares, 1.39% for Class P shares and 1.30% for Institutional Class shares. Expense ratio information is as of the Fund’s current prospectus dated April 1, 2015, as supplemented to date.
| 88 | May 31, 2015 | | Semiannual Report |
Table of Contents
Unaudited
AllianzGI NFJ Emerging Markets Value Fund (cont’d)
Cumulative Returns Through May 31, 2015
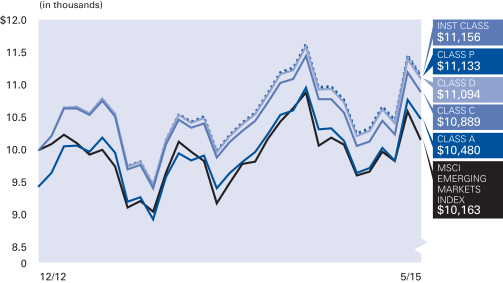
Country Allocation (as of May 31, 2015)
| China | 20.7% | |||
| Taiwan | 14.1% | |||
| Korea (Republic of) | 11.2% | |||
| Brazil | 8.3% | |||
| India | 7.9% | |||
| South Africa | 5.6% | |||
| Russian Federation | 5.0% | |||
| Mexico | 3.3% | |||
| Other | 20.0% | |||
| Cash & Equivalents-Net | 3.9% |
| Shareholder Expense Example | Actual Performance | |||||||||
| Class A | Class C | Class D | Class P | Institutional Class | ||||||
| Beginning Account Value (12/1/14) | $1,000.00 | $1,000.00 | $1,000.00 | $1,000.00 | $1,000.00 | |||||
| Ending Account Value (5/31/15) | $1,033.70 | $1,030.20 | $1,034.50 | $1,034.70 | $1,035.30 | |||||
| Expenses Paid During Period | $7.86 | $11.64 | $7.86 | $7.05 | $6.60 | |||||
| Hypothetical Performance | ||||||||||
| (5% return before expenses) | ||||||||||
| Class A | Class C | Class D | Class P | Institutional Class | ||||||
| Beginning Account Value (12/1/14) | $1,000.00 | $1,000.00 | $1,000.00 | $1,000.00 | $1,000.00 | |||||
| Ending Account Value (5/31/15) | $1,017.20 | $1,013.46 | $1,017.20 | $1,018.00 | $1,018.45 | |||||
| Expenses Paid During Period | $7.80 | $11.55 | $7.80 | $6.99 | $6.54 | |||||
For each class of the Fund, expenses (net of fee waiver and reimbursement, if any) are equal to the annualized expense ratio for the class (1.55% for Class A, 2.30% for Class C, 1.55% for Class D, 1.39% for Class P and 1.30% for Institutional Class), multiplied by the average account value over the period, multiplied by 182/365.
| Semiannual Report | | May 31, 2015 | 89 |
Table of Contents
Unaudited
AllianzGI NFJ Global Dividend Value Fund
For the period of December 1, 2014 through May 31, 2015, as provided by Krysta Hill, Product Specialist Associate, and reviewed by R. Burns McKinney, CFA, Portfolio Manager/Analyst.
Fund Insights
For the reporting period ended May 31, 2015, Class A shares at NAV of the AllianzGI NFJ Global Dividend Value Fund (the “Fund”) returned -0.05%, underperforming the MSCI AC World Index (the “benchmark index”), which returned 3.11%.
Market Environment
Global equities appreciated 3.11% during the trialing six months ended May 31, 2015, as measured by the benchmark index. The strongest returns were generated in the international developed economies, with the MSCI EAFE Net Index up 4.84% during the reporting period. US equities, as measured by the S&P 500 Index, gained 2.97%, while the MSCI Emerging Markets Index climbed a more moderated 0.82%. Monetary policy was a key theme across the international landscape, led by the ECB’s €60 billion monthly bond purchase program, which began in early March. Sweden’s central bank also announced a bond-buying package worth 10 billion Swedish kronor to spur inflation and initiated a negative benchmark index rate of -0.1%. Strength from the Asia/Pacific region was due in part to lending rate cuts across Australia, China, India, Indonesia, South Korea and Thailand. Within the US, comments from the US FOMC indicated a willingness to raise rates should the economic data support such a move. Of the 46 countries in the MSCI ACWI Net Index, China, Hungary, Denmark, Japan and Hong Kong were the strongest-performing countries over the trailing six-month period. Conversely, many countries in the emerging markets region swung to double-digit losses, including Greece, Colombia, Brazil, Turkey, Qatar, the United Arab Emirates and Malaysia. The spread between the best (health care) and worst (utilities) performing sectors within the MSCI ACWI Net Index was 11%. All but three benchmark sectors generated positive returns across the six-month period, with the utilities, energy and telecom services sectors sinking to a loss. The strongest performance was realized by health care, consumer discretionary and information technology names.
Portfolio Review
The Fund’s underperformance versus the benchmark index was largely due to stock selection, though sector allocation also contributed to negative relative returns. Conversely, country allocation was positive during the period.
In terms of stock selection, the Fund’s holdings in the information technology, telecom services and utilities sectors were the primary laggards versus sector counterparts. This was somewhat offset by the Fund’s holdings across the financials and consumer discretionary sectors, which contributed to relative results.
From a sector allocation perspective, an underweight in health care and overweight positions in telecom services and energy hampered relative results. An underweight in utilities aided performance over the reporting period.
By country, relative allocation strength was sourced from an overweight in China and overweight positions in the United States and Hong Kong, but somewhat offset by weakness from overweights in Brazil and Indonesia as well as an underweight in Japan.
Selection within the United States, France and Brazil dampened relative results while stock picks in the United Kingdom and Japan aided the Fund’s relative performance.
Sector weight deviations are a result of NFJ’s bottom-up investment process. On average during the reporting period, the Fund’s largest overweights relative to the benchmark index were in the telecom services and energy sectors, whereas the largest relative underweights were in the health care and consumer staples sectors.
Average Annual Total Return for the period ended May 31, 2015
| 6 Month* | 1 Year | 5 Year | Since Inception† | |||||||||||||||
| AllianzGI NFJ Global Dividend Value Fund Class A | –0.05% | –0.20% | 10.00% | 10.79% | ||||||||||||||
| AllianzGI NFJ Global Dividend Value Fund Class A (adjusted) | –5.55% | –5.69% | 8.76% | 9.74% | |||||||||||||
| AllianzGI NFJ Global Dividend Value Fund Class C | –0.48% | –1.00% | 9.15% | 9.93% | ||||||||||||||
| AllianzGI NFJ Global Dividend Value Fund Class C (adjusted) | –1.42% | –1.91% | 9.15% | 9.93% | |||||||||||||
| AllianzGI NFJ Global Dividend Value Fund Class D | –0.09% | –0.24% | 9.95% | 10.74% | |||||||||||||
| AllianzGI NFJ Global Dividend Value Fund Class P | 0.02% | –0.04% | 10.19% | 10.99% | |||||||||||||
| AllianzGI NFJ Global Dividend Value Fund Institutional Class | 0.05% | 0.01% | 10.30% | 11.09% | |||||||||||||
| MSCI AC World Index | 3.11% | 5.08% | 11.76% | 12.51% | |||||||||||||
| Lipper Global Equity Income Funds Average | 1.72% | 1.30% | 10.91% | 11.47% | ||||||||||||||
† The Fund began operations on 6/26/09. Benchmark return comparisons began on the fund inception date. Lipper performance comparisons began on 6/30/09.
* Cumulative return
Performance quoted represents past performance and is no guarantee of future results. Current performance may be lower or higher than performance shown. For performance current to the most recent month-end, visit our website at us.allianzgi.com. Investment return and the principal value will fluctuate. Shares may be worth more or less than original cost when redeemed. The adjusted returns take into account the maximum initial sales charge of 5.50% on Class A shares and the contingent deferred sales charge (CDSC) of 1% on Class C shares, which may apply to shares redeemed during the first year of ownership. Returns do not reflect deduction of taxes that a shareholder would pay on fund distributions or redemption of fund shares. See pages 106 and 107 for more information. The Fund’s gross expense ratios are 1.46% for Class A shares, 2.22% for Class C shares, 1.47% for Class D shares, 1.28% for Class P shares and 1.18% for Institutional Class shares. These ratios do not include an expense reduction, contractually guaranteed through at least 3/31/16. The Fund’s expense ratios net of this reduction are 1.20% for Class A shares, 1.99% for Class C shares, 1.20% for Class D shares, 1.04% for Class P shares and 0.95% for Institutional Class shares. Expense ratio information is as of the Fund’s current prospectus dated April 1, 2015, as supplemented to date.
| 90 | May 31, 2015 | | Semiannual Report |
Table of Contents
Unaudited
AllianzGI NFJ Global Dividend Value Fund (cont’d)
Cumulative Returns Through May 31, 2015
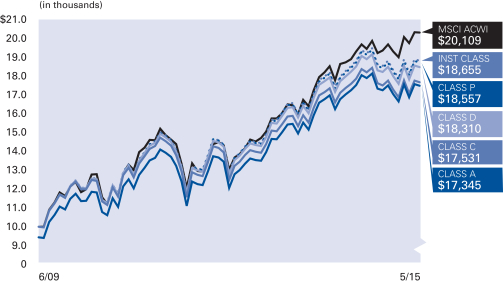
Country Allocation (as of May 31, 2015)
| United States | 39.2% | |||
| United Kingdom | 14.3% | |||
| Japan | 6.7% | |||
| China | 4.3% | |||
| Israel | 3.9% | |||
| France | 3.7% | |||
| South Africa | 3.6% | |||
| Spain | 3.6% | |||
| Other | 18.3% | |||
| Cash & Equivalents — Net | 2.4% |
| Shareholder Expense Example | Actual Performance | |||||||||
| Class A | Class C | Class D | Class P | Institutional Class | ||||||
| Beginning Account Value (12/1/14) | $1,000.00 | $1,000.00 | $1,000.00 | $1,000.00 | $1,000.00 | |||||
| Ending Account Value (5/31/15) | $999.50 | $995.20 | $999.10 | $1,000.20 | $1,000.50 | |||||
| Expenses Paid During Period | $5.98 | $9.90 | $6.28 | $5.19 | $4.74 | |||||
| Hypothetical Performance | ||||||||||
| (5% return before expenses) | ||||||||||
| Class A | Class C | Class D | Class P | Institutional Class | ||||||
| Beginning Account Value (12/1/14) | $1,000.00 | $1,000.00 | $1,000.00 | $1,000.00 | $1,000.00 | |||||
| Ending Account Value (5/31/15) | $1,018.95 | $1,015.01 | $1,018.65 | $1,019.75 | $1,020.19 | |||||
| Expenses Paid During Period | $6.04 | $10.00 | $6.34 | $5.24 | $4.78 | |||||
For each class of the Fund, expenses (net of fee waiver and reimbursement, if any) are equal to the annualized expense ratio for the class (1.20% for Class A, 1.99% for Class C, 1.26% for Class D, 1.04% for Class P and 0.95% for Institutional Class), multiplied by the average account value over the period, multiplied by 182/365.
| Semiannual Report | | May 31, 2015 | 91 |
Table of Contents
Unaudited
AllianzGI NFJ International Small-Cap Value Fund
For the period of December 1, 2014 through May 31, 2015, as provided by Krysta Hill, Product Specialist Associate, and reviewed by L. Baxter Hines, CFA, Portfolio Manager/Analyst.
Fund Insights
For the reporting period ended May 31, 2015, Class A shares at NAV of the AllianzGI NFJ International Small-Cap Fund (the “Fund”) returned 10.07%, outperforming the MSCI World ex USA Small Cap Index (the “benchmark index”), which returned 9.13%
Market Environment
International small-capitalization equities rose 9.13% during the trailing six months ended May 31, 2015, as measured by the benchmark index. This performance vastly outpaced other international indices, including the MSCI EAFE Net, which appreciated 4.84%, the MSCI AC World ex-USA Net, which climbed 3.16%, and the MSCI Emerging Markets Index, which gained 0.82% over the reporting period. Of the 22 countries in the benchmark index, just four swung to a loss: Canada, Norway, Portugal and Singapore. Top performers over the period were stocks largely based in Europe, including Ireland, Italy, the United Kingdom, Denmark and Switzerland, as well as companies in Japan and Hong Kong. The spread between the best (consumer discretionary) and worst (energy) performing sectors within the benchmark index was broad at almost 20%. All but two of the ten economic sectors generated positive returns across the six-month period, with six sectors, led by consumer discretionary, information technology, health care and materials names, leading performance gains. Conversely, the energy and utilities sectors dipped to a loss. Two sectors each comprised over 20% of the benchmark index, industrials, which secured a 10.96% return, and financials, which realized an 8.52% gain during the reporting period.
Portfolio Review
The Fund’s outperformance versus the benchmark index was due primarily to positive stock selection, while sector and country allocations were slightly negative during the period.
In terms of stock selection, the Fund’s holdings in the materials, consumer discretionary and industrials sectors contributed to performance. This was only slightly dampened by the Fund’s holdings in the financials and utilities sectors, which failed to keep pace with benchmark index shares.
By country, selection was strong in Japan and the United Kingdom, but partially diminished by poor selection in Canada and Switzerland.
From a sector allocation perspective, an overweight in telecom services and underweights in the energy and consumer discretionary sectors detracted during the reporting period. Conversely, underweight positions in the health care and utilities sectors contributed to results.
The Fund’s overweight positions in off-benchmark countries including Taiwan, the Philippines and Brazil, were primary detractors from relative returns. These negative results were somewhat offset by the Fund’s overweights in China and Cambodia and underweights in Canada and Singapore.
Sector weight deviations are a result of NFJ’s bottom-up investment process. On average during the reporting period, the Fund’s largest overweights relative to the benchmark index were in the financials and telecom services sectors, whereas the largest relative underweights were in the consumer staples and consumer discretionary sectors.
Average Annual Total Return for the period ended May 31, 2015
| 6 Month* | 1 Year | Since Inception† | ||||||||||||
| AllianzGI NFJ International Small-Cap Value Fund Class A | 10.07% | 5.68 | % | 18.44% | ||||||||||
| AllianzGI NFJ International Small-Cap Value Fund Class A (adjusted) | 4.01% | –0.14 | % | 16.23% | |||||||||
| AllianzGI NFJ International Small-Cap Value Fund Class C | 9.61% | 4.84 | % | 17.58% | ||||||||||
| AllianzGI NFJ International Small-Cap Value Fund Class C (adjusted) | 8.63% | 3.91 | % | 17.58% | |||||||||
| AllianzGI NFJ International Small-Cap Value Fund Class D | 10.07% | 5.65 | % | 18.45% | |||||||||
| AllianzGI NFJ International Small-Cap Value Fund Class P | 10.14% | 5.81 | % | 18.62% | |||||||||
| AllianzGI NFJ International Small-Cap Value Fund Institutional Class | 10.24% | 5.98 | % | 18.76% | |||||||||
| MSCI World ex USA Small Cap Index | 9.13% | –0.31 | % | 16.25% | |||||||||
| Lipper International Small/Mid-Cap Value Funds Average | 9.05% | 1.46 | % | 17.75% | ||||||||||
† The Fund began operations on 6/1/12. Benchmark return comparisons began on the fund inception date. Lipper performance comparisons began on 5/31/12.
* Cumulative return
Performance quoted represents past performance and is no guarantee of future results. Current performance may be lower or higher than performance shown. For performance current to the most recent month-end, visit our website at us.allianzgi.com. Investment return and the principal value will fluctuate. Shares may be worth more or less than original cost when redeemed. The adjusted returns take into account the maximum initial sales charge of 5.50% on Class A shares and the contingent deferred sales charge (CDSC) of 1% on Class C shares, which may apply to shares redeemed during the first year of ownership. Returns do not reflect deduction of taxes that a shareholder would pay on fund distributions or redemption of fund shares. See pages 106 and 107 for more information. The Fund’s gross expense ratios are 2.64% for Class A shares, 3.40% for Class C shares, 3.47% for Class D shares, 2.39% for Class P shares and 2.31% for Institutional Class shares. These ratios do not include an expense reduction, contractually guaranteed through at least 3/31/16. The Fund’s expense ratios net of this reduction are 1.45% for Class A shares, 2.20% for Class C shares, 1.45% for Class D shares, 1.30% for Class P shares and 1.20% for Institutional Class shares. Expense ratio information is as of the Fund’s current prospectus dated April 1, 2015, as supplemented to date.
| 92 | May 31, 2015 | | Semiannual Report |
Table of Contents
Unaudited
AllianzGI NFJ International Small-Cap Value Fund (cont’d)
Cumulative Returns Through May 31, 2015
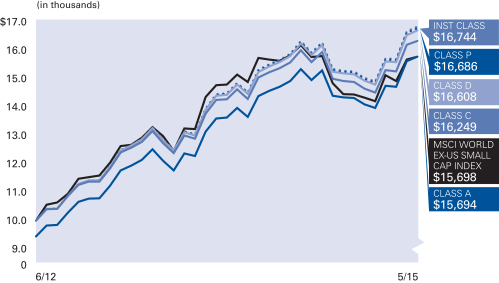
Country Allocation (as of May 31, 2015)
| Japan | 18.2% | |||
| United Kingdom | 17.4% | |||
| Canada | 9.0% | |||
| Hong Kong | 5.0% | |||
| China | 5.0% | |||
| Australia | 4.2% | |||
| Germany | 4.0% | |||
| Italy | 3.3% | |||
| Other | 30.5% | |||
| Cash & Equivalents — Net | 3.4% |
| Shareholder Expense Example | Actual Performance | |||||||||
| Class A | Class C | Class D | Class P | Institutional Class | ||||||
| Beginning Account Value (12/1/14) | $1,000.00 | $1,000.00 | $1,000.00 | $1,000.00 | $1,000.00 | |||||
| Ending Account Value (5/31/15) | $1,100.70 | $1,096.10 | $1,100.70 | $1,101.40 | $1,102.40 | |||||
| Expenses Paid During Period | $7.65 | $11.55 | $7.65 | $6.86 | $6.34 | |||||
| Hypothetical Performance | ||||||||||
| (5% return before expenses) | ||||||||||
| Class A | Class C | Class D | Class P | Institutional Class | ||||||
| Beginning Account Value (12/1/14) | $1,000.00 | $1,000.00 | $1,000.00 | $1,000.00 | $1,000.00 | |||||
| Ending Account Value (5/31/15) | $1,017.65 | $1,013.91 | $1,017.65 | $1,018.40 | $1,018.90 | |||||
| Expenses Paid During Period | $7.34 | $11.10 | $7.34 | $6.59 | $6.09 | |||||
For each class of the Fund, expenses (net of fee waiver and reimbursement, if any) are equal to the annualized expense ratio for the class (1.46% for Class A, 2.21% for Class C, 1.46% for Class D, 1.31% for Class P and 1.21% for Institutional Class), multiplied by the average account value over the period, multiplied by 182/365.
| Semiannual Report | | May 31, 2015 | 93 |
Table of Contents
Unaudited
AllianzGI NFJ International Value II Fund
For the period of December 1, 2014 through May 31, 2015, as provided by Krysta Hill, Product Specialist Associate, and reviewed by L. Baxter Hines, CFA, Portfolio Manager/Analyst.
Fund Insights
For the reporting period ended May 31, 2015, Class A shares at NAV of the AllianzGI NFJ International Value II Fund (the “Fund”) returned 5.04%, outperforming the MSCI EAFE Index (the “benchmark index”), which returned 4.84%.
Market Environment
International developed economies generated some of the strongest returns over the trailing six-month reporting period, with the benchmark index up 4.84%, US equities, as measured by the S&P 500 Index, gaining 2.97% and the MSCI Emerging Markets Index climbing a more moderate 0.82%. Monetary policy was a key theme across the international landscape, led by the ECB’s €60 billion monthly bond purchase program, which began in early March. Sweden’s central bank also announced a bond-buying package worth 10 billion Swedish kronor to spur inflation and initiated a negative benchmark index rate of -0.1%. Strength from the Asia/Pacific region was due in part to lending rate cuts across Australia, China, India, Indonesia, South Korea and Thailand. Of the 21 countries in the benchmark index, Denmark, Japan, Hong Kong, Israel and Ireland were the strongest-performing countries. Conversely, six countries dipped to a loss during the reporting period, including Spain, New Zealand, Finland, Singapore, Austria and Australia. The spread between the best (consumer discretionary) and worst (utilities) performing sectors within the benchmark index was over 11%. All but two benchmark index sectors generated positive returns across the six-month period, with the utilities and energy sinking to 2% losses. The strongest performance was realized by consumer discretionary, information technology and industrials names.
Portfolio Review
The Fund’s outperformance versus the benchmark index was due to positive stock selection, while country and sector allocations detracted somewhat from relative performance.
In terms of stock selection, the Fund’s holdings in the financials, consumer discretionary and materials sectors added to relative performance. This was somewhat offset by negative selection in the industrials and utilities sectors.
By country, selection was strong in the United Kingdom, France and Japan and only somewhat offset by negative selection across Hong Kong and Denmark.
From a sector allocation perspective, an overweight in the energy sector and an underweight in the industrials sector dampened relative results. Conversely, an overweight in the consumer discretionary sector and an underweight in the consumer staples sector boosted performance during the reporting period.
Overweight positions in the off-benchmark index countries of Canada, India and Brazil, as well as an underweight in Japan, hindered relative performance. The portfolio’s underweight positions in Switzerland, Spain and Australia added to gains.
Sector weight deviations are a result of NFJ’s bottom-up investment process. On average during the reporting period, the Fund’s largest overweights relative to the benchmark index were in the consumer discretionary and energy sectors, whereas the largest relative underweights were in the consumer staples and health care sectors.
Average Annual Total Return for the period ended May 31, 2015
| 6 Month* | 1 Year | Since Inception† | ||||||||||||
| AllianzGI NFJ International Value II Fund Class A | 5.04% | –0.68% | 9.86% | |||||||||||
| AllianzGI NFJ International Value II Fund Class A (adjusted) | –0.74% | –6.14% | 8.10% | ||||||||||
| AllianzGI NFJ International Value II Fund Class C | 4.67% | –1.41% | 9.04% | |||||||||||
| AllianzGI NFJ International Value II Fund Class C (adjusted) | 3.67% | –2.38% | 9.04% | ||||||||||
| AllianzGI NFJ International Value II Fund Class D | 5.10% | –0.65% | 9.86% | ||||||||||
| AllianzGI NFJ International Value II Fund Class P | 5.21% | –0.46% | 10.09% | ||||||||||
| AllianzGI NFJ International Value II Fund Institutional Class | 5.21% | –0.44% | 10.17% | ||||||||||
| MSCI EAFE Index | 4.84% | –0.48% | 11.63% | ||||||||||
| Lipper International Multi-Cap Value Funds Average | 4.84% | –2.20% | 10.12% | |||||||||||
† The Fund began operations on 12/1/11. Benchmark return comparisons began on the fund inception date. Lipper performance comparisons began on 11/30/11.
* Cumulative return
Performance quoted represents past performance and is no guarantee of future results. Current performance may be lower or higher than performance shown. For performance current to the most recent month-end, visit our website at us.allianzgi.com. Investment return and the principal value will fluctuate. Shares may be worth more or less than original cost when redeemed. The adjusted returns take into account the maximum initial sales charge of 5.50% on Class A shares and the contingent deferred sales charge (CDSC) of 1% on Class C shares, which may apply to shares redeemed during the first year of ownership. Returns do not reflect deduction of taxes that a shareholder would pay on fund distributions or redemption of fund shares. See pages 106 and 107 for more information. The Fund’s gross expense ratios are 2.46% for Class A shares, 3.23% for Class C shares, 2.45% for Class D shares, 2.11% for Class P shares and 1.78% for Institutional Class shares. These ratios do not include an expense reduction, contractually guaranteed through at least 3/31/16. The Fund’s expense ratios net of this reduction are 1.20% for Class A shares, 1.95% for Class C shares, 1.20% for Class D shares, 1.00% for Class P shares and 0.95% for Institutional Class shares. Expense ratio information is as of the Fund’s current prospectus dated April 1, 2015, as supplemented to date.
| 94 | May 31, 2015 | | Semiannual Report |
Table of Contents
Unaudited
AllianzGI NFJ International Value II Fund (cont’d)
Cumulative Returns Through May 31, 2015
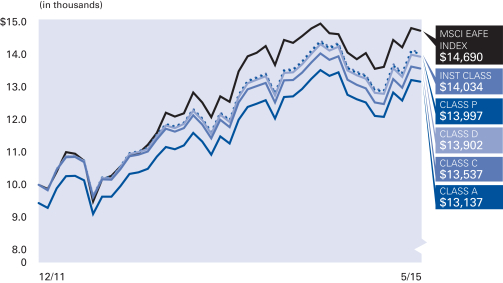
Country Allocation (as of May 31, 2015)
| United Kingdom | 22.0% | |||
| Japan | 13.2% | |||
| Hong Kong | 8.7% | |||
| France | 7.5% | |||
| Canada | 6.5% | |||
| China | 4.4% | |||
| Norway | 3.7% | |||
| Taiwan | 3.2% | |||
| Other | 25.5% | |||
| Cash & Equivalents — Net | 5.3% |
| Shareholder Expense Example | Actual Performance | |||||||||
| Class A | Class C | Class D | Class P | Institutional Class | ||||||
| Beginning Account Value (12/1/14) | $1,000.00 | $1,000.00 | $1,000.00 | $1,000.00 | $1,000.00 | |||||
| Ending Account Value (5/31/15) | $1,050.40 | $1,046.70 | $1,051.00 | $1,052.10 | $1,052.10 | |||||
| Expenses Paid During Period | $6.13 | $9.95 | $6.14 | $5.12 | $4.86 | |||||
| Hypothetical Performance | ||||||||||
| (5% return before expenses) | ||||||||||
| Class A | Class C | Class D | Class P | Institutional Class | ||||||
| Beginning Account Value (12/1/14) | $1,000.00 | $1,000.00 | $1,000.00 | $1,000.00 | $1,000.00 | |||||
| Ending Account Value (5/31/15) | $1,018.95 | $1,015.21 | $1,018.95 | $1,019.95 | $1,020.19 | |||||
| Expenses Paid During Period | $6.04 | $9.80 | $6.04 | $5.04 | $4.78 | |||||
For each class of the Fund, expenses (net of fee waiver and reimbursement, if any) are equal to the annualized expense ratio for the class (1.20% for Class A, 1.95% for Class C, 1.20% for Class D, 1.00% for Class P and 0.95% for Institutional Class), multiplied by the average account value over the period, multiplied by 182/365.
| Semiannual Report | | May 31, 2015 | 95 |
Table of Contents
Unaudited
AllianzGI Short Duration High Income Fund
For the period of December 1, 2014 through May 31, 2015, as provided by Doug Forsyth, CFA, Portfolio Manager.
Fund Insights
For the reporting period ended May 31, 2015, Class A shares at NAV of the AllianzGI Short Duration High Income Fund (the “Fund”) returned 3.20%, outperforming the BofA Merrill Lynch 1-3 Year BB US Cash Pay High Yield Index (the “benchmark index”), which returned 2.52%.
Market Environment
In the beginning of the reporting period, there were several factors that influenced the high-yield market. Investors digested non-earnings-related influences, including the strengthening US dollar, harsh winter weather conditions that plagued the Northeast and the West Coast port shutdown. The impact of these factors is considered short-lived, since they should not affect the positive financial condition of the core credit market. Energy prices continued to have an effect on the prices of high-yield energy issuers and the day-to-day volatility remained a challenge; however, market participants did a better job of isolating the commodity-price impact to those relevant issuers than was the case in the second half of 2014. Although prices moved lower overall among issuers in the energy industry, specifically among those in the exploration and production space, many issuers executed capital-market transactions. These transactions, both in new financing and in M&A activity, solidified balance sheets and extended the liquidity runway. Treasury-rate volatility remained a factor and its impact on the high-yield market was mixed. In addition, indicators generally pointed to a US economy that is slowly grinding higher. The data were arguably mixed, but the overall neutral to higher economic trend confirms the prospects for a continued low default rate for high-yield bonds. Finally, global central banks continued to be generally accommodative, and the Fed governors’ comments have maintained a dovish stance.
In the final months of the period, high-yield bonds advanced alongside stocks and provided diversification benefits as yields rose for US government bonds and US investment-grade corporate bonds. The asset class proved resilient in the face of rising rates and increased volatility in the treasury market. The high-yield market was aided by strong positions among energy issuers, which traded up concurrent with the rise in the price of crude oil. In addition, a better-than-feared start to the first-quarter earnings season had a positive impact on investor sentiment. Finally, mixed US economic data reinforced the message that the Fed would remain “patient” and the rate hike cycle would be gradual—a positive for risk assets.
Portfolio Review
For the period, performance of the Fund was positive and returns increased more than the benchmark index. Credit quality in the portfolio remains relatively high. The industries that contributed meaningfully to relative performance included weightings in metals/mining ex steel, gaming and energy. Contributions from energy were primarily in the subsector of gas distribution. These issuers have greater revenue visibility and less sensitivity to short term changes in commodity prices versus exploration and production companies. Minimal weightings versus the benchmark index in aerospace/defense also benefited performance. Offsetting these contributors to relative performance included weights in capital goods, steel and chemicals.
The Fund seeks a high level of current income while emphasizing the preservation of capital. The Fund’s outperformance these past six months can be largely attributed to the yield generated from the portfolio versus that of the benchmark index. Yield to worst for the Fund was consistently over 100 basis points higher than that of the benchmark index over the period. At the same time, duration for the Fund was lower than that of the benchmark index over the period to balance our objectives of maintaining high current income while attempting to preserve capital in the event of rising interest rates.
Average Annual Total Return for the period ended May 31, 2015
| 6 Month* | 1 Year | Since Inception† | ||||||||||||
| AllianzGI Short Duration High Income Fund Class A | 3.20% | 3.40% | 5.93% | |||||||||||
| AllianzGI Short Duration High Income Fund Class A (adjusted) | 0.88% | 1.08% | 5.28% | ||||||||||
| AllianzGI Short Duration High Income Fund Class C | 3.09% | 3.18% | 5.56% | |||||||||||
| AllianzGI Short Duration High Income Fund Class C (adjusted) | 2.09% | 2.19% | 5.56% | ||||||||||
| AllianzGI Short Duration High Income Fund Class D | 3.18% | 3.40% | 5.93% | ||||||||||
| AllianzGI Short Duration High Income Fund Class P | 3.30% | 3.56% | 6.10% | ||||||||||
| AllianzGI Short Duration High Income Fund Institutional Class | 3.35% | 3.62% | 6.21% | ||||||||||
| BofA Merrill Lynch 1-3 Year BB US Cash Pay High Yield Index | 2.52% | 2.84% | 6.69% | ||||||||||
† The Fund began operations on 10/3/11. Benchmark return comparisons began on the fund inception date.
* Cumulative return
Performance quoted represents past performance and is no guarantee of future results. Current performance may be lower or higher than performance shown. For performance current to the most recent month-end, visit our website at us.allianzgi.com. Investment return and the principal value will fluctuate. Shares may be worth more or less than original cost when redeemed. The adjusted returns take into account the maximum initial sales charge of 2.25% on Class A shares and the contingent deferred sales charge (CDSC) of 1% on Class C shares, which may apply to shares redeemed during the first year of ownership. Returns do not reflect deduction of taxes that a shareholder would pay on fund distributions or redemption of fund shares. See pages 106 and 107 for more information. The Fund’s gross expense ratios are 0.88% for Class A shares, 1.13% for Class C shares, 0.97% for Class D shares, 0.68% for Class P shares and 0.60% for Institutional Class shares. The ratio for Class D shares does not include an expense reduction, contractually guaranteed through at least 3/31/16. The Fund’s expense ratio net of this reduction is 0.85% for Class D shares. Expense ratio information is as of the Fund’s current prospectus dated April 1, 2015, as supplemented to date.
| 96 | May 31, 2015 | | Semiannual Report |
Table of Contents
Unaudited
AllianzGI Short Duration High Income Fund (cont’d)
Cumulative Returns Through May 31, 2015

Industry Allocation (as of May 31, 2015)
| Telecommunications | 10.5% | |||
| Home Builders | 9.4% | |||
| Diversified Financial Services | 6.6% | |||
| Retail | 5.7% | |||
| Pharmaceuticals | 4.7% | |||
| Containers & Packaging | 4.2% | |||
| Commercial Services & Supplies | 4.1% | |||
| Oil, Gas & Consumable Fuels | 3.6% | |||
| Other | 44.0% | |||
| Cash & Equivalents — Net | 7.2% |
Moody’s Ratings* (as of May 31, 2015)
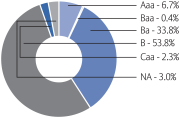
* As a percentage of total investments. Bond ratings refer to the underlying holdings of the Fund and are categorized from highest to lowest credit quality using ratings provided by Moody’s. Moody’s ratings have been selected for several reasons, including the access to information and materials provided by Moody’s, as well as the Fund’s consideration of industry practice. See “Important Information” for more detail on the selection of Moody’s for the Fund’s ratings presentation. Bonds not rated by Moody’s and bonds that do not currently have a rating available are designated in the chart above as “NR” and “NA”, respectively.
| Shareholder Expense Example | Actual Performance | |||||||||
| Class A | Class C | Class D | Class P | Institutional Class | ||||||
| Beginning Account Value (12/1/14) | $1,000.00 | $1,000.00 | $1,000.00 | $1,000.00 | $1,000.00 | |||||
| Ending Account Value (5/31/15) | $1,032.00 | $1,030.90 | $1,031.80 | $1,033.00 | $1,033.50 | |||||
| Expenses Paid During Period | $4.31 | $5.62 | $4.31 | $3.35 | $3.04 | |||||
| Hypothetical Performance | ||||||||||
| (5% return before expenses) | ||||||||||
| Class A | Class C | Class D | Class P | Institutional Class | ||||||
| Beginning Account Value (12/1/14) | $1,000.00 | $1,000.00 | $1,000.00 | $1,000.00 | $1,000.00 | |||||
| Ending Account Value (5/31/15) | $1,020.69 | $1,019.40 | $1,020.69 | $1,021.64 | $1,021.94 | |||||
| Expenses Paid During Period | $4.28 | $5.59 | $4.28 | $3.33 | $3.02 | |||||
For each class of the Fund, expenses (net of fee waiver and reimbursement, if any) are equal to the annualized expense ratio for the class (0.85% for Class A, 1.11% for Class C, 0.85% for Class D, 0.66% for Class P and 0.60% for Institutional Class), multiplied by the average account value over the period, multiplied by 182/365.
| Semiannual Report | | May 31, 2015 | 97 |
Table of Contents
Unaudited
AllianzGI Structured Return Fund
For the period of December 1, 2014, through May 31, 2015, as provided by Greg Tournant, Portfolio Manager.
Fund Insights
For the reporting period ended May 31, 2015, Class A shares at NAV of the AllianzGI Structured Return Fund (the “Fund”) returned 3.79%, outperforming the BofA Merrill Lynch 3-Month US Treasury Bill Index (the “benchmark index”), which returned 0.01%.
Portfolio Review
The Fund delivered consistent, positive returns for the period ended May 31, 2015. While equity markets exhibited increased choppiness during the period, the Fund demonstrated its ability to achieve its all-weather investment objective.
In December, equities destabilized as oil prices plunged, with the S&P 500 Index declining 4.5% in just a few days of trading. In response, we moved our
in-the-money call strikes from 2% to 4% to cushion the portfolio against the market decline. The benchmark index recovered to finish the month down just 0.25%.
Equity indices fluctuated throughout the period, yet ultimately did not get very far. The S&P 500 Index returned -3.00% in January, 5.75% in February and -1.58% in March, culminating in a quarterly return of 0.95%. Implied volatility, which in mid-December began its longest-lasting increase in years as oil-price instability roiled markets, was elevated at the start of the year.
Higher-volatility environments are often tied to a decline, or at least the fear of one, in the equity markets, and typically are characterized by a CBOE Volatility Index (“VIX”) level greater than 20. Increased volatility is advantageous for the Fund, in two ways: larger return potential and lower expected risk. In such environments, we are usually able to construct short in-the-money covered call positions that we believe can endure a larger equity-market decline without the need to restructure any positions, and which at the same time are more lucrative. Despite the S&P 500 Index’s sizable fluctuations throughout the quarter, we were able to hold all our positions to expiration, as is our objective.
In addition to realizing gains from in-the-money call selling at the beginning of the year, the Fund also profited from directional premium collection positions in February. As a reminder, directional positions are opportunistically incorporated into the portfolio to pursue additional incremental returns. These positions, in combination with the benefit of higher implied volatility in January, contributed to the above-target return of 1.11% in February. There were no notable detractors during the reporting period.
In March, equity markets fluctuated as investors reacted to varying news. Markets declined on worries about corporate earnings after the ECB stimulus prompted the dollar to strengthen, and then climb, as fears of a near-term Federal Reserve interest rate hike abated. The VIX declined to the mid-teens, as volatility dampened. The Fund performed in line with expectations, returning 0.39%.
In April, the S&P 500 Index climbed 0.96% on speculation that weaker than expected economic data would push out the timeline for an expected Fed interest-rate hike. Stronger economic results in May extended the equity rally as the broad market appreciated 1.96%. Implied volatility remained well below its historical average during this time. The Fund delivered returns in line with expectations, gaining 0.58% in April and 0.52% in May.
In an environment in which predicting the direction of equity and fixed income markets has been as challenging as ever, the non-directional nature of its investment approach has served the Fund well. The absence of a clear trend thus far this year has been problematic for other types of liquid alternative strategies, but so far the Fund has been able to withstand the choppiness and benefit from it.
Regardless of what lies ahead, we believe the Fund is well positioned to pursue steady returns with bond-like risk, low sensitivity to equity markets and the ability to navigate a wide range of market scenarios.
Average Annual Total Return for the period ended May 31, 2015
| 6 Month* | 1 Year | Since Inception† | ||||||||||||
| AllianzGI Structured Return Fund Class A | 3.79 | % | 5.89 | % | 5.28 | % | ||||||||
| AllianzGI Structured Return Fund Class A (adjusted) | –1.92 | % | 0.07 | % | 2.92 | % | |||||||
| AllianzGI Structured Return Fund Class C | 3.46 | % | 5.16 | % | 4.49 | % | ||||||||
| AllianzGI Structured Return Fund Class C (adjusted) | 2.46 | % | 4.16 | % | 4.49 | % | |||||||
| AllianzGI Structured Return Fund Class D | 3.82 | % | 5.92 | % | 5.35 | % | |||||||
| AllianzGI Structured Return Fund Class P | 3.85 | % | 6.08 | % | 5.44 | % | |||||||
| AllianzGI Structured Return Fund Institutional Class | 3.94 | % | 6.17 | % | 5.56 | % | |||||||
| BofA Merrill Lynch 3-Month US Treasury Bill Index | 0.01 | % | 0.02 | % | 0.05 | % | |||||||
| Lipper Absolute Return Funds Average | 1.29 | % | 2.19 | % | 3.38 | % | ||||||||
† The Fund began operations on 12/3/12. Benchmark return comparisons began on the fund inception date. Lipper performance comparisons began on 11/30/12.
* Cumulative return
Performance quoted represents past performance and is no guarantee of future results. Current performance may be lower or higher than performance shown. For performance current to the most recent month-end, visit our website at us.allianzgi.com. Investment return and the principal value will fluctuate. Shares may be worth more or less than original cost when redeemed. The adjusted returns take into account the maximum initial sales charge of 5.50% on Class A shares and the contingent deferred sales charge (CDSC) of 1% on Class C shares, which may apply to shares redeemed during the first year of ownership. Returns do not reflect deduction of taxes that a shareholder would pay on fund distributions or redemption of fund shares. See pages 106 and 107 for more information. The Fund’s gross expense ratios are 4.31% for Class A shares, 4.83% for Class C shares, 5.14% for Class D shares, 3.82% for Class P shares and 3.74% for Institutional Class shares. These ratios do not include an expense reduction, contractually guaranteed through at least 3/31/16. The Fund’s expense ratios net of this reduction are 1.24% for Class A shares, 1.99% for Class C shares, 1.24% for Class D shares, 1.09% for Class P shares and 0.99% for Institutional Class shares. Expense ratio information is as of the Fund’s current prospectus dated April 1, 2015, as supplemented to date.
| 98 | May 31, 2015 | | Semiannual Report |
Table of Contents
Unaudited
AllianzGI Structured Return Fund (cont’d)
Cumulative Returns Through May 31, 2015
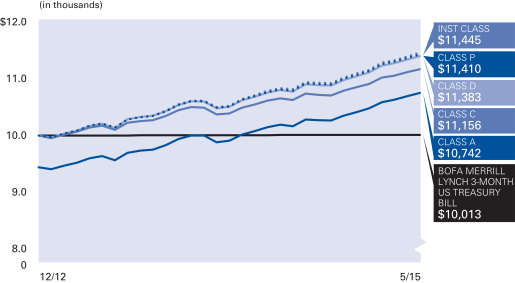
Asset Allocation (as of May 31, 2015)
| Exchange-Traded Funds | 95.2% | |||
| Cash & Equivalents — Net (including Options Purchased and Written) | 4.8% |
| Shareholder Expense Example | Actual Performance | |||||||||
| Class A | Class C | Class D | Class P | Institutional Class | ||||||
| Beginning Account Value (12/1/14) | $1,000.00 | $1,000.00 | $1,000.00 | $1,000.00 | $1,000.00 | |||||
| Ending Account Value (5/31/15) | $1,037.90 | $1,034.60 | $1,038.20 | $1,038.50 | $1,039.40 | |||||
| Expenses Paid During Period | $5.84 | $9.64 | $5.84 | $5.08 | $4.58 | |||||
| Hypothetical Performance | ||||||||||
| (5% return before expenses) | ||||||||||
| Class A | Class C | Class D | Class P | Institutional Class | ||||||
| Beginning Account Value (12/1/14) | $1,000.00 | $1,000.00 | $1,000.00 | $1,000.00 | $1,000.00 | |||||
| Ending Account Value (5/31/15) | $1,019.20 | $1,015.46 | $1,019.20 | $1,019.95 | $1,020.44 | |||||
| Expenses Paid During Period | $5.79 | $9.55 | $5.79 | $5.04 | $4.53 | |||||
For each class of the Fund, expenses (net of fee waiver and reimbursement, if any) are equal to the annualized expense ratio for the class (1.15% for Class A, 1.90% for Class C, 1.15% for Class D, 1.00% for Class P and 0.90% for Institutional Class), multiplied by the average account value over the period, multiplied by 182/365. The expense ratio does not include the expenses of the Underlying Funds, which based upon the allocation of the Fund’s assets among the Underlying Funds are indirectly borne by the shareholders of the Fund.
| Semiannual Report | | May 31, 2015 | 99 |
Table of Contents
Unaudited
AllianzGI U.S. Equity Hedged Fund
For the period of December 1, 2014 through May 31, 2015, as provided by Greg Tournant, Portfolio Manager.
Fund Insights
For the reporting period ended May 31, 2015, Class A shares at NAV of the AllianzGI U.S. Equity Hedged Fund (the “Fund”) returned 0.46%, underperforming the S&P 500 Index (the “benchmark index”), which returned 2.97%.
Portfolio Review
With equity markets undergoing increased choppiness, the Fund performed in line with expectations. While performance trailed the benchmark index for the period, the Fund provided a hedge during the market’s pullbacks and smoothed out its fluctuations.
The Fund seeks to provide protection against equity market declines while preserving the upside of the underlying passive equity market portfolio. The Fund pursues this objective by buying laddered, deep out-of-money put options while simultaneously selling calls at varying strike distances.
One of the distinguishing features of the strategy is the duration mismatch between its put and call option positions. The Fund’s long puts have approximately one-year duration at purchase, while its short calls have a weighted average duration of approximately one month. This enables the underlying equity portfolio to participate in a rising equity market, while remaining hedged against potential equity market declines. Longer-term, the Fund seeks to capture the majority of the benchmark index’s upside, while reducing the variability of returns by as much as 50% and creating a downside floor in the event of a market crash.
Volatility returned to the equity markets in December. With oil prices plunging, the S&P 500 Index dropped 4.5% in a few trading days. However, continued strong positive US economic data and GDP growth offset oil and euro zone concerns, enabling the benchmark index to finish the month down 0.25%. The Fund again smoothed out the intra-month volatility, outperforming the index and declining 0.07% for the month.
In January, disappointing US economic data and concerns surrounding the election in Greece caused equity markets to fluctuate sharply. The Fund’s long put protection provided a cushion during the declines while gains from its short call positions helped smooth performance. For the month, the Fund declined 2.11% while the benchmark index fell 3.00%.
From there, equities rallied on positive economic data and news of increased euro-zone stability. The benchmark index went on to gain 5.75% in February. The rapid ascent of the equity market, coupled with the decline in implied volatility, created a performance drag for the Fund. Our short call positions, which had been written between 3% and 4% out-of-the-money, were unable to avoid interfering with the run-up of the underlying passive equity portfolio, causing the Fund to miss out on approximately 60 bps of upside participation. In addition, our long put positions decreased in value as the market rose and the VIX declined, further curtailing gains. The Fund appreciated 2.76% for the month.
In March, equity markets first declined on worries about corporate earnings after the ECB’s stimulus prompted the dollar to strengthen, and then climbed as fears of a near-term Federal Reserve interest rate hike abated. Amid the volatility, the Fund fell 1.34% for the month compared with a decline of 1.58% for the benchmark index.
In April, the benchmark index climbed 0.96% on speculation that weaker than expected economic data would push out the timeline for an expected Fed interest rate hike. Stronger economic results in May extended the equity rally as the broad market appreciated 1.96%. Our short S&P 500 Index calls were written approximately 3% away from the benchmark index level at inception, allowing the fund to meaningfully participate in the market’s advance. The A share class of the Fund returned 0.59% and 0.71% in April and May, respectively.
The Fund is best positioned to outperform during a market correction, which, to the delight of equity investors, has yet to materialize over the past several years. January 2015 and October 2014 are the most recent examples of market pullbacks, and in both cases the rebound was swift. While the Fund can help smooth equity returns in such environments, they typically do not give the portfolio much opportunity to impact performance.
By seeking to maximize upside participation, reduce downside exposure and protect against crash risk, the Fund aims to give equity investors confidence without missing most of the upside.
Average Annual Total Return for the period ended May 31, 2015
| 6 Month* | 1 Year | Since Inception† | ||||||||||||
| AllianzGI U.S. Equity Hedged Fund Class A | 0.46% | 5.48% | 9.95% | |||||||||||
| AllianzGI U.S. Equity Hedged Fund Class A (adjusted) | –5.07% | –0.32% | 7.48% | ||||||||||
| AllianzGI U.S. Equity Hedged Fund Class C | 0.05% | 4.64% | 9.15% | |||||||||||
| AllianzGI U.S. Equity Hedged Fund Class C (adjusted) | –0.91% | 3.68% | 9.15% | ||||||||||
| AllianzGI U.S. Equity Hedged Fund Class D | 0.41% | 5.40% | 9.94% | ||||||||||
| AllianzGI U.S. Equity Hedged Fund Class P | 0.53% | 5.63% | 10.14% | ||||||||||
| AllianzGI U.S. Equity Hedged Fund Institutional Class | 0.57% | 5.74% | 10.25% | ||||||||||
| S&P 500 Index | 2.97% | 11.81% | 20.03% | ||||||||||
| Lipper Alternative Long/Short Equity Funds Average | 2.45% | 3.95% | 8.54% | |||||||||||
† The Fund began operations on 12/3/12. Benchmark return comparisons began on the fund inception date. Lipper performance comparisons began on 11/30/12.
* Cumulative return
Performance quoted represents past performance and is no guarantee of future results. Current performance may be lower or higher than performance shown. For performance current to the most recent month-end, visit our website at us.allianzgi.com. Investment return and the principal value will fluctuate. Shares may be worth more or less than original cost when redeemed. The adjusted returns take into account the maximum initial sales charge of 5.50% on Class A shares and the contingent deferred sales charge (CDSC) of 1% on Class C shares, which may apply to shares redeemed during the first year of ownership. Returns do not reflect deduction of taxes that a shareholder would pay on fund distributions or redemption of fund shares. See pages 106 and 107 for more information. The Fund’s gross expense ratios are 3.79% for Class A shares, 4.57% for Class C shares, 8.52% for Class D shares, 3.47% for Class P shares and 3.13% for Institutional Class shares. These ratios do not include an expense reduction, contractually guaranteed through at least 3/31/16. The Fund’s expense ratios net of this reduction are 1.34% for Class A shares, 2.09% for Class C shares, 1.34% for Class D shares, 1.19% for Class P shares and 1.09% for Institutional Class shares. Expense ratio information is as of the Fund’s current prospectus dated April 1, 2015, as supplemented to date.
| 100 | May 31, 2015 | | Semiannual Report |
Table of Contents
Unaudited
AllianzGI U.S. Equity Hedged Fund (cont’d)
Cumulative Returns Through May 31, 2015
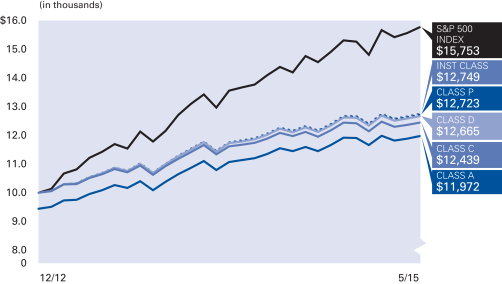
Asset Allocation (as of May 31, 2015)
| Exchange-Traded Funds | 97.0% | |||
| Cash & Equivalents — Net (including Options Purchased and Written) | 3.0% |
| Shareholder Expense Example | Actual Performance | |||||||||
| Class A | Class C | Class D | Class P | Institutional Class | ||||||
| Beginning Account Value (12/1/14) | $1,000.00 | $1,000.00 | $1,000.00 | $1,000.00 | $1,000.00 | |||||
| Ending Account Value (5/31/15) | $1,004.60 | $1,000.50 | $1,004.10 | $1,005.30 | $1,005.70 | |||||
| Expenses Paid During Period | $6.30 | $10.02 | $6.30 | $5.55 | $5.05 | |||||
| Hypothetical Performance | ||||||||||
| (5% return before expenses) | ||||||||||
| Class A | Class C | Class D | Class P | Institutional Class | ||||||
| Beginning Account Value (12/1/14) | $1,000.00 | $1,000.00 | $1,000.00 | $1,000.00 | $1,000.00 | |||||
| Ending Account Value (5/31/15) | $1,018.65 | $1,014.91 | $1,018.65 | $1,019.40 | $1,019.90 | |||||
| Expenses Paid During Period | $6.34 | $10.10 | $6.34 | $5.59 | $5.09 | |||||
For each class of the Fund, expenses (net of fee waiver and reimbursement, if any) are equal to the annualized expense ratio for the class (1.26% for Class A, 2.01% for Class C, 1.26% for Class D, 1.11% for Class P and 1.01% for Institutional Class), multiplied by the average account value over the period, multiplied by 182/365. The expense ratio does not include the expenses of the Underlying Funds, which based upon the allocation of the Fund’s assets among the Underlying Funds are indirectly borne by the shareholders of the Fund.
| Semiannual Report | | May 31, 2015 | 101 |
Table of Contents
Unaudited
AllianzGI U.S. Small-Cap Growth Fund
For the period of December 1, 2014 through May 31, 2015, as provided by John McCraw, Portfolio Manager.
Fund Insights
For the reporting period ended May 31, 2015, Class A shares at NAV of the AllianzGI U.S. Small-Cap Growth Fund (the “Fund”) returned 6.73%, underperforming the Russell 2000 Growth Index (the “benchmark index”), which returned 10.48%.
Market Environment
Overall, US stocks closed higher during the reporting period despite episodes of equity market volatility.
Early in the period, the decline in the price of crude oil accelerated and spilled into the broader market; however, stocks found their footing and moved higher into year-end with oil prices stabilizing. The FOMC’s meeting and subsequent communication to remain “patient” as it relates to future interest rate increases was a positive catalyst for the market. Lastly, a stronger-than-expected final third-quarter GDP report helped lift investor sentiment.
In the months that followed, volatility in the energy and currency markets as well as global macro-related headlines had an impact on day-to-day stock prices; however, Fed commentary and uncertainty surrounding the path of monetary policy arguably had a greater influence on investor sentiment. Aggressive actions by the ECB and other overseas central banks did not directly impact the stock market, but they reinforced the fact that the global landscape remains highly accommodative. Separately, fourth-quarter earnings and corporate actions including share buybacks, dividend increases and merger and acquisition activities supported a positive fundamental backdrop, while mixed economic reports signaled continued modest growth in the US.
As the end of the reporting period neared, equity prices weakened concurrent with a move higher in volatility and government bond yields, but stabilized and rebounded as Treasuries rallied into the end of the period. On the economic front, reports were mixed, suggesting that the Fed would remain patient and the rate hike cycle would be gradual—a positive for risk assets. With respect to corporate profits, first-quarter earnings reported a meager gain, but were impressive nonetheless given Wall Street’s estimates heading into April. Ultimately, stocks proved resilient in the face of interest rate volatility, macro uncertainties abroad and slower growth.
Against this backdrop, the Russell 2000 Index returned 6.94% and outperformed the Russell 1000 Index, which returned 3.41%. Within the small-cap universe, growth-oriented stocks outperformed value-oriented stocks. Specific to the benchmark index, sector performance was predominantly positive. Health care, utilities and information technology were the strongest-performing sectors, followed by financials, consumer discretionary and energy. By contrast, consumer staples was the only sector to decline and the materials and telecommunication services sectors gained the least.
Portfolio Review
The Fund underperformed its benchmark index over the reporting period. From an attribution perspective, security selection effects were the primary driver of relative underperformance, whereas asset allocation impacts were negligible. For example, stock picking was negative in the information technology, industrials, consumer discretionary, and health care sectors, whereas security selection in energy, financials and telecom services was positive. Separately, an overweight in the health care and financials sectors hindered relative performance, but was offset by an underweight in the consumer staples and consumer discretionary sectors.
Average Annual Total Return for the period ended May 31, 2015
| 6 Month* | 1 Year | 5 Year | 10 Year | Since Inception† | ||||||||||||||||||
| AllianzGI U.S. Small-Cap Growth Fund Class A | 6.73% | 9.00% | 15.10% | 10.11% | 7.95% | |||||||||||||||||
| AllianzGI U.S. Small-Cap Growth Fund Class A (adjusted) | 0.86% | 3.00% | 13.81% | 9.49% | 7.67% | ||||||||||||||||
| AllianzGI U.S. Small-Cap Growth Fund Class C | 6.32% | 8.14% | 14.26% | 9.30% | 7.15% | |||||||||||||||||
| AllianzGI U.S. Small-Cap Growth Fund Class C (adjusted) | 5.35% | 7.19% | 14.26% | 9.30% | 7.15% | ||||||||||||||||
| AllianzGI U.S. Small-Cap Growth Fund Class D | 6.72% | 8.99% | 15.12% | 10.12% | 7.95% | ||||||||||||||||
| AllianzGI U.S. Small-Cap Growth Fund Class R | 6.60% | 8.70% | 14.85% | 9.85% | 7.69% | ||||||||||||||||
| AllianzGI U.S. Small-Cap Growth Fund Class P | 6.77% | 9.14% | 15.36% | 10.37% | 8.21% | ||||||||||||||||
| AllianzGI U.S. Small-Cap Growth Fund Institutional Class | 6.86% | 9.23% | 15.48% | 10.48% | 8.32% | ||||||||||||||||
| Russell 2000 Growth Index | 10.48% | 17.73% | 17.37% | 10.06% | 7.56% | ||||||||||||||||
| Lipper Small-Cap Growth Funds Average | 8.31% | 14.73% | 16.15% | 9.13% | 9.19% | |||||||||||||||||
† The Fund began operations on 10/1/93. Benchmark return comparisons began on the fund inception date. Lipper performance comparisons began on 9/30/93.
* Cumulative return
Performance quoted represents past performance and is no guarantee of future results. Current performance may be lower or higher than performance shown. For performance current to the most recent month-end, visit our website at us.allianzgi.com. Investment return and the principal value will fluctuate. Shares may be worth more or less than original cost when redeemed. The adjusted returns take into account the maximum initial sales charge of 5.50% on Class A shares and the contingent deferred sales charge (CDSC) of 1% on Class C shares, which may apply to shares redeemed during the first year of ownership. Returns do not reflect deduction of taxes that a shareholder would pay on fund distributions or redemption of fund shares. See pages 106 and 107 for more information. The Fund’s gross expense ratios are 1.89% for Class A shares, 2.69% for Class C shares, 1.92% for Class D shares, 2.20% for Class R shares, 1.76% for Class P shares and 1.66% for Institutional Class shares. These ratios do not include an expense reduction, contractually guaranteed through at least 3/31/16. The Fund’s expense ratios net of this reduction are 1.40% for Class A shares, 2.20% for Class C shares, 1.42% for Class D shares, 1.65% for Class R shares, 1.25% for Class P shares and 1.16% for Institutional Class shares. Expense ratio information is as of the Fund’s current prospectus dated April 1, 2015, as supplemented to date.
| 102 | May 31, 2015 | | Semiannual Report |
Table of Contents
Unaudited
AllianzGI U.S. Small-Cap Growth Fund (cont’d)
Cumulative Returns Through May 31, 2015
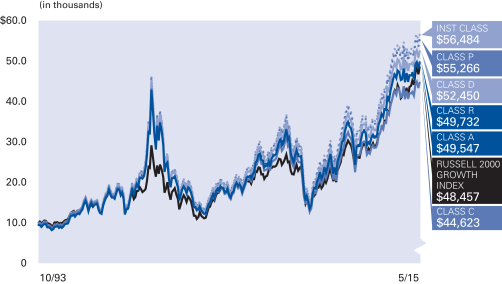
Industry Allocation (as of May 31, 2015)
Semiconductors & Semiconductor Equipment | 8.4% | |||
Software | 8.2% | |||
Health Care Providers & Services | 7.4% | |||
Hotels, Restaurants & Leisure | 7.1% | |||
Biotechnology | 6.1% | |||
Banks | 5.5% | |||
Pharmaceuticals | 5.3% | |||
Oil, Gas & Consumable Fuels | 3.9% | |||
Other | 45.2% | |||
Cash & Equivalents — Net | 2.9% |
| Shareholder Expense Example | Actual Performance | |||||||||||
| Class A | Class C | Class D | Class R | Class P | Institutional Class | |||||||
| Beginning Account Value (12/1/14) | $1,000.00 | $1,000.00 | $1,000.00 | $1,000.00 | $1,000.00 | $1,000.00 | ||||||
| Ending Account Value (5/31/15) | $1,067.30 | $1,063.20 | $1,067.20 | $1,066.00 | $1,067.70 | $1,068.60 | ||||||
| Expenses Paid During Period | $7.22 | $11.32 | $7.32 | $8.50 | $6.44 | $5.98 | ||||||
| Hypothetical Performance | ||||||||||||
| (5% return before expenses) | ||||||||||||
| Class A | Class C | Class D | Class R | Class P | Institutional Class | |||||||
| Beginning Account Value (12/1/14) | $1,000.00 | $1,000.00 | $1,000.00 | $1,000.00 | $1,000.00 | $1,000.00 | ||||||
| Ending Account Value (5/31/15) | $1,017.95 | $1,013.96 | $1,017.85 | $1,016.70 | $1,018.70 | $1,019.15 | ||||||
| Expenses Paid During Period | $7.04 | $11.05 | $7.14 | $8.30 | $6.29 | $5.84 | ||||||
For each class of the Fund, expenses (net of fee waiver and reimbursement, if any) are equal to the annualized expense ratio for the class (1.40% for Class A, 2.20% for Class C, 1.42% for Class D, 1.65% for Class R, 1.25% for Class P and 1.16% for Institutional Class), multiplied by the average account value over the period, multiplied by 182/365.
| Semiannual Report | | May 31, 2015 | 103 |
Table of Contents
Unaudited
AllianzGI Ultra Micro Cap Fund
For the period of December 1, 2014 through May 31, 2015, as provided by John McCraw, Portfolio Manager.
Fund Insights
For the reporting period ended May 31, 2015, Class A shares at NAV of the AllianzGI Ultra Micro Cap Fund (the “Fund”) returned 8.24%, underperforming the Russell Microcap Growth Index (the “benchmark index”), which returned 14.28%.
Market Environment
Overall, US stocks closed higher during the reporting period despite episodes of equity market volatility.
Early in the period, the decline in the price of crude oil accelerated and spilled into the broader market; however, stocks found their footing and moved higher into year-end with oil prices stabilizing. The FOMC’s meeting and subsequent communication to remain “patient” as it relates to future interest rate increases was a positive catalyst for the market. Lastly, a stronger-than-expected final third-quarter GDP report helped lift investor sentiment.
In the months that followed, volatility in the energy and currency markets as well as global macro-related headlines had an impact on day-to-day stock prices; however, Fed commentary and uncertainty surrounding the path of monetary policy arguably had a greater influence on investor sentiment. Aggressive action by the ECB and other overseas central banks did not directly impact the stock market, but they reinforced the fact that the global landscape remains highly accommodative. Separately, fourth-quarter earnings and corporate actions, including share buybacks, dividend increases and merger and acquisition activities, supported a positive fundamental backdrop, while mixed economic reports signaled continued modest growth in the US.
As the end of the reporting period neared, equity prices weakened concurrent with a move higher in volatility and government bond yields, but stabilized and rebounded as Treasuries rallied into the end of the period. On the economic front, reports were mixed, suggesting that the Fed would remain patient and the rate hike cycle would be gradual—a positive for risk assets. With respect to corporate profits, first-quarter earnings reported a meager gain, but impressive nonetheless given Wall Street’s estimates heading into April. Ultimately, stocks proved resilient in the face of interest rate volatility, macro uncertainties abroad and slower growth.
Against this backdrop, the Russell Microcap Index returned 9.07% and outperformed the Russell 2000 Index, which returned 6.94%. Within the microcap universe, growth-oriented stocks bested value-oriented stocks. Specific to the benchmark index, sector performance was predominantly positive. Health care and information technology were the strongest-performing sectors, followed by utilities and financials. In contrast, the energy sector declined the most, followed by the consumer staples and materials sectors.
Portfolio Review
The Fund underperformed its benchmark index over the reporting period. From an attribution perspective, security selection and asset allocation effects both negatively influenced relative performance. In particular, stock picking in the health care, information technology and consumer staples sectors weighed on relative returns. Conversely, security selection in the materials, industrials and consumer discretionary sectors had a positive impact and was partially offsetting. Separately, an underweight in the health care sector and an overweight in the industrials sector hindered performance; however, an underweight in the materials sector was partly equalizing.
Average Annual Total Return for the period ended May 31, 2015
| 6 Month* | 1 Year | 5 Year | Since Inception† | |||||||||||||||
| AllianzGI Ultra Micro Cap Fund Class A | 8.24% | 8.10% | 19.67% | 14.72% | ||||||||||||||
| AllianzGI Ultra Micro Cap Fund Class A (adjusted) | 2.29% | 2.15% | 18.33% | 13.84% | |||||||||||||
| AllianzGI Ultra Micro Cap Fund Class P | 8.38% | 8.41% | 19.94% | 14.99% | |||||||||||||
| AllianzGI Ultra Micro Cap Fund Institutional Class | 8.27% | 8.26% | 20.00% | 15.07% | |||||||||||||
| Russell Microcap Growth Index | 14.28% | 18.51% | 17.43% | 10.19% | |||||||||||||
| Lipper Small-Cap Growth Funds Average | 8.31% | 14.73% | 16.15% | 9.65% | ||||||||||||||
† The Fund began operations on 1/28/08. Benchmark return comparisons began on the fund inception date. Lipper performance comparisons began on 1/31/08.
* Cumulative return
Performance quoted represents past performance and is no guarantee of future results. Current performance may be lower or higher than performance shown. For performance current to the most recent month-end, visit our website at us.allianzgi.com. Investment return and the principal value will fluctuate. Shares may be worth more or less than original cost when redeemed. The adjusted returns take into account the maximum initial sales charge of 5.50% on Class A shares. Returns do not reflect deduction of taxes that a shareholder would pay on fund distributions or redemption of fund shares. See pages 106 and 107 for more information. The Fund’s expense ratios are 2.10% for Class A shares, 1.84% for Class P shares and 1.89% for Institutional Class shares. Expense ratio information is as of the Fund’s current prospectus dated April 1, 2015, as supplemented to date.
| 104 | May 31, 2015 | | Semiannual Report |
Table of Contents
Unaudited
AllianzGI Ultra Micro Cap Fund (cont’d)
Cumulative Returns Through May 31, 2015
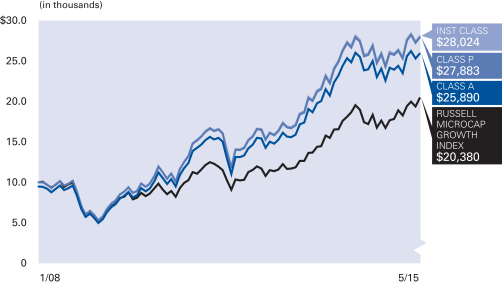
Industry Allocation (as of May 31, 2015)
| Health Care Equipment & Supplies | 9.4% | |||
| Biotechnology | 6.8% | |||
| Semiconductors & Semiconductor Equipment | 6.2% | |||
| Internet Software & Services | 5.6% | |||
| Health Care Providers & Services | 5.5% | |||
| Software | 4.8% | |||
| Pharmaceuticals | 4.7% | |||
| Hotels, Restaurants & Leisure | 4.3% | |||
| Other | 51.0% | |||
| Cash & Equivalents — Net | 1.7% |
| Shareholder Expense Example | Actual Performance | |||||
| Class A | Class P | Institutional Class | ||||
| Beginning Account Value (12/1/14) | $1,000.00 | $1,000.00 | $1,000.00 | |||
| Ending Account Value (5/31/15) | $1,082.40 | $1,083.80 | $1,082.70 | |||
| Expenses Paid During Period | $10.85 | $9.40 | $10.38 | |||
| Hypothetical Performance | ||||||
| (5% return before expenses) | ||||||
| Class A | Class P | Institutional Class | ||||
| Beginning Account Value (12/1/14) | $1,000.00 | $1,000.00 | $1,000.00 | |||
| Ending Account Value (5/31/15) | $1,014.51 | $1,015.91 | $1,014.96 | |||
| Expenses Paid During Period | $10.50 | $9.10 | $10.05 | |||
For each class of the Fund, expenses are equal to the annualized expense ratio for the class (2.09% for Class A, 1.81% for Class P and 2.00% for Institutional Class), multiplied by the average account value over the period, multiplied by 182/365.
| Semiannual Report | | May 31, 2015 | 105 |
Table of Contents
Unaudited
The inception date on each Fund Summary page is the inception date of the Fund’s oldest share class or classes. The AllianzGI Global Allocation Fund reorganized on May 4, 2009 when its predecessor merged into the Trust. The Global Allocation Fund’s shares were first offered in 9/98. On April 12, 2010, the following funds reorganized when their predecessors merged into series of the Trust (including fund’s inception date): AllianzGI Convertible Fund (4/93), AllianzGI High Yield Bond Fund (7/96), AllianzGI International Small-Cap Fund (12/97), AllianzGI U.S. Small-Cap Growth Fund (10/93), AllianzGI Micro Cap Fund (7/95), AllianzGI Ultra Micro Cap Fund (1/08). For each of the reorganized funds, Institutional Class is the oldest share class, except that for AllianzGI International Small-Cap Fund, the oldest share class of the predecessor fund merged into Class P.
The Target-Date Funds are designed to offer individual investors comprehensive asset allocation strategies tailored to the approximate date when they expect to begin withdrawing assets. The target date included in the Fund’s name does not necessarily represent the specific year an investor will begin withdrawing assets. It is intended only as a general guide. Each Fund follows a target asset allocation schedule that changes over time to help reduce portfolio risk, increasing its exposure to conservative investments as the target date approaches. The principal value of a Fund is not guaranteed at any time, including the target date. A Fund’s shareholders may experiences losses, including losses near, at or after the target year indicated in the Fund’s name.
Returns measure performance from the inception of the oldest share class to the present, so some returns predate the inception of the actual share class. Those returns are calculated by adjusting the returns of the oldest share class to reflect the indicated share class’s different operating expenses. Total return performance assumes that all dividend and capital gain distributions were reinvested on the payable date.
Class A shares are subject to an initial sales charge. Class C shares are subject to a 1% contingent deferred sales charge (“CDSC”) for shares redeemed in the first year. Class D shares are continuously offered through financial service firms, such as broker-dealers or registered investment advisers. Class R shares are generally available only to 401(k) plans, 457 plans, employer sponsored 403(b) plans, profit sharing and money purchase pension plans, defined benefit plans, non-qualified deferred compensation plans and healthcare benefit funding plans. Class P shares are offered primarily through certain asset allocation, wrap fee and other similar programs offered by broker-dealers and other intermediaries. Institutional Class shares are offered primarily for direct investment by investors such as pension and profit sharing plans, employee benefit trusts, endowments, foundations, corporations and high net worth individuals. Administrative Class shares are offered primarily through employee benefit plan alliances, broker-dealers and other intermediaries. Class R6 shares are offered primarily for 401(k) plans, 457 plans, employer sponsored 403(b) plans, profit sharing and money purchase pension plans, defined benefit plans, non-qualified deferred compensation plans, healthcare benefit funding plans and other specified benefit plans and accounts whereby the plan or the plan’s
broker, dealer or other financial Intermediary has an agreement with the Distributor or the Investment Manager to utilize Class R6 shares In certain Investment products or programs.
Class B shares of Allianz Multi-Strategy Funds are not available for purchase, except through exchanges and dividend reinvestments for any Funds with Class B shares outstanding (currently only AllianzGI Global Allocation Fund).
The Lipper Averages are calculated by Lipper, Inc. They are based on the total return performance, with distributions reinvested and operating expenses deducted, of funds included by Lipper in the stated category. Lipper does not take into account sales charges.
The Cumulative Returns charts for each Fund assume the initial investment was made on the first day of the Fund’s initial fiscal year. The charts reflect any sales load that would have applied at the time of purchase or any CDSC that would have applied if a full redemption occurred on the last business day of the most recent fiscal year. Results assume that all dividends and capital gain distributions were reinvested. They do not take into account the effect of taxes. The benchmark cumulative return began on the last day of the month of the respective Fund’s inception date.
Proxy Voting
The Funds’ Investment Manager and Sub-Advisers have adopted written proxy voting policies and procedures (the “Proxy Policy”) as required by Rule 206(4)-6 under the Investment Advisers Act of 1940. The Proxy Policy has been adopted by Allianz Funds Multi-Strategy Trust (the “Trust”) as the policies and procedures that the Sub-Advisers will use when voting proxies on behalf of the Funds. Copies of the written Proxy Policy and the factors that the Sub-Advisers may consider in determining how to vote proxies for each Fund, and information about how each Fund voted proxies relating to portfolio securities held during the most recent twelve-month period ended June 30, are available without charge, upon request, by calling 1-800-988-8380 (retail classes: A, B, C & R) or 1-800-498-5413 (Class P, R6, D, Institutional & Administrative classes), on the Allianz Global Investors Distributors website at us.allianzgi.com, and on the Securities and Exchange Commission’s (“SEC”) website at http://www.sec.gov.
Form N-Q
The Trust files complete schedules of each Fund’s portfolio holdings with the SEC on Form N-Q for the first and third quarters of each fiscal year, which are available on the SEC’s website at http://www.sec.gov. A copy of the Trust’s Form N-Q is available without charge, upon request, by calling 1-800-988-8380 (retail classes: A, B, C & R) or 1-800-498-5413 (Class P, R6, D, Institutional & Administrative classes). In addition, the Trust’s Form N-Q may be reviewed and copied at the SEC’s Public Reference Room in Washington, DC. Information on the operation of the Public Reference Room may be obtained by calling 1-800-SEC-0330.
| 106 | May 31, 2015 | | Semiannual Report |
Table of Contents
The following disclosure provides important information regarding each Fund’s Shareholder Expense Example, which appears on each Fund Summary page in this Semiannual Report. Please refer to this information when reviewing the Shareholder Expense Example for a Fund.
Shareholder Expense Example
Shareholders of a Fund incur two types of costs: (1) transaction costs; and (2) ongoing costs, including investment management fees; distribution and/or service (12b-1) fees and other Fund expenses. The Shareholder Expense Example is intended to help shareholders understand ongoing costs (in dollars) of investing in a Fund and to compare these costs with the ongoing costs of investing in other mutual funds. The Shareholder Expense Example is based on an investment of $1,000.00 invested at the beginning of the period, as indicated, and held for the entire period through May 31, 2015.
Actual Expenses
The information in the table under the heading “Actual Performance” provides information about actual account values and actual expenses. You may use the information in these columns, together with the amount you invested, to estimate the expenses that you paid over the period. Simply divide your account value by $1,000.00 (for example, an $8,600.00 account value divided by $1,000.00 = 8.6), then multiply the result by the number in the appropriate column for your share class, in the row entitled “Expenses Paid During Period”, to estimate the expenses you paid on your account during this period.
Hypothetical Example for Comparison Purposes
The information in the table under the heading “Hypothetical Performance (5% return before expenses)” provides information about hypothetical account values and hypothetical expenses based on a Fund’s actual expense ratio and an assumed rate of return of 5% per year before expenses, which is not the Fund’s actual return. The hypothetical account values and expenses may not be used to estimate the actual ending account balance or expenses you paid for the period. You may use this information to compare the ongoing costs of investing in a Fund and other funds. To do so, compare this 5% hypothetical example with the 5% hypothetical examples that appear in the shareholder reports of other funds.
Please note that the expenses shown in the table are meant to highlight your ongoing costs only and do not reflect any transactional costs. Therefore, the information under the heading “Hypothetical
Performance (5% return before expenses)” is useful in comparing ongoing costs only, and will not help you determine the relative total costs of owning different funds. In addition, if these transactional costs were included, your costs would have been higher.
Shareholders may be subject to an annual fee of $15 for any accounts, including fiduciary accounts, with balances that fall below $1,000. This fee is not included in the shareholder expense example. If you are subject to the fee, keep it in mind when you are estimating the ongoing expenses of investing in the Funds and when comparing the expenses of these Funds with other funds.
Credit Ratings
Bond ratings apply to the underlying holdings of a Fund and not the Fund itself and are divided into categories ranging from highest to lowest credit quality, determined for purposes of presentations in this report by using ratings provided by Moody’s Investors Service, Inc. (“Moody’s”). Presentations of credit ratings information in this report use ratings provided by Moody’s for this purpose, among other reasons, because of the access to background information and other materials provided by Moody’s, as well as the Funds’ considerations of industry practice. Bonds not rated by Moody’s or bonds that do not have a rating available from Moody’s are designated as “NR” and “NA”, respectively. Credit quality ratings assigned by a rating agency are subjective opinions, not statements of fact, and are subject to change periodically, even as frequently as daily. Ratings assigned by Moody’s or another rating agency are not absolute standards of credit quality and do not evaluate market risk. Rating agencies may fail to make timely changes in credit ratings, and an issuer’s current financial condition may be better or worse than a rating indicates. In formulating investment decisions for the applicable Funds, Allianz Global Investors U.S. LLC, the sub-adviser to the applicable Funds, develops its own analysis of the credit quality and risks associated with individual debt instruments, rather than relying exclusively on rating agencies or third-party research.
All the information on the Fund Summary pages, including Fund Insights, Average Annual Total/Cumulative Return Tables, Cumulative Return Charts, Shareholder Expense Examples and Allocation/Credit Rating Summaries, is unaudited.
Allianz Global Investors Distributors LLC, 1633 Broadway, New York, NY, 10019, us.allianzgi.com, 1-800-988-8380 (retail classes: A, B, C & R) or 1-800-498-5413 (Class P, R6, D, Institutional & Administrative classes).
| Semiannual Report | | May 31, 2015 | 107 |
Table of Contents
Unaudited
Unless otherwise noted, index returns reflect the reinvestment of income dividends and capital gains, if any, but do not reflect fees, brokerage commissions or other expenses of investing. It is not possible to invest directly in an index.
Prior to November 1, 2006, performance data for the MSCI Indices was calculated gross of dividend tax withholding. Performance data presently shown for the Indices is net of dividend tax withholding. This recalculation results in lower performance for the Indices.
| Index | Description | |
| Barclays Global Aggregate Index | The Barclays Global Aggregate Index provides a broad-based measure of the global investment grade fixed-rate debt markets. It is comprised of the US Aggregate, Pan-European Aggregate, and the Asian-Pacific Aggregate Indexes. It also includes a wide range of standard and customized sub-indices by liquidity constraint, sector, quality and maturity. | |
| Barclays Global High Yield Index | The Barclays Global High Yield Index is an unmanaged index considered representative of fixed rate, non-investment grade debt of companies in the US, developed markets and emerging markets. | |
| Barclays US Aggregate Bond Index | The Barclays US Aggregate Bond Index is composed of securities from the Barclays Government/Credit Bond Index, Mortgage-Backed Securities Index, and Asset-Backed Securities Index. It is generally considered to be representative of the domestic, investment grade, fixed rate, taxable bond market. | |
| Barclays US Credit Index | The Barclays US Credit Index is the credit component of the US Government/Credit Index. It includes publicly issued US corporate and specified foreign debentures and secured notes that meet the specified maturity, liquidity and quality requirements. To qualify, securities must be rated investment grade (Baa3 or better) by Moody’s. | |
| Barclays US Government Bond Index | The Barclays US Government Bond Index is composed of all publicly issued, nonconvertible, domestic debt of the US Government or any agency thereof, quasi-federal corporations or corporate debt guaranteed by the US Government. | |
| Barclays US Government Inflation-Linked Bond Index | Barclays US Government Inflation-Linked Bond Index measures the performance of the US Treasury Inflation Protected Securities (“TIPS”) market. The index includes TIPS with one or more years remaining maturity with total outstanding issue size of $500 million or more. | |
| Barclays US TIPS Index | The Barclays US TIPS Index is an unmanaged index that consists of inflation-protected securities issued by the US Treasury. | |
| Bloomberg Commodity Index | Bloomberg Commodity Index (BCOM) is calculated on an excess return basis and reflects commodity futures price movements. The index rebalances annually weighted 2/3 by trading volume and 1/3 by world production and weight-caps are applied at the commodity, sector and group level for diversification. Roll period typically occurs from 6th-10th business day based on the roll schedule. | |
| BofA Merrill Lynch 1-3 Year BB US Cash Pay High Yield Index | The BofA Merrill Lynch 1-3 Year BB US Cash Pay High Yield Index is a subset of the BofA Merrill Lynch US Cash Pay High Yield Index, including all securities with a remaining term to final maturity less than 3 years and rated BB1 through BB3, inclusive. The BofA Merrill Lynch US Cash Pay High Yield Index tracks the performance of US dollar-denominated below investment grade corporate debt, currently in a coupon paying period, that is publicly issued in the US domestic market. | |
| BofA Merrill Lynch 3-Month US Treasury Bill Index | The BofA Merrill Lynch 3-Month US Treasury Bill Index tracks the performance of the 3-month US Treasury markets. | |
BofA Merrill Lynch All Convertibles Index | The BofA Merrill Lynch All Convertibles Index is a widely used, unmanaged index that measures the performance of US dollar-denominated convertible securities not currently in bankruptcy with a total market value greater than $50 million at issuance. | |
| BofA Merrill Lynch High Yield Master II Index | The BofA Merrill Lynch High Yield Master II Index is an unmanaged index consisting of US dollar-denominated bonds that are issued in countries having a BBB3 or higher debt rating with at least one year remaining until maturity. All bonds must have a credit rating below investment grade but not in default. | |
| 108 | May 31, 2015 | | Semiannual Report |
Table of Contents
| Index | Description | |
| CBOE Volatility Index (VIX) | The CBOE Volatility Index (VIX) is a key measure of market expectations of near-term volatility conveyed by S&P 500 stock index option prices. | |
| Consumer Price Index | The Consumer Price Index (CPI) is an unmanaged index representing the rate of inflation of the US consumer prices as determined by the US Department of Labor Statistics. There can be no guarantee that the CPI or other indexes will reflect the exact level of inflation at any given time. | |
| Custom Real Asset Benchmark | The Custom Real Asset Benchmark represents the performance of a hypothetical index developed by the Adviser. This blended benchmark is comprised of seven underlying indices in the following proportions: 25% Dow Jones UBS Commodity Total Return Index, 25% MSCI World Real Estate Index, 25% Barclays US Government Inflation-Linked Bond Index, 6.25% DAX Global Agribusiness Index, 7.5% MSCI World Energy Index, 6.25% MSCI World Materials Index and 5% MSCI ACWI Industrials (equal-weighted) Index. The Dow Jones UBS Commodity Total Return Index tracks prices of futures contracts on physical commodities on the commodity markets. The MSCI World Real Estate Index is a free float-adjusted market capitalization index that consists of large and mid cap equity REITs across 23 Developed Markets (DM) countries, which generate a majority of their revenue and income from real estate rental and leasing operations. The Barclays US Government Inflation-Linked Bond Index measures the performance of the US Treasury Inflation Protected Securities (TIPS) market. The DAX Global Agribusiness Index replicates the performance of the largest and most liquid agribusiness companies. The MSCI World Energy Index is a component of the MSCI World Index and represents the energy securities defined by MSCI. The MSCI World Materials Index is a component of the MSCI World Index and represents the materials securities defined by MSCI. The MSCI ACWI Industrials (equal-weighted) Index is a component of the MSCI All Country World Index and represents the industrials securities defined by MSCI calculated equal-weighted. Performance data presently shown for MSCI and DAX Indexes is net of dividend tax withholding. It is not possible to invest directly in the blended benchmark or in the indices from which it is derived. | |
| Dow Jones Sustainability World Total Return Index | The Dow Jones Sustainability World Total Return Index tracks the performance of the top 10% of the 2500 largest companies in the S&P Global Broad Market Index that are the world’s sustainability leaders based on economic, environmental and social criteria. | |
| Eurozone Aggregate Consumer Price Index | The Eurozone Aggregate Consumer Price Index is an aggregation of harmonized indices across various items and across member countries in the European Monetary Union. | |
| Five-Year TIPS Constant Maturity Index | The Five-Year TIPS Constant Maturity Index is an index published by the Federal Reserve Board based on the average yield of a range of Treasury securities, all adjusted to the equivalent of a five-year maturity. | |
| JP Morgan Corporate Emerging Markets Bond Index (CEMBI) | The JP Morgan Corporate Emerging Markets Bond Index (CEMBI) tracks total returns of US dollar-denominated debt instruments issued by corporate entities in emerging market countries. Two variations are available: CEMBI Broad and CEMBI. The CEMBI Broad is the most comprehensive corporate benchmark followed by the CEMBI, which consists of an investable universe of corporate bonds. Both indices are also available in Diversified versions. | |
| JP Morgan Emerging Markets Bond Index Global Diversified (EMBI Global Diversified) | The JP Morgan Emerging Markets Bond Index Global Diversified (EMBI Global Diversified) is a uniquely-weighted version of the EMBI Global. It limits the weights of those index countries with larger debt stocks by only including specified portions of these countries’ eligible current face amounts of debt outstanding. The countries covered in the EMBI Global Diversified are identical to those covered by the EMBI Global. | |
| JP Morgan Government Bond Index-Emerging Markets (GBI-EM) | The JP Morgan Government Bond Index-Emerging Markets (GBI-EM) is the first comprehensive, global local emerging markets index, and consists of regularly traded, liquid fixed-rate, domestic currency government bonds to which international investors can gain exposure. Variations of the index are available to allow investors to select the most appropriate benchmark for their objectives. | |
| Semiannual Report | | May 31, 2015 | 109 |
Table of Contents
Unaudited
Benchmark Descriptions (cont’d)
| Index | Description | |
| Morningstar Lifetime Conservative Series: Morningstar Lifetime Conservative 2015, Morningstar Lifetime Conservative 2020, Morningstar Lifetime Conservative 2025, Morningstar Lifetime Conservative 2030, Morningstar Lifetime Conservative 2035, Morningstar Lifetime Conservative 2040, Morningstar Lifetime Conservative 2045, Morningstar Lifetime Conservative 2050, Morningstar Lifetime Conservative 2055 and Morningstar Conservative Income | The Morningstar Lifetime Conservative 2015, Morningstar Lifetime Conservative 2020, Morningstar Lifetime Conservative 2025, Morningstar Lifetime Conservative 2030, Morningstar Lifetime Conservative 2035, Morningstar Lifetime Conservative 2040, Morningstar Lifetime Conservative 2045, Morningstar Lifetime Conservative 2050, Morningstar Lifetime Conservative 2055 and Morningstar Conservative Income Indices each represents a portfolio of global equities, bonds and traditional inflation hedges such as commodities and TIPS. The portfolio is held in proportions appropriate for a US investor’s investment horizon until retirement. The conservative risk profile is for investors who are comfortable with below-average exposure to equity market volatility. | |
| MSCI AC World Index ex USA | The MSCI AC World Index ex USA is a free float-adjusted market capitalization weighted index that is designed to measure the equity market performance of developed and emerging markets, excluding the United States. | |
| MSCI ACWI ex USA Growth Index | The MSCI ACWI ex USA Growth Index captures large and mid-cap securities exhibiting overall growth style characteristics across developed and emerging markets, excluding the United States. | |
| MSCI All Country World Index (Also known as: MSCI AC World Index and MSCI ACWI) | The MSCI All Country World Index (MSCI ACWI) is a free float-adjusted market capitalization weighted index that is designed to measure the equity market performance of developed and emerging markets. The MSCI ACWI consists of 45 country indices comprising 24 developed and 21 emerging market country indices. | |
| MSCI China Index | The MSCI China Index is a free float-adjusted market capitalization-weighted index of Chinese equities that includes China-affiliated corporations (“Red-chips” or “P-chips”) and China-incorporated corporations listed as “H-shares” on the Hong Kong Exchange or listed as “B-shares” on the Shanghai and Shenzhen exchanges. | |
| MSCI EAFE Net Index | The MSCI EAFE Index (Europe, Australasia, Far East) is a free float-adjusted market capitalization index that is designed to measure the equity market performance of developed markets, excluding the US and Canada. | |
| MSCI EAFE Small Cap Index | The MSCI EAFE Small Cap Index is an equity index which captures small cap representation across Developed Markets countries* around the world, excluding the US and Canada. | |
| MSCI Emerging Markets Index | The MSCI Emerging Markets Index is a free float-adjusted market capitalization index that is designed to measure equity market performance in emerging markets. | |
| MSCI Europe Total Return (Net) Index | The MSCI Europe Total Return (Net) Index is a free float-adjusted market capitalization weighted index that is designed to measure the equity market performance of the developed markets in Europe. | |
| MSCI World Energy Index | The MSCI World Energy Index is designed to capture the large and mid-cap segments across 23 Developed Markets (DM) countries*. All securities in the index are classified in the Energy sector as per the Global Industry Classification Standard (GICS®). | |
| MSCI World ex USA Small Cap Index | The MSCI World ex USA Small Cap Index captures small cap representation across 23 of 24 of developed market countries (excluding the United States). | |
| MSCI World Healthcare and Consumer Blended Benchmark Index | The World Healthcare and Consumer Blended Benchmark is a blend of 70% MSCI World Healthcare Index, 15% MSCI World Consumer Discretionary Index and 15% MSCI World Consumer Staples Index. The World Healthcare and Consumer Blended Benchmark Index represent the performance of hypothetical index developed by the Adviser. | |
| MSCI World Index | The MSCI World Index is a free float-adjusted market capitalization weighted index that is designed to measure the equity market performance of developed markets. | |
| 110 | May 31, 2015 | | Semiannual Report |
Table of Contents
| Index | Description | |
| MSCI World Minimum Volatility Index | MSCI World Minimum Volatility Index aims to reflect the performance characteristics of a minimum variance strategy applied to the MSCI large and mid cap equity universe across 24 developed market countries. The index is calculated by optimizing the MSCI World Index, its parent index, for the lowest absolute risk (within a given set of constraints). Historically, the index has shown lower beta and volatility characteristics relative to the MSCI World Index. | |
| MSCI World Real Estate Index | The MSCI World Real Estate Index is a free float-adjusted market capitalization index that consists of large and mid-cap equity REITs across 23 Developed Markets (DM) countries*, which generate a majority of their revenue and income from real estate rental and leasing operations. With 103 constituents, it represents about 85% of the REIT universe in each country and all securities are classified in the REIT sector according to the Global Industry Classification Standard (GICS®). | |
| Real Return Target Date Index; RR Target 2015 Index; RR Target 2020 Index; RR Target 2025 Index; RR Target 2030 Index; RR Target 2035 Index; RR Target 2040 Index; RR Target 2045 Index; RR Target 2050 Index; RR Target 2040+ Index; RR Target Today Index | Each of the Real Return Target 2015, Real Return Target 2020, Real Return Target 2025, Real Return Target 2030, Real Return Target 2035, Real Return Target 2040, Real Return Target 2045, Real Return Target 2050, Real Return Target 40+ and Real Return Target Today Indices (for purposes of this paragraph, the “New Primary Indices”) is a composite of other indexes. The sub-indexes represent traditional stocks and bonds in addition to real return assets such as inflation-linked bonds, commodities and real estate securities that are considered to potentially counterbalance inflation. The component asset classes are weighted within each index to reflect a targeted level of risk at the beginning and end of the investment horizon. Over time, the weights are adjusted based on predetermined formulas to systematically reduce the level of potential risk as the index’s maturity date approaches. It is not possible to invest directly in an index. Each of the New Primary Indices is calculated using the methodology of, and is maintained by, S&P Opco, LLC (a subsidiary of S&P Dow Jones Indices LLC). The New Primary Indices are not sponsored by S&P Dow Jones Indices or its affiliates or its third party licensors (collectively, “S&P Dow Jones Indices”). S&P Dow Jones Indices will not be liable for any errors or omissions in calculating the New Primary Indices. “Calculated by S&P Dow Jones Indices” and the related stylized mark(s) are service marks of S&P Dow Jones Indices and have been licensed for use by Allianz Global Investors GmbH. | |
| Russell 1000 Index | The Russell 1000 Index is an unmanaged index that consists of the 1,000 largest companies in the Russell 3000 Index and represents approximately 90% of the total market capitalization of the Russell 3000 Index. It is highly correlated with the S&P 500 Index. | |
| Russell 2000 Growth Index | The Russell 2000 Growth Index is an unmanaged index composed of those Russell 2000 Index companies with higher price-to-book ratios and higher forecasted growth values. | |
| Russell 2000 Index | The Russell 2000 Index measures the performance of the small cap segment of the US equity universe. The Russell 2000 Index is a subset of the Russell 3000 Index and represents approximately 10% of total market capitalization of that index. | |
| Russell Microcap Growth Index | The Russell Microcap Growth Index measures the performance of the microcap growth segment of the US equity market. It includes those Russell Microcap Index companies with higher price-to-book ratios and higher forecasted growth values. | |
| Russell Microcap Index | The Russell Microcap Index measures the performance of the microcap segment of the US equity market. It makes up less than 3% of the US equity market. | |
| S&P 500 Index | The Standard & Poor’s 500 Index is an unmanaged market index generally considered representative of the stock market as a whole. The Index focuses on the large cap segment of the US equities market. | |
| S&P Global Water Index | The Standard & Poor’s Global Water Index is comprised of 50 of the largest publicly traded companies in water-related businesses that meet specific investability requirements. This index is designed to provide liquid exposure to the leading publicly-listed companies in the global water industry, from both developed markets and emerging markets. | |
| S&P North American Technology Sector Index | The S&P North American Tech Sector Index measures the performance of the technology sector of the US equity market. | |
| USD Overnight LIBOR | USD Overnight LIBOR (London Interbank Offered Rate) is the average interest rate at which leading banks in London borrow US dollar funds from one another with a maturity of one day (overnight). | |
| Semiannual Report | | May 31, 2015 | 111 |
Table of Contents
May 31, 2015 (Unaudited)
AllianzGI Retirement 2015 Fund
| Shares | Value | |||||||
| Mutual Funds—75.7% | ||||||||
AllianzGI Best Styles International Equity (a)(f) | 70,792 | $1,114,967 | ||||||
AllianzGI Best Styles U.S. Equity (a)(f) | 218,797 | 3,402,292 | ||||||
AllianzGI Emerging Markets Consumer (a)(b)(e) | 37,002 | 549,108 | ||||||
AllianzGI Global Natural Resources (a)(b) | 38,742 | 689,986 | ||||||
AllianzGI International Managed Volatility (a)(b) | 28,746 | 426,593 | ||||||
AllianzGI NFJ Mid-Cap Value (a)(b) | 33,441 | 930,659 | ||||||
AllianzGI Short Duration High Income (a)(b) | 155,732 | 2,440,322 | ||||||
AllianzGI U.S. Managed Volatility (a)(b) | 91 | 1,350 | ||||||
AllianzGI U.S. Small-Cap Growth (a)(b) | 36,341 | 627,975 | ||||||
Harvest Funds Intermediate Bond (b) | 97,192 | 996,219 | ||||||
PIMCO CommoditiesPLUS® Strategy (a)(b) | 90,227 | 697,456 | ||||||
PIMCO Foreign Bond (U.S. Dollar-Hedged) (a)(b) | 66,970 | 717,914 | ||||||
PIMCO Income (a)(b) | 286,808 | 3,582,231 | ||||||
PIMCO Long-Term Credit (a)(b) | 90,553 | 1,154,554 | ||||||
PIMCO Mortgage Opportunities (a)(b) | 230,638 | 2,576,226 | ||||||
PIMCO StocksPLUS® International (U.S. Dollar-Hedged) (a)(b) | 33,358 | 283,545 | ||||||
PIMCO TRENDS Managed Futures Strategy (a)(b) | 80,560 | 837,018 | ||||||
Templeton Frontier Markets (d) | 23,807 | 336,863 | ||||||
Voya Global Real Estate (c) | 7,034 | 143,137 | ||||||
|
| |||||||
| Total Mutual Funds (cost—$21,058,420) | 21,508,415 | |||||||
|
| |||||||
| Exchange-Traded Funds—23.9% | ||||||||
iShares MSCI Spain Capped | 6,440 | 224,241 | ||||||
PIMCO 15+ Year U.S. TIPS Index (a) | 20,352 | 1,327,968 | ||||||
PIMCO 25+ Year Zero Coupon U.S. Treasury Index (a) | 4,020 | 456,792 | ||||||
PIMCO Broad U.S. TIPS Index (a) | 83,435 | 4,788,335 | ||||||
|
| |||||||
| Total Exchange-Traded Funds (cost—$6,842,013) | 6,797,336 | |||||||
|
| |||||||
| Principal Amount (000s) | Value | |||||||
| Repurchase Agreements—0.6% | ||||||||
State Street Bank and Trust Co., dated 5/29/15, 0.00%, due 6/1/15, proceeds $165,000; collateralized by U.S. Treasury Notes, 2.125%, due 9/30/21, valued at $168,713 including accrued interest |
| |||||||
(cost—$165,000) | $165 | $ | 165,000 | |||||
|
| |||||||
| Total Investments (cost—$28,065,433)—100.2% | 28,470,751 | |||||||
|
| |||||||
Liabilities in excess of other assets—(0.2)% | (60,095 | ) | ||||||
|
| |||||||
| Net Assets—100.0% | $28,410,656 | |||||||
|
| |||||||
Notes to Schedule of Investments:
(a) Affiliated fund.
(b) Institutional Class share.
(c) Class I share.
(d) Advisor Class share.
(e) Non-income producing.
(f) Class R6 share.
Glossary:
MSCI—Morgan Stanley Capital International
TIPS—Treasury Inflation Protected Securities
AllianzGI Retirement 2020 Fund
| Shares | Value | |||||||
| Mutual Funds—76.5% | ||||||||
AllianzGI Best Styles International Equity (a)(f) | 179,234 | $2,822,934 | ||||||
AllianzGI Best Styles | 495,451 | 7,704,268 | ||||||
AllianzGI Emerging Markets Consumer (a)(b)(e) | 82,323 | 1,221,666 | ||||||
AllianzGI Global Natural Resources (a)(b) | 87,611 | 1,560,361 | ||||||
AllianzGI International Managed Volatility (a)(b) | 63,894 | 948,192 | ||||||
AllianzGI NFJ Mid-Cap Value (a)(b) | 77,536 | 2,157,832 | ||||||
AllianzGI Short Duration High Income (a)(b) | 347,966 | 5,452,634 | ||||||
AllianzGI U.S. Managed Volatility (a)(b) | 41,710 | 621,063 | ||||||
AllianzGI U.S. Small-Cap Growth (a)(b) | 84,556 | 1,461,130 | ||||||
Harvest Funds Intermediate Bond (b) | 162,433 | 1,664,938 | ||||||
PIMCO CommoditiesPLUS® Strategy (a)(b) | 244,401 | 1,889,222 | ||||||
PIMCO Foreign Bond (U.S. Dollar-Hedged) (a)(b) | 148,552 | 1,592,481 | ||||||
PIMCO Income (a)(b) | 634,350 | 7,923,036 | ||||||
PIMCO Long-Term Credit (a)(b) | 187,463 | 2,390,149 | ||||||
PIMCO Mortgage Opportunities (a)(b) | 488,995 | 5,462,076 | ||||||
PIMCO StocksPLUS® International (U.S. Dollar-Hedged) (a)(b) | 90,315 | 767,681 | ||||||
PIMCO TRENDS Managed Futures Strategy (a)(b) | 181,557 | 1,886,376 | ||||||
Templeton Frontier Markets (d) | 76,704 | 1,085,368 | ||||||
Voya Global Real Estate (c) | 15,386 | 313,104 | ||||||
|
| |||||||
| Total Mutual Funds (cost—$48,117,196) | 48,924,511 | |||||||
|
| |||||||
| Exchange-Traded Funds—22.9% | ||||||||
iShares MSCI Spain Capped | 21,105 | 734,876 | ||||||
PIMCO 15+ Year U.S. TIPS Index (a) | 40,208 | 2,623,572 | ||||||
PIMCO 25+ Year Zero Coupon U.S. Treasury Index (a) | 5,956 | 676,780 | ||||||
PIMCO Broad U.S. TIPS Index (a) | 184,460 | 10,586,160 | ||||||
|
| |||||||
| Total Exchange-Traded Funds (cost—$14,817,235) | 14,621,388 | |||||||
|
| |||||||
| 112 | Semiannual Report | | May 31, 2015 | | See accompanying Notes to Financial Statements |
Table of Contents
Schedule of Investments
May 31, 2015 (Unaudited)
| Principal Amount (000s) | Value | |||||||
| Repurchase Agreements—0.6% | ||||||||
State Street Bank and Trust Co., dated 5/29/15, 0.00%, due 6/1/15, proceeds $379,000; collateralized by U.S. Treasury Notes, 3.125%, due 5/15/21, valued at $388,349 including accrued interest |
| |||||||
(cost—$379,000) | $379 | $ | 379,000 | |||||
|
| |||||||
| Total Investments (cost-$63,313,431)—100.0% | 63,924,899 | |||||||
|
| |||||||
| Liabilities in excess of other assets—(0.0)% | (2,797 | ) | ||||||
|
| |||||||
| Net Assets—100.0% | $63,922,102 | |||||||
|
| |||||||
Notes to Schedule of Investments:
(a) Affiliated fund.
(b) Institutional Class share.
(c) Class I share.
(d) Advisor Class share.
(e) Non-income producing.
(f) Class R6 share.
Glossary:
MSCI—Morgan Stanley Capital International
TIPS—Treasury Inflation Protected Securities
AllianzGI Retirement 2025 Fund
| Shares | Value | |||||||
| Mutual Funds—78.9% | ||||||||
AllianzGI Best Styles International Equity (a)(f) | 214,957 | $3,385,580 | ||||||
AllianzGI Best Styles U.S. Equity (a)(f) | 557,485 | 8,668,890 | ||||||
AllianzGI Emerging Markets Consumer (a)(b)(e) | 88,397 | 1,311,807 | ||||||
AllianzGI Global Natural Resources (a)(b) | 111,037 | 1,977,567 | ||||||
AllianzGI International Managed Volatility (a)(b) | 68,325 | 1,013,943 | ||||||
AllianzGI NFJ Mid-Cap Value (a)(b) | 98,768 | 2,748,702 | ||||||
AllianzGI Short Duration High Income (a)(b) | 373,911 | 5,859,188 | ||||||
AllianzGI U.S. Managed Volatility (a)(b) | 46,530 | 692,836 | ||||||
AllianzGI U.S. Small-Cap Growth (a)(b) | 101,141 | 1,747,724 | ||||||
Harvest Funds Intermediate Bond (b) | 135,365 | 1,387,489 | ||||||
PIMCO CommoditiesPLUS® Strategy (a)(b) | 262,567 | 2,029,646 | ||||||
PIMCO EqS Long/Short (a)(b) | 86,170 | 1,034,043 | ||||||
PIMCO Foreign Bond (U.S. Dollar-Hedged) (a)(b) | 159,891 | 1,714,032 | ||||||
PIMCO Income (a)(b) | 626,267 | 7,822,073 | ||||||
PIMCO Long-Term Credit (a)(b) | 189,350 | 2,414,215 | ||||||
PIMCO Mortgage Opportunities (a)(b) | 493,255 | 5,509,661 | ||||||
PIMCO StocksPLUS® International (U.S. Dollar-Hedged) (a)(b) | 132,164 | 1,123,393 | ||||||
PIMCO TRENDS Managed Futures Strategy (a)(b) | 228,378 | 2,372,850 | ||||||
Templeton Frontier Markets (d) | 85,319 | 1,207,268 | ||||||
Voya Global Real Estate (c) | 16,504 | 335,853 | ||||||
|
| |||||||
| Total Mutual Funds (cost—$53,529,034) | 54,356,760 | |||||||
|
| |||||||
| Exchange-Traded Funds—20.1% | ||||||||
iShares MSCI Spain Capped | 25,904 | 901,977 | ||||||
PIMCO 15+ Year U.S. TIPS Index (a) | 42,992 | 2,805,228 | ||||||
PIMCO 25+ Year Zero Coupon U.S. Treasury Index (a) | 6,369 | 723,710 | ||||||
PIMCO Broad U.S. TIPS Index (a) | 163,821 | 9,401,687 | ||||||
|
| |||||||
| Total Exchange-Traded Funds (cost—$14,017,990) | 13,832,602 | |||||||
|
| |||||||
| Principal Amount (000s) | Value | |||||||
| Repurchase Agreements—1.2% | ||||||||
State Street Bank and Trust Co., dated 5/29/15, 0.00%, due 6/1/15, proceeds $805,000; collateralized by U.S. Treasury Notes, 2.125%, due 9/30/21, valued at $823,113 including accrued interest |
| |||||||
(cost—$805,000) | $805 | $ | 805,000 | |||||
|
| |||||||
| Total Investments (cost—$68,352,024)—100.2% | 68,994,362 | |||||||
|
| |||||||
Liabilities in excess of other assets—(0.2)% |
| (169,570 | ) | |||||
|
| |||||||
| Net Assets—100.0% | $68,824,792 | |||||||
|
| |||||||
Notes to Schedule of Investments:
(a) Affiliated fund.
(b) Institutional Class share.
(c) Class I share.
(d) Advisor Class share.
(e) Non-income producing.
(f) Class R6 share.
Glossary:
MSCI—Morgan Stanley Capital International
TIPS—Treasury Inflation Protected Securities
| See accompanying Notes to Financial Statements | | May 31, 2015 | | Semiannual Report | 113 |
Table of Contents
Schedule of Investments
May 31, 2015 (Unaudited)
AllianzGI Retirement 2030 Fund
| Shares | Value | |||||||
| Mutual Funds—82.7% | ||||||||
AllianzGI Best Styles International Equity (a)(f) | 294,082 | $4,631,797 | ||||||
AllianzGI Best Styles U.S. Equity (a)(f) | 588,463 | 9,150,596 | ||||||
AllianzGI Emerging Markets Consumer (a)(b)(e) | 86,618 | 1,285,412 | ||||||
AllianzGI Emerging Markets Opportunities (a)(b) | 24,296 | 649,683 | ||||||
AllianzGI Global Natural Resources (a)(b) | 110,181 | 1,962,326 | ||||||
AllianzGI International Managed Volatility (a)(b) | 89,165 | 1,323,207 | ||||||
AllianzGI NFJ Mid-Cap Value (a)(b) | 132,869 | 3,697,739 | ||||||
AllianzGI Short Duration High Income (a)(b) | 326,068 | 5,109,486 | ||||||
AllianzGI U.S. Managed Volatility (a)(b) | 45,715 | 680,698 | ||||||
AllianzGI U.S. Small-Cap Growth (a)(b) | 118,904 | 2,054,661 | ||||||
AllianzGI Ultra Micro Cap (a)(b) | 13,626 | 349,922 | ||||||
Harvest Funds Intermediate Bond (b) | 134,318 | 1,376,760 | ||||||
PIMCO CommoditiesPLUS® Strategy (a)(b) | 255,048 | 1,971,521 | ||||||
PIMCO EqS Long/Short (a)(b) | 167,373 | 2,008,474 | ||||||
PIMCO Foreign Bond (U.S. Dollar-Hedged) (a)(b) | 153,968 | 1,650,532 | ||||||
PIMCO Income (a)(b) | 487,704 | 6,091,428 | ||||||
PIMCO Long-Term Credit (a)(b) | 185,078 | 2,359,740 | ||||||
PIMCO Mortgage Opportunities (a)(b) | 331,791 | 3,706,107 | ||||||
PIMCO StocksPLUS® International (U.S. Dollar-Hedged) (a)(b) | 161,457 | 1,372,384 | ||||||
PIMCO TRENDS Managed Futures Strategy (a)(b) | 223,157 | 2,318,599 | ||||||
Templeton Frontier Markets (d) | 93,600 | 1,324,435 | ||||||
Voya Global Real Estate (c) | 32,037 | 651,957 | ||||||
|
| |||||||
| Total Mutual Funds (cost—$54,277,904) | 55,727,464 | |||||||
|
| |||||||
| Exchange-Traded Funds—16.1% | ||||||||
iShares MSCI Spain Capped | 29,153 | 1,015,108 | ||||||
PIMCO 15+ Year U.S. TIPS Index (a) | 36,773 | 2,399,438 | ||||||
PIMCO 25+ Year Zero Coupon U.S. Treasury Index (a) | 3,113 | 353,730 | ||||||
PIMCO Broad U.S. TIPS Index (a) | 123,116 | 7,065,627 | ||||||
|
| |||||||
| Total Exchange-Traded Funds (cost—$11,032,688) | 10,833,903 | |||||||
|
| |||||||
| Principal Amount (000s) | Value | |||||||
| Repurchase Agreements—1.2% | ||||||||
State Street Bank and Trust Co., dated 5/29/15, 0.00%, due 6/1/15, proceeds $803,000; collateralized by U.S. Treasury Notes, 3.125%, due 5/15/21, valued at $819,847 including accrued interest |
| |||||||
(cost—$803,000) | $803 | $ | 803,000 | |||||
|
| |||||||
| Total Investments (cost—$66,113,592)—100.0% | 67,364,367 | |||||||
|
| |||||||
| Other assets less liabilities—0.0% | 4,722 | |||||||
|
| |||||||
| Net Assets—100.0% | $67,369,089 | |||||||
|
| |||||||
Notes to Schedule of Investments:
(a) Affiliated fund.
(b) Institutional Class share.
(c) Class I share.
(d) Advisor Class share.
(e) Non-income producing.
(f) Class R6 share.
Glossary:
MSCI—Morgan Stanley Capital International
TIPS—Treasury Inflation Protected Securities
AllianzGI Retirement 2035 Fund
| Shares | Value | |||||||
| Mutual Funds—87.0% | ||||||||
AllianzGI Best Styles International Equity (a)(f) | 258,977 | $4,078,888 | ||||||
AllianzGI Best Styles | 519,565 | 8,079,243 | ||||||
AllianzGI Emerging Markets Consumer (a)(b)(e) | 71,920 | 1,067,287 | ||||||
AllianzGI Emerging Markets Opportunities (a)(b) | 30,004 | 802,308 | ||||||
AllianzGI Global Natural Resources (a)(b) | 90,430 | 1,610,552 | ||||||
AllianzGI International Managed Volatility (a)(b) | 73,298 | 1,087,739 | ||||||
AllianzGI NFJ Mid-Cap Value (a)(b) | 119,161 | 3,316,258 | ||||||
AllianzGI Short Duration High Income (a)(b) | 247,835 | 3,883,575 | ||||||
AllianzGI U.S. Managed Volatility (a)(b) | 74,812 | 1,113,947 | ||||||
AllianzGI U.S. Small-Cap Growth (a)(b) | 139,481 | 2,410,240 | ||||||
AllianzGI Ultra Micro Cap (a)(b) | 28,365 | 728,418 | ||||||
Harvest Funds Intermediate Bond (b) | 110,233 | 1,129,885 | ||||||
PIMCO CommoditiesPLUS® Strategy (a)(b) | 244,286 | 1,888,328 | ||||||
PIMCO EqS Long/Short (a)(b) | 161,799 | 1,941,590 | ||||||
PIMCO Foreign Bond (U.S. Dollar-Hedged) (a)(b) | 101,934 | 1,092,736 | ||||||
PIMCO Income (a)(b) | 356,361 | 4,450,943 | ||||||
PIMCO Long-Term Credit (a)(b) | 121,556 | 1,549,834 | ||||||
PIMCO Mortgage Opportunities (a)(b) | 223,135 | 2,492,422 | ||||||
PIMCO StocksPLUS® International (U.S. Dollar-Hedged) (a)(b) | 165,867 | 1,409,868 | ||||||
PIMCO TRENDS Managed Futures Strategy (a)(b) | 183,215 | 1,903,601 | ||||||
Templeton Frontier Markets (d) | 80,863 | 1,144,213 | ||||||
Voya Global Real Estate (c) | 26,298 | 535,160 | ||||||
|
| |||||||
| Total Mutual Funds (cost—$46,584,812) | 47,717,035 | |||||||
|
| |||||||
| Exchange-Traded Funds—12.5% | ||||||||
iShares MSCI Spain Capped | 31,744 | 1,105,326 | ||||||
PIMCO 15+ Year U.S. TIPS Index (a) | 21,589 | 1,408,682 | ||||||
PIMCO 25+ Year Zero Coupon U.S. Treasury Index (a) | 2,558 | 290,666 | ||||||
PIMCO Broad U.S. TIPS Index (a) | 71,079 | 4,079,224 | ||||||
|
| |||||||
| Total Exchange-Traded Funds (cost—$7,046,059) | 6,883,898 | |||||||
|
| |||||||
| 114 | Semiannual Report | | May 31, 2015 | | See accompanying Notes to Financial Statements |
Table of Contents
Schedule of Investments
May 31, 2015 (Unaudited)
| Principal Amount (000s) | Value | |||||||
| Repurchase Agreements—1.1% | ||||||||
State Street Bank and Trust Co., dated 5/29/15, 0.00%, due 6/1/15, proceeds $592,000; collateralized by U.S. Treasury Notes, 2.125%, due 9/30/21, valued at $608,388 including accrued interest |
| |||||||
(cost—$592,000) | $592 | $ | 592,000 | |||||
|
| |||||||
| Total Investments (cost—$54,222,871)—100.6% | 55,192,933 | |||||||
|
| |||||||
| Liabilities in excess of other assets—(0.6)% | (317,340 | ) | ||||||
|
| |||||||
| Net Assets—100.0% | $54,875,593 | |||||||
|
| |||||||
Notes to Schedule of Investments:
(a) Affiliated fund.
(b) Institutional Class share.
(c) Class I share.
(d) Advisor Class share.
(e) Non-income producing.
(f) Class R6 share.
Glossary:
MSCI—Morgan Stanley Capital International
TIPS—Treasury Inflation Protected Securities
AllianzGI Retirement 2040 Fund
| Shares | Value | |||||||
| Mutual Funds—91.7% | ||||||||
AllianzGI Best Styles International Equity (a)(f) | 246,970 | $3,889,772 | ||||||
AllianzGI Best Styles U.S. Equity (a)(f) | 438,491 | 6,818,541 | ||||||
AllianzGI Emerging Markets Consumer (a)(b)(e) | 56,513 | 838,649 | ||||||
AllianzGI Emerging Markets Opportunities (a)(b) | 31,840 | 851,408 | ||||||
AllianzGI Global Natural Resources (a)(b) | 72,932 | 1,298,923 | ||||||
AllianzGI International Managed Volatility (a)(b) | 86,891 | 1,289,460 | ||||||
AllianzGI NFJ Mid-Cap Value (a)(b) | 94,068 | 2,617,919 | ||||||
AllianzGI Short Duration High Income (a)(b) | 188,916 | 2,960,316 | ||||||
AllianzGI U.S. Managed Volatility (a)(b) | 88,450 | 1,317,017 | ||||||
AllianzGI U.S. Small-Cap Growth (a)(b) | 115,248 | 1,991,480 | ||||||
AllianzGI Ultra Micro Cap (a)(b) | 25,662 | 659,012 | ||||||
Harvest Funds Intermediate Bond (b) | 86,718 | 888,855 | ||||||
PIMCO CommoditiesPLUS® Strategy (a)(b) | 242,288 | 1,872,886 | ||||||
PIMCO EqS Long/Short (a)(b) | 155,337 | 1,864,040 | ||||||
PIMCO Foreign Bond (U.S. Dollar-Hedged) (a)(b) | 82,648 | 885,982 | ||||||
PIMCO Income (a)(b) | 211,014 | 2,635,563 | ||||||
PIMCO Long-Term Credit (a)(b) | 95,330 | 1,215,464 | ||||||
PIMCO Mortgage Opportunities (a)(b) | 136,996 | 1,530,249 | ||||||
PIMCO StocksPLUS® International (U.S. Dollar-Hedged) (a)(b) | 183,266 | 1,557,762 | ||||||
PIMCO TRENDS Managed Futures Strategy (a)(b) | 175,893 | 1,827,527 | ||||||
Templeton Frontier Markets (d) | 70,828 | 1,002,211 | ||||||
Voya Global Real Estate (c) | 20,690 | 421,040 | ||||||
|
| |||||||
| Total Mutual Funds (cost—$38,913,703) | 40,234,076 | |||||||
|
| |||||||
| Exchange-Traded Funds—7.0% | ||||||||
iShares MSCI Spain Capped | 25,582 | 890,765 | ||||||
PIMCO 15+ Year U.S. TIPS Index (a) | 10,223 | 667,051 | ||||||
PIMCO 25+ Year Zero Coupon U.S. Treasury Index (a) | 2,019 | 229,419 | ||||||
PIMCO Broad U.S. TIPS Index (a) | 22,553 | 1,294,317 | ||||||
|
| |||||||
| Total Exchange-Traded Funds (cost—$3,189,035) | 3,081,552 | |||||||
|
| |||||||
| Principal Amount (000s) | Value | |||||||
| Repurchase Agreements—1.1% | ||||||||
State Street Bank and Trust Co., dated 5/29/15, 0.00%, due 6/1/15, proceeds $463,000; collateralized by U.S. Treasury Notes, 3.125%, due 5/15/21, valued at $474,649 including accrued interest |
| |||||||
(cost—$463,000) | $463 | $ | 463,000 | |||||
|
| |||||||
| Total Investments (cost—$42,565,738)—99.8% | 43,778,628 | |||||||
|
| |||||||
| Other assets less liabilities—0.2% | 98,479 | |||||||
|
| |||||||
| Net Assets—100.0% | $43,877,107 | |||||||
|
| |||||||
Notes to Schedule of Investments:
(a) Affiliated fund.
(b) Institutional Class share.
(c) Class I share.
(d) Advisor Class share.
(e) Non-income producing.
(f) Class R6 share.
Glossary:
MSCI—Morgan Stanley Capital International
TIPS—Treasury Inflation Protected Securities
| See accompanying Notes to Financial Statements | | May 31, 2015 | | Semiannual Report | 115 |
Table of Contents
Schedule of Investments
May 31, 2015 (Unaudited)
AllianzGI Retirement 2045 Fund
| Shares | Value | |||||||
| Mutual Funds—92.4% | ||||||||
AllianzGI Best Styles International Equity (a)(f) | 175,164 | $2,758,840 | ||||||
AllianzGI Best Styles | 253,012 | 3,934,335 | ||||||
AllianzGI Emerging Markets Consumer (a)(b)(e) | 47,407 | 703,519 | ||||||
AllianzGI Emerging Markets Opportunities (a)(b) | 22,081 | 590,436 | ||||||
AllianzGI Global Natural Resources (a)(b) | 40,508 | 721,448 | ||||||
AllianzGI International Managed Volatility (a)(b) | 56,680 | 841,138 | ||||||
AllianzGI NFJ Mid-Cap Value (a)(b) | 63,993 | 1,780,917 | ||||||
AllianzGI Short Duration High Income (a)(b) | 36,482 | 571,675 | ||||||
AllianzGI U.S. Managed Volatility (a)(b) | 65,873 | 980,849 | ||||||
AllianzGI U.S. Small-Cap Growth (a)(b) | 68,726 | 1,187,581 | ||||||
AllianzGI Ultra Micro Cap (a)(b) | 13,835 | 355,293 | ||||||
Harvest Funds Intermediate Bond (b) | 48,833 | 500,540 | ||||||
PIMCO CommoditiesPLUS® Strategy (a)(b) | 139,630 | 1,079,338 | ||||||
PIMCO EqS Long/Short (a)(b) | 87,111 | 1,045,329 | ||||||
PIMCO Income (a)(b) | 137,547 | 1,717,956 | ||||||
PIMCO Long-Term Credit (a)(b) | 46,737 | 595,895 | ||||||
PIMCO StocksPLUS® International (U.S. Dollar-Hedged) (a)(b) | 146,307 | 1,243,614 | ||||||
PIMCO TRENDS Managed Futures Strategy (a)(b) | 100,071 | 1,039,735 | ||||||
Templeton Frontier Markets (d) | 42,163 | 596,600 | ||||||
Voya Global Real Estate (c) | 11,651 | 237,094 | ||||||
|
| |||||||
| Total Mutual Funds (cost—$21,629,827) | 22,482,132 | |||||||
|
| |||||||
| Exchange-Traded Funds���6.6% | ||||||||
iShares MSCI Spain Capped | 14,047 | 489,117 | ||||||
PIMCO 15+ Year U.S. TIPS Index (a) | 5,746 | 374,926 | ||||||
PIMCO Broad U.S. TIPS Index (a) | 12,771 | 732,928 | ||||||
|
| |||||||
| Total Exchange-Traded Funds (cost—$1,651,753) | 1,596,971 | |||||||
|
| |||||||
| Principal Amount (000s) | Value | |||||||
| Repurchase Agreements—1.1% | ||||||||
State Street Bank and Trust Co., dated 5/29/15, 0.00%, due 6/1/15, proceeds $270,000; collateralized by U.S. Treasury Notes, 2.125%, due 9/30/21, valued at $276,075 including accrued interest |
| |||||||
(cost—$270,000) | $270 | $ | 270,000 | |||||
|
| |||||||
| Total Investments (cost—$23,551,580)—100.1% | 24,349,103 | |||||||
|
| |||||||
| Liabilities in excess of other assets—(0.1)% | (23,862 | ) | ||||||
|
| |||||||
| Net Assets—100.0% | $24,325,241 | |||||||
|
| |||||||
Notes to Schedule of Investments:
(a) Affiliated fund.
(b) Institutional Class share.
(c) Class I share.
(d) Advisor Class share.
(e) Non-income producing.
(f) Class R6 share.
Glossary:
MSCI—Morgan Stanley Capital International
TIPS—Treasury Inflation Protected Securities
AllianzGI Retirement 2050 Fund
| Shares | Value | |||||||
| Mutual Funds—92.7% | ||||||||
AllianzGI Best Styles International Equity (a)(f) | 156,655 | $2,467,315 | ||||||
AllianzGI Best Styles U.S. Equity (a)(f) | 228,295 | 3,549,995 | ||||||
AllianzGI Emerging Markets Consumer (a)(b)(e) | 40,536 | 601,557 | ||||||
AllianzGI Emerging Markets Opportunities (a)(b) | 22,781 | 609,171 | ||||||
AllianzGI Global Natural Resources (a)(b) | 40,476 | 720,875 | ||||||
AllianzGI International Managed Volatility (a)(b) | 55,023 | 816,537 | ||||||
AllianzGI NFJ Mid-Cap Value (a)(b) | 58,068 | 1,616,026 | ||||||
AllianzGI U.S. Managed Volatility (a)(b) | 69,888 | 1,040,627 | ||||||
AllianzGI U.S. Small-Cap Growth (a)(b) | 60,791 | 1,050,461 | ||||||
AllianzGI Ultra Micro Cap (a)(b) | 13,796 | 354,279 | ||||||
Harvest Funds Intermediate Bond (b) | 41,029 | 420,551 | ||||||
PIMCO CommoditiesPLUS® Strategy (a)(b) | 134,018 | 1,035,959 | ||||||
PIMCO EqS Long/Short (a)(b) | 77,675 | 932,106 | ||||||
PIMCO Income (a)(b) | 66,813 | 834,489 | ||||||
PIMCO Long-Term Credit (a)(b) | 41,740 | 532,186 | ||||||
PIMCO StocksPLUS® International (U.S. Dollar-Hedged) (a)(b) | 124,257 | 1,056,184 | ||||||
PIMCO TRENDS Managed Futures Strategy (a)(b) | 88,979 | 924,497 | ||||||
Templeton Frontier Markets (d) | 36,634 | 518,376 | ||||||
Voya Global Real Estate (c) | 9,786 | 199,142 | ||||||
|
| |||||||
| Total Mutual Funds (cost—$18,326,118) | 19,280,333 | |||||||
|
| |||||||
| Exchange-Traded Funds—5.9% | ||||||||
iShares MSCI Spain Capped | 11,804 | 411,015 | ||||||
PIMCO 15+ Year U.S. TIPS Index (a) | 3,250 | 212,063 | ||||||
PIMCO Broad U.S. TIPS Index (a) | 10,733 | 615,967 | ||||||
|
| |||||||
| Total Exchange-Traded Funds (cost—$1,287,465) | 1,239,045 | |||||||
|
| |||||||
| Principal Amount (000s) | ||||||||
| Repurchase Agreements—1.3% | ||||||||
State Street Bank and Trust Co., dated 5/29/15, 0.00%, due 6/1/15, proceeds $269,000; collateralized by U.S. Treasury Notes, 2.125%, due 9/30/21, valued at $276,075 including accrued interest |
| |||||||
(cost—$269,000) | $269 | 269,000 | ||||||
|
| |||||||
| Total Investments (cost—$19,882,583)—99.9% | 20,788,378 | |||||||
|
| |||||||
| Other assets less liabilities—0.1% | 11,569 | |||||||
|
| |||||||
| Net Assets—100.0% | $20,799,947 | |||||||
|
| |||||||
| 116 | Semiannual Report | | May 31, 2015 | | See accompanying Notes to Financial Statements |
Table of Contents
Schedule of Investments
May 31, 2015 (Unaudited)
Notes to Schedule of Investments:
(a) Affiliated fund.
(b) Institutional Class share.
(c) Class I share.
(d) Advisor Class share.
(e) Non-income producing.
(f) Class R6 share.
Glossary:
MSCI—Morgan Stanley Capital International
TIPS—Treasury Inflation Protected Securities
AllianzGI Retirement 2055 Fund
| Shares | Value | |||||||
| Mutual Funds—93.3% | ||||||||
AllianzGI Best Styles International Equity (a)(f) | 63,931 | $1,006,906 | ||||||
AllianzGI Best Styles U.S. Equity (a)(f) | 98,754 | 1,535,619 | ||||||
AllianzGI Emerging Markets Consumer (a)(b)(e) | 16,464 | 244,330 | ||||||
AllianzGI Emerging Markets Opportunities (a)(b) | 9,207 | 246,206 | ||||||
AllianzGI Global Natural Resources (a)(b) | 16,520 | 294,226 | ||||||
AllianzGI International Managed Volatility (a)(b) | 22,477 | 333,564 | ||||||
AllianzGI NFJ Mid-Cap Value (a)(b) | 24,330 | 677,098 | ||||||
AllianzGI U.S. Managed Volatility (a)(b) | 28,551 | 425,125 | ||||||
AllianzGI U.S. Small-Cap Growth (a)(b) | 24,834 | 429,137 | ||||||
AllianzGI Ultra Micro Cap (a)(b) | 6,609 | 169,706 | ||||||
Harvest Funds Intermediate Bond (b) | 16,617 | 170,329 | ||||||
PIMCO CommoditiesPLUS® Strategy (a)(b) | 54,704 | 422,860 | ||||||
PIMCO EqS Long/Short (a)(b) | 31,975 | 383,704 | ||||||
PIMCO Income (a)(b) | 13,684 | 170,911 | ||||||
PIMCO Long-Term Credit (a)(b) | 17,024 | 217,056 | ||||||
PIMCO StocksPLUS® International (U.S. Dollar-Hedged) (a)(b) | 60,910 | 517,734 | ||||||
PIMCO TRENDS Managed Futures Strategy (a)(b) | 36,312 | 377,282 | ||||||
Templeton Frontier Markets (d) | 15,045 | 212,885 | ||||||
Voya Global Real Estate (c) | 3,963 | 80,650 | ||||||
|
| |||||||
| Total Mutual Funds (cost—$7,587,085) | 7,915,328 | |||||||
|
| |||||||
| Exchange-Traded Funds—5.4% | ||||||||
iShares MSCI Spain Capped | 4,879 | 169,887 | ||||||
PIMCO 15+ Year U.S. TIPS Index (a) | 1,321 | 86,195 | ||||||
PIMCO Broad U.S. TIPS Index (a) | 3,502 | 200,980 | ||||||
|
| |||||||
| Total Exchange-Traded Funds (cost—$477,755) | 457,062 | |||||||
|
| |||||||
| Principal Amount (000s) | ||||||||
| Repurchase Agreements—1.2% | ||||||||
State Street Bank and Trust Co., dated 5/29/15, 0.00%, due 6/1/15, proceeds $102,000; collateralized by U.S. Treasury Notes, 2.125%, due 9/30/21, valued at $107,363 including accrued interest |
| |||||||
(cost—$102,000) | $102 | 102,000 | ||||||
|
| |||||||
| Total Investments (cost—$8,166,840)—99.9% | 8,474,390 | |||||||
|
| |||||||
| Other assets less liabilities—0.1% | 8,089 | |||||||
|
| |||||||
| Net Assets—100.0% | $8,482,479 | |||||||
|
| |||||||
Notes to Schedule of Investments:
(a) Affiliated fund.
(b) Institutional Class share.
(c) Class I share.
(d) Advisor Class share.
(e) Non-income producing.
(f) Class R6 share.
Glossary:
MSCI—Morgan Stanley Capital International
TIPS—Treasury Inflation Protected Securities
| See accompanying Notes to Financial Statements | | May 31, 2015 | | Semiannual Report | 117 |
Table of Contents
Schedule of Investments
May 31, 2015 (Unaudited)
AllianzGI Retirement Income Fund
| Shares | Value | |||||||
| Mutual Funds—75.2% | ||||||||
AllianzGI Best Styles International Equity (a)(f) | 62,814 | $989,325 | ||||||
AllianzGI Best Styles U.S. Equity (a)(f) | 177,197 | 2,755,414 | ||||||
AllianzGI Emerging Markets Consumer (a)(b)(e) | 32,276 | 478,973 | ||||||
AllianzGI Global Natural Resources (a)(b) | 30,034 | 534,898 | ||||||
AllianzGI NFJ Mid-Cap Value (a)(b) | 29,384 | 817,765 | ||||||
AllianzGI Short Duration High Income (a)(b) | 135,785 | 2,127,755 | ||||||
AllianzGI U.S. Small-Cap Growth (a)(b) | 32,103 | 554,746 | ||||||
Harvest Funds Intermediate Bond (b) | 87,294 | 894,768 | ||||||
PIMCO CommoditiesPLUS® Strategy (a)(b) | 80,298 | 620,701 | ||||||
PIMCO Foreign Bond (U.S. Dollar-Hedged) (a)(b) | 58,738 | 629,667 | ||||||
PIMCO Income (a)(b) | 292,438 | 3,652,553 | ||||||
PIMCO Long-Term Credit (a)(b) | 79,632 | 1,015,306 | ||||||
PIMCO Mortgage Opportunities (a)(b) | 225,289 | 2,516,481 | ||||||
PIMCO StocksPLUS® International (U.S. Dollar-Hedged) (a)(b) | 29,849 | 253,719 | ||||||
PIMCO TRENDS Managed Futures Strategy (a)(b) | 58,828 | 611,226 | ||||||
Templeton Frontier Markets (d) | 17,812 | 252,039 | ||||||
Voya Global Real Estate (c) | 5,910 | 120,262 | ||||||
|
| |||||||
| Total Mutual Funds (cost—$18,371,931) | 18,825,598 | |||||||
|
| |||||||
| Exchange-Traded Funds—23.7% | ||||||||
iShares MSCI Spain Capped | 5,791 | 201,643 | ||||||
PIMCO 15+ Year U.S. TIPS Index (a) | 17,428 | 1,137,177 | ||||||
PIMCO 25+ Year Zero Coupon U.S. Treasury Index (a) | 3,442 | 391,115 | ||||||
PIMCO Broad U.S. TIPS Index (a) | 73,437 | 4,214,549 | ||||||
|
| |||||||
| Total Exchange-Traded Funds (cost—$6,001,434) | 5,944,484 | |||||||
|
| |||||||
| Principal Amount (000s) | ||||||||
| Repurchase Agreements—0.8% | ||||||||
State Street Bank and Trust Co., dated 5/29/15, 0.00%, due 6/1/15, proceeds $213,000; collateralized by U.S. Treasury Notes, 2.125%, due 9/30/21, valued at $219,838 including accrued interest |
| |||||||
(cost—$213,000) | $213 | 213,000 | ||||||
|
| |||||||
| Total Investments (cost—$24,586,365)—99.7% | 24,983,082 | |||||||
|
| |||||||
| Other assets less liabilities—0.3% | 76,857 | |||||||
|
| |||||||
| Net Assets—100.0% | $25,059,939 | |||||||
|
| |||||||
Notes to Schedule of Investments:
(a) Affiliated fund.
(b) Institutional Class share.
(c) Class I share.
(d) Advisor Class share.
(e) Non-income producing.
(f) Class R6 share.
Glossary:
MSCI—Morgan Stanley Capital International
TIPS—Treasury Inflation Protected Securities
AllianzGI Global Allocation Fund
| Shares | Value | |||||||
| Mutual Funds (a)— 79.4% | ||||||||
AllianzGI Best Styles Global Equity (c) | 6,444,342 | $107,104,967 | ||||||
AllianzGI International Managed Volatility (b) | 630,091 | 9,350,549 | ||||||
AllianzGI Short Duration High Income (b) | 905,944 | 14,196,150 | ||||||
AllianzGI U.S. Managed Volatility (b) | 743,468 | 11,070,236 | ||||||
PIMCO Commodity RealReturn Strategy (b) | 447,228 | 1,954,388 | ||||||
PIMCO Income (b) | 1,355,166 | 16,926,021 | ||||||
|
| |||||||
| Total Mutual Funds (cost—$149,987,732) | 160,602,311 | |||||||
|
| |||||||
| Exchange-Traded Funds—14.7% | ||||||||
PIMCO 15+ Year U.S. TIPS Index (a) | 46,300 | 3,021,075 | ||||||
PIMCO 7-15 Year U.S. Treasury Index (a) | 47,970 | 4,129,258 | ||||||
PIMCO Investment Grade Corporate Bond (a) | 85,503 | 8,764,912 | ||||||
Schwab U.S. TIPS | 179,490 | 9,821,693 | ||||||
Vanguard Long Term Corporate Bond | 45,410 | 4,036,949 | ||||||
|
| |||||||
| Total Exchange-Traded Funds (cost—$30,825,140) | 29,773,887 | |||||||
|
| |||||||
| Principal Amount (000s) | ||||||||
| Repurchase Agreements—5.2% | ||||||||
State Street Bank and Trust Co., dated 5/29/15, 0.00%, due 6/1/15, proceeds $10,601,000; collateralized by U.S. Treasury Notes, 3.125%, due 5/15/21, valued at $10,814,435 including accrued interest |
| |||||||
(cost—$10,601,000) | $10,601 | 10,601,000 | ||||||
|
| |||||||
| Total Investments (cost—$191,413,872)—99.3% | 200,977,198 | |||||||
|
| |||||||
| Other assets less liabilities—0.7% | 1,492,949 | |||||||
|
| |||||||
| Net Assets—100.0% | $202,470,147 | |||||||
|
| |||||||
Notes to Schedule of Investments:
(a) Affiliated fund.
(b) Institutional Class share.
(c) Class R6 share.
Glossary:
TIPS—Treasury Inflation Protected Securities
| 118 | Semiannual Report | | May 31, 2015 | | See accompanying Notes to Financial Statements |
Table of Contents
Schedule of Investments
May 31, 2015 (Unaudited)
AllianzGI Global Dynamic Allocation Fund
| Shares | Value | |||||||
| Mutual Funds (a)—68.8% | ||||||||
AllianzGI Best Styles Emerging Markets Equity (c) | 28,659 | $449,089 | ||||||
AllianzGI Best Styles International Equity (c) | 77,598 | 1,222,166 | ||||||
AllianzGI Best Styles U.S. Equity (c) | 80,846 | 1,257,158 | ||||||
AllianzGI International Managed Volatility (b) | 21,827 | 323,906 | ||||||
AllianzGI Short Duration High Income (b) | 9,775 | 153,168 | ||||||
AllianzGI U.S. Managed Volatility (b) | 23,997 | 357,315 | ||||||
PIMCO Emerging Markets Bond (b) | 15,412 | 160,750 | ||||||
PIMCO Income (b) | 18,541 | 231,578 | ||||||
PIMCO Investment Grade Corporate Bond (b) | 43,827 | 466,762 | ||||||
PIMCO Long-Term Credit (b) | 11,668 | 148,762 | ||||||
PIMCO Mortgage Opportunities (b) | 20,431 | 228,211 | ||||||
PIMCO Mortgage-Backed Securities (b) | 45,278 | 477,678 | ||||||
|
| |||||||
| Total Mutual Funds (cost—$5,228,763) | 5,476,543 | |||||||
|
| |||||||
| Exchange-Traded FUNDS—8.4% | ||||||||
iShares MSCI EAFE Minimum Volatility | 2,347 | 158,939 | ||||||
iShares MSCI Emerging Markets Minimum Volatility | 1,996 | 120,079 | ||||||
iShares MSCI USA Minimum Volatility | 5,567 | 230,697 | ||||||
ProShares S&P 500 Dividend Aristocrats | 3,183 | 160,296 | ||||||
|
| |||||||
| Total Exchange-Traded Funds (cost—$650,858) | 670,011 | |||||||
|
| |||||||
| Principal Amount (000s) | ||||||||
| U.S. Treasury Obligations—5.6% | ||||||||
U.S. Treasury Bonds, | ||||||||
3.125%, 2/15/43 | $26 | 27,138 | ||||||
4.375%, 5/15/41 | 21 | 26,951 | ||||||
6.875%, 8/15/25 | 15 | 21,568 | ||||||
U.S. Treasury Notes, | ||||||||
0.75%, 2/28/18 | 72 | 71,758 | ||||||
1.00%, 6/30/19 | 78 | 77,110 | ||||||
1.875%, 10/31/17 | 48 | 49,275 | ||||||
2.00%, 5/31/21 | 54 | 54,835 | ||||||
2.00%, 2/15/23 | 66 | 66,299 | ||||||
3.00%, 2/28/17 | 46 | 47,966 | ||||||
|
| |||||||
| Total U.S. Treasury Obligations (cost—$441,121) | 442,900 | |||||||
|
| |||||||
| U.S. Government Agency Securities—0.5% | ||||||||
Fannie Mae, | ||||||||
1.375%, 11/15/16 | 21 | 21,265 | ||||||
Freddie Mac, | ||||||||
1.00%, 6/29/17 | 18 | 18,120 | ||||||
|
| |||||||
| Total U.S. Government Agency Securities (cost—$39,307) | 39,385 | |||||||
|
| |||||||
Principal | Value | |||||||
| Short-Term Investments—14.2% | ||||||||
| Repurchase Agreements—13.4% | ||||||||
State Street Bank and Trust Co., dated 5/29/15, 0.00%, due 6/1/15, proceeds $1,071,000; collateralized by U.S. Treasury Notes, 2.125%, due 9/30/21, valued at $1,094,075 including accrued interest |
| |||||||
(cost—$1,071,000) | $ | 1,071 | $ | 1,071,000 | ||||
|
| |||||||
| U.S. Treasury Obligations—0.8% | ||||||||
U.S. Treasury Notes, | 64 | 64,405 | ||||||
|
| |||||||
| Total Short-Term Investments (cost—$1,135,635) | 1,135,405 | |||||||
|
| |||||||
| Total Investments (cost—$7,495,684)—97.5% | 7,764,244 | |||||||
|
| |||||||
| Other assets less liabilities—2.5% | 198,948 | |||||||
|
| |||||||
| Net Assets—100.0% | $7,963,192 | |||||||
|
| |||||||
Notes to Schedule of Investments:
(a) Affiliated fund.
(b) Institutional Class share.
(c) Class R6 share.
Glossary:
MSCI—Morgan Stanley Capital International
AllianzGI Global Megatrends Fund
| Shares | Value | |||||||
| Mutual Funds (a)(b)— 99.3% | ||||||||
AllianzGI Emerging Markets Consumer (c) | 41,337 | $613,443 | ||||||
AllianzGI Global Natural Resources | 34,841 | 620,524 | ||||||
AllianzGI Global Water | 47,831 | 628,015 | ||||||
AllianzGI Health Sciences (c) | 17,969 | 688,051 | ||||||
AllianzGI Technology | 10,383 | 662,982 | ||||||
|
| |||||||
| Total Investments (cost—$3,000,000)—99.3% | 3,213,015 | |||||||
|
| |||||||
| Other assets less liabilities—0.7% | 21,116 | |||||||
|
| |||||||
| Net Assets—100.0% | $3,234,131 | |||||||
|
| |||||||
Notes to Schedule of Investments:
(a) Affiliated fund.
(b) Institutional Class share.
(c) Non-income producing.
| See accompanying Notes to Financial Statements | | May 31, 2015 | | Semiannual Report | 119 |
Table of Contents
Schedule of Investments
May 31, 2015 (Unaudited)
AllianzGI Behavioral Advantage Large Cap Fund
| Shares | Value | |||||||
| Common Stock—99.3% | ||||||||
| Aerospace & Defense—3.4% | ||||||||
Boeing Co. | 3,600 | $505,872 | ||||||
General Dynamics Corp. | 3,400 | 476,544 | ||||||
Huntington Ingalls Industries, Inc. | 500 | 61,995 | ||||||
Northrop Grumman Corp. | 1,850 | 294,483 | ||||||
Rockwell Collins, Inc. | 1,000 | 95,190 | ||||||
Textron, Inc. | 1,800 | 81,396 | ||||||
|
| |||||||
| 1,515,480 | ||||||||
|
| |||||||
| Air Freight & Logistics—1.3% | ||||||||
Expeditors International of Washington, Inc. | 1,700 | 77,928 | ||||||
United Parcel Service, Inc., Class B | 5,100 | 506,022 | ||||||
|
| |||||||
| 583,950 | ||||||||
|
| |||||||
| Airlines—1.2% | ||||||||
Alaska Air Group, Inc. | 1,700 | 109,888 | ||||||
Delta Air Lines, Inc. | 6,150 | 263,958 | ||||||
JetBlue Airways Corp. (a) | 2,400 | 48,384 | ||||||
Southwest Airlines Co. | 3,200 | 118,560 | ||||||
|
| |||||||
| 540,790 | ||||||||
|
| |||||||
| Auto Components—0.9% | ||||||||
Cooper Tire & Rubber Co. | 500 | 18,355 | ||||||
Dana Holding Corp. | 1,100 | 23,947 | ||||||
Delphi Automotive PLC | 2,400 | 208,752 | ||||||
Gentex Corp. | 1,400 | 24,052 | ||||||
Goodyear Tire & Rubber Co. | 2,500 | 79,613 | ||||||
Visteon Corp. (a) | 300 | 32,856 | ||||||
|
| |||||||
| 387,575 | ||||||||
|
| |||||||
| Automobiles—0.1% | ||||||||
Thor Industries, Inc. | 400 | 24,436 | ||||||
|
| |||||||
| Beverages—2.7% | ||||||||
Brown-Forman Corp., Class B | 700 | 65,989 | ||||||
Coca-Cola Enterprises, Inc. | 1,300 | 57,499 | ||||||
Dr. Pepper Snapple Group, Inc. | 1,100 | 84,304 | ||||||
Molson Coors Brewing Co., Class B | 1,100 | 80,718 | ||||||
Monster Beverage Corp. (a) | 1,500 | 190,920 | ||||||
PepsiCo, Inc. | 7,650 | 737,690 | ||||||
|
| |||||||
| 1,217,120 | ||||||||
|
| |||||||
| Biotechnology—3.4% | ||||||||
Amgen, Inc. | 3,850 | 601,601 | ||||||
Gilead Sciences, Inc. (a) | 4,800 | 538,896 | ||||||
Incyte Corp. (a) | 2,200 | 242,330 | ||||||
Medivation, Inc. (a) | 800 | 105,640 | ||||||
United Therapeutics Corp. (a) | 200 | 36,744 | ||||||
|
| |||||||
| 1,525,211 | ||||||||
|
| |||||||
| Building Products—0.1% | ||||||||
Allegion PLC | 400 | 24,976 | ||||||
|
| |||||||
| Capital Markets—0.7% | ||||||||
Artisan Partners Asset Management, Inc., Class A | 500 | 22,055 | ||||||
BGC Partners, Inc., Class A | 2,100 | 19,845 | ||||||
Northern Trust Corp. | 1,000 | 74,550 | ||||||
NorthStar Asset Management Group, Inc. | 1,600 | 35,008 | ||||||
Raymond James Financial, Inc. | 900 | 52,308 | ||||||
SEI Investments Co. | 1,350 | 64,584 | ||||||
Waddell & Reed Financial, Inc., Class A | 800 | 38,224 | ||||||
WisdomTree Investments, Inc. | 800 | 17,088 | ||||||
|
| |||||||
| 323,662 | ||||||||
|
| |||||||
| Chemicals—3.0% | ||||||||
Ashland, Inc. | 900 | 114,660 | ||||||
Cabot Corp. | 400 | 16,588 | ||||||
| Shares | Value | |||||||
Celanese Corp., Ser. A | 1,100 | $ | 75,735 | |||||
Chemtura Corp. (a) | 600 | 16,656 | ||||||
Cytec Industries, Inc. | 300 | 18,147 | ||||||
EI du Pont de Nemours & Co. | 4,900 | 347,949 | ||||||
International Flavors & Fragrances, Inc. | 500 | 59,520 | ||||||
LyondellBasell Industries NV, Class A | 4,600 | 465,060 | ||||||
NewMarket Corp. | 100 | 46,041 | ||||||
Praxair, Inc. | 1,250 | 153,575 | ||||||
|
| |||||||
| 1,313,931 | ||||||||
|
| |||||||
| Commercial Services & Supplies—0.7% | ||||||||
Cintas Corp. | 800 | 68,872 | ||||||
Clean Harbors, Inc. (a) | 300 | 16,902 | ||||||
Deluxe Corp. | 300 | 19,149 | ||||||
Pitney Bowes, Inc. | 1,100 | 24,035 | ||||||
Rollins, Inc. | 1,500 | 37,230 | ||||||
RR Donnelley & Sons Co. | 2,200 | 42,196 | ||||||
Waste Management, Inc. | 2,300 | 114,195 | ||||||
|
| |||||||
| 322,579 | ||||||||
|
| |||||||
| Communications Equipment—3.0% | ||||||||
Cisco Systems, Inc. | 14,300 | 419,133 | ||||||
F5 Networks, Inc. (a) | 800 | 100,552 | ||||||
Harris Corp. | 500 | 39,610 | ||||||
InterDigital, Inc. | 400 | 23,452 | ||||||
Juniper Networks, Inc. | 3,400 | 94,520 | ||||||
Palo Alto Networks, Inc. (a) | 600 | 101,694 | ||||||
QUALCOMM, Inc. | 7,900 | 550,472 | ||||||
|
| |||||||
| 1,329,433 | ||||||||
|
| |||||||
| Construction & Engineering—0.2% | ||||||||
Dycom Industries, Inc. (a) | 400 | 23,032 | ||||||
EMCOR Group, Inc. | 700 | 31,759 | ||||||
KBR, Inc. | 1,000 | 19,150 | ||||||
|
| |||||||
| 73,941 | ||||||||
|
| |||||||
| Containers & Packaging—1.2% | ||||||||
Avery Dennison Corp. | 600 | 37,146 | ||||||
Ball Corp. | 800 | 56,792 | ||||||
Bemis Co., Inc. | 400 | 18,376 | ||||||
Berry Plastics Group, Inc. (a) | 7,900 | 264,413 | ||||||
Rock-Tenn Co., Class A | 800 | 52,112 | ||||||
Sealed Air Corp. | 2,000 | 97,400 | ||||||
|
| |||||||
| 526,239 | ||||||||
|
| |||||||
| Distributors—0.1% | ||||||||
Genuine Parts Co. | 600 | 54,282 | ||||||
|
| |||||||
| Diversified Consumer Services—0.6% | ||||||||
Bright Horizons Family Solutions, Inc. (a) | 400 | 22,268 | ||||||
Graham Holdings Co., Class B | 100 | 107,100 | ||||||
Houghton Mifflin Harcourt Co. (a) | 700 | 18,466 | ||||||
Service Corp. International | 1,000 | 29,060 | ||||||
ServiceMaster Global Holdings, Inc. (a) | 2,000 | 67,180 | ||||||
|
| |||||||
| 244,074 | ||||||||
|
| |||||||
| Diversified Financial Services—0.7% | ||||||||
CBOE Holdings, Inc. | 500 | 29,260 | ||||||
MarketAxess Holdings, Inc. | 300 | 26,535 | ||||||
Moody’s Corp. | 2,550 | 275,655 | ||||||
|
| |||||||
| 331,450 | ||||||||
|
| |||||||
| Diversified Telecommunication Services—0.2% | ||||||||
CenturyLink, Inc. | 2,800 | 93,072 | ||||||
|
| |||||||
| Electrical Equipment—0.5% | ||||||||
Acuity Brands, Inc. | 200 | 35,298 | ||||||
Hubbell, Inc., Class B | 300 | 32,409 | ||||||
| Shares | Value | |||||||
Regal Beloit Corp. | 300 | $ | 23,457 | |||||
Rockwell Automation, Inc. | 900 | 110,601 | ||||||
|
| |||||||
| 201,765 | ||||||||
|
| |||||||
| Electronic Equipment, Instruments & Components—0.6% | ||||||||
CDW Corp. | 700 | 25,970 | ||||||
Cognex Corp. (a) | 400 | 20,188 | ||||||
FLIR Systems, Inc. | 800 | 24,440 | ||||||
Jabil Circuit, Inc. | 3,400 | 83,538 | ||||||
Littelfuse, Inc. | 200 | 19,340 | ||||||
Methode Electronics, Inc. | 700 | 32,851 | ||||||
Sanmina Corp. (a) | 700 | 15,162 | ||||||
Tech Data Corp. (a) | 500 | 31,560 | ||||||
|
| |||||||
| 253,049 | ||||||||
|
| |||||||
| Energy Equipment & Services—1.5% | ||||||||
Cameron International Corp. (a) | 1,500 | 76,995 | ||||||
Noble Corp. PLC | 4,600 | 77,050 | ||||||
Oil States International, Inc. (a) | 1,200 | 49,056 | ||||||
Schlumberger Ltd. | 5,100 | 462,927 | ||||||
|
| |||||||
| 666,028 | ||||||||
|
| |||||||
| Food & Staples Retailing—5.4% | ||||||||
Costco Wholesale Corp. | 3,600 | 513,324 | ||||||
CVS Health Corp. | 6,600 | 675,708 | ||||||
Kroger Co. | 5,500 | 400,400 | ||||||
SUPERVALU, Inc. (a) | 2,100 | 18,543 | ||||||
Wal-Mart Stores, Inc. | 10,600 | 787,262 | ||||||
|
| |||||||
| 2,395,237 | ||||||||
|
| |||||||
| Food Products—3.4% | ||||||||
Archer-Daniels-Midland Co. | 4,700 | 248,395 | ||||||
Bunge Ltd. | 4,900 | 453,544 | ||||||
Campbell Soup Co. | 1,500 | 72,510 | ||||||
ConAgra Foods, Inc. | 2,900 | 111,969 | ||||||
Flowers Foods, Inc. | 1,000 | 22,460 | ||||||
Hormel Foods Corp. | 1,150 | 65,803 | ||||||
McCormick & Co., Inc. | 1,100 | 86,350 | ||||||
Mead Johnson Nutrition Co. | 850 | 82,705 | ||||||
Mondelez International, Inc., Class A | 6,400 | 266,176 | ||||||
Pilgrim’s Pride Corp. | 1,300 | 33,254 | ||||||
Pinnacle Foods, Inc. | 700 | 29,505 | ||||||
Seaboard Corp. (a) | 15 | 51,450 | ||||||
|
| |||||||
| 1,524,121 | ||||||||
|
| |||||||
| Gas Utilities—0.0% | ||||||||
New Jersey Resources Corp. | 600 | 18,042 | ||||||
|
| |||||||
| Health Care Equipment & Supplies—1.4% | ||||||||
ABIOMED, Inc. (a) | 600 | 35,832 | ||||||
Align Technology, Inc. (a) | 700 | 42,469 | ||||||
CR Bard, Inc. | 300 | 51,096 | ||||||
Cyberonics, Inc. (a) | 400 | 25,604 | ||||||
DENTSPLY International, Inc. | 500 | 26,018 | ||||||
DexCom, Inc. (a) | 400 | 28,688 | ||||||
St. Jude Medical, Inc. | 1,600 | 118,000 | ||||||
Stryker Corp. | 2,650 | 254,744 | ||||||
Thoratec Corp. (a) | 400 | 18,156 | ||||||
|
| |||||||
| 600,607 | ||||||||
|
| |||||||
| Health Care Providers & Services—3.3% | ||||||||
AmerisourceBergen Corp. | 2,300 | 258,888 | ||||||
Express Scripts Holding Co. (a) | 6,400 | 557,696 | ||||||
Health Net, Inc. (a) | 500 | 31,120 | ||||||
Omnicare, Inc. | 700 | 66,703 | ||||||
Team Health Holdings, Inc. (a) | 300 | 17,544 | ||||||
UnitedHealth Group, Inc. | 4,200 | 504,882 | ||||||
VCA, Inc. (a) | 400 | 20,984 | ||||||
WellCare Health Plans, Inc. (a) | 300 | 25,701 | ||||||
|
| |||||||
| 1,483,518 | ||||||||
|
| |||||||
| 120 | Semiannual Report | | May 31, 2015 | | See accompanying Notes to Financial Statements |
Table of Contents
Schedule of Investments
May 31, 2015 (Unaudited)
| Shares | Value | |||||||
| Health Care Technology—0.5% | ||||||||
Cerner Corp. (a) | 2,200 | $ | 148,038 | |||||
IMS Health Holdings, Inc. (a) | 1,800 | 53,568 | ||||||
Medidata Solutions, Inc. (a) | 600 | 34,806 | ||||||
|
| |||||||
| 236,412 | ||||||||
|
| |||||||
| Hotels, Restaurants & Leisure—4.6% | ||||||||
Carnival Corp. | 2,500 | 115,825 | ||||||
Cheesecake Factory, Inc. | 400 | 20,628 | ||||||
Choice Hotels International, Inc. | 900 | 50,913 | ||||||
Cracker Barrel Old Country Store, Inc. | 200 | 28,216 | ||||||
Darden Restaurants, Inc. | 1,700 | 111,418 | ||||||
Domino’s Pizza, Inc. | 650 | 70,629 | ||||||
Hyatt Hotels Corp., Class A (a) | 500 | 28,730 | ||||||
La Quinta Holdings, Inc. (a) | 2,500 | 62,150 | ||||||
Marriott International, Inc., Class A | 3,850 | 300,261 | ||||||
Marriott Vacations Worldwide Corp. | 400 | 35,312 | ||||||
McDonald’s Corp. | 3,990 | 382,761 | ||||||
Papa John’s International, Inc. | 300 | 20,613 | ||||||
Pinnacle Entertainment, Inc. (a) | 800 | 29,576 | ||||||
Six Flags Entertainment Corp. | 500 | 24,430 | ||||||
Starbucks Corp. | 11,500 | 597,540 | ||||||
Starwood Hotels & Resorts Worldwide, Inc. | 1,000 | 82,760 | ||||||
Vail Resorts, Inc. | 600 | 62,244 | ||||||
|
| |||||||
| 2,024,006 | ||||||||
|
| |||||||
| Household Durables—0.1% | ||||||||
NVR, Inc. (a) | 35 | 47,621 | ||||||
Tempur Sealy International, Inc. (a) | 300 | 17,877 | ||||||
|
| |||||||
| 65,498 | ||||||||
|
| |||||||
| Household Products—1.7% | ||||||||
Colgate-Palmolive Co. | 6,700 | 447,493 | ||||||
HRG Group, Inc. (a) | 1,700 | 22,304 | ||||||
Kimberly-Clark Corp. | 2,450 | 266,707 | ||||||
Spectrum Brands Holdings, Inc. | 300 | 28,995 | ||||||
|
| |||||||
| 765,499 | ||||||||
|
| |||||||
| Independent Power Producers & Energy Traders—0.1% | ||||||||
AES Corp. | 3,900 | 53,040 | ||||||
|
| |||||||
| Industrial Conglomerates—1.2% | ||||||||
3M Co. | 3,100 | 493,148 | ||||||
Carlisle Cos., Inc. | 300 | 29,745 | ||||||
|
| |||||||
| 522,893 | ||||||||
|
| |||||||
| Insurance—4.9% | ||||||||
Allstate Corp. | 3,250 | 218,790 | ||||||
American Financial Group, Inc. | 800 | 50,800 | ||||||
American National Insurance Co. | 200 | 20,642 | ||||||
Arch Capital Group Ltd. (a) | 700 | 44,723 | ||||||
Axis Capital Holdings Ltd. | 1,300 | 71,552 | ||||||
Chubb Corp. | 1,000 | 97,500 | ||||||
Genworth Financial, Inc., Class A (a) | 2,600 | 20,644 | ||||||
Hanover Insurance Group, Inc. | 300 | 21,354 | ||||||
Hartford Financial Services Group, Inc. | 2,000 | 82,220 | ||||||
Loews Corp. | 2,200 | 88,264 | ||||||
Markel Corp. (a) | 50 | 38,638 | ||||||
Marsh & McLennan Cos., Inc. | 2,850 | 165,955 | ||||||
MBIA, Inc. (a) | 5,100 | 46,002 | ||||||
MetLife, Inc. | 7,100 | 371,046 | ||||||
National General Holdings Corp. | 800 | 15,536 | ||||||
Principal Financial Group, Inc. | 2,000 | 103,380 | ||||||
Progressive Corp. | 2,450 | 66,983 | ||||||
Prudential Financial, Inc. | 4,200 | 355,362 | ||||||
StanCorp Financial Group, Inc. | 400 | 29,688 | ||||||
Symetra Financial Corp. | 600 | 14,676 | ||||||
Torchmark Corp. | 500 | 28,535 | ||||||
Travelers Cos., Inc. | 1,450 | 146,624 | ||||||
| Shares | Value | |||||||
Unum Group | 1,000 | $ | 34,960 | |||||
XL Group PLC | 1,200 | 45,216 | ||||||
|
| |||||||
| 2,179,090 | ||||||||
|
| |||||||
| Internet & Catalog Retail—0.6% | ||||||||
Expedia, Inc. | 600 | 64,356 | ||||||
HSN, Inc. | 300 | 20,133 | ||||||
Liberty Interactive Corp., Class A (a) | 1,900 | 53,143 | ||||||
Liberty Ventures, Ser. A (a) | 1,284 | 53,286 | ||||||
Travelport Worldwide Ltd. | 1,000 | 15,290 | ||||||
TripAdvisor, Inc. (a) | 1,000 | 76,260 | ||||||
|
| |||||||
| 282,468 | ||||||||
|
| |||||||
| Internet Software & Services—1.2% | ||||||||
comScore, Inc. (a) | 500 | 28,290 | ||||||
eBay, Inc. (a) | 6,300 | 386,568 | ||||||
Equinix, Inc. REIT | 200 | 53,614 | ||||||
Google, Inc., Class C (a) | 1 | 532 | ||||||
j2 Global, Inc. | 400 | 26,564 | ||||||
Rackspace Hosting, Inc. (a) | 600 | 24,054 | ||||||
|
| |||||||
| 519,622 | ||||||||
|
| |||||||
| IT Services—8.3% | ||||||||
Accenture PLC, Class A | 5,600 | 537,824 | ||||||
Amdocs Ltd. | 750 | 41,137 | ||||||
Automatic Data Processing, Inc. | 2,100 | 179,571 | ||||||
Booz Allen Hamilton Holding Corp. | 800 | 20,280 | ||||||
Broadridge Financial Solutions, Inc. | 700 | 37,926 | ||||||
CACI International, Inc., Class A (a) | 200 | 17,124 | ||||||
Cognizant Technology Solutions Corp., Class A (a) | 3,200 | 207,104 | ||||||
Computer Sciences Corp. | 1,000 | 68,600 | ||||||
CoreLogic, Inc. (a) | 1,300 | 50,674 | ||||||
DST Systems, Inc. | 300 | 35,520 | ||||||
EPAM Systems, Inc. (a) | 500 | 35,955 | ||||||
Fiserv, Inc. (a) | 1,600 | 128,240 | ||||||
Gartner, Inc. (a) | 900 | 78,732 | ||||||
Global Payments, Inc. | 400 | 41,752 | ||||||
International Business Machines Corp. | 6,100 | 1,034,865 | ||||||
Jack Henry & Associates, Inc. | 300 | 19,524 | ||||||
Leidos Holdings, Inc. | 675 | 28,688 | ||||||
Mastercard, Inc., Class A | 3,950 | 364,427 | ||||||
MAXIMUS, Inc. | 700 | 45,759 | ||||||
Sabre Corp. | 2,300 | 60,007 | ||||||
Science Applications International Corp. | 600 | 31,800 | ||||||
Syntel, Inc. (a) | 500 | 23,755 | ||||||
Total System Services, Inc. | 900 | 37,080 | ||||||
VeriFone Systems, Inc. (a) | 500 | 19,085 | ||||||
Visa, Inc., Class A | 6,700 | 460,156 | ||||||
Western Union Co. | 2,500 | 54,875 | ||||||
|
| |||||||
| 3,660,460 | ||||||||
|
| |||||||
| Life Sciences Tools & Services—0.9% | ||||||||
Agilent Technologies, Inc. | 2,100 | 86,499 | ||||||
Bio-Rad Laboratories, Inc., Class A (a) | 200 | 28,874 | ||||||
Mettler-Toledo International, Inc. (a) | 150 | 48,702 | ||||||
PRA Health Sciences, Inc. (a) | 500 | 16,730 | ||||||
Quintiles Transnational Holdings, Inc. (a) | 800 | 55,768 | ||||||
VWR Corp. (a) | 2,900 | 79,083 | ||||||
Waters Corp. (a) | 600 | 80,172 | ||||||
|
| |||||||
| 395,828 | ||||||||
|
| |||||||
| Machinery—1.2% | ||||||||
AGCO Corp. | 300 | 15,234 | ||||||
Illinois Tool Works, Inc. | 2,500 | 234,575 | ||||||
ITT Corp. | 400 | 17,072 | ||||||
| Shares | Value | |||||||
Lincoln Electric Holdings, Inc. | 400 | $ | 26,884 | |||||
Oshkosh Corp. | 400 | 20,064 | ||||||
PACCAR, Inc. | 2,300 | 146,188 | ||||||
Rexnord Corp. (a) | 600 | 15,372 | ||||||
Snap-on, Inc. | 300 | 46,620 | ||||||
Xylem, Inc. | 800 | 29,256 | ||||||
|
| |||||||
| 551,265 | ||||||||
|
| |||||||
| Media—2.4% | ||||||||
CBS Corp., Class B | 3,600 | 222,192 | ||||||
Charter Communications, Inc., Class A (a) | 500 | 89,510 | ||||||
Cinemark Holdings, Inc. | 700 | 28,371 | ||||||
Interpublic Group of Cos., Inc. | 2,400 | 49,008 | ||||||
Live Nation Entertainment, Inc. (a) | 900 | 25,740 | ||||||
Morningstar, Inc. | 300 | 23,190 | ||||||
Omnicom Group, Inc. | 2,100 | 156,513 | ||||||
Viacom, Inc., Class B | 2,400 | 160,512 | ||||||
Walt Disney Co. | 2,750 | 303,518 | ||||||
|
| |||||||
| 1,058,554 | ||||||||
|
| |||||||
| Metals & Mining—0.2% | ||||||||
Allegheny Technologies, Inc. | 600 | 19,500 | ||||||
Newmont Mining Corp. | 2,100 | 57,204 | ||||||
|
| |||||||
| 76,704 | ||||||||
|
| |||||||
| Multi-line Retail—1.7% | ||||||||
Big Lots, Inc. | 800 | 35,120 | ||||||
Burlington Stores, Inc. (a) | 700 | 36,939 | ||||||
Dillard’s, Inc., Class A | 500 | 58,005 | ||||||
Dollar Tree, Inc. (a) | 1,400 | 104,986 | ||||||
Kohl’s Corp. | 1,900 | 124,431 | ||||||
Macy’s, Inc. | 2,100 | 140,595 | ||||||
Target Corp. | 3,000 | 237,960 | ||||||
|
| |||||||
| 738,036 | ||||||||
|
| |||||||
| Multi-Utilities—0.1% | ||||||||
Vectren Corp. | 500 | 21,285 | ||||||
|
| |||||||
| Oil, Gas & Consumable Fuels—2.3% | ||||||||
Energen Corp. | 900 | 62,280 | ||||||
Exxon Mobil Corp. | 6,670 | 568,284 | ||||||
Murphy Oil Corp. | 1,100 | 47,806 | ||||||
Occidental Petroleum Corp. | 3,200 | 250,208 | ||||||
QEP Resources, Inc. | 3,900 | 73,437 | ||||||
|
| |||||||
| 1,002,015 | ||||||||
|
| |||||||
| Paper & Forest Products—0.5% | ||||||||
Domtar Corp. | 500 | 21,610 | ||||||
International Paper Co. | 3,300 | 171,039 | ||||||
KapStone Paper and Packaging Corp. | 800 | 21,560 | ||||||
|
| |||||||
| 214,209 | ||||||||
|
| |||||||
| Personal Products—0.4% | ||||||||
Coty, Inc., Class A (a) | 1,100 | 27,423 | ||||||
Estee Lauder Cos., Inc., Class A | 1,300 | 113,659 | ||||||
Revlon, Inc., Class A (a) | 500 | 18,455 | ||||||
|
| |||||||
| 159,537 | ||||||||
|
| |||||||
| Pharmaceuticals—3.4% | ||||||||
AbbVie, Inc. | 7,300 | 486,107 | ||||||
Johnson & Johnson | 6,128 | 613,658 | ||||||
Merck & Co., Inc. | 7,000 | 426,230 | ||||||
|
| |||||||
| 1,525,995 | ||||||||
|
| |||||||
| Professional Services—1.0% | ||||||||
CEB, Inc. | 200 | 16,918 | ||||||
Dun & Bradstreet Corp. | 500 | 63,965 | ||||||
Equifax, Inc. | 1,100 | 110,363 | ||||||
Robert Half International, Inc. | 800 | 45,096 | ||||||
Towers Watson & Co., Class A | 400 | 55,180 | ||||||
TriNet Group, Inc. (a) | 500 | 14,965 | ||||||
Verisk Analytics, Inc., Class A (a) | 1,900 | 137,902 | ||||||
|
| |||||||
| 444,389 | ||||||||
|
| |||||||
| See accompanying Notes to Financial Statements | | May 31, 2015 | | Semiannual Report | 121 |
Table of Contents
Schedule of Investments
May 31, 2015 (Unaudited)
| Shares | Value | |||||||
| Real Estate Management & Development—0.2% | ||||||||
CBRE Group, Inc. Class A (a) | 1,800 | $ | 68,832 | |||||
|
| |||||||
| Road & Rail—0.2% | ||||||||
AMERCO | 100 | 32,900 | ||||||
JB Hunt Transport Services, Inc. | 700 | 58,814 | ||||||
|
| |||||||
| 91,714 | ||||||||
|
| |||||||
| Semiconductors & Semiconductor Equipment—4.1% | ||||||||
Analog Devices, Inc. | 1,400 | 95,144 | ||||||
Avago Technologies Ltd. | 1,500 | 222,105 | ||||||
Broadcom Corp., Class A | 2,400 | 136,440 | ||||||
Fairchild Semiconductor International, Inc. (a) | 900 | 17,928 | ||||||
Integrated Device Technology, Inc. (a) | 700 | 16,559 | ||||||
Intel Corp. | 19,600 | 675,416 | ||||||
Linear Technology Corp. | 3,700 | 177,045 | ||||||
NVIDIA Corp. | 4,900 | 108,437 | ||||||
ON Semiconductor Corp. (a) | 2,600 | 34,476 | ||||||
Rambus, Inc. (a) | 1,300 | 19,877 | ||||||
Silicon Laboratories, Inc. (a) | 300 | 16,632 | ||||||
Skyworks Solutions, Inc. | 1,800 | 196,848 | ||||||
Tessera Technologies, Inc. | 700 | 26,985 | ||||||
Xilinx, Inc. | 1,700 | 80,614 | ||||||
|
| |||||||
| 1,824,506 | ||||||||
|
| |||||||
| Software—4.2% | ||||||||
Activision Blizzard, Inc. | 3,000 | 75,780 | ||||||
ANSYS, Inc. (a) | 600 | 53,400 | ||||||
Aspen Technology, Inc. (a) | 1,000 | 42,800 | ||||||
Autodesk, Inc. (a) | 1,300 | 70,395 | ||||||
Blackbaud, Inc. | 300 | 15,378 | ||||||
CommVault Systems, Inc. (a) | 500 | 22,215 | ||||||
Electronic Arts, Inc. (a) | 5,500 | 345,152 | ||||||
FactSet Research Systems, Inc. | 200 | 33,034 | ||||||
Fair Isaac Corp. | 200 | 17,544 | ||||||
Guidewire Software, Inc. (a) | 300 | 14,535 | ||||||
Intuit, Inc. | 4,000 | 416,600 | ||||||
Manhattan Associates, Inc. (a) | 1,100 | 60,335 | ||||||
NetSuite, Inc. (a) | 300 | 28,026 | ||||||
Pegasystems, Inc. | 500 | 10,930 | ||||||
Proofpoint, Inc. (a) | 400 | 23,652 | ||||||
Qlik Technologies, Inc. (a) | 1,300 | 47,021 | ||||||
Qualys, Inc. (a) | 700 | 28,504 | ||||||
Red Hat, Inc. (a) | 1,500 | 115,905 | ||||||
Salesforce.com, Inc. (a) | 2,700 | 196,425 | ||||||
Synopsys, Inc. (a) | 700 | 34,923 | ||||||
Take-Two Interactive Software, Inc. (a) | 800 | 21,896 | ||||||
Tyler Technologies, Inc. (a) | 400 | 48,592 | ||||||
VMware, Inc., Class A (a) | 1,600 | 139,712 | ||||||
|
| |||||||
| 1,862,754 | ||||||||
|
| |||||||
| Specialty Retail—7.2% | ||||||||
American Eagle Outfitters, Inc. | 2,400 | 39,288 | ||||||
Ascena Retail Group, Inc. (a) | 1,200 | 17,736 | ||||||
Bed Bath & Beyond, Inc. (a) | 1,200 | 85,584 | ||||||
Best Buy Co., Inc. | 3,500 | 121,450 | ||||||
Dick’s Sporting Goods, Inc. | 1,100 | 59,092 | ||||||
Foot Locker, Inc. | 1,800 | 113,760 | ||||||
Gap, Inc. | 4,900 | 187,817 | ||||||
Home Depot, Inc. | 5,600 | 623,952 | ||||||
L Brands, Inc. | 2,300 | 198,996 | ||||||
Lowe’s Cos., Inc. | 7,400 | 517,852 | ||||||
Michaels Cos., Inc. (a) | 2,500 | 68,400 | ||||||
Murphy USA, Inc. (a) | 500 | 29,115 | ||||||
O’Reilly Automotive, Inc. (a) | 1,050 | 230,506 | ||||||
Ross Stores, Inc. | 2,200 | 212,674 | ||||||
Sally Beauty Holdings, Inc. (a) | 700 | 21,847 | ||||||
Select Comfort Corp. (a) | 600 | 18,690 | ||||||
| Shares | Value | |||||||
Staples, Inc. | 4,800 | $ | 79,032 | |||||
TJX Cos., Inc. | 4,600 | 296,148 | ||||||
Tractor Supply Co. | 800 | 69,712 | ||||||
Ulta Salon Cosmetics & Fragrance, Inc. (a) | 700 | 106,834 | ||||||
Urban Outfitters, Inc. (a) | 1,500 | 51,570 | ||||||
Williams-Sonoma, Inc. | 400 | 31,444 | ||||||
|
| |||||||
| 3,181,499 | ||||||||
|
| |||||||
| Technology Hardware, Storage & Peripherals—2.0% | ||||||||
EMC Corp. | 10,500 | 276,570 | ||||||
Hewlett-Packard Co. | 12,900 | 430,860 | ||||||
Lexmark International, Inc., Class A | 400 | 18,392 | ||||||
Seagate Technology PLC | 2,500 | 139,100 | ||||||
|
| |||||||
| 864,922 | ||||||||
|
| |||||||
| Textiles, Apparel & Luxury Goods—0.9% | ||||||||
Carter’s, Inc. | 400 | 41,288 | ||||||
NIKE, Inc., Class B | 2,700 | 274,509 | ||||||
Skechers U.S.A., Inc., Class A (a) | 400 | 42,348 | ||||||
Steven Madden Ltd. (a) | 400 | 15,112 | ||||||
Wolverine World Wide, Inc. | 500 | 14,690 | ||||||
|
| |||||||
| 387,947 | ||||||||
|
| |||||||
| Tobacco—3.3% | ||||||||
Altria Group, Inc. | 12,100 | 619,520 | ||||||
Philip Morris International, Inc. | 10,370 | 861,436 | ||||||
|
| |||||||
| 1,480,956 | ||||||||
|
| |||||||
| Trading Companies & Distributors—0.3% | ||||||||
HD Supply Holdings, Inc. (a) | 1,200 | 38,940 | ||||||
WW Grainger, Inc. | 400 | 96,132 | ||||||
|
| |||||||
| 135,072 | ||||||||
|
| |||||||
| Total Common Stock (cost—$39,803,078) | 43,969,575 | |||||||
|
| |||||||
| Principal Amount (000s) | ||||||||
| Repurchase Agreements—0.6% | ||||||||
State Street Bank and Trust Co., dated 5/29/15, 0.00%, due 6/1/15, proceeds $280,000; collateralized by U.S. Treasury Notes, 2.125%, due 9/30/21, valued at $286,300 including accrued interest |
| |||||||
(cost—$280,000) | $280 | 280,000 | ||||||
|
| |||||||
| Total Investments (cost—$40,083,078)—99.9% | 44,249,575 | |||||||
|
| |||||||
| Other assets less liabilities—0.1% | 65,957 | |||||||
|
| |||||||
| Net Assets—100.0% | $44,315,532 | |||||||
|
| |||||||
Notes to Schedule of Investments:
(a) Non-income producing.
Glossary:
REIT—Real Estate Investment Trust
AllianzGI Best Styles Emerging Markets Equity Fund
| Shares | Value | |||||||
| Common Stock—87.0% | ||||||||
| Argentina—0.2% | ||||||||
Banco Macro S.A. ADR | 157 | $7,774 | ||||||
BBVA Banco Frances S.A. ADR | 305 | 4,932 | ||||||
|
| |||||||
| 12,706 | ||||||||
|
| |||||||
| Brazil—3.6% | ||||||||
Banco do Brasil S.A. | 3,300 | 23,552 | ||||||
BRF S.A. | 1,400 | 28,318 | ||||||
Cia Paranaense de Energia, Class P ADR | 395 | 4,065 | ||||||
JBS S.A. | 13,100 | 64,137 | ||||||
Kroton Educacional S.A. | 1,500 | 5,381 | ||||||
Marfrig Global Foods S.A. (f) | 4,600 | 5,876 | ||||||
MRV Engenharia e Participacoes S.A. | 7,600 | 18,128 | ||||||
Multiplus S.A. | 700 | 8,361 | ||||||
Porto Seguro S.A. | 1,200 | 13,637 | ||||||
Sul America S.A. UNIT | 4,500 | 18,543 | ||||||
Transmissora Alianca de Energia Eletrica S.A. UNIT | 700 | 4,523 | ||||||
Vale S.A. ADR | 3,024 | 15,997 | ||||||
|
| |||||||
| 210,518 | ||||||||
|
| |||||||
| Chile—1.0% | ||||||||
Banco Santander Chile ADR | 2,714 | 57,998 | ||||||
|
| |||||||
| China—23.1% | ||||||||
Agricultural Bank of China Ltd., Class H | 65,000 | 35,198 | ||||||
ANTA Sports Products Ltd. | 7,000 | 16,214 | ||||||
Bank of China Ltd., Class H | 83,000 | 54,877 | ||||||
Bank of Communications Co., Ltd., Class H | 32,000 | 30,376 | ||||||
Beijing Capital International Airport Co., Ltd., Class H | 8,000 | 9,666 | ||||||
BYD Electronic International Co., Ltd. | 4,500 | 7,332 | ||||||
China Citic Bank Corp., Ltd., Class H (f) | 34,000 | 28,664 | ||||||
China Communications Construction Co., Ltd., Class H | 1,000 | 1,714 | ||||||
China Construction Bank Corp., Class H | 138,000 | 137,425 | ||||||
China Everbright Bank Co., Ltd., Class H | 92,000 | 57,867 | ||||||
China Galaxy Securities Co., Ltd., Class H | 8,000 | 13,550 | ||||||
China Merchants Bank Co., Ltd., Class H | 2,000 | 6,044 | ||||||
China Minsheng Banking Corp., Ltd., Class H | 20,000 | 27,448 | ||||||
China Mobile Ltd. | 5,000 | 65,982 | ||||||
China National Building Material Co., Ltd., Class H | 12,000 | 12,757 | ||||||
China Oilfield Services Ltd., Class H | 9,000 | 16,590 | ||||||
China Petroleum & Chemical Corp., Class H | 72,000 | 63,166 | ||||||
China Railway Group Ltd., Class H | 18,000 | 23,189 | ||||||
China South City Holdings Ltd. | 18,000 | 6,874 | ||||||
China Southern Airlines Co., Ltd., Class H | 58,000 | 57,377 | ||||||
China Telecom Corp., Ltd., Class H | 52,000 | 35,225 | ||||||
Chongqing Rural Commercial Bank Co., Ltd., Class H | 40,000 | 32,463 | ||||||
Fosun International Ltd. | 13,500 | 34,485 | ||||||
Fuguiniao Co., Ltd., Class H | 2,800 | 5,738 | ||||||
Global Brands Group Holding Ltd. (f) | 56,000 | 12,483 | ||||||
Hengan International Group Co., Ltd. | 1,000 | 11,470 | ||||||
| 122 | Semiannual Report | | May 31, 2015 | | See accompanying Notes to Financial Statements |
Table of Contents
Schedule of Investments
May 31, 2015 (Unaudited)
| Shares | Value | |||||||
Huadian Power International Corp., Ltd., Class H | 10,000 | $ | 11,546 | |||||
Huaneng Power International, Inc., Class H | 18,000 | 23,930 | ||||||
Industrial & Commercial Bank of China Ltd., Class H | 172,000 | 148,944 | ||||||
KWG Property Holding Ltd. | 4,000 | 3,796 | ||||||
PetroChina Co., Ltd., Class H | 18,000 | 21,212 | ||||||
Ping An Insurance Group Co. of China Ltd., Class H | 5,000 | 73,264 | ||||||
Shenzhen Expressway Co., Ltd., Class H | 40,000 | 35,167 | ||||||
Sichuan Expressway Co., Ltd., Class H | 20,000 | 10,283 | ||||||
Sino-Ocean Land Holdings Ltd. | 9,000 | 6,471 | ||||||
Tencent Holdings Ltd. | 5,200 | 103,970 | ||||||
Wasion Group Holdings Ltd. | 12,000 | 18,661 | ||||||
Xinjiang Goldwind Science & Technology Co., Ltd., Class H | 8,400 | 20,498 | ||||||
Zhejiang Expressway Co., Ltd., Class H | 38,000 | 58,876 | ||||||
Zhuzhou CSR Times Electric Co., Ltd., Class H | 1,500 | 12,248 | ||||||
|
| |||||||
| 1,353,040 | ||||||||
|
| |||||||
| Colombia—0.3% | ||||||||
Corp. Financiera Colombiana S.A. | 1,242 | 17,921 | ||||||
|
| |||||||
| Hong Kong—3.6% | ||||||||
Brilliance China Automotive Holdings Ltd. | 8,000 | 12,474 | ||||||
Cathay Pacific Airways Ltd. | 2,000 | 5,118 | ||||||
Cheung Kong Holdings Ltd. (d) | 1,000 | 6,075 | ||||||
China Metal Resources Utilization Ltd. (a) | 16,000 | 3,570 | ||||||
China Power International Development Ltd. | 29,000 | 20,491 | ||||||
China Travel International Investment Hong Kong Ltd. | 68,000 | 33,055 | ||||||
CK Hutchison Holdings Ltd. | 1,000 | 15,541 | ||||||
Dah Sing Banking Group Ltd. | 3,200 | 7,571 | ||||||
Hutchison Whampoa Ltd. (d) | 2,000 | 29,663 | ||||||
Ju Teng International Holdings Ltd. (e) | 20,000 | 12,330 | ||||||
Link REIT | 3,000 | 17,448 | ||||||
Nexteer Automotive Group Ltd. | 11,000 | 12,800 | ||||||
PCCW Ltd. | 19,000 | 11,868 | ||||||
TCL Communication Technology Holdings Ltd. | 3,000 | 3,201 | ||||||
Truly International Holdings Ltd. | 42,000 | 21,125 | ||||||
|
| |||||||
| 212,330 | ||||||||
|
| |||||||
| India—1.4% | ||||||||
Axis Bank Ltd. GDR | 718 | 33,064 | ||||||
Reliance Industries Ltd. GDR (a) | 590 | 16,402 | ||||||
Tata Motors Ltd. ADR | 256 | 9,805 | ||||||
Vedanta Ltd. ADR | 1,404 | 17,494 | ||||||
Wipro Ltd. ADR | 672 | 8,111 | ||||||
|
| |||||||
| 84,876 | ||||||||
|
| |||||||
| Indonesia—2.9% | ||||||||
Bank Mandiri Persero Tbk PT | 33,600 | 27,363 | ||||||
Bank Negara Indonesia Persero Tbk PT | 134,100 | 69,550 | ||||||
Bank Rakyat Indonesia Persero Tbk PT | 31,400 | 27,922 | ||||||
Telekomunikasi Indonesia Persero Tbk PT | 195,300 | 42,055 | ||||||
|
| |||||||
| 166,890 | ||||||||
|
| |||||||
| Israel—0.1% | ||||||||
Mizrahi Tefahot Bank Ltd. (f) | 279 | 3,174 | ||||||
|
| |||||||
| Korea (Republic of)—13.9% | ||||||||
Asiana Airlines, Inc. (f) | 417 | 2,606 | ||||||
| Shares | Value | |||||||
Daesang Holdings Co., Ltd. | 117 | $ | 2,862 | |||||
Dongbu Insurance Co., Ltd. | 378 | 17,475 | ||||||
Dongwon F&B Co., Ltd. | 25 | 7,518 | ||||||
Eo Technics Co., Ltd. | 164 | 16,207 | ||||||
Halla Holdings Corp. | 553 | 34,032 | ||||||
Hanil Cement Co., Ltd. | 230 | 29,948 | ||||||
Hansae Co., Ltd. | 288 | 9,506 | ||||||
Hanssem Co., Ltd. | 61 | 12,350 | ||||||
Hyundai Marine & Fire Insurance Co., Ltd. | 151 | 3,784 | ||||||
Hyundai Mobis Co., Ltd. | 50 | 10,070 | ||||||
Hyundai Motor Co. | 139 | 19,754 | ||||||
JB Financial Group Co., Ltd. | 690 | 4,355 | ||||||
Kia Motors Corp. | 627 | 26,908 | ||||||
KISWIRE Ltd. | 106 | 5,734 | ||||||
Korea Electric Power Corp. | 1,612 | 66,968 | ||||||
LG Display Co., Ltd. | 2,252 | 59,363 | ||||||
Meritz Securities Co., Ltd. | 7,362 | 42,864 | ||||||
POSCO | 242 | 53,284 | ||||||
S-Oil Corp. | 134 | 7,948 | ||||||
Samsung Electronics Co., Ltd. | 119 | 139,989 | ||||||
Samsung Electronics Co., Ltd. GDR (f) | 131 | 77,552 | ||||||
Samyang Corp. | 30 | 3,567 | ||||||
SK Hynix, Inc. | 2,209 | 101,510 | ||||||
SK Networks Co., Ltd. | 2,969 | 22,064 | ||||||
SK Telecom Co., Ltd. ADR | 1,301 | 31,796 | ||||||
Ssangyong Cement Industrial Co., Ltd. (f) | 348 | 5,591 | ||||||
|
| |||||||
| 815,605 | ||||||||
|
| |||||||
| Malaysia—2.5% | ||||||||
Berjaya Auto Bhd. | 7,100 | 7,263 | ||||||
DiGi.Com Bhd. | 25,400 | 38,852 | ||||||
Hong Leong Financial Group Bhd. | 4,900 | 20,629 | ||||||
MISC Bhd. | 2,200 | 4,971 | ||||||
Sunway Bhd. | 6,900 | 6,337 | ||||||
Sunway Construction Group Bhd. (b)(d)(f) | 690 | 207 | ||||||
Tenaga Nasional Bhd. | 18,100 | 65,901 | ||||||
|
| |||||||
| 144,160 | ||||||||
|
| |||||||
| Mexico—3.8% | ||||||||
America Movil S.A.B. de C.V., Ser. L | 10,900 | 11,453 | ||||||
Credito Real S.A.B. de C.V. SOFOM ER | 2,800 | 6,484 | ||||||
Gentera SAB De C.V. | 8,900 | 15,287 | ||||||
Gruma S.A.B. de C.V., Class B | 2,300 | 30,243 | ||||||
Grupo Aeroportuario del Centro Norte SAB De C.V. ADR | 271 | 10,184 | ||||||
Grupo Aeroportuario del Pacifico S.A.B. de C.V. ADR | 338 | 24,065 | ||||||
Grupo Aeroportuario del Pacifico S.A.B. de C.V., Class B | 3,000 | 21,370 | ||||||
Grupo Aeroportuario del Sureste S.A.B. de C.V. ADR | 26 | 3,745 | ||||||
Industrias Bachoco S.A.B. de C.V. ADR | 799 | 45,839 | ||||||
Vitro S.A.B. de C.V., Ser. A (f) | 20,200 | 53,127 | ||||||
|
| |||||||
| 221,797 | ||||||||
|
| |||||||
| Peru—0.2% | ||||||||
Credicorp Ltd. | 103 | 14,537 | ||||||
|
| |||||||
| Philippines—1.4% | ||||||||
BDO Unibank, Inc. | 6,850 | 16,571 | ||||||
DMCI Holdings, Inc. | 83,000 | 24,734 | ||||||
Universal Robina Corp. | 9,480 | 40,489 | ||||||
|
| |||||||
| 81,794 | ||||||||
|
| |||||||
| Poland—0.9% | ||||||||
Asseco Poland S.A. | 867 | 13,899 | ||||||
Energa S.A. | 5,624 | 34,429 | ||||||
Tauron Polska Energia S.A. | 4,946 | 6,287 | ||||||
|
| |||||||
| 54,615 | ||||||||
|
| |||||||
| Shares | Value | |||||||
| Russian Federation—2.4% | ||||||||
Gazprom OAO ADR | 4,061 | $ | 21,767 | |||||
Mobile Telesystems OJSC ADR | 4,210 | 44,036 | ||||||
Rosneft OAO GDR | 2,670 | 12,225 | ||||||
RusHydro JSC ADR | 2,725 | 3,052 | ||||||
Severstal PAO GDR | 2,649 | 32,000 | ||||||
Sistema JSFC GDR | 1,948 | 14,805 | ||||||
TMK OAO GDR | 901 | 3,762 | ||||||
United Co. RUSAL PLC (f) | 15,000 | 8,195 | ||||||
|
| |||||||
| 139,842 | ||||||||
|
| |||||||
| Singapore—2.3% | ||||||||
ComfortDelGro Corp., Ltd. | 2,700 | 6,124 | ||||||
DBS Group Holdings Ltd. | 3,600 | 54,124 | ||||||
Fortune REIT | 14,000 | 14,125 | ||||||
Mapletree Commercial Trust REIT | 5,500 | 6,344 | ||||||
Religare Health Trust UNIT | 4,800 | 3,771 | ||||||
SMRT Corp. Ltd. | 7,000 | 8,302 | ||||||
Wing Tai Holdings Ltd. | 11,300 | 16,342 | ||||||
Yangzijiang Shipbuilding Holdings Ltd. | 24,900 | 26,667 | ||||||
|
| |||||||
| 135,799 | ||||||||
|
| |||||||
| South Africa—8.8% | ||||||||
Aeci Ltd. | 1,218 | 12,188 | ||||||
AVI Ltd. | 3,701 | 24,655 | ||||||
FirstRand Ltd. | 3,668 | 15,717 | ||||||
Gold Fields Ltd. | 5,555 | 19,126 | ||||||
Investec Ltd. | 6,145 | 55,640 | ||||||
JSE Ltd. | 654 | 7,135 | ||||||
Liberty Holdings Ltd. | 3,934 | 50,834 | ||||||
Mondi Ltd. | 2,794 | 63,295 | ||||||
MTN Group Ltd. | 335 | 5,935 | ||||||
Naspers Ltd., Class N | 376 | 55,178 | ||||||
Net 1 UEPS Technologies, Inc. (f) | 374 | 5,423 | ||||||
Pick n Pay Holdings Ltd. | 1,386 | 2,967 | ||||||
Sanlam Ltd. | 6,976 | 39,280 | ||||||
Sappi Ltd. (f) | 3,767 | 14,960 | ||||||
Sasol Ltd. | 1,051 | 37,175 | ||||||
Sibanye Gold Ltd. ADR | 572 | 4,061 | ||||||
Steinhoff International Holdings Ltd. | 7,764 | 48,114 | ||||||
Telkom S.A. SOC Ltd. (f) | 9,278 | 53,006 | ||||||
|
| |||||||
| 514,689 | ||||||||
|
| |||||||
| Taiwan—9.5% | ||||||||
Advanced Semiconductor Engineering, Inc. | 12,000 | 17,113 | ||||||
Advanced Semiconductor Engineering, Inc. ADR | 4,643 | 32,779 | ||||||
Asian Pay Television Trust UNIT | 7,900 | 5,391 | ||||||
AU Optronics Corp. ADR | 5,147 | 27,845 | ||||||
Chailease Holding Co., Ltd. | 2,000 | 5,048 | ||||||
China Development Financial Holding Corp. | 24,000 | 9,583 | ||||||
Coretronic Corp. | 14,000 | 17,992 | ||||||
Fubon Financial Holding Co., Ltd. | 33,000 | 67,675 | ||||||
Hon Hai Precision Industry Co., Ltd. | 22,000 | 70,908 | ||||||
Innolux Corp. | 89,000 | 54,769 | ||||||
Micro-Star International Co., Ltd. | 15,000 | 17,017 | ||||||
Silicon Motion Technology Corp. ADR | 1,108 | 39,290 | ||||||
Siliconware Precision Industries Co., Ltd. ADR | 3,448 | 28,170 | ||||||
Taishin Financial Holding Co., Ltd. | 21,000 | 9,085 | ||||||
Taiwan Semiconductor Manufacturing Co., Ltd. | 23,000 | 109,412 | ||||||
United Microelectronics Corp. | 86,000 | 38,883 | ||||||
United Microelectronics Corp. ADR | 1,307 | 2,941 | ||||||
|
| |||||||
| 553,901 | ||||||||
|
| |||||||
| Thailand—1.2% | ||||||||
Airports of Thailand PCL (d) | 1,200 | 10,602 | ||||||
Kasikornbank PCL | 1,600 | 9,252 | ||||||
| See accompanying Notes to Financial Statements | | May 31, 2015 | | Semiannual Report | 123 |
Table of Contents
Schedule of Investments
May 31, 2015 (Unaudited)
| Shares | Value | |||||||
PTT Exploration & Production PCL (d) | 7,400 | $ | 23,744 | |||||
PTT Global Chemical PCL (d) | 12,800 | 24,898 | ||||||
|
| |||||||
| 68,496 | ||||||||
|
| |||||||
| Turkey—2.8% | ||||||||
Cimsa Cimento Sanayi VE Ticaret AS | 649 | 3,873 | ||||||
Eregli Demir ve Celik Fabrikalari TAS | 27,501 | 44,183 | ||||||
Kardemir Karabuk Demir Celik Sanayi ve Ticaret AS, Class D (f) | 61,742 | 37,542 | ||||||
TAV Havalimanlari Holding AS | 2,148 | 17,836 | ||||||
Turkiye Is Bankasi | 10,535 | 22,371 | ||||||
Turkiye Vakiflar Bankasi Tao | 21,161 | 36,512 | ||||||
|
| |||||||
| 162,317 | ||||||||
|
| |||||||
| United Arab Emirates—0.2% | ||||||||
Dragon Oil PLC | 1,004 | 10,453 | ||||||
|
| |||||||
| United States—0.9% | ||||||||
Popular, Inc. (f) | 1,361 | 44,219 | ||||||
Triple-S Management Corp., Class B (f) | 352 | 8,448 | ||||||
|
| |||||||
| 52,667 | ||||||||
|
| |||||||
| Total Common Stock (cost—$4,932,781) | 5,090,125 | |||||||
|
| |||||||
| Preferred Stock—5.1% | ||||||||
| Brazil—3.9% | ||||||||
Banco Bradesco S.A. | 4,520 | 40,018 | ||||||
Banco do Estado do Rio Grande do Sul S.A., Class B | 3,100 | 9,710 | ||||||
Braskem S.A., Class A | 3,500 | 14,247 | ||||||
Cia Energetica de Minas Gerais | 600 | 2,670 | ||||||
Cia Energetica de Sao Paulo, Class B | 2,400 | 14,906 | ||||||
Itau Unibanco Holding S.A. | 6,900 | 74,342 | ||||||
Itausa - Investimentos Itau S.A. | 6,710 | 18,574 | ||||||
Petroleo Brasileiro S.A. (f) | 13,200 | 51,080 | ||||||
|
| |||||||
| 225,547 | ||||||||
|
| |||||||
| Colombia—0.6% | ||||||||
Banco Davivienda S.A. | 3,482 | 34,559 | ||||||
|
| |||||||
| Korea (Republic of)—0.6% | ||||||||
Samsung Electronics Co., Ltd. | 37 | 35,916 | ||||||
|
| |||||||
| Total Preferred Stock (cost—$364,387) | 296,022 | |||||||
|
| |||||||
| Principal Amount (000s) | ||||||||
| Repurchase Agreements—4.8% | ||||||||
State Street Bank and Trust Co., dated 5/29/15, 0.00%, due 6/1/15, proceeds $283,000; collateralized by U.S. Treasury Notes, 2.125%, due 9/30/21, valued at $291,413 including accrued interest |
| |||||||
(cost—$283,000) | $283 | 283,000 | ||||||
|
| |||||||
| Total Investments (cost—$5,580,168) (c)—96.9% | 5,669,147 | |||||||
|
| |||||||
| Other assets less liabilities—3.1% | 181,060 | |||||||
|
| |||||||
| Net Assets—100.0% | $5,850,207 | |||||||
|
| |||||||
Notes to Schedule of Investments:
(a) 144A—Exempt from registration under Rule 144A of the Securities Act of 1933. These securities may be resold in transactions exempt from registration, typically only to qualified institutional buyers. Unless otherwise indicated, these securities are not considered to be illiquid.
(b) When-issued or delayed-delivery. To be settled/delivered after May 31, 2015.
(c) Securities with an aggregate value of $3,836,721, representing 65.6% of net assets, were valued utilizing modeling tools provided by a third-party vendor. See Note 1(a) and Note 1(b) in the Notes to Financial Statements.
(d) Fair-Valued—Securities with an aggregate value of $95,189, representing 1.6% of net assets. See Note 1(a) and Note 1(b) in the Notes to Financial Statements.
(e) Affiliated security.
(f) Non-income producing.
Glossary:
ADR—American Depositary Receipt
GDR—Global Depositary Receipt
REIT—Real Estate Investment Trust
UNIT—More than one class of securities traded together.
The industry classification of portfolio holdings and other assets less liabilities shown as a percentage of net assets were as follows:
Banks | 21.1% | |||
Semiconductors & Semiconductor Equipment | 6.7% | |||
Electronic Equipment, Instruments & Components | 4.7% | |||
Metals & Mining | 4.7% | |||
Technology Hardware, Storage & Peripherals | 4.7% | |||
Oil, Gas & Consumable Fuels | 4.6% | |||
Food Products | 4.3% | |||
Insurance | 3.8% | |||
Wireless Telecommunication Services | 3.6% | |||
Transportation Infrastructure | 3.6% | |||
Electric Utilities | 3.2% | |||
Diversified Telecommunication Services | 2.4% | |||
Diversified Financial Services | 1.9% | |||
Capital Markets | 1.8% | |||
Internet Software & Services | 1.8% | |||
Paper & Forest Products | 1.4% | |||
Household Durables | 1.3% | |||
Industrial Conglomerates | 1.3% | |||
Independent Power and Renewable Electricity Producers | 1.2% | |||
Automobiles | 1.2% | |||
Media | 1.1% | |||
Airlines | 1.1% | |||
Auto Components | 1.0% | |||
Containers & Packaging | 0.9% | |||
Construction Materials | 0.9% | |||
Chemicals | 0.8% | |||
Real Estate Management & Development | 0.8% | |||
Textiles, Apparel & Luxury Goods | 0.8% | |||
Real Estate Investment Trust | 0.6% | |||
Hotels, Restaurants & Leisure | 0.6% | |||
Electrical Equipment | 0.5% | |||
Machinery | 0.5% | |||
Construction & Engineering | 0.4% | |||
Trading Companies & Distributors | 0.4% | |||
Energy Equipment & Services | 0.4% | |||
Consumer Finance | 0.3% | |||
Road & Rail | 0.2% | |||
Software | 0.2% | |||
IT Services | 0.2% | |||
Health Care Providers & Services | 0.2% | |||
Personal Products | 0.2% | |||
Banking | 0.2% | |||
Communications Equipment | 0.1% | |||
Specialty Retail | 0.1% | |||
Diversified Consumer Services | 0.1% | |||
Marine | 0.1% | |||
Food & Staples Retailing | 0.1% | |||
Industrials | 0.0% | |||
Repurchase Agreements | 4.8% | |||
Other assets less liabilities | 3.1% | |||
|
| |||
| 100.0% | ||||
|
|
| 124 | Semiannual Report | | May 31, 2015 | | See accompanying Notes to Financial Statements |
Table of Contents
Schedule of Investments
May 31, 2015 (Unaudited)
AllianzGI Best Styles Global Equity Fund
| Shares | Value | |||||||
| Common Stock—94.2% | ||||||||
| Australia—0.9% | ||||||||
Australia & New Zealand Banking Group Ltd. | 10,714 | $270,804 | ||||||
Bank of Queensland Ltd. | 10,235 | 103,355 | ||||||
Bendigo and Adelaide Bank Ltd. | 12,704 | 118,988 | ||||||
Dexus Property Group REIT | 5,360 | 32,705 | ||||||
Downer EDI Ltd. | 15,587 | 61,002 | ||||||
Echo Entertainment Group Ltd. | 17,683 | 62,953 | ||||||
Federation Centres REIT | 13,342 | 30,881 | ||||||
Macquarie Group Ltd. | 1,862 | 115,708 | ||||||
Tassal Group Ltd. | 21,196 | 53,281 | ||||||
Westpac Banking Corp. | 5,718 | 146,495 | ||||||
|
| |||||||
| 996,172 | ||||||||
|
| |||||||
| Austria—0.3% | ||||||||
OMV AG | 2,630 | 74,621 | ||||||
UNIQA Insurance Group AG | 15,611 | 152,901 | ||||||
Voestalpine AG | 3,990 | 165,892 | ||||||
|
| |||||||
| 393,414 | ||||||||
|
| |||||||
| Belgium—0.2% | ||||||||
Befimmo S.A. REIT | 720 | 47,299 | ||||||
Delhaize Group S.A. | 1,671 | 149,157 | ||||||
KBC Groep NV | 1,441 | 96,581 | ||||||
|
| |||||||
| 293,037 | ||||||||
|
| |||||||
| Bermuda—0.7% | ||||||||
Aspen Insurance Holdings Ltd. | 8,187 | 379,549 | ||||||
Endurance Specialty Holdings Ltd. | 2,162 | 131,406 | ||||||
Everest Re Group Ltd. | 923 | 167,534 | ||||||
Maiden Holdings Ltd. | 7,729 | 108,052 | ||||||
|
| |||||||
| 786,541 | ||||||||
|
| |||||||
| Brazil—0.6% | ||||||||
Banco Bradesco S.A. | 9,600 | 78,938 | ||||||
Banco do Brasil S.A. | 14,100 | 100,629 | ||||||
Cia Brasileira de Distribuicao ADR | 2,090 | 56,033 | ||||||
Cielo S.A. | 7,920 | 99,425 | ||||||
Embraer S.A. | 3,000 | 22,465 | ||||||
Estacio Participacoes S.A. | 10,700 | 61,454 | ||||||
Itau Unibanco Holding S.A. | 3,900 | 39,731 | ||||||
JBS S.A. | 19,600 | 95,961 | ||||||
Petroleo Brasileiro S.A. ADR (e) | 10,908 | 91,082 | ||||||
Porto Seguro S.A. | 2,400 | 27,274 | ||||||
|
| |||||||
| 672,992 | ||||||||
|
| |||||||
| Canada—3.7% | ||||||||
Artis Real Estate Investment Trust REIT | 5,657 | 64,003 | ||||||
BCE, Inc. | 2,858 | 125,250 | ||||||
Canadian Imperial Bank of Commerce | 3,193 | 243,660 | ||||||
Canadian National Railway Co. | 6,163 | 365,587 | ||||||
Canadian Natural Resources Ltd. | 1,915 | 59,101 | ||||||
Canadian Tire Corp., Ltd., Class A | 1,194 | 123,807 | ||||||
Canfor Pulp Products, Inc. | 2,368 | 29,971 | ||||||
Celestica, Inc. (e) | 3,772 | 48,257 | ||||||
Cogeco Cable, Inc. | 1,984 | 105,039 | ||||||
Corus Entertainment, Inc., Class B | 3,873 | 54,937 | ||||||
Entertainment One Ltd. | 12,143 | 59,979 | ||||||
Genworth MI Canada, Inc. | 2,505 | 68,104 | ||||||
George Weston Ltd. | 1,283 | 104,272 | ||||||
Great-West Lifeco, Inc. | 4,002 | 115,947 | ||||||
Intact Financial Corp. | 1,166 | 83,625 | ||||||
Laurentian Bank of Canada | 3,641 | 139,919 | ||||||
Linamar Corp. | 3,366 | 229,308 | ||||||
Loblaw Cos., Ltd. | 4,222 | 214,733 | ||||||
Magna International, Inc. | 8,238 | 473,440 | ||||||
Metro, Inc. | 5,346 | 147,750 | ||||||
National Bank of Canada | 2,719 | 106,062 | ||||||
Raging River Exploration, Inc. (e) | 7,877 | 56,690 | ||||||
| Shares | Value | |||||||
Royal Bank of Canada | 7,597 | $ | 483,029 | |||||
Shaw Communications, Inc., Class B | 10,018 | 221,128 | ||||||
Stantec, Inc. | 1,664 | 46,029 | ||||||
Toronto-Dominion Bank | 10,033 | 436,866 | ||||||
Transcontinental, Inc., Class A | 7,806 | 114,680 | ||||||
|
| |||||||
| 4,321,173 | ||||||||
|
| |||||||
| Cayman Islands—0.0% | ||||||||
Home Loan Servicing Solutions Ltd. | 6,605 | 4,544 | ||||||
|
| |||||||
| China—3.2% | ||||||||
Agricultural Bank of China Ltd., Class H | 146,000 | 79,060 | ||||||
Bank of China Ltd., Class H | 241,000 | 159,342 | ||||||
China Citic Bank Corp., Ltd., Class H (e) | 402,000 | 338,904 | ||||||
China Construction Bank Corp., Class H | 119,000 | 118,504 | ||||||
China Lumena New Materials Corp. (c)(e) | 62,000 | 1,199 | ||||||
China Merchants Bank Co., Ltd., Class H | 48,500 | 146,560 | ||||||
China Minsheng Banking Corp., Ltd., Class H | 49,500 | 67,935 | ||||||
China Mobile Ltd. | 22,000 | 290,319 | ||||||
China Oilfield Services Ltd., Class H | 26,000 | 47,928 | ||||||
China Overseas Land & Investment Ltd. | 32,000 | 115,037 | ||||||
China Petroleum & Chemical Corp., Class H | 138,000 | 121,069 | ||||||
China Railway Construction Corp., Ltd., Class H | 34,000 | 62,567 | ||||||
China Resources Cement Holdings Ltd. | 46,000 | 28,202 | ||||||
China Southern Airlines Co., Ltd., Class H | 222,000 | 219,615 | ||||||
Chongqing Rural Commercial Bank Co., Ltd., Class H | 66,000 | 53,564 | ||||||
Dongfeng Motor Group Co., Ltd., Class H | 54,000 | 87,804 | ||||||
Huadian Power International Corp., Ltd., Class H | 228,000 | 263,255 | ||||||
Huaneng Power International, Inc., Class H | 192,000 | 255,248 | ||||||
Hydoo International Holding Ltd. | 442,000 | 86,021 | ||||||
Industrial & Commercial Bank of China Ltd., Class H | 462,000 | 400,070 | ||||||
KWG Property Holding Ltd. | 42,500 | 40,328 | ||||||
Lijun International Pharmaceutical Holding Co., Ltd. | 80,000 | 30,900 | ||||||
PetroChina Co., Ltd. ADR | 1,701 | 201,552 | ||||||
Shenzhen Expressway Co., Ltd., Class H | 60,000 | 52,751 | ||||||
Shimao Property Holdings Ltd. | 40,000 | 85,280 | ||||||
Sinopharm Group Co., Ltd., Class H | 22,000 | 104,603 | ||||||
Wasion Group Holdings Ltd. | 90,000 | 139,958 | ||||||
Yuexiu Transport Infrastructure Ltd. | 28,000 | 21,600 | ||||||
Zhejiang Expressway Co., Ltd., Class H | 34,000 | 52,678 | ||||||
|
| |||||||
| 3,671,853 | ||||||||
|
| |||||||
| Denmark—0.6% | ||||||||
AP Moeller - Maersk A/S, Class B | 69 | 132,997 | ||||||
Bakkafrost P/F | 6,736 | 178,377 | ||||||
Pandora A/S | 1,089 | 109,193 | ||||||
Royal Unibrew A/S | 5,135 | 183,114 | ||||||
TDC A/S | 16,313 | 121,826 | ||||||
|
| |||||||
| 725,507 | ||||||||
|
| |||||||
| Shares | Value | |||||||
| Finland—0.4% | ||||||||
Elisa Oyj | 4,496 | $ | 138,048 | |||||
Oriola-KD Oyj, Class B (e) | 7,824 | 35,501 | ||||||
Stora Enso Oyj, Class R | 12,978 | 136,014 | ||||||
UPM-Kymmene Oyj | 12,015 | 215,925 | ||||||
|
| |||||||
| 525,488 | ||||||||
|
| |||||||
| France—2.8% | ||||||||
Atos S.E. | 598 | 45,898 | ||||||
AXA S.A. | 7,643 | 192,040 | ||||||
Cap Gemini S.A. | 1,374 | 119,114 | ||||||
Cie Generale des Etablissements Michelin | 1,000 | 106,995 | ||||||
Ipsen S.A. | 896 | 47,775 | ||||||
Lagardere SCA | 3,728 | 112,781 | ||||||
Natixis S.A. | 6,802 | 50,960 | ||||||
Orange S.A. | 18,483 | 291,365 | ||||||
Plastic Omnium S.A. | 1,807 | 51,225 | ||||||
Sanofi | 9,091 | 895,285 | ||||||
Technicolor S.A. | 17,907 | 114,757 | ||||||
Teleperformance | 1,879 | 138,392 | ||||||
Total S.A. | 10,977 | 553,960 | ||||||
UBISOFT Entertainment (e) | 3,628 | 65,414 | ||||||
Valeo S.A. | 3,200 | 509,764 | ||||||
|
| |||||||
| 3,295,725 | ||||||||
|
| |||||||
| Germany—2.6% | ||||||||
Aareal Bank AG (d) | 4,092 | 162,680 | ||||||
Bayerische Motoren Werke AG | 3,262 | 361,395 | ||||||
Bechtle AG (d) | 568 | 41,774 | ||||||
Daimler AG | 5,305 | 497,582 | ||||||
Deutsche Lufthansa AG (e) | 19,852 | 279,835 | ||||||
Deutsche Post AG | 3,405 | 102,898 | ||||||
Freenet AG (d) | 4,404 | 145,058 | ||||||
Fresenius SE & Co. KGaA | 3,210 | 204,769 | ||||||
Hannover Rueck SE | 2,916 | 283,664 | ||||||
Indus Holding AG | 2,595 | 137,211 | ||||||
Merck KGaA | 2,782 | 298,090 | ||||||
Muenchener Rueckversicherungs-Gesellschaft AG in Muenchen | 979 | 180,904 | ||||||
Sixt SE | 1,118 | 48,485 | ||||||
Stada Arzneimittel AG | 1,172 | 40,734 | ||||||
Talanx AG | 3,509 | 105,476 | ||||||
TUI AG | 5,031 | 89,269 | ||||||
|
| |||||||
| 2,979,824 | ||||||||
|
| |||||||
| Hong Kong—0.5% | ||||||||
Brilliance China Automotive Holdings Ltd. | 20,000 | 31,185 | ||||||
Cheung Kong Holdings Ltd. (c) | 2,000 | 12,149 | ||||||
China Power International Development Ltd. | 230,000 | 162,517 | ||||||
CK Hutchison Holdings Ltd. | 2,000 | 31,081 | ||||||
Country Garden Holdings Co., Ltd. | 113,000 | 51,560 | ||||||
Orient Overseas International Ltd. | 13,500 | 74,534 | ||||||
PCCW Ltd. | 97,000 | 60,589 | ||||||
TCL Communication Technology Holdings Ltd. | 94,000 | 100,312 | ||||||
Truly International Holdings Ltd. | 92,000 | 46,275 | ||||||
|
| |||||||
| 570,202 | ||||||||
|
| |||||||
| India—0.2% | ||||||||
Tata Motors Ltd. ADR | 5,978 | 228,957 | ||||||
|
| |||||||
| Indonesia—0.4% | ||||||||
Adaro Energy Tbk PT | 546,600 | 35,465 | ||||||
Bank Negara Indonesia Persero Tbk PT | 629,200 | 326,332 | ||||||
Bank Rakyat Indonesia Persero Tbk PT | 117,200 | 104,217 | ||||||
| See accompanying Notes to Financial Statements | | May 31, 2015 | | Semiannual Report | 125 |
Table of Contents
Schedule of Investments
May 31, 2015 (Unaudited)
| Shares | Value | |||||||
Indofood Sukses Makmur Tbk PT | 51,900 | $ | 28,621 | |||||
|
| |||||||
| 494,635 | ||||||||
|
| |||||||
| Ireland—1.0% | ||||||||
Medtronic PLC | 7,926 | 604,912 | ||||||
Smurfit Kappa Group PLC | 17,367 | 511,392 | ||||||
|
| |||||||
| 1,116,304 | ||||||||
|
| |||||||
| Israel—0.2% | ||||||||
Teva Pharmaceutical Industries Ltd. | 2,988 | 180,591 | ||||||
|
| |||||||
| Italy—1.0% | ||||||||
Brembo SpA | 1,336 | 56,798 | ||||||
Enel SpA | 85,494 | 415,564 | ||||||
Iren SpA | 36,036 | 51,936 | ||||||
Recordati SpA | 7,666 | 161,280 | ||||||
Snam SpA | 54,692 | 270,890 | ||||||
Unipol Gruppo Finanziario SpA | 27,248 | 147,716 | ||||||
Vittoria Assicurazioni SpA | 5,774 | 61,640 | ||||||
|
| |||||||
| 1,165,824 | ||||||||
|
| |||||||
| Japan—9.8% | ||||||||
Aisin Seiki Co., Ltd. | 2,400 | 110,323 | ||||||
Alfresa Holdings Corp. | 5,500 | 84,004 | ||||||
Bank of Yokohama Ltd. | 16,000 | 99,090 | ||||||
Bridgestone Corp. | 7,000 | 290,534 | ||||||
Central Japan Railway Co. | 1,900 | 329,275 | ||||||
COMSYS Holdings Corp. | 8,800 | 127,278 | ||||||
Daihen Corp. | 5,000 | 25,744 | ||||||
Exedy Corp. | 2,000 | 51,976 | ||||||
Fuji Heavy Industries Ltd. | 18,000 | 675,718 | ||||||
FUJIFILM Holdings Corp. | 7,800 | 296,808 | ||||||
Haseko Corp. | 8,000 | 93,019 | ||||||
Hitachi Kokusai Electric, Inc. | 3,000 | 44,233 | ||||||
Idemitsu Kosan Co., Ltd. | 2,700 | 53,270 | ||||||
ITOCHU Corp. | 30,100 | 404,551 | ||||||
Japan Airlines Co., Ltd. | 3,600 | 123,341 | ||||||
Japan Aviation Electronics Industry Ltd. | 2,000 | 54,585 | ||||||
Japan Petroleum Exploration Co., Ltd. | 1,500 | 50,045 | ||||||
JFE Holdings, Inc. | 10,600 | 257,549 | ||||||
JTEKT Corp. | 8,300 | 151,225 | ||||||
Kaneka Corp. | 5,000 | 36,436 | ||||||
Kawasaki Kisen Kaisha Ltd. | 54,000 | 136,330 | ||||||
KDDI Corp. | 16,200 | 364,673 | ||||||
Kewpie Corp. | 1,100 | 24,271 | ||||||
Kinden Corp. | 5,000 | 68,137 | ||||||
Kose Corp. | 600 | 39,203 | ||||||
Kyowa Exeo Corp. | 6,000 | 70,402 | ||||||
Marubeni Corp. | 9,200 | 53,692 | ||||||
Mitsubishi Electric Corp. | 20,000 | 273,127 | ||||||
Mitsubishi Materials Corp. | 30,000 | 118,424 | ||||||
Mitsubishi UFJ Financial Group, Inc. | 129,500 | 954,907 | ||||||
Mizuho Financial Group, Inc. | 182,900 | 402,670 | ||||||
Nichirei Corp. | 22,000 | 122,712 | ||||||
Nippon Telegraph & Telephone Corp. | 4,200 | 290,470 | ||||||
Nippon Yusen KK | 33,000 | 99,331 | ||||||
Nissan Motor Co., Ltd. | 29,000 | 301,189 | ||||||
NOK Corp. | 1,400 | 46,079 | ||||||
NTN Corp. | 10,000 | 58,798 | ||||||
ORIX Corp. | 19,600 | 309,037 | ||||||
Osaka Gas Co., Ltd. | 44,000 | 175,757 | ||||||
Resona Holdings, Inc. | 51,000 | 290,820 | ||||||
Ricoh Co., Ltd. | 12,400 | 128,833 | ||||||
Sanwa Holdings Corp. | 19,300 | 167,422 | ||||||
Seiko Epson Corp. | 8,600 | 158,361 | ||||||
Seino Holdings Co., Ltd. | 5,000 | 61,437 | ||||||
Sekisui Chemical Co., Ltd. | 4,000 | 53,806 | ||||||
Sekisui House Ltd. | 14,900 | 247,992 | ||||||
Senko Co., Ltd. | 14,000 | 86,675 | ||||||
Seven & I Holdings Co., Ltd. | 3,300 | 136,282 | ||||||
| Shares | Value | |||||||
Sumitomo Mitsui Financial Group, Inc. | 3,000 | $ | 136,138 | |||||
Sumitomo Mitsui Trust Holdings, Inc. | 80,000 | 364,034 | ||||||
Sumitomo Osaka Cement Co., Ltd. | 14,000 | 50,073 | ||||||
Sumitomo Rubber Industries Ltd. | 23,100 | 406,160 | ||||||
Suzuki Motor Corp. | 4,400 | 152,736 | ||||||
Tokai Rika Co., Ltd. | 6,000 | 154,402 | ||||||
Tokyo Seimitsu Co., Ltd. | 1,400 | 32,381 | ||||||
Tosoh Corp. | 26,000 | 154,959 | ||||||
Toyota Motor Corp. | 11,500 | 793,276 | ||||||
Tsubakimoto Chain Co. | 10,000 | 89,154 | ||||||
West Japan Railway Co. | 2,300 | 136,398 | ||||||
Yamaha Motor Co., Ltd. | 4,500 | 112,103 | ||||||
Yokohama Rubber Co., Ltd. | 18,000 | 202,527 | ||||||
|
| |||||||
| 11,384,182 | ||||||||
|
| |||||||
| Korea (Republic of)—1.6% | ||||||||
Hyundai Hysco Co., Ltd. | 1,923 | 109,008 | ||||||
Korea Electric Power Corp. | 1,300 | 54,007 | ||||||
Korea Gas Corp. | 957 | 44,842 | ||||||
LG Display Co., Ltd. | 6,625 | 174,635 | ||||||
LG Electronics, Inc. | 1,621 | 80,763 | ||||||
Samsung Electronics Co., Ltd. GDR (e) | 1,355 | 802,160 | ||||||
SK Hynix, Inc. | 7,292 | 335,088 | ||||||
SK Telecom Co., Ltd. | 984 | 217,524 | ||||||
|
| |||||||
| 1,818,027 | ||||||||
|
| |||||||
| Malaysia—0.2% | ||||||||
Tenaga Nasional Bhd. | 60,000 | 218,455 | ||||||
|
| |||||||
| Mexico—0.2% | ||||||||
Gruma S.A.B. de C.V. ADR | 1,358 | 71,675 | ||||||
Grupo Aeroportuario del Pacifico S.A.B. de C.V. ADR | 364 | 25,917 | ||||||
Industrias Bachoco S.A.B. de C.V. ADR | 1,447 | 83,014 | ||||||
Mexico Real Estate Management S.A. de C.V. REIT | 23,700 | 34,368 | ||||||
|
| |||||||
| 214,974 | ||||||||
|
| |||||||
| Netherlands—1.1% | ||||||||
Aegon NV | 8,452 | 64,462 | ||||||
AerCap Holdings NV (e) | 6,282 | 303,044 | ||||||
ASM International NV | 4,089 | 199,685 | ||||||
BE Semiconductor Industries NV | 2,403 | 65,204 | ||||||
BinckBank NV | 2,831 | 26,242 | ||||||
Boskalis Westminster NV | 828 | 40,970 | ||||||
Koninklijke Ahold NV | 9,073 | 184,304 | ||||||
Reed Elsevier NV | 5,586 | 135,450 | ||||||
Wolters Kluwer NV | 8,696 | 270,306 | ||||||
|
| |||||||
| 1,289,667 | ||||||||
|
| |||||||
| New Zealand—0.2% | ||||||||
Air New Zealand Ltd. | 89,106 | 188,679 | ||||||
|
| |||||||
| Norway—1.3% | ||||||||
DNB ASA | 40,218 | 704,852 | ||||||
Kongsberg Automotive ASA (e) | 124,929 | 89,003 | ||||||
Leroy Seafood Group ASA | 2,361 | 77,100 | ||||||
Norsk Hydro ASA | 29,714 | 138,768 | ||||||
Salmar ASA | 3,265 | 52,793 | ||||||
SpareBank 1 SMN | 29,239 | 249,806 | ||||||
Yara International ASA | 5,160 | 259,983 | ||||||
|
| |||||||
| 1,572,305 | ||||||||
|
| |||||||
| Philippines—0.1% | ||||||||
Universal Robina Corp. | 22,710 | 96,993 | ||||||
|
| |||||||
| Shares | Value | |||||||
| Poland—0.1% | ||||||||
Energa S.A. | 12,006 | $ | 73,497 | |||||
Tauron Polska Energia S.A. | 25,736 | 32,714 | ||||||
|
| |||||||
| 106,211 | ||||||||
|
| |||||||
| Singapore—0.7% | ||||||||
AIMS AMP Capital Industrial REIT | 22,000 | 24,561 | ||||||
DBS Group Holdings Ltd. | 19,700 | 296,180 | ||||||
Ezion Holdings Ltd. | 37,200 | 28,219 | ||||||
Fortune REIT | 60,000 | 60,535 | ||||||
Oversea-Chinese Banking Corp., Ltd. | 38,600 | 291,703 | ||||||
Yangzijiang Shipbuilding Holdings Ltd. | 66,000 | 70,683 | ||||||
|
| |||||||
| 771,881 | ||||||||
|
| |||||||
| South Africa—0.2% | ||||||||
FirstRand Ltd. | 21,270 | 91,139 | ||||||
Liberty Holdings Ltd. | 3,235 | 41,802 | ||||||
Sibanye Gold Ltd. ADR | 4,332 | 30,757 | ||||||
Telkom S.A. SOC Ltd. (e) | 15,518 | 88,656 | ||||||
|
| |||||||
| 252,354 | ||||||||
|
| |||||||
| Spain—0.6% | ||||||||
Banco de Sabadell S.A. | 52,997 | 134,120 | ||||||
Banco Santander S.A. | 46,630 | 332,439 | ||||||
Gas Natural SDG S.A. | 5,795 | 142,444 | ||||||
Mapfre S.A. | 13,241 | 47,177 | ||||||
|
| |||||||
| 656,180 | ||||||||
|
| |||||||
| Sweden—0.9% | ||||||||
Bilia AB | 1,350 | 26,603 | ||||||
Boliden AB | 8,386 | 180,068 | ||||||
Holmen AB, Class B | 1,388 | 41,602 | ||||||
Loomis AB, Class B | 1,846 | 54,289 | ||||||
NCC AB, Class B (d) | 1,380 | 42,945 | ||||||
Nordea Bank AB | 13,259 | 172,665 | ||||||
Skandinaviska Enskilda Banken AB, Class A | 21,903 | 270,912 | ||||||
Swedbank AB, Class A | 10,909 | 256,036 | ||||||
|
| |||||||
| 1,045,120 | ||||||||
|
| |||||||
| Switzerland—1.2% | ||||||||
ACE Ltd. | 3,364 | 358,199 | ||||||
Bucher Industries AG | 413 | 109,009 | ||||||
Georg Fischer AG | 135 | 102,324 | ||||||
Novartis AG | 4,412 | 452,810 | ||||||
Swiss Life Holding AG (e) | 460 | 110,378 | ||||||
Swiss Re AG | 2,653 | 238,385 | ||||||
|
| |||||||
| 1,371,105 | ||||||||
|
| |||||||
| Taiwan—1.0% | ||||||||
Advanced Semiconductor Engineering, Inc. | 120,000 | 171,136 | ||||||
Fubon Financial Holding Co., Ltd. | 137,000 | 280,953 | ||||||
Hon Hai Precision Industry Co., Ltd. | 31,200 | 100,560 | ||||||
Innolux Corp. | 134,000 | 82,461 | ||||||
Micro-Star International Co., Ltd. | 45,000 | 51,050 | ||||||
Siliconware Precision Industries Co., Ltd. | 35,000 | 57,569 | ||||||
Taishin Financial Holding Co., Ltd. | 156,933 | 67,889 | ||||||
Taiwan Semiconductor Manufacturing Co., Ltd. | 86,000 | 409,105 | ||||||
|
| |||||||
| 1,220,723 | ||||||||
|
| |||||||
| Thailand—0.2% | ||||||||
Kasikornbank PCL | 26,800 | 154,972 | ||||||
Krung Thai Bank PCL (c) | 49,100 | 26,364 | ||||||
Thai Union Frozen Products PCL (c) | 60,100 | 36,483 | ||||||
|
| |||||||
| 217,819 | ||||||||
|
| |||||||
| 126 | Semiannual Report | | May 31, 2015 | | See accompanying Notes to Financial Statements |
Table of Contents
Schedule of Investments
May 31, 2015 (Unaudited)
| Shares | Value | |||||||
| Turkey—0.3% | ||||||||
Dogus Otomotiv Servis ve Ticaret AS | 6,980 | $ | 44,276 | |||||
Eregli Demir ve Celik Fabrikalari TAS | 54,838 | 88,102 | ||||||
Tekfen Holding AS (e) | 42,532 | 74,889 | ||||||
Turk Hava Yollari AO (e) | 31,067 | 105,276 | ||||||
Turkiye Is Bankasi | 44,652 | 94,819 | ||||||
|
| |||||||
| 407,362 | ||||||||
|
| |||||||
| United Kingdom—6.1% | ||||||||
3i Group PLC | 14,963 | 128,964 | ||||||
Aviva PLC | 55,260 | 443,240 | ||||||
Barratt Developments PLC | 10,320 | 93,673 | ||||||
Bellway PLC | 6,197 | 222,811 | ||||||
Berkeley Group Holdings PLC | 4,792 | 226,970 | ||||||
Bovis Homes Group PLC | 6,384 | 106,835 | ||||||
Brit PLC (a) | 14,557 | 62,408 | ||||||
Britvic PLC | 6,960 | 78,018 | ||||||
BT Group PLC | 47,025 | 321,627 | ||||||
Carnival PLC | 1,884 | 91,152 | ||||||
DCC PLC (d) | 824 | 65,564 | ||||||
Dixons Carphone PLC | 25,435 | 185,255 | ||||||
easyJet PLC | 14,157 | 348,525 | ||||||
Galliford Try PLC | 8,087 | 204,442 | ||||||
HSBC Holdings PLC | 22,732 | 215,971 | ||||||
International Game Technology PLC (e) | 6,787 | 122,777 | ||||||
Interserve PLC | 15,015 | 142,522 | ||||||
Ithaca Energy, Inc. (e) | 24,455 | 18,878 | ||||||
ITV PLC | 30,390 | 126,476 | ||||||
Keller Group PLC | 8,820 | 143,769 | ||||||
Legal & General Group PLC | 58,267 | 237,170 | ||||||
Lloyds Banking Group PLC | 325,828 | 438,105 | ||||||
Lookers PLC | 10,829 | 26,770 | ||||||
Man Group PLC | 19,277 | 52,676 | ||||||
Micro Focus International PLC | 3,377 | 68,337 | ||||||
Mondi PLC | 10,849 | 245,083 | ||||||
National Express Group PLC | 15,096 | 71,955 | ||||||
Noble Corp. PLC | 7,111 | 119,109 | ||||||
Pace PLC | 26,468 | 167,024 | ||||||
Paragon Group of Cos. PLC | 6,280 | 42,257 | ||||||
Persimmon PLC | 7,049 | 211,962 | ||||||
Redrow PLC | 10,050 | 67,044 | ||||||
Royal Dutch Shell PLC, Class A | 5,829 | 173,753 | ||||||
Royal Dutch Shell PLC, Class B | 24,428 | 739,161 | ||||||
RPC Group PLC | 9,994 | 93,915 | ||||||
Shire PLC | 4,195 | 362,829 | ||||||
Taylor Wimpey PLC | 126,092 | 354,355 | ||||||
Trinity Mirror PLC | 11,183 | 26,792 | ||||||
WH Smith PLC | 8,302 | 196,776 | ||||||
|
| |||||||
| 7,044,950 | ||||||||
|
| |||||||
| United States—49.1% | ||||||||
A Schulman, Inc. | 2,642 | 112,998 | ||||||
ABM Industries, Inc. | 1,607 | 52,131 | ||||||
Actavis PLC (e) | 2,474 | 759,048 | ||||||
Aetna, Inc. | 6,641 | 783,439 | ||||||
AG Mortgage Investment Trust, Inc. REIT | 4,235 | 79,787 | ||||||
AGL Resources, Inc. | 1,361 | 68,554 | ||||||
Air Lease Corp. | 2,550 | 95,957 | ||||||
Aircastle Ltd. | 4,844 | 117,515 | ||||||
Alaska Air Group, Inc. | 5,960 | 385,254 | ||||||
Alcoa, Inc. | 15,271 | 190,888 | ||||||
ALLETE, Inc. | 1,019 | 51,307 | ||||||
Alliance Data Systems Corp. (e) | 802 | 239,020 | ||||||
Allstate Corp. | 5,198 | 349,929 | ||||||
Altria Group, Inc. | 14,207 | 727,398 | ||||||
Amdocs Ltd. | 4,672 | 256,259 | ||||||
Ameren Corp. | 6,781 | 272,800 | ||||||
American Airlines Group, Inc. | 2,486 | 105,332 | ||||||
American Capital Agency Corp. REIT | 1,573 | 32,813 | ||||||
American Electric Power Co., Inc. | 5,558 | 312,860 | ||||||
| Shares | Value | |||||||
American Financial Group, Inc. | 4,458 | $ | 283,083 | |||||
American Railcar Industries, Inc. | 2,525 | 135,769 | ||||||
Ameriprise Financial, Inc. | 687 | 85,593 | ||||||
AmerisourceBergen Corp. | 3,261 | 367,058 | ||||||
Amgen, Inc. | 5,666 | 885,369 | ||||||
Amsurg Corp. (e) | 1,841 | 123,973 | ||||||
Amtrust Financial Services, Inc. | 3,230 | 194,381 | ||||||
Annaly Capital Management, Inc. REIT | 7,939 | 82,883 | ||||||
Anthem, Inc. | 4,610 | 773,788 | ||||||
Anworth Mortgage Asset Corp. REIT | 6,428 | 33,426 | ||||||
Apollo Commercial Real Estate Finance, Inc. REIT | 2,119 | 36,383 | ||||||
Apollo Investment Corp. | 6,955 | 54,597 | ||||||
Apple, Inc. | 20,642 | 2,689,240 | ||||||
Archer-Daniels-Midland Co. | 6,863 | 362,710 | ||||||
Arlington Asset Investment Corp., Class A | 1,343 | 27,787 | ||||||
ARRIS Group, Inc. (e) | 1,646 | 54,334 | ||||||
Arrow Electronics, Inc. (e) | 586 | 35,623 | ||||||
Associated Banc-Corp | 3,262 | 61,880 | ||||||
AT&T, Inc. | 25,504 | 880,908 | ||||||
Atmos Energy Corp. | 3,209 | 173,350 | ||||||
Atwood Oceanics, Inc. | 4,757 | 146,373 | ||||||
Avery Dennison Corp. | 1,256 | 77,759 | ||||||
Avista Corp. | 3,539 | 113,248 | ||||||
Avnet, Inc. | 2,159 | 95,018 | ||||||
Becton Dickinson and Co. | 1,557 | 218,774 | ||||||
Belden, Inc. | 3,171 | 267,696 | ||||||
Benchmark Electronics, Inc. (e) | 1,962 | 45,597 | ||||||
Booz Allen Hamilton Holding Corp. | 3,786 | 95,975 | ||||||
Brocade Communications Systems, Inc. | 22,815 | 282,107 | ||||||
Caleres, Inc. | 2,783 | 86,078 | ||||||
Capital One Financial Corp. | 3,346 | 279,592 | ||||||
Capstead Mortgage Corp. REIT | 8,238 | 97,456 | ||||||
Cardtronics, Inc. (e) | 4,654 | 169,871 | ||||||
CDW Corp. | 5,995 | 222,414 | ||||||
Centene Corp. (e) | 1,046 | 78,806 | ||||||
CenturyLink, Inc. | 5,601 | 186,177 | ||||||
CF Industries Holdings, Inc. | 549 | 173,418 | ||||||
Chemed Corp. | 690 | 85,691 | ||||||
Chevron Corp. | 3,153 | 324,759 | ||||||
Chimera Investment Corp. REIT | 3,491 | 50,375 | ||||||
Cigna Corp. | 5,338 | 751,751 | ||||||
Cisco Systems, Inc. | 29,399 | 861,685 | ||||||
Citigroup, Inc. | 12,950 | 700,336 | ||||||
CNA Financial Corp. | 1,871 | 72,333 | ||||||
Comcast Corp., Class A | 18,402 | 1,071,724 | ||||||
Community Health Systems, Inc. (e) | 803 | 44,414 | ||||||
Conn’s, Inc. (e) | 2,277 | 84,226 | ||||||
ConocoPhillips | 14,762 | 940,044 | ||||||
Consolidated Edison, Inc. | 1,334 | 82,495 | ||||||
Convergys Corp. | 8,513 | 211,378 | ||||||
Cooper Cos., Inc. | 1,534 | 278,835 | ||||||
Crane Co. | 1,241 | 75,118 | ||||||
CVS Health Corp. | 8,201 | 839,618 | ||||||
Delta Air Lines, Inc. | 4,573 | 196,273 | ||||||
Deluxe Corp. | 2,785 | 177,767 | ||||||
DeVry Education Group, Inc. | 1,230 | 39,126 | ||||||
Dillard’s, Inc., Class A | 1,397 | 162,066 | ||||||
DineEquity, Inc. | 410 | 40,016 | ||||||
Discover Financial Services | 4,637 | 270,198 | ||||||
Dr. Pepper Snapple Group, Inc. | 2,594 | 198,804 | ||||||
Duke Energy Corp. | 2,525 | 191,218 | ||||||
Eastman Chemical Co. | 1,513 | 116,153 | ||||||
Edison International | 4,728 | 287,510 | ||||||
EMC Corp. | 6,722 | 177,057 | ||||||
Ensco PLC, Class A | 3,500 | 82,250 | ||||||
Entergy Corp. | 4,090 | 312,762 | ||||||
Enterprise Financial Services Corp. | 1,787 | 37,741 | ||||||
Euronet Worldwide, Inc. (e) | 704 | 42,099 | ||||||
| Shares | Value | |||||||
EverBank Financial Corp. | 3,060 | $ | 56,426 | |||||
Exelon Corp. | 8,918 | 301,696 | ||||||
Exxon Mobil Corp. | 6,996 | 596,059 | ||||||
Fidelity National Information Services, Inc. | 1,785 | 111,920 | ||||||
First Interstate Bancsystem, Inc., Class A | 1,613 | 43,938 | ||||||
First Merchants Corp. | 3,989 | 92,904 | ||||||
Foot Locker, Inc. | 3,099 | 195,857 | ||||||
GameStop Corp., Class A | 2,530 | 109,827 | ||||||
GATX Corp. | 4,247 | 236,600 | ||||||
General Electric Co. | 12,467 | 339,975 | ||||||
Gilead Sciences, Inc. (e) | 5,770 | 647,798 | ||||||
Global Cash Access Holdings, Inc. (e) | 10,172 | 78,630 | ||||||
Global Payments, Inc. | 3,048 | 318,150 | ||||||
Google, Inc., Class A (e) | 448 | 244,303 | ||||||
Google, Inc., Class C (e) | 351 | 186,771 | ||||||
Great Plains Energy, Inc. | 3,284 | 85,614 | ||||||
Green Plains, Inc. | 976 | 32,071 | ||||||
Greenbrier Cos., Inc. | 2,876 | 173,221 | ||||||
Group 1 Automotive, Inc. | 679 | 55,888 | ||||||
Halyard Health, Inc. (e) | 525 | 21,746 | ||||||
Hanesbrands, Inc. | 9,585 | 305,378 | ||||||
Hanover Insurance Group, Inc. | 1,460 | 103,923 | ||||||
HCC Insurance Holdings, Inc. | 2,092 | 119,621 | ||||||
Health Net, Inc. (e) | 1,837 | 114,335 | ||||||
Heartland Payment Systems, Inc. | 853 | 45,593 | ||||||
Hewlett-Packard Co. | 20,581 | 687,405 | ||||||
Humana, Inc. | 1,667 | 357,822 | ||||||
Huntsman Corp. | 1,962 | 44,027 | ||||||
Iconix Brand Group, Inc. (e) | 1,519 | 39,221 | ||||||
Ingram Micro, Inc., Class A (e) | 4,518 | 121,128 | ||||||
Intel Corp. | 22,604 | 778,934 | ||||||
International Business Machines Corp. | 2,903 | 492,494 | ||||||
Intersil Corp., Class A | 4,488 | 60,588 | ||||||
j2 Global, Inc. | 950 | 63,090 | ||||||
Jabil Circuit, Inc. | 3,609 | 88,673 | ||||||
Jack in the Box, Inc. | 481 | 41,756 | ||||||
JetBlue Airways Corp. (e) | 3,217 | 64,855 | ||||||
Johnson & Johnson | 14,698 | 1,471,858 | ||||||
JPMorgan Chase & Co. | 1,841 | 121,101 | ||||||
Kaiser Aluminum Corp. | 416 | 33,750 | ||||||
KeyCorp | 4,906 | 71,529 | ||||||
Kohl’s Corp. | 4,532 | 296,801 | ||||||
Kroger Co. | 11,074 | 806,187 | ||||||
Lam Research Corp. | 6,433 | 529,114 | ||||||
Lear Corp. | 2,587 | 300,144 | ||||||
LifePoint Hospitals, Inc. (e) | 2,592 | 195,152 | ||||||
Lincoln National Corp. | 10,614 | 605,104 | ||||||
LyondellBasell Industries NV, Class A | 2,593 | 262,152 | ||||||
Macy’s, Inc. | 4,765 | 319,017 | ||||||
MainSource Financial Group, Inc. | 2,136 | 42,763 | ||||||
Mallinckrodt PLC (e) | 3,993 | 516,854 | ||||||
Marriott Vacations Worldwide Corp. | 684 | 60,384 | ||||||
McKesson Corp. | 2,423 | 574,808 | ||||||
Mentor Graphics Corp. | 4,992 | 130,341 | ||||||
MetLife, Inc. | 4,411 | 230,519 | ||||||
Micron Technology, Inc. (e) | 14,572 | 406,996 | ||||||
Microsoft Corp. | 18,316 | 858,288 | ||||||
Morgan Stanley | 9,401 | 359,118 | ||||||
Mylan NV (e) | 8,937 | 649,094 | ||||||
Nabors Industries Ltd. | 2,550 | 37,613 | ||||||
Natus Medical, Inc. (e) | 3,892 | 152,022 | ||||||
Norfolk Southern Corp. | 2,931 | 269,652 | ||||||
Northrop Grumman Corp. | 2,037 | 324,250 | ||||||
O’Reilly Automotive, Inc. (e) | 546 | 119,863 | ||||||
Olin Corp. | 1,744 | 50,995 | ||||||
Omega Healthcare Investors, Inc. REIT | 1,963 | 70,727 | ||||||
Omnicare, Inc. | 3,323 | 316,649 | ||||||
ON Semiconductor Corp. (e) | 16,718 | 221,681 | ||||||
| See accompanying Notes to Financial Statements | | May 31, 2015 | | Semiannual Report | 127 |
Table of Contents
Schedule of Investments
May 31, 2015 (Unaudited)
| Shares | Value | |||||||
Oracle Corp. | 2,586 | $ | 112,465 | |||||
Packaging Corp. of America | 619 | 42,822 | ||||||
PartnerRe Ltd. | 2,797 | 367,610 | ||||||
PBF Energy, Inc., Class A | 1,399 | 37,521 | ||||||
Penske Automotive Group, Inc. | 2,068 | 106,729 | ||||||
PG&E Corp. | 11,683 | 624,690 | ||||||
PharMerica Corp. (e) | 12,555 | 417,579 | ||||||
Pinnacle Foods, Inc. | 2,572 | 108,410 | ||||||
Popular, Inc. (e) | 6,574 | 213,589 | ||||||
Portland General Electric Co. | 11,946 | 417,632 | ||||||
PPL Corp. | 3,317 | 115,133 | ||||||
Providence Service Corp. (e) | 885 | 42,533 | ||||||
Prudential Financial, Inc. | 3,424 | 289,705 | ||||||
Public Service Enterprise Group, Inc. | 14,819 | 631,734 | ||||||
QLogic Corp. (e) | 3,757 | 58,309 | ||||||
Qorvo, Inc. (e) | 748 | 61,448 | ||||||
Quest Diagnostics, Inc. | 4,096 | 308,142 | ||||||
Quintiles Transnational Holdings, Inc. (e) | 2,586 | 180,270 | ||||||
Reinsurance Group of America, Inc. | 1,089 | 101,876 | ||||||
Reynolds American, Inc. | 5,946 | 456,355 | ||||||
Rock-Tenn Co., Class A | 1,637 | 106,634 | ||||||
Rockwell Collins, Inc. | 762 | 72,535 | ||||||
Royal Caribbean Cruises Ltd. | 4,237 | 321,927 | ||||||
Ryder System, Inc. | 986 | 90,367 | ||||||
Sanderson Farms, Inc. | 2,309 | 188,253 | ||||||
Sanmina Corp. (e) | 6,970 | 150,970 | ||||||
SCANA Corp. | 1,630 | 86,651 | ||||||
Skyworks Solutions, Inc. | 2,131 | 233,046 | ||||||
Snap-on, Inc. | 264 | 41,026 | ||||||
Spirit AeroSystems Holdings, Inc., Class A (e) | 1,132 | 61,796 | ||||||
SS&C Technologies Holdings, Inc. | 784 | 46,201 | ||||||
SunTrust Banks, Inc. | 1,030 | 43,960 | ||||||
Symetra Financial Corp. | 2,955 | 72,279 | ||||||
Synaptics, Inc. (e) | 652 | 64,965 | ||||||
SYNNEX Corp. | 2,082 | 172,119 | ||||||
Syntel, Inc. (e) | 974 | 46,275 | ||||||
Target Corp. | 1,319 | 104,623 | ||||||
Teleflex, Inc. | 388 | 49,951 | ||||||
Time Warner Cable, Inc. | 903 | 163,344 | ||||||
Travelers Cos., Inc. | 4,446 | 449,580 | ||||||
Trinity Industries, Inc. | 4,809 | 144,222 | ||||||
Tutor Perini Corp. (e) | 1,691 | 35,443 | ||||||
Tyson Foods, Inc., Class A | 11,465 | 486,689 | ||||||
Umpqua Holdings Corp. | 3,010 | 52,946 | ||||||
Union Pacific Corp. | 8,773 | 885,283 | ||||||
United Continental Holdings, Inc. (e) | 2,396 | 130,798 | ||||||
United Therapeutics Corp. (e) | 900 | 165,348 | ||||||
UnitedHealth Group, Inc. | 6,724 | 808,292 | ||||||
USANA Health Sciences, Inc. (e) | 305 | 39,067 | ||||||
Valero Energy Corp. | 4,979 | 294,956 | ||||||
Verint Systems, Inc. (e) | 1,569 | 101,467 | ||||||
Verizon Communications, Inc. | 21,517 | 1,063,800 | ||||||
Voya Financial, Inc. | 6,376 | 288,897 | ||||||
Walt Disney Co. | 9,043 | 998,076 | ||||||
Webster Financial Corp. | 1,646 | 62,367 | ||||||
Wells Fargo & Co. | 19,479 | 1,090,045 | ||||||
WesBanco, Inc. | 2,827 | 89,446 | ||||||
West Corp. | 1,224 | 37,454 | ||||||
Westar Energy, Inc. | 5,924 | 217,233 | ||||||
Western Alliance Bancorp (e) | 1,940 | 60,819 | ||||||
Western Digital Corp. | 4,334 | 421,958 | ||||||
Western Union Co. | 8,640 | 189,648 | ||||||
Whirlpool Corp. | 723 | 133,213 | ||||||
Wintrust Financial Corp. | 1,261 | 63,176 | ||||||
World Fuel Services Corp. | 735 | 36,772 | ||||||
WSFS Financial Corp. | 1,242 | 30,640 | ||||||
Xcel Energy, Inc. | 6,412 | 218,329 | ||||||
|
| |||||||
| 57,047,806 | ||||||||
|
| |||||||
| Total Common Stock (cost—$102,157,860) | 109,347,576 | |||||||
|
| |||||||
| Shares | Value | |||||||
| Preferred Stock—0.5% | ||||||||
| Brazil—0.3% | ||||||||
Banco Bradesco S.A. | 6,120 | 54,184 | ||||||
Braskem S.A., Class A | 4,500 | 18,317 | ||||||
Cia Energetica de Sao Paulo, Class B | 11,900 | 73,910 | ||||||
Cia Paranaense de Energia | 9,200 | 94,619 | ||||||
Itau Unibanco Holding S.A. | 10,350 | 111,514 | ||||||
|
| |||||||
| 352,544 | ||||||||
|
| |||||||
| Korea (Republic of)—0.2% | ||||||||
Hyundai Motor Co. | 2,811 | 296,061 | ||||||
|
| |||||||
| Total Preferred Stock (cost—$745,911) | 648,605 | |||||||
|
| |||||||
| Rights—0.0% | ||||||||
| Italy—0.0% | ||||||||
Unipol Gruppo Finanziario SpA,strike price $3.71, expires 6/3/15 (c)(e) (cost—$0) | 27,248 | — | ||||||
|
| |||||||
| Principal Amount (000s) | ||||||||
| Repurchase Agreements—3.9% | ||||||||
State Street Bank and Trust Co., dated 5/29/15, 0.00%, due 6/1/15, proceeds $4,517,000; collateralized by U.S. Treasury Notes, 2.125%, due 9/30/21, valued at $4,611,475 including accrued interest |
| |||||||
(cost—$4,517,000) | $4,517 | 4,517,000 | ||||||
|
| |||||||
| Total Investments (cost—$107,420,771) (b)—98.6% | 114,513,181 | |||||||
|
| |||||||
| Other assets less liabilities—1.4% | 1,576,636 | |||||||
|
| |||||||
| Net Assets—100.0% | $116,089,817 | |||||||
|
| |||||||
Notes to Schedule of Investments:
(a) 144A—Exempt from registration under Rule 144A of the Securities Act of 1933. These securities may be resold in transactions exempt from registration, typically only to qualified institutional buyers. Unless otherwise indicated, these securities are not considered to be illiquid.
(b) Securities with an aggregate value of $43,405,808, representing 37.4% of net assets, were valued utilizing modeling tools provided by a third-party vendor. See Note 1(a) and Note 1(b) in the Notes to Financial Statements.
(c) Fair-Valued—Securities with an aggregate value of $76,195, representing 0.1% of net assets. See Note 1(a) and Note 1(b) in the Notes to Financial Statements.
(d) Affiliated security.
(e) Non-income producing.
Glossary:
ADR—American Depositary Receipt
€—Euro
GDR—Global Depositary Receipt
REIT—Real Estate Investment Trust
The industry classification of portfolio holdings and other assets less liabilities shown as a percentage of net assets were as follows:
Banks | 11.5% | |||
Insurance | 6.4% | |||
Health Care Providers & Services | 5.8% | |||
Pharmaceuticals | 5.0% | |||
Technology Hardware, Storage & Peripherals | 4.9% | |||
Oil, Gas & Consumable Fuels | 3.7% | |||
Semiconductors & Semiconductor Equipment | 3.4% | |||
Diversified Telecommunication Services | 3.3% | |||
Electric Utilities | 3.1% | |||
Automobiles | 3.0% | |||
Media | 2.9% | |||
Auto Components | 2.7% | |||
Road & Rail | 2.2% | |||
Food & Staples Retailing | 2.1% | |||
IT Services | 2.1% | |||
Airlines | 1.9% | |||
Food Products | 1.8% | |||
Household Durables | 1.7% | |||
Multi-Utilities | 1.5% | |||
Electronic Equipment, Instruments & Components | 1.5% | |||
Biotechnology | 1.5% | |||
Software | 1.2% | |||
Metals & Mining | 1.1% | |||
Trading Companies & Distributors | 1.1% | |||
Communications Equipment | 1.0% | |||
Health Care Equipment & Supplies | 1.0% | |||
Specialty Retail | 1.0% | |||
Tobacco | 1.0% | |||
Machinery | 1.0% | |||
Wireless Telecommunication Services | 0.9% | |||
Multi-line Retail | 0.9% | |||
Chemicals | 0.8% | |||
Construction & Engineering | 0.8% | |||
Diversified Financial Services | 0.8% | |||
Containers & Packaging | 0.8% | |||
Hotels, Restaurants & Leisure | 0.8% | |||
Gas Utilities | 0.7% | |||
Capital Markets | 0.6% | |||
Real Estate Investment Trust | 0.6% | |||
Independent Power and Renewable Electricity Producers | 0.6% | |||
Paper & Forest Products | 0.5% | |||
Industrial Conglomerates | 0.5% | |||
Commercial Services & Supplies | 0.5% | |||
Internet Software & Services | 0.5% | |||
Aerospace & Defense | 0.5% | |||
Beverages | 0.5% | |||
Consumer Finance | 0.4% | |||
Textiles, Apparel & Luxury Goods | 0.4% | |||
Marine | 0.4% | |||
Real Estate Management & Development | 0.4% | |||
Energy Equipment & Services | 0.3% | |||
Thrifts & Mortgage Finance | 0.2% | |||
Electrical Equipment | 0.2% | |||
Life Sciences Tools & Services | 0.2% | |||
Professional Services | 0.1% | |||
Building Products | 0.1% | |||
Transportation Infrastructure | 0.1% | |||
Air Freight & Logistics | 0.1% | |||
Diversified Consumer Services | 0.1% | |||
Construction Materials | 0.0% | |||
Personal Products | 0.0% | |||
Distributors | 0.0% | |||
Repurchase Agreements | 3.9% | |||
Other assets less liabilities | 1.4% | |||
|
| |||
| 100.0% | ||||
|
|
| 128 | Semiannual Report | | May 31, 2015 | | See accompanying Notes to Financial Statements |
Table of Contents
Schedule of Investments
May 31, 2015 (Unaudited)
AllianzGI Best Styles International Equity Fund
| Shares | Value | |||||||
| Common Stock—95.3% | ||||||||
| Australia—5.1% | ||||||||
Abacus Property Group REIT | 15,398 | $34,202 | ||||||
Australia & New Zealand Banking Group Ltd. | 7,786 | 196,797 | ||||||
Bank of Queensland Ltd. | 11,197 | 113,069 | ||||||
Bendigo and Adelaide Bank Ltd. | 11,020 | 103,215 | ||||||
Commonwealth Bank of Australia | 734 | 47,563 | ||||||
CSR Ltd. | 17,974 | 57,606 | ||||||
Dexus Property Group REIT | 13,387 | 81,684 | ||||||
Downer EDI Ltd. | 19,986 | 78,218 | ||||||
Echo Entertainment Group Ltd. | 23,347 | 83,118 | ||||||
Federation Centres REIT | 49,653 | 114,925 | ||||||
Genworth Mortgage Insurance Australia Ltd. | 29,581 | 71,291 | ||||||
Independence Group NL | 4,483 | 16,520 | ||||||
Investa Office Fund REIT | 9,573 | 28,944 | ||||||
Lend Lease Group | 9,638 | 122,051 | ||||||
Orora Ltd. | 18,395 | 30,803 | ||||||
Select Harvests Ltd. | 3,224 | 25,484 | ||||||
Sigma Pharmaceuticals Ltd. | 63,522 | 42,111 | ||||||
Tassal Group Ltd. | 11,787 | 29,629 | ||||||
Transfield Services Ltd. (e) | 10,590 | 13,411 | ||||||
Westpac Banking Corp. | 16,767 | 429,570 | ||||||
|
| |||||||
| 1,720,211 | ||||||||
|
| |||||||
| Belgium—1.2% | ||||||||
Anheuser-Busch InBev NV | 126 | 15,203 | ||||||
bpost S.A. (d) | 2,677 | 77,274 | ||||||
Delhaize Group S.A. | 1,916 | 171,026 | ||||||
Elia System Operator S.A. | 902 | 39,113 | ||||||
Exmar NV | 1,407 | 14,103 | ||||||
Ontex Group NV (d) | 2,075 | 64,075 | ||||||
Warehouses De Pauw CVA REIT | 258 | 19,495 | ||||||
|
| |||||||
| 400,289 | ||||||||
|
| |||||||
| Bermuda—0.1% | ||||||||
North Atlantic Drilling Ltd. | 19,616 | 26,089 | ||||||
|
| |||||||
| Cayman Islands—0.2% | ||||||||
Phoenix Group Holdings | 6,411 | 83,911 | ||||||
|
| |||||||
| China—0.4% | ||||||||
Global Brands Group Holding Ltd. (e) | 238,000 | 53,053 | ||||||
Huabao International Holdings Ltd. | 66,000 | 62,821 | ||||||
Wasion Group Holdings Ltd. | 22,000 | 34,212 | ||||||
|
| |||||||
| 150,086 | ||||||||
|
| |||||||
| Denmark—1.4% | ||||||||
AP Moeller—Maersk A/S, Class B | 139 | 267,922 | ||||||
Bakkafrost P/F | 2,123 | 56,219 | ||||||
Danske Bank A/S | 625 | 18,321 | ||||||
Novo Nordisk A/S, Class B | 306 | 17,359 | ||||||
Schouw & Co. | 397 | 21,654 | ||||||
TDC A/S | 13,744 | 102,641 | ||||||
|
| |||||||
| 484,116 | ||||||||
|
| |||||||
| Finland—0.9% | ||||||||
UPM-Kymmene Oyj | 16,356 | 293,938 | ||||||
|
| |||||||
| France—7.0% | ||||||||
APERAM S.A. (e) | 1,744 | 72,061 | ||||||
AXA S.A. | 15,399 | 386,920 | ||||||
Boiron S.A. | 173 | 17,872 | ||||||
Casino Guichard Perrachon S.A. | 444 | 34,797 | ||||||
Coface S.A. (d) | 4,007 | 44,920 | ||||||
Electricite de France S.A. | 4,135 | 101,563 | ||||||
Elior Participations SCA (a) | 2,887 | 52,553 | ||||||
GDF Suez | 4,682 | 94,377 | ||||||
| Shares | Value | |||||||
Generale de Sante S.A. | 1,901 | $ | 30,661 | |||||
Lagardere SCA | 2,364 | 71,517 | ||||||
Natixis S.A. | 13,338 | 99,927 | ||||||
Norbert Dentressangle S.A. | 156 | 37,622 | ||||||
Orange S.A. | 19,039 | 300,130 | ||||||
Rallye S.A. | 1,178 | 37,733 | ||||||
Renault S.A. | 685 | 70,914 | ||||||
Sanofi | 625 | 61,550 | ||||||
Suez Environnement Co. | 2,189 | 42,172 | ||||||
Technicolor S.A. | 6,606 | 42,335 | ||||||
Teleperformance | 998 | 73,505 | ||||||
Total S.A. | 5,073 | 256,011 | ||||||
UBISOFT Entertainment (e) | 4,474 | 80,667 | ||||||
Valeo S.A. | 2,200 | 350,462 | ||||||
|
| |||||||
| 2,360,269 | ||||||||
|
| |||||||
| Germany—8.4% | ||||||||
Bayer AG | 505 | 71,795 | ||||||
Daimler AG | 5,197 | 487,452 | ||||||
Deutsche Post AG | 6,405 | 193,557 | ||||||
Deutsche Telekom AG | 23,873 | 411,825 | ||||||
Deutsche Wohnen AG | 6,481 | 158,025 | ||||||
Duerr AG | 802 | 82,107 | ||||||
Hannover Rueck SE | 1,646 | 160,120 | ||||||
K&S AG | 4,898 | 159,801 | ||||||
Krones AG | 707 | 77,548 | ||||||
KUKA AG | 998 | 79,138 | ||||||
Merck KGaA | 2,941 | 315,127 | ||||||
MTU Aero Engines AG | 1,230 | 117,482 | ||||||
Muenchener Rueckversicherungs-Gesellschaft AG in Muenchen | 1,691 | 312,470 | ||||||
Rhoen Klinikum AG | 1,871 | 52,172 | ||||||
Siemens AG | 132 | 13,909 | ||||||
Stada Arzneimittel AG | 1,287 | 44,731 | ||||||
TUI AG | 4,164 | 73,922 | ||||||
Wacker Neuson SE | 1,094 | 25,273 | ||||||
|
| |||||||
| 2,836,454 | ||||||||
|
| |||||||
| Hong Kong—1.0% | ||||||||
BOC Hong Kong Holdings Ltd. | 8,500 | 34,943 | ||||||
HK Electric Investments & HK Electric Investments Ltd. (a) | 93,000 | 63,210 | ||||||
Hutchison Whampoa Ltd. (c) | 5,000 | 74,159 | ||||||
Noble Group Ltd. | 29,000 | 17,072 | ||||||
PCCW Ltd. | 101,000 | 63,088 | ||||||
Power Assets Holdings Ltd. | 8,500 | 81,280 | ||||||
|
| |||||||
| 333,752 | ||||||||
|
| |||||||
| Ireland—0.8% | ||||||||
Total Produce PLC | 3,031 | 3,729 | ||||||
XL Group PLC | 7,050 | 265,644 | ||||||
|
| |||||||
| 269,373 | ||||||||
|
| |||||||
| Israel—0.4% | ||||||||
Bank Hapoalim BM | 24,586 | 128,841 | ||||||
|
| |||||||
| Italy—3.7% | ||||||||
Enel SpA | 70,115 | 340,811 | ||||||
Hera SpA | 28,746 | 75,979 | ||||||
Intesa Sanpaolo SpA | 113,074 | 409,631 | ||||||
Snam SpA | 54,221 | 268,557 | ||||||
Terna Rete Elettrica Nazionale SpA | 22,461 | 107,254 | ||||||
UniCredit SpA | 7,834 | 54,963 | ||||||
|
| |||||||
| 1,257,195 | ||||||||
|
| |||||||
| Japan—23.9% | ||||||||
Accordia Golf Co., Ltd. | 4,700 | 43,561 | ||||||
Aderans Co., Ltd. | 2,300 | 20,403 | ||||||
AOKI Holdings, Inc. | 3,500 | 49,735 | ||||||
Aoyama Trading Co., Ltd. | 2,000 | 76,089 | ||||||
| Shares | Value | |||||||
Aozora Bank Ltd. | 41,000 | $ | 157,664 | |||||
Arrk Corp. (e) | 15,600 | 16,654 | ||||||
As One Corp. | 500 | 17,426 | ||||||
Asahi Holdings, Inc. | 2,300 | 40,997 | ||||||
Asahi Kasei Corp. | 27,000 | 238,839 | ||||||
Awa Bank Ltd. | 5,000 | 30,470 | ||||||
Chiyoda Co., Ltd. | 1,700 | 37,481 | ||||||
Chudenko Corp. | 1,700 | 32,453 | ||||||
Coca-Cola East Japan Co., Ltd. | 2,900 | 53,558 | ||||||
COMSYS Holdings Corp. | 4,700 | 67,978 | ||||||
DCM Holdings Co., Ltd. | 6,600 | 60,317 | ||||||
Duskin Co., Ltd. | 2,900 | 47,559 | ||||||
EDION Corp. | 5,900 | 44,034 | ||||||
FUJIFILM Holdings Corp. | 1,100 | 41,858 | ||||||
Gunze Ltd. | 11,000 | 29,406 | ||||||
Heiwa Corp. | 1,700 | 32,871 | ||||||
Hitachi Ltd. | 40,000 | 272,284 | ||||||
Hokkoku Bank Ltd. | 5,000 | 17,359 | ||||||
Hokuriku Electric Power Co. | 5,300 | 80,257 | ||||||
Honda Motor Co., Ltd. | 12,400 | 426,375 | ||||||
Inabata & Co., Ltd. | 2,300 | 23,961 | ||||||
J Trust Co., Ltd. | 4,100 | 41,359 | ||||||
Japan Petroleum Exploration Co., Ltd. | 1,100 | 36,700 | ||||||
JFE Holdings, Inc. | 11,700 | 284,275 | ||||||
Kato Sangyo Co., Ltd. | 500 | 10,904 | ||||||
Kawasaki Kisen Kaisha Ltd. | 23,000 | 58,066 | ||||||
Kissei Pharmaceutical Co., Ltd. | 1,700 | 44,694 | ||||||
Kiyo Bank Ltd. | 2,900 | 41,496 | ||||||
Kokuyo Co., Ltd. | 5,300 | 46,239 | ||||||
Kurabo Industries Ltd. | 1,000 | 2,104 | ||||||
Kuraray Co., Ltd. | 1,700 | 22,237 | ||||||
Kuroda Electric Co., Ltd. | 2,300 | 40,749 | ||||||
Kyokuto Kaihatsu Kogyo Co., Ltd. | 2,300 | 26,080 | ||||||
Marubeni Corp. | 45,400 | 264,960 | ||||||
Marudai Food Co., Ltd. | 5,000 | 18,128 | ||||||
Megmilk Snow Brand Co., Ltd. | 2,900 | 36,592 | ||||||
Mitsubishi Chemical Holdings Corp. | 27,600 | 173,104 | ||||||
Mitsubishi Gas Chemical Co., Inc. | 5,000 | 28,955 | ||||||
Mitsubishi Materials Corp. | 34,000 | 134,214 | ||||||
Mitsubishi UFJ Financial Group, Inc. | 74,200 | 547,136 | ||||||
Mitsui & Co., Ltd. | 18,000 | 251,726 | ||||||
Mitsui OSK Lines Ltd. | 11,000 | 37,635 | ||||||
Mizuho Financial Group, Inc. | 213,500 | 470,039 | ||||||
Mochida Pharmaceutical Co., Ltd. | 500 | 27,960 | ||||||
Nagase & Co., Ltd. | 5,900 | 79,109 | ||||||
Nanto Bank Ltd. | 5,000 | 18,079 | ||||||
NEC Networks & System Integration Corp. | 1,700 | 36,126 | ||||||
NH Foods Ltd. | 5,000 | 108,227 | ||||||
Nippon Densetsu Kogyo Co., Ltd. | 2,300 | 40,017 | ||||||
Nippon Flour Mills Co., Ltd. | 5,000 | 27,449 | ||||||
Nippon Steel & Sumitomo Metal Corp. | 72,000 | 197,114 | ||||||
Nissan Motor Co., Ltd. | 33,400 | 346,887 | ||||||
Nisshin Oillio Group Ltd. | 5,000 | 18,594 | ||||||
Nitto Denko Corp. | 500 | 38,716 | ||||||
Otsuka Holdings Co., Ltd. | 8,900 | 277,712 | ||||||
Press Kogyo Co., Ltd. | 5,000 | 22,163 | ||||||
Ricoh Co., Ltd. | 8,000 | 83,118 | ||||||
Sekisui House Ltd. | 1,100 | 18,308 | ||||||
Senko Co., Ltd. | 5,000 | 30,955 | ||||||
Senshu Ikeda Holdings, Inc. | 8,900 | 40,121 | ||||||
Showa Corp. | 3,500 | 36,610 | ||||||
Sumitomo Corp. | 8,900 | 105,565 | ||||||
Sumitomo Dainippon Pharma Co., Ltd. | 3,500 | 39,749 | ||||||
Sumitomo Electric Industries Ltd. | 3,500 | 55,661 | ||||||
Sumitomo Metal Mining Co., Ltd. | 13,000 | 199,977 | ||||||
| See accompanying Notes to Financial Statements | | May 31, 2015 | | Semiannual Report | 129 |
Table of Contents
Schedule of Investments
May 31, 2015 (Unaudited)
| Shares | Value | |||||||
Sumitomo Mitsui Financial Group, Inc. | 9,800 | $ | 444,717 | |||||
Takara Standard Co., Ltd. | 5,000 | 36,719 | ||||||
Toagosei Co., Ltd. | 11,000 | 47,170 | ||||||
Tohoku Electric Power Co., Inc. | 1,100 | 15,377 | ||||||
Torii Pharmaceutical Co., Ltd. | 500 | 12,860 | ||||||
Toyota Motor Corp. | 10,400 | 717,397 | ||||||
United Super Markets Holdings, Inc. (e) | 3,500 | 29,638 | ||||||
West Japan Railway Co. | 5,400 | 320,239 | ||||||
Yellow Hat Ltd. | 500 | 10,009 | ||||||
Yokohama Reito Co., Ltd. | 2,300 | 15,781 | ||||||
|
| |||||||
| 8,075,105 | ||||||||
|
| |||||||
| Netherlands—1.7% | ||||||||
AerCap Holdings NV (e) | 2,498 | 120,503 | ||||||
BE Semiconductor Industries NV | 1,973 | 53,536 | ||||||
Boskalis Westminster NV | 2,165 | 107,125 | ||||||
Heineken Holding NV | 2,266 | 157,384 | ||||||
NN Group NV (e) | 3,825 | 106,895 | ||||||
Unilever NV | 1,052 | 44,945 | ||||||
|
| |||||||
| 590,388 | ||||||||
|
| |||||||
| New Zealand—0.4% | ||||||||
Air New Zealand Ltd. | 34,599 | 73,262 | ||||||
Sky Network Television Ltd. | 11,420 | 51,359 | ||||||
|
| |||||||
| 124,621 | ||||||||
|
| |||||||
| Norway—3.3% | ||||||||
Atea ASA | 3,988 | 44,646 | ||||||
Austevoll Seafood ASA | 7,129 | 40,320 | ||||||
Borregaard ASA | 4,404 | 31,718 | ||||||
BW Offshore Ltd. | 35,444 | 27,385 | ||||||
DNB ASA | 18,285 | 320,459 | ||||||
Leroy Seafood Group ASA | 1,203 | 39,285 | ||||||
Marine Harvest ASA | 7,544 | 86,680 | ||||||
Salmar ASA | 3,995 | 64,597 | ||||||
Ship Finance International Ltd. | 3,224 | 52,712 | ||||||
Sparebank 1 Nord Norge | 2,906 | 16,341 | ||||||
SpareBank 1 SMN | 5,421 | 46,315 | ||||||
Veidekke ASA | 2,418 | 28,626 | ||||||
Yara International ASA | 6,336 | 319,235 | ||||||
|
| |||||||
| 1,118,319 | ||||||||
|
| |||||||
| Singapore—0.6% | ||||||||
DBS Group Holdings Ltd. | 5,000 | 75,173 | ||||||
Fortune REIT | 41,000 | 41,365 | ||||||
Mapletree Logistics Trust REIT | 66,000 | 57,036 | ||||||
Religare Health Trust UNIT | 29,000 | 22,783 | ||||||
United Engineers Ltd. | 5,000 | 10,051 | ||||||
|
| |||||||
| 206,408 | ||||||||
|
| |||||||
| Spain—3.4% | ||||||||
Applus Services S.A. (e) | 4,747 | 56,006 | ||||||
Banco Santander S.A. | 61,761 | 440,312 | ||||||
Gas Natural SDG S.A. | 9,991 | 245,584 | ||||||
Iberdrola S.A. | 48,993 | 338,584 | ||||||
Merlin Properties Socimi S.A. REIT (e) | 5,884 | 76,579 | ||||||
|
| |||||||
| 1,157,065 | ||||||||
|
| |||||||
| Sweden—3.5% | ||||||||
BillerudKorsnas AB | 3,779 | 64,066 | ||||||
Boliden AB | 8,837 | 189,753 | ||||||
ICA Gruppen AB | 2,832 | 98,712 | ||||||
Klovern AB, Class A | 13,665 | 13,303 | ||||||
Loomis AB, Class B | 2,792 | 82,110 | ||||||
Securitas AB, Class B | 1,534 | 20,862 | ||||||
Skanska AB, Class B | 12,787 | 266,492 | ||||||
Swedbank AB, Class A | 12,353 | 289,927 | ||||||
Tele2 AB, Class B | 9,209 | 108,419 | ||||||
Telefonaktiebolaget LM Ericsson, Class B | 3,405 | 38,325 | ||||||
|
| |||||||
| 1,171,969 | ||||||||
|
| |||||||
| Shares | Value | |||||||
| Switzerland—8.6% | ||||||||
ACE Ltd. | 2,166 | $ | 230,636 | |||||
Aryzta AG | 1,083 | 69,040 | ||||||
Aryzta AG | 1,504 | 95,357 | ||||||
Baloise Holding AG | 397 | 49,476 | ||||||
Flughafen Zuerich AG | 29 | 22,957 | ||||||
Nestle S.A. | 5,763 | 446,500 | ||||||
Novartis AG | 8,420 | 864,157 | ||||||
Pargesa Holding S.A. | 1,132 | 79,751 | ||||||
Roche Holding AG | 1,124 | 342,675 | ||||||
Siegfried Holding AG (e) | 126 | 22,992 | ||||||
Swiss Life Holding AG (e) | 475 | 113,977 | ||||||
Swiss Re AG | 1,279 | 114,924 | ||||||
Swisscom AG | 107 | 62,027 | ||||||
Zurich Insurance Group AG (e) | 1,222 | 390,067 | ||||||
|
| |||||||
| 2,904,536 | ||||||||
|
| |||||||
| United Kingdom—19.3% | ||||||||
3i Group PLC | 17,272 | 148,866 | ||||||
AstraZeneca PLC | 2,360 | 158,935 | ||||||
Aviva PLC | 33,139 | 265,807 | ||||||
Barratt Developments PLC | 14,595 | 132,477 | ||||||
Bellway PLC | 3,528 | 126,848 | ||||||
Berkeley Group Holdings PLC | 2,647 | 125,373 | ||||||
Bovis Homes Group PLC | 5,108 | 85,482 | ||||||
BP PLC | 81,797 | 566,013 | ||||||
Brit PLC (a) | 6,997 | 29,997 | ||||||
British American Tobacco PLC | 805 | 44,464 | ||||||
BT Group PLC | 61,270 | 419,055 | ||||||
Cranswick PLC | 775 | 18,988 | ||||||
Direct Line Insurance Group PLC | 13,093 | 67,505 | ||||||
easyJet PLC | 4,241 | 104,407 | ||||||
Enterprise Inns PLC (e) | 24,238 | 47,996 | ||||||
Evraz PLC | 18,258 | 47,049 | ||||||
Galliford Try PLC | 2,779 | 70,254 | ||||||
GlaxoSmithKline PLC | 2,526 | 56,126 | ||||||
Go-Ahead Group PLC | 1,515 | 61,532 | ||||||
Greggs PLC | 4,668 | 84,715 | ||||||
Hammerson PLC REIT | 2,196 | 22,444 | ||||||
HSBC Holdings PLC | 72,994 | 693,499 | ||||||
International Consolidated Airlines Group S.A. (e) | 20,260 | 171,112 | ||||||
International Consolidated Airlines Group S.A. (e) | 33,224 | 282,092 | ||||||
Legal & General Group PLC | 74,170 | 301,901 | ||||||
Lloyds Banking Group PLC | 359,571 | 483,475 | ||||||
National Grid PLC | 18,927 | 271,014 | ||||||
Navigator Holdings Ltd. (e) | 2,785 | 51,968 | ||||||
Northgate PLC | 3,820 | 36,753 | ||||||
Pace PLC | 12,847 | 81,070 | ||||||
Persimmon PLC | 4,962 | 149,207 | ||||||
Petra Diamonds Ltd. (e) | 17,348 | 46,136 | ||||||
Royal Dutch Shell PLC, Class A | 17,613 | 525,016 | ||||||
Royal Dutch Shell PLC, Class B | 14,304 | 432,821 | ||||||
Safestore Holdings PLC REIT | 4,085 | 17,029 | ||||||
Shire PLC | 800 | 69,193 | ||||||
Spirit Pub Co. PLC | 33,801 | 59,152 | ||||||
Taylor Wimpey PLC | 50,111 | 140,826 | ||||||
Vodafone Group PLC | 4,308 | 16,840 | ||||||
Xchanging PLC | 6,847 | 13,199 | ||||||
|
| |||||||
| 6,526,636 | ||||||||
|
| |||||||
Total Common Stock (cost—$30,816,097) | 32,219,571 | |||||||
|
| |||||||
| Preferred Stock—2.4% | ||||||||
| Germany—2.1% | ||||||||
Henkel AG & Co. KGaA | 2,815 | 336,976 | ||||||
Volkswagen AG | 1,543 | 374,977 | ||||||
|
| |||||||
| 711,953 | ||||||||
|
| |||||||
| Shares | Value | |||||||
| Spain—0.3% | ||||||||
Grifols S.A., Class B | 3,016 | $ | 96,657 | |||||
|
| |||||||
Total Preferred Stock (cost—$770,396) | 808,610 | |||||||
|
| |||||||
| Rights—0.0% | ||||||||
| Germany—0.0% | ||||||||
Deutsche Wohnen AG, exercise price €21.50, expires 6/3/15 (e) (cost—$0) | 6,481 | 213 | ||||||
|
| |||||||
| Principal Amount (000s) | ||||||||
| Repurchase Agreements—1.6% | ||||||||
State Street Bank and Trust Co., dated 5/29/15, 0.00%, due 6/1/15, proceeds $557,000; collateralized by U.S. Treasury Notes, 2.125%, due 9/30/21, valued at $572,600 including accrued interest |
| |||||||
(cost—$557,000) | $557 | 557,000 | ||||||
| Total Investments (cost—$32,143,493) (b)—99.3% | 33,585,394 | |||||||
|
| |||||||
| Other assets less liabilities—0.7% | 246,976 | |||||||
|
| |||||||
| Net Assets—100.0% | $33,832,370 | |||||||
|
| |||||||
Notes to Schedule of Investments:
(a) 144A—Exempt from registration under Rule 144A of the Securities Act of 1933. These securities may be resold in transactions exempt from registration, typically only to qualified institutional buyers. Unless otherwise indicated, these securities are not considered to be illiquid.
(b) Securities with an aggregate value of $31,443,413, representing 92.9% of net assets, were valued utilizing modeling tools provided by a third-party vendor. See Note 1(a) and Note 1(b) in the Notes to Financial Statements.
(c) Fair-Valued—Security with a value of $74,159, representing 0.2% of net assets. See Note 1(a) and Note 1(b) in the Notes to Financial Statements.
(d) Affiliated security.
(e) Non-income producing.
Glossary:
€—Euro
REIT—Real Estate Investment Trust
UNIT—More than one class of securities traded together.
| 130 | Semiannual Report | | May 31, 2015 | | See accompanying Notes to Financial Statements |
Table of Contents
Schedule of Investments
May 31, 2015 (Unaudited)
The industry classification of portfolio holdings and other assets less liabilities shown as a percentage of net assets were as follows:
Banks | 17.1% | |||
Insurance | 8.5% | |||
Pharmaceuticals | 7.2% | |||
Automobiles | 7.1% | |||
Oil, Gas & Consumable Fuels | 5.9% | |||
Diversified Telecommunication Services | 4.0% | |||
Food Products | 3.8% | |||
Metals & Mining | 3.6% | |||
Electric Utilities | 3.3% | |||
Chemicals | 3.3% | |||
Trading Companies & Distributors | 2.6% | |||
Household Durables | 2.4% | |||
Airlines | 1.8% | |||
Construction & Engineering | 1.8% | |||
Gas Utilities | 1.5% | |||
Real Estate Investment Trust | 1.5% | |||
Food & Staples Retailing | 1.5% | |||
Multi-Utilities | 1.4% | |||
Auto Components | 1.4% | |||
Road & Rail | 1.4% | |||
Marine | 1.0% | |||
Household Products/Wares | 1.0% | |||
Commercial Services & Supplies | 0.9% | |||
Air Freight & Logistics | 0.9% | |||
Hotels, Restaurants & Leisure | 0.9% | |||
Electronic Equipment, Instruments & Components | 0.9% | |||
Paper & Forest Products | 0.9% | |||
Real Estate Management & Development | 0.9% | |||
Machinery | 0.9% | |||
Specialty Retail | 0.8% | |||
Beverages | 0.8% | |||
Health Care Providers & Services | 0.6% | |||
Media | 0.5% | |||
Professional Services | 0.5% | |||
Capital Markets | 0.4% | |||
Aerospace & Defense | 0.4% | |||
Wireless Telecommunication Services | 0.3% | |||
Technology Hardware, Storage & Peripherals | 0.3% | |||
Diversified Financial Services | 0.3% | |||
Communications Equipment | 0.3% | |||
Biotechnology | 0.3% | |||
Containers & Packaging | 0.3% | |||
Personal Products | 0.3% | |||
IT Services | 0.2% | |||
Industrial Conglomerates | 0.2% | |||
Textiles, Apparel & Luxury Goods | 0.2% | |||
Software | 0.2% | |||
Thrifts & Mortgage Finance | 0.2% | |||
Construction Materials | 0.2% | |||
Semiconductors & Semiconductor Equipment | 0.2% | |||
Energy Equipment & Services | 0.2% | |||
Tobacco | 0.1% | |||
Consumer Finance | 0.1% | |||
Building Products | 0.1% | |||
Leisure Equipment & Products | 0.1% | |||
Life Sciences Tools & Services | 0.1% | |||
Transportation Infrastructure | 0.1% | |||
Real Estate | 0.0% | |||
Repurchase Agreements | 1.6% | |||
Other assets less liabilities | 0.7% | |||
|
| |||
| 100.0% | ||||
|
|
AllianzGI Best Styles U.S. Equity Fund
| Shares | Value | |||||||
| Common Stock—93.2% | ||||||||
| Aerospace & Defense—0.4% | ||||||||
Northrop Grumman Corp. | 1,683 | $267,900 | ||||||
|
| |||||||
| Air Freight & Logistics—0.5% | ||||||||
FedEx Corp. | 1,699 | 294,301 | ||||||
|
| |||||||
| Airlines—1.2% | ||||||||
Alaska Air Group, Inc. | 2,301 | 148,737 | ||||||
American Airlines Group, Inc. | 1,589 | 67,326 | ||||||
Delta Air Lines, Inc. | 4,605 | 197,647 | ||||||
JetBlue Airways Corp. (b) | 2,922 | 58,907 | ||||||
Southwest Airlines Co. | 6,991 | 259,016 | ||||||
|
| |||||||
| 731,633 | ||||||||
|
| |||||||
| Auto Components—1.0% | ||||||||
Delphi Automotive PLC | 1,609 | 139,951 | ||||||
Lear Corp. | 1,620 | 187,952 | ||||||
Magna International, Inc. | 4,732 | 271,949 | ||||||
|
| |||||||
| 599,852 | ||||||||
|
| |||||||
| Automobiles—0.3% | ||||||||
General Motors Co. | 4,510 | 162,225 | ||||||
|
| |||||||
| Banks—6.2% | ||||||||
Bank of America Corp. | 34,514 | 569,481 | ||||||
BB&T Corp. | 1,896 | 74,835 | ||||||
Citigroup, Inc. | 9,810 | 530,525 | ||||||
JPMorgan Chase & Co. | 12,149 | 799,161 | ||||||
KeyCorp | 5,990 | 87,334 | ||||||
PNC Financial Services Group, Inc. | 2,389 | 228,603 | ||||||
SunTrust Banks, Inc. | 3,148 | 134,357 | ||||||
Toronto-Dominion Bank | 2,700 | 117,566 | ||||||
U.S. Bancorp | 2,589 | 111,612 | ||||||
Webster Financial Corp. | 1,854 | 70,248 | ||||||
Wells Fargo & Co. | 17,902 | 1,001,796 | ||||||
|
| |||||||
| 3,725,518 | ||||||||
|
| |||||||
| Beverages—1.3% | ||||||||
Coca-Cola Co. | 3,681 | 150,774 | ||||||
Dr. Pepper Snapple Group, Inc. | 3,788 | 290,312 | ||||||
Molson Coors Brewing Co., Class B | 2,660 | 195,191 | ||||||
PepsiCo, Inc. | 1,390 | 134,038 | ||||||
|
| |||||||
| 770,315 | ||||||||
|
| |||||||
| Biotechnology—2.1% | ||||||||
Amgen, Inc. | 2,586 | 404,088 | ||||||
Biogen, Inc. (b) | 197 | 78,207 | ||||||
Celgene Corp. (b) | 494 | 56,533 | ||||||
Gilead Sciences, Inc. (b) | 5,368 | 602,666 | ||||||
United Therapeutics Corp. (b) | 801 | 147,160 | ||||||
|
| |||||||
| 1,288,654 | ||||||||
|
| |||||||
| Capital Markets—1.2% | ||||||||
Ameriprise Financial, Inc. | 1,045 | 130,196 | ||||||
Goldman Sachs Group, Inc. | 1,540 | 317,533 | ||||||
Legg Mason, Inc. | 645 | 34,417 | ||||||
Morgan Stanley | 6,473 | 247,269 | ||||||
|
| |||||||
| 729,415 | ||||||||
|
| |||||||
| Chemicals—1.0% | ||||||||
CF Industries Holdings, Inc. | 300 | 94,764 | ||||||
Chemtrade Logistics Income Fund UNIT | 2,660 | 44,062 | ||||||
Dow Chemical Co. | 946 | 49,258 | ||||||
Minerals Technologies, Inc. | 960 | 64,618 | ||||||
Mosaic Co. | 1,800 | 82,530 | ||||||
PPG Industries, Inc. | 1,140 | 260,935 | ||||||
|
| |||||||
| 596,167 | ||||||||
|
| |||||||
| Commercial Services & Supplies—0.2% | ||||||||
Pitney Bowes, Inc. | 3,411 | 74,531 | ||||||
Waste Management, Inc. | 1,125 | 55,856 | ||||||
|
| |||||||
| 130,387 | ||||||||
|
| |||||||
| Shares | Value | |||||||
| Communications Equipment—1.9% | ||||||||
ARRIS Group, Inc. (b) | 2,394 | $ | 79,026 | |||||
Brocade Communications Systems, Inc. | 17,186 | 212,505 | ||||||
Cisco Systems, Inc. | 20,477 | 600,181 | ||||||
QUALCOMM, Inc. | 3,598 | 250,708 | ||||||
|
| |||||||
| 1,142,420 | ||||||||
|
| |||||||
| Consumer Finance—1.4% | ||||||||
Capital One Financial Corp. | 5,089 | 425,237 | ||||||
Discover Financial Services | 5,326 | 310,346 | ||||||
Navient Corp. | 7,051 | 135,873 | ||||||
|
| |||||||
| 871,456 | ||||||||
|
| |||||||
| Containers & Packaging—1.1% | ||||||||
Ball Corp. | 1,600 | 113,584 | ||||||
Bemis Co., Inc. | 1,333 | 61,238 | ||||||
CCL Industries, Inc., Class B | 608 | 70,661 | ||||||
MeadWestvaco Corp. | 2,311 | 116,798 | ||||||
Packaging Corp. of America | 3,609 | 249,671 | ||||||
Sonoco Products Co. | 1,848 | 83,197 | ||||||
|
| |||||||
| 695,149 | ||||||||
|
| |||||||
| Diversified Consumer Services—0.1% | ||||||||
Graham Holdings Co., Class B | 72 | 77,112 | ||||||
|
| |||||||
| Diversified Financial Services—2.8% | ||||||||
Berkshire Hathaway, Inc., Class B (b) | 5,670 | 810,810 | ||||||
IntercontinentalExchange Group, Inc. | 1,430 | 338,595 | ||||||
McGraw Hill Financial, Inc. | 1,060 | 109,975 | ||||||
Voya Financial, Inc. | 9,158 | 414,949 | ||||||
|
| |||||||
| 1,674,329 | ||||||||
|
| |||||||
| Diversified Telecommunication Services—1.7% | ||||||||
AT&T, Inc. | 5,722 | 197,638 | ||||||
BCE, Inc. | 2,060 | 90,278 | ||||||
CenturyLink, Inc. | 10,597 | 352,244 | ||||||
Frontier Communications Corp. | 25,995 | 133,874 | ||||||
Verizon Communications, Inc. | 5,193 | 256,742 | ||||||
|
| |||||||
| 1,030,776 | ||||||||
|
| |||||||
| Electric Utilities—2.7% | ||||||||
American Electric Power Co., Inc. | 1,540 | 86,687 | ||||||
Duke Energy Corp. | 3,474 | 263,086 | ||||||
Edison International | 979 | 59,533 | ||||||
Entergy Corp. | 2,610 | 199,587 | ||||||
Eversource Energy | 1,250 | 61,562 | ||||||
NextEra Energy, Inc. | 2,520 | 257,897 | ||||||
Portland General Electric Co. | 3,843 | 134,351 | ||||||
PPL Corp. | 7,600 | 263,796 | ||||||
Westar Energy, Inc. | 2,305 | 84,524 | ||||||
Xcel Energy, Inc. | 7,416 | 252,515 | ||||||
|
| |||||||
| 1,663,538 | ||||||||
|
| |||||||
| Electronic Equipment, Instruments & Components—2.4% | ||||||||
Arrow Electronics, Inc. (b) | 1,729 | 105,106 | ||||||
Avnet, Inc. | 3,845 | 169,218 | ||||||
Benchmark Electronics, Inc. (b) | 1,567 | 36,417 | ||||||
CDW Corp. | 2,956 | 109,668 | ||||||
Corning, Inc. | 15,714 | 328,737 | ||||||
Flextronics International Ltd. (b) | 20,140 | 244,701 | ||||||
Jabil Circuit, Inc. | 3,620 | 88,943 | ||||||
SYNNEX Corp. | 771 | 63,739 | ||||||
TE Connectivity Ltd. | 4,271 | 294,699 | ||||||
|
| |||||||
| 1,441,228 | ||||||||
|
| |||||||
| Energy Equipment & Services—0.4% | ||||||||
Helmerich & Payne, Inc. | 1,240 | 90,508 | ||||||
Schlumberger Ltd. | 1,850 | 167,924 | ||||||
|
| |||||||
| 258,432 | ||||||||
|
| |||||||
| See accompanying Notes to Financial Statements | | May 31, 2015 | | Semiannual Report | 131 |
Table of Contents
Schedule of Investments
May 31, 2015 (Unaudited)
| Shares | Value | |||||||
| Food & Staples Retailing—3.0% | ||||||||
Alimentation Couche-Tard, Inc., Class B | 2,826 | $ | 110,122 | |||||
Costco Wholesale Corp. | 2,610 | 372,160 | ||||||
CVS Health Corp. | 4,045 | 414,127 | ||||||
Empire Co., Ltd. | 2,018 | 144,551 | ||||||
George Weston Ltd. | 1,756 | 142,714 | ||||||
Kroger Co. | 6,280 | 457,184 | ||||||
SpartanNash Co. | 2,231 | 69,741 | ||||||
Wal-Mart Stores, Inc. | 1,369 | 101,676 | ||||||
|
| |||||||
| 1,812,275 | ||||||||
|
| |||||||
| Food Products—1.7% | ||||||||
Archer-Daniels-Midland Co. | 9,591 | 506,884 | ||||||
Cal-Maine Foods, Inc. (a) | 1,800 | 102,042 | ||||||
Pilgrim’s Pride Corp. | 1,890 | 48,346 | ||||||
Sanderson Farms, Inc. | 856 | 69,790 | ||||||
Tyson Foods, Inc., Class A | 7,001 | 297,193 | ||||||
|
| |||||||
| 1,024,255 | ||||||||
|
| |||||||
| Gas Utilities—0.3% | ||||||||
AGL Resources, Inc. | 1,485 | 74,800 | ||||||
Atmos Energy Corp. | 1,560 | 84,271 | ||||||
|
| |||||||
| 159,071 | ||||||||
|
| |||||||
| Health Care Equipment & Supplies—1.2% | ||||||||
Becton Dickinson and Co. | 1,104 | 155,123 | ||||||
Medtronic PLC | 7,225 | 551,412 | ||||||
|
| |||||||
| 706,535 | ||||||||
|
| |||||||
| Health Care Providers & Services—5.5% | ||||||||
Aetna, Inc. | 3,258 | 384,346 | ||||||
Anthem, Inc. | 2,531 | 424,828 | ||||||
Cardinal Health, Inc. | 1,880 | 165,760 | ||||||
Chemed Corp. | 446 | 55,389 | ||||||
Cigna Corp. | 1,947 | 274,196 | ||||||
HealthSouth Corp. | 1,875 | 80,925 | ||||||
Humana, Inc. | 2,190 | 470,083 | ||||||
Laboratory Corp. of America Holdings (b) | 2,310 | 272,464 | ||||||
McKesson Corp. | 564 | 133,798 | ||||||
MEDNAX, Inc. (b) | 822 | 58,510 | ||||||
Quest Diagnostics, Inc. | 3,668 | 275,944 | ||||||
UnitedHealth Group, Inc. | 3,428 | 412,080 | ||||||
Universal Health Services, Inc., Class B | 2,360 | 305,809 | ||||||
|
| |||||||
| 3,314,132 | ||||||||
|
| |||||||
| Hotels, Restaurants & Leisure—1.2% | ||||||||
Brinker International, Inc. | 2,320 | 128,018 | ||||||
Carnival Corp. | 7,120 | 329,869 | ||||||
Cracker Barrel Old Country Store, Inc. | 464 | 65,461 | ||||||
Darden Restaurants, Inc. | 2,040 | 133,702 | ||||||
Marriott Vacations Worldwide Corp. | 917 | 80,953 | ||||||
|
| |||||||
| 738,003 | ||||||||
|
| |||||||
| Household Durables—0.2% | ||||||||
Whirlpool Corp. | 658 | 121,236 | ||||||
|
| |||||||
| Household Products—0.7% | ||||||||
Procter & Gamble Co. | 4,273 | 334,960 | ||||||
Spectrum Brands Holdings, Inc. | 863 | 83,409 | ||||||
|
| |||||||
| 418,369 | ||||||||
|
| |||||||
| Industrial Conglomerates—2.3% | ||||||||
3M Co. | 585 | 93,062 | ||||||
Danaher Corp. | 3,310 | 285,719 | ||||||
General Electric Co. | 36,991 | 1,008,745 | ||||||
|
| |||||||
| 1,387,526 | ||||||||
|
| |||||||
| Insurance—5.0% | ||||||||
ACE Ltd. | 2,782 | 296,227 | ||||||
Allstate Corp. | 4,917 | 331,012 | ||||||
American International Group, Inc. | 5,336 | 312,743 | ||||||
| Shares | Value | |||||||
Aspen Insurance Holdings Ltd. | 3,587 | $ | 166,293 | |||||
Assurant, Inc. | 3,899 | 256,749 | ||||||
Axis Capital Holdings Ltd. | 2,311 | 127,197 | ||||||
Everest Re Group Ltd. | 1,605 | 291,324 | ||||||
Hanover Insurance Group, Inc. | 950 | 67,621 | ||||||
Lincoln National Corp. | 1,480 | 84,375 | ||||||
MetLife, Inc. | 4,664 | 243,741 | ||||||
Montpelier Re Holdings Ltd. | 2,142 | 81,546 | ||||||
PartnerRe Ltd. | 834 | 109,613 | ||||||
Progressive Corp. | 4,140 | 113,188 | ||||||
Prudential Financial, Inc. | 2,175 | 184,027 | ||||||
Travelers Cos., Inc. | 3,729 | 377,076 | ||||||
|
| |||||||
| 3,042,732 | ||||||||
|
| |||||||
| Internet Software & Services—1.8% | ||||||||
Facebook, Inc., Class A (b) | 4,942 | 391,357 | ||||||
Google, Inc., Class A (b) | 524 | 285,747 | ||||||
Google, Inc., Class C (b) | 535 | 284,679 | ||||||
j2 Global, Inc. | 1,185 | 78,696 | ||||||
Yahoo!, Inc. (b) | 1,540 | 66,120 | ||||||
|
| |||||||
| 1,106,599 | ||||||||
|
| |||||||
| IT Services—2.6% | ||||||||
Amdocs Ltd. | 4,244 | 232,783 | ||||||
Broadridge Financial Solutions, Inc. | 6,232 | 337,650 | ||||||
Convergys Corp. | 3,709 | 92,095 | ||||||
DH Corp. | 2,292 | 75,233 | ||||||
Euronet Worldwide, Inc. (b) | 979 | 58,544 | ||||||
International Business Machines Corp. | 680 | 115,362 | ||||||
Jack Henry & Associates, Inc. | 3,260 | 212,161 | ||||||
Visa, Inc., Class A | 1,024 | 70,328 | ||||||
Western Union Co. | 14,050 | 308,398 | ||||||
Xerox Corp. | 8,820 | 100,724 | ||||||
|
| |||||||
| 1,603,278 | ||||||||
|
| |||||||
| Machinery—0.7% | ||||||||
American Railcar Industries, Inc. | 577 | 31,025 | ||||||
PACCAR, Inc. | 1,997 | 126,929 | ||||||
Snap-on, Inc. | 708 | 110,023 | ||||||
Trinity Industries, Inc. | 4,832 | 144,912 | ||||||
|
| |||||||
| 412,889 | ||||||||
|
| |||||||
| Media—3.4% | ||||||||
Cinemark Holdings, Inc. | 3,810 | 154,419 | ||||||
Comcast Corp., Class A | 10,009 | 585,126 | ||||||
Gannett Co., Inc. | 4,010 | 143,518 | ||||||
Interpublic Group of Cos., Inc. | 4,360 | 89,031 | ||||||
Shaw Communications, Inc., Class B | 8,913 | 196,737 | ||||||
Time Warner Cable, Inc. | 713 | 128,975 | ||||||
Time Warner, Inc. | 3,790 | 320,179 | ||||||
Walt Disney Co. | 4,011 | 442,694 | ||||||
|
| |||||||
| 2,060,679 | ||||||||
|
| |||||||
| Metals & Mining—0.3% | ||||||||
Alcoa, Inc. | 13,637 | 170,462 | ||||||
|
| |||||||
| Multi-line Retail—1.7% | ||||||||
Canadian Tire Corp., Ltd., Class A | 1,715 | 177,830 | ||||||
Dillard’s, Inc., Class A | 1,287 | 149,305 | ||||||
Kohl’s Corp. | 588 | 38,508 | ||||||
Macy’s, Inc. | 3,607 | 241,489 | ||||||
Target Corp. | 5,010 | 397,393 | ||||||
|
| |||||||
| 1,004,525 | ||||||||
|
| |||||||
| Multi-Utilities—2.1% | ||||||||
Ameren Corp. | 5,870 | 236,150 | ||||||
CMS Energy Corp. | 6,122 | 209,005 | ||||||
DTE Energy Co. | 2,458 | 194,747 | ||||||
NiSource, Inc. | 1,579 | 74,497 | ||||||
PG&E Corp. | 3,210 | 171,639 | ||||||
Public Service Enterprise Group, Inc. | 4,080 | 173,931 | ||||||
| Shares | Value | |||||||
SCANA Corp. | 4,555 | $ | 242,144 | |||||
|
| |||||||
| 1,302,113 | ||||||||
|
| |||||||
| Oil, Gas & Consumable Fuels—4.8% | ||||||||
Chevron Corp. | 3,898 | 401,494 | ||||||
ConocoPhillips | 1,772 | 112,841 | ||||||
Devon Energy Corp. | 2,237 | 145,897 | ||||||
EOG Resources, Inc. | 1,342 | 119,022 | ||||||
Exxon Mobil Corp. | 11,539 | 983,123 | ||||||
Marathon Petroleum Corp. | 2,240 | 231,750 | ||||||
PBF Energy, Inc., Class A | 3,897 | 104,517 | ||||||
Phillips 66 | 2,849 | 225,413 | ||||||
Tesoro Corp. | 2,270 | 200,895 | ||||||
Valero Energy Corp. | 4,615 | 273,393 | ||||||
Western Refining, Inc. | 1,791 | 78,768 | ||||||
|
| |||||||
| 2,877,113 | ||||||||
|
| |||||||
| Paper & Forest Products—0.2% | ||||||||
Domtar Corp. | 1,516 | 65,521 | ||||||
Western Forest Products, Inc. | 29,679 | 52,504 | ||||||
|
| |||||||
| 118,025 | ||||||||
|
| |||||||
| Personal Products—0.1% | ||||||||
USANA Health Sciences, Inc. (b) | 541 | 69,297 | ||||||
|
| |||||||
| Pharmaceuticals—4.5% | ||||||||
AbbVie, Inc. | 9,274 | 617,555 | ||||||
Actavis PLC (b) | 716 | 219,676 | ||||||
Johnson & Johnson | 7,313 | 732,324 | ||||||
Mallinckrodt PLC (b) | 2,183 | 282,567 | ||||||
Merck & Co., Inc. | 5,319 | 323,874 | ||||||
Mylan NV (b) | 3,109 | 225,807 | ||||||
Pfizer, Inc. | 9,208 | 319,978 | ||||||
|
| |||||||
| 2,721,781 | ||||||||
|
| |||||||
| Professional Services—0.1% | ||||||||
Huron Consulting Group, Inc. (b) | 649 | 41,731 | ||||||
|
| |||||||
| Real Estate Investment Trust—0.3% | ||||||||
Annaly Capital Management, Inc. | 8,734 | 91,183 | ||||||
Starwood Property Trust, Inc. | 4,257 | 101,700 | ||||||
|
| |||||||
| 192,883 | ||||||||
|
| |||||||
| Road & Rail—2.1% | ||||||||
CSX Corp. | 11,890 | 405,211 | ||||||
Norfolk Southern Corp. | 673 | 61,916 | ||||||
Ryder System, Inc. | 2,683 | 245,897 | ||||||
Union Pacific Corp. | 5,151 | 519,787 | ||||||
Werner Enterprises, Inc. | 2,240 | 61,645 | ||||||
|
| |||||||
| 1,294,456 | ||||||||
|
| |||||||
| Semiconductors & Semiconductor Equipment—4.1% | ||||||||
Avago Technologies Ltd. | 850 | 125,859 | ||||||
Broadcom Corp., Class A | 7,700 | 437,745 | ||||||
Cabot Microelectronics Corp. (b) | 2,310 | 106,676 | ||||||
Cirrus Logic, Inc. (b) | 2,560 | 96,640 | ||||||
Cypress Semiconductor Corp. | 5,205 | 71,465 | ||||||
Intel Corp. | 22,988 | 792,166 | ||||||
Lam Research Corp. | 1,348 | 110,873 | ||||||
Micron Technology, Inc. (b) | 11,177 | 312,174 | ||||||
ON Semiconductor Corp. (b) | 23,341 | 309,502 | ||||||
Qorvo, Inc. (b) | 850 | 69,828 | ||||||
Texas Instruments, Inc. | 1,208 | 67,551 | ||||||
|
| |||||||
| 2,500,479 | ||||||||
|
| |||||||
| Software—2.4% | ||||||||
Microsoft Corp. | 20,042 | 939,168 | ||||||
Oracle Corp. | 5,000 | 217,450 | ||||||
Symantec Corp. | 3,610 | 88,896 | ||||||
Synopsys, Inc. (b) | 2,440 | 121,732 | ||||||
Verint Systems, Inc. (b) | 875 | 56,586 | ||||||
|
| |||||||
| 1,423,832 | ||||||||
|
| |||||||
| Specialty Retail—3.3% | ||||||||
AutoNation, Inc. (b) | 1,320 | 82,381 | ||||||
CST Brands, Inc. | 1,940 | 77,154 | ||||||
| 132 | Semiannual Report | | May 31, 2015 | | See accompanying Notes to Financial Statements |
Table of Contents
Schedule of Investments
May 31, 2015 (Unaudited)
| Shares | Value | |||||||
Foot Locker, Inc. | 2,765 | $ | 174,748 | |||||
Home Depot, Inc. | 4,939 | 550,303 | ||||||
L Brands, Inc. | 2,710 | 234,469 | ||||||
Lowe’s Cos., Inc. | 4,928 | 344,862 | ||||||
Murphy USA, Inc. (b) | 2,317 | 134,919 | ||||||
Penske Automotive Group, Inc. | 1,266 | 65,338 | ||||||
Signet Jewelers Ltd. | 1,220 | 157,783 | ||||||
Stage Stores, Inc. | 1,990 | 32,218 | ||||||
Staples, Inc. | 10,180 | 167,614 | ||||||
|
| |||||||
| 2,021,789 | ||||||||
|
| |||||||
| Technology Hardware, Storage & Peripherals—5.2% | ||||||||
Apple, Inc. | 20,167 | 2,627,357 | ||||||
Hewlett-Packard Co. | 9,649 | 322,276 | ||||||
Western Digital Corp. | 1,742 | 169,601 | ||||||
|
| |||||||
| 3,119,234 | ||||||||
|
| |||||||
| Textiles, Apparel & Luxury Goods—0.8% | ||||||||
NIKE, Inc., Class B | 3,980 | 404,646 | ||||||
Skechers U.S.A., Inc., Class A (b) | 979 | 103,647 | ||||||
|
| |||||||
| 508,293 | ||||||||
|
| |||||||
| Thrifts & Mortgage Finance—0.0% | ||||||||
Home Loan Servicing Solutions Ltd. | 6,056 | 4,166 | ||||||
|
| |||||||
| Tobacco—0.9% | ||||||||
Altria Group, Inc. | 9,059 | 463,821 | ||||||
Lorillard, Inc. | 1,280 | 92,774 | ||||||
|
| |||||||
| 556,595 | ||||||||
|
| |||||||
| Trading Companies & Distributors—0.8% | ||||||||
AerCap Holdings NV (b) | 3,984 | 192,188 | ||||||
Air Lease Corp. | 2,465 | 92,758 | ||||||
GATX Corp. | 1,919 | 106,908 | ||||||
United Rentals, Inc. (b) | 875 | 77,796 | ||||||
|
| |||||||
| 469,650 | ||||||||
|
| |||||||
| Total Common Stock (cost—$55,907,728) | 56,454,810 | |||||||
|
| |||||||
| Rights (b)— 0.1% | ||||||||
| Food & Staples Retailing—0.1% | ||||||||
Safeway CVR—Casa Ley | 11,157 | 11,323 | ||||||
Safeway CVR—PDC | 11,157 | 545 | ||||||
|
| |||||||
| Total Rights (cost—$11,827) | 11,868 | |||||||
|
| |||||||
Principal | ||||||||
| Repurchase Agreements—6.0% | ||||||||
State Street Bank and Trust Co., dated 5/29/15, 0.00%, due 6/1/15, proceeds $3,653,000; collateralized by U.S. Treasury Notes, 2.125%, due 9/30/21, valued at $3,727,013 including accrued interest |
| |||||||
(cost-$3,653,000) | $3,653 | 3,653,000 | ||||||
|
| |||||||
| Total Investments (cost—$59,572,555)—99.3% | 60,119,678 | |||||||
|
| |||||||
| Other assets less liabilities—0.7% | 443,022 | |||||||
|
| |||||||
| Net Assets—100.0% | $60,562,700 | |||||||
|
| |||||||
Notes to Schedule of Investments:
(a) Affiliated security.
(b) Non-income producing.
Glossary:
CVR—Contingent Value Rights.
UNIT—More than one class of securities traded together.
AllianzGI China Equity Fund
| Shares | Value | |||||||
| Common Stock—92.2% | ||||||||
| China—81.0% | ||||||||
Baidu, Inc. ADR (e) | 239 | $47,179 | ||||||
Bank of China Ltd., Class H | 678,500 | 448,603 | ||||||
Beijing Enterprises Holdings Ltd. | 45,500 | 400,778 | ||||||
Central China Real Estate Ltd. | 347,000 | 110,093 | ||||||
China Automation Group Ltd. (e) | 1,172,000 | 254,840 | ||||||
China Construction Bank Corp., Class H | 435,000 | 433,189 | ||||||
China Everbright International Ltd. | 194,000 | 369,140 | ||||||
China Life Insurance Co., Ltd., Class H | 153,000 | 733,574 | ||||||
China Merchants Bank Co., Ltd., Class H | 89,500 | 270,455 | ||||||
China Mobile Ltd. | 43,500 | 574,040 | ||||||
China Overseas Land & Investment Ltd. | 70,000 | 251,642 | ||||||
China Pacific Insurance Group Co., Ltd., Class H | 93,400 | 479,255 | ||||||
China Telecom Corp., Ltd., Class H | 580,000 | 392,892 | ||||||
Chongqing Changan Automobile Co., Ltd., Class B | 105,848 | 281,513 | ||||||
Chongqing Rural Commercial Bank Co., Ltd., Class H | 514,000 | 417,148 | ||||||
CSR Corp. Ltd., Class H (c) | 86,000 | 166,373 | ||||||
Digital China Holdings Ltd. (d) | 306,000 | 550,450 | ||||||
Haitong Securities Co., Ltd., Class H | 41,600 | 131,154 | ||||||
Hengan International Group Co., Ltd. | 9,000 | 103,234 | ||||||
Industrial & Commercial Bank of China Ltd., Class H | 495,335 | 428,937 | ||||||
PetroChina Co., Ltd., Class H | 198,000 | 233,336 | ||||||
Ping An Insurance Group Co. of China Ltd., Class H | 38,000 | 556,809 | ||||||
Qingdao Port International Co., Ltd., Class H (a)(e) | 513,000 | 381,095 | ||||||
Qingling Motors Co., Ltd., Class H (d) | 1,068,000 | 422,867 | ||||||
Semiconductor Manufacturing International Corp. (e) | 1,570,000 | 180,896 | ||||||
Sino-Ocean Land Holdings Ltd. | 270,000 | 194,120 | ||||||
Tencent Holdings Ltd. | 34,000 | 679,801 | ||||||
Tiangong International Co., Ltd. | 812,000 | 169,167 | ||||||
Want Want China Holdings Ltd. | 473,000 | 533,149 | ||||||
Weiqiao Textile Co., Class H | 261,000 | 202,642 | ||||||
Zhuzhou CSR Times Electric Co., Ltd., Class H | 27,000 | 220,466 | ||||||
ZTE Corp., Class H | 44,200 | 152,972 | ||||||
|
| |||||||
| 10,771,809 | ||||||||
|
| |||||||
| Hong Kong—11.2% | ||||||||
China State Construction International Holdings Ltd. | 106,000 | 186,353 | ||||||
CSPC Pharmaceutical Group Ltd. | 198,000 | 204,291 | ||||||
Goldpac Group Ltd. | 293,000 | 245,119 | ||||||
Hong Kong Exchanges and Clearing Ltd. | 15,200 | 582,460 | ||||||
Man Yue Technology Holdings Ltd. | 700,000 | 165,444 | ||||||
| See accompanying Notes to Financial Statements | | May 31, 2015 | | Semiannual Report | 133 |
Table of Contents
Schedule of Investments
May 31, 2015 (Unaudited)
| Shares | Value | |||||||
Natural Beauty Bio-Technology Ltd. | 1,210,000 | $ | 109,239 | |||||
|
| |||||||
| 1,492,906 | ||||||||
|
| |||||||
| Total Common Stock (cost—$10,875,247) | 12,264,715 | |||||||
|
| |||||||
| Principal Amount (000s) | ||||||||
| Repurchase Agreements—6.9% | ||||||||
State Street Bank and Trust Co., dated 5/29/15, 0.00%, due 6/1/15, proceeds $920,000; collateralized by U.S. Treasury Notes, 2.125%, due 6/30/21, valued at $941,306 including accrued interest |
| |||||||
(cost—$920,000) | $920 | 920,000 | ||||||
|
| |||||||
| Total Investments (cost—$11,795,247) (b)—99.1% | 13,184,715 | |||||||
|
| |||||||
Other assets less liabilities—0.9% | 119,158 | |||||||
|
| |||||||
| Net Assets—100.0% | $13,303,873 | |||||||
|
| |||||||
Notes to Schedule of Investments:
(a) 144A—Exempt from registration under Rule 144A of the Securities Act of 1933. These securities may be resold in transactions exempt from registration, typically only to qualified institutional buyers. Unless otherwise indicated, these securities are not considered to be illiquid.
(b) Securities with an aggregate value of $10,823,578, representing 81.4% of net assets, were valued utilizing modeling tools provided by a third-party vendor. See Note 1(a) and Note 1(b) in the Notes to Financial Statements.
(c) Fair-Valued—Security with a value of $166,373, representing 1.3% of net assets. See Note 1(a) and Note 1(b) in the Notes to Financial Statements.
(d) Affiliated security.
(e) Non-income producing.
Glossary:
ADR—American Depositary Receipt
The industry classification of portfolio holdings and other assets less liabilities shown as a percentage of net assets were as follows:
Banks | 15.0% | |||
Insurance | 13.3% | |||
Internet Software & Services | 5.5% | |||
Electronic Equipment, Instruments & Components | 5.4% | |||
Automobiles | 5.3% | |||
Diversified Financial Services | 4.4% | |||
Wireless Telecommunication Services | 4.3% | |||
Real Estate Management & Development | 4.2% | |||
Food Products | 4.0% | |||
Machinery | 3.1% | |||
Industrial Conglomerates | 3.0% | |||
Diversified Telecommunication Services | 2.9% | |||
Transportation Infrastructure | 2.9% | |||
Commercial Services & Supplies | 2.8% | |||
Technology Hardware, Storage & Peripherals | 1.8% | |||
Oil, Gas & Consumable Fuels | 1.8% | |||
Electrical Equipment | 1.7% | |||
Personal Products | 1.6% | |||
Pharmaceuticals | 1.5% | |||
Textiles, Apparel & Luxury Goods | 1.5% | |||
Construction & Engineering | 1.4% | |||
Semiconductors & Semiconductor Equipment | 1.4% | |||
Metals & Mining | 1.3% | |||
Communications Equipment | 1.1% | |||
Capital Markets | 1.0% | |||
Repurchase Agreements | 6.9% | |||
Other assets less liabilities | 0.9% | |||
|
| |||
| 100.0% | ||||
|
|
AllianzGI Convertible Fund
| Principal Amount (000s) | Value | |||||||
| Convertible Bonds—80.5% | ||||||||
| Air Freight & Logistics—0.5% | ||||||||
Atlas Air Worldwide Holdings, Inc. (c), |
| |||||||
2.25%, 6/1/22 | $13,535 | $13,475,784 | ||||||
|
| |||||||
| Auto Manufacturers—3.3% | ||||||||
Fiat Chrysler Automobiles NV, |
| |||||||
7.875%, 12/15/16 | 34,459 | 47,488,809 | ||||||
Tesla Motors, Inc., | ||||||||
0.25%, 3/1/19 | 17,055 | 16,649,944 | ||||||
1.50%, 6/1/18 | 8,670 | 17,795,175 | ||||||
|
| |||||||
| 81,933,928 | ||||||||
|
| |||||||
| Biotechnology—8.6% | ||||||||
BioMarin Pharmaceutical, Inc., |
| |||||||
0.75%, 10/15/18 | 10,180 | 15,002,775 | ||||||
1.50%, 10/15/20 | 4,520 | 6,813,900 | ||||||
Emergent Biosolutions, Inc., |
| |||||||
2.875%, 1/15/21 | 16,240 | 19,975,200 | ||||||
Gilead Sciences, Inc., |
| |||||||
1.625%, 5/1/16 | 7,245 | 35,794,864 | ||||||
Illumina, Inc. (a)(b), |
| |||||||
zero coupon, 6/15/19 | 38,815 | 45,049,660 | ||||||
0.50%, 6/15/21 | 1,805 | 2,186,306 | ||||||
Incyte Corp., |
| |||||||
0.375%, 11/15/18 | 9,835 | 21,194,425 | ||||||
Ligand Pharmaceuticals, Inc. (a)(b), |
| |||||||
0.75%, 8/15/19 | 15,605 | 20,549,835 | ||||||
Medicines Co. (a)(b), |
| |||||||
2.50%, 1/15/22 | 11,975 | 13,254,828 | ||||||
Medivation, Inc., |
| |||||||
2.625%, 4/1/17 | 6,810 | 17,518,725 | ||||||
Regeneron Pharmaceuticals, Inc., |
| |||||||
1.875%, 10/1/16 | 3,120 | 19,018,350 | ||||||
|
| |||||||
| 216,358,868 | ||||||||
|
| |||||||
| Chemicals—0.9% | ||||||||
RPM International, Inc., |
| |||||||
2.25%, 12/15/20 | 19,275 | 22,624,031 | ||||||
|
| |||||||
| Commercial Services—4.1% | ||||||||
Euronet Worldwide, Inc. (a)(b), |
| |||||||
1.50%, 10/1/44 | 23,365 | 26,095,785 | ||||||
Huron Consulting Group, Inc. (a)(b), |
| |||||||
1.25%, 10/1/19 | 19,280 | 20,641,650 | ||||||
Live Nation Entertainment, Inc., |
| |||||||
2.50%, 5/15/19 | 25,605 | 28,181,503 | ||||||
Macquarie Infrastructure Corp., |
| |||||||
2.875%, 7/15/19 | 23,600 | 28,275,750 | ||||||
|
| |||||||
| 103,194,688 | ||||||||
|
| |||||||
| Computers—3.2% | ||||||||
Brocade Communications Systems, Inc. (a)(b), |
| |||||||
1.375%, 1/1/20 | 22,920 | 24,366,825 | ||||||
Electronics For Imaging, Inc. (a)(b), |
| |||||||
0.75%, 9/1/19 | 21,520 | 22,542,200 | ||||||
SanDisk Corp., |
| |||||||
1.50%, 8/15/17 | 9,935 | 14,418,169 | ||||||
Spansion LLC, |
| |||||||
2.00%, 9/1/20 | 7,535 | 18,456,040 | ||||||
|
| |||||||
| 79,783,234 | ||||||||
|
| |||||||
| Diversified Financial Services—2.3% | ||||||||
Air Lease Corp., |
| |||||||
3.875%, 12/1/18 | 15,535 | 22,244,178 | ||||||
Cowen Group, Inc., |
| |||||||
3.00%, 3/15/19 | 11,545 | 14,106,547 | ||||||
PRA Group, Inc., |
| |||||||
3.00%, 8/1/20 | 20,595 | 22,551,525 | ||||||
|
| |||||||
| 58,902,250 | ||||||||
|
| |||||||
| 134 | Semiannual Report | | May 31, 2015 | | See accompanying Notes to Financial Statements |
Table of Contents
Schedule of Investments
May 31, 2015 (Unaudited)
| Principal Amount (000s) | Value | |||||||
| Electric Utilities—1.1% | ||||||||
NRG Yield, Inc. (a)(b), |
| |||||||
3.50%, 2/1/19 | $ | 23,520 | $ | 28,341,600 | ||||
|
| |||||||
| Electrical Equipment—0.7% | ||||||||
SunPower Corp. (a)(b), |
| |||||||
0.875%, 6/1/21 | 17,265 | 17,416,069 | ||||||
|
| |||||||
| Energy-Alternate Sources—3.8% | ||||||||
SolarCity Corp. (a)(b), |
| |||||||
1.625%, 11/1/19 | 27,660 | 27,262,388 | ||||||
SunEdison, Inc. (a)(b), | ||||||||
0.25%, 1/15/20 | 31,755 | 38,919,722 | ||||||
2.375%, 4/15/22 | 11,780 | 15,991,350 | ||||||
2.625%, 6/1/23 | 3,695 | 3,831,253 | ||||||
3.375%, 6/1/25 | 9,725 | 10,278,109 | ||||||
|
| |||||||
| 96,282,822 | ||||||||
|
| |||||||
| Health Care Providers & Services—1.5% | ||||||||
Brookdale Senior Living, Inc., |
| |||||||
2.75%, 6/15/18 | 13,990 | 19,568,512 | ||||||
Laboratory Corp. of America Holdings, |
| |||||||
zero coupon, 9/11/21 | 10,650 | 16,846,969 | ||||||
|
| |||||||
| 36,415,481 | ||||||||
|
| |||||||
| Healthcare-Products—4.7% | ||||||||
Cepheid, |
| |||||||
1.25%, 2/1/21 | 17,645 | 19,365,388 | ||||||
Hologic, Inc., |
| |||||||
2.00%, 12/15/37 | 18,080 | 28,589,000 | ||||||
NuVasive, Inc., |
| |||||||
2.75%, 7/1/17 | 17,850 | 23,796,281 | ||||||
Teleflex, Inc., |
| |||||||
3.875%, 8/1/17 | 11,165 | 23,404,631 | ||||||
Wright Medical Group, Inc. (a)(b), |
| |||||||
2.00%, 2/15/20 | 21,370 | 23,360,081 | ||||||
|
| |||||||
| 118,515,381 | ||||||||
|
| |||||||
| Healthcare-Services—1.8% | ||||||||
Anthem, Inc., |
| |||||||
2.75%, 10/15/42 | 6,550 | 14,721,125 | ||||||
Molina Healthcare, Inc., | ||||||||
1.125%, 1/15/20 | 8,800 | 16,093,000 | ||||||
1.625%, 8/15/44 | 10,850 | 14,789,906 | ||||||
|
| |||||||
| 45,604,031 | ||||||||
|
| |||||||
| Holding Companies-Diversified—1.0% | ||||||||
Horizon Pharma Investment Ltd. (a)(b), |
| |||||||
2.50%, 3/15/22 | 19,205 | 26,166,813 | ||||||
|
| |||||||
| Home Builders—0.9% | ||||||||
Lennar Corp. (a)(b), |
| |||||||
3.25%, 11/15/21 | 10,910 | 21,942,738 | ||||||
|
| |||||||
| Insurance—3.4% | ||||||||
AmTrust Financial Services, Inc., |
| |||||||
2.75%, 12/15/44 | 28,803 | 27,074,820 | ||||||
Fidelity National Financial, Inc., |
| |||||||
4.25%, 8/15/18 | 12,335 | 25,595,125 | ||||||
Radian Group, Inc., |
| |||||||
2.25%, 3/1/19 | 19,450 | 33,150,094 | ||||||
|
| |||||||
| 85,820,039 | ||||||||
|
| |||||||
| Internet—6.4% | ||||||||
Ctrip.com International Ltd., |
| |||||||
1.25%, 10/15/18 | 15,290 | 18,892,706 | ||||||
LinkedIn Corp. (a)(b), |
| |||||||
0.50%, 11/1/19 | 11,645 | 11,601,389 | ||||||
Priceline Group, Inc., | ||||||||
0.35%, 6/15/20 | 5,130 | 5,819,344 | ||||||
1.00%, 3/15/18 | 22,735 | 30,720,669 | ||||||
VeriSign, Inc., |
| |||||||
4.136%, 8/15/37 | 10,550 | 19,952,687 | ||||||
Web.com Group, Inc., |
| |||||||
1.00%, 8/15/18 | 20,440 | 20,197,275 | ||||||
| Principal Amount (000s) | Value | |||||||
WebMD Health Corp., |
| |||||||
1.50%, 12/1/20 | $ | 14,875 | $ | 16,520,547 | ||||
Yahoo!, Inc., |
| |||||||
zero coupon, 12/1/18 | 34,645 | 37,546,519 | ||||||
|
| |||||||
| 161,251,136 | ||||||||
|
| |||||||
| Leisure Time—1.6% | ||||||||
Jarden Corp., | ||||||||
1.125%, 3/15/34 | 21,340 | 25,381,262 | ||||||
1.875%, 9/15/18 | 8,010 | 13,787,213 | ||||||
|
| |||||||
| 39,168,475 | ||||||||
|
| |||||||
| Media—1.0% | ||||||||
Liberty Media Corp., |
| |||||||
1.375%, 10/15/23 | 23,865 | 23,775,506 | ||||||
|
| |||||||
| Oil, Gas & Consumable Fuels—2.3% | ||||||||
Cheniere Energy, Inc., |
| |||||||
4.25%, 3/15/45 | 29,365 | 23,638,825 | ||||||
Energy XXI Ltd., |
| |||||||
3.00%, 12/15/18 | 18,150 | 6,171,000 | ||||||
Whiting Petroleum Corp. (a)(b), |
| |||||||
1.25%, 4/1/20 | 24,785 | 27,263,500 | ||||||
|
| |||||||
| 57,073,325 | ||||||||
|
| |||||||
| Pharmaceuticals—4.1% | ||||||||
Clovis Oncology, Inc. (a)(b), |
| |||||||
2.50%, 9/15/21 | 4,730 | 7,860,669 | ||||||
Depomed, Inc., |
| |||||||
2.50%, 9/1/21 | 12,715 | 16,068,581 | ||||||
Jazz Investments I Ltd. (a)(b), |
| |||||||
1.875%, 8/15/21 | 18,590 | 22,249,906 | ||||||
Mylan, Inc., |
| |||||||
3.75%, 9/15/15 | 5,220 | 28,426,163 | ||||||
Omnicare, Inc., |
| |||||||
3.50%, 2/15/44 | 20,420 | 29,468,612 | ||||||
|
| |||||||
| 104,073,931 | ||||||||
|
| |||||||
| Retail—1.1% | ||||||||
Restoration Hardware Holdings, Inc. (a)(b), |
| |||||||
zero coupon, 6/15/19 | 26,975 | 27,531,359 | ||||||
|
| |||||||
| Semiconductors—8.5% | ||||||||
Intel Corp., |
| |||||||
3.25%, 8/1/39 | 26,740 | 45,474,846 | ||||||
Lam Research Corp., |
| |||||||
1.25%, 5/15/18 | 32,665 | 47,425,497 | ||||||
Microchip Technology, Inc., | ||||||||
1.625%, 2/15/25 (a)(b) | 23,565 | 24,640,153 | ||||||
2.125%, 12/15/37 | 4,065 | 8,056,322 | ||||||
Micron Technology, Inc., |
| |||||||
3.00%, 11/15/43 | 32,220 | 36,408,600 | ||||||
NVIDIA Corp., |
| |||||||
1.00%, 12/1/18 | 9,195 | 11,223,647 | ||||||
NXP Semiconductors NV (a)(b), |
| |||||||
1.00%, 12/1/19 | 19,765 | 25,064,491 | ||||||
Xilinx, Inc., |
| |||||||
2.625%, 6/15/17 | 9,045 | 14,975,128 | ||||||
|
| |||||||
| 213,268,684 | ||||||||
|
| |||||||
| Software—9.9% | ||||||||
Akamai Technologies, Inc., |
| |||||||
zero coupon, 2/15/19 | 27,090 | 29,968,448 | ||||||
Dealertrack Technologies, Inc., |
| |||||||
1.50%, 3/15/17 | 14,770 | 18,342,494 | ||||||
FireEye, Inc. (b)(c), | ||||||||
1.00%, 6/1/35 | 6,580 | 6,917,225 | ||||||
1.625%, 6/1/35 | 6,580 | 6,921,338 | ||||||
inContact, Inc. (a)(b), |
| |||||||
2.50%, 4/1/22 | 9,570 | 9,426,450 | ||||||
Medidata Solutions, Inc., |
| |||||||
1.00%, 8/1/18 | 10,025 | 12,349,547 | ||||||
Red Hat, Inc. (a)(b), |
| |||||||
0.25%, 10/1/19 | 19,660 | 24,808,462 | ||||||
| Principal Amount (000s) | Value | |||||||
Salesforce.com, Inc., |
| |||||||
0.25%, 4/1/18 | $ | 33,595 | $ | 42,098,734 | ||||
ServiceNow, Inc., |
| |||||||
zero coupon, 11/1/18 | 19,500 | 23,534,062 | ||||||
Synchronoss Technologies, Inc., |
| |||||||
0.75%, 8/15/19 | 20,655 | 23,288,513 | ||||||
Take-Two Interactive Software, Inc., |
| |||||||
1.00%, 7/1/18 | 14,690 | 20,382,375 | ||||||
Verint Systems, Inc., |
| |||||||
1.50%, 6/1/21 | 25,555 | 30,522,253 | ||||||
|
| |||||||
| 248,559,901 | ||||||||
|
| |||||||
| Telecommunications—3.2% | ||||||||
Ciena Corp. (a)(b), |
| |||||||
3.75%, 10/15/18 | 14,560 | 20,374,900 | ||||||
Gogo, Inc. (a)(b), |
| |||||||
3.75%, 3/1/20 | 17,020 | 17,913,635 | ||||||
InterDigital, Inc. (a)(b), |
| |||||||
1.50%, 3/1/20 | 19,250 | 20,332,813 | ||||||
Palo Alto Networks, Inc. (a)(b), |
| |||||||
zero coupon, 7/1/19 | 13,490 | 21,558,706 | ||||||
|
| |||||||
| 80,180,054 | ||||||||
|
| |||||||
| Transportation—0.6% | ||||||||
Greenbrier Cos., Inc., |
| |||||||
3.50%, 4/1/18 | 8,540 | 13,712,038 | ||||||
|
| |||||||
| Total Convertible Bonds (cost—$1,726,795,983) | 2,021,372,166 | |||||||
|
| |||||||
| Shares | ||||||||
| Convertible Preferred Stock—16.7% | ||||||||
| Banks—1.5% | ||||||||
Bank of America Corp., Ser. L (d), |
| |||||||
7.25% | 16,285 | 18,654,467 | ||||||
Wells Fargo & Co., Ser. L (d), |
| |||||||
7.50% | 15,925 | 19,250,618 | ||||||
|
| |||||||
| 37,905,085 | ||||||||
|
| |||||||
| Electric Utilities—0.6% | ||||||||
Exelon Corp., |
| |||||||
6.50%, 6/1/17 | 290,170 | 14,018,113 | ||||||
|
| |||||||
| Food Products—1.2% | ||||||||
Tyson Foods, Inc., |
| |||||||
4.75%, 7/15/17 | 587,300 | 30,521,981 | ||||||
|
| |||||||
| Health Care Providers & Services—0.7% | ||||||||
Amsurg Corp., Ser. A-1, |
| |||||||
5.25%, 7/1/17 | 137,270 | 18,342,704 | ||||||
|
| |||||||
| Healthcare-Services—2.4% | ||||||||
Anthem, Inc., |
| |||||||
5.25%, 5/1/18 | 750,055 | 40,832,994 | ||||||
Kindred Healthcare, Inc., |
| |||||||
7.50%, 12/1/17 | 16,935 | 19,645,277 | ||||||
|
| |||||||
| 60,478,271 | ||||||||
|
| |||||||
| Independent Power Producers & Energy Traders—0.8% | ||||||||
Dynegy, Inc., Ser. A, |
| |||||||
5.375%, 11/1/17 | 181,565 | 20,331,649 | ||||||
|
| |||||||
| Machinery—1.2% | ||||||||
Stanley Black & Decker, Inc., | ||||||||
4.75%, 11/17/15 | 199,545 | 28,534,935 | ||||||
6.25%, 11/17/16, UNIT | 16,640 | 1,946,713 | ||||||
|
| |||||||
| 30,481,648 | ||||||||
|
| |||||||
| Metals & Mining—0.4% | ||||||||
Alcoa, Inc., Ser. 1, |
| |||||||
5.375%, 10/1/17 | 207,640 | 9,102,938 | ||||||
|
| |||||||
| See accompanying Notes to Financial Statements | | May 31, 2015 | | Semiannual Report | 135 |
Table of Contents
Schedule of Investments
May 31, 2015 (Unaudited)
| Shares | Value | |||||||
| Oil, Gas & Consumable Fuels—2.4% | ||||||||
Chesapeake Energy Corp. (a)(b)(d), |
| |||||||
5.75% | 32,330 | $ | 26,631,837 | |||||
Sanchez Energy Corp., Ser. B (d), |
| |||||||
6.50% | 354,605 | 12,535,287 | ||||||
Southwestern Energy Co., Ser. B, |
| |||||||
6.25% | 383,290 | 21,176,773 | ||||||
|
| |||||||
| 60,343,897 | ||||||||
|
| |||||||
| Pharmaceuticals—2.8% | ||||||||
Actavis PLC, Ser. A, |
| |||||||
5.50%, 3/1/18 | 65,770 | 69,714,227 | ||||||
|
| |||||||
| Real Estate Investment Trust—1.5% | ||||||||
American Tower Corp., | ||||||||
5.25%, 5/15/17, Ser. A | 246,435 | 25,345,840 | ||||||
5.50%, 2/15/18 | 125,020 | 12,639,522 | ||||||
|
| |||||||
| 37,985,362 | ||||||||
|
| |||||||
| Wireless Telecommunication Services—1.2% | ||||||||
T-Mobile U.S., Inc., |
| |||||||
5.50%, 12/15/17 | 445,785 | 30,656,634 | ||||||
|
| |||||||
| Total Convertible Preferred Stock (cost—$406,547,196) | 419,882,509 | |||||||
|
| |||||||
| Principal Amount (000s) | ||||||||
| Repurchase Agreements—3.3% | ||||||||
State Street Bank and Trust Co., dated 5/29/15, 0.00%, due 6/1/15, proceeds $83,492,000; collateralized by U.S. Treasury Notes, 2.00%, due 8/31/21, valued at $85,162,406 including accrued interest |
| |||||||
(cost—$83,492,000) | $83,492 | 83,492,000 | ||||||
|
| |||||||
| Total Investments (cost—$2,216,835,179)—100.5% | 2,524,746,675 | |||||||
|
| |||||||
| Liabilities in excess of other assets—(0.5)% | (13,744,200 | ) | ||||||
|
| |||||||
| Net Assets—100.0% | $2,511,002,475 | |||||||
|
| |||||||
Notes to Schedule of Investments:
(a) Private Placement—Restricted as to resale and may not have a readily available market. Securities with an aggregate value of $675,455,482, representing 26.9% of net assets.
(b) 144A—Exempt from registration under Rule 144A of the Securities Act of 1933. These securities may be resold in transactions exempt from registration, typically only to qualified institutional buyers. Unless otherwise indicated, these securities are not considered to be illiquid.
(c) When-issued or delayed-delivery. To be settled/delivered after May 31, 2015.
(d) Perpetual maturity. The date shown, if any, is the next call date.
Glossary:
UNIT—More than one class of securities traded together.
AllianzGI Emerging Markets Consumer Fund
| Shares | Value | |||||||
| Common Stock—93.8% | ||||||||
| Australia—0.5% | ||||||||
CSL Ltd. | 949 | $67,617 | ||||||
|
| |||||||
| Brazil—5.6% | ||||||||
BB Seguridade Participacoes S.A. | 17,100 | 178,980 | ||||||
Cielo S.A. | 16,320 | 204,877 | ||||||
JBS S.A. | 12,400 | 60,710 | ||||||
Porto Seguro S.A. | 13,500 | 153,418 | ||||||
Qualicorp S.A. | 21,700 | 129,398 | ||||||
|
| |||||||
| 727,383 | ||||||||
|
| |||||||
| China—22.4% | ||||||||
ANTA Sports Products Ltd. | 47,000 | 108,868 | ||||||
China Everbright Bank Co., Ltd., Class H | 288,000 | 181,150 | ||||||
China Mobile Ltd. | 14,000 | 184,748 | ||||||
China Southern Airlines Co., Ltd., Class H | 370,000 | 366,025 | ||||||
Dongfeng Motor Group Co., Ltd., Class H | 76,000 | 123,576 | ||||||
Great Wall Motor Co., Ltd., Class H | 69,000 | 441,583 | ||||||
Haitong Securities Co., Ltd., Class H | 30,800 | 97,104 | ||||||
Hengan International Group Co., Ltd. | 26,000 | 298,232 | ||||||
Lenovo Group Ltd. | 134,000 | 212,944 | ||||||
Shanghai Pharmaceuticals Holding Co., Ltd., Class H | 136,100 | 454,111 | ||||||
Sihuan Pharmaceutical Holdings Group Ltd. (b) | 549,000 | 233,658 | ||||||
Skyworth Digital Holdings Ltd. | 106,000 | 100,963 | ||||||
Tencent Holdings Ltd. | 5,500 | 109,968 | ||||||
|
| |||||||
| 2,912,930 | ||||||||
|
| |||||||
| France—3.9% | ||||||||
Hermes International | 589 | 229,948 | ||||||
Sanofi | 2,751 | 270,919 | ||||||
|
| |||||||
| 500,867 | ||||||||
|
| |||||||
| Hong Kong—4.2% | ||||||||
Hang Seng Bank Ltd. | 7,400 | 148,143 | ||||||
VTech Holdings Ltd. | 1,600 | 21,064 | ||||||
Yue Yuen Industrial Holdings Ltd. | 108,500 | 373,198 | ||||||
|
| |||||||
| 542,405 | ||||||||
|
| |||||||
| India—5.7% | ||||||||
Dr Reddy’s Laboratories Ltd. ADR | 6,400 | 354,752 | ||||||
HDFC Bank Ltd. ADR | 400 | 23,848 | ||||||
Tata Motors Ltd. ADR | 9,500 | 363,850 | ||||||
|
| |||||||
| 742,450 | ||||||||
|
| |||||||
| Indonesia—0.7% | ||||||||
Bank Central Asia Tbk PT | 31,600 | 33,724 | ||||||
Gudang Garam Tbk PT | 16,200 | 57,640 | ||||||
|
| |||||||
| 91,364 | ||||||||
|
| |||||||
| Japan—1.9% | ||||||||
Yamaha Motor Co., Ltd. | 9,900 | 246,627 | ||||||
|
| |||||||
| Korea (Republic of)—17.4% | ||||||||
Amorepacific Corp. | 769 | 279,354 | ||||||
AMOREPACIFIC Group | 760 | 119,614 | ||||||
Com2uS Corp. (c) | 495 | 59,982 | ||||||
Kia Motors Corp. | 6,511 | 279,420 | ||||||
Korean Air Lines Co., Ltd. (c) | 3,989 | 145,595 | ||||||
LG Electronics, Inc. | 3,657 | 182,204 | ||||||
LG Uplus Corp. | 11,791 | 98,968 | ||||||
Samsung Card Co., Ltd. | 7,880 | 296,709 | ||||||
Samsung Electronics Co., Ltd. | 527 | 619,949 | ||||||
| Shares | Value | |||||||
SL Corp. | 5,408 | $ | 93,512 | |||||
Sungwoo Hitech Co., Ltd. | 9,524 | 87,811 | ||||||
|
| |||||||
| 2,263,118 | ||||||||
|
| |||||||
| Malaysia—0.8% | ||||||||
AirAsia Bhd. | 45,100 | 26,942 | ||||||
British American Tobacco Malaysia Bhd. | 4,700 | 79,437 | ||||||
|
| |||||||
| 106,379 | ||||||||
|
| |||||||
| Mexico—1.4% | ||||||||
America Movil S.A.B. de C.V., Ser. L | 46,900 | 49,279 | ||||||
Gruma S.A.B. de C.V., Class B | 5,400 | 71,005 | ||||||
Kimberly-Clark de Mexico S.A.B. de C.V., Class A | 29,000 | 65,631 | ||||||
|
| |||||||
| 185,915 | ||||||||
|
| |||||||
| Philippines—0.4% | ||||||||
Universal Robina Corp. | 13,670 | 58,384 | ||||||
|
| |||||||
| Poland—0.6% | ||||||||
Orange Polska S.A. | 26,932 | 74,700 | ||||||
|
| |||||||
| Russian Federation—0.5% | ||||||||
Mobile Telesystems OJSC ADR | 5,800 | 60,668 | ||||||
|
| |||||||
| Singapore—1.4% | ||||||||
Singapore Airlines Ltd. | 21,800 | 183,509 | ||||||
|
| |||||||
| South Africa—6.5% | ||||||||
AVI Ltd. | 7,969 | 53,087 | ||||||
FirstRand Ltd. | 86,597 | 371,057 | ||||||
Netcare Ltd. | 67,497 | 216,289 | ||||||
Telkom S.A. SOC Ltd. (c) | 17,177 | 98,134 | ||||||
Vodacom Group Ltd. | 10,027 | 110,394 | ||||||
|
| |||||||
| 848,961 | ||||||||
|
| |||||||
| Switzerland—1.1% | ||||||||
Novartis AG | 1,401 | 143,787 | ||||||
|
| |||||||
| Taiwan—10.8% | ||||||||
Asustek Computer, Inc. | 10,000 | 98,304 | ||||||
Cathay Financial Holding Co., Ltd. | 124,000 | 221,029 | ||||||
Chicony Electronics Co., Ltd. | 8,000 | 22,297 | ||||||
Chunghwa Telecom Co., Ltd. | 64,000 | 202,446 | ||||||
CTBC Financial Holding Co., Ltd. | 162,000 | 122,809 | ||||||
Eva Airways Corp. (c) | 175,000 | 129,910 | ||||||
Fubon Financial Holding Co., Ltd. | 136,000 | 278,902 | ||||||
Pou Chen Corp. | 211,000 | 302,052 | ||||||
Taishin Financial Holding Co., Ltd. | 58,000 | 25,091 | ||||||
|
| |||||||
| 1,402,840 | ||||||||
|
| |||||||
| Thailand—1.1% | ||||||||
Thai Union Frozen Products PCL NVDR | 229,100 | 139,091 | ||||||
|
| |||||||
| Turkey—3.3% | ||||||||
Dogus Otomotiv Servis ve Ticaret AS | 14,459 | 91,718 | ||||||
Turk Hava Yollari AO (c) | 99,629 | 337,610 | ||||||
|
| |||||||
| 429,328 | ||||||||
|
| |||||||
| United States—3.6% | ||||||||
Lear Corp. | 4,000 | 464,080 | ||||||
|
| |||||||
Total Common Stock (cost—$11,856,815) | 12,192,403 | |||||||
|
| |||||||
| 136 | Semiannual Report | | May 31, 2015 | | See accompanying Notes to Financial Statements |
Table of Contents
Schedule of Investments
May 31, 2015 (Unaudited)
| Shares | Value | |||||||
| Equity-Linked Securities—3.2% | ||||||||
| India—3.2% | ||||||||
CLSA Global Markets PTE Ltd., | ||||||||
Apollo Tyres, Ltd., | 25,888 | $ | 77,146 | |||||
Aurobindo Pharma Ltd., expires 10/7/19 | 3,528 | 76,099 | ||||||
LIC Housing Finance Ltd., expires 10/7/19 | 10,726 | 70,577 | ||||||
Lupin Ltd., | 2,808 | 80,814 | ||||||
Sun Pharmaceutical Industries Ltd., | 6,969 | 105,720 | ||||||
|
| |||||||
Total Equity-Linked Securities (cost—$405,571) |
| 410,356 | ||||||
|
| |||||||
| Exchange-Traded Funds—0.5% | ||||||||
iShares MSCI India (cost—$63,530) | 2,000 | 61,120 | ||||||
|
| |||||||
| Principal Amount (000s) | ||||||||
| Repurchase Agreements—1.4% | ||||||||
State Street Bank and Trust Co., dated 5/29/15, 0.00%, due 6/1/15, proceeds $183,000; collateralized by U.S. Treasury Notes, 2.125%, due 9/30/21, valued at $189,163 including accrued interest |
| |||||||
(cost—$183,000) | $183 | 183,000 | ||||||
|
| |||||||
Total Investments (cost—$12,508,916) (a)—98.9% |
| 12,846,879 | ||||||
|
| |||||||
| Other assets less liabilities—1.1% | 143,760 | |||||||
|
| |||||||
| Net Assets—100.0% | $12,990,639 | |||||||
|
| |||||||
Notes to Schedule of Investments:
(a) Securities with an aggregate value of $9,642,439, representing 74.2% of net assets, were valued utilizing modeling tools provided by a third-party vendor. See Note 1(a) and Note 1(b) in the Notes to Financial Statements.
(b) Fair-Valued—Security with a value of $233,658, representing 1.8% of net assets. See Note 1(a) and Note 1(b) in the Notes to Financial Statements.
(c) Non-income producing.
Glossary:
ADR—American Depositary Receipt
MSCI—Morgan Stanley Capital International
NVDR—Non-Voting Depository Receipt
The industry classification of portfolio holdings and other assets less liabilities shown as a percentage of net assets were as follows:
Automobiles | 11.2% | |||
Pharmaceuticals | 9.7% | |||
Airlines | 9.1% | |||
Textiles, Apparel & Luxury Goods | 7.8% | |||
Technology Hardware, Storage & Peripherals | 7.4% | |||
Health Care Providers & Services | 6.2% | |||
Auto Components | 5.6% | |||
Personal Products | 5.3% | |||
Diversified Financial Services | 5.0% | |||
Banks | 4.7% | |||
Insurance | 4.3% | |||
Diversified Telecommunication Services | 3.7% | |||
Wireless Telecommunication Services | 3.1% | |||
Food Products | 2.8% | |||
Consumer Finance | 2.3% | |||
Household Durables | 2.2% | |||
IT Services | 1.6% | |||
Tobacco | 1.0% | |||
Internet Software & Services | 0.8% | |||
Capital Markets | 0.8% | |||
Distributors | 0.7% | |||
Biotechnology | 0.5% | |||
Household Products | 0.5% | |||
Exchange-Traded Funds | 0.5% | |||
Software | 0.5% | |||
Communications Equipment | 0.2% | |||
Repurchase Agreements | 1.4% | |||
Other assets less liabilities | 1.1% | |||
|
| |||
| 100.0% | ||||
|
|
AllianzGI Emerging Markets Debt Fund
| Principal Amount (000s) | Value | |||||||
| Corporate Bonds & Notes—62.0% | ||||||||
| Argentina—1.3% | ||||||||
YPF S.A. (a)(b), |
| |||||||
8.50%, 7/28/25 | $400 | $409,880 | ||||||
|
| |||||||
| Brazil—6.5% | ||||||||
Banco ABC Brasil S.A. (a)(b), |
| |||||||
7.875%, 4/8/20 | 200 | 209,500 | ||||||
CIMPOR Financial Operations BV (a)(b), |
| |||||||
5.75%, 7/17/24 | 226 | 202,270 | ||||||
Marfrig Holding Europe BV, |
| |||||||
9.875%, 7/24/17 | 300 | 309,375 | ||||||
Minerva Luxembourg S.A. (a)(b), |
| |||||||
7.75%, 1/31/23 | 210 | 217,088 | ||||||
OAS Finance Ltd. (a)(b)(d), |
| |||||||
8.00%, 7/2/21 | 206 | 37,080 | ||||||
Odebrecht Finance Ltd., |
| |||||||
7.125%, 6/26/42 | 300 | 277,875 | ||||||
Odebrecht Offshore Drilling Finance Ltd., |
| |||||||
6.625%, 10/1/23 | 190 | 170,440 | ||||||
6.75%, 10/1/23 | 279 | 252,857 | ||||||
Petrobras Global Finance BV, |
| |||||||
3.50%, 2/6/17 | 300 | 299,490 | ||||||
|
| |||||||
| 1,975,975 | ||||||||
|
| |||||||
| Chile—3.1% | ||||||||
Banco del Estado de Chile, |
| |||||||
3.875%, 2/8/22 | 257 | 268,485 | ||||||
Banco Santander Chile (a)(b), |
| |||||||
3.875%, 9/20/22 | 220 | 225,864 | ||||||
Corp. Nacional del Cobre de Chile, |
| |||||||
4.50%, 8/13/23 | 200 | 215,641 | ||||||
Embotelladora Andina S.A. (a)(b), |
| |||||||
5.00%, 10/1/23 | 207 | 226,002 | ||||||
|
| |||||||
| 935,992 | ||||||||
|
| |||||||
| China—7.6% | ||||||||
Big Will Investments Ltd., |
| |||||||
10.875%, 4/29/16 | 200 | 207,500 | ||||||
Central Plaza Development Ltd. (e), |
| |||||||
7.125%, 12/2/19 | 200 | 205,500 | ||||||
Century Master Investment Co., Ltd., |
| |||||||
4.75%, 9/19/18 | 200 | 211,666 | ||||||
Chinalco Finance Holdings Ltd., |
| |||||||
3.625%, 12/11/19 | 200 | 205,460 | ||||||
CIFI Holdings Group Co., Ltd., |
| |||||||
12.25%, 4/15/18 | 200 | 219,000 | ||||||
CITIC Ltd., |
| |||||||
6.875%, 1/21/18 | 200 | 222,654 | ||||||
CRCC Yupeng Ltd. (e), |
| |||||||
3.95%, 8/1/19 | 202 | 207,050 | ||||||
Logan Property Holdings Co., Ltd., |
| |||||||
11.25%, 6/4/19 | 200 | 205,089 | ||||||
Poly Real Estate Finance Ltd., |
| |||||||
4.50%, 8/6/18 | 200 | 208,136 | ||||||
Sino-Ocean Land Treasure Finance I Ltd., |
| |||||||
4.625%, 7/30/19 | 200 | 205,430 | ||||||
Sunac China Holdings Ltd., |
| |||||||
12.50%, 10/16/17 | 200 | 216,000 | ||||||
|
| |||||||
| 2,313,485 | ||||||||
|
| |||||||
| Colombia—1.0% | ||||||||
Avianca Holdings S.A., |
| |||||||
8.375%, 5/10/20 | 300 | 306,750 | ||||||
|
| |||||||
| Croatia—0.7% | ||||||||
Hrvatska Elektroprivreda, |
| |||||||
6.00%, 11/9/17 | 214 | 225,342 | ||||||
|
| |||||||
| El Salvador—0.7% | ||||||||
AES El Salvador Trust II (a)(b), |
| |||||||
6.75%, 3/28/23 | 210 | 202,650 | ||||||
|
| |||||||
| See accompanying Notes to Financial Statements | | May 31, 2015 | | Semiannual Report | 137 |
Table of Contents
Schedule of Investments
May 31, 2015 (Unaudited)
| Principal Amount (000s) | Value | |||||||
| Guatemala—0.7% | ||||||||
Comcel Trust via Comunicaciones Celulares S.A. (a)(b), |
| |||||||
6.875%, 2/6/24 | $ | 203 | $ | 218,225 | ||||
|
| |||||||
| Hong Kong—3.5% | ||||||||
China CITIC Bank International Ltd. (f), |
| |||||||
3.875%, 9/28/22 | 200 | 202,160 | ||||||
CLP Power HK Finance Ltd. (e), |
| |||||||
4.25%, 11/7/19 | 206 | 212,180 | ||||||
FPT Finance Ltd., |
| |||||||
6.375%, 9/28/20 | 200 | 222,500 | ||||||
PCCW Capital No 4 Ltd., |
| |||||||
5.75%, 4/17/22 | 200 | 219,488 | ||||||
Texhong Textile Group Ltd., |
| |||||||
7.625%, 1/19/16 | 200 | 205,000 | ||||||
|
| |||||||
| 1,061,328 | ||||||||
|
| |||||||
| India—4.8% | ||||||||
Bank of Baroda, |
| |||||||
4.875%, 7/23/19 | 204 | 219,413 | ||||||
Export-Import Bank of India, |
| |||||||
4.00%, 1/14/23 | 409 | 420,094 | ||||||
GCX Ltd., |
| |||||||
7.00%, 8/1/19 | 205 | 210,821 | ||||||
Indian Oil Corp. Ltd., |
| |||||||
5.625%, 8/2/21 | 204 | 227,727 | ||||||
Rolta Americas LLC, |
| |||||||
8.875%, 7/24/19 | 203 | 177,625 | ||||||
State Bank of India, |
| |||||||
4.125%, 8/1/17 | 200 | 208,715 | ||||||
|
| |||||||
| 1,464,395 | ||||||||
|
| |||||||
| Indonesia—3.8% | ||||||||
Gajah Tunggal Tbk PT, |
| |||||||
7.75%, 2/6/18 | 200 | 182,000 | ||||||
Indo Energy Finance II BV, |
| |||||||
6.375%, 1/24/23 | 256 | 174,080 | ||||||
Majapahit Holding BV, |
| |||||||
7.875%, 6/29/37 | 236 | 284,380 | ||||||
Ottawa Holdings PTE Ltd., |
| |||||||
5.875%, 5/16/18 | 250 | 207,500 | ||||||
Pertamina Persero PT, |
| |||||||
4.875%, 5/3/22 | 304 | 314,260 | ||||||
|
| |||||||
| 1,162,220 | ||||||||
|
| |||||||
| Israel—1.1% | ||||||||
Delek & Avner Tamar Bond Ltd. (a)(b), |
| |||||||
2.803%, 12/30/16 | 150 | 150,750 | ||||||
4.435%, 12/30/20 | 200 | 204,000 | ||||||
|
| |||||||
| 354,750 | ||||||||
|
| |||||||
| Jamaica—1.0% | ||||||||
Digicel Group Ltd., |
| |||||||
8.25%, 9/30/20 | 300 | 312,600 | ||||||
|
| |||||||
| Korea (Republic of)—0.7% | ||||||||
Woori Bank, |
| |||||||
4.75%, 4/30/24 | 204 | 216,063 | ||||||
|
| |||||||
| Luxembourg—1.1% | ||||||||
Millicom International Cellular S.A. (a)(b), |
| |||||||
6.00%, 3/15/25 | 350 | 353,948 | ||||||
|
| |||||||
| Malaysia—1.7% | ||||||||
Malayan Banking Bhd. (f), |
| |||||||
3.25%, 9/20/22 | 200 | 202,441 | ||||||
Petronas Capital Ltd., |
| |||||||
4.50%, 3/18/45 | 300 | 305,756 | ||||||
|
| |||||||
| 508,197 | ||||||||
|
| |||||||
| Mexico—5.3% | ||||||||
Alfa S.A.B. de C.V. (a)(b), |
| |||||||
6.875%, 3/25/44 | 211 | 226,825 | ||||||
| Principal Amount (000s) | Value | |||||||||
BBVA Bancomer S.A., |
| |||||||||
7.25%, 4/22/20 | $ | 192 | $ | 217,440 | ||||||
Coca-Cola Femsa S.A.B. de C.V., |
| |||||||||
3.875%, 11/26/23 | 194 | 205,264 | ||||||||
Comision Federal de Electricidad, |
| |||||||||
4.875%, 1/15/24 | 221 | 232,602 | ||||||||
Gruma S.A.B. de C.V. (a)(b), |
| |||||||||
4.875%, 12/1/24 | 200 | 211,500 | ||||||||
Petroleos Mexicanos, |
| |||||||||
4.50%, 1/23/26 | 200 | 201,000 | ||||||||
Sixsigma Networks Mexico S.A. de C.V. (a)(b), |
| |||||||||
8.25%, 11/7/21 | 300 | 320,250 | ||||||||
|
| |||||||||
| 1,614,881 | ||||||||||
|
| |||||||||
| Morocco—0.7% | ||||||||||
OCP S.A., | 200 | 218,290 | ||||||||
|
| |||||||||
| Nigeria—2.2% | ||||||||||
FBN Finance Co. BV, (converts to FRN on 7/23/19) (a)(b), |
| |||||||||
8.00%, 7/23/21 | 251 | 235,313 | ||||||||
GTB Finance BV (a)(b), | 201 | 194,508 | ||||||||
Zenith Bank PLC (a)(b), | 250 | 241,562 | ||||||||
|
| |||||||||
| 671,383 | ||||||||||
|
| |||||||||
| Peru—1.5% | ||||||||||
Abengoa Transmision Sur S.A., | 206 | 232,265 | ||||||||
Corp. Financiera de Desarrollo S.A., |
| |||||||||
4.75%, 2/8/22 | 207 | 220,662 | ||||||||
|
| |||||||||
| 452,927 | ||||||||||
|
| |||||||||
| Qatar—1.0% | ||||||||||
Ras Laffan Liquefied Natural Gas Co., Ltd. III (a)(b), |
| |||||||||
6.332%, 9/30/27 | 250 | 295,937 | ||||||||
|
| |||||||||
| Russian Federation—4.5% | ||||||||||
Alfa Bank OJSC Via Alfa Bond Issuance PLC (a)(b), |
| |||||||||
7.50%, 9/26/19 | 200 | 200,500 | ||||||||
Gazprom Neft OAO Via GPN Capital S.A. (a)(b), |
| |||||||||
6.00%, 11/27/23 | 203 | 193,865 | ||||||||
Gazprom OAO Via Gaz Capital S.A. (a)(b), |
| |||||||||
4.30%, 11/12/15 | 200 | 201,150 | ||||||||
Lukoil International Finance BV (a)(b), |
| |||||||||
6.656%, 6/7/22 | 385 | 407,137 | ||||||||
Sberbank of Russia Via SB Capital S.A. (a)(b), |
| |||||||||
5.25%, 5/23/23 | 224 | 189,280 | ||||||||
TMK OAO Via TMK Capital S.A. (a)(b), |
| |||||||||
6.75%, 4/3/20 | 203 | 180,670 | ||||||||
|
| |||||||||
| 1,372,602 | ||||||||||
|
| |||||||||
| South Africa—2.0% | ||||||||||
Gold Fields Orogen Holding BVI Ltd. (a)(b), |
| |||||||||
4.875%, 10/7/20 | 200 | 181,250 | ||||||||
MTN Mauritius Investments Ltd. (a)(b), |
| |||||||||
4.755%, 11/11/24 | 200 | 204,500 | ||||||||
Myriad International Holdings BV (a)(b), |
| |||||||||
6.00%, 7/18/20 | 200 | 222,000 | ||||||||
|
| |||||||||
| 607,750 | ||||||||||
|
| |||||||||
| Thailand—0.7% | ||||||||||
PTT Exploration & Production PCL, |
| |||||||||
4.875%, 6/18/19 | 203 | 206,045 | ||||||||
|
| |||||||||
| Turkey—3.1% | ||||||||||
Akbank TAS (a)(b), | 250 | 253,750 | ||||||||
5.125%, 3/31/25 | 200 | 194,250 | ||||||||
Global Liman Isletmeleri (a)(b), |
| |||||||||
8.125%, 11/14/21 | 300 | 286,500 | ||||||||
| Principal Amount (000s) | Value | |||||||||
Yasar Holdings AS (a)(b), | $ | 200 | $ | 213,500 | ||||||
|
| |||||||||
| 948,000 | ||||||||||
|
| |||||||||
| United Arab Emirates—0.4% | ||||||||||
Dolphin Energy Ltd. (a)(b), | 114 | 125,142 | ||||||||
|
| |||||||||
| United Kingdom—0.6% | ||||||||||
Genel Energy Finance PLC (b), |
| |||||||||
7.50%, 5/14/19 | 200 | 189,000 | ||||||||
|
| |||||||||
| Uruguay—0.7% | ||||||||||
Navios South American Logistics, Inc. (a)(b), |
| |||||||||
7.25%, 5/1/22 | 213 | 206,876 | ||||||||
|
| |||||||||
| Total Corporate Bonds & Notes (cost—$19,095,982) | 18,930,633 | |||||||||
|
| |||||||||
| Sovereign Debt Obligations—35.1% | ||||||||||
| Argentina—2.8% | ||||||||||
Argentina Boden Bonds, |
| |||||||||
7.00%, 10/3/15 | 500 | 492,361 | ||||||||
Argentina Bonar Bonds, |
| |||||||||
7.00%, 4/17/17 | 350 | 341,231 | ||||||||
|
| |||||||||
| 833,592 | ||||||||||
|
| |||||||||
| Brazil—0.8% | ||||||||||
Brazilian Government International Bond, |
| |||||||||
4.25%, 1/7/25 | 250 | 246,312 | ||||||||
|
| |||||||||
| Colombia—1.7% | ||||||||||
Colombia Government International Bond, |
| |||||||||
2.625%, 3/15/23 | 316 | 294,670 | ||||||||
5.625%, 2/26/44 | 207 | 224,077 | ||||||||
|
| |||||||||
| 518,747 | ||||||||||
|
| |||||||||
| Croatia—1.0% | ||||||||||
Croatia Government International Bond, |
| |||||||||
5.50%, 4/4/23 | 276 | 292,112 | ||||||||
|
| |||||||||
| Dominican Republic—1.5% | ||||||||||
Dominican Republic International Bond, |
| |||||||||
5.50%, 1/27/25 | �� | 200 | 204,000 | |||||||
6.85%, 1/27/45 (a)(b) | 250 | 260,000 | ||||||||
|
| |||||||||
| 464,000 | ||||||||||
|
| |||||||||
| Ecuador—1.1% | ||||||||||
Ecuador Government International Bond (a)(b), |
| |||||||||
10.50%, 3/24/20 | 300 | 316,500 | ||||||||
|
| |||||||||
| El Salvador—0.7% | ||||||||||
El Salvador Government International Bond, |
| |||||||||
5.875%, 1/30/25 | 210 | 204,225 | ||||||||
|
| |||||||||
| Hungary—2.3% | ||||||||||
Hungary Government International Bond, |
| |||||||||
5.375%, 2/21/23 | 196 | 217,659 | ||||||||
6.25%, 1/29/20 | 185 | 211,033 | ||||||||
7.625%, 3/29/41 | 200 | 282,000 | ||||||||
|
| |||||||||
| 710,692 | ||||||||||
|
| |||||||||
| Indonesia—0.9% | ||||||||||
Indonesia Government International Bond (a)(b), |
| |||||||||
4.625%, 4/15/43 | 300 | 280,500 | ||||||||
|
| |||||||||
| Ivory Coast—1.0% | ||||||||||
Ivory Coast Government International Bond (a)(b), |
| |||||||||
6.375%, 3/3/28 | 300 | 300,750 | ||||||||
|
| |||||||||
| Kazakhstan—0.8% | ||||||||||
Kazakhstan Government International Bond, |
| |||||||||
3.875%, 10/14/24 | 250 | 241,563 | ||||||||
|
| |||||||||
| 138 | Semiannual Report | | May 31, 2015 | | See accompanying Notes to Financial Statements |
Table of Contents
Schedule of Investments
May 31, 2015 (Unaudited)
| Principal Amount (000s) | Value | |||||||||||
| Kenya—0.8% | ||||||||||||
Kenya Government International Bond, |
| |||||||||||
6.875%, 6/24/24 | $ | 241 | $ | 253,472 | ||||||||
|
| |||||||||||
| Mexico—3.0% | ||||||||||||
Mexican Bonos, |
| |||||||||||
10.00%, 12/5/24 | MXN | 8,500 | 711,964 | |||||||||
Mexico Government International Bond, |
| |||||||||||
3.60%, 1/30/25 | $ | 200 | 201,600 | |||||||||
|
| |||||||||||
| 913,564 | ||||||||||||
|
| |||||||||||
| Morocco—1.0% | ||||||||||||
Morocco Government International Bond, |
| |||||||||||
3.50%, 6/19/24 | € | 250 | 286,964 | |||||||||
|
| |||||||||||
| Namibia—0.7% | ||||||||||||
Namibia International Bonds (a)(b), |
| |||||||||||
5.50%, 11/3/21 | $ | 200 | 219,500 | |||||||||
|
| |||||||||||
| Panama—0.8% | ||||||||||||
Panama Government International Bond, |
| |||||||||||
3.75%, 3/16/25 | 250 | 252,187 | ||||||||||
|
| |||||||||||
| Paraguay—1.6% | ||||||||||||
Republic of Paraguay, |
| |||||||||||
6.10%, 8/11/44 | 457 | 493,560 | ||||||||||
|
| |||||||||||
| Peru—2.7% | ||||||||||||
Peruvian Government International Bond, |
| |||||||||||
5.625%, 11/18/50 | 350 | 413,000 | ||||||||||
5.70%, 8/12/24 (a)(b) | PEN | 900 | 277,256 | |||||||||
6.90%, 8/12/37 | 425 | 133,529 | ||||||||||
|
| |||||||||||
| 823,785 | ||||||||||||
|
| |||||||||||
| Romania—1.4% | ||||||||||||
Romanian Government International Bond, |
| |||||||||||
4.375%, 8/22/23 | $ | 116 | 123,158 | |||||||||
6.125%, 1/22/44 | 250 | 304,925 | ||||||||||
|
| |||||||||||
| 428,083 | ||||||||||||
|
| |||||||||||
| Serbia—1.0% | ||||||||||||
Republic of Serbia, |
| |||||||||||
5.875%, 12/3/18 | 292 | 310,980 | ||||||||||
|
| |||||||||||
| South Africa—3.5% | ||||||||||||
South Africa Government Bond, |
| |||||||||||
6.50%, 2/28/41 | ZAR | 7,650 | 484,772 | |||||||||
6.75%, 3/31/21 | 3,500 | 274,616 | ||||||||||
South Africa Government International Bond, |
| |||||||||||
5.375%, 7/24/44 | $ | 300 | 313,211 | |||||||||
|
| |||||||||||
| 1,072,599 | ||||||||||||
|
| |||||||||||
| Sri Lanka—0.8% | ||||||||||||
Republic of Sri Lanka (b)(c), |
| |||||||||||
6.125%, 6/3/25 | 250 | 248,125 | ||||||||||
|
| |||||||||||
| Tunisia—1.0% | ||||||||||||
Banque Centrale de Tunisie S.A. (a)(b), |
| |||||||||||
5.75%, 1/30/25 | 300 | 310,500 | ||||||||||
|
| |||||||||||
| United Arab Emirates—0.9% | ||||||||||||
IPIC GMTN Ltd. (a)(b), |
| |||||||||||
5.00%, 11/15/20 | 253 | 283,044 | ||||||||||
|
| |||||||||||
| Uruguay—0.7% | ||||||||||||
Uruguay Government International Bond, |
| |||||||||||
4.50%, 8/14/24 | 197 | 211,283 | ||||||||||
|
| |||||||||||
| Zambia—0.6% | ||||||||||||
Zambia Government International Bond, |
| |||||||||||
5.375%, 9/20/22 | 200 | 185,000 | ||||||||||
|
| |||||||||||
| Total Sovereign Debt Obligations (cost—$10,808,854) | 10,701,639 | |||||||||||
|
| |||||||||||
| Principal Amount (000s) | Value | |||||||||
| Repurchase Agreements—2.0% | ||||||||||
State Street Bank and Trust Co., dated 5/29/15, 0.00%, due 6/1/15, proceeds $599,000; collateralized by U.S. Treasury Notes, 2.125%, due 9/30/21, valued at $613,500 including accrued interest |
| |||||||||
(cost—$599,000) | $ | 599 | $ | 599,000 | ||||||
|
| |||||||||
| Total Investments (cost—$30,503,836)—99.1% | 30,231,272 | |||||||||
|
| |||||||||
| Other assets less liabilities—0.9% | 285,820 | |||||||||
|
| |||||||||
| Net Assets—100.0% | $30,517,092 | |||||||||
|
| |||||||||
Notes to Schedule of Investments:
(a) Private Placement—Restricted as to resale and may not have a readily available market. Securities with an aggregate value of $9,891,572, representing 32.4% of net assets.
(b) 144A—Exempt from registration under Rule 144A of the Securities Act of 1933. These securities may be resold in transactions exempt from registration, typically only to qualified institutional buyers. Unless otherwise indicated, these securities are not considered to be illiquid.
(c) When-issued or delayed-delivery. To be settled/delivered after May 31, 2015.
(d) In default.
(e) Perpetual maturity. The date shown, if any, is the next call date. For Corporate Bonds & Notes the interest rate is fixed until the first call date and variable thereafter.
(f) Variable or Floating Rate Security—Securities with an interest rate that changes periodically. The interest rate disclosed reflects the rate in effect on May 31, 2015.
Glossary:
€—Euro
FRN—Floating Rate Note
MXN—Mexican Peso
PEN—Peruvian Nuevo Sol
ZAR—South African Rand
The industry classification of portfolio holdings and other assets less liabilities shown as a percentage of net assets were as follows:
Sovereign Debt Obligations | 35.1% | |||
Banks | 12.8% | |||
Oil, Gas & Consumable Fuels | 13.6% | |||
Telecommunications | 5.9% | |||
Food & Beverage | 4.6% | |||
Electric Utilities | 4.6% | |||
Real Estate | 4.1% | |||
Airlines | 2.4% | |||
Diversified Financial Services | 2.1% | |||
Mining | 1.9% | |||
Engineering & Construction | 1.7% | |||
Holding Companies-Diversified | 1.4% | |||
Commercial Services | 1.0% | |||
Iron/Steel | 0.7% | |||
Media | 0.7% | |||
Chemicals | 0.7% | |||
Transportation | 0.7% | |||
Apparel & Textiles | 0.7% | |||
Auto Components | 0.6% | |||
Metal Fabricate/Hardware | 0.6% | |||
Software | 0.6% | |||
Coal | 0.6% | |||
Repurchase Agreements | 2.0% | |||
Other assets less liabilities | 0.9% | |||
|
| |||
| 100.0% | ||||
|
|
| See accompanying Notes to Financial Statements | | May 31, 2015 | | Semiannual Report | 139 |
Table of Contents
Schedule of Investments
May 31, 2015 (Unaudited)
AllianzGI Emerging Markets Small-Cap Fund
| Shares | Value | |||||||
| Common Stock—89.7% | ||||||||
| Brazil—0.3% | ||||||||
Eternit S.A. | 5,900 | $5,111 | ||||||
Ser Educacional S.A. | 2,200 | 9,480 | ||||||
|
| |||||||
| 14,591 | ||||||||
|
| |||||||
| China—17.9% | ||||||||
361 Degrees International Ltd. | 148,000 | 57,588 | ||||||
AMVIG Holdings Ltd. | 18,000 | 9,797 | ||||||
Anhui Expressway Co., Ltd., Class H | 54,000 | 52,626 | ||||||
Asia Cement China Holdings Corp. | 13,000 | 6,764 | ||||||
Central China Securities Co., Ltd., Class H | 55,000 | 54,041 | ||||||
China Everbright Ltd. | 8,000 | 31,525 | ||||||
China Galaxy Securities Co., Ltd., Class H | 17,500 | 29,642 | ||||||
China Lilang Ltd. | 35,000 | 42,020 | ||||||
China Southern Airlines Co., Ltd., Class H | 64,000 | 63,312 | ||||||
Comba Telecom Systems Holdings Ltd. | 22,000 | 7,782 | ||||||
Far East Horizon Ltd. | 124,000 | 120,291 | ||||||
Hopewell Highway Infrastructure Ltd. | 29,500 | 14,673 | ||||||
Jingwei Textile Machinery, Class H | 16,000 | 25,464 | ||||||
Kingboard Laminates Holdings Ltd. | 159,500 | 81,021 | ||||||
Peak Sport Products Co., Ltd. | 86,000 | 28,125 | ||||||
Shandong Chenming Paper Holdings Ltd., Class H | 13,000 | 10,077 | ||||||
Sichuan Expressway Co., Ltd., Class H | 54,000 | 27,764 | ||||||
Skyworth Digital Holdings Ltd. | 152,000 | 144,778 | ||||||
TPV Technology Ltd. | 20,000 | 4,940 | ||||||
Weiqiao Textile Co., Class H | 93,500 | 72,594 | ||||||
Yuexiu Real Estate Investment Trust REIT | 56,000 | 31,471 | ||||||
Zijin Mining Group Co., Ltd., Class H | 44,000 | 19,772 | ||||||
|
| |||||||
| 936,067 | ||||||||
|
| |||||||
| Greece—0.2% | ||||||||
Mytilineos Holdings S.A. (c) | 1,542 | 9,997 | ||||||
|
| |||||||
| Hong Kong—5.1% | ||||||||
Champion REIT | 238,000 | 136,287 | ||||||
Pico Far East Holdings Ltd. | 60,000 | 17,411 | ||||||
Regal Real Estate Investment Trust REIT | 127,000 | 37,107 | ||||||
Soundwill Holdings Ltd. | 3,500 | 7,051 | ||||||
Sunlight Real Estate Investment Trust REIT | 31,000 | 15,657 | ||||||
Texwinca Holdings Ltd. | 22,000 | 21,329 | ||||||
VST Holdings Ltd. | 78,000 | 31,543 | ||||||
|
| |||||||
| 266,385 | ||||||||
|
| |||||||
| Indonesia—0.1% | ||||||||
Kawasan Industri Jababeka Tbk PT | 336,400 | 6,935 | ||||||
|
| |||||||
| Korea (Republic of)—20.1% | ||||||||
Daewon San Up Co., Ltd. | 919 | 7,322 | ||||||
Dongwon F&B Co., Ltd. | 71 | 21,352 | ||||||
e-LITECOM Co., Ltd. | 3,751 | 79,830 | ||||||
HS R&A Co., Ltd. | 389 | 13,296 | ||||||
Humax Co., Ltd. | 1,848 | 32,349 | ||||||
Huvis Corp. | 595 | 5,758 | ||||||
Hyundai Elevator Co., Ltd. (c) | 106 | 7,451 | ||||||
IsuPetasys Co., Ltd. | 5,594 | 33,462 | ||||||
Jeil Pharmaceutical Co. | 656 | 22,717 | ||||||
KC Green Holdings Co., Ltd. | 12,591 | 138,690 | ||||||
KG Eco Technology Service Co., Ltd. | 2,624 | 15,001 | ||||||
| Shares | Value | |||||||
Korea Electric Terminal Co., Ltd. | 489 | $ | 39,976 | |||||
Korea Petro Chemical Ind | 332 | 49,787 | ||||||
Korea United Pharm, Inc. | 4,613 | 94,133 | ||||||
Korean Air Lines Co., Ltd. (c) | 280 | 10,220 | ||||||
Kumkang Kind Co., Ltd. | 156 | 12,025 | ||||||
Kwang Dong Pharmaceutical Co., Ltd. | 4,435 | 72,595 | ||||||
NICE Holdings Co., Ltd. | 3,117 | 59,704 | ||||||
NICE Information & Telecommunication, Inc. | 2,073 | 67,214 | ||||||
S&T Dynamics Co., Ltd. | 898 | 11,523 | ||||||
S&T Motiv Co., Ltd. | 636 | 37,546 | ||||||
Saeron Automotive Corp. | 687 | 6,602 | ||||||
Samjin Pharmaceutical Co., Ltd. | 961 | 23,093 | ||||||
Samyang Holdings Corp. | 78 | 7,591 | ||||||
Sebang Co., Ltd. | 512 | 9,563 | ||||||
Sungwoo Hitech Co., Ltd. | 3,524 | 32,491 | ||||||
Tovis Co., Ltd. | 840 | 11,961 | ||||||
Ubiquoss, Inc. | 583 | 6,405 | ||||||
Unid Co., Ltd. | 128 | 7,369 | ||||||
Woongjin Thinkbig Co., Ltd. (c) | 4,951 | 48,890 | ||||||
Yearimdang Publishing Co., Ltd. | 11,566 | 65,530 | ||||||
|
| |||||||
| 1,051,446 | ||||||||
|
| |||||||
| Malaysia—2.8% | ||||||||
Sunway Real Estate Investment Trust REIT | 185,500 | 81,466 | ||||||
Top Glove Corp. Bhd. | 40,000 | 59,138 | ||||||
Unisem M Bhd. | 9,000 | 5,935 | ||||||
|
| |||||||
| 146,539 | ||||||||
|
| |||||||
| Mexico—0.8% | ||||||||
Credito Real S.A.B. de C.V. SOFOM ER | 17,600 | 40,757 | ||||||
|
| |||||||
| Philippines—1.5% | ||||||||
Cebu Air, Inc. | 41,810 | 80,647 | ||||||
|
| |||||||
| Poland—3.8% | ||||||||
Asseco Poland S.A. | 2,368 | 37,962 | ||||||
Enea S.A. | 16,504 | 73,816 | ||||||
Tauron Polska Energia S.A. | 69,156 | 87,906 | ||||||
|
| |||||||
| 199,684 | ||||||||
|
| |||||||
| Russian Federation—0.9% | ||||||||
Acron JSC (b) | 897 | 37,836 | ||||||
Magnitogorsck Iron & Steel Works OJSC (b) | 36,347 | 10,177 | ||||||
|
| |||||||
| 48,013 | ||||||||
|
| |||||||
| Singapore—0.7% | ||||||||
Yangzijiang Shipbuilding Holdings Ltd. | 33,700 | 36,091 | ||||||
|
| |||||||
| South Africa—8.5% | ||||||||
Aeci Ltd. | 3,592 | 35,944 | ||||||
Cashbuild Ltd. | 2,610 | 61,249 | ||||||
Clover Industries Ltd. | 20,150 | 31,089 | ||||||
Emira Property Fund REIT | 29,048 | 41,139 | ||||||
Fountainhead Property Trust REIT | 45,231 | 32,476 | ||||||
Growthpoint Properties Ltd. REIT | 31,320 | 66,533 | ||||||
Net 1 UEPS Technologies, Inc. (c) | 8,700 | 126,150 | ||||||
Octodec Investments Ltd. | 2,321 | 4,666 | ||||||
Raubex Group Ltd. | 4,339 | 8,214 | ||||||
Redefine Properties Ltd. REIT | 42,943 | 37,836 | ||||||
|
| |||||||
| 445,296 | ||||||||
|
| |||||||
| Taiwan—20.2% | ||||||||
Ability Enterprise Co., Ltd. | 69,000 | 41,831 | ||||||
China Airlines Ltd. (c) | 258,000 | 126,087 | ||||||
Coretronic Corp. | 37,000 | 47,551 | ||||||
| Shares | Value | |||||||
Elite Material Co., Ltd. | 36,000 | $ | 62,114 | |||||
FLEXium Interconnect, Inc. | 2,000 | 7,295 | ||||||
Foxconn Technology Co., Ltd. | 23,000 | 80,736 | ||||||
Gamania Digital Entertainment Co., Ltd. | 46,000 | 57,974 | ||||||
Gold Circuit Electronics Ltd. (c) | 74,000 | 39,873 | ||||||
Grand Pacific Petrochemical | 98,000 | 60,771 | ||||||
Highwealth Construction Corp. | 30,000 | 74,971 | ||||||
Lealea Enterprise Co., Ltd. (c) | 22,000 | 7,382 | ||||||
Pou Chen Corp. | 54,000 | 77,302 | ||||||
Sampo Corp. | 119,000 | 52,257 | ||||||
Taiwan Sogo Shin Kong SEC | 10,000 | 13,342 | ||||||
Topco Scientific Co., Ltd. | 19,000 | 37,483 | ||||||
Topoint Technology Co., Ltd. | 44,000 | 36,817 | ||||||
TPK Holding Co., Ltd. | 1,000 | 6,632 | ||||||
Tripod Technology Corp. | 34,000 | 62,894 | ||||||
Unitech Printed Circuit Board Corp. | 95,000 | 39,536 | ||||||
Visual Photonics Epitaxy Co., Ltd. | 38,000 | 54,565 | ||||||
Win Semiconductors Corp. | 28,000 | 43,866 | ||||||
Youngtek Electronics Corp. | 12,000 | 24,934 | ||||||
Zinwell Corp. | 5,000 | 4,976 | ||||||
|
| |||||||
| 1,061,189 | ||||||||
|
| |||||||
| Thailand—4.4% | ||||||||
Advanced Information Technology PCL NVDR | 42,900 | 39,852 | ||||||
AP Thailand PCL NVDR | 306,100 | 63,582 | ||||||
Asia Plus Group Holdings Securities PCL NVDR | 391,100 | 46,639 | ||||||
Major Cineplex Group PCL NVDR | 62,600 | 62,721 | ||||||
Modernform Group PCL NVDR | 18,600 | 5,391 | ||||||
Somboon Advance Technology PCL NVDR | 13,200 | 7,475 | ||||||
Thai Vegetable Oil PCL NVDR | 11,300 | 7,424 | ||||||
|
| |||||||
| 233,084 | ||||||||
|
| |||||||
| Turkey—2.4% | ||||||||
Dogus Otomotiv Servis ve Ticaret AS | 13,899 | 88,166 | ||||||
Mardin Cimento Sanayii ve Ticaret AS | 14,554 | 23,341 | ||||||
Trakya Cam Sanayii AS | 10,892 | 12,682 | ||||||
|
| |||||||
| 124,189 | ||||||||
|
| |||||||
| Total Common Stock (cost—$4,247,285) | 4,700,910 | |||||||
|
| |||||||
| Exchange-Traded Funds—4.8% | ||||||||
iShares MSCI India Small-Cap | 5,845 | 202,646 | ||||||
PowerShares India Portfolio | 2,125 | 46,261 | ||||||
|
| |||||||
| Total Exchange-Traded Funds (cost—$251,412) | 248,907 | |||||||
|
| |||||||
| Equity-Linked Securities—2.0% | ||||||||
| India—2.0% | ||||||||
CLSA Global Markets PTE Ltd., | ||||||||
Apollo Tyres, Ltd., expires 10/7/19 | 13,078 | 38,973 | ||||||
LIC Housing Finance Ltd., expires 10/7/19 | 10,026 | 65,971 | ||||||
|
| |||||||
| Total Equity-Linked Securities (cost—$119,063) | 104,944 | |||||||
|
| |||||||
| 140 | Semiannual Report | | May 31, 2015 | | See accompanying Notes to Financial Statements |
Table of Contents
Schedule of Investments
May 31, 2015 (Unaudited)
| Shares | Value | |||||||
| Preferred Stock—1.2% | ||||||||
| Brazil—1.2% | ||||||||
Suzano Papel e Celulose S.A., Class A | 11,800 | $ | 61,772 | |||||
|
| |||||||
Total Investments (cost—$4,676,391) (a)—97.7% |
| 5,116,533 | ||||||
|
| |||||||
Other assets less liabilities—2.3% | 121,867 | |||||||
|
| |||||||
| Net Assets—100.0% | $5,238,400 | |||||||
|
| |||||||
Notes to Schedule of Investments:
(a) Securities with an aggregate value of $3,482,682, representing 66.5% of net assets, were valued utilizing modeling tools provided by a third-party vendor. See Note 1(a) and Note 1(b) in the Notes to Financial Statements.
(b) Fair-Valued—Securities with an aggregate value of $48,013, representing 0.9% of net assets. See Note 1(a) and Note 1(b) in the Notes to Financial Statements.
(c) Non-income producing.
Glossary:
MSCI—Morgan Stanley Capital International
NVDR—Non-Voting Depository Receipt
REIT—Real Estate Investment Trust
The industry classification of portfolio holdings and other assets less liabilities shown as a percentage of net assets were as follows:
Real Estate Investment Trust | 9.3% | |||
Electronic Equipment, Instruments & Components | 8.7% | |||
Textiles, Apparel & Luxury Goods | 5.9% | |||
Airlines | 5.3% | |||
Exchange-Traded Funds | 4.8% | |||
Semiconductors & Semiconductor Equipment | 4.7% | |||
Household Durables | 4.7% | |||
IT Services | 4.5% | |||
Pharmaceuticals | 4.1% | |||
Machinery | 4.1% | |||
Media | 3.7% | |||
Chemicals | 3.7% | |||
Diversified Financial Services | 3.4% | |||
Capital Markets | 3.1% | |||
Electric Utilities | 3.1% | |||
Real Estate Management & Development | 2.8% | |||
Auto Components | 2.6% | |||
Transportation Infrastructure | 2.0% | |||
Software | 1.8% | |||
Distributors | 1.7% | |||
Technology Hardware, Storage & Peripherals | 1.6% | |||
Paper & Forest Products | 1.4% | |||
Food Products | 1.3% | |||
Banks | 1.3% | |||
Specialty Retail | 1.2% | |||
Health Care Equipment & Supplies | 1.1% | |||
Metals & Mining | 1.0% | |||
Communications Equipment | 1.0% | |||
Consumer Finance | 0.8% | |||
Electrical Equipment | 0.8% | |||
Construction Materials | 0.7% | |||
Independent Power Producers & Energy Traders | 0.3% | |||
Commercial Services & Supplies | 0.3% | |||
Building Products | 0.2% | |||
Aerospace & Defense | 0.2% | |||
Containers & Packaging | 0.2% | |||
Diversified Consumer Services | 0.2% | |||
Construction & Engineering | 0.1% | |||
Other assets less liabilities | 2.3% | |||
|
| |||
| 100.0% | ||||
|
|
AllianzGI Europe Equity Dividend Fund
| Shares | Value | |||||||
| Common Stock—96.1% | ||||||||
| Austria—0.3% | ||||||||
Oesterreichische Post AG | 180 | $8,882 | ||||||
|
| |||||||
| Belgium—3.1% | ||||||||
bpost S.A. (c) | 2,640 | 76,206 | ||||||
EVS Broadcast Equipment S.A. (c) | 780 | 24,815 | ||||||
|
| |||||||
| 101,021 | ||||||||
|
| |||||||
| Finland—2.0% | ||||||||
Nokian Renkaat Oyj | 2,040 | 65,826 | ||||||
|
| |||||||
| France—14.7% | ||||||||
Bouygues S.A. | 1,360 | 53,489 | ||||||
Coface S.A. (c) | 3,180 | 35,649 | ||||||
GDF Suez | 3,230 | 65,109 | ||||||
Rexel S.A. | 2,250 | 41,211 | ||||||
SCOR SE | 3,055 | 104,586 | ||||||
SES S.A. | 1,870 | 66,169 | ||||||
Total S.A. | 2,350 | 118,594 | ||||||
|
| |||||||
| 484,807 | ||||||||
|
| |||||||
| Germany—8.7% | ||||||||
Drillisch AG (c) | 1,540 | 71,662 | ||||||
Freenet AG (c) | 2,930 | 96,508 | ||||||
Muenchener Rueckversicherungs-Gesellschaft AG in Muenchen | 650 | 120,110 | ||||||
|
| |||||||
| 288,280 | ||||||||
|
| |||||||
| Italy—1.8% | ||||||||
MARR SpA (c) | 1,420 | 26,196 | ||||||
Snam SpA | 6,530 | 32,343 | ||||||
|
| |||||||
| 58,539 | ||||||||
|
| |||||||
| Netherlands—3.5% | ||||||||
Royal Dutch Shell PLC, Class A | 3,830 | 114,200 | ||||||
|
| |||||||
| Norway—6.4% | ||||||||
Statoil ASA | 5,880 | 109,783 | ||||||
Telenor ASA | 2,770 | 62,714 | ||||||
TGS Nopec Geophysical Co. ASA | 1,580 | 39,836 | ||||||
|
| |||||||
| 212,333 | ||||||||
|
| |||||||
| Poland—1.5% | ||||||||
Energa S.A. | 7,810 | 47,811 | ||||||
|
| |||||||
| Portugal—1.1% | ||||||||
CTT-Correios de Portugal S.A. (c) | 3,440 | 34,701 | ||||||
|
| |||||||
| Spain—5.7% | ||||||||
Cia de Distribucion Integral Logista Holdings S.A. (c) | 3,488 | 72,499 | ||||||
Enagas S.A. | 2,120 | 60,932 | ||||||
Mapfre S.A. | 15,780 | 56,223 | ||||||
|
| |||||||
| 189,654 | ||||||||
|
| |||||||
| Sweden—5.0% | ||||||||
NCC AB, Class B (c) | 1,980 | 61,616 | ||||||
Nordea Bank AB | 8,040 | 104,701 | ||||||
|
| |||||||
| 166,317 | ||||||||
|
| |||||||
| Switzerland—3.6% | ||||||||
Cembra Money Bank AG (c) | 747 | 47,562 | ||||||
Sunrise Communications Group AG (a)(c)(d) | 876 | 72,346 | ||||||
|
| |||||||
| 119,908 | ||||||||
|
| |||||||
| United Kingdom—38.7% | ||||||||
Ashmore Group PLC (c) | 15,760 | 79,934 | ||||||
AstraZeneca PLC | 1,200 | 80,815 | ||||||
BP PLC | 21,340 | 147,667 | ||||||
British American Tobacco PLC | 2,270 | 125,384 | ||||||
GlaxoSmithKline PLC | 3,740 | 83,100 | ||||||
HSBC Holdings PLC | 14,540 | 138,141 | ||||||
ICAP PLC | 5,130 | 43,441 | ||||||
| See accompanying Notes to Financial Statements | | May 31, 2015 | | Semiannual Report | 141 |
Table of Contents
Schedule of Investments
May 31, 2015 (Unaudited)
| Shares | Value | |||||||
IG Group Holdings PLC | 8,490 | $ | 101,591 | |||||
Imperial Tobacco Group PLC | 1,890 | 97,463 | ||||||
Pearson PLC | 3,320 | 66,442 | ||||||
Tate & Lyle PLC | 3,770 | 33,535 | ||||||
Tullett Prebon PLC (c) | 6,860 | 41,524 | ||||||
UBM PLC (c) | 7,590 | 64,587 | ||||||
Vodafone Group PLC | 44,310 | 173,207 | ||||||
|
| |||||||
| 1,276,831 | ||||||||
|
| |||||||
| Total Common Stock (cost—$3,065,182) | 3,169,110 | |||||||
|
| |||||||
| Principal Amount (000s) | ||||||||
| Repurchase Agreements—6.6% | ||||||||
State Street Bank and Trust Co., dated 5/29/15, 0.00%, due 6/1/15, proceeds $219,000; collateralized by U.S. Treasury Notes, 2.125%, due 9/30/21, valued at $224,950 including accrued interest |
| |||||||
(cost—$219,000) | $219 | 219,000 | ||||||
|
| |||||||
| Total Investments (cost—$3,284,182) (b)—102.7% | 3,388,110 | |||||||
|
| |||||||
| Liabilities in excess of other assets—(2.7)% | (88,759 | ) | ||||||
|
| |||||||
| Net Assets—100.0% | $3,299,351 | |||||||
|
| |||||||
Notes to Schedule of Investments:
(a) 144A—Exempt from registration under Rule 144A of the Securities Act of 1933. These securities may be resold in transactions exempt from registration, typically only to qualified institutional buyers. Unless otherwise indicated, these securities are not considered to be illiquid.
(b) Securities with an aggregate value of $3,054,194, representing 92.6% of net assets, were valued utilizing modeling tools provided by a third-party vendor. See Note 1(a) and Note 1(b) in the Notes to Financial Statements.
(c) Affiliated security.
(d) Non-income producing.
The industry classification of portfolio holdings and liabilities in excess of other assets shown as a percentage of net assets were as follows:
Oil, Gas & Consumable Fuels | 14.9% | |||
Wireless Telecommunication Services | 10.3% | |||
Insurance | 8.5% | |||
Banks | 7.4% | |||
Tobacco | 6.8% | |||
Media | 6.0% | |||
Air Freight & Logistics | 5.8% | |||
Capital Markets | 5.0% | |||
Pharmaceuticals | 5.0% | |||
Diversified Financial Services | 4.2% | |||
Diversified Telecommunication Services | 4.1% | |||
Construction & Engineering | 3.5% | |||
Gas Utilities | 2.8% | |||
Auto Components | 2.0% | |||
Multi-Utilities | 2.0% | |||
Electric Utilities | 1.4% | |||
Consumer Finance | 1.4% | |||
Trading Companies & Distributors | 1.2% | |||
Energy Equipment & Services | 1.2% | |||
Food Products | 1.0% | |||
Food & Staples Retailing | 0.8% | |||
Communications Equipment | 0.8% | |||
Repurchase Agreements | 6.6% | |||
Liabilities in excess of other assets | (2.7)% | |||
|
| |||
| 100.0% | ||||
|
|
AllianzGI Global Fundamental Strategy Fund
| Shares | Value | |||||||||
| Common Stock—33.9% | ||||||||||
| Australia—0.1% | ||||||||||
South32 Ltd. (g) | 9,700 | $16,012 | ||||||||
|
| |||||||||
| Belgium—1.2% | ||||||||||
bpost S.A. (f) | 6,000 | 173,195 | ||||||||
Warehouses De Pauw CVA REIT | 1,400 | 105,788 | ||||||||
|
| |||||||||
| 278,983 | ||||||||||
|
| |||||||||
| France—0.8% | ||||||||||
GDF Suez | 9,000 | 181,417 | ||||||||
|
| |||||||||
| Germany—3.5% | ||||||||||
BASF SE | 2,100 | 194,827 | ||||||||
Deutsche Annington Immobilien SE | 6,400 | 202,570 | ||||||||
Muenchener Rueckversicherungs-Gesellschaft AG in Muenchen | 900 | 166,306 | ||||||||
SAP SE | 1,600 | 118,790 | ||||||||
TLG Immobilien AG (f)(g) | 6,282 | 106,253 | ||||||||
|
| |||||||||
| 788,746 | ||||||||||
|
| |||||||||
| Hong Kong—2.2% | ||||||||||
HKT Trust & HKT Ltd. | 222,400 | 279,949 | ||||||||
Power Assets Holdings Ltd. | 22,600 | 216,110 | ||||||||
|
| |||||||||
| 496,059 | ||||||||||
|
| |||||||||
| Indonesia—1.3% | ||||||||||
Bank Negara Indonesia Persero Tbk PT | 130,000 | 67,424 | ||||||||
Indocement Tunggal Prakarsa Tbk PT | 30,000 | 50,727 | ||||||||
Telekomunikasi Indonesia Persero Tbk PT | 777,300 | 167,379 | ||||||||
|
| |||||||||
| 285,530 | ||||||||||
|
| |||||||||
| Italy—0.6% | ||||||||||
Eni SpA | 7,700 | 138,759 | ||||||||
|
| |||||||||
| New Zealand—0.8% | ||||||||||
Spark New Zealand Ltd. | 87,100 | 170,566 | ||||||||
|
| |||||||||
| Norway—2.0% | ||||||||||
Telenor ASA | 9,300 | 210,556 | ||||||||
Yara International ASA | 4,900 | 246,883 | ||||||||
|
| |||||||||
| 457,439 | ||||||||||
|
| |||||||||
| Portugal—0.9% | ||||||||||
CTT-Correios de Portugal S.A. (f) | 20,000 | 201,748 | ||||||||
|
| |||||||||
| Switzerland—2.3% | ||||||||||
Nestle S.A. | 3,200 | 247,926 | ||||||||
Roche Holding AG | 900 | 274,384 | ||||||||
|
| |||||||||
| 522,310 | ||||||||||
|
| |||||||||
| Turkey—1.3% | ||||||||||
Tupras Turkiye Petrol Rafinerileri AS (g) | 11,500 | 287,610 | ||||||||
|
| |||||||||
| United Arab Emirates—0.8% | ||||||||||
Dragon Oil PLC | 17,000 | 176,991 | ||||||||
|
| |||||||||
| United Kingdom—4.5% | ||||||||||
BHP Billiton PLC | 9,700 | 204,512 | ||||||||
BP PLC | 28,000 | 193,752 | ||||||||
Centrica PLC | 33,200 | 140,667 | ||||||||
Reckitt Benckiser Group PLC | 2,900 | 261,915 | ||||||||
Royal Dutch Shell PLC, Class A | 7,300 | 217,601 | ||||||||
|
| |||||||||
| 1,018,447 | ||||||||||
|
| |||||||||
| United States—11.6% | ||||||||||
Amazon.com, Inc. (e)(g) | 500 | 214,615 | ||||||||
Apple, Inc. (e) | 1,400 | 182,392 | ||||||||
| 142 | Semiannual Report | | May 31, 2015 | | See accompanying Notes to Financial Statements |
Table of Contents
Schedule of Investments
May 31, 2015 (Unaudited)
Shares | Value | |||||||||||
Cisco Systems, Inc. (e) | 8,400 | $ | 246,204 | |||||||||
Eli Lilly & Co. | 3,300 | 260,370 | ||||||||||
General Electric Co. (e) | 8,300 | 226,341 | ||||||||||
Intel Corp. (e) | 7,500 | 258,450 | ||||||||||
Johnson & Johnson | 2,400 | 240,336 | ||||||||||
Merck & Co., Inc. | 4,200 | 255,738 | ||||||||||
Microchip Technology, Inc. (e) | 5,800 | 284,954 | ||||||||||
Microsoft Corp. (e) | 5,100 | 238,986 | ||||||||||
Verizon Communications, Inc. | 3,900 | 192,816 | ||||||||||
|
| |||||||||||
| 2,601,202 | ||||||||||||
|
| |||||||||||
| Total Common Stock (cost—$6,735,168) | 7,621,819 | |||||||||||
|
| |||||||||||
| Principal Amount (000s) | ||||||||||||
| Corporate Bonds & Notes—30.0% | ||||||||||||
| Brazil—0.9% | ||||||||||||
Petrobras Global Finance BV, |
| |||||||||||
5.375%, 1/27/21 | $ | 200 | 195,600 | |||||||||
|
| |||||||||||
| Germany—4.6% | ||||||||||||
KFW, | 1,000 | 1,015,808 | ||||||||||
|
| |||||||||||
| Israel—1.0% | ||||||||||||
Israel Electric Corp., Ltd. (a)(b), |
| |||||||||||
7.25%, 1/15/19 | 200 | 228,250 | ||||||||||
|
| |||||||||||
| Mexico—1.0% | ||||||||||||
Controladora Mabe S.A. de C.V. (a)(b), |
| |||||||||||
7.875%, 10/28/19 | 200 | 229,190 | ||||||||||
|
| |||||||||||
| Supranational—8.9% | ||||||||||||
European Investment Bank, |
| |||||||||||
0.625%, 4/15/16 | 1,000 | 1,002,046 | ||||||||||
Inter-American Development Bank, |
| |||||||||||
0.625%, 9/12/16 | 1,000 | 1,000,955 | ||||||||||
|
| |||||||||||
| 2,003,001 | ||||||||||||
|
| |||||||||||
| Switzerland—2.5% | ||||||||||||
Credit Suisse, |
| |||||||||||
5.30%, 8/13/19 | 500 | 562,708 | ||||||||||
|
| |||||||||||
| United States—11.1% | ||||||||||||
AT&T, Inc., |
| |||||||||||
5.80%, 2/15/19 | 500 | 564,447 | ||||||||||
Daimler Finance North America LLC (a)(b), |
| |||||||||||
1.25%, 1/11/16 | 250 | 250,810 | ||||||||||
HSBC USA, Inc., |
| |||||||||||
1.625%, 1/16/18 | 500 | 502,044 | ||||||||||
Morgan Stanley, |
| |||||||||||
4.00%, 7/24/15 | 500 | 502,468 | ||||||||||
Oracle Corp., |
| |||||||||||
5.75%, 4/15/18 | 600 | 672,624 | ||||||||||
|
| |||||||||||
| 2,492,393 | ||||||||||||
|
| |||||||||||
| Total Corporate Bonds & Notes (cost—$6,667,004) | 6,726,950 | |||||||||||
|
| |||||||||||
| Sovereign Debt Obligations—18.4% | ||||||||||||
| Brazil—2.0% | ||||||||||||
Brazil Notas do Tesouro Nacional, Ser. F, |
| |||||||||||
10.00%, 1/1/18 | BRL | 1,500 | 445,123 | |||||||||
|
| |||||||||||
| Indonesia—2.3% | ||||||||||||
Indonesia Treasury Bond, |
| |||||||||||
7.375%, 9/15/16 | IDR | 6,900,000 | 522,039 | |||||||||
|
| |||||||||||
| Italy—4.9% | ||||||||||||
Italy Buoni Poliennali Del Tesoro (d), |
| |||||||||||
1.65%, 4/23/20 | € | 441 | 510,431 | |||||||||
3.10%, 9/15/26 | 445 | 602,923 | ||||||||||
|
| |||||||||||
| 1,113,354 | ||||||||||||
|
| |||||||||||
| Principal Amount (000s) | Value | |||||||||||
| Mexico—2.3% | ||||||||||||
Mexican Bonos, Ser. M, |
| |||||||||||
6.50%, 6/9/22 | MXN | 7,500 | $ | 508,242 | ||||||||
|
| |||||||||||
| Poland—1.9% | ||||||||||||
Poland Government Bond, |
| |||||||||||
3.75%, 4/25/18 | PLN | 1,500 | 420,225 | |||||||||
|
| |||||||||||
| Russia—0.9% | ||||||||||||
Russian Federation Bond (a)(b), |
| |||||||||||
4.50%, 4/4/22 | $ | 200 | 197,172 | |||||||||
|
| |||||||||||
| South Africa—2.2% | ||||||||||||
South Africa Government Bond, |
| |||||||||||
8.00%, 12/21/18 | ZAR | 6,000 | 502,870 | |||||||||
|
| |||||||||||
| Spain—1.9% | ||||||||||||
Spain Government Linked Bond (b)(d), |
| |||||||||||
1.80%, 11/30/24 | € | 350 | 424,167 | |||||||||
|
| |||||||||||
| Total Sovereign Debt Obligations (cost—$4,717,930) | 4,133,192 | |||||||||||
|
| |||||||||||
| Shares | ||||||||||||
| Exchange-Traded Funds—1.9% | ||||||||||||
iShares MSCI Emerging Markets Index (e) |
| 10,400 | 427,648 | |||||||||
|
| |||||||||||
| Principal Amount (000s) | ||||||||||||
| Repurchase Agreements—14.9% | ||||||||||||
State Street Bank and Trust Co., dated 5/29/15, 0.00%, due 6/1/15, proceeds $3,346,000; collateralized by U.S. Treasury Notes, 2.125%, due 9/30/21, valued at $3,415,150 including accrued interest |
| |||||||||||
(cost—$3,346,000) |
| $3,346 | 3,346,000 | |||||||||
|
| |||||||||||
| Contracts | ||||||||||||
| Options Purchased (g)(h)— 0.2% | ||||||||||||
| Put Options—0.2% | ||||||||||||
E-mini S&P 500 Index, |
| 15 | 35,250 | |||||||||
Euro STOXX 50 Index, |
| 30 | 6,738 | |||||||||
|
| |||||||||||
| Total Options Purchased (cost—$87,036) | 41,988 | |||||||||||
|
| |||||||||||
| Total Investments, before options written (cost—$21,989,648) (c)—99.3% | 22,297,597 | |||||||||||
|
| |||||||||||
| Options Written (g)(h)—(0.2)% | ||||||||||||
| Call Options—(0.1)% | ||||||||||||
Amazon.com, Inc., |
| 5 | (298 | ) | ||||||||
Euro STOXX 50 Index, |
| 30 | (27,512 | ) | ||||||||
Microsoft Corp., |
| 51 | (357 | ) | ||||||||
|
| |||||||||||
| (28,167 | ) | |||||||||||
|
| |||||||||||
| Contracts | Value | |||||||||
| Put Options—(0.1)% | ||||||||||
E-mini S&P 500 Index, | 15 | $ | (14,625 | ) | ||||||
Euro STOXX 600 Index, | 70 | (2,306 | ) | |||||||
|
| |||||||||
| (16,931 | ) | |||||||||
|
| |||||||||
| Total Options Written (premiums received—$78,094) | (45,098 | ) | ||||||||
|
| |||||||||
| Total Investments, net of options written (cost—$21,911,554)—99.1% | 22,252,499 | |||||||||
|
| |||||||||
| Other assets less other liabilities—0.9% | 194,188 | |||||||||
|
| |||||||||
| Net Assets—100.0% | $22,446,687 | |||||||||
|
| |||||||||
Notes to Schedule of Investments:
(a) Private Placement—Restricted as to resale and may not have a readily available market. Securities with an aggregate value of $905,422, representing 4.0% of net assets.
(b) 144A—Exempt from registration under Rule 144A of the Securities Act of 1933. These securities may be resold in transactions exempt from registration, typically only to qualified institutional buyers. Unless otherwise indicated, these securities are not considered to be illiquid.
(c) Securities with an aggregate value of $4,512,615, representing 20.1% of net assets, were valued utilizing modeling tools provided by a third-party vendor. See Note 1(a) and Note 1(b) in the Notes to Financial Statements.
(d) Inflationary Bonds—Principal amount of security is adjusted for inflation/deflation.
(e) All or partial amount segregated for the benefit of the counterparty as collateral for options written.
(f) Affiliated security.
(g) Non-income producing.
(h) Exchange traded-Chicago Board Options Exchange.
Glossary:
BRL—Brazilian Real
€—Euro
IDR—Indonesian Rupiah
MSCI—Morgan Stanley Capital International
MXN—Mexican Peso
PLN—Polish Zloty
REIT—Real Estate Investment Trust
ZAR—South African Rand
| See accompanying Notes to Financial Statements | | May 31, 2015 | | Semiannual Report | 143 |
Table of Contents
Schedule of Investments
May 31, 2015 (Unaudited)
The industry classification of portfolio holdings and other assets less other liabilities shown as a percentage of net assets were as follows:
Banks | 20.8% | |||
Sovereign Debt Obligations | 18.4% | |||
Oil, Gas & Consumable Fuels | 5.4% | |||
Pharmaceuticals | 4.6% | |||
Software | 4.6% | |||
Diversified Telecommunication Services | 4.6% | |||
Telecommunications | 2.5% | |||
Semiconductors & Semiconductor Equipment | 2.4% | |||
Electric Utilities | 2.0% | |||
Chemicals | 2.0% | |||
Exchange-Traded Funds | 1.9% | |||
Air Freight & Logistics | 1.7% | |||
Multi-Utilities | 1.4% | |||
Real Estate Management & Development | 1.4% | |||
Household Products | 1.2% | |||
Auto Manufacturers | 1.1% | |||
Food Products | 1.1% | |||
Communications Equipment | 1.1% | |||
Household Products/Wares | 1.0% | |||
Industrial Conglomerates | 1.0% | |||
Metals & Mining | 1.0% | |||
Internet & Catalog Retail | 0.9% | |||
Technology Hardware, Storage & Peripherals | 0.8% | |||
Insurance | 0.7% | |||
Real Estate Investment Trust | 0.4% | |||
Construction Materials | 0.2% | |||
Repurchase Agreements | 14.9% | |||
Options Purchased | 0.2% | |||
Options Written | (0.2)% | |||
Other assets less other liabilities | 0.9% | |||
|
| |||
| 100.0% | ||||
|
|
AllianzGI Global Managed Volatility Fund
| Shares | Value | |||||||
| Common Stock—96.0% | ||||||||
| Australia—3.4% | ||||||||
Amcor Ltd. | 4,431 | $48,901 | ||||||
Flight Centre Travel Group Ltd. | 286 | 10,134 | ||||||
Insurance Australia Group Ltd. | 4,049 | 17,470 | ||||||
JB Hi-Fi Ltd. | 830 | 13,826 | ||||||
Sonic Healthcare Ltd. | 545 | 8,339 | ||||||
|
| |||||||
| 98,670 | ||||||||
|
| |||||||
| Canada—9.4% | ||||||||
Alimentation Couche-Tard, Inc., Class B | 391 | 15,236 | ||||||
BCE, Inc. | 249 | 10,912 | ||||||
Canadian Apartment Properties REIT | 432 | 9,546 | ||||||
Canadian Tire Corp., Ltd., Class A | 87 | 9,021 | ||||||
Dollarama, Inc. | 326 | 18,056 | ||||||
Empire Co., Ltd. | 180 | 12,894 | ||||||
Fairfax Financial Holdings Ltd. | 122 | 61,450 | ||||||
Fortis, Inc. | 877 | 26,784 | ||||||
Intact Financial Corp. | 517 | 37,079 | ||||||
Manitoba Telecom Services, Inc. | 503 | 11,261 | ||||||
Metro, Inc. | 412 | 11,387 | ||||||
Rogers Communications, Inc., Class B | 806 | 27,733 | ||||||
TELUS Corp. | 526 | 17,908 | ||||||
|
| |||||||
| 269,267 | ||||||||
|
| |||||||
| China—1.4% | ||||||||
Anhui Conch Cement Co., Ltd., Class H | 4,000 | 16,702 | ||||||
China Mobile Ltd. | 700 | 9,237 | ||||||
China Overseas Land & Investment Ltd. | 2,000 | 7,190 | ||||||
China Petroleum & Chemical Corp., Class H | 8,000 | 7,018 | ||||||
|
| |||||||
| 40,147 | ||||||||
|
| |||||||
| France—1.8% | ||||||||
Eutelsat Communications S.A. | 234 | 7,962 | ||||||
SES S.A. | 1,244 | 44,019 | ||||||
|
| |||||||
| 51,981 | ||||||||
|
| |||||||
| Germany—3.2% | ||||||||
Deutsche Lufthansa AG (b) | 544 | 7,668 | ||||||
Fresenius Medical Care AG & Co. KGaA | 607 | 51,990 | ||||||
MAN SE | 310 | 32,059 | ||||||
|
| |||||||
| 91,717 | ||||||||
|
| |||||||
| Hong Kong—4.0% | ||||||||
AIA Group Ltd. | 2,000 | 13,103 | ||||||
BOC Hong Kong Holdings Ltd. | 2,000 | 8,222 | ||||||
CLP Holdings Ltd. | 4,100 | 35,821 | ||||||
Li & Fung Ltd. | 22,000 | 19,039 | ||||||
Link REIT | 1,000 | 5,816 | ||||||
PCCW Ltd. | 11,000 | 6,871 | ||||||
Power Assets Holdings Ltd. | 1,200 | 11,475 | ||||||
Yue Yuen Industrial Holdings Ltd. | 4,000 | 13,758 | ||||||
|
| |||||||
| 114,105 | ||||||||
|
| |||||||
| Israel—2.5% | ||||||||
Bank Hapoalim BM | 2,279 | 11,943 | ||||||
Bank Leumi Le-Israel BM (b) | 11,057 | 43,211 | ||||||
Bezeq The Israeli Telecommunication Corp., Ltd. | 4,407 | 7,373 | ||||||
Israel Chemicals Ltd. | 1,119 | 8,001 | ||||||
|
| |||||||
| 70,528 | ||||||||
|
| |||||||
| Japan—5.4% | ||||||||
ABC-Mart, Inc. | 200 | 11,548 | ||||||
Benesse Holdings, Inc. | 300 | 7,838 | ||||||
| Shares | Value | |||||||
Capcom Co., Ltd. | 600 | $ | 11,576 | |||||
Don Quijote Holdings Co., Ltd. | 200 | 15,417 | ||||||
FamilyMart Co., Ltd. | 200 | 8,380 | ||||||
K’s Holdings Corp. | 200 | 7,493 | ||||||
Kao Corp. | 500 | 22,709 | ||||||
Kose Corp. | 200 | 13,068 | ||||||
Sanrio Co., Ltd. | 300 | 8,394 | ||||||
Sawai Pharmaceutical Co., Ltd. | 100 | 5,750 | ||||||
Shimamura Co., Ltd. | 100 | 10,738 | ||||||
Shiseido Co., Ltd. | 900 | 18,016 | ||||||
Sumitomo Heavy Industries Ltd. | 2,000 | 13,083 | ||||||
|
| |||||||
| 154,010 | ||||||||
|
| |||||||
| Netherlands—0.4% | ||||||||
Koninklijke DSM NV | 203 | 12,018 | ||||||
|
| |||||||
| Singapore—3.9% | ||||||||
CapitaLand Mall Trust REIT | 6,500 | 10,443 | ||||||
DBS Group Holdings Ltd. | 800 | 12,028 | ||||||
Hutchison Port Holdings Trust UNIT | 12,800 | 8,438 | ||||||
Singapore Airlines Ltd. | 2,400 | 20,203 | ||||||
Singapore Press Holdings Ltd. | 2,900 | 8,945 | ||||||
Singapore Telecommunications Ltd. | 16,600 | 50,701 | ||||||
|
| |||||||
| 110,758 | ||||||||
|
| |||||||
| Sweden—0.3% | ||||||||
Swedish Match AB | 268 | 7,984 | ||||||
|
| |||||||
| Switzerland—0.6% | ||||||||
Nestle S.A. | 123 | 9,530 | ||||||
Swisscom AG | 13 | 7,536 | ||||||
|
| |||||||
| 17,066 | ||||||||
|
| |||||||
| United Kingdom—1.7% | ||||||||
Next PLC | 96 | 11,042 | ||||||
Randgold Resources Ltd. | 269 | 19,479 | ||||||
RSA Insurance Group PLC | 1,234 | 8,153 | ||||||
SSE PLC | 342 | 8,703 | ||||||
|
| |||||||
| 47,377 | ||||||||
|
| |||||||
| United States—58.0% | ||||||||
Alleghany Corp. (b) | 90 | 42,782 | ||||||
American Capital Agency Corp. REIT | 3,700 | 77,182 | ||||||
American Eagle Outfitters, Inc. | 1,130 | 18,498 | ||||||
American Homes 4 Rent REIT | 400 | 6,676 | ||||||
Annaly Capital Management, Inc. REIT | 6,845 | 71,462 | ||||||
Apple, Inc. | 135 | 17,588 | ||||||
Ares Capital Corp. | 2,055 | 34,421 | ||||||
AT&T, Inc. | 400 | 13,816 | ||||||
AutoZone, Inc. (b) | 100 | 67,362 | ||||||
Bed Bath & Beyond, Inc. (b) | 210 | 14,977 | ||||||
Bunge Ltd. | 150 | 13,884 | ||||||
Capitol Federal Financial, Inc. | 2,820 | 34,122 | ||||||
Capstead Mortgage Corp. REIT | 4,350 | 51,460 | ||||||
CBOE Holdings, Inc. | 400 | 23,408 | ||||||
Chimera Investment Corp. REIT | 1,023 | 14,762 | ||||||
Cirrus Logic, Inc. (b) | 510 | 19,253 | ||||||
Clorox Co. | 710 | 76,439 | ||||||
Coach, Inc. | 440 | 15,563 | ||||||
Coca-Cola Co. | 850 | 34,816 | ||||||
ConAgra Foods, Inc. | 765 | 29,537 | ||||||
Consolidated Edison, Inc. | 360 | 22,262 | ||||||
Costco Wholesale Corp. | 130 | 18,537 | ||||||
Deere & Co. | 100 | 9,368 | ||||||
DIRECTV (b) | 100 | 9,104 | ||||||
Dollar General Corp. | 95 | 6,896 | ||||||
Dollar Tree, Inc. (b) | 245 | 18,373 | ||||||
Duke Energy Corp. | 341 | 25,824 | ||||||
Dunkin’ Brands Group, Inc. | 310 | 16,542 | ||||||
eBay, Inc. (b) | 200 | 12,272 | ||||||
Express Scripts Holding Co. (b) | 320 | 27,885 | ||||||
| 144 | Semiannual Report | | May 31, 2015 | | See accompanying Notes to Financial Statements |
Table of Contents
Schedule of Investments
May 31, 2015 (Unaudited)
| Shares | Value | |||||||
Hatteras Financial Corp. REIT | 2,425 | $ | 43,553 | |||||
HCP, Inc. REIT | 1,480 | 57,306 | ||||||
Integra LifeSciences Holdings Corp. (b) | 220 | 14,777 | ||||||
Intel Corp. | 200 | 6,892 | ||||||
International Business Machines Corp. | 180 | 30,537 | ||||||
Kohl’s Corp. | 200 | 13,098 | ||||||
M&T Bank Corp. | 175 | 21,154 | ||||||
McDonald’s Corp. | 710 | 68,110 | ||||||
Merck & Co., Inc. | 250 | 15,223 | ||||||
MFA Financial, Inc. REIT | 1,270 | 10,084 | ||||||
Michael Kors Holdings Ltd. (b) | 100 | 4,650 | ||||||
Morningstar, Inc. | 205 | 15,847 | ||||||
Newmont Mining Corp. | 420 | 11,441 | ||||||
NOW, Inc. (b) | 300 | 6,936 | ||||||
PartnerRe Ltd. | 65 | 8,543 | ||||||
PepsiCo, Inc. | 415 | 40,018 | ||||||
Procter & Gamble Co. | 750 | 58,792 | ||||||
Regions Financial Corp. | 1,000 | 10,090 | ||||||
Republic Services, Inc. | 1,160 | 46,736 | ||||||
Ross Stores, Inc. | 100 | 9,667 | ||||||
Sally Beauty Holdings, Inc. (b) | 420 | 13,108 | ||||||
Southern Co. | 1,415 | 61,821 | ||||||
Starwood Property Trust, Inc. REIT | 300 | 7,167 | ||||||
Stericycle, Inc. (b) | 415 | 56,979 | ||||||
Target Corp. | 115 | 9,122 | ||||||
TransDigm Group, Inc. | 65 | 14,693 | ||||||
Two Harbors Investment Corp. REIT | 1,060 | 11,331 | ||||||
Ulta Salon Cosmetics & Fragrance, Inc. (b) | 100 | 15,262 | ||||||
Urban Outfitters, Inc. (b) | 210 | 7,220 | ||||||
Validus Holdings Ltd. | 220 | 9,440 | ||||||
Ventas, Inc. REIT | 210 | 13,969 | ||||||
Verizon Communications, Inc. | 310 | 15,326 | ||||||
Wal-Mart Stores, Inc. | 920 | 68,328 | ||||||
Waste Management, Inc. | 100 | 4,965 | ||||||
Whole Foods Market, Inc. | 210 | 8,660 | ||||||
|
| |||||||
| 1,655,916 | ||||||||
|
| |||||||
Total Investments (cost—$2,482,930) (a)—96.0% |
| 2,741,544 | ||||||
|
| |||||||
Other assets less liabilities—4.0% | 115,536 | |||||||
|
| |||||||
| Net Assets—100.0% | $2,857,080 | |||||||
|
| |||||||
Notes to Schedule of Investments:
(a) Securities with an aggregate value of $788,619, representing 27.6% of net assets, were valued utilizing modeling tools provided by a third-party vendor. See Note 1(a) and Note 1(b) in the Notes to Financial Statements.
(b) Non-income producing.
Glossary:
REIT—Real Estate Investment Trust
UNIT—More than one class of securities traded together.
The industry classification of portfolio holdings and other assets less liabilities shown as a percentage of net assets were as follows:
Real Estate Investment Trust | 13.7% | |||
Specialty Retail | 7.1% | |||
Insurance | 7.0% | |||
Electric Utilities | 5.9% | |||
Food & Staples Retailing | 5.1% | |||
Diversified Telecommunication Services | 5.0% | |||
Household Products | 4.8% | |||
Commercial Services & Supplies | 3.8% | |||
Banks | 3.7% | |||
Multi-line Retail | 3.4% | |||
Hotels, Restaurants & Leisure | 3.3% | |||
Health Care Providers & Services | 3.1% | |||
Media | 3.0% | |||
Beverages | 2.6% | |||
Machinery | 1.9% | |||
Textiles, Apparel & Luxury Goods | 1.9% | |||
Personal Products | 1.8% | |||
Food Products | 1.8% | |||
Containers & Packaging | 1.7% | |||
Wireless Telecommunication Services | 1.3% | |||
Capital Markets | 1.2% | |||
Thrifts & Mortgage Finance | 1.2% | |||
Metals & Mining | 1.1% | |||
IT Services | 1.1% | |||
Airlines | 1.0% | |||
Semiconductors & Semiconductor Equipment | 0.9% | |||
Diversified Financial Services | 0.8% | |||
Multi-Utilities | 0.8% | |||
Pharmaceuticals | 0.7% | |||
Chemicals | 0.7% | |||
Technology Hardware, Storage & Peripherals | 0.6% | |||
Construction Materials | 0.6% | |||
Health Care Equipment & Supplies | 0.5% | |||
Aerospace & Defense | 0.5% | |||
Internet Software & Services | 0.4% | |||
Software | 0.4% | |||
Transportation Infrastructure | 0.3% | |||
Tobacco | 0.3% | |||
Diversified Consumer Services | 0.3% | |||
Oil, Gas & Consumable Fuels | 0.3% | |||
Real Estate Management & Development | 0.2% | |||
Trading Companies & Distributors | 0.2% | |||
Other assets less liabilities | 4.0% | |||
|
| |||
| 100.0% | ||||
|
|
AllianzGI Global Sustainability Fund
| Shares | Value | |||||||
| Common Stock—93.4% | ||||||||
| Australia—3.4% | ||||||||
Australia & New Zealand Banking Group Ltd. | 2,162 | $54,646 | ||||||
Brambles Ltd. | 5,416 | 47,166 | ||||||
South32 Ltd. (c) | 2,009 | 3,317 | ||||||
|
| |||||||
| 105,129 | ||||||||
|
| |||||||
| Canada—1.0% | ||||||||
Gibson Energy, Inc. | 1,694 | 32,597 | ||||||
|
| |||||||
| Denmark—2.0% | ||||||||
Novo Nordisk A/S, Class B | 1,115 | 63,254 | ||||||
|
| |||||||
| France—3.0% | ||||||||
BNP Paribas S.A. | 802 | 48,307 | ||||||
Bureau Veritas S.A. (b) | 2,033 | 46,537 | ||||||
|
| |||||||
| 94,844 | ||||||||
|
| |||||||
| Germany—5.2% | ||||||||
Adidas AG | 784 | 61,695 | ||||||
Muenchener Rueckversicherungs-Gesellschaft AG in Muenchen | 318 | 58,762 | ||||||
SAP SE | 595 | 44,175 | ||||||
|
| |||||||
| 164,632 | ||||||||
|
| |||||||
| Ireland—1.7% | ||||||||
Accenture PLC, Class A | 562 | 53,974 | ||||||
|
| |||||||
| Japan—4.1% | ||||||||
Astellas Pharma, Inc. | 2,600 | 37,736 | ||||||
Daikin Industries Ltd. | 700 | 53,459 | ||||||
Mazda Motor Corp. | 1,700 | 36,383 | ||||||
|
| |||||||
| 127,578 | ||||||||
|
| |||||||
| Norway—1.0% | ||||||||
Storebrand ASA (c) | 8,726 | 31,275 | ||||||
|
| |||||||
| Spain—4.0% | ||||||||
Amadeus IT Holding S.A., Class A | 1,551 | 70,561 | ||||||
Inditex S.A. | 1,672 | 55,356 | ||||||
|
| |||||||
| 125,917 | ||||||||
|
| |||||||
| Sweden—3.5% | ||||||||
Atlas Copco AB, Class A | 1,833 | 55,458 | ||||||
Skandinaviska Enskilda Banken AB, Class A | 4,363 | 53,964 | ||||||
|
| |||||||
| 109,422 | ||||||||
|
| |||||||
| Switzerland—5.8% | ||||||||
Nestle S.A. | 760 | 58,883 | ||||||
Roche Holding AG | 261 | 79,571 | ||||||
UBS Group AG | 2,079 | 44,744 | ||||||
|
| |||||||
| 183,198 | ||||||||
|
| |||||||
| United Kingdom—14.7% | ||||||||
AstraZeneca PLC | 624 | 42,024 | ||||||
BG Group PLC | 3,379 | 58,898 | ||||||
BHP Billiton PLC | 2,009 | 42,357 | ||||||
Prudential PLC | 2,826 | 70,423 | ||||||
Rio Tinto PLC | 1,025 | 44,828 | ||||||
Unilever PLC | 1,495 | 66,128 | ||||||
Vodafone Group PLC | 18,612 | 72,754 | ||||||
WPP PLC | 2,663 | 62,916 | ||||||
|
| |||||||
| 460,328 | ||||||||
|
| |||||||
| United States—44.0% | ||||||||
Agilent Technologies, Inc. | 1,222 | 50,334 | ||||||
American Express Co. | 737 | 58,754 | ||||||
Apple, Inc. | 536 | 69,830 | ||||||
Biogen, Inc. (c) | 115 | 45,654 | ||||||
Citigroup, Inc. | 1,419 | 76,739 | ||||||
Colgate-Palmolive Co. | 892 | 59,577 | ||||||
Eaton Corp. PLC | 868 | 62,140 | ||||||
Ecolab, Inc. | 428 | 49,070 | ||||||
| See accompanying Notes to Financial Statements | | May 31, 2015 | | Semiannual Report | 145 |
Table of Contents
Schedule of Investments
May 31, 2015 (Unaudited)
| Shares | Value | |||||||
EOG Resources, Inc. | 665 | $ | 58,979 | |||||
Estee Lauder Cos., Inc., Class A | 669 | 58,491 | ||||||
Google, Inc., Class A (c) | 109 | 59,440 | ||||||
IDEX Corp. | 762 | 58,872 | ||||||
Intel Corp. | 691 | 23,812 | ||||||
Intuit, Inc. | 537 | 55,929 | ||||||
Johnson & Johnson | 708 | 70,899 | ||||||
Microsoft Corp. | 1,271 | 59,559 | ||||||
Mondelez International, Inc., Class A | 1,370 | 56,978 | ||||||
Priceline Group, Inc. (c) | 43 | 50,398 | ||||||
Schlumberger Ltd. | 691 | 62,722 | ||||||
Starbucks Corp. | 1,386 | 72,017 | ||||||
Visa, Inc., Class A | 1,144 | 78,570 | ||||||
Wells Fargo & Co. | 1,940 | 108,562 | ||||||
WW Grainger, Inc. | 144 | 34,607 | ||||||
|
| |||||||
| 1,381,933 | ||||||||
|
| |||||||
| Total Common Stock (cost—$2,823,255) | 2,934,081 | |||||||
|
| |||||||
| Preferred Stock—2.1% | ||||||||
| Germany—2.1% | ||||||||
Henkel AG & Co. KGaA | 545 | 65,240 | ||||||
|
| |||||||
| Principal Amount (000s) | ||||||||
| Repurchase Agreements—4.6% | ||||||||
State Street Bank and Trust Co., dated 5/29/15, 0.00%, due 6/1/15, proceeds $145,000; collateralized by U.S. Treasury Notes, 2.125%, due 9/30/21, valued at $148,263 including accrued interest |
| |||||||
(cost—$145,000) | $145 | 145,000 | ||||||
|
| |||||||
| Total Investments (cost—$3,028,945) (a)—100.1% | 3,144,321 | |||||||
|
| |||||||
| Liabilities in excess of other assets—(0.1)% | (3,741 | ) | ||||||
|
| |||||||
| Net Assets—100.0% | $3,140,580 | |||||||
|
| |||||||
Notes to Schedule of Investments:
(a) Securities with an aggregate value of $1,527,500, representing 48.6% of net assets, were valued utilizing modeling tools provided by a third-party vendor. See Note 1(a) and Note 1(b) in the Notes to Financial Statements.
(b) Affiliated security.
(c) Non-income producing.
The industry classification of portfolio holdings and liabilities in excess of other assets shown as a percentage of net assets were as follows:
Banks | 10.8% | |||
Pharmaceuticals | 9.2% | |||
IT Services | 6.4% | |||
Food Products | 5.8% | |||
Insurance | 5.2% | |||
Software | 5.1% | |||
Oil, Gas & Consumable Fuels | 4.8% | |||
Machinery | 3.7% | |||
Metals & Mining | 2.9% | |||
Wireless Telecommunication Services | 2.3% | |||
Hotels, Restaurants & Leisure | 2.3% | |||
Technology Hardware, Storage & Peripherals | 2.2% | |||
Household Products/Wares | 2.1% | |||
Media | 2.0% | |||
Energy Equipment & Services | 2.0% | |||
Electrical Equipment | 2.0% | |||
Textiles, Apparel & Luxury Goods | 1.9% | |||
Household Products | 1.9% | |||
Internet Software & Services | 1.9% | |||
Consumer Finance | 1.9% | |||
Personal Products | 1.9% | |||
Specialty Retail | 1.8% | |||
Building Products | 1.7% | |||
Internet & Catalog Retail | 1.6% | |||
Life Sciences Tools & Services | 1.6% | |||
Chemicals | 1.6% | |||
Commercial Services & Supplies | 1.5% | |||
Professional Services | 1.5% | |||
Biotechnology | 1.4% | |||
Capital Markets | 1.4% | |||
Automobiles | 1.2% | |||
Trading Companies & Distributors | 1.1% | |||
Semiconductors & Semiconductor Equipment | 0.8% | |||
Repurchase Agreements | 4.6% | |||
Liabilities in excess of other assets | (0.1)% | |||
|
| |||
| 100.0% | ||||
|
|
AllianzGI Global Water Fund
| Shares | Value | |||||||
| Common Stock—93.1% | ||||||||
| Austria—1.9% | ||||||||
Andritz AG | 114,430 | $7,070,473 | ||||||
|
| |||||||
| Canada—1.0% | ||||||||
Stantec, Inc. | 140,000 | 3,872,628 | ||||||
|
| |||||||
| China—4.4% | ||||||||
Guangdong Investment Ltd. | 11,492,000 | 16,015,176 | ||||||
|
| |||||||
| Finland—3.0% | ||||||||
Uponor Oyj | 687,000 | 11,112,288 | ||||||
|
| |||||||
| France—5.2% | ||||||||
Suez Environnement Co. | 988,437 | 19,042,535 | ||||||
|
| |||||||
| Germany—3.9% | ||||||||
CENTROTEC Sustainable AG | 209,389 | 3,368,734 | ||||||
GEA Group AG | 152,153 | 7,401,745 | ||||||
Norma Group SE (b) | 67,124 | 3,603,814 | ||||||
|
| |||||||
| 14,374,293 | ||||||||
|
| |||||||
| Hong Kong—4.7% | ||||||||
Beijing Enterprises Water Group Ltd. | 20,142,000 | 17,147,933 | ||||||
|
| |||||||
| Italy—1.0% | ||||||||
ACEA SpA | 267,033 | 3,751,871 | ||||||
|
| |||||||
| Japan—3.9% | ||||||||
Ebara Corp. | 3,000,000 | 14,520,951 | ||||||
|
| |||||||
| Netherlands—1.0% | ||||||||
Arcadis NV | 132,920 | 3,768,985 | ||||||
|
| |||||||
| Sweden—2.6% | ||||||||
Alfa Laval AB | 275,696 | 5,208,094 | ||||||
Sweco AB, Class B | 301,786 | 4,211,873 | ||||||
|
| |||||||
| 9,419,967 | ||||||||
|
| |||||||
| Switzerland—8.6% | ||||||||
Belimo Holding AG | 1,545 | 3,828,595 | ||||||
Geberit AG | 19,378 | 6,974,020 | ||||||
Georg Fischer AG | 13,921 | 10,551,530 | ||||||
Sulzer AG | 91,820 | 10,093,041 | ||||||
|
| |||||||
| 31,447,186 | ||||||||
|
| |||||||
| United Kingdom—12.3% | ||||||||
Halma PLC | 969,998 | 11,333,197 | ||||||
Intertek Group PLC | 96,500 | 3,695,877 | ||||||
Pentair PLC | 216,485 | 13,861,535 | ||||||
RPS Group PLC | 921,754 | 3,310,701 | ||||||
Severn Trent PLC | 220,634 | 7,418,703 | ||||||
Spectris PLC | 154,963 | 5,539,612 | ||||||
|
| |||||||
| 45,159,625 | ||||||||
|
| |||||||
| United States—39.6% | ||||||||
Aegion Corp. (c) | 80,000 | 1,425,600 | ||||||
American Water Works Co., Inc. | 450,706 | 23,828,826 | ||||||
AO Smith Corp. | 53,815 | 3,841,315 | ||||||
California Water Service Group | 140,000 | 3,344,600 | ||||||
Danaher Corp. | 313,247 | 27,039,481 | ||||||
Ecolab, Inc. | 30,000 | 3,439,500 | ||||||
Franklin Electric Co., Inc. | 351,871 | 12,382,340 | ||||||
IDEX Corp. | 253,447 | 19,581,315 | ||||||
ITT Corp. | 254,120 | 10,845,842 | ||||||
Mueller Water Products, Inc., Class A | 1,064,371 | 9,813,501 | ||||||
Pall Corp. | 35,025 | 4,358,511 | ||||||
Roper Technologies, Inc. | 38,011 | 6,650,405 | ||||||
Xylem, Inc. | 510,395 | 18,665,145 | ||||||
|
| |||||||
| 145,216,381 | ||||||||
|
| |||||||
| Total Common Stock (cost—$300,475,886) | 341,920,292 | |||||||
|
| |||||||
| 146 | Semiannual Report | | May 31, 2015 | | See accompanying Notes to Financial Statements |
Table of Contents
Schedule of Investments
May 31, 2015 (Unaudited)
| Principal Amount (000s) | Value | |||||||
| Repurchase Agreements—7.0% | ||||||||
State Street Bank and Trust Co., dated 5/29/15, 0.00%, due 6/1/15, proceeds $25,507,000; collateralized by U.S. Treasury Notes, 2.125%, due 6/30/21, valued at $26,022,231 including accrued interest |
| |||||||
(cost—$25,507,000) | $25,507 | $ | 25,507,000 | |||||
|
| |||||||
| Total Investments (cost—$325,982,886) (a)—100.1% | 367,427,292 | |||||||
|
| |||||||
| Liabilities in excess of other assets—(0.1)% | (505,779 | ) | ||||||
|
| |||||||
| Net Assets—100.0% | $366,921,513 | |||||||
|
| |||||||
Notes to Schedule of Investments:
(a) Securities with an aggregate value of $167,618,579, representing 45.7% of net assets, were valued utilizing modeling tools provided by a third-party vendor. See Note 1(a) and Note 1(b) in the Notes to Financial Statements.
(b) Affiliated security.
(c) Non-income producing.
The industry classification of portfolio holdings and liabilities in excess of other assets shown as a percentage of net assets were as follows:
Machinery | 37.0% | |||
Water Utilities | 18.5% | |||
Industrial Conglomerates | 9.2% | |||
Building Products | 7.8% | |||
Multi-Utilities | 6.2% | |||
Electronic Equipment, Instruments & Components | 4.6% | |||
Electrical Equipment | 3.4% | |||
Construction & Engineering | 2.6% | |||
Professional Services | 2.0% | |||
Chemicals | 0.9% | |||
Commercial Services & Supplies | 0.9% | |||
Repurchase Agreements | 7.0% | |||
Liabilities in excess of other assets | (0.1)% | |||
|
| |||
| 100.0% | ||||
|
|
AllianzGI High Yield Bond Fund
| Principal Amount (000s) | Value | |||||||
| Corporate Bonds & Notes—96.5% | ||||||||
| Advertising—0.4% | ||||||||
Affinion Group, Inc., |
| |||||||
7.875%, 12/15/18 | $2,150 | $1,515,750 | ||||||
|
| |||||||
| Aerospace & Defense—1.4% | ||||||||
KLX, Inc. (a)(b), |
| |||||||
5.875%, 12/1/22 | 1,165 | 1,183,931 | ||||||
Kratos Defense & Security Solutions, Inc., |
| |||||||
7.00%, 5/15/19 | 1,322 | 1,183,190 | ||||||
TransDigm, Inc., | ||||||||
6.50%, 5/15/25 (a)(b) | 1,430 | 1,465,750 | ||||||
7.50%, 7/15/21 | 1,830 | 1,985,550 | ||||||
|
| |||||||
| 5,818,421 | ||||||||
|
| |||||||
| Auto Components—2.1% | ||||||||
American Axle & Manufacturing, Inc., |
| |||||||
6.625%, 10/15/22 | 2,490 | 2,686,088 | ||||||
Commercial Vehicle Group, Inc., |
| |||||||
7.875%, 4/15/19 | 2,955 | 3,065,812 | ||||||
Goodyear Tire & Rubber Co., |
| |||||||
8.25%, 8/15/20 | 2,605 | 2,748,275 | ||||||
|
| |||||||
| 8,500,175 | ||||||||
|
| |||||||
| Auto Manufacturers—1.5% | ||||||||
FCA US LLC, |
| |||||||
8.25%, 6/15/21 | 2,845 | 3,149,415 | ||||||
Navistar International Corp., |
| |||||||
8.25%, 11/1/21 | 2,790 | 2,803,950 | ||||||
|
| |||||||
| 5,953,365 | ||||||||
|
| |||||||
| Building Materials—0.8% | ||||||||
Louisiana-Pacific Corp., |
| |||||||
7.50%, 6/1/20 | 3,045 | 3,273,375 | ||||||
|
| |||||||
| Chemicals—2.4% | ||||||||
A Schulman, Inc. (a)(b), |
| |||||||
6.875%, 6/1/23 | 2,465 | 2,520,462 | ||||||
Chemours Co. (a)(b), |
| |||||||
7.00%, 5/15/25 | 2,760 | 2,815,200 | ||||||
OMNOVA Solutions, Inc., |
| |||||||
7.875%, 11/1/18 | 2,220 | 2,272,725 | ||||||
Platform Specialty Products Corp. (a)(b), |
| |||||||
6.50%, 2/1/22 | 1,805 | 1,904,275 | ||||||
|
| |||||||
| 9,512,662 | ||||||||
|
| |||||||
| Coal—0.4% | ||||||||
Arch Coal, Inc., |
| |||||||
9.875%, 6/15/19 | 2,995 | 673,875 | ||||||
CONSOL Energy, Inc., |
| |||||||
5.875%, 4/15/22 | 1,145 | 1,081,309 | ||||||
|
| |||||||
| 1,755,184 | ||||||||
|
| |||||||
| Commercial Services—7.0% | ||||||||
Cardtronics, Inc. (a)(b), |
| |||||||
5.125%, 8/1/22 | 1,440 | 1,440,000 | ||||||
Cenveo Corp., |
| |||||||
11.50%, 5/15/17 | 3,105 | 3,202,031 | ||||||
ExamWorks Group, Inc., |
| |||||||
5.625%, 4/15/23 | 2,020 | 2,073,025 | ||||||
Harland Clarke Holdings Corp. (a)(b), |
| |||||||
9.25%, 3/1/21 | 3,020 | 2,895,425 | ||||||
9.75%, 8/1/18 | 3,050 | 3,226,137 | ||||||
Hertz Corp., |
| |||||||
6.75%, 4/15/19 | 1,985 | 2,059,438 | ||||||
RR Donnelley & Sons Co., | ||||||||
6.00%, 4/1/24 | 2,415 | 2,502,544 | ||||||
7.00%, 2/15/22 | 3,845 | 4,215,081 | ||||||
SFX Entertainment, Inc. (a)(b), |
| |||||||
9.625%, 2/1/19 | 2,761 | 2,402,070 | ||||||
| Principal Amount (000s) | Value | |||||||
United Rentals North America, Inc., |
| |||||||
5.50%, 7/15/25 | $ | 2,950 | $ | 2,950,000 | ||||
8.25%, 2/1/21 | 1,184 | 1,280,200 | ||||||
|
| |||||||
| 28,245,951 | ||||||||
|
| |||||||
| Communications Equipment—0.3% | ||||||||
CommScope Holding Co., Inc. (b), |
| |||||||
6.00%, 6/15/25 | 1,080 | 1,096,200 | ||||||
|
| |||||||
| Computers—0.5% | ||||||||
Unisys Corp., |
| |||||||
6.25%, 8/15/17 | 1,850 | 1,977,188 | ||||||
|
| |||||||
| Containers & Packaging—0.9% | ||||||||
Owens-Brockway Glass Container, Inc. (a)(b), |
| |||||||
5.00%, 1/15/22 | 660 | 675,675 | ||||||
Reynolds Group Issuer, Inc., |
| |||||||
9.875%, 8/15/19 | 2,680 | 2,849,175 | ||||||
|
| |||||||
| 3,524,850 | ||||||||
|
| |||||||
| Distribution/Wholesale—2.6% | ||||||||
H&E Equipment Services, Inc., |
| |||||||
7.00%, 9/1/22 | 2,375 | 2,517,500 | ||||||
HD Supply, Inc., |
| |||||||
11.00%, 4/15/20 | 3,975 | 4,521,562 | ||||||
Park-Ohio Industries, Inc., |
| |||||||
8.125%, 4/1/21 | 3,165 | 3,370,725 | ||||||
|
| |||||||
| 10,409,787 | ||||||||
|
| |||||||
| Diversified Financial Services—5.5% | ||||||||
Ally Financial, Inc., |
| |||||||
8.00%, 3/15/20 | 2,355 | 2,790,675 | ||||||
Community Choice Financial, Inc., |
| |||||||
10.75%, 5/1/19 | 2,815 | 1,393,425 | ||||||
International Lease Finance Corp., |
| |||||||
8.25%, 12/15/20 | 3,350 | 4,078,625 | ||||||
Nationstar Mortgage LLC, | ||||||||
7.875%, 10/1/20 | 1,950 | 1,986,563 | ||||||
9.625%, 5/1/19 | 3,000 | 3,206,250 | ||||||
Navient Corp., |
| |||||||
8.45%, 6/15/18 | 2,365 | 2,654,712 | ||||||
Springleaf Finance Corp., | ||||||||
6.90%, 12/15/17 | 1,215 | 1,300,050 | ||||||
8.25%, 10/1/23 | 3,945 | 4,517,025 | ||||||
|
| |||||||
| 21,927,325 | ||||||||
|
| |||||||
| Electric Utilities—0.9% | ||||||||
NRG Energy, Inc., |
| |||||||
6.25%, 5/1/24 | 2,001 | 2,056,027 | ||||||
PPL Energy Supply LLC (a)(b), |
| |||||||
6.50%, 6/1/25 | 1,355 | 1,382,534 | ||||||
|
| |||||||
| 3,438,561 | ||||||||
|
| |||||||
| Electrical Equipment—1.2% | ||||||||
Anixter, Inc., |
| |||||||
5.125%, 10/1/21 | 100 | 103,625 | ||||||
Edgewell Personal Care Co. (a)(b)(c), |
| |||||||
5.50%, 6/15/25 | 1,600 | 1,604,000 | ||||||
WireCo WorldGroup, Inc., |
| |||||||
9.50%, 5/15/17 | 3,440 | 3,199,200 | ||||||
|
| |||||||
| 4,906,825 | ||||||||
|
| |||||||
| Electronics—2.0% | ||||||||
Kemet Corp., |
| |||||||
10.50%, 5/1/18 | 4,659 | 4,752,180 | ||||||
Viasystems, Inc. (a)(b), |
| |||||||
7.875%, 5/1/19 | 3,080 | 3,276,350 | ||||||
|
| |||||||
| 8,028,530 | ||||||||
|
| |||||||
| Engineering & Construction—1.3% | ||||||||
AECOM (a)(b), |
| |||||||
5.875%, 10/15/24 | 3,305 | 3,445,462 | ||||||
Dycom Investments, Inc., |
| |||||||
7.125%, 1/15/21 | 1,870 | 1,977,525 | ||||||
|
| |||||||
| 5,422,987 | ||||||||
|
| |||||||
| See accompanying Notes to Financial Statements | | May 31, 2015 | | Semiannual Report | 147 |
Table of Contents
Schedule of Investments
May 31, 2015 (Unaudited)
| Principal Amount (000s) | Value | |||||||
| Entertainment—1.8% | ||||||||
AMC Entertainment, Inc., |
| |||||||
9.75%, 12/1/20 | $ | 2,495 | $ | 2,730,653 | ||||
Cedar Fair L.P., |
| |||||||
5.375%, 6/1/24 | 3,145 | 3,294,387 | ||||||
International Game Technology PLC (a)(b), |
| |||||||
6.25%, 2/15/22 | 1,175 | 1,145,625 | ||||||
|
| |||||||
| 7,170,665 | ||||||||
|
| |||||||
| Food & Beverage—0.2% | ||||||||
SUPERVALU, Inc., |
| |||||||
8.00%, 5/1/16 | 832 | 880,880 | ||||||
|
| |||||||
| Healthcare-Products—1.7% | ||||||||
Kinetic Concepts, Inc., |
| |||||||
10.50%, 11/1/18 | 2,570 | 2,770,460 | ||||||
Teleflex, Inc., | 3,855 | 3,951,375 | ||||||
|
| |||||||
| 6,721,835 | ||||||||
|
| |||||||
| Healthcare-Services—4.3% | ||||||||
Community Health Systems, Inc., |
| |||||||
7.125%, 7/15/20 | 1,150 | 1,229,063 | ||||||
8.00%, 11/15/19 | 3,220 | 3,429,300 | ||||||
Envision Healthcare Corp. (a)(b), |
| |||||||
5.125%, 7/1/22 | 1,980 | 2,044,350 | ||||||
HCA, Inc., |
| |||||||
7.50%, 2/15/22 | 2,440 | 2,860,900 | ||||||
Kindred Healthcare, Inc., | ||||||||
6.375%, 4/15/22 | 2,123 | 2,173,421 | ||||||
8.75%, 1/15/23 (a)(b) | 1,235 | 1,375,481 | ||||||
Tenet Healthcare Corp., |
| |||||||
8.125%, 4/1/22 | 3,820 | 4,173,350 | ||||||
|
| |||||||
| 17,285,865 | ||||||||
|
| |||||||
| Holding Companies-Diversified—0.5% | ||||||||
Horizon Pharma Financing, Inc. (a)(b), |
| |||||||
6.625%, 5/1/23 | 1,895 | 1,956,588 | ||||||
|
| |||||||
| Home Builders—3.2% | ||||||||
Beazer Homes USA, Inc., |
| |||||||
9.125%, 5/15/19 | 1,125 | 1,172,813 | ||||||
Brookfield Residential Properties, Inc. (a)(b), |
| |||||||
6.50%, 12/15/20 | 3,165 | 3,267,862 | ||||||
KB Home, |
| |||||||
8.00%, 3/15/20 | 3,105 | 3,465,956 | ||||||
Standard Pacific Corp., | ||||||||
5.875%, 11/15/24 | 615 | 642,675 | ||||||
8.375%, 5/15/18 | 3,110 | 3,576,500 | ||||||
William Lyon Homes, Inc., |
| |||||||
8.50%, 11/15/20 | 585 | 639,113 | ||||||
|
| |||||||
| 12,764,919 | ||||||||
|
| |||||||
| Household Products/Wares—0.7% | ||||||||
Spectrum Brands, Inc. (a)(b), |
| |||||||
5.75%, 7/15/25 | 2,825 | 2,916,812 | ||||||
|
| |||||||
| Insurance—0.5% | ||||||||
CNO Financial Group, Inc., |
| |||||||
5.25%, 5/30/25 | 1,885 | 1,960,400 | ||||||
|
| |||||||
| Internet—2.2% | ||||||||
Affinion Investments LLC, |
| |||||||
13.50%, 8/15/18 | 2,098 | 1,185,314 | ||||||
Equinix, Inc., |
| |||||||
5.375%, 1/1/22 | 1,660 | 1,735,737 | ||||||
j2 Global, Inc., |
| |||||||
8.00%, 8/1/20 | 3,780 | 4,091,850 | ||||||
Netflix, Inc. (a)(b), |
| |||||||
5.875%, 2/15/25 | 1,930 | 2,026,500 | ||||||
|
| |||||||
| 9,039,401 | ||||||||
|
| |||||||
| Iron/Steel—0.8% | ||||||||
AK Steel Corp., | ||||||||
7.625%, 5/15/20 | 650 | 576,063 | ||||||
8.375%, 4/1/22 | 1,550 | 1,354,312 | ||||||
8.75%, 12/1/18 | 770 | 817,163 | ||||||
| Principal Amount (000s) | Value | |||||||
Steel Dynamics, Inc., |
| |||||||
5.50%, 10/1/24 | $ | 635 | $ | 656,431 | ||||
|
| |||||||
| 3,403,969 | ||||||||
|
| |||||||
| Leisure Time—0.6% | ||||||||
NCL Corp. Ltd. (a)(b), |
| |||||||
5.25%, 11/15/19 | 2,195 | 2,279,947 | ||||||
|
| |||||||
| Lodging—0.4% | ||||||||
Wynn Las Vegas LLC (a)(b), |
| |||||||
5.50%, 3/1/25 | 1,455 | 1,462,275 | ||||||
|
| |||||||
| Machinery-Construction & Mining—0.7% | ||||||||
BlueLine Rental Finance Corp. (a)(b), |
| |||||||
7.00%, 2/1/19 | 2,735 | 2,837,563 | ||||||
|
| |||||||
| Machinery-Diversified—0.7% | ||||||||
Zebra Technologies Corp. (a)(b), |
| |||||||
7.25%, 10/15/22 | 2,680 | 2,914,500 | ||||||
|
| |||||||
| Media—7.5% | ||||||||
American Media, Inc., |
| |||||||
11.50%, 12/15/17 | 2,565 | 2,699,663 | ||||||
Cablevision Systems Corp., |
| |||||||
8.625%, 9/15/17 | 2,545 | 2,828,131 | ||||||
CCO Holdings LLC, |
| |||||||
5.75%, 1/15/24 | 2,200 | 2,271,500 | ||||||
Clear Channel Worldwide Holdings, Inc., |
| |||||||
6.50%, 11/15/22 | 3,710 | 3,941,875 | ||||||
DISH DBS Corp., |
| |||||||
5.875%, 7/15/22 | 1,275 | 1,303,688 | ||||||
Gray Television, Inc., |
| |||||||
7.50%, 10/1/20 | 3,045 | 3,258,150 | ||||||
LIN Television Corp. (a)(b), |
| |||||||
5.875%, 11/15/22 | 1,930 | 1,983,075 | ||||||
McClatchy Co., |
| |||||||
9.00%, 12/15/22 | 3,440 | 3,366,900 | ||||||
McGraw-Hill Global Education Holdings LLC, |
| |||||||
9.75%, 4/1/21 | 3,615 | 4,021,687 | ||||||
Nexstar Broadcasting, Inc., |
| |||||||
6.875%, 11/15/20 | 2,390 | 2,551,325 | ||||||
Sinclair Television Group, Inc., |
| |||||||
6.375%, 11/1/21 | 1,670 | 1,770,200 | ||||||
|
| |||||||
| 29,996,194 | ||||||||
|
| |||||||
| Metals & Mining—0.8% | ||||||||
ArcelorMittal, |
| |||||||
10.60%, 6/1/19 | 2,565 | 3,119,681 | ||||||
|
| |||||||
| Mining—1.3% | ||||||||
Alcoa, Inc., |
| |||||||
5.90%, 2/1/27 | 1,115 | 1,220,925 | ||||||
HudBay Minerals, Inc., |
| |||||||
9.50%, 10/1/20 | 1,795 | 1,929,625 | ||||||
Thompson Creek Metals Co., Inc., |
| |||||||
7.375%, 6/1/18 | 2,350 | 2,056,250 | ||||||
|
| |||||||
| 5,206,800 | ||||||||
|
| |||||||
| Miscellaneous Manufacturing—0.6% | ||||||||
Trinseo Materials Operating SCA (a)(b), |
| |||||||
6.75%, 5/1/22 | 2,250 | 2,297,813 | ||||||
|
| |||||||
| Oil, Gas & Consumable Fuels—10.1% | ||||||||
BreitBurn Energy Partners L.P., |
| |||||||
8.625%, 10/15/20 | 3,220 | 2,914,100 | ||||||
Calumet Specialty Products Partners L.P., |
| |||||||
6.50%, 4/15/21 | 3,565 | 3,587,281 | ||||||
Carrizo Oil & Gas, Inc., |
| |||||||
6.25%, 4/15/23 | 735 | 751,538 | ||||||
Chesapeake Energy Corp., |
| |||||||
6.625%, 8/15/20 | 3,615 | 3,813,825 | ||||||
Concho Resources, Inc., |
| |||||||
7.00%, 1/15/21 | 1,930 | 2,045,800 | ||||||
CVR Refining LLC, |
| |||||||
6.50%, 11/1/22 | 2,175 | 2,240,250 | ||||||
| Principal Amount (000s) | Value | |||||||
Energy XXI Gulf Coast, Inc., | ||||||||
9.25%, 12/15/17 | $ | 2,285 | $ | 1,570,937 | ||||
11.00%, 3/15/20 (a)(b) | 4,185 | 3,850,200 | ||||||
EP Energy LLC, |
| |||||||
9.375%, 5/1/20 | 2,860 | 3,124,550 | ||||||
Linn Energy LLC, |
| |||||||
6.50%, 9/15/21 | 1,415 | 1,142,613 | ||||||
Range Resources Corp. (a)(b), |
| |||||||
4.875%, 5/15/25 | 2,485 | 2,488,106 | ||||||
Rice Energy, Inc., |
| |||||||
6.25%, 5/1/22 | 2,710 | 2,792,980 | ||||||
Sanchez Energy Corp., |
| |||||||
6.125%, 1/15/23 | 2,625 | 2,506,875 | ||||||
Sunoco L.P. (a)(b), |
| |||||||
6.375%, 4/1/23 | 3,055 | 3,192,475 | ||||||
Ultra Petroleum Corp. (a)(b), |
| |||||||
6.125%, 10/1/24 | 610 | 563,488 | ||||||
United Refining Co., |
| |||||||
10.50%, 2/28/18 | 1,434 | 1,512,870 | ||||||
Vanguard Natural Resources LLC, |
| |||||||
7.875%, 4/1/20 | 2,560 | 2,521,600 | ||||||
|
| |||||||
| 40,619,488 | ||||||||
|
| |||||||
| Paper & Forest Products—0.5% | ||||||||
Mercer International, Inc., |
| |||||||
7.75%, 12/1/22 | 1,825 | 1,975,563 | ||||||
|
| |||||||
| Pharmaceuticals—2.5% | ||||||||
Endo Finance LLC (a)(b), | ||||||||
5.375%, 1/15/23 | 1,825 | 1,788,500 | ||||||
7.00%, 12/15/20 | 3,745 | 3,955,656 | ||||||
Omnicare, Inc., |
| |||||||
5.00%, 12/1/24 | 1,085 | 1,205,706 | ||||||
Valeant Pharmaceuticals International, Inc. (a)(b), |
| |||||||
6.125%, 4/15/25 | 2,870 | 2,995,563 | ||||||
|
| |||||||
| 9,945,425 | ||||||||
|
| |||||||
| Pipelines—1.4% | ||||||||
Energy Transfer Equity L.P., |
| |||||||
5.875%, 1/15/24 | 1,755 | 1,873,462 | ||||||
Sabine Pass Liquefaction LLC, |
| |||||||
5.75%, 5/15/24 | 2,309 | 2,358,066 | ||||||
Tesoro Logistics L.P., | ||||||||
6.125%, 10/15/21 | 765 | 807,075 | ||||||
6.25%, 10/15/22 (a)(b) | 745 | 791,563 | ||||||
|
| |||||||
| 5,830,166 | ||||||||
|
| |||||||
| Real Estate—0.6% | ||||||||
Kennedy-Wilson, Inc., |
| |||||||
5.875%, 4/1/24 | 2,481 | 2,530,620 | ||||||
|
| |||||||
| Real Estate Investment Trust—0.2% | ||||||||
iStar Financial, Inc., |
| |||||||
7.125%, 2/15/18 | 720 | 765,900 | ||||||
|
| |||||||
| Retail—4.2% | ||||||||
Caleres, Inc., |
| |||||||
7.125%, 5/15/19 | 3,890 | 4,045,600 | ||||||
Conn’s, Inc. (a)(b), |
| |||||||
7.25%, 7/15/22 | 2,205 | 2,127,825 | ||||||
Family Tree Escrow LLC (a)(b), |
| |||||||
5.75%, 3/1/23 | 2,815 | 2,980,381 | ||||||
Neiman Marcus Group Ltd. LLC (a)(b), |
| |||||||
8.00%, 10/15/21 | 3,465 | 3,733,538 | ||||||
Sonic Automotive, Inc., |
| |||||||
7.00%, 7/15/22 | 3,665 | 3,994,850 | ||||||
|
| |||||||
| 16,882,194 | ||||||||
|
| |||||||
| Semiconductors—3.8% | ||||||||
Advanced Micro Devices, Inc., | ||||||||
6.75%, 3/1/19 | 1,860 | 1,667,025 | ||||||
7.50%, 8/15/22 | 885 | 783,225 | ||||||
Amkor Technology, Inc., |
| |||||||
6.375%, 10/1/22 | 3,500 | 3,600,625 | ||||||
Freescale Semiconductor, Inc. (a)(b), |
| |||||||
6.00%, 1/15/22 | 3,306 | 3,570,480 | ||||||
Micron Technology, Inc., |
| |||||||
5.875%, 2/15/22 | 2,900 | 3,055,875 | ||||||
| 148 | Semiannual Report | | May 31, 2015 | | See accompanying Notes to Financial Statements |
Table of Contents
Schedule of Investments
May 31, 2015 (Unaudited)
| Principal Amount (000s) | Value | |||||||
Sensata Technologies BV (a)(b), |
| |||||||
5.625%, 11/1/24 | $ | 2,285 | $ | 2,444,950 | ||||
|
| |||||||
| 15,122,180 | ||||||||
|
| |||||||
| Shipbuilding—0.5% | ||||||||
Huntington Ingalls Industries, Inc. (a)(b), |
| |||||||
5.00%, 12/15/21 | 2,005 | 2,092,719 | ||||||
|
| |||||||
| Software—2.0% | ||||||||
First Data Corp., | ||||||||
10.625%, 6/15/21 | 1,848 | 2,092,860 | ||||||
12.625%, 1/15/21 | 1,410 | 1,654,988 | ||||||
MSCI, Inc. (a)(b), |
| |||||||
5.25%, 11/15/24 | 1,950 | 2,040,187 | ||||||
Open Text Corp. (a)(b), |
| |||||||
5.625%, 1/15/23 | 2,280 | 2,302,800 | ||||||
|
| |||||||
| 8,090,835 | ||||||||
|
| |||||||
| Telecommunications—8.7% | ||||||||
Consolidated Communications, Inc., |
| |||||||
6.50%, 10/1/22 (a)(b) | 1,745 | 1,771,175 | ||||||
10.875%, 6/1/20 | 2,580 | 2,899,275 | ||||||
EarthLink Holdings Corp., | ||||||||
7.375%, 6/1/20 | 1,550 | 1,629,438 | ||||||
8.875%, 5/15/19 | 1,532 | 1,600,940 | ||||||
Hughes Satellite Systems Corp., |
| |||||||
7.625%, 6/15/21 | 3,665 | 4,132,287 | ||||||
Intelsat Jackson Holdings S.A., |
| |||||||
7.25%, 4/1/19 | 2,335 | 2,402,131 | ||||||
Level 3 Financing, Inc. (a)(b), |
| |||||||
5.375%, 5/1/25 | 2,990 | 2,978,788 | ||||||
Sprint Communications, Inc., |
| |||||||
6.00%, 11/15/22 | 1,065 | 1,022,400 | ||||||
11.50%, 11/15/21 | 3,515 | 4,279,512 | ||||||
Sprint Corp., |
| |||||||
7.125%, 6/15/24 | 1,290 | 1,251,300 | ||||||
T-Mobile USA, Inc., | ||||||||
6.625%, 11/15/20 | 1,935 | 2,031,750 | ||||||
6.625%, 4/1/23 | 1,160 | 1,223,800 | ||||||
6.836%, 4/28/23 | 2,885 | 3,079,738 | ||||||
West Corp. (a)(b), |
| |||||||
5.375%, 7/15/22 | 2,075 | 2,020,531 | ||||||
Windstream Services LLC, |
| |||||||
7.50%, 6/1/22 | 2,720 | 2,492,200 | ||||||
|
| |||||||
| 34,815,265 | ||||||||
|
| |||||||
| Transportation—1.6% | ||||||||
Erickson, Inc., |
| |||||||
8.25%, 5/1/20 | 2,941 | 2,242,512 | ||||||
Quality Distribution LLC, |
| |||||||
9.875%, 11/1/18 | 1,468 | 1,552,410 | ||||||
XPO Logistics, Inc. (a)(b), |
| |||||||
7.875%, 9/1/19 | 2,620 | 2,823,050 | ||||||
|
| |||||||
| 6,617,972 | ||||||||
|
| |||||||
| Utilities—0.7% | ||||||||
TerraForm Power Operating LLC (a)(b), |
| |||||||
5.875%, 2/1/23 | 2,645 | 2,737,575 | ||||||
|
| |||||||
| Total Corporate Bonds & Notes (cost—$385,260,099) | 387,549,145 | |||||||
|
| |||||||
| Repurchase Agreements—2.7% | ||||||||
State Street Bank and Trust Co., dated 5/29/15, 0.00%, due 6/1/15, proceeds $10,810,000; collateralized by U.S. Treasury Notes, 2.125%, due 9/30/21, valued at $11,027,663 including accrued interest |
| |||||||
(cost—$10,810,000) | 10,810 | 10,810,000 | ||||||
|
| |||||||
| Total Investments (cost—$396,070,099)—99.2% | 398,359,145 | |||||||
|
| |||||||
| Other assets less liabilities—0.8% | 3,323,393 | |||||||
|
| |||||||
| Net Assets—100.0% | $401,682,538 | |||||||
|
| |||||||
Notes to Schedule of Investments:
(a) Private Placement—Restricted as to resale and may not have a readily available market. Securities with an aggregate value of $111,995,212, representing 27.9% of net assets.
(b) 144A—Exempt from registration under Rule 144A of the Securities Act of 1933. These securities may be resold in transactions exempt from registration, typically only to qualified institutional buyers. Unless otherwise indicated, these securities are not considered to be illiquid.
(c) When-issued or delayed-delivery. To be settled/delivered after May 31, 2015.
Glossary:
MSCI—Morgan Stanley Capital International
AllianzGI International Growth Fund
| Shares | Value | |||||||
| Common Stock—98.3% | ||||||||
| Australia—3.2% | ||||||||
Brambles Ltd. | 3,568 | $31,073 | ||||||
CSL Ltd. | 463 | 32,989 | ||||||
REA Group Ltd. | 469 | 13,931 | ||||||
Seek Ltd. | 1,975 | 25,409 | ||||||
|
| |||||||
| 103,402 | ||||||||
|
| |||||||
| Brazil—6.2% | ||||||||
Ambev S.A. | 6,072 | 35,064 | ||||||
Cielo S.A. | 2,664 | 33,443 | ||||||
Lojas Renner S.A. | 1,154 | 38,771 | ||||||
Odontoprev S.A. | 8,272 | 29,362 | ||||||
Ultrapar Participacoes S.A. | 1,252 | 26,971 | ||||||
WEG S.A. | 6,816 | 36,815 | ||||||
|
| |||||||
| 200,426 | ||||||||
|
| |||||||
| Canada—5.4% | ||||||||
Bank of Nova Scotia | 762 | 40,073 | ||||||
Canadian National Railway Co. | 901 | 53,447 | ||||||
Restaurant Brands International, Inc. | 1,437 | 55,650 | ||||||
Richelieu Hardware Ltd. | 514 | 25,212 | ||||||
|
| |||||||
| 174,382 | ||||||||
|
| |||||||
| China—1.5% | ||||||||
Tencent Holdings Ltd. | 2,394 | 47,866 | ||||||
|
| |||||||
| Denmark—7.6% | ||||||||
Ambu A/S, Class B | 1,476 | 43,266 | ||||||
DSV A/S (b) | 1,687 | 58,572 | ||||||
Novo Nordisk A/S, Class B | 1,828 | 103,703 | ||||||
SimCorp A/S (b) | 978 | 36,714 | ||||||
|
| |||||||
| 242,255 | ||||||||
|
| |||||||
| France—9.6% | ||||||||
Bureau Veritas S.A. (b) | 1,658 | 37,953 | ||||||
Dassault Systemes | 449 | 35,035 | ||||||
L’Oreal S.A. | 251 | 47,339 | ||||||
Legrand S.A. | 1,258 | 70,703 | ||||||
Schneider Electric SE | 984 | 74,184 | ||||||
Sodexo S.A. | 421 | 43,391 | ||||||
|
| |||||||
| 308,605 | ||||||||
|
| |||||||
| Germany—9.4% | ||||||||
Fresenius SE & Co. KGaA | 719 | 45,866 | ||||||
HUGO BOSS AG (b) | 473 | 54,062 | ||||||
Infineon Technologies AG (b) | 4,172 | 54,484 | ||||||
Kontron AG (c) | 3,577 | 17,997 | ||||||
Linde AG | 196 | 37,660 | ||||||
Norma Group SE (b) | 515 | 27,650 | ||||||
SAP SE | 877 | 65,112 | ||||||
|
| |||||||
| 302,831 | ||||||||
|
| |||||||
| Hong Kong—2.8% | ||||||||
AIA Group Ltd. | 10,389 | 68,065 | ||||||
Biostime International Holdings Ltd. | 5,033 | 21,005 | ||||||
|
| |||||||
| 89,070 | ||||||||
|
| |||||||
| Indonesia—1.3% | ||||||||
Ace Hardware Indonesia Tbk PT | 459,400 | 23,971 | ||||||
Bank Mandiri Persero Tbk PT | 20,600 | 16,776 | ||||||
|
| |||||||
| 40,747 | ||||||||
|
| |||||||
| Japan—8.9% | ||||||||
Keyence Corp. | 134 | 71,889 | ||||||
Nippon Paint Holdings Co., Ltd. | 1,012 | 31,253 | ||||||
SMC Corp. | 222 | 66,944 | ||||||
Sundrug Co., Ltd. | 591 | 31,225 | ||||||
Sysmex Corp. | 897 | 51,746 | ||||||
Unicharm Corp. | 1,524 | 33,615 | ||||||
|
| |||||||
| 286,672 | ||||||||
|
| |||||||
| See accompanying Notes to Financial Statements | | May 31, 2015 | | Semiannual Report | 149 |
Table of Contents
Schedule of Investments
May 31, 2015 (Unaudited)
| Shares | Value | |||||||
| Korea (Republic of)—1.5% | ||||||||
LG Household & Health Care Ltd. | 68 | $ | 49,577 | |||||
|
| |||||||
| Luxembourg—2.0% | ||||||||
Samsonite International S.A. | 17,863 | 64,931 | ||||||
|
| |||||||
| Mexico—1.2% | ||||||||
Fomento Economico Mexicano S.A.B. de C.V. UNIT | 4,190 | 37,299 | ||||||
|
| |||||||
| Netherlands—3.0% | ||||||||
Akzo Nobel NV | 544 | 41,364 | ||||||
ASML Holding NV | 481 | 53,840 | ||||||
|
| |||||||
| 95,204 | ||||||||
|
| |||||||
| Philippines—2.2% | ||||||||
Jollibee Foods Corp. | 5,340 | 24,053 | ||||||
Universal Robina Corp. | 10,980 | 46,895 | ||||||
|
| |||||||
| 70,948 | ||||||||
|
| |||||||
| South Africa—1.2% | ||||||||
Woolworths Holdings Ltd. | 4,777 | 37,576 | ||||||
|
| |||||||
| Spain—1.6% | ||||||||
Inditex S.A. | 1,526 | 50,523 | ||||||
|
| |||||||
| Sweden—7.1% | ||||||||
Atlas Copco AB, Class A | 1,995 | 60,359 | ||||||
Elekta AB, Class B | 2,700 | 19,015 | ||||||
Hexagon AB, Class B | 1,629 | 59,796 | ||||||
Hexpol AB | 5,000 | 54,269 | ||||||
Trelleborg AB, Class B (b) | 1,685 | 32,876 | ||||||
|
| |||||||
| 226,315 | ||||||||
|
| |||||||
| Switzerland—6.7% | ||||||||
Cie Financiere Richemont S.A. | 782 | 67,542 | ||||||
Roche Holding AG | 196 | 59,755 | ||||||
Sika AG | 8 | 27,524 | ||||||
UBS Group AG | 2,753 | 59,249 | ||||||
|
| |||||||
| 214,070 | ||||||||
|
| |||||||
| United Kingdom—15.9% | ||||||||
British American Tobacco PLC | 1,337 | 73,849 | ||||||
Diageo PLC | 1,885 | 52,310 | ||||||
IMI PLC | 1,730 | 32,928 | ||||||
Prudential PLC | 2,567 | 63,968 | ||||||
Reckitt Benckiser Group PLC | 1,021 | 92,212 | ||||||
Rotork PLC (b) | 8,630 | 33,408 | ||||||
Shire PLC | 660 | 57,084 | ||||||
Spirax-Sarco Engineering PLC (b) | 628 | 33,444 | ||||||
Unilever PLC | 1,561 | 69,048 | ||||||
|
| |||||||
| 508,251 | ||||||||
|
| |||||||
| Total Investments (cost—$2,971,964) (a)—98.3% | 3,150,950 | |||||||
|
| |||||||
| Other assets less liabilities—1.7% | 54,492 | |||||||
|
| |||||||
| Net Assets—100.0% | $3,205,442 | |||||||
|
| |||||||
Notes to Schedule of Investments:
(a) Securities with an aggregate value of $2,633,537, representing 82.2% of net assets, were valued utilizing modeling tools provided by a third-party vendor. See Note 1(a) and Note 1(b) in the Notes to Financial Statements.
(b) Affiliated security.
(c) Non-income producing.
Glossary:
UNIT—More than one class of securities traded together.
The industry classification of portfolio holdings and other assets less liabilities shown as a percentage of net assets were as follows:
Machinery | 10.2% | |||
Pharmaceuticals | 6.9% | |||
Chemicals | 6.1% | |||
Textiles, Apparel & Luxury Goods | 5.8% | |||
Household Products | 5.4% | |||
Electrical Equipment | 4.5% | |||
Food Products | 4.4% | |||
Software | 4.3% | |||
Insurance | 4.1% | |||
Electronic Equipment, Instruments & Components | 4.1% | |||
Semiconductors & Semiconductor Equipment | 3.9% | |||
Beverages | 3.9% | |||
Hotels, Restaurants & Leisure | 3.7% | |||
Health Care Equipment & Supplies | 3.6% | |||
Road & Rail | 3.5% | |||
Multi-line Retail | 2.4% | |||
Specialty Retail | 2.4% | |||
Health Care Providers & Services | 2.3% | |||
Tobacco | 2.3% | |||
Professional Services | 2.0% | |||
Capital Markets | 1.8% | |||
Banks | 1.7% | |||
Internet Software & Services | 1.5% | |||
Personal Products | 1.5% | |||
IT Services | 1.0% | |||
Biotechnology | 1.0% | |||
Food & Staples Retailing | 1.0% | |||
Commercial Services & Supplies | 1.0% | |||
Oil, Gas & Consumable Fuels | 0.8% | |||
Trading Companies & Distributors | 0.8% | |||
Media | 0.4% | |||
Other assets less liabilities | 1.7% | |||
|
| |||
| 100.0% | ||||
|
|
AllianzGI International Small-Cap Fund
| Shares | Value | |||||||
| Common Stock—92.6% | ||||||||
| Australia—2.7% | ||||||||
Challenger Ltd. | 194,200 | $1,016,296 | ||||||
Dick Smith Holdings Ltd. | 426,528 | 715,500 | ||||||
Slater & Gordon Ltd. | 157,027 | 721,075 | ||||||
Spotless Group Holdings Ltd. | 502,890 | 862,241 | ||||||
|
| |||||||
| 3,315,112 | ||||||||
|
| |||||||
| Austria—3.2% | ||||||||
ams AG | 49,649 | 2,952,282 | ||||||
Schoeller-Bleckmann Oilfield Equipment AG (d) | 13,795 | 913,866 | ||||||
|
| |||||||
| 3,866,148 | ||||||||
|
| |||||||
| Belgium—1.4% | ||||||||
Ontex Group NV (d) | 56,453 | 1,743,230 | ||||||
|
| |||||||
| China—1.8% | ||||||||
China Everbright International Ltd. | 677,000 | 1,288,185 | ||||||
Sunny Optical Technology Group Co., Ltd. | 405,000 | 885,127 | ||||||
|
| |||||||
| 2,173,312 | ||||||||
|
| |||||||
| Denmark—1.6% | ||||||||
SimCorp A/S (d) | 51,399 | 1,929,520 | ||||||
|
| |||||||
| Finland—2.5% | ||||||||
Amer Sports Oyj | 66,146 | 1,688,017 | ||||||
Huhtamaki Oyj | 38,463 | 1,297,058 | ||||||
|
| |||||||
| 2,985,075 | ||||||||
|
| |||||||
| France—6.1% | ||||||||
GameLoft SE (d)(e) | 165,335 | 813,742 | ||||||
Korian-Medica | 51,814 | 1,797,418 | ||||||
Sartorius Stedim Biotech | 10,937 | 2,888,912 | ||||||
Virbac S.A. | 7,605 | 1,832,136 | ||||||
|
| |||||||
| 7,332,208 | ||||||||
|
| |||||||
| Germany—5.6% | ||||||||
Aareal Bank AG (d) | 53,454 | 2,125,095 | ||||||
Bechtle AG (d) | 21,264 | 1,563,881 | ||||||
Bertrandt AG | 5,578 | 734,059 | ||||||
CANCOM SE (d) | 37,835 | 1,416,231 | ||||||
Gerry Weber International AG (d) | 28,369 | 901,500 | ||||||
|
| |||||||
| 6,740,766 | ||||||||
|
| |||||||
| Hong Kong—2.8% | ||||||||
Ju Teng International Holdings Ltd. (d) | 1,306,000 | 805,128 | ||||||
Nexteer Automotive Group Ltd. | 1,125,000 | 1,309,084 | ||||||
Techtronic Industries Co., Ltd. | 159,500 | 548,316 | ||||||
Xinyi Glass Holdings Ltd. | 1,316,000 | 791,137 | ||||||
|
| |||||||
| 3,453,665 | ||||||||
|
| |||||||
| Ireland—2.8% | ||||||||
Glanbia PLC | 65,315 | 1,293,390 | ||||||
Kingspan Group PLC (d) | 91,649 | 2,089,958 | ||||||
|
| |||||||
| 3,383,348 | ||||||||
|
| |||||||
| Italy—3.2% | ||||||||
Banca Popolare di Milano Scarl | 2,321,575 | 2,408,459 | ||||||
De’ Longhi (d) | 62,967 | 1,497,353 | ||||||
|
| |||||||
| 3,905,812 | ||||||||
|
| |||||||
| Japan—26.8% | ||||||||
ABC-Mart, Inc. | 28,900 | 1,668,622 | ||||||
Aica Kogyo Co., Ltd. | 61,200 | 1,367,798 | ||||||
Aozora Bank Ltd. | 446,000 | 1,715,078 | ||||||
Asics Corp. | 77,200 | 2,050,416 | ||||||
Bandai Namco Holdings, Inc. | 75,300 | 1,543,370 | ||||||
| 150 | Semiannual Report | | May 31, 2015 | | See accompanying Notes to Financial Statements |
Table of Contents
Schedule of Investments
May 31, 2015 (Unaudited)
| Shares | Value | |||||||
Calbee, Inc. | 33,800 | $ | 1,292,827 | |||||
Coca-Cola East Japan Co., Ltd. | 38,300 | 707,332 | ||||||
Daiho Corp. | 121,000 | 540,045 | ||||||
Disco Corp. | 14,300 | 1,327,997 | ||||||
Don Quijote Holdings Co., Ltd. | 20,900 | 1,611,072 | ||||||
Fukushima Industries Corp. | 39,400 | 692,333 | ||||||
Hoshizaki Electric Co., Ltd. | 31,900 | 1,961,954 | ||||||
Inaba Denki Sangyo Co., Ltd. | 28,200 | 961,665 | ||||||
Japan Airport Terminal Co., Ltd. | 17,100 | 990,411 | ||||||
Kusuri No Aoki Co., Ltd. | 39,000 | 1,412,161 | ||||||
Maeda Road Construction Co., Ltd. | 61,000 | 1,196,312 | ||||||
Obayashi Corp. | 332,000 | 2,168,412 | ||||||
Sanwa Holdings Corp. | 154,200 | 1,337,644 | ||||||
Seiko Holdings Corp. | 167,000 | 913,415 | ||||||
Shinmaywa Industries Ltd. | 59,000 | 597,347 | ||||||
Suruga Bank Ltd. | 30,900 | 654,144 | ||||||
Teijin Ltd. | 549,000 | 2,041,921 | ||||||
THK Co., Ltd. | 40,000 | 957,915 | ||||||
Tokyo Tatemono Co., Ltd. | 104,000 | 803,001 | ||||||
Yamaha Motor Co., Ltd. | 78,400 | 1,953,085 | ||||||
|
| |||||||
| 32,466,277 | ||||||||
|
| |||||||
| New Zealand—0.2% | ||||||||
Metlifecare Ltd. | 81,138 | 282,308 | ||||||
|
| |||||||
| Norway—1.0% | ||||||||
Opera Software ASA (d) | 101,495 | 877,703 | ||||||
ProSafe SE | 73,448 | 278,407 | ||||||
|
| |||||||
| 1,156,110 | ||||||||
|
| |||||||
| Philippines—0.7% | ||||||||
Cosco Capital, Inc. | 4,966,800 | 864,755 | ||||||
|
| |||||||
| Spain—5.2% | ||||||||
Bolsas y Mercados Espanoles S.A. | 39,015 | 1,580,525 | ||||||
Gamesa Corp. Tecnologica S.A. (e) | 179,644 | 2,761,473 | ||||||
Melia Hotels International S.A. | 146,527 | 1,905,287 | ||||||
|
| |||||||
| 6,247,285 | ||||||||
|
| |||||||
| Sweden—6.0% | ||||||||
Betsson AB (e) | 157,374 | 2,353,695 | ||||||
Betsson AB Redemption Shares (e) | 52,458 | 73,213 | ||||||
JM AB | 38,180 | 1,081,978 | ||||||
NetEnt AB (d) | 53,570 | 2,066,486 | ||||||
NetEnt AB Redemption Shares (c) | 53,570 | 31,414 | ||||||
Nibe Industrier AB, Class B | 54,048 | 1,610,968 | ||||||
|
| |||||||
| 7,217,754 | ||||||||
|
| |||||||
| Switzerland—3.7% | ||||||||
Burckhardt Compression Holding AG (d) | 2,919 | 1,345,296 | ||||||
Georg Fischer AG | 2,385 | 1,807,729 | ||||||
Interroll Holding AG (d) | 1,988 | 1,277,600 | ||||||
|
| |||||||
| 4,430,625 | ||||||||
|
| |||||||
| Taiwan—2.2% | ||||||||
Chailease Holding Co., Ltd. | 281,000 | 709,196 | ||||||
Chipbond Technology Corp. | 312,000 | 721,290 | ||||||
Hermes Microvision, Inc. | 7,000 | 549,599 | ||||||
Primax Electronics Ltd. (d) | 528,000 | 741,509 | ||||||
|
| |||||||
| 2,721,594 | ||||||||
|
| |||||||
| Thailand—0.5% | ||||||||
AP Thailand PCL (c) | 2,954,320 | 613,666 | ||||||
|
| |||||||
| United Kingdom—12.6% | ||||||||
Auto Trader Group PLC (a)(e) | 446,734 | 1,940,826 | ||||||
| Shares | Value | |||||||
DS Smith PLC | 121,508 | $ | 660,229 | |||||
Elementis PLC | 349,548 | 1,637,049 | ||||||
Intermediate Capital Group PLC | 121,710 | 1,114,243 | ||||||
Pets at Home Group PLC | 279,113 | 1,205,135 | ||||||
Restaurant Group PLC | 184,148 | 1,944,043 | ||||||
Rotork PLC (d) | 388,180 | 1,502,725 | ||||||
Segro PLC REIT | 305,691 | 1,991,284 | ||||||
Senior PLC (d) | 180,976 | 887,233 | ||||||
Spirax-Sarco Engineering PLC (d) | 43,424 | 2,312,509 | ||||||
|
| |||||||
| 15,195,276 | ||||||||
|
| |||||||
| Total Common Stock (cost—$92,816,697) | 112,023,846 | |||||||
|
| |||||||
| Principal Amount (000s) | ||||||||
| Repurchase Agreements—6.6% | ||||||||
State Street Bank and Trust Co., dated 5/29/15, 0.00%, due 6/1/15, proceeds $7,946,000; collateralized by U.S. Treasury Notes, 2.125%, due 9/30/21, valued at $8,108,425 including accrued interest |
| |||||||
(cost—$7,946,000) | $7,946 | 7,946,000 | ||||||
|
| |||||||
| Total Investments (cost—$100,762,697) (b)—99.2% | 119,969,846 | |||||||
|
| |||||||
| Other assets less liabilities—0.8% | 1,010,422 | |||||||
|
| |||||||
| Net Assets—100.0% | $120,980,268 | |||||||
|
| |||||||
Notes to Schedule of Investments:
(a) 144A—Exempt from registration under Rule 144A of the Securities Act of 1933. These securities may be resold in transactions exempt from registration, typically only to qualified institutional buyers. Unless otherwise indicated, these securities are not considered to be illiquid.
(b) Securities with an aggregate value of $94,344,204, representing 78.0% of net assets, were valued utilizing modeling tools provided by a third-party vendor. See Note 1(a) and Note 1(b) in the Notes to Financial Statements.
(c) Fair-Valued—Securities with an aggregate value of $645,080, representing 0.5% of net assets. See Note 1(a) and Note 1(b) in the Notes to Financial Statements.
(d) Affiliated security.
(e) Non-income producing.
Glossary:
REIT—Real Estate Investment Trust
The industry classification of portfolio holdings and other assets less liabilities shown as a percentage of net assets were as follows:
Machinery | 10.3% | |||
Hotels, Restaurants & Leisure | 5.3% | |||
Building Products | 5.2% | |||
Semiconductors & Semiconductor Equipment | 4.5% | |||
Internet Software & Services | 4.0% | |||
Banks | 3.9% | |||
Construction & Engineering | 3.2% | |||
Textiles, Apparel & Luxury Goods | 3.1% | |||
Chemicals | 3.1% | |||
Specialty Retail | 3.0% | |||
Diversified Financial Services | 2.7% | |||
Leisure Products | 2.7% | |||
Household Durables | 2.5% | |||
IT Services | 2.5% | |||
Health Care Equipment & Supplies | 2.4% | |||
Electrical Equipment | 2.3% | |||
Software | 2.3% | |||
Food Products | 2.2% | |||
Food & Staples Retailing | 1.9% | |||
Commercial Services & Supplies | 1.8% | |||
Thrifts & Mortgage Finance | 1.8% | |||
Auto Components | 1.7% | |||
Health Care Providers & Services | 1.7% | |||
Real Estate Investment Trust | 1.7% | |||
Containers & Packaging | 1.7% | |||
Automobiles | 1.6% | |||
Pharmaceuticals | 1.5% | |||
Personal Products | 1.4% | |||
Electronic Equipment, Instruments & Components | 1.4% | |||
Multi-line Retail | 1.3% | |||
Real Estate Management & Development | 1.2% | |||
Energy Equipment & Services | 1.1% | |||
Capital Markets | 0.9% | |||
Transportation Infrastructure | 0.8% | |||
Trading Companies & Distributors | 0.8% | |||
Aerospace & Defense | 0.7% | |||
Technology Hardware, Storage & Peripherals | 0.6% | |||
Professional Services | 0.6% | |||
Diversified Consumer Services | 0.6% | |||
Beverages | 0.6% | |||
Repurchase Agreements | 6.6% | |||
Other assets less liabilities | 0.8% | |||
|
| |||
| 100.0% | ||||
|
|
| See accompanying Notes to Financial Statements | | May 31, 2015 | | Semiannual Report | 151 |
Table of Contents
Schedule of Investments
May 31, 2015 (Unaudited)
AllianzGI Micro Cap Fund
| Shares | Value | |||||||
| Common Stock—96.6% | ||||||||
| Aerospace & Defense—1.0% | ||||||||
Astronics Corp. (b) | 6,166 | $430,942 | ||||||
|
| |||||||
| Air Freight & Logistics—0.4% | ||||||||
Park-Ohio Holdings Corp. | 3,549 | 170,387 | ||||||
|
| |||||||
| Auto Components—2.3% | ||||||||
Motorcar Parts of America, Inc. (b) | 18,155 | 522,320 | ||||||
Strattec Security Corp. (a) | 2,006 | 138,434 | ||||||
Tower International, Inc. (b) | 11,677 | 321,234 | ||||||
|
| |||||||
| 981,988 | ||||||||
|
| |||||||
| Banks—4.4% | ||||||||
Ameris Bancorp | 12,907 | 325,127 | ||||||
Banner Corp. | 9,295 | 418,461 | ||||||
Eagle Bancorp, Inc. (b) | 10,859 | 432,080 | ||||||
First Merchants Corp. | 15,710 | 365,886 | ||||||
First NBC Bank Holding Co. (b) | 9,896 | 336,365 | ||||||
|
| |||||||
| 1,877,919 | ||||||||
|
| |||||||
| Biotechnology—10.0% | ||||||||
AMAG Pharmaceuticals, Inc. (b) | 4,714 | 328,000 | ||||||
Anacor Pharmaceuticals, Inc. (b) | 7,017 | 499,751 | ||||||
BioSpecifics Technologies Corp. (b) | 6,750 | 321,570 | ||||||
Eagle Pharmaceuticals, Inc. (b) | 4,155 | 301,778 | ||||||
Esperion Therapeutics, Inc. (b) | 3,697 | 397,464 | ||||||
Insmed, Inc. (b) | 10,423 | 228,681 | ||||||
Insys Therapeutics, Inc. (b) | 5,871 | 349,911 | ||||||
Ligand Pharmaceuticals, Inc., Class B (b) | 9,457 | 833,256 | ||||||
MacroGenics, Inc. (b) | 6,136 | 198,500 | ||||||
Repligen Corp. (b) | 21,189 | 863,664 | ||||||
|
| |||||||
| 4,322,575 | ||||||||
|
| |||||||
| Building Products—4.6% | ||||||||
American Woodmark Corp. (b) | 6,646 | 341,206 | ||||||
Builders FirstSource, Inc. (b) | 41,809 | 513,414 | ||||||
Patrick Industries, Inc. (b) | 13,192 | 788,882 | ||||||
PGT, Inc. (b) | 28,527 | 341,183 | ||||||
|
| |||||||
| 1,984,685 | ||||||||
|
| |||||||
| Capital Markets—1.0% | ||||||||
Cowen Group, Inc., Class A (a)(b) | 76,316 | 450,264 | ||||||
|
| |||||||
| Chemicals—0.6% | ||||||||
American Vanguard Corp. | 18,633 | 256,763 | ||||||
|
| |||||||
| Commercial Services & Supplies—0.6% | ||||||||
ARC Document Solutions, Inc. (b) | 37,424 | 280,306 | ||||||
|
| |||||||
| Communications Equipment—0.7% | ||||||||
ShoreTel, Inc. (b) | 45,879 | 315,648 | ||||||
|
| |||||||
| Construction Materials—1.0% | ||||||||
U.S. Concrete, Inc. (b) | 11,995 | 453,291 | ||||||
|
| |||||||
| Diversified Consumer Services—0.9% | ||||||||
Carriage Services, Inc. | 15,297 | 380,589 | ||||||
|
| |||||||
| Diversified Telecommunication Services—1.5% | ||||||||
8x8, Inc. (b) | 34,648 | 288,965 | ||||||
inContact, Inc. (b) | 36,899 | 358,658 | ||||||
|
| |||||||
| 647,623 | ||||||||
|
| |||||||
| Electrical Equipment—0.7% | ||||||||
Enphase Energy, Inc. (b) | 30,233 | 286,307 | ||||||
|
| |||||||
| Electronic Equipment, Instruments & Components—0.8% | ||||||||
Methode Electronics, Inc. | 5,075 | 238,170 | ||||||
Planar Systems, Inc. (b) | 21,566 | 93,381 | ||||||
|
| |||||||
| 331,551 | ||||||||
|
| |||||||
| Shares | Value | |||||||
| Food Products—0.3% | ||||||||
John B Sanfilippo & Son, Inc. | 2,819 | $ | 142,670 | |||||
|
| |||||||
| Health Care Equipment & Supplies—6.9% | ||||||||
AtriCure, Inc. (b) | 16,772 | 384,750 | ||||||
Cardiovascular Systems, Inc. (b) | 11,698 | 327,310 | ||||||
Cynosure, Inc., Class A (b) | 10,851 | 387,381 | ||||||
Inogen, Inc. (b) | 16,284 | 608,696 | ||||||
RTI Surgical, Inc. (b) | 16,242 | 105,086 | ||||||
Spectranetics Corp. (b) | 11,749 | 291,728 | ||||||
SurModics, Inc. (b) | 10,773 | 265,877 | ||||||
Trinity Biotech PLC ADR | 14,893 | 257,649 | ||||||
Vascular Solutions, Inc. (b) | 10,991 | 358,636 | ||||||
|
| |||||||
| 2,987,113 | ||||||||
|
| |||||||
| Health Care Providers & Services—5.9% | ||||||||
Aceto Corp. | 16,816 | 396,353 | ||||||
Adeptus Health, Inc., Class A (b) | 7,374 | 516,549 | ||||||
BioTelemetry, Inc. (b) | 32,594 | 314,532 | ||||||
Capital Senior Living Corp. (b) | 14,926 | 384,494 | ||||||
Cross Country Healthcare, Inc. (b) | 32,815 | 348,495 | ||||||
Providence Service Corp. (b) | 7,467 | 358,864 | ||||||
RadNet, Inc. (b) | 34,291 | 223,234 | ||||||
|
| |||||||
| 2,542,521 | ||||||||
|
| |||||||
| Health Care Technology—1.2% | ||||||||
Omnicell, Inc. (b) | 13,681 | 505,923 | ||||||
|
| |||||||
| Hotels, Restaurants & Leisure—2.9% | ||||||||
Carrols Restaurant Group, Inc. (b) | 34,175 | 342,433 | ||||||
Kona Grill, Inc. (b) | 11,540 | 234,493 | ||||||
Popeyes Louisiana Kitchen, Inc. (b) | 7,044 | 391,717 | ||||||
Rave Restaurant Group, Inc. (b) | 23,137 | 301,475 | ||||||
|
| |||||||
| 1,270,118 | ||||||||
|
| |||||||
| Household Durables—3.1% | ||||||||
LGI Homes, Inc. (b) | 18,981 | 357,792 | ||||||
Libbey, Inc. | 10,968 | 433,236 | ||||||
M/I Homes, Inc. (b) | 13,715 | 319,148 | ||||||
Skullcandy, Inc. (b) | 30,645 | 229,837 | ||||||
|
| |||||||
| 1,340,013 | ||||||||
|
| |||||||
| Insurance—2.0% | ||||||||
Federated National Holding Co. | 8,789 | 225,701 | ||||||
HCI Group, Inc. (a) | 6,881 | 297,466 | ||||||
Heritage Insurance Holdings, Inc. (b) | 15,231 | 319,851 | ||||||
|
| |||||||
| 843,018 | ||||||||
|
| |||||||
| Internet & Catalog Retail—1.0% | ||||||||
Nutrisystem, Inc. | 18,225 | 414,801 | ||||||
|
| |||||||
| Internet Software & Services—5.2% | ||||||||
Actua Corp. (b) | 2,446 | 31,089 | ||||||
Autobytel, Inc. (b) | 23,834 | 399,458 | ||||||
GTT Communications, Inc. (b) | 16,398 | 361,248 | ||||||
Internap Corp. (b) | 33,990 | 331,062 | ||||||
IntraLinks Holdings, Inc. (b) | 30,165 | 320,654 | ||||||
Limelight Networks, Inc. (b) | 69,594 | 304,126 | ||||||
SPS Commerce, Inc. (b) | 4,201 | 273,149 | ||||||
TechTarget, Inc. (b) | 26,002 | 240,518 | ||||||
|
| |||||||
| 2,261,304 | ||||||||
|
| |||||||
| IT Services—1.1% | ||||||||
Virtusa Corp. (b) | 10,518 | 478,569 | ||||||
|
| |||||||
| Leisure Equipment & Products—1.5% | ||||||||
Nautilus, Inc. (b) | 30,059 | 634,846 | ||||||
|
| |||||||
| Life Sciences Tools & Services—3.8% | ||||||||
Albany Molecular Research, Inc. (b) | 25,371 | 511,225 | ||||||
Cambrex Corp. (b) | 19,201 | 768,424 | ||||||
NeoGenomics, Inc. (b) | 63,287 | 337,320 | ||||||
|
| |||||||
| 1,616,969 | ||||||||
|
| |||||||
| Shares | Value | |||||||
| Machinery—2.2% | ||||||||
Kadant, Inc. | 7,473 | $ | 351,978 | |||||
Lydall, Inc. (b) | 10,592 | 290,327 | ||||||
NN, Inc. | 11,360 | 309,560 | ||||||
|
| |||||||
| 951,865 | ||||||||
|
| |||||||
| Media—1.8% | ||||||||
Carmike Cinemas, Inc. (b) | 15,952 | 443,944 | ||||||
Entravision Communications Corp., Class A | 47,251 | 318,944 | ||||||
|
| |||||||
| 762,888 | ||||||||
|
| |||||||
| Metals & Mining—0.6% | ||||||||
Olympic Steel, Inc. | 14,736 | 258,469 | ||||||
|
| |||||||
| Oil, Gas & Consumable Fuels—2.3% | ||||||||
Abraxas Petroleum Corp. (b) | 90,651 | 265,608 | ||||||
Gastar Exploration, Inc. (b) | 59,087 | 180,215 | ||||||
Synergy Resources Corp. (b) | 15,076 | 173,525 | ||||||
Teekay Tankers Ltd., Class A | 54,043 | 364,790 | ||||||
|
| |||||||
| 984,138 | ||||||||
|
| |||||||
| Paper & Forest Products—1.0% | ||||||||
Neenah Paper, Inc. (a) | 7,033 | 424,020 | ||||||
|
| |||||||
| Pharmaceuticals—7.7% | ||||||||
ANI Pharmaceuticals, Inc. (b) | 5,683 | 286,310 | ||||||
Cempra, Inc. (b) | 7,114 | 261,155 | ||||||
Depomed, Inc. (b) | 31,776 | 662,847 | ||||||
Horizon Pharma PLC (b) | 10,616 | 344,277 | ||||||
IGI Laboratories, Inc. (b) | 47,422 | 308,243 | ||||||
Intersect ENT, Inc. (b) | 14,369 | 341,120 | ||||||
Omeros Corp. (b) | 14,280 | 283,458 | ||||||
Pernix Therapeutics Holdings, Inc. (b) | 37,338 | 237,843 | ||||||
Supernus Pharmaceuticals, Inc. (b) | 19,712 | 280,305 | ||||||
Tetraphase Pharmaceuticals, Inc. (b) | 7,297 | 312,895 | ||||||
|
| |||||||
| 3,318,453 | ||||||||
|
| |||||||
| Professional Services—0.8% | ||||||||
Barrett Business Services, Inc. | 835 | 30,068 | ||||||
GP Strategies Corp. (b) | 10,648 | 332,324 | ||||||
|
| |||||||
| 362,392 | ||||||||
|
| |||||||
| Road & Rail—1.3% | ||||||||
Celadon Group, Inc. | 12,329 | 287,512 | ||||||
Covenant Transportation Group, Inc., Class A (b) | 9,087 | 280,879 | ||||||
|
| |||||||
| 568,391 | ||||||||
|
| |||||||
| Semiconductors & Semiconductor Equipment—4.6% | ||||||||
Ambarella, Inc. (b) | 4,640 | 418,574 | ||||||
FormFactor, Inc. (b) | 44,324 | 412,656 | ||||||
Inphi Corp. (b) | 14,005 | 335,280 | ||||||
PDF Solutions, Inc. (b) | 16,977 | 270,444 | ||||||
Tower Semiconductor Ltd. (b) | 34,236 | 528,262 | ||||||
|
| |||||||
| 1,965,216 | ||||||||
|
| |||||||
| Software—3.0% | ||||||||
Callidus Software, Inc. (b) | 28,197 | 403,781 | ||||||
ePlus, Inc. (b) | 4,735 | 367,673 | ||||||
Silver Spring Networks, Inc. (b) | 15,643 | 213,840 | ||||||
Telenav, Inc. (b) | 33,065 | 298,577 | ||||||
|
| |||||||
| 1,283,871 | ||||||||
|
| |||||||
| Specialty Retail—2.8% | ||||||||
Citi Trends, Inc. (b) | 14,083 | 338,696 | ||||||
Kirkland’s, Inc. (b) | 13,742 | 361,002 | ||||||
Shoe Carnival, Inc. | 11,365 | 314,129 | ||||||
Tilly’s, Inc., Class A (b) | 19,691 | 189,821 | ||||||
|
| |||||||
| 1,203,648 | ||||||||
|
| |||||||
| 152 | Semiannual Report | | May 31, 2015 | | See accompanying Notes to Financial Statements |
Table of Contents
Schedule of Investments
May 31, 2015 (Unaudited)
| Shares | Value | |||||||
| Technology Hardware, Storage & Peripherals—0.8% | ||||||||
Quantum Corp. (b) | 172,605 | $ | 352,114 | |||||
|
| |||||||
| Thrifts & Mortgage Finance—2.3% | ||||||||
LendingTree, Inc. (b) | 10,466 | 620,215 | ||||||
Meridian Bancorp, Inc. (b) | 28,818 | 370,023 | ||||||
|
| |||||||
| 990,238 | ||||||||
|
| |||||||
Total Investments (cost—$27,669,511)—96.6% |
| 41,634,406 | ||||||
|
| |||||||
Other assets less liabilities—3.4% | 1,461,859 | |||||||
|
| |||||||
| Net Assets—100.0% | $43,096,265 | |||||||
|
| |||||||
Notes to Schedule of Investments:
(a) Affiliated security.
(b) Non-income producing.
Glossary:
ADR—American Depositary Receipt
AllianzGI Multi-Asset Real Return Fund
| Shares | Value | |||||||
| Mutual Funds (e)(f)—50.3% | ||||||||
AllianzGI Global Natural Resources | 79,315 | $1,412,605 | ||||||
PIMCO Commodity RealReturn Strategy | 286,559 | 1,252,264 | ||||||
|
| |||||||
| Total Mutual Funds (cost—$2,880,055) | 2,664,869 | |||||||
|
| |||||||
| Common Stock—26.3% | ||||||||
| Australia—2.1% | ||||||||
Dexus Property Group REIT | 1,115 | 6,803 | ||||||
Federation Centres REIT | 2,930 | 6,781 | ||||||
Goodman Group REIT | 1,778 | 8,846 | ||||||
GPT Group REIT | 2,240 | 7,881 | ||||||
Lend Lease Group | 1,020 | 12,917 | ||||||
Mirvac Group REIT | 4,641 | 7,107 | ||||||
Novion Property Group REIT | 3,280 | 6,090 | ||||||
Scentre Group REIT | 7,879 | 23,689 | ||||||
Stockland REIT | 3,686 | 12,174 | ||||||
Westfield Corp. REIT | 2,619 | 19,281 | ||||||
|
| |||||||
| 111,569 | ||||||||
|
| |||||||
| Austria—0.0% | ||||||||
BUWOG AG (g) | 101 | 2,031 | ||||||
|
| |||||||
| Canada—0.9% | ||||||||
Brookfield Asset Management, Inc., Class A | 972 | 34,375 | ||||||
First Capital Realty, Inc. | 157 | 2,373 | ||||||
H&R Real Estate Investment Trust REIT | 220 | 4,000 | ||||||
RioCan Real Estate Investment Trust REIT | 320 | 7,128 | ||||||
|
| |||||||
| 47,876 | ||||||||
|
| |||||||
| France—1.1% | ||||||||
Fonciere Des Regions REIT | 60 | 5,282 | ||||||
Gecina S.A. REIT | 50 | 6,568 | ||||||
ICADE REIT | 60 | 4,673 | ||||||
Klepierre REIT | 285 | 12,645 | ||||||
Unibail-Rodamco SE REIT | 114 | 29,265 | ||||||
|
| |||||||
| 58,433 | ||||||||
|
| |||||||
| Germany—0.5% | ||||||||
Deutsche Annington Immobilien SE | 500 | 15,826 | ||||||
Deutsche Wohnen AG | 500 | 12,191 | ||||||
|
| |||||||
| 28,017 | ||||||||
|
| |||||||
| Hong Kong—3.2% | ||||||||
Cheung Kong Holdings Ltd. (b) | 1,696 | 10,302 | ||||||
CK Hutchison Holdings Ltd. | 1,696 | 26,357 | ||||||
Hang Lung Properties Ltd. | 3,871 | 12,193 | ||||||
Henderson Land Development Co., Ltd. | 1,671 | 13,439 | ||||||
Hysan Development Co., Ltd. | 1,450 | 6,619 | ||||||
Kerry Properties Ltd. | 1,052 | 4,387 | ||||||
Link REIT | 2,821 | 16,407 | ||||||
New World Development Co., Ltd. | 5,440 | 7,203 | ||||||
Sino Land Co., Ltd. | 3,271 | 5,563 | ||||||
Sun Hung Kai Properties Ltd. | 1,827 | 30,850 | ||||||
Swire Pacific Ltd., Class A | 700 | 9,367 | ||||||
Swire Properties Ltd. | 1,993 | 6,751 | ||||||
Wharf Holdings Ltd. | 2,649 | 18,242 | ||||||
Wheelock & Co., Ltd. | 856 | 4,604 | ||||||
|
| |||||||
| 172,284 | ||||||||
|
| |||||||
| Japan—3.2% | ||||||||
Aeon Mall Co., Ltd. | 130 | 2,381 | ||||||
Daito Trust Construction Co., Ltd. | 110 | 12,207 | ||||||
Daiwa House Industry Co., Ltd. | 636 | 15,232 | ||||||
| Shares | Value | |||||||
Hulic Co., Ltd. | 325 | $ | 3,341 | |||||
Japan Prime Realty Investment Corp. REIT | 1 | 3,281 | ||||||
Japan Real Estate Investment Corp. REIT | 1 | 4,589 | ||||||
Japan Retail Fund Investment Corp. REIT | 3 | 6,009 | ||||||
Mitsubishi Estate Co., Ltd. | 1,521 | 33,935 | ||||||
Mitsui Fudosan Co., Ltd. | 1,156 | 33,597 | ||||||
Nippon Building Fund, Inc. REIT | 2 | 9,333 | ||||||
Nippon Prologis REIT, Inc. REIT | 2 | 3,847 | ||||||
Nomura Real Estate Holdings, Inc. | 200 | 4,095 | ||||||
Nomura Real Estate Office Fund, Inc. REIT | 1 | 4,571 | ||||||
NTT Urban Development Corp. | 200 | 2,066 | ||||||
Sumitomo Realty & Development Co., Ltd. | 390 | 14,961 | ||||||
Tokyo Tatemono Co., Ltd. | 562 | 4,339 | ||||||
Tokyu Fudosan Holdings Corp. | 600 | 4,496 | ||||||
United Urban Investment Corp. REIT | 4 | 5,966 | ||||||
|
| |||||||
| 168,246 | ||||||||
|
| |||||||
| Singapore—0.9% | ||||||||
Ascendas Real Estate Investment Trust REIT | 2,520 | 4,481 | ||||||
CapitaLand Commercial Trust REIT | 3,940 | 4,714 | ||||||
CapitaLand Ltd. | 4,675 | 12,086 | ||||||
CapitaLand Mall Trust REIT | 2,670 | 4,290 | ||||||
City Developments Ltd. | 651 | 5,076 | ||||||
Global Logistic Properties Ltd. | 2,200 | 4,502 | ||||||
Suntec Real Estate Investment Trust REIT | 5,000 | 6,670 | ||||||
UOL Group Ltd. | 1,110 | 6,043 | ||||||
|
| |||||||
| 47,862 | ||||||||
|
| |||||||
| Switzerland—0.2% | ||||||||
Swiss Prime Site AG | 110 | 8,803 | ||||||
|
| |||||||
| United Kingdom—1.2% | ||||||||
British Land Co. PLC REIT | 1,494 | 19,698 | ||||||
Hammerson PLC REIT | 1,081 | 11,048 | ||||||
Intu Properties PLC REIT | 1,220 | 6,241 | ||||||
Land Securities Group PLC REIT | 941 | 18,912 | ||||||
Segro PLC REIT | 1,150 | 7,491 | ||||||
|
| |||||||
| 63,390 | ||||||||
|
| |||||||
| United States—13.0% | ||||||||
American Capital Agency Corp. REIT | 500 | 10,430 | ||||||
American Realty Capital Properties, Inc. REIT | 1,500 | 13,305 | ||||||
American Tower Corp. REIT | 472 | 43,797 | ||||||
Annaly Capital Management, Inc. REIT | 1,223 | 12,768 | ||||||
AvalonBay Communities, Inc. REIT | 155 | 25,808 | ||||||
Boston Properties, Inc. REIT | 206 | 26,786 | ||||||
Camden Property Trust REIT | 131 | 9,822 | ||||||
CBRE Group, Inc. Class A (g) | 429 | 16,405 | ||||||
Crown Castle International Corp. REIT | 400 | 32,620 | ||||||
Digital Realty Trust, Inc. REIT | 210 | 13,868 | ||||||
Duke Realty Corp. REIT | 519 | 10,152 | ||||||
Equity Residential REIT | 439 | 32,627 | ||||||
Essex Property Trust, Inc. REIT | 100 | 22,262 | ||||||
Federal Realty Investment Trust REIT | 77 | 10,354 | ||||||
General Growth Properties, Inc. REIT | 747 | 21,163 | ||||||
HCP, Inc. REIT | 560 | 21,683 | ||||||
Health Care REIT, Inc. REIT | 463 | 32,530 | ||||||
Host Hotels & Resorts, Inc. REIT | 1,111 | 22,131 | ||||||
Kimco Realty Corp. REIT | 638 | 15,286 | ||||||
Liberty Property Trust REIT | 250 | 8,735 | ||||||
Macerich Co. REIT | 215 | 17,654 | ||||||
Plum Creek Timber Co., Inc. REIT | 257 | 10,604 | ||||||
Prologis, Inc. REIT | 807 | 31,949 | ||||||
Public Storage REIT | 179 | 34,644 | ||||||
Rayonier Advanced Materials, Inc. | 65 | 1,072 | ||||||
Rayonier, Inc. REIT | 197 | 5,087 | ||||||
| See accompanying Notes to Financial Statements | | May 31, 2015 | | Semiannual Report | 153 |
Table of Contents
Schedule of Investments
May 31, 2015 (Unaudited)
| Shares | Value | |||||||
Realogy Holdings Corp. (g) | 178 | $ | 8,357 | |||||
Realty Income Corp. REIT | 200 | 9,114 | ||||||
Regency Centers Corp. REIT | 72 | 4,546 | ||||||
Simon Property Group, Inc. REIT | 356 | 64,578 | ||||||
SL Green Realty Corp. REIT | 137 | 16,256 | ||||||
UDR, Inc. REIT | 379 | 12,340 | ||||||
Ventas, Inc. REIT | 407 | 27,074 | ||||||
Vornado Realty Trust REIT | 201 | 20,078 | ||||||
Weyerhaeuser Co. REIT | 660 | 21,490 | ||||||
|
| |||||||
| 687,375 | ||||||||
|
| |||||||
| Total Common Stock (cost—$1,242,081) | 1,395,886 | |||||||
|
| |||||||
| Principal Amount (000s) | ||||||||
| U.S. Treasury Obligations (c)—11.0% | ||||||||
U.S. Treasury Inflation Indexed Bonds, |
| |||||||
2.125%, 2/15/40 | $55 | 69,433 | ||||||
2.375%, 1/15/25 | 123 | 146,736 | ||||||
3.875%, 4/15/29 | 172 | 248,604 | ||||||
U.S. Treasury Inflation Indexed Notes, |
| |||||||
0.625%, 7/15/21 | 8 | 8,709 | ||||||
2.375%, 1/15/17 (d) | 103 | 108,432 | ||||||
|
| |||||||
Total U.S. Treasury Obligations |
| 581,914 | ||||||
|
| |||||||
| Shares | ||||||||
| Exchange-Traded Funds—0.6% | ||||||||
Schwab U.S. TIPS | 100 | 5,472 | ||||||
SPDR Barclays Short Term High Yield Bond | 1,000 | 29,280 | ||||||
|
| |||||||
Total Exchange-Traded Funds |
| 34,752 | ||||||
|
| |||||||
| Rights—0.0% | ||||||||
| Germany—0.0% | ||||||||
Deutsche Wohnen AG, exercise price $21.50, expires 6/3/15 (g) | 500 | 16 | ||||||
|
| |||||||
| Principal Amount (000s) | ||||||||
| Repurchase Agreements—7.0% | ||||||||
State Street Bank and Trust Co., dated 5/29/15, 0.00%, due 6/1/15, proceeds $369,000; collateralized by U.S. Treasury Notes, 2.125%, due 6/30/21, valued at $380,638 including accrued interest |
| |||||||
(cost—$369,000) | 369 | 369,000 | ||||||
|
| |||||||
| Total Investments (cost—$5,153,783) (a)—95.2% | 5,046,437 | |||||||
|
| |||||||
Other assets less liabilities—4.8% | 255,139 | |||||||
|
| |||||||
| Net Assets—100.0% | $5,301,576 | |||||||
|
| |||||||
Notes to Schedule of Investments:
(a) Securities with an aggregate value of $1,224,756, representing 23.1% of net assets, were valued utilizing modeling tools provided by a third-party vendor. See Note 1(a) and Note 1(b) in the Notes to Financial Statements.
(b) Fair-Valued—Security with a value of $10,302, representing 0.2% of net assets. See Note 1(a) and Note 1(b) in the Notes to Financial Statements.
(c) Inflationary Bonds—Principal amount of security is adjusted for inflation/deflation.
(d) All or partial amount segregated for the benefit of the counterparty as collateral for derivatives.
(e) Affiliated fund.
(f) Institutional Class share.
(g) Non-income producing.
Glossary:
€—Euro
REIT—Real Estate Investment Trust
TIPS—Treasury Inflation Protected Securities
The industry classification of portfolio holdings and other assets less liabilities shown as a percentage of net assets were as follows:
Mutual Funds | 50.3% | |||
Real Estate Investment Trust | 18.4% | |||
U.S. Treasury Obligations | 11.0% | |||
Real Estate Management & Development | 7.9% | |||
Exchange-Traded Funds | 0.6% | |||
Chemicals | 0.0% | |||
Real Estate | 0.0% | |||
Repurchase Agreements | 7.0% | |||
Other assets less liabilities | 4.8% | |||
|
| |||
| 100.0% | ||||
|
|
AllianzGI NFJ Emerging Markets Value Fund
| Shares | Value | |||||||
| Common Stock—91.9% | ||||||||
| Brazil—5.8% | ||||||||
Banco do Brasil S.A. | 7,500 | $53,526 | ||||||
CVC Brasil Operadora e Agencia de Viagens S.A. | 11,200 | 68,543 | ||||||
FII BTG Pactual Corp. Office Fund REIT | 1,820 | 59,976 | ||||||
Grendene S.A. | 11,100 | 60,511 | ||||||
Grupo BTG Pactual UNIT | 6,500 | 62,729 | ||||||
JBS S.A. | 12,401 | 60,715 | ||||||
Mahle-Metal Leve S.A. | 9,100 | 64,831 | ||||||
Sul America S.A. UNIT | 13,700 | 56,455 | ||||||
Transmissora Alianca de Energia Eletrica S.A. UNIT | 9,800 | 63,328 | ||||||
|
| |||||||
| 550,614 | ||||||||
|
| |||||||
| Chile—0.6% | ||||||||
Inversiones La Construccion S.A. | 5,152 | 59,837 | ||||||
|
| |||||||
| China—20.0% | ||||||||
Agricultural Bank of China Ltd., Class H | 118,000 | 63,898 | ||||||
Anhui Expressway Co., Ltd., Class H | 75,000 | 73,092 | ||||||
Bank of China Ltd., Class H | 93,000 | 61,489 | ||||||
Bank of Chongqing Co., Ltd., Class H | 66,000 | 65,027 | ||||||
Bank of Communications Co., Ltd., Class H | 64,000 | 60,752 | ||||||
China Communications Services Corp. Ltd., Class H | 116,000 | 63,778 | ||||||
China Construction Bank Corp., Class H | 70,000 | 69,708 | ||||||
China Creative Home Group Ltd. | 304,000 | 56,392 | ||||||
China Lilang Ltd. | 52,000 | 62,430 | ||||||
China Merchants Bank Co., Ltd., Class H | 22,100 | 66,783 | ||||||
China Mobile Games & Entertainment Group Ltd. ADR | 3,200 | 63,488 | ||||||
China Shineway Pharmaceutical Group Ltd. | 33,000 | 57,789 | ||||||
Chongqing Rural Commercial Bank Co., Ltd., Class H | 80,000 | 64,926 | ||||||
Daqin Railway Co., Ltd., Class A | 28,500 | 56,048 | ||||||
Fufeng Group Ltd. | 75,000 | 61,472 | ||||||
Guangdong Electric Power Development Co., Ltd., Class B | 60,900 | 68,019 | ||||||
Huabao International Holdings Ltd. | 67,000 | 63,773 | ||||||
Industrial & Commercial Bank of China Ltd., Class H | 77,000 | 66,678 | ||||||
Jiangling Motors Corp., Ltd., Class B | 12,400 | 60,771 | ||||||
Jiangnan Group Ltd. | 214,000 | 66,101 | ||||||
Jintian Pharmaceutical Group Ltd. | 132,000 | 71,862 | ||||||
Kingboard Laminates Holdings Ltd. | 132,000 | 67,052 | ||||||
Luthai Textile Co., Ltd., Class B | 38,100 | 62,651 | ||||||
Peak Sport Products Co., Ltd. | 197,000 | 64,425 | ||||||
Qinhuangdao Port Co., Ltd., Class H | 106,000 | 66,851 | ||||||
SAIC Motor Corp. Ltd., Class A | 15,200 | 58,828 | ||||||
Shenzhen Expressway Co., Ltd., Class H | 70,000 | 61,543 | ||||||
Sichuan Expressway Co., Ltd., Class H | 98,000 | 50,386 | ||||||
TCC International Holdings Ltd. | 140,000 | 52,797 | ||||||
Yuexiu Transport Infrastructure Ltd. | 80,000 | 61,714 | ||||||
|
| |||||||
| 1,890,523 | ||||||||
|
| |||||||
| 154 | Semiannual Report | | May 31, 2015 | | See accompanying Notes to Financial Statements |
Table of Contents
Schedule of Investments
May 31, 2015 (Unaudited)
| Shares | Value | |||||||
| Czech Republic—0.7% | ||||||||
Philip Morris CR AS | 153 | $ | 66,547 | |||||
|
| |||||||
| Egypt—0.7% | ||||||||
Eastern Tobacco | 2,447 | 68,952 | ||||||
|
| |||||||
| Greece—0.7% | ||||||||
Aegean Airlines S.A. | 7,744 | 60,888 | ||||||
|
| |||||||
| Hong Kong—2.1% | ||||||||
CITIC Telecom International Holdings Ltd. | 126,000 | 64,887 | ||||||
NagaCorp Ltd. | 85,000 | 67,331 | ||||||
SITC International Holdings Co., Ltd. | 96,000 | 64,903 | ||||||
|
| |||||||
| 197,121 | ||||||||
|
| |||||||
| India—7.5% | ||||||||
Great Eastern Shipping Co., Ltd. | 11,368 | 60,530 | ||||||
Indiabulls Housing Finance Ltd. | 7,189 | 66,822 | ||||||
Mphasis Ltd. | 4,188 | 24,328 | ||||||
Muthoot Finance Ltd. | 22,484 | 69,582 | ||||||
National Aluminium Co., Ltd. | 86,349 | 65,549 | ||||||
NMDC Ltd. | 24,964 | 50,526 | ||||||
Oil India Ltd. | 7,704 | 56,315 | ||||||
Power Finance Corp., Ltd. | 14,067 | 59,914 | ||||||
Rural Electrification Corp., Ltd. | 13,480 | 62,309 | ||||||
Tata Motors Ltd. ADR | 1,639 | 62,774 | ||||||
Vardhman Textiles Ltd. | 6,193 | 62,070 | ||||||
Zensar Technologies Ltd. | 5,779 | 70,570 | ||||||
|
| |||||||
| 711,289 | ||||||||
|
| |||||||
| Indonesia—1.4% | ||||||||
Bank Pembangunan Daerah Jawa Timur Tbk PT | 1,721,500 | 66,972 | ||||||
Indofood Sukses Makmur Tbk PT | 113,500 | 62,591 | ||||||
|
| |||||||
| 129,563 | ||||||||
|
| |||||||
| Korea (Republic of)—11.2% | ||||||||
Dongbu Insurance Co., Ltd. | 1,216 | 56,217 | ||||||
Hankook Tire Co., Ltd. | 1,418 | 56,054 | ||||||
Hyundai Marine & Fire Insurance Co., Ltd. | 2,530 | 63,410 | ||||||
Hyundai Mobis Co., Ltd. | 306 | 61,629 | ||||||
Industrial Bank of Korea | 4,824 | 63,108 | ||||||
Kia Motors Corp. | 1,485 | 63,729 | ||||||
Korea Electric Power Corp. | 1,516 | 62,980 | ||||||
KT&G Corp. | 732 | 63,672 | ||||||
LG Display Co., Ltd. | 2,380 | 62,737 | ||||||
LIG Insurance Co., Ltd. | 2,770 | 66,663 | ||||||
Samsung Electronics Co., Ltd. | 52 | 61,171 | ||||||
Seah Besteel Corp. | 1,700 | 64,727 | ||||||
SK Hynix, Inc. | 1,553 | 71,365 | ||||||
SK Telecom Co., Ltd. | 272 | 60,129 | ||||||
SL Corp. | 3,820 | 66,053 | ||||||
Sungwoo Hitech Co., Ltd. | 5,830 | 53,752 | ||||||
Tongyang Life Insurance | 5,090 | 66,312 | ||||||
|
| |||||||
| 1,063,708 | ||||||||
|
| |||||||
| Malaysia—3.2% | ||||||||
KSL Holdings Bhd. | 115,500 | 55,961 | ||||||
Scientex Bhd. | 34,000 | 63,923 | ||||||
Star Publications Malaysia Bhd. | 92,500 | 62,323 | ||||||
Supermax Corp. Bhd. | 113,600 | 61,975 | ||||||
YTL Corp. Bhd. | 142,900 | 61,978 | ||||||
|
| |||||||
| 306,160 | ||||||||
|
| |||||||
| Mexico—3.3% | ||||||||
Credito Real S.A.B. de C.V. SOFOM ER | 27,253 | 63,111 | ||||||
Fibra Shop Portafolios Inmobiliarios SAPI de C.V. REIT | 54,800 | 61,138 | ||||||
| Shares | Value | |||||||
Mexico Real Estate Management S.A. de C.V. REIT | 43,600 | $ | 63,225 | |||||
Prologis Property Mexico S.A. de C.V. REIT | 36,400 | 62,050 | ||||||
Ternium S.A. ADR | 3,100 | 60,512 | ||||||
|
| |||||||
| 310,036 | ||||||||
|
| |||||||
| Norway—0.6% | ||||||||
BW LPG Ltd. (a) | 6,944 | 57,376 | ||||||
|
| |||||||
| Peru—0.7% | ||||||||
Intercorp Financial Services, Inc. | 2,210 | 64,731 | ||||||
|
| |||||||
| Philippines—0.6% | ||||||||
Manila Water Co., Inc. | 107,700 | 56,767 | ||||||
|
| |||||||
| Poland—1.4% | ||||||||
Asseco Poland S.A. | 4,056 | 65,022 | ||||||
Energa S.A. | 10,565 | 64,676 | ||||||
|
| |||||||
| 129,698 | ||||||||
|
| |||||||
| Russian Federation—4.4% | ||||||||
Acron JSC (c) | 1,479 | 62,384 | ||||||
Gazprom Neft OAO ADR | 4,070 | 53,765 | ||||||
Gazprom OAO (c) | 22,245 | 58,949 | ||||||
Lukoil OAO (c) | 1,234 | 57,813 | ||||||
MMC Norilsk Nickel OJSC ADR | 3,372 | 59,398 | ||||||
Moscow Exchange MICEX-RTS PJSC (c) | 46,600 | 63,842 | ||||||
Tatneft OAO (c) | 11,426 | 60,900 | ||||||
|
| |||||||
| 417,051 | ||||||||
|
| |||||||
| Singapore—2.6% | ||||||||
China Merchants Holdings Pacific Ltd. | 77,700 | 60,760 | ||||||
Lippo Malls Indonesia Retail Trust REIT | 227,000 | 63,144 | ||||||
Religare Health Trust UNIT | 80,000 | 62,849 | ||||||
Yangzijiang Shipbuilding Holdings Ltd. | 58,000 | 62,116 | ||||||
|
| |||||||
| 248,869 | ||||||||
|
| |||||||
| South Africa—5.6% | ||||||||
Astral Foods Ltd. | 4,593 | 62,481 | ||||||
Barclays Africa Group Ltd. | 4,136 | 59,861 | ||||||
DataTec Ltd. | 11,331 | 62,091 | ||||||
Illovo Sugar Ltd. | 26,777 | 39,687 | ||||||
Imperial Holdings Ltd. | 4,129 | 61,878 | ||||||
Liberty Holdings Ltd. | 4,681 | 60,486 | ||||||
S.A. Corporate Real Estate Fund Nominees Pty Ltd. REIT | 155,621 | 59,456 | ||||||
Sasol Ltd. | 1,730 | 61,192 | ||||||
Vukile Property Fund Ltd. REIT | 41,300 | 63,762 | ||||||
|
| |||||||
| 530,894 | ||||||||
|
| |||||||
| Taiwan—14.1% | ||||||||
Chimei Materials Technology Corp. | 59,700 | 66,149 | ||||||
Compal Electronics, Inc. | 75,000 | 61,807 | ||||||
Coretronic Corp. | 46,000 | 59,117 | ||||||
Elan Microelectronics Corp. | 41,000 | 60,872 | ||||||
Elite Semiconductor Memory Technology, Inc. | 44,000 | 62,464 | ||||||
Elitegroup Computer Systems Co., Ltd. | 64,553 | 66,297 | ||||||
Formosan Rubber Group, Inc. | 61,000 | 61,169 | ||||||
Gigabyte Technology Co., Ltd. | 56,000 | 62,581 | ||||||
Greatek Electronics, Inc. | 48,000 | 65,950 | ||||||
Hon Hai Precision Industry Co., Ltd. GDR | 10,231 | 66,297 | ||||||
Inventec Corp. | 86,000 | 61,474 | ||||||
King Yuan Electronics Co., Ltd. | 72,000 | 64,235 | ||||||
King’s Town Bank Co., Ltd. | 66,000 | 64,547 | ||||||
Lite-On Technology Corp. | 48,334 | 61,876 | ||||||
Micro-Star International Co., Ltd. | 57,000 | 64,663 | ||||||
Siliconware Precision Industries Co., Ltd. | 39,000 | 64,148 | ||||||
| Shares | Value | |||||||
Taiwan PCB Techvest Co., Ltd. | 42,000 | $ | 63,085 | |||||
Taiwan Semiconductor Manufacturing Co., Ltd. | 13,000 | 61,841 | ||||||
Test Research, Inc. | 32,000 | 70,348 | ||||||
Tripod Technology Corp. | 31,000 | 57,345 | ||||||
Yageo Corp. | 35,000 | 66,284 | ||||||
|
| |||||||
| 1,332,549 | ||||||||
|
| |||||||
| Thailand—2.1% | ||||||||
Bangkok Expressway PCL NVDR | 55,800 | 66,243 | ||||||
CPN Retail Growth Leasehold Property Fund UNIT | 130,200 | 63,862 | ||||||
Thai Vegetable Oil PCL NVDR | 97,200 | 63,856 | ||||||
|
| |||||||
| 193,961 | ||||||||
|
| |||||||
| Turkey—2.6% | ||||||||
Aksa Akrilik Kimya Sanayii AS | 15,990 | 65,470 | ||||||
Selcuk Ecza Deposu Ticaret ve Sanayi AS | 66,396 | 61,582 | ||||||
Soda Sanayii AS | 26,343 | 59,035 | ||||||
Turk Telekomunikasyon AS | 24,163 | 63,075 | ||||||
|
| |||||||
| 249,162 | ||||||||
|
| |||||||
| Total Common Stock (cost—$8,425,799) | 8,696,296 | |||||||
|
| |||||||
| Preferred Stock—3.1% | ||||||||
| Brazil—2.5% | ||||||||
Banco ABC Brasil S.A. | 15,557 | 57,027 | ||||||
Banco Daycoval S.A. | 24,200 | 58,102 | ||||||
Itausa - Investimentos Itau S.A. | 22,060 | 61,064 | ||||||
Telefonica Brasil S.A. | 4,400 | 61,934 | ||||||
|
| |||||||
| 238,127 | ||||||||
|
| |||||||
| Russian Federation—0.6% | ||||||||
Surgutneftegas OAO (c) | 79,643 | 56,547 | ||||||
|
| |||||||
| Total Preferred Stock (cost—$360,822) | 294,674 | |||||||
|
| |||||||
| Equity-Linked Securities—1.1% | ||||||||
| China—0.7% | ||||||||
Merrill Lynch International & Co.,Gree Electric Appliances, Inc., | 6,700 | 68,070 | ||||||
|
| |||||||
| India—0.4% | ||||||||
CLSA Financial Products, Ltd.,Mphasis Ltd., expires 8/13/18 | 6,483 | 37,601 | ||||||
|
| |||||||
| Total Equity-Linked Securities (cost—$105,213) | 105,671 | |||||||
|
| |||||||
| Principal Amount (000s) | ||||||||
| Repurchase Agreements—1.9% | ||||||||
State Street Bank and Trust Co., dated 5/29/15, 0.00%, due 6/1/15, proceeds $184,000; collateralized by U.S. Treasury Notes, 2.125%, due 9/30/21, valued at $189,163 including accrued interest |
| |||||||
(cost—$184,000) | $184 | 184,000 | ||||||
|
| |||||||
| Total Investments (cost—$9,075,834) (b)—98.0% | 9,280,641 | |||||||
|
| |||||||
| Other assets less liabilities—2.0% | 185,007 | |||||||
|
| |||||||
| Net Assets—100.0% | $9,465,648 | |||||||
|
| |||||||
| See accompanying Notes to Financial Statements | | May 31, 2015 | | Semiannual Report | 155 |
Table of Contents
Schedule of Investments
May 31, 2015 (Unaudited)
Notes to Schedule of Investments:
(a) 144A—Exempt from registration under Rule 144A of the Securities Act of 1933. These securities may be resold in transactions exempt from registration, typically only to qualified institutional buyers. Unless otherwise indicated, these securities are not considered to be illiquid.
(b) Securities with an aggregate value of $5,590,276, representing 59.1% of net assets, were valued utilizing modeling tools provided by a third-party vendor. See Note 1(a) and Note 1(b) in the Notes to Financial Statements.
(c) Fair-Valued—Securities with an aggregate value of $360,435, representing 3.8% of net assets. See Note 1(a) and Note 1(b) in the Notes to Financial Statements.
Glossary:
ADR—American Depositary Receipt
GDR—Global Depositary Receipt
NVDR—Non-Voting Depository Receipt
REIT—Real Estate Investment Trust
UNIT—More than one class of securities traded together.
The industry classification of portfolio holdings and other assets less liabilities shown as a percentage of net assets were as follows:
Banks | 11.2% | |||
Electronic Equipment, Instruments & Components | 6.7% | |||
Oil, Gas & Consumable Fuels | 5.4% | |||
Real Estate Investment Trust | 5.3% | |||
Semiconductors & Semiconductor Equipment | 4.8% | |||
Transportation Infrastructure | 4.6% | |||
Technology Hardware, Storage & Peripherals | 4.6% | |||
Textiles, Apparel & Luxury Goods | 4.1% | |||
Chemicals | 3.9% | |||
Insurance | 3.9% | |||
Auto Components | 3.2% | |||
Metals & Mining | 3.1% | |||
Food Products | 3.1% | |||
Diversified Telecommunication Services | 2.8% | |||
Automobiles | 2.6% | |||
Diversified Financial Services | 2.6% | |||
Tobacco | 2.1% | |||
Software | 2.1% | |||
Health Care Providers & Services | 2.1% | |||
Electric Utilities | 2.1% | |||
Hotels, Restaurants & Leisure | 1.4% | |||
Consumer Finance | 1.4% | |||
Household Durables | 1.3% | |||
Independent Power Producers & Energy Traders | 0.7% | |||
Thrifts & Mortgage Finance | 0.7% | |||
Electrical Equipment | 0.7% | |||
Marine | 0.7% | |||
Capital Markets | 0.7% | |||
Media | 0.7% | |||
IT Services | 0.7% | |||
Distributors | 0.7% | |||
Airlines | 0.7% | |||
Machinery | 0.6% | |||
Multi-Utilities | 0.6% | |||
Health Care Equipment & Supplies | 0.6% | |||
Wireless Telecommunication Services | 0.6% | |||
Pharmaceuticals | 0.6% | |||
Water Utilities | 0.6% | |||
Road & Rail | 0.6% | |||
Real Estate Management & Development | 0.6% | |||
Construction Materials | 0.6% | |||
Repurchase Agreements | 1.9% | |||
Other assets less liabilities | 2.0% | |||
|
| |||
| 100.0% | ||||
|
|
AllianzGI NFJ Global Dividend Value Fund
| Shares | Value | |||||||
| Common Stock—97.6% | ||||||||
| Chile—2.0% | ||||||||
Corpbanca S.A. ADR | 45,500 | $824,005 | ||||||
|
| |||||||
| China—4.3% | ||||||||
China Construction Bank Corp., Class H | 934,700 | 930,808 | ||||||
China Mobile Ltd. | 61,900 | 816,852 | ||||||
|
| |||||||
| 1,747,660 | ||||||||
|
| |||||||
| France—3.7% | ||||||||
Total S.A. | 29,899 | 1,508,867 | ||||||
|
| |||||||
| Germany—1.8% | ||||||||
Siemens AG | 7,000 | 737,576 | ||||||
|
| |||||||
| Hong Kong—1.8% | ||||||||
Television Broadcasts Ltd. | 119,200 | 734,849 | ||||||
|
| |||||||
| Indonesia—3.3% | ||||||||
Bank Rakyat Indonesia Persero Tbk PT ADR | 40,805 | 724,289 | ||||||
Perusahaan Gas Negara Persero Tbk PT | 1,926,500 | 624,632 | ||||||
|
| |||||||
| 1,348,921 | ||||||||
|
| |||||||
| Israel—3.9% | ||||||||
Israel Chemicals Ltd. | 108,500 | 775,820 | ||||||
Teva Pharmaceutical Industries Ltd. ADR | 13,800 | 829,380 | ||||||
|
| |||||||
| 1,605,200 | ||||||||
|
| |||||||
| Japan—6.7% | ||||||||
ITOCHU Corp. | 70,100 | 942,160 | ||||||
Mizuho Financial Group, Inc. | 423,000 | 931,271 | ||||||
Sumitomo Metal Mining Co., Ltd. | 55,000 | 846,057 | ||||||
|
| |||||||
| 2,719,488 | ||||||||
|
| |||||||
| Korea (Republic of)—1.8% | ||||||||
SK Telecom Co., Ltd. | 3,275 | 723,973 | ||||||
|
| |||||||
| Norway—1.8% | ||||||||
Marine Harvest ASA | 62,807 | 721,647 | ||||||
|
| |||||||
| Russian Federation—1.9% | ||||||||
Lukoil OAO ADR | 16,200 | 773,388 | ||||||
|
| |||||||
| South Africa—3.6% | ||||||||
MTN Group Ltd. ADR | 42,200 | 756,224 | ||||||
Sasol Ltd. ADR | 20,821 | 738,521 | ||||||
|
| |||||||
| 1,494,745 | ||||||||
|
| |||||||
| Spain—3.6% | ||||||||
Banco Santander S.A. | 105,829 | 754,486 | ||||||
Enagas S.A. | 25,300 | 727,156 | ||||||
|
| |||||||
| 1,481,642 | ||||||||
|
| |||||||
| Switzerland—1.9% | ||||||||
Swiss Re AG | 8,603 | 773,020 | ||||||
|
| |||||||
| Taiwan—2.0% | ||||||||
Siliconware Precision Industries Co., Ltd. ADR | 98,600 | 805,562 | ||||||
|
| |||||||
| United Kingdom—14.3% | ||||||||
BAE Systems PLC | 101,732 | 802,500 | ||||||
Greene King PLC | 59,300 | 743,744 | ||||||
Imperial Tobacco Group PLC | 16,300 | 840,552 | ||||||
Marks & Spencer Group PLC | 101,400 | 904,600 | ||||||
Persimmon PLC | 60,804 | 1,828,367 | ||||||
Royal Dutch Shell PLC ADR | 11,900 | 710,668 | ||||||
|
| |||||||
| 5,830,431 | ||||||||
|
| |||||||
| 156 | Semiannual Report | | May 31, 2015 | | See accompanying Notes to Financial Statements |
Table of Contents
Schedule of Investments
May 31, 2015 (Unaudited)
| Shares | Value | |||||||
| United States—39.2% | ||||||||
AbbVie, Inc. | 13,000 | $ | 865,670 | |||||
Axis Capital Holdings Ltd. | 16,300 | 897,152 | ||||||
CA, Inc. | 23,900 | 727,755 | ||||||
Cisco Systems, Inc. | 54,900 | 1,609,119 | ||||||
Ford Motor Co. | 47,700 | 723,609 | ||||||
General Motors Co. | 23,300 | 838,101 | ||||||
Intel Corp. | 27,300 | 940,758 | ||||||
International Business Machines Corp. | 4,700 | 797,355 | ||||||
JPMorgan Chase & Co. | 13,200 | 868,296 | ||||||
MetLife, Inc. | 15,300 | 799,578 | ||||||
Navient Corp. | 40,200 | 774,654 | ||||||
Norfolk Southern Corp. | 7,000 | 644,000 | ||||||
Northrop Grumman Corp. | 4,600 | 732,228 | ||||||
Pfizer, Inc. | 22,600 | 785,350 | ||||||
PNC Financial Services Group, Inc. | 8,600 | 822,934 | ||||||
Seagate Technology PLC | 14,900 | 829,036 | ||||||
Symantec Corp. | 35,013 | 862,195 | ||||||
Verizon Communications, Inc. | 15,900 | 786,096 | ||||||
Wal-Mart Stores, Inc. | 9,300 | 690,711 | ||||||
|
| |||||||
| 15,994,597 | ||||||||
|
| |||||||
| Total Common Stock (cost—$35,806,361) | 39,825,571 | |||||||
|
| |||||||
| Principal Amount (000s) | ||||||||
| Repurchase Agreements—1.4% | ||||||||
State Street Bank and Trust Co., dated 5/29/15, 0.00%, due 6/1/15, proceeds $553,000; collateralized by U.S. Treasury Notes, 2.00%, due 8/31/21, valued at $565,406 including accrued interest |
| |||||||
(cost—$553,000) | $553 | 553,000 | ||||||
|
| |||||||
| Total Investments (cost—$36,359,361) (a)—99.0% | 40,378,571 | |||||||
|
| |||||||
| Other assets less liabilities—1.0% | 405,647 | |||||||
|
| |||||||
| Net Assets—100.0% | $40,784,218 | |||||||
|
| |||||||
Notes to Schedule of Investments:
(a) Securities with an aggregate value of $16,934,088, representing 41.5% of net assets, were valued utilizing modeling tools provided by a third-party vendor. See Note 1(a) and Note 1(b) in the Notes to Financial Statements.
Glossary:
ADR—American Depositary Receipt
The industry classification of portfolio holdings and other assets less liabilities shown as a percentage of net assets were as follows:
Banks | 14.3% | |||
Oil, Gas & Consumable Fuels | 9.1% | |||
Insurance | 6.1% | |||
Pharmaceuticals | 6.0% | |||
Wireless Telecommunication Services | 5.6% | |||
Household Durables | 4.5% | |||
Semiconductors & Semiconductor Equipment | 4.3% | |||
Communications Equipment | 3.9% | |||
Software | 3.9% | |||
Automobiles | 3.9% | |||
Aerospace & Defense | 3.8% | |||
Gas Utilities | 3.3% | |||
Trading Companies & Distributors | 2.3% | |||
Multi-line Retail | 2.2% | |||
Metals & Mining | 2.1% | |||
Tobacco | 2.1% | |||
Technology Hardware, Storage & Peripherals | 2.0% | |||
IT Services | 2.0% | |||
Diversified Telecommunication Services | 1.9% | |||
Chemicals | 1.9% | |||
Consumer Finance | 1.9% | |||
Hotels, Restaurants & Leisure | 1.8% | |||
Industrial Conglomerates | 1.8% | |||
Media | 1.8% | |||
Food Products | 1.8% | |||
Food & Staples Retailing | 1.7% | |||
Road & Rail | 1.6% | |||
Repurchase Agreements | 1.4% | |||
Other assets less liabilities | 1.0% | |||
|
| |||
| 100.0% | ||||
|
|
AllianzGI NFJ International Small-Cap Value Fund
| Shares | Value | |||||||
| Common Stock—95.8% | ||||||||
| Australia—4.2% | ||||||||
Bank of Queensland Ltd. | 13,000 | $131,276 | ||||||
Beach Energy Ltd. (c) | 111,315 | 93,225 | ||||||
Charter Hall Retail REIT | 39,052 | 133,331 | ||||||
Genworth Mortgage Insurance Australia Ltd. | 67,105 | 161,725 | ||||||
McMillan Shakespeare Ltd. | 15,104 | 150,563 | ||||||
Pact Group Holdings Ltd. | 43,796 | 140,223 | ||||||
|
| |||||||
| 810,343 | ||||||||
|
| |||||||
| Austria—1.0% | ||||||||
RHI AG | 6,973 | 188,725 | ||||||
|
| |||||||
| Belgium—1.0% | ||||||||
Befimmo S.A. REIT | 2,806 | 184,333 | ||||||
|
| |||||||
| Brazil—1.5% | ||||||||
CVC Brasil Operadora e Agencia de Viagens S.A. | 28,800 | 176,255 | ||||||
Sul America S.A. UNIT | 30,200 | 124,447 | ||||||
|
| |||||||
| 300,702 | ||||||||
|
| |||||||
| Canada—9.0% | ||||||||
Canfor Pulp Products, Inc. | 11,900 | 150,616 | ||||||
Chorus Aviation, Inc. | 28,300 | 144,504 | ||||||
Cogeco, Inc. | 4,393 | 184,113 | ||||||
Linamar Corp. | 3,143 | 214,116 | ||||||
Lucara Diamond Corp. | 137,845 | 229,446 | ||||||
Magellan Aerospace Corp. | 14,315 | 193,384 | ||||||
Martinrea International, Inc. | 12,300 | 139,161 | ||||||
Methanex Corp. | 2,300 | 127,627 | ||||||
New Flyer Industries, Inc. | 15,500 | 194,436 | ||||||
Transcontinental, Inc., Class A | 12,558 | 184,492 | ||||||
|
| |||||||
| 1,761,895 | ||||||||
|
| |||||||
| Chile—0.9% | ||||||||
Corpbanca S.A. ADR | 10,100 | 182,911 | ||||||
|
| |||||||
| China—5.0% | ||||||||
China Mobile Games & Entertainment Group Ltd. ADR | 7,200 | 142,848 | ||||||
Fufeng Group Ltd. | 281,000 | 230,314 | ||||||
Huabao International Holdings Ltd. | 179,000 | 170,380 | ||||||
Lonking Holdings Ltd. | 686,000 | 166,815 | ||||||
Zhejiang Expressway Co., Ltd., Class H | 166,900 | 258,588 | ||||||
|
| |||||||
| 968,945 | ||||||||
|
| |||||||
| Finland—0.7% | ||||||||
Lassila & Tikanoja Oyj | 8,054 | 141,753 | ||||||
|
| |||||||
| France—3.3% | ||||||||
Alten S.A. | 3,048 | 143,391 | ||||||
Euronext NV (a) | 5,576 | 239,144 | ||||||
Rallye S.A. | 4,000 | 128,125 | ||||||
Technicolor S.A. | 20,400 | 130,733 | ||||||
|
| |||||||
| 641,393 | ||||||||
|
| |||||||
| Germany—3.2% | ||||||||
Aareal Bank AG (c) | 3,118 | 123,958 | ||||||
Freenet AG (c) | 4,509 | 148,517 | ||||||
Takkt AG | 7,360 | 138,338 | ||||||
Wacker Neuson SE | 8,806 | 203,431 | ||||||
|
| |||||||
| 614,244 | ||||||||
|
| |||||||
| Hong Kong—5.0% | ||||||||
First Pacific Co., Ltd. | 170,100 | 161,025 | ||||||
Luk Fook Holdings International Ltd. | 34,000 | 108,534 | ||||||
NagaCorp Ltd. | 216,000 | 171,101 | ||||||
Orient Overseas International Ltd. | 31,500 | 173,913 | ||||||
| See accompanying Notes to Financial Statements | | May 31, 2015 | | Semiannual Report | 157 |
Table of Contents
Schedule of Investments
May 31, 2015 (Unaudited)
| Shares | Value | |||||||
PCCW Ltd. | 291,000 | $ | 181,767 | |||||
Television Broadcasts Ltd. | 30,400 | 187,411 | ||||||
|
| |||||||
| 983,751 | ||||||||
|
| |||||||
| Italy—3.3% | ||||||||
Anima Holding SpA (a) | 16,757 | 144,543 | ||||||
ASTM SpA | 13,900 | 188,998 | ||||||
Cementir Holding SpA | 22,200 | 146,531 | ||||||
Credito Emiliano SpA | 20,239 | 167,767 | ||||||
|
| |||||||
| 647,839 | ||||||||
|
| |||||||
| Japan—18.2% | ||||||||
Aderans Co., Ltd. | 12,400 | 109,997 | ||||||
Aida Engineering Ltd. | 11,700 | 135,996 | ||||||
Asahi Holdings, Inc. | 8,500 | 151,509 | ||||||
DTS Corp. | 7,700 | 164,545 | ||||||
Hitachi Chemical Co., Ltd. | 7,400 | 145,870 | ||||||
Jafco Co., Ltd. | 5,000 | 191,521 | ||||||
Japan Aviation Electronics Industry Ltd. | 8,700 | 237,443 | ||||||
Kato Sangyo Co., Ltd. | 8,000 | 174,460 | ||||||
Komori Corp. | 10,500 | 134,496 | ||||||
Nippo Corp. | 9,000 | 156,355 | ||||||
Nippon Soda Co., Ltd. | 23,000 | 137,882 | ||||||
Nissha Printing Co., Ltd. | 7,200 | 130,298 | ||||||
Nitto Kogyo Corp. | 9,100 | 211,082 | ||||||
Round One Corp. | 21,800 | 103,683 | ||||||
Sankyu, Inc. | 37,000 | 196,521 | ||||||
Showa Corp. | 18,100 | 189,325 | ||||||
Sumitomo Osaka Cement Co., Ltd. | 47,000 | 168,103 | ||||||
T-Gaia Corp. | 16,800 | 232,827 | ||||||
Takeuchi Manufacturing Co., Ltd. | 3,300 | 176,457 | ||||||
Tosoh Corp. | 38,800 | 231,246 | ||||||
Towa Pharmaceutical Co., Ltd. | 3,200 | 175,747 | ||||||
|
| |||||||
| 3,555,363 | ||||||||
|
| |||||||
| Netherlands—0.7% | ||||||||
Aalberts Industries NV | 4,297 | 132,708 | ||||||
|
| |||||||
| New Zealand—2.3% | ||||||||
Air New Zealand Ltd. | 73,419 | 155,462 | ||||||
Goodman Property Trust REIT | 181,765 | 152,653 | ||||||
Sky Network Television Ltd. | 32,689 | 147,011 | ||||||
|
| |||||||
| 455,126 | ||||||||
|
| |||||||
| Norway—3.3% | ||||||||
Avance Gas Holding Ltd. (a) | 10,242 | 154,675 | ||||||
Borregaard ASA | 20,347 | 146,540 | ||||||
BW Offshore Ltd. | 203,468 | 157,206 | ||||||
SpareBank 1 SMN | 21,464 | 183,379 | ||||||
|
| |||||||
| 641,800 | ||||||||
|
| |||||||
| Panama—0.9% | ||||||||
Banco Latinoamericano de Comercio Exterior S.A. | 5,700 | 172,881 | ||||||
|
| |||||||
| Philippines—0.9% | ||||||||
Manila Water Co., Inc. | 337,700 | 177,996 | ||||||
|
| |||||||
| Portugal—0.7% | ||||||||
Semapa-Sociedade de Investimento e Gestao | 9,700 | 139,135 | ||||||
|
| |||||||
| Singapore—0.8% | ||||||||
Lippo Malls Indonesia Retail Trust REIT | 539,900 | 150,184 | ||||||
|
| |||||||
| South Africa—2.5% | ||||||||
Astral Foods Ltd. | 8,700 | 118,350 | ||||||
Investec Ltd. | 20,382 | 184,548 | ||||||
JSE Ltd. | 17,483 | 190,740 | ||||||
|
| |||||||
| 493,638 | ||||||||
|
| |||||||
| Spain—2.2% | ||||||||
Cia de Distribucion Integral Logista Holdings S.A. (c)(d) | 6,575 | 136,664 | ||||||
| Shares | Value | |||||||
Grupo Catalana Occidente S.A. | 4,823 | $ | 151,583 | |||||
Liberbank S.A. (d) | 174,300 | 140,641 | ||||||
|
| |||||||
| 428,888 | ||||||||
|
| |||||||
| Sweden—2.9% | ||||||||
B&B Tools AB, Class B | 8,678 | 134,693 | ||||||
Dios Fastigheter AB | 25,372 | 174,757 | ||||||
Granges AB | 18,800 | 141,557 | ||||||
Hemfosa Fastigheter AB | 12,000 | 122,818 | ||||||
|
| |||||||
| 573,825 | ||||||||
|
| |||||||
| Switzerland—1.8% | ||||||||
Cembra Money Bank AG (c)(d) | 2,211 | 140,775 | ||||||
Siegfried Holding AG (d) | 1,161 | 211,855 | ||||||
|
| |||||||
| 352,630 | ||||||||
|
| |||||||
| Taiwan—3.1% | ||||||||
Coretronic Corp. | 88,000 | 113,094 | ||||||
King Yuan Electronics Co., Ltd. | 202,200 | 180,393 | ||||||
King’s Town Bank Co., Ltd. | 166,000 | 162,345 | ||||||
Wisdom Marine Lines Co., Ltd. | 109,000 | 146,613 | ||||||
|
| |||||||
| 602,445 | ||||||||
|
| |||||||
| United Kingdom—17.4% | ||||||||
Bank of Georgia Holdings PLC | 5,507 | 157,312 | ||||||
Beazley PLC | 41,677 | 189,610 | ||||||
Berendsen PLC | 10,595 | 164,630 | ||||||
Bodycote PLC | 14,259 | 162,268 | ||||||
Close Brothers Group PLC | 8,475 | 207,681 | ||||||
Countrywide PLC | 18,549 | 169,843 | ||||||
Crest Nicholson Holdings PLC | 21,286 | 174,220 | ||||||
Go-Ahead Group PLC | 5,120 | 207,949 | ||||||
Hill & Smith Holdings PLC | 13,151 | 141,303 | ||||||
Inchcape PLC | 13,451 | 173,868 | ||||||
Kcom Group PLC | 97,341 | 143,569 | ||||||
Marston’s PLC | 78,039 | 199,091 | ||||||
Micro Focus International PLC | 10,669 | 215,898 | ||||||
Morgan Advanced Materials PLC | 37,096 | 197,307 | ||||||
OneSavings Bank PLC | 32,600 | 163,429 | ||||||
PayPoint PLC | 15,200 | 219,772 | ||||||
RPC Group PLC | 18,804 | 176,704 | ||||||
Savills PLC | 11,271 | 167,345 | ||||||
Synthomer PLC | 29,351 | 157,055 | ||||||
|
| |||||||
| 3,388,854 | ||||||||
|
| |||||||
| Total Common Stock (cost—$17,291,497) | 18,692,307 | |||||||
|
| |||||||
| Preferred Stock—0.8% | ||||||||
| Brazil—0.0% | ||||||||
Banco ABC Brasil S.A. | 853 | 3,126 | ||||||
|
| |||||||
| Germany—0.8% | ||||||||
Hornbach Holding AG | 1,691 | 147,761 | ||||||
|
| |||||||
| Total Preferred Stock (cost—$131,935) | 150,887 | |||||||
|
| |||||||
| Total Investments (cost—$17,423,432) (b)—96.6% | 18,843,194 | |||||||
|
| |||||||
| Other assets less liabilities—3.4% | 668,905 | |||||||
|
| |||||||
| Net Assets—100.0% | $19,512,099 | |||||||
|
| |||||||
Notes to Schedule of Investments:
(a) 144A—Exempt from registration under Rule 144A of the Securities Act of 1933. These securities may be resold in transactions exempt from registration, typically only to qualified institutional buyers. Unless otherwise indicated, these securities are not considered to be illiquid.
(b) Securities with an aggregate value of $13,073,067, representing 67.0% of net assets, were valued utilizing modeling tools provided by a third-party vendor. See Note 1(a) and Note 1(b) in the Notes to Financial Statements.
(c) Affiliated security.
(d) Non-income producing.
Glossary:
ADR—American Depositary Receipt
REIT—Real Estate Investment Trust
UNIT—More than one class of securities traded together.
| 158 | Semiannual Report | | May 31, 2015 | | See accompanying Notes to Financial Statements |
Table of Contents
Schedule of Investments
May 31, 2015 (Unaudited)
The industry classification of portfolio holdings and other assets less liabilities shown as a percentage of net assets were as follows:
Machinery | 7.8% | |||
Chemicals | 7.0% | |||
Banks | 6.6% | |||
Commercial Services & Supplies | 4.3% | |||
Capital Markets | 3.7% | |||
Metals & Mining | 3.4% | |||
Hotels, Restaurants & Leisure | 3.3% | |||
Media | 3.3% | |||
Real Estate Management & Development | 3.3% | |||
Real Estate Investment Trust | 3.3% | |||
Diversified Financial Services | 3.0% | |||
Auto Components | 2.8% | |||
Construction Materials | 2.5% | |||
Specialty Retail | 2.5% | |||
Insurance | 2.4% | |||
Transportation Infrastructure | 2.3% | |||
Thrifts & Mortgage Finance | 2.2% | |||
Road & Rail | 2.1% | |||
Software | 1.8% | |||
Electronic Equipment, Instruments & Components | 1.8% | |||
Marine | 1.7% | |||
Diversified Telecommunication Services | 1.6% | |||
Containers & Packaging | 1.6% | |||
Food & Staples Retailing | 1.6% | |||
IT Services | 1.5% | |||
Airlines | 1.5% | |||
Paper & Forest Products | 1.5% | |||
Oil, Gas & Consumable Fuels | 1.3% | |||
Life Sciences Tools & Services | 1.1% | |||
Electrical Equipment | 1.1% | |||
Aerospace & Defense | 1.0% | |||
Semiconductors & Semiconductor Equipment | 0.9% | |||
Water Utilities | 0.9% | |||
Pharmaceuticals | 0.9% | |||
Household Durables | 0.9% | |||
Distributors | 0.9% | |||
Energy Equipment & Services | 0.8% | |||
Construction & Engineering | 0.8% | |||
Professional Services | 0.8% | |||
Wireless Telecommunication Services | 0.8% | |||
Consumer Finance | 0.7% | |||
Internet & Catalog Retail | 0.7% | |||
Air Freight & Logistics | 0.7% | |||
Trading Companies & Distributors | 0.7% | |||
Food Products | 0.6% | |||
Personal Products | 0.6% | |||
Other assets less liabilities | 3.4% | |||
|
| |||
| 100.0% | ||||
|
|
AllianzGI NFJ International Value II Fund
| Shares | Value | |||||||
| Common Stock—93.4% | ||||||||
| Australia—0.8% | ||||||||
Beach Energy Ltd. (d) | 506,174 | $423,913 | ||||||
|
| |||||||
| Canada—6.5% | ||||||||
Atco Ltd., Class I | 10,800 | 377,861 | ||||||
Cogeco Cable, Inc. | 6,300 | 333,541 | ||||||
Magna International, Inc. | 8,200 | 471,582 | ||||||
Manulife Financial Corp. | 24,200 | 444,264 | ||||||
Methanex Corp. | 7,600 | 421,724 | ||||||
Open Text Corp. | 8,500 | 360,740 | ||||||
Power Financial Corp. | 14,900 | 430,130 | ||||||
Shaw Communications, Inc., Class B | 19,200 | 423,744 | ||||||
|
| |||||||
| 3,263,586 | ||||||||
|
| |||||||
| Chile—0.7% | ||||||||
Corpbanca S.A. ADR | 20,700 | 374,877 | ||||||
|
| |||||||
| China—4.4% | ||||||||
Belle International Holdings Ltd. | 384,000 | 490,298 | ||||||
China Construction Bank Corp., Class H | 479,200 | 477,205 | ||||||
China Mobile Ltd. | 38,300 | 505,419 | ||||||
CNOOC Ltd. | 212,300 | 330,479 | ||||||
PICC Property & Casualty Co., Ltd., Class H | 180,000 | 410,761 | ||||||
|
| |||||||
| 2,214,162 | ||||||||
|
| |||||||
| Denmark—1.0% | ||||||||
TDC A/S | 64,000 | 477,956 | ||||||
|
| |||||||
| France—7.5% | ||||||||
AXA S.A. | 19,800 | 497,501 | ||||||
Christian Dior SE | 2,600 | 520,664 | ||||||
Cie Generale des Etablissements Michelin | 3,800 | 406,579 | ||||||
CNP Assurances | 30,600 | 505,810 | ||||||
Euronext NV (a) | 17,900 | 767,696 | ||||||
Sanofi | 6,800 | 669,666 | ||||||
Technip S.A. | 6,111 | 402,709 | ||||||
|
| |||||||
| 3,770,625 | ||||||||
|
| |||||||
| Germany—1.6% | ||||||||
Aareal Bank AG (d) | 10,300 | 409,482 | ||||||
Talanx AG | 13,400 | 402,787 | ||||||
|
| |||||||
| 812,269 | ||||||||
|
| |||||||
| Hong Kong—8.7% | ||||||||
BOC Hong Kong Holdings Ltd. | 150,300 | 617,879 | ||||||
Cheung Kong Holdings Ltd. (c) | 25,000 | 151,864 | ||||||
CK Hutchison Holdings Ltd. | 25,000 | 388,514 | ||||||
First Pacific Co., Ltd. | 514,100 | 486,673 | ||||||
Hang Lung Group Ltd. | 76,000 | 384,503 | ||||||
Jardine Strategic Holdings Ltd. | 12,600 | 418,147 | ||||||
NWS Holdings Ltd. | 243,000 | 393,898 | ||||||
Orient Overseas International Ltd. | 56,500 | 311,939 | ||||||
PCCW Ltd. | 745,000 | 465,349 | ||||||
Television Broadcasts Ltd. | 74,600 | 459,897 | ||||||
Yue Yuen Industrial Holdings Ltd. | 80,800 | 277,920 | ||||||
|
| |||||||
| 4,356,583 | ||||||||
|
| |||||||
| India—0.8% | ||||||||
Tata Motors Ltd. ADR | 10,700 | 409,810 | ||||||
|
| |||||||
| Ireland—1.3% | ||||||||
Smurfit Kappa Group PLC | 21,951 | 646,373 | ||||||
|
| |||||||
| Israel—2.2% | ||||||||
Israel Chemicals Ltd. | 61,300 | 438,321 | ||||||
Teva Pharmaceutical Industries Ltd. ADR | 11,000 | 661,100 | ||||||
|
| |||||||
| 1,099,421 | ||||||||
|
| |||||||
| Shares | Value | |||||||
| Italy—0.7% | ||||||||
ASTM SpA | 27,700 | $ | 376,636 | |||||
|
| |||||||
| Japan—13.2% | ||||||||
Brother Industries Ltd. | 28,600 | 445,685 | ||||||
Central Japan Railway Co. | 3,400 | 589,229 | ||||||
Hitachi Chemical Co., Ltd. | 19,800 | 390,300 | ||||||
Isuzu Motors Ltd. | 33,700 | 456,334 | ||||||
Kobe Steel Ltd. | 288,000 | 537,658 | ||||||
Mitsui & Co., Ltd. | 21,500 | 300,673 | ||||||
Mizuho Financial Group, Inc. | 315,400 | 694,380 | ||||||
Nippo Corp. | 30,000 | 521,183 | ||||||
Nippon Telegraph & Telephone Corp. | 10,400 | 719,259 | ||||||
Nissan Motor Co., Ltd. | 32,100 | 333,385 | ||||||
Osaka Gas Co., Ltd. | 113,000 | 451,375 | ||||||
Sumitomo Metal Mining Co., Ltd. | 39,000 | 599,931 | ||||||
T&D Holdings, Inc. | 39,900 | 594,842 | ||||||
|
| |||||||
| 6,634,234 | ||||||||
|
| |||||||
| Korea (Republic of)—1.0% | ||||||||
Korea Electric Power Corp. ADR | 23,784 | 491,615 | ||||||
|
| |||||||
| Mexico—1.1% | ||||||||
America Movil S.A.B. de C.V., Ser. L ADR | 26,400 | 554,400 | ||||||
|
| |||||||
| Netherlands—2.3% | ||||||||
Aegon NV | 80,811 | 616,332 | ||||||
Wolters Kluwer NV | 17,900 | 556,403 | ||||||
|
| |||||||
| 1,172,735 | ||||||||
|
| |||||||
| Norway—3.7% | ||||||||
DNB ASA | 27,300 | 478,454 | ||||||
Norsk Hydro ASA | 92,100 | 430,118 | ||||||
SpareBank 1 SR Bank ASA | 60,751 | 433,234 | ||||||
Yara International ASA | 9,800 | 493,766 | ||||||
|
| |||||||
| 1,835,572 | ||||||||
|
| |||||||
| Philippines—0.9% | ||||||||
Manila Water Co., Inc. | 812,300 | 428,150 | ||||||
|
| |||||||
| Russian Federation—0.7% | ||||||||
Lukoil OAO ADR | 7,100 | 338,954 | ||||||
|
| |||||||
| Singapore—2.0% | ||||||||
DBS Group Holdings Ltd. | 42,836 | 644,018 | ||||||
Mapletree Industrial Trust REIT | 324,100 | 383,159 | ||||||
|
| |||||||
| 1,027,177 | ||||||||
|
| |||||||
| South Africa—0.7% | ||||||||
Sasol Ltd. ADR | 10,100 | 358,247 | ||||||
|
| |||||||
| Spain—0.9% | ||||||||
Mapfre S.A. | 123,800 | 441,095 | ||||||
|
| |||||||
| Sweden—2.6% | ||||||||
Hemfosa Fastigheter AB | 32,400 | 331,608 | ||||||
Nordea Bank AB | 39,500 | 514,388 | ||||||
TeliaSonera AB | 81,995 | 483,835 | ||||||
|
| |||||||
| 1,329,831 | ||||||||
|
| |||||||
| Switzerland—2.1% | ||||||||
Baloise Holding AG | 3,400 | 423,720 | ||||||
Roche Holding AG | 2,000 | 609,743 | ||||||
|
| |||||||
| 1,033,463 | ||||||||
|
| |||||||
| Taiwan—3.2% | ||||||||
Advanced Semiconductor Engineering, Inc. ADR | 76,000 | 536,560 | ||||||
AU Optronics Corp. ADR | 100,100 | 541,541 | ||||||
Taiwan Semiconductor Manufacturing Co., Ltd. ADR | 21,300 | 517,164 | ||||||
|
| |||||||
| 1,595,265 | ||||||||
|
| |||||||
| See accompanying Notes to Financial Statements | | May 31, 2015 | | Semiannual Report | 159 |
Table of Contents
Schedule of Investments
May 31, 2015 (Unaudited)
| Shares | Value | |||||||
| Turkey—0.8% | ||||||||
KOC Holding AS ADR | 19,100 | $426,312 | ||||||
|
| |||||||
| United Kingdom—22.0% | ||||||||
BAE Systems PLC | 65,700 | 518,266 | ||||||
BP PLC | 57,700 | 399,268 | ||||||
BT Group PLC | 96,800 | 662,062 | ||||||
Centrica PLC | 68,700 | 291,078 | ||||||
Close Brothers Group PLC | 19,300 | 472,950 | ||||||
Crest Nicholson Holdings PLC | 106,578 | 872,311 | ||||||
Direct Line Insurance Group PLC | 102,700 | 529,502 | ||||||
GlaxoSmithKline PLC | 28,600 | 635,469 | ||||||
Greene King PLC | 35,200 | 441,480 | ||||||
Imperial Tobacco Group PLC | 16,200 | 835,396 | ||||||
Inchcape PLC | 32,700 | 422,681 | ||||||
Man Group PLC | 81,858 | 223,683 | ||||||
Marks & Spencer Group PLC | 66,900 | 596,822 | ||||||
Micro Focus International PLC | 31,869 | 644,902 | ||||||
Mondi PLC | 28,300 | 639,308 | ||||||
Old Mutual PLC | 147,400 | 499,040 | ||||||
Persimmon PLC | 21,505 | 646,652 | ||||||
Rio Tinto PLC | 10,400 | 454,838 | ||||||
Royal Dutch Shell PLC, Class A | 24,000 | 715,402 | ||||||
Sky PLC | 33,871 | 546,643 | ||||||
|
| |||||||
| 11,047,753 | ||||||||
|
| |||||||
| Total Common Stock (cost—$44,928,897) | 46,941,014 | |||||||
|
| |||||||
| Preferred Stock—1.3% | ||||||||
| Germany—1.3% | ||||||||
Volkswagen AG | 2,678 | 650,802 | ||||||
|
| |||||||
| Principal Amount (000s) | ||||||||
| Repurchase Agreements—4.9% | ||||||||
State Street Bank and Trust Co., dated 5/29/15, 0.00%, due 6/1/15, proceeds $2,464,000; collateralized by U.S. Treasury Notes, 2.125%, due 9/30/21, valued at $2,515,350 including accrued interest |
| |||||||
(cost—$2,464,000) | $2,464 | 2,464,000 | ||||||
|
| |||||||
| Total Investments (cost—$48,072,324) (b)—99.6% | 50,055,816 | |||||||
|
| |||||||
Other assets less liabilities—0.4% | 182,044 | |||||||
|
| |||||||
| Net Assets—100.0% | $50,237,860 | |||||||
|
| |||||||
Notes to Schedule of Investments:
(a) 144A—Exempt from registration under Rule 144A of the Securities Act of 1933. These securities may be resold in transactions exempt from registration, typically only to qualified institutional buyers. Unless otherwise indicated, these securities are not considered to be illiquid.
(b) Securities with an aggregate value of $36,079,230, representing 71.8% of net assets, were valued utilizing modeling tools provided by a third-party vendor. See Note 1(a) and Note 1(b) in the Notes to Financial Statements.
(c) Fair-Valued—Security with a value of $151,864, representing 0.3% of net assets. See Note 1(a) and Note 1(b) in the Notes to Financial Statements.
(d) Affiliated security.
Glossary:
ADR—American Depositary Receipt
REIT—Real Estate Investment Trust
The industry classification of portfolio holdings and other assets less liabilities shown as a percentage of net assets were as follows:
Insurance | 11.7% | |||
Banks | 8.3% | |||
Diversified Telecommunication Services | 5.6% | |||
Pharmaceuticals | 5.1% | |||
Oil, Gas & Consumable Fuels | 5.1% | |||
Media | 4.6% | |||
Metals & Mining | 4.1% | |||
Automobiles | 3.6% | |||
Chemicals | 3.5% | |||
Household Durables | 3.0% | |||
Textiles, Apparel & Luxury Goods | 2.7% | |||
Real Estate Management & Development | 2.5% | |||
Diversified Financial Services | 2.5% | |||
Industrial Conglomerates | 2.4% | |||
Wireless Telecommunication Services | 2.1% | |||
Semiconductors & Semiconductor Equipment | 2.1% | |||
Software | 2.0% | |||
Auto Components | 1.7% | |||
Tobacco | 1.7% | |||
Multi-Utilities | 1.4% | |||
Capital Markets | 1.3% | |||
Containers & Packaging | 1.3% | |||
Paper & Forest Products | 1.3% | |||
Multi-line Retail | 1.2% | |||
Road & Rail | 1.2% | |||
Electronic Equipment, Instruments & Components | 1.1% | |||
Construction & Engineering | 1.0% | |||
Aerospace & Defense | 1.0% | |||
Electric Utilities | 1.0% | |||
Gas Utilities | 0.9% | |||
Technology Hardware, Storage & Peripherals | 0.9% | |||
Hotels, Restaurants & Leisure | 0.9% | |||
Water Utilities | 0.9% | |||
Distributors | 0.8% | |||
Thrifts & Mortgage Finance | 0.8% | |||
Energy Equipment & Services | 0.8% | |||
Real Estate Investment Trust | 0.7% | |||
Transportation Infrastructure | 0.7% | |||
Marine | 0.6% | |||
Trading Companies & Distributors | 0.6% | |||
Repurchase Agreements | 4.9% | |||
Other assets less liabilities | 0.4% | |||
|
| |||
| 100.0% | ||||
|
|
| 160 | Semiannual Report | | May 31, 2015 | | See accompanying Notes to Financial Statements |
Table of Contents
Schedule of Investments
May 31, 2015 (Unaudited)
AllianzGI Short Duration High Income Fund
| Principal Amount (000s) | Value | |||||||
| Corporate Bonds & Notes—81.9% | ||||||||
| Advertising—3.0% | ||||||||
Alliance Data Systems Corp. (a)(c), |
| |||||||
5.25%, 12/1/17 | $23,441 | $24,495,845 | ||||||
|
| |||||||
| Auto Components—0.2% | ||||||||
ZF North America Capital, Inc. (a)(c), |
| |||||||
4.00%, 4/29/20 | 1,500 | 1,531,875 | ||||||
|
| |||||||
| Auto Manufacturers—0.3% | ||||||||
General Motors Financial Co., Inc., |
| |||||||
3.25%, 5/15/18 | 250 | 256,122 | ||||||
4.75%, 8/15/17 | 1,980 | 2,094,052 | ||||||
6.75%, 6/1/18 | 325 | 364,961 | ||||||
|
| |||||||
| 2,715,135 | ||||||||
|
| |||||||
| Banks—1.7% | ||||||||
CIT Group, Inc., | 13,400 | 13,926,620 | ||||||
|
| |||||||
| Building Materials—1.8% | ||||||||
Louisiana-Pacific Corp., | 14,280 | 15,351,000 | ||||||
|
| |||||||
| Coal—1.5% | ||||||||
Cloud Peak Energy Resources LLC, |
| |||||||
8.50%, 12/15/19 | 12,650 | 12,112,375 | ||||||
|
| |||||||
| Commercial Services—1.3% | ||||||||
Hertz Corp., | 4,624 | 4,797,400 | ||||||
United Rentals North America, Inc., |
| |||||||
7.375%, 5/15/20 | 5,780 | 6,256,850 | ||||||
|
| |||||||
| 11,054,250 | ||||||||
|
| |||||||
| Computers—0.1% | ||||||||
Seagate HDD Cayman, | 1,000 | 1,046,291 | ||||||
|
| |||||||
| Containers & Packaging—4.2% | ||||||||
Novelis, Inc., | 22,965 | 24,055,838 | ||||||
Reynolds Group Issuer, Inc., | 10,076 | 10,441,255 | ||||||
|
| |||||||
| 34,497,093 | ||||||||
|
| |||||||
| Distribution/Wholesale—3.1% | ||||||||
Brightstar Corp. (a)(c), | ||||||||
7.25%, 8/1/18 | 12,460 | 13,238,750 | ||||||
9.50%, 12/1/16 | 12,083 | 12,528,863 | ||||||
|
| |||||||
| 25,767,613 | ||||||||
|
| |||||||
| Diversified Financial Services—6.6% | ||||||||
Aircastle Ltd., | ||||||||
4.625%, 12/15/18 | 3,791 | 3,961,595 | ||||||
6.75%, 4/15/17 | 13,686 | 14,746,665 | ||||||
Ally Financial, Inc., | ||||||||
3.60%, 5/21/18 | 4,000 | 4,025,000 | ||||||
4.125%, 3/30/20 | 7,000 | 7,017,500 | ||||||
4.75%, 9/10/18 | 2,280 | 2,365,500 | ||||||
5.50%, 2/15/17 | 1,175 | 1,230,812 | ||||||
Fly Leasing Ltd., | 16,833 | 17,422,155 | ||||||
International Lease Finance Corp., |
| |||||||
2.221%, 6/15/16 (e) | 600 | 602,250 | ||||||
6.75%, 9/1/16 (a)(c) | 870 | 921,656 | ||||||
8.625%, 9/15/15 | 250 | 254,688 | ||||||
TMX Finance LLC (a)(c), | 3,000 | 2,556,000 | ||||||
|
| |||||||
| 55,103,821 | ||||||||
|
| |||||||
| Principal Amount (000s) | Value | |||||||
| Electric Utilities—1.6% | ||||||||
Ipalco Enterprises, Inc. (a)(c), 7.25%, 4/1/16 | $ | 2,300 | $ | 2,409,250 | ||||
NRG Energy, Inc., | 9,748 | 10,888,516 | ||||||
|
| |||||||
| 13,297,766 | ||||||||
|
| |||||||
| Entertainment—2.3% | ||||||||
Scientific Games Corp., | 20,330 | 19,110,200 | ||||||
|
| |||||||
| Healthcare-Products—1.7% | ||||||||
Hologic, Inc., | 5,724 | 5,945,805 | ||||||
Mallinckrodt International Finance S.A. (a)(c), |
| |||||||
4.875%, 4/15/20 | 7,950 | 8,168,625 | ||||||
|
| |||||||
| 14,114,430 | ||||||||
|
| |||||||
| Holding Companies-Diversified—0.1% | ||||||||
Leucadia National Corp., 8.125%, 9/15/15 | 860 | 876,663 | ||||||
|
| |||||||
| Home Builders—9.4% | ||||||||
Brookfield Residential Properties, Inc. (a)(c), |
| |||||||
6.50%, 12/15/20 | 16,798 | 17,343,935 | ||||||
Lennar Corp., | 950 | 971,375 | ||||||
Meritage Homes Corp., | 15,790 | 16,105,800 | ||||||
TRI Pointe Holdings, Inc. (a)(c), | 20,500 | 20,269,375 | ||||||
William Lyon Homes, Inc., |
| |||||||
5.75%, 4/15/19 | 3,700 | 3,764,750 | ||||||
8.50%, 11/15/20 | 17,975 | 19,637,688 | ||||||
|
| |||||||
| 78,092,923 | ||||||||
|
| |||||||
| Internet—2.9% | ||||||||
Equinix, Inc., | 9,852 | 10,221,450 | ||||||
j2 Global, Inc., | 12,850 | 13,910,125 | ||||||
|
| |||||||
| 24,131,575 | ||||||||
|
| |||||||
| Leisure Time—0.1% | ||||||||
NCL Corp., Ltd., | 444 | 456,210 | ||||||
|
| |||||||
| Machinery-Diversified—1.9% | ||||||||
Case New Holland Industrial, Inc., |
| |||||||
7.875%, 12/1/17 | 4,250 | 4,722,812 | ||||||
CNH Industrial Capital LLC, | ||||||||
3.25%, 2/1/17 | 6,222 | 6,268,665 | ||||||
3.875%, 11/1/15 | 4,585 | 4,625,119 | ||||||
|
| |||||||
| 15,616,596 | ||||||||
|
| |||||||
| Media—3.4% | ||||||||
Cablevision Systems Corp., | 14,628 | 16,072,515 | ||||||
CCO Holdings LLC, | 5,723 | 5,955,497 | ||||||
DISH DBS Corp., | ||||||||
4.25%, 4/1/18 | 2,000 | 2,060,000 | ||||||
4.625%, 7/15/17 | 4,146 | 4,317,022 | ||||||
|
| |||||||
| 28,405,034 | ||||||||
|
| |||||||
| Metals & Mining—2.2% | ||||||||
ArcelorMittal, | ||||||||
5.125%, 6/1/20 (d) | 15,250 | 15,516,875 | ||||||
10.60%, 6/1/19 | 2,000 | 2,432,500 | ||||||
|
| |||||||
| 17,949,375 | ||||||||
|
| |||||||
| Principal Amount (000s) | Value | |||||||
| Mining—1.2% | ||||||||
Alcoa, Inc., | $ | 8,900 | $ | 10,097,201 | ||||
|
| |||||||
| Oil, Gas & Consumable Fuels—3.6% | ||||||||
AmeriGas Partners L.P., |
| |||||||
6.25%, 8/20/19 | 10,685 | 11,085,688 | ||||||
Light Tower Rentals, Inc. (a)(c), |
| |||||||
8.125%, 8/1/19 | 10,000 | 8,500,000 | ||||||
NGL Energy Partners LP, |
| |||||||
5.125%, 7/15/19 | 10,348 | 10,322,130 | ||||||
|
| |||||||
| 29,907,818 | ||||||||
|
| |||||||
| Pharmaceuticals—4.7% | ||||||||
Valeant Pharmaceuticals International, Inc. (a)(c), |
| |||||||
5.375%, 3/15/20 | 12,000 | 12,540,000 | ||||||
7.00%, 10/1/20 | 25,071 | 26,293,211 | ||||||
|
| |||||||
| 38,833,211 | ||||||||
|
| |||||||
| Pipelines—3.6% | ||||||||
Crestwood Midstream Partners L.P., |
| |||||||
6.00%, 12/15/20 | 2,000 | 2,105,000 | ||||||
Sabine Pass LNG L.P., |
| |||||||
7.50%, 11/30/16 | 21,780 | 23,359,050 | ||||||
SemGroup Corp., |
| |||||||
7.50%, 6/15/21 | 3,830 | 4,059,800 | ||||||
|
| |||||||
| 29,523,850 | ||||||||
|
| |||||||
| Real Estate—0.3% | ||||||||
Realogy Group LLC (a)(c), |
| |||||||
7.625%, 1/15/20 | 2,600 | 2,791,750 | ||||||
|
| |||||||
| Retail—5.7% | ||||||||
GameStop Corp. (a)(c), |
| |||||||
5.50%, 10/1/19 | 17,407 | 18,125,039 | ||||||
Sally Holdings LLC, |
| |||||||
6.875%, 11/15/19 | 741 | 783,607 | ||||||
Tops Holding Corp., |
| |||||||
8.875%, 12/15/17 | 26,856 | 28,198,800 | ||||||
|
| |||||||
| 47,107,446 | ||||||||
|
| |||||||
| Software—2.7% | ||||||||
First Data Corp. (a)(c), |
| |||||||
8.875%, 8/15/20 | 20,922 | 22,177,320 | ||||||
|
| |||||||
| Telecommunications—10.5% | ||||||||
Intelsat Jackson Holdings S.A., |
| |||||||
7.25%, 4/1/19 | 22,810 | 23,465,787 | ||||||
Sprint Capital Corp., |
| |||||||
6.90%, 5/1/19 | 16,850 | 17,517,260 | ||||||
Sprint Communications, Inc., |
| |||||||
8.375%, 8/15/17 | 1,537 | 1,683,015 | ||||||
T-Mobile USA, Inc., |
| |||||||
6.464%, 4/28/19 | 34,939 | 36,183,702 | ||||||
ViaSat, Inc., |
| |||||||
6.875%, 6/15/20 | 4,700 | 5,005,500 | ||||||
Windstream Services LLC, |
| |||||||
7.875%, 11/1/17 | 3,250 | 3,514,063 | ||||||
|
| |||||||
| 87,369,327 | ||||||||
|
| |||||||
| Transportation—0.2% | ||||||||
AWAS Aviation Capital Ltd. (a)(c), |
| |||||||
7.00%, 10/17/16 | 2,033 | 2,071,567 | ||||||
|
| |||||||
| Total Corporate Bonds & Notes (cost—$678,843,058) | 679,532,180 | |||||||
|
| |||||||
| See accompanying Notes to Financial Statements | | May 31, 2015 | | Semiannual Report | 161 |
Table of Contents
Schedule of Investments
May 31, 2015 (Unaudited)
| Principal Amount (000s) | Value | |||||||
| Senior Loans (a)(b)—10.9% | ||||||||
| Commercial Services & Supplies—4.1% | ||||||||
Asurion LLC, | ||||||||
5.00%, 5/24/19, Term B1 | $ | 9,538 | $ | 9,589,295 | ||||
8.50%, 3/3/21, 2nd Lien | 24,000 | 24,641,256 | ||||||
|
| |||||||
| 34,230,551 | ||||||||
|
| |||||||
| Diversified Telecommunication Services—0.6% | ||||||||
Level 3 Financing, Inc., Term B, |
| |||||||
4.00%, 1/15/20 | 5,000 | 5,006,250 | ||||||
|
| |||||||
| Financial Services—1.8% | ||||||||
Delos Finance Sarl, Term B, |
| |||||||
3.50%, 3/6/21 | 15,000 | 15,034,380 | ||||||
|
| |||||||
| Real Estate Investment Trust—2.5% | ||||||||
Communications Sales & Leasing, Inc., Term B, | ||||||||
5.00%, 10/24/22 | 20,500 | 20,484,625 | ||||||
|
| |||||||
| Specialty Retail—1.9% | ||||||||
J Crew Group, Inc., Term B, |
| |||||||
4.00%, 3/5/21 | 6,453 | 5,898,484 | ||||||
PetSmart, Inc., Term B, | ||||||||
4.25%, 3/10/22 | 10,000 | 10,046,530 | ||||||
|
| |||||||
| 15,945,014 | ||||||||
|
| |||||||
| Total Senior Loans (cost—$90,514,170) | 90,700,820 | |||||||
|
| |||||||
| Repurchase Agreements—6.7% | ||||||||
State Street Bank and Trust Co., dated 5/29/15, 0.00%, due 6/1/15, proceeds $55,837,000; collateralized by U.S. Treasury Notes, 2.00%, due 8/31/21, valued at $56,958,313 including accrued interest |
| |||||||
(cost—$55,837,000) | 55,837 | 55,837,000 | ||||||
|
| |||||||
| Total Investments (cost—$825,194,228)—99.5% | 826,070,000 | |||||||
|
| |||||||
| Other assets less liabilities—0.5% | 4,040,563 | |||||||
|
| |||||||
| Net Assets—100.0% | $830,110,563 | |||||||
|
| |||||||
Notes to Schedule of Investments:
(a) Private Placement—Restricted as to resale and may not have a readily available market. Securities with an aggregate value of $286,663,881, representing 34.5% of net assets.
(b) These securities generally pay interest at rates which are periodically pre-determined by reference to a base lending rate plus a premium. These base lending rates are generally either the lending rate offered by one or more major European banks, such as the “LIBOR” or the prime rate offered by one or more major United States banks, or the certificate of deposit rate. These securities are generally considered to be restricted as the Fund is ordinarily contractually obligated to receive approval from the Agent bank and/or borrower prior to disposition. Remaining maturities of senior loans may be less than the stated maturities shown as a result of contractual or optional payments by the borrower. Such prepayments cannot be predicted with certainty. The interest rate disclosed reflects the rate in effect on May 31, 2015.
(c) 144A—Exempt from registration under Rule 144A of the Securities Act of 1933. These securities may be resold in transactions exempt from registration, typically only to qualified institutional buyers. Unless otherwise indicated, these securities are not considered to be illiquid.
(d) When-issued or delayed-delivery. To be settled/delivered after May 31, 2015.
(e) Variable or Floating Rate Security—Security with an interest rate that changes periodically. The interest rate disclosed reflects the rate in effect on May 31, 2015.
AllianzGI Structured Return Fund
| Shares | Value | |||||||
| Exchange-Traded Funds—95.2% | ||||||||
SPDR S&P 500 (a) | 143,000 | $30,191,590 | ||||||
|
| |||||||
| Principal Amount (000s) | ||||||||
| Repurchase Agreements—8.1% | ||||||||
State Street Bank and Trust Co., dated 5/29/15, 0.00%, due 6/1/15, proceeds $2,553,000; collateralized by U.S. Treasury Notes, 2.125%, due 6/30/21, valued at $2,607,881 including accrued interest |
| |||||||
(cost—$2,553,000) | $2,553 | 2,553,000 | ||||||
|
| |||||||
| Contracts | ||||||||
| Options Purchased (b)(c)—0.3% | ||||||||
| Call Options—0.0% | ||||||||
S&P 500 Index, | 12 | 90 | ||||||
strike price $2,400.00, expires 6/5/15 | 23 | 255 | ||||||
strike price $2,400.00, expires 6/12/15 | 27 | 300 | ||||||
strike price $2,400.00, expires 6/19/15 | 26 | 383 | ||||||
strike price $2,400.00, expires 6/26/15 | 31 | 344 | ||||||
strike price $2,400.00, expires 7/2/15 | 24 | 240 | ||||||
|
| |||||||
| 1,612 | ||||||||
|
| |||||||
| Put Options—0.3% | ||||||||
S&P 500 Index, | 18 | 135 | ||||||
strike price $1,550.00, expires 6/5/15 | 25 | 187 | ||||||
strike price $2,035.00, expires 6/5/15 | 12 | 2,580 | ||||||
strike price $1,500.00, expires 6/12/15 | 40 | 300 | ||||||
strike price $1,775.00, expires 6/12/15 | 125 | 1,250 | ||||||
strike price $2,025.00, expires 6/12/15 | 10 | 4,000 | ||||||
strike price $1,500.00, expires 6/19/15 | 15 | 113 | ||||||
strike price $1,550.00, expires 6/19/15 | 30 | 225 | ||||||
strike price $1,600.00, expires 6/26/15 | 35 | 612 | ||||||
strike price $2,040.00, expires 6/26/15 | 15 | 17,700 | ||||||
strike price $2,070.00, expires 6/26/15 | 10 | 17,600 | ||||||
strike price $1,550.00, expires 6/30/15 | 15 | 225 | ||||||
strike price $1,600.00, expires 6/30/15 | 18 | 270 | ||||||
strike price $1,575.00, expires 7/2/15 | 15 | 225 | ||||||
strike price $2,070.00, expires 7/2/15 | 10 | 20,450 | ||||||
strike price $1,550.00, expires 7/10/15 | 15 | 300 | ||||||
| 162 | Semiannual Report | | May 31, 2015 | | See accompanying Notes to Financial Statements |
Table of Contents
Schedule of Investments
May 31, 2015 (Unaudited)
| Contracts | Value | |||||||
strike price $2,070.00, expires 7/10/15 | 10 | $ | 23,750 | |||||
|
| |||||||
| 89,922 | ||||||||
|
| |||||||
| Total Options Purchased (cost—$136,816) | 91,534 | |||||||
|
| |||||||
| Total Investments, before options written (cost—$31,761,319)—103.6% | 32,836,124 | |||||||
|
| |||||||
| Options Written (b)(c)—(4.1)% | ||||||||
| Call Options—(3.8)% | ||||||||
S&P 500 Index, | 12 | (112,500 | ) | |||||
strike price $2,035.00, expires 6/5/15 | 23 | (171,695 | ) | |||||
strike price $2,025.00, expires 6/12/15 | 27 | (230,715 | ) | |||||
strike price $2,035.00, expires 6/19/15 | 26 | (209,170 | ) | |||||
strike price $2,040.00, expires 6/26/15 | 31 | (240,095 | ) | |||||
strike price $2,020.00, expires 7/2/15 | 24 | (231,960 | ) | |||||
|
| |||||||
| (1,196,135 | ) | |||||||
|
| |||||||
| Put Options—(0.3)% | ||||||||
S&P 500 Index, | 17 | (680 | ) | |||||
strike price $1,980.00, expires 6/5/15 | 24 | (1,320 | ) | |||||
strike price $1,935.00, expires 6/12/15 | 17 | (1,445 | ) | |||||
strike price $1,965.00, expires 6/12/15 | 20 | (2,800 | ) | |||||
strike price $1,900.00, expires 6/19/15 | 10 | (1,150 | ) | |||||
strike price $1,935.00, expires 6/19/15 | 20 | (3,600 | ) | |||||
strike price $1,990.00, expires 6/26/15 | 30 | (18,300 | ) | |||||
strike price $2,020.00, expires 6/26/15 | 20 | (18,200 | ) | |||||
strike price $1,970.00, expires 6/30/15 | 12 | (6,720 | ) | |||||
strike price $2,000.00, expires 6/30/15 | 10 | (8,000 | ) | |||||
strike price $2,015.00, expires 7/2/15 | 20 | (21,200 | ) | |||||
strike price $2,010.00, expires 7/10/15 | 20 | (24,800 | ) | |||||
|
| |||||||
| (108,215 | ) | |||||||
|
| |||||||
| Total Options Written (premiums received—$1,494,549) | (1,304,350 | ) | ||||||
|
| |||||||
| Total Investments, net of options written (cost—$30,266,770)—99.5% | 31,531,774 | |||||||
|
| |||||||
| Other assets less other liabilities—0.5% | 155,243 | |||||||
|
| |||||||
| Net Assets—100.0% | $31,687,017 | |||||||
|
| |||||||
Notes to Schedule of Investments:
(a) All or partial amount segregated for the benefit of the counterparty as collateral for options written.
(b) Non-income producing.
(c) Exchange traded-Chicago Board Options Exchange.
AllianzGI U.S. Equity Hedged Fund
| Shares | Value | |||||||
| Exchange-Traded Funds—97.0% | ||||||||
SPDR S&P 500 (a) | 74,000 | $15,623,620 | ||||||
|
| |||||||
| Principal Amount (000s) | ||||||||
| Repurchase Agreements—2.4% | ||||||||
State Street Bank and Trust Co., dated 5/29/15, 0.00%, due 6/1/15, proceeds $381,000; collateralized by U.S. Treasury Notes, 2.125%, due 6/30/21, valued at $390,925 including accrued interest |
| |||||||
(cost—$381,000) | $381 | 381,000 | ||||||
|
| |||||||
| Contracts | ||||||||
| Options Purchased (b)(c)—1.5% | ||||||||
| Call Options—0.0% | ||||||||
S&P 500 Index, | 50 | 500 | ||||||
|
| |||||||
| Put Options—1.5% | ||||||||
S&P 500 Index, | 6 | 1,920 | ||||||
strike price $2,050.00, expires 6/12/15 | 6 | 3,840 | ||||||
strike price $1,875.00, expires 6/30/15 | 13 | 2,470 | ||||||
strike price $1,800.00, expires 9/30/15 | 10 | 12,750 | ||||||
strike price $1,900.00, expires 12/19/15 | 13 | 53,495 | ||||||
strike price $1,800.00, expires 12/31/15 | 12 | 34,620 | ||||||
strike price $1,875.00, expires 1/15/16 | 6 | 25,290 | ||||||
strike price $1,900.00, expires 1/15/16 | 7 | 32,585 | ||||||
strike price $1,900.00, expires 3/31/16 | 13 | 83,525 | ||||||
|
| |||||||
| 250,495 | ||||||||
|
| |||||||
| Total Options Purchased (cost—$659,929) | 250,995 | |||||||
|
| |||||||
| Total Investments, before options written (cost—$16,359,034)—100.9% | 16,255,615 | |||||||
|
| |||||||
| Options Written (b)(c)—(0.3)% | ||||||||
| Call Options—(0.3)% | ||||||||
S&P 500 Index, | 74 | (45,140 | ) | |||||
|
| |||||||
| Put Options—(0.0)% | ||||||||
S&P 500 Index, | 12 | (840 | ) | |||||
strike price $1,980.00, expires 6/12/15 | 12 | (2,100 | ) | |||||
|
| |||||||
| (2,940 | ) | |||||||
|
| |||||||
| Total Options Written (premiums received—$68,929) | (48,080 | ) | ||||||
|
| |||||||
| See accompanying Notes to Financial Statements | | May 31, 2015 | | Semiannual Report | 163 |
Table of Contents
Schedule of Investments
May 31, 2015 (Unaudited)
| Value | ||||||
| Total Investments, net of options written (cost—$16,290,105)—100.6% | $ | 16,207,535 | ||||
|
| |||||
| Other liabilities in excess of other assets—(0.6)% | (94,646 | ) | ||||
|
| |||||
| Net Assets—100.0% | $16,112,889 | |||||
|
| |||||
Notes to Schedule of Investments:
(a) All or partial amount segregated for the benefit of the counterparty as collateral for options written.
(b) Non-income producing.
(c) Exchange traded-Chicago Board Options Exchange.
AllianzGI U.S. Small-Cap Growth Fund
| Shares | Value | |||||||
| Common Stock—97.1% | ||||||||
| Aerospace & Defense—0.8% | ||||||||
Astronics Corp. (b) | 5,402 | $377,546 | ||||||
|
| |||||||
| Air Freight & Logistics—2.6% | ||||||||
Echo Global Logistics, Inc. (b) | 10,520 | 338,534 | ||||||
Forward Air Corp. | 6,632 | 344,002 | ||||||
XPO Logistics, Inc. (b) | 9,795 | 481,522 | ||||||
|
| |||||||
| 1,164,058 | ||||||||
|
| |||||||
| Auto Components—0.7% | ||||||||
Motorcar Parts of America, Inc. (b) | 10,840 | 311,867 | ||||||
|
| |||||||
| Banks—5.5% | ||||||||
Bank of the Ozarks, Inc. | 13,199 | 580,360 | ||||||
Cathay General Bancorp | 15,460 | 467,201 | ||||||
PrivateBancorp, Inc. | 14,466 | 551,589 | ||||||
South State Corp. | 5,075 | 364,537 | ||||||
Western Alliance Bancorp (b) | 17,036 | 534,079 | ||||||
|
| |||||||
| 2,497,766 | ||||||||
|
| |||||||
| Biotechnology—6.1% | ||||||||
AMAG Pharmaceuticals, Inc. (b) | 6,165 | 428,961 | ||||||
Cepheid (b) | 6,575 | 362,743 | ||||||
Eagle Pharmaceuticals, Inc. (b) | 4,693 | 340,852 | ||||||
Esperion Therapeutics, Inc. (b) | 1,981 | 212,977 | ||||||
Insys Therapeutics, Inc. (b) | 5,676 | 338,290 | ||||||
Ligand Pharmaceuticals, Inc., Class B (b) | 4,437 | 390,944 | ||||||
Receptos, Inc. (b) | 1,821 | 300,265 | ||||||
Repligen Corp. (b) | 9,845 | 401,282 | ||||||
|
| |||||||
| 2,776,314 | ||||||||
|
| |||||||
| Building Products—0.8% | ||||||||
Builders FirstSource, Inc. (b) | 27,701 | 340,168 | ||||||
|
| |||||||
| Capital Markets—1.8% | ||||||||
Cowen Group, Inc., Class A (a)(b) | 64,504 | 380,574 | ||||||
HFF, Inc., Class A | 11,277 | 453,786 | ||||||
|
| |||||||
| 834,360 | ||||||||
|
| |||||||
| Chemicals—0.8% | ||||||||
Ferro Corp. (b) | 1,763 | 26,745 | ||||||
PolyOne Corp. | 8,570 | 333,287 | ||||||
|
| |||||||
| 360,032 | ||||||||
|
| |||||||
| Commercial Services & Supplies—0.5% | ||||||||
Knoll, Inc. | 9,660 | 219,862 | ||||||
|
| |||||||
| Communications Equipment—0.7% | ||||||||
EchoStar Corp., Class A (b) | 6,532 | 327,253 | ||||||
|
| |||||||
| Construction Materials—0.8% | ||||||||
U.S. Concrete, Inc. (b) | 9,834 | 371,627 | ||||||
|
| |||||||
| Distributors—0.7% | ||||||||
Core-Mark Holding Co., Inc. | 6,025 | 323,603 | ||||||
|
| |||||||
| Diversified Telecommunication Services—2.0% | ||||||||
8x8, Inc. (b) | 38,360 | 319,922 | ||||||
inContact, Inc. (b) | 26,833 | 260,817 | ||||||
Vonage Holdings Corp. (b) | 65,844 | 306,833 | ||||||
|
| |||||||
| 887,572 | ||||||||
|
| |||||||
| Electronic Equipment, Instruments & Components—2.7% | ||||||||
Belden, Inc. | 4,315 | 364,272 | ||||||
DTS, Inc. (b) | 4,424 | 140,374 | ||||||
Methode Electronics, Inc. | 4,786 | 224,607 | ||||||
Newport Corp. (b) | 16,210 | 306,207 | ||||||
Orbotech Ltd. (b) | 9,988 | 208,749 | ||||||
|
| |||||||
| 1,244,209 | ||||||||
|
| |||||||
| Energy Equipment & Services—0.6% | ||||||||
C&J Energy Services Ltd. (b) | 19,433 | 292,078 | ||||||
|
| |||||||
| Food & Staples Retailing—0.7% | ||||||||
United Natural Foods, Inc. (b) | 4,438 | 297,657 | ||||||
|
| |||||||
| Shares | Value | |||||||
| Food Products—0.4% | ||||||||
B&G Foods, Inc. | 5,883 | $ | 182,020 | |||||
|
| |||||||
| Health Care Equipment & Supplies—3.8% | ||||||||
Cardiovascular Systems, Inc. (b) | 6,906 | 193,230 | ||||||
Cynosure, Inc., Class A (b) | 11,013 | 393,164 | ||||||
Globus Medical, Inc., Class A (b) | 15,330 | 397,660 | ||||||
Inogen, Inc. (b) | 9,588 | 358,399 | ||||||
LDR Holding Corp. (b) | 9,888 | 400,662 | ||||||
|
| |||||||
| 1,743,115 | ||||||||
|
| |||||||
| Health Care Providers & Services—7.4% | ||||||||
AAC Holdings, Inc. (b) | 5,402 | 209,922 | ||||||
Acadia Healthcare Co., Inc. (b) | 8,679 | 643,461 | ||||||
Adeptus Health, Inc., Class A (b) | 6,067 | 424,993 | ||||||
Amsurg Corp. (b) | 6,858 | 461,818 | ||||||
Centene Corp. (b) | 6,557 | 494,004 | ||||||
ExamWorks Group, Inc. (b) | 7,793 | 318,578 | ||||||
Providence Service Corp. (b) | 6,872 | 330,268 | ||||||
Team Health Holdings, Inc. (b) | 7,875 | 460,530 | ||||||
|
| |||||||
| 3,343,574 | ||||||||
|
| |||||||
| Health Care Technology—0.9% | ||||||||
Omnicell, Inc. (b) | 10,783 | 398,755 | ||||||
|
| |||||||
| Hotels, Restaurants & Leisure—7.1% | ||||||||
Cheesecake Factory, Inc. | 7,229 | 372,799 | ||||||
Diamond Resorts International, Inc. (b) | 16,158 | 502,514 | ||||||
Krispy Kreme Doughnuts, Inc. (b) | 17,304 | 300,917 | ||||||
La Quinta Holdings, Inc. (b) | 19,596 | 487,157 | ||||||
Marriott Vacations Worldwide Corp. | 6,337 | 559,430 | ||||||
Six Flags Entertainment Corp. | 6,172 | 301,564 | ||||||
Sonic Corp. | 10,656 | 321,172 | ||||||
Texas Roadhouse, Inc. | 10,666 | 373,523 | ||||||
|
| |||||||
| 3,219,076 | ||||||||
|
| |||||||
| Household Durables—1.4% | ||||||||
Helen of Troy Ltd. (b) | 3,976 | 347,860 | ||||||
Ryland Group, Inc. (a) | 7,076 | 297,688 | ||||||
|
| |||||||
| 645,548 | ||||||||
|
| |||||||
| Insurance—1.6% | ||||||||
AMERISAFE, Inc. | 9,267 | 396,071 | ||||||
Hanover Insurance Group, Inc. | 4,915 | 349,850 | ||||||
|
| |||||||
| 745,921 | ||||||||
|
| |||||||
| Internet Software & Services—1.4% | ||||||||
Actua Corp. (b) | 1,605 | 20,399 | ||||||
Endurance International Group Holdings, Inc. (b) | 14,973 | 304,401 | ||||||
SPS Commerce, Inc. (b) | 4,787 | 311,251 | ||||||
|
| |||||||
| 636,051 | ||||||||
|
| |||||||
| IT Services—2.7% | ||||||||
Convergys Corp. | 17,141 | 425,611 | ||||||
MAXIMUS, Inc. | 6,829 | 446,412 | ||||||
WEX, Inc. (b) | 3,134 | 355,364 | ||||||
|
| |||||||
| 1,227,387 | ||||||||
|
| |||||||
| Life Sciences Tools & Services—3.2% | ||||||||
Albany Molecular Research, Inc. (b) | 19,649 | 395,927 | ||||||
Cambrex Corp. (b) | 8,835 | 353,577 | ||||||
ICON PLC (b) | 6,716 | 435,667 | ||||||
PAREXEL International Corp. (b) | 4,183 | 278,044 | ||||||
|
| |||||||
| 1,463,215 | ||||||||
|
| |||||||
| Machinery—0.8% | ||||||||
Middleby Corp. (b) | 1,017 | 110,548 | ||||||
Mueller Water Products, Inc., Class A | 28,700 | 264,614 | ||||||
|
| |||||||
| 375,162 | ||||||||
|
| |||||||
| 164 | Semiannual Report | | May 31, 2015 | | See accompanying Notes to Financial Statements |
Table of Contents
Schedule of Investments
May 31, 2015 (Unaudited)
| Shares | Value | |||||||
| Media—1.5% | ||||||||
MDC Partners, Inc., Class A | 13,561 | $ | 287,493 | |||||
New Media Investment Group, Inc. | 17,507 | 385,504 | ||||||
|
| |||||||
| 672,997 | ||||||||
|
| |||||||
| Metals & Mining—0.8% | ||||||||
Kaiser Aluminum Corp. | 4,442 | 360,379 | ||||||
|
| |||||||
| Multi-line Retail—0.9% | ||||||||
Burlington Stores, Inc. (b) | 7,671 | 404,799 | ||||||
|
| |||||||
| Oil, Gas & Consumable Fuels—3.9% | ||||||||
Abraxas Petroleum Corp. (b) | 94,008 | 275,443 | ||||||
Carrizo Oil & Gas, Inc. (b) | 6,574 | 329,752 | ||||||
Diamondback Energy, Inc. (b) | 3,713 | 288,909 | ||||||
Matador Resources Co. (b) | 11,845 | 326,211 | ||||||
Synergy Resources Corp. (b) | 18,506 | 213,004 | ||||||
Teekay Tankers Ltd., Class A | 52,852 | 356,751 | ||||||
|
| |||||||
| 1,790,070 | ||||||||
|
| |||||||
| Paper & Forest Products—0.5% | ||||||||
KapStone Paper and Packaging Corp. | 8,709 | 234,708 | ||||||
|
| |||||||
| Pharmaceuticals—5.3% | ||||||||
ANI Pharmaceuticals, Inc. (b) | 5,904 | 297,444 | ||||||
Depomed, Inc. (b) | 15,505 | 323,434 | ||||||
Horizon Pharma PLC (b) | 15,621 | 506,589 | ||||||
Impax Laboratories, Inc. (b) | 6,736 | 316,659 | ||||||
Pernix Therapeutics Holdings, Inc. (b) | 31,063 | 197,871 | ||||||
Phibro Animal Health Corp., Class A | 15,790 | 546,808 | ||||||
Tetraphase Pharmaceuticals, Inc. (b) | 4,959 | 212,642 | ||||||
|
| |||||||
| 2,401,447 | ||||||||
|
| |||||||
| Professional Services—0.6% | ||||||||
ICF International, Inc. (b) | 7,595 | 271,749 | ||||||
|
| |||||||
| Real Estate Management & Development—0.7% | ||||||||
Kennedy-Wilson Holdings, Inc. | 12,437 | 318,014 | ||||||
|
| |||||||
| Road & Rail—0.7% | ||||||||
Ryder System, Inc. | 3,666 | 335,989 | ||||||
|
| |||||||
| Semiconductors & Semiconductor Equipment—8.4% | ||||||||
Cypress Semiconductor Corp. | 28,163 | 386,678 | ||||||
Inphi Corp. (b) | 15,286 | 365,947 | ||||||
Kulicke & Soffa Industries, Inc. (b) | 21,930 | 290,792 | ||||||
M/A-COM Technology Solutions Holdings, Inc. (b) | 10,805 | 412,319 | ||||||
Mellanox Technologies Ltd. (b) | 7,354 | 370,053 | ||||||
Qorvo, Inc. (b) | 5,867 | 481,974 | ||||||
SunEdison, Inc. (b) | 16,389 | 491,178 | ||||||
Synaptics, Inc. (b) | 4,044 | 402,944 | ||||||
Tower Semiconductor Ltd. (b) | 25,000 | 385,750 | ||||||
Xcerra Corp. (b) | 29,625 | 228,705 | ||||||
|
| |||||||
| 3,816,340 | ||||||||
|
| |||||||
| Software—8.2% | ||||||||
ACI Worldwide, Inc. (b) | 17,888 | 425,913 | ||||||
Cadence Design Systems, Inc. (b) | 19,268 | 381,314 | ||||||
Callidus Software, Inc. (b) | 20,427 | 292,515 | ||||||
Guidewire Software, Inc. (b) | 6,855 | 332,125 | ||||||
Mentor Graphics Corp. | 16,705 | 436,168 | ||||||
PTC, Inc. (b) | 9,020 | 372,255 | ||||||
Synchronoss Technologies, Inc. (b) | 6,412 | 282,385 | ||||||
Take-Two Interactive Software, Inc. (b) | 11,920 | 326,250 | ||||||
Ultimate Software Group, Inc. (b) | 2,405 | 389,105 | ||||||
Verint Systems, Inc. (b) | 7,502 | 485,154 | ||||||
|
| |||||||
| 3,723,184 | ||||||||
|
| |||||||
| Shares | Value | |||||||
| Specialty Retail—1.5% | ||||||||
American Eagle Outfitters, Inc. | 21,213 | $ | 347,257 | |||||
Select Comfort Corp. (b) | 10,664 | 332,183 | ||||||
|
| |||||||
| 679,440 | ||||||||
|
| |||||||
| Technology Hardware, Storage & Peripherals—1.6% | ||||||||
Electronics for Imaging, Inc. (b) | 7,611 | 329,024 | ||||||
Super Micro Computer, Inc. (b) | 12,539 | 419,555 | ||||||
|
| |||||||
| 748,579 | ||||||||
|
| |||||||
| Thrifts & Mortgage Finance—0.7% | ||||||||
LendingTree, Inc. (b) | 5,023 | 297,663 | ||||||
|
| |||||||
| Trading Companies & Distributors—2.1% | ||||||||
Air Lease Corp. | 11,540 | 434,250 | ||||||
Aircastle Ltd. | 20,520 | 497,815 | ||||||
|
| |||||||
| 932,065 | ||||||||
|
| |||||||
| Transportation Infrastructure—1.2% | ||||||||
Macquarie Infrastructure Corp. | 6,337 | 536,364 | ||||||
|
| |||||||
| Total Common Stock (cost—$34,147,212) | 44,129,583 | |||||||
|
| |||||||
| Principal Amount (000s) | ||||||||
| Repurchase Agreements—2.4% | ||||||||
State Street Bank and Trust Co., dated 5/29/15, 0.00%, due 6/1/15, proceeds $1,108,000; collateralized by U.S. Treasury Notes, 2.125%, due 9/30/21, valued at $1,134,975 including accrued interest |
| |||||||
(cost—$1,108,000) | $1,108 | 1,108,000 | ||||||
|
| |||||||
| Total Investments (cost—$35,255,212)—99.5% | 45,237,583 | |||||||
|
| |||||||
| Other assets less liabilities—0.5% | 207,976 | |||||||
|
| |||||||
| Net Assets—100.0% | $45,445,559 | |||||||
|
| |||||||
Notes to Schedule of Investments:
(a) Affiliated security.
(b) Non-income producing.
AllianzGI Ultra Micro Cap Fund
| Shares | Value | |||||||
| Common Stock—98.3% | ||||||||
| Aerospace & Defense—1.6% | ||||||||
Astronics Corp. (b) | 23,014 | $1,608,448 | ||||||
|
| |||||||
| Air Freight & Logistics—0.6% | ||||||||
Park-Ohio Holdings Corp. | 12,299 | 590,475 | ||||||
|
| |||||||
| Auto Components—1.8% | ||||||||
Motorcar Parts of America, Inc. (b) | 45,523 | 1,309,697 | ||||||
Strattec Security Corp. (a) | 7,386 | 509,708 | ||||||
|
| |||||||
| 1,819,405 | ||||||||
|
| |||||||
| Banks—1.6% | ||||||||
Park Sterling Corp. | 100,099 | 664,657 | ||||||
Southwest Bancorp, Inc. | 57,161 | 1,011,750 | ||||||
|
| |||||||
| 1,676,407 | ||||||||
|
| |||||||
| Biotechnology—6.8% | ||||||||
BioSpecifics Technologies Corp. (b) | 17,770 | 846,563 | ||||||
Catalyst Pharmaceuticals, Inc. (b) | 152,597 | 602,758 | ||||||
Eagle Pharmaceuticals, Inc. (b) | 30,818 | 2,238,311 | ||||||
Pfenex, Inc. (b) | 39,854 | 756,429 | ||||||
Repligen Corp. (b) | 50,372 | 2,053,163 | ||||||
Vitae Pharmaceuticals, Inc. (b) | 35,137 | 430,779 | ||||||
|
| |||||||
| 6,928,003 | ||||||||
|
| |||||||
| Building Products—1.9% | ||||||||
Patrick Industries, Inc. (b) | 32,859 | 1,964,968 | ||||||
|
| |||||||
| Chemicals—0.4% | ||||||||
American Vanguard Corp. | 33,102 | 456,146 | ||||||
|
| |||||||
| Communications Equipment—0.8% | ||||||||
ShoreTel, Inc. (b) | 116,454 | 801,203 | ||||||
|
| |||||||
| Construction & Engineering—0.9% | ||||||||
NV5 Holdings, Inc. (b) | 39,424 | 899,656 | ||||||
|
| |||||||
| Construction Materials—1.1% | ||||||||
U.S. Concrete, Inc. (b) | 29,772 | 1,125,084 | ||||||
|
| |||||||
| Diversified Consumer Services—1.6% | ||||||||
Carriage Services, Inc. | 63,745 | 1,585,976 | ||||||
|
| |||||||
| Diversified Telecommunication Services—2.3% | ||||||||
8x8, Inc. (b) | 99,753 | 831,940 | ||||||
inContact, Inc. (b) | 150,719 | 1,464,989 | ||||||
|
| |||||||
| 2,296,929 | ||||||||
|
| |||||||
| Electrical Equipment—0.6% | ||||||||
Magnetek, Inc. (b) | 19,864 | 655,313 | ||||||
|
| |||||||
| Electronic Equipment, Instruments & Components—0.9% | ||||||||
Planar Systems, Inc. (b) | 77,183 | 334,203 | ||||||
SuperCom Ltd. (b) | 55,404 | 598,917 | ||||||
|
| |||||||
| 933,120 | ||||||||
|
| |||||||
| Energy Equipment & Services—0.4% | ||||||||
Independence Contract Drilling, Inc. (b) | 51,444 | 377,599 | ||||||
|
| |||||||
| Food Products—1.5% | ||||||||
John B Sanfilippo & Son, Inc. | 30,708 | 1,554,132 | ||||||
|
| |||||||
| Health Care Equipment & Supplies—9.4% | ||||||||
AtriCure, Inc. (b) | 44,735 | 1,026,221 | ||||||
Cardiovascular Systems, Inc. (b) | 42,590 | 1,191,668 | ||||||
Cynosure, Inc., Class A (b) | 30,975 | 1,105,807 | ||||||
Inogen, Inc. (b) | 36,683 | 1,371,211 | ||||||
Rockwell Medical, Inc. (b) | 70,270 | 777,889 | ||||||
RTI Surgical, Inc. (b) | 147,242 | 952,656 | ||||||
SurModics, Inc. (b) | 34,133 | 842,402 | ||||||
| See accompanying Notes to Financial Statements | | May 31, 2015 | | Semiannual Report | 165 |
Table of Contents
Schedule of Investments
May 31, 2015 (Unaudited)
Shares | Value | |||||||
Trinity Biotech PLC ADR | 54,115 | $ | 936,190 | |||||
Vascular Solutions, Inc. (b) | 43,964 | 1,434,545 | ||||||
|
| |||||||
| 9,638,589 | ||||||||
|
| |||||||
| Health Care Providers & Services—5.5% | ||||||||
Aceto Corp. | 47,641 | 1,122,898 | ||||||
BioTelemetry, Inc. (b) | 86,353 | 833,307 | ||||||
Capital Senior Living Corp. (b) | 36,611 | 943,099 | ||||||
Cross Country Healthcare, Inc. (b) | 90,915 | 965,517 | ||||||
Providence Service Corp. (b) | 24,063 | 1,156,468 | ||||||
RadNet, Inc. (b) | 95,848 | 623,971 | ||||||
|
| |||||||
| 5,645,260 | ||||||||
|
| �� | ||||||
| Health Care Technology—0.2% | ||||||||
Icad, Inc. (b) | 44,866 | 197,859 | ||||||
|
| |||||||
| Hotels, Restaurants & Leisure—4.3% | ||||||||
Carrols Restaurant Group, Inc. (b) | 91,574 | 917,572 | ||||||
Good Times Restaurants, Inc. (b) | 97,355 | 893,719 | ||||||
Kona Grill, Inc. (b) | 36,726 | 746,272 | ||||||
Papa Murphy’s Holdings, Inc. (b) | 61,596 | 1,058,219 | ||||||
Rave Restaurant Group, Inc. (b) | 59,404 | 774,034 | ||||||
|
| |||||||
| 4,389,816 | ||||||||
|
| |||||||
| Household Durables—2.3% | ||||||||
Century Communities, Inc. (b) | 40,226 | 830,667 | ||||||
LGI Homes, Inc. (b) | 49,614 | 935,224 | ||||||
Skullcandy, Inc. (b) | 81,221 | 609,157 | ||||||
|
| |||||||
| 2,375,048 | ||||||||
|
| |||||||
| Insurance—3.2% | ||||||||
Atlas Financial Holdings, Inc. (b) | 56,452 | 1,061,862 | ||||||
Federated National Holding Co. | 53,671 | 1,378,272 | ||||||
HCI Group, Inc. (a) | 18,601 | 804,121 | ||||||
|
| |||||||
| 3,244,255 | ||||||||
|
| |||||||
| Internet Software & Services—5.6% | ||||||||
Autobytel, Inc. (b) | 80,424 | 1,347,906 | ||||||
GTT Communications, Inc. (b) | 74,387 | 1,638,746 | ||||||
Internap Corp. (b) | 98,942 | 963,695 | ||||||
Limelight Networks, Inc. (b) | 51,326 | 224,295 | ||||||
Reis, Inc. | 26,216 | 569,411 | ||||||
TechTarget, Inc. (b) | 106,721 | 987,169 | ||||||
|
| |||||||
| 5,731,222 | ||||||||
|
| |||||||
| IT Services—1.9% | ||||||||
Hackett Group, Inc. | 96,885 | 1,146,150 | ||||||
Information Services Group, Inc. | 204,776 | 782,244 | ||||||
|
| |||||||
| 1,928,394 | ||||||||
|
| |||||||
| Leisure Equipment & Products—2.2% | ||||||||
Nautilus, Inc. (b) | 92,487 | 1,953,326 | ||||||
Summer Infant, Inc. (b) | 100,615 | 250,531 | ||||||
|
| |||||||
| 2,203,857 | ||||||||
|
| |||||||
| Life Sciences Tools & Services—2.6% | ||||||||
Albany Molecular Research, Inc. (b) | 84,194 | 1,696,509 | ||||||
NeoGenomics, Inc. (b) | 172,580 | 919,851 | ||||||
|
| |||||||
| 2,616,360 | ||||||||
|
| |||||||
| Machinery—2.8% | ||||||||
Accuride Corp. (b) | 176,441 | 763,990 | ||||||
NN, Inc. | 34,413 | 937,754 | ||||||
Xerium Technologies, Inc. (b) | 67,705 | 1,157,755 | ||||||
|
| |||||||
| 2,859,499 | ||||||||
|
| |||||||
| Media—2.3% | ||||||||
Carmike Cinemas, Inc. (b) | 40,576 | 1,129,230 | ||||||
Entravision Communications Corp., Class A | 185,586 | 1,252,706 | ||||||
|
| |||||||
| 2,381,936 | ||||||||
|
| |||||||
Shares | Value | |||||||
| Metals & Mining—1.7% | ||||||||
Olympic Steel, Inc. | 54,373 | $ | 953,702 | |||||
Real Industry, Inc. (b) | 66,933 | 740,279 | ||||||
|
| |||||||
| 1,693,981 | ||||||||
|
| |||||||
| Oil, Gas & Consumable Fuels—1.9% | ||||||||
Abraxas Petroleum Corp. (b) | 227,655 | 667,029 | ||||||
Gastar Exploration, Inc. (b) | 173,671 | 529,697 | ||||||
Ring Energy, Inc. (b) | 63,557 | 730,270 | ||||||
|
| |||||||
| 1,926,996 | ||||||||
|
| |||||||
| Pharmaceuticals—4.7% | ||||||||
ANI Pharmaceuticals, Inc. (b) | 11,492 | 578,967 | ||||||
Cempra, Inc. (b) | 29,788 | 1,093,517 | ||||||
IGI Laboratories, Inc. (b) | 135,025 | 877,663 | ||||||
Intersect ENT, Inc. (b) | 34,751 | 824,989 | ||||||
Pernix Therapeutics Holdings, Inc. (b) | 116,325 | 740,990 | ||||||
Supernus Pharmaceuticals, Inc. (b) | 48,861 | 694,803 | ||||||
|
| |||||||
| 4,810,929 | ||||||||
|
| |||||||
| Professional Services—1.8% | ||||||||
Barrett Business Services, Inc. | 2,541 | 91,501 | ||||||
GP Strategies Corp. (b) | 34,619 | 1,080,459 | ||||||
Willdan Group, Inc. (b) | 48,116 | 690,946 | ||||||
|
| |||||||
| 1,862,906 | ||||||||
|
| |||||||
| Road & Rail—3.2% | ||||||||
Celadon Group, Inc. | 30,529 | 711,936 | ||||||
Covenant Transportation Group, Inc., Class A (b) | 43,400 | 1,341,494 | ||||||
PAM Transportation Services, Inc. (b) | 20,315 | 1,230,480 | ||||||
|
| |||||||
| 3,283,910 | ||||||||
|
| |||||||
| Semiconductors & Semiconductor Equipment—6.2% | ||||||||
Amtech Systems, Inc. (b) | 85,202 | 953,410 | ||||||
Cascade Microtech, Inc. (b) | 57,772 | 924,930 | ||||||
FormFactor, Inc. (b) | 121,936 | 1,135,224 | ||||||
MaxLinear, Inc., Class A (b) | 110,392 | 1,106,128 | ||||||
PDF Solutions, Inc. (b) | 48,856 | 778,276 | ||||||
Tower Semiconductor Ltd. (b) | 95,520 | 1,473,874 | ||||||
|
| |||||||
| 6,371,842 | ||||||||
|
| |||||||
| Software—4.8% | ||||||||
Attunity Ltd. (b) | 78,892 | 1,090,287 | ||||||
ePlus, Inc. (b) | 15,977 | 1,240,614 | ||||||
Park City Group, Inc. (b) | 85,116 | 981,388 | ||||||
QAD, Inc., Class A | 26,907 | 643,077 | ||||||
Telenav, Inc. (b) | 109,694 | 990,537 | ||||||
|
| |||||||
| 4,945,903 | ||||||||
|
| |||||||
| Specialty Retail—3.0% | ||||||||
bebe stores, Inc. | 216,710 | 563,446 | ||||||
Kirkland’s, Inc. (b) | 41,700 | 1,095,459 | ||||||
Sportsman’s Warehouse Holdings, Inc. (b) | 77,133 | 747,419 | ||||||
Tilly’s, Inc., Class A (b) | 64,250 | 619,370 | ||||||
|
| |||||||
| 3,025,694 | ||||||||
|
| |||||||
| Technology Hardware, Storage & Peripherals—1.1% | ||||||||
Quantum Corp. (b) | 554,778 | 1,131,747 | ||||||
|
| |||||||
| Textiles, Apparel & Luxury Goods—0.9% | ||||||||
Cherokee, Inc. | 37,688 | 900,743 | ||||||
|
| |||||||
| Thrifts & Mortgage Finance—1.9% | ||||||||
LendingTree, Inc. (b) | 33,361 | 1,976,973 | ||||||
|
| |||||||
| Total Common Stock (cost—$69,511,430) | 100,416,583 | |||||||
|
| |||||||
| Principal Amount (000s) | Value | |||||||
| Repurchase Agreements—1.2% | ||||||||
State Street Bank and Trust Co., dated 5/29/15, 0.00%, due 6/1/15, proceeds $1,248,000; collateralized by U.S. Treasury Notes, 2.125%, due 9/30/21, valued at $1,273,013 including accrued interest |
| |||||||
(cost—$1,248,000) | $1,248 | $ | 1,248,000 | |||||
|
| |||||||
| Total Investments (cost—$70,759,430)—99.5% | 101,664,583 | |||||||
|
| |||||||
Other assets less liabilities—0.5% | 529,673 | |||||||
|
| |||||||
| Net Assets—100.0% | $102,194,256 | |||||||
|
| |||||||
Notes to Schedule of Investments:
(a) Affiliated security.
(b) Non-income producing.
Glossary:
ADR—American Depositary Receipt
| 166 | Semiannual Report | | May 31, 2015 | | See accompanying Notes to Financial Statements |
Table of Contents
(THIS PAGE INTENTIONALLY LEFT BLANK)
| See accompanying Notes to Financial Statements | | May 31, 2015 | | Semiannual Report | 167 |
Table of Contents
Statements of Assets and Liabilities
May 31, 2015 (Unaudited)
| AllianzGI Retirement 2015 | AllianzGI Retirement 2020 | AllianzGI Retirement 2025 | AllianzGI Retirement 2030 | AllianzGI Retirement 2035 | ||||||||||||||||||
| Assets: | ||||||||||||||||||||||
| Investments, at value | $ | 1,700,460 | $ | 3,798,286 | $ | 3,832,587 | $ | 4,368,260 | $ | 3,914,584 | ||||||||||||
| Investments in Affiliates, at value | 26,605,291 | 59,747,613 | 64,356,775 | 62,193,107 | 50,686,349 | |||||||||||||||||
| Repurchase agreements, at value | 165,000 | 379,000 | 805,000 | 803,000 | 592,000 | |||||||||||||||||
| Cash | 86 | 519 | 891 | 332 | 902 | |||||||||||||||||
| Dividends receivable from Affiliates | 31,803 | 64,911 | 65,457 | 51,865 | 36,407 | |||||||||||||||||
| Receivable for Fund shares sold | 12,462 | 18,211 | 12,583 | 35,749 | 19,092 | |||||||||||||||||
| Investments in Affiliated Funds — Trustee Deferred Compensation Plan (see Note 5) | 163 | 283 | 302 | 296 | 239 | |||||||||||||||||
| Receivable for variation margin on futures contracts | — | — | — | — | — | |||||||||||||||||
| Dividends and interest receivable (net of foreign withholding taxes) | — | — | — | — | — | |||||||||||||||||
| Unrealized appreciation of forward foreign currency contracts | — | — | — | — | — | |||||||||||||||||
| Receivable from Investment Manager | — | — | — | — | — | |||||||||||||||||
| Deposits with brokers for derivatives collateral | — | — | — | — | — | |||||||||||||||||
| Prepaid expenses and other assets | — | — | — | — | — | |||||||||||||||||
Total Assets | 28,515,265 | 64,008,823 | 69,073,595 | 67,452,609 | 55,249,573 | |||||||||||||||||
| Liabilities: | ||||||||||||||||||||||
| Payable for investments in Affiliates purchased | 31,803 | 64,911 | 65,457 | 51,865 | 36,407 | |||||||||||||||||
| Payable for Fund shares redeemed | 64,560 | 1,926 | 165,038 | 15,690 | 325,539 | |||||||||||||||||
| Payable for variation margin on futures contracts | — | — | — | — | — | |||||||||||||||||
| Administration fees payable | 4,528 | 10,997 | 10,392 | 8,535 | 6,401 | |||||||||||||||||
| Servicing fees payable | 2,622 | 7,459 | 6,921 | 5,705 | 4,640 | |||||||||||||||||
| Distribution fees payable | 933 | 1,145 | 693 | 1,429 | 754 | |||||||||||||||||
| Trustees Deferred Compensation Plan payable (see Note 5) | 163 | 283 | 302 | 296 | 239 | |||||||||||||||||
| Unrealized depreciation of forward foreign currency contracts | — | — | — | — | — | |||||||||||||||||
| Investment management fees payable | — | — | — | — | — | |||||||||||||||||
| Accrued expenses and other liabilities | — | — | — | — | — | |||||||||||||||||
Total Liabilities | 104,609 | 86,721 | 248,803 | 83,520 | 373,980 | |||||||||||||||||
| Net Assets | $ | 28,410,656 | $ | 63,922,102 | $ | 68,824,792 | $ | 67,369,089 | $ | 54,875,593 | ||||||||||||
| Net Assets Consist of: | ||||||||||||||||||||||
| Paid-in-capital | $ | 27,626,368 | $ | 63,331,483 | $ | 67,979,623 | $ | 65,618,023 | $ | 53,309,974 | ||||||||||||
| Undistributed (dividends in excess of) net investment income | 281,961 | 360,365 | 409,870 | 324,978 | 152,555 | |||||||||||||||||
| Accumulated net realized gain (loss) | 97,009 | (381,214 | ) | (207,039 | ) | 175,313 | 443,002 | |||||||||||||||
| Net unrealized appreciation | 405,318 | 611,468 | 642,338 | 1,250,775 | 970,062 | |||||||||||||||||
| Net Assets | $ | 28,410,656 | $ | 63,922,102 | $ | 68,824,792 | $ | 67,369,089 | $ | 54,875,593 | ||||||||||||
| Cost of Investments | $ | 1,692,676 | $ | 3,971,240 | $ | 4,021,342 | $ | 4,527,002 | $ | 4,100,170 | ||||||||||||
| Cost of Investments in Affiliates | $ | 26,207,757 | $ | 58,963,191 | $ | 63,525,682 | $ | 60,783,590 | $ | 49,530,701 | ||||||||||||
| Cost of Repurchase Agreements | $ | 165,000 | $ | 379,000 | $ | 805,000 | $ | 803,000 | $ | 592,000 | ||||||||||||
| 168 | Semiannual Report | | May 31, 2015 | | See accompanying Notes to Financial Statements |
Table of Contents
| AllianzGI Retirement 2040 | AllianzGI Retirement 2045 | AllianzGI Retirement 2050 | AllianzGI Retirement 2055 | AllianzGI Retirement Income | AllianzGI Global Allocation | AllianzGI Global Dynamic Allocation | ||||||||||||||||||||||
| $ | 3,202,871 | $ | 1,823,351 | $ | 1,549,084 | $ | 633,751 | $ | 1,468,712 | $ | 13,858,642 | $ | 1,216,701 | |||||||||||||||
| 40,112,757 | 22,255,752 | 18,970,294 | 7,738,639 | 23,301,370 | 176,517,556 | 5,476,543 | ||||||||||||||||||||||
| 463,000 | 270,000 | 269,000 | 102,000 | 213,000 | 10,601,000 | 1,071,000 | ||||||||||||||||||||||
| 532 | 741 | 127 | 498 | 53 | 526 | 104 | ||||||||||||||||||||||
| 23,427 | 10,422 | 6,103 | 1,739 | 29,384 | 104,785 | 5,630 | ||||||||||||||||||||||
| 117,296 | 11,002 | 14,199 | 10,718 | 88,660 | 25,366 | 947 | ||||||||||||||||||||||
| 191 | 119 | 98 | 35 | 120 | 900 | 34 | ||||||||||||||||||||||
| — | — | — | — | — | 550,879 | 39,758 | ||||||||||||||||||||||
| — | — | — | — | — | — | 2,934 | ||||||||||||||||||||||
| — | — | — | — | — | 87,200 | — | ||||||||||||||||||||||
| — | — | — | — | — | — | 26,840 | ||||||||||||||||||||||
| — | — | — | — | — | 3,591,850 | 203,618 | ||||||||||||||||||||||
| — | — | — | — | — | 49,200 | 59,202 | ||||||||||||||||||||||
| 43,920,074 | 24,371,387 | 20,808,905 | 8,487,380 | 25,101,299 | 205,387,904 | 8,103,311 | ||||||||||||||||||||||
| 23,427 | 10,422 | 6,103 | 1,739 | 29,384 | 74,879 | 5,630 | ||||||||||||||||||||||
| 10,572 | 30,616 | 113 | 2,462 | 3,710 | 2,431,261 | 88,725 | ||||||||||||||||||||||
| — | — | — | — | — | 197,938 | 3,183 | ||||||||||||||||||||||
| 4,241 | 2,268 | 712 | 149 | 3,170 | — | — | ||||||||||||||||||||||
| 3,775 | 2,437 | 1,327 | 333 | 2,390 | 26,060 | 571 | ||||||||||||||||||||||
| 761 | 284 | 605 | 183 | 2,586 | 38,396 | 1,141 | ||||||||||||||||||||||
| 191 | 119 | 98 | 35 | 120 | 900 | 34 | ||||||||||||||||||||||
| — | — | — | — | — | 38,103 | 1,721 | ||||||||||||||||||||||
| — | — | — | — | — | 19,091 | — | ||||||||||||||||||||||
| — | — | — | — | — | 91,129 | 39,114 | ||||||||||||||||||||||
| 42,967 | 46,146 | 8,958 | 4,901 | 41,360 | 2,917,757 | 140,119 | ||||||||||||||||||||||
| $ | 43,877,107 | $ | 24,325,241 | $ | 20,799,947 | $ | 8,482,479 | $ | 25,059,939 | $ | 202,470,147 | $ | 7,963,192 | |||||||||||||||
| $ | 41,925,656 | $ | 22,987,374 | $ | 19,246,421 | $ | 7,898,226 | $ | 24,225,232 | $ | 181,006,525 | $ | 7,269,386 | |||||||||||||||
| (68,088 | ) | (65,598 | ) | (80,847 | ) | (43,389 | ) | 27,443 | (1,185,498 | ) | (19,730 | ) | ||||||||||||||||
| 806,649 | 605,942 | 728,578 | 320,092 | 410,547 | 12,721,666 | 412,706 | ||||||||||||||||||||||
| 1,212,890 | 797,523 | 905,795 | 307,550 | 396,717 | 9,927,454 | 300,830 | ||||||||||||||||||||||
| $ | 43,877,107 | $ | 24,325,241 | $ | 20,799,947 | $ | 8,482,479 | $ | 25,059,939 | $ | 202,470,147 | $ | 7,963,192 | |||||||||||||||
| $ | 3,363,588 | $ | 1,909,041 | $ | 1,614,113 | $ | 662,702 | $ | 1,462,369 | $ | 14,373,179 | $ | 1,195,921 | |||||||||||||||
| $ | 38,739,150 | $ | 21,372,539 | $ | 17,999,470 | $ | 7,402,138 | $ | 22,910,996 | $ | 166,439,693 | $ | 5,228,763 | |||||||||||||||
| $ | 463,000 | $ | 270,000 | $ | 269,000 | $ | 102,000 | $ | 213,000 | $ | 10,601,000 | $ | 1,071,000 | |||||||||||||||
| See accompanying Notes to Financial Statements | | May 31, 2015 | | Semiannual Report | 169 |
Table of Contents
Statements of Assets and Liabilities (cont’d)
May 31, 2015 (Unaudited)
| AllianzGI Retirement 2015 | AllianzGI Retirement 2020 | AllianzGI Retirement 2025 | AllianzGI Retirement 2030 | AllianzGI Retirement 2035 | ||||||||||||||||||
| Net Assets: | ||||||||||||||||||||||
| Class A | $ | 11,088,889 | $ | 33,002,096 | $ | 31,483,249 | $ | 24,042,292 | $ | 20,244,663 | ||||||||||||
| Class B | — | — | — | — | — | |||||||||||||||||
| Class C | 898,942 | 384,776 | — | 682,937 | — | |||||||||||||||||
| Class D | 62,795 | 289,687 | — | 602,419 | — | |||||||||||||||||
| Class R | 246,278 | 1,096,168 | 1,112,283 | 1,551,265 | 1,630,650 | |||||||||||||||||
| Class P | 10,286,240 | 21,949,502 | 29,422,270 | 29,315,224 | 28,532,231 | |||||||||||||||||
| Institutional Class | — | — | — | — | — | |||||||||||||||||
| Class R6 | 5,473,405 | 5,244,732 | 5,621,471 | 9,419,308 | 3,561,451 | |||||||||||||||||
| Administrative Class | 354,107 | 1,955,141 | 1,185,519 | 1,755,644 | 906,598 | |||||||||||||||||
| Shares Issued and Outstanding: | ||||||||||||||||||||||
| Class A | 575,734 | 1,724,511 | 1,866,543 | 1,188,432 | 1,133,117 | |||||||||||||||||
| Class B | — | — | — | — | — | |||||||||||||||||
| Class C | 46,988 | 20,138 | — | 33,926 | — | |||||||||||||||||
| Class D | 3,223 | 15,034 | — | 29,577 | — | |||||||||||||||||
| Class R | 12,682 | 57,193 | 66,097 | 76,414 | 91,358 | |||||||||||||||||
| Class P | 528,394 | 1,132,627 | 1,732,493 | 1,427,828 | 1,584,429 | |||||||||||||||||
| Institutional Class | — | — | — | — | — | |||||||||||||||||
| Class R6 | 280,848 | 270,239 | 330,698 | 457,770 | 197,449 | |||||||||||||||||
| Administrative Class | 18,236 | 101,489 | 69,998 | 85,809 | 50,514 | |||||||||||||||||
| Net Asset Value and Redemption Price Per Share:* | ||||||||||||||||||||||
| Class A | $ | 19.26 | $ | 19.14 | $ | 16.87 | $ | 20.23 | $ | 17.87 | ||||||||||||
| Class B | — | — | — | — | — | |||||||||||||||||
| Class C | 19.13 | 19.11 | — | 20.13 | — | |||||||||||||||||
| Class D | 19.48 | 19.27 | — | 20.37 | — | |||||||||||||||||
| Class R | 19.42 | 19.17 | 16.83 | 20.30 | 17.85 | |||||||||||||||||
| Class P | 19.47 | 19.38 | 16.98 | 20.53 | 18.01 | |||||||||||||||||
| Institutional Class | — | — | — | — | — | |||||||||||||||||
| Class R6 | 19.49 | 19.41 | 17.00 | 20.58 | 18.04 | |||||||||||||||||
| Administrative Class | 19.42 | 19.26 | 16.94 | 20.46 | 17.95 | |||||||||||||||||
| * | Net asset value and redemption price per share may not recalculate exactly due to rounding. |
| 170 | Semiannual Report | | May 31, 2015 | | See accompanying Notes to Financial Statements |
Table of Contents
| AllianzGI Retirement 2040 | AllianzGI Retirement 2045 | AllianzGI Retirement 2050 | AllianzGI Retirement 2055 | AllianzGI Retirement Income | AllianzGI Global Allocation | AllianzGI Global Dynamic Allocation | ||||||||||||||||||||||
| $ | 16,003,213 | $ | 10,929,641 | $ | 5,183,869 | $ | 1,372,979 | $ | 6,388,424 | $ | 59,623,280 | $ | 1,107,696 | |||||||||||||||
| — | — | — | — | — | 968,779 | — | ||||||||||||||||||||||
| 204,709 | — | 154,694 | — | 3,689,471 | 58,541,628 | 1,317,886 | ||||||||||||||||||||||
| 290,390 | — | 236,670 | — | 974,871 | 2,379,303 | 96,073 | ||||||||||||||||||||||
| 1,248,265 | 509,204 | 664,822 | 202,780 | 227,976 | 17,831 | 159,742 | ||||||||||||||||||||||
| 16,920,355 | 11,043,074 | 8,006,772 | 1,600,124 | 6,684,837 | 2,245,143 | 48,910 | ||||||||||||||||||||||
| — | — | — | — | — | 78,668,943 | 5,205,602 | ||||||||||||||||||||||
| 8,753,246 | 1,524,685 | 6,055,621 | 5,138,553 | 7,049,205 | — | — | ||||||||||||||||||||||
| 456,929 | 318,637 | 497,499 | 168,043 | 45,155 | 25,240 | 27,283 | ||||||||||||||||||||||
| 770,016 | 594,049 | 250,261 | 77,212 | 344,992 | 4,990,978 | 57,325 | ||||||||||||||||||||||
| — | — | — | — | — | 79,340 | — | ||||||||||||||||||||||
| 9,879 | — | 7,527 | — | 201,538 | 4,839,903 | 69,404 | ||||||||||||||||||||||
| 13,936 | — | 11,364 | — | 52,362 | 200,110 | 4,998 | ||||||||||||||||||||||
| 60,233 | 27,748 | 32,115 | 11,430 | 11,923 | 1,500 | 8,326 | ||||||||||||||||||||||
| 805,664 | 596,101 | 381,858 | 89,261 | 355,970 | 187,933 | 2,535 | ||||||||||||||||||||||
| — | — | — | — | — | 6,653,537 | 269,164 | ||||||||||||||||||||||
| 416,052 | 82,114 | 288,012 | 285,881 | 383,222 | — | — | ||||||||||||||||||||||
| 21,881 | 17,269 | 23,826 | 9,417 | 2,408 | 2,061 | 1,417 | ||||||||||||||||||||||
| $ | 20.78 | $ | 18.40 | $ | 20.71 | $ | 17.78 | $ | 18.52 | $ | 11.95 | $ | 19.32 | |||||||||||||||
| — | — | — | — | — | 12.21 | — | ||||||||||||||||||||||
| 20.72 | — | 20.55 | — | 18.31 | 12.10 | 18.99 | ||||||||||||||||||||||
| 20.84 | — | 20.83 | — | 18.62 | 11.89 | 19.23 | ||||||||||||||||||||||
| 20.72 | 18.35 | 20.70 | 17.74 | 19.12 | 11.89 | 19.19 | ||||||||||||||||||||||
| 21.00 | 18.53 | 20.97 | 17.93 | 18.78 | 11.95 | 19.29 | ||||||||||||||||||||||
| — | — | — | — | — | 11.82 | 19.34 | ||||||||||||||||||||||
| 21.04 | 18.57 | 21.03 | 17.97 | 18.39 | — | — | ||||||||||||||||||||||
| 20.88 | 18.45 | 20.88 | 17.84 | 18.75 | 12.24 | 19.26 | ||||||||||||||||||||||
| See accompanying Notes to Financial Statements | | May 31, 2015 | | Semiannual Report | 171 |
Table of Contents
Statements of Assets and Liabilities (cont’d)
May 31, 2015 (Unaudited)
| AllianzGI Global Megatrends | AllianzGI Behavioral Advantage Large Cap | AllianzGI Best Styles Emerging Markets Equity | AllianzGI Best Styles Global Equity | AllianzGI Best Styles International Equity | ||||||||||||||||||
| Assets: | ||||||||||||||||||||||
| Investments, at value | $ | — | $ | 43,969,575 | $ | 5,373,817 | $ | 109,538,160 | $ | 32,842,125 | ||||||||||||
| Investments in Affiliates, at value | 3,213,015 | — | 12,330 | 458,021 | 186,269 | |||||||||||||||||
| Repurchase agreements, at value | — | 280,000 | 283,000 | 4,517,000 | 557,000 | |||||||||||||||||
| Cash | 26,364 | 157 | 698 | 984 | 584 | |||||||||||||||||
| Foreign currency, at value | — | — | 26,748 | 182,376 | 23,407 | |||||||||||||||||
| Unrealized appreciation of forward foreign currency contracts | — | — | — | — | — | |||||||||||||||||
| Dividends and interest receivable (net of foreign withholding taxes) | — | 98,434 | 14,998 | 341,595 | 180,707 | |||||||||||||||||
| Receivable for investments sold | — | — | — | — | — | |||||||||||||||||
| Swap premiums paid | — | — | — | — | — | |||||||||||||||||
| Unrealized appreciation of OTC swaps | — | — | — | — | — | |||||||||||||||||
| Deposits with brokers for derivatives collateral | — | — | 152,210 | 1,009,268 | — | |||||||||||||||||
| Receivable for Fund shares sold | — | 27,411 | — | 28,570 | — | |||||||||||||||||
| Receivable from Investment Manager | 9,966 | 219 | 15,256 | 2,821 | 14,996 | |||||||||||||||||
| Deferred offering costs | 55,239 | — | 39,626 | — | 39,046 | |||||||||||||||||
| Tax reclaims receivable | — | — | — | 27,119 | 29,415 | |||||||||||||||||
| Dividends receivable from Affiliates | — | 120 | — | 634 | 323 | |||||||||||||||||
| Investments in Affiliated Funds — Trustee Deferred Compensation Plan (see Note 5) | 14 | 277 | 24 | 489 | 148 | |||||||||||||||||
| Receivable for variation margin on futures contracts | — | — | — | 26,215 | — | |||||||||||||||||
| Prepaid expenses and other assets | 3,303 | 22,296 | 4,225 | 25,865 | 4,225 | |||||||||||||||||
Total Assets | 3,307,901 | 44,398,489 | 5,922,932 | 116,159,117 | 33,878,245 | |||||||||||||||||
| Liabilities: | ||||||||||||||||||||||
| Payable for investments purchased | — | — | — | — | — | |||||||||||||||||
| Payable for investments in Affiliates purchased | — | — | — | — | — | |||||||||||||||||
| Payable for Fund shares redeemed | — | 50,337 | — | 13,356 | 2,106 | |||||||||||||||||
| Payable to custodian for cash overdraft | — | — | — | — | — | |||||||||||||||||
| Payable for variation margin on futures contracts | — | — | — | 3,129 | — | |||||||||||||||||
| Investment management fees payable | — | — | — | — | — | |||||||||||||||||
| Distribution fees payable | — | 611 | — | — | — | |||||||||||||||||
| Servicing fees payable | 2 | 3,137 | — | 37 | — | |||||||||||||||||
| Swap premiums received | — | — | — | — | — | |||||||||||||||||
| Unrealized depreciation of forward foreign currency contracts | — | — | — | — | — | |||||||||||||||||
| Unrealized depreciation of OTC swaps | — | — | — | — | — | |||||||||||||||||
| Due to Investment Manager | 55,239 | — | 39,626 | — | 39,046 | |||||||||||||||||
| Trustees Deferred Compensation Plan payable (see Note 5) | 14 | 277 | 24 | 489 | 148 | |||||||||||||||||
| Accrued expenses and other liabilities | 18,515 | 28,595 | 33,075 | 52,289 | 4,575 | |||||||||||||||||
Total Liabilities | 73,770 | 82,957 | 72,725 | 69,300 | 45,875 | |||||||||||||||||
| Net Assets | $ | 3,234,131 | $ | 44,315,532 | $ | 5,850,207 | $ | 116,089,817 | $ | 33,832,370 | ||||||||||||
| 172 | Semiannual Report | | May 31, 2015 | | See accompanying Notes to Financial Statements |
Table of Contents
| AllianzGI Best Styles U.S. Equity | AllianzGI China Equity | AllianzGI Convertible | AllianzGI Emerging Markets Consumer | AllianzGI Emerging Markets Debt | AllianzGI Emerging Markets Small-Cap | AllianzGI Europe Equity Dividend | ||||||||||||||||||||||
| $ | 56,364,636 | $ | 11,291,398 | $ | 2,441,254,675 | $ | 12,663,879 | $ | 29,632,272 | $ | 5,116,533 | $ | 2,363,305 | |||||||||||||||
| 102,042 | 973,317 | — | — | — | — | 805,805 | ||||||||||||||||||||||
| 3,653,000 | 920,000 | 83,492,000 | 183,000 | 599,000 | — | 219,000 | ||||||||||||||||||||||
| 537 | 426 | 537 | 391 | — | 66,617 | 8 | ||||||||||||||||||||||
| 783 | 7,202 | — | 23,607 | 16,704 | 29,545 | 4,407 | ||||||||||||||||||||||
| — | — | — | — | 6,223 | — | 639 | ||||||||||||||||||||||
| �� | ||||||||||||||||||||||||||||
| 114,731 | 37,744 | 9,249,088 | 17,065 | 436,336 | 10,952 | 8,647 | ||||||||||||||||||||||
| — | — | 24,828,022 | 188,362 | 2,569,427 | — | 896 | ||||||||||||||||||||||
| — | — | — | — | 101,797 | — | — | ||||||||||||||||||||||
| — | — | — | — | 103,531 | — | — | ||||||||||||||||||||||
| 363,671 | — | — | — | 520,000 | — | — | ||||||||||||||||||||||
| — | 360,850 | 2,526,789 | 1,000 | — | 16,840 | — | ||||||||||||||||||||||
| — | 11,925 | — | 491 | — | 11,087 | 13,157 | ||||||||||||||||||||||
| 39,414 | — | — | 29,204 | 51,860 | 29,555 | 62,218 | ||||||||||||||||||||||
| — | — | — | 917 | — | — | 1,551 | ||||||||||||||||||||||
| 356 | — | — | — | — | — | — | ||||||||||||||||||||||
| 317 | 22 | 11,038 | 58 | 129 | 19 | 13 | ||||||||||||||||||||||
| 10,228 | — | — | — | — | — | — | ||||||||||||||||||||||
| 4,225 | 69,571 | 85,118 | 3,455 | 12,786 | 41,444 | 4,071 | ||||||||||||||||||||||
| 60,653,940 | 13,672,455 | 2,561,447,267 | 13,111,429 | 34,050,065 | 5,322,592 | 3,483,717 | ||||||||||||||||||||||
| — | 299,839 | 46,269,611 | 80,334 | 2,657,336 | — | 3,038 | ||||||||||||||||||||||
| — | — | — | — | — | — | 640 | ||||||||||||||||||||||
| 15,566 | 22,055 | 1,952,662 | 6,172 | 199 | 32,137 | — | ||||||||||||||||||||||
| — | — | — | — | 149,652 | — | — | ||||||||||||||||||||||
| — | — | — | — | — | — | — | ||||||||||||||||||||||
| 3,996 | — | 1,199,432 | — | 6,983 | — | — | ||||||||||||||||||||||
| — | 31 | 77,444 | — | 6 | — | 82 | ||||||||||||||||||||||
| — | 1,256 | 144,790 | 5 | 4 | 4 | 30 | ||||||||||||||||||||||
| — | — | — | — | 603,083 | — | — | ||||||||||||||||||||||
| — | — | — | — | 12,904 | — | 92,439 | ||||||||||||||||||||||
| — | — | — | — | 2,858 | — | — | ||||||||||||||||||||||
| 39,414 | — | — | 29,204 | 51,860 | 29,555 | 62,218 | ||||||||||||||||||||||
| 317 | 22 | 11,038 | 58 | 129 | 19 | 13 | ||||||||||||||||||||||
| 31,947 | 45,379 | 789,815 | 5,017 | 47,959 | 22,477 | 25,906 | ||||||||||||||||||||||
| 91,240 | 368,582 | 50,444,792 | 120,790 | 3,532,973 | 84,192 | 184,366 | ||||||||||||||||||||||
| $ | 60,562,700 | $ | 13,303,873 | $ | 2,511,002,475 | $ | 12,990,639 | $ | 30,517,092 | $ | 5,238,400 | $ | 3,299,351 | |||||||||||||||
| See accompanying Notes to Financial Statements | | May 31, 2015 | | Semiannual Report | 173 |
Table of Contents
Statements of Assets and Liabilities (cont’d)
May 31, 2015 (Unaudited)
| AllianzGI Global Megatrends | AllianzGI Behavioral Advantage Large Cap | AllianzGI Best Styles Emerging Markets Equity | AllianzGI Best Styles Global Equity | AllianzGI Best Styles International Equity | ||||||||||||||||||
| Net Assets Consist of: | ||||||||||||||||||||||
| Paid-in-capital | $ | 3,020,000 | $ | 40,114,638 | $ | 5,587,414 | $ | 108,081,589 | $ | 31,491,032 | ||||||||||||
| Undistributed (dividends in excess of) net investment income | 1,116 | 42,798 | 44,950 | 1,102,475 | 614,811 | |||||||||||||||||
| Accumulated net realized gain (loss) | — | (8,401 | ) | 129,062 | (204,013 | ) | 289,005 | |||||||||||||||
| Net unrealized appreciation (depreciation) | 213,015 | 4,166,497 | 88,781 | 7,109,766 | 1,437,522 | |||||||||||||||||
| Net Assets | $ | 3,234,131 | $ | 44,315,532 | $ | 5,850,207 | $ | 116,089,817 | $ | 33,832,370 | ||||||||||||
| Cost of Investments | $ | — | $ | 39,803,078 | $ | 5,287,159 | $ | 102,469,120 | $ | 31,407,274 | ||||||||||||
| Cost of Investments in Affiliates | $ | 3,000,000 | $ | — | $ | 10,009 | $ | 434,651 | $ | 179,219 | ||||||||||||
| Cost of Repurchase Agreements | $ | — | $ | 280,000 | $ | 283,000 | $ | 4,517,000 | $ | 557,000 | ||||||||||||
| Cost of Foreign Currency | $ | — | $ | — | $ | 26,765 | $ | 178,754 | $ | 23,434 | ||||||||||||
| Net Assets: | ||||||||||||||||||||||
| Class A | $ | 10,700 | $ | 10,850,865 | $ | — | $ | 242,284 | $ | — | ||||||||||||
| Class C | — | 954,652 | — | — | — | |||||||||||||||||
| Class D | — | 2,954,836 | — | — | — | |||||||||||||||||
| Class R | — | — | — | — | — | |||||||||||||||||
| Class P | 10,706 | 108,754 | 10,441 | 4,291,334 | 10,500 | |||||||||||||||||
| Institutional Class | 3,212,725 | 29,446,425 | 10,445 | 106,133 | 10,504 | |||||||||||||||||
| Class R6 | — | — | 5,829,321 | 111,450,066 | 33,811,366 | |||||||||||||||||
| Administrative Class | — | — | — | — | — | |||||||||||||||||
| Shares Issued and Outstanding: | ||||||||||||||||||||||
| Class A | 667 | 538,972 | — | 14,663 | — | |||||||||||||||||
| Class C | — | 48,622 | — | — | — | |||||||||||||||||
| Class D | — | 148,142 | — | — | — | |||||||||||||||||
| Class R | — | — | — | — | — | |||||||||||||||||
| Class P | 666 | 5,386 | 666 | 258,347 | 666 | |||||||||||||||||
| Institutional Class | 200,000 | 1,453,565 | 667 | 6,416 | 667 | |||||||||||||||||
| Class R6 | — | — | 372,012 | 6,706,368 | 2,146,805 | |||||||||||||||||
| Administrative Class | — | — | — | — | — | |||||||||||||||||
| Net Asset Value and Redemption Price Per Share:* | ||||||||||||||||||||||
| Class A | $ | 16.05 | $ | 20.13 | $ | — | $ | 16.52 | $ | — | ||||||||||||
| Class C | — | 19.63 | — | — | — | |||||||||||||||||
| Class D | — | 19.95 | — | — | — | |||||||||||||||||
| Class R | — | — | — | — | — | |||||||||||||||||
| Class P | 16.06 | 20.19 | 15.66 | 16.61 | 15.74 | |||||||||||||||||
| Institutional Class | 16.06 | 20.26 | 15.66 | 16.54 | 15.74 | |||||||||||||||||
| Class R6 | — | — | 15.67 | 16.62 | 15.75 | |||||||||||||||||
| Administrative Class | — | — | — | — | — | |||||||||||||||||
| * | Net asset value and redemption price per share may not recalculate exactly due to rounding. |
| 174 | Semiannual Report | | May 31, 2015 | | See accompanying Notes to Financial Statements |
Table of Contents
| AllianzGI Best Styles U.S. Equity | AllianzGI China Equity | AllianzGI Convertible | AllianzGI Emerging Markets Consumer | AllianzGI Emerging Markets Debt | AllianzGI Emerging Markets Small-Cap | AllianzGI Europe Equity Dividend | ||||||||||||||||||||||
| $ | 59,323,598 | $ | 11,695,517 | $ | 2,057,935,045 | $ | 12,607,377 | $ | 31,163,093 | $ | 4,678,774 | $ | 3,240,753 | |||||||||||||||
| 441,929 | (17,879 | ) | (1,057,105 | ) | 13,692 | 70,359 | 21,142 | 63,077 | ||||||||||||||||||||
| 239,836 | 236,812 | 146,213,039 | 31,621 | (536,062 | ) | 98,500 | (16,582 | ) | ||||||||||||||||||||
| 557,337 | 1,389,423 | 307,911,496 | 337,949 | (180,298 | ) | 439,984 | 12,103 | |||||||||||||||||||||
| $ | 60,562,700 | $ | 13,303,873 | $ | 2,511,002,475 | $ | 12,990,639 | $ | 30,517,092 | $ | 5,238,400 | $ | 3,299,351 | |||||||||||||||
| $ | 55,849,290 | $ | 10,146,356 | $ | 2,133,343,179 | $ | 12,325,916 | $ | 29,904,836 | $ | 4,676,391 | $ | 2,311,377 | |||||||||||||||
| $ | 70,265 | $ | 728,891 | $ | — | $ | — | $ | — | $ | — | $ | 753,805 | |||||||||||||||
| $ | 3,653,000 | $ | 920,000 | $ | 83,492,000 | $ | 183,000 | $ | 599,000 | $ | — | $ | 219,000 | |||||||||||||||
| $ | 782 | $ | 7,204 | $ | — | $ | 23,739 | $ | 17,839 | $ | 29,536 | $ | 4,363 | |||||||||||||||
| $ | — | $ | 4,695,340 | $ | 496,355,222 | $ | 44,524 | $ | 10,002 | $ | 21,067 | $ | 10,182 | |||||||||||||||
| — | 61,199 | 119,089,592 | — | 9,949 | — | 163,737 | ||||||||||||||||||||||
| — | 2,877,937 | 70,256,596 | — | — | — | — | ||||||||||||||||||||||
| — | — | 1,706,415 | — | — | — | — | ||||||||||||||||||||||
| 27,507 | 91,314 | 191,182,145 | — | 10,012 | — | 24,881 | ||||||||||||||||||||||
| 283,955 | 5,578,083 | 1,630,173,437 | 12,946,115 | 30,487,129 | 5,217,333 | 3,100,551 | ||||||||||||||||||||||
| 60,251,238 | — | — | — | — | — | — | ||||||||||||||||||||||
| — | — | 2,239,068 | — | — | — | — | ||||||||||||||||||||||
| — | 219,125 | 13,871,490 | 3,006 | 683 | 1,254 | 667 | ||||||||||||||||||||||
| — | 2,814 | 3,326,343 | — | 680 | — | 10,746 | ||||||||||||||||||||||
| — | 132,495 | 1,964,526 | — | — | — | — | ||||||||||||||||||||||
| — | — | 47,799 | — | — | — | — | ||||||||||||||||||||||
| 1,771 | 4,086 | 5,352,373 | — | 683 | — | 1,628 | ||||||||||||||||||||||
| 18,265 | 259,845 | 45,697,533 | 872,464 | 2,078,729 | 310,099 | 202,855 | ||||||||||||||||||||||
| 3,875,637 | — | — | — | — | — | — | ||||||||||||||||||||||
| — | — | 62,555 | — | — | — | — | ||||||||||||||||||||||
| $ | — | $ | 21.43 | $ | 35.78 | $ | 14.81 | $ | 14.66 | $ | 16.80 | $ | 15.27 | |||||||||||||||
| — | 21.75 | 35.80 | — | 14.64 | — | 15.24 | ||||||||||||||||||||||
| — | 21.72 | 35.76 | — | — | — | — | ||||||||||||||||||||||
| — | — | 35.70 | — | — | — | — | ||||||||||||||||||||||
| 15.53 | 22.35 | 35.72 | — | 14.66 | — | 15.28 | ||||||||||||||||||||||
| 15.55 | 21.47 | 35.67 | 14.84 | 14.67 | 16.82 | 15.28 | ||||||||||||||||||||||
| 15.55 | — | — | — | — | — | — | ||||||||||||||||||||||
| — | — | 35.79 | — | — | — | — | ||||||||||||||||||||||
| See accompanying Notes to Financial Statements | | May 31, 2015 | | Semiannual Report | 175 |
Table of Contents
Statements of Assets and Liabilities (cont’d)
May 31, 2015 (Unaudited)
| AllianzGI Global Fundamental Strategy | AllianzGI Global Managed Volatility | AllianzGI Global Sustainability | AllianzGI Global Water | AllianzGI High Yield Bond | ||||||||||||||||||
| Assets: | ||||||||||||||||||||||
| Investments, at value | $ | 18,470,401 | $ | 2,741,544 | $ | 2,952,784 | $ | 338,316,478 | $ | 387,549,145 | ||||||||||||
| Investments in Affiliates, at value | 481,196 | — | 46,537 | 3,603,814 | — | |||||||||||||||||
| Repurchase agreements, at value | 3,346,000 | — | 145,000 | 25,507,000 | 10,810,000 | |||||||||||||||||
| Cash | 691 | 84,862 | 152 | 996 | 130 | |||||||||||||||||
| Foreign currency, at value | 21,799 | 458 | — | 6 | — | |||||||||||||||||
| Unrealized appreciation of forward foreign currency contracts | 7,320 | — | — | — | — | |||||||||||||||||
| Dividends and interest receivable (net of foreign withholding taxes) | 151,472 | 6,707 | 4,891 | 789,738 | 6,615,338 | |||||||||||||||||
| Receivable for investments sold | 14,975 | — | — | 1,029 | — | |||||||||||||||||
| Receivable for investments in Affiliates sold | — | — | — | — | — | |||||||||||||||||
| Deposits with brokers for derivatives collateral | 82,763 | — | — | — | — | |||||||||||||||||
| Receivable for Fund shares sold | — | — | — | 1,077,042 | 245,511 | |||||||||||||||||
| Receivable from Investment Manager | 5,135 | 26,389 | 10,549 | — | — | |||||||||||||||||
| Deferred offering costs | — | — | 42,019 | — | — | |||||||||||||||||
| Tax reclaims receivable | 11,844 | 7,438 | 1,474 | 437,874 | — | |||||||||||||||||
| Dividends receivable from Affiliates | — | — | — | 72,271 | — | |||||||||||||||||
| Investments in Affiliated Funds — Trustee Deferred Compensation Plan (see Note 5) | 97 | 12 | 13 | 1,519 | 1,709 | |||||||||||||||||
| Receivable for variation margin on futures contracts | — | — | — | — | — | |||||||||||||||||
| Prepaid expenses and other assets | 44,429 | 31,997 | 4,225 | 49,040 | 59,897 | |||||||||||||||||
Total Assets | 22,638,122 | 2,899,407 | 3,207,644 | 369,856,807 | 405,281,730 | |||||||||||||||||
| Liabilities: | ||||||||||||||||||||||
| Payable for investments purchased | 36,025 | — | — | 1,223,337 | 2,680,000 | |||||||||||||||||
| Payable for Fund shares redeemed | 46,753 | — | — | 1,014,115 | 533,163 | |||||||||||||||||
| Payable to custodian for cash overdraft | — | — | — | — | — | |||||||||||||||||
| Payable for variation margin on futures contracts | 7,557 | — | — | — | — | |||||||||||||||||
| Options written, at value | 45,098 | — | — | — | — | |||||||||||||||||
| Investment management fees payable | — | — | — | 295,507 | 166,561 | |||||||||||||||||
| Distribution fees payable | 7 | 209 | — | 50,403 | 20,310 | |||||||||||||||||
| Servicing fees payable | 18 | 201 | 2 | 52,614 | 20,916 | |||||||||||||||||
| Unrealized depreciation of forward foreign currency contracts | 18,473 | — | — | — | — | |||||||||||||||||
| Due to Investment Manager | — | — | 42,019 | — | — | |||||||||||||||||
| Trustees Deferred Compensation Plan payable (see Note 5) | 97 | 12 | 13 | 1,519 | 1,709 | |||||||||||||||||
| Accrued expenses and other liabilities | 37,407 | 41,905 | 25,030 | 297,799 | 176,533 | |||||||||||||||||
Total Liabilities | 191,435 | 42,327 | 67,064 | 2,935,294 | 3,599,192 | |||||||||||||||||
| Net Assets | $ | 22,446,687 | $ | 2,857,080 | $ | 3,140,580 | $ | 366,921,513 | $ | 401,682,538 | ||||||||||||
| 176 | Semiannual Report | | May 31, 2015 | | See accompanying Notes to Financial Statements |
Table of Contents
| AllianzGI International Growth | AllianzGI International Small-Cap | AllianzGI Micro Cap | AllianzGI Multi-Asset Real Return | AllianzGI NFJ Emerging Markets Value | AllianzGI NFJ Global Dividend Value | AllianzGI NFJ International Small-Cap Value | ||||||||||||||||||||||
| $ | 2,781,787 | $ | 85,213,281 | $ | 40,324,222 | $ | 2,012,568 | $ | 9,096,641 | $ | 39,825,571 | $ | 18,200,055 | |||||||||||||||
| 369,163 | 26,810,565 | 1,310,184 | 2,664,869 | — | — | 643,139 | ||||||||||||||||||||||
| — | 7,946,000 | — | 369,000 | 184,000 | 553,000 | — | ||||||||||||||||||||||
| 62,608 | 965 | — | 428 | 64,370 | 90 | 89,068 | ||||||||||||||||||||||
| 2,299 | 251,595 | — | 12,015 | 148,654 | 173,260 | 375,576 | ||||||||||||||||||||||
| — | — | — | — | 20 | — | — | ||||||||||||||||||||||
| 2,363 | 174,498 | 3,504 | 4,803 | 40,304 | 229,277 | 71,094 | ||||||||||||||||||||||
| — | 1,151,046 | 2,379,571 | 99,678 | 33,356 | — | 14,665 | ||||||||||||||||||||||
| — | — | 171,382 | — | — | — | — | ||||||||||||||||||||||
| — | — | — | 130,917 | — | — | — | ||||||||||||||||||||||
| — | 906,313 | 4,339 | — | 500 | 47,475 | 82,555 | ||||||||||||||||||||||
| 11,929 | — | — | 20,211 | 23,973 | — | 17,466 | ||||||||||||||||||||||
| 44,956 | — | — | — | — | — | — | ||||||||||||||||||||||
| 1,076 | 85,088 | — | 25 | 6,004 | 7,479 | 14,156 | ||||||||||||||||||||||
| — | 8,783 | 4,839 | — | — | — | — | ||||||||||||||||||||||
| 14 | 447 | 186 | 27 | 38 | 169 | 76 | ||||||||||||||||||||||
| — | — | — | 8,725 | — | — | — | ||||||||||||||||||||||
| 2,533 | 51,108 | 26,468 | 32,803 | 28,329 | 43,735 | 70,931 | ||||||||||||||||||||||
| 3,278,728 | 122,599,689 | 44,224,695 | 5,356,069 | 9,626,189 | 40,880,056 | 19,578,781 | ||||||||||||||||||||||
| — | 1,282,491 | 869,666 | — | 114,343 | — | — | ||||||||||||||||||||||
| — | 34,698 | 119,981 | — | — | 29,605 | 17,624 | ||||||||||||||||||||||
| — | — | 47,524 | — | — | — | — | ||||||||||||||||||||||
| — | — | — | 6,625 | — | — | — | ||||||||||||||||||||||
| — | — | — | — | — | — | — | ||||||||||||||||||||||
| — | 84,083 | 33,497 | — | — | 927 | — | ||||||||||||||||||||||
| — | 1,302 | — | 71 | 41 | 4,049 | 970 | ||||||||||||||||||||||
| 2 | 3,218 | 1,465 | 60 | 373 | 4,647 | 1,297 | ||||||||||||||||||||||
| — | 143 | — | — | 66 | — | — | ||||||||||||||||||||||
| 44,956 | — | — | — | — | — | — | ||||||||||||||||||||||
| 14 | 447 | 186 | 27 | 38 | 169 | 76 | ||||||||||||||||||||||
| 28,314 | 213,039 | 56,111 | 47,710 | 45,680 | 56,441 | 46,715 | ||||||||||||||||||||||
| 73,286 | 1,619,421 | 1,128,430 | 54,493 | 160,541 | 95,838 | 66,682 | ||||||||||||||||||||||
| $ | 3,205,442 | $ | 120,980,268 | $ | 43,096,265 | $ | 5,301,576 | $ | 9,465,648 | $ | 40,784,218 | $ | 19,512,099 | |||||||||||||||
| See accompanying Notes to Financial Statements | | May 31, 2015 | | Semiannual Report | 177 |
Table of Contents
Statements of Assets and Liabilities (cont’d)
May 31, 2015 (Unaudited)
| AllianzGI Global Fundamental Strategy | AllianzGI Global Managed Volatility | AllianzGI Global Sustainability | AllianzGI Global Water | AllianzGI High Yield Bond | ||||||||||||||||||
| Net Assets Consist of: | ||||||||||||||||||||||
| Paid-in-capital | $ | 21,603,592 | $ | 1,410,855 | $ | 3,020,000 | $ | 326,391,622 | $ | 410,662,832 | ||||||||||||
| Undistributed (dividends in excess of) net investment income | 89,829 | 52,938 | 24,564 | 1,468,265 | (2,797,803 | ) | ||||||||||||||||
| Accumulated net realized gain (loss) | 434,832 | 1,140,339 | (19,303 | ) | (2,347,809 | ) | (8,471,537 | ) | ||||||||||||||
| Net unrealized appreciation (depreciation) | 318,434 | 252,948 | 115,319 | 41,409,435 | 2,289,046 | |||||||||||||||||
| Net Assets | $ | 22,446,687 | $ | 2,857,080 | $ | 3,140,580 | $ | 366,921,513 | $ | 401,682,538 | ||||||||||||
| Cost of Investments | $ | 18,219,736 | $ | 2,485,726 | $ | 2,838,089 | $ | 297,324,202 | $ | 385,260,099 | ||||||||||||
| Cost of Investments in Affiliates | $ | 423,912 | $ | — | $ | 45,856 | $ | 3,151,684 | $ | — | ||||||||||||
| Cost of Repurchase Agreements | $ | 3,346,000 | $ | — | $ | 145,000 | $ | 25,507,000 | $ | 10,810,000 | ||||||||||||
| Cost of Foreign Currency | $ | 21,791 | $ | 463 | $ | — | $ | 6 | $ | — | ||||||||||||
| Premiums Received for Options Written | $ | 78,094 | $ | — | $ | — | $ | — | $ | — | ||||||||||||
| Net Assets: | ||||||||||||||||||||||
| Class A | $ | 24,595 | $ | 202,838 | $ | 10,387 | $ | 140,175,003 | $ | 38,826,658 | ||||||||||||
| Class C | 10,697 | 335,079 | — | 78,409,629 | 20,419,891 | |||||||||||||||||
| Class D | 50,455 | 414,612 | — | 29,081,976 | 38,325,764 | |||||||||||||||||
| Class R | — | — | — | — | 1,017,693 | |||||||||||||||||
| Class P | 10,885 | 14,053 | 10,394 | 88,533,579 | 79,037,297 | |||||||||||||||||
| Institutional Class | 22,350,055 | 1,890,498 | 3,119,799 | 30,721,326 | 187,304,109 | |||||||||||||||||
| Administrative Class | — | — | — | — | 36,751,126 | |||||||||||||||||
| Shares Issued and Outstanding: | ||||||||||||||||||||||
| Class A | 1,585 | 12,103 | 667 | 10,579,259 | 3,977,693 | |||||||||||||||||
| Class C | 690 | 20,512 | — | 6,107,835 | 2,095,199 | |||||||||||||||||
| Class D | 3,136 | 24,810 | — | 2,203,903 | 4,050,524 | |||||||||||||||||
| Class R | — | — | — | — | 107,760 | |||||||||||||||||
| Class P | 699 | 831 | 666 | 6,657,623 | 8,375,333 | |||||||||||||||||
| Institutional Class | 1,434,374 | 111,838 | 200,000 | 2,339,790 | 19,792,307 | |||||||||||||||||
| Administrative Class | — | — | — | — | 3,901,433 | |||||||||||||||||
| Net Asset Value and Redemption Price Per Share:* | ||||||||||||||||||||||
| Class A | $ | 15.52 | $ | 16.76 | $ | 15.58 | $ | 13.25 | $ | 9.76 | ||||||||||||
| Class C | 15.51 | 16.34 | — | 12.84 | 9.75 | |||||||||||||||||
| Class D | 16.09 | 16.71 | — | 13.20 | 9.46 | |||||||||||||||||
| Class R | — | — | — | — | 9.44 | |||||||||||||||||
| Class P | 15.57 | 16.91 | 15.59 | 13.30 | 9.44 | |||||||||||||||||
| Institutional Class | 15.58 | 16.90 | 15.60 | 13.13 | 9.46 | |||||||||||||||||
| Administrative Class | — | — | — | — | 9.42 | |||||||||||||||||
| * | Net asset value and redemption price per share may not recalculate exactly due to rounding. |
| 178 | Semiannual Report | | May 31, 2015 | | See accompanying Notes to Financial Statements |
Table of Contents
| AllianzGI International Growth | AllianzGI International Small-Cap | AllianzGI Micro Cap | AllianzGI Multi-Asset Real Return | AllianzGI NFJ Emerging Markets Value | AllianzGI NFJ Global Dividend Value | AllianzGI NFJ International Small-Cap Value | ||||||||||||||||||||||
| $ | 3,011,056 | $ | 97,746,928 | $ | 32,766,337 | $ | 5,554,493 | $ | 9,313,638 | $ | 34,529,265 | $ | 17,317,825 | |||||||||||||||
| 22,074 | 425,128 | (753,822 | ) | (43 | ) | 56,658 | 426,400 | 161,879 | ||||||||||||||||||||
| (6,651 | ) | 3,616,518 | (2,881,145 | ) | (143,838 | ) | (108,283 | ) | 1,815,419 | 618,689 | ||||||||||||||||||
| 178,963 | 19,191,694 | 13,964,895 | (109,036 | ) | 203,635 | 4,013,134 | 1,413,706 | |||||||||||||||||||||
| $ | 3,205,442 | $ | 120,980,268 | $ | 43,096,265 | $ | 5,301,576 | $ | 9,465,648 | $ | 40,784,218 | $ | 19,512,099 | |||||||||||||||
| $ | 2,631,440 | $ | 68,752,637 | $ | 26,983,596 | $ | 1,904,728 | $ | 8,891,834 | $ | 35,806,361 | $ | 16,772,325 | |||||||||||||||
| $ | 340,524 | $ | 24,064,060 | $ | 685,915 | $ | 2,880,055 | $ | — | $ | — | $ | 651,107 | |||||||||||||||
| $ | — | $ | 7,946,000 | $ | — | $ | 369,000 | $ | 184,000 | $ | 553,000 | $ | — | |||||||||||||||
| $ | 2,301 | $ | 251,519 | $ | — | $ | 12,280 | $ | 148,748 | $ | 177,426 | $ | 378,639 | |||||||||||||||
| $ | — | $ | — | $ | — | $ | — | $ | — | $ | — | $ | — | |||||||||||||||
| $ | 11,673 | $ | 10,241,358 | $ | 6,916,198 | $ | 144,597 | $ | 154,609 | $ | 12,645,770 | $ | 3,131,388 | |||||||||||||||
| — | 2,123,198 | — | 109,132 | 73,455 | 6,349,771 | 1,517,261 | ||||||||||||||||||||||
| — | 3,828,069 | — | 23,953 | 1,549,119 | 2,484,226 | 1,631,066 | ||||||||||||||||||||||
| — | 107,121 | — | — | — | — | — | ||||||||||||||||||||||
| — | 41,478,182 | 1,784,505 | 9,974 | 11,133 | 1,850,644 | 54,275 | ||||||||||||||||||||||
| 3,193,769 | 63,202,340 | 34,395,562 | 5,013,920 | 7,677,332 | 17,453,807 | 13,178,109 | ||||||||||||||||||||||
| — | — | — | — | — | — | — | ||||||||||||||||||||||
| 732 | 276,701 | 454,442 | 10,025 | 10,110 | 626,898 | 149,160 | ||||||||||||||||||||||
| — | 58,240 | — | 7,631 | 4,815 | 319,169 | 73,210 | ||||||||||||||||||||||
| — | 102,140 | — | 1,651 | 100,529 | 121,956 | 77,628 | ||||||||||||||||||||||
| — | 2,937 | — | — | — | — | — | ||||||||||||||||||||||
| — | 1,123,500 | 116,845 | 688 | 722 | 91,162 | 2,558 | ||||||||||||||||||||||
| 200,000 | 1,657,698 | 2,242,402 | 345,961 | 497,751 | 867,814 | 618,218 | ||||||||||||||||||||||
| — | — | — | — | — | — | — | ||||||||||||||||||||||
| $ | 15.96 | $ | 37.01 | $ | 15.22 | $ | 14.43 | $ | 15.29 | $ | 20.17 | $ | 20.99 | |||||||||||||||
| — | 36.46 | — | 14.30 | 15.25 | 19.89 | 20.72 | ||||||||||||||||||||||
| — | 37.48 | — | 14.50 | 15.41 | 20.37 | 21.01 | ||||||||||||||||||||||
| — | 36.48 | — | — | — | — | — | ||||||||||||||||||||||
| — | 36.92 | 15.27 | 14.50 | 15.41 | 20.30 | 21.22 | ||||||||||||||||||||||
| 15.97 | 38.13 | 15.34 | 14.49 | 15.42 | 20.11 | 21.32 | ||||||||||||||||||||||
| — | — | — | — | — | — | — | ||||||||||||||||||||||
| See accompanying Notes to Financial Statements | | May 31, 2015 | | Semiannual Report | 179 |
Table of Contents
Statements of Assets and Liabilities (cont’d)
May 31, 2015 (Unaudited)
| AllianzGI NFJ International Value II | AllianzGI Short Duration High Income | AllianzGI Structured Return | AllianzGI U.S. Equity Hedged | |||||||||||||||
| Assets: | ||||||||||||||||||
| Investments, at value | $ | 46,758,421 | $ | 770,233,000 | $ | 30,283,124 | $ | 15,874,615 | ||||||||||
| Investments in Affiliates, at value | 833,395 | — | — | — | ||||||||||||||
| Repurchase agreements, at value | 2,464,000 | 55,837,000 | 2,553,000 | 381,000 | ||||||||||||||
| Cash | 552 | — | 25 | 569 | ||||||||||||||
| Foreign currency, at value | 44,148 | — | — | — | ||||||||||||||
| Dividends and interest receivable (net of foreign withholding taxes) | 221,295 | 13,949,628 | — | — | ||||||||||||||
| Receivable for investments sold | 54,707 | 4,625,968 | 291,290 | 45,059 | ||||||||||||||
| Receivable for investments in Affiliates sold | — | — | — | — | ||||||||||||||
| Deposits with brokers for derivatives collateral | — | — | 11,123 | 85,599 | ||||||||||||||
| Receivable for Fund shares sold | — | 15,505,488 | 142,750 | — | ||||||||||||||
| Receivable from Investment Manager | — | — | 1,257 | 8,727 | ||||||||||||||
| Tax reclaims receivable | 24,669 | — | — | — | ||||||||||||||
| Dividends receivable from Affiliates | — | — | — | — | ||||||||||||||
| Investments in Affiliated Funds — Trustee Deferred Compensation Plan (see Note 5) | 211 | 3,136 | 118 | 72 | ||||||||||||||
| Prepaid expenses and other assets | 20,329 | 29,286 | 22,171 | 22,344 | ||||||||||||||
Total Assets | 50,421,727 | 860,183,506 | 33,304,858 | 16,417,985 | ||||||||||||||
| Liabilities: | ||||||||||||||||||
| Payable for investments purchased | 119,221 | 27,685,642 | 203,822 | 305 | ||||||||||||||
| Payable for Fund shares redeemed | 72 | 865,972 | 39,409 | 196,767 | ||||||||||||||
| Payable to custodian for cash overdraft | — | 783,745 | — | — | ||||||||||||||
| Options written, at value | — | — | 1,304,350 | 48,080 | ||||||||||||||
| Investment management fees payable | 17,046 | 329,521 | — | — | ||||||||||||||
| Distribution fees payable | 112 | 19,148 | 808 | 136 | ||||||||||||||
| Servicing fees payable | 86 | 58,318 | 2,794 | 590 | ||||||||||||||
| Trustees Deferred Compensation Plan payable (see Note 5) | 211 | 3,136 | 118 | 72 | ||||||||||||||
| Accrued expenses and other liabilities | 47,119 | 327,461 | 66,540 | 59,146 | ||||||||||||||
Total Liabilities | 183,867 | 30,072,943 | 1,617,841 | 305,096 | ||||||||||||||
| Net Assets | $ | 50,237,860 | $ | 830,110,563 | $ | 31,687,017 | $ | 16,112,889 | ||||||||||
| Net Assets Consist of: | ||||||||||||||||||
| Paid-in-capital | $ | 48,471,659 | $ | 843,481,027 | $ | 31,019,709 | $ | 15,722,002 | ||||||||||
| Undistributed (dividends in excess of) net investment income | 429,191 | (6,275,037 | ) | 32,222 | 54,583 | |||||||||||||
| Accumulated net realized gain (loss) | (642,153 | ) | (7,971,199 | ) | (629,918 | ) | 419,429 | |||||||||||
| Net unrealized appreciation (depreciation) | 1,979,163 | 875,772 | 1,265,004 | (83,125 | ) | |||||||||||||
| Net Assets | $ | 50,237,860 | $ | 830,110,563 | $ | 31,687,017 | $ | 16,112,889 | ||||||||||
| Cost of Investments | $ | 44,546,085 | $ | 769,357,228 | $ | 29,208,319 | $ | 15,978,034 | ||||||||||
| Cost of Investments in Affiliates | $ | 1,062,239 | $ | — | $ | — | $ | — | ||||||||||
| Cost of Repurchase Agreements | $ | 2,464,000 | $ | 55,837,000 | $ | 2,553,000 | $ | 381,000 | ||||||||||
| Cost of Foreign Currency | $ | 44,149 | $ | — | $ | — | $ | — | ||||||||||
| Premiums Received for Options Written | $ | — | $ | — | $ | 1,494,549 | $ | 68,929 | ||||||||||
| 180 | Semiannual Report | | May 31, 2015 | | See accompanying Notes to Financial Statements |
Table of Contents
| AllianzGI U.S. Small-Cap Growth | AllianzGI Ultra Micro Cap | |||||||
| $ | 43,451,321 | $ | 99,102,754 | |||||
| 678,262 | 1,313,829 | |||||||
| 1,108,000 | 1,248,000 | |||||||
| 154 | 964 | |||||||
| — | — | |||||||
| 12,767 | 8,439 | |||||||
| 447,981 | �� | 1,465,207 | ||||||
| — | 312,526 | |||||||
| — | — | |||||||
| 20,328 | 3,766 | |||||||
| — | — | |||||||
| — | — | |||||||
| — | 7,180 | |||||||
| 171 | 458 | |||||||
| 43,524 | 25,621 | |||||||
| 45,762,508 | 103,488,744 | |||||||
| 238,687 | 922,422 | |||||||
| 13,719 | 120,916 | |||||||
| — | — | |||||||
| — | — | |||||||
| 17,213 | 139,978 | |||||||
| 428 | — | |||||||
| 922 | 10,243 | |||||||
| 171 | 458 | |||||||
| 45,809 | 100,471 | |||||||
| 316,949 | 1,294,488 | |||||||
| $ | 45,445,559 | $ | 102,194,256 | |||||
| $ | 34,089,889 | $ | 71,984,884 | |||||
| (524,685 | ) | (3,043,578 | ) | |||||
| 1,897,984 | 2,347,797 | |||||||
| 9,982,371 | 30,905,153 | |||||||
| $ | 45,445,559 | $ | 102,194,256 | |||||
| $ | 33,446,632 | $ | 68,726,047 | |||||
| $ | 700,580 | $ | 785,383 | |||||
| $ | 1,108,000 | $ | 1,248,000 | |||||
| $ | — | $ | — | |||||
| $ | — | $ | — | |||||
| See accompanying Notes to Financial Statements | | May 31, 2015 | | Semiannual Report | 181 |
Table of Contents
Statements of Assets and Liabilities (cont’d)
May 31, 2015 (Unaudited)
| AllianzGI NFJ International Value II | AllianzGI Short Duration High Income | AllianzGI Structured Return | AllianzGI U.S. Equity Hedged | |||||||||||||||
| Net Assets: | ||||||||||||||||||
| Class A | $ | 214,170 | $ | 157,389,965 | $ | 4,076,763 | $ | 1,515,386 | ||||||||||
| Class C | 173,140 | 90,785,237 | 1,367,076 | 281,911 | ||||||||||||||
| Class D | 14,424 | 30,100,813 | 8,244,089 | 358,314 | ||||||||||||||
| Class R | — | — | — | — | ||||||||||||||
| Class P | 587,151 | 240,006,136 | 128,866 | 12,717 | ||||||||||||||
| Institutional Class | 49,248,975 | 311,828,412 | 17,870,223 | 13,944,561 | ||||||||||||||
| Shares Issued and Outstanding: | ||||||||||||||||||
| Class A | 11,446 | 10,047,757 | 261,305 | 88,465 | ||||||||||||||
| Class C | 9,344 | 5,808,851 | 89,431 | 16,789 | ||||||||||||||
| Class D | 770 | 1,921,845 | 531,664 | 20,995 | ||||||||||||||
| Class R | — | — | — | — | ||||||||||||||
| Class P | 31,384 | 15,332,917 | 8,227 | 737 | ||||||||||||||
| Institutional Class | 2,626,087 | 19,894,762 | 1,140,834 | 810,855 | ||||||||||||||
| Net Asset Value and Redemption Price Per Share:* | ||||||||||||||||||
| Class A | $ | 18.71 | $ | 15.66 | $ | 15.60 | $ | 17.13 | ||||||||||
| Class C | 18.53 | 15.63 | 15.29 | 16.79 | ||||||||||||||
| Class D | 18.74 | 15.66 | 15.51 | 17.07 | ||||||||||||||
| Class R | — | — | — | — | ||||||||||||||
| Class P | 18.71 | 15.65 | 15.66 | 17.27 | ||||||||||||||
| Institutional Class | 18.75 | 15.67 | 15.66 | 17.20 | ||||||||||||||
| * | Net asset value and redemption price per share may not recalculate exactly due to rounding. |
| 182 | Semiannual Report | | May 31, 2015 | | See accompanying Notes to Financial Statements |
Table of Contents
| AllianzGI U.S. Small-Cap Growth | AllianzGI Ultra Micro Cap | |||||||
| $ | 3,561,871 | $ | 48,394,953 | |||||
| 670,765 | — | |||||||
| 121,582 | — | |||||||
| 25,920 | — | |||||||
| 330,813 | 8,762,013 | |||||||
| 40,734,608 | 45,037,290 | |||||||
| 209,805 | 1,899,530 | |||||||
| 41,081 | — | |||||||
| 7,152 | — | |||||||
| 1,543 | — | |||||||
| 19,241 | 341,862 | |||||||
| 2,357,648 | 1,753,704 | |||||||
| $ | 16.98 | $ | 25.48 | |||||
| 16.33 | — | |||||||
| 17.00 | — | |||||||
| 16.79 | — | |||||||
| 17.19 | 25.63 | |||||||
| 17.28 | 25.68 | |||||||
| See accompanying Notes to Financial Statements | | May 31, 2015 | | Semiannual Report | 183 |
Table of Contents
Six Months ended May 31, 2015 (Unaudited)
| AllianzGI Retirement 2015 | AllianzGI Retirement 2020 | AllianzGI Retirement 2025 | AllianzGI Retirement 2030 | AllianzGI Retirement 2035 | ||||||||||||||||||
| Investment Income: | ||||||||||||||||||||||
| Dividends from investments in Affiliates | $ | 688,690 | $ | 1,192,712 | $ | 1,271,832 | $ | 1,293,352 | $ | 1,051,897 | ||||||||||||
| Dividends | 48,299 | 102,450 | 108,150 | 120,067 | 100,575 | |||||||||||||||||
| Interest | — | — | — | — | — | |||||||||||||||||
| Contribution from Investment Manager (see Note 6) | — | — | — | — | — | |||||||||||||||||
Total Investment Income | 736,989 | 1,295,162 | 1,379,982 | 1,413,419 | 1,152,472 | |||||||||||||||||
| Expenses: | ||||||||||||||||||||||
| Investment management | 8,785 | 16,163 | 16,984 | 16,662 | 13,536 | |||||||||||||||||
| Administration | 29,973 | 72,308 | 72,412 | 65,991 | 54,879 | |||||||||||||||||
| Distribution — Class B | — | — | — | — | — | |||||||||||||||||
| Distribution — Class C | 3,710 | 1,528 | — | 2,497 | — | |||||||||||||||||
| Distribution — Class R | 293 | 1,324 | 1,421 | 1,835 | 1,827 | |||||||||||||||||
| Administrative servicing — Class P | — | — | — | — | — | |||||||||||||||||
| Servicing — Class A | 14,583 | 41,999 | 38,847 | 30,819 | 24,968 | |||||||||||||||||
| Servicing — Class B | — | — | — | — | — | |||||||||||||||||
| Servicing — Class C | 1,237 | 509 | — | 832 | — | |||||||||||||||||
| Servicing — Class D | 91 | 326 | — | 748 | — | |||||||||||||||||
| Servicing — Class R | 293 | 1,323 | 1,421 | 1,835 | 1,827 | |||||||||||||||||
| Distribution and/or servicing — Administrative Class | 1,142 | 3,814 | 4,173 | 4,070 | 3,655 | |||||||||||||||||
| Sub-transfer agent — Class A | — | — | — | — | — | |||||||||||||||||
| Sub-transfer agent — Class B | — | — | — | — | — | |||||||||||||||||
| Sub-transfer agent — Class C | — | — | — | — | — | |||||||||||||||||
| Sub-transfer agent — Class D | — | — | — | — | — | |||||||||||||||||
| Sub-transfer agent — Class R | — | — | — | — | — | |||||||||||||||||
| Sub-transfer agent — Institutional Class | — | — | — | — | — | |||||||||||||||||
| Excise tax | 7,145 | 10,242 | 11,945 | 10,653 | 7,389 | |||||||||||||||||
| Trustees | — | — | — | — | — | |||||||||||||||||
| Custodian and accounting agent | — | — | — | — | — | |||||||||||||||||
| Shareholder communications | — | — | — | — | — | |||||||||||||||||
| Transfer agent | — | — | — | — | — | |||||||||||||||||
| Legal | — | — | — | — | — | |||||||||||||||||
| Insurance | — | — | — | — | — | |||||||||||||||||
| Audit and tax services | — | — | — | — | — | |||||||||||||||||
| Registration | — | — | — | — | — | |||||||||||||||||
| Proxy | — | — | — | — | — | |||||||||||||||||
| Miscellaneous | — | — | — | — | — | |||||||||||||||||
Total Expenses | 67,252 | 149,536 | 147,203 | 135,942 | 108,081 | |||||||||||||||||
Less: Fee Waiver/Reimbursement from Investment Manager | (9,790 | ) | (23,387 | ) | (29,031 | ) | (32,562 | ) | (31,569 | ) | ||||||||||||
Net Expenses | 57,462 | 126,149 | 118,172 | 103,380 | 76,512 | |||||||||||||||||
| Net Investment Income | 679,527 | 1,169,013 | 1,261,810 | 1,310,039 | 1,075,960 | |||||||||||||||||
| 184 | Semiannual Report | | May 31, 2015 | | See accompanying Notes to Financial Statements |
Table of Contents
| AllianzGI Retirement 2040 | AllianzGI Retirement 2045 | AllianzGI Retirement 2050 | AllianzGI Retirement 2055 | AllianzGI Retirement Income | AllianzGI Global Allocation | AllianzGI Global Dynamic Allocation | ||||||||||||||||||||||
| $ | 813,908 | $ | 523,857 | $ | 404,014 | $ | 138,273 | $ | 525,997 | $ | 3,972,047 | $ | 128,331 | |||||||||||||||
| 90,847 | 53,287 | 45,552 | 16,466 | 37,499 | 236,511 | 8,450 | ||||||||||||||||||||||
| — | — | — | — | — | 307 | 4,611 | ||||||||||||||||||||||
| — | 208 | 1,836 | 741 | — | — | — | ||||||||||||||||||||||
| 904,755 | 577,352 | 451,402 | 155,480 | 563,496 | 4,208,865 | 141,392 | ||||||||||||||||||||||
| 10,799 | 6,552 | 5,335 | 1,994 | 6,764 | 812,983 | 27,250 | ||||||||||||||||||||||
| 41,396 | 25,828 | 16,841 | 4,533 | 24,667 | — | — | ||||||||||||||||||||||
| — | — | — | — | — | 4,888 | — | ||||||||||||||||||||||
| 878 | — | 543 | — | 14,128 | 223,120 | 4,945 | ||||||||||||||||||||||
| 1,539 | 590 | 791 | 212 | 274 | 22 | 188 | ||||||||||||||||||||||
| — | — | — | — | — | 1,037 | 21 | ||||||||||||||||||||||
| 20,022 | 13,078 | 6,228 | 1,527 | 8,074 | 76,979 | 1,291 | ||||||||||||||||||||||
| — | — | — | — | — | 1,629 | — | ||||||||||||||||||||||
| 293 | — | 181 | — | 4,709 | 74,373 | 1,648 | ||||||||||||||||||||||
| 301 | — | 289 | — | 1,236 | 2,827 | 147 | ||||||||||||||||||||||
| 1,539 | 590 | 791 | 212 | 274 | 22 | 188 | ||||||||||||||||||||||
| 1,717 | 734 | 802 | 251 | 547 | 31 | 33 | ||||||||||||||||||||||
| — | — | — | — | — | 15,561 | 419 | ||||||||||||||||||||||
| — | — | — | — | — | 624 | — | ||||||||||||||||||||||
| — | — | — | — | — | 13,702 | 320 | ||||||||||||||||||||||
| — | — | — | — | — | 590 | 90 | ||||||||||||||||||||||
| — | — | — | — | — | — | 116 | ||||||||||||||||||||||
| — | — | — | — | — | 26,108 | — | ||||||||||||||||||||||
| 1,191 | 2,263 | 1,125 | 49 | 4,512 | 13,234 | — | ||||||||||||||||||||||
| — | — | — | — | — | 12,305 | 368 | ||||||||||||||||||||||
| — | — | — | — | — | 26,550 | 32,686 | ||||||||||||||||||||||
| — | — | — | — | — | 17,860 | 6,531 | ||||||||||||||||||||||
| — | — | — | — | — | 32,764 | 5,330 | ||||||||||||||||||||||
| — | — | — | — | — | 17,411 | 9,718 | ||||||||||||||||||||||
| — | — | — | — | — | 5,063 | 2,602 | ||||||||||||||||||||||
| — | — | — | — | — | 19,609 | 14,881 | ||||||||||||||||||||||
| — | — | — | — | — | 27,003 | 27,278 | ||||||||||||||||||||||
| — | — | — | — | — | 3,433 | 83 | ||||||||||||||||||||||
| — | — | — | — | — | 1,921 | 1,719 | ||||||||||||||||||||||
| 79,675 | 49,635 | 32,926 | 8,778 | 65,185 | 1,431,649 | 137,852 | ||||||||||||||||||||||
| | (27,504 | ) | (19,401 | ) | (16,732 | ) | (5,043 | ) | (11,840 | ) | (796,991 | ) | (119,462 | ) | ||||||||||||||
| 52,171 | 30,234 | 16,194 | 3,735 | 53,345 | 634,658 | 18,390 | ||||||||||||||||||||||
| 852,584 | 547,118 | 435,208 | 151,745 | 510,151 | 3,574,207 | 123,002 | ||||||||||||||||||||||
| See accompanying Notes to Financial Statements | | May 31, 2015 | | Semiannual Report | 185 |
Table of Contents
Statements of Operations (cont’d)
Six Months ended May 31, 2015 (Unaudited)
| AllianzGI Retirement 2015 | AllianzGI Retirement 2020 | AllianzGI Retirement 2025 | AllianzGI Retirement 2030 | AllianzGI Retirement 2035 | ||||||||||||||||||
| Realized and Change in Unrealized Gain (Loss): | ||||||||||||||||||||||
| Net realized gain (loss) on: | ||||||||||||||||||||||
Investments | $ | 70,951 | $ | 115,100 | $ | 152,102 | $ | 150,178 | $ | 143,254 | ||||||||||||
Investments in Affiliates | (109,238 | ) | (909,294 | ) | (819,457 | ) | (606,173 | ) | (465,716 | ) | ||||||||||||
Futures contracts | — | — | — | — | — | |||||||||||||||||
Foreign currency transactions | — | — | — | — | — | |||||||||||||||||
| Net capital gain distributions received from underlying Affiliated funds | 320,555 | 635,045 | 801,325 | 859,427 | 805,631 | |||||||||||||||||
| Net capital gain distributions received from underlying funds | 14,853 | 39,137 | 41,097 | 45,920 | 36,717 | |||||||||||||||||
| Net change in unrealized appreciation/depreciation of: | ||||||||||||||||||||||
Investments | (105,872 | ) | (283,594 | ) | (339,532 | ) | (376,396 | ) | (341,375 | ) | ||||||||||||
Investments in Affiliates | (616,092 | ) | (587,879 | ) | (673,883 | ) | (885,951 | ) | (676,635 | ) | ||||||||||||
Futures contracts | — | — | — | — | — | |||||||||||||||||
Foreign currency transactions | — | — | — | — | — | |||||||||||||||||
| Net realized and change in unrealized gain (loss) | (424,843 | ) | (991,485 | ) | (838,348 | ) | (812,995 | ) | (498,124 | ) | ||||||||||||
| Net Increase in Net Assets Resulting from Investment Operations | $ | 254,684 | $ | 177,528 | $ | 423,462 | $ | 497,044 | $ | 577,836 | ||||||||||||
| 186 | Semiannual Report | | May 31, 2015 | | See accompanying Notes to Financial Statements |
Table of Contents
| AllianzGI Retirement 2040 | AllianzGI Retirement 2045 | AllianzGI Retirement 2050 | AllianzGI Retirement 2055 | AllianzGI Retirement Income | AllianzGI Global Allocation | AllianzGI Global Dynamic Allocation | ||||||||||||||||||||||
| $ | 99,646 | $ | 45,954 | $ | 47,563 | $ | 24,228 | $ | 124,449 | $ | 359,249 | $ | (55,552 | ) | ||||||||||||||
| (7,170 | ) | (56,437 | ) | 250,614 | 73,622 | 127,069 | 10,298,227 | 376,778 | ||||||||||||||||||||
| — | — | — | — | — | (350,871 | ) | 5,706 | |||||||||||||||||||||
| — | — | — | — | — | 180,537 | (528 | ) | |||||||||||||||||||||
| | 819,485 | | 574,789 | 480,844 | 182,847 | 246,383 | 3,588,230 | 129,988 | ||||||||||||||||||||
| | 37,833 | | 21,659 | 19,630 | 7,145 | 9,639 | 33,217 | 3,849 | ||||||||||||||||||||
| (302,785 | ) | (160,272 | ) | (151,392 | ) | (60,595 | ) | (146,846 | ) | (1,309,062 | ) | 46,762 | ||||||||||||||||
| (958,533 | ) | (475,633 | ) | (686,786 | ) | (229,053 | ) | (707,953 | ) | (12,194,328 | ) | (522,454 | ) | |||||||||||||||
| — | — | — | — | — | 352,941 | 36,575 | ||||||||||||||||||||||
| — | — | — | — | — | 11,187 | (4,305 | ) | |||||||||||||||||||||
| (311,524 | ) | (49,940 | ) | (39,527 | ) | (1,806 | ) | (347,259 | ) | 969,327 | 16,819 | |||||||||||||||||
| $ | 541,060 | | $ | 497,178 | $ | 395,681 | $ | 149,939 | $ | 162,892 | $ | 4,543,534 | $ | 139,821 | ||||||||||||||
| See accompanying Notes to Financial Statements | | May 31, 2015 | | Semiannual Report | 187 |
Table of Contents
Statements of Operations (cont’d)
Six Months ended May 31, 2015 (Unaudited)
| AllianzGI Global Megatrends (1) | AllianzGI Behavioral Advantage Large Cap | AllianzGI Best Styles Emerging Markets Equity (2) | AllianzGI Best Styles Global Equity | AllianzGI Best Styles International Equity (2) | ||||||||||||||||||
| Investment Income: | ||||||||||||||||||||||
| Interest | $ | — | $ | — | $ | — | $ | — | $ | — | ||||||||||||
| Dividends, net of foreign withholding taxes* | — | 602,171 | 61,922 | 1,313,183 | 681,385 | |||||||||||||||||
| Dividends from investments in Affiliates | — | — | 387 | 19,772 | 2,603 | |||||||||||||||||
| Contribution from Investment Manager (see Note 6) | 1,120 | — | — | — | — | |||||||||||||||||
| Miscellaneous | — | 4 | — | 24 | 211 | |||||||||||||||||
Total Investment Income | 1,120 | 602,175 | 62,309 | 1,332,979 | 684,199 | |||||||||||||||||
| Expenses: | ||||||||||||||||||||||
| Investment management | — | 127,927 | 10,481 | 139,652 | 43,601 | |||||||||||||||||
| Distribution — Class C | — | 3,235 | — | — | — | |||||||||||||||||
| Distribution — Class R | — | — | — | — | — | |||||||||||||||||
| Administrative servicing — Class P | — | 58 | — | — | — | |||||||||||||||||
| Servicing — Class A | 8 | 13,154 | — | 88 | — | |||||||||||||||||
| Servicing — Class C | — | 1,078 | — | — | — | |||||||||||||||||
| Servicing — Class D | — | 2,443 | — | — | — | |||||||||||||||||
| Servicing — Class R | — | — | — | — | — | |||||||||||||||||
| Distribution and/or servicing — Administrative Class | — | — | — | — | — | |||||||||||||||||
| Sub-transfer agent — Class A | — | 327 | — | 68 | — | |||||||||||||||||
| Sub-transfer agent — Class C | — | 116 | — | — | — | |||||||||||||||||
| Sub-transfer agent — Class D | — | 5,917 | — | — | — | |||||||||||||||||
| Sub-transfer agent — Class R | — | — | — | — | — | |||||||||||||||||
| Sub-transfer agent — Institutional Class | — | 106 | — | — | — | |||||||||||||||||
| Sub-transfer agent — Administrative Class | — | — | — | — | — | |||||||||||||||||
| Legal | 2,745 | 8,020 | 5,350 | 9,787 | 5,359 | |||||||||||||||||
| Trustees | 309 | 4,382 | 368 | 2,115 | 777 | |||||||||||||||||
| Audit and tax services | 10,244 | 13,871 | 16,022 | 16,576 | 16,022 | |||||||||||||||||
| Registration | 1,833 | 14,783 | 5,780 | 28,107 | 5,081 | |||||||||||||||||
| Custodian and accounting agent | 15,600 | 47,669 | 57,574 | 137,363 | 86,446 | |||||||||||||||||
| Shareholder communications | 1,445 | 6,673 | 5,271 | 15,913 | 6,106 | |||||||||||||||||
| Transfer agent | 716 | 6,676 | 2,587 | 2,537 | 2,594 | |||||||||||||||||
| Organizational | 6,729 | — | 1,866 | — | 1,920 | |||||||||||||||||
| Offering | 26,388 | — | 35,703 | 467 | 35,181 | |||||||||||||||||
| Excise tax | — | — | — | — | — | |||||||||||||||||
| Insurance | — | 3,577 | — | 3,078 | — | |||||||||||||||||
| Proxy | — | 460 | — | 165 | — | |||||||||||||||||
| Miscellaneous | 1,384 | 1,902 | 1,134 | 1,575 | 1,519 | |||||||||||||||||
Total Expenses | 67,401 | 262,374 | 142,136 | 357,491 | 204,606 | |||||||||||||||||
Less: Fee Waiver/Reimbursement from Investment Manager | (67,397 | ) | (65,336 | ) | (126,399 | ) | (169,743 | ) | (139,162 | ) | ||||||||||||
Net Expenses | 4 | 197,038 | 15,737 | 187,748 | 65,444 | |||||||||||||||||
| Net Investment Income (Loss) | 1,116 | 405,137 | 46,572 | 1,145,231 | 618,755 | |||||||||||||||||
| 188 | Semiannual Report | | May 31, 2015 | | See accompanying Notes to Financial Statements |
Table of Contents
| AllianzGI Best Styles U.S. Equity (3) | AllianzGI China Equity | AllianzGI Convertible | AllianzGI Emerging Markets Consumer (3) | AllianzGI Emerging Markets Debt | AllianzGI Emerging Markets Small-Cap (3) | AllianzGI Europe Equity Dividend (1) | ||||||||||||||||||||||
| $ | — | $ | — | $ | 16,153,560 | $ | — | $ | 748,728 | $ | — | $ | — | |||||||||||||||
| 550,455 | 47,289 | 9,287,712 | 80,134 | — | 51,825 | 52,352 | ||||||||||||||||||||||
| 9,525 | — | — | — | — | — | 20,494 | ||||||||||||||||||||||
| | — | | — | — | — | — | — | — | ||||||||||||||||||||
| — | — | 16,325 | — | 1,206 | — | — | ||||||||||||||||||||||
| 559,980 | 47,289 | 25,457,597 | 80,134 | 749,934 | 51,825 | 72,846 | ||||||||||||||||||||||
| 84,987 | 35,259 | 7,189,058 | 51,094 | 111,159 | 23,911 | 8,103 | ||||||||||||||||||||||
| — | 126 | 449,294 | — | 36 | — | 100 | ||||||||||||||||||||||
| — | — | 1,965 | — | — | — | — | ||||||||||||||||||||||
| — | — | 100,725 | — | — | — | — | ||||||||||||||||||||||
| — | 1,391 | 597,803 | 15 | 13 | 19 | 8 | ||||||||||||||||||||||
| — | 42 | 149,765 | — | 13 | — | 33 | ||||||||||||||||||||||
| — | 691 | 90,151 | — | — | — | — | ||||||||||||||||||||||
| — | — | 1,965 | — | — | — | — | ||||||||||||||||||||||
| | — | | — | 3,371 | — | — | — | — | ||||||||||||||||||||
| — | 110 | 152,295 | — | — | — | — | ||||||||||||||||||||||
| — | — | 46,039 | — | — | — | — | ||||||||||||||||||||||
| — | 5,979 | 71,688 | — | — | — | — | ||||||||||||||||||||||
| — | — | 1,164 | — | — | — | — | ||||||||||||||||||||||
| — | 16 | 97,239 | — | — | — | — | ||||||||||||||||||||||
| — | — | 299 | — | — | — | — | ||||||||||||||||||||||
| 6,279 | 6,453 | 104,112 | 4,969 | 10,163 | 4,976 | 3,920 | ||||||||||||||||||||||
| 1,589 | 285 | 144,987 | 455 | 1,630 | 448 | 235 | ||||||||||||||||||||||
| 14,389 | 13,646 | 35,146 | 16,570 | 20,548 | 15,690 | 10,766 | ||||||||||||||||||||||
| 5,012 | 18,102 | 58,396 | 3,981 | 7,434 | 4,181 | 3,514 | ||||||||||||||||||||||
| 45,643 | 52,312 | 136,828 | 39,691 | 44,528 | 42,473 | 31,537 | ||||||||||||||||||||||
| 6,245 | 5,648 | 72,025 | 5,433 | 6,975 | 6,070 | 1,747 | ||||||||||||||||||||||
| 2,896 | 3,102 | 65,995 | 1,982 | 3,128 | 2,890 | 2,157 | ||||||||||||||||||||||
| 2,177 | — | — | 3,643 | — | 3,134 | 10,007 | ||||||||||||||||||||||
| 38,775 | — | — | 28,725 | 88,210 | 29,071 | 29,723 | ||||||||||||||||||||||
| — | — | — | — | 488 | — | — | ||||||||||||||||||||||
| — | 2,558 | 30,063 | — | — | — | — | ||||||||||||||||||||||
| — | 112 | 47,316 | — | 149 | — | — | ||||||||||||||||||||||
| 1,738 | 2,442 | 13,438 | 2,580 | 8,365 | 1,674 | 1,568 | ||||||||||||||||||||||
| 209,730 | 148,274 | 9,661,127 | 159,138 | 302,839 | 134,537 | 103,418 | ||||||||||||||||||||||
| | (96,340 | ) | (99,229 | ) | — | (92,696 | ) | (156,462 | ) | (104,623 | ) | (93,649 | ) | |||||||||||||||
| 113,390 | 49,045 | 9,661,127 | 66,442 | 146,377 | 29,914 | 9,769 | ||||||||||||||||||||||
| 446,590 | (1,756 | ) | 15,796,470 | 13,692 | 603,557 | 21,911 | 63,077 | |||||||||||||||||||||
| See accompanying Notes to Financial Statements | | May 31, 2015 | | Semiannual Report | 189 |
Table of Contents
Statements of Operations (cont’d)
Six Months ended May 31, 2015 (Unaudited)
| AllianzGI Global Megatrends (1) | AllianzGI Behavioral Advantage Large Cap | AllianzGI Best Styles Emerging Markets Equity (2) | AllianzGI Best Styles Global Equity | AllianzGI Best Styles International Equity (2) | ||||||||||||||||||
| Realized and Change in Unrealized Gain (Loss): | ||||||||||||||||||||||
| Net realized gain (loss) on: | ||||||||||||||||||||||
Investments | $ | — | $ | 10,471,101 | $ | 111,243 | $ | (85,975 | ) | $ | 362,233 | |||||||||||
Investments in Affiliates | — | — | 3,571 | (9,974 | ) | — | ||||||||||||||||
Futures contracts | — | — | 22,957 | (87,306 | ) | — | ||||||||||||||||
Swaps | — | — | — | — | — | |||||||||||||||||
Foreign currency transactions | — | — | (8,709 | ) | (58,270 | ) | (73,228 | ) | ||||||||||||||
| Net change in unrealized appreciation/depreciation of: | ||||||||||||||||||||||
Investments | — | (8,801,756 | ) | 86,658 | 4,820,050 | 1,434,851 | ||||||||||||||||
Investments in Affiliates | 213,015 | — | 2,321 | 37,125 | 7,050 | |||||||||||||||||
Futures contracts | — | — | — | 2,139 | — | |||||||||||||||||
Swaps | — | — | — | — | — | |||||||||||||||||
Foreign currency transactions | — | — | (198 | ) | (2,435 | ) | (4,379 | ) | ||||||||||||||
| Net realized and change in unrealized gain (loss) | 213,015 | 1,669,345 | 217,843 | 4,615,354 | 1,726,527 | |||||||||||||||||
| Net Increase in Net Assets Resulting from Investment Operations | $ | 214,131 | $ | 2,074,482 | $ | 264,415 | $ | 5,760,585 | $ | 2,345,282 | ||||||||||||
| * Foreign withholding taxes | $ | — | $ | 11 | $ | 7,950 | $ | 91,229 | $ | 74,008 | ||||||||||||
| (1) | Commencement of operations, February 2, 2015. |
| (2) | Commencement of operations, December 9, 2014. |
| (3) | Commencement of operations, December 1, 2014. |
| 190 | Semiannual Report | | May 31, 2015 | | See accompanying Notes to Financial Statements |
Table of Contents
| AllianzGI Best Styles U.S. Equity (3) | AllianzGI China Equity | AllianzGI Convertible | AllianzGI Emerging Markets Consumer (3) | AllianzGI Emerging Markets Debt | AllianzGI Emerging Markets Small-Cap (3) | AllianzGI Europe Equity Dividend (1) | ||||||||||||||||||||||
| $ | 56,980 | $ | (30,088 | ) | $ | 153,449,636 | $ | 31,158 | $ | (388,892 | ) | $ | 107,035 | $ | (9,029 | ) | ||||||||||||
| 28,018 | 196,737 | — | — | — | — | 2,547 | ||||||||||||||||||||||
| 163,671 | — | — | — | — | — | — | ||||||||||||||||||||||
| — | — | — | — | 778 | — | — | ||||||||||||||||||||||
| (8,833 | ) | (288 | ) | — | 463 | 31,477 | (8,535 | ) | (10,100 | ) | ||||||||||||||||||
| 515,346 | 951,719 | (29,004,877 | ) | 337,963 | (114,987 | ) | 440,142 | 51,928 | ||||||||||||||||||||
| 31,777 | 281,158 | — | — | — | — | 52,000 | ||||||||||||||||||||||
| 10,228 | — | — | — | — | — | — | ||||||||||||||||||||||
| — | — | — | — | 100,673 | — | — | ||||||||||||||||||||||
| (14 | ) | (19 | ) | — | (14 | ) | (19,002 | ) | (158 | ) | (91,825 | ) | ||||||||||||||||
| 797,173 | 1,399,219 | 124,444,759 | 369,570 | (389,953 | ) | 538,484 | (4,479 | ) | ||||||||||||||||||||
| $ | 1,243,763 | | $ | 1,397,463 | $ | 140,241,229 | $ | 383,262 | $ | 213,604 | $ | 560,395 | $ | 58,598 | ||||||||||||||
| $ | 3,864 | $ | 1,023 | $ | — | $ | 9,511 | $ | — | $ | 5,750 | $ | 7,814 | |||||||||||||||
| See accompanying Notes to Financial Statements | | May 31, 2015 | | Semiannual Report | 191 |
Table of Contents
Statements of Operations (cont’d)
Six Months ended May 31, 2015 (Unaudited)
| AllianzGI Global Fundamental Strategy | AllianzGI Global Managed Volatility | AllianzGI Global Sustainability (1) | AllianzGI Global Water | AllianzGI High Yield Bond | ||||||||||||||||||
| Investment Income: | ||||||||||||||||||||||
| Interest, net of foreign withholding taxes* | $ | 167,477 | $ | — | $ | — | $ | — | $ | 13,600,364 | ||||||||||||
| Dividends, net of foreign withholding taxes* | 167,288 | 131,689 | 38,239 | 4,112,983 | — | |||||||||||||||||
| Dividends from investments in Affiliates | 14,463 | — | — | 113,493 | — | |||||||||||||||||
| Miscellaneous | — | — | — | — | 10,615 | |||||||||||||||||
Total Investment Income | 349,228 | 131,689 | 38,239 | 4,226,476 | 13,610,979 | |||||||||||||||||
| Expenses: | ||||||||||||||||||||||
| Investment management | 83,059 | 14,140 | 11,502 | 1,656,748 | 944,391 | |||||||||||||||||
| Distribution — Class C | 40 | 1,065 | — | 287,312 | 80,217 | |||||||||||||||||
| Distribution — Class R | — | — | — | — | 2,826 | |||||||||||||||||
| Administrative servicing — Class P | — | — | — | 42,641 | 38,036 | |||||||||||||||||
| Servicing — Class A | 21 | 248 | 12 | 170,030 | 49,820 | |||||||||||||||||
| Servicing — Class C | 13 | 355 | — | 95,771 | 26,739 | |||||||||||||||||
| Servicing — Class D | 67 | 458 | — | 30,553 | 45,565 | |||||||||||||||||
| Servicing — Class R | — | — | — | — | 2,826 | |||||||||||||||||
| Distribution and/or servicing — Administrative Class | — | — | — | — | 43,935 | |||||||||||||||||
| Sub-transfer agent — Class A | — | 75 | — | 54,884 | 12,334 | |||||||||||||||||
| Sub-transfer agent — Class C | — | 37 | — | 42,110 | 5,704 | |||||||||||||||||
| Sub-transfer agent — Class D | 1,045 | 104 | — | 15,200 | 22,676 | |||||||||||||||||
| Sub-transfer agent — Class R | — | — | — | — | 1,156 | |||||||||||||||||
| Sub-transfer agent — Institutional Class | 65 | — | — | 4,215 | 9,235 | |||||||||||||||||
| Sub-transfer agent — Administrative Class | — | — | — | — | 6,385 | |||||||||||||||||
| Legal | 5,986 | 5,875 | 4,867 | 24,605 | 15,887 | |||||||||||||||||
| Trustees | 1,218 | 825 | 228 | 18,540 | 23,100 | |||||||||||||||||
| Audit and tax services | 16,773 | 16,948 | 16,022 | 23,736 | 25,064 | |||||||||||||||||
| Registration | 15,236 | 23,886 | 5,833 | 31,798 | 26,743 | |||||||||||||||||
| Custodian and accounting agent | 46,521 | 77,248 | 34,817 | 87,103 | 46,174 | |||||||||||||||||
| Shareholder communications | 4,459 | 6,657 | 4,093 | 26,916 | 30,132 | |||||||||||||||||
| Transfer agent | 3,032 | 3,717 | 2,624 | 19,431 | 22,137 | |||||||||||||||||
| Organizational | — | — | 2,040 | — | — | |||||||||||||||||
| Offering | — | — | 37,859 | — | — | |||||||||||||||||
| Recoupment | — | — | — | 939 | 12,521 | |||||||||||||||||
| Insurance | 2,845 | 2,756 | — | 6,440 | 8,183 | |||||||||||||||||
| Proxy | 118 | 98 | — | 12,475 | 10,309 | |||||||||||||||||
| Miscellaneous | 2,171 | 2,646 | 1,196 | 3,206 | 4,595 | |||||||||||||||||
Total Expenses | 182,669 | 157,138 | 121,093 | 2,654,653 | 1,516,690 | |||||||||||||||||
Less: Fee Waiver/Reimbursement from Investment Manager | (71,657 | ) | (133,367 | ) | (107,418 | ) | — | — | ||||||||||||||
Net Expenses | 111,012 | 23,771 | 13,675 | 2,654,653 | 1,516,690 | |||||||||||||||||
| Net Investment Income (Loss) | 238,216 | 107,918 | 24,564 | 1,571,823 | 12,094,289 | |||||||||||||||||
| 192 | Semiannual Report | | May 31, 2015 | | See accompanying Notes to Financial Statements |
Table of Contents
| AllianzGI International Growth (2) | AllianzGI International Small-Cap | AllianzGI Micro Cap | AllianzGI Multi-Asset Real Return | AllianzGI NFJ Emerging Markets Value | AllianzGI NFJ Global Dividend Value | AllianzGI NFJ International Small-Cap Value | ||||||||||||||||||||||
| $ | — | $ | — | $ | — | $ | — | $ | — | $ | — | $ | — | |||||||||||||||
| 26,377 | 743,831 | 38,301 | 29,045 | 188,727 | 916,206 | 300,362 | ||||||||||||||||||||||
| 5,412 | 275,739 | 10,068 | 3,045 | — | — | 22,111 | ||||||||||||||||||||||
| — | — | — | — | — | — | — | ||||||||||||||||||||||
| 31,789 | 1,019,570 | 48,369 | 32,090 | 188,727 | 916,206 | 322,473 | ||||||||||||||||||||||
| 8,173 | 500,537 | 257,904 | 22,671 | 44,588 | 192,015 | 77,833 | ||||||||||||||||||||||
| — | 5,068 | — | 448 | 245 | 22,090 | 5,141 | ||||||||||||||||||||||
| — | 104 | — | — | — | — | — | ||||||||||||||||||||||
| — | — | 1,114 | — | — | 907 | 20 | ||||||||||||||||||||||
| 9 | 8,169 | 6,774 | 179 | 167 | 15,058 | 3,392 | ||||||||||||||||||||||
| — | 1,689 | — | 149 | 82 | 7,363 | 1,714 | ||||||||||||||||||||||
| — | 2,737 | — | 30 | 1,621 | 4,454 | 1,758 | ||||||||||||||||||||||
| — | 104 | — | — | — | — | — | ||||||||||||||||||||||
| — | — | — | — | — | — | — | ||||||||||||||||||||||
| — | 570 | 1,878 | 32 | — | 1,725 | 847 | ||||||||||||||||||||||
| — | 144 | — | 22 | — | 1,746 | 482 | ||||||||||||||||||||||
| — | 100 | — | 5,527 | 4,665 | 623 | 5,607 | ||||||||||||||||||||||
| — | 44 | — | — | — | — | — | ||||||||||||||||||||||
| — | 6,782 | 19,155 | 93 | 716 | 1,259 | 557 | ||||||||||||||||||||||
| — | — | — | — | — | — | — | ||||||||||||||||||||||
| 3,920 | 7,051 | 5,197 | 9,295 | 4,864 | 6,706 | 4,074 | ||||||||||||||||||||||
| 231 | 5,074 | 2,316 | 336 | 514 | 3,550 | 1,048 | ||||||||||||||||||||||
| 10,766 | 18,479 | 17,281 | 15,520 | 18,522 | 16,739 | 14,664 | ||||||||||||||||||||||
| 3,011 | 22,353 | 14,552 | 24,453 | 23,698 | 18,270 | 18,281 | ||||||||||||||||||||||
| 30,924 | 100,679 | 33,714 | 44,232 | 107,966 | 60,979 | 88,451 | ||||||||||||||||||||||
| 1,742 | 7,018 | 6,136 | 5,881 | 5,888 | 7,154 | 5,605 | ||||||||||||||||||||||
| 2,157 | 9,770 | 5,539 | 2,694 | 3,404 | 8,524 | 4,354 | ||||||||||||||||||||||
| 4,623 | — | — | — | — | — | — | ||||||||||||||||||||||
| 21,475 | — | — | — | — | — | — | ||||||||||||||||||||||
| — | — | — | — | — | — | — | ||||||||||||||||||||||
| — | 3,924 | 3,138 | 2,605 | 2,680 | 3,575 | 2,915 | ||||||||||||||||||||||
| — | 937 | 560 | 40 | 81 | 765 | 310 | ||||||||||||||||||||||
| 1,441 | 3,469 | 1,992 | 2,506 | 2,001 | 2,735 | 2,384 | ||||||||||||||||||||||
| 88,472 | 704,802 | 377,250 | 136,713 | 221,702 | 376,237 | 239,437 | ||||||||||||||||||||||
| (78,757 | ) | (69,913 | ) | (57,356 | ) | (117,726 | ) | (161,438 | ) | (95,448 | ) | (128,591 | ) | |||||||||||||||
| 9,715 | 634,889 | 319,894 | 18,987 | 60,264 | 280,789 | 110,846 | ||||||||||||||||||||||
| 22,074 | 384,681 | (271,525 | ) | 13,103 | 128,463 | 635,417 | 211,627 | |||||||||||||||||||||
| See accompanying Notes to Financial Statements | | May 31, 2015 | | Semiannual Report | 193 |
Table of Contents
Statements of Operations (cont’d)
Six Months ended May 31, 2015 (Unaudited)
| AllianzGI Global Fundamental Strategy | AllianzGI Global Managed Volatility | AllianzGI Global Sustainability (1) | AllianzGI Global Water | AllianzGI High Yield Bond | ||||||||||||||||||
| Realized and Change in Unrealized Gain (Loss): | ||||||||||||||||||||||
| Net realized gain (loss) on: | ||||||||||||||||||||||
Investments | $ | 269,074 | $ | 1,108,947 | $ | (13,855 | ) | $ | 7,185,905 | $ | (3,283,373 | ) | ||||||||||
Investments in Affiliates | 7,108 | — | (113 | ) | (1,236,796 | ) | — | |||||||||||||||
Futures contracts | (47,374 | ) | — | — | — | — | ||||||||||||||||
Options written | 6,830 | — | — | — | — | |||||||||||||||||
Foreign currency transactions | 318,988 | (8,328 | ) | (5,335 | ) | (200,340 | ) | — | ||||||||||||||
| Net capital gain distributions received from underlying Affiliated funds | — | — | — | — | — | |||||||||||||||||
| Net change in unrealized appreciation/depreciation of: | ||||||||||||||||||||||
Investments | (674,905 | ) | (1,058,848 | ) | 114,695 | 7,620,377 | 339,784 | |||||||||||||||
Investments in Affiliates | 57,689 | — | 681 | 543,429 | — | |||||||||||||||||
Futures contracts | 21,187 | — | — | — | — | |||||||||||||||||
Options written | 36,589 | — | — | — | — | |||||||||||||||||
Foreign currency transactions | (13,170 | ) | 1,613 | (57 | ) | (10,275 | ) | — | ||||||||||||||
| Net realized and change in unrealized gain (loss) | (17,984 | ) | 43,384 | 96,016 | 13,902,300 | (2,943,589 | ) | |||||||||||||||
| Net Increase (Decrease) in Net Assets Resulting from Investment Operations | $ | 220,232 | $ | 151,302 | $ | 120,580 | $ | 15,474,123 | $ | 9,150,700 | ||||||||||||
| * Foreign withholding taxes | $ | 18,875 | $ | 3,545 | $ | 2,479 | $ | 381,852 | $ | — | ||||||||||||
| (1) | Commencement of operations, December 9, 2014. |
| (2) | Commencement of operations, February 2, 2015. |
| 194 | Semiannual Report | | May 31, 2015 | | See accompanying Notes to Financial Statements |
Table of Contents
| AllianzGI International Growth (2) | AllianzGI International Small-Cap | AllianzGI Micro Cap | AllianzGI Multi-Asset Real Return | AllianzGI NFJ Emerging Markets Value | AllianzGI NFJ Global Dividend Value | AllianzGI NFJ International Small-Cap Value | ||||||||||||||||||||||
| $ | (37 | ) | $ | 3,821,284 | $ | 1,586,548 | $ | (41,706 | ) | $ | (81,707 | ) | $ | 693,431 | $ | 625,627 | ||||||||||||
| — | 136,804 | 76,131 | (19,369 | ) | — | — | (30,514 | ) | ||||||||||||||||||||
| — | — | — | 15,569 | — | — | — | ||||||||||||||||||||||
| — | — | — | — | — | — | — | ||||||||||||||||||||||
| (6,614 | ) | (55,276 | ) | — | (982 | ) | (9,728 | ) | (46,356 | ) | 22,525 | |||||||||||||||||
| — | — | — | 3,520 | — | — | — | ||||||||||||||||||||||
| 150,347 | 8,125,617 | 2,584,959 | 36,649 | 271,431 | (1,335,827 | ) | 801,180 | |||||||||||||||||||||
| 28,639 | 1,708,749 | 324,849 | (95,651 | ) | — | — | (9,082 | ) | ||||||||||||||||||||
| — | — | — | 1,934 | — | — | — | ||||||||||||||||||||||
| — | — | — | — | — | — | — | ||||||||||||||||||||||
| (23 | ) | 3,626 | — | (157 | ) | (875 | ) | 963 | 4,823 | |||||||||||||||||||
| 172,312 | 13,740,804 | 4,572,487 | (100,193 | ) | 179,121 | (687,789 | ) | 1,414,559 | ||||||||||||||||||||
| $ | 194,386 | $ | 14,125,485 | $ | 4,300,962 | $ | (87,090 | ) | $ | 307,584 | $ | (52,372 | ) | $ | 1,626,186 | |||||||||||||
| $ | 2,986 | $ | 111,682 | $ | — | $ | 1,023 | $ | 19,858 | $ | 63,917 | $ | 25,345 | |||||||||||||||
| See accompanying Notes to Financial Statements | | May 31, 2015 | | Semiannual Report | 195 |
Table of Contents
Statements of Operations (cont’d)
Six Months ended May 31, 2015 (Unaudited)
| AllianzGI NFJ International Value II | AllianzGI Short Duration High Income | AllianzGI Structured Return | AllianzGI U.S. Equity Hedged | |||||||||||||
| Investment Income: | ||||||||||||||||
| Interest | $ | — | $ | 19,147,692 | $ | — | $ | — | ||||||||
| Dividends, net of foreign withholding taxes* | 824,974 | — | 245,732 | 151,063 | ||||||||||||
| Dividends from investments in Affiliates | 14,080 | — | — | — | ||||||||||||
| Miscellaneous | — | 166,039 | — | 6 | ||||||||||||
Total Investment Income | 839,054 | 19,313,731 | 245,732 | 151,069 | ||||||||||||
| Expenses: | ||||||||||||||||
| Investment management | 178,447 | 1,736,294 | 80,203 | 56,020 | ||||||||||||
| Distribution — Class C | 534 | 110,386 | 1,730 | 693 | ||||||||||||
| Distribution — Class R | — | — | — | — | ||||||||||||
| Administrative servicing — Class P | 213 | 110,813 | — | — | ||||||||||||
| Servicing — Class A | 218 | 188,870 | 3,994 | 1,864 | ||||||||||||
| Servicing — Class C | 178 | 110,386 | 577 | 231 | ||||||||||||
| Servicing — Class D | 17 | 35,848 | 8,343 | 1,426 | ||||||||||||
| Servicing — Class R | — | — | — | — | ||||||||||||
| Sub-transfer agent — Class A | 38 | 41,008 | 1,681 | 405 | ||||||||||||
| Sub-transfer agent — Class C | 16 | 21,346 | 35 | 72 | ||||||||||||
| Sub-transfer agent — Class D | — | 22,335 | 2,733 | 5,658 | ||||||||||||
| Sub-transfer agent — Class R | — | — | — | — | ||||||||||||
| Sub-transfer agent — Institutional Class | 47 | 13,800 | 503 | 352 | ||||||||||||
| Legal | 2,105 | 22,757 | 11,379 | 6,823 | ||||||||||||
| Trustees | 2,206 | 40,515 | 1,292 | 774 | ||||||||||||
| Audit and tax services | 18,023 | 18,269 | 16,762 | 14,602 | ||||||||||||
| Registration | 32,252 | 39,219 | 33,632 | 31,189 | ||||||||||||
| Custodian and accounting agent | 60,170 | 59,776 | 54,310 | 55,410 | ||||||||||||
| Shareholder communications | 5,969 | 35,622 | 7,357 | 6,034 | ||||||||||||
| Transfer agent | 3,592 | 44,131 | 2,718 | 2,774 | ||||||||||||
| Excise tax | 1,145 | — | 360 | 1,440 | ||||||||||||
| Recoupment | — | 36,827 | — | — | ||||||||||||
| Insurance | 3,080 | 10,779 | 2,779 | 2,637 | ||||||||||||
| Proxy | 180 | 15,338 | 384 | 94 | ||||||||||||
| Miscellaneous | 2,635 | 3,798 | 2,860 | 2,851 | ||||||||||||
Total Expenses | 311,065 | 2,718,117 | 233,632 | 191,349 | ||||||||||||
Less: Fee Waiver/Reimbursement from Investment Manager | (96,647 | ) | (26,068 | ) | (97,877 | ) | (105,554 | ) | ||||||||
Net Expenses | 214,418 | 2,692,049 | 135,755 | 85,795 | ||||||||||||
| Net Investment Income (Loss) | 624,636 | 16,621,682 | 109,977 | 65,274 | ||||||||||||
| 196 | Semiannual Report | | May 31, 2015 | | See accompanying Notes to Financial Statements |
Table of Contents
| AllianzGI U.S. Small-Cap Growth | AllianzGI Ultra Micro Cap | |||||||
| $ | — | $ | — | |||||
| 119,593 | 187,836 | |||||||
| 1,840 | 17,552 | |||||||
| — | — | |||||||
| 121,433 | 205,388 | |||||||
| 176,530 | 800,932 | |||||||
| 2,443 | — | |||||||
| 34 | — | |||||||
| 117 | 4,651 | |||||||
| 4,263 | 62,567 | |||||||
| 814 | — | |||||||
| 151 | — | |||||||
| 34 | — | |||||||
| 169 | 32,273 | |||||||
| 124 | — | |||||||
| 12 | — | |||||||
| 6 | — | |||||||
| 3,212 | 11,808 | |||||||
| 6,928 | 6,973 | |||||||
| 2,092 | 6,465 | |||||||
| 13,905 | 17,281 | |||||||
| 27,828 | 14,402 | |||||||
| 40,999 | 34,368 | |||||||
| 8,425 | 12,733 | |||||||
| 7,457 | 9,706 | |||||||
| — | — | |||||||
| — | 57,807 | |||||||
| 3,084 | 4,155 | |||||||
| 271 | 3,525 | |||||||
| 2,464 | 2,213 | |||||||
| 301,362 | 1,081,859 | |||||||
| (65,755 | ) | — | ||||||
| 235,607 | 1,081,859 | |||||||
| (114,174 | ) | (876,471 | ) | |||||
| See accompanying Notes to Financial Statements | | May 31, 2015 | | Semiannual Report | 197 |
Table of Contents
Statements of Operations (cont���d)
Six Months ended May 31, 2015 (Unaudited)
| AllianzGI NFJ International Value II | AllianzGI Short Duration High Income | AllianzGI Structured Return | AllianzGI U.S. Equity Hedged | |||||||||||||
| Realized and Change in Unrealized Gain (Loss): | ||||||||||||||||
| Net realized gain (loss) on: | ||||||||||||||||
Investments | $ | (679,984 | ) | $ | (3,196,035 | ) | $ | (946,297 | ) | $ | 2,146,278 | |||||
Investments in Affiliates | — | — | — | — | ||||||||||||
Options written | — | — | 1,006,919 | 182,675 | ||||||||||||
Foreign currency transactions | (14,203 | ) | — | — | — | |||||||||||
| Net change in unrealized appreciation/depreciation of: | ||||||||||||||||
Investments | 2,727,733 | 9,188,711 | 569,070 | (2,312,277 | ) | |||||||||||
Investments in Affiliates | (228,080 | ) | — | — | — | |||||||||||
Options written | — | — | 260,316 | 18,587 | ||||||||||||
Foreign currency transactions | 36 | — | — | — | ||||||||||||
| Net realized and change in unrealized gain | 1,805,502 | 5,992,676 | 890,008 | 35,263 | ||||||||||||
| Net Increase in Net Assets Resulting from Investment Operations | $ | 2,430,138 | $ | 22,614,358 | $ | 999,985 | $ | 100,537 | ||||||||
| * Foreign withholding taxes | $ | 85,948 | $ | — | $ | — | $ | — | ||||||||
| 198 | Semiannual Report | | May 31, 2015 | | See accompanying Notes to Financial Statements |
Table of Contents
| AllianzGI U.S. Small-Cap Growth | AllianzGI Ultra Micro Cap | |||||||
| $ | 2,269,681 | $ | 3,609,749 | |||||
| (109,087 | ) | 374,257 | ||||||
| — | — | |||||||
| — | — | |||||||
| 654,089 | 4,767,769 | |||||||
| (205,807 | ) | 528,446 | ||||||
| — | — | |||||||
| — | — | |||||||
| 2,608,876 | 9,280,221 | |||||||
| $ | 2,494,702 | $ | 8,403,750 | |||||
| $ | 733 | $ | — | |||||
| See accompanying Notes to Financial Statements | | May 31, 2015 | | Semiannual Report | 199 |
Table of Contents
Statements of Changes in Net Assets
| AllianzGI Retirement 2015 | AllianzGI Retirement 2020 | |||||||||||||||||
| Six months ended May 31, 2015 (Unaudited) | Year ended November 30, 2014 | Six months ended May 31, 2015 (Unaudited) | Year ended November 30, 2014 | |||||||||||||||
| Increase (Decrease) in Net Assets from: | ||||||||||||||||||
Investment Operations: | ||||||||||||||||||
| Net investment income | $ | 679,527 | $ | 692,615 | $ | 1,169,013 | $ | 1,176,208 | ||||||||||
| Net realized gain (loss) | 297,121 | 739,814 | (120,012 | ) | 675,957 | |||||||||||||
| Net change in unrealized appreciation/depreciation | (721,964 | ) | (194,407 | ) | (871,473 | ) | 93,961 | |||||||||||
| Net increase in net assets resulting from investment operations | 254,684 | 1,238,022 | 177,528 | 1,946,126 | ||||||||||||||
| Dividends and Distributions to Shareholders from: | ||||||||||||||||||
| Net investment income: | ||||||||||||||||||
Class A | (335,648 | ) | (202,351 | ) | (975,546 | ) | (376,596 | ) | ||||||||||
Class C | (18,133 | ) | (14,041 | ) | (8,972 | ) | (4,276 | ) | ||||||||||
Class D | (1,671 | ) | (2,326 | ) | (6,522 | ) | (5,007 | ) | ||||||||||
Class R | (4,383 | ) | (1,465 | ) | (25,688 | ) | (14,740 | ) | ||||||||||
Class P | (170,923 | ) | (84,782 | ) | (470,625 | ) | (154,714 | ) | ||||||||||
Class R6 | (410,232 | ) | (178,596 | ) | (174,103 | ) | (160,647 | ) | ||||||||||
Administrative Class | (83,769 | ) | (73,602 | ) | (209,026 | ) | (138,300 | ) | ||||||||||
| Net realized capital gains: | ||||||||||||||||||
Class A | (135,070 | ) | — | (106,444 | ) | — | ||||||||||||
Class C | (11,810 | ) | — | (1,385 | ) | — | ||||||||||||
Class D | (829 | ) | — | (796 | ) | — | ||||||||||||
Class R | (2,103 | ) | — | (3,288 | ) | — | ||||||||||||
Class P | (62,912 | ) | — | (47,542 | ) | — | ||||||||||||
Class R6 | (147,028 | ) | — | (17,182 | ) | — | ||||||||||||
Administrative Class | (34,472 | ) | — | (23,125 | ) | — | ||||||||||||
| Total dividends and distributions to shareholders | (1,418,983 | ) | (557,163 | ) | (2,070,244 | ) | (854,280 | ) | ||||||||||
| Fund Share Transactions: | ||||||||||||||||||
| Net proceeds from the sale of shares | 9,712,185 | 29,495,264 | 16,618,663 | 39,564,146 | ||||||||||||||
| Issued in reinvestment of dividends and distributions | 1,417,374 | 556,499 | 2,069,603 | 854,232 | ||||||||||||||
| Cost of shares redeemed | (15,833,918 | ) | (18,462,269 | ) | (15,460,311 | ) | (12,114,831 | ) | ||||||||||
| Net increase (decrease) from Fund share transactions | (4,704,359 | ) | 11,589,494 | 3,227,955 | 28,303,547 | |||||||||||||
| Total increase (decrease) in net assets | (5,868,658 | ) | 12,270,353 | 1,335,239 | 29,395,393 | |||||||||||||
| Net Assets: | ||||||||||||||||||
| Beginning of period | 34,279,314 | 22,008,961 | 62,586,863 | 33,191,470 | ||||||||||||||
| End of period* | $ | 28,410,656 | $ | 34,279,314 | $ | 63,922,102 | $ | 62,586,863 | ||||||||||
* Including undistributed net investment income of: | $ | 281,961 | $ | 627,193 | $ | 360,365 | $ | 1,061,834 | ||||||||||
| 200 | Semiannual Report | | May 31, 2015 | | See accompanying Notes to Financial Statements |
Table of Contents
| AllianzGI Retirement 2025 | AllianzGI Retirement 2030 | AllianzGI Retirement 2035 | ||||||||||||||||||||||
| Six months ended May 31, 2015 (Unaudited) | Year ended November 30, 2014 | Six months ended May 31, 2015 (Unaudited) | Year ended November 30, 2014 | Six months ended May 31, 2015 (Unaudited) | Year ended November 30, 2014 | |||||||||||||||||||
| $ | 1,261,810 | $ | 1,286,786 | $ | 1,310,039 | $ | 1,406,560 | $ | 1,075,960 | $ | 1,097,824 | |||||||||||||
| 175,067 | 434,739 | 449,352 | 1,199,068 | 519,886 | 910,969 | |||||||||||||||||||
| (1,013,415 | ) | 622,984 | (1,262,347 | ) | (86,428 | ) | (1,018,010 | ) | 179,591 | |||||||||||||||
| 423,462 | 2,344,509 | 497,044 | 2,519,200 | 577,836 | 2,188,384 | |||||||||||||||||||
| (914,877 | ) | (426,739 | ) | (832,150 | ) | (428,196 | ) | (688,726 | ) | (300,338 | ) | |||||||||||||
| — | — | (15,900 | ) | (10,033 | ) | — | — | |||||||||||||||||
| — | — | (19,313 | ) | (13,222 | ) | — | — | |||||||||||||||||
| (24,873 | ) | (18,248 | ) | (39,434 | ) | (21,599 | ) | (32,992 | ) | (16,445 | ) | |||||||||||||
| (545,013 | ) | (80,183 | ) | (652,591 | ) | (184,881 | ) | (607,188 | ) | (113,126 | ) | |||||||||||||
| (172,571 | ) | (108,975 | ) | (313,706 | ) | (258,616 | ) | (133,916 | ) | (137,282 | ) | |||||||||||||
| (348,778 | ) | (200,811 | ) | (314,079 | ) | (200,325 | ) | (388,586 | ) | (224,389 | ) | |||||||||||||
| — | — | (290,155 | ) | — | (173,568 | ) | — | |||||||||||||||||
| — | — | (7,640 | ) | — | — | — | ||||||||||||||||||
| — | — | (7,109 | ) | — | — | — | ||||||||||||||||||
| — | — | (15,563 | ) | — | (9,405 | ) | — | |||||||||||||||||
| — | — | (210,887 | ) | — | (143,165 | ) | — | |||||||||||||||||
| — | — | (99,015 | ) | — | (30,957 | ) | — | |||||||||||||||||
| — | — | (108,740 | ) | — | (98,543 | ) | — | |||||||||||||||||
| (2,006,112 | ) | (834,956 | ) | (2,926,282 | ) | (1,116,872 | ) | (2,307,046 | ) | (791,580 | ) | |||||||||||||
| 20,669,619 | 41,120,713 | 20,405,106 | 38,677,395 | 19,050,452 | 29,581,674 | |||||||||||||||||||
| 1,997,280 | 829,680 | 2,910,216 | 1,113,004 | 2,300,803 | 788,966 | |||||||||||||||||||
| (17,366,992 | ) | (12,163,443 | ) | (17,822,455 | ) | (17,086,760 | ) | (18,428,496 | ) | (7,595,095 | ) | |||||||||||||
| 5,299,907 | 29,786,950 | 5,492,867 | 22,703,639 | 2,922,759 | 22,775,545 | |||||||||||||||||||
| 3,717,257 | 31,296,503 | 3,063,629 | 24,105,967 | 1,193,549 | 24,172,349 | |||||||||||||||||||
| 65,107,535 | 33,811,032 | 64,305,460 | 40,199,493 | 53,682,044 | 29,509,695 | |||||||||||||||||||
| $ | 68,824,792 | $ | 65,107,535 | $ | 67,369,089 | $ | 64,305,460 | $ | 54,875,593 | $ | 53,682,044 | |||||||||||||
| $ | 409,870 | $ | 1,154,172 | $ | 324,978 | $ | 1,202,112 | $ | 152,555 | $ | 928,003 | |||||||||||||
| See accompanying Notes to Financial Statements | | May 31, 2015 | | Semiannual Report | 201 |
Table of Contents
Statements of Changes in Net Assets (cont’d)
| AllianzGI Retirement 2040 | AllianzGI Retirement 2045 | |||||||||||||||||
| Six months ended May 31, 2015 (Unaudited) | Year ended November 30, 2014 | Six months ended May 31, 2015 (Unaudited) | Year ended November 30, 2014 | |||||||||||||||
| Increase (Decrease) in Net Assets from: | ||||||||||||||||||
Investment Operations: | ||||||||||||||||||
| Net investment income | $ | 852,584 | $ | 955,485 | $ | 547,118 | $ | 517,862 | ||||||||||
| Net realized gain | 949,794 | 1,285,907 | 585,965 | 526,086 | ||||||||||||||
| Net change in unrealized appreciation/depreciation | (1,261,318 | ) | (213,031 | ) | (635,905 | ) | 187,541 | |||||||||||
Net increase in net assets resulting from investment operations | 541,060 | 2,028,361 | 497,178 | 1,231,489 | ||||||||||||||
| Dividends and Distributions to Shareholders from: | ||||||||||||||||||
| Net investment income: | ||||||||||||||||||
Class A | (634,069 | ) | (299,358 | ) | (383,760 | ) | (181,709 | ) | ||||||||||
Class C | (6,919 | ) | (4,849 | ) | — | — | ||||||||||||
Class D | (7,206 | ) | (4,271 | ) | — | — | ||||||||||||
Class R | (45,420 | ) | (22,265 | ) | (15,841 | ) | (6,954 | ) | ||||||||||
Class P | (448,321 | ) | (113,845 | ) | (378,055 | ) | (56,921 | ) | ||||||||||
Class R6 | (349,785 | ) | (262,190 | ) | (199,794 | ) | (115,794 | ) | ||||||||||
Administrative Class | (197,536 | ) | (116,327 | ) | (67,503 | ) | (36,633 | ) | ||||||||||
| Net realized capital gains: | ||||||||||||||||||
Class A | (396,764 | ) | (10,167 | ) | (129,553 | ) | (14,940 | ) | ||||||||||
Class C | (6,074 | ) | (190 | ) | — | — | ||||||||||||
Class D | (4,720 | ) | (119 | ) | — | — | ||||||||||||
Class R | (31,620 | ) | (827 | ) | (5,852 | ) | (658 | ) | ||||||||||
Class P | (262,971 | ) | (7,225 | ) | (119,406 | ) | (13,700 | ) | ||||||||||
Class R6 | (201,138 | ) | (4,534 | ) | (62,179 | ) | (8,805 | ) | ||||||||||
Administrative Class | (123,496 | ) | (3,144 | ) | (22,696 | ) | (2,638 | ) | ||||||||||
| Total dividends and distributions to shareholders | (2,716,039 | ) | (849,311 | ) | (1,384,639 | ) | (438,752 | ) | ||||||||||
| Fund Share Transactions: | ||||||||||||||||||
| Net proceeds from the sale of shares | 12,197,171 | 27,176,932 | 5,226,675 | 15,099,268 | ||||||||||||||
| Issued in reinvestment of dividends and distributions | 2,705,665 | 847,385 | 1,383,981 | 438,561 | ||||||||||||||
| Cost of shares redeemed | (12,393,967 | ) | (12,583,051 | ) | (7,960,308 | ) | (2,852,267 | ) | ||||||||||
| Net increase (decrease) from Fund share transactions | 2,508,869 | 15,441,266 | (1,349,652 | ) | 12,685,562 | |||||||||||||
| Total increase (decrease) in net assets | 333,890 | 16,620,316 | (2,237,113 | ) | 13,478,299 | |||||||||||||
| Net Assets: | ||||||||||||||||||
| Beginning of period | 43,543,217 | 26,922,901 | 26,562,354 | 13,084,055 | ||||||||||||||
| End of period* | $ | 43,877,107 | $ | 43,543,217 | $ | 24,325,241 | $ | 26,562,354 | ||||||||||
* Including undistributed (dividends in excess of) net investment income of: | $ | (68,088 | ) | $ | 768,584 | $ | (65,598 | ) | $ | 432,237 | ||||||||
| 202 | Semiannual Report | | May 31, 2015 | | See accompanying Notes to Financial Statements |
Table of Contents
| AllianzGI Retirement 2050 | AllianzGI Retirement 2055 | AllianzGI Retirement Income | ||||||||||||||||||||||
| Six months ended May 31, 2015 (Unaudited) | Year ended November 30, 2014 | Six months ended May 31, 2015 (Unaudited) | Year ended November 30, 2014 | Six months ended May 31, 2015 (Unaudited) | Year ended November 30, 2014 | |||||||||||||||||||
| $ | 435,208 | $ | 439,654 | $ | 151,745 | $ | 156,879 | $ | 510,151 | $ | 677,809 | |||||||||||||
| 798,651 | 746,452 | 287,842 | 245,428 | 507,540 | 855,090 | |||||||||||||||||||
| (838,178 | ) | (183,686 | ) | (289,648 | ) | (84,342 | ) | (854,799 | ) | (257,664 | ) | |||||||||||||
| 395,681 | 1,002,420 | 149,939 | 317,965 | 162,892 | 1,275,235 | |||||||||||||||||||
| (192,203 | ) | (68,062 | ) | (45,481 | ) | (13,942 | ) | (154,777 | ) | (99,066 | ) | |||||||||||||
| (4,538 | ) | (2,510 | ) | — | — | (81,258 | ) | (45,087 | ) | |||||||||||||||
| (8,207 | ) | (8,335 | ) | — | — | (23,678 | ) | (16,960 | ) | |||||||||||||||
| (21,154 | ) | (10,670 | ) | (5,539 | ) | (1,668 | ) | (4,750 | ) | (2,510 | ) | |||||||||||||
| (271,151 | ) | (37,456 | ) | (45,785 | ) | (6,547 | ) | (145,959 | ) | (151,273 | ) | |||||||||||||
| (324,615 | ) | (245,688 | ) | (213,835 | ) | (118,426 | ) | (234,719 | ) | (215,784 | ) | |||||||||||||
| (47,447 | ) | (30,843 | ) | (15,068 | ) | (5,836 | ) | (35,871 | ) | (37,092 | ) | |||||||||||||
| (129,289 | ) | (25,014 | ) | (24,465 | ) | (7,419 | ) | (150,834 | ) | — | ||||||||||||||
| (3,775 | ) | (823 | ) | — | — | (95,583 | ) | — | ||||||||||||||||
| (6,029 | ) | (1,745 | ) | — | — | (23,950 | ) | — | ||||||||||||||||
| (15,822 | ) | (3,662 | ) | (3,224 | ) | (1,123 | ) | (5,023 | ) | — | ||||||||||||||
| (172,288 | ) | (33,116 | ) | (23,661 | ) | (9,316 | ) | (125,434 | ) | — | ||||||||||||||
| (204,365 | ) | (51,300 | ) | (109,285 | ) | (51,679 | ) | (215,863 | ) | — | ||||||||||||||
| (32,173 | ) | (6,978 | ) | (8,161 | ) | (3,149 | ) | (47,564 | ) | — | ||||||||||||||
| (1,433,056 | ) | (526,202 | ) | (494,504 | ) | (219,105 | ) | (1,345,263 | ) | (567,772 | ) | |||||||||||||
| 6,448,896 | 12,294,801 | 1,454,059 | 2,861,581 | 4,535,768 | 13,555,798 | |||||||||||||||||||
| 1,430,821 | 525,997 | 493,806 | 219,099 | 1,344,896 | 567,659 | |||||||||||||||||||
| (7,530,323 | ) | (5,298,045 | ) | (1,006,550 | ) | (349,327 | ) | (9,018,947 | ) | (11,773,274 | ) | |||||||||||||
| 349,394 | 7,522,753 | 941,315 | 2,731,353 | (3,138,283 | ) | 2,350,183 | ||||||||||||||||||
| (687,981 | ) | 7,998,971 | 596,750 | 2,830,213 | (4,320,654 | ) | 3,057,646 | |||||||||||||||||
| 21,487,928 | 13,488,957 | 7,885,729 | 5,055,516 | 29,380,593 | 26,322,947 | |||||||||||||||||||
| $ | 20,799,947 | $ | 21,487,928 | $ | 8,482,479 | $ | 7,885,729 | $ | 25,059,939 | $ | 29,380,593 | |||||||||||||
| $ | (80,847 | ) | $ | 353,260 | $ | (43,389 | ) | $ | 130,574 | $ | 27,443 | $ | 198,304 | |||||||||||
| See accompanying Notes to Financial Statements | | May 31, 2015 | | Semiannual Report | 203 |
Table of Contents
Statements of Changes in Net Assets (cont’d)
| AllianzGI Global Allocation | AllianzGI Global Dynamic Allocation | |||||||||||||||||
| Six months ended May 31, 2015 (Unaudited) | Year ended November 30, 2014 | Six months ended | Year ended November 30, 2014 | |||||||||||||||
| Increase (Decrease) in Net Assets from: | ||||||||||||||||||
Investment Operations: | ||||||||||||||||||
| Net investment income | $ | 3,574,207 | $ | 4,997,925 | $ | 123,002 | $ | 124,498 | ||||||||||
| Net realized gain | 14,108,589 | 11,590,534 | 460,241 | 609,442 | ||||||||||||||
| Net change in unrealized appreciation/depreciation | (13,139,262 | ) | (7,044,237 | ) | (443,422 | ) | (515,792 | ) | ||||||||||
Net increase in net assets resulting from investment operations | 4,543,534 | 9,544,222 | 139,821 | 218,148 | ||||||||||||||
| Dividends and Distributions to Shareholders from: | ||||||||||||||||||
| Net investment income: | ||||||||||||||||||
Class A | (1,957,987 | ) | (1,515,468 | ) | (37,530 | ) | (36,024 | ) | ||||||||||
Class B | (40,110 | ) | (31,583 | ) | — | — | ||||||||||||
Class C | (1,641,882 | ) | (941,983 | ) | (40,272 | ) | (26,791 | ) | ||||||||||
Class D | (71,006 | ) | (34,957 | ) | (4,316 | ) | (10,657 | ) | ||||||||||
Class R | (530 | ) | (351 | ) | (5,287 | ) | (3,112 | ) | ||||||||||
Class P | (64,231 | ) | (48,927 | ) | (1,681 | ) | (1,171 | ) | ||||||||||
Institutional Class | (2,464,741 | ) | (1,801,068 | ) | (134,390 | ) | (92,056 | ) | ||||||||||
Class R6 | — | — | — | — | ||||||||||||||
Administrative Class | (739 | ) | (588 | ) | (994 | ) | (523 | ) | ||||||||||
| Net realized capital gains: | ||||||||||||||||||
Class A | (710,721 | ) | — | (96,863 | ) | (155,116 | ) | |||||||||||
Class B | (17,867 | ) | — | — | — | |||||||||||||
Class C | (668,774 | ) | — | (129,299 | ) | (163,735 | ) | |||||||||||
Class D | (24,515 | ) | — | (11,895 | ) | (44,224 | ) | |||||||||||
Class R | (192 | ) | — | (14,193 | ) | (13,397 | ) | |||||||||||
Class P | (21,906 | ) | — | (4,067 | ) | (4,798 | ) | |||||||||||
Institutional Class | (826,712 | ) | — | (317,122 | ) | (378,173 | ) | |||||||||||
Administrative Class | (265 | ) | — | (2,452 | ) | (2,270 | ) | |||||||||||
| Total dividends and distributions to shareholders | (8,512,178 | ) | (4,374,925 | ) | (800,361 | ) | (932,047 | ) | ||||||||||
| Fund Share Transactions: | ||||||||||||||||||
| Net proceeds from the sale of shares | 16,634,010 | 27,705,749 | 2,187,301 | 898,223 | ||||||||||||||
| Issued in reinvestment of dividends and distributions | 7,662,357 | 3,945,498 | 800,361 | 930,946 | ||||||||||||||
| Cost of shares redeemed | (26,842,016 | ) | (40,895,649 | ) | (503,564 | ) | (1,655,346 | ) | ||||||||||
| Net increase (decrease) from Fund share transactions | (2,545,649 | ) | (9,244,402 | ) | 2,484,098 | 173,823 | ||||||||||||
| Total increase (decrease) in net assets | (6,514,293 | ) | (4,075,105 | ) | 1,823,558 | (540,076 | ) | |||||||||||
| Net Assets: | ||||||||||||||||||
| Beginning of period | 208,984,440 | 213,059,545 | 6,139,634 | 6,679,710 | ||||||||||||||
| End of period* | $ | 202,470,147 | $ | 208,984,440 | $ | 7,963,192 | $ | 6,139,634 | ||||||||||
* Including undistributed (dividends in excess of) net investment income of: | $ | (1,185,498 | ) | $ | 1,481,521 | $ | (19,730 | ) | $ | 81,738 | ||||||||
| ** | Commencement of operations. |
| 204 | Semiannual Report | | May 31, 2015 | | See accompanying Notes to Financial Statements |
Table of Contents
| AllianzGI Global Megatrends | AllianzGI Behavioral Advantage Large Cap | AllianzGI Best Styles Emerging Markets Equity | ||||||||||||||
| Period from February 2, 2015** through May 31, 2015 (Unaudited) | Six months ended May 31, 2015 (Unaudited) | Year ended November 30, 2014 | Period from December 9, 2014** through May 31, 2015 (Unaudited) | |||||||||||||
| $ | 1,116 | $ | 405,137 | $ | 981,337 | $ | 46,572 | |||||||||
| — | 10,471,101 | 6,048,044 | 129,062 | |||||||||||||
| 213,015 | (8,801,756 | ) | 3,453,370 | 88,781 | ||||||||||||
| 214,131 | 2,074,482 | 10,482,751 | 264,415 | |||||||||||||
| — | (151,343 | ) | (90,468 | ) | — | |||||||||||
| — | — | — | — | |||||||||||||
| — | (7,028 | ) | (1,785 | ) | — | |||||||||||
| — | (33,727 | ) | (454 | ) | — | |||||||||||
| — | — | — | — | |||||||||||||
| — | (2,311 | ) | (111 | ) | (2 | ) | ||||||||||
| — | (1,119,347 | ) | (412,898 | ) | (3 | ) | ||||||||||
| — | — | — | (1,617 | ) | ||||||||||||
| — | — | — | — | |||||||||||||
| — | (2,518,110 | ) | (306,379 | ) | — | |||||||||||
| — | — | — | — | |||||||||||||
| — | (208,608 | ) | (8,829 | ) | — | |||||||||||
| — | (588,302 | ) | (6,517 | ) | — | |||||||||||
| — | — | — | — | |||||||||||||
| — | (27,964 | ) | (603 | ) | — | |||||||||||
| — | (13,174,278 | ) | (1,759,764 | ) | — | |||||||||||
| — | — | — | — | |||||||||||||
| — | (17,831,018 | ) | (2,587,808 | ) | (1,622 | ) | ||||||||||
| — | 10,417,726 | 49,243,234 | 565,792 | |||||||||||||
| — | 15,396,960 | 2,233,422 | 1,622 | |||||||||||||
| — | (51,402,072 | ) | (31,003,981 | ) | — | |||||||||||
| — | (25,587,386 | ) | 20,472,675 | 567,414 | ||||||||||||
| 214,131 | (41,343,922 | ) | 28,367,618 | 830,207 | �� | |||||||||||
| 3,020,000 | 85,659,454 | 57,291,836 | 5,020,000 | |||||||||||||
| $ | 3,234,131 | $ | 44,315,532 | $ | 85,659,454 | $ | 5,850,207 | |||||||||
| $ | 1,116 | $ | 42,798 | $ | 951,417 | $ | 44,950 | |||||||||
| See accompanying Notes to Financial Statements | | May 31, 2015 | | Semiannual Report | 205 |
Table of Contents
Statements of Changes in Net Assets (cont’d)
| AllianzGI Best Styles Global Equity | AllianzGI Best Styles International Equity | |||||||||||||
| Six months ended May 31, 2015 (Unaudited) | Period from December 2, 2013** through November 30, 2014 | Period from December 9, 2014** through May 31, 2015 (Unaudited) | ||||||||||||
| Increase (Decrease) in Net Assets from: | ||||||||||||||
Investment Operations: | ||||||||||||||
| Net investment income (loss) | $ | 1,145,231 | $ | 785,022 | $ | 618,755 | ||||||||
| Net realized gain (loss) | (241,525 | ) | 843,623 | 289,005 | ||||||||||
| Net change in unrealized appreciation/depreciation | 4,856,879 | 2,253,182 | 1,437,522 | |||||||||||
Net increase in net assets resulting from investment operations | 5,760,585 | 3,881,827 | 2,345,282 | |||||||||||
| Dividends and Distributions to Shareholders from: | ||||||||||||||
| Net investment income: | ||||||||||||||
Class A | (265 | ) | — | — | ||||||||||
Class C | — | — | — | |||||||||||
Class D | — | — | — | |||||||||||
Class R | — | — | — | |||||||||||
Class P | — | — | (7 | ) | ||||||||||
Institutional Class | (273 | ) | — | (7 | ) | |||||||||
Class R6 | (813,579 | ) | — | (3,930 | ) | |||||||||
Administrative Class | — | — | — | |||||||||||
| Net realized capital gains: | ||||||||||||||
Class A | (244 | ) | — | — | ||||||||||
Class C | — | — | — | |||||||||||
Class D | — | — | — | |||||||||||
Class R | — | — | — | |||||||||||
Class P | — | — | — | |||||||||||
Institutional Class | (244 | ) | — | — | ||||||||||
Class R6 | (820,158 | ) | — | — | ||||||||||
Administrative Class | — | — | — | |||||||||||
| Total dividends and distributions to shareholders | (1,634,763 | ) | — | (3,944 | ) | |||||||||
| Fund Share Transactions: | ||||||||||||||
| Net proceeds from the sale of shares | 99,777,020 | 36,454,373 | 34,152,135 | |||||||||||
| Issued in reinvestment of dividends and distributions | 1,634,763 | — | 3,944 | |||||||||||
| Cost of shares redeemed | (22,899,928 | ) | (11,914,060 | ) | (7,685,047 | ) | ||||||||
| Net increase (decrease) from Fund share transactions | 78,511,855 | 24,540,313 | 26,471,032 | |||||||||||
| Total increase (decrease) in net assets | 82,637,677 | 28,422,140 | 28,812,370 | |||||||||||
| Net Assets: | ||||||||||||||
| Beginning of period | 33,452,140 | 5,020,000 | 5,020,000 | |||||||||||
| End of period* | $ | 116,089,817 | $ | 33,442,140 | $ | 33,832,370 | ||||||||
* Including undistributed (dividends in excess of) net investment income of: | $ | 1,102,475 | $ | 771,361 | $ | 614,811 | ||||||||
| ** | Commencement of operations. |
| 206 | Semiannual Report | | May 31, 2015 | | See accompanying Notes to Financial Statements |
Table of Contents
| AllianzGI Best Styles U.S. Equity | AllianzGI China Equity | AllianzGI Convertible | ||||||||||||||||||
| Period from December 1, 2014** through May 31, 2015 (Unaudited) | Six months ended May 31, 2015 (Unaudited) | Year ended November 30, 2014 | Six months ended May 31, 2015 (Unaudited) | Year ended November 30, 2014 | ||||||||||||||||
| $ | 446,590 | $ | (1,756 | ) | $ | 67,404 | $ | 15,796,470 | $ | 33,329,413 | ||||||||||
| 239,836 | 166,361 | 402,768 | 153,449,636 | 174,588,949 | ||||||||||||||||
| 557,337 | 1,232,858 | (385,396 | ) | (29,004,877 | ) | 29,600,080 | ||||||||||||||
| 1,243,763 | 1,397,463 | 84,776 | 140,241,229 | 237,518,442 | ||||||||||||||||
| — | (9,049 | ) | (1,192 | ) | (5,162,209 | ) | (8,036,190 | ) | ||||||||||||
| — | (43 | ) | (2 | ) | (868,353 | ) | (1,651,959 | ) | ||||||||||||
| — | (4,326 | ) | (1,635 | ) | (736,317 | ) | (2,363,380 | ) | ||||||||||||
| — | — | — | (13,733 | ) | (16,226 | ) | ||||||||||||||
| (14 | ) | (1 | ) | (45 | ) | (2,446,235 | ) | (5,514,465 | ) | |||||||||||
| (15 | ) | (97,475 | ) | (31,446 | ) | (20,224,139 | ) | (39,138,558 | ) | |||||||||||
| (4,632 | ) | — | — | — | — | |||||||||||||||
| — | — | — | (35,956 | ) | (209,464 | ) | ||||||||||||||
| — | (2,796 | ) | — | (30,559,402 | ) | (9,748,925 | ) | |||||||||||||
| — | (200 | ) | — | (7,902,259 | ) | (2,953,239 | ) | |||||||||||||
| — | (2,162 | ) | — | (4,909,717 | ) | (2,652,574 | ) | |||||||||||||
| — | — | — | (90,285 | ) | (19,171 | ) | ||||||||||||||
| — | (153 | ) | — | (14,081,872 | ) | (5,628,426 | ) | |||||||||||||
| — | (31,534 | ) | — | (111,971,539 | ) | (38,746,943 | ) | |||||||||||||
| — | — | — | — | — | ||||||||||||||||
| — | — | — | (236,630 | ) | (203,909 | ) | ||||||||||||||
| (4,661 | ) | (147,739 | ) | (34,320 | ) | (199,238,646 | ) | (116,883,429 | ) | |||||||||||
| 76,375,571 | 7,822,864 | 4,723,503 | 178,305,216 | 1,084,404,115 | ||||||||||||||||
| 4,661 | 147,739 | 34,320 | 123,698,254 | 76,423,408 | ||||||||||||||||
| (20,076,634 | ) | (863,776 | ) | (4,358,814 | ) | (433,631,126 | ) | (983,620,998 | ) | |||||||||||
| 56,303,598 | 7,106,827 | 399,009 | (131,627,656 | ) | 177,206,525 | |||||||||||||||
| 57,542,700 | 8,356,551 | 449,465 | (190,625,073 | ) | 297,841,538 | |||||||||||||||
| 3,020,000 | 4,947,322 | 4,497,857 | 2,701,627,548 | 2,403,786,010 | ||||||||||||||||
| $ | 60,562,700 | $ | 13,303,873 | $ | 4,947,322 | $ | 2,511,002,475 | $ | 2,701,627,548 | |||||||||||
| $ | 441,929 | $ | (17,879 | ) | $ | 94,771 | $ | (1,057,105 | ) | $ | 12,633,367 | |||||||||
| See accompanying Notes to Financial Statements | | May 31, 2015 | | Semiannual Report | 207 |
Table of Contents
Statements of Changes in Net Assets (cont’d)
| AllianzGI Emerging Markets Consumer | AllianzGI Emerging Markets Debt | |||||||||||||
| Period from December 1, 2014** through May 31, 2015 (Unaudited) | Six months ended May 31, 2015 (Unaudited) | Period from September 15, 2014** through November 30, 2014 | ||||||||||||
| Increase (Decrease) in Net Assets from: | ||||||||||||||
Investment Operations: | ||||||||||||||
| Net investment income | $ | 13,692 | $ | 603,557 | $ | 243,119 | ||||||||
| Net realized gain (loss) | 31,621 | (356,637 | ) | (243,113 | ) | |||||||||
| Net change in unrealized appreciation/depreciation | 337,949 | (33,316 | ) | (146,982 | ) | |||||||||
Net increase (decrease) in net assets resulting from investment operations | 383,262 | 213,604 | (146,976 | ) | ||||||||||
| Dividends and Distributions to Shareholders from: | ||||||||||||||
| Net investment income: | ||||||||||||||
Class A | — | (222 | ) | — | ||||||||||
Class C | — | (183 | ) | — | ||||||||||
Class D | — | — | — | |||||||||||
Class P | — | (230 | ) | — | ||||||||||
Institutional Class | — | (712,020 | ) | — | ||||||||||
| Net realized capital gains: | ||||||||||||||
Class A | — | — | — | |||||||||||
Class C | — | — | — | |||||||||||
Class D | — | — | — | |||||||||||
Class P | — | — | — | |||||||||||
Institutional Class | — | — | — | |||||||||||
| Total dividends and distributions to shareholders | — | (712,655 | ) | — | ||||||||||
| Fund Share Transactions: | ||||||||||||||
| Net proceeds from the sale of shares | 10,699,433 | 424,090 | 3,000 | |||||||||||
| Issued in reinvestment of dividends and distributions | — | 712,655 | — | |||||||||||
| Cost of shares redeemed | (1,102,056 | ) | (6,626 | ) | — | |||||||||
| Net increase from Fund share transactions | 9,597,377 | 1,130,119 | 3,000 | |||||||||||
| Total increase (decrease) in net assets | 9,980,639 | 631,068 | (143,976 | ) | ||||||||||
| Net Assets: | ||||||||||||||
| Beginning of period | 3,010,000 | 29,886,024 | 30,030,000 | |||||||||||
| End of period* | $ | 12,990,639 | $ | 30,517,092 | $ | 29,886,024 | ||||||||
* Including undistributed net investment income of: | $ | 13,692 | $ | 70,359 | $ | 179,457 | ||||||||
| ** | Commencement of operations. |
| 208 | Semiannual Report | | May 31, 2015 | | See accompanying Notes to Financial Statements |
Table of Contents
| AllianzGI Emerging Markets Small-Cap | AllianzGI Europe Equity Dividend | AllianzGI Global Fundamental Strategy | ||||||||||||||
| Period from December 1, 2014** through May 31, 2015 (Unaudited) | Period from February 2, 2015** through May 31, 2015 (Unaudited) | Six months ended May 31, 2015 (Unaudited) | Year ended November 30, 2014 | |||||||||||||
| $ | 21,911 | $ | 63,077 | $ | 238,216 | $ | 423,304 | |||||||||
| 98,500 | (16,582 | ) | 554,626 | 186,964 | ||||||||||||
| 439,984 | 12,103 | (572,610 | ) | 421,354 | ||||||||||||
| 560,395 | 58,598 | 220,232 | 1,031,622 | |||||||||||||
| (1 | ) | — | (573 | ) | (78 | ) | ||||||||||
| — | — | (267 | ) | (40 | ) | |||||||||||
| — | — | (1 | ) | (78 | ) | |||||||||||
| — | — | (363 | ) | (86 | ) | |||||||||||
| (768 | ) | — | (766,540 | ) | (183,029 | ) | ||||||||||
| — | — | — | (42 | ) | ||||||||||||
| — | — | — | (42 | ) | ||||||||||||
| — | — | — | (45 | ) | ||||||||||||
| — | — | — | (42 | ) | ||||||||||||
| — | — | — | (83,961 | ) | ||||||||||||
| (769 | ) | — | (767,744 | ) | (267,443 | ) | ||||||||||
| 1,711,029 | 210,753 | 89,887 | 2,628,459 | |||||||||||||
| 769 | — | 767,744 | 267,443 | |||||||||||||
| (43,024 | ) | — | (70,395 | ) | (2,175,508 | ) | ||||||||||
| 1,668,774 | 210,753 | 787,236 | 720,394 | |||||||||||||
| 2,228,400 | 269,351 | 239,724 | 1,484,573 | |||||||||||||
| 3,010,000 | 3,030,000 | 22,206,963 | 20,722,390 | |||||||||||||
| $ | 5,238,400 | $ | 3,299,351 | $ | 22,446,687 | $ | 22,206,963 | |||||||||
| $ | 21,142 | $ | 63,077 | $ | 89,829 | $ | 619,357 | |||||||||
| See accompanying Notes to Financial Statements | | May 31, 2015 | | Semiannual Report | 209 |
Table of Contents
Statements of Changes in Net Assets (cont’d)
| AllianzGI Global Managed Volatility | AllianzGI Global Sustainability | |||||||||||||
| Six months ended May 31, 2015 (Unaudited) | Year ended November 30, 2014 | Period from December 9, 2014** through May 31, 2015 (Unaudited) | ||||||||||||
| Increase (Decrease) in Net Assets from: | ||||||||||||||
Investment Operations: | ||||||||||||||
| Net investment income | $ | 107,918 | $ | 407,635 | $ | 24,564 | ||||||||
| Net realized gain (loss) | 1,100,619 | 1,459,982 | (19,303 | ) | ||||||||||
| Net change in unrealized appreciation/depreciation | (1,057,235 | ) | (83,908 | ) | 115,319 | |||||||||
Net increase in net assets resulting from investment operations | 151,302 | 1,783,709 | 120,580 | |||||||||||
| Dividends and Distributions to Shareholders from: | ||||||||||||||
| Net investment income: | ||||||||||||||
Class A | (5,231 | ) | (3,296 | ) | — | |||||||||
Class C | (5,508 | ) | (4,877 | ) | — | |||||||||
Class D | (6,160 | ) | (1,358 | ) | — | |||||||||
Class R | — | — | — | |||||||||||
Class P | (367 | ) | (368 | ) | — | |||||||||
Institutional Class | (443,411 | ) | (466,258 | ) | — | |||||||||
Administrative Class | — | — | — | |||||||||||
| Net realized capital gains: | ||||||||||||||
Class A | (16,252 | ) | (4,082 | ) | — | |||||||||
Class C | (21,867 | ) | (6,056 | ) | — | |||||||||
Class D | (17,969 | ) | (2,421 | ) | — | |||||||||
Class R | — | — | — | |||||||||||
Class P | (1,148 | ) | (397 | ) | — | |||||||||
Institutional Class | (1,336,798 | ) | (470,054 | ) | — | |||||||||
Administrative Class | — | — | — | |||||||||||
| Total dividends and distributions to shareholders | (1,854,711 | ) | (959,167 | ) | — | |||||||||
| Fund Share Transactions: | ||||||||||||||
| Net proceeds from the sale of shares | 1,283,106 | 6,745,131 | — | |||||||||||
| Issued in reinvestment of dividends and distributions | 1,854,032 | 958,921 | — | |||||||||||
| Cost of shares redeemed | (15,334,909 | ) | (6,297,535 | ) | — | |||||||||
| Net increase (decrease) from Fund share transactions | (12,197,771 | ) | 1,406,517 | — | ||||||||||
| Total increase (decrease) in net assets | (13,901,180 | ) | 2,231,059 | 120,580 | ||||||||||
| Net Assets: | ||||||||||||||
| Beginning of period | 16,758,260 | 14,527,201 | 3,020,000 | |||||||||||
| End of period* | $ | 2,857,080 | $ | 16,758,260 | $ | 3,140,580 | ||||||||
* Including undistributed (dividends in excess of) net investment income of: | $ | 52,938 | $ | 405,697 | $ | 24,564 | ||||||||
| ** | Commencement of operations. |
| 210 | Semiannual Report | | May 31, 2015 | | See accompanying Notes to Financial Statements |
Table of Contents
| AllianzGI Global Water | AllianzGI High Yield Bond | AllianzGI International Growth | ||||||||||||||||||
| Six months ended May 31, 2015 (Unaudited) | Year ended November 30, 2014 | Six months ended May 31, 2015 (Unaudited) | Year ended November 30, 2014 | Period from February 2, 2015** through May 31, 2015 (Unaudited) | ||||||||||||||||
| $ | 1,571,823 | $ | 1,281,291 | $ | 12,094,289 | $ | 26,751,720 | $ | 22,074 | |||||||||||
| 5,748,769 | 12,071,081 | (3,283,373 | ) | (2,594,450 | ) | (6,651 | ) | |||||||||||||
| 8,153,531 | (9,066,116 | ) | 339,784 | (13,254,415 | ) | 178,963 | ||||||||||||||
| 15,474,123 | 4,286,256 | 9,150,700 | 10,902,855 | 194,386 | ||||||||||||||||
| (320,545 | ) | (269,464 | ) | (1,227,499 | ) | (4,652,555 | ) | — | ||||||||||||
| (62 | ) | (44 | ) | (595,671 | ) | (1,492,477 | ) | — | ||||||||||||
| (58,560 | ) | (27,063 | ) | (1,177,541 | ) | (4,685,232 | ) | — | ||||||||||||
| — | — | (67,695 | ) | (186,866 | ) | — | ||||||||||||||
| (617,050 | ) | (164,700 | ) | (2,584,902 | ) | (5,226,144 | ) | — | ||||||||||||
| (138,567 | ) | (175,053 | ) | (6,169,146 | ) | (11,638,201 | ) | — | ||||||||||||
| — | — | (1,158,674 | ) | (2,355,230 | ) | — | ||||||||||||||
| — | — | — | (619,224 | ) | — | |||||||||||||||
| — | — | — | (228,112 | ) | — | |||||||||||||||
| — | — | — | (937,624 | ) | — | |||||||||||||||
| — | — | — | (24,919 | ) | — | |||||||||||||||
| — | — | — | (667,219 | ) | — | |||||||||||||||
| — | — | — | (1,221,439 | ) | — | |||||||||||||||
| — | — | — | (287,135 | ) | — | |||||||||||||||
| (1,134,784 | ) | (636,324 | ) | (12,981,128 | ) | (34,222,377 | ) | — | ||||||||||||
| 62,707,728 | 183,509,079 | 142,754,986 | 261,023,783 | 35,957 | ||||||||||||||||
| 720,606 | 446,287 | 12,181,960 | 28,415,730 | — | ||||||||||||||||
| (57,723,051 | ) | (85,247,989 | ) | (134,423,001 | ) | (343,171,573 | ) | (34,901 | ) | |||||||||||
| 5,705,283 | 98,707,377 | 20,513,945 | (53,732,060 | ) | 1,056 | |||||||||||||||
| 20,044,622 | 102,357,309 | 16,683,517 | (77,051,582 | ) | 195,442 | |||||||||||||||
| 346,876,891 | 244,519,582 | 384,999,021 | 462,050,603 | 3,010,000 | ||||||||||||||||
| $ | 366,921,513 | $ | 346,876,891 | $ | 401,682,538 | $ | 384,999,021 | $ | 3,205,442 | |||||||||||
| $ | 1,468,265 | $ | 1,031,226 | $ | (2,797,803 | ) | $ | (1,910,964 | ) | $ | 22,074 | |||||||||
| See accompanying Notes to Financial Statements | | May 31, 2015 | | Semiannual Report | 211 |
Table of Contents
Statements of Changes in Net Assets (cont’d)
| AllianzGI International Small-Cap | AllianzGI Micro Cap | |||||||||||||||||
| Six months ended May 31, 2015 (Unaudited) | Year ended November 30, 2014 | Six months ended May 31, 2015 (Unaudited) | Year ended November 30, 2014 | |||||||||||||||
| Increase (Decrease) in Net Assets from: | ||||||||||||||||||
Investment Operations: | ||||||||||||||||||
| Net investment income (loss) | $ | 384,681 | $ | 486,533 | $ | (271,525 | ) | $ | (529,827 | ) | ||||||||
| Net realized gain (loss) | 3,902,812 | 8,929,778 | 1,662,679 | 5,318,065 | ||||||||||||||
| Net change in unrealized appreciation/depreciation | 9,837,992 | (14,951,435 | ) | 2,909,808 | (5,003,191 | ) | ||||||||||||
Net increase (decrease) in net assets resulting from investment operations | 14,125,485 | (5,535,124 | ) | 4,300,962 | (214,953 | ) | ||||||||||||
| Dividends and Distributions to Shareholders from: | ||||||||||||||||||
| Net investment income: | ||||||||||||||||||
Class A | (13,607 | ) | (76,677 | ) | — | — | ||||||||||||
Class C | (1 | ) | (7,882 | ) | — | — | ||||||||||||
Class D | (2,486 | ) | (24,442 | ) | — | — | ||||||||||||
Class R | (83 | ) | (1,445 | ) | — | — | ||||||||||||
Class P | (60,241 | ) | (413,514 | ) | — | — | ||||||||||||
Institutional Class | (111,297 | ) | (712,548 | ) | — | — | ||||||||||||
Administrative Class** | — | (143 | ) | — | — | |||||||||||||
| Net realized capital gains: | ||||||||||||||||||
Class A | (527,948 | ) | (401,037 | ) | (401,198 | ) | (99,298 | ) | ||||||||||
Class C | (108,272 | ) | (67,871 | ) | — | — | ||||||||||||
Class D | (144,512 | ) | (43,636 | ) | — | — | ||||||||||||
Class R | (7,377 | ) | (3,246 | ) | — | — | ||||||||||||
Class P | (2,809,567 | ) | (2,839,970 | ) | (131,124 | ) | (121,008 | ) | ||||||||||
Institutional Class | (5,583,444 | ) | (5,781,334 | ) | (2,778,216 | ) | (2,458,693 | ) | ||||||||||
Administrative Class** | — | (1,090 | ) | — | — | |||||||||||||
| Total dividends and distributions to shareholders | (9,368,835 | ) | (10,374,835 | ) | (3,310,538 | ) | (2,678,999 | ) | ||||||||||
| Fund Share Transactions: | ||||||||||||||||||
| Net proceeds from the sale of shares | 38,584,696 | 31,565,843 | 10,566,757 | 16,002,865 | ||||||||||||||
| Issued in reinvestment of dividends and distributions | 8,878,523 | 9,979,963 | 3,304,682 | 2,674,893 | ||||||||||||||
| Cost of shares redeemed | (22,815,315 | ) | (45,162,105 | ) | (11,512,885 | ) | (21,006,118 | ) | ||||||||||
| Net increase (decrease) from Fund share transactions | 24,647,904 | (3,616,299 | ) | 2,358,554 | (2,328,360 | ) | ||||||||||||
| Total increase (decrease) in net assets | 29,404,554 | (19,526,258 | ) | 3,348,978 | (5,222,312 | ) | ||||||||||||
| Net Assets: | ||||||||||||||||||
| Beginning of period | 91,575,714 | 111,101,972 | 39,747,287 | 44,969,599 | ||||||||||||||
| End of period* | $ | 120,980,268 | $ | 91,575,714 | $ | 43,096,265 | $ | 39,747,287 | ||||||||||
* Including undistributed (dividends in excess of) net investment income of: | $ | 425,128 | $ | 228,162 | $ | (753,822 | ) | $ | (482,297 | ) | ||||||||
| ** | AllianzGI International Small-Cap liquidated its Administrative Class on May 21, 2014. |
| 212 | Semiannual Report | | May 31, 2015 | | See accompanying Notes to Financial Statements |
Table of Contents
| AllianzGI Multi-Asset Real Return | AllianzGI NFJ Emerging Markets Value | AllianzGI NFJ Global Dividend Value | ||||||||||||||||||||||
| Six months ended May 31, 2015 (Unaudited) | Year ended November 30, 2014 | Six months ended May 31, 2015 (Unaudited) | Year ended November 30, 2014 | Six months ended May 31, 2015 (Unaudited) | Year ended November 30, 2014 | |||||||||||||||||||
| $ | 13,103 | $ | 74,280 | $ | 128,463 | $ | 270,969 | $ | 635,417 | $ | 2,181,257 | |||||||||||||
| (42,968 | ) | (53,943 | ) | (91,435 | ) | 325,266 | 647,075 | 4,043,646 | ||||||||||||||||
| (57,225 | ) | (116,868 | ) | 270,556 | (247,980 | ) | (1,334,864 | ) | (2,887,427 | ) | ||||||||||||||
| (87,090 | ) | (96,531 | ) | 307,584 | 348,255 | (52,372 | ) | 3,337,476 | ||||||||||||||||
| (1,726 | ) | (677 | ) | (2,763 | ) | (1,302 | ) | (215,624 | ) | (289,279 | ) | |||||||||||||
| (703 | ) | (1,050 | ) | (1,447 | ) | (619 | ) | (82,567 | ) | (106,170 | ) | |||||||||||||
| (237 | ) | (136 | ) | (35,249 | ) | (27,988 | ) | (72,878 | ) | (22,598 | ) | |||||||||||||
| — | — | — | — | — | — | |||||||||||||||||||
| (113 | ) | (152 | ) | (269 | ) | (251 | ) | (35,398 | ) | (50,720 | ) | |||||||||||||
| (75,299 | ) | (88,246 | ) | (200,949 | ) | (171,834 | ) | (679,175 | ) | (1,494,313 | ) | |||||||||||||
| — | — | — | — | — | — | |||||||||||||||||||
| — | (350 | ) | (1,806 | ) | — | (457,799 | ) | (524,358 | ) | |||||||||||||||
| — | (473 | ) | (1,142 | ) | — | (225,690 | ) | (278,781 | ) | |||||||||||||||
| — | (111 | ) | (24,209 | ) | — | (156,981 | ) | (37,086 | ) | |||||||||||||||
| — | — | — | — | — | — | |||||||||||||||||||
| — | (53 | ) | (174 | ) | — | (73,929 | ) | (87,797 | ) | |||||||||||||||
| — | (29,343 | ) | (127,949 | ) | — | (1,638,984 | ) | (2,562,825 | ) | |||||||||||||||
| — | — | — | — | — | — | |||||||||||||||||||
| (78,078 | ) | (120,591 | ) | (395,957 | ) | (201,994 | ) | (3,639,025 | ) | (5,453,927 | ) | |||||||||||||
| 263,702 | 1,227,771 | 1,211,116 | 2,873,339 | 7,841,807 | 23,212,818 | |||||||||||||||||||
| 78,078 | 120,591 | 395,957 | 201,994 | 3,203,956 | 4,954,544 | |||||||||||||||||||
| (1,198,632 | ) | (108,911 | ) | (1,628,511 | ) | (1,256,884 | ) | (32,843,814 | ) | (29,958,637 | ) | |||||||||||||
| (856,852 | ) | 1,239,451 | (21,438 | ) | 1,818,449 | (21,798,051 | ) | (1,791,275 | ) | |||||||||||||||
| (1,022,020 | ) | 1,022,329 | (109,811 | ) | 1,964,710 | (25,489,448 | ) | (3,907,726 | ) | |||||||||||||||
| 6,323,596 | 5,301,267 | 9,575,459 | 7,610,749 | 66,273,666 | 70,181,392 | |||||||||||||||||||
| $ | 5,301,576 | $ | 6,323,596 | $ | 9,465,648 | $ | 9,575,459 | $ | 40,784,218 | $ | 66,273,666 | |||||||||||||
| $ | (43 | ) | $ | 64,932 | $ | 56,658 | $ | 168,872 | $ | 426,400 | $ | 876,625 | ||||||||||||
| See accompanying Notes to Financial Statements | | May 31, 2015 | | Semiannual Report | 213 |
Table of Contents
Statements of Changes in Net Assets (cont’d)
| AllianzGI NFJ International Small-Cap Value | AllianzGI NFJ International Value II | |||||||||||||||||
| Six months ended May 31, 2015 (Unaudited) | Year ended November 30, 2014 | Six months ended May 31, 2015 (Unaudited) | Year ended November 30, 2014 | |||||||||||||||
| Increase in Net Assets from: | ||||||||||||||||||
Investment Operations: | ||||||||||||||||||
| Net investment income (loss) | $ | 211,627 | $ | 414,397 | $ | 624,636 | $ | 864,809 | ||||||||||
| Net realized gain (loss) | 617,638 | 1,461,108 | (694,187 | ) | 158,105 | |||||||||||||
| Net change in unrealized appreciation/depreciation | 796,921 | (1,033,876 | ) | 2,499,689 | (1,278,749 | ) | ||||||||||||
Net increase (decrease) in net assets resulting from investment operations | 1,626,186 | 841,629 | 2,430,138 | (255,835 | ) | |||||||||||||
| Dividends and Distributions to Shareholders from: | ||||||||||||||||||
| Net investment income: | ||||||||||||||||||
Class A | (77,148 | ) | (28,563 | ) | (1,192 | ) | (2,980 | ) | ||||||||||
Class C | (32,806 | ) | (13,235 | ) | (356 | ) | (1,279 | ) | ||||||||||
Class D | (43,395 | ) | (8,011 | ) | (99 | ) | (410 | ) | ||||||||||
Class P | (1,235 | ) | (134 | ) | (2,385 | ) | (1,094 | ) | ||||||||||
Institutional Class | (320,408 | ) | (198,102 | ) | (375,521 | ) | (735,960 | ) | ||||||||||
| Net realized capital gains: | ||||||||||||||||||
Class A | (216,087 | ) | (49,292 | ) | (421 | ) | (2,574 | ) | ||||||||||
Class C | (107,054 | ) | (14,329 | ) | (202 | ) | (1,615 | ) | ||||||||||
Class D | (111,960 | ) | (20,783 | ) | (35 | ) | (448 | ) | ||||||||||
Class P | (3,064 | ) | (325 | ) | (306 | ) | (452 | ) | ||||||||||
Institutional Class | (958,204 | ) | (277,871 | ) | (97,903 | ) | (154,322 | ) | ||||||||||
| Total dividends and distributions to shareholders | (1,871,361 | ) | (610,645 | ) | (478,420 | ) | (901,134 | ) | ||||||||||
| Fund Share Transactions: | ||||||||||||||||||
| Net proceeds from the sale of shares | 5,623,273 | 11,637,433 | 8,474,323 | 39,704,993 | ||||||||||||||
| Issued in reinvestment of dividends and distributions | 1,867,740 | 609,584 | 478,420 | 901,134 | ||||||||||||||
| Cost of shares redeemed | (7,216,021 | ) | (8,626,539 | ) | (27,489 | ) | (4,406,491 | ) | ||||||||||
| Net increase from Fund share transactions | 274,992 | 3,620,478 | 8,925,254 | 36,199,636 | ||||||||||||||
| Total increase in net assets | 29,817 | 3,851,462 | 10,876,972 | 35,042,667 | ||||||||||||||
| Net Assets: | ||||||||||||||||||
| Beginning of period | 19,482,282 | 15,630,820 | 39,360,888 | 4,318,221 | ||||||||||||||
| End of period* | $ | 19,512,099 | $ | 19,482,282 | $ | 50,237,860 | $ | 39,360,888 | ||||||||||
* Including undistributed (dividends in excess of) net investment income of: | $ | 161,879 | $ | 425,244 | $ | 429,191 | $ | 184,108 | ||||||||||
| 214 | Semiannual Report | | May 31, 2015 | | See accompanying Notes to Financial Statements |
Table of Contents
| AllianzGI Short Duration High Income | AllianzGI Structured Return | AllianzGI U.S. Equity Hedged | ||||||||||||||||||||||
| Six months ended May 31, 2015 (Unaudited) | Year ended November 30, 2014 | Six months ended May 31, 2015 (Unaudited) | Year ended November 30, 2014 | Six months ended May 31, 2015 (Unaudited) | Year ended November 30, 2014 | |||||||||||||||||||
| $ | 16,621,682 | $ | 28,755,543 | $ | 109,977 | $ | (99,064 | ) | $ | 65,274 | $ | 91,071 | ||||||||||||
| (3,196,035 | ) | 2,167,612 | 60,622 | 478,651 | 2,328,953 | (425,013 | ) | |||||||||||||||||
| 9,188,711 | (14,120,813 | ) | 829,386 | 348,559 | (2,293,690 | ) | 1,330,644 | |||||||||||||||||
| 22,614,358 | 16,802,342 | 999,985 | 728,146 | 100,537 | 996,702 | |||||||||||||||||||
| (4,133,452 | ) | (8,370,337 | ) | (2 | ) | — | (1,746 | ) | (13,056 | ) | ||||||||||||||
| (2,287,695 | ) | (3,564,709 | ) | (2 | ) | — | (1 | ) | (1,801 | ) | ||||||||||||||
| (760,345 | ) | (1,473,888 | ) | (43,262 | ) | — | (11,090 | ) | (1,167 | ) | ||||||||||||||
| (6,248,292 | ) | (9,035,739 | ) | (1 | ) | — | (39 | ) | (47 | ) | ||||||||||||||
| (6,667,116 | ) | (10,905,778 | ) | (34,488 | ) | — | (89,019 | ) | (36,196 | ) | ||||||||||||||
| — | — | (99,623 | ) | (37,417 | ) | (55,780 | ) | (80,061 | ) | |||||||||||||||
| — | — | (5,430 | ) | (5,488 | ) | (6,863 | ) | (9,450 | ) | |||||||||||||||
| — | — | (224,129 | ) | (69,417 | ) | (44,348 | ) | (15,115 | ) | |||||||||||||||
| — | — | (1,428 | ) | (2,794 | ) | (469 | ) | (638 | ) | |||||||||||||||
| — | — | (595,738 | ) | (410,919 | ) | (476,318 | ) | (562,186 | ) | |||||||||||||||
| (20,096,900 | ) | (33,350,451 | ) | (1,004,103 | ) | (526,035 | ) | (685,673 | ) | (719,717 | ) | |||||||||||||
| 288,055,359 | 559,371,784 | 10,042,575 | 16,098,848 | 1,627,603 | 8,217,176 | |||||||||||||||||||
| 16,491,556 | 27,490,449 | 1,002,067 | 526,035 | 685,673 | 719,717 | |||||||||||||||||||
| (239,633,901 | ) | (360,175,213 | ) | (2,956,071 | ) | (3,270,567 | ) | (1,168,157 | ) | (871,008 | ) | |||||||||||||
| 64,913,014 | 226,687,020 | 8,088,571 | 13,354,316 | 1,145,119 | 8,065,885 | |||||||||||||||||||
| 67,430,472 | 210,138,911 | 8,084,453 | 13,556,427 | 559,983 | 8,342,870 | |||||||||||||||||||
| 762,680,091 | 552,541,180 | 23,602,564 | 10,046,137 | 15,552,906 | 7,210,036 | |||||||||||||||||||
| $ | 830,110,563 | $ | 762,680,091 | $ | 31,687,017 | $ | 23,602,564 | $ | 16,112,889 | $ | 15,552,906 | |||||||||||||
| $ | (6,275,037 | ) | $ | (2,799,819 | ) | $ | 32,222 | $ | — | $ | 54,583 | $ | 91,204 | |||||||||||
| See accompanying Notes to Financial Statements | | May 31, 2015 | | Semiannual Report | 215 |
Table of Contents
Statements of Changes in Net Assets (cont’d)
| AllianzGI U.S. Small-Cap Growth | AllianzGI Ultra Micro Cap | |||||||||||||||
| Six months ended May 31, 2015 (Unaudited) | Year ended November 30, 2014 | Six months ended May 31, 2015 (Unaudited) | Year ended November 30, 2014 | |||||||||||||
| Increase (Decrease) in Net Assets from: | ||||||||||||||||
Investment Operations: | ||||||||||||||||
| Net investment loss | $ | (114,174 | ) | $ | (297,538 | ) | $ | (876,471 | ) | $ | (2,310,720 | ) | ||||
| Net realized gain (loss) | 2,160,594 | 3,004,047 | 3,984,006 | (290,346 | ) | |||||||||||
| Net change in unrealized appreciation/depreciation | 448,282 | (2,125,589 | ) | 5,296,215 | (1,655,282 | ) | ||||||||||
Net increase (decrease) in net assets resulting from investment operations | 2,494,702 | 580,920 | 8,403,750 | (4,256,348 | ) | |||||||||||
| Dividends and Distributions to Shareholders from: | ||||||||||||||||
| Net realized capital gains: | ||||||||||||||||
Class A | (284,924 | ) | (497,317 | ) | (459,304 | ) | (280,502 | ) | ||||||||
Class C | (61,355 | ) | (62,072 | ) | — | — | ||||||||||
Class D | (10,288 | ) | (7,759 | ) | — | — | ||||||||||
Class R | (2,525 | ) | (2,639 | ) | — | — | ||||||||||
Class P | (18,156 | ) | (12,307 | ) | (88,470 | ) | (11,847 | ) | ||||||||
Institutional Class | (2,837,538 | ) | (2,798,232 | ) | (428,047 | ) | (259,818 | ) | ||||||||
| Total dividends and distributions to shareholders | (3,214,786 | ) | (3,380,326 | ) | (975,821 | ) | (552,167 | ) | ||||||||
| Fund Share Transactions: | ||||||||||||||||
| Net proceeds from the sale of shares | 10,556,540 | 16,713,796 | 7,638,679 | 74,836,748 | ||||||||||||
| Issued in reinvestment of dividends and distributions | 2,985,630 | 2,978,885 | 951,727 | 543,201 | ||||||||||||
| Cost of shares redeemed | (4,905,308 | ) | (14,261,233 | ) | (27,101,884 | ) | (82,317,148 | ) | ||||||||
| Net increase (decrease) from Fund share transactions | 8,636,862 | 5,431,448 | (18,511,478 | ) | (6,937,199 | ) | ||||||||||
| Total increase (decrease) in net assets | 7,916,778 | 2,632,042 | (11,083,549 | ) | (11,745,714 | ) | ||||||||||
| Net Assets: | ||||||||||||||||
| Beginning of period | 37,528,781 | 34,896,739 | 113,277,805 | 125,023,519 | ||||||||||||
| End of period* | $ | 45,445,559 | $ | 37,528,781 | $ | 102,194,256 | $ | 113,277,805 | ||||||||
* Including dividends in excess of net investment income of: | $ | (524,685 | ) | $ | (410,511 | ) | $ | (3,043,578 | ) | $ | (2,167,107 | ) | ||||
| 216 | Semiannual Report | | May 31, 2015 | | See accompanying Notes to Financial Statements |
Table of Contents
(THIS PAGE INTENTIONALLY LEFT BLANK)
| See accompanying Notes to Financial Statements | | May 31, 2015 | | Semiannual Report | 217 |
Table of Contents
For a Share Outstanding for the Period ended:
| Net Asset Value, Beginning of Period | Net Investment Income (a) | Net Realized and Change in Unrealized Gain (Loss) | Total from Investment Operations | Dividends from Net Investment Income | Distributions from Net Realized Capital Gains | |||||||||||||||||||
| AllianzGI Retirement 2015: | ||||||||||||||||||||||||
| Class A | ||||||||||||||||||||||||
5/31/2015+ | $ | 19.95 | $ | 0.36 | $ | (0.28 | ) | $ | 0.08 | $ | (0.55 | ) | $ | (0.22 | ) | |||||||||
11/30/2014 | 19.56 | 0.42 | 0.37 | 0.79 | (0.40 | ) | — | |||||||||||||||||
11/30/2013 | 19.52 | 0.49 | 0.10 | 0.59 | (0.55 | ) | — | |||||||||||||||||
11/30/2012 | 18.86 | 0.48 | 1.27 | 1.75 | (0.70 | ) | (0.39 | ) | ||||||||||||||||
11/30/2011 | 19.28 | 0.38 | 0.23 | 0.61 | (0.74 | ) | (0.29 | ) | ||||||||||||||||
11/30/2010 | 18.38 | 0.48 | 1.22 | 1.70 | (0.68 | ) | (0.12 | ) | ||||||||||||||||
| Class C | ||||||||||||||||||||||||
5/31/2015+ | $ | 19.68 | $ | 0.29 | $ | (0.28 | ) | $ | 0.01 | $ | (0.34 | ) | $ | (0.22 | ) | |||||||||
11/30/2014 | 19.23 | 0.28 | 0.36 | 0.64 | (0.19 | ) | — | |||||||||||||||||
11/30/2013 | 19.15 | 0.38 | 0.05 | 0.43 | (0.35 | ) | — | |||||||||||||||||
11/30/2012 | 18.53 | 0.35 | 1.24 | 1.59 | (0.58 | ) | (0.39 | ) | ||||||||||||||||
11/30/2011 | 19.09 | 0.31 | 0.14 | 0.45 | (0.72 | ) | (0.29 | ) | ||||||||||||||||
11/30/2010 | 18.25 | 0.36 | 1.19 | 1.55 | (0.59 | ) | (0.12 | ) | ||||||||||||||||
| Class D | ||||||||||||||||||||||||
5/31/2015+ | $ | 20.07 | $ | 0.35 | $ | (0.28 | ) | $ | 0.07 | $ | (0.44 | ) | $ | (0.22 | ) | |||||||||
11/30/2014 | 19.54 | 0.41 | 0.36 | 0.77 | (0.24 | ) | — | |||||||||||||||||
11/30/2013 | 19.52 | 0.88 | (0.32 | ) | 0.56 | (0.54 | ) | — | ||||||||||||||||
11/30/2012 | 18.87 | 0.41 | 1.34 | 1.75 | (0.71 | ) | (0.39 | ) | ||||||||||||||||
11/30/2011 | 19.30 | 0.58 | — | 0.58 | (0.72 | ) | (0.29 | ) | ||||||||||||||||
11/30/2010 | 18.40 | 0.52 | 1.18 | 1.70 | (0.68 | ) | (0.12 | ) | ||||||||||||||||
| Class R | ||||||||||||||||||||||||
5/31/2015+ | $ | 20.05 | $ | 0.27 | $ | (0.22 | ) | $ | 0.05 | $ | (0.46 | ) | $ | (0.22 | ) | |||||||||
11/30/2014 | 19.48 | 0.36 | 0.36 | 0.72 | (0.15 | ) | — | |||||||||||||||||
11/30/2013 | 19.50 | 0.46 | 0.05 | 0.51 | (0.53 | ) | — | |||||||||||||||||
11/30/2012 | 18.85 | 0.19 | 1.51 | 1.70 | (0.66 | ) | (0.39 | ) | ||||||||||||||||
11/30/2011 | 19.27 | 0.55 | — | 0.55 | (0.68 | ) | (0.29 | ) | ||||||||||||||||
11/30/2010 | 18.35 | 0.53 | 1.13 | 1.66 | (0.62 | ) | (0.12 | ) | ||||||||||||||||
| Class P | ||||||||||||||||||||||||
5/31/2015+ | $ | 20.17 | $ | 0.31 | $ | (0.19 | ) | $ | 0.12 | $ | (0.60 | ) | $ | (0.22 | ) | |||||||||
11/30/2014 | 19.74 | 0.48 | 0.38 | 0.86 | (0.43 | ) | — | |||||||||||||||||
11/30/2013 | 19.66 | 0.51 | 0.14 | 0.65 | (0.57 | ) | — | |||||||||||||||||
11/30/2012 | 18.97 | 0.34 | 1.49 | 1.83 | (0.75 | ) | (0.39 | ) | ||||||||||||||||
11/30/2011 | 19.37 | 0.65 | (0.01 | ) | 0.64 | (0.75 | ) | (0.29 | ) | |||||||||||||||
11/30/2010 | 18.43 | 0.61 | 1.13 | 1.74 | (0.68 | ) | (0.12 | ) | ||||||||||||||||
| Class R6 | ||||||||||||||||||||||||
5/31/2015+ | $ | 20.20 | $ | 0.41 | $ | (0.29 | ) | $ | 0.12 | $ | (0.61 | ) | $ | (0.22 | ) | |||||||||
11/30/2014 | 19.77 | 0.50 | 0.38 | 0.88 | (0.45 | ) | — | |||||||||||||||||
11/30/2013 | 19.68 | 0.54 | 0.12 | 0.66 | (0.57 | ) | — | |||||||||||||||||
11/30/2012 | 18.99 | 0.54 | 1.31 | 1.85 | (0.77 | ) | (0.39 | ) | ||||||||||||||||
11/30/2011 | 19.39 | 0.66 | — | 0.66 | (0.77 | ) | (0.29 | ) | ||||||||||||||||
11/30/2010 | 18.45 | 0.61 | 1.14 | 1.75 | (0.69 | ) | (0.12 | ) | ||||||||||||||||
| Administrative Class | ||||||||||||||||||||||||
5/31/2015+ | $ | 20.10 | $ | 0.89 | $ | (0.82 | ) | $ | 0.07 | $ | (0.53 | ) | $ | (0.22 | ) | |||||||||
11/30/2014 | 19.68 | 0.44 | 0.38 | 0.82 | (0.40 | ) | — | |||||||||||||||||
11/30/2013 | 19.60 | 0.22 | 0.37 | 0.59 | (0.51 | ) | — | |||||||||||||||||
11/30/2012 | 18.94 | 0.48 | 1.29 | 1.77 | (0.72 | ) | (0.39 | ) | ||||||||||||||||
11/30/2011 | 19.34 | 0.61 | — | 0.61 | (0.72 | ) | (0.29 | ) | ||||||||||||||||
11/30/2010 | 18.40 | 0.58 | 1.14 | 1.72 | (0.66 | ) | (0.12 | ) | ||||||||||||||||
| + | Unaudited |
| (a) | Calculated on average shares outstanding during the period. |
| 218 | Semiannual Report | | May 31, 2015 | | See accompanying Notes to Financial Statements |
Table of Contents
| Total Dividends and Distributions | Net Asset Value, End of Period | Total Return (b) | Net Assets, End of Period (000s) | Ratio of Expenses to Average Net Assets with Fee Waiver/ Reimbursement (c) | Ratio of Expenses to Average Net Assets without Fee Waiver/ Reimbursement (c) | Ratio of Net Investment Income to Average Net Assets (c) | Portfolio Turnover Rate | |||||||||||||||||||||||||
| $ | (0.77 | ) | $ | 19.26 | 0.45 | % | $ | 11,090 | 0.50 | %(d) | 0.62 | %(d) | 3.71 | %(d) | 109 | % | ||||||||||||||||
| (0.40 | ) | 19.95 | 4.14 | 12,398 | 0.41 | 0.60 | 2.15 | 114 | ||||||||||||||||||||||||
| (0.55 | ) | 19.56 | 3.10 | 4,900 | 0.40 | 0.60 | 2.55 | 94 | ||||||||||||||||||||||||
| (1.09 | ) | 19.52 | 9.88 | 1,798 | 0.40 | 0.60 | 2.57 | 70 | ||||||||||||||||||||||||
| (1.03 | ) | 18.86 | 3.27 | 1,564 | 0.47 | 2.06 | 2.03 | 108 | ||||||||||||||||||||||||
| (0.80 | ) | 19.28 | 9.67 | 229 | 0.50 | 5.47 | 2.62 | 24 | ||||||||||||||||||||||||
| $ | (0.56 | ) | $ | 19.13 | 0.08 | % | $ | 899 | 1.25 | %(d) | 1.37 | %(d) | 3.02 | %(d) | 109 | % | ||||||||||||||||
| (0.19 | ) | 19.68 | 3.37 | 1,096 | 1.16 | 1.35 | 1.43 | 114 | ||||||||||||||||||||||||
| (0.35 | ) | 19.23 | 2.29 | 1,445 | 1.15 | 1.35 | 2.01 | 94 | ||||||||||||||||||||||||
| (0.97 | ) | 19.15 | 9.08 | 2,049 | 1.15 | 1.35 | 1.91 | 70 | ||||||||||||||||||||||||
| (1.01 | ) | 18.53 | 2.44 | 2,347 | 1.22 | 2.66 | 1.65 | 108 | ||||||||||||||||||||||||
| (0.71 | ) | 19.09 | 8.88 | 305 | 1.25 | 7.23 | 1.99 | 24 | ||||||||||||||||||||||||
| $ | (0.66 | ) | $ | 19.48 | 0.42 | % | $ | 63 | 0.60 | %(d) | 0.62 | %(d) | 3.57 | %(d) | 109 | % | ||||||||||||||||
| (0.24 | ) | 20.07 | 3.99 | 92 | 0.51 | 0.60 | 2.09 | 114 | ||||||||||||||||||||||||
| (0.54 | ) | 19.54 | 2.95 | 191 | 0.50 | 0.60 | 4.52 | 94 | ||||||||||||||||||||||||
| (1.10 | ) | 19.52 | 9.82 | 1,290 | 0.50 | 0.60 | 2.19 | 70 | ||||||||||||||||||||||||
| (1.01 | ) | 18.87 | 3.20 | 251 | 0.50 | 2.22 | 3.07 | 108 | ||||||||||||||||||||||||
| (0.80 | ) | 19.30 | 9.62 | 204 | 0.50 | 5.74 | 2.84 | 24 | ||||||||||||||||||||||||
| $ | (0.68 | ) | $ | 19.42 | 0.30 | % | $ | 246 | 0.86 | %(d) | 0.88 | %(d) | 2.85 | %(d) | 109 | % | ||||||||||||||||
| (0.15 | ) | 20.05 | 3.75 | 206 | 0.76 | 0.85 | 1.79 | 114 | ||||||||||||||||||||||||
| (0.53 | ) | 19.48 | 2.71 | 227 | 0.75 | 0.85 | 2.39 | 94 | ||||||||||||||||||||||||
| (1.05 | ) | 19.50 | 9.50 | 469 | 0.75 | 0.85 | 1.01 | 70 | ||||||||||||||||||||||||
| (0.97 | ) | 18.85 | 2.94 | 14 | 0.75 | 2.46 | 2.91 | 108 | ||||||||||||||||||||||||
| (0.74 | ) | 19.27 | 9.43 | 13 | 0.75 | 5.77 | 2.87 | 24 | ||||||||||||||||||||||||
| $ | (0.82 | ) | $ | 19.47 | 0.66 | % | $ | 10,286 | 0.21 | %(d) | 0.23 | %(d) | 3.18 | %(d) | 109 | % | ||||||||||||||||
| (0.43 | ) | 20.17 | 4.43 | 3,720 | 0.11 | 0.20 | 2.43 | 114 | ||||||||||||||||||||||||
| (0.57 | ) | 19.74 | 3.39 | 3,925 | 0.10 | 0.20 | 2.65 | 94 | ||||||||||||||||||||||||
| (1.14 | ) | 19.66 | 10.27 | 3,845 | 0.10 | 0.20 | 1.78 | 70 | ||||||||||||||||||||||||
| (1.04 | ) | 18.97 | 3.44 | 14 | 0.25 | 2.00 | 3.41 | 108 | ||||||||||||||||||||||||
| (0.80 | ) | 19.37 | 9.88 | 14 | 0.30 | 5.38 | 3.32 | 24 | ||||||||||||||||||||||||
| $ | (0.83 | ) | $ | 19.49 | 0.69 | % | $ | 5,473 | 0.09 | %(d) | 0.11 | %(d) | 4.24 | %(d) | 109 | % | ||||||||||||||||
| (0.45 | ) | 20.20 | 4.53 | 13,577 | 0.01 | 0.10 | 2.49 | 114 | ||||||||||||||||||||||||
| (0.57 | ) | 19.77 | 3.52 | 7,675 | — | 0.12 | 2.77 | 94 | ||||||||||||||||||||||||
| (1.16 | ) | 19.68 | 10.31 | 8,243 | — | 0.15 | 2.84 | 70 | ||||||||||||||||||||||||
| (1.06 | ) | 18.99 | 3.53 | 5,885 | 0.15 | 1.90 | 3.48 | 108 | ||||||||||||||||||||||||
| (0.81 | ) | 19.39 | 10.02 | 5,553 | 0.20 | 5.26 | 3.32 | 24 | ||||||||||||||||||||||||
| $ | (0.75 | ) | $ | 19.42 | 0.44 | % | $ | 354 | 0.45 | %(d) | 0.46 | %(d) | 8.94 | %(d) | 109 | % | ||||||||||||||||
| (0.40 | ) | 20.10 | 4.23 | 3,190 | 0.36 | 0.45 | 2.21 | 114 | ||||||||||||||||||||||||
| (0.51 | ) | 19.68 | 3.08 | 3,646 | 0.35 | 0.45 | 1.13 | 94 | ||||||||||||||||||||||||
| (1.11 | ) | 19.60 | 9.97 | 15 | 0.35 | 0.45 | 2.57 | 70 | ||||||||||||||||||||||||
| (1.01 | ) | 18.94 | 3.23 | 14 | 0.42 | 2.17 | 3.23 | 108 | ||||||||||||||||||||||||
| (0.78 | ) | 19.34 | 9.75 | 13 | 0.45 | 5.54 | 3.17 | 24 | ||||||||||||||||||||||||
| (b) | Total return is calculated assuming a purchase of a share on the first day of the period and a sale of a share on the last day of each period reported. Dividends and distributions, if any, are assumed, for purposes of this calculation, to be reinvested. Total return does not reflect sales charges and includes the effect of fee waivers and reimbursements. Total return may reflect adjustments to conform to U.S. GAAP. Total return for a period of less than one year is not annualized. |
| (c) | Does not include expenses of the investment companies in which the Fund invests. |
| (d) | Annualized. |
| See accompanying Notes to Financial Statements | | May 31, 2015 | | Semiannual Report | 219 |
Table of Contents
Financial Highlights (cont’d)
For a Share Outstanding for the Period ended:
| Net Asset Value, Beginning of Period | Net Investment Income (a) | Net Realized and Change in Unrealized Gain (Loss) | Total from Investment Operations | Dividends from Net Investment Income | Distributions from Net Realized Capital Gains | |||||||||||||||||||
| AllianzGI Retirement 2020: | ||||||||||||||||||||||||
| Class A | ||||||||||||||||||||||||
5/31/2015+ | $ | 19.72 | $ | 0.33 | $ | (0.29 | ) | $ | 0.04 | $ | (0.56 | ) | $ | (0.06 | ) | |||||||||
11/30/2014 | 19.32 | 0.41 | 0.37 | 0.78 | (0.38 | ) | — | |||||||||||||||||
11/30/2013 | 19.15 | 0.49 | 0.21 | 0.70 | (0.48 | ) | (0.05 | ) | ||||||||||||||||
11/30/2012 | 18.82 | 0.44 | 1.34 | 1.78 | (0.70 | ) | (0.75 | ) | ||||||||||||||||
11/30/2011 | 19.43 | 0.49 | 0.04 | 0.53 | (0.83 | ) | (0.31 | ) | ||||||||||||||||
11/30/2010 | 18.58 | 0.52 | 1.18 | 1.70 | (0.66 | ) | (0.19 | ) | ||||||||||||||||
| Class C | ||||||||||||||||||||||||
5/31/2015+ | $ | 19.60 | $ | 0.27 | $ | (0.31 | ) | $ | (0.04 | ) | $ | (0.39 | ) | $ | (0.06 | ) | ||||||||
11/30/2014 | 19.16 | 0.27 | 0.35 | 0.62 | (0.18 | ) | — | |||||||||||||||||
11/30/2013 | 18.78 | 0.31 | 0.26 | 0.57 | (0.14 | ) | (0.05 | ) | ||||||||||||||||
11/30/2012 | 18.53 | 0.37 | 1.23 | 1.60 | (0.60 | ) | (0.75 | ) | ||||||||||||||||
11/30/2011 | 19.21 | 0.30 | 0.09 | 0.39 | (0.76 | ) | (0.31 | ) | ||||||||||||||||
11/30/2010 | 18.46 | 0.32 | 1.22 | 1.54 | (0.60 | ) | (0.19 | ) | ||||||||||||||||
| Class D | ||||||||||||||||||||||||
5/31/2015+ | $ | 19.80 | $ | 0.32 | $ | (0.29 | ) | $ | 0.03 | $ | (0.50 | ) | $ | (0.06 | ) | |||||||||
11/30/2014 | 19.37 | 0.40 | 0.36 | 0.76 | (0.33 | ) | — | |||||||||||||||||
11/30/2013 | 19.16 | 0.49 | 0.20 | 0.69 | (0.43 | ) | (0.05 | ) | ||||||||||||||||
11/30/2012 | 18.84 | 0.39 | 1.36 | 1.75 | (0.68 | ) | (0.75 | ) | ||||||||||||||||
11/30/2011 | 19.43 | 0.72 | (0.19 | ) | 0.53 | (0.81 | ) | (0.31 | ) | |||||||||||||||
11/30/2010 | 18.59 | 0.52 | 1.17 | 1.69 | (0.66 | ) | (0.19 | ) | ||||||||||||||||
| Class R | ||||||||||||||||||||||||
5/31/2015+ | $ | 19.70 | $ | 0.29 | $ | (0.28 | ) | $ | 0.01 | $ | (0.48 | ) | $ | (0.06 | ) | |||||||||
11/30/2014 | 19.27 | 0.35 | 0.36 | 0.71 | (0.28 | ) | — | |||||||||||||||||
11/30/2013 | 19.14 | 0.43 | 0.21 | 0.64 | (0.46 | ) | (0.05 | ) | ||||||||||||||||
11/30/2012 | 18.81 | 0.18 | 1.54 | 1.72 | (0.64 | ) | (0.75 | ) | ||||||||||||||||
11/30/2011 | 19.40 | 0.53 | (0.05 | ) | 0.48 | (0.76 | ) | (0.31 | ) | |||||||||||||||
11/30/2010 | 18.55 | 0.55 | 1.09 | 1.64 | (0.60 | ) | (0.19 | ) | ||||||||||||||||
| Class P | �� | |||||||||||||||||||||||
5/31/2015+ | $ | 19.98 | $ | 0.32 | $ | (0.26 | ) | $ | 0.06 | $ | (0.60 | ) | $ | (0.06 | ) | |||||||||
11/30/2014 | 19.53 | 0.47 | 0.38 | 0.85 | (0.40 | ) | — | |||||||||||||||||
11/30/2013 | 19.30 | 0.47 | 0.30 | 0.77 | (0.49 | ) | (0.05 | ) | ||||||||||||||||
11/30/2012 | 18.94 | 0.37 | 1.47 | 1.84 | (0.73 | ) | (0.75 | ) | ||||||||||||||||
11/30/2011 | 19.51 | 0.42 | 0.16 | 0.58 | (0.84 | ) | (0.31 | ) | ||||||||||||||||
11/30/2010 | 18.62 | 0.64 | 1.10 | 1.74 | (0.66 | ) | (0.19 | ) | ||||||||||||||||
| Class R6 | ||||||||||||||||||||||||
5/31/2015+ | $ | 20.01 | $ | 0.38 | $ | (0.30 | ) | $ | 0.08 | $ | (0.62 | ) | $ | (0.06 | ) | |||||||||
11/30/2014 | 19.57 | 0.51 | 0.35 | 0.86 | (0.42 | ) | — | |||||||||||||||||
11/30/2013 | 19.32 | 0.58 | 0.21 | 0.79 | (0.49 | ) | (0.05 | ) | ||||||||||||||||
11/30/2012 | 18.96 | 0.55 | 1.31 | 1.86 | (0.75 | ) | (0.75 | ) | ||||||||||||||||
11/30/2011 | 19.53 | 0.64 | (0.04 | ) | 0.60 | (0.86 | ) | (0.31 | ) | |||||||||||||||
11/30/2010 | 18.64 | 0.64 | 1.12 | 1.76 | (0.68 | ) | (0.19 | ) | ||||||||||||||||
| Administrative Class | ||||||||||||||||||||||||
5/31/2015+ | $ | 19.84 | $ | 0.66 | $ | (0.63 | ) | $ | 0.03 | $ | (0.55 | ) | $ | (0.06 | ) | |||||||||
11/30/2014 | 19.42 | 0.43 | 0.36 | 0.79 | (0.37 | ) | — | |||||||||||||||||
11/30/2013 | 19.25 | 0.24 | 0.47 | 0.71 | (0.49 | ) | (0.05 | ) | ||||||||||||||||
11/30/2012 | 18.90 | 0.51 | 1.28 | 1.79 | (0.69 | ) | (0.75 | ) | ||||||||||||||||
11/30/2011 | 19.48 | 0.59 | (0.05 | ) | 0.54 | (0.81 | ) | (0.31 | ) | |||||||||||||||
11/30/2010 | 18.60 | 0.61 | 1.10 | 1.71 | (0.64 | ) | (0.19 | ) | ||||||||||||||||
| + | Unaudited |
| (a) | Calculated on average shares outstanding during the period. |
| 220 | Semiannual Report | | May 31, 2015 | | See accompanying Notes to Financial Statements |
Table of Contents
| Total Dividends and Distributions | Net Asset Value, End of Period | Total Return (b) | Net Assets, End of Period (000s) | Ratio of Expenses to Average Net Assets with Fee Waiver/ Reimbursement (c) | Ratio of Expenses to Average Net Assets without Fee Waiver/ Reimbursement (c) | Ratio of Net Investment Income to Average Net Assets (c) | Portfolio Turnover Rate | |||||||||||||||||||||||||
| $ | (0.62 | ) | $ | 19.14 | 0.25 | % | $ | 33,001 | 0.50 | %(d) | 0.62 | %(d) | 3.50 | %(d) | 99 | % | ||||||||||||||||
| (0.38 | ) | 19.72 | 4.11 | 34,624 | 0.42 | 0.60 | 2.08 | 89 | ||||||||||||||||||||||||
| (0.53 | ) | 19.32 | 3.75 | 9,102 | 0.40 | 0.60 | 2.60 | 86 | ||||||||||||||||||||||||
| (1.45 | ) | 19.15 | 10.23 | 985 | 0.38 | 0.60 | 2.40 | 55 | ||||||||||||||||||||||||
| (1.14 | ) | 18.82 | 2.82 | 351 | 0.48 | 2.71 | 2.56 | 56 | ||||||||||||||||||||||||
| (0.85 | ) | 19.43 | 9.60 | 154 | 0.53 | 6.52 | 2.79 | 23 | ||||||||||||||||||||||||
| $ | (0.45 | ) | $ | 19.11 | (0.15 | )% | $ | 385 | 1.25 | %(d) | 1.37 | %(d) | 2.88 | %(d) | 99 | % | ||||||||||||||||
| (0.18 | ) | 19.60 | 3.29 | 468 | 1.17 | 1.35 | 1.39 | 89 | ||||||||||||||||||||||||
| (0.19 | ) | 19.16 | 3.02 | 438 | 1.15 | 1.35 | 1.64 | 86 | ||||||||||||||||||||||||
| (1.35 | ) | 18.78 | 9.29 | 364 | 1.13 | 1.35 | 2.07 | 55 | ||||||||||||||||||||||||
| (1.07 | ) | 18.53 | 2.07 | 669 | 1.23 | 3.40 | 1.61 | 56 | ||||||||||||||||||||||||
| (0.79 | ) | 19.21 | 8.72 | 204 | 1.28 | 8.05 | 1.72 | 23 | ||||||||||||||||||||||||
| $ | (0.56 | ) | $ | 19.27 | 0.19 | % | $ | 290 | 0.60 | %(d) | 0.62 | %(d) | 3.33 | %(d) | 99 | % | ||||||||||||||||
| (0.33 | ) | 19.80 | 3.98 | 274 | 0.52 | 0.60 | 2.06 | 89 | ||||||||||||||||||||||||
| (0.48 | ) | 19.37 | 3.67 | 319 | 0.50 | 0.60 | 2.58 | 86 | ||||||||||||||||||||||||
| (1.43 | ) | 19.16 | 10.02 | 266 | 0.48 | 0.60 | 2.12 | 55 | ||||||||||||||||||||||||
| (1.12 | ) | 18.84 | 2.85 | 115 | 0.52 | 2.91 | 3.80 | 56 | ||||||||||||||||||||||||
| (0.85 | ) | 19.43 | 9.54 | 187 | 0.53 | 5.95 | 2.80 | 23 | ||||||||||||||||||||||||
| $ | (0.54 | ) | $ | 19.17 | 0.07 | % | $ | 1,096 | 0.85 | %(d) | 0.87 | %(d) | 3.05 | %(d) | 99 | % | ||||||||||||||||
| (0.28 | ) | 19.70 | 3.72 | 1,008 | 0.77 | 0.85 | 1.81 | 89 | ||||||||||||||||||||||||
| (0.51 | ) | 19.27 | 3.40 | 1,022 | 0.75 | 0.85 | 2.26 | 86 | ||||||||||||||||||||||||
| (1.39 | ) | 19.14 | 9.84 | 938 | 0.73 | 0.85 | 0.97 | 55 | ||||||||||||||||||||||||
| (1.07 | ) | 18.81 | 2.57 | 14 | 0.77 | 3.09 | 2.77 | 56 | ||||||||||||||||||||||||
| (0.79 | ) | 19.40 | 9.25 | 13 | 0.78 | 6.30 | 2.99 | 23 | ||||||||||||||||||||||||
| $ | (0.66 | ) | $ | 19.38 | 0.38 | % | $ | 21,950 | 0.20 | %(d) | 0.22 | %(d) | 3.31 | %(d) | 99 | % | ||||||||||||||||
| (0.40 | ) | 19.98 | 4.43 | 12,665 | 0.12 | 0.20 | 2.38 | 89 | ||||||||||||||||||||||||
| (0.54 | ) | 19.53 | 4.06 | 7,643 | 0.10 | 0.20 | 2.44 | 86 | ||||||||||||||||||||||||
| (1.48 | ) | 19.30 | 10.55 | 5,323 | 0.08 | 0.20 | 1.95 | 55 | ||||||||||||||||||||||||
| (1.15 | ) | 18.94 | 3.07 | 42 | 0.17 | 1.39 | 2.24 | 56 | ||||||||||||||||||||||||
| (0.85 | ) | 19.51 | 9.81 | 14 | 0.33 | 5.93 | 3.44 | 23 | ||||||||||||||||||||||||
| $ | (0.68 | ) | $ | 19.41 | 0.45 | % | $ | 5,245 | 0.10 | %(d) | 0.12 | %(d) | 3.96 | %(d) | 99 | % | ||||||||||||||||
| (0.42 | ) | 20.01 | 4.48 | 5,574 | 0.02 | 0.10 | 2.59 | 89 | ||||||||||||||||||||||||
| (0.54 | ) | 19.57 | 4.19 | 7,457 | — | 0.12 | 3.00 | 86 | ||||||||||||||||||||||||
| (1.50 | ) | 19.32 | 10.62 | 7,708 | — | (e) | 0.15 | 2.98 | 55 | |||||||||||||||||||||||
| (1.17 | ) | 18.96 | 3.16 | 5,157 | 0.17 | 2.51 | 3.34 | 56 | ||||||||||||||||||||||||
| (0.87 | ) | 19.53 | 9.90 | 4,834 | 0.23 | 5.80 | 3.44 | 23 | ||||||||||||||||||||||||
| $ | (0.61 | ) | $ | 19.26 | 0.21 | % | $ | 1,955 | 0.45 | %(d) | 0.46 | %(d) | 6.75 | %(d) | 99 | % | ||||||||||||||||
| (0.37 | ) | 19.84 | 4.15 | 7,974 | 0.37 | 0.45 | 2.19 | 89 | ||||||||||||||||||||||||
| (0.54 | ) | 19.42 | 3.79 | 7,210 | 0.35 | 0.45 | 1.27 | 86 | ||||||||||||||||||||||||
| (1.44 | ) | 19.25 | 10.20 | 15 | 0.33 | 0.45 | 2.73 | 55 | ||||||||||||||||||||||||
| (1.12 | ) | 18.90 | 2.87 | 14 | 0.44 | 2.78 | 3.09 | 56 | ||||||||||||||||||||||||
| (0.83 | ) | 19.48 | 9.63 | 14 | 0.48 | 6.08 | 3.29 | 23 | ||||||||||||||||||||||||
| (b) | Total return is calculated assuming a purchase of a share on the first day of the period and a sale of a share on the last day of each period reported. Dividends and distributions, if any, are assumed, for purposes of this calculation, to be reinvested. Total return does not reflect sales charges and includes the effect of fee waivers and reimbursements. Total return may reflect adjustments to conform to U.S. GAAP. Total return for a period of less than one year is not annualized. |
| (c) | Does not include expenses of the investment companies in which the Fund invests. |
| (d) | Annualized. |
| (e) | See Note 6 in the Notes to Financial Statements. |
| See accompanying Notes to Financial Statements | | May 31, 2015 | | Semiannual Report | 221 |
Table of Contents
Financial Highlights (cont’d)
For a Share Outstanding for the Period ended:
| Net Asset Value, Beginning of Period | Net Investment Income (a) | Net Realized and Change in Unrealized Gain (Loss) | Total from Investment Operations | Dividends from Net Investment Income | Distributions from Net Realized Capital Gains | |||||||||||||||||||
| AllianzGI Retirement 2025: | ||||||||||||||||||||||||
| Class A | ||||||||||||||||||||||||
5/31/2015+ | $ | 17.30 | $ | 0.30 | $ | (0.23 | ) | $ | 0.07 | $ | (0.50 | ) | $ | — | ||||||||||
11/30/2014 | 16.92 | 0.37 | 0.33 | 0.70 | (0.32 | ) | — | |||||||||||||||||
11/30/2013 | 16.63 | 0.41 | 0.32 | 0.73 | (0.40 | ) | (0.04 | ) | ||||||||||||||||
12/19/2011* - 11/30/2012 | 15.00 | 0.34 | 1.43 | 1.77 | (0.14 | ) | — | |||||||||||||||||
| Class R | ||||||||||||||||||||||||
5/31/2015+ | $ | 17.21 | $ | 0.25 | $ | (0.21 | ) | $ | 0.04 | $ | (0.42 | ) | $ | — | ||||||||||
11/30/2014 | 16.84 | 0.32 | 0.32 | 0.64 | (0.27 | ) | — | |||||||||||||||||
11/30/2013 | 16.57 | 0.48 | 0.19 | 0.67 | (0.36 | ) | (0.04 | ) | ||||||||||||||||
12/19/2011* - 11/30/2012 | 15.00 | 0.18 | 1.53 | 1.71 | (0.14 | ) | — | |||||||||||||||||
| Class P | ||||||||||||||||||||||||
5/31/2015+ | $ | 17.43 | $ | 0.26 | $ | (0.16 | ) | $ | 0.10 | $ | (0.55 | ) | $ | — | ||||||||||
11/30/2014 | 17.02 | 0.40 | 0.35 | 0.75 | (0.34 | ) | — | |||||||||||||||||
11/30/2013 | 16.67 | 0.48 | 0.31 | 0.79 | (0.40 | ) | (0.04 | ) | ||||||||||||||||
12/19/2011* - 11/30/2012 | 15.00 | 0.38 | 1.44 | 1.82 | (0.15 | ) | — | |||||||||||||||||
| Class R6 | ||||||||||||||||||||||||
5/31/2015+ | $ | 17.45 | $ | 0.34 | $ | (0.23 | ) | $ | 0.11 | $ | (0.56 | ) | $ | — | ||||||||||
11/30/2014 | 17.04 | 0.44 | 0.33 | 0.77 | (0.36 | ) | — | |||||||||||||||||
11/30/2013 | 16.68 | 0.50 | 0.30 | 0.80 | (0.40 | ) | (0.04 | ) | ||||||||||||||||
12/19/2011* - 11/30/2012 | 15.00 | 0.45 | 1.38 | 1.83 | (0.15 | ) | — | |||||||||||||||||
| Administrative Class | ||||||||||||||||||||||||
5/31/2015+ | $ | 17.37 | $ | 0.83 | $ | (0.76 | ) | $ | 0.07 | $ | (0.50 | ) | $ | — | ||||||||||
11/30/2014 | 16.98 | 0.38 | 0.33 | 0.71 | (0.32 | ) | — | |||||||||||||||||
11/30/2013 | 16.62 | 0.20 | 0.55 | 0.75 | (0.35 | ) | (0.04 | ) | ||||||||||||||||
12/19/2011* - 11/30/2012 | 15.00 | 0.41 | 1.35 | 1.76 | (0.14 | ) | — | |||||||||||||||||
| + | Unaudited |
| * | Commencement of operations. |
| (a) | Calculated on average shares outstanding during the period. |
| (b) | Total return is calculated assuming a purchase of a share on the first day of the period and a sale of a share on the last day of each period reported. Dividends and distributions, if any, are assumed, for purposes of this calculation, to be reinvested. Total return does not reflect sales charges and includes the effect of fee waivers and reimbursements. Total return may reflect adjustments to conform to U.S. GAAP. Total return for a period of less than one year is not annualized. |
| (c) | Does not include expenses of the investment companies in which the Fund invests. |
| (d) | Annualized. |
| (e) | See Note 6 in the Notes to Financial Statements. |
| 222 | Semiannual Report | | May 31, 2015 | | See accompanying Notes to Financial Statements |
Table of Contents
| Total Dividends and Distributions | Net Asset Value, End of Period | Total Return (b) | Net Assets, End of Period (000s) | Ratio of Expenses to Average Net Assets with Fee Waiver/ Reimbursement (c) | Ratio of Expenses to Average Net Assets without Fee Waiver/ Reimbursement (c) | Ratio of Net Investment Income to Average Net Assets (c) | Portfolio Turnover Rate | |||||||||||||||||||||||||
| $ | (0.50 | ) | $ | 16.87 | 0.48 | % | $ | 31,483 | 0.48 | %(d) | 0.62 | %(d) | 3.62 | %(d) | 92 | % | ||||||||||||||||
| (0.32 | ) | 17.30 | 4.22 | 31,358 | 0.41 | 0.60 | 2.16 | 93 | ||||||||||||||||||||||||
| (0.44 | ) | 16.92 | 4.54 | 13,058 | 0.40 | 0.60 | 2.48 | 76 | ||||||||||||||||||||||||
| (0.14 | ) | 16.63 | 11.86 | 335 | 0.38 | (d) | 0.60 | (d) | 2.22 | (d) | 55 | |||||||||||||||||||||
| $ | (0.42 | ) | $ | 16.83 | 0.29 | % | $ | 1,112 | 0.83 | %(d) | 0.87 | %(d) | 2.98 | %(d) | 92 | % | ||||||||||||||||
| (0.27 | ) | 17.21 | 3.83 | 1,004 | 0.76 | 0.85 | 1.89 | 93 | ||||||||||||||||||||||||
| (0.40 | ) | 16.84 | 4.16 | 753 | 0.75 | 0.85 | 2.88 | 76 | ||||||||||||||||||||||||
| (0.14 | ) | 16.57 | 11.51 | 1,284 | 0.73 | (d) | 0.85 | (d) | 1.19 | (d) | 55 | |||||||||||||||||||||
| $ | (0.55 | ) | $ | 16.98 | 0.63 | % | $ | 29,422 | 0.18 | %(d) | 0.22 | %(d) | 3.07 | %(d) | 92 | % | ||||||||||||||||
| (0.34 | ) | 17.43 | 4.49 | 13,866 | 0.11 | 0.20 | 2.32 | 93 | ||||||||||||||||||||||||
| (0.44 | ) | 17.02 | 4.84 | 4,336 | 0.10 | 0.20 | 2.88 | 76 | ||||||||||||||||||||||||
| (0.15 | ) | 16.67 | 12.21 | 3,873 | 0.08 | (d) | 0.20 | (d) | 2.47 | (d) | 55 | |||||||||||||||||||||
| $ | (0.56 | ) | $ | 17.00 | 0.70 | % | $ | 5,622 | 0.08 | %(d) | 0.12 | %(d) | 3.97 | %(d) | 92 | % | ||||||||||||||||
| (0.36 | ) | 17.45 | 4.60 | 6,745 | 0.01 | 0.10 | 2.54 | 93 | ||||||||||||||||||||||||
| (0.44 | ) | 17.04 | 4.93 | 5,058 | — | 0.12 | 3.02 | 76 | ||||||||||||||||||||||||
| (0.15 | ) | 16.68 | 12.28 | 5,375 | — | (d)(e) | 0.15 | (d) | 2.94 | (d) | 55 | |||||||||||||||||||||
| $ | (0.50 | ) | $ | 16.94 | 0.48 | % | $ | 1,186 | 0.42 | %(d) | 0.46 | %(d) | 9.69 | %(d) | 92 | % | ||||||||||||||||
| (0.32 | ) | 17.37 | 4.26 | 12,135 | 0.36 | 0.45 | 2.23 | 93 | ||||||||||||||||||||||||
| (0.39 | ) | 16.98 | 4.60 | 10,606 | 0.35 | 0.45 | 1.23 | 76 | ||||||||||||||||||||||||
| (0.14 | ) | 16.62 | 11.86 | 11 | 0.33 | (d) | 0.45 | (d) | 2.72 | (d) | 55 | |||||||||||||||||||||
| See accompanying Notes to Financial Statements | | May 31, 2015 | | Semiannual Report | 223 |
Table of Contents
Financial Highlights (cont’d)
For a Share Outstanding for the Period ended:
Net Asset Beginning | Net Investment Income (a) | Net Realized and Change in Unrealized Gain (Loss) | Total from Investment Operations | Dividends from Net Investment Income | Distributions from Net Realized Capital Gains | |||||||||||||||||||
| AllianzGI Retirement 2030: | ||||||||||||||||||||||||
| Class A | ||||||||||||||||||||||||
5/31/2015+ | $ | 21.05 | $ | 0.39 | $ | (0.28 | ) | $ | 0.11 | $ | (0.69 | ) | $ | (0.24 | ) | |||||||||
11/30/2014 | 20.66 | 0.48 | 0.38 | 0.86 | (0.47 | ) | — | |||||||||||||||||
11/30/2013 | 19.80 | 0.52 | 0.92 | 1.44 | (0.54 | ) | (0.04 | ) | ||||||||||||||||
11/30/2012 | 19.77 | 0.29 | 1.61 | 1.90 | (0.70 | ) | (1.17 | ) | ||||||||||||||||
11/30/2011 | 20.78 | 0.50 | (0.10 | ) | 0.40 | (0.85 | ) | (0.56 | ) | |||||||||||||||
11/30/2010 | 19.36 | 0.50 | 1.59 | 2.09 | (0.51 | ) | (0.16 | ) | ||||||||||||||||
| Class C | ||||||||||||||||||||||||
5/31/2015+ | $ | 20.83 | $ | 0.30 | $ | (0.26 | ) | $ | 0.04 | $ | (0.50 | ) | $ | (0.24 | ) | |||||||||
11/30/2014 | 20.42 | 0.33 | 0.36 | 0.69 | (0.28 | ) | — | |||||||||||||||||
11/30/2013 | 19.53 | 0.35 | 0.93 | 1.28 | (0.35 | ) | (0.04 | ) | ||||||||||||||||
11/30/2012 | 19.51 | 0.43 | 1.30 | 1.73 | (0.54 | ) | (1.17 | ) | ||||||||||||||||
11/30/2011 | 20.59 | 0.37 | (0.09 | ) | 0.28 | (0.80 | ) | (0.56 | ) | |||||||||||||||
11/30/2010 | 19.28 | 0.26 | 1.66 | 1.92 | (0.45 | ) | (0.16 | ) | ||||||||||||||||
| Class D | ||||||||||||||||||||||||
5/31/2015+ | $ | 21.16 | $ | 0.38 | $ | (0.28 | ) | $ | 0.10 | $ | (0.65 | ) | $ | (0.24 | ) | |||||||||
11/30/2014 | 20.74 | 0.47 | 0.38 | 0.85 | (0.43 | ) | — | |||||||||||||||||
11/30/2013 | 19.84 | 0.52 | 0.90 | 1.42 | (0.48 | ) | (0.04 | ) | ||||||||||||||||
11/30/2012 | 19.82 | 0.52 | 1.36 | 1.88 | (0.69 | ) | (1.17 | ) | ||||||||||||||||
11/30/2011 | 20.82 | 0.53 | (0.12 | ) | 0.41 | (0.85 | ) | (0.56 | ) | |||||||||||||||
11/30/2010 | 19.40 | 0.47 | 1.62 | 2.09 | (0.51 | ) | (0.16 | ) | ||||||||||||||||
| Class R | ||||||||||||||||||||||||
5/31/2015+ | $ | 21.07 | $ | 0.33 | $ | (0.25 | ) | $ | 0.08 | $ | (0.61 | ) | $ | (0.24 | ) | |||||||||
11/30/2014 | 20.65 | 0.41 | 0.37 | 0.78 | (0.36 | ) | — | |||||||||||||||||
11/30/2013 | 19.85 | 0.46 | 0.91 | 1.37 | (0.53 | ) | (0.04 | ) | ||||||||||||||||
11/30/2012 | 19.81 | 0.18 | 1.67 | 1.85 | (0.64 | ) | (1.17 | ) | ||||||||||||||||
11/30/2011 | 20.80 | 0.52 | (0.15 | ) | 0.37 | (0.80 | ) | (0.56 | ) | |||||||||||||||
11/30/2010 | 19.37 | 0.49 | 1.54 | 2.03 | (0.44 | ) | (0.16 | ) | ||||||||||||||||
| Class P | ||||||||||||||||||||||||
5/31/2015+ | $ | 21.37 | $ | 0.34 | $ | (0.20 | ) | $ | 0.14 | $ | (0.74 | ) | $ | (0.24 | ) | |||||||||
11/30/2014 | 20.93 | 0.51 | 0.43 | 0.94 | (0.50 | ) | — | |||||||||||||||||
11/30/2013 | 20.02 | 0.51 | 1.00 | 1.51 | (0.56 | ) | (0.04 | ) | ||||||||||||||||
11/30/2012 | 19.95 | 0.41 | 1.57 | 1.98 | (0.74 | ) | (1.17 | ) | ||||||||||||||||
11/30/2011 | 20.92 | 0.58 | (0.12 | ) | 0.46 | (0.87 | ) | (0.56 | ) | |||||||||||||||
11/30/2010 | 19.45 | 0.58 | 1.56 | 2.14 | (0.51 | ) | (0.16 | ) | ||||||||||||||||
| Class R6 | ||||||||||||||||||||||||
5/31/2015+ | $ | 21.42 | $ | 0.42 | $ | (0.26 | ) | $ | 0.16 | $ | (0.76 | ) | $ | (0.24 | ) | |||||||||
11/30/2014 | 20.98 | 0.59 | 0.36 | 0.95 | (0.51 | ) | — | |||||||||||||||||
11/30/2013 | 20.04 | 0.62 | 0.92 | 1.54 | (0.56 | ) | (0.04 | ) | ||||||||||||||||
11/30/2012 | 19.97 | 0.61 | 1.38 | 1.99 | (0.75 | ) | (1.17 | ) | ||||||||||||||||
11/30/2011 | 20.94 | 0.62 | (0.14 | ) | 0.48 | (0.89 | ) | (0.56 | ) | |||||||||||||||
11/30/2010 | 19.47 | 0.59 | 1.56 | 2.15 | (0.52 | ) | (0.16 | ) | ||||||||||||||||
| Administrative Class | ||||||||||||||||||||||||
5/31/2015+ | $ | 21.28 | $ | 0.94 | $ | (0.83 | ) | $ | 0.11 | $ | (0.69 | ) | $ | (0.24 | ) | |||||||||
11/30/2014 | 20.87 | 0.50 | 0.38 | 0.88 | (0.47 | ) | — | |||||||||||||||||
11/30/2013 | 19.96 | 0.26 | 1.21 | 1.47 | (0.52 | ) | (0.04 | ) | ||||||||||||||||
11/30/2012 | 19.91 | 0.57 | 1.35 | 1.92 | (0.70 | ) | (1.17 | ) | ||||||||||||||||
11/30/2011 | 20.88 | 0.58 | (0.14 | ) | 0.44 | (0.85 | ) | (0.56 | ) | |||||||||||||||
11/30/2010 | 19.43 | 0.55 | 1.54 | 2.09 | (0.48 | ) | (0.16 | ) | ||||||||||||||||
| + | Unaudited |
| (a) | Calculated on average shares outstanding during the period. |
| 224 | Semiannual Report | | May 31, 2015 | | See accompanying Notes to Financial Statements |
Table of Contents
| Total Dividends and Distributions | Net Asset Value, End of Period | Total Return (b) | Net Assets, End of Period (000s) | Ratio of Expenses to Average Net Assets with Fee Waiver/ Reimbursement (c) | Ratio of Expenses to Average Net Assets without Fee Waiver/ Reimbursement (c) | Ratio of Net Investment Income to Average Net Assets (c) | Portfolio Turnover Rate | |||||||||||||||||||||||||
| $ | (0.93 | ) | $ | 20.23 | 0.59 | % | $ | 24,043 | 0.46 | %(d) | 0.62 | %(d) | 3.86 | %(d) | 95 | % | ||||||||||||||||
| (0.47 | ) | 21.05 | 4.26 | 25,487 | 0.39 | 0.60 | 2.28 | 93 | ||||||||||||||||||||||||
| (0.58 | ) | 20.66 | 7.48 | 10,080 | 0.35 | 0.60 | 2.58 | 79 | ||||||||||||||||||||||||
| (1.87 | ) | 19.80 | 10.68 | 10,692 | 0.29 | 0.60 | 1.48 | 47 | ||||||||||||||||||||||||
| (1.41 | ) | 19.77 | 1.76 | 460 | 0.45 | 2.50 | 2.43 | 52 | ||||||||||||||||||||||||
| (0.67 | ) | 20.78 | 11.07 | 286 | 0.63 | 5.46 | 2.57 | 33 | ||||||||||||||||||||||||
| $ | (0.74 | ) | $ | 20.13 | 0.24 | % | $ | 683 | 1.21 | %(d) | 1.37 | %(d) | 3.01 | %(d) | 95 | % | ||||||||||||||||
| (0.28 | ) | 20.83 | 3.43 | 680 | 1.14 | 1.35 | 1.59 | 93 | ||||||||||||||||||||||||
| (0.39 | ) | 20.42 | 6.63 | 736 | 1.10 | 1.35 | 1.77 | 79 | ||||||||||||||||||||||||
| (1.71 | ) | 19.53 | 9.80 | 605 | 1.04 | 1.35 | 2.26 | 47 | ||||||||||||||||||||||||
| (1.36 | ) | 19.51 | 1.20 | 654 | 1.21 | 3.34 | 1.84 | 52 | ||||||||||||||||||||||||
| (0.61 | ) | 20.59 | 10.17 | 542 | 1.38 | 7.39 | 1.32 | 33 | ||||||||||||||||||||||||
| $ | (0.89 | ) | $ | 20.37 | 0.56 | % | $ | 602 | 0.56 | %(d) | 0.62 | %(d) | 3.80 | %(d) | 95 | % | ||||||||||||||||
| (0.43 | ) | 21.16 | 4.17 | 639 | 0.49 | 0.60 | 2.22 | 93 | ||||||||||||||||||||||||
| (0.52 | ) | 20.74 | 7.34 | 643 | 0.45 | 0.60 | 2.60 | 79 | ||||||||||||||||||||||||
| (1.86 | ) | 19.84 | 10.48 | 519 | 0.39 | 0.60 | 2.69 | 47 | ||||||||||||||||||||||||
| (1.41 | ) | 19.82 | 1.89 | 377 | 0.48 | 2.51 | 2.59 | 52 | ||||||||||||||||||||||||
| (0.67 | ) | 20.82 | 11.04 | 295 | 0.63 | 5.63 | 2.41 | 33 | ||||||||||||||||||||||||
| $ | (0.85 | ) | $ | 20.30 | 0.44 | % | $ | 1,551 | 0.81 | %(d) | 0.87 | %(d) | 3.27 | %(d) | 95 | % | ||||||||||||||||
| (0.36 | ) | 21.07 | 3.85 | 1,420 | 0.74 | 0.85 | 1.94 | 93 | ||||||||||||||||||||||||
| (0.57 | ) | 20.65 | 7.09 | 1,199 | 0.70 | 0.85 | 2.28 | 79 | ||||||||||||||||||||||||
| (1.81 | ) | 19.85 | 10.23 | 1,103 | 0.64 | 0.85 | 0.95 | 47 | ||||||||||||||||||||||||
| (1.36 | ) | 19.81 | 1.66 | 14 | 0.74 | 2.82 | 2.54 | 52 | ||||||||||||||||||||||||
| (0.60 | ) | 20.80 | 10.73 | 14 | 0.88 | 5.79 | 2.53 | 33 | ||||||||||||||||||||||||
| $ | (0.98 | ) | $ | 20.53 | 0.76 | % | $ | 29,315 | 0.16 | %(d) | 0.22 | %(d) | 3.38 | %(d) | 95 | % | ||||||||||||||||
| (0.50 | ) | 21.37 | 4.58 | 17,741 | 0.09 | 0.20 | 2.42 | 93 | ||||||||||||||||||||||||
| (0.60 | ) | 20.93 | 7.77 | 7,748 | 0.05 | 0.20 | 2.54 | 79 | ||||||||||||||||||||||||
| (1.91 | ) | 20.02 | 10.97 | 5,103 | — | (e) | 0.20 | 2.06 | 47 | |||||||||||||||||||||||
| (1.43 | ) | 19.95 | 2.13 | 19 | 0.22 | 2.27 | 2.84 | 52 | ||||||||||||||||||||||||
| (0.67 | ) | 20.92 | 11.27 | 14 | 0.43 | 5.41 | 2.97 | 33 | ||||||||||||||||||||||||
| $ | (1.00 | ) | $ | 20.58 | 0.84 | % | $ | 9,419 | 0.06 | %(d) | 0.12 | %(d) | 4.11 | %(d) | 95 | % | ||||||||||||||||
| (0.51 | ) | 21.42 | 4.63 | 8,752 | — | (e) | 0.10 | 2.79 | 93 | |||||||||||||||||||||||
| (0.60 | ) | 20.98 | 7.87 | 10,854 | — | (e) | 0.12 | 3.05 | 79 | |||||||||||||||||||||||
| (1.92 | ) | 20.04 | 11.07 | 9,182 | — | (e) | 0.15 | 3.14 | 47 | |||||||||||||||||||||||
| (1.45 | ) | 19.97 | 2.23 | 5,813 | 0.13 | 2.24 | 3.04 | 52 | ||||||||||||||||||||||||
| (0.68 | ) | 20.94 | 11.35 | 5,145 | 0.33 | 5.29 | 3.02 | 33 | ||||||||||||||||||||||||
| $ | (0.93 | ) | $ | 20.46 | 0.61 | % | $ | 1,756 | 0.41 | %(d) | 0.46 | %(d) | 9.06 | %(d) | 95 | % | ||||||||||||||||
| (0.47 | ) | 21.28 | 4.29 | 9,586 | 0.34 | 0.45 | 2.37 | 93 | ||||||||||||||||||||||||
| (0.56 | ) | 20.87 | 7.55 | 8,939 | 0.30 | 0.45 | 1.29 | 79 | ||||||||||||||||||||||||
| (1.87 | ) | 19.96 | 10.60 | 16 | 0.24 | 0.45 | 2.95 | 47 | ||||||||||||||||||||||||
| (1.41 | ) | 19.91 | 1.99 | 15 | 0.41 | 2.52 | 2.85 | 52 | ||||||||||||||||||||||||
| (0.64 | ) | 20.88 | 11.04 | 14 | 0.58 | 5.55 | 2.82 | 33 | ||||||||||||||||||||||||
| (b) | Total return is calculated assuming a purchase of a share on the first day of the period and a sale of a share on the last day of each period reported. Dividends and distributions, if any, are assumed, for purposes of this calculation, to be reinvested. Total return does not reflect sales charges and includes the effect of fee waivers and reimbursements. Total return may reflect adjustments to conform to U.S. GAAP. Total return for a period of less than one year is not annualized. |
| (c) | Does not include expenses of the investment companies in which the Fund invests. |
| (d) | Annualized. |
| (e) | See Note 6 in the Notes to Financial Statements. |
| See accompanying Notes to Financial Statements | | May 31, 2015 | | Semiannual Report | 225 |
Table of Contents
Financial Highlights (cont’d)
For a Share Outstanding for the Period ended:
| Net Asset Value, Beginning of Period | Net Investment Income (a) | Net Realized and Change in Unrealized Gain (Loss) | Total from Investment Operations | Dividends from Net Investment Income | Distributions from Net Realized Capital Gains | |||||||||||||||||||
| AllianzGI Retirement 2035: | ||||||||||||||||||||||||
| Class A | ||||||||||||||||||||||||
5/31/2015+ | $ | 18.49 | $ | 0.34 | $ | (0.17 | ) | $ | 0.17 | $ | (0.63 | ) | $ | (0.16 | ) | |||||||||
11/30/2014 | 18.09 | 0.41 | 0.39 | 0.80 | (0.40 | ) | — | |||||||||||||||||
11/30/2013 | 16.94 | 0.43 | 1.20 | 1.63 | (0.42 | ) | (0.06 | ) | ||||||||||||||||
12/19/2011* - 11/30/2012 | 15.00 | 0.37 | 1.74 | 2.11 | (0.17 | ) | — | |||||||||||||||||
| Class R | ||||||||||||||||||||||||
5/31/2015+ | $ | 18.43 | $ | 0.24 | $ | (0.11 | ) | $ | 0.13 | $ | (0.55 | ) | $ | (0.16 | ) | |||||||||
11/30/2014 | 18.00 | 0.35 | 0.38 | 0.73 | (0.30 | ) | — | |||||||||||||||||
11/30/2013 | 16.89 | 0.41 | 1.15 | 1.56 | (0.39 | ) | (0.06 | ) | ||||||||||||||||
12/19/2011* - 11/30/2012 | 15.00 | 0.16 | 1.90 | 2.06 | (0.17 | ) | — | |||||||||||||||||
| Class P | ||||||||||||||||||||||||
5/31/2015+ | $ | 18.65 | $ | 0.28 | $ | (0.09 | ) | $ | 0.19 | $ | (0.67 | ) | $ | (0.16 | ) | |||||||||
11/30/2014 | 18.20 | 0.43 | 0.43 | 0.86 | (0.41 | ) | — | |||||||||||||||||
11/30/2013 | 16.99 | 0.49 | 1.20 | 1.69 | (0.42 | ) | (0.06 | ) | ||||||||||||||||
12/19/2011* - 11/30/2012 | 15.00 | 0.38 | 1.79 | 2.17 | (0.18 | ) | — | |||||||||||||||||
| Class R6 | ||||||||||||||||||||||||
5/31/2015+ | $ | 18.68 | $ | 0.38 | $ | (0.18 | ) | $ | 0.20 | $ | (0.68 | ) | $ | (0.16 | ) | |||||||||
11/30/2014 | 18.23 | 0.49 | 0.38 | 0.87 | (0.42 | ) | — | |||||||||||||||||
11/30/2013 | 17.00 | 0.54 | 1.17 | 1.71 | (0.42 | ) | (0.06 | ) | ||||||||||||||||
12/19/2011* - 11/30/2012 | 15.00 | 0.46 | 1.72 | 2.18 | (0.18 | ) | — | |||||||||||||||||
| Administrative Class | ||||||||||||||||||||||||
5/31/2015+ | $ | 18.58 | $ | 1.14 | $ | (0.99 | ) | $ | 0.15 | $ | (0.62 | ) | $ | (0.16 | ) | |||||||||
11/30/2014 | 18.15 | 0.43 | 0.39 | 0.82 | (0.39 | ) | — | |||||||||||||||||
11/30/2013 | 16.94 | 0.22 | 1.43 | 1.65 | (0.38 | ) | (0.06 | ) | ||||||||||||||||
12/19/2011* - 11/30/2012 | 15.00 | 0.42 | 1.69 | 2.11 | (0.17 | ) | — | |||||||||||||||||
| + | Unaudited |
| * | Commencement of operations. |
| (a) | Calculated on average shares outstanding during the period. |
| (b) | Total return is calculated assuming a purchase of a share on the first day of the period and a sale of a share on the last day of each period reported. Dividends and distributions, if any, are assumed, for purposes of this calculation, to be reinvested. Total return does not reflect sales charges and includes the effect of fee waivers and reimbursements. Total return may reflect adjustments to conform to U.S. GAAP. Total return for a period of less than one year is not annualized. |
| (c) | Does not include expenses of the investment companies in which the Fund invests. |
| (d) | Annualized. |
| (e) | See Note 6 in the Notes to Financial Statements. |
| 226 | Semiannual Report | | May 31, 2015 | | See accompanying Notes to Financial Statements |
Table of Contents
| Total Dividends and Distributions | Net Asset Value, End of Period | Total Return (b) | Net Assets, End of Period (000s) | Ratio of Expenses to Average Net Assets with Fee Waiver/ Reimbursement (c) | Ratio of Expenses to Average Net Assets without Fee Waiver/ Reimbursement (c) | Ratio of Net Investment Income to Average Net Assets (c) | Portfolio Turnover Rate | |||||||||||||||||||||||||
| $ | (0.79 | ) | $ | 17.87 | 0.98 | % | $ | 20,245 | 0.43 | %(d) | 0.61 | %(d) | 3.88 | %(d) | 87 | % | ||||||||||||||||
| (0.40 | ) | 18.49 | 4.49 | 20,351 | 0.39 | 0.60 | 2.27 | 90 | ||||||||||||||||||||||||
| (0.48 | ) | 18.09 | 9.83 | 6,939 | 0.35 | 0.60 | 2.48 | 67 | ||||||||||||||||||||||||
| (0.17 | ) | 16.94 | 14.23 | 104 | 0.30 | (d) | 0.60 | (d) | 2.36 | (d) | 38 | |||||||||||||||||||||
| $ | (0.71 | ) | $ | 17.85 | 0.79 | % | $ | 1,631 | 0.79 | %(d) | 0.87 | %(d) | 2.76 | %(d) | 87 | % | ||||||||||||||||
| (0.30 | ) | 18.43 | 4.14 | 1,089 | 0.74 | 0.85 | 1.93 | 90 | ||||||||||||||||||||||||
| (0.45 | ) | 18.00 | 9.46 | 961 | 0.70 | 0.85 | 2.38 | 67 | ||||||||||||||||||||||||
| (0.17 | ) | 16.89 | 13.88 | 893 | 0.65 | (d) | 0.85 | (d) | 1.04 | (d) | 38 | |||||||||||||||||||||
| $ | (0.83 | ) | $ | 18.01 | 1.10 | % | $ | 28,532 | 0.13 | %(d) | 0.21 | %(d) | 3.13 | %(d) | 87 | % | ||||||||||||||||
| (0.41 | ) | 18.65 | 4.84 | 14,105 | 0.09 | 0.20 | 2.32 | 90 | ||||||||||||||||||||||||
| (0.48 | ) | 18.20 | 10.19 | 5,333 | 0.05 | 0.20 | 2.83 | 67 | ||||||||||||||||||||||||
| (0.18 | ) | 16.99 | 14.58 | 4,090 | — | (d) | 0.20 | (d) | 2.43 | (d) | 38 | |||||||||||||||||||||
| $ | (0.84 | ) | $ | 18.04 | 1.18 | % | $ | 3,561 | 0.03 | %(d) | 0.11 | %(d) | 4.26 | %(d) | 87 | % | ||||||||||||||||
| (0.42 | ) | 18.68 | 4.89 | 6,587 | — | (e) | 0.10 | 2.66 | 90 | |||||||||||||||||||||||
| (0.48 | ) | 18.23 | 10.24 | 5,850 | — | (e) | 0.12 | 3.10 | 67 | |||||||||||||||||||||||
| (0.18 | ) | 17.00 | 14.65 | 5,132 | — | (d)(e) | 0.15 | (d) | 3.00 | (d) | 38 | |||||||||||||||||||||
| $ | (0.78 | ) | $ | 17.95 | 0.90 | % | $ | 907 | 0.38 | %(d) | 0.45 | %(d) | 12.41 | %(d) | 87 | % | ||||||||||||||||
| (0.39 | ) | 18.58 | 4.60 | 11,550 | 0.34 | 0.45 | 2.33 | 90 | ||||||||||||||||||||||||
| (0.44 | ) | 18.15 | 9.95 | 10,427 | 0.30 | 0.45 | 1.29 | 67 | ||||||||||||||||||||||||
| (0.17 | ) | 16.94 | 14.23 | 12 | 0.25 | (d) | 0.45 | (d) | 2.76 | (d) | 38 | |||||||||||||||||||||
| See accompanying Notes to Financial Statements | | May 31, 2015 | | Semiannual Report | 227 |
Table of Contents
Financial Highlights (cont’d)
For a Share Outstanding for the Period ended:
| Net Asset Value, Beginning of Period | Net Investment Income (a) | Net Realized and Change in Unrealized Gain (Loss) | Total from Investment Operations | Dividends from Net Investment Income | Distributions from Net Realized Capital Gains | |||||||||||||||||||
| AllianzGI Retirement 2040: | ||||||||||||||||||||||||
| Class A | ||||||||||||||||||||||||
5/31/2015+ | $ | 21.91 | $ | 0.39 | $ | (0.17 | ) | $ | 0.22 | $ | (0.83 | ) | $ | (0.52 | ) | |||||||||
11/30/2014 | 21.45 | 0.48 | 0.50 | 0.98 | (0.51 | ) | (0.01 | ) | ||||||||||||||||
11/30/2013 | 19.71 | 0.49 | 1.82 | 2.31 | (0.53 | ) | (0.04 | ) | ||||||||||||||||
11/30/2012 | 20.22 | 0.29 | 1.61 | 1.90 | (0.69 | ) | (1.72 | ) | ||||||||||||||||
11/30/2011 | 21.88 | 0.52 | (0.27 | ) | 0.25 | (0.97 | ) | (0.94 | ) | |||||||||||||||
11/30/2010 | 20.08 | 0.73 | 1.71 | 2.44 | (0.49 | ) | (0.15 | ) | ||||||||||||||||
| Class C | ||||||||||||||||||||||||
5/31/2015+ | $ | 21.68 | $ | 0.32 | $ | (0.17 | ) | $ | 0.15 | $ | (0.59 | ) | $ | (0.52 | ) | |||||||||
11/30/2014 | 21.21 | 0.33 | 0.48 | 0.81 | (0.33 | ) | (0.01 | ) | ||||||||||||||||
11/30/2013 | 19.53 | 0.34 | 1.80 | 2.14 | (0.42 | ) | (0.04 | ) | ||||||||||||||||
11/30/2012 | 20.07 | 0.31 | 1.43 | 1.74 | (0.56 | ) | (1.72 | ) | ||||||||||||||||
11/30/2011 | 21.65 | 0.27 | (0.18 | ) | 0.09 | (0.73 | ) | (0.94 | ) | |||||||||||||||
11/30/2010 | 19.92 | 0.57 | 1.69 | 2.26 | (0.38 | ) | (0.15 | ) | ||||||||||||||||
| Class D | ||||||||||||||||||||||||
5/31/2015+ | $ | 21.93 | $ | 0.32 | $ | (0.09 | ) | $ | 0.23 | $ | (0.80 | ) | $ | (0.52 | ) | |||||||||
11/30/2014 | 21.42 | 0.47 | 0.48 | 0.95 | (0.43 | ) | (0.01 | ) | ||||||||||||||||
11/30/2013 | 19.61 | 0.56 | 1.74 | 2.30 | (0.45 | ) | (0.04 | ) | ||||||||||||||||
11/30/2012 | 20.16 | 0.41 | 1.44 | 1.85 | (0.68 | ) | (1.72 | ) | ||||||||||||||||
11/30/2011 | 21.88 | 0.76 | (0.51 | ) | 0.25 | (1.03 | ) | (0.94 | ) | |||||||||||||||
11/30/2010 | 20.05 | 0.52 | 1.92 | 2.44 | (0.46 | ) | (0.15 | ) | ||||||||||||||||
| Class R | ||||||||||||||||||||||||
5/31/2015+ | $ | 21.80 | $ | 0.36 | $ | (0.17 | ) | $ | 0.19 | $ | (0.75 | ) | $ | (0.52 | ) | |||||||||
11/30/2014 | 21.31 | 0.41 | 0.49 | 0.90 | (0.40 | ) | (0.01 | ) | ||||||||||||||||
11/30/2013 | 19.63 | 0.44 | 1.80 | 2.24 | (0.52 | ) | (0.04 | ) | ||||||||||||||||
11/30/2012 | 20.16 | 0.16 | 1.66 | 1.82 | (0.63 | ) | (1.72 | ) | ||||||||||||||||
11/30/2011 | 21.85 | 0.56 | (0.36 | ) | 0.20 | (0.95 | ) | (0.94 | ) | |||||||||||||||
11/30/2010 | 20.03 | 0.59 | 1.80 | 2.39 | (0.42 | ) | (0.15 | ) | ||||||||||||||||
| Class P | ||||||||||||||||||||||||
5/31/2015+ | $ | 22.15 | $ | 0.35 | $ | (0.09 | ) | $ | 0.26 | $ | (0.89 | ) | $ | (0.52 | ) | |||||||||
11/30/2014 | 21.63 | 0.50 | 0.56 | 1.06 | (0.53 | ) | (0.01 | ) | ||||||||||||||||
11/30/2013 | 19.82 | 0.49 | 1.90 | 2.39 | (0.54 | ) | (0.04 | ) | ||||||||||||||||
11/30/2012 | 20.31 | 0.39 | 1.57 | 1.96 | (0.73 | ) | (1.72 | ) | ||||||||||||||||
11/30/2011 | 21.97 | 0.67 | (0.36 | ) | 0.31 | (1.03 | ) | (0.94 | ) | |||||||||||||||
11/30/2010 | 20.12 | 0.68 | 1.80 | 2.48 | (0.48 | ) | (0.15 | ) | ||||||||||||||||
| Class R6 | ||||||||||||||||||||||||
5/31/2015+ | $ | 22.19 | $ | 0.43 | $ | (0.15 | ) | $ | 0.28 | $ | (0.91 | ) | $ | (0.52 | ) | |||||||||
11/30/2014 | 21.66 | 0.61 | 0.47 | 1.08 | (0.54 | ) | (0.01 | ) | ||||||||||||||||
11/30/2013 | 19.83 | 0.60 | 1.81 | 2.41 | (0.54 | ) | (0.04 | ) | ||||||||||||||||
11/30/2012 | 20.33 | 0.56 | 1.41 | 1.97 | (0.75 | ) | (1.72 | ) | ||||||||||||||||
11/30/2011 | 22.00 | 0.68 | (0.36 | ) | 0.32 | (1.05 | ) | (0.94 | ) | |||||||||||||||
11/30/2010 | 20.13 | 0.70 | 1.82 | 2.52 | (0.50 | ) | (0.15 | ) | ||||||||||||||||
| Administrative Class | ||||||||||||||||||||||||
5/31/2015+ | $ | 22.02 | $ | 1.25 | $ | (1.03 | ) | $ | 0.22 | $ | (0.84 | ) | $ | (0.52 | ) | |||||||||
11/30/2014 | 21.53 | 0.50 | 0.49 | 0.99 | (0.49 | ) | (0.01 | ) | ||||||||||||||||
11/30/2013 | 19.75 | 0.26 | 2.07 | 2.33 | (0.51 | ) | (0.04 | ) | ||||||||||||||||
11/30/2012 | 20.26 | 0.52 | 1.38 | 1.90 | (0.69 | ) | (1.72 | ) | ||||||||||||||||
11/30/2011 | 21.93 | 0.63 | (0.36 | ) | 0.27 | (1.00 | ) | (0.94 | ) | |||||||||||||||
11/30/2010 | 20.09 | 0.65 | 1.80 | 2.45 | (0.46 | ) | (0.15 | ) | ||||||||||||||||
| + | Unaudited |
| (a) | Calculated on average shares outstanding during the period. |
| 228 | Semiannual Report | | May 31, 2015 | | See accompanying Notes to Financial Statements |
Table of Contents
| Total Dividends and Distributions | Net Asset Value, End of Period | Total Return (b) | Net Assets, End of Period (000s) | Ratio of Expenses to Average Net Assets with Fee Waiver/ Reimbursement (c) | Ratio of Expenses to Average Net Assets without Fee Waiver/ Reimbursement (c) | Ratio of Net Investment Income to Average Net Assets (c) | Portfolio Turnover Rate | |||||||||||||||||||||||||
| $ | (1.35 | ) | $ | 20.78 | 1.19 | % | $ | 16,004 | 0.41 | %(d) | 0.60 | %(d) | 3.79 | %(d) | 89 | % | ||||||||||||||||
| (0.52 | ) | 21.91 | 4.65 | 16,631 | 0.38 | 0.60 | 2.22 | 84 | ||||||||||||||||||||||||
| (0.57 | ) | 21.45 | 12.11 | 5,513 | 0.35 | 0.60 | 2.40 | 61 | ||||||||||||||||||||||||
| (2.41 | ) | 19.71 | 10.61 | 1,915 | 0.28 | 0.60 | 1.52 | 45 | ||||||||||||||||||||||||
| (1.91 | ) | 20.22 | 0.81 | 151 | 0.42 | 2.96 | 2.42 | 53 | ||||||||||||||||||||||||
| (0.64 | ) | 21.88 | 12.48 | 79 | 0.56 | 5.99 | 3.57 | 44 | ||||||||||||||||||||||||
| $ | (1.11 | ) | $ | 20.72 | 0.83 | % | $ | 205 | 1.16 | %(d) | 1.35 | %(d) | 3.14 | %(d) | 89 | % | ||||||||||||||||
| (0.34 | ) | 21.68 | 3.90 | 269 | 1.13 | 1.35 | 1.51 | 84 | ||||||||||||||||||||||||
| (0.46 | ) | 21.21 | 11.20 | 317 | 1.10 | 1.35 | 1.66 | 61 | ||||||||||||||||||||||||
| (2.28 | ) | 19.53 | 9.80 | 195 | 1.03 | 1.35 | 1.66 | 45 | ||||||||||||||||||||||||
| (1.67 | ) | 20.07 | 0.07 | 87 | 1.15 | 3.56 | 1.30 | 53 | ||||||||||||||||||||||||
| (0.53 | ) | 21.65 | 11.61 | 22 | 1.31 | 6.66 | 2.82 | 44 | ||||||||||||||||||||||||
| $ | (1.32 | ) | $ | 20.84 | 1.19 | % | $ | 290 | 0.51 | %(d) | 0.60 | %(d) | 3.11 | %(d) | 89 | % | ||||||||||||||||
| (0.44 | ) | 21.93 | 4.53 | 217 | 0.48 | 0.60 | 2.15 | 84 | ||||||||||||||||||||||||
| (0.49 | ) | 21.42 | 11.94 | 229 | 0.45 | 0.60 | 2.76 | 61 | ||||||||||||||||||||||||
| (2.40 | ) | 19.61 | 10.42 | 245 | 0.38 | 0.60 | 2.16 | 45 | ||||||||||||||||||||||||
| (1.97 | ) | 20.16 | 0.77 | 187 | 0.46 | 3.00 | 3.57 | 53 | ||||||||||||||||||||||||
| (0.61 | ) | 21.88 | 12.49 | 177 | 0.56 | 6.58 | 2.51 | 44 | ||||||||||||||||||||||||
| $ | (1.27 | ) | $ | 20.72 | 1.02 | % | $ | 1,248 | 0.76 | %(d) | 0.85 | %(d) | 3.52 | %(d) | 89 | % | ||||||||||||||||
| (0.41 | ) | 21.80 | 4.31 | 1,343 | 0.73 | 0.85 | 1.88 | 84 | ||||||||||||||||||||||||
| (0.56 | ) | 21.31 | 11.70 | 1,167 | 0.70 | 0.85 | 2.15 | 61 | ||||||||||||||||||||||||
| (2.35 | ) | 19.63 | 10.24 | 848 | 0.63 | 0.85 | 0.87 | 45 | ||||||||||||||||||||||||
| (1.89 | ) | 20.16 | 0.54 | 15 | 0.70 | 3.22 | 2.63 | 53 | ||||||||||||||||||||||||
| (0.57 | ) | 21.85 | 12.19 | 15 | 0.81 | 6.50 | 2.90 | 44 | ||||||||||||||||||||||||
| $ | (1.41 | ) | $ | 21.00 | 1.35 | % | $ | 16,920 | 0.11 | %(d) | 0.20 | %(d) | 3.41 | %(d) | 89 | % | ||||||||||||||||
| (0.54 | ) | 22.15 | 4.99 | 11,734 | 0.08 | 0.20 | 2.27 | 84 | ||||||||||||||||||||||||
| (0.58 | ) | 21.63 | 12.42 | 4,704 | 0.05 | 0.20 | 2.37 | 61 | ||||||||||||||||||||||||
| (2.45 | ) | 19.82 | 10.99 | 2,343 | — | (e) | 0.20 | 2.00 | 45 | |||||||||||||||||||||||
| (1.97 | ) | 20.31 | 1.06 | 15 | 0.21 | 2.75 | 3.11 | 53 | ||||||||||||||||||||||||
| (0.63 | ) | 21.97 | 12.64 | 15 | 0.36 | 6.10 | 3.35 | 44 | ||||||||||||||||||||||||
| $ | (1.43 | ) | $ | 21.04 | 1.43 | % | $ | 8,753 | 0.01 | %(d) | 0.10 | %(d) | 4.09 | %(d) | 89 | % | ||||||||||||||||
| (0.55 | ) | 22.19 | 5.09 | 8,071 | — | (e) | 0.10 | 2.78 | 84 | |||||||||||||||||||||||
| (0.58 | ) | 21.66 | 12.51 | 9,939 | — | (e) | 0.12 | 2.93 | 61 | |||||||||||||||||||||||
| (2.47 | ) | 19.83 | 11.04 | 7,782 | — | (e) | 0.15 | 2.95 | 45 | |||||||||||||||||||||||
| (1.99 | ) | 20.33 | 1.11 | 5,315 | 0.10 | 2.65 | 3.15 | 53 | ||||||||||||||||||||||||
| (0.65 | ) | 22.00 | 12.83 | 4,769 | 0.26 | 5.98 | 3.43 | 44 | ||||||||||||||||||||||||
| $ | (1.36 | ) | $ | 20.88 | 1.14 | % | $ | 457 | 0.36 | %(d) | 0.45 | %(d) | 11.64 | %(d) | 89 | % | ||||||||||||||||
| (0.50 | ) | 22.02 | 4.72 | 5,278 | 0.33 | 0.45 | 2.31 | 84 | ||||||||||||||||||||||||
| (0.55 | ) | 21.53 | 12.13 | 5,054 | 0.30 | 0.45 | 1.27 | 61 | ||||||||||||||||||||||||
| (2.41 | ) | 19.75 | 10.67 | 17 | 0.23 | 0.45 | 2.72 | 45 | ||||||||||||||||||||||||
| (1.94 | ) | 20.26 | 0.87 | 15 | 0.38 | 2.93 | 2.94 | 53 | ||||||||||||||||||||||||
| (0.61 | ) | 21.93 | 12.48 | 15 | 0.51 | 6.24 | 3.20 | 44 | ||||||||||||||||||||||||
| (b) | Total return is calculated assuming a purchase of a share on the first day of the period and a sale of a share on the last day of each period reported. Dividends and distributions, if any, are assumed, for purposes of this calculation, to be reinvested. Total return does not reflect sales charges and includes the effect of fee waivers and reimbursements. Total return may reflect adjustments to conform to U.S. GAAP. Total return for a period of less than one year is not annualized. |
| (c) | Does not include expenses of the investment companies in which the Fund invests. |
| (d) | Annualized. |
| (e) | See Note 6 in the Notes to Financial Statements. |
| See accompanying Notes to Financial Statements | | May 31, 2015 | | Semiannual Report | 229 |
Table of Contents
Financial Highlights (cont’d)
For a Share Outstanding for the Period ended:
| Net Asset Value, Beginning of Period | Net Investment Income (a) | Net Realized and Change in Unrealized Gain (Loss) | Total from Investment Operations | Dividends from Net Investment Income | Distributions from Net Realized Capital Gains | |||||||||||||||||||
| AllianzGI Retirement 2045: | ||||||||||||||||||||||||
| Class A | ||||||||||||||||||||||||
5/31/2015+ | $ | 19.09 | $ | 0.35 | $ | (0.08 | ) | $ | 0.27 | $ | (0.72 | ) | $ | (0.24 | ) | |||||||||
11/30/2014 | 18.67 | 0.41 | 0.49 | 0.90 | (0.45 | ) | (0.03 | ) | ||||||||||||||||
11/30/2013 | 17.02 | 0.41 | 1.79 | 2.20 | (0.46 | ) | (0.09 | ) | ||||||||||||||||
12/19/2011* - 11/30/2012 | 15.00 | 0.32 | 1.92 | 2.24 | (0.22 | ) | — | |||||||||||||||||
| Class R | ||||||||||||||||||||||||
5/31/2015+ | $ | 19.01 | $ | 0.31 | $ | (0.07 | ) | $ | 0.24 | $ | (0.66 | ) | $ | (0.24 | ) | |||||||||
11/30/2014 | 18.57 | 0.34 | 0.49 | 0.83 | (0.36 | ) | (0.03 | ) | ||||||||||||||||
11/30/2013 | 16.96 | 0.38 | 1.75 | 2.13 | (0.43 | ) | (0.09 | ) | ||||||||||||||||
12/19/2011* - 11/30/2012 | 15.00 | 0.16 | 2.02 | 2.18 | (0.22 | ) | — | |||||||||||||||||
| Class P | ||||||||||||||||||||||||
5/31/2015+ | $ | 19.24 | $ | 0.35 | $ | (0.05 | ) | $ | 0.30 | $ | (0.77 | ) | $ | (0.24 | ) | |||||||||
11/30/2014 | 18.77 | 0.40 | 0.57 | 0.97 | (0.47 | ) | (0.03 | ) | ||||||||||||||||
11/30/2013 | 17.06 | 0.47 | 1.79 | 2.26 | (0.46 | ) | (0.09 | ) | ||||||||||||||||
12/19/2011* - 11/30/2012 | 15.00 | 0.39 | 1.89 | 2.28 | (0.22 | ) | — | |||||||||||||||||
| Class R6 | ||||||||||||||||||||||||
5/31/2015+ | $ | 19.28 | $ | 0.47 | $ | (0.16 | ) | $ | 0.31 | $ | (0.78 | ) | $ | (0.24 | ) | |||||||||
11/30/2014 | 18.80 | 0.49 | 0.49 | 0.98 | (0.47 | ) | (0.03 | ) | ||||||||||||||||
11/30/2013 | 17.07 | 0.52 | 1.76 | 2.28 | (0.46 | ) | (0.09 | ) | ||||||||||||||||
12/19/2011* - 11/30/2012 | 15.00 | 0.50 | 1.79 | 2.29 | (0.22 | ) | — | |||||||||||||||||
| Administrative Class | ||||||||||||||||||||||||
5/31/2015+ | $ | 19.15 | $ | 1.00 | $ | (0.74 | ) | $ | 0.26 | $ | (0.72 | ) | $ | (0.24 | ) | |||||||||
11/30/2014 | 18.71 | 0.42 | 0.49 | 0.91 | (0.44 | ) | (0.03 | ) | ||||||||||||||||
11/30/2013 | 17.01 | 0.22 | 1.99 | 2.21 | (0.42 | ) | (0.09 | ) | ||||||||||||||||
12/19/2011* - 11/30/2012 | 15.00 | 0.44 | 1.79 | 2.23 | (0.22 | ) | — | |||||||||||||||||
| + | Unaudited |
| * | Commencement of operations. |
| (a) | Calculated on average shares outstanding during the period. |
| (b) | Total return is calculated assuming a purchase of a share on the first day of the period and a sale of a share on the last day of each period reported. Dividends and distributions, if any, are assumed, for purposes of this calculation, to be reinvested. Total return does not reflect sales charges and includes the effect of fee waivers and reimbursements. Total return may reflect adjustments to conform to U.S. GAAP. Total return for a period of less than one year is not annualized. |
| (c) | Does not include expenses of the investment companies in which the Fund invests. |
| (d) | Annualized. |
| (e) | See Note 6 in the Notes to Financial Statements. |
| (f) | Less than 0.01%. |
| 230 | Semiannual Report | | May 31, 2015 | | See accompanying Notes to Financial Statements |
Table of Contents
| Total Dividends and Distributions | Net Asset Value, End of Period | Total Return (b) | Net Assets, End of Period (000s) | Ratio of Expenses to Average Net Assets with Fee Waiver/ Reimbursement (c) | Ratio of Expenses to Average Net Assets without Fee Waiver/ Reimbursement (c) | Ratio of Net Investment Income to Average Net Assets (c) | Portfolio Turnover Rate | |||||||||||||||||||||||||
| $ | (0.96 | ) | $ | 18.40 | 1.58 | % | $ | 10,929 | 0.40 | %(d) | 0.61 | %(d) | 3.82 | %(d) | 90 | % | ||||||||||||||||
| (0.48 | ) | 19.09 | 4.89 | 10,080 | 0.37 | 0.60 | 2.17 | 69 | ||||||||||||||||||||||||
| (0.55 | ) | 18.67 | 13.33 | 4,313 | 0.33 | 0.60 | 2.31 | 51 | ||||||||||||||||||||||||
| (0.22 | ) | 17.02 | 15.09 | 61 | 0.29 | (d) | 0.60 | (d) | 2.08 | (d) | 38 | |||||||||||||||||||||
| $ | (0.90 | ) | $ | 18.35 | 1.40 | % | $ | 509 | 0.75 | %(d) | 0.86 | %(d) | 3.45 | %(d) | 90 | % | ||||||||||||||||
| (0.39 | ) | 19.01 | 4.52 | 449 | 0.72 | 0.85 | 1.82 | 69 | ||||||||||||||||||||||||
| (0.52 | ) | 18.57 | 12.94 | 356 | 0.68 | 0.85 | 2.17 | 51 | ||||||||||||||||||||||||
| (0.22 | ) | 16.96 | 14.67 | 293 | 0.64 | (d) | 0.85 | (d) | 1.07 | (d) | 38 | |||||||||||||||||||||
| $ | (1.01 | ) | $ | 18.53 | 1.73 | % | $ | 11,043 | 0.10 | %(d) | 0.21 | %(d) | 3.84 | %(d) | 90 | % | ||||||||||||||||
| (0.50 | ) | 19.24 | 5.26 | 8,793 | 0.07 | 0.20 | 2.10 | 69 | ||||||||||||||||||||||||
| (0.55 | ) | 18.77 | 13.68 | 2,286 | 0.03 | 0.20 | 2.63 | 51 | ||||||||||||||||||||||||
| (0.22 | ) | 17.06 | 15.37 | 1,584 | — | (d)(e) | 0.20 | (d) | 2.46 | (d) | 38 | |||||||||||||||||||||
| $ | (1.02 | ) | $ | 18.57 | 1.79 | % | $ | 1,525 | — | %(d)(e)(f) | 0.10 | %(d) | 5.08 | %(d) | 90 | % | ||||||||||||||||
| (0.50 | ) | 19.28 | 5.33 | 5,477 | — | (e) | 0.10 | 2.55 | 69 | |||||||||||||||||||||||
| (0.55 | ) | 18.80 | 13.80 | 4,587 | — | (e) | 0.12 | 2.91 | 51 | |||||||||||||||||||||||
| (0.22 | ) | 17.07 | 15.44 | 3,733 | — | (d)(e) | 0.15 | (d) | 3.23 | (d) | 38 | |||||||||||||||||||||
| $ | (0.96 | ) | $ | 18.45 | 1.53 | % | $ | 319 | 0.35 | %(d) | 0.45 | %(d) | 10.77 | %(d) | 90 | % | ||||||||||||||||
| (0.47 | ) | 19.15 | 4.95 | 1,763 | 0.32 | 0.45 | 2.24 | 69 | ||||||||||||||||||||||||
| (0.51 | ) | 18.71 | 13.40 | 1,542 | 0.28 | 0.45 | 1.23 | 51 | ||||||||||||||||||||||||
| (0.22 | ) | 17.01 | 15.02 | 12 | 0.24 | (d) | 0.45 | (d) | 2.84 | (d) | 38 | |||||||||||||||||||||
| See accompanying Notes to Financial Statements | | May 31, 2015 | | Semiannual Report | 231 |
Table of Contents
Financial Highlights (cont’d)
For a Share Outstanding for the Period ended:
| Net Asset Value, Beginning of Period | Net Investment Income (a) | Net Realized and Change in Unrealized Gain (Loss) | Total from Investment Operations | Dividends from Net Investment Income | Distributions from Net Realized Capital Gains | |||||||||||||||||||
| AllianzGI Retirement 2050: | ||||||||||||||||||||||||
| Class A | ||||||||||||||||||||||||
5/31/2015+ | $ | 21.87 | $ | 0.38 | $ | (0.09 | ) | $ | 0.29 | $ | (0.87 | ) | $ | (0.58 | ) | |||||||||
11/30/2014 | 21.55 | 0.44 | 0.58 | 1.02 | (0.57 | ) | (0.13 | ) | ||||||||||||||||
11/30/2013 | 19.48 | 0.42 | 2.32 | 2.74 | (0.60 | ) | (0.07 | ) | ||||||||||||||||
11/30/2012 | 20.16 | 0.28 | 1.59 | 1.87 | (0.76 | ) | (1.79 | ) | ||||||||||||||||
11/30/2011 | 22.00 | 0.61 | (0.34 | ) | 0.27 | (1.09 | ) | (1.02 | ) | |||||||||||||||
11/30/2010 | 20.07 | 0.62 | 1.93 | 2.55 | (0.43 | ) | (0.19 | ) | ||||||||||||||||
| Class C | ||||||||||||||||||||||||
5/31/2015+ | $ | 21.62 | $ | 0.30 | $ | (0.09 | ) | $ | 0.21 | $ | (0.70 | ) | $ | (0.58 | ) | |||||||||
11/30/2014 | 21.34 | 0.30 | 0.55 | 0.85 | (0.44 | ) | (0.13 | ) | ||||||||||||||||
11/30/2013 | 19.25 | 0.30 | 2.27 | 2.57 | (0.41 | ) | (0.07 | ) | ||||||||||||||||
11/30/2012 | 19.92 | 0.27 | 1.44 | 1.71 | (0.59 | ) | (1.79 | ) | ||||||||||||||||
11/30/2011 | 21.85 | 0.44 | (0.34 | ) | 0.10 | (1.01 | ) | (1.02 | ) | |||||||||||||||
11/30/2010 | 19.96 | 0.43 | 1.96 | 2.39 | (0.31 | ) | (0.19 | ) | ||||||||||||||||
| Class D | ||||||||||||||||||||||||
5/31/2015+ | $ | 21.91 | $ | 0.43 | $ | (0.13 | ) | $ | 0.30 | $ | (0.80 | ) | $ | (0.58 | ) | |||||||||
11/30/2014 | 21.58 | 0.46 | 0.52 | 0.98 | (0.52 | ) | (0.13 | ) | ||||||||||||||||
11/30/2013 | 19.48 | 0.45 | 2.28 | 2.73 | (0.56 | ) | (0.07 | ) | ||||||||||||||||
11/30/2012 | 20.15 | 0.48 | 1.37 | 1.85 | (0.73 | ) | (1.79 | ) | ||||||||||||||||
11/30/2011 | 22.01 | 0.59 | (0.34 | ) | 0.25 | (1.09 | ) | (1.02 | ) | |||||||||||||||
11/30/2010 | 20.09 | 0.62 | 1.93 | 2.55 | (0.44 | ) | (0.19 | ) | ||||||||||||||||
| Class R | ||||||||||||||||||||||||
5/31/2015+ | $ | 21.80 | $ | 0.33 | $ | (0.07 | ) | $ | 0.26 | $ | (0.78 | ) | $ | (0.58 | ) | |||||||||
11/30/2014 | 21.46 | 0.39 | 0.53 | 0.92 | (0.45 | ) | (0.13 | ) | ||||||||||||||||
11/30/2013 | 19.47 | 0.37 | 2.29 | 2.66 | (0.60 | ) | (0.07 | ) | ||||||||||||||||
11/30/2012 | 20.12 | 0.18 | 1.64 | 1.82 | (0.68 | ) | (1.79 | ) | ||||||||||||||||
11/30/2011 | 21.97 | 0.58 | (0.37 | ) | 0.21 | (1.04 | ) | (1.02 | ) | |||||||||||||||
11/30/2010 | 20.06 | 0.61 | 1.88 | 2.49 | (0.39 | ) | (0.19 | ) | ||||||||||||||||
| Class P | ||||||||||||||||||||||||
5/31/2015+ | $ | 22.14 | $ | 0.39 | $ | (0.06 | ) | $ | 0.33 | $ | (0.92 | ) | $ | (0.58 | ) | |||||||||
11/30/2014 | 21.77 | 0.45 | 0.64 | 1.09 | (0.59 | ) | (0.13 | ) | ||||||||||||||||
11/30/2013 | 19.64 | 0.48 | 2.35 | 2.83 | (0.63 | ) | (0.07 | ) | ||||||||||||||||
11/30/2012 | 20.27 | 0.38 | 1.56 | 1.94 | (0.78 | ) | (1.79 | ) | ||||||||||||||||
11/30/2011 | 22.10 | 0.69 | (0.39 | ) | 0.30 | (1.11 | ) | (1.02 | ) | |||||||||||||||
11/30/2010 | 20.14 | 0.71 | 1.89 | 2.60 | (0.45 | ) | (0.19 | ) | ||||||||||||||||
| Class R6 | ||||||||||||||||||||||||
5/31/2015+ | $ | 22.20 | $ | 0.47 | $ | (0.13 | ) | $ | 0.34 | $ | (0.93 | ) | $ | (0.58 | ) | |||||||||
11/30/2014 | 21.80 | 0.57 | 0.55 | 1.12 | (0.59 | ) | (0.13 | ) | ||||||||||||||||
11/30/2013 | 19.66 | 0.55 | 2.29 | 2.84 | (0.63 | ) | (0.07 | ) | ||||||||||||||||
11/30/2012 | 20.30 | 0.58 | 1.38 | 1.96 | (0.81 | ) | (1.79 | ) | ||||||||||||||||
11/30/2011 | 22.12 | 0.69 | (0.35 | ) | 0.34 | (1.14 | ) | (1.02 | ) | |||||||||||||||
11/30/2010 | 20.16 | 0.73 | 1.89 | 2.62 | (0.47 | ) | (0.19 | ) | ||||||||||||||||
| Administrative Class | ||||||||||||||||||||||||
5/31/2015+ | $ | 22.03 | $ | 0.73 | $ | (0.44 | ) | $ | 0.29 | $ | (0.86 | ) | $ | (0.58 | ) | |||||||||
11/30/2014 | 21.69 | 0.49 | 0.54 | 1.03 | (0.56 | ) | (0.13 | ) | ||||||||||||||||
11/30/2013 | 19.58 | 0.22 | 2.55 | 2.77 | (0.59 | ) | (0.07 | ) | ||||||||||||||||
11/30/2012 | 20.23 | 0.53 | 1.36 | 1.89 | (0.75 | ) | (1.79 | ) | ||||||||||||||||
11/30/2011 | 22.06 | 0.65 | (0.38 | ) | 0.27 | (1.08 | ) | (1.02 | ) | |||||||||||||||
11/30/2010 | 20.11 | 0.68 | 1.89 | 2.57 | (0.43 | ) | (0.19 | ) | ||||||||||||||||
| + | Unaudited |
| (a) | Calculated on average shares outstanding during the period. |
| 232 | Semiannual Report | | May 31, 2015 | | See accompanying Notes to Financial Statements |
Table of Contents
| Total Dividends and Distributions | Net Asset Value, End of Period | Total Return (b) | Net Assets, End of Period (000s) | Ratio of Expenses to Average Net Assets with Fee Waiver/ Reimbursement (c) | Ratio of Expenses to Average Net Assets without Fee Waiver/ Reimbursement (c) | Ratio of Net Investment Income to Average Net Assets (c) | Portfolio Turnover Rate | |||||||||||||||||||||||||
| $ | (1.45 | ) | $ | 20.71 | 1.53 | % | $ | 5,184 | 0.36 | %(d) | 0.61 | %(d) | 3.74 | %(d) | 95 | % | ||||||||||||||||
| (0.70 | ) | 21.87 | 4.85 | 4,772 | 0.35 | 0.60 | 2.02 | 78 | ||||||||||||||||||||||||
| (0.67 | ) | 21.55 | 14.50 | 1,014 | 0.30 | 0.60 | 2.08 | 54 | ||||||||||||||||||||||||
| (2.55 | ) | 19.48 | 10.64 | 1,371 | 0.26 | 0.60 | 1.45 | 47 | ||||||||||||||||||||||||
| (2.11 | ) | 20.16 | 0.80 | 71 | 0.41 | 2.92 | 2.85 | 51 | ||||||||||||||||||||||||
| (0.62 | ) | 22.00 | 13.02 | 57 | 0.56 | 6.28 | 3.05 | 37 | ||||||||||||||||||||||||
| $ | (1.28 | ) | $ | 20.55 | 1.15 | % | $ | 155 | 1.11 | %(d) | 1.36 | %(d) | 2.96 | %(d) | 95 | % | ||||||||||||||||
| (0.57 | ) | 21.62 | 4.08 | 138 | 1.10 | 1.35 | 1.38 | 78 | ||||||||||||||||||||||||
| (0.48 | ) | 21.34 | 13.64 | 119 | 1.05 | 1.35 | 1.48 | 54 | ||||||||||||||||||||||||
| (2.38 | ) | 19.25 | 9.78 | 60 | 1.01 | 1.35 | 1.44 | 47 | ||||||||||||||||||||||||
| (2.03 | ) | 19.92 | (0.01 | ) | 48 | 1.17 | 3.70 | 2.09 | 51 | |||||||||||||||||||||||
| (0.50 | ) | 21.85 | 12.21 | 35 | 1.31 | 7.37 | 2.11 | 37 | ||||||||||||||||||||||||
| $ | (1.38 | ) | $ | 20.83 | 1.55 | % | $ | 237 | 0.46 | %(d) | 0.61 | %(d) | 4.19 | %(d) | 95 | % | ||||||||||||||||
| (0.65 | ) | 21.91 | 4.68 | 288 | 0.45 | 0.60 | 2.13 | 78 | ||||||||||||||||||||||||
| (0.63 | ) | 21.58 | 14.42 | 333 | 0.40 | 0.60 | 2.21 | 54 | ||||||||||||||||||||||||
| (2.52 | ) | 19.48 | 10.51 | 202 | 0.36 | 0.60 | 2.55 | 47 | ||||||||||||||||||||||||
| (2.11 | ) | 20.15 | 0.75 | 189 | 0.44 | 3.02 | 2.74 | 51 | ||||||||||||||||||||||||
| (0.63 | ) | 22.01 | 12.99 | 166 | 0.56 | 6.36 | 3.04 | 37 | ||||||||||||||||||||||||
| $ | (1.36 | ) | $ | 20.70 | 1.39 | % | $ | 665 | 0.71 | %(d) | 0.86 | %(d) | 3.24 | %(d) | 95 | % | ||||||||||||||||
| (0.58 | ) | 21.80 | 4.41 | 584 | 0.70 | 0.85 | 1.79 | 78 | ||||||||||||||||||||||||
| (0.67 | ) | 21.46 | 14.11 | 497 | 0.65 | 0.85 | 1.85 | 54 | ||||||||||||||||||||||||
| (2.47 | ) | 19.47 | 10.30 | 359 | 0.61 | 0.85 | 0.96 | 47 | ||||||||||||||||||||||||
| (2.06 | ) | 20.12 | 0.51 | 17 | 0.69 | 3.21 | 2.71 | 51 | ||||||||||||||||||||||||
| (0.58 | ) | 21.97 | 12.75 | 17 | 0.81 | 6.49 | 2.98 | 37 | ||||||||||||||||||||||||
| $ | (1.50 | ) | $ | 20.97 | 1.71 | % | $ | 8,007 | 0.06 | %(d) | 0.21 | %(d) | 3.77 | %(d) | 95 | % | ||||||||||||||||
| (0.72 | ) | 22.14 | 5.13 | 5,234 | 0.05 | 0.20 | 2.06 | 78 | ||||||||||||||||||||||||
| (0.70 | ) | 21.77 | 14.90 | 1,397 | — | 0.20 | 2.34 | 54 | ||||||||||||||||||||||||
| (2.57 | ) | 19.64 | 11.00 | 762 | — | (e) | 0.20 | 1.98 | 47 | |||||||||||||||||||||||
| (2.13 | ) | 20.27 | 0.96 | 15 | 0.19 | 2.75 | 3.21 | 51 | ||||||||||||||||||||||||
| (0.64 | ) | 22.10 | 13.26 | 15 | 0.36 | 6.08 | 3.48 | 37 | ||||||||||||||||||||||||
| $ | (1.51 | ) | $ | 21.03 | 1.75 | % | $ | 6,055 | — | %(d)(e)(f) | 0.10 | %(d) | 4.46 | %(d) | 95 | % | ||||||||||||||||
| (0.72 | ) | 22.20 | 5.27 | 9,227 | — | (e) | 0.10 | 2.58 | 78 | |||||||||||||||||||||||
| (0.70 | ) | 21.80 | 14.94 | 8,935 | — | (e) | 0.12 | 2.68 | 54 | |||||||||||||||||||||||
| (2.60 | ) | 19.66 | 11.06 | 6,431 | — | (e) | 0.15 | 3.03 | 47 | |||||||||||||||||||||||
| (2.16 | ) | 20.30 | 1.11 | 5,149 | 0.09 | 2.65 | 3.22 | 51 | ||||||||||||||||||||||||
| (0.66 | ) | 22.12 | 13.34 | 4,619 | 0.26 | 5.97 | 3.56 | 37 | ||||||||||||||||||||||||
| $ | (1.44 | ) | $ | 20.88 | 1.53 | % | $ | 497 | 0.31 | %(d) | 0.45 | %(d) | 7.00 | %(d) | 95 | % | ||||||||||||||||
| (0.69 | ) | 22.03 | 4.87 | 1,245 | 0.30 | 0.45 | 2.25 | 78 | ||||||||||||||||||||||||
| (0.66 | ) | 21.69 | 14.66 | 1,194 | 0.25 | 0.45 | 1.07 | 54 | ||||||||||||||||||||||||
| (2.54 | ) | 19.58 | 10.62 | 17 | 0.21 | 0.45 | 2.77 | 47 | ||||||||||||||||||||||||
| (2.10 | ) | 20.23 | 0.82 | 15 | 0.37 | 2.93 | 3.04 | 51 | ||||||||||||||||||||||||
| (0.62 | ) | 22.06 | 13.09 | 15 | 0.51 | 6.23 | 3.32 | 37 | ||||||||||||||||||||||||
| (b) | Total return is calculated assuming a purchase of a share on the first day of the period and a sale of a share on the last day of each period reported. Dividends and distributions, if any, are assumed, for purposes of this calculation, to be reinvested. Total return does not reflect sales charges and includes the effect of fee waivers and reimbursements. Total return may reflect adjustments to conform to U.S. GAAP. Total return for a period of less than one year is not annualized. |
| (c) | Does not include expenses of the investment companies in which the Fund invests. |
| (d) | Annualized. |
| (e) | See Note 6 in the Notes to Financial Statements. |
| (f) | Less than 0.01%. |
| See accompanying Notes to Financial Statements | | May 31, 2015 | | Semiannual Report | 233 |
Table of Contents
Financial Highlights (cont’d)
For a Share Outstanding for the Period ended:
Net Asset | Net Investment Income (a) | Net Realized and Change in Unrealized Gain (Loss) | Total from Investment Operations | Dividends from Net Investment Income | Distributions Gains | |||||||||||||||||||
| AllianzGI Retirement 2055: | ||||||||||||||||||||||||
| Class A | ||||||||||||||||||||||||
5/31/2015+ | $ | 18.70 | $ | 0.29 | $ | (0.02 | ) | $ | 0.27 | $ | (0.77 | ) | $ | (0.42 | ) | |||||||||
11/30/2014 | 18.51 | 0.39 | 0.50 | 0.89 | (0.49 | ) | (0.21 | ) | ||||||||||||||||
11/30/2013 | 17.02 | 0.26 | 2.11 | 2.37 | (0.59 | ) | (0.29 | ) | ||||||||||||||||
12/19/2011* - 11/30/2012 | 15.00 | 0.44 | 1.80 | 2.24 | (0.22 | ) | — | |||||||||||||||||
| Class R | ||||||||||||||||||||||||
5/31/2015+ | $ | 18.63 | $ | 0.25 | $ | (0.01 | ) | $ | 0.24 | $ | (0.71 | ) | $ | (0.42 | ) | |||||||||
11/30/2014 | 18.42 | 0.30 | 0.53 | 0.83 | (0.41 | ) | (0.21 | ) | ||||||||||||||||
11/30/2013 | 16.97 | 0.30 | 2.00 | 2.30 | (0.56 | ) | (0.29 | ) | ||||||||||||||||
12/19/2011* - 11/30/2012 | 15.00 | 0.31 | 1.88 | 2.19 | (0.22 | ) | — | |||||||||||||||||
| Class P | ||||||||||||||||||||||||
5/31/2015+ | $ | 18.85 | $ | 0.30 | $ | — | $ | 0.30 | $ | (0.80 | ) | $ | (0.42 | ) | ||||||||||
11/30/2014 | 18.61 | 0.38 | 0.57 | 0.95 | (0.50 | ) | (0.21 | ) | ||||||||||||||||
11/30/2013 | 17.08 | 0.34 | 2.09 | 2.43 | (0.61 | ) | (0.29 | ) | ||||||||||||||||
12/19/2011* - 11/30/2012 | 15.00 | 0.43 | 1.87 | 2.30 | (0.22 | ) | — | |||||||||||||||||
| Class R6 | ||||||||||||||||||||||||
5/31/2015+ | $ | 18.90 | $ | 0.35 | $ | (0.05 | ) | $ | 0.30 | $ | (0.81 | ) | $ | (0.42 | ) | |||||||||
11/30/2014 | 18.64 | 0.47 | 0.50 | 0.97 | (0.50 | ) | (0.21 | ) | ||||||||||||||||
11/30/2013 | 17.09 | 0.49 | 1.96 | 2.45 | (0.61 | ) | (0.29 | ) | ||||||||||||||||
12/19/2011* - 11/30/2012 | 15.00 | 0.50 | 1.81 | 2.31 | (0.22 | ) | — | |||||||||||||||||
| Administrative Class | ||||||||||||||||||||||||
5/31/2015+ | $ | 18.76 | $ | 0.58 | $ | (0.31 | ) | $ | 0.27 | $ | (0.77 | ) | $ | (0.42 | ) | |||||||||
11/30/2014 | 18.55 | 0.38 | 0.52 | 0.90 | (0.48 | ) | (0.21 | ) | ||||||||||||||||
11/30/2013 | 17.03 | 0.22 | 2.16 | 2.38 | (0.57 | ) | (0.29 | ) | ||||||||||||||||
12/19/2011* - 11/30/2012 | 15.00 | 0.44 | 1.81 | 2.25 | (0.22 | ) | — | |||||||||||||||||
| + | Unaudited |
| (a) | Calculated on average shares outstanding during the period. |
| (b) | Total return is calculated assuming a purchase of a share on the first day of the period and a sale of a share on the last day of each period reported. Dividends and distributions, if any, are assumed, for purposes of this calculation, to be reinvested. Total return does not reflect sales charges and includes the effect of fee waivers and reimbursements. Total return may reflect adjustments to conform to U.S. GAAP. Total return for a period of less than one year is not annualized. |
| (c) | Does not include expenses of the investment companies in which the Fund invests. |
| (d) | Annualized. |
| (e) | See Note 6 in the Notes to Financial Statements. |
| (f) | Less than 0.01%. |
| 234 | Semiannual Report | | May 31, 2015 | | See accompanying Notes to Financial Statements |
Table of Contents
| Total Dividends and Distributions | Net Asset Value, End of Period | Total Return (b) | Net Assets, End of Period (000s) | Ratio of Expenses to Average Net Assets with Fee Waiver/ Reimbursement (c) | Ratio of Expenses to Average Net Assets without Fee Waiver/ Reimbursement (c) | Ratio of Net Investment Income to Average Net Assets (c) | Portfolio Turnover Rate | |||||||||||||||||||||||||
| $ | (1.19 | ) | $ | 17.78 | 1.62 | % | $ | 1,373 | 0.37 | %(d) | 0.60 | %(d) | 3.28 | %(d) | 85 | % | ||||||||||||||||
| (0.70 | ) | 18.70 | 4.96 | 1,089 | 0.35 | 0.60 | 2.11 | 74 | ||||||||||||||||||||||||
| (0.88 | ) | 18.51 | 14.59 | 135 | 0.30 | 0.60 | 1.52 | 41 | ||||||||||||||||||||||||
| (0.22 | ) | 17.02 | 15.10 | 11 | 0.27 | (d) | 0.60 | (d) | 2.82 | (d) | 31 | |||||||||||||||||||||
| $ | (1.13 | ) | $ | 17.74 | 1.45 | % | $ | 203 | 0.72 | %(d) | 0.85 | %(d) | 2.79 | %(d) | 85 | % | ||||||||||||||||
| (0.62 | ) | 18.63 | 4.61 | 144 | 0.70 | 0.85 | 1.61 | 74 | ||||||||||||||||||||||||
| (0.85 | ) | 18.42 | 14.22 | 72 | 0.65 | 0.85 | 1.75 | 41 | ||||||||||||||||||||||||
| (0.22 | ) | 16.97 | 14.75 | 39 | 0.62 | (d) | 0.85 | (d) | 1.99 | (d) | 31 | |||||||||||||||||||||
| $ | (1.22 | ) | $ | 17.93 | 1.79 | % | $ | 1,600 | 0.07 | %(d) | 0.20 | %(d) | 3.38 | %(d) | 85 | % | ||||||||||||||||
| (0.71 | ) | 18.85 | 5.27 | 1,362 | 0.05 | 0.20 | 2.04 | 74 | ||||||||||||||||||||||||
| (0.90 | ) | 18.61 | 14.88 | 240 | — | 0.20 | 1.96 | 41 | ||||||||||||||||||||||||
| (0.22 | ) | 17.08 | 15.52 | 59 | — | (d)(e) | 0.20 | (d) | 2.77 | (d) | 31 | |||||||||||||||||||||
| $ | (1.23 | ) | $ | 17.97 | 1.78 | % | $ | 5,138 | — | %(d)(e)(f) | 0.10 | %(d) | 3.98 | %(d) | 85 | % | ||||||||||||||||
| (0.71 | ) | 18.90 | 5.37 | 4,934 | — | (e) | 0.10 | 2.52 | 74 | |||||||||||||||||||||||
| (0.90 | ) | 18.64 | 15.06 | 4,388 | — | (e) | 0.12 | 2.77 | 41 | |||||||||||||||||||||||
| (0.22 | ) | 17.09 | 15.52 | 3,509 | — | (d)(e) | 0.15 | (d) | 3.21 | (d) | 31 | |||||||||||||||||||||
| $ | (1.19 | ) | $ | 17.84 | 1.58 | % | $ | 168 | 0.32 | %(d) | 0.45 | %(d) | 6.45 | %(d) | 85 | % | ||||||||||||||||
| (0.69 | ) | 18.76 | 5.00 | 357 | 0.30 | 0.45 | 2.06 | 74 | ||||||||||||||||||||||||
| (0.86 | ) | 18.55 | 14.67 | 221 | 0.25 | 0.45 | 1.22 | 41 | ||||||||||||||||||||||||
| (0.22 | ) | 17.03 | 15.17 | 11 | 0.22 | (d) | 0.46 | (d) | 2.87 | (d) | 31 | |||||||||||||||||||||
| See accompanying Notes to Financial Statements | | May 31, 2015 | | Semiannual Report | 235 |
Table of Contents
Financial Highlights (cont’d)
For a Share Outstanding for the Period ended:
| Net Asset Value, Beginning of Period | Net Investment Income (a) | Net Realized and Change in Unrealized Gain (Loss) | Total from Investment Operations | Dividends from Net Investment Income | Distributions from Net Realized Capital Gains | |||||||||||||||||||
| AllianzGI Retirement Income: | ||||||||||||||||||||||||
| Class A | ||||||||||||||||||||||||
5/31/2015+ | $ | 19.35 | $ | 0.33 | $ | (0.24 | ) | $ | 0.09 | $ | (0.46 | ) | $ | (0.46 | ) | |||||||||
11/30/2014 | 18.96 | 0.42 | 0.31 | 0.73 | (0.34 | ) | — | |||||||||||||||||
11/30/2013 | 19.20 | 0.50 | 0.03 | 0.53 | (0.66 | ) | (0.08 | ) | ||||||||||||||||
11/30/2012 | 18.27 | 0.48 | 1.23 | 1.71 | (0.58 | ) | (0.20 | ) | ||||||||||||||||
11/30/2011 | 18.52 | 0.37 | 0.25 | 0.62 | (0.67 | ) | (0.20 | ) | ||||||||||||||||
11/30/2010 | 17.81 | 0.47 | 1.05 | 1.52 | (0.61 | ) | (0.20 | ) | ||||||||||||||||
| Class C | ||||||||||||||||||||||||
5/31/2015+ | $ | 19.14 | $ | 0.27 | $ | (0.25 | ) | $ | 0.02 | $ | (0.39 | ) | $ | (0.46 | ) | |||||||||
11/30/2014 | 18.76 | 0.27 | 0.31 | 0.58 | (0.20 | ) | — | |||||||||||||||||
11/30/2013 | 18.99 | 0.37 | 0.01 | 0.38 | (0.50 | ) | (0.08 | ) | ||||||||||||||||
11/30/2012 | 18.09 | 0.31 | 1.24 | 1.55 | (0.45 | ) | (0.20 | ) | ||||||||||||||||
11/30/2011 | 18.36 | 0.27 | 0.21 | 0.48 | (0.55 | ) | (0.20 | ) | ||||||||||||||||
11/30/2010 | 17.83 | 0.28 | 1.11 | 1.39 | (0.66 | ) | (0.20 | ) | ||||||||||||||||
| Class D | ||||||||||||||||||||||||
5/31/2015+ | $ | 19.45 | $ | 0.33 | $ | (0.25 | ) | $ | 0.08 | $ | (0.45 | ) | $ | (0.46 | ) | |||||||||
11/30/2014 | 19.05 | 0.40 | 0.32 | 0.72 | (0.32 | ) | — | |||||||||||||||||
11/30/2013 | 19.29 | 0.45 | 0.05 | 0.50 | (0.63 | ) | (0.08 | ) | ||||||||||||||||
11/30/2012 | 18.36 | 0.30 | 1.41 | 1.71 | (0.58 | ) | (0.20 | ) | ||||||||||||||||
11/30/2011 | 18.60 | 0.49 | 0.13 | 0.62 | (0.66 | ) | (0.20 | ) | ||||||||||||||||
11/30/2010 | 17.83 | 0.49 | 1.04 | 1.53 | (0.56 | ) | (0.20 | ) | ||||||||||||||||
| Class R | ||||||||||||||||||||||||
5/31/2015+ | $ | 19.95 | $ | 0.31 | $ | (0.25 | ) | $ | 0.06 | $ | (0.43 | ) | $ | (0.46 | ) | |||||||||
11/30/2014 | 19.53 | 0.36 | 0.33 | 0.69 | (0.27 | ) | — | |||||||||||||||||
11/30/2013 | 19.74 | 0.46 | 0.01 | 0.47 | (0.57 | ) | (0.08 | ) | ||||||||||||||||
11/30/2012 | 18.77 | 0.24 | 1.45 | 1.69 | (0.52 | ) | (0.20 | ) | ||||||||||||||||
11/30/2011 | 18.73 | 0.53 | 0.05 | 0.58 | (0.34 | ) | (0.20 | ) | ||||||||||||||||
11/30/2010 | 17.86 | 0.49 | 1.01 | 1.50 | (0.43 | ) | (0.20 | ) | ||||||||||||||||
| Class P | ||||||||||||||||||||||||
5/31/2015+ | $ | 19.61 | $ | 0.34 | $ | (0.22 | ) | $ | 0.12 | $ | (0.49 | ) | $ | (0.46 | ) | |||||||||
11/30/2014 | 19.20 | 0.47 | 0.34 | 0.81 | (0.40 | ) | — | |||||||||||||||||
11/30/2013 | 19.44 | 0.46 | 0.13 | 0.59 | (0.72 | ) | (0.08 | ) | ||||||||||||||||
11/30/2012 | 18.49 | 0.32 | 1.48 | 1.80 | (0.65 | ) | (0.20 | ) | ||||||||||||||||
11/30/2011 | 18.41 | 0.63 | 0.03 | 0.66 | (0.38 | ) | (0.20 | ) | ||||||||||||||||
11/30/2010 | 17.85 | 0.57 | 0.99 | 1.56 | (0.80 | ) | (0.20 | ) | ||||||||||||||||
| Class R6 | ||||||||||||||||||||||||
5/31/2015+ | $ | 19.23 | $ | 0.38 | $ | (0.26 | ) | $ | 0.12 | $ | (0.50 | ) | $ | (0.46 | ) | |||||||||
11/30/2014 | 18.83 | 0.49 | 0.33 | 0.82 | (0.42 | ) | — | |||||||||||||||||
11/30/2013 | 19.08 | 0.56 | 0.03 | 0.59 | (0.73 | ) | (0.08 | ) | ||||||||||||||||
11/30/2012 | 18.16 | 0.49 | 1.28 | 1.77 | (0.65 | ) | (0.20 | ) | ||||||||||||||||
11/30/2011 | 18.40 | 0.65 | 0.02 | 0.67 | (0.71 | ) | (0.20 | ) | ||||||||||||||||
11/30/2010 | 17.85 | 0.57 | 1.01 | 1.58 | (0.83 | ) | (0.20 | ) | ||||||||||||||||
| Administrative Class | ||||||||||||||||||||||||
5/31/2015+ | $ | 19.56 | $ | 1.06 | $ | (1.01 | ) | $ | 0.05 | $ | (0.40 | ) | $ | (0.46 | ) | |||||||||
11/30/2014 | 19.15 | 0.43 | 0.33 | 0.76 | (0.35 | ) | — | |||||||||||||||||
11/30/2013 | 19.41 | 0.22 | 0.32 | 0.54 | (0.69 | ) | (0.08 | ) | ||||||||||||||||
11/30/2012 | 18.46 | 0.49 | 1.26 | 1.75 | (0.60 | ) | (0.20 | ) | ||||||||||||||||
11/30/2011 | 18.40 | 0.59 | 0.03 | 0.62 | (0.36 | ) | (0.20 | ) | ||||||||||||||||
11/30/2010 | 17.83 | 0.54 | 0.99 | 1.53 | (0.76 | ) | (0.20 | ) | ||||||||||||||||
| + | Unaudited |
| (a) | Calculated on average shares outstanding during the period. |
| 236 | Semiannual Report | | May 31, 2015 | | See accompanying Notes to Financial Statements |
Table of Contents
| Distributions from Return of Capital | Total Dividends and Distributions | Net Asset Value, End of Period | Total Return (b) | Net Assets, End of Period (000s) | Ratio of Expenses to Average Net Assets with Fee Waiver/ Reimbursement (c) | Ratio of Expenses to Average Net Assets without Fee Waiver/ Reimbursement (c) | Ratio of Net Investment Income to Average Net Assets (c) | Portfolio Turnover Rate | ||||||||||||||||||||||||||||
| $ | — | $ | (0.92 | ) | $ | 18.52 | 0.57 | % | $ | 6,389 | 0.47 | %(d) | 0.62 | %(d) | 3.55 | %(d) | 96 | % | ||||||||||||||||||
| — | (0.34 | ) | 19.35 | 3.88 | 6,324 | 0.40 | 0.60 | 2.18 | 101 | |||||||||||||||||||||||||||
| (0.03 | ) | (0.77 | ) | 18.96 | 2.78 | 4,326 | 0.39 | 0.60 | 2.64 | 81 | ||||||||||||||||||||||||||
| — | (0.78 | ) | 19.20 | 9.68 | 4,891 | 0.40 | 0.60 | 2.57 | 51 | |||||||||||||||||||||||||||
| — | (0.87 | ) | 18.27 | 3.45 | 4,427 | 0.46 | 1.60 | 2.01 | 74 | |||||||||||||||||||||||||||
| — | (0.81 | ) | 18.52 | 8.86 | 595 | 0.52 | 5.29 | 2.65 | 22 | |||||||||||||||||||||||||||
| $ | — | $ | (0.85 | ) | $ | 18.31 | 0.19 | % | $ | 3,689 | 1.22 | %(d) | 1.37 | %(d) | 2.94 | %(d) | 96 | % | ||||||||||||||||||
| — | (0.20 | ) | 19.14 | 3.12 | 3,984 | 1.15 | 1.35 | 1.42 | 101 | |||||||||||||||||||||||||||
| (0.03 | ) | (0.61 | ) | 18.76 | 2.03 | 4,359 | 1.14 | 1.35 | 1.99 | 81 | ||||||||||||||||||||||||||
| — | (0.65 | ) | 18.99 | 8.84 | 6,935 | 1.15 | 1.35 | 1.70 | 51 | |||||||||||||||||||||||||||
| — | (0.75 | ) | 18.09 | 2.71 | 5,820 | 1.22 | 2.48 | 1.50 | 74 | |||||||||||||||||||||||||||
| — | (0.86 | ) | 18.36 | 8.09 | 1,398 | 1.27 | 6.16 | 1.56 | 22 | |||||||||||||||||||||||||||
| $ | — | $ | (0.91 | ) | $ | 18.62 | 0.51 | % | $ | 975 | 0.57 | %(d) | 0.62 | %(d) | 3.53 | %(d) | 96 | % | ||||||||||||||||||
| — | (0.32 | ) | 19.45 | 3.79 | 1,012 | 0.50 | 0.60 | 2.07 | 101 | |||||||||||||||||||||||||||
| (0.03 | ) | (0.74 | ) | 19.05 | 2.70 | 1,111 | 0.49 | 0.60 | 2.37 | 81 | ||||||||||||||||||||||||||
| — | (0.78 | ) | 19.29 | 9.53 | 1,553 | 0.50 | 0.60 | 1.59 | 51 | |||||||||||||||||||||||||||
| — | (0.86 | ) | 18.36 | 3.42 | 326 | 0.51 | 2.21 | 2.65 | 74 | |||||||||||||||||||||||||||
| — | (0.76 | ) | 18.60 | 8.89 | 179 | 0.52 | 5.75 | 2.75 | 22 | |||||||||||||||||||||||||||
| $ | — | $ | (0.89 | ) | $ | 19.12 | 0.38 | % | $ | 228 | 0.82 | %(d) | 0.87 | %(d) | 3.22 | %(d) | 96 | % | ||||||||||||||||||
| — | (0.27 | ) | 19.95 | 3.55 | 215 | 0.75 | 0.85 | 1.80 | 101 | |||||||||||||||||||||||||||
| (0.03 | ) | (0.68 | ) | 19.53 | 2.46 | 152 | 0.74 | 0.85 | 2.36 | 81 | ||||||||||||||||||||||||||
| — | (0.72 | ) | 19.74 | 9.28 | 183 | 0.75 | 0.85 | 1.29 | 51 | |||||||||||||||||||||||||||
| — | (0.54 | ) | 18.77 | 3.18 | 17 | 0.76 | 4.59 | 2.82 | 74 | |||||||||||||||||||||||||||
| — | (0.63 | ) | 18.73 | 8.61 | 15 | 0.77 | 5.62 | 2.70 | 22 | |||||||||||||||||||||||||||
| $ | — | $ | (0.95 | ) | $ | 18.78 | 0.70 | % | $ | 6,685 | 0.17 | %(d) | 0.22 | %(d) | 3.59 | %(d) | 96 | % | ||||||||||||||||||
| — | (0.40 | ) | 19.61 | 4.23 | 6,349 | 0.11 | 0.21 | 2.39 | 101 | |||||||||||||||||||||||||||
| (0.03 | ) | (0.83 | ) | 19.20 | 3.12 | 4,427 | 0.09 | 0.20 | 2.42 | 81 | ||||||||||||||||||||||||||
| — | (0.85 | ) | 19.44 | 10.05 | 4,751 | 0.10 | 0.20 | 1.71 | 51 | |||||||||||||||||||||||||||
| — | (0.58 | ) | 18.49 | 3.69 | 14 | 0.26 | 4.47 | 3.38 | 74 | |||||||||||||||||||||||||||
| — | (1.00 | ) | 18.41 | 9.13 | 13 | 0.32 | 5.13 | 3.20 | 22 | |||||||||||||||||||||||||||
| $ | — | $ | (0.96 | ) | $ | 18.39 | 0.72 | % | $ | 7,049 | 0.07 | %(d) | 0.11 | %(d) | 4.13 | %(d) | 96 | % | ||||||||||||||||||
| — | (0.42 | ) | 19.23 | 4.36 | 9,496 | — | (e)(f) | 0.10 | 2.56 | 101 | ||||||||||||||||||||||||||
| (0.03 | ) | (0.84 | ) | 18.83 | 3.23 | 9,487 | — | (e) | 0.12 | 2.96 | 81 | |||||||||||||||||||||||||
| — | (0.85 | ) | 19.08 | 10.11 | 11,294 | — | 0.15 | 2.64 | 51 | |||||||||||||||||||||||||||
| — | (0.91 | ) | 18.16 | 3.77 | 4,904 | 0.16 | 1.81 | 3.53 | 74 | |||||||||||||||||||||||||||
| — | (1.03 | ) | 18.40 | 9.24 | 4,803 | 0.22 | 5.04 | 3.22 | 22 | |||||||||||||||||||||||||||
| $ | — | $ | (0.86 | )�� | $ | 18.75 | 0.31 | % | $ | 45 | 0.40 | %(d) | 0.45 | %(d) | 10.82 | %(d) | 96 | % | ||||||||||||||||||
| — | (0.35 | ) | 19.56 | 3.97 | 2,001 | 0.35 | 0.45 | 2.20 | 101 | |||||||||||||||||||||||||||
| (0.03 | ) | (0.80 | ) | 19.15 | 2.92 | 2,461 | 0.34 | 0.45 | 1.16 | 81 | ||||||||||||||||||||||||||
| — | (0.80 | ) | 19.41 | 9.71 | 15 | 0.35 | 0.45 | 2.59 | 51 | |||||||||||||||||||||||||||
| — | (0.56 | ) | 18.46 | 3.49 | 14 | 0.44 | 4.65 | 3.21 | 74 | |||||||||||||||||||||||||||
| — | (0.96 | ) | 18.40 | 8.94 | 13 | 0.47 | 5.28 | 3.05 | 22 | |||||||||||||||||||||||||||
| (b) | Total return is calculated assuming a purchase of a share on the first day of the period and a sale of a share on the last day of each period reported. Dividends and distributions, if any, are assumed, for purposes of this calculation, to be reinvested. Total return does not reflect sales charges and includes the effect of fee waivers and reimbursements. Total return may reflect adjustments to conform to U.S. GAAP. Total investment return for a period of less than one year is not annualized. |
| (c) | Does not include expenses of the investment companies in which the Fund invests. |
| (d) | Annualized. |
| (e) | See Note 6 in the Notes to Financial Statements. |
| (f) | Less than 0.01%. |
| See accompanying Notes to Financial Statements | | May 31, 2015 | | Semiannual Report | 237 |
Table of Contents
Financial Highlights (cont’d)
For a Share Outstanding for the Period ended:
| Net Asset Value, Beginning of Period | Net Investment Income (a) | Net Realized and Change in Unrealized Gain (Loss) | Total from Investment Operations | Dividends from Net Investment Income | Distributions from Net Realized Capital Gains | |||||||||||||||||||
| AllianzGI Global Allocation: | ||||||||||||||||||||||||
| Class A | ||||||||||||||||||||||||
5/31/2015+ | $ | 12.18 | $ | 0.22 | $ | 0.05 | $ | 0.27 | $ | (0.37 | ) | $ | (0.13 | ) | ||||||||||
11/30/2014 | 11.90 | 0.30 | 0.25 | 0.55 | (0.27 | ) | — | |||||||||||||||||
11/30/2013 | 11.07 | 0.31 | 0.95 | 1.26 | (0.43 | ) | — | |||||||||||||||||
11/30/2012 | 10.30 | 0.25 | 0.84 | 1.09 | (0.32 | ) | — | |||||||||||||||||
11/30/2011 | 10.58 | 0.25 | (0.14 | ) | 0.11 | (0.39 | ) | — | ||||||||||||||||
11/30/2010 | 9.84 | 0.26 | 0.85 | 1.11 | (0.37 | ) | — | |||||||||||||||||
| Class B | ||||||||||||||||||||||||
5/31/2015+ | $ | 12.44 | $ | 0.22 | $ | — | $ | 0.22 | $ | (0.32 | ) | $ | (0.13 | ) | ||||||||||
11/30/2014 | 12.13 | 0.23 | 0.25 | 0.48 | (0.17 | ) | — | |||||||||||||||||
11/30/2013 | 11.27 | 0.26 | 0.94 | 1.20 | (0.34 | ) | — | |||||||||||||||||
11/30/2012 | 10.48 | 0.21 | 0.81 | 1.02 | (0.23 | ) | — | |||||||||||||||||
11/30/2011 | 10.74 | 0.22 | (0.20 | ) | 0.02 | (0.28 | ) | — | ||||||||||||||||
11/30/2010 | 9.92 | 0.22 | 0.83 | 1.05 | (0.23 | ) | — | |||||||||||||||||
| Class C | ||||||||||||||||||||||||
5/31/2015+ | $ | 12.33 | $ | 0.18 | $ | 0.05 | $ | 0.23 | $ | (0.33 | ) | $ | (0.13 | ) | ||||||||||
11/30/2014 | 12.04 | 0.22 | 0.24 | 0.46 | (0.17 | ) | — | |||||||||||||||||
11/30/2013 | 11.19 | 0.23 | 0.96 | 1.19 | (0.34 | ) | — | |||||||||||||||||
11/30/2012 | 10.41 | 0.17 | 0.85 | 1.02 | (0.24 | ) | — | |||||||||||||||||
11/30/2011 | 10.69 | 0.18 | (0.16 | ) | 0.02 | (0.30 | ) | — | ||||||||||||||||
11/30/2010 | 9.89 | 0.19 | 0.85 | 1.04 | (0.24 | ) | — | |||||||||||||||||
| Class D | ||||||||||||||||||||||||
5/31/2015+ | $ | 12.13 | $ | 0.21 | $ | 0.05 | $ | 0.26 | $ | (0.37 | ) | $ | (0.13 | ) | ||||||||||
11/30/2014 | 11.85 | 0.28 | 0.27 | 0.55 | (0.27 | ) | — | |||||||||||||||||
11/30/2013 | 11.03 | 0.23 | 1.03 | 1.26 | (0.44 | ) | — | |||||||||||||||||
11/30/2012 | 10.27 | 0.24 | 0.84 | 1.08 | (0.32 | ) | — | |||||||||||||||||
11/30/2011 | 10.56 | 0.17 | (0.06 | ) | 0.11 | (0.40 | ) | — | ||||||||||||||||
11/30/2010 | 9.83 | 0.23 | 0.87 | 1.10 | (0.37 | ) | — | |||||||||||||||||
| Class R | ||||||||||||||||||||||||
5/31/2015+ | $ | 12.13 | $ | 0.20 | $ | 0.05 | $ | 0.25 | $ | (0.36 | ) | $ | (0.13 | ) | ||||||||||
11/30/2014 | 11.84 | 0.28 | 0.26 | 0.54 | (0.25 | ) | — | |||||||||||||||||
11/30/2013 | 11.02 | 0.28 | 0.95 | 1.23 | (0.41 | ) | — | |||||||||||||||||
11/30/2012 | 10.26 | 0.21 | 0.84 | 1.05 | (0.29 | ) | — | |||||||||||||||||
11/30/2011 | 10.54 | 0.23 | (0.15 | ) | 0.08 | (0.36 | ) | — | ||||||||||||||||
11/30/2010 | 9.81 | 0.24 | 0.84 | 1.08 | (0.35 | ) | — | |||||||||||||||||
| + | Unaudited |
| (a) | Calculated on average shares outstanding during the period. |
| (b) | Total return is calculated assuming a purchase of a share on the first day of the period and a sale of a share on the last day of each period reported. Dividends and distributions, if any, are assumed, for purposes of this calculation, to be reinvested. Total return does not reflect sales charges and includes the effect of fee waivers and reimbursements. Total return may reflect adjustments to conform to U.S. GAAP. Total return for a period of less than one year is not annualized. |
| (c) | Does not include expenses of the investment companies in which the Fund invests. |
| (d) | Annualized. |
| 238 | Semiannual Report | | May 31, 2015 | | See accompanying Notes to Financial Statements |
Table of Contents
| Total Dividends and Distributions | Net Asset Value, End of Period | Total Return (b) | Net Assets, End of Period (000s) | Ratio of Expenses to Average Net Assets with Fee Waiver/ Reimbursement (c) | Ratio of Expenses to Average Net Assets without Fee Waiver/ Reimbursement (c) | Ratio of Net Investment Income to Average Net Assets (c) | Portfolio Turnover Rate | |||||||||||||||||||||||||
| $ | (0.50 | ) | $ | 11.95 | 2.40 | % | $ | 59,623 | 0.49 | %(d) | 1.27 | %(d) | 3.74 | %(d) | 98 | % | ||||||||||||||||
| (0.27 | ) | 12.18 | 4.62 | 65,499 | 0.40 | 1.34 | 2.48 | 48 | ||||||||||||||||||||||||
| (0.43 | ) | 11.90 | 11.79 | 69,565 | 0.41 | 1.36 | 2.68 | 45 | ||||||||||||||||||||||||
| (0.32 | ) | 11.07 | 10.64 | 70,312 | 0.43 | 1.38 | 2.32 | 57 | ||||||||||||||||||||||||
| (0.39 | ) | 10.30 | 0.95 | 73,816 | 0.47 | 1.35 | 2.32 | 64 | ||||||||||||||||||||||||
| (0.37 | ) | 10.58 | 11.56 | 72,415 | 0.51 | 1.42 | 2.58 | 46 | ||||||||||||||||||||||||
| $ | (0.45 | ) | $ | 12.21 | 1.93 | % | $ | 969 | 1.19 | %(d) | 2.07 | %(d) | 3.69 | %(d) | 98 | % | ||||||||||||||||
| (0.17 | ) | 12.44 | 3.96 | 1,823 | 1.11 | 2.10 | 1.88 | 48 | ||||||||||||||||||||||||
| (0.34 | ) | 12.13 | 10.84 | 2,874 | 1.14 | 2.18 | 2.25 | 45 | ||||||||||||||||||||||||
| (0.23 | ) | 11.27 | 9.90 | 4,307 | 1.19 | 2.09 | 1.96 | 57 | ||||||||||||||||||||||||
| (0.28 | ) | 10.48 | 0.15 | 9,467 | 1.22 | 2.10 | 1.95 | 64 | ||||||||||||||||||||||||
| (0.23 | ) | 10.74 | 10.86 | 18,030 | 1.26 | 2.19 | 2.13 | 46 | ||||||||||||||||||||||||
| $ | (0.46 | ) | $ | 12.10 | 2.00 | % | $ | 58,542 | 1.22 | %(d) | 2.01 | %(d) | 2.96 | %(d) | 98 | % | ||||||||||||||||
| (0.17 | ) | 12.33 | 3.88 | 62,275 | 1.13 | 2.08 | 1.78 | 48 | ||||||||||||||||||||||||
| (0.34 | ) | 12.04 | 10.81 | 68,756 | 1.14 | 2.10 | 1.98 | 45 | ||||||||||||||||||||||||
| (0.24 | ) | 11.19 | 9.90 | 71,375 | 1.18 | 2.11 | 1.59 | 57 | ||||||||||||||||||||||||
| (0.30 | ) | 10.41 | 0.15 | 78,367 | 1.22 | 2.09 | 1.64 | 64 | ||||||||||||||||||||||||
| (0.24 | ) | 10.69 | 10.65 | 87,546 | 1.26 | 2.16 | 1.93 | 46 | ||||||||||||||||||||||||
| $ | (0.50 | ) | $ | 11.89 | 2.34 | % | $ | 2,379 | 0.50 | %(d) | 1.27 | %(d) | 3.52 | %(d) | 98 | % | ||||||||||||||||
| (0.27 | ) | 12.13 | 4.68 | 2,241 | 0.39 | 1.37 | 2.31 | 48 | ||||||||||||||||||||||||
| (0.44 | ) | 11.85 | 11.70 | 1,189 | 0.37 | 1.39 | 1.99 | 45 | ||||||||||||||||||||||||
| (0.32 | ) | 11.03 | 10.68 | 266 | 0.46 | 1.33 | 2.25 | 57 | ||||||||||||||||||||||||
| (0.40 | ) | 10.27 | 0.95 | 197 | 0.45 | 1.38 | 1.56 | 64 | ||||||||||||||||||||||||
| (0.37 | ) | 10.56 | 11.48 | 34 | 0.51 | 1.41 | 2.28 | 46 | ||||||||||||||||||||||||
| $ | (0.49 | ) | $ | 11.89 | 2.25 | % | $ | 18 | 0.66 | %(d) | 1.48 | %(d) | 3.42 | %(d) | 98 | % | ||||||||||||||||
| (0.25 | ) | 12.13 | 4.57 | 17 | 0.56 | 1.53 | 2.32 | 48 | ||||||||||||||||||||||||
| (0.41 | ) | 11.84 | 11.44 | 17 | 0.59 | 1.54 | 2.42 | 45 | ||||||||||||||||||||||||
| (0.29 | ) | 11.02 | 10.44 | 15 | 0.67 | 1.56 | 2.02 | 57 | ||||||||||||||||||||||||
| (0.36 | ) | 10.26 | 0.73 | 14 | 0.72 | 1.59 | 2.11 | 64 | ||||||||||||||||||||||||
| (0.35 | ) | 10.54 | 11.30 | 13 | 0.76 | 1.64 | 2.38 | 46 | ||||||||||||||||||||||||
| See accompanying Notes to Financial Statements | | May 31, 2015 | | Semiannual Report | 239 |
Table of Contents
Financial Highlights (cont’d)
For a Share Outstanding for the Period ended:
| Net Asset Value, Beginning of Period | Net Investment Income (a) | Net Realized and Change in Unrealized Gain (Loss) | Total from Investment Operations | Dividends from Net Investment Income | Distributions from Net Realized Capital Gains | |||||||||||||||||||
| AllianzGI Global Allocation (cont’d) | ||||||||||||||||||||||||
| Class P | ||||||||||||||||||||||||
5/31/2015+ | $ | 12.19 | $ | 0.22 | $ | 0.06 | $ | 0.28 | $ | (0.39 | ) | $ | (0.13 | ) | ||||||||||
11/30/2014 | 11.90 | 0.32 | 0.26 | 0.58 | (0.29 | ) | — | |||||||||||||||||
11/30/2013 | 11.07 | 0.32 | 0.96 | 1.28 | (0.45 | ) | — | |||||||||||||||||
11/30/2012 | 10.28 | 0.29 | 0.81 | 1.10 | (0.31 | ) | — | |||||||||||||||||
11/30/2011 | 10.56 | 0.27 | (0.14 | ) | 0.13 | (0.41 | ) | — | ||||||||||||||||
11/30/2010 | 9.84 | 0.26 | 0.86 | 1.12 | (0.40 | ) | — | |||||||||||||||||
| Institutional Class | ||||||||||||||||||||||||
5/31/2015+ | $ | 12.07 | $ | 0.22 | $ | 0.05 | $ | 0.27 | $ | (0.39 | ) | $ | (0.13 | ) | ||||||||||
11/30/2014 | 11.78 | 0.32 | 0.27 | 0.59 | (0.30 | ) | — | |||||||||||||||||
11/30/2013 | 10.97 | 0.32 | 0.95 | 1.27 | (0.46 | ) | — | |||||||||||||||||
11/30/2012 | 10.21 | 0.26 | 0.84 | 1.10 | (0.34 | ) | — | |||||||||||||||||
11/30/2011 | 10.48 | 0.27 | (0.13 | ) | 0.14 | (0.41 | ) | — | ||||||||||||||||
11/30/2010 | 9.77 | 0.29 | 0.83 | 1.12 | (0.41 | ) | — | |||||||||||||||||
| Administrative Class | ||||||||||||||||||||||||
5/31/2015+ | $ | 12.47 | $ | 0.22 | $ | 0.05 | $ | 0.27 | $ | (0.37 | ) | $ | (0.13 | ) | ||||||||||
11/30/2014 | 12.17 | 0.30 | 0.27 | 0.57 | (0.27 | ) | — | |||||||||||||||||
11/30/2013 | 11.30 | 0.43 | 0.85 | 1.28 | (0.41 | ) | — | |||||||||||||||||
11/30/2012 | 10.51 | 0.26 | 0.84 | 1.10 | (0.31 | ) | — | |||||||||||||||||
11/30/2011 | 10.78 | 0.13 | (0.01 | ) | 0.12 | (0.39 | ) | — | ||||||||||||||||
11/30/2010 | 9.83 | 0.27 | 0.86 | 1.13 | (0.18 | ) | — | |||||||||||||||||
| + | Unaudited |
| (a) | Calculated on average shares outstanding during the period. |
| (b) | Total return is calculated assuming a purchase of a share on the first day of the period and a sale of a share on the last day of each period reported. Dividends and distributions, if any, are assumed, for purposes of this calculation, to be reinvested. Total return does not reflect sales charges and includes the effect of fee waivers and reimbursements. Total return may reflect adjustments to conform to U.S. GAAP. Total return for a period of less than one year is not annualized. |
| (c) | Does not include expenses of the investment companies in which the Fund invests. |
| (d) | Annualized. |
| 240 | Semiannual Report | | May 31, 2015 | | See accompanying Notes to Financial Statements |
Table of Contents
| Total Dividends and Distributions | Net Asset Value, End of Period | Total Return (b) | Net Assets, End of Period (000s) | Ratio of Expenses to Average Net Assets with Fee Waiver/ Reimbursement (c) | Ratio of Expenses to Average Net Assets without Fee Waiver/ Reimbursement (c) | Ratio of Net Investment Income to Average Net Assets (c) | Portfolio Turnover Rate | |||||||||||||||||||||||||
| $ | (0.52 | ) | $ | 11.95 | 2.44 | % | $ | 2,245 | 0.26 | %(d) | 1.07 | %(d) | 3.71 | %(d) | 98 | % | ||||||||||||||||
| (0.29 | ) | 12.19 | 4.96 | 2,139 | 0.16 | 1.12 | 2.68 | 48 | ||||||||||||||||||||||||
| (0.45 | ) | 11.90 | 11.92 | 1,960 | 0.19 | 1.13 | 2.81 | 45 | ||||||||||||||||||||||||
| (0.31 | ) | 11.07 | 10.91 | 1,340 | 0.25 | 1.37 | 2.75 | 57 | ||||||||||||||||||||||||
| (0.41 | ) | 10.28 | 1.13 | 1,996 | 0.27 | 1.22 | 2.52 | 64 | ||||||||||||||||||||||||
| (0.40 | ) | 10.56 | 11.77 | 6,433 | 0.31 | 1.39 | 2.54 | 46 | ||||||||||||||||||||||||
| $ | (0.52 | ) | $ | 11.82 | 2.38 | % | $ | 78,669 | 0.25 | %(d) | 1.03 | %(d) | 3.75 | %(d) | 98 | % | ||||||||||||||||
| (0.30 | ) | 12.07 | 5.01 | 74,957 | 0.16 | 1.11 | 2.69 | 48 | ||||||||||||||||||||||||
| (0.46 | ) | 11.78 | 11.90 | 68,675 | 0.16 | 1.11 | 2.81 | 45 | ||||||||||||||||||||||||
| (0.34 | ) | 10.97 | 11.01 | 57,357 | 0.15 | 1.14 | 2.47 | 57 | ||||||||||||||||||||||||
| (0.41 | ) | 10.21 | 1.31 | 47,916 | 0.16 | 1.12 | 2.50 | 64 | ||||||||||||||||||||||||
| (0.41 | ) | 10.48 | 11.88 | 37,093 | 0.21 | 1.15 | 2.91 | 46 | ||||||||||||||||||||||||
| $ | (0.50 | ) | $ | 12.24 | 2.31 | % | $ | 25 | 0.51 | %(d) | 1.21 | %(d) | 3.56 | %(d) | 98 | % | ||||||||||||||||
| (0.27 | ) | 12.47 | 4.68 | 33 | 0.41 | 1.27 | 2.45 | 48 | ||||||||||||||||||||||||
| (0.41 | ) | 12.17 | 11.59 | 24 | 0.41 | 1.48 | 3.73 | 45 | ||||||||||||||||||||||||
| (0.31 | ) | 11.30 | 10.70 | 1,653 | 0.40 | 1.42 | 2.35 | 57 | ||||||||||||||||||||||||
| (0.39 | ) | 10.51 | 1.05 | 1,649 | 0.41 | 1.36 | 1.19 | 64 | ||||||||||||||||||||||||
| (0.18 | ) | 10.78 | 11.62 | 14 | 0.46 | 1.37 | 2.68 | 46 | ||||||||||||||||||||||||
| See accompanying Notes to Financial Statements | | May 31, 2015 | | Semiannual Report | 241 |
Table of Contents
Financial Highlights (cont’d)
For a Share Outstanding for the Period ended:
| Net Asset Value, Beginning of Period | Net Investment Income (a) | Net Realized and Change in Unrealized Gain (Loss) | Total from Investment Operations | Dividends from Net Investment Income | Distributions from Net Realized Capital Gains | |||||||||||||||||||
| AllianzGI Global Dynamic Allocation: | ||||||||||||||||||||||||
| Class A | ||||||||||||||||||||||||
5/31/2015+ | $ | 21.93 | $ | 0.38 | $ | (0.10 | ) | $ | 0.28 | $ | (0.81 | ) | $ | (2.08 | ) | |||||||||
11/30/2014 | 24.70 | 0.44 | 0.31 | 0.75 | (0.66 | ) | (2.86 | ) | ||||||||||||||||
11/30/2013 | 22.04 | 0.42 | 3.07 | 3.49 | (0.61 | ) | (0.22 | ) | ||||||||||||||||
11/30/2012 | 20.72 | 0.51 | 1.71 | 2.22 | (0.59 | ) | (0.31 | ) | ||||||||||||||||
11/30/2011 | 22.03 | 0.45 | (0.33 | ) | 0.12 | (0.91 | ) | (0.52 | ) | |||||||||||||||
11/30/2010 | 19.96 | 0.47 | 2.09 | 2.56 | (0.35 | ) | (0.14 | ) | ||||||||||||||||
| Class C | ||||||||||||||||||||||||
5/31/2015+ | $ | 21.52 | $ | 0.31 | $ | (0.11 | ) | $ | 0.20 | $ | (0.65 | ) | $ | (2.08 | ) | |||||||||
11/30/2014 | 24.28 | 0.25 | 0.32 | 0.57 | (0.47 | ) | (2.86 | ) | ||||||||||||||||
11/30/2013 | 21.71 | 0.30 | 2.97 | 3.27 | (0.48 | ) | (0.22 | ) | ||||||||||||||||
11/30/2012 | 20.49 | 0.30 | 1.74 | 2.04 | (0.51 | ) | (0.31 | ) | ||||||||||||||||
11/30/2011 | 21.81 | 0.24 | (0.28 | ) | (0.04 | ) | (0.76 | ) | (0.52 | ) | ||||||||||||||
11/30/2010 | 19.87 | 0.44 | 1.96 | 2.40 | (0.32 | ) | (0.14 | ) | ||||||||||||||||
| Class D | ||||||||||||||||||||||||
5/31/2015+ | $ | 21.79 | $ | 0.43 | $ | (0.16 | ) | $ | 0.27 | $ | (0.75 | ) | $ | (2.08 | ) | |||||||||
11/30/2014 | 24.58 | 0.50 | 0.25 | 0.75 | (0.68 | ) | (2.86 | ) | ||||||||||||||||
11/30/2013 | 22.00 | 0.31 | 3.16 | 3.47 | (0.67 | ) | (0.22 | ) | ||||||||||||||||
11/30/2012 | 20.78 | 0.37 | 1.85 | 2.22 | (0.69 | ) | (0.31 | ) | ||||||||||||||||
11/30/2011 | 22.06 | 0.48 | (0.36 | ) | 0.12 | (0.88 | ) | (0.52 | ) | |||||||||||||||
11/30/2010 | 19.96 | 0.63 | 1.94 | 2.57 | (0.33 | ) | (0.14 | ) | ||||||||||||||||
| Class R | ||||||||||||||||||||||||
5/31/2015+ | $ | 21.79 | $ | 0.35 | $ | (0.09 | ) | $ | 0.26 | $ | (0.78 | ) | $ | (2.08 | ) | |||||||||
11/30/2014 | 24.62 | 0.40 | 0.30 | 0.70 | (0.67 | ) | (2.86 | ) | ||||||||||||||||
11/30/2013 | 21.90 | 0.23 | 3.20 | 3.43 | (0.49 | ) | (0.22 | ) | ||||||||||||||||
11/30/2012 | 20.73 | 0.39 | 1.77 | 2.16 | (0.68 | ) | (0.31 | ) | ||||||||||||||||
11/30/2011 | 22.01 | 0.40 | (0.34 | ) | 0.06 | (0.82 | ) | (0.52 | ) | |||||||||||||||
11/30/2010 | 19.93 | 0.62 | 1.91 | 2.53 | (0.31 | ) | (0.14 | ) | ||||||||||||||||
| Class P | ||||||||||||||||||||||||
5/31/2015+ | $ | 21.94 | $ | 0.38 | $ | (0.09 | ) | $ | 0.29 | $ | (0.86 | ) | $ | (2.08 | ) | |||||||||
11/30/2014 | 24.71 | 0.46 | 0.33 | 0.79 | (0.70 | ) | (2.86 | ) | ||||||||||||||||
11/30/2013 | 22.08 | 0.38 | 3.14 | 3.52 | (0.67 | ) | (0.22 | ) | ||||||||||||||||
11/30/2012 | 20.85 | 0.49 | 1.77 | 2.26 | (0.72 | ) | (0.31 | ) | ||||||||||||||||
11/30/2011 | 22.12 | 0.63 | (0.48 | ) | 0.15 | (0.90 | ) | (0.52 | ) | |||||||||||||||
11/30/2010 | 19.99 | 0.71 | 1.91 | 2.62 | (0.35 | ) | (0.14 | ) | ||||||||||||||||
| Institutional Class | ||||||||||||||||||||||||
5/31/2015+ | $ | 22.00 | $ | 0.34 | $ | (0.04 | ) | $ | 0.30 | $ | (0.88 | ) | $ | (2.08 | ) | |||||||||
11/30/2014 | 24.74 | 0.48 | 0.34 | 0.82 | (0.70 | ) | (2.86 | ) | ||||||||||||||||
11/30/2013 | 22.10 | 0.56 | 2.99 | 3.55 | (0.69 | ) | (0.22 | ) | ||||||||||||||||
11/30/2012 | 20.87 | 0.51 | 1.78 | 2.29 | (0.75 | ) | (0.31 | ) | ||||||||||||||||
11/30/2011 | 22.14 | 0.65 | (0.48 | ) | 0.17 | (0.92 | ) | (0.52 | ) | |||||||||||||||
11/30/2010 | 20.00 | 0.73 | 1.91 | 2.64 | (0.36 | ) | (0.14 | ) | ||||||||||||||||
| Administrative Class | ||||||||||||||||||||||||
5/31/2015+ | $ | 21.90 | $ | 0.38 | $ | (0.10 | ) | $ | 0.28 | $ | (0.84 | ) | $ | (2.08 | ) | |||||||||
11/30/2014 | 24.67 | 0.42 | 0.33 | 0.75 | (0.66 | ) | (2.86 | ) | ||||||||||||||||
11/30/2013 | 22.04 | 0.48 | 3.01 | 3.49 | (0.64 | ) | (0.22 | ) | ||||||||||||||||
11/30/2012 | 20.81 | 0.46 | 1.77 | 2.23 | (0.69 | ) | (0.31 | ) | ||||||||||||||||
11/30/2011 | 22.08 | 0.59 | (0.47 | ) | 0.12 | (0.87 | ) | (0.52 | ) | |||||||||||||||
11/30/2010 | 19.97 | 0.68 | 1.90 | 2.58 | (0.33 | ) | (0.14 | ) | ||||||||||||||||
| + | Unaudited |
| (a) | Calculated on average shares outstanding during the period. |
| 242 | Semiannual Report | | May 31, 2015 | | See accompanying Notes to Financial Statements |
Table of Contents
| Total Dividends and Distributions | Net Asset Value, End of Period | Total Return (b) | Net Assets, End of Period (000s) | Ratio of Expenses to Average Net Assets with Fee Waiver/ Reimbursement (c) | Ratio of Expenses to Average Net Assets without Fee Waiver/ Reimbursement (c) | Ratio of Net Investment Income to Average Net Assets (c) | Portfolio Turnover Rate | |||||||||||||||||||||||||
| $ | (2.89 | ) | $ | 19.32 | 1.66 | % | $ | 1,108 | 0.53 | %(d) | 4.06 | %(d) | 3.97 | %(d) | 104 | % | ||||||||||||||||
| (3.52 | ) | 21.93 | 3.40 | 1,042 | 0.40 | 4.53 | 2.00 | 62 | ||||||||||||||||||||||||
| (0.83 | ) | 24.70 | 16.42 | 1,344 | 0.40 | 3.84 | 1.82 | 101 | ||||||||||||||||||||||||
| (0.90 | ) | 22.04 | 11.17 | 841 | 0.41 | 4.12 | 2.40 | 51 | ||||||||||||||||||||||||
| (1.43 | ) | 20.72 | 0.17 | 1,283 | 0.47 | 3.23 | 2.02 | 85 | ||||||||||||||||||||||||
| (0.49 | ) | 22.03 | 13.08 | 815 | 0.54 | 5.64 | 2.29 | 66 | ||||||||||||||||||||||||
| $ | (2.73 | ) | $ | 18.99 | 1.27 | % | $ | 1,318 | 1.29 | %(d) | 4.75 | %(d) | 3.25 | %(d) | 104 | % | ||||||||||||||||
| (3.33 | ) | 21.52 | 2.57 | 1,346 | 1.18 | 5.31 | 1.16 | 62 | ||||||||||||||||||||||||
| (0.70 | ) | 24.28 | 15.52 | 1,455 | 1.18 | 4.53 | 1.33 | 101 | ||||||||||||||||||||||||
| (0.82 | ) | 21.71 | 10.34 | 1,277 | 1.18 | 4.65 | 1.44 | 51 | ||||||||||||||||||||||||
| (1.28 | ) | 20.49 | (0.53 | ) | 1,241 | 1.20 | 4.46 | 1.13 | 85 | |||||||||||||||||||||||
| (0.46 | ) | 21.81 | 12.34 | 497 | 1.29 | 6.28 | 2.18 | 66 | ||||||||||||||||||||||||
| $ | (2.83 | ) | $ | 19.23 | 1.66 | % | $ | 96 | 0.50 | %(d) | 3.92 | %(d) | 4.46 | %(d) | 104 | % | ||||||||||||||||
| (3.54 | ) | 21.79 | 3.41 | 137 | 0.40 | 4.51 | 2.29 | 62 | ||||||||||||||||||||||||
| (0.89 | ) | 24.58 | 16.43 | 413 | 0.40 | 4.16 | 1.36 | 101 | ||||||||||||||||||||||||
| (1.00 | ) | 22.00 | 11.13 | 105 | 0.41 | 3.95 | 1.73 | 51 | ||||||||||||||||||||||||
| (1.40 | ) | 20.78 | 0.19 | 37 | 0.45 | 3.60 | 2.20 | 85 | ||||||||||||||||||||||||
| (0.47 | ) | 22.06 | 13.15 | 22 | 0.54 | 5.48 | 3.05 | 66 | ||||||||||||||||||||||||
| $ | (2.86 | ) | $ | 19.19 | 1.56 | % | $ | 160 | 0.77 | %(d) | 4.39 | %(d) | 3.67 | %(d) | 104 | % | ||||||||||||||||
| (3.53 | ) | 21.79 | 3.17 | 145 | 0.63 | 4.99 | 1.79 | 62 | ||||||||||||||||||||||||
| (0.71 | ) | 24.62 | 16.13 | 111 | 0.63 | 4.28 | 1.00 | 101 | ||||||||||||||||||||||||
| (0.99 | ) | 21.90 | 10.89 | 38 | 0.65 | 4.16 | 1.87 | 51 | ||||||||||||||||||||||||
| (1.34 | ) | 20.73 | (0.08 | ) | 36 | 0.71 | 3.90 | 1.84 | 85 | |||||||||||||||||||||||
| (0.45 | ) | 22.01 | 12.91 | 15 | 0.79 | 5.61 | 3.04 | 66 | ||||||||||||||||||||||||
| $ | (2.94 | ) | $ | 19.29 | 1.74 | % | $ | 49 | 0.37 | %(d) | 3.75 | %(d) | 3.90 | %(d) | 104 | % | ||||||||||||||||
| (3.56 | ) | 21.94 | 3.57 | 43 | 0.23 | 4.40 | 2.06 | 62 | ||||||||||||||||||||||||
| (0.89 | ) | 24.71 | 16.62 | 41 | 0.23 | 3.76 | 1.65 | 101 | ||||||||||||||||||||||||
| (1.03 | ) | 22.08 | 11.35 | 17 | 0.23 | 3.67 | 2.32 | 51 | ||||||||||||||||||||||||
| (1.42 | ) | 20.85 | 0.34 | 15 | 0.27 | 3.26 | 2.84 | 85 | ||||||||||||||||||||||||
| (0.49 | ) | 22.12 | 13.38 | 15 | 0.34 | 5.21 | 3.48 | 66 | ||||||||||||||||||||||||
| $ | (2.96 | ) | $ | 19.34 | 1.80 | % | $ | 5,205 | 0.29 | %(d) | 3.75 | %(d) | 3.54 | %(d) | 104 | % | ||||||||||||||||
| (3.56 | ) | 22.00 | 3.69 | 3,401 | 0.13 | 4.30 | 2.16 | 62 | ||||||||||||||||||||||||
| (0.91 | ) | 24.74 | 16.71 | 3,296 | 0.13 | 3.48 | 2.43 | 101 | ||||||||||||||||||||||||
| (1.06 | ) | 22.10 | 11.51 | 5,008 | 0.13 | 3.84 | 2.42 | 51 | ||||||||||||||||||||||||
| (1.44 | ) | 20.87 | 0.43 | 4,483 | 0.17 | 3.16 | 2.95 | 85 | ||||||||||||||||||||||||
| (0.50 | ) | 22.14 | 13.49 | 4,484 | 0.24 | 5.11 | 3.58 | 66 | ||||||||||||||||||||||||
| $ | (2.92 | ) | $ | 19.26 | 1.70 | % | $ | 27 | 0.51 | %(d) | 3.95 | %(d) | 3.91 | %(d) | 104 | % | ||||||||||||||||
| (3.52 | ) | 21.90 | 3.38 | 26 | 0.38 | 4.55 | 1.90 | 62 | ||||||||||||||||||||||||
| (0.86 | ) | 24.67 | 16.48 | 20 | 0.38 | 3.79 | 2.09 | 101 | ||||||||||||||||||||||||
| (1.00 | ) | 22.04 | 11.20 | 17 | 0.38 | 3.82 | 2.17 | 51 | ||||||||||||||||||||||||
| (1.39 | ) | 20.81 | 0.20 | 15 | 0.42 | 3.41 | 2.69 | 85 | ||||||||||||||||||||||||
| (0.47 | ) | 22.08 | 13.20 | 15 | 0.49 | 5.36 | 3.33 | 66 | ||||||||||||||||||||||||
| (b) | Total return is calculated assuming a purchase of a share on the first day of the period and a sale of a share on the last day of each period reported. Dividends and distributions, if any, are assumed, for purposes of this calculation, to be reinvested. Total return does not reflect sales charges and includes the effect of fee waivers and reimbursements. Total return may reflect adjustments to conform to U.S. GAAP. Total return for a period of less than one year is not annualized. |
| (c) | Does not include expenses of the investment companies in which the Fund invests. |
| (d) | Annualized. |
| See accompanying Notes to Financial Statements | | May 31, 2015 | | Semiannual Report | 243 |
Table of Contents
Financial Highlights (cont’d)
For a Share Outstanding for the Period ended:
| Net Asset Value, Beginning of Period | Net Investment Income (Loss) (a) | Net Realized and Change in Unrealized Gain | Total from Investment Operations | Dividends from Net Investment Income | Distributions from Net Realized Capital Gains | |||||||||||||||||||
| AllianzGI Global Megatrends: | ||||||||||||||||||||||||
| Class A | ||||||||||||||||||||||||
2/2/2015* - 5/31/2015+ | $ | 15.00 | $ | (0.01 | ) | $ | 1.06 | $ | 1.05 | $ | — | $ | — | |||||||||||
| Class P | ||||||||||||||||||||||||
2/2/2015* - 5/31/2015+ | $ | 15.00 | $ | — | (g) | $ | 1.06 | $ | 1.06 | $ | — | $ | — | |||||||||||
| Institutional Class | ||||||||||||||||||||||||
2/2/2015* - 5/31/2015+ | $ | 15.00 | $ | 0.01 | $ | 1.05 | $ | 1.06 | $ | — | $ | — | ||||||||||||
| AllianzGI Behavioral Advantage Large Cap: | ||||||||||||||||||||||||
| Class A | ||||||||||||||||||||||||
5/31/2015+ | $ | 25.67 | $ | 0.13 | $ | 0.54 | $ | 0.67 | $ | (0.35 | ) | $ | (5.86 | ) | ||||||||||
11/30/2014 | 23.72 | 0.24 | 2.79 | 3.03 | (0.24 | ) | (0.84 | ) | ||||||||||||||||
11/30/2013 | 19.04 | 0.24 | 5.73 | 5.97 | (0.20 | ) | (1.09 | ) | ||||||||||||||||
11/30/2012 | 16.05 | 0.29 | 2.76 | 3.05 | (0.06 | ) | — | |||||||||||||||||
9/8/2011* - 11/30/2011 | 15.00 | 0.04 | 1.01 | 1.05 | — | — | ||||||||||||||||||
| Class C | ||||||||||||||||||||||||
5/31/2015+ | $ | 25.17 | $ | 0.04 | $ | 0.52 | $ | 0.56 | $ | (0.24 | ) | $ | (5.86 | ) | ||||||||||
11/30/2014 | 23.34 | 0.07 | 2.74 | 2.81 | (0.14 | ) | (0.84 | ) | ||||||||||||||||
11/30/2013 | 18.90 | 0.09 | 5.65 | 5.74 | (0.21 | ) | (1.09 | ) | ||||||||||||||||
11/30/2012 | 16.02 | 0.16 | 2.74 | 2.90 | (0.02 | ) | — | |||||||||||||||||
9/8/2011* - 11/30/2011 | 15.00 | 0.01 | 1.01 | 1.02 | — | — | ||||||||||||||||||
| Class D | ||||||||||||||||||||||||
5/31/2015+ | $ | 25.63 | $ | 0.13 | $ | 0.54 | $ | 0.67 | $ | (0.49 | ) | $ | (5.86 | ) | ||||||||||
11/30/2014 | 23.50 | 0.28 | 2.75 | 3.03 | (0.06 | ) | (0.84 | ) | ||||||||||||||||
11/30/2013 | 19.04 | 0.23 | 5.68 | 5.91 | (0.36 | ) | (1.09 | ) | ||||||||||||||||
11/30/2012 | 16.05 | 0.28 | 2.77 | 3.05 | (0.06 | ) | — | |||||||||||||||||
9/8/2011* - 11/30/2011 | 15.00 | 0.04 | 1.01 | 1.05 | — | — | ||||||||||||||||||
| Class P | ||||||||||||||||||||||||
5/31/2015+ | $ | 25.84 | $ | 0.15 | $ | 0.53 | $ | 0.68 | $ | (0.47 | ) | $ | (5.86 | ) | ||||||||||
11/30/2014 | 23.74 | 0.31 | 2.78 | 3.09 | (0.15 | ) | (0.84 | ) | ||||||||||||||||
11/30/2013 | 19.09 | 0.29 | 5.71 | 6.00 | (0.26 | ) | (1.09 | ) | ||||||||||||||||
11/30/2012 | 16.05 | 0.32 | 2.79 | 3.11 | (0.07 | ) | — | |||||||||||||||||
9/8/2011* - 11/30/2011 | 15.00 | 0.05 | 1.00 | 1.05 | — | — | ||||||||||||||||||
| Institutional Class | ||||||||||||||||||||||||
5/31/2015+ | $ | 25.83 | $ | 0.16 | $ | 0.55 | $ | 0.71 | $ | (0.42 | ) | $ | (5.86 | ) | ||||||||||
11/30/2014 | 23.74 | 0.31 | 2.81 | 3.12 | (0.19 | ) | (0.84 | ) | ||||||||||||||||
11/30/2013 | 19.10 | 0.30 | 5.73 | 6.03 | (0.30 | ) | (1.09 | ) | ||||||||||||||||
11/30/2012 | 16.06 | 0.34 | 2.77 | 3.11 | (0.07 | ) | — | |||||||||||||||||
9/8/2011* - 11/30/2011 | 15.00 | 0.05 | 1.01 | 1.06 | — | — | ||||||||||||||||||
| + | Unaudited |
| * | Commencement of operations. |
| (a) | Calculated on average shares outstanding during the period. |
| 244 | Semiannual Report | | May 31, 2015 | | See accompanying Notes to Financial Statements |
Table of Contents
| Total Dividends and Distributions | Net Asset Value, End of Period | Total Return (b) | Net Assets, End of Period (000s) | Ratio of Fee Waiver/ | Ratio of Expenses to | Ratio of Net to Average | Portfolio Turnover Rate | |||||||||||||||||||||||||
| $ | — | $ | 16.05 | 7.00 | % | $ | 11 | 0.14 | %(c)(e) | 5.76 | %(c)(e) | (0.14 | )%(c)(e) | — | % | |||||||||||||||||
| $ | — | $ | 16.06 | 7.07 | % | $ | 11 | — | %(c)(e)(f) | 5.51 | %(c)(e) | 0.01 | %(c)(e) | — | % | |||||||||||||||||
| $ | — | $ | 16.06 | 7.07 | % | $ | 3,213 | — | %(c)(e)(f) | 5.51 | %(c)(e) | 0.11 | %(c)(e) | — | % | |||||||||||||||||
| $ | (6.21 | ) | $ | 20.13 | 2.99 | % | $ | 10,851 | 0.81 | %(c) | 1.00 | %(c) | 1.10 | %(c) | 53 | % | ||||||||||||||||
| (1.08 | ) | 25.67 | 13.43 | 10,023 | 0.82 | 1.02 | 1.02 | 89 | ||||||||||||||||||||||||
| (1.29 | ) | 23.72 | 33.61 | 8,607 | 0.83 | 1.25 | 1.09 | 64 | ||||||||||||||||||||||||
| (0.06 | ) | 19.04 | 19.07 | 49 | 0.90 | 2.76 | 1.59 | 76 | ||||||||||||||||||||||||
| — | 16.05 | 7.00 | 11 | 0.90 | (c) | 2.84 | (c) | 1.14 | (c) | — | (d) | |||||||||||||||||||||
| $ | (6.10 | ) | $ | 19.63 | 2.57 | % | $ | 955 | 1.57 | %(c) | 1.78 | %(c) | 0.36 | %(c) | 53 | % | ||||||||||||||||
| (0.98 | ) | 25.17 | 12.61 | 450 | 1.57 | 1.83 | 0.29 | 89 | ||||||||||||||||||||||||
| (1.30 | ) | 23.34 | 32.60 | 204 | 1.59 | 2.08 | 0.44 | 64 | ||||||||||||||||||||||||
| (0.02 | ) | 18.90 | 18.15 | 64 | 1.65 | 3.62 | 0.89 | 76 | ||||||||||||||||||||||||
| — | 16.02 | 6.80 | 10 | 1.65 | (c) | 3.59 | (c) | 0.38 | (c) | — | (d) | |||||||||||||||||||||
| $ | (6.35 | ) | $ | 19.95 | 3.03 | % | $ | 2,955 | 0.81 | %(c) | 1.62 | %(c) | 1.14 | %(c) | 53 | % | ||||||||||||||||
| (0.90 | ) | 25.63 | 13.45 | 1,025 | 0.81 | 4.22 | 1.19 | 89 | ||||||||||||||||||||||||
| (1.45 | ) | 23.50 | 33.57 | 183 | 0.85 | 2.08 | 1.15 | 64 | ||||||||||||||||||||||||
| (0.06 | ) | 19.04 | 19.07 | 19 | 0.90 | 2.61 | 1.55 | 76 | ||||||||||||||||||||||||
| — | 16.05 | 7.00 | 11 | 0.90 | (c) | 2.84 | (c) | 1.14 | (c) | — | (d) | |||||||||||||||||||||
| $ | (6.33 | ) | $ | 20.19 | 3.04 | % | $ | 109 | 0.65 | %(c) | 0.84 | %(c) | 1.26 | %(c) | 53 | % | ||||||||||||||||
| (0.99 | ) | 25.84 | 13.64 | 117 | 0.65 | 0.81 | 1.29 | 89 | ||||||||||||||||||||||||
| (1.35 | ) | 23.74 | 33.83 | 17 | 0.65 | 1.20 | 1.42 | 64 | ||||||||||||||||||||||||
| (0.07 | ) | 19.09 | 19.43 | 13 | 0.65 | 2.38 | 1.76 | 76 | ||||||||||||||||||||||||
| — | 16.05 | 7.00 | 11 | 0.65 | (c) | 2.70 | (c) | 1.39 | (c) | — | (d) | |||||||||||||||||||||
| $ | (6.28 | ) | $ | 20.26 | 3.14 | % | $ | 29,446 | 0.55 | %(c) | 0.74 | %(c) | 1.32 | %(c) | 53 | % | ||||||||||||||||
| (1.03 | ) | 25.83 | 13.79 | 74,044 | 0.55 | 0.76 | 1.29 | 89 | ||||||||||||||||||||||||
| (1.39 | ) | 23.74 | 34.02 | 48,281 | 0.55 | 1.05 | 1.44 | 64 | ||||||||||||||||||||||||
| (0.07 | ) | 19.10 | 19.46 | 17,172 | 0.55 | 2.32 | 1.88 | 76 | ||||||||||||||||||||||||
| — | 16.06 | 7.07 | 10,705 | 0.55 | (c) | 2.58 | (c) | 1.48 | (c) | — | (d) | |||||||||||||||||||||
| (b) | Total return is calculated assuming a purchase of a share on the first day of the period and a sale of a share on the last day of each period reported. Dividends and distributions, if any, are assumed, for purposes of this calculation, to be reinvested. Total return does not reflect sales charges and includes the effect of fee waivers and reimbursements. Total return may reflect adjustments to conform to U.S. GAAP. Total return for a period of less than one year is not annualized. |
| (c) | Annualized. |
| (d) | Less than 1%. |
| (e) | Does not include expenses of the investment companies in which the Fund invests. |
| (f) | See Note 6 in the Notes to Financial Statements. |
| (g) | Less than $0.01 per share. |
| See accompanying Notes to Financial Statements | | May 31, 2015 | | Semiannual Report | 245 |
Table of Contents
Financial Highlights (cont’d)
For a Share Outstanding for the Period ended:
Net Asset | Net Investment Income (a) | Net Realized and Change in Unrealized Gain | Total from Investment Operations | Dividends from Net Investment Income | Distributions from Net Realized Capital Gains | |||||||||||||||||||
| AllianzGI Best Styles Emerging Markets Equity: | ||||||||||||||||||||||||
| Class P | ||||||||||||||||||||||||
12/9/2014* - 5/31/2015+ | $ | 15.00 | $ | 0.11 | $ | 0.55 | $ | 0.66 | $ | — | (d) | $ | — | |||||||||||
| Institutional Class | ||||||||||||||||||||||||
12/9/2014* - 5/31/2015+ | $ | 15.00 | $ | 0.12 | $ | 0.54 | $ | 0.66 | $ | — | (d) | $ | — | |||||||||||
| Class R6 | ||||||||||||||||||||||||
12/9/2014* - 5/31/2015+ | $ | 15.00 | $ | 0.13 | $ | 0.54 | $ | 0.67 | $ | — | (d) | $ | — | |||||||||||
| AllianzGI Best Styles Global Equity: | ||||||||||||||||||||||||
| Class A | ||||||||||||||||||||||||
5/31/2015+ | $ | 16.57 | $ | 0.20 | $ | 0.58 | $ | 0.78 | $ | (0.43 | ) | $ | (0.40 | ) | ||||||||||
9/2/2014* - 11/30/2014 | 16.51 | 0.05 | 0.01 | 0.06 | — | — | ||||||||||||||||||
| Class P | ||||||||||||||||||||||||
12/22/2014* - 5/31/2015+ | $ | 15.68 | $ | 0.23 | $ | 0.70 | $ | 0.93 | $ | — | $ | — | ||||||||||||
| Institutional Class | ||||||||||||||||||||||||
5/31/2015+ | $ | 16.58 | $ | 0.25 | $ | 0.55 | $ | 0.80 | $ | (0.44 | ) | $ | (0.40 | ) | ||||||||||
9/2/2014* - 11/30/2014 | 16.51 | 0.06 | 0.01 | 0.07 | — | — | ||||||||||||||||||
| Class R6 | ||||||||||||||||||||||||
5/31/2015+ | $ | 16.58 | $ | 0.20 | $ | 0.62 | $ | 0.82 | $ | (0.38 | ) | $ | (0.40 | ) | ||||||||||
12/2/2013* - 11/30/2014 | 15.00 | 0.38 | 1.20 | 1.58 | — | — | ||||||||||||||||||
| AllianzGI Best Styles International Equity: | ||||||||||||||||||||||||
| Class P | ||||||||||||||||||||||||
12/9/2014* - 5/31/2015+ | $ | 15.00 | $ | 0.27 | $ | 0.48 | $ | 0.75 | $ | (0.01 | ) | $ | — | |||||||||||
| Institutional Class | ||||||||||||||||||||||||
12/9/2014* - 5/31/2015+ | $ | 15.00 | $ | 0.28 | $ | 0.47 | $ | 0.75 | $ | (0.01 | ) | $ | — | |||||||||||
| Class R6 | ||||||||||||||||||||||||
12/9/2014* - 5/31/2015+ | $ | 15.00 | $ | 0.31 | $ | 0.45 | $ | 0.76 | $ | (0.01 | ) | $ | — | |||||||||||
| AllianzGI Best Styles U.S. Equity: | ||||||||||||||||||||||||
| Class P | ||||||||||||||||||||||||
12/1/2014* - 5/31/2015+ | $ | 15.00 | $ | 0.10 | $ | 0.45 | $ | 0.55 | $ | (0.02 | ) | $ | — | |||||||||||
| Institutional Class | ||||||||||||||||||||||||
12/1/2014* - 5/31/2015+ | $ | 15.00 | $ | 0.12 | $ | 0.45 | $ | 0.57 | $ | (0.02 | ) | $ | — | |||||||||||
| Class R6 | ||||||||||||||||||||||||
12/1/2014* - 5/31/2015+ | $ | 15.00 | $ | 0.12 | $ | 0.45 | $ | 0.57 | $ | (0.02 | ) | $ | — | |||||||||||
| + | Unaudited |
| * | Commencement of operations. |
| (a) | Calculated on average shares outstanding during the period. |
| (b) | Total return is calculated assuming a purchase of a share on the first day of the period and a sale of a share on the last day of each period reported. Dividends and distributions, if any, are assumed, for purposes of this calculation, to be reinvested. Total return does not reflect sales charges and includes the effect of fee waivers and reimbursements. Total return may reflect adjustments to conform to U.S. GAAP. Total return for a period of less than one year is not annualized. |
| (c) | Annualized. |
| (d) | Less than $(0.01) per share. |
| 246 | Semiannual Report | | May 31, 2015 | | See accompanying Notes to Financial Statements |
Table of Contents
| Total Dividends and Distributions | Net Asset Value, End of Period | Total Return (b) | Net Assets, End of Period (000s) | Ratio of Expenses to Average Net Assets with Fee Waiver/ Reimbursement | Ratio of Expenses to Average Net Assets without Fee Waiver/ Reimbursement | Ratio of Net Investment Income to Average Net Assets | Portfolio Turnover Rate | |||||||||||||||||||||||||
| $ | — | (d) | $ | 15.66 | 4.42 | % | $ | 10 | 0.80 | %(c) | 5.39 | %(c) | 1.54 | %(c) | 27 | % | ||||||||||||||||
| $ | — | (d) | $ | 15.66 | 4.43 | % | $ | 10 | 0.70 | %(c) | 5.39 | %(c) | 1.64 | %(c) | 27 | % | ||||||||||||||||
| $ | — | (d) | $ | 15.67 | 4.50 | % | $ | 5,830 | 0.60 | %(c) | 5.34 | %(c) | 1.78 | %(c) | 27 | % | ||||||||||||||||
| $ | (0.83 | ) | $ | 16.52 | 5.06 | % | $ | 242 | 0.75 | %(c) | 1.22 | %(c) | 2.58 | %(c) | 20 | % | ||||||||||||||||
| — | 16.57 | 0.36 | 10 | 0.75 | (c) | 2.53 | (c) | 1.31 | (c) | 76 | ||||||||||||||||||||||
| $ | — | $ | 16.61 | 5.93 | % | $ | 4,292 | 0.60 | %(c) | 0.78 | %(c) | 3.24 | %(c) | 20 | % | |||||||||||||||||
| $ | (0.84 | ) | $ | 16.54 | 5.20 | % | $ | 106 | 0.50 | %(c) | 0.79 | %(c) | 3.17 | %(c) | 20 | % | ||||||||||||||||
| — | 16.58 | 0.42 | 10 | 0.50 | (c) | 2.27 | (c) | 1.56 | (c) | 76 | ||||||||||||||||||||||
| $ | (0.78 | ) | $ | 16.62 | 5.31 | % | $ | 111,450 | 0.40 | %(c) | 0.77 | %(c) | 2.45 | %(c) | 20 | % | ||||||||||||||||
| — | 16.58 | 10.53 | 33,422 | 0.40 | (c) | 1.80 | (c) | 2.40 | (c) | 76 | ||||||||||||||||||||||
| $ | (0.01 | ) | $ | 15.74 | 5.01 | % | $ | 11 | 0.65 | %(c) | 2.06 | %(c) | 3.73 | %(c) | 18 | % | ||||||||||||||||
| $ | (0.01 | ) | $ | 15.74 | 5.01 | % | $ | 10 | 0.55 | %(c) | 2.06 | %(c) | 3.83 | %(c) | 18 | % | ||||||||||||||||
| $ | (0.01 | ) | $ | 15.75 | 5.09 | % | $ | 33,811 | 0.45 | %(c) | 1.39 | %(c) | 4.26 | %(c) | 18 | % | ||||||||||||||||
| $ | (0.02 | ) | $ | 15.53 | 3.68 | % | $ | 28 | 0.60 | %(c) | 1.74 | %(c) | 1.34 | %(c) | 52 | % | ||||||||||||||||
| $ | (0.02 | ) | $ | 15.55 | 3.82 | % | $ | 284 | 0.50 | %(c) | 0.81 | %(c) | 1.56 | %(c) | 52 | % | ||||||||||||||||
| $ | (0.02 | ) | $ | 15.55 | 3.83 | % | $ | 60,251 | 0.40 | %(c) | 0.74 | %(c) | 1.58 | %(c) | 52 | % | ||||||||||||||||
| See accompanying Notes to Financial Statements | | May 31, 2015 | | Semiannual Report | 247 |
Table of Contents
Financial Highlights (cont’d)
For a Share Outstanding for the Period ended:
Net Asset | Net Investment Income (Loss) (a) | Net Realized and Change in Unrealized Gain (Loss) | Total from Investment Operations | Dividends from Net Investment Income | Distributions from Net Realized Capital Gains | |||||||||||||||||||
| AllianzGI China Equity: | ||||||||||||||||||||||||
| Class A | ||||||||||||||||||||||||
5/31/2015+ | $ | 17.31 | $ | 0.11 | $ | 4.55 | $ | 4.66 | $ | (0.41 | ) | $ | (0.13 | ) | ||||||||||
11/30/2014 | 16.85 | 0.20 | 0.38 | 0.58 | (0.12 | ) | — | |||||||||||||||||
11/30/2013 | 14.78 | 0.15 | 2.13 | 2.28 | (0.21 | ) | — | |||||||||||||||||
11/30/2012 | 15.01 | 0.16 | 0.91 | 1.07 | (0.10 | ) | (1.20 | ) | ||||||||||||||||
11/30/2011 | 19.81 | 0.60 | (4.58 | ) | (3.98 | ) | — | (e) | (0.82 | ) | ||||||||||||||
6/7/2010* - 11/30/2010 | 15.00 | (0.09 | ) | 4.90 | 4.81 | — | — | |||||||||||||||||
| Class C | ||||||||||||||||||||||||
5/31/2015+ | $ | 17.22 | $ | (0.11 | ) | $ | 4.80 | $ | 4.69 | $ | (0.03 | ) | $ | (0.13 | ) | |||||||||
11/30/2014 | 16.78 | (0.02 | ) | 0.46 | 0.44 | — | (e) | — | ||||||||||||||||
11/30/2013 | 14.63 | (0.03 | ) | 2.18 | 2.15 | — | (e) | — | ||||||||||||||||
11/30/2012 | 14.88 | 0.06 | 0.89 | 0.95 | — | (e) | (1.20 | ) | ||||||||||||||||
11/30/2011 | 19.78 | (0.10 | ) | (3.98 | ) | (4.08 | ) | — | (e) | (0.82 | ) | |||||||||||||
6/7/2010* - 11/30/2010 | 15.00 | (0.17 | ) | 4.95 | 4.78 | — | — | |||||||||||||||||
| Class D | ||||||||||||||||||||||||
5/31/2015+ | $ | 17.38 | $ | 0.11 | $ | 4.62 | $ | 4.73 | $ | (0.26 | ) | $ | (0.13 | ) | ||||||||||
11/30/2014 | 16.86 | 0.23 | 0.34 | 0.57 | (0.05 | ) | — | |||||||||||||||||
11/30/2013 | 14.91 | 0.07 | 2.23 | 2.30 | (0.35 | ) | — | |||||||||||||||||
11/30/2012 | 15.04 | 0.16 | 0.91 | 1.07 | — | (e) | (1.20 | ) | ||||||||||||||||
11/30/2011 | 19.84 | 0.02 | (3.99 | ) | (3.97 | ) | (0.01 | ) | (0.82 | ) | ||||||||||||||
6/7/2010* - 11/30/2010 | 15.00 | (0.08 | ) | 4.92 | 4.84 | — | — | |||||||||||||||||
| Class P | ||||||||||||||||||||||||
5/31/2015+ | $ | 17.58 | $ | 0.04 | $ | 4.86 | $ | 4.90 | $ | — | (e) | $ | (0.13 | ) | ||||||||||
11/30/2014 | 16.99 | 0.19 | 0.43 | 0.62 | (0.03 | ) | — | |||||||||||||||||
11/30/2013 | 14.78 | 0.23 | 2.11 | 2.34 | (0.13 | ) | — | |||||||||||||||||
11/30/2012 | 15.10 | 0.01 | 1.08 | 1.09 | (0.21 | ) | (1.20 | ) | ||||||||||||||||
11/30/2011 | 19.87 | 0.12 | (4.06 | ) | (3.94 | ) | (0.01 | ) | (0.82 | ) | ||||||||||||||
6/7/2010* - 11/30/2010 | 15.00 | (0.02 | ) | 4.89 | 4.87 | — | — | |||||||||||||||||
| Institutional Class | ||||||||||||||||||||||||
5/31/2015+ | $ | 17.30 | $ | (0.04 | ) | $ | 4.74 | $ | 4.70 | $ | (0.40 | ) | $ | (0.13 | ) | |||||||||
11/30/2014 | 16.82 | 0.22 | 0.39 | 0.61 | (0.13 | ) | — | |||||||||||||||||
11/30/2013 | 14.81 | 0.20 | 2.13 | 2.33 | (0.32 | ) | — | |||||||||||||||||
11/30/2012 | 15.12 | 0.20 | 0.90 | 1.10 | (0.21 | ) | (1.20 | ) | ||||||||||||||||
11/30/2011 | 19.88 | 0.18 | (4.10 | ) | (3.92 | ) | (0.02 | ) | (0.82 | ) | ||||||||||||||
6/7/2010* - 11/30/2010 | 15.00 | (0.01 | ) | 4.89 | 4.88 | — | — | |||||||||||||||||
| + | Unaudited |
| * | Commencement of operations. |
| (a) | Calculated on average shares outstanding during the period. |
| (b) | Total return is calculated assuming a purchase of a share on the first day of the period and a sale of a share on the last day of each period reported. Dividends and distributions, if any, are assumed, for purposes of this calculation, to be reinvested. Total return does not reflect sales charges and includes the effect of fee waivers and reimbursements. Total return may reflect adjustments to conform to U.S. GAAP. Total return for a period of less than one year is not annualized. |
| (c) | Annualized. |
| (d) | Payments from Affiliates increased the net asset value and the total return by $0.12 and 0.82%, respectively. |
| (e) | Less than $(0.01) per share. |
| 248 | Semiannual Report | | May 31, 2015 | | See accompanying Notes to Financial Statements |
Table of Contents
| Total Dividends and Distributions | Net Asset Value, End of Period | Total Return (b) | Net Assets, End of Period (000s) | Ratio of Expenses to Average Net Assets with Fee Waiver/ Reimbursement | Ratio of Expenses to Average Net Assets without Fee Waiver/ Reimbursement | Ratio of Net Investment Income (Loss) to Average Net Assets | Portfolio Turnover Rate | |||||||||||||||||||||||||
| $ | (0.54 | ) | $ | 21.43 | 28.00 | % | $ | 4,696 | 1.70 | %(c) | 4.26 | %(c) | 1.10 | %(c) | 36 | % | ||||||||||||||||
| (0.12 | ) | 17.31 | 3.47 | 367 | 1.70 | 5.73 | 1.21 | 123 | ||||||||||||||||||||||||
| (0.21 | ) | 16.85 | (d) | 15.58 | (d) | 137 | 1.73 | 5.88 | 0.96 | 36 | ||||||||||||||||||||||
| (1.30 | ) | 14.78 | 8.35 | 137 | 1.72 | 6.54 | 1.15 | 36 | ||||||||||||||||||||||||
| (0.82 | ) | 15.01 | (20.45 | ) | 191 | 1.73 | 5.29 | 3.25 | 132 | |||||||||||||||||||||||
| — | 19.81 | 32.07 | 239 | 1.90 | (c) | 8.21 | (c) | (0.99 | )(c) | 21 | ||||||||||||||||||||||
| $ | (0.16 | ) | $ | 21.75 | 27.51 | % | $ | 61 | 2.45 | %(c) | 5.43 | %(c) | (1.19 | )%(c) | 36 | % | ||||||||||||||||
| — | (e) | 17.22 | 2.63 | 27 | 2.50 | 6.92 | (0.10 | ) | 123 | |||||||||||||||||||||||
| — | (e) | 16.78 | (d) | 14.70 | (d) | 52 | 2.56 | 6.59 | (0.20 | ) | 36 | |||||||||||||||||||||
| (1.20 | ) | 14.63 | 7.49 | 55 | 2.52 | 8.46 | 0.43 | 36 | ||||||||||||||||||||||||
| (0.82 | ) | 14.88 | (21.02 | ) | 108 | 2.56 | 6.74 | (0.56 | ) | 132 | ||||||||||||||||||||||
| — | 19.78 | 31.87 | 387 | 2.65 | (c) | 8.88 | (c) | (1.88 | )(c) | 21 | ||||||||||||||||||||||
| $ | (0.39 | ) | $ | 21.72 | 27.94 | % | $ | 2,878 | 1.77 | %(c) | 6.46 | %(c) | 1.12 | %(c) | 36 | % | ||||||||||||||||
| (0.05 | ) | 17.38 | 3.40 | 289 | 1.77 | 9.06 | 1.34 | 123 | ||||||||||||||||||||||||
| (0.35 | ) | 16.86 | (d) | 15.64 | (d) | 220 | 1.77 | 13.23 | 0.42 | 36 | ||||||||||||||||||||||
| (1.20 | ) | 14.91 | 8.26 | 362 | 1.74 | 15.31 | 1.14 | 36 | ||||||||||||||||||||||||
| (0.83 | ) | 15.04 | (20.40 | ) | 232 | 1.77 | 6.76 | 0.14 | 132 | |||||||||||||||||||||||
| — | 19.84 | 32.27 | 386 | 1.90 | (c) | 8.10 | (c) | (0.91 | )(c) | 21 | ||||||||||||||||||||||
| $ | (0.13 | ) | $ | 22.35 | 28.12 | % | $ | 91 | 1.51 | %(c) | 4.18 | %(c) | 0.39 | %(c) | 36 | % | ||||||||||||||||
| (0.03 | ) | 17.58 | 3.62 | 38 | 1.51 | 4.74 | 1.07 | 123 | ||||||||||||||||||||||||
| (0.13 | ) | 16.99 | (d) | 15.93 | (d) | 13 | 1.51 | 5.73 | 1.53 | 36 | ||||||||||||||||||||||
| (1.41 | ) | 14.78 | 8.51 | 25 | 1.50 | 5.74 | 0.08 | 36 | ||||||||||||||||||||||||
| (0.83 | ) | 15.10 | (20.18 | ) | 124 | 1.51 | 8.18 | 0.79 | 132 | |||||||||||||||||||||||
| — | 19.87 | 32.47 | 13 | 1.65 | (c) | 8.13 | (c) | (0.19 | )(c) | 21 | ||||||||||||||||||||||
| $ | (0.53 | ) | $ | 21.47 | 28.17 | % | $ | 5,578 | 1.45 | %(c) | 4.49 | %(c) | (0.46 | )%(c) | 36 | % | ||||||||||||||||
| (0.13 | ) | 17.30 | 3.68 | 4,226 | 1.45 | 5.93 | 1.37 | 123 | ||||||||||||||||||||||||
| (0.32 | ) | 16.82 | (d) | 15.99 | (d) | 4,076 | 1.45 | 5.69 | 1.31 | 36 | ||||||||||||||||||||||
| (1.41 | ) | 14.81 | 8.64 | 3,490 | 1.43 | 6.19 | 1.41 | 36 | ||||||||||||||||||||||||
| (0.84 | ) | 15.12 | (20.11 | ) | 3,216 | 1.45 | 5.96 | 1.04 | 132 | |||||||||||||||||||||||
| — | 19.88 | 32.53 | 3,923 | 1.55 | (c) | 8.01 | (c) | (0.08 | )(c) | 21 | ||||||||||||||||||||||
| See accompanying Notes to Financial Statements | | May 31, 2015 | | Semiannual Report | 249 |
Table of Contents
Financial Highlights (cont’d)
For a Share Outstanding for the Period ended:
| Net Asset Value, Beginning of Period | Net Investment Income (a) | Net Realized and Change in Unrealized Gain | Total from Investment Operations | Dividends from Net Investment Income | Distributions from Net Realized Capital Gains | |||||||||||||||||||
| AllianzGI Convertible: | ||||||||||||||||||||||||
| Class A | ||||||||||||||||||||||||
5/31/2015+ | $ | 36.54 | $ | 0.19 | $ | 1.71 | $ | 1.90 | $ | (0.37 | ) | $ | (2.29 | ) | ||||||||||
11/30/2014 | 34.91 | 0.39 | 2.81 | 3.20 | (0.73 | ) | (0.84 | ) | ||||||||||||||||
11/30/2013 | 28.27 | 0.54 | 6.59 | 7.13 | (0.49 | ) | — | |||||||||||||||||
11/30/2012 | 28.11 | 0.53 | 1.95 | 2.48 | (0.75 | ) | (1.57 | ) | ||||||||||||||||
11/30/2011 | 28.21 | 0.55 | 0.01 | 0.56 | (0.66 | ) | — | |||||||||||||||||
4/12/2010* - 11/30/2010 | 26.22 | 0.38 | 1.82 | 2.20 | (0.21 | ) | — | |||||||||||||||||
| Class C | ||||||||||||||||||||||||
5/31/2015+ | $ | 36.55 | $ | 0.05 | $ | 1.73 | $ | 1.78 | $ | (0.24 | ) | $ | (2.29 | ) | ||||||||||
11/30/2014 | 34.93 | 0.13 | 2.80 | 2.93 | (0.47 | ) | (0.84 | ) | ||||||||||||||||
11/30/2013 | 28.30 | 0.30 | 6.60 | 6.90 | (0.27 | ) | — | |||||||||||||||||
11/30/2012 | 28.15 | 0.32 | 1.96 | 2.28 | (0.56 | ) | (1.57 | ) | ||||||||||||||||
11/30/2011 | 28.30 | 0.34 | 0.03 | 0.37 | (0.52 | ) | — | |||||||||||||||||
4/12/2010* - 11/30/2010 | 26.22 | 0.24 | 1.84 | 2.08 | — | (e) | — | |||||||||||||||||
| Class D | ||||||||||||||||||||||||
5/31/2015+ | $ | 36.51 | $ | 0.16 | $ | 1.72 | $ | 1.88 | $ | (0.34 | ) | $ | (2.29 | ) | ||||||||||
11/30/2014 | 34.86 | 0.38 | 2.79 | 3.17 | (0.68 | ) | (0.84 | ) | ||||||||||||||||
11/30/2013 | 28.22 | 0.52 | 6.57 | 7.09 | (0.45 | ) | — | |||||||||||||||||
11/30/2012 | 28.08 | 0.51 | 1.95 | 2.46 | (0.75 | ) | (1.57 | ) | ||||||||||||||||
11/30/2011 | 28.16 | 0.54 | 0.03 | 0.57 | (0.65 | ) | — | |||||||||||||||||
4/12/2010* - 11/30/2010 | 26.22 | 0.40 | 1.79 | 2.19 | (0.25 | ) | — | |||||||||||||||||
| Class R | ||||||||||||||||||||||||
5/31/2015+ | $ | 36.45 | $ | 0.13 | $ | 1.72 | $ | 1.85 | $ | (0.31 | ) | $ | (2.29 | ) | ||||||||||
11/30/2014 | 34.87 | 0.26 | 2.81 | 3.07 | (0.65 | ) | (0.84 | ) | ||||||||||||||||
11/30/2013 | 28.20 | 0.34 | 6.61 | 6.95 | (0.28 | ) | — | |||||||||||||||||
11/30/2012 | 28.08 | 0.43 | 1.95 | 2.38 | (0.69 | ) | (1.57 | ) | ||||||||||||||||
11/30/2011 | 28.17 | 0.48 | 0.02 | 0.50 | (0.59 | ) | — | |||||||||||||||||
4/12/2010* - 11/30/2010 | 26.22 | 0.33 | 1.82 | 2.15 | (0.20 | ) | — | |||||||||||||||||
| Class P | ||||||||||||||||||||||||
5/31/2015+ | $ | 36.47 | $ | 0.22 | $ | 1.72 | $ | 1.94 | $ | (0.40 | ) | $ | (2.29 | ) | ||||||||||
11/30/2014 | 34.84 | 0.47 | 2.80 | 3.27 | (0.80 | ) | (0.84 | ) | ||||||||||||||||
11/30/2013 | 28.20 | 0.63 | 6.55 | 7.18 | (0.54 | ) | — | |||||||||||||||||
11/30/2012 | 28.04 | 0.58 | 1.94 | 2.52 | (0.79 | ) | (1.57 | ) | ||||||||||||||||
11/30/2011 | 28.12 | 0.60 | 0.01 | 0.61 | (0.69 | ) | — | |||||||||||||||||
6/7/2010* - 11/30/2010 | 24.02 | 0.27 | 4.11 | 4.38 | (0.28 | ) | — | |||||||||||||||||
| Institutional Class | ||||||||||||||||||||||||
5/31/2015+ | $ | 36.42 | $ | 0.24 | $ | 1.72 | $ | 1.96 | $ | (0.42 | ) | $ | (2.29 | ) | ||||||||||
11/30/2014 | 34.80 | 0.50 | 2.79 | 3.29 | (0.83 | ) | (0.84 | ) | ||||||||||||||||
11/30/2013 | 28.16 | 0.61 | 6.59 | 7.20 | (0.56 | ) | — | |||||||||||||||||
11/30/2012 | 28.00 | 0.62 | 1.94 | 2.56 | (0.83 | ) | (1.57 | ) | ||||||||||||||||
11/30/2011 | 28.08 | 0.63 | 0.01 | 0.64 | (0.72 | ) | — | |||||||||||||||||
11/30/2010 | 23.92 | 0.62 | 4.20 | 4.82 | (0.66 | ) | — | |||||||||||||||||
| Administrative Class | ||||||||||||||||||||||||
5/31/2015+ | $ | 36.54 | $ | 0.19 | $ | 1.72 | $ | 1.91 | $ | (0.37 | ) | $ | (2.29 | ) | ||||||||||
11/30/2014 | 34.84 | 0.43 | 2.79 | 3.22 | (0.68 | ) | (0.84 | ) | ||||||||||||||||
11/30/2013 | 28.20 | 0.53 | 6.59 | 7.12 | (0.48 | ) | — | |||||||||||||||||
11/30/2012 | 28.04 | 0.55 | 1.94 | 2.49 | (0.76 | ) | (1.57 | ) | ||||||||||||||||
11/30/2011 | 28.14 | 0.55 | 0.01 | 0.56 | (0.66 | ) | — | |||||||||||||||||
4/12/2010* - 11/30/2010 | 26.22 | 0.37 | 1.83 | 2.20 | (0.28 | ) | — | |||||||||||||||||
| + | Unaudited |
| * | Commencement of operations. |
| (a) | Calculated on average shares outstanding during the period. |
| 250 | Semiannual Report | | May 31, 2015 | | See accompanying Notes to Financial Statements |
Table of Contents
| Total Dividends and Distributions | Net Asset Value, End of Period | Total Return (b) | Net Assets, End of Period | Ratio of Expenses to Average Net Assets with Fee Waiver/ Reimbursement | Ratio of Expenses to Average Net Assets without Fee Waiver/ Reimbursement | Ratio of Net Income to Average | Portfolio Turnover Rate | |||||||||||||||||||||||||
| $ | (2.66 | ) | $ | 35.78 | 5.75 | % | $ | 496,355 | 0.94 | %(c) | 0.94 | %(c) | 1.08 | %(c) | 46 | % | ||||||||||||||||
| (1.57 | ) | 36.54 | (d) | 9.47 | (d) | 483,863 | 0.97 | 0.97 | 1.09 | 94 | ||||||||||||||||||||||
| (0.49 | ) | 34.91 | 25.49 | 319,778 | 0.96 | 0.96 | 1.67 | 81 | ||||||||||||||||||||||||
| (2.32 | ) | 28.27 | 9.64 | 94,347 | 1.01 | 1.01 | 1.91 | 108 | ||||||||||||||||||||||||
| (0.66 | ) | 28.11 | 1.95 | 64,857 | 0.97 | 0.97 | 1.89 | 129 | ||||||||||||||||||||||||
| (0.21 | ) | 28.21 | 8.46 | 10,500 | 0.96 | (c) | 0.97 | (c) | 2.25 | (c) | 116 | |||||||||||||||||||||
| $ | (2.53 | ) | $ | 35.80 | 5.38 | % | $ | 119,090 | 1.70 | %(c) | 1.70 | %(c) | 0.31 | %(c) | 46 | % | ||||||||||||||||
| (1.31 | ) | 36.55 | (d) | 8.66 | (d) | 127,201 | 1.70 | 1.70 | 0.36 | 94 | ||||||||||||||||||||||
| (0.27 | ) | 34.93 | 24.55 | 113,799 | 1.70 | 1.70 | 0.94 | 81 | ||||||||||||||||||||||||
| (2.13 | ) | 28.30 | 8.81 | 36,917 | 1.76 | 1.76 | 1.16 | 108 | ||||||||||||||||||||||||
| (0.52 | ) | 28.15 | 1.26 | 27,465 | 1.74 | 1.74 | 1.17 | 129 | ||||||||||||||||||||||||
| — | (e) | 28.30 | 7.94 | 227 | 1.77 | (c) | 1.77 | (c) | 1.40 | (c) | 116 | |||||||||||||||||||||
| $ | (2.63 | ) | $ | 35.76 | 5.69 | % | $ | 70,257 | 1.07 | %(c) | 1.07 | %(c) | 0.94 | %(c) | 46 | % | ||||||||||||||||
| (1.52 | ) | 36.51 | (d) | 9.41 | (d) | 79,288 | 1.02 | 1.02 | 1.05 | 94 | ||||||||||||||||||||||
| (0.45 | ) | 34.86 | 25.41 | 121,663 | 1.02 | 1.02 | 1.60 | 81 | ||||||||||||||||||||||||
| (2.32 | ) | 28.22 | 9.57 | 35,886 | 1.06 | 1.06 | 1.85 | 108 | ||||||||||||||||||||||||
| (0.65 | ) | 28.08 | 1.99 | 30,176 | 0.98 | 0.98 | 1.83 | 129 | ||||||||||||||||||||||||
| (0.25 | ) | 28.16 | 8.46 | 2,180 | 0.93 | (c) | 0.94 | (c) | 2.31 | (c) | 116 | |||||||||||||||||||||
| $ | (2.60 | ) | $ | 35.70 | 5.61 | % | $ | 1,706 | 1.28 | %(c) | 1.28 | %(c) | 0.75 | %(c) | 46 | % | ||||||||||||||||
| (1.49 | ) | 36.45 | (d) | 9.10 | (d) | 1,440 | 1.30 | 1.30 | 0.74 | 94 | ||||||||||||||||||||||
| (0.28 | ) | 34.87 | 24.86 | 394 | 1.51 | 1.51 | 1.06 | 81 | ||||||||||||||||||||||||
| (2.26 | ) | 28.20 | 9.25 | 210 | 1.36 | 1.36 | 1.58 | 108 | ||||||||||||||||||||||||
| (0.59 | ) | 28.08 | 1.76 | 37 | 1.22 | 1.22 | 1.67 | 129 | ||||||||||||||||||||||||
| (0.20 | ) | 28.17 | 8.29 | 11 | 1.25 | (c) | 1.26 | (c) | 1.97 | (c) | 116 | |||||||||||||||||||||
| $ | (2.69 | ) | $ | 35.72 | 5.88 | % | $ | 191,182 | 0.73 | %(c) | 0.73 | %(c) | 1.29 | %(c) | 46 | % | ||||||||||||||||
| (1.64 | ) | 36.47 | (d) | 9.71 | (d) | 224,860 | 0.74 | 0.74 | 1.32 | 94 | ||||||||||||||||||||||
| (0.54 | ) | 34.84 | 25.76 | 251,377 | 0.75 | 0.75 | 1.96 | 81 | ||||||||||||||||||||||||
| (2.36 | ) | 28.20 | 9.84 | 53,368 | 0.80 | 0.86 | 2.12 | 108 | ||||||||||||||||||||||||
| (0.69 | ) | 28.04 | 2.14 | 37,551 | 0.80 | 0.83 | 2.07 | 129 | ||||||||||||||||||||||||
| (0.28 | ) | 28.12 | 18.34 | 21,417 | 0.84 | (c) | 0.87 | (c) | 2.35 | (c) | 116 | |||||||||||||||||||||
| $ | (2.71 | ) | $ | 35.67 | 5.94 | % | $ | 1,630,173 | 0.64 | %(c) | 0.64 | %(c) | 1.38 | %(c) | 46 | % | ||||||||||||||||
| (1.67 | ) | 36.42 | (d) | 9.79 | (d) | 1,781,193 | 0.65 | 0.65 | 1.41 | 94 | ||||||||||||||||||||||
| (0.56 | ) | 34.80 | 25.88 | 1,583,824 | 0.65 | 0.65 | 1.93 | 81 | ||||||||||||||||||||||||
| (2.40 | ) | 28.16 | 10.00 | 804,646 | 0.67 | 0.67 | 2.26 | 108 | ||||||||||||||||||||||||
| (0.72 | ) | 28.00 | 2.24 | 521,854 | 0.70 | 0.70 | 2.16 | 129 | ||||||||||||||||||||||||
| (0.66 | ) | 28.08 | 20.46 | 471,226 | 0.77 | 0.80 | 2.42 | 116 | ||||||||||||||||||||||||
| $ | (2.66 | ) | $ | 35.79 | 5.77 | % | $ | 2,239 | 0.90 | %(c) | 0.90 | %(c) | 1.11 | %(c) | 46 | % | ||||||||||||||||
| (1.52 | ) | 36.54 | (d) | 9.57 | (d) | 3,783 | 0.89 | 0.89 | 1.22 | 94 | ||||||||||||||||||||||
| (0.48 | ) | 34.84 | 25.55 | 12,951 | 0.90 | 0.90 | 1.65 | 81 | ||||||||||||||||||||||||
| (2.33 | ) | 28.20 | 9.70 | 2,199 | 0.92 | 0.92 | 2.00 | 108 | ||||||||||||||||||||||||
| (0.66 | ) | 28.04 | 2.00 | 1,352 | 0.97 | 0.97 | 1.90 | 129 | ||||||||||||||||||||||||
| (0.28 | ) | 28.14 | 8.45 | 11 | 0.98 | (c) | 0.99 | (c) | 2.23 | (c) | 116 | |||||||||||||||||||||
| (b) | Total return is calculated assuming a purchase of a share on the first day of the period and a sale of a share on the last day of each period reported. Dividends and distributions, if any, are assumed, for purposes of this calculation, to be reinvested. Total return does not reflect sales charges and includes the effect of fee waivers and reimbursements. Total return may reflect adjustments to conform to U.S. GAAP. Total return for a period of less than one year is not annualized. |
| (c) | Annualized. |
| (d) | Payments from Affiliates increased net asset value and total return by less than $0.01 and 0.01%, respectively. |
| (e) | Less than $(0.01) per share. |
| See accompanying Notes to Financial Statements | | May 31, 2015 | | Semiannual Report | 251 |
Table of Contents
Financial Highlights (cont’d)
For a Share Outstanding for the Period ended:
| Net Asset Value, Beginning of Period | Net Investment Income (Loss) (a) | Net Realized and Change in Unrealized Gain (Loss) | Total from Investment Operations | Dividends from Net Investment Income | ||||||||||||||||||
| AllianzGI Emerging Markets Consumer: | ||||||||||||||||||||||
| Class A | ||||||||||||||||||||||
12/1/2014* - 5/31/2015+ | $ | 15.00 | $ | — | (d) | $ | (0.19 | ) | $ | (0.19 | ) | $ | — | |||||||||
| Institutional Class | ||||||||||||||||||||||
12/1/2014* - 5/31/2015+ | $ | 15.00 | $ | 0.02 | $ | (0.18 | ) | $ | (0.16 | ) | $ | — | ||||||||||
| AllianzGI Emerging Markets Debt: | ||||||||||||||||||||||
| Class A | ||||||||||||||||||||||
5/31/2015+ | $ | 14.92 | $ | 0.28 | $ | (0.21 | ) | $ | 0.07 | $ | (0.33 | ) | ||||||||||
9/15/2014* - 11/30/2014 | 15.00 | 0.11 | (0.19 | ) | (0.08 | ) | — | |||||||||||||||
| Class C | ||||||||||||||||||||||
5/31/2015+ | $ | 14.90 | $ | 0.22 | $ | (0.21 | ) | $ | 0.01 | $ | (0.27 | ) | ||||||||||
9/15/2014* - 11/30/2014 | 15.00 | 0.09 | (0.19 | ) | (0.10 | ) | — | |||||||||||||||
| Class P | ||||||||||||||||||||||
5/31/2015+ | $ | 14.92 | $ | 0.29 | $ | (0.21 | ) | $ | 0.08 | $ | (0.34 | ) | ||||||||||
9/15/2014* - 11/30/2014 | 15.00 | 0.12 | (0.20 | ) | (0.08 | ) | — | |||||||||||||||
| Institutional Class | ||||||||||||||||||||||
5/31/2015+ | $ | 14.93 | $ | 0.29 | $ | (0.20 | ) | $ | 0.09 | $ | (0.35 | ) | ||||||||||
9/15/2014* - 11/30/2014 | 15.00 | 0.12 | (0.19 | ) | (0.07 | ) | — | |||||||||||||||
| AllianzGI Emerging Markets Small-Cap: | ||||||||||||||||||||||
| Class A | ||||||||||||||||||||||
12/1/2014* - 5/31/2015+ | $ | 15.00 | $ | 0.07 | $ | 1.73 | $ | 1.80 | $ | — | (d) | |||||||||||
| Institutional Class | ||||||||||||||||||||||
12/1/2014* - 5/31/2015+ | $ | 15.00 | $ | 0.09 | $ | 1.73 | $ | 1.82 | $ | — | (d) | |||||||||||
| AllianzGI Europe Equity Dividend: | ||||||||||||||||||||||
| Class A | ||||||||||||||||||||||
2/2/2015* - 5/31/2015+ | $ | 15.00 | $ | 0.29 | $ | (0.02 | ) | $ | 0.27 | $ | — | |||||||||||
| Class C | ||||||||||||||||||||||
2/2/2015* - 5/31/2015+ | $ | 15.00 | $ | 0.39 | $ | (0.15 | ) | $ | 0.24 | $ | — | |||||||||||
| Class P | ||||||||||||||||||||||
2/2/2015* - 5/31/2015+ | $ | 15.00 | $ | 0.38 | $ | (0.10 | ) | $ | 0.28 | $ | — | |||||||||||
| Institutional Class | ||||||||||||||||||||||
2/2/2015* - 5/31/2015+ | $ | 15.00 | $ | 0.31 | $ | (0.03 | ) | $ | 0.28 | $ | — | |||||||||||
| + | Unaudited |
| * | Commencement of operations. |
| (a) | Calculated on average shares outstanding during the period. |
| (b) | Total return is calculated assuming a purchase of a share on the first day of the period and a sale of a share on the last day of each period reported. Dividends and distributions, if any, are assumed, for purposes of this calculation, to be reinvested. Total return does not reflect sales charges and includes the effect of fee waivers and reimbursements. Total return may reflect adjustments to conform to U.S. GAAP. Total return for a period of less than one year is not annualized. |
| (c) | Annualized. |
| (d) | Less than $(0.01) per share. |
| 252 | Semiannual Report | | May 31, 2015 | | See accompanying Notes to Financial Statements |
Table of Contents
| Net Asset Value, End of Period | Total Return (b) | Net Assets, End of Period (000s) | Ratio of Expenses to Average Net Assets with Fee Waiver/ Reimbursement | Ratio of Expenses to Average Net Assets without Fee Waiver/ Reimbursement | Ratio of Net Investment Income (Loss) to Average Net Assets | Portfolio Turnover Rate | ||||||||||||||||||||||
| $ | 14.81 | (1.27 | )% | $ | 45 | 1.65 | %(c) | 3.86 | %(c) | (0.01 | )%(c) | 34 | % | |||||||||||||||
| $ | 14.84 | (1.07 | )% | $ | 12,946 | 1.30 | %(c) | 3.08 | %(c) | 0.27 | %(c) | 34 | % | |||||||||||||||
| $ | 14.66 | 0.55 | % | $ | 10 | 1.24 | %(c) | 2.17 | %(c) | 3.82 | %(c) | 77 | % | |||||||||||||||
| 14.92 | (0.53 | ) | 10 | 1.20 | (c) | 2.51 | (c) | 3.65 | (c) | 27 | ||||||||||||||||||
| $ | 14.64 | 0.15 | % | $ | 10 | 1.99 | %(c) | 2.91 | %(c) | 3.08 | %(c) | 77 | % | |||||||||||||||
| 14.90 | (0.67 | ) | 10 | 1.95 | (c) | 3.25 | (c) | 2.90 | (c) | 27 | ||||||||||||||||||
| $ | 14.66 | 0.63 | % | $ | 10 | 1.09 | %(c) | 1.91 | %(c) | 3.97 | %(c) | 77 | % | |||||||||||||||
| 14.92 | (0.53 | ) | 10 | 1.05 | (c) | 2.25 | (c) | 3.80 | (c) | 27 | ||||||||||||||||||
| $ | 14.67 | 0.69 | % | $ | 30,487 | 0.99 | %(c) | 1.92 | %(c) | 4.07 | %(c) | 77 | % | |||||||||||||||
| 14.93 | (0.47 | ) | 29,856 | 0.95 | (c) | 2.28 | (c) | 3.91 | (c) | 27 | ||||||||||||||||||
| $ | 16.80 | 12.01 | % | $ | 21 | 1.85 | %(c) | 6.69 | %(c) | 0.87 | %(c) | 56 | % | |||||||||||||||
| $ | 16.82 | 12.16 | % | $ | 5,217 | 1.50 | %(c) | 6.67 | %(c) | 1.10 | %(c) | 56 | % | |||||||||||||||
| $ | 15.27 | 1.80 | % | $ | 10 | 1.20 | %(c) | 9.10 | %(c) | 5.93 | %(c) | 12 | % | |||||||||||||||
| $ | 15.24 | 1.60 | % | $ | 164 | 1.95 | %(c) | 9.23 | %(c) | 8.07 | %(c) | 12 | % | |||||||||||||||
| $ | 15.28 | 1.87 | % | $ | 25 | 1.05 | %(c) | 8.64 | %(c) | 7.71 | %(c) | 12 | % | |||||||||||||||
| $ | 15.28 | 1.87 | % | $ | 3,100 | 0.95 | %(c) | 8.84 | %(c) | 6.20 | %(c) | 12 | % | |||||||||||||||
| See accompanying Notes to Financial Statements | | May 31, 2015 | | Semiannual Report | 253 |
Table of Contents
Financial Highlights (cont’d)
For a Share Outstanding for the Period ended:
| Net Asset Value, Beginning of Period | Net Investment Income (a) | Net Realized and Change in Unrealized Gain (Loss) | Total from Investment Operations | Dividends from Net Investment Income | Distributions from Net Realized Capital Gains | |||||||||||||||||||
| AllianzGI Global Fundamental Strategy: | ||||||||||||||||||||||||
| Class A | ||||||||||||||||||||||||
5/31/2015+ | $ | 15.95 | $ | 0.16 | $ | (0.03 | ) | $ | 0.13 | $ | (0.56 | ) | $ | — | ||||||||||
11/30/2014 | 15.45 | 0.26 | 0.42 | 0.68 | (0.12 | ) | (0.06 | ) | ||||||||||||||||
7/1/2013* - 11/30/2013 | 15.00 | 0.06 | 0.39 | 0.45 | — | — | ||||||||||||||||||
| Class C | ||||||||||||||||||||||||
5/31/2015+ | $ | 15.84 | $ | 0.09 | $ | (0.02 | ) | $ | 0.07 | $ | (0.40 | ) | $ | — | ||||||||||
11/30/2014 | 15.40 | 0.14 | 0.42 | 0.56 | (0.06 | ) | (0.06 | ) | ||||||||||||||||
7/1/2013* - 11/30/2013 | 15.00 | 0.01 | 0.39 | 0.40 | — | — | ||||||||||||||||||
| Class D | ||||||||||||||||||||||||
5/31/2015+ | $ | 15.95 | $ | 0.15 | $ | (0.01 | ) | $ | 0.14 | $ | — | (e) | $ | — | ||||||||||
11/30/2014 | 15.45 | 0.43 | 0.25 | 0.68 | (0.12 | ) | (0.06 | ) | ||||||||||||||||
7/1/2013* - 11/30/2013 | 15.00 | 0.06 | 0.39 | 0.45 | — | — | ||||||||||||||||||
| Class P | ||||||||||||||||||||||||
5/31/2015+ | $ | 15.98 | $ | 0.16 | $ | (0.03 | ) | $ | 0.13 | $ | (0.54 | ) | $ | — | ||||||||||
11/30/2014 | 15.46 | 0.28 | 0.43 | 0.71 | (0.13 | ) | (0.06 | ) | ||||||||||||||||
7/1/2013* - 11/30/2013 | 15.00 | 0.07 | 0.39 | 0.46 | — | — | ||||||||||||||||||
| Institutional Class | ||||||||||||||||||||||||
5/31/2015+ | $ | 15.99 | $ | 0.17 | $ | (0.03 | ) | $ | 0.14 | $ | (0.55 | ) | $ | — | ||||||||||
11/30/2014 | 15.47 | 0.30 | 0.42 | 0.72 | (0.14 | ) | (0.06 | ) | ||||||||||||||||
7/1/2013* - 11/30/2013 | 15.00 | 0.08 | 0.39 | 0.47 | — | — | ||||||||||||||||||
| AllianzGI Global Managed Volatility: | ||||||||||||||||||||||||
| Class A | ||||||||||||||||||||||||
5/31/2015+ | $ | 18.73 | $ | 0.21 | $ | (0.17 | ) | $ | 0.04 | $ | (0.46 | ) | $ | (1.55 | ) | |||||||||
11/30/2014 | 17.96 | 0.40 | 1.42 | 1.82 | (0.49 | ) | (0.56 | ) | ||||||||||||||||
11/30/2013 | 16.68 | 0.39 | 1.63 | 2.02 | (0.59 | ) | (0.15 | ) | ||||||||||||||||
12/19/2011* - 11/30/2012 | 15.00 | 0.39 | 1.29 | 1.68 | — | — | ||||||||||||||||||
| Class C | ||||||||||||||||||||||||
5/31/2015+ | $ | 18.26 | $ | 0.15 | $ | (0.16 | ) | $ | (0.01 | ) | $ | (0.36 | ) | $ | (1.55 | ) | ||||||||
11/30/2014 | 17.62 | 0.26 | 1.40 | 1.66 | (0.46 | ) | (0.56 | ) | ||||||||||||||||
11/30/2013 | 16.56 | 0.24 | 1.64 | 1.88 | (0.67 | ) | (0.15 | ) | ||||||||||||||||
12/19/2011* - 11/30/2012 | 15.00 | 0.33 | 1.23 | 1.56 | — | — | ||||||||||||||||||
| Class D | ||||||||||||||||||||||||
5/31/2015+ | $ | 18.72 | $ | 0.21 | $ | (0.18 | ) | $ | 0.03 | $ | (0.49 | ) | $ | (1.55 | ) | |||||||||
11/30/2014 | 17.88 | 0.39 | 1.43 | 1.82 | (0.42 | ) | (0.56 | ) | ||||||||||||||||
11/30/2013 | 16.68 | 0.45 | 1.58 | 2.03 | (0.68 | ) | (0.15 | ) | ||||||||||||||||
12/19/2011* - 11/30/2012 | 15.00 | 0.39 | 1.29 | 1.68 | — | — | ||||||||||||||||||
| Class P | ||||||||||||||||||||||||
5/31/2015+ | $ | 18.86 | $ | 0.23 | $ | (0.18 | ) | $ | 0.05 | $ | (0.45 | ) | $ | (1.55 | ) | |||||||||
11/30/2014 | 18.06 | 0.43 | 1.45 | 1.88 | (0.52 | ) | (0.56 | ) | ||||||||||||||||
11/30/2013 | 16.71 | 0.48 | 1.61 | 2.09 | (0.59 | ) | (0.15 | ) | ||||||||||||||||
12/19/2011* - 11/30/2012 | 15.00 | 0.48 | 1.23 | 1.71 | — | — | ||||||||||||||||||
| Institutional Class | ||||||||||||||||||||||||
5/31/2015+ | $ | 18.85 | $ | 0.27 | $ | (0.20 | ) | $ | 0.07 | $ | (0.47 | ) | $ | (1.55 | ) | |||||||||
11/30/2014 | 18.06 | 0.46 | 1.42 | 1.88 | (0.53 | ) | (0.56 | ) | ||||||||||||||||
11/30/2013 | 16.73 | 0.50 | 1.60 | 2.10 | (0.62 | ) | (0.15 | ) | ||||||||||||||||
12/19/2011* - 11/30/2012 | 15.00 | 0.49 | 1.24 | 1.73 | — | — | ||||||||||||||||||
| + | Unaudited |
| * | Commencement of operations. |
| (a) | Calculated on average shares outstanding during the period. |
| 254 | Semiannual Report | | May 31, 2015 | | See accompanying Notes to Financial Statements |
Table of Contents
| Total Dividends and Distributions | Net Asset Value, End of Period | Total Return (b) | Net Assets, End of Period (000s) | Ratio of Expenses to Average Net Assets with Fee Waiver/ Reimbursement | Ratio of Assets without | Ratio of Net Investment Income to Average Net Assets | Portfolio Turnover Rate | |||||||||||||||||||||||||
| $ | (0.56 | ) | $ | 15.52 | 0.90 | % | $ | 25 | 1.25 | %(c) | 1.91 | %(c) | 2.13 | %(c) | 11 | % | ||||||||||||||||
| (0.18 | ) | 15.95 | (d) | 4.45 | (d) | 16 | 1.25 | 2.36 | 1.62 | 28 | ||||||||||||||||||||||
| — | 15.45 | 3.00 | 10 | 1.25 | (c) | 2.41 | (c) | 0.96 | (c) | 2 | ||||||||||||||||||||||
| $ | (0.40 | ) | $ | 15.51 | 0.48 | % | $ | 11 | 2.00 | %(c) | 2.65 | %(c) | 1.15 | %(c) | 11 | % | ||||||||||||||||
| (0.12 | ) | 15.84 | (d) | 3.69 | (d) | 11 | 2.00 | 3.14 | 0.88 | 28 | ||||||||||||||||||||||
| — | 15.40 | 2.67 | 10 | 2.00 | (c) | 3.16 | (c) | 0.21 | (c) | 2 | ||||||||||||||||||||||
| $ | — | (e) | $ | 16.09 | 0.88 | % | $ | 50 | 1.25 | %(c) | 5.81 | %(c) | 1.85 | %(c) | 11 | % | ||||||||||||||||
| (0.18 | ) | 15.95 | (d) | 4.45 | (d) | 54 | 1.25 | 2.95 | 2.75 | 28 | ||||||||||||||||||||||
| — | 15.45 | 3.00 | 10 | 1.25 | (c) | 2.41 | (c) | 0.97 | (c) | 2 | ||||||||||||||||||||||
| $ | (0.54 | ) | $ | 15.57 | 0.88 | % | $ | 11 | 1.10 | %(c) | 1.65 | %(c) | 2.05 | %(c) | 11 | % | ||||||||||||||||
| (0.19 | ) | 15.98 | (d) | 4.66 | (d) | 11 | 1.10 | 2.14 | 1.79 | 28 | ||||||||||||||||||||||
| — | 15.46 | 3.07 | 10 | 1.10 | (c) | 2.16 | (c) | 1.12 | (c) | 2 | ||||||||||||||||||||||
| $ | (0.55 | ) | $ | 15.58 | 0.99 | % | $ | 22,350 | 1.00 | %(c) | 1.64 | %(c) | 2.15 | %(c) | 11 | % | ||||||||||||||||
| (0.20 | ) | 15.99 | (d) | 4.72 | (d) | 22,115 | 1.00 | 2.15 | 1.90 | 28 | ||||||||||||||||||||||
| — | 15.47 | 3.13 | 20,682 | 1.00 | (c) | 2.14 | (c) | 1.23 | (c) | 2 | ||||||||||||||||||||||
| $ | (2.01 | ) | $ | 16.76 | 0.32 | % | $ | 203 | 0.95 | %(c) | 7.44 | %(c) | 2.51 | %(c) | 56 | % | ||||||||||||||||
| (1.05 | ) | 18.73 | 10.88 | 197 | 0.94 | 2.59 | 2.25 | 118 | ||||||||||||||||||||||||
| (0.74 | ) | 17.96 | 12.66 | 117 | 0.95 | 2.63 | 2.28 | 92 | ||||||||||||||||||||||||
| — | 16.68 | 11.20 | 50 | 0.95 | (c) | 3.24 | (c) | 2.56 | (c) | 92 | ||||||||||||||||||||||
| $ | (1.91 | ) | $ | 16.34 | 0.03 | % | $ | 335 | 1.63 | %(c) | 8.35 | %(c) | 1.82 | %(c) | 56 | % | ||||||||||||||||
| (1.02 | ) | 18.26 | 10.07 | 258 | 1.62 | 3.30 | 1.49 | 118 | ||||||||||||||||||||||||
| (0.82 | ) | 17.62 | 11.90 | 184 | 1.64 | 3.26 | 1.40 | 92 | ||||||||||||||||||||||||
| — | 16.56 | 10.40 | 12 | 1.70 | (c) | 4.02 | (c) | 2.18 | (c) | 92 | ||||||||||||||||||||||
| $ | (2.04 | ) | $ | 16.71 | 0.31 | % | $ | 415 | 0.93 | %(c) | 7.84 | %(c) | 2.49 | %(c) | 56 | % | ||||||||||||||||
| (0.98 | ) | 18.72 | 10.87 | 220 | 0.93 | 2.70 | 2.23 | 118 | ||||||||||||||||||||||||
| (0.83 | ) | 17.88 | 12.74 | 57 | 0.90 | 2.84 | 2.61 | 92 | ||||||||||||||||||||||||
| — | 16.68 | 11.20 | 38 | 0.95 | (c) | 3.37 | (c) | 2.63 | (c) | 92 | ||||||||||||||||||||||
| $ | (2.00 | ) | $ | 16.91 | 0.42 | % | $ | 14 | 0.70 | %(c) | 7.04 | %(c) | 2.75 | %(c) | 56 | % | ||||||||||||||||
| (1.08 | ) | 18.86 | 11.14 | 14 | 0.69 | 2.29 | 2.45 | 118 | ||||||||||||||||||||||||
| (0.74 | ) | 18.06 | 13.03 | 13 | 0.70 | 2.38 | 2.78 | 92 | ||||||||||||||||||||||||
| — | 16.71 | 11.40 | 11 | 0.70 | (c) | 3.11 | (c) | 3.19 | (c) | 92 | ||||||||||||||||||||||
| $ | (2.02 | ) | $ | 16.90 | 0.50 | % | $ | 1,890 | 0.60 | %(c) | 3.96 | %(c) | 3.16 | %(c) | 56 | % | ||||||||||||||||
| (1.09 | ) | 18.85 | 11.19 | 16,069 | 0.60 | 2.21 | 2.59 | 118 | ||||||||||||||||||||||||
| (0.77 | ) | 18.06 | 13.09 | 14,156 | 0.60 | 2.32 | 2.92 | 92 | ||||||||||||||||||||||||
| — | 16.73 | 11.53 | 14,585 | 0.60 | (c) | 2.98 | (c) | 3.22 | (c) | 92 | ||||||||||||||||||||||
| (b) | Total return is calculated assuming a purchase of a share on the first day of the period and a sale of a share on the last day of each period reported. Dividends and distributions, if any, are assumed, for purposes of this calculation, to be reinvested. Total return does not reflect sales charges and includes the effect of fee waivers and reimbursements. Total return may reflect adjustments to conform to U.S. GAAP. Total return for a period of less than one year is not annualized. |
| (c) | Annualized. |
| (d) | Payments from Affiliates increased net asset value and total return by less than $0.01 and 0.01%, respectively. |
| (e) | Less than $(0.01) per share. |
| See accompanying Notes to Financial Statements | | May 31, 2015 | | Semiannual Report | 255 |
Table of Contents
Financial Highlights (cont’d)
For a Share Outstanding for the Period ended:
Net Asset | Net Investment Income (Loss) (a) | Net Realized and Change in Unrealized Gain | Total from Investment Operations | Dividends from Net Investment Income | ||||||||||||||||||
| AllianzGI Global Sustainability: | ||||||||||||||||||||||
| Class A | ||||||||||||||||||||||
12/9/2014* - 5/31/2015+ | $ | 15.00 | $ | 0.10 | $ | 0.48 | $ | 0.58 | $ | — | ||||||||||||
| Class P | ||||||||||||||||||||||
12/9/2014* - 5/31/2015+ | $ | 15.00 | $ | 0.11 | $ | 0.48 | $ | 0.59 | $ | — | ||||||||||||
| Institutional Class | ||||||||||||||||||||||
12/9/2014* - 5/31/2015+ | $ | 15.00 | $ | 0.12 | $ | 0.48 | $ | 0.60 | $ | — | ||||||||||||
| AllianzGI Global Water: | ||||||||||||||||||||||
| Class A | ||||||||||||||||||||||
5/31/2015+ | $ | 12.70 | $ | 0.06 | $ | 0.52 | $ | 0.58 | $ | (0.03 | ) | |||||||||||
11/30/2014 | 12.41 | 0.07 | 0.25 | 0.32 | (0.03 | ) | ||||||||||||||||
11/30/2013 | 10.26 | 0.07 | 2.20 | 2.27 | (0.12 | ) | ||||||||||||||||
11/30/2012 | 8.89 | 0.12 | 1.30 | 1.42 | (0.05 | ) | ||||||||||||||||
11/30/2011 | 8.75 | 0.06 | 0.08 | 0.14 | — | (d) | ||||||||||||||||
11/30/2010 | 7.99 | 0.03 | 0.74 | 0.77 | (0.01 | ) | ||||||||||||||||
| Class C | ||||||||||||||||||||||
5/31/2015+ | $ | 12.33 | $ | 0.01 | $ | 0.50 | $ | 0.51 | $ | — | (d) | |||||||||||
11/30/2014 | 12.11 | (0.03 | ) | 0.25 | 0.22 | — | (d) | |||||||||||||||
11/30/2013 | 10.02 | (0.02 | ) | 2.16 | 2.14 | (0.05 | ) | |||||||||||||||
11/30/2012 | 8.70 | 0.05 | 1.27 | 1.32 | — | (d) | ||||||||||||||||
11/30/2011 | 8.62 | (0.01 | ) | 0.09 | 0.08 | — | (d) | |||||||||||||||
11/30/2010 | 7.93 | (0.03 | ) | 0.72 | 0.69 | — | (d) | |||||||||||||||
| Class D | ||||||||||||||||||||||
5/31/2015+ | $ | 12.66 | $ | 0.07 | $ | 0.50 | $ | 0.57 | $ | (0.03 | ) | |||||||||||
11/30/2014 | 12.38 | 0.05 | 0.25 | 0.30 | (0.02 | ) | ||||||||||||||||
11/30/2013 | 10.25 | 0.07 | 2.19 | 2.26 | (0.13 | ) | ||||||||||||||||
11/30/2012 | 8.87 | 0.10 | 1.32 | 1.42 | (0.04 | ) | ||||||||||||||||
11/30/2011 | 8.73 | 0.04 | 0.10 | 0.14 | — | (d) | ||||||||||||||||
11/30/2010 | 7.98 | 0.03 | 0.73 | 0.76 | (0.01 | ) | ||||||||||||||||
| Class P | ||||||||||||||||||||||
5/31/2015+ | $ | 12.80 | $ | 0.08 | $ | 0.51 | $ | 0.59 | $ | (0.09 | ) | |||||||||||
11/30/2014 | 12.49 | 0.09 | 0.27 | 0.36 | (0.05 | ) | ||||||||||||||||
11/30/2013 | 10.30 | 0.09 | 2.21 | 2.30 | (0.11 | ) | ||||||||||||||||
11/30/2012 | 8.93 | 0.14 | 1.30 | 1.44 | (0.07 | ) | ||||||||||||||||
11/30/2011 | 8.77 | 0.07 | 0.09 | 0.16 | — | (d) | ||||||||||||||||
11/30/2010 | 7.99 | 0.05 | 0.74 | 0.79 | (0.01 | ) | ||||||||||||||||
| Institutional Class | ||||||||||||||||||||||
5/31/2015+ | $ | 12.61 | $ | 0.09 | $ | 0.50 | $ | 0.59 | $ | (0.07 | ) | |||||||||||
11/30/2014 | 12.37 | 0.11 | 0.24 | 0.35 | (0.11 | ) | ||||||||||||||||
11/30/2013 | 10.25 | 0.09 | 2.21 | 2.30 | (0.18 | ) | ||||||||||||||||
11/30/2012 | 8.88 | 0.12 | 1.32 | 1.44 | (0.07 | ) | ||||||||||||||||
11/30/2011 | 8.71 | 0.08 | 0.09 | 0.17 | — | (d) | ||||||||||||||||
11/30/2010 | 7.94 | 0.05 | 0.74 | 0.79 | (0.02 | ) | ||||||||||||||||
| + | Unaudited |
| * | Commencement of Operations. |
| (a) | Calculated on average shares outstanding during the period. |
| 256 | Semiannual Report | | May 31, 2015 | | See accompanying Notes to Financial Statements |
Table of Contents
| Net Asset Value, End of Period | Total Return (b) | Net Assets, End of Period (000s) | Ratio of Expenses to Average Net Assets with Fee Waiver/ Reimbursement | Ratio of Expenses to Average Net Assets without Fee Waiver/ Reimbursement | Ratio of Net Investment Income (Loss) to Average Net Assets | Portfolio Turnover Rate | ||||||||||||||||||||||
| $ | 15.58 | 3.87 | % | $ | 10 | 1.20 | %(c) | 8.50 | %(c) | 1.46 | %(c) | 24 | % | |||||||||||||||
| $ | 15.59 | 3.93 | % | $ | 11 | 1.05 | %(c) | 8.25 | %(c) | 1.61 | %(c) | 24 | % | |||||||||||||||
| $ | 15.60 | 4.00 | % | $ | 3,120 | 0.95 | %(c) | 8.25 | %(c) | 1.71 | %(c) | 24 | % | |||||||||||||||
| $ | 13.25 | 4.57 | % | $ | 140,175 | 1.43 | %(c) | 1.43 | %(c) | 0.98 | %(c) | 41 | % | |||||||||||||||
| 12.70 | 2.57 | 138,219 | 1.46 | 1.46 | 0.55 | 28 | ||||||||||||||||||||||
| 12.41 | 22.31 | 118,252 | 1.54 | 1.54 | 0.63 | 28 | ||||||||||||||||||||||
| 10.26 | 16.12 | 59,611 | 1.57 | 1.60 | 1.27 | 73 | ||||||||||||||||||||||
| 8.89 | 1.62 | 27,101 | 1.68 | 1.68 | 0.60 | 73 | ||||||||||||||||||||||
| 8.75 | 9.63 | 22,774 | 1.80 | 1.80 | 0.41 | 40 | ||||||||||||||||||||||
| $ | 12.84 | 4.14 | % | $ | 78,410 | 2.21 | %(c) | 2.21 | %(c) | 0.21 | %(c) | 41 | % | |||||||||||||||
| 12.33 | 1.82 | 77,082 | 2.23 | 2.23 | (0.26 | ) | 28 | |||||||||||||||||||||
| 12.11 | 21.41 | 51,767 | 2.33 | 2.33 | (0.18 | ) | 28 | |||||||||||||||||||||
| 10.02 | 15.17 | 25,870 | 2.33 | 2.41 | 0.48 | 73 | ||||||||||||||||||||||
| 8.70 | 0.93 | 20,842 | 2.44 | 2.44 | (0.15 | ) | 73 | |||||||||||||||||||||
| 8.62 | 8.70 | 22,225 | 2.56 | 2.60 | (0.37 | ) | 40 | |||||||||||||||||||||
| $ | 13.20 | 4.53 | % | $ | 29,082 | 1.48 | %(c) | 1.48 | %(c) | 1.04 | %(c) | 41 | % | |||||||||||||||
| 12.66 | 2.42 | 23,056 | 1.60 | 1.60 | 0.37 | 28 | ||||||||||||||||||||||
| 12.38 | 22.30 | 17,624 | 1.60 | 1.60 | 0.62 | 28 | ||||||||||||||||||||||
| 10.25 | 16.09 | 5,869 | 1.64 | 2.25 | 1.02 | 73 | ||||||||||||||||||||||
| 8.87 | 1.60 | 5,214 | 1.72 | 2.00 | 0.47 | 73 | ||||||||||||||||||||||
| 8.73 | 9.70 | 1,157 | 1.84 | 2.74 | 0.34 | 40 | ||||||||||||||||||||||
| $ | 13.30 | 4.66 | % | $ | 88,534 | 1.20 | %(c) | 1.20 | %(c) | 1.21 | %(c) | 41 | % | |||||||||||||||
| 12.80 | 2.87 | 84,835 | 1.21 | 1.21 | 0.67 | 28 | ||||||||||||||||||||||
| 12.49 | 22.58 | 42,448 | 1.34 | 1.34 | 0.81 | 28 | ||||||||||||||||||||||
| 10.30 | 16.22 | 16,820 | 1.41 | 1.47 | 1.49 | 73 | ||||||||||||||||||||||
| 8.93 | 1.85 | 16,118 | 1.49 | 1.52 | 0.79 | 73 | ||||||||||||||||||||||
| 8.77 | 9.95 | 10,432 | 1.56 | 1.64 | 0.62 | 40 | ||||||||||||||||||||||
| $ | 13.13 | 4.73 | % | $ | 30,721 | 1.13 | %(c) | 1.13 | %(c) | 1.39 | %(c) | 41 | % | |||||||||||||||
| 12.61 | 2.82 | 23,685 | 1.15 | 1.15 | 0.84 | 28 | ||||||||||||||||||||||
| 12.37 | 22.77 | 14,429 | 1.19 | 1.19 | 0.77 | 28 | ||||||||||||||||||||||
| 10.25 | 16.44 | 3,105 | 1.29 | 1.29 | 1.28 | 73 | ||||||||||||||||||||||
| 8.88 | 1.99 | 1,267 | 1.37 | 1.39 | 0.91 | 73 | ||||||||||||||||||||||
| 8.71 | 9.96 | 1,378 | 1.46 | 1.48 | 0.61 | 40 | ||||||||||||||||||||||
| (b) | Total return is calculated assuming a purchase of a share on the first day of the period and a sale of a share on the last day of each period reported. Dividends and distributions, if any, are assumed, for purposes of this calculation, to be reinvested. Total return does not reflect sales charges and includes the effect of fee waivers and reimbursements. Total return may reflect adjustments to conform to U.S. GAAP. Total return for a period of less than one year is not annualized. |
| (c) | Annualized. |
| (d) | Less than $(0.01) per share. |
| See accompanying Notes to Financial Statements | | May 31, 2015 | | Semiannual Report | 257 |
Table of Contents
Financial Highlights (cont’d)
For a Share Outstanding for the Period ended:
| Net Asset Value, Beginning of Period | Net Investment Income (a) | Net Realized and Change in Unrealized Gain (Loss) | Total from Investment Operations | Dividends from Net Investment Income | Distributions from Net Realized Capital Gains | |||||||||||||||||||
| AllianzGI High Yield Bond: | ||||||||||||||||||||||||
| Class A | ||||||||||||||||||||||||
5/31/2015+ | $ | 9.85 | $ | 0.29 | $ | (0.08 | ) | $ | 0.21 | $ | (0.30 | ) | $ | — | ||||||||||
11/30/2014 | 10.36 | 0.61 | (0.36 | ) | 0.25 | (0.67 | ) | (0.09 | ) | |||||||||||||||
11/30/2013 | 10.16 | 0.67 | 0.22 | 0.89 | (0.68 | ) | (0.01 | ) | ||||||||||||||||
11/30/2012 | 9.69 | 0.72 | 0.61 | 1.33 | (0.73 | ) | (0.13 | ) | ||||||||||||||||
11/30/2011 | 10.03 | 0.72 | (0.28 | ) | 0.44 | (0.78 | ) | — | ||||||||||||||||
4/12/2010* - 11/30/2010 | 9.65 | 0.49 | 0.19 | 0.68 | (0.30 | ) | — | |||||||||||||||||
| Class C | ||||||||||||||||||||||||
5/31/2015+ | $ | 9.83 | $ | 0.25 | $ | (0.06 | ) | $ | 0.19 | $ | (0.27 | ) | $ | — | ||||||||||
11/30/2014 | 10.35 | 0.54 | (0.37 | ) | 0.17 | (0.60 | ) | (0.09 | ) | |||||||||||||||
11/30/2013 | 10.15 | 0.59 | 0.22 | 0.81 | (0.60 | ) | (0.01 | ) | ||||||||||||||||
11/30/2012 | 9.68 | 0.64 | 0.62 | 1.26 | (0.66 | ) | (0.13 | ) | ||||||||||||||||
11/30/2011 | 10.02 | 0.65 | (0.29 | ) | 0.36 | (0.70 | ) | — | ||||||||||||||||
4/12/2010* - 11/30/2010 | 9.65 | 0.45 | 0.19 | 0.64 | (0.27 | ) | — | |||||||||||||||||
| Class D | ||||||||||||||||||||||||
5/31/2015+ | $ | 9.55 | $ | 0.28 | $ | (0.07 | ) | $ | 0.21 | $ | (0.30 | ) | $ | — | ||||||||||
11/30/2014 | 10.08 | 0.59 | (0.37 | ) | 0.22 | (0.66 | ) | (0.09 | ) | |||||||||||||||
11/30/2013 | 9.91 | 0.64 | 0.22 | 0.86 | (0.68 | ) | (0.01 | ) | ||||||||||||||||
11/30/2012 | 9.47 | 0.70 | 0.60 | 1.30 | (0.73 | ) | (0.13 | ) | ||||||||||||||||
11/30/2011 | 9.79 | 0.72 | (0.28 | ) | 0.44 | (0.76 | ) | — | ||||||||||||||||
4/12/2010* - 11/30/2010 | 9.65 | 0.48 | 0.18 | 0.66 | (0.52 | ) | — | |||||||||||||||||
| Class R | ||||||||||||||||||||||||
5/31/2015+ | $ | 9.53 | $ | 0.27 | $ | (0.08 | ) | $ | 0.19 | $ | (0.28 | ) | $ | — | ||||||||||
11/30/2014 | 10.05 | 0.54 | (0.34 | ) | 0.20 | (0.63 | ) | (0.09 | ) | |||||||||||||||
11/30/2013 | 9.88 | 0.63 | 0.21 | 0.84 | (0.66 | ) | (0.01 | ) | ||||||||||||||||
11/30/2012 | 9.45 | 0.67 | 0.60 | 1.27 | (0.71 | ) | (0.13 | ) | ||||||||||||||||
11/30/2011 | 9.80 | 0.68 | (0.28 | ) | 0.40 | (0.75 | ) | — | ||||||||||||||||
4/12/2010* - 11/30/2010 | 9.65 | 0.47 | 0.18 | 0.65 | (0.50 | ) | — | |||||||||||||||||
| Class P | ||||||||||||||||||||||||
5/31/2015+ | $ | 9.53 | $ | 0.29 | $ | (0.06 | ) | $ | 0.23 | $ | (0.32 | ) | $ | — | ||||||||||
11/30/2014 | 10.05 | 0.62 | (0.35 | ) | 0.27 | (0.70 | ) | (0.09 | ) | |||||||||||||||
11/30/2013 | 9.87 | 0.66 | 0.23 | 0.89 | (0.70 | ) | (0.01 | ) | ||||||||||||||||
11/30/2012 | 9.44 | 0.72 | 0.58 | 1.30 | (0.74 | ) | (0.13 | ) | ||||||||||||||||
11/30/2011 | 9.78 | 0.72 | (0.27 | ) | 0.45 | (0.79 | ) | — | ||||||||||||||||
4/12/2010* - 11/30/2010 | 9.65 | 0.50 | 0.17 | 0.67 | (0.54 | ) | — | |||||||||||||||||
| Institutional Class | ||||||||||||||||||||||||
5/31/2015+ | $ | 9.55 | $ | 0.30 | $ | (0.07 | ) | $ | 0.23 | $ | (0.32 | ) | $ | — | ||||||||||
11/30/2014 | 10.08 | 0.62 | (0.35 | ) | 0.27 | (0.71 | ) | (0.09 | ) | |||||||||||||||
11/30/2013 | 9.90 | 0.68 | 0.22 | 0.90 | (0.71 | ) | (0.01 | ) | ||||||||||||||||
11/30/2012 | 9.46 | 0.73 | 0.60 | 1.33 | (0.76 | ) | (0.13 | ) | ||||||||||||||||
11/30/2011 | 9.80 | 0.76 | (0.30 | ) | 0.46 | (0.80 | ) | — | ||||||||||||||||
11/30/2010 | 9.17 | 0.83 | 0.61 | 1.44 | (0.81 | ) | — | |||||||||||||||||
| Administrative Class | ||||||||||||||||||||||||
5/31/2015+ | $ | 9.51 | $ | 0.28 | $ | (0.06 | ) | $ | 0.22 | $ | (0.31 | ) | $ | — | ||||||||||
11/30/2014 | 10.04 | 0.59 | (0.36 | ) | 0.23 | (0.67 | ) | (0.09 | ) | |||||||||||||||
11/30/2013 | 9.87 | 0.65 | 0.22 | 0.87 | (0.69 | ) | (0.01 | ) | ||||||||||||||||
11/30/2012 | 9.43 | 0.70 | 0.61 | 1.31 | (0.74 | ) | (0.13 | ) | ||||||||||||||||
11/30/2011 | 9.78 | 0.72 | (0.30 | ) | 0.42 | (0.77 | ) | — | ||||||||||||||||
4/12/2010* - 11/30/2010 | 9.65 | 0.49 | 0.17 | 0.66 | (0.53 | ) | — | |||||||||||||||||
| + | Unaudited |
| * | Commencement of operations. |
| (a) | Calculated on average shares outstanding during the period. |
| 258 | Semiannual Report | | May 31, 2015 | | See accompanying Notes to Financial Statements |
Table of Contents
| Total Dividends and Distributions | Net Asset Value, End of Period | Total Return (b) | Net Assets, End of Period (000s) | Ratio of Expenses to Average Net Assets with Fee Waiver/ Reimbursement | Ratio of Expenses to Average Net Assets without Fee Waiver/ Reimbursement | Ratio of Net Investment Income to Average Net Assets | Portfolio Turnover Rate | |||||||||||||||||||||||||
| $ | (0.30 | ) | $ | 9.76 | 2.25 | % | $ | 38,827 | 0.91 | %(c) | 0.91 | %(c) | 5.98 | %(c) | 26 | % | ||||||||||||||||
| (0.76 | ) | 9.85 | (d) | 2.39 | (d) | 76,274 | 0.94 | 0.94 | 5.93 | 66 | ||||||||||||||||||||||
| (0.69 | ) | 10.36 | 8.98 | 73,920 | 0.91 | 0.91 | 6.49 | 67 | ||||||||||||||||||||||||
| (0.86 | ) | 10.16 | 14.34 | 109,668 | 0.89 | 0.90 | 7.21 | 86 | ||||||||||||||||||||||||
| (0.78 | ) | 9.69 | 4.29 | 61,339 | 1.05 | 1.05 | 7.19 | 168 | ||||||||||||||||||||||||
| (0.30 | ) | 10.03 | 7.07 | 1,296 | 1.11 | (c) | 1.47 | (c) | 7.70 | (c) | 144 | |||||||||||||||||||||
| $ | (0.27 | ) | $ | 9.75 | 1.99 | % | $ | 20,420 | 1.64 | %(c) | 1.64 | %(c) | 5.27 | %(c) | 26 | % | ||||||||||||||||
| (0.69 | ) | 9.83 | (d) | 1.57 | (d) | 23,249 | 1.68 | 1.68 | 5.23 | 66 | ||||||||||||||||||||||
| (0.61 | ) | 10.35 | 8.14 | 27,525 | 1.70 | 1.70 | 5.68 | 67 | ||||||||||||||||||||||||
| (0.79 | ) | 10.15 | 13.54 | 30,692 | 1.68 | 1.68 | 6.43 | 86 | ||||||||||||||||||||||||
| (0.70 | ) | 9.68 | 3.53 | 12,443 | 1.82 | 1.87 | 6.56 | 168 | ||||||||||||||||||||||||
| (0.27 | ) | 10.02 | 6.73 | 311 | 1.87 | (c) | 2.21 | (c) | 7.12 | (c) | 144 | |||||||||||||||||||||
| $ | (0.30 | ) | $ | 9.46 | 2.31 | % | $ | 38,326 | 1.00 | %(c) | 1.00 | %(c) | 5.91 | %(c) | 26 | % | ||||||||||||||||
| (0.75 | ) | 9.55 | (d) | 2.17 | (d) | 36,987 | 1.01 | 1.01 | 5.90 | 66 | ||||||||||||||||||||||
| (0.69 | ) | 10.08 | 8.92 | 108,011 | 1.00 | 1.02 | 6.40 | 67 | ||||||||||||||||||||||||
| (0.86 | ) | 9.91 | 14.33 | 43,921 | 0.96 | 1.07 | 7.14 | 86 | ||||||||||||||||||||||||
| (0.76 | ) | 9.47 | 4.42 | 20,378 | 1.07 | 1.12 | 7.36 | 168 | ||||||||||||||||||||||||
| (0.52 | ) | 9.79 | 7.09 | 169 | 1.11 | (c) | 1.47 | (c) | 7.84 | (c) | 144 | |||||||||||||||||||||
| $ | (0.28 | ) | $ | 9.44 | 2.09 | % | $ | 1,018 | 1.18 | %(c) | 1.18 | %(c) | 5.73 | %(c) | 26 | % | ||||||||||||||||
| (0.72 | ) | 9.53 | (d) | 1.91 | (d) | 2,823 | 1.43 | 1.45 | 5.48 | 66 | ||||||||||||||||||||||
| (0.67 | ) | 10.05 | 8.72 | 2,851 | 1.15 | 1.32 | 6.24 | 67 | ||||||||||||||||||||||||
| (0.84 | ) | 9.88 | 14.05 | 2,111 | 1.15 | 1.25 | 6.95 | 86 | ||||||||||||||||||||||||
| (0.75 | ) | 9.45 | 4.02 | 342 | 1.33 | 1.37 | 7.23 | 168 | ||||||||||||||||||||||||
| (0.50 | ) | 9.80 | 6.97 | 11 | 1.36 | (c) | 1.63 | (c) | 7.74 | (c) | 144 | |||||||||||||||||||||
| $ | (0.32 | ) | $ | 9.44 | 2.46 | % | $ | 79,037 | 0.69 | %(c) | 0.69 | %(c) | 6.24 | %(c) | 26 | % | ||||||||||||||||
| (0.79 | ) | 9.53 | (d) | 2.63 | (d) | 47,385 | 0.71 | 0.71 | 6.21 | 66 | ||||||||||||||||||||||
| (0.71 | ) | 10.05 | 9.27 | 77,649 | 0.74 | 0.74 | 6.64 | 67 | ||||||||||||||||||||||||
| (0.87 | ) | 9.87 | 14.48 | 19,497 | 0.74 | 0.79 | 7.39 | 86 | ||||||||||||||||||||||||
| (0.79 | ) | 9.44 | 4.57 | 11,096 | 0.88 | 0.88 | 7.49 | 168 | ||||||||||||||||||||||||
| (0.54 | ) | 9.78 | 7.22 | 11 | 0.97 | (c) | 1.14 | (c) | 8.13 | (c) | 144 | |||||||||||||||||||||
| $ | (0.32 | ) | $ | 9.46 | 2.49 | % | $ | 187,304 | 0.60 | %(c) | 0.60 | %(c) | 6.32 | %(c) | 26 | % | ||||||||||||||||
| (0.80 | ) | 9.55 | (d) | 2.59 | (d) | 163,567 | 0.64 | 0.64 | 6.27 | 66 | ||||||||||||||||||||||
| (0.72 | ) | 10.08 | 9.35 | 139,306 | 0.62 | 0.62 | 6.76 | 67 | ||||||||||||||||||||||||
| (0.89 | ) | 9.90 | 14.68 | 121,362 | 0.63 | 0.63 | 7.47 | 86 | ||||||||||||||||||||||||
| (0.80 | ) | 9.46 | 4.66 | 70,174 | 0.61 | 0.77 | 7.65 | 168 | ||||||||||||||||||||||||
| (0.81 | ) | 9.80 | 16.23 | 93,782 | 0.63 | 0.93 | 8.65 | 144 | ||||||||||||||||||||||||
| $ | (0.31 | ) | $ | 9.42 | 2.37 | % | $ | 36,751 | 0.89 | %(c) | 0.89 | %(c) | 6.03 | %(c) | 26 | % | ||||||||||||||||
| (0.76 | ) | 9.51 | (d) | 2.27 | (d) | 34,714 | 0.97 | 0.97 | 5.93 | 66 | ||||||||||||||||||||||
| (0.70 | ) | 10.04 | 9.02 | 32,789 | 0.90 | 0.91 | 6.49 | 67 | ||||||||||||||||||||||||
| (0.87 | ) | 9.87 | 14.54 | 27,274 | 0.90 | 1.14 | 8.92 | 86 | ||||||||||||||||||||||||
| (0.77 | ) | 9.43 | 4.27 | 11 | 1.03 | 1.03 | 7.25 | 168 | ||||||||||||||||||||||||
| (0.53 | ) | 9.78 | 7.12 | 11 | 1.12 | (c) | 1.28 | (c) | 7.98 | (c) | 144 | |||||||||||||||||||||
| (b) | Total return is calculated assuming a purchase of a share on the first day of the period and a sale of a share on the last day of each period reported. Dividends and distributions, if any, are assumed, for purposes of this calculation, to be reinvested. Total return does not reflect sales charges and includes the effect of fee waivers and reimbursements. Total return may reflect adjustments to conform to U.S. GAAP. Total return for a period of less than one year is not annualized. |
| (c) | Annualized. |
| (d) | Payments from Affiliates increased net asset value and total return by less than $0.01 and 0.01%, respectively. |
| See accompanying Notes to Financial Statements | | May 31, 2015 | | Semiannual Report | 259 |
Table of Contents
Financial Highlights (cont’d)
For a Share Outstanding for the Period ended:
Net Asset | Net Investment Income (a) | Net Realized and Change in Unrealized Gain | Total from Investment Operations | |||||||||||||
| AllianzGI International Growth: | ||||||||||||||||
| Class A | ||||||||||||||||
2/2/2015* - 5/31/2015+ | $ | 15.00 | $ | 0.10 | $ | 0.86 | $ | 0.96 | ||||||||
| Institutional Class | ||||||||||||||||
2/2/2015* - 5/31/2015+ | $ | 15.00 | $ | 0.11 | $ | 0.86 | $ | 0.97 | ||||||||
| + | Unaudited |
| * | Commencement of operations. |
| (a) | Calculated on average shares outstanding during the period. |
| (b) | Total return is calculated assuming a purchase of a share on the first day of the period and a sale of a share on the last day of each period reported. Dividends and distributions, if any, are assumed, for purposes of this calculation, to be reinvested. Total return does not reflect sales charges and includes the effect of fee waivers and reimbursements. Total return may reflect adjustments to conform to U.S. GAAP. Total return for a period of less than one year is not annualized. |
| (c) | Annualized. |
| (d) | Less than 1%. |
| 260 | Semiannual Report | | May 31, 2015 | | See accompanying Notes to Financial Statements |
Table of Contents
| Net Asset Value, End of Period | Total Return (b) | Net Assets, End of Period (000s) | Ratio of Expenses to Average Net Assets with Fee Waiver/ Reimbursement | Ratio of Expenses to Average Net Assets without Fee Waiver/ Reimbursement | Ratio of Net Investment Income to Average Net Assets | Portfolio Turnover Rate | ||||||||||||||||||||||
| $ | 15.96 | 6.40 | % | $ | 12 | 1.20 | %(c) | 7.99 | %(c) | 1.95 | %(c) | — | %(d) | |||||||||||||||
| $ | 15.97 | 6.47 | % | $ | 3,193 | 0.95 | %(c) | 7.80 | %(c) | 2.16 | %(c) | — | %(d) | |||||||||||||||
| See accompanying Notes to Financial Statements | | May 31, 2015 | | Semiannual Report | 261 |
Table of Contents
Financial Highlights (cont’d)
For a Share Outstanding for the Period ended:
| Net Asset Value, Beginning of Period | Net Investment Income (Loss) (a) | Net Realized and Change in Unrealized Gain (Loss) | Total from Investment Operations | Dividends from Net Investment Income | Distributions from Net Realized Capital Gains | |||||||||||||||||||
| AllianzGI International Small-Cap: | ||||||||||||||||||||||||
| Class A | ||||||||||||||||||||||||
5/31/2015+ | $ | 35.77 | $ | 0.13 | $ | 4.79 | $ | 4.92 | $ | (0.08 | ) | $ | (3.60 | ) | ||||||||||
11/30/2014 | 42.30 | 0.09 | (2.41 | ) | (2.32 | ) | (0.64 | ) | (3.57 | ) | ||||||||||||||
11/30/2013 | 31.89 | 0.09 | 10.32 | 10.41 | — | (d) | — | |||||||||||||||||
11/30/2012 | 28.31 | 0.16 | 4.06 | 4.22 | (0.64 | ) | — | |||||||||||||||||
11/30/2011 | 31.36 | 0.12 | (2.56 | ) | (2.44 | ) | (0.61 | ) | — | |||||||||||||||
4/12/2010* - 11/30/2010 | 28.30 | (0.01 | ) | 3.07 | 3.06 | — | — | |||||||||||||||||
| Class C | ||||||||||||||||||||||||
5/31/2015+ | $ | 35.33 | $ | 0.02 | $ | 4.71 | $ | 4.73 | $ | — | $ | (3.60 | ) | |||||||||||
11/30/2014 | 41.78 | (0.18 | ) | (2.39 | ) | (2.57 | ) | (0.31 | ) | (3.57 | ) | |||||||||||||
11/30/2013 | 31.75 | (0.17 | ) | 10.22 | 10.05 | (0.02 | ) | — | ||||||||||||||||
11/30/2012 | 28.01 | (0.07 | ) | 4.04 | 3.97 | (0.23 | ) | — | ||||||||||||||||
11/30/2011 | 31.22 | 0.06 | (2.72 | ) | (2.66 | ) | (0.55 | ) | — | |||||||||||||||
4/12/2010* - 11/30/2010 | 28.30 | (0.24 | ) | 3.16 | 2.92 | — | — | |||||||||||||||||
| Class D | ||||||||||||||||||||||||
5/31/2015+ | $ | 36.15 | $ | 0.18 | $ | 4.81 | $ | 4.99 | $ | (0.06 | ) | $ | (3.60 | ) | ||||||||||
11/30/2014 | 43.24 | 0.16 | (2.52 | ) | (2.36 | ) | (1.16 | ) | (3.57 | ) | ||||||||||||||
11/30/2013 | 32.60 | 0.05 | 10.59 | 10.64 | — | (d) | — | |||||||||||||||||
11/30/2012 | 28.33 | 0.24 | 4.03 | 4.27 | — | (d) | — | |||||||||||||||||
11/30/2011 | 31.37 | 0.07 | (2.53 | ) | (2.46 | ) | (0.58 | ) | — | |||||||||||||||
4/12/2010* - 11/30/2010 | 28.30 | 0.04 | 3.03 | 3.07 | — | — | ||||||||||||||||||
| Class R | ||||||||||||||||||||||||
5/31/2015+ | $ | 35.30 | $ | 0.06 | $ | 4.76 | $ | 4.82 | $ | (0.04 | ) | $ | (3.60 | ) | ||||||||||
11/30/2014 | 42.23 | 0.07 | (2.47 | ) | (2.40 | ) | (0.96 | ) | (3.57 | ) | ||||||||||||||
11/30/2013 | 32.25 | 0.02 | 10.32 | 10.34 | (0.36 | ) | — | |||||||||||||||||
11/30/2012 | 28.27 | 0.08 | 4.10 | 4.18 | (0.20 | ) | — | |||||||||||||||||
11/30/2011 | 31.32 | 0.16 | (2.70 | ) | (2.54 | ) | (0.51 | ) | — | |||||||||||||||
4/12/2010* - 11/30/2010 | 28.30 | 0.05 | 2.97 | 3.02 | — | — | ||||||||||||||||||
| Class P | ||||||||||||||||||||||||
5/31/2015+ | $ | 35.65 | $ | 0.13 | $ | 4.81 | $ | 4.94 | $ | (0.07 | ) | $ | (3.60 | ) | ||||||||||
11/30/2014 | 41.97 | 0.16 | (2.41 | ) | (2.25 | ) | (0.50 | ) | (3.57 | ) | ||||||||||||||
11/30/2013 | 31.92 | 0.16 | 10.24 | 10.40 | (0.35 | ) | — | |||||||||||||||||
11/30/2012 | 27.86 | 0.20 | 4.05 | 4.25 | (0.19 | ) | — | |||||||||||||||||
11/30/2011 | 30.35 | 0.30 | (2.67 | ) | (2.37 | ) | (0.12 | ) | — | |||||||||||||||
11/30/2010 | 25.86 | 0.20 | 4.45 | 4.65 | (0.16 | ) | — | |||||||||||||||||
| Institutional Class | ||||||||||||||||||||||||
5/31/2015+ | $ | 36.68 | $ | 0.14 | $ | 4.97 | $ | 5.11 | $ | (0.06 | ) | $ | (3.60 | ) | ||||||||||
11/30/2014 | 42.94 | 0.21 | (2.49 | ) | (2.28 | ) | (0.41 | ) | (3.57 | ) | ||||||||||||||
11/30/2013 | 32.60 | 0.17 | 10.48 | 10.65 | (0.31 | ) | — | |||||||||||||||||
11/30/2012 | 28.58 | 0.24 | 4.15 | 4.39 | (0.37 | ) | — | |||||||||||||||||
11/30/2011 | 31.45 | 0.37 | (2.74 | ) | (2.37 | ) | (0.50 | ) | — | |||||||||||||||
11/30/2010 | 26.91 | 0.24 | 4.94 | 5.18 | (0.64 | ) | — | |||||||||||||||||
| + | Unaudited |
| * | Commencement of operations. |
| (a) | Calculated on average shares outstanding during the period. |
| 262 | Semiannual Report | | May 31, 2015 | | See accompanying Notes to Financial Statements |
Table of Contents
| Total Dividends and Distributions | Net Asset Value, End of Period | Total Return (b) | Net Assets, End of Period (000s) | Ratio of Expenses to Average Net Assets with Fee Waiver/ Reimbursement | Ratio of Expenses to Average Net Assets without Fee Waiver/ Reimbursement | Ratio of Net Investment Income (Loss) to Average Net Assets | Portfolio Turnover Rate | |||||||||||||||||||||||||
| $ | (3.68 | ) | $ | 37.01 | 15.41 | % | $ | 10,241 | 1.45 | %(c) | 1.63 | %(c) | 0.77 | %(c) | 25 | % | ||||||||||||||||
| (4.21 | ) | 35.77 | (5.84 | ) | 5,290 | 1.45 | 1.76 | 0.23 | 77 | |||||||||||||||||||||||
| — | (d) | 42.30 | 32.64 | 4,569 | 1.45 | 1.83 | 0.23 | 92 | ||||||||||||||||||||||||
| (0.64 | ) | 31.89 | 15.13 | 2,773 | 1.50 | 1.76 | 0.53 | 117 | ||||||||||||||||||||||||
| (0.61 | ) | 28.31 | (8.03 | ) | 4,103 | 1.60 | 1.83 | 0.40 | 66 | |||||||||||||||||||||||
| — | 31.36 | 10.81 | 97 | 1.66 | (c) | 1.70 | (c) | (0.07 | )(c) | 57 | ||||||||||||||||||||||
| $ | (3.60 | ) | $ | 36.46 | 14.98 | % | $ | 2,123 | 2.19 | %(c) | 2.38 | %(c) | 0.09 | %(c) | 25 | % | ||||||||||||||||
| (3.88 | ) | 35.33 | (6.52 | ) | 1,135 | 2.19 | 2.45 | (0.47 | ) | 77 | ||||||||||||||||||||||
| (0.02 | ) | 41.78 | 31.67 | 702 | 2.20 | 2.43 | (0.46 | ) | 92 | |||||||||||||||||||||||
| (0.23 | ) | 31.75 | 14.26 | 531 | 2.26 | 2.37 | (0.24 | ) | 117 | |||||||||||||||||||||||
| (0.55 | ) | 28.01 | (8.75 | ) | 455 | 2.34 | 2.86 | 0.19 | 66 | |||||||||||||||||||||||
| — | 31.22 | 10.32 | 176 | 2.44 | (c) | 2.48 | (c) | (1.23 | )(c) | 57 | ||||||||||||||||||||||
| $ | (3.66 | ) | $ | 37.48 | 15.43 | % | $ | 3,828 | 1.45 | %(c) | 1.61 | %(c) | 1.05 | %(c) | 25 | % | ||||||||||||||||
| (4.73 | ) | 36.15 | (5.83 | ) | 1,453 | 1.45 | 1.71 | 0.41 | 77 | |||||||||||||||||||||||
| — | (d) | 43.24 | 32.65 | 339 | 1.45 | 1.73 | 0.13 | 92 | ||||||||||||||||||||||||
| — | (d) | 32.60 | 15.07 | 112 | 1.56 | 5.66 | 0.77 | 117 | ||||||||||||||||||||||||
| (0.58 | ) | 28.33 | (8.08 | ) | 1,440 | 1.61 | 2.83 | 0.22 | 66 | |||||||||||||||||||||||
| — | 31.37 | 10.85 | 38 | 1.66 | (c) | 1.83 | (c) | 0.22 | (c) | 57 | ||||||||||||||||||||||
| $ | (3.64 | ) | $ | 36.48 | 15.28 | % | $ | 107 | 1.70 | %(c) | 1.96 | %(c) | 0.37 | %(c) | 25 | % | ||||||||||||||||
| (4.53 | ) | 35.30 | (6.06 | ) | 73 | 1.70 | 2.10 | 0.19 | 77 | |||||||||||||||||||||||
| (0.36 | ) | 42.23 | 32.29 | 27 | 1.70 | 1.96 | 0.05 | 92 | ||||||||||||||||||||||||
| (0.20 | ) | 32.25 | 14.86 | 12 | 1.74 | 1.90 | 0.26 | 117 | ||||||||||||||||||||||||
| (0.51 | ) | 28.27 | (8.32 | ) | 10 | 1.82 | 1.84 | 0.51 | 66 | |||||||||||||||||||||||
| — | 31.32 | 10.67 | 11 | 1.91 | (c) | 2.35 | (c) | 0.27 | (c) | 57 | ||||||||||||||||||||||
| $ | (3.67 | ) | $ | 36.92 | 15.52 | % | $ | 41,478 | 1.28 | %(c) | 1.36 | %(c) | 0.78 | %(c) | 25 | % | ||||||||||||||||
| (4.07 | ) | 35.65 | (5.68 | ) | 27,882 | 1.29 | 1.54 | 0.41 | 77 | |||||||||||||||||||||||
| (0.35 | ) | 41.97 | 32.86 | 33,574 | 1.30 | 1.52 | 0.45 | 92 | ||||||||||||||||||||||||
| (0.19 | ) | 31.92 | 15.32 | 28,996 | 1.31 | 1.52 | 0.68 | 117 | ||||||||||||||||||||||||
| (0.12 | ) | 27.86 | (7.86 | ) | 34,772 | 1.32 | 1.47 | 0.95 | 66 | |||||||||||||||||||||||
| (0.16 | ) | 30.35 | 18.12 | 46,636 | 1.37 | 1.77 | 0.74 | 57 | ||||||||||||||||||||||||
| $ | (3.66 | ) | $ | 38.13 | 15.56 | % | $ | 63,203 | 1.21 | %(c) | 1.38 | %(c) | 0.77 | %(c) | 25 | % | ||||||||||||||||
| (3.98 | ) | 36.68 | (5.61 | ) | 55,743 | 1.21 | 1.46 | 0.53 | 77 | |||||||||||||||||||||||
| (0.31 | ) | 42.94 | 32.96 | 71,875 | 1.21 | 1.44 | 0.46 | 92 | ||||||||||||||||||||||||
| (0.37 | ) | 32.60 | 15.50 | 88,301 | 1.20 | 1.38 | 0.80 | 117 | ||||||||||||||||||||||||
| (0.50 | ) | 28.58 | (7.74 | ) | 84,026 | 1.20 | 1.34 | 1.14 | 66 | |||||||||||||||||||||||
| (0.64 | ) | 31.45 | 18.22 | 89,186 | 1.23 | 1.70 | 0.86 | 57 | ||||||||||||||||||||||||
| (b) | Total return is calculated assuming a purchase of a share on the first day of the period and a sale of a share on the last day of each period reported. Dividends and distributions, if any, are assumed, for purposes of this calculation, to be reinvested. Total return does not reflect sales charges and includes the effect of fee waivers and reimbursements. Total return may reflect adjustments to conform to U.S. GAAP. Total return for a period of less than one year is not annualized. |
| (c) | Annualized. |
| (d) | Less than $(0.01) per share. |
| See accompanying Notes to Financial Statements | | May 31, 2015 | | Semiannual Report | 263 |
Table of Contents
Financial Highlights (cont’d)
For a Share Outstanding for the Period ended:
Net Asset | Net Investment Income (Loss) (a) | Net Realized and Change in Unrealized Gain (Loss) | Total from Investment Operations | Dividends from Net Investment Income | Distributions from Net Realized Capital Gains | |||||||||||||||||||
| AllianzGI Micro Cap: | ||||||||||||||||||||||||
| Class A | ||||||||||||||||||||||||
5/31/2015+ | $ | 14.88 | $ | (0.10 | ) | $ | 1.70 | $ | 1.60 | $ | — | $ | (1.26 | ) | ||||||||||
11/30/2014 | 16.06 | (0.21 | ) | — | (d) | (0.21 | ) | — | (0.97 | ) | ||||||||||||||
11/30/2013 | 11.62 | (0.20 | ) | 5.57 | 5.37 | — | (0.93 | ) | ||||||||||||||||
12/19/2011* - 11/30/2012 | 9.84 | (0.07 | ) | 1.85 | 1.78 | — | — | |||||||||||||||||
| Class P | ||||||||||||||||||||||||
5/31/2015+ | $ | 14.92 | $ | (0.09 | ) | $ | 1.70 | $ | 1.61 | $ | — | $ | (1.26 | ) | ||||||||||
11/30/2014 | 16.08 | (0.19 | ) | — | (d) | (0.19 | ) | — | (0.97 | ) | ||||||||||||||
11/30/2013 | 11.61 | (0.17 | ) | 5.57 | 5.40 | — | (0.93 | ) | ||||||||||||||||
11/30/2012 | 12.20 | (0.10 | ) | 1.47 | 1.37 | — | (1.96 | ) | ||||||||||||||||
12/27/2010* - 11/30/2011 | 14.20 | (0.15 | ) | (1.64 | ) | (1.79 | ) | — | (0.21 | ) | ||||||||||||||
| Institutional Class | ||||||||||||||||||||||||
5/31/2015+ | $ | 14.99 | $ | (0.10 | ) | $ | 1.71 | $ | 1.61 | $ | — | $ | (1.26 | ) | ||||||||||
11/30/2014 | 16.15 | (0.19 | ) | — | (d) | (0.19 | ) | — | (0.97 | ) | ||||||||||||||
11/30/2013 | 11.65 | (0.15 | ) | 5.58 | 5.43 | — | (0.93 | ) | ||||||||||||||||
11/30/2012 | 12.22 | (0.10 | ) | 1.49 | 1.39 | — | (1.96 | ) | ||||||||||||||||
11/30/2011 | 13.80 | (0.17 | ) | (0.16 | ) | (0.33 | ) | — | (1.25 | ) | ||||||||||||||
11/30/2010 | 10.44 | (0.15 | ) | 3.51 | 3.36 | — | — | |||||||||||||||||
| AllianzGI Multi-Asset Real Return: | ||||||||||||||||||||||||
| Class A | ||||||||||||||||||||||||
5/31/2015+ | $ | 14.91 | $ | 0.02 | $ | (0.32 | ) | $ | (0.30 | ) | $ | (0.18 | ) | $ | — | |||||||||
11/30/2014 | 15.34 | 0.14 | (0.26 | ) | (0.12 | ) | (0.23 | ) | (0.08 | ) | ||||||||||||||
12/17/2012* - 11/30/2013 | 15.00 | 0.12 | 0.22 | 0.34 | — | — | ||||||||||||||||||
| Class C | ||||||||||||||||||||||||
5/31/2015+ | $ | 14.74 | $ | (0.04 | ) | $ | (0.32 | ) | $ | (0.36 | ) | $ | (0.08 | ) | $ | — | ||||||||
11/30/2014 | 15.24 | 0.03 | (0.25 | ) | (0.22 | ) | (0.20 | ) | (0.08 | ) | ||||||||||||||
12/17/2012* - 11/30/2013 | 15.00 | (0.03 | ) | 0.27 | 0.24 | — | — | |||||||||||||||||
| Class D | ||||||||||||||||||||||||
5/31/2015+ | $ | 14.94 | $ | 0.02 | $ | (0.32 | ) | $ | (0.30 | ) | $ | (0.14 | ) | $ | — | |||||||||
11/30/2014 | 15.34 | 0.14 | (0.25 | ) | (0.11 | ) | (0.21 | ) | (0.08 | ) | ||||||||||||||
12/17/2012* - 11/30/2013 | 15.00 | 0.14 | 0.20 | 0.34 | — | — | ||||||||||||||||||
| Class P | ||||||||||||||||||||||||
5/31/2015+ | $ | 14.96 | $ | 0.03 | $ | (0.32 | ) | $ | (0.29 | ) | $ | (0.17 | ) | $ | — | |||||||||
11/30/2014 | 15.36 | 0.18 | (0.27 | ) | (0.09 | ) | (0.23 | ) | (0.08 | ) | ||||||||||||||
12/17/2012* - 11/30/2013 | 15.00 | 0.16 | 0.20 | 0.36 | — | — | ||||||||||||||||||
| Institutional Class | ||||||||||||||||||||||||
5/31/2015+ | $ | 14.97 | $ | 0.03 | $ | (0.32 | ) | $ | (0.29 | ) | $ | (0.19 | ) | $ | — | |||||||||
11/30/2014 | 15.37 | 0.19 | (0.26 | ) | (0.07 | ) | (0.25 | ) | (0.08 | ) | ||||||||||||||
12/17/2012* - 11/30/2013 | 15.00 | 0.18 | 0.19 | 0.37 | — | — | ||||||||||||||||||
| + | Unaudited |
| * | Commencement of operations. |
| (a) | Calculated on average shares outstanding during the period. |
| 264 | Semiannual Report | | May 31, 2015 | | See accompanying Notes to Financial Statements |
Table of Contents
| Total Dividends and Distributions | Net Asset Value, End of Period | Total Return (b) | Net Assets, End of Period (000s) | Ratio of Expenses to Average Net Assets with Fee Waiver/ Reimbursement | Ratio of Expenses to Average Net Assets without Fee Waiver/ Reimbursement | Ratio of Net Investment Income (Loss) to Average Net Assets | Portfolio Turnover Rate | |||||||||||||||||||||||||
| $ | (1.26 | ) | $ | 15.22 | 11.81 | % | $ | 6,916 | 1.62 | %(c) | 2.02 | %(c) | (1.39 | )%(c) | 30 | % | ||||||||||||||||
| (0.97 | ) | 14.88 | (1.11 | ) | 4,684 | 1.66 | 2.10 | (1.40 | ) | 48 | ||||||||||||||||||||||
| (0.93 | ) | 16.06 | 50.11 | 1,065 | 1.80 | 2.07 | (1.45 | ) | 63 | |||||||||||||||||||||||
| — | 11.62 | 18.09 | 135 | 1.82 | (c) | 2.18 | (c) | (0.62 | )(c) | 62 | ||||||||||||||||||||||
| $ | (1.26 | ) | $ | 15.27 | 11.85 | % | $ | 1,784 | 1.49 | %(c) | 1.79 | %(c) | (1.25 | )%(c) | 30 | % | ||||||||||||||||
| (0.97 | ) | 14.92 | (0.98 | ) | 1,550 | 1.52 | 1.81 | (1.21 | ) | 48 | ||||||||||||||||||||||
| (0.93 | ) | 16.08 | 50.42 | 2,192 | 1.63 | 1.90 | (1.25 | ) | 63 | |||||||||||||||||||||||
| (1.96 | ) | 11.61 | 13.90 | 332 | 1.65 | 1.99 | (0.85 | ) | 62 | |||||||||||||||||||||||
| (0.21 | ) | 12.20 | (12.43 | ) | 426 | 1.65 | (c) | 1.85 | (c) | (1.35 | )(c) | 74 | ||||||||||||||||||||
| $ | (1.26 | ) | $ | 15.34 | 11.79 | % | $ | 34,396 | 1.54 | %(c) | 1.80 | %(c) | (1.31 | )%(c) | 30 | % | ||||||||||||||||
| (0.97 | ) | 14.99 | (0.97 | ) | 33,513 | 1.54 | 1.80 | (1.25 | ) | 48 | ||||||||||||||||||||||
| (0.93 | ) | 16.15 | 50.51 | 41,713 | 1.54 | 2.01 | (1.10 | ) | 63 | |||||||||||||||||||||||
| (1.96 | ) | 11.65 | 14.09 | 27,343 | 1.54 | 1.84 | (0.90 | ) | 62 | |||||||||||||||||||||||
| (1.25 | ) | 12.22 | (2.88 | ) | 46,514 | 1.54 | 1.65 | (1.24 | ) | 74 | ||||||||||||||||||||||
| — | 13.80 | 32.18 | 57,591 | 1.57 | 1.64 | (1.25 | ) | 112 | ||||||||||||||||||||||||
| $ | (0.18 | ) | $ | 14.43 | (2.00 | )% | $ | 145 | 0.85 | %(c)(e) | 4.66 | %(c)(e) | 0.24 | %(c)(e) | 23 | % | ||||||||||||||||
| (0.31 | ) | 14.91 | (0.81 | ) | 143 | 0.85 | (e) | 4.61 | (e) | 0.90 | (e) | 41 | ||||||||||||||||||||
| — | 15.34 | 2.27 | 45 | 0.86 | (c)(e) | 8.42 | (c)(e) | 0.83 | (c)(e) | 46 | ||||||||||||||||||||||
| $ | (0.08 | ) | $ | 14.30 | (2.43 | )% | $ | 109 | 1.60 | %(c)(e) | 5.36 | %(c)(e) | (0.54 | )%(c)(e) | 23 | % | ||||||||||||||||
| (0.28 | ) | 14.74 | (1.50 | ) | 114 | 1.60 | (e) | 5.46 | (e) | 0.21 | (e) | 41 | ||||||||||||||||||||
| — | 15.24 | 1.60 | 81 | 1.60 | (c)(e) | 9.55 | (c)(e) | (0.17 | )(c)(e) | 46 | ||||||||||||||||||||||
| $ | (0.14 | ) | $ | 14.50 | (2.01 | )% | $ | 24 | 0.85 | %(c)(e) | 50.28 | %(c)(e) | 0.23 | %(c)(e) | 23 | % | ||||||||||||||||
| (0.29 | ) | 14.94 | (0.79 | ) | 23 | 0.85 | (e) | 60.76 | (e) | 0.88 | (e) | 41 | ||||||||||||||||||||
| — | 15.34 | 2.27 | 10 | 0.86 | (c)(e) | 19.52 | (c)(e) | 0.96 | (c)(e) | 46 | ||||||||||||||||||||||
| $ | (0.17 | ) | $ | 14.50 | (1.96 | )% | $ | 10 | 0.70 | %(c)(e) | 4.34 | %(c)(e) | 0.38 | %(c)(e) | 23 | % | ||||||||||||||||
| (0.31 | ) | 14.96 | (0.64 | ) | 10 | 0.70 | (e) | 4.50 | (e) | 1.14 | (e) | 41 | ||||||||||||||||||||
| — | 15.36 | 2.40 | 10 | 0.71 | (c)(e) | 7.75 | (c)(e) | 1.11 | (c)(e) | 46 | ||||||||||||||||||||||
| $ | (0.19 | ) | $ | 14.49 | (1.96 | )% | $ | 5,014 | 0.60 | %(c)(e) | 4.31 | %(c)(e) | 0.46 | %(c)(e) | 23 | % | ||||||||||||||||
| (0.33 | ) | 14.97 | (0.50 | ) | 6,034 | 0.60 | (e) | 4.48 | (e) | 1.22 | (e) | 41 | ||||||||||||||||||||
| — | 15.37 | 2.47 | 5,155 | 0.61 | (c)(e) | 7.74 | (c)(e) | 1.21 | (c)(e) | 46 | ||||||||||||||||||||||
| (b) | Total return is calculated assuming a purchase of a share on the first day of the period and a sale of a share on the last day of each period reported. Dividends and distributions, if any, are assumed, for purposes of this calculation, to be reinvested. Total return does not reflect sales charges and includes the effect of fee waivers and reimbursements. Total return may reflect adjustments to conform to U.S. GAAP. Total return for a period of less than one year is not annualized. |
| (c) | Annualized. |
| (d) | Less than $0.01 per share. |
| (e) | Does not include expenses of the investment companies in which the Fund invests. |
| See accompanying Notes to Financial Statements | | May 31, 2015 | | Semiannual Report | 265 |
Table of Contents
Financial Highlights (cont’d)
For a Share Outstanding for the Period ended:
| Net Asset Value, Beginning of Period | Net Investment Income (a) | Net Realized and Change in Unrealized Gain | Total from Investment Operations | Dividends from Net Investment Income | Distributions from Net Realized Capital Gains | |||||||||||||||||||
| AllianzGI NFJ Emerging Markets Value: | ||||||||||||||||||||||||
| Class A | ||||||||||||||||||||||||
5/31/2015+ | $ | 15.45 | $ | 0.21 | $ | 0.25 | $ | 0.46 | $ | (0.37 | ) | $ | (0.25 | ) | ||||||||||
11/30/2014 | 15.42 | 0.37 | 0.08 | 0.45 | (0.42 | ) | — | |||||||||||||||||
12/18/2012* - 11/30/2013 | 15.00 | 0.35 | 0.27 | 0.62 | (0.20 | ) | — | |||||||||||||||||
| Class C | ||||||||||||||||||||||||
5/31/2015+ | $ | 15.40 | $ | 0.14 | $ | 0.27 | $ | 0.41 | $ | (0.31 | ) | $ | (0.25 | ) | ||||||||||
11/30/2014 | 15.35 | 0.28 | 0.05 | 0.33 | (0.28 | ) | — | |||||||||||||||||
12/18/2012* - 11/30/2013 | 15.00 | 0.14 | 0.36 | 0.50 | (0.15 | ) | — | |||||||||||||||||
| Class D | ||||||||||||||||||||||||
5/31/2015+ | $ | 15.55 | $ | 0.21 | $ | 0.27 | $ | 0.48 | $ | (0.37 | ) | $ | (0.25 | ) | ||||||||||
11/30/2014 | 15.45 | 0.42 | 0.03 | 0.45 | (0.35 | ) | — | |||||||||||||||||
12/18/2012* - 11/30/2013 | 15.00 | 0.25 | 0.36 | 0.61 | (0.16 | ) | — | |||||||||||||||||
| Class P | ||||||||||||||||||||||||
5/31/2015+ | $ | 15.56 | $ | 0.21 | $ | 0.27 | $ | 0.48 | $ | (0.38 | ) | $ | (0.25 | ) | ||||||||||
11/30/2014 | 15.45 | 0.43 | 0.05 | 0.48 | (0.37 | ) | — | |||||||||||||||||
12/18/2012* - 11/30/2013 | 15.00 | 0.36 | 0.27 | 0.63 | (0.18 | ) | — | |||||||||||||||||
| Institutional Class | ||||||||||||||||||||||||
5/31/2015+ | $ | 15.57 | $ | 0.21 | $ | 0.28 | $ | 0.49 | $ | (0.39 | ) | $ | (0.25 | ) | ||||||||||
11/30/2014 | 15.46 | 0.46 | 0.03 | 0.49 | (0.38 | ) | — | |||||||||||||||||
12/18/2012* - 11/30/2013 | 15.00 | 0.39 | 0.26 | 0.65 | (0.19 | ) | — | |||||||||||||||||
| + | Unaudited |
| * | Commencement of operations. |
| (a) | Calculated on average shares outstanding during the period. |
| (b) | Total return is calculated assuming a purchase of a share on the first day of the period and a sale of a share on the last day of each period reported. Dividends and distributions, if any, are assumed, for purposes of this calculation, to be reinvested. Total return does not reflect sales charges and includes the effect of fee waivers and reimbursements. Total return may reflect adjustments to conform to U.S. GAAP. Total return for a period of less than one year is not annualized. |
| (c) | Annualized. |
| 266 | Semiannual Report | | May 31, 2015 | | See accompanying Notes to Financial Statements |
Table of Contents
| Total Dividends and Distributions | Net Asset Value, End of Period | Total Return (b) | Net Assets, End of Period (000s) | Ratio of Expenses to Average Net Assets with Fee Waiver/ Reimbursement | Ratio of Expenses to Average Net Assets without Fee Waiver/ Reimbursement | Ratio of Net Investment Income to Average Net Assets | Portfolio Turnover Rate | |||||||||||||||||||||||||
| $ | (0.62 | ) | $ | 15.29 | 3.37 | % | $ | 155 | 1.55 | %(c) | 5.05 | %(c) | 2.88 | %(c) | 53 | % | ||||||||||||||||
| (0.42 | ) | 15.45 | 2.94 | 110 | 1.55 | 4.86 | 2.33 | 85 | ||||||||||||||||||||||||
| (0.20 | ) | 15.42 | 4.14 | 19 | 1.55 | (c) | 17.07 | (c) | 2.41 | (c) | 67 | |||||||||||||||||||||
| $ | (0.56 | ) | $ | 15.25 | 3.02 | % | $ | 74 | 2.30 | %(c) | 5.79 | %(c) | 1.85 | %(c) | 53 | % | ||||||||||||||||
| (0.28 | ) | 15.40 | 2.19 | 73 | 2.30 | 5.60 | 1.82 | 85 | ||||||||||||||||||||||||
| (0.15 | ) | 15.35 | 3.40 | 25 | 2.30 | (c) | 19.41 | (c) | 1.00 | (c) | 67 | |||||||||||||||||||||
| $ | (0.62 | ) | $ | 15.41 | 3.45 | % | $ | 1,549 | 1.55 | %(c) | 5.78 | %(c) | 2.81 | %(c) | 53 | % | ||||||||||||||||
| (0.35 | ) | 15.55 | 2.95 | 1,492 | 1.55 | 5.76 | 2.68 | 85 | ||||||||||||||||||||||||
| (0.16 | ) | 15.45 | 4.10 | 1,086 | 1.55 | (c) | 8.48 | (c) | 1.75 | (c) | 67 | |||||||||||||||||||||
| $ | (0.63 | ) | $ | 15.41 | 3.47 | % | $ | 11 | 1.39 | %(c) | 4.80 | %(c) | 2.84 | %(c) | 53 | % | ||||||||||||||||
| (0.37 | ) | 15.56 | 3.13 | 11 | 1.39 | 4.64 | 2.77 | 85 | ||||||||||||||||||||||||
| (0.18 | ) | 15.45 | 4.25 | 11 | 1.41 | (c) | 7.72 | (c) | 2.49 | (c) | 67 | |||||||||||||||||||||
| $ | (0.64 | ) | $ | 15.42 | 3.53 | % | $ | 7,677 | 1.30 | %(c) | 4.82 | %(c) | 2.90 | %(c) | 53 | % | ||||||||||||||||
| (0.38 | ) | 15.57 | 3.18 | 7,889 | 1.30 | 4.63 | 2.96 | 85 | ||||||||||||||||||||||||
| (0.19 | ) | 15.46 | 4.38 | 6,470 | 1.30 | (c) | 7.78 | (c) | 2.70 | (c) | 67 | |||||||||||||||||||||
| See accompanying Notes to Financial Statements | | May 31, 2015 | | Semiannual Report | 267 |
Table of Contents
Financial Highlights (cont’d)
For a Share Outstanding for the Period ended:
| Net Asset Value, Beginning of Period | Net Investment Income (a) | Net Realized and Change in Unrealized Gain (Loss) | Total from Investment Operations | Dividends from Net Investment Income | Distributions from Net Realized Capital Gains | |||||||||||||||||||
| AllianzGI NFJ Global Dividend Value: | ||||||||||||||||||||||||
| Class A | ||||||||||||||||||||||||
5/31/2015+ | $ | 21.40 | $ | 0.28 | $ | (0.32 | ) | $ | (0.04 | ) | $ | (0.37 | ) | $ | (0.82 | ) | ||||||||
11/30/2014 | 22.08 | 0.61 | 0.30 | 0.91 | (0.55 | ) | (1.04 | ) | ||||||||||||||||
11/30/2013 | 18.27 | 0.54 | 3.75 | 4.29 | (0.44 | ) | (0.04 | ) | ||||||||||||||||
11/30/2012 | 17.35 | 0.56 | 1.10 | 1.66 | (0.40 | ) | (0.34 | ) | ||||||||||||||||
11/30/2011 | 17.91 | 0.55 | (0.19 | ) | 0.36 | (0.64 | ) | (0.28 | ) | |||||||||||||||
11/30/2010 | 18.16 | 0.43 | 0.38 | 0.81 | (0.71 | ) | (0.35 | ) | ||||||||||||||||
| Class C | ||||||||||||||||||||||||
5/31/2015+ | $ | 21.13 | $ | 0.20 | $ | (0.33 | ) | $ | (0.13 | ) | $ | (0.29 | ) | $ | (0.82 | ) | ||||||||
11/30/2014 | 21.82 | 0.43 | 0.31 | 0.74 | (0.39 | ) | (1.04 | ) | ||||||||||||||||
11/30/2013 | 18.05 | 0.37 | 3.72 | 4.09 | (0.28 | ) | (0.04 | ) | ||||||||||||||||
11/30/2012 | 17.19 | 0.42 | 1.07 | 1.49 | (0.29 | ) | (0.34 | ) | ||||||||||||||||
11/30/2011 | 17.76 | 0.43 | (0.20 | ) | 0.23 | (0.52 | ) | (0.28 | ) | |||||||||||||||
11/30/2010 | 18.12 | 0.28 | 0.41 | 0.69 | (0.70 | ) | (0.35 | ) | ||||||||||||||||
| Class D | ||||||||||||||||||||||||
5/31/2015+ | $ | 21.61 | $ | 0.26 | $ | (0.31 | ) | $ | (0.05 | ) | $ | (0.37 | ) | $ | (0.82 | ) | ||||||||
11/30/2014 | 22.30 | 0.55 | 0.36 | 0.91 | (0.56 | ) | (1.04 | ) | ||||||||||||||||
11/30/2013 | 18.44 | 0.52 | 3.80 | 4.32 | (0.42 | ) | (0.04 | ) | ||||||||||||||||
11/30/2012 | 17.38 | 0.60 | 1.05 | 1.65 | (0.25 | ) | (0.34 | ) | ||||||||||||||||
11/30/2011 | 17.86 | 0.61 | (0.23 | ) | 0.38 | (0.58 | ) | (0.28 | ) | |||||||||||||||
11/30/2010 | 18.17 | 0.43 | 0.37 | 0.80 | (0.76 | ) | (0.35 | ) | ||||||||||||||||
| Class P | ||||||||||||||||||||||||
5/31/2015+ | $ | 21.53 | $ | 0.29 | $ | (0.32 | ) | $ | (0.03 | ) | $ | (0.38 | ) | $ | (0.82 | ) | ||||||||
11/30/2014 | 22.21 | 0.65 | 0.30 | 0.95 | (0.59 | ) | (1.04 | ) | ||||||||||||||||
11/30/2013 | 18.36 | 0.57 | 3.78 | 4.35 | (0.46 | ) | (0.04 | ) | ||||||||||||||||
11/30/2012 | 17.45 | 0.60 | 1.10 | 1.70 | (0.45 | ) | (0.34 | ) | ||||||||||||||||
11/30/2011 | 17.82 | 0.42 | (0.02 | ) | 0.40 | (0.49 | ) | (0.28 | ) | |||||||||||||||
11/30/2010 | 18.17 | 0.46 | 0.38 | 0.84 | (0.84 | ) | (0.35 | ) | ||||||||||||||||
| Institutional Class | ||||||||||||||||||||||||
5/31/2015+ | $ | 21.30 | $ | 0.27 | $ | (0.29 | ) | $ | (0.02 | ) | $ | (0.35 | ) | $ | (0.82 | ) | ||||||||
11/30/2014 | 21.98 | 0.66 | 0.30 | 0.96 | (0.60 | ) | (1.04 | ) | ||||||||||||||||
11/30/2013 | 18.18 | 0.60 | 3.73 | 4.33 | (0.49 | ) | (0.04 | ) | ||||||||||||||||
11/30/2012 | 17.29 | 0.60 | 1.09 | 1.69 | (0.46 | ) | (0.34 | ) | ||||||||||||||||
11/30/2011 | 17.83 | 0.64 | (0.21 | ) | 0.43 | (0.69 | ) | (0.28 | ) | |||||||||||||||
11/30/2010 | 18.17 | 0.41 | 0.46 | 0.87 | (0.86 | ) | (0.35 | ) | ||||||||||||||||
| + | Unaudited |
| (a) | Calculated on average shares outstanding during the period. |
| (b) | Total return is calculated assuming a purchase of a share on the first day of the period and a sale of a share on the last day of each period reported. Dividends and distributions, if any, are assumed, for purposes of this calculation, to be reinvested. Total return does not reflect sales charges and includes the effect of fee waivers and reimbursements. Total return may reflect adjustments to conform to U.S. GAAP. Total return for a period of less than one year is not annualized. |
| (c) | Annualized. |
| 268 | Semiannual Report | | May 31, 2015 | | See accompanying Notes to Financial Statements |
Table of Contents
| Total Dividends and Distributions | Net Asset Value, End of Period | Total Return (b) | Net Assets, End of Period (000s) | Ratio of Expenses to Average Net Assets with Fee Waiver/ Reimbursement | Ratio of Expenses to Average Net Assets without Fee Waiver/ Reimbursement | Ratio of Net Investment Income to Average Net Assets | Portfolio Turnover Rate | |||||||||||||||||||||||||
| $ | (1.19 | ) | $ | 20.17 | (0.05 | )% | $ | 12,646 | 1.20 | %(c) | 1.65 | %(c) | 2.79 | %(c) | 22 | % | ||||||||||||||||
| (1.59 | ) | 21.40 | 4.32 | 11,999 | 1.20 | 1.46 | 2.82 | 49 | ||||||||||||||||||||||||
| (0.48 | ) | 22.08 | 23.80 | 10,705 | 1.21 | 1.51 | 2.68 | 43 | ||||||||||||||||||||||||
| (0.74 | ) | 18.27 | 9.98 | 7,355 | 1.32 | 1.71 | 3.13 | 41 | ||||||||||||||||||||||||
| (0.92 | ) | 17.35 | 1.85 | 6,821 | 1.50 | 1.92 | 3.01 | 66 | ||||||||||||||||||||||||
| (1.06 | ) | 17.91 | 4.71 | 1,469 | 1.50 | 4.55 | 2.41 | 40 | ||||||||||||||||||||||||
| $ | (1.11 | ) | $ | 19.89 | (0.48 | )% | $ | 6,350 | 1.99 | %(c) | 2.43 | %(c) | 2.02 | %(c) | 22 | % | ||||||||||||||||
| (1.43 | ) | 21.13 | 3.52 | 5,587 | 1.99 | 2.22 | 2.03 | 49 | ||||||||||||||||||||||||
| (0.32 | ) | 21.82 | 22.88 | 5,720 | 2.00 | 2.27 | 1.83 | 43 | ||||||||||||||||||||||||
| (0.63 | ) | 18.05 | 9.03 | 3,948 | 2.07 | 2.46 | 2.34 | 41 | ||||||||||||||||||||||||
| (0.80 | ) | 17.19 | 1.12 | 3,020 | 2.25 | 2.71 | 2.39 | 66 | ||||||||||||||||||||||||
| (1.05 | ) | 17.76 | 3.99 | 1,210 | 2.25 | 5.11 | 1.57 | 40 | ||||||||||||||||||||||||
| $ | (1.19 | ) | $ | 20.37 | (0.09 | )% | $ | 2,484 | 1.26 | %(c) | 1.63 | %(c) | 2.56 | %(c) | 22 | % | ||||||||||||||||
| (1.60 | ) | 21.61 | 4.25 | 3,896 | 1.28 | 1.47 | 2.55 | 49 | ||||||||||||||||||||||||
| (0.46 | ) | 22.30 | 23.72 | 753 | 1.31 | 1.55 | 2.53 | 43 | ||||||||||||||||||||||||
| (0.59 | ) | 18.44 | 9.83 | 480 | 1.38 | 3.04 | 3.31 | 41 | ||||||||||||||||||||||||
| (0.86 | ) | 17.38 | 1.91 | 558 | 1.50 | 3.74 | 3.27 | 66 | ||||||||||||||||||||||||
| (1.11 | ) | 17.86 | 4.68 | 203 | 1.50 | 4.53 | 2.44 | 40 | ||||||||||||||||||||||||
| $ | (1.20 | ) | $ | 20.30 | 0.02 | % | $ | 1,851 | 1.04 | %(c) | 1.47 | %(c) | 2.91 | %(c) | 22 | % | ||||||||||||||||
| (1.63 | ) | 21.53 | 4.48 | 1,811 | 1.04 | 1.28 | 2.99 | 49 | ||||||||||||||||||||||||
| (0.50 | ) | 22.21 | 24.06 | 1,685 | 1.05 | 1.32 | 2.77 | 43 | ||||||||||||||||||||||||
| (0.79 | ) | 18.36 | 10.11 | 1,089 | 1.12 | 1.51 | 3.32 | 41 | ||||||||||||||||||||||||
| (0.77 | ) | 17.45 | 2.13 | 718 | 1.30 | 1.99 | 2.41 | 66 | ||||||||||||||||||||||||
| (1.19 | ) | 17.82 | 4.90 | 13 | 1.30 | 4.45 | 2.63 | 40 | ||||||||||||||||||||||||
| $ | (1.17 | ) | $ | 20.11 | 0.05 | % | $ | 17,453 | 0.95 | %(c) | 1.32 | %(c) | 2.72 | %(c) | 22 | % | ||||||||||||||||
| (1.64 | ) | 21.30 | 4.58 | 42,981 | 0.95 | 1.18 | 3.08 | 49 | ||||||||||||||||||||||||
| (0.53 | ) | 21.98 | 24.16 | 51,318 | 0.96 | 1.21 | 2.96 | 43 | ||||||||||||||||||||||||
| (0.80 | ) | 18.18 | 10.19 | 39,215 | 1.02 | 1.40 | 3.38 | 41 | ||||||||||||||||||||||||
| (0.97 | ) | 17.29 | 2.21 | 20,556 | 1.20 | 1.68 | 3.51 | 66 | ||||||||||||||||||||||||
| (1.21 | ) | 17.83 | 5.07 | 15,211 | 1.20 | 3.40 | 2.32 | 40 | ||||||||||||||||||||||||
| See accompanying Notes to Financial Statements | | May 31, 2015 | | Semiannual Report | 269 |
Table of Contents
Financial Highlights (cont’d)
For a Share Outstanding for the Period ended:
| Net Asset Value, Beginning of Period | Net Investment Income (a) | Net Realized and Change in Unrealized Gain | Total from Investment Operations | Dividends from Net | Distributions from Net Realized Capital Gains | |||||||||||||||||||
| AllianzGI NFJ International Small-Cap Value: | ||||||||||||||||||||||||
| Class A | ||||||||||||||||||||||||
5/31/2015+ | $ | 21.37 | $ | 0.24 | $ | 1.64 | $ | 1.88 | $ | (0.57 | ) | $ | (1.69 | ) | ||||||||||
11/30/2014 | 21.06 | 0.39 | 0.62 | 1.01 | (0.26 | ) | (0.44 | ) | ||||||||||||||||
11/30/2013 | 17.10 | 0.35 | 4.03 | 4.38 | (0.33 | ) | (0.09 | ) | ||||||||||||||||
6/1/2012* - 11/30/2012 | 15.00 | 0.07 | 2.03 | 2.10 | — | — | ||||||||||||||||||
| Class C | ||||||||||||||||||||||||
5/31/2015+ | $ | 21.11 | $ | 0.16 | $ | 1.62 | $ | 1.78 | $ | (0.48 | ) | $ | (1.69 | ) | ||||||||||
11/30/2014 | 21.04 | 0.23 | 0.63 | 0.86 | (0.35 | ) | (0.44 | ) | ||||||||||||||||
11/30/2013 | 17.04 | 0.16 | 4.09 | 4.25 | (0.16 | ) | (0.09 | ) | ||||||||||||||||
6/1/2012* - 11/30/2012 | 15.00 | 0.09 | 1.95 | 2.04 | — | — | ||||||||||||||||||
| Class D | ||||||||||||||||||||||||
5/31/2015+ | $ | 21.44 | $ | 0.24 | $ | 1.64 | $ | 1.88 | $ | (0.62 | ) | $ | (1.69 | ) | ||||||||||
11/30/2014 | 21.04 | 0.38 | 0.63 | 1.01 | (0.17 | ) | (0.44 | ) | ||||||||||||||||
11/30/2013 | 17.11 | 0.42 | 3.95 | 4.37 | (0.35 | ) | (0.09 | ) | ||||||||||||||||
6/1/2012* - 11/30/2012 | 15.00 | 0.13 | 1.98 | 2.11 | — | — | ||||||||||||||||||
| Class P | ||||||||||||||||||||||||
5/31/2015+ | $ | 21.70 | $ | 0.27 | $ | 1.64 | $ | 1.91 | $ | (0.70 | ) | $ | (1.69 | ) | ||||||||||
11/30/2014 | 21.27 | 0.44 | 0.62 | 1.06 | (0.19 | ) | (0.44 | ) | ||||||||||||||||
11/30/2013 | 17.11 | 0.39 | 4.05 | 4.44 | (0.19 | ) | (0.09 | ) | ||||||||||||||||
6/1/2012* - 11/30/2012 | 15.00 | 0.16 | 1.95 | 2.11 | — | — | ||||||||||||||||||
| Institutional Class | ||||||||||||||||||||||||
5/31/2015+ | $ | 21.59 | $ | 0.28 | $ | 1.66 | $ | 1.94 | $ | (0.52 | ) | $ | (1.69 | ) | ||||||||||
11/30/2014 | 21.28 | 0.45 | 0.63 | 1.08 | (0.33 | ) | (0.44 | ) | ||||||||||||||||
11/30/2013 | 17.12 | 0.43 | 4.03 | 4.46 | (0.21 | ) | (0.09 | ) | ||||||||||||||||
6/1/2012* - 11/30/2012 | 15.00 | 0.17 | 1.95 | 2.12 | — | — | ||||||||||||||||||
| + | Unaudited |
| * | Commencement of operations. |
| (a) | Calculated on average shares outstanding during the period. |
| (b) | Total return is calculated assuming a purchase of a share on the first day of the period and a sale of a share on the last day of each period reported. Dividends and distributions, if any, are assumed, for purposes of this calculation, to be reinvested. Total return does not reflect sales charges and includes the effect of fee waivers and reimbursements. Total return may reflect adjustments to conform to U.S. GAAP. Total return for a period of less than one year is not annualized. |
| (c) | Annualized. |
| 270 | Semiannual Report | | May 31, 2015 | | See accompanying Notes to Financial Statements |
Table of Contents
| Total Dividends and Distributions | Net Asset Value, End of Period | Total Return (b) | Net Assets, End of Period (000s) | Ratio of Expenses to Average Net Assets with Fee Waiver/ Reimbursement | Ratio of Expenses to Average Net Assets without Fee Waiver/ Reimbursement | Ratio of Net Investment Income to Average Net Assets | Portfolio Turnover Rate | |||||||||||||||||||||||||
| $ | (2.26 | ) | $ | 20.99 | 10.07 | % | $ | 3,132 | 1.46 | %(c) | 2.98 | %(c) | 2.43 | %(c) | 56 | % | ||||||||||||||||
| (0.70 | ) | 21.37 | 4.98 | 2,736 | 1.45 | 2.64 | 1.80 | 76 | ||||||||||||||||||||||||
| (0.42 | ) | 21.06 | 26.08 | 2,272 | 1.45 | 4.81 | 1.81 | 50 | ||||||||||||||||||||||||
| — | 17.10 | 14.00 | 1,049 | 1.45 | (c) | 4.22 | (c) | 0.82 | (c) | 19 | ||||||||||||||||||||||
| $ | (2.17 | ) | $ | 20.72 | 9.61 | % | $ | 1,517 | 2.21 | %(c) | 3.74 | %(c) | 1.66 | %(c) | 56 | % | ||||||||||||||||
| (0.79 | ) | 21.11 | 4.24 | 1,340 | 2.20 | 3.40 | 1.07 | 76 | ||||||||||||||||||||||||
| (0.25 | ) | 21.04 | 25.20 | 521 | 2.20 | 5.66 | 0.80 | 50 | ||||||||||||||||||||||||
| — | 17.04 | 13.60 | 11 | 2.20 | (c) | 9.92 | (c) | 1.08 | (c) | 19 | ||||||||||||||||||||||
| $ | (2.31 | ) | $ | 21.01 | 10.07 | % | $ | 1,631 | 1.46 | %(c) | 3.72 | %(c) | 2.39 | %(c) | 56 | % | ||||||||||||||||
| (0.61 | ) | 21.44 | 4.98 | 1,388 | 1.45 | 3.47 | 1.74 | 76 | ||||||||||||||||||||||||
| (0.44 | ) | 21.04 | 26.03 | 951 | 1.45 | 6.56 | 2.17 | 50 | ||||||||||||||||||||||||
| — | 17.11 | 14.07 | 84 | 1.45 | (c) | 7.85 | (c) | 1.59 | (c) | 19 | ||||||||||||||||||||||
| $ | (2.39 | ) | $ | 21.22 | 10.14 | % | $ | 54 | 1.31 | %(c) | 2.80 | %(c) | 2.74 | %(c) | 56 | % | ||||||||||||||||
| (0.63 | ) | 21.70 | 5.17 | 39 | 1.30 | 2.39 | 1.98 | 76 | ||||||||||||||||||||||||
| (0.28 | ) | 21.27 | 26.28 | 14 | 1.31 | 4.63 | 2.04 | 50 | ||||||||||||||||||||||||
| — | 17.11 | 14.07 | 12 | 1.30 | (c) | 8.92 | (c) | 1.98 | (c) | 19 | ||||||||||||||||||||||
| $ | (2.21 | ) | $ | 21.32 | 10.24 | % | $ | 13,178 | 1.21 | %(c) | 2.70 | %(c) | 2.76 | %(c) | 56 | % | ||||||||||||||||
| (0.77 | ) | 21.59 | 5.27 | 13,979 | 1.20 | 2.31 | 2.03 | 76 | ||||||||||||||||||||||||
| (0.30 | ) | 21.28 | 26.40 | 11,873 | 1.21 | 4.66 | 2.22 | 50 | ||||||||||||||||||||||||
| — | 17.12 | 14.13 | 3,551 | 1.20 | (c) | 8.90 | (c) | 2.08 | (c) | 19 | ||||||||||||||||||||||
| See accompanying Notes to Financial Statements | | May 31, 2015 | | Semiannual Report | 271 |
Table of Contents
Financial Highlights (cont’d)
For a Share Outstanding for the Period ended:
| Net Asset Value, Beginning of Period | Net Investment Income (a) | Net Realized and Change in Unrealized Gain (Loss) | Total from Investment Operations | Dividends from Net Investment Income | Distributions from Net Realized Capital Gains | |||||||||||||||||||
| AllianzGI NFJ International Value II: | ||||||||||||||||||||||||
| Class A | ||||||||||||||||||||||||
5/31/2015+ | $ | 17.99 | $ | 0.23 | $ | 0.67 | $ | 0.90 | $ | (0.13 | ) | $ | (0.05 | ) | ||||||||||
11/30/2014 | 19.17 | 0.47 | (0.44 | ) | 0.03 | (0.56 | ) | (0.65 | ) | |||||||||||||||
11/30/2013 | 16.36 | 0.34 | 2.71 | 3.05 | (0.22 | ) | (0.02 | ) | ||||||||||||||||
12/1/2011* - 11/30/2012 | 15.00 | 0.29 | 1.33 | 1.62 | (0.26 | ) | — | |||||||||||||||||
| Class C | ||||||||||||||||||||||||
5/31/2015+ | $ | 17.82 | $ | 0.16 | $ | 0.67 | $ | 0.83 | $ | (0.07 | ) | $ | (0.05 | ) | ||||||||||
11/30/2014 | 19.04 | 0.32 | (0.43 | ) | (0.11 | ) | (0.46 | ) | (0.65 | ) | ||||||||||||||
11/30/2013 | 16.32 | 0.18 | 2.73 | 2.91 | (0.17 | ) | (0.02 | ) | ||||||||||||||||
12/1/2011* - 11/30/2012 | 15.00 | 0.22 | 1.28 | 1.50 | (0.18 | ) | — | |||||||||||||||||
| Class D | ||||||||||||||||||||||||
5/31/2015+ | $ | 18.01 | $ | 0.22 | $ | 0.69 | $ | 0.91 | $ | (0.13 | ) | $ | (0.05 | ) | ||||||||||
11/30/2014 | 19.20 | 0.51 | (0.49 | ) | 0.02 | (0.56 | ) | (0.65 | ) | |||||||||||||||
11/30/2013 | 16.36 | 0.33 | 2.73 | 3.06 | (0.20 | ) | (0.02 | ) | ||||||||||||||||
12/1/2011* - 11/30/2012 | 15.00 | 0.34 | 1.28 | 1.62 | (0.26 | ) | — | |||||||||||||||||
| Class P | ||||||||||||||||||||||||
5/31/2015+ | $ | 17.99 | $ | 0.27 | $ | 0.66 | $ | 0.93 | $ | (0.16 | ) | $ | (0.05 | ) | ||||||||||
11/30/2014 | 19.24 | 0.38 | (0.32 | ) | 0.06 | (0.66 | ) | (0.65 | ) | |||||||||||||||
11/30/2013 | 16.38 | 0.36 | 2.73 | 3.09 | (0.21 | ) | (0.02 | ) | ||||||||||||||||
12/1/2011* - 11/30/2012 | 15.00 | 0.38 | 1.28 | 1.66 | (0.28 | ) | — | |||||||||||||||||
| Institutional Class | ||||||||||||||||||||||||
5/31/2015+ | $ | 18.03 | $ | 0.25 | $ | 0.68 | $ | 0.93 | $ | (0.16 | ) | $ | (0.05 | ) | ||||||||||
11/30/2014 | 19.26 | 0.57 | (0.50 | ) | 0.07 | (0.65 | ) | (0.65 | ) | |||||||||||||||
11/30/2013 | 16.38 | 0.36 | 2.76 | 3.12 | (0.22 | ) | (0.02 | ) | ||||||||||||||||
12/1/2011* - 11/30/2012 | 15.00 | 0.39 | 1.29 | 1.68 | (0.30 | ) | — | |||||||||||||||||
| + | Unaudited |
| * | Commencement of operations. |
| (a) | Calculated on average shares outstanding during the period. |
| (b) | Total return is calculated assuming a purchase of a share on the first day of the period and a sale of a share on the last day of each period reported. Dividends and distributions, if any, are assumed, for purposes of this calculation, to be reinvested. Total return does not reflect sales charges and includes the effect of fee waivers and reimbursements. Total return may reflect adjustments to conform to U.S. GAAP. Total return for a period of less than one year is not annualized. |
| (c) | Annualized. |
| 272 | Semiannual Report | | May 31, 2015 | | See accompanying Notes to Financial Statements |
Table of Contents
| Total Dividends and Distributions | Net Asset Value, End of Period | Total Return (b) | Net Assets, End of Period (000s) | Ratio of Expenses to Average Net Assets with Fee Waiver/ Reimbursement | Ratio of Expenses to Average Net Assets without Fee Waiver/ Reimbursement | Ratio of Net Investment Income to Average Net Assets | Portfolio Turnover Rate | |||||||||||||||||||||||||
| $ | (0.18 | ) | $ | 18.71 | 5.04 | % | $ | 214 | 1.20 | %(c) | 1.68 | %(c) | 2.58 | %(c) | 31 | % | ||||||||||||||||
| (1.21 | ) | 17.99 | 0.25 | 167 | 1.20 | 2.46 | 2.53 | 34 | ||||||||||||||||||||||||
| (0.24 | ) | 19.17 | 18.89 | 75 | 1.23 | 7.16 | 1.93 | 20 | ||||||||||||||||||||||||
| (0.26 | ) | 16.36 | 10.99 | 49 | 1.30 | (c) | 10.98 | (c) | 1.89 | (c) | 22 | |||||||||||||||||||||
| $ | (0.12 | ) | $ | 18.53 | 4.67 | % | $ | 173 | 1.95 | %(c) | 2.40 | %(c) | 1.81 | %(c) | 31 | % | ||||||||||||||||
| (1.11 | ) | 17.82 | (0.53 | ) | 79 | 1.95 | 3.23 | 1.76 | 34 | |||||||||||||||||||||||
| (0.19 | ) | 19.04 | 18.02 | 47 | 1.97 | 8.26 | 1.02 | 20 | ||||||||||||||||||||||||
| (0.18 | ) | 16.32 | 10.17 | 11 | 2.05 | (c) | 10.82 | (c) | 1.45 | (c) | 22 | |||||||||||||||||||||
| $ | (0.18 | ) | $ | 18.74 | 5.10 | % | $ | 14 | 1.20 | %(c) | 1.62 | %(c) | 2.41 | %(c) | 31 | % | ||||||||||||||||
| (1.21 | ) | 18.01 | 0.20 | 14 | 1.20 | 2.45 | 2.72 | 34 | ||||||||||||||||||||||||
| (0.22 | ) | 19.20 | 18.93 | 13 | 1.23 | 7.04 | 1.87 | 20 | ||||||||||||||||||||||||
| (0.26 | ) | 16.36 | 10.97 | 11 | 1.30 | (c) | 10.07 | (c) | 2.20 | (c) | 22 | |||||||||||||||||||||
| $ | (0.21 | ) | $ | 18.71 | 5.21 | % | $ | 587 | 1.00 | %(c) | 1.46 | %(c) | 2.98 | %(c) | 31 | % | ||||||||||||||||
| (1.31 | ) | 17.99 | 0.40 | 118 | 1.01 | 2.11 | 2.08 | 34 | ||||||||||||||||||||||||
| (0.23 | ) | 19.24 | 19.10 | 13 | 1.05 | 6.87 | 2.05 | 20 | ||||||||||||||||||||||||
| (0.28 | ) | 16.38 | 11.28 | 11 | 1.05 | (c) | 9.92 | (c) | 2.45 | (c) | 22 | |||||||||||||||||||||
| $ | (0.21 | ) | $ | 18.75 | 5.21 | % | $ | 49,250 | 0.95 | %(c) | 1.39 | %(c) | 2.80 | %(c) | 31 | % | ||||||||||||||||
| (1.30 | ) | 18.03 | 0.45 | 38,983 | 0.95 | 1.78 | 3.05 | 34 | ||||||||||||||||||||||||
| (0.24 | ) | 19.26 | 19.25 | 4,170 | 0.95 | 6.77 | 2.06 | 20 | ||||||||||||||||||||||||
| (0.30 | ) | 16.38 | 11.36 | 4,396 | 0.95 | (c) | 9.93 | (c) | 2.50 | (c) | 22 | |||||||||||||||||||||
| See accompanying Notes to Financial Statements | | May 31, 2015 | | Semiannual Report | 273 |
Table of Contents
Financial Highlights (cont’d)
For a Share Outstanding for the Period ended:
| Net Asset Value, Beginning of Period | Net Investment Income (a) | Net Realized and Change in Unrealized Gain (Loss) | Total from Investment Operations | Dividends from Net Investment Income | Distributions from Net Realized Capital Gains | |||||||||||||||||||
| AllianzGI Short Duration High Income: | ||||||||||||||||||||||||
| Class A | ||||||||||||||||||||||||
5/31/2015+ | $ | 15.59 | $ | 0.35 | $ | 0.14 | $ | 0.49 | $ | (0.42 | ) | $ | — | |||||||||||
11/30/2014 | 15.92 | 0.64 | (0.23 | ) | 0.41 | (0.74 | ) | — | ||||||||||||||||
11/30/2013 | 15.97 | 0.63 | 0.09 | 0.72 | (0.76 | ) | (0.01 | ) | ||||||||||||||||
11/30/2012 | 15.32 | 0.64 | 0.68 | 1.32 | (0.67 | ) | — | |||||||||||||||||
10/3/2011* - 11/30/2011 | 15.00 | 0.12 | 0.25 | 0.37 | (0.05 | ) | — | |||||||||||||||||
| Class C | ||||||||||||||||||||||||
5/31/2015+ | $ | 15.56 | $ | 0.33 | $ | 0.14 | $ | 0.47 | $ | (0.40 | ) | $ | — | |||||||||||
11/30/2014 | 15.89 | 0.60 | (0.23 | ) | 0.37 | (0.70 | ) | — | ||||||||||||||||
11/30/2013 | 15.94 | 0.59 | 0.09 | 0.68 | (0.72 | ) | (0.01 | ) | ||||||||||||||||
11/30/2012 | 15.31 | 0.58 | 0.64 | 1.22 | (0.59 | ) | — | |||||||||||||||||
10/3/2011* - 11/30/2011 | 15.00 | 0.10 | 0.25 | 0.35 | (0.04 | ) | — | |||||||||||||||||
| Class D | ||||||||||||||||||||||||
5/31/2015+ | $ | 15.59 | $ | 0.35 | $ | 0.14 | $ | 0.49 | $ | (0.42 | ) | $ | — | |||||||||||
11/30/2014 | 15.92 | 0.64 | (0.23 | ) | 0.41 | (0.74 | ) | — | ||||||||||||||||
11/30/2013 | 15.97 | 0.63 | 0.09 | 0.72 | (0.76 | ) | (0.01 | ) | ||||||||||||||||
11/30/2012 | 15.32 | 0.65 | 0.67 | 1.32 | (0.67 | ) | — | |||||||||||||||||
10/3/2011* - 11/30/2011 | 15.00 | 0.12 | 0.25 | 0.37 | (0.05 | ) | — | |||||||||||||||||
| Class P | ||||||||||||||||||||||||
5/31/2015+ | $ | 15.58 | $ | 0.36 | $ | 0.14 | $ | 0.50 | $ | (0.43 | ) | $ | — | |||||||||||
11/30/2014 | 15.92 | 0.66 | (0.23 | ) | 0.43 | (0.77 | ) | — | ||||||||||||||||
11/30/2013 | 15.96 | 0.66 | 0.10 | 0.76 | (0.79 | ) | (0.01 | ) | ||||||||||||||||
11/30/2012 | 15.32 | 0.66 | 0.68 | 1.34 | (0.70 | ) | — | |||||||||||||||||
10/3/2011* - 11/30/2011 | 15.00 | 0.10 | 0.28 | 0.38 | (0.06 | ) | — | |||||||||||||||||
| Institutional Class | ||||||||||||||||||||||||
5/31/2015+ | $ | 15.60 | $ | 0.37 | $ | 0.14 | $ | 0.51 | $ | (0.44 | ) | $ | — | |||||||||||
11/30/2014 | 15.94 | 0.68 | (0.24 | ) | 0.44 | (0.78 | ) | — | ||||||||||||||||
11/30/2013 | 15.99 | 0.67 | 0.09 | 0.76 | (0.80 | ) | (0.01 | ) | ||||||||||||||||
11/30/2012 | 15.32 | 0.70 | 0.67 | 1.37 | (0.70 | ) | — | |||||||||||||||||
10/3/2011* - 11/30/2011 | 15.00 | 0.11 | 0.27 | 0.38 | (0.06 | ) | — | |||||||||||||||||
| + | Unaudited |
| * | Commencement of operations. |
| (a) | Calculated on average shares outstanding during the period. |
| (b) | Total return is calculated assuming a purchase of a share on the first day of the period and a sale of a share on the last day of each period reported. Dividends and distributions, if any, are assumed, for purposes of this calculation, to be reinvested. Total return does not reflect sales charges and includes the effect of fee waivers and reimbursements. Total return may reflect adjustments to conform to U.S. GAAP. Total return for a period of less than one year is not annualized. |
| (c) | Annualized. |
| 274 | Semiannual Report | | May 31, 2015 | | See accompanying Notes to Financial Statements |
Table of Contents
| Total Dividends and Distributions | Net Asset Value, End of Period | Total Return (b) | Net Assets, End of Period (000s) | Ratio of Expenses to Average Net Assets with Fee Waiver/ Reimbursement | Ratio of Expenses to Average Net Assets without Fee Waiver/ Reimbursement | Ratio of Net Investment Income to Average Net Assets | Portfolio Turnover Rate | |||||||||||||||||||||||||
| $ | (0.42 | ) | $ | 15.66 | 3.20 | % | $ | 157,390 | 0.85 | %(c) | 0.87 | %(c) | 4.49 | %(c) | 49 | % | ||||||||||||||||
| (0.74 | ) | 15.59 | 2.60 | 163,070 | 0.85 | 0.88 | 4.01 | 94 | ||||||||||||||||||||||||
| (0.77 | ) | 15.92 | 4.60 | 168,536 | 0.85 | 0.90 | 3.98 | 63 | ||||||||||||||||||||||||
| (0.67 | ) | 15.97 | 8.78 | 80,995 | 0.89 | 1.09 | 4.09 | 51 | ||||||||||||||||||||||||
| (0.05 | ) | 15.32 | 2.50 | 532 | 0.95 | (c) | 2.99 | (c) | 4.97 | (c) | 10 | |||||||||||||||||||||
| $ | (0.40 | ) | $ | 15.63 | 3.09 | % | $ | 90,785 | 1.11 | %(c) | 1.11 | %(c) | 4.24 | %(c) | 49 | % | ||||||||||||||||
| (0.70 | ) | 15.56 | 2.38 | 89,801 | 1.10 | 1.13 | 3.78 | 94 | ||||||||||||||||||||||||
| (0.73 | ) | 15.89 | 4.36 | 63,680 | 1.10 | 1.16 | 3.74 | 63 | ||||||||||||||||||||||||
| (0.59 | ) | 15.94 | 8.18 | 28,567 | 1.29 | 1.50 | 3.73 | 51 | ||||||||||||||||||||||||
| (0.04 | ) | 15.31 | 2.36 | 1,245 | 1.70 | (c) | 3.72 | (c) | 4.26 | (c) | 10 | |||||||||||||||||||||
| $ | (0.42 | ) | $ | 15.66 | 3.18 | % | $ | 30,101 | 0.85 | %(c) | 0.97 | %(c) | 4.48 | %(c) | 49 | % | ||||||||||||||||
| (0.74 | ) | 15.59 | 2.62 | 35,821 | 0.85 | 0.97 | 4.05 | 94 | ||||||||||||||||||||||||
| (0.77 | ) | 15.92 | 4.61 | 18,902 | 0.85 | 1.08 | 3.99 | 63 | ||||||||||||||||||||||||
| (0.67 | ) | 15.97 | 8.78 | 10,018 | 0.90 | 1.18 | 4.16 | 51 | ||||||||||||||||||||||||
| (0.05 | ) | 15.32 | 2.50 | 65 | 0.95 | (c) | 2.88 | (c) | 4.95 | (c) | 10 | |||||||||||||||||||||
| $ | (0.43 | ) | $ | 15.65 | 3.30 | % | $ | 240,006 | 0.66 | %(c) | 0.66 | %(c) | 4.67 | %(c) | 49 | % | ||||||||||||||||
| (0.77 | ) | 15.58 | 2.74 | 248,345 | 0.70 | 0.70 | 4.20 | 94 | ||||||||||||||||||||||||
| (0.80 | ) | 15.92 | 4.83 | 121,747 | 0.70 | 0.71 | 4.14 | 63 | ||||||||||||||||||||||||
| (0.70 | ) | 15.96 | 8.91 | 52,932 | 0.70 | 0.92 | 4.24 | 51 | ||||||||||||||||||||||||
| (0.06 | ) | 15.32 | 2.50 | 10 | 0.70 | (c) | 2.84 | (c) | 4.22 | (c) | 10 | |||||||||||||||||||||
| $ | (0.44 | ) | $ | 15.67 | 3.35 | % | $ | 311,829 | 0.60 | %(c) | 0.60 | %(c) | 4.74 | %(c) | 49 | % | ||||||||||||||||
| (0.78 | ) | 15.60 | 2.81 | 225,643 | 0.60 | 0.60 | 4.28 | 94 | ||||||||||||||||||||||||
| (0.81 | ) | 15.94 | 4.87 | 179,676 | 0.61 | 0.61 | 4.23 | 63 | ||||||||||||||||||||||||
| (0.70 | ) | 15.99 | 9.13 | 38,247 | 0.60 | 0.89 | 4.48 | 51 | ||||||||||||||||||||||||
| (0.06 | ) | 15.32 | 2.52 | 8,055 | 0.60 | (c) | 2.72 | (c) | 4.58 | (c) | 10 | |||||||||||||||||||||
| See accompanying Notes to Financial Statements | | May 31, 2015 | | Semiannual Report | 275 |
Table of Contents
Financial Highlights (cont’d)
For a Share Outstanding for the Period ended:
| Net Asset Value, Beginning of Period | Net Investment Income (Loss) (a) | Net Realized and Change in Unrealized Gain | Total from Investment Operations | Dividends from Net Investment Income | Distributions from Net Realized Capital Gains | |||||||||||||||||||
| AllianzGI Structured Return: | ||||||||||||||||||||||||
| Class A | ||||||||||||||||||||||||
5/31/2015+ | $ | 15.64 | $ | 0.05 | $ | 0.52 | $ | 0.57 | $ | — | (c) | $ | (0.61 | ) | ||||||||||
11/30/2014 | 15.87 | (0.12 | ) | 0.65 | 0.53 | — | (0.76 | ) | ||||||||||||||||
12/3/2012* - 11/30/2013 | 15.00 | (0.28 | ) | 1.15 | 0.87 | — | — | |||||||||||||||||
| Class C | ||||||||||||||||||||||||
5/31/2015+ | $ | 15.39 | $ | (0.08 | ) | $ | 0.59 | $ | 0.51 | $ | — | (c) | $ | (0.61 | ) | |||||||||
11/30/2014 | 15.73 | (0.25 | ) | 0.67 | 0.42 | — | (0.76 | ) | ||||||||||||||||
12/3/2012* - 11/30/2013 | 15.00 | (0.39 | ) | 1.12 | 0.73 | — | — | |||||||||||||||||
| Class D | ||||||||||||||||||||||||
5/31/2015+ | $ | 15.66 | $ | 0.05 | $ | 0.52 | $ | 0.57 | $ | (0.11 | ) | $ | (0.61 | ) | ||||||||||
11/30/2014 | 15.89 | (0.11 | ) | 0.64 | 0.53 | — | (0.76 | ) | ||||||||||||||||
12/3/2012* - 11/30/2013 | 15.00 | (0.28 | ) | 1.17 | 0.89 | — | — | |||||||||||||||||
| Class P | ||||||||||||||||||||||||
5/31/2015+ | $ | 15.69 | $ | 0.05 | $ | 0.53 | $ | 0.58 | $ | — | (c) | $ | (0.61 | ) | ||||||||||
11/30/2014 | 15.89 | (0.15 | ) | 0.71 | 0.56 | — | (0.76 | ) | ||||||||||||||||
12/3/2012* - 11/30/2013 | 15.00 | (0.26 | ) | 1.15 | 0.89 | — | — | |||||||||||||||||
| Institutional Class | ||||||||||||||||||||||||
5/31/2015+ | $ | 15.72 | $ | 0.08 | $ | 0.50 | $ | 0.58 | $ | (0.03 | ) | $ | (0.61 | ) | ||||||||||
11/30/2014 | 15.90 | (0.08 | ) | 0.66 | 0.58 | — | (0.76 | ) | ||||||||||||||||
12/3/2012* - 11/30/2013 | 15.00 | (0.24 | ) | 1.14 | 0.90 | — | — | |||||||||||||||||
| AllianzGI U.S. Equity Hedged: | ||||||||||||||||||||||||
| Class A | ||||||||||||||||||||||||
5/31/2015+ | $ | 17.74 | $ | 0.05 | $ | 0.02 | $ | 0.07 | $ | (0.02 | ) | $ | (0.66 | ) | ||||||||||
11/30/2014 | 17.26 | 0.12 | 1.45 | 1.57 | (0.15 | ) | (0.94 | ) | ||||||||||||||||
12/3/2012* - 11/30/2013 | 15.00 | 0.12 | 2.14 | 2.26 | — | — | ||||||||||||||||||
| Class C | ||||||||||||||||||||||||
5/31/2015+ | $ | 17.45 | $ | (0.01 | ) | $ | 0.01 | $ | — | $ | — | (c) | $ | (0.66 | ) | |||||||||
11/30/2014 | 17.14 | (0.01 | ) | 1.44 | 1.43 | (0.18 | ) | (0.94 | ) | |||||||||||||||
12/3/2012* - 11/30/2013 | 15.00 | — | (c) | 2.14 | 2.14 | — | — | |||||||||||||||||
| Class D | ||||||||||||||||||||||||
5/31/2015+ | $ | 17.83 | $ | 0.06 | $ | — | $ | 0.06 | $ | (0.16 | ) | $ | (0.66 | ) | ||||||||||
11/30/2014 | 17.26 | 0.12 | 1.47 | 1.59 | (0.08 | ) | (0.94 | ) | ||||||||||||||||
12/3/2012* - 11/30/2013 | 15.00 | 0.12 | 2.14 | 2.26 | — | — | ||||||||||||||||||
| Class P | ||||||||||||||||||||||||
5/31/2015+ | $ | 17.90 | $ | 0.07 | $ | 0.01 | $ | 0.08 | $ | (0.05 | ) | $ | (0.66 | ) | ||||||||||
11/30/2014 | 17.29 | 0.15 | 1.47 | 1.62 | (0.07 | ) | (0.94 | ) | ||||||||||||||||
12/3/2012* - 11/30/2013 | 15.00 | 0.15 | 2.14 | 2.29 | — | — | ||||||||||||||||||
| Institutional Class | ||||||||||||||||||||||||
5/31/2015+ | $ | 17.89 | $ | 0.07 | $ | 0.02 | $ | 0.09 | $ | (0.12 | ) | $ | (0.66 | ) | ||||||||||
11/30/2014 | 17.31 | 0.17 | 1.46 | 1.63 | (0.11 | ) | (0.94 | ) | ||||||||||||||||
12/3/2012* - 11/30/2013 | 15.00 | 0.17 | 2.14 | 2.31 | — | — | ||||||||||||||||||
| + | Unaudited |
| * | Commencement of operations. |
| (a) | Calculated on average shares outstanding during the period. |
| (b) | Total return is calculated assuming a purchase of a share on the first day of the period and a sale of a share on the last day of each period reported. Dividends and distributions, if any, are assumed, for purposes of this calculation, to be reinvested. Total return does not reflect sales charges and includes the effect of fee waivers and reimbursements. Total return may reflect adjustments to conform to U.S. GAAP. Total return for a period of less than one year is not annualized. |
| (c) | Less than $(0.01) per share. |
| 276 | Semiannual Report | | May 31, 2015 | | See accompanying Notes to Financial Statements |
Table of Contents
| Total Dividends and Distributions | Net Asset Value, End of Period | Total Return (b) | Net Assets, End of Period (000s) | Ratio of Expenses to Average Net Assets with Fee Waiver/ Reimbursement | Ratio of Expenses to Average Net Assets without Fee Waiver/ Reimbursement | Ratio of Net Investment Income (Loss) to Average Net Assets | Portfolio Turnover Rate | |||||||||||||||||||||||||
| $ | (0.61 | ) | $ | 15.60 | 3.79 | % | $ | 4,077 | 1.15 | %(d) | 1.95 | %(d) | 0.59 | %(d) | 1 | % | ||||||||||||||||
| (0.76 | ) | 15.64 | 3.52 | 2,551 | 1.52 | 4.22 | (0.75 | ) | 229 | |||||||||||||||||||||||
| — | 15.87 | 5.80 | 517 | 1.90 | (d) | 7.34 | (d) | (1.86 | )(d) | — | ||||||||||||||||||||||
| $ | (0.61 | ) | $ | 15.29 | 3.46 | % | $ | 1,367 | 1.90 | %(d) | 2.60 | %(d) | (1.09 | )%(d) | 1 | % | ||||||||||||||||
| (0.76 | ) | 15.39 | 2.82 | 138 | 2.31 | 4.74 | (1.64 | ) | 229 | |||||||||||||||||||||||
| — | 15.73 | 4.87 | 74 | 2.65 | (d) | 6.91 | (d) | (2.60 | )(d) | — | ||||||||||||||||||||||
| $ | (0.72 | ) | $ | 15.51 | 3.82 | % | $ | 8,244 | 1.15 | %(d) | 1.93 | %(d) | 0.65 | %(d) | 1 | % | ||||||||||||||||
| (0.76 | ) | 15.66 | 3.52 | 5,735 | 1.45 | 5.05 | (0.72 | ) | 229 | |||||||||||||||||||||||
| — | 15.89 | 5.93 | 1,416 | 1.90 | (d) | 6.29 | (d) | (1.85 | )(d) | — | ||||||||||||||||||||||
| $ | (0.61 | ) | $ | 15.66 | 3.85 | % | $ | 129 | 1.00 | %(d) | 1.59 | %(d) | 0.62 | %(d) | 1 | % | ||||||||||||||||
| (0.76 | ) | 15.69 | 3.72 | 37 | 1.50 | 3.73 | (1.00 | ) | 229 | |||||||||||||||||||||||
| — | 15.89 | 5.93 | 61 | 1.75 | (d) | 5.97 | (d) | (1.69 | )(d) | — | ||||||||||||||||||||||
| $ | (0.64 | ) | $ | 15.66 | 3.88 | % | $ | 17,870 | 0.90 | %(d) | 1.61 | %(d) | 0.99 | %(d) | 1 | % | ||||||||||||||||
| (0.76 | ) | 15.72 | 3.84 | 15,142 | 1.28 | 3.65 | (0.54 | ) | 229 | |||||||||||||||||||||||
| — | 15.90 | 6.00 | 7,978 | 1.65 | (d) | 5.64 | (d) | (1.60 | )(d) | — | ||||||||||||||||||||||
| $ | (0.68 | ) | $ | 17.13 | 0.46 | % | $ | 1,515 | 1.26 | %(d) | 2.55 | %(d) | 0.62 | %(d) | 94 | % | ||||||||||||||||
| (1.09 | ) | 17.74 | (e) | 9.57 | (e) | 1,491 | 1.25 | 3.70 | 0.70 | 5 | ||||||||||||||||||||||
| — | 17.26 | 15.07 | 1,416 | 1.25 | (d) | 9.81 | (d) | 0.74 | (d) | 6 | ||||||||||||||||||||||
| $ | (0.66 | ) | $ | 16.79 | 0.05 | % | $ | 282 | 2.01 | %(d) | 3.32 | %(d) | (0.18 | )%(d) | 94 | % | ||||||||||||||||
| (1.12 | ) | 17.45 | (e) | 8.78 | (e) | 180 | 2.00 | 4.48 | (0.05 | ) | 5 | |||||||||||||||||||||
| — | 17.14 | 14.27 | 122 | 2.00 | (d) | 11.10 | (d) | (0.01 | )(d) | 6 | ||||||||||||||||||||||
| $ | (0.82 | ) | $ | 17.07 | 0.41 | % | $ | 358 | 1.26 | %(d) | 3.49 | %(d) | 0.67 | %(d) | 94 | % | ||||||||||||||||
| (1.02 | ) | 17.83 | (e) | 9.59 | (e) | 1,191 | 1.25 | 8.43 | 0.72 | 5 | ||||||||||||||||||||||
| — | 17.26 | 15.07 | 265 | 1.25 | (d) | 9.77 | (d) | 0.76 | (d) | 6 | ||||||||||||||||||||||
| $ | (0.71 | ) | $ | 17.27 | 0.53 | % | $ | 13 | 1.11 | %(d) | 2.22 | %(d) | 0.78 | %(d) | 94 | % | ||||||||||||||||
| (1.01 | ) | 17.90 | (e) | 9.77 | (e) | 13 | 1.10 | 3.38 | 0.85 | 5 | ||||||||||||||||||||||
| — | 17.29 | 15.27 | 12 | 1.11 | (d) | 8.71 | (d) | 0.96 | (d) | 6 | ||||||||||||||||||||||
| $ | (0.78 | ) | $ | 17.20 | 0.57 | % | $ | 13,945 | 1.01 | %(d) | 2.25 | %(d) | 0.86 | %(d) | 94 | % | ||||||||||||||||
| (1.05 | ) | 17.89 | (e) | 9.87 | (e) | 12,678 | 1.00 | 3.04 | 1.00 | 5 | ||||||||||||||||||||||
| — | 17.31 | 15.40 | 5,395 | 1.00 | (d) | 8.82 | (d) | 1.05 | (d) | 6 | ||||||||||||||||||||||
| (d) | Annualized. |
| (e) | Payments from Affiliates increased net asset value and total return by less than $0.01 and 0.01%, respectively. |
| See accompanying Notes to Financial Statements | | May 31, 2015 | | Semiannual Report | 277 |
Table of Contents
Financial Highlights (cont’d)
For a Share Outstanding for the Period ended:
| Net Asset Value, Beginning of Period | Net Investment Loss (a) | Net Realized and Change in Unrealized Gain (Loss) | Total from Investment Operations | Distributions from Net Realized Capital Gains | ||||||||||||||||||
| AllianzGI U.S. Small-Cap Growth: | ||||||||||||||||||||||
| Class A | ||||||||||||||||||||||
5/31/2015+ | $ | 17.45 | $ | (0.06 | ) | $ | 1.10 | $ | 1.04 | $ | (1.51 | ) | ||||||||||
11/30/2014 | 19.09 | (0.19 | ) | 0.36 | 0.17 | (1.81 | ) | |||||||||||||||
11/30/2013 | 13.25 | (0.15 | ) | 6.27 | 6.12 | (0.28 | ) | |||||||||||||||
11/30/2012 | 13.34 | (0.08 | ) | 0.98 | 0.90 | (0.99 | ) | |||||||||||||||
12/20/2010* - 11/30/2011 | 13.77 | (0.11 | ) | (0.32 | ) | (0.43 | ) | — | ||||||||||||||
| Class C | ||||||||||||||||||||||
5/31/2015+ | $ | 16.90 | $ | (0.13 | ) | $ | 1.07 | $ | 0.94 | $ | (1.51 | ) | ||||||||||
11/30/2014 | 18.68 | (0.31 | ) | 0.34 | 0.03 | (1.81 | ) | |||||||||||||||
11/30/2013 | 13.07 | (0.25 | ) | 6.14 | 5.89 | (0.28 | ) | |||||||||||||||
11/30/2012 | 13.25 | (0.18 | ) | 0.99 | 0.81 | (0.99 | ) | |||||||||||||||
12/20/2010* - 11/30/2011 | 13.77 | (0.22 | ) | (0.30 | ) | (0.52 | ) | — | ||||||||||||||
| Class D | ||||||||||||||||||||||
5/31/2015+ | $ | 17.47 | $ | (0.07 | ) | $ | 1.11 | $ | 1.04 | $ | (1.51 | ) | ||||||||||
11/30/2014 | 19.11 | (0.18 | ) | 0.35 | 0.17 | (1.81 | ) | |||||||||||||||
11/30/2013 | 13.25 | (0.11 | ) | 6.25 | 6.14 | (0.28 | ) | |||||||||||||||
11/30/2012 | 13.34 | (0.09 | ) | 0.99 | 0.90 | (0.99 | ) | |||||||||||||||
12/20/2010* - 11/30/2011 | 13.77 | (0.11 | ) | (0.32 | ) | (0.43 | ) | — | ||||||||||||||
| Class R | ||||||||||||||||||||||
5/31/2015+ | $ | 17.29 | $ | (0.08 | ) | $ | 1.09 | $ | 1.01 | $ | (1.51 | ) | ||||||||||
11/30/2014 | 18.98 | (0.22 | ) | 0.34 | 0.12 | (1.81 | ) | |||||||||||||||
11/30/2013 | 13.19 | (0.17 | ) | 6.24 | 6.07 | (0.28 | ) | |||||||||||||||
11/30/2012 | 13.31 | (0.11 | ) | 0.98 | 0.87 | (0.99 | ) | |||||||||||||||
12/20/2010* - 11/30/2011 | 13.77 | (0.15 | ) | (0.31 | ) | (0.46 | ) | — | ||||||||||||||
| Class P | ||||||||||||||||||||||
5/31/2015+ | $ | 17.64 | $ | (0.05 | ) | $ | 1.11 | $ | 1.06 | $ | (1.51 | ) | ||||||||||
11/30/2014 | 19.25 | (0.15 | ) | 0.35 | 0.20 | (1.81 | ) | |||||||||||||||
11/30/2013 | 13.32 | (0.11 | ) | 6.32 | 6.21 | (0.28 | ) | |||||||||||||||
11/30/2012 | 13.37 | (0.04 | ) | 0.98 | 0.94 | (0.99 | ) | |||||||||||||||
12/20/2010* - 11/30/2011 | 13.77 | (0.09 | ) | (0.31 | ) | (0.40 | ) | — | ||||||||||||||
| Institutional Class | ||||||||||||||||||||||
5/31/2015+ | $ | 17.71 | $ | (0.05 | ) | $ | 1.13 | $ | 1.08 | $ | (1.51 | ) | ||||||||||
11/30/2014 | 19.30 | (0.14 | ) | 0.36 | 0.22 | (1.81 | ) | |||||||||||||||
11/30/2013 | 13.35 | (0.08 | ) | 6.31 | 6.23 | (0.28 | ) | |||||||||||||||
11/30/2012 | 13.39 | (0.04 | ) | 0.99 | 0.95 | (0.99 | ) | |||||||||||||||
11/30/2011 | 12.84 | (0.07 | ) | 0.62 | 0.55 | — | ||||||||||||||||
11/30/2010 | 10.05 | (0.06 | ) | 2.85 | 2.79 | — | ||||||||||||||||
| + | Unaudited |
| * | Commencement of operations. |
| (a) | Calculated on average shares outstanding during the period. |
| 278 | Semiannual Report | | May 31, 2015 | | See accompanying Notes to Financial Statements |
Table of Contents
| Net Asset Value, End of Period | Total Return (b) | Net Assets, End of Period (000s) | Ratio of Expenses to Average Net Assets with Fee Waiver/ Reimbursement | Ratio of Expenses to Average Net Assets without Fee Waiver/ Reimbursement | Ratio of Net Investment Loss to Average Net Assets | Portfolio Turnover Rate | ||||||||||||||||||||||
| $ | 16.98 | 6.73 | % | $ | 3,561 | 1.40 | %(c) | 1.73 | %(c) | (0.78 | )%(c) | 43 | % | |||||||||||||||
| 17.45 | 1.31 | 3,277 | 1.44 | 1.89 | (1.05 | ) | 69 | |||||||||||||||||||||
| 19.09 | 47.16 | 4,971 | 1.50 | 1.91 | (0.90 | ) | 81 | |||||||||||||||||||||
| 13.25 | 7.67 | 1,359 | 1.50 | 2.45 | (0.59 | ) | 92 | |||||||||||||||||||||
| 13.34 | (3.12 | ) | 837 | 1.50 | (c) | 2.70 | (c) | (0.92 | )(c) | 111 | ||||||||||||||||||
| $ | 16.33 | 6.32 | % | $ | 671 | 2.20 | %(c) | 2.52 | %(c) | (1.59 | )%(c) | 43 | % | |||||||||||||||
| 16.90 | 0.53 | 661 | 2.20 | 2.69 | (1.81 | ) | 69 | |||||||||||||||||||||
| 18.68 | 46.03 | 606 | 2.21 | 2.73 | (1.57 | ) | 81 | |||||||||||||||||||||
| 13.07 | 6.99 | 228 | 2.22 | 3.16 | (1.35 | ) | 92 | |||||||||||||||||||||
| 13.25 | (3.78 | ) | 134 | 2.25 | (c) | 3.04 | (c) | (1.60 | )(c) | 111 | ||||||||||||||||||
| $ | 17.00 | 6.72 | % | $ | 122 | 1.42 | %(c) | 1.74 | %(c) | (0.80 | )%(c) | 43 | % | |||||||||||||||
| 17.47 | 1.31 | 117 | 1.42 | 1.92 | (1.01 | ) | 69 | |||||||||||||||||||||
| 19.11 | 47.32 | 68 | 1.44 | 2.00 | (0.71 | ) | 81 | |||||||||||||||||||||
| 13.25 | 7.67 | 57 | 1.49 | 2.36 | (0.65 | ) | 92 | |||||||||||||||||||||
| 13.34 | (3.12 | ) | 27 | 1.50 | (c) | 2.31 | (c) | (0.86 | )(c) | 111 | ||||||||||||||||||
| $ | 16.79 | 6.60 | % | $ | 26 | 1.65 | %(c) | 2.01 | %(c) | (1.03 | )%(c) | 43 | % | |||||||||||||||
| 17.29 | 1.03 | 29 | 1.66 | 2.20 | (1.26 | ) | 69 | |||||||||||||||||||||
| 18.98 | 46.99 | 26 | 1.67 | 2.16 | (1.03 | ) | 81 | |||||||||||||||||||||
| 13.19 | 7.44 | 10 | 1.70 | 2.60 | (0.84 | ) | 92 | |||||||||||||||||||||
| 13.31 | (3.34 | ) | 10 | 1.75 | (c) | 2.50 | (c) | (1.14 | )(c) | 111 | ||||||||||||||||||
| $ | 17.19 | 6.77 | % | $ | 331 | 1.25 | %(c) | 1.59 | %(c) | (0.63 | )%(c) | 43 | % | |||||||||||||||
| 17.64 | 1.47 | 214 | 1.25 | 1.76 | (0.84 | ) | 69 | |||||||||||||||||||||
| 19.25 | 47.60 | 110 | 1.25 | 1.74 | (0.69 | ) | 81 | |||||||||||||||||||||
| 13.32 | 7.97 | 19 | 1.25 | 2.25 | (0.27 | ) | 92 | |||||||||||||||||||||
| 13.37 | (2.90 | ) | 15 | 1.25 | (c) | 2.13 | (c) | (0.65 | )(c) | 111 | ||||||||||||||||||
| $ | 17.28 | 6.86 | % | $ | 40,735 | 1.16 | %(c) | 1.50 | %(c) | (0.54 | )%(c) | 43 | % | |||||||||||||||
| 17.71 | 1.57 | 33,231 | 1.16 | 1.66 | (0.76 | ) | 69 | |||||||||||||||||||||
| 19.30 | 47.64 | 29,116 | 1.16 | 1.69 | (0.48 | ) | 81 | |||||||||||||||||||||
| 13.35 | 8.05 | 20,140 | 1.15 | 2.09 | (0.29 | ) | 92 | |||||||||||||||||||||
| 13.39 | 4.28 | 20,862 | 1.15 | 1.99 | (0.53 | ) | 111 | |||||||||||||||||||||
| 12.84 | 27.76 | 20,079 | 1.19 | 1.71 | (0.57 | ) | 168 | |||||||||||||||||||||
| (b) | Total return is calculated assuming a purchase of a share on the first day of the period and a sale of a share on the last day of each period reported. Dividends and distributions, if any, are assumed, for purposes of this calculation, to be reinvested. Total return does not reflect sales charges and includes the effect of fee waivers and reimbursements. Total return may reflect adjustments to conform to U.S. GAAP. Total return for a period of less than one year is not annualized. |
| (c) | Annualized. |
| See accompanying Notes to Financial Statements | | May 31, 2015 | | Semiannual Report | 279 |
Table of Contents
Financial Highlights (cont’d)
For a Share Outstanding for the Period ended:
| Net Asset Value, Beginning of Period | Net Investment Loss (a) | Net Realized and Change in Unrealized Gain (Loss) | Total from Investment Operations | Distributions from Net Realized Capital Gains | ||||||||||||||||||
| AllianzGI Ultra Micro Cap: | ||||||||||||||||||||||
| Class A | ||||||||||||||||||||||
5/31/2015+ | $ | 23.75 | $ | (0.21 | ) | $ | 2.15 | $ | 1.94 | $ | (0.21 | ) | ||||||||||
11/30/2014 | 24.34 | (0.44 | ) | (0.04 | ) | (0.48 | ) | (0.11 | ) | |||||||||||||
11/30/2013 | 15.53 | (0.29 | ) | 9.11 | 8.82 | (0.01 | ) | |||||||||||||||
12/19/2011* - 11/30/2012 | 12.82 | (0.14 | ) | 2.85 | 2.71 | — | ||||||||||||||||
| Class P | ||||||||||||||||||||||
5/31/2015+ | $ | 23.86 | $ | (0.17 | ) | $ | 2.15 | $ | 1.98 | $ | (0.21 | ) | ||||||||||
11/30/2014 | 24.40 | (0.39 | ) | (0.04 | ) | (0.43 | ) | (0.11 | ) | |||||||||||||
11/30/2013 | 15.54 | (0.24 | ) | 9.11 | 8.87 | (0.01 | ) | |||||||||||||||
11/30/2012 | 13.26 | (0.20 | ) | 2.71 | 2.51 | (0.23 | ) | |||||||||||||||
12/27/2010* - 11/30/2011 | 13.80 | (0.29 | ) | (0.22 | ) | (0.51 | ) | (0.03 | ) | |||||||||||||
| Institutional Class | ||||||||||||||||||||||
5/31/2015+ | $ | 23.93 | $ | (0.20 | ) | $ | 2.16 | $ | 1.96 | $ | (0.21 | ) | ||||||||||
11/30/2014 | 24.49 | (0.40 | ) | (0.05 | ) | (0.45 | ) | (0.11 | ) | |||||||||||||
11/30/2013 | 15.59 | (0.26 | ) | 9.17 | 8.91 | (0.01 | ) | |||||||||||||||
11/30/2012 | 13.29 | (0.19 | ) | 2.72 | 2.53 | (0.23 | ) | |||||||||||||||
11/30/2011 | 13.25 | (0.29 | ) | 1.08 | 0.79 | (0.75 | ) | |||||||||||||||
11/30/2010 | 8.93 | (0.22 | ) | 4.54 | 4.32 | — | ||||||||||||||||
| + | Unaudited |
| * | Commencement of operations. |
| (a) | Calculated on average shares outstanding during the period. |
| (b) | Total return is calculated assuming a purchase of a share on the first day of the period and a sale of a share on the last day of each period reported. Dividends and distributions, if any, are assumed, for purposes of this calculation, to be reinvested. Total return does not reflect sales charges and includes the effect of fee waivers and reimbursements. Total return may reflect adjustments to conform to U.S. GAAP. Total return for a period of less than one year is not annualized. |
| (c) | Annualized. |
| 280 | Semiannual Report | | May 31, 2015 | | See accompanying Notes to Financial Statements |
Table of Contents
| Net Asset Value, End of Period | Total Return (b) | Net Assets, End of Period (000s) | Ratio of Expenses to Average Net Assets with Fee Waiver/ Reimbursement | Ratio of Expenses to Average Net Assets without Fee Waiver/ Reimbursement | Ratio of Net Investment Loss to Average Net Assets | Portfolio Turnover Rate | ||||||||||||||||||||||
| $ | 25.48 | 8.24 | % | $ | 48,395 | 2.09 | %(c) | 2.09 | %(c) | (1.70 | )%(c) | 23 | % | |||||||||||||||
| 23.75 | (1.98 | ) | 53,192 | 2.16 | 2.16 | (1.81 | ) | 66 | ||||||||||||||||||||
| 24.34 | 56.82 | 61,525 | 2.20 | 2.30 | (1.41 | ) | 59 | |||||||||||||||||||||
| 15.53 | 21.14 | 6,862 | 2.36 | (c) | 3.36 | (c) | (0.96 | )(c) | 114 | |||||||||||||||||||
| $ | 25.63 | 8.38 | % | $ | 8,762 | 1.81 | %(c) | 1.81 | %(c) | (1.42 | )%(c) | 23 | % | |||||||||||||||
| 23.86 | (1.77 | ) | 10,561 | 1.94 | 1.94 | (1.67 | ) | 66 | ||||||||||||||||||||
| 24.40 | 57.10 | 858 | 2.01 | 2.07 | (1.19 | ) | 59 | |||||||||||||||||||||
| 15.54 | 19.26 | 252 | 2.18 | 3.08 | (1.38 | ) | 114 | |||||||||||||||||||||
| 13.26 | (3.64 | ) | 230 | 2.41 | (c) | 3.48 | (c) | (2.23 | )(c) | 101 | ||||||||||||||||||
| $ | 25.68 | 8.27 | % | $ | 45,037 | 2.00 | %(c) | 2.00 | %(c) | (1.62 | )%(c) | 23 | % | |||||||||||||||
| 23.93 | (1.84 | ) | 49,525 | 2.00 | 2.00 | (1.65 | ) | 66 | ||||||||||||||||||||
| 24.49 | 57.18 | 62,641 | 2.00 | 2.00 | (1.24 | ) | 59 | |||||||||||||||||||||
| 15.59 | 19.37 | 9,296 | 2.08 | 3.15 | (1.32 | ) | 114 | |||||||||||||||||||||
| 13.29 | 6.04 | 9,757 | 2.24 | 3.53 | (2.06 | ) | 101 | |||||||||||||||||||||
| 13.25 | 48.38 | 4,629 | 2.29 | 5.40 | (1.99 | ) | 123 | |||||||||||||||||||||
| See accompanying Notes to Financial Statements | | May 31, 2015 | | Semiannual Report | 281 |
Table of Contents
May 31, 2015 (Unaudited)
| 1. | ORGANIZATION AND SIGNIFICANT ACCOUNTING POLICIES |
Allianz Funds Multi-Strategy Trust (the “Trust”) was organized on January 10, 2008, as an open-end registered investment management company organized as a Massachusetts business trust, and accordingly, follows the investment company accounting and reporting guidance of the Financial Accounting Standards Board (“FASB”) Accounting Standards Codification (“ASC”) Topic 946 Financial Services-Investment Companies. As of May 31, 2015, the Trust consisted of forty-two separate investment series (each a “Fund” and collectively the “Funds”). Allianz Global Investors Fund Management LLC (“AGIFM” or the “Investment Manager”) serves as the Funds’ investment manager and Allianz Global Investors U.S. LLC (“AllianzGI U.S.”) and NFJ Investment Group LLC (“NFJ”), each an affiliate of the Investment Manager, and Fuller & Thaler Asset Management, Inc. (“Fuller & Thaler”) (collectively the “Sub-Advisers”) serve as the Funds’ sub-advisers. The Investment Manager, AllianzGI U.S. and NFJ are indirect, wholly-owned subsidiaries of Allianz Asset Management of America L.P. (“AAM”). AAM is an indirect, wholly-owned subsidiary of Allianz SE, a publicly traded European insurance and financial services company. Currently, the Trust may offer up to eight classes of shares: A, C, D, R, P, Institutional, R6 and Administrative. As of November 1, 2009, Class B shares were no longer available for purchase, except through exchanges and dividend reinvestments. Effective January 16, 2014, shares of AllianzGI Convertible and shares of AllianzGI Ultra Micro Cap are no longer available for purchase by any new investor, and shareholders of other series of the Trust or series of Allianz Funds are no longer permitted to exchange any of their shares for shares of AllianzGI Convertible or AllianzGI Ultra Micro Cap, with certain exceptions.
The following Funds sold and issued shares of beneficial interest to Allianz Funds Investments, Inc. (“AFI”) during the six months ended May 31, 2015 and year ended November 30, 2014. AFI is an indirect, wholly-owned subsidiary of Allianz SE.
| AllianzGI Global Megatrends | ||||||||||||
| Class | Date | Shares | Amount | |||||||||
A | 2/2/15 | 667 | $ | 10,000 | ||||||||
P | 2/2/15 | 666 | 10,000 | |||||||||
Institutional | 2/2/15 | 200,000 | 3,000,000 | |||||||||
| 201,333 | $ | 3,020,000 | ||||||||||
| AllianzGI Best Styles Emerging Markets Equity | ||||||||||||
| Class | Date | Shares | Amount | |||||||||
P | 12/9/14 | 666 | $ | 10,000 | ||||||||
Institutional | 12/9/14 | 667 | 10,000 | |||||||||
Class R6 | 12/9/14 | 333,333 | 5,000,000 | |||||||||
| 334,666 | $ | 5,020,000 | ||||||||||
| AllianzGI Best Styles Global Equity | ||||||||||||
| Class | Date | Shares | Amount | |||||||||
A | 9/2/14 | 606 | $ | 10,000 | ||||||||
P | 12/22/14 | 641 | 10,000 | |||||||||
Institutional | 9/2/14 | 606 | 10,000 | |||||||||
Class R6 | 12/2/13 | 333,333 | 5,000,000 | |||||||||
| 335,186 | $ | 5,030,000 | ||||||||||
| AllianzGI Best Styles International Equity | ||||||||||||
| Class | Date | Shares | Amount | |||||||||
P | 12/9/14 | 666 | $ | 10,000 | ||||||||
Institutional | 12/9/14 | 667 | 10,000 | |||||||||
Class R6 | 12/9/14 | 333,333 | 5,000,000 | |||||||||
| 334,666 | $ | 5,020,000 | ||||||||||
| AllianzGI Best Styles U.S. Equity | ||||||||||||
| Class | Date | Shares | Amount | |||||||||
P | 12/1/14 | 666 | $ | 10,000 | ||||||||
Institutional | 12/1/14 | 667 | 10,000 | |||||||||
Class R6 | 12/1/14 | 200,000 | 3,000,000 | |||||||||
| 201,333 | $ | 3,020,000 | ||||||||||
| AllianzGI Emerging Markets Consumer | ||||||||||||
| Class | Date | Shares | Amount | |||||||||
A | 12/1/14 | 667 | $ | 10,000 | ||||||||
Institutional | 12/1/14 | 200,000 | 3,000,000 | |||||||||
| 200,667 | $ | 3,010,000 | ||||||||||
| AllianzGI Emerging Markets Debt | ||||||||||||
| Class | Date | Shares | Amount | |||||||||
A | 9/15/14 | 667 | $ | 10,000 | ||||||||
C | 9/15/14 | 666 | 10,000 | |||||||||
P | 9/15/14 | 667 | 10,000 | |||||||||
Institutional | 9/15/14 | 2,000,000 | 30,000,000 | |||||||||
| 2,002,000 | $ | 30,030,000 | ||||||||||
| AllianzGI Emerging Markets Small-Cap | ||||||||||||
| Class | Date | Shares | Amount | |||||||||
A | 12/1/14 | 667 | $ | 10,000 | ||||||||
Institutional | 12/1/14 | 200,000 | 3,000,000 | |||||||||
| 200,667 | $ | 3,010,000 | ||||||||||
| AllianzGI Europe Equity Dividend | ||||||||||||
| Class | Date | Shares | Amount | |||||||||
A | 2/2/15 | 667 | $ | 10,000 | ||||||||
C | 2/2/15 | 667 | 10,000 | |||||||||
P | 2/2/15 | 666 | 10,000 | |||||||||
Institutional | 2/2/15 | 200,000 | 3,000,000 | |||||||||
| 202,000 | $ | 3,030,000 | ||||||||||
| 282 | May 31, 2015 | | Semiannual Report |
Table of Contents
| AllianzGI Global Sustainability | ||||||||||||
| Class | Date | Shares | Amount | |||||||||
A | 12/9/14 | 667 | $ | 10,000 | ||||||||
P | 12/9/14 | 666 | 10,000 | |||||||||
Institutional | 12/9/14 | 200,000 | 3,000,000 | |||||||||
| 201,333 | $ | 3,020,000 | ||||||||||
| AllianzGI International Growth | ||||||||||||
| Class | Date | Shares | Amount | |||||||||
A | 2/2/15 | 667 | $ | 10,000 | ||||||||
Institutional | 2/2/15 | 200,000 | 3,000,000 | |||||||||
| 200,667 | $ | 3,010,000 | ||||||||||
The investment objective of each of AllianzGI Retirement 2015, AllianzGI Retirement 2020, AllianzGI Retirement 2025, AllianzGI Retirement 2030, AllianzGI Retirement 2035, AllianzGI Retirement 2040, AllianzGI Retirement 2045, AllianzGI Retirement 2050 and AllianzGI Retirement 2055 is to seek capital growth and preservation consistent with its asset allocation as the target date in the Fund name approaches, and thereafter current income, and secondarily, capital appreciation. AllianzGI Retirement Income’s investment objective is to seek current income and secondarily, capital appreciation. AllianzGI Global Allocation’s investment objective is to seek after-inflation capital appreciation and current income. The investment objective of AllianzGI Global Dynamic Allocation is to seek after-inflation capital appreciation and, secondarily, current income. The investment objective of AllianzGI Global Megatrends, AllianzGI Behavioral Advantage Large Cap, AllianzGI Best Styles Emerging Markets Equity, AllianzGI Best Styles Global Equity, AllianzGI Best Styles International Equity, AllianzGI Best Styles U.S. Equity, AllianzGI China Equity, AllianzGI Emerging Markets Consumer, AllianzGI Emerging Markets Small-Cap, AllianzGI Europe Equity Dividend, AllianzGI Global Managed Volatility, AllianzGI Global Sustainability, AllianzGI Global Water, AllianzGI International Growth, AllianzGI NFJ Emerging Markets Value, AllianzGI NFJ International Small-Cap Value, AllianzGI NFJ International Value II and AllianzGI Structured Return is to seek long-term capital appreciation. AllianzGI Convertible’s investment objective is to seek maximum total return, consisting of capital appreciation and current income. AllianzGI Emerging Markets Debt’s investment objective is to seek long-term capital appreciation and current income. AllianzGI Global Fundamental Strategy’s investment objective is to seek to generate positive real absolute returns through a complete market cycle (rolling 3-year period) by investing in a broad range of global asset classes. AllianzGI High Yield Bond’s investment objective is to seek a high level of current income and capital growth. The investment objective of AllianzGI Short Duration High Income is to seek a high level of current income with lower volatility than the broader high yield market. The investment objective of AllianzGI International Small-Cap, AllianzGI Micro Cap, AllianzGI U.S. Small-Cap Growth and AllianzGI Ultra Micro Cap is to seek maximum long-term capital appreciation. AllianzGI NFJ Global Dividend Value’s investment objective is to seek long-term growth of capital and income. The investment objective of AllianzGI Multi-Asset Real Return is to seek
long-term capital appreciation emphasizing inflation-adjusted returns. The investment objective of AllianzGI U.S. Equity Hedged is to seek capital appreciation, with added emphasis on the protection of capital during unfavorable market conditions. There can be no assurance that the Funds will meet their stated objectives.
The preparation of the Funds’ financial statements in accordance with accounting principles generally accepted in the United States of America (“U.S. GAAP”) requires the Funds’ management to make estimates and assumptions that affect the reported amounts and disclosures in each Fund’s financial statements. Actual results could differ from those estimates.
In the normal course of business, the Funds enter into contracts that contain a variety of representations that provide general indemnifications. The Funds’ maximum exposure under these arrangements is unknown as this would involve future claims that may be made against the Funds that have not yet occurred.
In June 2014, the FASB issued an Accounting Standards Update (“ASU”) 2014-11 that expands secured borrowing accounting for certain repurchase agreements. ASU 2014-11 also sets forth additional disclosure requirements for certain transactions accounted for as sales, in order to provide financial statement users with information to compare to similar transactions accounted for as secured borrowings. ASU 2014-11 became effective for annual periods beginning after December 15, 2014, and for interim periods beginning after March 15, 2015. The adoption of ASU 2014-11 did not have an impact on the Funds’ financial statements.
In April 2015, the FASB issued ASU 2015-7, disclosures for investments in certain entities that calculate net asset value per share (“NAV”) (or its equivalent), modifying ASC 946 Financial Services Investment Companies. Under the modifications, investments in affiliated and private investment funds valued at NAV are no longer included in the fair value hierarchy. ASU 2015-7 is effective prospectively during interim or annual periods beginning after December 15, 2014. At this time, management is evaluating the implications of these changes on the Funds’ financial statements.
The following is a summary of significant accounting policies consistently followed by the Funds:
(a) Valuation of Investments. Portfolio securities and other financial instruments for which market quotations are readily available are stated at market value. Market value is generally determined on the basis of official closing prices, last reported sales prices, or if no sales or closing prices are reported, on the basis of quotes obtained from a quotation reporting system, established market makers, or independent pricing services. Investments in mutual funds are valued at the NAV as reported on each business day. The Funds’ investments are valued daily using prices supplied by an independent pricing service or broker/dealer quotations, or by using the last sale or settlement price on the exchange that is the primary market for such securities, or the mean between the last bid and ask quotations. The market value for NASDAQ Global Market and NASDAQ Capital Market
| Semiannual Report | | May 31, 2015 | 283 |
Table of Contents
Notes to Financial Statements (cont’d)
May 31, 2015 (Unaudited)
securities may also be calculated using the NASDAQ Official Closing Price instead of the last reported sales price. Independent pricing services use information provided by market makers or estimates of market values obtained from yield data relating to investments or securities with similar characteristics. Exchange traded futures are valued at the price determined by the relevant exchange. Securities purchased on a when-issued or delayed-delivery basis are marked to market daily until settlement at the forward settlement date.
The Board of Trustees (the “Board”) has adopted procedures for valuing portfolio securities and other financial instruments in circumstances where market quotations are not readily available, and has delegated primary responsibility for applying the valuation methods to the Investment Manager and the Sub-Advisers. The Trust’s Valuation Committee was established by the Board to oversee the implementation of the Funds’ valuation methods and to make fair value determinations on behalf of the Board, as instructed by the Board. Each Sub-Adviser monitors the continued appropriateness of methods applied and identifies to the Investment Manager circumstances and events that may require fair valuation. The Investment Manager, in turn, determines if adjustments should be made in light of market changes, events affecting the issuer or other factors. If the Investment Manager (in consultation with the Sub-Adviser) determines that a valuation method may no longer be appropriate, another valuation method may be selected or the Valuation Committee will be convened to consider the matter and take any appropriate action in accordance with procedures set forth by the Board. The Board shall review and ratify the appropriateness of the valuation methods and these methods may be amended or supplemented from time to time by the Valuation Committee.
Short-term debt instruments maturing in 60 days or less are valued at amortized cost, if their original term to maturity was 60 days or less, or by amortizing premium or discount based on their value on the 61st day prior to maturity, if the original term to maturity exceeded 60 days.
Investments initially valued in currencies other than the U.S. dollar are converted to the U.S. dollar using exchange rates obtained from pricing services. As a result, the NAV of each share class of a Fund may be affected by changes in the value of currencies in relation to the U.S. dollar. The value of securities traded in markets outside the United States or denominated in currencies other than the U.S. dollar may be affected significantly on a day that the New York Stock Exchange (“NYSE”) is closed.
The prices used by the Funds to value investments may differ from the value that would be realized if the investments were sold, and these differences could be material to the Funds’ financial statements. The NAV of each share class of a Fund is normally determined as of the close of regular trading (normally, 4:00 p.m. Eastern time) on the NYSE on each day the NYSE is open for business.
The prices of certain portfolio securities or financial instruments may be determined at a time prior to the close of regular trading on the NYSE. When fair-valuing the securities, the Funds may, among other things, consider significant events (which may be considered to
include changes in the value of U.S. securities or securities indices) that occur after the close of the relevant market and before the time the NAV of each share class of a Fund is calculated. With respect to certain foreign securities, the Funds may fair-value securities using modeling tools provided by third-party vendors. The Funds have retained a statistical research service to assist in determining the fair value of foreign securities. This service utilizes statistics and programs based on historical performance of markets and other economic data to assist in making fair value estimates. Fair value estimates used by the Funds for foreign securities may differ from the value realized from the sale of those securities and the difference could be material to the financial statements. Fair value pricing may require subjective determinations about the value of a security or other assets, and fair values used to determine the NAV of each share class of a Fund may differ from quoted or published prices, or from prices that are used by others, for the same investments. In addition, the use of fair value pricing may not always result in adjustments to the prices of securities or other assets held by a Fund.
(b) Fair Value Measurements. Fair value is defined as the price that would be received to sell an asset or paid to transfer a liability (i.e. the “exit price”) in an orderly transaction between market participants. The three levels of the fair value hierarchy are described below:
| n | Level 1—quoted prices in active markets for identical investments that the Funds have the ability to access |
| n | Level 2—valuations based on other significant observable inputs, which may include, but are not limited to, quoted prices for similar assets or liabilities, interest rates, yield curves, volatilities, prepayment speeds, loss severities, credit risks and default rates or other market corroborated inputs |
| n | Level 3—valuations based on significant unobservable inputs (including the Sub-Advisers’ or Valuation Committee’s own assumptions and securities whose price was determined by using a single broker’s quote) |
The valuation techniques used by the Funds to measure fair value during the period or six months ended May 31, 2015 were intended to maximize the use of observable inputs and to minimize the use of unobservable inputs.
The Funds’ policy is to recognize transfers between levels at the end of the reporting period. An investment asset’s or liability’s level within the fair value hierarchy is based on the lowest level input, individually or in aggregate, that is significant to the fair value measurement. The objective of fair value measurement remains the same even when there is a significant decrease in the volume and level of activity for an asset or liability and regardless of the valuation techniques used. Investments categorized as Level 1 or 2 as of period end may have been transferred between Levels 1 and 2 since the prior period due to changes in the valuation method utilized in valuing the investments.
The inputs or methodology used for valuing securities are not necessarily an indication of the risk associated with investing in those securities. The following are certain inputs and techniques that the Funds generally use to evaluate how to classify each major category of assets and liabilities within Level 2 and Level 3, in accordance with U.S. GAAP.
| 284 | May 31, 2015 | | Semiannual Report |
Table of Contents
Equity Securities (Common and Preferred Stock)—Equity securities traded in inactive markets and certain foreign equity securities are valued using inputs which include broker-dealer quotes, recently executed transactions adjusted for changes in the benchmark index, or evaluated price quotes received from independent pricing services that take into account the integrity of the market sector and issuer, the individual characteristics of the security, and information received from broker-dealers and other market sources pertaining to the issuer or security. To the extent that these inputs are observable, the values of equity securities are categorized as Level 2. To the extent that these inputs are unobservable, the values are categorized as Level 3.
U.S. Treasury Obligations—U.S. Treasury obligations are valued by independent pricing services based on pricing models that evaluate the mean between the most recently quoted bid and ask price. The models also take into consideration data received from active market makers and broker-dealers, yield curves, and the spread over comparable U.S. Treasury issues. The spreads change daily in response to market conditions and are generally obtained from the new issue market and broker-dealer sources. To the extent that these inputs are observable, the values of U.S. Treasury obligations are categorized as Level 2. To the extent that these inputs are unobservable, the values are categorized as Level 3.
Government Sponsored Enterprise and Mortgage-Backed Securities—Government sponsored enterprise and mortgage-backed securities are valued by independent pricing services using pricing models based on inputs that include issuer type, coupon, cash flows, mortgage prepayment projection tables and Adjustable Rate Mortgage evaluations that incorporate index data, periodic life caps and the next coupon reset date. To the extent that these inputs are observable, the values of government sponsored enterprise and mortgage-backed securities are categorized as Level 2. To the extent that these inputs are unobservable, the values are categorized as Level 3.
Sovereign Debt Obligations—Sovereign debt obligations are valued by independent pricing services based on discounted cash flow models that incorporate option adjusted spreads along with benchmark curves and credit spreads. In addition, international bond markets are monitored regularly for information pertaining to the issuer and/or the specific issue. To the extent that these inputs are observable, the values of sovereign debt obligations are categorized as Level 2. To the extent that these inputs are unobservable, the values are categorized as Level 3.
Corporate Bonds & Notes—Corporate bonds & notes are generally comprised of two main categories: investment grade bonds and high yield bonds. Investment grade bonds are valued by independent pricing services using various inputs and techniques, which include broker-dealer quotations, live trading levels, recently executed transactions in securities of the issuer or comparable issuers, and option adjusted spread models that include base curve and spread curve inputs. Adjustments to individual bonds can be applied to recognize trading differences compared to other bonds issued by the
same issuer. High yield bonds are valued by independent pricing services based primarily on broker-dealer quotations from relevant market makers and recently executed transactions in securities of the issuer or comparable issuers. The broker-dealer quotations received are supported by credit analysis of the issuer that takes into consideration credit quality assessments, daily trading activity, and the activity of the underlying equities, listed bonds and sector-specific trends. To the extent that these inputs are observable, the values of corporate bonds & notes are categorized as Level 2. To the extent that these inputs are unobservable, the values are categorized as Level 3.
Convertible Bonds—Convertible bonds are valued by independent pricing services based on various inputs and techniques, which include broker-dealer quotations from relevant market makers and recently executed transactions in securities of the issuer or comparable issuers. The broker-dealer quotations received are supported by credit analysis of the issuer that takes into consideration credit quality assessments, daily trading activity, and the activity of the underlying equities, listed bonds and sector-specific trends. To the extent that these inputs are observable, the values of convertible bonds are categorized as Level 2. To the extent that these inputs are unobservable, the values are categorized as Level 3.
Option Contracts—Option contracts traded over-the-counter (“OTC”) and FLexible EXchange (“FLEX”) options are valued by independent pricing services based on pricing models that incorporate various inputs such as interest rates, credit spreads, currency exchange rates and volatility measurements for in-the-money, at-the-money, and out-of-the-money contracts based on a given strike price. To the extent that these inputs are observable, the values of OTC and FLEX option contracts are categorized as Level 2. To the extent that these inputs are unobservable, the values are categorized as Level 3.
Forward Foreign Currency Contracts—Forward foreign currency contracts are valued by independent pricing services using various inputs and techniques, which include broker-dealer quotations, actual trading information and foreign currency exchange rates gathered from leading market makers and foreign currency exchange trading centers throughout the world. To the extent that these inputs are observable, the values of forward foreign currency contracts are categorized as Level 2. To the extent that these inputs are unobservable, the values are categorized as Level 3.
Credit Default Swaps—OTC credit default swaps are valued by independent pricing services using pricing models that take into account, among other factors, information received from market makers and broker/dealers, default probabilities from index specific credit spread curves, recovery rates, and cash flows. To the extent that these inputs are observable, the values of credit default swaps are categorized as Level 2. To the extent that these inputs are unobservable, the values are categorized as Level 3.
Senior Loans—Senior Loans are valued by independent pricing services based on the average of quoted prices received from multiple dealers or valued relative to other benchmark securities when broker-dealer quotes are unavailable. These quoted prices are based on
| Semiannual Report | | May 31, 2015 | 285 |
Table of Contents
Notes to Financial Statements (cont’d)
May 31, 2015 (Unaudited)
interest rates, yield curves, option adjusted spreads and credit spreads. To the extent that these inputs are observable, the values of Senior Loans are categorized as Level 2. To the extent that these inputs are unobservable, the values are categorized as Level 3.
A summary of the inputs used at May 31, 2015 in valuing each Fund’s assets and liabilities is listed below (refer to the Schedules of Investments and Notes 7(a), 7(b) and 7(c) for more detailed information on Investments in Securities and Other Financial Instruments):
| AllianzGI Retirement 2015: | ||||||||||||||||
| Investments in Securities – Assets | Level 1– Quoted Prices | Level 2– Other Significant Observable Inputs | Level 3– Significant Unobservable Inputs | Value at 5/31/15 | ||||||||||||
Mutual Funds | $ | 21,508,415 | — | — | $ | 21,508,415 | ||||||||||
Exchange-Traded Funds | 6,797,336 | — | — | 6,797,336 | ||||||||||||
Repurchase Agreements | — | $ | 165,000 | — | 165,000 | |||||||||||
Totals | $ | 28,305,751 | $ | 165,000 | — | $ | 28,470,751 | |||||||||
| AllianzGI Retirement 2020: | ||||||||||||||||
| Investments in Securities – Assets | Level 1– Quoted Prices | Level 2– Other Significant Observable Inputs | Level 3– Significant Unobservable Inputs | Value at 5/31/15 | ||||||||||||
Mutual Funds | $ | 48,924,511 | — | — | $ | 48,924,511 | ||||||||||
Exchange-Traded Funds | 14,621,388 | — | — | 14,621,388 | ||||||||||||
Repurchase Agreements | — | $ | 379,000 | — | 379,000 | |||||||||||
Totals | $ | 63,545,899 | $ | 379,000 | — | $ | 63,924,899 | |||||||||
| AllianzGI Retirement 2025: | ||||||||||||||||
| Investments in Securities – Assets | Level 1– Quoted Prices | Level 2– Other Significant Observable Inputs | Level 3– Significant Unobservable Inputs | Value at 5/31/15 | ||||||||||||
Mutual Funds | $ | 54,356,760 | — | — | $ | 54,356,760 | ||||||||||
Exchange-Traded Funds | 13,832,602 | — | — | 13,832,602 | ||||||||||||
Repurchase Agreements | — | $ | 805,000 | — | 805,000 | |||||||||||
Totals | $ | 68,189,362 | $ | 805,000 | — | $ | 68,994,362 | |||||||||
| AllianzGI Retirement 2030: | ||||||||||||||||
| Investments in Securities – Assets | Level 1– Quoted Prices | Level 2– Other Significant Observable Inputs | Level 3– Significant Unobservable Inputs | Value at 5/31/15 | ||||||||||||
Mutual Funds | $ | 55,727,464 | — | — | $ | 55,727,464 | ||||||||||
Exchange-Traded Funds | 10,833,903 | — | — | 10,833,903 | ||||||||||||
Repurchase Agreements | — | $ | 803,000 | — | 803,000 | |||||||||||
Totals | $ | 66,561,367 | $ | 803,000 | — | $ | 67,364,367 | |||||||||
| AllianzGI Retirement 2035: | ||||||||||||||||
| Investments in Securities – Assets | Level 1– Quoted Prices | Level 2– Other Significant Observable Inputs | Level 3– Significant Unobservable Inputs | Value at 5/31/15 | ||||||||||||
Mutual Funds | $ | 47,717,035 | — | — | $ | 47,717,035 | ||||||||||
Exchange-Traded Funds | 6,883,898 | — | — | 6,883,898 | ||||||||||||
Repurchase Agreements | — | $ | 592,000 | — | 592,000 | |||||||||||
Totals | $ | 54,600,933 | $ | 592,000 | — | $ | 55,192,933 | |||||||||
| 286 | May 31, 2015 | | Semiannual Report |
Table of Contents
| AllianzGI Retirement 2040: | ||||||||||||||||
| Investments in Securities – Assets | Level 1– Quoted Prices | Level 2– Other Significant Observable Inputs | Level 3– Significant Unobservable Inputs | Value at 5/31/15 | ||||||||||||
Mutual Funds | $ | 40,234,076 | — | — | $ | 40,234,076 | ||||||||||
Exchange-Traded Funds | 3,081,552 | — | — | 3,081,552 | ||||||||||||
Repurchase Agreements | — | $ | 463,000 | — | 463,000 | |||||||||||
Totals | $ | 43,315,628 | $ | 463,000 | — | $ | 43,778,628 | |||||||||
| AllianzGI Retirement 2045: | ||||||||||||||||
| Investments in Securities – Assets | Level 1– Quoted Prices | Level 2– Other Significant Observable Inputs | Level 3– Significant Unobservable Inputs | Value at 5/31/15 | ||||||||||||
Mutual Funds | $ | 22,482,132 | — | — | $ | 22,482,132 | ||||||||||
Exchange-Traded Funds | 1,596,971 | — | — | 1,596,971 | ||||||||||||
Repurchase Agreements | — | $ | 270,000 | — | 270,000 | |||||||||||
Totals | $ | 24,079,103 | $ | 270,000 | — | $ | 24,349,103 | |||||||||
| AllianzGI Retirement 2050: | ||||||||||||||||
| Investments in Securities – Assets | Level 1– Quoted Prices | Level 2– Other Significant Observable Inputs | Level 3– Significant Unobservable Inputs | Value at 5/31/15 | ||||||||||||
Mutual Funds | $ | 19,280,333 | — | — | $ | 19,280,333 | ||||||||||
Exchange-Traded Funds | 1,239,045 | — | — | 1,239,045 | ||||||||||||
Repurchase Agreements | — | $ | 269,000 | — | 269,000 | |||||||||||
Totals | $ | 20,519,378 | $ | 269,000 | — | $ | 20,788,378 | |||||||||
| AllianzGI Retirement 2055: | ||||||||||||||||
| Investments in Securities – Assets | Level 1– Quoted Prices | Level 2– Other Significant Observable Inputs | Level 3– Significant Unobservable Inputs | Value at 5/31/15 | ||||||||||||
Mutual Funds | $ | 7,915,328 | — | — | $ | 7,915,328 | ||||||||||
Exchange-Traded Funds | 457,062 | — | — | 457,062 | ||||||||||||
Repurchase Agreements | — | $ | 102,000 | — | 102,000 | |||||||||||
Totals | $ | 8,372,390 | $ | 102,000 | — | $ | 8,474,390 | |||||||||
| AllianzGI Retirement Income: | ||||||||||||||||
| Investments in Securities – Assets | Level 1– Quoted Prices | Level 2– Other Significant Observable Inputs | Level 3– Significant Unobservable Inputs | Value at 5/31/15 | ||||||||||||
Mutual Funds | $ | 18,825,598 | — | — | $ | 18,825,598 | ||||||||||
Exchange-Traded Funds | 5,944,484 | — | — | 5,944,484 | ||||||||||||
Repurchase Agreements | — | $ | 213,000 | — | 213,000 | |||||||||||
Totals | $ | 24,770,082 | $ | 213,000 | — | $ | 24,983,082 | |||||||||
| AllianzGI Global Allocation: | ||||||||||||||||
| Investments in Securities – Assets | Level 1– Quoted Prices | Level 2– Other Significant Observable Inputs | Level 3– Significant Unobservable Inputs | Value at 5/31/15 | ||||||||||||
Mutual Funds | $ | 160,602,311 | — | — | $ | 160,602,311 | ||||||||||
Exchange-Traded Funds | 29,773,887 | — | — | 29,773,887 | ||||||||||||
Repurchase Agreements | — | $ | 10,601,000 | — | 10,601,000 | |||||||||||
| 190,376,198 | 10,601,000 | — | 200,977,198 | |||||||||||||
| Semiannual Report | | May 31, 2015 | 287 |
Table of Contents
Notes to Financial Statements (cont’d)
May 31, 2015 (Unaudited)
| AllianzGI Global Allocation (cont’d) | ||||||||||||||||
| Other Financial Instruments* – Assets | Level 1– Quoted Prices | Level 2– Other Significant Observable Inputs | Level 3– Significant Unobservable Inputs | Value at 5/31/15 | ||||||||||||
Foreign Exchange Contracts | — | $ | 87,200 | — | $ | 87,200 | ||||||||||
Interest Rate Contracts | $ | 202,225 | — | — | 202,225 | |||||||||||
Market Price | 348,654 | — | — | 348,654 | ||||||||||||
| 550,879 | 87,200 | — | 638,079 | |||||||||||||
Other Financial Instruments* – Liabilities | ||||||||||||||||
Foreign Exchange Contracts | (24,140 | ) | (38,103 | ) | — | (62,243 | ) | |||||||||
Market Price | (173,798 | ) | — | — | (173,798 | ) | ||||||||||
| (197,938 | ) | (38,103 | ) | — | (236,041 | ) | ||||||||||
Totals | $ | 190,729,139 | $ | 10,650,097 | — | $ | 201,379,236 | |||||||||
| AllianzGI Global Dynamic Allocation: | ||||||||||||||||
| Investments in Securities – Assets | Level 1– Quoted Prices | Level 2– Other Significant Observable Inputs | Level 3– Significant Unobservable Inputs | Value at 5/31/15 | ||||||||||||
Mutual Funds | $ | 5,476,543 | — | — | $ | 5,476,543 | ||||||||||
Exchange-Traded Funds | 670,011 | — | — | 670,011 | ||||||||||||
U.S. Treasury Obligations | — | $ | 442,900 | — | 442,900 | |||||||||||
U.S. Government Agency Securities | — | 39,385 | — | 39,385 | ||||||||||||
Short-Term Investments | — | 1,135,405 | — | 1,135,405 | ||||||||||||
| 6,146,554 | 1,617,690 | — | 7,764,244 | |||||||||||||
Other Financial Instruments* – Assets | ||||||||||||||||
Interest Rate Contracts | 1,095 | — | — | 1,095 | ||||||||||||
Market Price | 38,663 | — | — | 38,663 | ||||||||||||
| 39,758 | — | — | 39,758 | |||||||||||||
Other Financial Instruments* – Liabilities | ||||||||||||||||
Foreign Exchange Contracts | — | (1,721 | ) | — | (1,721 | ) | ||||||||||
Market Price | (3,183 | ) | — | — | (3,183 | ) | ||||||||||
| (3,183 | ) | (1,721 | ) | — | (4,904 | ) | ||||||||||
Totals | $ | 6,183,129 | $ | 1,615,969 | — | $ | 7,799,098 | |||||||||
| AllianzGI Global Megatrends: | ||||||||||||||||
| Investments in Securities – Assets | Level 1– Quoted Prices | Level 2– Other Significant Observable Inputs | Level 3– Significant Unobservable Inputs | Value at 5/31/15 | ||||||||||||
Mutual Funds | $ | 3,213,015 | — | — | $ | 3,213,015 | ||||||||||
| AllianzGI Behavioral Advantage Large Cap: | ||||||||||||||||
| Investments in Securities – Assets | Level 1– Quoted Prices | Level 2– Other Significant Observable Inputs | Level 3– Significant Unobservable Inputs | Value at 5/31/15 | ||||||||||||
Common Stock | $ | 43,969,575 | — | — | $ | 43,969,575 | ||||||||||
Repurchase Agreements | — | $ | 280,000 | — | 280,000 | |||||||||||
Totals | $ | 43,969,575 | $ | 280,000 | — | $ | 44,249,575 | |||||||||
| 288 | May 31, 2015 | | Semiannual Report |
Table of Contents
| AllianzGI Best Styles Emerging Markets Equity: | ||||||||||||||||
| Investments in Securities – Assets | Level 1– Quoted Prices | Level 2– Other Significant Observable Inputs | Level 3– Significant Unobservable Inputs | Value at 5/31/15 | ||||||||||||
Common Stock: | ||||||||||||||||
China | $ | 16,214 | $ | 1,336,826 | — | $ | 1,353,040 | |||||||||
Hong Kong | 42,143 | 134,449 | $ | 35,738 | 212,330 | |||||||||||
Indonesia | — | 166,890 | — | 166,890 | ||||||||||||
Israel | — | 3,174 | — | 3,174 | ||||||||||||
Korea (Republic of) | 109,348 | 706,257 | — | 815,605 | ||||||||||||
Malaysia | — | 143,953 | 207 | 144,160 | ||||||||||||
Philippines | — | 81,794 | — | 81,794 | ||||||||||||
Poland | — | 54,615 | — | 54,615 | ||||||||||||
Russian Federation | 119,422 | 20,420 | — | 139,842 | ||||||||||||
Singapore | — | 135,799 | — | 135,799 | ||||||||||||
South Africa | 97,568 | 417,121 | — | 514,689 | ||||||||||||
Taiwan | 136,416 | 417,485 | — | 553,901 | ||||||||||||
Thailand | — | 9,252 | 59,244 | 68,496 | ||||||||||||
Turkey | — | 162,317 | — | 162,317 | ||||||||||||
United Arab Emirates | — | 10,453 | — | 10,453 | ||||||||||||
All Other | 673,020 | — | — | 673,020 | ||||||||||||
Preferred Stock: | ||||||||||||||||
Korea (Republic of) | — | 35,916 | — | 35,916 | ||||||||||||
All Other | 260,106 | — | — | 260,106 | ||||||||||||
Repurchase Agreements | — | 283,000 | — | 283,000 | ||||||||||||
Totals | $ | 1,454,237 | $ | 4,119,721 | $ | 95,189 | $ | 5,669,147 | ||||||||
| AllianzGI Best Styles Global Equity: | ||||||||||||||||
| Investments in Securities – Assets | Level 1– Quoted Prices | Level 2– Other Significant Observable Inputs | Level 3– Significant Unobservable Inputs | Value at 5/31/15 | ||||||||||||
Common Stock: | ||||||||||||||||
Australia | — | $ | 996,172 | — | $ | 996,172 | ||||||||||
Austria | — | 393,414 | — | 393,414 | ||||||||||||
Belgium | — | 293,037 | — | 293,037 | ||||||||||||
Canada | $ | 4,261,194 | 59,979 | — | 4,321,173 | |||||||||||
China | 201,552 | 3,469,102 | $ | 1,199 | 3,671,853 | |||||||||||
Denmark | — | 725,507 | — | 725,507 | ||||||||||||
Finland | — | 525,488 | — | 525,488 | ||||||||||||
France | 138,392 | 3,157,333 | — | 3,295,725 | ||||||||||||
Germany | — | 2,979,824 | — | 2,979,824 | ||||||||||||
Hong Kong | 46,275 | 511,778 | 12,149 | 570,202 | ||||||||||||
Indonesia | — | 494,635 | — | 494,635 | ||||||||||||
Ireland | 604,912 | 511,392 | — | 1,116,304 | ||||||||||||
Israel | — | 180,591 | — | 180,591 | ||||||||||||
Italy | 61,640 | 1,104,184 | — | 1,165,824 | ||||||||||||
Japan | — | 11,384,182 | — | 11,384,182 | ||||||||||||
Korea (Republic of) | 802,160 | 1,015,867 | — | 1,818,027 | ||||||||||||
Malaysia | — | 218,455 | — | 218,455 | ||||||||||||
Netherlands | 303,044 | 986,623 | — | 1,289,667 | ||||||||||||
New Zealand | — | 188,679 | — | 188,679 | ||||||||||||
Norway | — | 1,572,305 | — | 1,572,305 | ||||||||||||
| Semiannual Report | | May 31, 2015 | 289 |
Table of Contents
Notes to Financial Statements (cont’d)
May 31, 2015 (Unaudited)
| AllianzGI Best Styles Global Equity (cont’d) | ||||||||||||||||
| Investments in Securities – Assets | Level 1– Quoted Prices | Level 2– Other Significant Observable Inputs | Level 3– Significant Unobservable Inputs | Value at 5/31/15 | ||||||||||||
Philippines | — | $ | 96,993 | — | $ | 96,993 | ||||||||||
Poland | — | 106,211 | — | 106,211 | ||||||||||||
Singapore | — | 771,881 | — | 771,881 | ||||||||||||
South Africa | $ | 72,559 | 179,795 | — | 252,354 | |||||||||||
Spain | — | 656,180 | — | 656,180 | ||||||||||||
Sweden | — | 1,045,120 | — | 1,045,120 | ||||||||||||
Switzerland | 358,199 | 1,012,906 | — | 1,371,105 | ||||||||||||
Taiwan | — | 1,220,723 | — | 1,220,723 | ||||||||||||
Thailand | — | 154,972 | $ | 62,847 | 217,819 | |||||||||||
Turkey | — | 407,362 | — | 407,362 | ||||||||||||
United Kingdom | 355,893 | 6,689,057 | — | 7,044,950 | ||||||||||||
All Other | 58,955,814 | — | — | 58,955,814 | ||||||||||||
Preferred Stock: | ||||||||||||||||
Brazil | 352,544 | — | — | 352,544 | ||||||||||||
Korea (Republic of) | — | 296,061 | — | 296,061 | ||||||||||||
Rights | — | — | — | † | — | † | ||||||||||
Repurchase Agreements | — | 4,517,000 | — | 4,517,000 | ||||||||||||
| 66,514,178 | 47,922,808 | 76,195 | 114,513,181 | |||||||||||||
Other Financial Instruments* – Assets | ||||||||||||||||
Market Price | 26,215 | — | — | 26,215 | ||||||||||||
Other Financial Instruments* – Liabilities | ||||||||||||||||
Market Price | (3,129 | ) | — | — | (3,129 | ) | ||||||||||
Totals | $ | 66,537,264 | $ | 47,922,808 | $ | 76,195 | $ | 114,536,267 | ||||||||
| AllianzGI Best Styles International Equity: | ||||||||||||||||
| Investments in Securities – Assets | Level 1– Quoted Prices | Level 2– Other Significant Observable Inputs | Level 3– Significant Unobservable Inputs | Value at 5/31/15 | ||||||||||||
Common Stock: | ||||||||||||||||
Belgium | $ | 19,495 | $ | 380,794 | — | $ | 400,289 | |||||||||
Bermuda | 26,089 | — | — | 26,089 | ||||||||||||
Denmark | 21,654 | 462,462 | — | 484,116 | ||||||||||||
France | 91,377 | 2,268,892 | — | 2,360,269 | ||||||||||||
Hong Kong | 63,210 | 196,383 | $ | 74,159 | 333,752 | |||||||||||
Ireland | 269,373 | — | — | 269,373 | ||||||||||||
Japan | 29,638 | 8,045,467 | — | 8,075,105 | ||||||||||||
Netherlands | 120,503 | 469,885 | — | 590,388 | ||||||||||||
Norway | 142,325 | 975,994 | — | 1,118,319 | ||||||||||||
Singapore | 67,087 | 139,321 | — | 206,408 | ||||||||||||
Spain | 76,579 | 1,080,486 | — | 1,157,065 | ||||||||||||
Sweden | 98,712 | 1,073,257 | — | 1,171,969 | ||||||||||||
Switzerland | 253,628 | 2,650,908 | — | 2,904,536 | ||||||||||||
United Kingdom | 230,939 | 6,295,697 | — | 6,526,636 | ||||||||||||
All Other | — | 6,595,257 | — | 6,595,257 | ||||||||||||
Preferred Stock | — | 808,610 | — | 808,610 | ||||||||||||
Rights | 213 | — | — | 213 | ||||||||||||
Repurchase Agreements | — | 557,000 | — | 557,000 | ||||||||||||
Totals | $ | 1,510,822 | $ | 32,000,413 | $ | 74,159 | $ | 33,585,394 | ||||||||
| 290 | May 31, 2015 | | Semiannual Report |
Table of Contents
| AllianzGI Best Styles U.S. Equity: | ||||||||||||||||
| Investments in Securities – Assets | Level 1– Quoted Prices | Level 2– Other Significant Observable Inputs | Level 3– Significant Unobservable Inputs | Value at 5/31/15 | ||||||||||||
Common Stock | $ | 56,454,810 | — | — | $ | 56,454,810 | ||||||||||
Rights | — | $ | 11,868 | — | 11,868 | |||||||||||
Repurchase Agreements | — | 3,653,000 | — | 3,653,000 | ||||||||||||
| 56,454,810 | 3,664,868 | — | 60,119,678 | |||||||||||||
Other Financial Instruments* – Assets | ||||||||||||||||
Market Price | 10,228 | — | — | 10,228 | ||||||||||||
Totals | $ | 56,465,038 | $ | 3,664,868 | — | $ | 60,129,906 | |||||||||
| AllianzGI China Equity: | ||||||||||||||||
| Investments in Securities – Assets | Level 1– Quoted Prices | Level 2– Other Significant Observable Inputs | Level 3– Significant Unobservable Inputs | Value at 5/31/15 | ||||||||||||
Common Stock: | ||||||||||||||||
China | $ | 961,234 | $ | 9,644,202 | $ | 166,373 | $ | 10,771,809 | ||||||||
Hong Kong | 313,530 | 1,179,376 | — | 1,492,906 | ||||||||||||
Repurchase Agreements | — | 920,000 | — | 920,000 | ||||||||||||
Totals | $ | 1,274,764 | $ | 11,743,578 | $ | 166,373 | $ | 13,184,715 | ||||||||
| AllianzGI Convertible: | ||||||||||||||||
| Investments in Securities – Assets | Level 1– Quoted Prices | Level 2– Other Significant Observable Inputs | Level 3– Significant Unobservable Inputs | Value at 5/31/15 | ||||||||||||
Convertible Bonds | — | $ | 2,021,372,166 | — | $ | 2,021,372,166 | ||||||||||
Convertible Preferred Stock: | ||||||||||||||||
Health Care Providers & Services | — | 18,342,704 | — | 18,342,704 | ||||||||||||
Machinery | $ | 1,946,713 | 28,534,935 | — | 30,481,648 | |||||||||||
Oil, Gas & Consumable Fuels | 21,176,773 | 39,167,124 | — | 60,343,897 | ||||||||||||
All Other | 310,714,260 | — | — | 310,714,260 | ||||||||||||
Repurchase Agreements | — | 83,492,000 | — | 83,492,000 | ||||||||||||
Totals | $ | 333,837,746 | $ | 2,190,908,929 | — | $ | 2,524,746,675 | |||||||||
| AllianzGI Emerging Markets Consumer: | ||||||||||||||||
| Investments in Securities – Assets | Level 1– Quoted Prices | Level 2– Other Significant Observable Inputs | Level 3– Significant Unobservable Inputs | Value at 5/31/15 | ||||||||||||
Common Stock: | ||||||||||||||||
Brazil | $ | 727,383 | — | — | $ | 727,383 | ||||||||||
China | 108,868 | $ | 2,570,404 | $ | 233,658 | 2,912,930 | ||||||||||
India | 742,450 | — | — | 742,450 | ||||||||||||
Malaysia | 26,942 | 79,437 | — | 106,379 | ||||||||||||
Mexico | 185,915 | — | — | 185,915 | ||||||||||||
Russian Federation | 60,668 | — | — | 60,668 | ||||||||||||
United States | 464,080 | — | — | 464,080 | ||||||||||||
All Other | — | 6,992,598 | — | 6,992,598 | ||||||||||||
Equity-Linked Securities | — | 410,356 | — | 410,356 | ||||||||||||
Exchange-Traded Funds | 61,120 | — | — | 61,120 | ||||||||||||
Repurchase Agreements | — | 183,000 | — | 183,000 | ||||||||||||
Totals | $ | 2,377,426 | $ | 10,235,795 | $ | 233,658 | $ | 12,846,879 | ||||||||
| Semiannual Report | | May 31, 2015 | 291 |
Table of Contents
Notes to Financial Statements (cont’d)
May 31, 2015 (Unaudited)
| AllianzGI Emerging Markets Debt: | ||||||||||||||||
| Investments in Securities – Assets | Level 1– Quoted Prices | Level 2– Other Significant Observable Inputs | Level 3– Significant Unobservable Inputs | Value at 5/31/15 | ||||||||||||
Corporate Bonds & Notes | — | $ | 18,930,633 | — | $ | 18,930,633 | ||||||||||
Sovereign Debt Obligations: | ||||||||||||||||
Sri Lanka | — | — | $ | 248,125 | 248,125 | |||||||||||
All Other | — | 10,453,514 | — | 10,453,514 | ||||||||||||
Repurchase Agreements | — | 599,000 | — | 599,000 | ||||||||||||
| — | 29,983,147 | 248,125 | 30,231,272 | |||||||||||||
Other Financial Instruments* – Assets | ||||||||||||||||
Credit Contracts | — | 103,531 | — | 103,531 | ||||||||||||
Foreign Exchange Contracts | — | 6,223 | — | 6,223 | ||||||||||||
| — | 109,754 | — | 109,754 | |||||||||||||
Other Financial Instruments* – Liabilities | ||||||||||||||||
Credit Contracts | — | (2,858 | ) | — | (2,858 | ) | ||||||||||
Foreign Exchange Contracts | — | (12,904 | ) | — | (12,904 | ) | ||||||||||
| — | (15,762 | ) | — | (15,762 | ) | |||||||||||
Totals | — | $ | 30,077,139 | $ | 248,125 | $ | 30,325,264 | |||||||||
| AllianzGI Emerging Markets Small-Cap: | ||||||||||||||||
| Investments in Securities – Assets | Level 1– Quoted Prices | Level 2– Other Significant Observable Inputs | Level 3– Significant Unobservable Inputs | Value at 5/31/15 | ||||||||||||
Common Stock: | ||||||||||||||||
China | $ | 35,261 | $ | 900,806 | — | $ | 936,067 | |||||||||
Greece | — | 9,997 | — | 9,997 | ||||||||||||
Hong Kong | 160,749 | 105,636 | — | 266,385 | ||||||||||||
Indonesia | — | 6,935 | — | 6,935 | ||||||||||||
Korea (Republic of) | 103,181 | 948,265 | — | 1,051,446 | ||||||||||||
Malaysia | 140,604 | 5,935 | — | 146,539 | ||||||||||||
Poland | 73,816 | 125,868 | — | 199,684 | ||||||||||||
Russian Federation | — | — | $ | 48,013 | 48,013 | |||||||||||
Singapore | — | 36,091 | — | 36,091 | ||||||||||||
South Africa | 305,172 | 140,124 | — | 445,296 | ||||||||||||
Taiwan | 139,429 | 921,760 | — | 1,061,189 | ||||||||||||
Thailand | 52,667 | 180,417 | — | 233,084 | ||||||||||||
Turkey | 23,341 | 100,848 | — | 124,189 | ||||||||||||
All Other | 135,995 | — | — | 135,995 | ||||||||||||
Exchange-Traded Funds | 248,907 | — | — | 248,907 | ||||||||||||
Equity-Linked Securities | — | 104,944 | — | 104,944 | ||||||||||||
Preferred Stock | 61,772 | — | — | 61,772 | ||||||||||||
Totals | $ | 1,480,894 | $ | 3,587,626 | $ | 48,013 | $ | 5,116,533 | ||||||||
| AllianzGI Europe Equity Dividend: | ||||||||||||||||
| Investments in Securities – Assets | Level 1– Quoted Prices | Level 2– Other Significant Observable Inputs | Level 3– Significant Unobservable Inputs | Value at 5/31/15 | ||||||||||||
Common Stock: | ||||||||||||||||
Austria | $ | 8,882 | — | — | $ | 8,882 | ||||||||||
Spain | 72,499 | $ | 117,155 | — | 189,654 | |||||||||||
United Kingdom | 33,535 | 1,243,296 | — | 1,276,831 | ||||||||||||
All Other | — | 1,693,743 | — | 1,693,743 | ||||||||||||
Repurchase Agreements | — | 219,000 | — | 219,000 | ||||||||||||
| 114,916 | 3,273,194 | — | 3,388,110 | |||||||||||||
| 292 | May 31, 2015 | | Semiannual Report |
Table of Contents
| AllianzGI Europe Equity Dividend (cont’d) | ||||||||||||||||
| Other Financial Instruments* – Assets | Level 1– Quoted Prices | Level 2– Other Significant Observable Inputs | Level 3– Significant Unobservable Inputs | Value at 5/31/15 | ||||||||||||
Foreign Exchange Contracts | — | $ | 639 | — | $ | 639 | ||||||||||
Other Financial Instruments* – Liabilities | ||||||||||||||||
Foreign Exchange Contracts | — | (92,439 | ) | — | (92,439 | ) | ||||||||||
Totals | $ | 114,916 | $ | 3,181,394 | — | $ | 3,296,310 | |||||||||
| AllianzGI Global Fundamental Strategy: | ||||||||||||||||
| Investments in Securities – Assets | Level 1– Quoted Prices | Level 2– Other Significant Observable Inputs | Level 3– Significant Unobservable Inputs | Value at 5/31/15 | ||||||||||||
Common Stock: | ||||||||||||||||
Australia | $ | 16,012 | — | — | $ | 16,012 | ||||||||||
Belgium | 105,788 | $ | 173,195 | — | 278,983 | |||||||||||
Germany | 106,253 | 682,493 | — | 788,746 | ||||||||||||
Hong Kong | 279,949 | 216,110 | — | 496,059 | ||||||||||||
United States | 2,601,202 | — | — | 2,601,202 | ||||||||||||
All Other | — | 3,440,817 | — | 3,440,817 | ||||||||||||
Corporate Bonds & Notes | — | 6,726,950 | — | 6,726,950 | ||||||||||||
Sovereign Debt Obligations | — | 4,133,192 | — | 4,133,192 | ||||||||||||
Exchange-Traded Funds | 427,648 | — | — | 427,648 | ||||||||||||
Repurchase Agreements | — | 3,346,000 | — | 3,346,000 | ||||||||||||
Options Purchased: | ||||||||||||||||
Market Price | 41,988 | — | — | 41,988 | ||||||||||||
| 3,578,840 | 18,718,757 | — | 22,297,597 | |||||||||||||
Investments in Securities – Liabilities | ||||||||||||||||
Options Written: | ||||||||||||||||
Market Price | (45,098 | ) | — | — | (45,098 | ) | ||||||||||
Other Financial Instruments* – Assets | ||||||||||||||||
Foreign Exchange Contracts | — | 7,320 | — | 7,320 | ||||||||||||
Other Financial Instruments* – Liabilities | ||||||||||||||||
Foreign Exchange Contracts | — | (18,473 | ) | — | (18,473 | ) | ||||||||||
Interest Rate Contracts | (7,557 | ) | — | — | (7,557 | ) | ||||||||||
| (7,557 | ) | (18,473 | ) | — | (26,030 | ) | ||||||||||
Totals | $ | 3,526,185 | $ | 18,707,604 | — | $ | 22,233,789 | |||||||||
| AllianzGI Global Managed Volatility: | ||||||||||||||||
| Investments in Securities – Assets | Level 1– Quoted Prices | Level 2– Other Significant Observable Inputs | Level 3– Significant Unobservable Inputs | Value at 5/31/15 | ||||||||||||
Common Stock: | ||||||||||||||||
Australia | — | $ | 98,670 | — | $ | 98,670 | ||||||||||
China | — | 40,147 | — | 40,147 | ||||||||||||
France | — | 51,981 | — | 51,981 | ||||||||||||
Germany | — | 91,717 | — | 91,717 | ||||||||||||
Hong Kong | $ | 19,039 | 95,066 | — | 114,105 | |||||||||||
Israel | — | 70,528 | — | 70,528 | ||||||||||||
Japan | — | 154,010 | — | 154,010 | ||||||||||||
Netherlands | — | 12,018 | — | 12,018 | ||||||||||||
Singapore | — | 110,758 | — | 110,758 | ||||||||||||
Sweden | — | 7,984 | — | 7,984 | ||||||||||||
Switzerland | — | 17,066 | — | 17,066 | ||||||||||||
| Semiannual Report | | May 31, 2015 | 293 |
Table of Contents
Notes to Financial Statements (cont’d)
May 31, 2015 (Unaudited)
| AllianzGI Global Managed Volatility (cont’d) | ||||||||||||||||
| Investments in Securities – Assets | Level 1– Quoted Prices | Level 2– Other Significant Observable Inputs | Level 3– Significant Unobservable Inputs | Value at 5/31/15 | ||||||||||||
United Kingdom | $ | 8,703 | $ | 38,674 | — | $ | 47,377 | |||||||||
All Other | 1,925,183 | — | — | 1,925,183 | ||||||||||||
Totals | $ | 1,952,925 | $ | 788,619 | — | $ | 2,741,544 | |||||||||
| AllianzGI Global Sustainability: | ||||||||||||||||
| Investments in Securities – Assets | Level 1– Quoted Prices | Level 2– Other Significant Observable Inputs | Level 3– Significant Unobservable Inputs | Value at 5/31/15 | ||||||||||||
Common Stock: | ||||||||||||||||
Australia | $ | 3,317 | $ | 101,812 | — | $ | 105,129 | |||||||||
Denmark | — | 63,254 | — | 63,254 | ||||||||||||
France | — | 94,844 | — | 94,844 | ||||||||||||
Germany | — | 164,632 | — | 164,632 | ||||||||||||
Japan | — | 127,578 | — | 127,578 | ||||||||||||
Norway | — | 31,275 | — | 31,275 | ||||||||||||
Spain | — | 125,917 | — | 125,917 | ||||||||||||
Sweden | — | 109,422 | — | 109,422 | ||||||||||||
Switzerland | — | 183,198 | — | 183,198 | ||||||||||||
United Kingdom | — | 460,328 | — | 460,328 | ||||||||||||
All Other | 1,468,504 | — | — | 1,468,504 | ||||||||||||
Preferred Stock | — | 65,240 | — | 65,240 | ||||||||||||
Repurchase Agreements | — | 145,000 | — | 145,000 | ||||||||||||
Totals | $ | 1,471,821 | $ | 1,672,500 | — | $ | 3,144,321 | |||||||||
| AllianzGI Global Water: | ||||||||||||||||
| Investments in Securities – Assets | Level 1– Quoted Prices | Level 2– Other Significant Observable Inputs | Level 3– Significant Unobservable Inputs | Value at 5/31/15 | ||||||||||||
Common Stock: | ||||||||||||||||
Austria | — | $ | 7,070,473 | — | $ | 7,070,473 | ||||||||||
China | — | 16,015,176 | — | 16,015,176 | ||||||||||||
Finland | — | 11,112,288 | — | 11,112,288 | ||||||||||||
France | — | 19,042,535 | — | 19,042,535 | ||||||||||||
Germany | — | 14,374,293 | — | 14,374,293 | ||||||||||||
Hong Kong | — | 17,147,933 | — | 17,147,933 | ||||||||||||
Italy | — | 3,751,871 | — | 3,751,871 | ||||||||||||
Japan | — | 14,520,951 | — | 14,520,951 | ||||||||||||
Netherlands | — | 3,768,985 | — | 3,768,985 | ||||||||||||
Sweden | $ | 4,211,873 | 5,208,094 | — | 9,419,967 | |||||||||||
Switzerland | 3,828,595 | 27,618,591 | — | 31,447,186 | ||||||||||||
United Kingdom | 17,172,236 | 27,987,389 | — | 45,159,625 | ||||||||||||
All Other | 149,089,009 | — | — | 149,089,009 | ||||||||||||
Repurchase Agreements | — | 25,507,000 | — | 25,507,000 | ||||||||||||
Totals | $ | 174,301,713 | $ | 193,125,579 | — | $ | 367,427,292 | |||||||||
| 294 | May 31, 2015 | | Semiannual Report |
Table of Contents
| AllianzGI High Yield Bond: | ||||||||||||||||
| Investments in Securities – Assets | Level 1– Quoted Prices | Level 2– Other Significant Observable Inputs | Level 3– Significant Unobservable Inputs | Value at 5/31/15 | ||||||||||||
Corporate Bonds & Notes | — | $ | 387,549,145 | — | $ | 387,549,145 | ||||||||||
Repurchase Agreements | — | 10,810,000 | — | 10,810,000 | ||||||||||||
Totals | — | $ | 398,359,145 | — | $ | 398,359,145 | ||||||||||
| AllianzGI International Growth: | ||||||||||||||||
| Investments in Securities – Assets | Level 1– Quoted Prices | Level 2– Other Significant Observable Inputs | Level 3– Significant Unobservable Inputs | Value at 5/31/15 | ||||||||||||
Common Stock: | ||||||||||||||||
Brazil | $ | 200,426 | — | — | $ | 200,426 | ||||||||||
Canada | 174,382 | — | — | 174,382 | ||||||||||||
Denmark | 36,714 | $ | 205,541 | — | 242,255 | |||||||||||
Korea (Republic of) | 49,577 | — | — | 49,577 | ||||||||||||
Mexico | 37,299 | — | — | 37,299 | ||||||||||||
Sweden | 19,015 | 207,300 | — | 226,315 | ||||||||||||
All Other | — | 2,220,696 | — | 2,220,696 | ||||||||||||
Totals | $ | 517,413 | $ | 2,633,537 | — | $ | 3,150,950 | |||||||||
| AllianzGI International Small-Cap: | ||||||||||||||||
| Investments in Securities – Assets | Level 1– Quoted Prices | Level 2– Other Significant Observable Inputs | Level 3– Significant Unobservable Inputs | Value at 5/31/15 | ||||||||||||
Common Stock: | ||||||||||||||||
Denmark | $ | 1,929,520 | — | — | $ | 1,929,520 | ||||||||||
France | 6,518,466 | $ | 813,742 | — | 7,332,208 | |||||||||||
Hong Kong | 805,128 | 2,648,537 | — | 3,453,665 | ||||||||||||
Ireland | 1,293,390 | 2,089,958 | — | 3,383,348 | ||||||||||||
Sweden | 73,213 | 7,113,127 | $ | 31,414 | 7,217,754 | |||||||||||
Switzerland | 1,277,600 | 3,153,025 | — | 4,430,625 | ||||||||||||
Thailand | — | — | 613,666 | 613,666 | ||||||||||||
United Kingdom | 5,137,245 | 10,058,031 | — | 15,195,276 | ||||||||||||
All Other | — | 68,467,784 | — | 68,467,784 | ||||||||||||
Repurchase Agreements | — | 7,946,000 | — | 7,946,000 | ||||||||||||
| 17,034,562 | 102,290,204 | 645,080 | 119,969,846 | |||||||||||||
Other Financial Instruments* – Liabilities | ||||||||||||||||
Foreign Exchange Contracts | — | (143 | ) | — | (143 | ) | ||||||||||
Totals | $ | 17,034,562 | $ | 102,290,061 | $ | 645,080 | $ | 119,969,703 | ||||||||
| AllianzGI Micro Cap: | ||||||||||||||||
| Investments in Securities – Assets | Level 1– Quoted Prices | Level 2– Other Significant Observable Inputs | Level 3– Significant Unobservable Inputs | Value at 5/31/15 | ||||||||||||
Common Stock | $ | 41,634,406 | — | — | $ | 41,634,406 | ||||||||||
| Semiannual Report | | May 31, 2015 | 295 |
Table of Contents
Notes to Financial Statements (cont’d)
May 31, 2015 (Unaudited)
| AllianzGI Multi-Asset Real Return: | ||||||||||||||||
| Investments in Securities – Assets | Level 1– Quoted Prices | Level 2– Other Significant Observable Inputs | Level 3– Significant Unobservable Inputs | Value at 5/31/15 | ||||||||||||
Mutual Funds | $ | 2,664,869 | — | — | $ | 2,664,869 | ||||||||||
Common Stock: | ||||||||||||||||
Australia | — | $ | 111,569 | — | 111,569 | |||||||||||
Austria | — | 2,031 | — | 2,031 | ||||||||||||
France | — | 58,433 | — | 58,433 | ||||||||||||
Germany | — | 28,017 | — | 28,017 | ||||||||||||
Hong Kong | — | 161,982 | $ | 10,302 | 172,284 | |||||||||||
Japan | — | 168,246 | — | 168,246 | ||||||||||||
Singapore | — | 47,862 | — | 47,862 | ||||||||||||
Switzerland | — | 8,803 | — | 8,803 | ||||||||||||
United Kingdom | 7,491 | 55,899 | — | 63,390 | ||||||||||||
All Other | 735,251 | — | — | 735,251 | ||||||||||||
U.S. Treasury Obligations | — | 581,914 | — | 581,914 | ||||||||||||
Exchange-Traded Funds | 34,752 | — | — | 34,752 | ||||||||||||
Rights | 16 | — | — | 16 | ||||||||||||
Repurchase Agreements | — | 369,000 | — | 369,000 | ||||||||||||
| 3,442,379 | 1,593,756 | 10,302 | 5,046,437 | |||||||||||||
Other Financial Instruments* – Assets | ||||||||||||||||
Foreign Exchange Contracts | 2,803 | — | — | 2,803 | ||||||||||||
Market Price | 5,922 | — | — | 5,922 | ||||||||||||
| 8,725 | — | — | 8,725 | |||||||||||||
Other Financial Instruments* – Liabilities | ||||||||||||||||
Interest Rate Contracts | (1,870 | ) | — | — | (1,870 | ) | ||||||||||
Market Price | (4,755 | ) | — | — | (4,755 | ) | ||||||||||
| (6,625 | ) | — | — | (6,625 | ) | |||||||||||
Totals | $ | 3,444,479 | $ | 1,593,756 | $ | 10,302 | $ | 5,048,537 | ||||||||
| AllianzGI NFJ Emerging Markets Value: | ||||||||||||||||
| Investments in Securities – Assets | Level 1– Quoted Prices | Level 2– Other Significant Observable Inputs | Level 3– Significant Unobservable Inputs | Value at 5/31/15 | ||||||||||||
Common Stock: | ||||||||||||||||
China | $ | 436,656 | $ | 1,453,867 | — | $ | 1,890,523 | |||||||||
Greece | — | 60,888 | — | 60,888 | ||||||||||||
Hong Kong | — | 197,121 | — | 197,121 | ||||||||||||
India | 156,684 | 554,605 | — | 711,289 | ||||||||||||
Indonesia | — | 129,563 | — | 129,563 | ||||||||||||
Korea (Republic of) | 63,672 | 1,000,036 | — | 1,063,708 | ||||||||||||
Malaysia | 186,276 | 119,884 | — | 306,160 | ||||||||||||
Norway | — | 57,376 | — | 57,376 | ||||||||||||
Poland | — | 129,698 | — | 129,698 | ||||||||||||
Russian Federation | 113,163 | — | $ | 303,888 | 417,051 | |||||||||||
Singapore | 63,144 | 185,725 | — | 248,869 | ||||||||||||
South Africa | 347,963 | 182,931 | — | 530,894 | ||||||||||||
Taiwan | 66,297 | 1,266,252 | — | 1,332,549 | ||||||||||||
Thailand | 127,718 | 66,243 | — | 193,961 | ||||||||||||
Turkey | 63,075 | 186,087 | — | 249,162 | ||||||||||||
All Other | 1,177,484 | — | — | 1,177,484 | ||||||||||||
| 296 | May 31, 2015 | | Semiannual Report |
Table of Contents
| AllianzGI NFJ Emerging Markets Value (cont’d) | ||||||||||||||||
| Investments in Securities – Assets | Level 1– Quoted Prices | Level 2– Other Significant Observable Inputs | Level 3– Significant Unobservable Inputs | Value at 5/31/15 | ||||||||||||
Preferred Stock: | ||||||||||||||||
Brazil | $ | 238,127 | — | — | $ | 238,127 | ||||||||||
Russian Federation | — | — | $ | 56,547 | 56,547 | |||||||||||
Equity-Linked Securities | — | $ | 105,671 | — | 105,671 | |||||||||||
Repurchase Agreements | — | 184,000 | — | 184,000 | ||||||||||||
| 3,040,259 | 5,879,947 | 360,435 | 9,280,641 | |||||||||||||
Other Financial Instruments* – Assets | ||||||||||||||||
Foreign Exchange Contracts | — | 20 | — | 20 | ||||||||||||
Other Financial Instruments* – Liabilities | ||||||||||||||||
Foreign Exchange Contracts | — | (66 | ) | — | (66 | ) | ||||||||||
Totals | $ | 3,040,259 | $ | 5,879,901 | $ | 360,435 | $ | 9,280,595 | ||||||||
| AllianzGI NFJ Global Dividend Value: | ||||||||||||||||
| Investments in Securities – Assets | Level 1– Quoted Prices | Level 2– Other Significant Observable Inputs | Level 3– Significant Unobservable Inputs | Value at 5/31/15 | ||||||||||||
Common Stock: | ||||||||||||||||
China | — | $ | 1,747,660 | — | $ | 1,747,660 | ||||||||||
France | — | 1,508,867 | — | 1,508,867 | ||||||||||||
Germany | — | 737,576 | — | 737,576 | ||||||||||||
Indonesia | $ | 724,289 | 624,632 | — | 1,348,921 | |||||||||||
Israel | 829,380 | 775,820 | — | 1,605,200 | ||||||||||||
Japan | — | 2,719,488 | — | 2,719,488 | ||||||||||||
Korea (Republic of) | — | 723,973 | — | 723,973 | ||||||||||||
Norway | — | 721,647 | — | 721,647 | ||||||||||||
Spain | — | 1,481,642 | — | 1,481,642 | ||||||||||||
Switzerland | — | 773,020 | — | 773,020 | ||||||||||||
United Kingdom | 710,668 | 5,119,763 | — | 5,830,431 | ||||||||||||
All Other | 20,627,146 | — | — | 20,627,146 | ||||||||||||
Repurchase Agreements | — | 553,000 | — | 553,000 | ||||||||||||
Totals | $ | 22,891,483 | $ | 17,487,088 | — | $ | 40,378,571 | |||||||||
| AllianzGI NFJ International Small-Cap Value: | ||||||||||||||||
| Investments in Securities – Assets | Level 1– Quoted Prices | Level 2– Other Significant Observable Inputs | Level 3– Significant Unobservable Inputs | Value at 5/31/15 | ||||||||||||
Common Stock: | ||||||||||||||||
Brazil | $ | 300,702 | — | — | $ | 300,702 | ||||||||||
Canada | 1,761,895 | — | — | 1,761,895 | ||||||||||||
Chile | 182,911 | — | — | 182,911 | ||||||||||||
China | 142,848 | $ | 826,097 | — | 968,945 | |||||||||||
Hong Kong | 348,436 | 635,315 | — | 983,751 | ||||||||||||
Italy | 188,998 | 458,841 | — | 647,839 | ||||||||||||
Panama | 172,881 | — | — | 172,881 | ||||||||||||
Philippines | 177,996 | — | — | 177,996 | ||||||||||||
Portugal | 139,135 | — | — | 139,135 | ||||||||||||
Singapore | 150,184 | — | — | 150,184 | ||||||||||||
South Africa | 309,090 | 184,548 | — | 493,638 | ||||||||||||
Spain | 136,664 | 292,224 | — | 428,888 | ||||||||||||
| Semiannual Report | | May 31, 2015 | 297 |
Table of Contents
Notes to Financial Statements (cont’d)
May 31, 2015 (Unaudited)
| AllianzGI NFJ International Small-Cap Value (cont’d) | ||||||||||||||||
| Investments in Securities – Assets | Level 1– Quoted Prices | Level 2– Other Significant Observable Inputs | Level 3– Significant Unobservable Inputs | Value at 5/31/15 | ||||||||||||
Switzerland | $ | 211,855 | $ | 140,775 | — | $ | 352,630 | |||||||||
United Kingdom | 1,395,645 | 1,993,209 | — | 3,388,854 | ||||||||||||
All Other | — | 8,542,058 | — | 8,542,058 | ||||||||||||
Preferred Stock | 150,887 | — | — | 150,887 | ||||||||||||
Totals | $ | 5,770,127 | $ | 13,073,067 | — | $ | 18,843,194 | |||||||||
| AllianzGI NFJ International Value II: | ||||||||||||||||
| Investments in Securities – Assets | Level 1– Quoted Prices | Level 2– Other Significant Observable Inputs | Level 3– Significant Unobservable Inputs | Value at 5/31/15 | ||||||||||||
Common Stock: | ||||||||||||||||
Canada | $ | 3,263,586 | — | — | $ | 3,263,586 | ||||||||||
Chile | 374,877 | — | — | 374,877 | ||||||||||||
China | 490,298 | $ | 1,723,864 | — | 2,214,162 | |||||||||||
Hong Kong | 946,570 | 3,258,149 | $ | 151,864 | 4,356,583 | |||||||||||
India | 409,810 | — | — | 409,810 | ||||||||||||
Israel | 661,100 | 438,321 | — | 1,099,421 | ||||||||||||
Italy | 376,636 | — | — | 376,636 | ||||||||||||
Korea (Republic of) | 491,615 | — | — | 491,615 | ||||||||||||
Mexico | 554,400 | — | — | 554,400 | ||||||||||||
Philippines | 428,150 | — | — | 428,150 | ||||||||||||
Russian Federation | 338,954 | — | — | 338,954 | ||||||||||||
South Africa | 358,247 | — | — | 358,247 | ||||||||||||
Taiwan | 1,595,265 | — | — | 1,595,265 | ||||||||||||
Turkey | 426,312 | — | — | 426,312 | ||||||||||||
United Kingdom | 644,902 | 10,402,851 | — | 11,047,753 | ||||||||||||
All Other | — | 19,605,243 | — | 19,605,243 | ||||||||||||
Preferred Stock | — | 650,802 | — | 650,802 | ||||||||||||
Repurchase Agreements | — | 2,464,000 | — | 2,464,000 | ||||||||||||
Totals | $ | 11,360,722 | $ | 38,543,230 | $ | 151,864 | $ | 50,055,816 | ||||||||
| AllianzGI Short Duration High Income: | ||||||||||||||||
Investments in Securities – Assets | Level 1– Quoted Prices | Level 2– Other Significant Observable Inputs | Level 3– Significant Unobservable Inputs | Value at 5/31/15 | ||||||||||||
Corporate Bonds & Notes | — | $ | 679,532,180 | — | $ | 679,532,180 | ||||||||||
Senior Loans | — | 90,700,820 | — | 90,700,820 | ||||||||||||
Repurchase Agreements | — | 55,837,000 | — | 55,837,000 | ||||||||||||
Totals | — | $ | 826,070,000 | — | $ | 826,070,000 | ||||||||||
| AllianzGI Structured Return: | ||||||||||||||||
| Investments in Securities – Assets | Level 1– Quoted Prices | Level 2– Other Significant Observable Inputs | Level 3– Significant Unobservable Inputs | Value at 5/31/15 | ||||||||||||
Exchange-Traded Funds | $ | 30,191,590 | — | — | $ | 30,191,590 | ||||||||||
Repurchase Agreements | — | $ | 2,553,000 | — | 2,553,000 | |||||||||||
Options Purchased: | ||||||||||||||||
Market Price | 91,534 | — | — | 91,534 | ||||||||||||
| 30,283,124 | 2,553,000 | — | 32,836,124 | |||||||||||||
| 298 | May 31, 2015 | | Semiannual Report |
Table of Contents
| AllianzGI Structured Return (cont’d) | ||||||||||||||||
| Investments in Securities – Liabilities | Level 1– Quoted Prices | Level 2– Other Significant Observable Inputs | Level 3– Significant Unobservable Inputs | Value at 5/31/15 | ||||||||||||
Options Written: | ||||||||||||||||
Market Price | $ | (1,304,350 | ) | — | — | $ | (1,304,350 | ) | ||||||||
Totals | $ | 28,978,774 | $ | 2,553,000 | — | $ | 31,531,774 | |||||||||
| AllianzGI U.S. Equity Hedged: | ||||||||||||||||
| Investments in Securities – Assets | Level 1– Quoted Prices | Level 2– Other Significant Observable Inputs | Level 3– Significant Unobservable Inputs | Value at 5/31/15 | ||||||||||||
Exchange-Traded Funds | $ | 15,623,620 | — | — | $ | 15,623,620 | ||||||||||
Repurchase Agreements | — | $ | 381,000 | — | 381,000 | |||||||||||
Options Purchased: | ||||||||||||||||
Market Price | 250,995 | — | — | 250,995 | ||||||||||||
| 15,874,615 | 381,000 | — | 16,255,615 | |||||||||||||
Investments in Securities – Liabilities | ||||||||||||||||
Options Written: | ||||||||||||||||
Market Price | (48,080 | ) | — | — | (48,080 | ) | ||||||||||
Totals | $ | 15,826,535 | $ | 381,000 | — | $ | 16,207,535 | |||||||||
| AllianzGI U.S. Small-Cap Growth: | ||||||||||||||||
| Investments in Securities – Assets | Level 1– Quoted Prices | Level 2– Other Significant Observable Inputs | Level 3– Significant Unobservable Inputs | Value at 5/31/15 | ||||||||||||
Common Stock | $ | 44,129,583 | — | — | $ | 44,129,583 | ||||||||||
Repurchase Agreements | — | $ | 1,108,000 | — | 1,108,000 | |||||||||||
Totals | $ | 44,129,583 | $ | 1,108,000 | — | $ | 45,237,583 | |||||||||
| AllianzGI Ultra Micro Cap: | ||||||||||||||||
| Investments in Securities – Assets | Level 1– Quoted Prices | Level 2– Other Significant Observable Inputs | Level 3– Significant Unobservable Inputs | Value at 5/31/15 | ||||||||||||
Common Stock | $ | 100,416,583 | — | — | $ | 100,416,583 | ||||||||||
Repurchase Agreements | — | $ | 1,248,000 | — | 1,248,000 | |||||||||||
Totals | $ | 100,416,583 | $ | 1,248,000 | — | $ | 101,664,583 | |||||||||
| † | Security fair-valued at $0. |
At May 31, 2015, the following Funds had transfers between Levels 1 and 2:
| Transfers | ||||||||
| Level 1 to Level 2 | Level 2 to Level 1 | |||||||
AllianzGI Best Styles Global Equity | $ | 477,140 | (a) | $ | 149,717 | (b) | ||
AllianzGI China Equity | — | 109,239 | (b) | |||||
AllianzGI Convertible | 18,342,704 | (c) | 44,596,458 | (d) | ||||
AllianzGI Global Fundamental Strategy | 350,186 | (a) | 279,949 | (b) | ||||
AllianzGI Global Managed Volatility | 7,962 | (a) | — | |||||
AllianzGI Global Water | — | 3,828,595 | (b) | |||||
AllianzGI International Small-Cap | 2,556,971 | (a) | 5,623,560 | (b) | ||||
AllianzGI Multi-Asset Real Return | 4,673 | (a) | 7,491 | (b) | ||||
AllianzGI NFJ Emerging Markets Value | 319,946 | (a) | 273,536 | (b) | ||||
AllianzGI NFJ International Small-Cap Value | 1,513,672 | (a) | 865,364 | (b) | ||||
AllianzGI NFJ International Value II | 1,200,930 | (a) | 946,570 | (b) | ||||
| Semiannual Report | | May 31, 2015 | 299 |
Table of Contents
Notes to Financial Statements (cont’d)
May 31, 2015 (Unaudited)
| (a) | This transfer was a result of securities trading outside the U.S. whose values were not adjusted by the application of a modeling tool at November 30, 2014, which was applied on May 31, 2015. |
| (b) | This transfer was a result of securities trading outside the U.S. whose values were adjusted by the application of a modeling tool at November 30, 2014, which was not applied on May 31, 2015. |
| (c) | This transfer was a result of securities with an exchange-traded closing price at November 30, 2014, which was not available on May 31, 2015. |
| (d) | This transfer was a result of securities without an exchange-traded closing price at November 30, 2014, which was available on May 31, 2015. |
A roll forward of fair value measurements using significant unobservable inputs (Level 3) for the period or six months ended May 31, 2015, was as follows:
| AllianzGI Best Styles Emerging Markets Equity: | ||||||||||||||||||||||||||||||||||||
| Investments in Securities – Assets | Beginning Balance 12/9/14** | Purchases | Sales | Accrued Discount (Premiums) | Net Realized Gain (Loss) | Net Change in Unrealized Appreciation/ Depreciation | Transfers into Level 3 | Transfers out of Level 3 | Ending Balance 5/31/15 | |||||||||||||||||||||||||||
Common Stock: | ||||||||||||||||||||||||||||||||||||
Hong Kong | — | $ | 40,900 | $ | (14,853 | ) | — | $ | 2,928 | $ | 6,763 | — | — | $ | 35,738 | |||||||||||||||||||||
Malaysia | — | — | †† | — | — | — | 207 | — | — | 207 | ||||||||||||||||||||||||||
Thailand | — | 63,997 | (2,596 | ) | — | (46 | ) | (2,111 | ) | — | — | 59,244 | ||||||||||||||||||||||||
Totals | — | $ | 104,897 | $ | (17,449 | ) | — | $ | 2,882 | $ | 4,859 | — | — | $ | 95,189 | |||||||||||||||||||||
| AllianzGI Best Styles Global Equity: | ||||||||||||||||||||||||||||||||||||
| Investments in Securities – Assets | Beginning 11/30/14 | Purchases | Sales | Accrued Discount (Premiums) | Net Realized Gain (Loss) | Net Change in Unrealized Appreciation/ Depreciation | Transfers into Level 3 | Transfers out of Level 3 | Ending Balance 5/31/15 | |||||||||||||||||||||||||||
Common Stock: | ||||||||||||||||||||||||||||||||||||
China | $ | 9,993 | — | — | — | — | $ | (8,794 | ) | — | — | $ | 1,199 | |||||||||||||||||||||||
Hong Kong | — | $ | 9,626 | — | — | — | 2,523 | — | — | 12,149 | ||||||||||||||||||||||||||
Thailand | 43,865 | 106,185 | $ | (73,062 | ) | — | $ | (2,589 | ) | (11,552 | ) | — | — | 62,847 | ||||||||||||||||||||||
Rights: | ||||||||||||||||||||||||||||||||||||
Italy | — | — | †† | — | — | — | — | — | — | — | † | |||||||||||||||||||||||||
Totals | $ | 53,858 | $ | 115,811 | $ | (73,062 | ) | — | $ | (2,589 | ) | $ | (17,823 | ) | — | — | $ | 76,195 | ||||||||||||||||||
| AllianzGI Best Styles International Equity: | ||||||||||||||||||||||||||||||||||||
| Investments in Securities – Assets | Beginning Balance 12/9/14** | Purchases | Sales | Accrued Discount (Premiums) | Net Realized Gain (Loss) | Net Change in Unrealized Appreciation/ Depreciation | Transfers into Level 3 | Transfers out of Level 3 | Ending Balance 5/31/15 | |||||||||||||||||||||||||||
Common Stock: | ||||||||||||||||||||||||||||||||||||
Hong Kong | — | $ | 59,433 | — | — | — | $ | 14,726 | — | — | $ | 74,159 | ||||||||||||||||||||||||
| AllianzGI China Equity: | ||||||||||||||||||||||||||||||||||||
| Investments in Securities – Assets | Beginning Balance 11/30/14 | Purchases | Sales | Accrued Discount (Premiums) | Net Realized Gain (Loss) | Net Change in Unrealized Appreciation/ Depreciation | Transfers into Level 3 | Transfers out of Level 3 | Ending Balance 5/31/15 | |||||||||||||||||||||||||||
Common Stock: | ||||||||||||||||||||||||||||||||||||
China | $ | 320,473 | $ | 24,065 | $ | (431,638 | ) | — | $ | 216,376 | $ | 37,097 | — | — | $ | 166,373 | ||||||||||||||||||||
| AllianzGI Emerging Markets Consumer: | ||||||||||||||||||||||||||||||||||||
| Investments in Securities – Assets | Beginning Balance 12/1/14** | Purchases | Sales | Accrued Discount (Premiums) | Net Realized Gain (Loss) | Net Change in Unrealized Appreciation/ Depreciation | Transfers into Level 3 | Transfers out of Level 3 | Ending Balance 5/31/15 | |||||||||||||||||||||||||||
Common Stock: | ||||||||||||||||||||||||||||||||||||
China | — | $ | 382,411 | — | — | — | $ | (148,753 | ) | — | — | $ | 233,658 | |||||||||||||||||||||||
| 300 | May 31, 2015 | | Semiannual Report |
Table of Contents
| AllianzGI Emerging Markets Debt: | ||||||||||||||||||||||||||||||||||||
| Investments in Securities – Assets | Beginning Balance 11/30/14 | Purchases | Sales | Accrued Discount (Premiums) | Net Realized Gain (Loss) | Net Change in Unrealized Appreciation/ Depreciation | Transfers into Level 3 | Transfers out of Level 3 | Ending Balance 5/31/15 | |||||||||||||||||||||||||||
Sovereign Debt Obligations: | ||||||||||||||||||||||||||||||||||||
Sri Lanka | — | $ | 250,000 | — | — | — | $ | (1,875 | ) | — | — | $ | 248,125 | |||||||||||||||||||||||
| AllianzGI Emerging Markets Small-Cap: | ||||||||||||||||||||||||||||||||||||
| Investments in Securities – Assets | Beginning Balance 12/1/14** | Purchases | Sales | Accrued Discount (Premiums) | Net Realized Gain (Loss) | Net Change in Unrealized Appreciation/ Depreciation | Transfers into Level 3 | Transfers out of Level 3 | Ending Balance 5/31/15 | |||||||||||||||||||||||||||
Common Stock: | ||||||||||||||||||||||||||||||||||||
Russian Federation | — | $ | 108,914 | $ | (68,032 | ) | — | $ | (1,702 | ) | $ | 8,833 | — | — | $ | 48,013 | ||||||||||||||||||||
| AllianzGI International Small-Cap: | ||||||||||||||||||||||||||||||||||||
| Investments in Securities – Assets | Beginning Balance 11/30/14 | Purchases | Sales | Accrued Discount (Premiums) | Net Realized Gain (Loss) | Net Change in Unrealized Appreciation/ Depreciation | Transfers into Level 3 | Transfers out of Level 3 | Ending Balance 5/31/15 | |||||||||||||||||||||||||||
Common Stock: | ||||||||||||||||||||||||||||||||||||
Sweden | — | $ | 32,317 | — | — | — | $ | (903 | ) | — | — | $ | 31,414 | |||||||||||||||||||||||
Thailand | $ | 816,875 | 236,155 | $ | (512,951 | ) | — | $ | 38,942 | 34,645 | — | — | 613,666 | |||||||||||||||||||||||
Totals | $ | 816,875 | $ | 268,472 | $ | (512,951 | ) | — | $ | 38,942 | $ | 33,742 | — | — | $ | 645,080 | ||||||||||||||||||||
| AllianzGI Multi-Asset Real Return: | ||||||||||||||||||||||||||||||||||||
| Investments in Securities – Assets | Beginning Balance 11/30/14 | Purchases | Sales | Accrued Discount (Premiums) | Net Realized Gain (Loss) | Net Change in Unrealized Appreciation/ Depreciation | Transfers into Level 3 | Transfers out of Level 3 | Ending Balance 5/31/15 | |||||||||||||||||||||||||||
Common Stock: | ||||||||||||||||||||||||||||||||||||
Hong Kong | — | $ | 7,500 | — | — | — | $ | 2,802 | — | — | $ | 10,302 | ||||||||||||||||||||||||
| AllianzGI NFJ Emerging Markets Value: | ||||||||||||||||||||||||||||||||||||
| Investments in Securities – Assets | Beginning Balance 11/30/14 | Purchases | Sales | Accrued Discount (Premiums) | Net Realized Gain (Loss) | Net Change in Unrealized Appreciation/ Depreciation | Transfers into Level 3 | Transfers out of Level 3 | Ending Balance 5/31/15 | |||||||||||||||||||||||||||
Common Stock: | ||||||||||||||||||||||||||||||||||||
Russian Federation | $ | 276,596 | $ | 121,413 | $ | (128,097 | ) | — | $ | (63,517 | ) | $ | 97,493 | — | — | $ | 303,888 | |||||||||||||||||||
Thailand | 93,210 | — | (85,845 | ) | — | (21,230 | ) | 13,865 | — | — | — | |||||||||||||||||||||||||
Preferred Stock | 60,144 | 23,450 | (35,924 | ) | — | (2,054 | ) | 10,931 | — | — | 56,547 | |||||||||||||||||||||||||
Totals | $ | 429,950 | $ | 144,863 | $ | (249,866 | ) | — | $ | (86,801 | ) | $ | 122,289 | — | — | $ | 360,435 | |||||||||||||||||||
| AllianzGI NFJ International Value II: | ||||||||||||||||||||||||||||||||||||
| Investments in Securities – Assets | Beginning Balance 11/30/14 | Purchases | Sales | Accrued Discount (Premiums) | Net Realized Gain (Loss) | Net Change in Unrealized Appreciation/ Depreciation | Transfers into Level 3 | Transfers out of Level 3 | Ending Balance 5/31/15 | |||||||||||||||||||||||||||
Common Stock: | ||||||||||||||||||||||||||||||||||||
Hong Kong | — | $ | 125,354 | — | — | — | $ | 26,510 | — | — | $ | 151,864 | ||||||||||||||||||||||||
Israel | $ | 363,356 | — | $ | (460,419 | ) | — | — | 97,063 | — | — | — | ||||||||||||||||||||||||
Totals | $ | 363,356 | $ | 125,354 | $ | (460,419 | ) | — | — | $ | 123,573 | — | — | $ | 151,864 | |||||||||||||||||||||
| Semiannual Report | | May 31, 2015 | 301 |
Table of Contents
Notes to Financial Statements (cont’d)
May 31, 2015 (Unaudited)
| AllianzGI Short Duration High Income: | ||||||||||||||||||||||||||||||||||||
| Investments in Securities – Assets | Beginning Balance 11/30/14 | Purchases | Sales | Accrued Discount (Premiums) | Net Realized Gain (Loss) | Net Change in Unrealized Appreciation/ Depreciation | Transfers into Level 3 | Transfers out of Level 3 | Ending Balance 5/31/15 | |||||||||||||||||||||||||||
Senior Loans: | ||||||||||||||||||||||||||||||||||||
Real Estate Investment Trust | $ | 6,264,439 | — | $ | (6,210,302 | ) | $ | 124 | $ | (80,775 | ) | $ | 26,514 | — | — | — | ||||||||||||||||||||
The following tables present additional information about valuation techniques and inputs used for investments that are measured at fair value and categorized within Level 3 at May 31, 2015:
| AllianzGI Best Styles Emerging Markers Equity: | ||||||||||||
| Investments in Securities – Assets | Ending Balance at 5/31/15 | Valuation Technique Used | Unobservable Inputs | Input Values | ||||||||
Common Stock | $ | 59,244 | Value of Foreign Security Traded on Foreign Exchange | Price of Non-Resident Shares on Foreign Exchange | THB 65.44-297.21 | |||||||
| $ | 6,075 | Fundamental Analytical Data Relating to the Investment | Trading Volume | HKD 47.10 | ||||||||
| $ | 29,663 | Last Exchange-Traded Closing Price | Trading Volume | HKD 115.00 | ||||||||
| AllianzGI Best Styles Global Equity: | ||||||||||||
| Investments in Securities – Assets | Ending Balance at 5/31/15 | Valuation Technique Used | Unobservable Inputs | Input Values | ||||||||
Common Stock | $ | 62,847 | Value of Foreign Security Traded on Foreign Exchange | Price of Non-Resident Shares on Foreign Exchange | THB 18.06-20.42 | |||||||
| $ | 12,149 | Fundamental Analytical Data Relating to the Investment | Trading Volume | HKD 47.10 | ||||||||
| $ | 1,199 | Discount of Publicly Trading Quote | Discount Applied to Last Exchange Price | | HKD 0.15 (88% Discount) | | ||||||
| AllianzGI Best Styles International Equity: | ||||||||||||
| Investments in Securities – Assets | Ending Balance at 5/31/15 | Valuation Technique Used | Unobservable Inputs | Input Values | ||||||||
Common Stock | $ | 74,159 | Last Exchange-Traded Closing Price | Trading Volume | HKD 115.00 | |||||||
| AllianzGI China Equity: | ||||||||||||
| Investments in Securities – Assets | Ending Balance at 5/31/15 | Valuation Technique Used | Unobservable Inputs | Input Values | ||||||||
Common Stock | $ | 166,373 | Last Exchange-Traded Closing Price | Trading Volume | HKD 15.00 | |||||||
| AllianzGI Emerging Markets Consumer: | ||||||||||||
| Investments in Securities – Assets | Ending Balance at 5/31/15 | Valuation Technique Used | Unobservable Inputs | Input Values | ||||||||
Common Stock | $ | 233,658 | Fundamental Analytical Data Relating to the Investment | Price of Stock | HKD 3.30 | |||||||
| AllianzGI Emerging Markets Debt: | ||||||||||||
| Investments in Securities – Assets | Ending Balance at 5/31/15 | Valuation Technique Used | Unobservable Inputs | Input Values | ||||||||
Sovereign Debt Obligations | $ | 248,125 | Third-Party Pricing Vendor | Single Broker Quote | $ | 99.25 | ||||||
| 302 | May 31, 2015 | | Semiannual Report |
Table of Contents
| AllianzGI Emerging Markets Small-Cap: | ||||||||||||
Investments in Securities – Assets | Ending Balance at 5/31/15 | Valuation Technique Used | Unobservable Inputs | Input Values | ||||||||
Common Stock | $ | 48,013 | Value of Foreign Security Traded on Foreign Exchange | Price of Non-Resident Shares on Foreign Exchange | $ | 0.28-$42.18 | ||||||
| AllianzGI International Small-Cap: | ||||||||||||
| Investments in Securities – Assets | Ending Balance at 5/31/15 | Valuation Technique Used | Unobservable Inputs | Input Values | ||||||||
Common Stock | $ | 613,666 | Value of Foreign Security Traded on Foreign Exchange | Price of Non-Resident Shares on Foreign Exchange | THB 6.99 | |||||||
| $ | 31,414 | Fundamental Analytical Data Relating to the Investment | Price of Interim Share | SEK 5.00 | ||||||||
AllianzGI Multi-Asst real Return: | ||||||||||||
| Investments in Securities – Assets | Ending Balance at 5/31/15 | Valuation Technique Used | Unobservable Inputs | Input Values | ||||||||
Common Stock | $ | 10,302 | Fundamental Analytical Data Relating to the Investment | Trading Volume | HKD 47.10 | |||||||
| AllianzGI NFJ Emerging Markets Value: | ||||||||||||
| Investments in Securities – Assets | Ending Balance at 5/31/15 | Valuation Technique Used | Unobservable Inputs | Input Values | ||||||||
Common Stock | $ | 303,888 | Value of Foreign Security Traded on Foreign Exchange | Price of Non-Resident Shares on Foreign Exchange | $ | 1.37-$46.85 | ||||||
Preferred Stock | $ | 56,547 | Value of Foreign Security Traded on Foreign Exchange | Price of Non-Resident Shares on Foreign Exchange | $ | 0.71 | ||||||
| AllianzGI NFJ International Value II: | ||||||||||||
| Investments in Securities – Assets | Ending Balance at 5/31/15 | Valuation Technique Used | Unobservable Inputs | Input Values | ||||||||
Common Stock | $ | 151,864 | Fundamental Analytical Data Relating to the Investment | Trading Volume | HKD 47.10 | |||||||
HKD – Hong Kong Dollar
MYR – Malaysian Ringgit
SEK – Swedish Krona
THB – Thai Baht
| * | Other financial instruments are derivatives, such as swap agreements, futures contracts and forward foreign currency contracts, which are valued at the unrealized appreciation (depreciation) of the instrument. |
| ** | Commencement of operations. |
The net change in unrealized appreciation/depreciation of Level 3 investments which the following Funds held at May 31, 2015 was:
AllianzGI Best Styles Emerging Markets Equity | $ | 4,859 | ||
AllianzGI Best Styles Global Equity | (15,939 | ) | ||
AllianzGI Best Styles International Equity | 14,726 | |||
AllianzGI China Equity | 78,879 | |||
AllianzGI Emerging Markets Consumer | (148,753 | ) | ||
AllianzGI Emerging Markets Debt | (1,875 | ) |
AllianzGI Emerging Markets Small-Cap | $ | 8,833 | ||
AllianzGI International Small-Cap | 19,683 | |||
AllianzGI Multi-Asset Real Return | 2,802 | |||
AllianzGI NFJ Emerging Markets Value | 30,357 | |||
AllianzGI NFJ International Value II | 26,510 |
Net realized gain (loss) and net change in unrealized appreciation/depreciation are reflected on the Statements of Operations.
| Semiannual Report | | May 31, 2015 | 303 |
Table of Contents
Notes to Financial Statements (cont’d)
May 31, 2015 (Unaudited)
(c) Investment Transactions and Investment Income. Investment transactions are accounted for on the trade date. Securities purchased and sold on a when-issued or delayed-delivery basis may be settled a month or more after the trade date. Realized gains and losses on investments are determined on an identified cost basis. Interest income adjusted for the accretion of discount and amortization of premiums is recorded on an accrual basis. Discounts or premiums on debt securities purchased are accreted or amortized, respectively, to interest income. Conversion premium is not amortized. Dividend income is recorded on the ex-dividend date, except for certain dividends from foreign securities where the ex-dividend date may have passed, and then are recorded as soon after the ex-dividend date as the Funds, using reasonable diligence, become aware of such dividends. Dividend and interest income on the Statements of Operations are shown net of any foreign taxes withheld on income from foreign securities. Payments received from real estate investment trust securities may be comprised of dividends, realized gains and return of capital. The payment may initially be recorded as dividend income and may subsequently be reclassified as realized gains and/or return of capital upon receipt of information from the issuer. Payments considered return of capital reduce the cost basis of the respective security. Dividends from underlying funds are recorded as dividend income, while capital gain distributions are recorded as net capital gain distributions received from underlying funds on the Statements of Operations. Facility fees and other fees (such as origination fees) received on settlement date are amortized as income over the expected term of the senior loan. Facility fees and other fees received after settlement date relating to senior loans and consent fees relating to corporate actions are recorded as miscellaneous income upon receipt. Expenses are recorded on an accrual basis and such expenses exclude those of the underlying funds. Expenses of the underlying funds are reflected in the net asset values of those funds.
(d) Federal Income Taxes. The Funds intend to distribute all of their taxable income and to comply with the other requirements of Subchapter M of the U.S. Internal Revenue Code of 1986, as amended, applicable to regulated investment companies. Accordingly, no provision for U.S. federal income taxes is required. The Funds may be subject to excise tax based on distributions to shareholders.
Accounting for uncertainty in income taxes establishes for all entities, including pass-through entities such as the Funds, a minimum threshold for financial statement recognition of the benefit of positions taken in filing tax returns (including whether an entity is taxable in a particular jurisdiction), and requires certain expanded tax disclosures. In accordance with provisions set forth under U.S. GAAP, the Investment Manager has reviewed the Funds’ tax positions for all open tax years. As of May 31, 2015, the Funds have recorded no liability for net unrecognized tax benefits relating to uncertain income tax positions they have taken. The Funds’ federal income tax returns for the prior three years, as applicable, remain subject to examination by the Internal Revenue Service.
(e) Dividends and Distributions to Shareholders. The Funds (except AllianzGI Retirement Income, AllianzGI Global Allocation,
AllianzGI Convertible, AllianzGI Emerging Markets Debt, AllianzGI Europe Equity Dividend, AllianzGI High Yield Bond, AllianzGI NFJ Emerging Markets Value, AllianzGI NFJ Global Dividend Value, AllianzGI NFJ International Value II and AllianzGI Short Duration High Income) declare dividends and distributions from net investment income and net realized capital gains, if any, annually. AllianzGI Retirement Income, AllianzGI Global Allocation, AllianzGI Convertible, AllianzGI Emerging Markets Debt, AllianzGI Europe Equity Dividend, AllianzGI NFJ Emerging Markets Value, AllianzGI NFJ Global Dividend Value and AllianzGI NFJ International Value II declare dividends from net investment income quarterly and distributions from net realized capital gains, if any, annually. AllianzGI High Yield Bond and AllianzGI Short Duration High Income declare dividends from net investment income monthly and distributions from net realized capital gains, if any, annually. The Funds record dividends and distributions to their respective shareholders on the ex-dividend date. The amount of dividends from net investment income and distributions from net realized capital gains is determined in accordance with federal income tax regulations, which may differ from U.S. GAAP. These “book-tax” differences are considered either temporary or permanent in nature. To the extent these differences are permanent in nature, such amounts are reclassified within the capital accounts based on their federal income tax treatment; temporary differences do not require reclassification. To the extent dividends and/or distributions exceed current and accumulated earnings and profits for federal income tax purposes, they are reported as dividends and/or distributions to shareholders from return of capital.
(f) Multi-Class Operations. Each class offered by the Trust has equal rights as to assets and voting privileges (except that shareholders of a class have exclusive voting rights regarding any matter relating solely to that class of shares). Income, non-class specific expenses, and realized and unrealized capital gains and losses of each Fund are allocated daily to each class of shares based on the relative net assets of each class. Class specific expenses, where applicable, include administration, administrative servicing, distribution, recoupment, servicing and sub-transfer agent fees.
(g) Foreign Currency Translation. The Funds’ accounting records are maintained in U.S. dollars as follows: (1) the foreign currency market values of investments and other assets and liabilities denominated in foreign currencies are translated at the prevailing exchange rate at the end of the period; and (2) purchases and sales, income and expenses are translated at the prevailing exchange rate on the respective dates of such transactions. The resulting net foreign currency gain (loss) is included in the Funds’ Statements of Operations.
The Funds do not generally isolate that portion of the results of operations arising as a result of changes in foreign currency exchange rates from the fluctuations arising from changes in the market prices of securities. Accordingly, such foreign currency gain (loss) is included in net realized and unrealized gain (loss) on investments. However, the Funds do isolate the effect of fluctuations in foreign currency exchange rates when determining the gain (loss) upon the sale or
| 304 | May 31, 2015 | | Semiannual Report |
Table of Contents
maturity of foreign currency denominated debt obligations pursuant to U.S. federal income tax regulations; such amount is categorized as foreign currency gain (loss) for both financial reporting and income tax reporting purposes.
(h) Repurchase Agreements. The Funds are parties to Master Repurchase Agreements (“Master Repo Agreements”) with select counterparties. The Master Repo Agreements maintain provisions for initiation, income payments, events of default, and maintenance of collateral.
The Funds enter into transactions, under the Master Repo Agreements, with their custodian bank or securities brokerage firms whereby they purchase securities under agreements to resell such securities at an agreed upon price and date (“repurchase agreements”). The Funds, through their custodian, take possession of securities collateralizing the repurchase agreement. Such agreements are carried at the contract amount in the financial statements, which is considered to represent fair value. Collateral pledged (the securities received), which consists primarily of U.S. government obligations and asset-backed securities, is held by the custodian bank for the benefit of the Funds until maturity of the repurchase agreement. Provisions of the repurchase agreements and the procedures adopted by the Funds require that the market value of the collateral, including accrued interest thereon, be sufficient in the event of default by the counterparty. If the counterparty defaults under the Master Repo Agreements, and the value of the collateral declines or if the counterparty enters an insolvency proceeding, realization of the collateral by the Funds may be delayed or limited. The gross values are included in the Funds’ Schedules of Investments. The value of the related collateral exceeded the value of the repurchase agreements at May 31, 2015.
(i) Equity-Linked Securities. Certain Funds invest in equity-linked securities such as participatory notes (“P-Notes”). P-Notes are used to gain exposure to issuers in certain countries with a costly or lengthy registration process. They are generally traded over-the-counter and constitute general unsecured contractual obligations of the banks or broker-dealers that issue them. Generally, banks and broker-dealers associated with non-U.S.-based brokerage firms buy securities listed on certain foreign exchanges and then issue P-Notes which are designed to replicate the performance of certain issuers and markets. To the extent that the Funds invest in equity-linked securities whose return corresponds to the performance of a foreign securities index or one or more foreign stocks, investing in equity-linked securities will involve risks similar to the risks of investing in foreign securities. In addition, the Funds bear the risk that the issuer of an equity-linked security may default on its obligation under the terms of the arrangement with the counterparty.
(j) Warrants. The Funds may receive warrants. Warrants are securities that are usually issued together with a debt security or preferred stock and that give the holder the right to buy a proportionate amount of common stock at a specified price. Warrants may be freely transferable and are often traded on major exchanges.
Warrants normally have a life that is measured in years and entitle the holder to buy common stock of a company at a price that is usually higher than the market price at the time the warrant is issued. Warrants may entail greater risks than certain other types of investments. Generally, warrants do not carry the right to receive dividends or exercise voting rights with respect to the underlying securities, and they do not represent any rights in the assets of the issuer. In addition, their value does not necessarily change with the value of the underlying securities, and they cease to have value if they are not exercised on or before their expiration date. If the market price of the underlying stock does not exceed the exercise price during the life of the warrant, the warrant will expire worthless. Warrants may increase the potential profit or loss to be realized from the investment as compared with investing the same amount in the underlying securities. Similarly, the percentage increase or decrease in the value of an equity security warrant may be greater than the percentage increase or decrease in the value of the underlying common stock. Warrants may relate to the purchase of equity or debt securities. Debt obligations with warrants attached to purchase equity securities have many characteristics of convertible securities and their prices may, to some degree, reflect the performance of the underlying stock. Debt obligations also may be issued with warrants attached to purchase additional debt securities at the same coupon rate. A decline in interest rates would permit a Fund to sell such warrants at a profit. If interest rates rise, these warrants would generally expire with no value.
(k) Rights. The Funds may receive rights. A right is a privilege granted to existing shareholders of a corporation to subscribe for shares of a new issue of common stock before it is issued. Rights normally have a short life, usually two to four weeks, are freely transferable and entitle the holder to buy the new common stock at a lower price than the public offering price. Rights may entail greater risks than certain other types of investments. Generally, rights do not carry the right to receive dividends or exercise voting rights with respect to the underlying securities, and they do not represent any rights in the assets of the issuer. In addition, their value does not necessarily change with the value of the underlying securities, and they cease to have value if they are not exercised on or before their expiration date. If the market price of the underlying stock does not exceed the exercise price during the life of the right, the right will expire worthless. Rights may increase the potential profit or loss to be realized from the investment as compared with investing the same amount in the underlying securities.
(l) Senior Loans. The Funds may purchase assignments of, and participations in, Senior Loans originated, negotiated and structured by a U.S. or foreign commercial bank, insurance company, finance company or other financial institution (the “Agent”) for a lending syndicate of financial institutions (the “Lender”). When purchasing an assignment, the Funds succeed to all the rights and obligations under the loan agreement with the same rights and obligations as the assigning Lender. Assignments may, however, be arranged through private negotiations between potential assignees and potential
| Semiannual Report | | May 31, 2015 | 305 |
Table of Contents
Notes to Financial Statements (cont’d)
May 31, 2015 (Unaudited)
assignors, and the rights and obligations acquired by the purchaser of an assignment may differ from, and be more limited than, those held by the assigning Lender.
(m) U.S. Government Agencies or Government-Sponsored Enterprises. Securities issued by U.S. Government agencies or government-sponsored enterprises may not be guaranteed by the U.S. Treasury. The Government National Mortgage Association (“GNMA” or “Ginnie Mae”), a wholly-owned U.S. Government corporation, is authorized to guarantee, with the full faith and credit of the U.S. Government, the timely payment of principal and interest on securities issued by institutions approved by GNMA and backed by pools of mortgages insured by the Federal Housing Administration or guaranteed by the Department of Veterans Affairs. Government-related guarantors not backed by the full faith and credit of the U.S. Government include the Federal National Mortgage Association (“FNMA” or “Fannie Mae”) and the Federal Home Loan Mortgage Corporation (“FHLMC” or “Freddie Mac”). Pass-through securities issued by FNMA are guaranteed as to timely payment of principal and interest by FNMA, but are not backed by the full faith and credit of the U.S. Government. FHLMC guarantees the timely payment of interest and ultimate collection of principal, but its participation certificates are not backed by the full faith and credit of the U.S. Government.
(n) Exchange-Traded Funds. Certain Funds may invest in exchange-traded funds (“ETFs”), which typically are index-based investment companies that hold substantially all of their assets in securities representing their specific index, but may also be actively-managed investment companies. Shares of ETFs trade throughout the day on an exchange and represent an investment in a portfolio of securities and other assets. As a shareholder of another investment company, the Funds would bear their pro rata portion of the other investment company’s expenses, including advisory fees, in addition to the expenses the Funds bear directly in connection with their own operations.
(o) Inflation-Indexed Bonds. Certain Funds may invest in inflation-indexed bonds. Inflation-indexed bonds are fixed income securities whose principal value is periodically adjusted to the rate of inflation. The interest rate on these bonds is generally fixed at issuance at a rate lower than typical bonds. Over the life of an inflation-indexed bond, however, interest will be paid based on a principal value which is adjusted for inflation.
(p) When-Issued/Delayed-Delivery Transactions. When-issued or delayed-delivery transactions involve a commitment to purchase or sell securities for a predetermined price or yield, with payment and delivery taking place beyond the customary settlement period. When delayed-delivery purchases are outstanding, the Funds will set aside and maintain until the settlement date in a designated account, liquid assets in an amount sufficient to meet the purchase price. When purchasing a security on a delayed-delivery basis, the Funds assume the rights and risks of ownership of the security, including the risk of price and yield fluctuations; consequently, such fluctuations are taken into account when determining the NAV. The Funds may dispose of or
renegotiate a delayed-delivery transaction after it is entered into, and may sell when-issued securities before they are delivered, which may result in a realized gain or loss. When a security is sold on a delayed-delivery basis, the Funds do not participate in future gains and losses with respect to the security.
(q) Organizational and Offering Costs. Organizational costs are expensed at the inception of a Fund. Offering costs are amortized over a twelve-month period from the inception of a Fund.
| 2. | PRINCIPAL RISKS |
In the normal course of business, the Funds trade financial instruments and enter into financial transactions where risk of potential loss exists due to, among other things, changes in the market (market risk) or failure of the other party to a transaction to perform (counterparty risk). The Funds are also exposed to other risks such as, but not limited to, interest rate, foreign currency, credit and leverage risks.
Interest rate risk is the risk that fixed income securities will decline in value because of changes in interest rates. As nominal interest rates rise, the values of certain fixed income securities held by the Funds are likely to decrease. A nominal interest rate can be described as the sum of a real interest rate and an expected inflation rate. Fixed income securities with longer durations tend to be more sensitive to changes in interest rates, usually making them more volatile than securities with shorter durations. Duration is used primarily as a measure of the sensitivity of a fixed income security’s market price to interest rate (i.e. yield) movements. Interest rate changes can be sudden and unpredictable, and the Funds may lose money as a result of movements in interest rates. The Funds may not be able to hedge against changes in interest rates or may choose not to do so for cost or other reasons. In addition, any hedges may not work as intended.
Variable and floating rate securities generally are less sensitive to interest rate changes but may decline in value if their interest rates do not rise as much, or as quickly, as interest rates in general. Conversely, floating rate securities will not generally increase in value if interest rates decline. Inverse floating rate securities may decrease in value if interest rates increase. Inverse floating rate securities may also exhibit greater price volatility than a fixed rate obligation with similar credit quality. When the Funds hold variable or floating rate securities, a decrease (or, in the case of inverse floating rate securities, an increase) in market interest rates will adversely affect the income received from such securities and the NAV of the Funds’ shares.
The Funds are exposed to credit risk, which is the risk of losing money if the issuer or guarantor of a fixed income security is unable or unwilling, or is perceived (whether by market participants, rating agencies, pricing services or otherwise) as unable or unwilling, to make timely principal and/or interest payments, or to otherwise honor its obligations. Securities are subject to varying degrees of credit risk, which are often reflected in credit ratings.
To the extent the Funds directly invest in foreign currencies or in securities that trade in, and receive revenues in, foreign currencies, or
| 306 | May 31, 2015 | | Semiannual Report |
Table of Contents
in derivatives that provide exposure to foreign currencies, they will be subject to the risk that those currencies will decline in value relative to the U.S. dollar, or, in the case of hedging positions, that the U.S. dollar will decline in value relative to the currency being hedged. Currency rates in foreign countries may fluctuate significantly over short periods of time for a number of reasons, including economic growth, inflation, changes in interest rates, intervention (or the failure to intervene) by U.S. or foreign governments, central banks or supranational entities such as the International Monetary Fund, or the imposition of currency controls or other political developments in the United States or abroad. As a result, the Funds’ investments in foreign currency-denominated securities may reduce the returns of the Funds. The local emerging market currencies in which the Funds may be invested may experience substantially greater volatility against the U.S. dollar than the major convertible currencies in developed countries.
The Funds are subject to elements of risk not typically associated with investments in the U.S., due to concentrated investments in foreign issuers located in a specific country or region. Such concentrations will subject the Funds to additional risks resulting from future political or economic conditions in such country or region and the possible imposition of adverse governmental laws or currency exchange restrictions affecting such country or region, which could cause the securities and their markets to be less liquid and prices more volatile than those of comparable U.S. companies.
The market values of securities may decline due to general market conditions (market risk) which are not specifically related to a particular company, such as real or perceived adverse economic conditions, changes in the general outlook for corporate earnings, changes in interest or currency rates, adverse changes to credit markets or adverse investor sentiment. They may also decline due to factors that affect a particular industry or industries, such as labor shortages or increased production costs and competitive conditions within an industry. Equity securities and equity-related investments generally have greater market price volatility than fixed income securities, although under certain market conditions fixed income securities may have comparable or greater price volatility. Credit ratings downgrades may also negatively affect securities held by the Funds. Even when markets perform well, there is no assurance that the investments held by the Funds will increase in value along with the broader market. In addition, market risk includes the risk that geopolitical events will disrupt the economy on a national or global level.
The Funds are exposed to counterparty risk, or the risk that an institution or other entity with which the Funds have unsettled or open transactions will default. The potential loss to the Funds could exceed the value of the financial assets recorded in the Funds’ financial statements. Financial assets, which potentially expose the Funds to counterparty risk, consist principally of cash due from counterparties and investments. The Sub-Advisers seek to minimize the Funds’ counterparty risk by performing reviews of each counterparty and by minimizing concentration of counterparty risk by undertaking transactions with multiple customers and counterparties on recognized and reputable exchanges. Delivery of securities sold is only
made once the Funds have received payment. Payment is made on a purchase once the securities have been delivered by the counterparty. The trade will fail if either party fails to meet its obligation.
The Funds are exposed to risks associated with leverage. Leverage may cause the value of the Funds’ shares to be more volatile than if the Funds did not use leverage. This is because leverage tends to exaggerate the effect of any increase or decrease in the value of the Funds’ portfolio securities. The Funds may engage in transactions or purchase instruments that give rise to forms of leverage. In addition, to the extent the Funds employ leverage, dividend and interest costs may not be recovered by any appreciation of the securities purchased with the leverage proceeds and could exceed the Funds’ investment returns, resulting in greater losses.
The Funds may hold defaulted securities that may involve special considerations including bankruptcy proceedings, other regulatory and legal restrictions affecting the Funds’ ability to trade, and the availability of prices from independent pricing services or dealer quotations. Defaulted securities may also be illiquid and may not be actively traded. Sale of securities in bankrupt companies at an acceptable price may be difficult and differences compared to the value of the securities used by the Funds could be material. A Fund may incur additional expenses to the extent it is required to seek recovery upon a portfolio security’s default in the payment of principal or interest. In any bankruptcy proceeding relating to a defaulted investment, a Fund may lose its entire investment or may be required to accept cash or securities with a value substantially less than its original investment.
The Funds are party to International Swaps and Derivatives Association, Inc. Master Agreements (“ISDA Master Agreements”) with select counterparties that govern transactions, over-the-counter derivatives and foreign exchange contracts entered into by the Funds and those counterparties. The ISDA Master Agreements contain provisions for general obligations, representations, agreements, collateral and events of default or termination. Events of termination include conditions that may entitle counterparties to elect to terminate early and cause settlement of all outstanding transactions under the applicable ISDA Master Agreement. Any election to terminate early could be material to the financial statements of the Funds.
The considerations and factors surrounding the settlement of certain purchases and sales made on a delayed-delivery basis are governed by Master Securities Forward Transaction Agreements (“Master Forward Agreements”) between the Funds and select counterparties. The Master Forward Agreements maintain provisions for, among other things, initiation and confirmation, payment and transfer, events of default, termination, and maintenance of collateral.
The counterparty risk associated with certain contracts may be reduced by master netting arrangements to the extent that if an event of default occurs, all amounts with the counterparty are terminated and settled on a net basis. The Funds’ overall exposure to counterparty risk with respect to transactions subject to master netting arrangements can change substantially within a short period, as it is affected by each transaction subject to the arrangement.
| Semiannual Report | | May 31, 2015 | 307 |
Table of Contents
Notes to Financial Statements (cont’d)
May 31, 2015 (Unaudited)
| 3. | UNDERLYING FUNDS AND OTHER ACQUIRED FUNDS RISK |
AllianzGI Retirement 2015, AllianzGI Retirement 2020, AllianzGI Retirement 2025, AllianzGI Retirement 2030, AllianzGI Retirement 2035, AllianzGI Retirement 2040, AllianzGI Retirement 2045, AllianzGI Retirement 2050, AllianzGI Retirement 2055 and AllianzGI Retirement Income (collectively the “Target Date Funds”) and AllianzGI Global Megatrends intend to invest their assets primarily in series of Allianz Funds, Allianz Funds Multi-Strategy Trust, PIMCO Equity Series, PIMCO Funds and PIMCO ETF Trust (together, “Underlying Funds”). AllianzGI Global Allocation, AllianzGI Global Dynamic Allocation, AllianzGI Emerging Markets Debt, Allianz Global Fundamental Strategy and AllianzGI Multi-Asset Real Return may invest their assets partially, significantly or primarily in Underlying Funds. The Funds may also invest a portion of their assets in unaffiliated ETFs and mutual funds and pooled vehicles (together, “Other Acquired Funds”). AllianzGI Structured Return and AllianzGI U.S. Equity Hedged expect to achieve their exposure to equity securities by investing in Other Acquired Funds. Accordingly, the investment performance of the Funds depends upon a favorable allocation among the Underlying Funds and Other Acquired Funds as well as the ability of the Underlying Funds and Other Acquired Funds to achieve their objectives. There can be no assurance that the investment objective of any Underlying Fund or Other Acquired Fund will be achieved. The risks associated with investing in each Fund are closely related to the risks associated with the securities and other investments held by the Underlying Funds and Other Acquired Funds.
Investing in the Underlying Funds and Other Acquired Funds involves certain additional expenses and tax results that would not be present in a direct investment in the Underlying Funds or Other Acquired Funds. Each Fund’s net asset value will fluctuate in response to changes in the net asset values of the Underlying Funds and Other Acquired Funds in which it invests. The extent to which the investment performance and risks associated with each Fund correlate to those of a particular Underlying Fund or Other Acquired Fund will depend upon the extent to which each Fund’s assets are allocated from time to time for investment in the Underlying Fund or Other Acquired Fund, which will vary. Each Fund’s investment in a particular Underlying Fund may exceed 25% of its assets. To the extent that a Fund invests a significant portion of its assets in an Underlying Fund, it will be particularly sensitive to the risks associated with that Underlying Fund.
| 4. | FINANCIAL DERIVATIVE INSTRUMENTS |
Disclosure about derivatives and hedging activities requires qualitative disclosure regarding objectives and strategies for using derivatives, quantitative disclosure about fair value amounts of gains and losses on derivatives, and disclosure about credit-risk-related contingent features in derivative agreements. The disclosure requirements distinguish between derivatives which are accounted for as “hedges”, and those that do not qualify for such accounting. Although the Funds at times use derivatives for hedging purposes, the Funds reflect derivatives at fair value and recognize changes in fair value through the Funds’ Statements of Operations, and such derivatives do not qualify for hedge accounting treatment.
During the six months ended May 31, 2015, AllianzGI Emerging Markets Debt and AllianzGI Global Fundamental Strategy were subject to regulation as a commodity pool under the Commodity Exchange Act pursuant to recent rule changes by the Commodity Futures Trading Commission (the “CFTC”). The Investment Manager has registered with the CFTC as a Commodity Pool Operator, AllianzGI U.S. has registered with the CFTC as a Commodity Trading Adviser, and both entities are members of the National Futures Association. As a result, additional CFTC-mandated disclosure, reporting and recordkeeping obligations applied with respect to AllianzGI Emerging Markets Debt and AllianzGI Global Fundamental Strategy. Compliance with the CFTC’s regulatory requirements could increase these Funds’ expenses, adversely affecting their total returns. Effective March 20, 2015, AllianzGI Emerging Markets Debt and AllianzGI Global Fundamental Strategy were no longer subject to regulation as commodity pools under the Commodity Exchange Act pursuant to recent rule changes by the CFTC.
Option Transactions. The Funds purchase put and call options on securities and indices for hedging purposes, risk management purposes or otherwise as part of their investment strategies. The risks associated with purchasing an option include the risk that the Funds pay a premium whether or not the option is exercised. Additionally, the Funds bear the risk of loss of premiums and changes in market value should the counterparty not perform under the contract. Put and call options purchased are accounted for in the same manner as portfolio securities. The cost of securities acquired through the exercise of call options is increased by the premiums paid. The proceeds from securities sold through the exercise of put options are decreased by the premiums paid.
The Funds may write (sell) put and call options on securities and indices to earn premiums, for hedging purposes, risk management purposes or otherwise as part of their investment strategies. When an option is written, the premium received is recorded as an asset with an equal liability that is subsequently marked to market to reflect the market value of the option written. These liabilities, if any, are reflected as options written in the Funds’ Statements of Assets and Liabilities. Premiums received from writing options which expire unexercised are recorded on the expiration date as a realized gain. The difference between the premium received and the amount paid on effecting a closing purchase transaction, including brokerage commissions, is also treated as a realized gain, or if the premium is less than the amount paid for the closing purchase transaction, as a realized loss. If a call option written is exercised, the premium is added to the proceeds from the sale of the underlying security in determining whether there has been a realized gain or loss. If a put option written is exercised, the premium reduces the cost basis of the security. In writing an option, the Funds bear the market risk of an unfavorable change in the price of the security underlying the written option. Exercise of a written option could result in the Funds purchasing a security at a price different from its current market value.
Futures Contracts. The Funds use futures contracts to manage their exposure to the securities markets or the movements in interest rates
| 308 | May 31, 2015 | | Semiannual Report |
Table of Contents
and currency values. A futures contract is an agreement between two parties to buy and sell a financial instrument at a set price on a future date. Upon entering into such a contract, the Funds are required to pledge to the broker an amount of cash or securities equal to the minimum “initial margin” requirements of the exchange. Pursuant to the contracts, the Funds agree to receive from or pay to the broker an amount of cash or securities equal to the daily fluctuation in the value of the contracts. Such receipts or payments are known as “variation margin” and are recorded by the Funds as unrealized appreciation or depreciation. When the contracts are closed, the Funds record a realized gain or loss equal to the difference between the value of the contracts at the time they were opened and the value at the time they were closed. Any unrealized appreciation or depreciation recorded is simultaneously reversed. The use of futures transactions involves various risks, including the risk of an imperfect correlation in the movements in the price of futures contracts, interest rates and underlying hedging assets, and possible inability or unwillingness of counterparties to meet the terms of their contracts.
Swap Agreements. Swap agreements are bilaterally negotiated agreements between the Funds and a counterparty to exchange or swap investment cash flows, assets, foreign currencies or market or event-linked returns at specified, future intervals. Swap agreements may be privately negotiated in the over-the-counter market (“OTC swaps”) or may be executed in a multilateral or other trade facility platform, such as a registered commodities exchange (“centrally cleared swaps”). The Funds may enter into credit default, cross-currency, interest rate, total return, variance and other forms of swap agreements in order, among other things, manage their exposure to credit, currency and interest rate risk. In connection with these agreements, securities or cash may be identified as collateral or margin in accordance with the terms of the respective swap agreements to provide assets of value and recourse in the event of default or bankruptcy/insolvency.
OTC swap payments received or made at the beginning of the measurement period, if any, are reflected as such on the Funds’ Statements of Assets and Liabilities and represent payments made or received upon entering into the swap agreement to compensate for differences between the stated terms of the swap agreement and prevailing market conditions (credit spreads, currency exchange rates, interest rates, and other relevant factors). These upfront payments are recorded as realized gains or losses on the Funds’ Statements of Operations upon termination or maturity of the swap. A liquidation payment received or made at the termination of the swap is recorded as realized gain or loss on the Funds’ Statements of Operations. Net periodic payments received or paid by the Funds are included as part of realized gains or losses on the Funds’ Statements of Operations. Changes in market value, if any, are reflected as a component of net changes in unrealized appreciation/depreciation on the Funds’ Statements of Operations.
Entering into these agreements involves, to varying degrees, elements of credit, legal, market and documentation risk in excess of the amounts recognized on the Funds’ Statements of Assets and
Liabilities. Such risks include the possibility that there will be no liquid market for these agreements, that the counterparties to the agreements may default on their obligation to perform or disagree as to the meaning of contractual terms in the agreements and that there may be unfavorable changes in interest rates.
Credit Default Swap Agreements—Credit default swap agreements involve one party (referred to as the buyer of protection) making a stream of payments to another party (the seller of protection) in exchange for the right to receive a specified return in the event of a default or other credit event for the referenced entity, obligation or index. As the sellers of protection on credit default swap agreements, the Funds will generally receive from the buyer of protection a fixed rate of income throughout the term of the swap provided that there is no credit event. As the sellers, the Funds would effectively add leverage to their investment portfolios because, in addition to their total net assets, the Funds would be subject to investment exposure on the notional amount of the swap.
If the Funds are sellers of protection and a credit event occurs, as defined under the terms of that particular swap agreement, a Fund will either (i) pay to the buyer of protection an amount equal to the notional amount of the swap and take delivery of the referenced obligation, other deliverable obligations or underlying securities comprising the referenced index or (ii) pay a net settlement amount in the form of cash or securities equal to the notional amount of the swap less the recovery value of the referenced obligation or underlying securities comprising the referenced index. If the Funds are buyers of protection and a credit event occurs, as defined under the terms of that particular swap agreement, a Fund will either (i) receive from the seller of protection an amount equal to the notional amount of the swap and deliver the referenced obligation, other deliverable obligations or underlying securities comprising the referenced index or (ii) receive a net settlement amount in the form of cash or securities equal to the notional amount of the swap less the recovery value of the referenced obligation or underlying securities comprising the referenced index. Recovery values are assumed by market makers considering either industry standard recovery rates or entity specific factors and considerations until a credit event occurs. If a credit event has occurred, the recovery value is determined by a facilitated auction whereby a minimum number of allowable broker bids, together with a specified valuation method, are used to calculate the settlement value.
Credit default swap agreements on corporate or sovereign issues involve one party making a stream of payments to another party in exchange for the right to receive a specified return in the event of a default or other credit event. If a credit event occurs and cash settlement is not elected, a variety of other deliverable obligations may be delivered in lieu of the specific referenced obligation. The ability to deliver other obligations may result in a cheapest-to-deliver option (the buyer of protection’s right to choose the deliverable obligation with the lowest value following a credit event). The Funds use credit default swaps on corporate or sovereign issues to provide a measure of protection against defaults of the issuers (i.e., to reduce risk where
| Semiannual Report | | May 31, 2015 | 309 |
Table of Contents
Notes to Financial Statements (cont’d)
May 31, 2015 (Unaudited)
the Funds own or have exposure to the referenced obligation) or to take an active long or short position with respect to the likelihood of a particular issuer’s default.
Credit default swap agreements on asset-backed securities involve one party making a stream of payments to another party in exchange for the right to receive a specified return in the event of a default or other credit events. Unlike credit default swaps on corporate or sovereign issues, deliverable obligations in most instances would be limited to the specific referenced obligation as performance for asset-backed securities can vary across deals. Prepayments, principal paydowns, and other write-down or loss events on the underlying mortgage loans will reduce the outstanding principal balance of the referenced obligation. These reductions may be temporary or permanent as defined under the terms of the swap agreement and the notional amount of the swap agreement will be adjusted by corresponding amounts. The Funds use credit default swaps on asset-backed securities to provide a measure of protection against defaults of the referenced obligation or to take an active long or short position with respect to the likelihood of a particular referenced obligation’s default.
Credit default swap agreements on credit indices involve one party making a stream of payments to another party in exchange for the right to receive a specified return in the event of a write-down, principal shortfall, interest shortfall or default of all or part of the referenced entities comprising the credit index. A credit index is a basket of credit instruments or exposures designed to be representative of some part of the credit market as a whole. These indices are made up of reference credits that are judged by a poll of dealers to be the most liquid entities in the credit default swap market based on the sector of the index. Components of the indices may include, but are not limited to, investment grade securities, high yield securities, asset backed securities, emerging markets, and/or various credit ratings within each sector. Credit indices are traded using credit default swaps with standardized terms including a fixed spread and standard maturity dates. An index credit default swap references all the names in the index, and if there is a default, the credit event is settled based on that name’s weight in the index, or in the case of a tranched index credit default swap, the credit event is settled based on the name’s weight in the index that falls within the tranche for which the Funds bear exposure. The composition of the indices changes periodically, usually every six months, and for most indices, each name has an equal weight in the index. The Funds use credit default swaps on credit indices to hedge a portfolio of credit default swaps or bonds, which is less expensive than it would be to buy many credit default swaps to achieve a similar effect. Credit-default swaps on indices are benchmarks for protecting investors owning bonds against default, and traders use them to speculate on changes in credit quality.
Implied credit spreads, represented in absolute terms, utilized in determining the market value of credit default swap agreements on corporate or sovereign issues as of period end are disclosed in Note 7(b), serve as an indicator of the current status of the payment/performance risk, and represent the likelihood or risk of default for the credit derivative. The implied credit spread of a particular referenced entity reflects the cost of buying/selling protection and may include upfront payments required to be made to enter into the agreement. For credit default swap agreements on asset-backed securities and credit indices, the quoted market prices and resulting values serve as the indicator of the current status of the payment/performance risk. Wider credit spreads and increasing market values, in absolute terms when compared to the notional amount of the swap, represent a deterioration of the referenced entity’s credit soundness and a greater likelihood or risk of default or other credit event occurring as defined under the terms of the agreement.
The maximum potential amount of future payments (undiscounted) that the Funds as sellers of protection could be required to make under a credit default swap agreement would be an amount equal to the notional amount of the agreement. Notional amounts of all credit default swap agreements outstanding as of May 31, 2015 for which the Funds are sellers of protection are disclosed in Note 7(b). These potential amounts would be partially offset by any recovery values of the respective referenced obligations, upfront payments received upon entering into the agreement, or net amounts received from the settlement of buy protection credit default swap agreements entered into by the Funds for the same referenced entity or entities.
Forward Foreign Currency Contracts. A forward foreign currency contract is an agreement between two parties to buy and sell a currency at a set exchange rate on a future date. The Funds enter into forward foreign currency contracts for the purpose of hedging against foreign currency risk arising from the investment or anticipated investment in securities denominated in foreign currencies. The Funds also enter into these contracts for purposes of increasing exposure to a foreign currency or shifting exposure to foreign currency fluctuations from one country to another. The market value of a forward foreign currency contract fluctuates with changes in foreign currency exchange rates. All commitments are marked to market daily at the applicable exchange rates and any resulting unrealized appreciation or depreciation is recorded. Realized gains or losses are recorded at the time the forward contract matures or by delivery of the currency. Risks may arise upon entering into these contracts from the potential inability of counterparties to meet the terms of their contracts and from unanticipated movements in the value of a foreign currency relative to the U.S. dollar. In addition, these contracts may involve market risk in excess of the unrealized appreciation (depreciation) reflected in the Funds’ Statements of Assets and Liabilities.
| 310 | May 31, 2015 | | Semiannual Report |
Table of Contents
The following is a summary of the Funds’ derivatives categorized by risk exposure.
The effect of derivatives on the Statements of Assets and Liabilities at May 31, 2015:
| AllianzGI Global Allocation: | ||||||||||||||||
| Location | Market Price | Interest Rate Contracts | Foreign Exchange Contracts | Total | ||||||||||||
Asset derivatives: | ||||||||||||||||
Receivable for variation margin on futures contracts* | $ | 348,654 | $ | 202,225 | — | $ | 550,879 | |||||||||
Unrealized appreciation of forward foreign currency contracts | — | — | $ | 87,200 | 87,200 | |||||||||||
Total asset derivatives | $ | 348,654 | $ | 202,225 | $ | 87,200 | $ | 638,079 | ||||||||
Liability derivatives: | ||||||||||||||||
Payable for variation margin on futures contracts* | $ | (173,798 | ) | — | $ | (24,140 | ) | $ | (197,938 | ) | ||||||
Unrealized depreciation of forward foreign currency contracts | — | — | (38,103 | ) | (38,103 | ) | ||||||||||
Total liability derivatives | $ | (173,798 | ) | — | $ | (62,243 | ) | $ | (236,041 | ) | ||||||
| * | Included in net unrealized appreciation of $352,941 on futures contracts as reported in Note 7(c). |
| AllianzGI Global Dynamic Allocation: | ||||||||||||||||
| Location | Market Price | Interest Rate Contracts | Foreign Exchange Contracts | Total | ||||||||||||
Asset derivatives: | ||||||||||||||||
Receivable for variation margin on futures contracts* | $ | 38,663 | $ | 1,095 | — | $ | 39,758 | |||||||||
Liability derivatives: | ||||||||||||||||
Payable for variation margin on futures contracts* | $ | (3,183 | ) | — | — | $ | (3,183 | ) | ||||||||
Unrealized depreciation of forward foreign currency contracts | — | — | $ | (1,721 | ) | (1,721 | ) | |||||||||
Total liability derivatives | $ | (3,183 | ) | — | $ | (1,721 | ) | $ | (4,904 | ) | ||||||
| * | Included in net unrealized appreciation of $36,575 on futures contracts as reported in Note 7(c). |
| AllianzGI Best Styles Global Equity: | ||||
| Location | Market Price | |||
Asset derivatives: | ||||
Receivable for variation margin on futures contracts* | $ | 26,215 | ||
Liability derivatives: | ||||
Payable for variation margin on futures contracts* | $ | (3,129 | ) | |
| * | Included in net unrealized appreciation of $23,086 on futures contracts as reported in Note 7(c). |
| AllianzGI Best Styles U.S. Equity: | ||||
| Location | Market Price | |||
Asset derivatives: | ||||
Receivable for variation margin on futures contracts* | $ | 10,228 | ||
| * | Included in net unrealized appreciation of $10,228 on futures contracts as reported in Note 7(c). |
| AllianzGI Emerging Markets Debt: | ||||||||||||
| Location | Credit Contracts | Foreign Exchange Contracts | Total | |||||||||
Asset derivatives: | ||||||||||||
Unrealized appreciation of OTC swaps | $ | 103,531 | — | $ | 103,531 | |||||||
Unrealized appreciation of forward foreign currency contracts | — | $ | 6,223 | 6,223 | ||||||||
Total asset derivatives | $ | 103,531 | $ | 6,223 | $ | 109,754 | ||||||
Liability derivatives: | ||||||||||||
Unrealized depreciation of OTC swaps | $ | (2,858 | ) | — | $ | (2,858 | ) | |||||
Unrealized depreciation of forward foreign currency contracts | — | $ | (12,904 | ) | (12,904 | ) | ||||||
Total liability derivatives | $ | (2,858 | ) | $ | (12,904 | ) | $ | (15,762 | ) | |||
| Semiannual Report | | May 31, 2015 | 311 |
Table of Contents
Notes to Financial Statements (cont’d)
May 31, 2015 (Unaudited)
| AllianzGI Europe Equity Dividend: | ||||
| Location | Foreign Exchange Contracts | |||
Asset derivatives: | ||||
Unrealized appreciation of forward foreign currency contracts | $ | 639 | ||
Liability derivatives: | ||||
Unrealized depreciation of forward foreign currency contracts | $ | (92,439 | ) | |
| AllianzGI Global Fundamental Strategy: | ||||||||||||||||
| Location | Market Price | Interest Rate Contracts | Foreign Exchange Contracts | Total | ||||||||||||
Asset derivatives: | ||||||||||||||||
Investments, at value (options purchased) | $ | 41,988 | — | — | $ | 41,988 | ||||||||||
Unrealized appreciation of forward foreign currency contracts | — | — | $ | 7,320 | 7,320 | |||||||||||
Total asset derivatives | $ | 41,988 | — | $ | 7,320 | $ | 49,308 | |||||||||
Liability derivatives: | ||||||||||||||||
Options written, at value | $ | (45,098 | ) | — | — | $ | (45,098 | ) | ||||||||
Payable for variation margin on futures contracts* | — | $ | (7,557 | ) | — | (7,557 | ) | |||||||||
Unrealized depreciation of forward foreign currency contracts | — | — | $ | (18,473 | ) | (18,473 | ) | |||||||||
Total liability derivatives | $ | (45,098 | ) | $ | (7,557 | ) | $ | (18,473 | ) | $ | (71,128 | ) | ||||
| * | Included in net unrealized depreciation of $7,557 on futures contracts as reported in Note 7(c). |
| AllianzGI International Small-Cap: | ||||
| Location | Foreign Exchange Contracts | |||
Liability derivatives: | ||||
Unrealized depreciation of forward foreign currency contracts | $ | (143 | ) | |
| AllianzGI Multi-Asset Real Return: | ||||||||||||||||
| Location | Market Price | Interest Rate Contracts | Foreign Exchange Contracts | Total | ||||||||||||
Asset derivatives: | ||||||||||||||||
Receivable for variation margin on futures contracts* | $ | 5,922 | — | $ | 2,803 | $ | 8,725 | |||||||||
Liability derivatives: | ||||||||||||||||
Payable for variation margin on futures contracts* | $ | (4,755 | ) | $ | (1,870 | ) | — | $ | (6,625 | ) | ||||||
| * | Included in net unrealized appreciation of $2,100 on futures contracts as reported in Note 7(c). |
| AllianzGI NFJ Emerging Markets Value: | ||||
| Location | Foreign Exchange Contracts | |||
Asset derivatives: | ||||
Unrealized appreciation of forward foreign currency contracts | $ | 20 | ||
Liability derivatives: | ||||
Unrealized depreciation of forward foreign currency contracts | $ | (66 | ) | |
| AllianzGI Structured Return: | ||||
| Location | Market Price | |||
Asset derivatives: | ||||
Investments, at value (options purchased) | $ | 91,534 | ||
Liability derivatives: | ||||
Options written, at value | $ | (1,304,350 | ) | |
| 312 | May 31, 2015 | | Semiannual Report |
Table of Contents
| AllianzGI U.S. Equity Hedged: | ||||
| Location | Market Price | |||
Asset derivatives: | ||||
Investments, at value (options purchased) | $ | 250,995 | ||
Liability derivatives: | ||||
Options written, at value | $ | (48,080 | ) | |
The effect of derivatives on the Statements of Operations for the period or six months ended May 31, 2015:
| AllianzGI Global Allocation: | ||||||||||||||||
| Location | Market Price | Interest Rate Contracts | Foreign Exchange Contracts | Total | ||||||||||||
Net realized gain (loss) on: | ||||||||||||||||
Futures contracts | $ | 143,825 | $ | (490,491 | ) | $ | (4,205 | ) | $ | (350,871 | ) | |||||
Foreign currency transactions (forward foreign currency contracts) | — | — | 86,596 | 86,596 | ||||||||||||
Total net realized gain (loss) | $ | 143,825 | $ | (490,491 | ) | $ | 82,391 | $ | (264,275 | ) | ||||||
Net change in unrealized appreciation/depreciation of: | ||||||||||||||||
Futures contracts | $ | 174,856 | $ | 202,225 | $ | (24,140 | ) | $ | 352,941 | |||||||
Foreign currency transactions (forward foreign currency contracts) | — | — | 49,097 | 49,097 | ||||||||||||
Total net change in unrealized appreciation/depreciation | $ | 174,856 | $ | 202,225 | $ | 24,957 | $ | 402,038 | ||||||||
| AllianzGI Global Dynamic Allocation: | ||||||||||||||||
| Location | Market Price | Interest Rate Contracts | Foreign Exchange Contracts | Total | ||||||||||||
Net realized gain (loss) on: | ||||||||||||||||
Futures contracts | $ | 2,253 | $ | 3,453 | — | $ | 5,706 | |||||||||
Foreign currency transactions (forward foreign currency contracts) | — | — | $ | (3,708 | ) | (3,708 | ) | |||||||||
Total net realized gain (loss) | $ | 2,253 | $ | 3,453 | $ | (3,708 | ) | $ | 1,998 | |||||||
Net change in unrealized appreciation/depreciation of: | ||||||||||||||||
Futures contracts | $ | 35,480 | $ | 1,095 | — | $ | 36,575 | |||||||||
Foreign currency transactions (forward foreign currency contracts) | — | — | $ | (1,721 | ) | (1,721 | ) | |||||||||
Total net change in unrealized appreciation/depreciation | $ | 35,480 | $ | 1,095 | $ | (1,721 | ) | $ | 34,854 | |||||||
| AllianzGI Best Styles Emerging Markets Equity: | ||||||||||||
| Location | Market Price | Foreign Exchange Contracts | Total | |||||||||
Net realized gain (loss) on: | ||||||||||||
Futures contracts | $ | 22,957 | — | $ | 22,957 | |||||||
Foreign currency transactions (forward foreign currency contracts) | — | $ | (13,524 | ) | (13,524 | ) | ||||||
Total net realized gain (loss) | $ | 22,957 | $ | (13,524 | ) | $ | 9,433 | |||||
| AllianzGI Best Styles Global Equity: | ||||||||||||
| Location | Market Price | Foreign Exchange Contracts | Total | |||||||||
Net realized loss on: | ||||||||||||
Futures contracts | $ | (87,306 | ) | — | $ | (87,306 | ) | |||||
Foreign currency transactions (forward foreign currency contracts) | — | $ | (13,513 | ) | (13,513 | ) | ||||||
Total net realized loss | $ | (87,306 | ) | $ | (13,513 | ) | $ | (100,819 | ) | |||
Net change in unrealized appreciation/depreciation of: | ||||||||||||
Futures contracts | $ | 2,139 | — | $ | 2,139 | |||||||
| Semiannual Report | | May 31, 2015 | 313 |
Table of Contents
Notes to Financial Statements (cont’d)
May 31, 2015 (Unaudited)
| AllianzGI Best Styles International Equity: | ||||
| Location | Foreign Exchange Contracts | |||
Net realized gain on: | ||||
Foreign currency transactions (forward foreign currency contracts) | $ | 12,870 | ||
| AllianzGI Best Styles U.S. Equity: | ||||||||||||
| Location | Market Price | Foreign Exchange Contracts | Total | |||||||||
Net realized gain (loss) on: | ||||||||||||
Futures contracts | $ | 163,671 | — | $ | 163,671 | |||||||
Foreign currency transactions (forward foreign currency contracts) | — | $ | (1,687 | ) | (1,687 | ) | ||||||
Total net realized gain (loss) | $ | 163,671 | $ | (1,687 | ) | $ | 161,984 | |||||
Net change in unrealized appreciation/depreciation of: | ||||||||||||
Futures contracts | $ | 10,228 | — | $ | 10,228 | |||||||
| AllianzGI China Equity: | ||||
| Location | Foreign Exchange Contracts | |||
Net realized loss on: | ||||
Foreign currency transactions (forward foreign currency contracts) | $ | (367 | ) | |
| AllianzGI Emerging Markets Consumer: | ||||
| Location | Foreign Exchange Contracts | |||
Net realized gain on: | ||||
Foreign currency transactions (forward foreign currency contracts) | $ | 1,925 | ||
| AllianzGI Emerging Markets Debt: | ||||||||||||
| Location | Credit Contracts | Foreign Exchange Contracts | Total | |||||||||
Net realized gain on: | ||||||||||||
Swaps | $ | 778 | — | $ | 778 | |||||||
Foreign currency transactions (forward foreign currency contracts) | — | $ | 52,724 | 52,724 | ||||||||
Total net realized gain | $ | 778 | $ | 52,724 | $ | 53,502 | ||||||
Net change in unrealized appreciation/depreciation of: | ||||||||||||
Swaps | $ | 100,673 | — | $ | 100,673 | |||||||
Foreign currency transactions (forward foreign currency contracts) | — | $ | (31,245 | ) | (31,245 | ) | ||||||
Total net change in unrealized appreciation/depreciation | $ | 100,673 | $ | (31,245 | ) | $ | 69,428 | |||||
| AllianzGI Emerging Markets Small-Cap: | ||||
| Location | Foreign Exchange Contracts | |||
Net realized loss on: | ||||
Foreign currency transactions (forward foreign currency contracts) | $ | (67 | ) | |
| AllianzGI Europe Equity Dividend: | ||||
| Location | Foreign Exchange Contracts | |||
Net realized gain on: | ||||
Foreign currency transactions (forward foreign currency contracts) | $ | 434 | ||
Net change in unrealized appreciation/depreciation of: | ||||
Foreign currency transactions (forward foreign currency contracts) | $ | (91,800 | ) | |
| 314 | May 31, 2015 | | Semiannual Report |
Table of Contents
| AllianzGI Global Fundamental Strategy: | ||||||||||||||||
| Location | Market Price | Interest Rate Contracts | Foreign Exchange Contracts | Total | ||||||||||||
Net realized gain (loss) on: | ||||||||||||||||
Investments (options purchased) | $ | (4,883 | ) | — | — | $ | (4,883 | ) | ||||||||
Futures contracts | (26,912 | ) | $ | (20,461 | ) | — | (47,374 | ) | ||||||||
Options written | 6,830 | — | — | 6,830 | ||||||||||||
Foreign currency transactions (forward foreign currency contracts) | — | — | $ | 336,075 | 336,075 | |||||||||||
Total net realized gain (loss) | $ | (24,965 | ) | $ | (20,461 | ) | $ | 336,075 | $ | 290,648 | ||||||
Net change in unrealized appreciation/depreciation of: | ||||||||||||||||
Investments (options purchased) | $ | 7,300 | — | — | $ | 7,300 | ||||||||||
Futures contracts | 20,320 | $ | 867 | — | 21,187 | |||||||||||
Options written | 36,589 | — | — | 36,589 | ||||||||||||
Foreign currency transactions (forward foreign currency contracts) | — | — | $ | (15,027 | ) | (15,027 | ) | |||||||||
Total net change in unrealized appreciation/depreciation | $ | 64,209 | $ | 867 | $ | (15,027 | ) | $ | 50,049 | |||||||
| AllianzGI Global Managed Volatility: | ||||
| Location | Foreign Exchange Contracts | |||
Net realized gain on: | ||||
Foreign currency transactions (forward foreign currency contracts) | $ | 613 | ||
| AllianzGI Global Sustainability: | ||||
| Location | Foreign Exchange Contracts | |||
Net realized gain on: | ||||
Foreign currency transactions (forward foreign currency contracts) | $ | 281 | ||
| AllianzGI Global Water: | ||||
| Location | Foreign Exchange Contracts | |||
Net realized gain on: | ||||
Foreign currency transactions (forward foreign currency contracts) | $ | 22,233 | ||
| AllianzGI International Small-Cap: | ||||
| Location | Foreign Exchange Contracts | |||
Net realized loss on: | ||||
Foreign currency transactions (forward foreign currency contracts) | $ | (18,447 | ) | |
Net change in unrealized appreciation/depreciation of: | ||||
Foreign currency transactions (forward foreign currency contracts) | $ | (143 | ) | |
| AllianzGI Multi-Asset Real Return: | ||||||||||||||||
| Location | Market Price | Interest Rate Contracts | Foreign Exchange Contracts | Total | ||||||||||||
Net realized gain (loss) on: | ||||||||||||||||
Futures contracts | $ | 11,011 | $ | (4,292 | ) | $ | 8,851 | $ | 15,569 | |||||||
Foreign currency transactions (forward foreign currency contracts) | — | — | (703 | ) | (703 | ) | ||||||||||
Total net realized gain (loss) | $ | 11,011 | $ | (4,292 | ) | $ | 8,148 | $ | 14,866 | |||||||
Net change in unrealized appreciation/depreciation of: | ||||||||||||||||
Futures contracts | $ | (8,528 | ) | $ | 7,659 | $ | 2,803 | $ | 1,934 | |||||||
| Semiannual Report | | May 31, 2015 | 315 |
Table of Contents
Notes to Financial Statements (cont’d)
May 31, 2015 (Unaudited)
| AllianzGI NFJ Emerging Markets Value: | ||||
| Location | Foreign Exchange Contracts | |||
Net realized gain on: | ||||
Foreign currency transactions (forward foreign currency contracts) | $ | 366 | ||
Net change in unrealized appreciation/depreciation of: | ||||
Foreign currency transactions (forward foreign currency contracts) | $ | (46 | ) | |
| AllianzGI NFJ Global Dividend Value: | ||||
| Location | Foreign Exchange Contracts | |||
Net realized loss on: | ||||
Foreign currency transactions (forward foreign currency contracts) | $ | (4,456 | ) | |
| AllianzGI NFJ International Small-Cap Value: | ||||
| Location | Foreign Exchange Contracts | |||
Net realized loss on: | ||||
Foreign currency transactions (forward foreign currency contracts) | $ | (596 | ) | |
| AllianzGI NFJ International Value II: | ||||
| Location | Foreign Exchange Contracts | |||
Net realized loss on: | ||||
Foreign currency transactions (forward foreign currency contracts) | $ | (1,175 | ) | |
| AllianzGI Structured Return: | ||||
| Location | Market Price | |||
Net realized gain (loss) on: | ||||
Investments (options purchased) | $ | (959,913 | ) | |
Options written | 1,006,919 | |||
Total net realized gain | $ | 47,006 | ||
Net change in unrealized appreciation/depreciation of: | ||||
Investments (options purchased) | $ | (19,897 | ) | |
Options written | 260,316 | |||
Total net change in unrealized appreciation/depreciation | $ | 240,419 | ||
| AllianzGI U.S. Equity Hedged: | ||||
| Location | Market Price | |||
Net realized gain (loss) on: | ||||
Investments (options purchased) | $ | (258,352 | ) | |
Options written | 182,675 | |||
Total net realized loss | $ | (75,677 | ) | |
Net change in unrealized appreciation/depreciation of: | ||||
Investments (options purchased) | $ | (203,758 | ) | |
Options written | 18,587 | |||
Total net change in unrealized appreciation/depreciation | $ | (185,171 | ) | |
The average volume (based on the open positions at each fiscal quarter-end) of derivative activity for the period or six months ended May 31, 2015:
Options Contracts(1) | Options Contracts(1) | Forward Foreign Currency Contracts(2) | Futures Contracts(1) | Credit Default Swap Agreements(3) | ||||||||||||||||||||||||||||
| Purchased | Sold | Long | Short | Buy | Sell | |||||||||||||||||||||||||||
AllianzGI Global Allocation | — | — | $ | 379,163 | $ | 4,508,578 | 318 | 13 | — | — | ||||||||||||||||||||||
AllianzGI Global Dynamic Allocation | — | — | — | 58,024 | 17 | 3 | — | — | ||||||||||||||||||||||||
AllianzGI Best Styles Global Equity | — | — | — | — | 16 | — | — | — | ||||||||||||||||||||||||
AllianzGI Best Styles U.S. Equity | — | — | — | — | 16 | — | — | — | ||||||||||||||||||||||||
AllianzGI Emerging Markets Debt | — | — | 2,664,217 | 2,817,666 | — | — | $ | 667 | $ | 2,000 | ||||||||||||||||||||||
AllianzGI Europe Equity Dividend | — | — | 42,641 | 1,578,617 | — | — | — | — | ||||||||||||||||||||||||
AllianzGI Global Fundamental Strategy | 38 | 119 | 529,719 | 2,215,026 | — | 17 | — | — | ||||||||||||||||||||||||
AllianzGI International Small-Cap | — | — | — | 31,939 | — | — | — | — | ||||||||||||||||||||||||
AllianzGI Multi-Asset Real Return | — | — | — | — | 9 | 13 | — | — | ||||||||||||||||||||||||
AllianzGI NFJ Emerging Markets Value | — | — | 4,433 | 3,594 | — | — | — | — | ||||||||||||||||||||||||
AllianzGI Structured Return | 694 | 490 | — | — | — | — | — | — | ||||||||||||||||||||||||
AllianzGI U.S. Equity Hedged | 94 | 81 | — | — | — | — | — | — | ||||||||||||||||||||||||
| (1) | Number of contracts |
| (2) | U.S. $ value on origination date |
| (3) | Notional Amount (in thousands) |
| 316 | May 31, 2015 | | Semiannual Report |
Table of Contents
The following tables present by counterparty, the Funds’ derivative assets and liabilities net of related collateral held by the Funds at May 31, 2015 which has not been offset in the Statements of Assets and Liabilities, but would be available for offset to the extent of a default by the counterparty to the transaction.
Financial Assets and Derivative Assets, and Collateral Received at May 31, 2015:
| AllianzGI Global Allocation: | ||||||||||||||||
| Gross Amounts Not Offset in the Statement of Assets and Liabilities | ||||||||||||||||
| Counterparty | Gross Asset Derivatives Presented in Statement of Assets and Liabilities | Financial Instrument/ Derivative Offset | Cash Collateral Received | Net Amount | ||||||||||||
Foreign Currency Exchange Contracts | ||||||||||||||||
State Street Bank | $ | 87,200 | $ | (38,103 | ) | — | $ | 49,097 | ||||||||
| AllianzGI Emerging Markets Debt: | ||||||||||||||||
| Gross Amounts Not Offset in the Statement of Assets and Liabilities | ||||||||||||||||
| Counterparty | Gross Asset Derivatives Presented in Statement of Assets and Liabilities | Financial Instrument/ Derivative Offset | Cash Collateral Received | Net Amount | ||||||||||||
Foreign Currency Exchange Contracts | ||||||||||||||||
State Street Bank | $ | 6,223 | $ | (6,223 | ) | — | — | |||||||||
Swaps | ||||||||||||||||
Barclays Bank PLC | 103,531 | (2,858 | ) | $ | (18,714 | )#,## | $ | 81,959 | ||||||||
Totals | $ | 109,754 | $ | (9,081 | ) | $ | (18,714 | ) | $ | 81,959 | ||||||
| AllianzGI Europe Equity: | ||||||||||||||||
| Gross Amounts Not Offset in the Statement of Assets and Liabilities | ||||||||||||||||
| Counterparty | Gross Asset Derivatives Presented in Statement of Assets and Liabilities | Financial Instrument/ Derivative Offset | Cash Collateral Received | Net Amount | ||||||||||||
Foreign Currency Exchange Contracts | ||||||||||||||||
State Street Bank | $ | 639 | $ | (639 | ) | — | — | |||||||||
| AllianzGI Global Fundamental Strategy: | ||||||||||||||||
| Gross Amounts Not Offset in the Statement of Assets and Liabilities | ||||||||||||||||
| Counterparty | Gross Asset Derivatives Presented in Statement of Assets and Liabilities | Financial Instrument/ Derivative Offset | Cash Collateral Received | Net Amount | ||||||||||||
Foreign Currency Exchange Contracts | ||||||||||||||||
State Street Bank | $ | 7,320 | $ | (7,320 | ) | — | — | |||||||||
| AllianzGI NFJ Emerging Markets Value: | ||||||||||||||||
| Gross Amounts Not Offset in the Statement of Assets and Liabilities | ||||||||||||||||
| Counterparty | Gross Asset Derivatives Presented in Statement of Assets and Liabilities | Financial Instrument/ Derivative Offset | Cash Collateral Received | Net Amount | ||||||||||||
Foreign Currency Exchange Contracts | ||||||||||||||||
Northern Trust Company | $ | 20 | $ | (20 | ) | — | — | |||||||||
| Semiannual Report | | May 31, 2015 | 317 |
Table of Contents
Notes to Financial Statements (cont’d)
May 31, 2015 (Unaudited)
Financial Liabilities and Derivative Liabilities, and Collateral Received at May 31, 2015:
| AllianzGI Global Allocation: | ||||||||||||||||
| Gross Amounts Not Offset in the Statement of Assets and Liabilities | ||||||||||||||||
| Counterparty | Gross Liability Derivatives Presented in Statement of Assets and Liabilities | Financial Instrument/ Derivative Offset | Cash Collateral Received (Pledged) | Net Amount | ||||||||||||
Foreign Currency Exchange Contracts | ||||||||||||||||
State Street Bank | $ | 38,103 | $ | (38,103 | ) | — | — | |||||||||
| AllianzGI Global Dynamic Allocation: | ||||||||||||||||
| Gross Amounts Not Offset in the Statement of Assets and Liabilities | ||||||||||||||||
| Counterparty | Gross Liability Derivatives Presented in Statement of Assets and Liabilities | Financial Instrument/ Derivative Offset | Cash Collateral Received (Pledged) | Net Amount | ||||||||||||
Foreign Currency Exchange Contracts | ||||||||||||||||
State Street Bank | $ | 1,721 | — | — | $ | 1,721 | ||||||||||
| AllianzGI Emerging Markets Debt: | ||||||||||||||||
Gross Amounts Not Offset in the Statement of Assets and Liabilities | ||||||||||||||||
| Counterparty | Gross Liability Derivatives Presented in Statement of Assets and Liabilities | Financial Instrument/ Derivative Offset | Cash Collateral Received (Pledged) | Net Amount | ||||||||||||
Foreign Currency Exchange Contracts | ||||||||||||||||
State Street Bank | $ | 12,904 | $ | (6,223 | ) | — | $ | 6,681 | ||||||||
Swaps | ||||||||||||||||
Barclays Bank PLC | 2,858 | (2,858 | ) | — | — | |||||||||||
Totals | $ | 15,762 | $ | (9,081 | ) | — | $ | 6,681 | ||||||||
| AllianzGI Europe Equity: | ||||||||||||||||
Gross Amounts Not Offset in the Statement of Assets and Liabilities | ||||||||||||||||
| Counterparty | Gross Liability Derivatives Presented in Statement of Assets and Liabilities | Financial Instrument/ Derivative Offset | Cash Collateral Received (Pledged) | Net Amount | ||||||||||||
Foreign Currency Exchange Contracts | ||||||||||||||||
State Street Bank | $ | 92,439 | $ | (639 | ) | — | $ | 91,800 | ||||||||
| AllianzGI Global Fundamental Strategy: | ||||||||||||||||
| Gross Amounts Not Offset in the Statement of Assets and Liabilities | ||||||||||||||||
| Counterparty | Gross Liability Derivatives Presented in Statement of Assets and Liabilities | Financial Instrument/ Derivative Offset | Cash Collateral Received (Pledged) | Net Amount | ||||||||||||
Foreign Currency Exchange Contracts | ||||||||||||||||
State Street Bank | $ | 18,473 | $ | (7,320 | ) | — | $ | 11,153 | ||||||||
| 318 | May 31, 2015 | | Semiannual Report |
Table of Contents
| AllianzGI International Small-Cap: | ||||||||||||||||
| Gross Amounts Not Offset in the Statement of Assets and Liabilities | ||||||||||||||||
| Counterparty | Gross Liability Derivatives Presented in Statement of Assets and Liabilities | Financial Instrument/ Derivative Offset | Cash Collateral Received (Pledged) | Net Amount | ||||||||||||
Foreign Currency Exchange Contracts | ||||||||||||||||
Northern Trust Company | $ | 143 | — | — | $ | 143 | ||||||||||
| AllianzGI NFJ Emerging Markets Value: | ||||||||||||||||
| Gross Amounts Not Offset in the Statement of Assets and Liabilities | ||||||||||||||||
| Counterparty | Gross Liability Derivatives Presented in Statement of Assets and Liabilities | Financial Instrument/ Derivative Offset | Cash Collateral Received (Pledged) | Net Amount | ||||||||||||
Foreign Currency Exchange Contracts | ||||||||||||||||
Northern Trust Company | $ | 66 | $ | (20 | ) | — | $ | 46 | ||||||||
| # | The amount includes upfront premiums received. |
| ## | The amount includes upfront premiums paid. |
| 5. | INVESTMENT MANAGER/ADMINISTRATOR/DISTRIBUTOR FEES & DEFERRED COMPENSATION |
Investment Management Fee. Each Fund has an Investment Management Agreement (collectively the “Agreements”) with the Investment Manager. Subject to the supervision of the Trust’s Board, the Investment Manager is responsible for managing, either directly or through others selected by it, each Fund’s investment activities, business affairs and administrative matters. Pursuant to the Agreements, the Investment Manager receives an annual fee, payable monthly (net of any fee waivers, reimbursements and recoupment), at an annual rate of each Fund’s average daily net assets (the “Investment Management Fee”).
“Due to Investment Manager” on the Statements of Assets and Liabilities represents the remaining payable for the Funds’ offering costs that were paid by the Investment Manager.
The Investment Manager has retained the Sub-Advisers to manage the Funds’ investments. Subject to the supervision of the Investment Manager, the Sub-Advisers are responsible for making all of the investment decisions for the Funds for which they serve as sub-adviser. The Investment Manager, not the Funds, pays a portion of the fees it receives as Investment Manager to the Sub-Advisers in return for their services.
| Sub-Adviser(s) | Funds | |
AllianzGI U.S. | AllianzGI Retirement 2015, AllianzGI Retirement 2020, AllianzGI Retirement 2025, AllianzGI Retirement 2030, AllianzGI Retirement 2035, AllianzGI Retirement 2040, AllianzGI Retirement 2045, AllianzGI Retirement 2050, AllianzGI Retirement 2055, AllianzGI Retirement Income, AllianzGI Global Allocation, AllianzGI Global Dynamic Allocation, AllianzGI Global Megatrends, AllianzGI Best Styles Emerging Markets Equity, AllianzGI Best Styles Global Equity, AllianzGI Best Styles International Equity, AllianzGI Best Styles U.S. Equity, AllianzGI China Equity, AllianzGI Convertible, AllianzGI Emerging Markets Consumer, AllianzGI Emerging Markets Debt, AllianzGI Emerging Markets Small-Cap, AllianzGI Europe Equity Dividend, AllianzGI Global Fundamental Strategy, AllianzGI Global Managed Volatility, AllianzGI Global Sustainability, AllianzGI Global Water, AllianzGI High Yield Bond, AllianzGI International Growth, AllianzGI International Small-Cap, AllianzGI Micro Cap, AllianzGI Multi-Asset Real Return, AllianzGI Short Duration High Income, AllianzGI Structured Return, AllianzGI U.S. Equity Hedged, AllianzGI U.S. Small-Cap Growth, AllianzGI Ultra Micro Cap | |
Fuller & Thaler | AllianzGI Behavioral Advantage Large Cap | |
NFJ | NFJ Emerging Markets Value, NFJ Global Dividend Value, NFJ International Small-Cap Value, NFJ International Value II |
Administration Fee. The Investment Manager provides administrative services to the Target Date Funds and also bears the cost of most third-party administrative services required by the Target Date Funds, and in return it receives from each share class of each Target Date Fund a monthly administration fee based on each share class’ average daily net assets (the “Administration Fee”).
| Semiannual Report | | May 31, 2015 | 319 |
Table of Contents
Notes to Financial Statements (cont’d)
May 31, 2015 (Unaudited)
The Investment Management Fee and Administration Fee for all classes are charged at an annual rate as indicated in the following table:
| All Classes | Class A,C,D and R | Class P and Administrative | Class R6 | |||||||||||||||||
| Management Fee | Effective Management Fee | Administration Fee | ||||||||||||||||||
AllianzGI Retirement 2015 | 0.05 | % | 0.05 | % | 0.30 | % | 0.15 | % | 0.05 | % | ||||||||||
AllianzGI Retirement 2020 | 0.05 | 0.05 | 0.30 | 0.15 | 0.05 | |||||||||||||||
AllianzGI Retirement 2025 | 0.05 | 0.05 | 0.30 | 0.15 | 0.05 | |||||||||||||||
AllianzGI Retirement 2030 | 0.05 | 0.05 | 0.30 | 0.15 | 0.05 | |||||||||||||||
AllianzGI Retirement 2035 | 0.05 | 0.05 | 0.30 | 0.15 | 0.05 | |||||||||||||||
AllianzGI Retirement 2040 | 0.05 | 0.05 | 0.30 | 0.15 | 0.05 | |||||||||||||||
AllianzGI Retirement 2045 | 0.05 | 0.05 | 0.30 | 0.15 | 0.05 | |||||||||||||||
AllianzGI Retirement 2050 | 0.05 | 0.05 | 0.30 | 0.15 | 0.05 | |||||||||||||||
AllianzGI Retirement 2055 | 0.05 | 0.05 | 0.30 | 0.15 | 0.05 | |||||||||||||||
AllianzGI Retirement Income | 0.05 | 0.05 | 0.30 | 0.15 | 0.05 | |||||||||||||||
AllianzGI Global Allocation | 0.70 | * | 0.21 | N/A | N/A | N/A | ||||||||||||||
AllianzGI Global Dynamic Allocation | 0.70 | * | 0.34 | N/A | N/A | N/A | ||||||||||||||
AllianzGI Global Megatrends | 0.00 | 0.00 | N/A | N/A | N/A | |||||||||||||||
AllianzGI Behavioral Advantage Large Cap | 0.40 | 0.40 | N/A | N/A | N/A | |||||||||||||||
AllianzGI Best Styles Emerging Markets Equity | 0.40 | 0.40 | N/A | N/A | N/A | |||||||||||||||
AllianzGI Best Styles Global Equity | 0.30 | 0.30 | N/A | N/A | N/A | |||||||||||||||
AllianzGI Best Styles International Equity | 0.30 | 0.30 | N/A | N/A | N/A | |||||||||||||||
AllianzGI Best Styles U.S. Equity | 0.30 | 0.30 | N/A | N/A | N/A | |||||||||||||||
AllianzGI China Equity | 1.10 | 1.10 | N/A | N/A | N/A | |||||||||||||||
AllianzGI Convertible | 0.57 | 0.57 | N/A | N/A | N/A | |||||||||||||||
AllianzGI Emerging Markets Consumer | 1.00 | 1.00 | N/A | N/A | N/A | |||||||||||||||
AllianzGI Emerging Markets Debt | 0.75 | 0.75 | N/A | N/A | N/A | |||||||||||||||
AllianzGI Emerging Markets Small-Cap | 1.20 | 1.20 | N/A | N/A | N/A | |||||||||||||||
AllianzGI Europe Equity Dividend | 0.80 | 0.80 | N/A | N/A | N/A | |||||||||||||||
AllianzGI Global Fundamental Strategy | 0.75 | 0.75 | N/A | N/A | N/A | |||||||||||||||
AllianzGI Global Managed Volatility | 0.40 | 0.40 | N/A | N/A | N/A | |||||||||||||||
AllianzGI Global Sustainability | 0.80 | 0.80 | N/A | N/A | N/A | |||||||||||||||
AllianzGI Global Water | 0.95 | 0.95 | N/A | N/A | N/A | |||||||||||||||
AllianzGI High Yield Bond | 0.48 | 0.48 | N/A | N/A | N/A | |||||||||||||||
AllianzGI International Growth | 0.80 | 0.80 | N/A | N/A | N/A | |||||||||||||||
AllianzGI International Small-Cap | 1.00 | 1.00 | N/A | N/A | N/A | |||||||||||||||
AllianzGI Micro Cap | 1.25 | 1.25 | N/A | N/A | N/A | |||||||||||||||
AllianzGI Multi-Asset Real Return | 0.75 | 0.75 | N/A | N/A | N/A | |||||||||||||||
AllianzGI NFJ Emerging Markets Value | 1.00 | 1.00 | N/A | N/A | N/A | |||||||||||||||
AllianzGI NFJ Global Dividend Value | 0.80 | 0.80 | N/A | N/A | N/A | |||||||||||||||
AllianzGI NFJ International Small-Cap Value | 0.95 | 0.95 | N/A | N/A | N/A | |||||||||||||||
AllianzGI NFJ International Value II | 0.80 | 0.80 | N/A | N/A | N/A | |||||||||||||||
AllianzGI Short Duration High Income | 0.48 | 0.48 | N/A | N/A | N/A | |||||||||||||||
AllianzGI Structured Return | 0.60 | 0.60 | N/A | N/A | N/A | |||||||||||||||
AllianzGI U.S. Equity Hedged | 0.70 | 0.70 | N/A | N/A | N/A | |||||||||||||||
AllianzGI U.S. Small-Cap Growth | 0.90 | 0.90 | N/A | N/A | N/A | |||||||||||||||
AllianzGI Ultra Micro Cap | 1.50 | 1.50 | N/A | N/A | N/A | |||||||||||||||
| * | Effective April 1, 2015, the management fee rate was decreased from 0.85% to 0.70% and the management fee waiver was decreased from 0.70% to 0.55%. |
| 320 | May 31, 2015 | | Semiannual Report |
Table of Contents
Distribution and Servicing Fees. Allianz Global Investors Distributors LLC (the “Distributor”), an affiliate of AAM, the Investment Manager and the Sub-Advisers (with the exception of Fuller & Thaler), serves as the distributor of the Funds’ shares pursuant to separate Distribution Servicing Plans for Class A, B, C, D and R. The Distributor, for each of the Funds, receives (i) servicing fees of 0.25% of the average daily net assets of each of Class A, B, C, D and R in connection with services rendered to shareholders of each class and the maintenance of shareholder accounts, and (ii) distribution fees of 0.75% of the average daily net assets of each of Class B and C (with the exception of Class C for AllianzGI Short Duration High Income which is 0.25%) and 0.25% of average daily net assets of Class R in connection with the distribution of Class B, C and R shares.
Pursuant to the Distribution and Servicing Plans adopted by the A, B, C, D and R classes, the Funds compensate the Distributor for services provided and expenses incurred in connection with assistance rendered in the sale of shares and services rendered to shareholders and for maintenance of shareholder accounts.
Pursuant to the Distribution Plan for the Administrative Class shares, the Funds are permitted to reimburse the Distributor out of the Administrative Class’ assets of each Fund offering Administrative Class shares, in an amount up to 0.25% on an annual basis of the average net assets of the Administrative Class, for payments made to financial intermediaries that provide services in connection with the distribution of shares or administration plans or programs that use fund shares as their funding medium. Unreimbursed costs may be
carried forward for reimbursement for up to twelve months beyond the date in which they are incurred, subject always to the limit that no more than 0.25% of the average daily net assets attributable to the Administrative Class may be expensed.
The Distributor also receives the proceeds of the initial sales charges paid by the shareholders upon the purchase of Class A shares and contingent deferred sales charges (“CDSC”) paid by the shareholders upon certain redemptions of Class A, B and C shares. For the six months ended May 31, 2015, the Distributor received $154,065, representing commissions (sales charges) and CDSC from the Funds.
Deferred Compensation. Trustees do not currently receive any pension or retirement benefits from the Trust. The Trust has adopted a deferred compensation plan for the Trustees that went into place at the beginning of this calendar year and permits the Trustees to defer their receipt of compensation from the Trust, at their election, in accordance with the terms of the plan. Under the plan, each Trustee may elect not to receive all or a portion of his or her fees from the Trust on a current basis but to receive in a subsequent period chosen by the Trustee an amount equal to the value of such compensation if such compensation had been invested in a Fund or Funds, or one or more series of Allianz Funds, selected by the Trustees from and after the normal payment dates for such compensation. The deferred compensation program is structured such that the Trust remains in substantially the same financial position whether Trustee fees are paid when earned or deferred.
| 6. | EXPENSE LIMITATION AND RECOUPMENT |
The Trust and the Investment Manager have entered into Expense Limitation and Management Fee Waiver Agreements as indicated below:
| Expense Limitation | ||||||||||||||||||||||||||||||||||||||||
| Management Fee Waiver(1) | Class A | Class B | Class C | Class D | Class R | Class P | Institutional Class | Class R6 | Administrative Class | |||||||||||||||||||||||||||||||
AllianzGI Retirement 2015(2) | N/A | 0.97 | % | N/A | 1.72 | % | 1.07 | % | 1.32 | % | 0.67 | % | N/A | 0.57 | % | 0.92 | % | |||||||||||||||||||||||
AllianzGI Retirement 2020(2) | N/A | 0.99 | N/A | 1.74 | 1.09 | 1.34 | 0.69 | N/A | 0.59 | 0.94 | ||||||||||||||||||||||||||||||
AllianzGI Retirement 2025(2) | N/A | 1.01 | N/A | N/A | N/A | 1.36 | 0.71 | N/A | 0.61 | 0.96 | ||||||||||||||||||||||||||||||
AllianzGI Retirement 2030(2) | N/A | 1.03 | N/A | 1.78 | 1.13 | 1.38 | 0.73 | N/A | 0.63 | 0.98 | ||||||||||||||||||||||||||||||
AllianzGI Retirement 2035(2) | N/A | 1.06 | N/A | N/A | N/A | 1.41 | 0.76 | N/A | 0.66 | 1.01 | ||||||||||||||||||||||||||||||
AllianzGI Retirement 2040(2) | N/A | 1.09 | N/A | 1.84 | 1.19 | 1.44 | 0.79 | N/A | 0.69 | 1.04 | ||||||||||||||||||||||||||||||
AllianzGI Retirement 2045(2) | N/A | 1.10 | N/A | N/A | N/A | 1.45 | 0.80 | N/A | 0.70 | * | 1.05 | |||||||||||||||||||||||||||||
AllianzGI Retirement 2050(2) | N/A | 1.10 | N/A | 1.85 | 1.20 | 1.45 | 0.80 | N/A | 0.70 | * | 1.05 | |||||||||||||||||||||||||||||
AllianzGI Retirement 2055(2) | N/A | 1.10 | N/A | N/A | N/A | 1.45 | 0.80 | N/A | 0.70 | * | 1.05 | |||||||||||||||||||||||||||||
AllianzGI Retirement Income(2) | N/A | 0.95 | N/A | 1.70 | 1.05 | 1.30 | 0.65 | N/A | 0.55 | 0.90 | ||||||||||||||||||||||||||||||
AllianzGI Global Allocation(3) | 0.55 | % | 0.64 | 1.36 | % | 1.38 | 0.64 | 0.81 | 0.41 | 0.40 | % | N/A | 0.65 | |||||||||||||||||||||||||||
AllianzGI Global Dynamic Allocation(3) | 0.55 | 0.76 | N/A | 1.49 | 0.76 | 1.01 | 0.61 | 0.51 | N/A | 0.76 | ||||||||||||||||||||||||||||||
AllianzGI Global Megatrends(4) | N/A | 1.30 | N/A | N/A | N/A | N/A | 1.15 | * | 1.05 | * | N/A | N/A | ||||||||||||||||||||||||||||
AllianzGI Behavioral Advantage Large Cap(5) | N/A | 0.81 | N/A | 1.57 | 0.81 | N/A | 0.65 | 0.55 | N/A | N/A | ||||||||||||||||||||||||||||||
AllianzGI Best Styles Emerging Markets | N/A | N/A | N/A | N/A | N/A | N/A | 0.80 | 0.70 | 0.60 | N/A | ||||||||||||||||||||||||||||||
AllianzGI Best Styles Global Equity(5) | N/A | 0.75 | N/A | N/A | N/A | N/A | 0.60 | 0.50 | 0.40 | N/A | ||||||||||||||||||||||||||||||
AllianzGI Best Styles International | N/A | N/A | N/A | N/A | N/A | N/A | 0.65 | 0.55 | 0.45 | N/A | ||||||||||||||||||||||||||||||
AllianzGI Best Styles U.S. Equity(6) | N/A | N/A | N/A | N/A | N/A | N/A | 0.60 | 0.50 | 0.40 | N/A | ||||||||||||||||||||||||||||||
AllianzGI China Equity(5) | N/A | 1.70 | N/A | 2.45 | 1.77 | N/A | 1.51 | 1.45 | N/A | N/A | ||||||||||||||||||||||||||||||
| Semiannual Report | | May 31, 2015 | 321 |
Table of Contents
Notes to Financial Statements (cont’d)
May 31, 2015 (Unaudited)
| Expense Limitation | ||||||||||||||||||||||||||||||||||||||||
| Management Fee Waiver(1) | Class A | Class B | Class C | Class D | Class R | Class P | Institutional Class | Class R6 | Administrative Class | |||||||||||||||||||||||||||||||
AllianzGI Convertible | N/A | N/A | N/A | N/A | N/A | N/A | N/A | N/A | N/A | N/A | ||||||||||||||||||||||||||||||
AllianzGI Emerging Markets Consumers(6) | N/A | 1.65 | % | N/A | N/A | N/A | N/A | N/A | 1.30 | % | N/A | N/A | ||||||||||||||||||||||||||||
AllianzGI Emerging Markets Debt(6) | N/A | 1.20 | N/A | 1.95 | % | N/A | N/A | 1.05 | % | 0.95 | N/A | N/A | ||||||||||||||||||||||||||||
AllianzGI Emerging Markets Small-Cap(6) | N/A | 1.85 | N/A | N/A | N/A | N/A | N/A | 1.50 | N/A | N/A | ||||||||||||||||||||||||||||||
AllianzGI Europe Equity Dividend(6) | N/A | 1.20 | N/A | 1.95 | N/A | N/A | 1.05 | 0.95 | N/A | N/A | ||||||||||||||||||||||||||||||
AllianzGI Global Fundamental Strategy(5) | N/A | 1.25 | N/A | 2.00 | 1.25 | % | N/A | 1.10 | 1.00 | N/A | N/A | |||||||||||||||||||||||||||||
AllianzGI Global Managed Volatility(7) | N/A | 0.93 | N/A | 1.62 | 0.89 | N/A | 0.69 | 0.60 | N/A | N/A | ||||||||||||||||||||||||||||||
AllianzGI Global Sustainability(6) | N/A | 1.20 | N/A | N/A | N/A | N/A | 1.05 | 0.95 | N/A | N/A | ||||||||||||||||||||||||||||||
AllianzGI Global Water | N/A | N/A | N/A | N/A | N/A | N/A | N/A | N/A | N/A | N/A | ||||||||||||||||||||||||||||||
AllianzGI High Yield Bond | N/A | N/A | N/A | N/A | N/A | N/A | N/A | N/A | N/A | N/A | ||||||||||||||||||||||||||||||
AllianzGI International Growth(6) | N/A | 1.20 | N/A | N/A | N/A | N/A | N/A | 0.95 | N/A | N/A | ||||||||||||||||||||||||||||||
AllianzGI International Small-Cap(5) | N/A | 1.45 | N/A | 2.19 | 1.45 | 1.70 | % | 1.28 | 1.21 | N/A | N/A | |||||||||||||||||||||||||||||
AllianzGI Micro Cap(7) | N/A | 1.62 | N/A | N/A | N/A | N/A | 1.54 | 1.54 | N/A | N/A | ||||||||||||||||||||||||||||||
AllianzGI Multi-Asset Real Return(7) | N/A | 0.85 | N/A | 1.60 | 0.85 | N/A | 0.70 | 0.60 | N/A | N/A | ||||||||||||||||||||||||||||||
AllianzGI NFJ Emerging Markets Value(5) | N/A | 1.55 | N/A | 2.30 | 1.55 | N/A | 1.39 | 1.30 | N/A | N/A | ||||||||||||||||||||||||||||||
AllianzGI NFJ Global Dividend Value(5) | N/A | 1.20 | N/A | 1.99 | 1.20 | N/A | 1.04 | 0.95 | N/A | N/A | ||||||||||||||||||||||||||||||
AllianzGI NFJ International Small-Cap Value(5) | N/A | 1.45 | N/A | 2.20 | 1.45 | N/A | 1.30 | 1.20 | N/A | N/A | ||||||||||||||||||||||||||||||
AllianzGI NFJ International Value II(5) | N/A | 1.20 | N/A | 1.95 | 1.20 | N/A | 1.00 | 0.95 | N/A | N/A | ||||||||||||||||||||||||||||||
AllianzGI Short Duration High Income(5) | N/A | N/A | N/A | N/A | 0.85 | N/A | N/A | N/A | N/A | N/A | ||||||||||||||||||||||||||||||
AllianzGI Structured Return(7) | N/A | 1.15 | N/A | 1.90 | 1.15 | N/A | 1.00 | 0.90 | N/A | N/A | ||||||||||||||||||||||||||||||
AllianzGI U.S. Equity Hedged(7) | N/A | 1.25 | N/A | 2.00 | 1.25 | N/A | 1.10 | 1.00 | N/A | N/A | ||||||||||||||||||||||||||||||
AllianzGI U.S. Small-Cap Growth(5) | N/A | 1.40 | N/A | 2.20 | 1.42 | 1.65 | 1.25 | 1.16 | N/A | N/A | ||||||||||||||||||||||||||||||
AllianzGI Ultra Micro Cap | N/A | N/A | N/A | N/A | N/A | N/A | N/A | N/A | N/A | N/A | ||||||||||||||||||||||||||||||
| (1) | Effective April 1, 2015, the Investment Manager has contractually agreed to irrevocably waive a portion of its management fee with respect to the noted Funds. The waiver is calculated on the average daily net assets of each applicable Fund that are attributable to investments in either Underlying Funds or Other Acquired Funds based on the rates disclosed in the above table. This waiver with respect to investments in Underlying Funds and Other Acquired Funds for which the Investment Manager or an affiliated person thereof serves as investment adviser is terminable only by the Board of Trustees of the Trust, and the waiver with respect to investments in unaffiliated Other Acquired Funds will continue through at least March 31, 2016. This waiver does not apply to net assets of the Fund not invested in shares of Underlying Funds or Other Acquired Funds (e.g., direct investments in other securities and instruments). |
| (2) | The Investment Manager has contractually agreed, until March 31, 2016, to irrevocably waive its management and administrative fees and reimburse any additional other expenses or acquired fund fees and expenses, to the extent that Total Annual Fund Operating Expenses after Expense Reductions, excluding, interest, taxes, and extraordinary expenses, exceed the rates noted in the table above based on the Fund’s average net assets attributable to each share class. Under the Expense Limitation Agreement, the Investment Manager may recoup waived or reimbursed amounts for three years, provided total expenses, including such recoupment, do not exceed the annual expense limit in effect at the time of such waiver or reimbursement. The Expense Limitation Agreement is terminable by the Trust upon 90 days’ prior written notice to the Investment Manager or at any time by mutual agreement of the parties. |
| (3) | Effective April 1, 2015, the Investment Manager has contractually agreed, until March 31, 2016, to irrevocably waive its management fee and/or reimburse the Fund, to the extent that, after the application of the fee waiver described in footnote (1) above, Total Annual Fund Operating Expenses, excluding interest, taxes, and extraordinary expenses, acquired fund fees and expenses and certain credits and other expenses, exceed the rates noted in the table above based on the Fund’s average net assets attributable to each share class. Under the Expense Limitation Agreement, the Investment Manager may recoup waived or reimbursed amounts for three years, provided total expenses, including such recoupment, do not exceed the annual expense limit in effect at the time of such waiver or reimbursement. The Expense Limitation Agreement is terminable by the Trust upon 90 days’ prior written notice to the Investment Manager or at any time by mutual agreement of the parties. |
| (4) | The Investment Manager has contractually agreed, until March 31, 2016, to reimburse other expenses or acquired fund fees and expenses, to the extent that Total Annual Fund Operating Expenses after Expense Reductions, including payment of organizational expenses, but excluding, interest, taxes, and extraordinary expenses, exceed the rates noted in the table above based on the Fund’s average net assets attributable to each share class. Under the Expense Limitation Agreement, the Investment Manager may recoup waived or reimbursed amounts for three years, provided total expenses, including such recoupment, do not exceed the annual expense limit in effect at the time of such waiver or reimbursement. The Expense Limitation Agreement is terminable by the Trust upon 90 days’ prior written notice to the Investment Manager or at any time by mutual agreement of the parties. |
| (5) | Effective April 1, 2015, the Investment Manager has contractually agreed, until March 31, 2016, to irrevocably waive its management fee and/or reimburse the Fund, to the extent that, Total Annual Fund Operating Expenses, excluding interest, taxes, and extraordinary expenses, and certain credits and other expenses, exceed the rates noted in the table above based upon the Fund’s average net assets attributable to each share class. Under the Expense Limitation Agreement, the Investment Manager may recoup waived or reimbursed amounts for three years, provided total expenses, including such recoupment, do not exceed the annual expense limit in effect at the time of such waiver or reimbursement. The Expense Limitation Agreement is terminable by the Trust upon 90 days’ prior written notice to the Investment Manager or at any time by mutual agreement of the parties. |
| (6) | The Investment Manager has contractually agreed, until March 31, 2016, to irrevocably waive its management fee and/or reimburse the Fund, to the extent that, Total Annual Fund Operating Expenses, including payment of organizational expenses, but excluding interest, taxes, and extraordinary expenses, and certain credits and other expenses, exceed the rates noted in the table above based upon the Fund’s average net assets attributable to each share class. Under the Expense Limitation Agreement, the Investment Manager may recoup waived or reimbursed amounts for three years, provided total expenses, including such recoupment, do not exceed the annual expense limit in effect at the time of such waiver or reimbursement. The Expense Limitation Agreement is terminable by the Trust upon 90 days’ prior written notice to the Investment Manager or at any time by mutual agreement of the parties. |
| 322 | May 31, 2015 | | Semiannual Report |
Table of Contents
| (7) | Effective April 1, 2015, the Investment Manager has contractually agreed, until March 31, 2016, to irrevocably waive its management fee and/or reimburse the Fund, to the extent that, Total Annual Fund Operating Expenses, including payment of organizational expenses, but excluding interest, taxes, and extraordinary expenses, acquired fund fees and expenses, and certain credits and other expenses, exceed the rates noted in the table above based upon the Fund’s average net assets attributable to each share class. Under the Expense Limitation Agreement, the Investment Manager may recoup waived or reimbursed amounts for three years, provided total expenses, including such recoupment, do not exceed the annual expense limit in effect at the time of such waiver or reimbursement. The Expense Limitation Agreement is terminable by the Trust upon 90 days’ prior written notice to the Investment Manager or at any time by mutual agreement of the parties. |
| * | As a result of reimbursing expenses inclusive of estimated acquired fund fees and expenses, the Investment Manager reimbursed amounts in excess of the respective share class’ operating expenses. The aggregate excess reimbursement of each share class is accounted for as “Contribution from Investment Manager” on the Statements of Operations. |
The Investment Manager, as per expense limitation agreements, may recoup waived/reimbursed amounts for a period of up to three years, provided total expenses, including such recoupment, do not exceed the annual expense limit in effect at the time of such waiver/recoupment. During the period or six months ended May 31, 2015, the Investment Manager recouped a total of $108,094 from the Funds as disclosed on the Statements of Operations. The following represents the amounts that still can be recouped by the Investment Manager as of May 31, 2015.
| Unrecouped Expenses Waived/Reimbursed through Year ended November 30, | ||||||||||||||||
| 2012 | 2013 | 2014 | Total | |||||||||||||
AllianzGI Retirement 2015 | $ | 18,532 | $ | 30,313 | $ | 38,573 | $ | 87,418 | ||||||||
AllianzGI Retirement 2020 | 14,067 | 41,366 | 67,973 | 123,406 | ||||||||||||
AllianzGI Retirement 2025 | 7,439 | 40,739 | 77,249 | 125,427 | ||||||||||||
AllianzGI Retirement 2030 | 30,870 | 64,152 | 86,688 | 181,710 | ||||||||||||
AllianzGI Retirement 2035 | 10,573 | 39,569 | 66,529 | 116,671 | ||||||||||||
AllianzGI Retirement 2040 | 20,733 | 40,074 | 63,194 | 124,001 | ||||||||||||
AllianzGI Retirement 2045 | 9,262 | 21,258 | 38,603 | 69,123 | ||||||||||||
AllianzGI Retirement 2050 | 19,237 | 24,243 | 32,386 | 75,866 | ||||||||||||
AllianzGI Retirement 2055 | 8,988 | 9,226 | 10,500 | 28,714 | ||||||||||||
AllianzGI Retirement Income | 35,421 | 45,280 | 40,092 | 120,793 | ||||||||||||
AllianzGI Global Allocation | 529,000 | 529,090 | 527,620 | 1,585,710 | ||||||||||||
AllianzGI Global Dynamic Allocation | 211,891 | 215,351 | 225,735 | 652,977 | ||||||||||||
AllianzGI Behavioral Advantage Large Cap | 235,009 | 179,849 | 177,064 | 591,922 | ||||||||||||
AllianzGI Best Styles Global Equity | — | — | 457,171 | 457,171 | ||||||||||||
AllianzGI China Equity | 217,554 | 198,512 | 231,354 | 647,420 | ||||||||||||
AllianzGI Emerging Markets Debt | — | — | 217,381 | 217,381 | ||||||||||||
AllianzGI Global Fundamental Strategy | — | 172,001 | 255,965 | 427,966 | ||||||||||||
AllianzGI Global Managed Volatility | 286,597 | 263,268 | 256,403 | 806,268 | ||||||||||||
AllianzGI High Yield Bond | 22,180 | 16,068 | 508 | 38,756 | ||||||||||||
AllianzGI International Small-Cap | 266,568 | 259,712 | 263,862 | 790,142 | ||||||||||||
AllianzGI Micro Cap | 131,890 | 162,476 | 117,388 | 411,754 | ||||||||||||
AllianzGI Multi-Asset Real Return | — | 366,103 | 255,119 | 621,222 | ||||||||||||
AllianzGI NFJ Emerging Markets Value | — | 385,249 | 322,923 | 708,172 | ||||||||||||
AllianzGI NFJ Global Dividend Value | 171,065 | 175,973 | 172,847 | 519,885 | ||||||||||||
AllianzGI NFJ International Small-Cap Value | 175,822 | 311,827 | 251,942 | 739,591 | ||||||||||||
AllianzGI NFJ International Value II | 302,633 | 242,764 | 236,156 | 781,553 | ||||||||||||
AllianzGI Short Duration High Income | 109,027 | 137,195 | 113,125 | 359,347 | ||||||||||||
AllianzGI Structured Return | — | 317,508 | 423,380 | 740,888 | ||||||||||||
AllianzGI U.S. Equity Hedged | — | 375,759 | 222,985 | 598,744 | ||||||||||||
AllianzGI U.S. Small-Cap Growth | 197,501 | 158,039 | 177,919 | 533,459 | ||||||||||||
AllianzGI Ultra Micro Cap | 13,282 | — | — | 13,282 | ||||||||||||
| Semiannual Report | | May 31, 2015 | 323 |
Table of Contents
Notes to Financial Statements (cont’d)
May 31, 2015 (Unaudited)
| 7. | INVESTMENTS IN SECURITIES |
For the period or six months ended May 31, 2015, purchases and sales of investments, other than short-term securities and U.S. government obligations were:
| Purchases | Sales | |||||||
AllianzGI Retirement 2015 | $ | 37,702,004 | $ | 42,689,139 | ||||
AllianzGI Retirement 2020 | 66,142,663 | 63,252,606 | ||||||
AllianzGI Retirement 2025 | 66,819,009 | 61,833,342 | ||||||
AllianzGI Retirement 2030 | 66,773,812 | 62,433,614 | ||||||
AllianzGI Retirement 2035 | 49,587,366 | 46,981,748 | ||||||
AllianzGI Retirement 2040 | 39,293,813 | 38,148,768 | ||||||
AllianzGI Retirement 2045 | 23,358,288 | 25,051,401 | ||||||
AllianzGI Retirement 2050 | 20,021,137 | 20,227,779 | ||||||
AllianzGI Retirement 2055 | 7,466,095 | 6,717,934 | ||||||
AllianzGI Retirement Income | 25,839,838 | 29,646,300 | ||||||
AllianzGI Global Allocation | 187,590,751 | 203,344,125 | ||||||
AllianzGI Global Dynamic Allocation | 6,515,355 | 6,400,229 | ||||||
AllianzGI Global Megatrends | 3,000,000 | — | ||||||
AllianzGI Behavioral Advantage Large Cap | 33,072,429 | 75,550,540 | ||||||
AllianzGI Best Styles Emerging Markets Equity | 6,568,248 | 1,385,378 | ||||||
AllianzGI Best Styles Global Equity | 91,695,003 | 17,860,139 | ||||||
AllianzGI Best Styles International Equity | 37,422,837 | 6,191,941 | ||||||
AllianzGI Best Styles U.S. Equity | 89,830,028 | 33,503,595 | ||||||
AllianzGI China Equity | 8,028,852 | 2,456,629 | ||||||
AllianzGI Convertible | 1,133,285,729 | 1,433,005,801 | ||||||
AllianzGI Emerging Markets Consumer | 16,061,906 | 3,767,142 | ||||||
AllianzGI Emerging Markets Debt | 23,063,748 | 20,758,061 | ||||||
AllianzGI Emerging Markets Small-Cap | 6,868,151 | 2,298,809 | ||||||
AllianzGI Europe Equity Dividend | 3,324,472 | 252,808 | ||||||
AllianzGI Global Fundamental Strategy | 2,047,191 | 3,302,739 | ||||||
AllianzGI Global Managed Volatility | 3,980,330 | 17,752,955 | ||||||
AllianzGI Global Sustainability | 3,607,745 | 685,985 | ||||||
AllianzGI Global Water | 133,971,311 | 135,070,920 | ||||||
AllianzGI High Yield Bond | 115,158,382 | 99,708,452 | ||||||
AllianzGI International Growth | 2,973,416 | 1,414 | ||||||
AllianzGI International Small-Cap | 33,634,037 | 23,805,064 | ||||||
AllianzGI Micro Cap | 12,079,596 | 14,094,430 | ||||||
AllianzGI Multi-Asset Real Return | 1,037,058 | 1,210,914 | ||||||
| Purchases | Sales | |||||||
AllianzGI NFJ Emerging Markets Value | $ | 4,685,952 | $ | 5,235,389 | ||||
AllianzGI NFJ Global Dividend Value | 10,451,956 | 35,393,953 | ||||||
AllianzGI NFJ International Small-Cap Value | 9,169,988 | 10,875,002 | ||||||
AllianzGI NFJ International Value II | 20,367,524 | 13,247,855 | ||||||
AllianzGI Short Duration High Income | 368,081,705 | 340,297,434 | ||||||
AllianzGI Structured Return | 8,250,853 | 210,646 | ||||||
AllianzGI U.S. Equity Hedged | 14,695,830 | 14,322,550 | ||||||
AllianzGI U.S. Small-Cap Growth | 21,386,107 | 16,330,344 | ||||||
AllianzGI Ultra Micro Cap | 23,868,136 | 44,336,082 | ||||||
Purchases and sales in U.S. government obligations were:
| Purchases | Sales | |||||||
AllianzGI Global Dynamic Allocation | $ | 480,069 | — | |||||
AllianzGI Multi-Asset Real Return | 126,565 | $ | 431,423 | |||||
(a) Transactions in options written for the six months ended May 31, 2015:
| AllianzGI Global Fundamental Strategy: | ||||||||
| Contracts | Premiums | |||||||
Options outstanding, November 30, 2014 | 45 | $ | 15,646 | |||||
Options written | 296 | 129,476 | ||||||
Options terminated in closing transactions | (108 | ) | (40,338 | ) | ||||
Options expired | (62 | ) | (26,690 | ) | ||||
Options outstanding, May 31, 2015 | 171 | $ | 78,094 | |||||
| AllianzGI Structured Return: | ||||||||
| Contracts | Premiums | |||||||
Options outstanding, November 30, 2014 | 844 | $ | 1,537,991 | |||||
Options written | 2,134 | 8,301,970 | ||||||
Options terminated in closing transactions | (655 | ) | (6,750,825 | ) | ||||
Options expired | (1,960 | ) | (1,594,587 | ) | ||||
Options outstanding, May 31, 2015 | 363 | $ | 1,494,549 | |||||
| AllianzGI U.S. Equity Hedged: | ||||||||
| Contracts | Premiums | |||||||
Options outstanding, November 30, 2014 | 72 | $ | 42,942 | |||||
Options written | 619 | 433,236 | ||||||
Options terminated in closing transactions | (146 | ) | (121,947 | ) | ||||
Options expired | (447 | ) | (285,302 | ) | ||||
Options outstanding, May 31, 2015 | 98 | $ | 68,929 | |||||
| 324 | May 31, 2015 | | Semiannual Report |
Table of Contents
(b) Credit default swap agreements outstanding at May 31, 2015:
OTC buy protection swap agreements:
| AllianzGI Emerging Markets Debt: | ||||||||||||||||||||||||||||
| Swap Counterparty/ Referenced Debt Issuer | Notional Amount (000s)(1) | Credit Spread | Termination Date | Payments Made | Value(2) | Upfront Premiums Paid | Unrealized Appreciation (Depreciation) | |||||||||||||||||||||
Barclays Bank PLC: | ||||||||||||||||||||||||||||
Republic of Turkey | $ | 1,000 | 2.08 | % | 6/20/20 | (1.00 | )% | $ | 49,766 | $ | 49,061 | $ | 705 | |||||||||||||||
Republic of Turkey | 1,000 | 2.08 | % | 6/20/20 | (1.00 | )% | 49,878 | 52,736 | (2,858 | ) | ||||||||||||||||||
| $ | 99,644 | $ | 101,797 | $ | (2,153 | ) | ||||||||||||||||||||||
OTC sell protection swap agreements:
| AllianzGI Emerging Markets Debt: | ||||||||||||||||||||||||||||
| Swap Counterparty/ Referenced Debt Issuer | Notional Amount (000s)(1) | Credit Spread | Termination Date | Payments Received | Value(2) | Upfront Premiums Received | Unrealized Appreciation | |||||||||||||||||||||
Barclays Bank PLC: | ||||||||||||||||||||||||||||
CDX.EM-22 5-Year Index | $ | 4,000 | 3.52 | % | 12/20/19 | 1.00 | % | $ | (405,975 | ) | $ | (508,000 | ) | $ | 102,025 | |||||||||||||
Republic of South Africa | 2,000 | 2.03 | % | 6/20/20 | 1.00 | % | (94,282 | ) | (95,083 | ) | 801 | |||||||||||||||||
| $ | (500,257 | ) | $ | (603,083 | ) | $ | 102,826 | |||||||||||||||||||||
| (1) | This represents the maximum potential amount the Fund could be required to make available as a seller of credit protection or receive as a buyer of credit protection if a credit event occurs as defined under the terms of that particular swap agreement. |
| (2) | The quoted market prices and resulting values for credit default swap agreements serve as an indicator of the status at May 31, 2015 of the payment/performance risk and represent the likelihood of an expected liability (or profit) for the credit derivative should the notional amount of the swap agreement have been closed/sold as of the period end. Increasing market values, in absolute terms when compared to the notional amount of the swap, represent a deterioration of the referenced entity’s credit soundness and a greater likelihood or risk of default or other credit event occurring as defined under the terms of the agreement. |
(c) Futures contracts outstanding at May 31, 2015:
| AllianzGI Global Allocation: | ||||||||||||||||
| Type | Contracts | Market Value (000s) | Expiration Date | Unrealized Appreciation (Depreciation) | ||||||||||||
Long: 10-Year U.S. Treasury Note Futures | 24 | $ | 3,065 | 9/21/15 | $ | 25,463 | ||||||||||
Bovespa Index | 45 | 749 | 6/17/15 | (50,306 | ) | |||||||||||
Dow Jones U.S. Real Estate Index | 30 | 880 | 6/19/15 | (30,104 | ) | |||||||||||
Euro STOXX 50 Index | 257 | 5,030 | 6/19/15 | 4,522 | ||||||||||||
FTSE 100 Index | 13 | 1,384 | 6/19/15 | 24,452 | ||||||||||||
FTSE/JSE Top 40 Index | 25 | 956 | 6/18/15 | (3,792 | ) | |||||||||||
Hang Seng Index | 10 | 1,752 | 6/29/15 | (51,597 | ) | |||||||||||
MSCI Taiwan Index | 26 | 937 | 6/29/15 | (4,680 | ) | |||||||||||
Russell 2000 Mini Index | 22 | 2,737 | 6/19/15 | 66,873 | ||||||||||||
SPI 200 Index | 4 | 442 | 6/18/15 | (14,539 | ) | |||||||||||
TOPIX Index | 21 | 2,827 | 6/11/15 | 252,807 | ||||||||||||
U.S. Dollar Index | 20 | 1,940 | 6/15/15 | (24,140 | ) | |||||||||||
U.S. Treasury 5-Year Note | 114 | 13,649 | 9/30/15 | 73,698 | ||||||||||||
U.S. Treasury Ultra Long-Term Bond | 25 | 4,007 | 9/21/15 | 103,064 | ||||||||||||
Short: Mini MSCI Emerging Markets Index | (9 | ) | (449 | ) | 6/19/15 | (18,780 | ) | |||||||||
| $ | 352,941 | |||||||||||||||
| Semiannual Report | | May 31, 2015 | 325 |
Table of Contents
Notes to Financial Statements (cont’d)
May 31, 2015 (Unaudited)
| AllianzGI Global Dynamic Allocation: | ||||||||||||||||
| Type | Contracts | Market Value (000s) | Expiration Date | Unrealized Appreciation (Depreciation) | ||||||||||||
Long: 10-Year U.S. Treasury Note Futures | 1 | $ | 128 | 9/21/15 | $ | 396 | ||||||||||
E-mini S&P 500 Index | 8 | 842 | 6/19/15 | 16,863 | ||||||||||||
Euro STOXX 600 Index | 11 | 241 | 6/19/15 | 5,337 | ||||||||||||
TOPIX Index | 2 | 269 | 6/11/15 | 16,463 | ||||||||||||
U.S. Treasury 5-Year Note | 2 | 240 | 9/30/15 | 699 | ||||||||||||
Short: Mini MSCI Emerging Markets Index | (1 | ) | (50 | ) | 6/19/15 | (3,183 | ) | |||||||||
| $ | 36,575 | |||||||||||||||
| AllianzGI Best Styles Global Equity: | ||||||||||||||||
| Type | Contracts | Market Value (000s) | Expiration Date | Unrealized Appreciation (Depreciation) | ||||||||||||
Long: E-mini S&P 500 Index | 8 | $ | 842 | 6/19/15 | $ | 11,731 | ||||||||||
Euro STOXX 50 Index | 6 | 235 | 6/19/15 | (3,129 | ) | |||||||||||
FTSE 100 Index | 1 | 106 | 6/19/15 | 1,993 | ||||||||||||
Mini MSCI Emerging Markets Index | 3 | 150 | 6/19/15 | 2,830 | ||||||||||||
TOPIX Index | 1 | 135 | 6/11/15 | 9,661 | ||||||||||||
| $ | 23,086 | |||||||||||||||
| AllianzGI Best Styles U.S. Equity: | ||||||||||||||||
| Type | Contracts | Market Value (000s) | Expiration Date | Unrealized Appreciation | ||||||||||||
Long: E-mini S&P 500 Index | 35 | $ | 3,686 | 6/19/15 | $ | 10,228 | ||||||||||
| AllianzGI Global Fundamental Strategy: | ||||||||||||||||
| Type | Contracts | Market Value (000s) | Expiration Date | Unrealized Depreciation | ||||||||||||
Short: 10-Year U.S. Treasury Note Futures | (5 | ) | $ | (638 | ) | 9/21/15 | $ | (3,213 | ) | |||||||
Euro-Bobl | (3 | ) | (429 | ) | 9/8/15 | (268 | ) | |||||||||
Euro-Bund 10-Year Bond | (3 | ) | (4 | ) | 6/26/15 | (1,124 | ) | |||||||||
Euro-Bund 10-Year Bond | (1 | ) | (170 | ) | 9/8/15 | (913 | ) | |||||||||
U.S. Treasury 5-Year Note | (4 | ) | (479 | ) | 9/30/15 | (2,039 | ) | |||||||||
| $ | (7,557 | ) | ||||||||||||||
| AllianzGI Multi-Asset Real Return: | ||||||||||||||||
| Type | Contracts | Market Value (000s) | Expiration Date | Unrealized Appreciation (Depreciation) | ||||||||||||
Long: E-mini S&P 500 Index | 2 | $ | 211 | 6/19/15 | $ | 2,623 | ||||||||||
Euro STOXX 50 Index | 3 | 117 | 6/19/15 | (927 | ) | |||||||||||
Mini MSCI Emerging Markets Index | 1 | 50 | 6/19/15 | (1,538 | ) | |||||||||||
Short: 10-Year U.S. Treasury Note Futures | (4 | ) | (511 | ) | 9/21/15 | (1,602 | ) | |||||||||
Dow Jones U.S. Real Estate Index | (9 | ) | (264 | ) | 6/19/15 | 3,299 | ||||||||||
Euro Currency | (1 | ) | (137 | ) | 6/15/15 | 2,803 | ||||||||||
U.S. Treasury 2-Year Note | (1 | ) | (219 | ) | 9/30/15 | (268 | ) | |||||||||
XAB Materials | (4 | ) | (214 | ) | 6/19/15 | (2,290 | ) | |||||||||
| $ | 2,100 | |||||||||||||||
| 326 | May 31, 2015 | | Semiannual Report |
Table of Contents
(d) Forward foreign currency contracts outstanding at May 31, 2015:
| AllianzGI Global Allocation: | ||||||||||||||||
| Counterparty | U.S.$ Value on Origination Date | U.S.$ Value May 31, 2015 | Unrealized Appreciation (Depreciation) | |||||||||||||
Purchased: | ||||||||||||||||
1,000,000 Euro settling 8/12/15 | State Street Bank | $ | 1,137,490 | $ | 1,099,387 | $ | (38,103 | ) | ||||||||
Sold: | ||||||||||||||||
5,000,000 Euro settling 8/12/15 | State Street Bank | 5,584,135 | 5,496,935 | 87,200 | ||||||||||||
| $ | 49,097 | |||||||||||||||
| AllianzGI Global Dynamic Allocation: | ||||||||||||||||
| Counterparty | U.S.$ Value on Origination Date | U.S.$ Value May 31, 2015 | Unrealized Depreciation | |||||||||||||
Sold: | ||||||||||||||||
160,000 Euro settling 7/1/15 | State Street Bank | $ | 174,073 | $ | 175,794 | $ | (1,721 | ) | ||||||||
| AllianzGI Emerging Markets Debt: | ||||||||||||||||
| Counterparty | U.S.$ Value on Origination Date | U.S.$ Value May 31, 2015 | Unrealized Appreciation (Depreciation) | |||||||||||||
Purchased: | ||||||||||||||||
270,484 Euro settling 7/10/15 | State Street Bank | $ | 291,000 | $ | 297,223 | $ | 6,223 | |||||||||
Sold: | ||||||||||||||||
545,934 Euro settling 7/10/15 | State Street Bank | 587,000 | 599,904 | (12,904 | ) | |||||||||||
| $ | (6,681 | ) | ||||||||||||||
| AllianzGI Europe Equity Dividend: | ||||||||||||||||
| Counterparty | U.S.$ Value on Origination Date | U.S.$ Value May 31, 2015 | Unrealized Appreciation (Depreciation) | |||||||||||||
Purchased: | ||||||||||||||||
78,034 Euro settling 6/12/15 | State Street Bank | $ | 85,075 | $ | 85,714 | $ | 639 | |||||||||
Sold: | ||||||||||||||||
849,135 British Pound settling 6/12/15 | State Street Bank | 1,272,840 | 1,297,713 | (24,873 | ) | |||||||||||
1,320,000 Euro settling 6/12/15 | State Street Bank | 1,400,936 | 1,449,933 | (48,996 | ) | |||||||||||
1,400,000 Norwegian Krone settling 6/12/15 | State Street Bank | 171,074 | 180,098 | (9,024 | ) | |||||||||||
200,000 Polish Zloty settling 6/12/15 | State Street Bank | 50,931 | 53,422 | (2,491 | ) | |||||||||||
1,300,000 Swedish Krona settling 6/12/15 | State Street Bank | 151,084 | 152,493 | (1,409 | ) | |||||||||||
109,000 Swiss Franc settling 6/12/15 | State Street Bank | 110,368 | 116,014 | (5,646 | ) | |||||||||||
| $ | (91,800 | ) | ||||||||||||||
| AllianzGI Global Fundamental Strategy: | ||||||||||||||||
| Counterparty | U.S.$ Value on Origination Date | U.S.$ Value May 31, 2015 | Unrealized Appreciation (Depreciation) | |||||||||||||
Purchased: | ||||||||||||||||
35,000,000 Indian Rupee settling 2/26/16 | State Street Bank | $ | 530,222 | $ | 521,299 | $ | (8,923 | ) | ||||||||
Sold: | ||||||||||||||||
250,000 British Pound settling 8/28/15 | State Street Bank | 385,192 | 381,857 | 3,335 | ||||||||||||
1,400,000 Euro settling 8/28/15 | State Street Bank | 1,529,958 | 1,539,508 | (9,550 | ) | |||||||||||
55,000,000 Japanese Yen settling 8/28/15 | State Street Bank | 447,607 | 443,622 | 3,985 | ||||||||||||
| $ | (11,153 | ) | ||||||||||||||
| Semiannual Report | | May 31, 2015 | 327 |
Table of Contents
Notes to Financial Statements (cont’d)
May 31, 2015 (Unaudited)
| AllianzGI International Small-Cap: | ||||||||||||||||
| Counterparty | U.S.$ Value on Origination Date | U.S.$ Value May 31, 2015 | Unrealized Depreciation | |||||||||||||
Purchased: | ||||||||||||||||
125,145 Australian Dollar settling 6/3/15 | Northern Trust Company | $ | 95,818 | $ | 95,675 | $ | (143 | ) | ||||||||
| AllianzGI NFJ Emerging Markets Value: | ||||||||||||||||
| Counterparty | U.S.$ Value on Origination Date | U.S.$ Value May 31, 2015 | Unrealized Appreciation (Depreciation) | |||||||||||||
Purchased: | ||||||||||||||||
66,670 South African Rand settling 6/3/15 | Northern Trust Company | $ | 5,513 | $ | 5,489 | $ | (24 | ) | ||||||||
34,591 South African Rand settling 6/4/15 | Northern Trust Company | 2,852 | 2,847 | (5 | ) | |||||||||||
59,741 South African Rand settling 6/5/15 | Northern Trust Company | 4,933 | 4,917 | (16 | ) | |||||||||||
Sold: | ||||||||||||||||
20,638 Hong Kong Dollar settling 6/1/15 | Northern Trust Company | 2,662 | 2,662 | — | ||||||||||||
7,387 Singapore Dollar settling 6/2/15 | Northern Trust Company | 5,458 | 5,479 | (21 | ) | |||||||||||
33,335 South African Rand settling 6/3/15 | Northern Trust Company | 2,764 | 2,744 | 20 | ||||||||||||
| $ | (46 | ) | ||||||||||||||
At May 31, 2015, the following Funds pledged cash as collateral for derivatives:
| Collateral | ||||
AllianzGI Global Allocation | $ | 3,591,850 | ||
AllianzGI Global Dynamic Allocation | 203,618 | |||
AllianzGI Best Styles Global Equity | 1,009,268 | |||
AllianzGI Emerging Markets Debt | 520,000 | |||
AllianzGI Global Fundamental Strategy | 82,763 | |||
AllianzGI Multi-Asset Real Return | 130,917 | |||
Glossary:
CDX.EM—Credit Derivatives Index Emerging Markets
FTSE—Financial Times Stock Exchange
JSE—Johannesburg Stock Exchange Limited
MSCI—Morgan Stanley Capital International
OTC—Over-the-Counter
TOPIX—Tokyo Stock Price Index
| 8. | INCOME TAX INFORMATION |
At May 31, 2015, the aggregate cost basis and the net unrealized appreciation (depreciation) of investments (before options written) for federal income tax purposes were:
| Federal Tax Cost Basis | Unrealized Appreciation | Unrealized Depreciation | Net Unrealized Appreciation | |||||||||||||
AllianzGI Retirement 2015 | $ | 28,209,385 | $ | 474,034 | $ | 212,668 | $ | 261,366 | ||||||||
AllianzGI Retirement 2020 | 63,582,026 | 974,157 | 631,284 | 342,873 | ||||||||||||
AllianzGI Retirement 2025 | 68,616,163 | 1,055,420 | 677,221 | 378,199 | ||||||||||||
AllianzGI Retirement 2030 | 66,629,766 | 1,403,227 | 668,626 | 734,601 | ||||||||||||
AllianzGI Retirement 2035 | 54,619,632 | 1,186,801 | 613,500 | 573,301 | ||||||||||||
AllianzGI Retirement 2040 | 42,896,396 | 1,404,563 | 522,331 | 882,232 | ||||||||||||
AllianzGI Retirement 2045 | 23,721,439 | 887,985 | 260,321 | 627,664 | ||||||||||||
AllianzGI Retirement 2050 | 20,045,163 | 965,974 | 222,759 | 743,215 | ||||||||||||
AllianzGI Retirement 2055 | 8,217,527 | 365,664 | 108,801 | 256,863 | ||||||||||||
AllianzGI Retirement Income | 24,657,032 | 522,816 | 196,766 | 326,050 | ||||||||||||
| 328 | May 31, 2015 | | Semiannual Report |
Table of Contents
| Federal Tax Cost Basis | Unrealized Appreciation | Unrealized Depreciation | Net Unrealized Appreciation (Depreciation) | |||||||||||||
AllianzGI Global Allocation | $ | 191,844,106 | $ | 10,290,083 | $ | 1,156,991 | $ | 9,133,092 | ||||||||
AllianzGI Global Dynamic Allocation | 7,507,693 | 263,561 | 7,010 | 256,551 | ||||||||||||
AllianzGI Global Megatrends | 3,000,000 | 213,015 | — | 213,015 | ||||||||||||
AllianzGI Behavioral Advantage Large Cap | 40,091,493 | 4,625,662 | 467,580 | 4,158,082 | ||||||||||||
AllianzGI Best Styles Emerging Markets Equity | 5,580,168 | 381,480 | 292,501 | 88,979 | ||||||||||||
AllianzGI Best Styles Global Equity | 107,429,484 | 9,545,218 | 2,461,521 | 7,083,697 | ||||||||||||
AllianzGI Best Styles International Equity | 32,198,104 | 2,203,043 | 815,753 | 1,387,290 | ||||||||||||
AllianzGI Best Styles U.S. Equity | 59,594,764 | 2,452,465 | 1,927,551 | 524,914 | ||||||||||||
AllianzGI China Equity | 11,818,649 | 1,550,665 | 184,599 | 1,366,066 | ||||||||||||
AllianzGI Convertible | 2,220,718,408 | 328,422,602 | 24,394,335 | 304,028,267 | ||||||||||||
AllianzGI Emerging Markets Consumer | 12,533,283 | 1,061,120 | 747,524 | 313,596 | ||||||||||||
AllianzGI Emerging Markets Debt | 30,603,375 | 280,207 | 652,310 | (372,103 | ) | |||||||||||
AllianzGI Emerging Markets Small-Cap | 4,684,459 | 581,805 | 149,731 | 432,074 | ||||||||||||
AllianzGI Europe Equity Dividend | 3,284,182 | 162,485 | 58,557 | 103,928 | ||||||||||||
AllianzGI Global Fundamental Strategy | 22,115,027 | 1,167,922 | 985,352 | 182,570 | ||||||||||||
AllianzGI Global Managed Volatility | 2,520,400 | 255,221 | 34,077 | 221,144 | ||||||||||||
AllianzGI Global Sustainability | 3,028,945 | 169,008 | 53,632 | 115,376 | ||||||||||||
AllianzGI Global Water | 326,442,937 | 48,705,233 | 7,720,878 | 40,984,355 | ||||||||||||
AllianzGI High Yield Bond | 398,583,104 | 11,561,849 | 11,785,808 | (223,959 | ) | |||||||||||
AllianzGI International Growth | 2,971,964 | 251,745 | 72,759 | 178,986 | ||||||||||||
AllianzGI International Small-Cap | 100,786,121 | 23,154,119 | 3,970,394 | 19,183,725 | ||||||||||||
AllianzGI Micro Cap | 27,765,561 | 14,716,008 | 847,163 | 13,868,845 | ||||||||||||
AllianzGI Multi-Asset Real Return | 5,164,322 | 273,253 | 391,138 | (117,885 | ) | |||||||||||
AllianzGI NFJ Emerging Markets Value | 9,132,556 | 844,094 | 696,009 | 148,085 | ||||||||||||
AllianzGI NFJ Global Dividend Value | 36,609,984 | 4,963,019 | 1,194,432 | 3,768,587 | ||||||||||||
AllianzGI NFJ International Small-Cap Value | 17,428,767 | 2,054,455 | 640,028 | 1,414,427 | ||||||||||||
AllianzGI NFJ International Value II | 48,073,834 | 4,145,331 | 2,163,349 | 1,981,982 | ||||||||||||
AllianzGI Short Duration High Income | 831,967,195 | 4,057,702 | 9,954,897 | (5,897,195 | ) | |||||||||||
AllianzGI Structured Return | 31,761,319 | 1,120,518 | 45,713 | 1,074,805 | ||||||||||||
AllianzGI U.S. Equity Hedged | 16,359,034 | 305,711 | 409,130 | (103,419 | ) | |||||||||||
AllianzGI U.S. Small-Cap Growth | 35,330,252 | 10,739,379 | 832,048 | 9,907,331 | ||||||||||||
AllianzGI Ultra Micro Cap | 71,141,503 | 33,197,026 | 2,673,946 | 30,523,080 | ||||||||||||
Differences, if any, between book and tax cost basis were attributable to wash sale loss deferrals and the differing treatment of bond premium amortization.
| Semiannual Report | | May 31, 2015 | 329 |
Table of Contents
Notes to Financial Statements (cont’d)
May 31, 2015 (Unaudited)
| 9. | SHARES OF BENEFICIAL INTEREST |
The Trust may issue an unlimited number of shares of beneficial interest with $0.0001 par value. Changes in shares of beneficial interest were as follows:
| AllianzGI Retirement 2015 | AllianzGI Retirement 2020 | |||||||||||||||||||||||||||||||||
| Six Months ended May 31, 2015 (unaudited) | Year ended November 30, 2014 | Six Months ended May 31, 2015 (unaudited) | Year ended November 30, 2014 | |||||||||||||||||||||||||||||||
| Shares | Amount | Shares | Amount | Shares | Amount | Shares | Amount | |||||||||||||||||||||||||||
Shares sold: | ||||||||||||||||||||||||||||||||||
Class A | 59,308 | $ | 1,134,068 | 565,795 | $ | 11,168,574 | 81,329 | $ | 1,546,748 | 1,433,411 | $ | 28,178,631 | ||||||||||||||||||||||
Class C | 1,368 | 26,258 | 15,337 | 298,797 | 524 | 10,005 | 4,810 | 94,427 | ||||||||||||||||||||||||||
Class D | 128 | 2,478 | 17 | 332 | 1,697 | 32,804 | 2,880 | 56,444 | ||||||||||||||||||||||||||
Class R | 4,378 | 83,545 | 1,134 | 22,530 | 5,726 | 110,395 | 5,007 | 97,615 | ||||||||||||||||||||||||||
Class P | 407,573 | 7,917,777 | 171,764 | 3,325,289 | 719,167 | 13,941,521 | 333,605 | 6,405,645 | ||||||||||||||||||||||||||
Class R6 | 25,904 | 502,110 | 715,197 | 14,343,900 | 41,734 | 802,549 | 159,121 | 3,113,834 | ||||||||||||||||||||||||||
Administrative Class | 2,354 | 45,949 | 16,965 | 335,842 | 9,076 | 174,641 | 82,204 | 1,617,550 | ||||||||||||||||||||||||||
Issued in reinvestment of dividends and distributions: |
| |||||||||||||||||||||||||||||||||
Class A | 24,769 | 469,122 | 10,510 | 201,688 | 57,371 | 1,081,443 | 19,810 | 376,585 | ||||||||||||||||||||||||||
Class C | 1,587 | 29,943 | 736 | 14,041 | 549 | 10,356 | 225 | 4,276 | ||||||||||||||||||||||||||
Class D | 130 | 2,500 | 120 | 2,326 | 386 | 7,318 | 262 | 5,007 | ||||||||||||||||||||||||||
Class R | 339 | 6,473 | 76 | 1,464 | 1,528 | 28,883 | 772 | 14,703 | ||||||||||||||||||||||||||
Class P | 12,230 | 233,835 | 4,379 | 84,782 | 27,186 | 518,167 | 8,058 | 154,714 | ||||||||||||||||||||||||||
Class R6 | 29,130 | 557,260 | 9,220 | 178,596 | 10,025 | 191,285 | 8,358 | 160,647 | ||||||||||||||||||||||||||
Administrative Class | 6,191 | 118,241 | 3,808 | 73,602 | 12,238 | 232,151 | 7,237 | 138,300 | ||||||||||||||||||||||||||
Cost of shares redeemed: | ||||||||||||||||||||||||||||||||||
Class A | (129,903 | ) | (2,491,839 | ) | (205,257 | ) | (4,032,346 | ) | (169,947 | ) | (3,236,253 | ) | (168,555 | ) | (3,278,677 | ) | ||||||||||||||||||
Class C | (11,679 | ) | (223,804 | ) | (35,474 | ) | (694,946 | ) | (4,825 | ) | (92,208 | ) | (4,003 | ) | (78,690 | ) | ||||||||||||||||||
Class D | (1,611 | ) | (31,823 | ) | (5,313 | ) | (104,936 | ) | (908 | ) | (17,841 | ) | (5,733 | ) | (113,637 | ) | ||||||||||||||||||
Class R | (2,312 | ) | (44,798 | ) | (2,592 | ) | (50,484 | ) | (1,216 | ) | (23,700 | ) | (7,690 | ) | (150,766 | )�� | ||||||||||||||||||
Class P | (75,815 | ) | (1,472,265 | ) | (190,596 | ) | (3,761,904 | ) | (247,686 | ) | (4,836,431 | ) | (99,035 | ) | (1,960,444 | ) | ||||||||||||||||||
Class R6 | (446,235 | ) | (8,726,828 | ) | (440,624 | ) | (8,878,990 | ) | (60,046 | ) | (1,152,584 | ) | (270,027 | ) | (5,377,317 | ) | ||||||||||||||||||
Administrative Class | (149,054 | ) | (2,842,561 | ) | (47,231 | ) | (938,663 | ) | (321,771 | ) | (6,101,294 | ) | (58,748 | ) | (1,155,300 | ) | ||||||||||||||||||
Net increase (decrease) resulting from Fund share transactions | (241,220 | ) | $ | (4,704,359 | ) | 587,971 | $ | 11,589,494 | 162,137 | $ | 3,227,955 | 1,451,969 | $ | 28,303,547 | ||||||||||||||||||||
| 330 | May 31, 2015 | | Semiannual Report |
Table of Contents
| AllianzGI Retirement 2025 | AllianzGI Retirement 2030 | AllianzGI Retirement 2035 | ||||||||||||||||||||||||||||||||||||||||||||||
| Six Months ended May 31, 2015 (unaudited) | Year ended November 30, 2014 | Six Months ended May 31, 2015 (unaudited) | Year ended November 30, 2014 | Six Months ended May 31, 2015 (unaudited) | Year ended November 30, 2014 | |||||||||||||||||||||||||||||||||||||||||||
| Shares | Amount | Shares | Amount | Shares | Amount | Shares | Amount | Shares | Amount | Shares | Amount | |||||||||||||||||||||||||||||||||||||
| 109,250 | $ | 1,831,946 | 1,335,068 | $ | 22,916,623 | 103,760 | $ | 2,085,353 | 928,027 | $ | 19,420,259 | 85,264 | $ | 1,510,605 | 816,929 | $ | 14,941,272 | |||||||||||||||||||||||||||||||
| — | — | — | — | 1,779 | 35,603 | 6,650 | 138,830 | — | — | — | — | |||||||||||||||||||||||||||||||||||||
| — | — | — | — | 681 | 13,830 | 2,113 | 43,399 | — | — | — | — | |||||||||||||||||||||||||||||||||||||
| 14,689 | 242,987 | 35,394 | 595,164 | 12,928 | 259,266 | 18,581 | 388,307 | 35,076 | 612,302 | 9,352 | 170,961 | |||||||||||||||||||||||||||||||||||||
| 1,065,630 | 17,878,987 | 703,711 | 11,746,860 | 768,981 | 15,644,318 | 541,841 | 11,072,179 | 924,682 | 16,361,124 | 572,738 | 10,179,074 | |||||||||||||||||||||||||||||||||||||
| 29,926 | 505,279 | 225,478 | 3,834,014 | 106,854 | 2,191,650 | 268,513 | 5,654,075 | 20,204 | 363,260 | 155,191 | 2,843,057 | |||||||||||||||||||||||||||||||||||||
| 12,426 | 210,420 | 117,954 | 2,028,052 | 8,523 | 175,086 | 92,910 | 1,960,346 | 11,304 | 203,161 | 78,765 | 1,447,310 | |||||||||||||||||||||||||||||||||||||
| 54,681 | 906,067 | 25,283 | 421,464 | 56,387 | 1,119,279 | 21,054 | 427,836 | 48,988 | 856,311 | 16,679 | 297,724 | |||||||||||||||||||||||||||||||||||||
| — | — | — | — | 1,188 | 23,540 | 495 | 10,033 | — | — | — | — | |||||||||||||||||||||||||||||||||||||
| — | — | — | — | 1,301 | 26,010 | 637 | 13,023 | — | — | — | — | |||||||||||||||||||||||||||||||||||||
| 1,501 | 24,851 | 1,097 | 18,248 | 2,124 | 42,369 | 896 | 18,290 | 2,409 | 42,137 | 922 | 16,445 | |||||||||||||||||||||||||||||||||||||
| 32,694 | 545,013 | 4,784 | 80,182 | 42,916 | 863,478 | 8,988 | 184,881 | 42,634 | 750,353 | 6,302 | 113,126 | |||||||||||||||||||||||||||||||||||||
| 10,346 | 172,571 | 6,502 | 108,975 | 20,482 | 412,721 | 12,548 | 258,616 | 9,357 | 164,873 | 7,644 | 137,282 | |||||||||||||||||||||||||||||||||||||
| 20,948 | 348,778 | 11,996 | 200,811 | 21,067 | 422,819 | 9,758 | 200,325 | 27,741 | 487,129 | 12,521 | 224,389 | |||||||||||||||||||||||||||||||||||||
| (110,498 | ) | (1,849,539 | ) | (318,923 | ) | (5,466,861 | ) | (182,706 | ) | (3,675,677 | ) | (225,966 | ) | (4,705,694 | ) | (101,506 | ) | (1,790,820 | ) | (116,775 | ) | (2,135,925 | ) | |||||||||||||||||||||||||
| — | — | — | — | (1,670 | ) | (33,810 | ) | (10,583 | ) | (219,126 | ) | — | — | — | — | |||||||||||||||||||||||||||||||||
| — | — | — | — | (2,630 | ) | (53,390 | ) | (3,534 | ) | (74,687 | ) | — | — | — | — | |||||||||||||||||||||||||||||||||
| (8,424 | ) | (141,869 | ) | (22,892 | ) | (383,869 | ) | (6,007 | ) | (122,976 | ) | (10,198 | ) | (211,997 | ) | (5,187 | ) | (90,689 | ) | (4,604 | ) | (85,076 | ) | |||||||||||||||||||||||||
| (161,298 | ) | (2,731,984 | ) | (167,809 | ) | (2,872,130 | ) | (214,296 | ) | (4,455,185 | ) | (90,735 | ) | (1,921,242 | ) | (139,142 | ) | (2,486,908 | ) | (115,777 | ) | (2,127,542 | ) | |||||||||||||||||||||||||
| (96,122 | ) | (1,662,160 | ) | (142,236 | ) | (2,478,415 | ) | (78,109 | ) | (1,608,039 | ) | (389,999 | ) | (8,258,015 | ) | (184,706 | ) | (3,413,327 | ) | (131,228 | ) | (2,440,381 | ) | |||||||||||||||||||||||||
| (661,995 | ) | (10,981,440 | ) | (55,774 | ) | (962,168 | ) | (394,366 | ) | (7,873,378 | ) | (80,462 | ) | (1,695,999 | ) | (610,310 | ) | (10,646,752 | ) | (43,975 | ) | (806,171 | ) | |||||||||||||||||||||||||
| | 313,754 | | $ | 5,299,907 | 1,759,633 | $ | 29,786,950 | 269,187 | $ | 5,492,867 | 1,101,534 | $ | 22,703,639 | 166,808 | $ | 2,922,759 | 1,264,684 | $ | 22,775,545 | |||||||||||||||||||||||||||||
| Semiannual Report | | May 31, 2015 | 331 |
Table of Contents
Notes to Financial Statements (cont’d)
May 31, 2015 (Unaudited)
| AllianzGI Retirement 2040 | AllianzGI Retirement 2045 | |||||||||||||||||||||||||||||||||
| Six Months ended May 31, 2015 (unaudited) | Year ended November 30, 2014 | Six Months ended May 31, 2015 (unaudited) | Year ended November 30, 2014 | |||||||||||||||||||||||||||||||
| Shares | Amount | Shares | Amount | Shares | Amount | Shares | Amount | |||||||||||||||||||||||||||
Shares sold: | ||||||||||||||||||||||||||||||||||
Class A | 63,217 | $ | 1,296,846 | 602,125 | $ | 13,046,627 | 79,278 | $ | 1,432,979 | 351,881 | $ | 6,635,440 | ||||||||||||||||||||||
Class C | 1,038 | 21,119 | 3,035 | 65,077 | — | — | — | — | ||||||||||||||||||||||||||
Class D | 5,542 | 115,150 | 1,915 | 41,790 | — | — | — | — | ||||||||||||||||||||||||||
Class R | 9,507 | 194,143 | 13,129 | 283,949 | 4,441 | 80,687 | 5,261 | 99,251 | ||||||||||||||||||||||||||
Class P | 383,362 | 7,926,688 | 396,823 | 8,391,622 | 184,632 | 3,367,053 | 374,167 | 6,834,798 | ||||||||||||||||||||||||||
Class R6 | 120,420 | 2,524,777 | 207,481 | 4,538,383 | 15,546 | 287,758 | 55,303 | 1,043,172 | ||||||||||||||||||||||||||
Administrative Class | 5,631 | 118,448 | 37,217 | 809,484 | 3,159 | 58,198 | 25,662 | 486,607 | ||||||||||||||||||||||||||
Issued in reinvestment of dividends and distributions: |
| |||||||||||||||||||||||||||||||||
Class A | 50,572 | 1,025,602 | 14,621 | 309,393 | 28,656 | 512,944 | 10,650 | 196,475 | ||||||||||||||||||||||||||
Class C | 640 | 12,993 | 239 | 5,039 | — | — | — | — | ||||||||||||||||||||||||||
Class D | 573 | 11,659 | 203 | 4,300 | — | — | — | — | ||||||||||||||||||||||||||
Class R | 3,564 | 72,164 | 1,013 | 21,388 | 1,197 | 21,404 | 412 | 7,597 | ||||||||||||||||||||||||||
Class P | 34,748 | 711,292 | 5,671 | 121,070 | 27,637 | 497,461 | 3,796 | 70,620 | ||||||||||||||||||||||||||
Class R6 | 26,874 | 550,923 | 12,498 | 266,724 | 14,530 | 261,973 | 6,710 | 124,598 | ||||||||||||||||||||||||||
Administrative Class | 15,745 | 321,032 | 5,623 | 119,471 | 5,022 | 90,199 | 2,123 | 39,271 | ||||||||||||||||||||||||||
Cost of shares redeemed: | ||||||||||||||||||||||||||||||||||
Class A | (102,907 | ) | (2,110,174 | ) | (114,672 | ) | (2,480,516 | ) | (41,873 | ) | (757,289 | ) | (65,555 | ) | (1,241,169 | ) | ||||||||||||||||||
Class C | (4,188 | ) | (86,613 | ) | (5,844 | ) | (125,784 | ) | — | — | — | — | ||||||||||||||||||||||
Class D | (2,095 | ) | (43,910 | ) | (2,906 | ) | (62,937 | ) | — | — | — | — | ||||||||||||||||||||||
Class R | (14,432 | ) | (291,653 | ) | (7,288 | ) | (158,731 | ) | (1,534 | ) | (27,532 | ) | (1,225 | ) | (23,327 | ) | ||||||||||||||||||
Class P | (142,232 | ) | (3,040,071 | ) | (90,176 | ) | (1,975,572 | ) | (73,231 | ) | (1,343,604 | ) | (42,668 | ) | (819,648 | ) | ||||||||||||||||||
Class R6 | (94,881 | ) | (1,976,101 | ) | (315,133 | ) | (6,958,416 | ) | (232,068 | ) | (4,356,369 | ) | (21,916 | ) | (422,785 | ) | ||||||||||||||||||
Administrative Class | (239,212 | ) | (4,845,445 | ) | (37,880 | ) | (821,095 | ) | (82,973 | ) | (1,475,514 | ) | (18,161 | ) | (345,338 | ) | ||||||||||||||||||
Net increase (decrease) resulting from Fund share transactions | 121,486 | $ | 2,508,869 | 727,694 | $ | 15,441,266 | (67,581 | ) | $ | (1,349,652 | ) | 686,440 | $ | 12,685,562 | ||||||||||||||||||||
| 332 | May 31, 2015 | | Semiannual Report |
Table of Contents
| AllianzGI Retirement 2050 | AllianzGI Retirement 2055 | AllianzGI Retirement Income | ||||||||||||||||||||||||||||||||||||||||||||||
| Six Months ended May 31, 2015 (unaudited) | Year ended November 30, 2014 | Six Months ended May 31, 2015 (unaudited) | Year ended November 30, 2014 | Six Months ended May 31, 2015 (unaudited) | Year ended November 30, 2014 | |||||||||||||||||||||||||||||||||||||||||||
| Shares | Amount | Shares | Amount | Shares | Amount | Shares | Amount | Shares | Amount | Shares | Amount | |||||||||||||||||||||||||||||||||||||
| 38,374 | $ | 787,854 | 184,392 | $ | 4,003,253 | 21,000 | $ | 369,426 | 62,661 | $ | 1,165,536 | 51,895 | $ | 956,720 | 277,751 | $ | 5,324,689 | |||||||||||||||||||||||||||||||
| 739 | 15,035 | 848 | 18,153 | — | — | — | — | 20,921 | 383,305 | 29,059 | 554,674 | |||||||||||||||||||||||||||||||||||||
| 1,428 | 29,632 | 1,934 | 41,897 | — | — | — | — | 1,049 | 19,329 | 4,586 | 89,080 | |||||||||||||||||||||||||||||||||||||
| 5,188 | 105,546 | 5,260 | 114,561 | 3,802 | 66,622 | 4,091 | 75,584 | 646 | 12,351 | 3,714 | 73,267 | |||||||||||||||||||||||||||||||||||||
| 165,825 | 3,509,748 | 218,872 | 4,652,264 | 39,889 | 702,664 | 61,933 | 1,143,776 | 142,783 | 2,668,771 | 259,938 | 4,960,657 | |||||||||||||||||||||||||||||||||||||
| 93,706 | 1,949,038 | 142,748 | 3,131,628 | 16,013 | 281,727 | 17,208 | 327,478 | 25,896 | 476,491 | 121,093 | 2,307,728 | |||||||||||||||||||||||||||||||||||||
| 2,491 | 52,043 | 15,235 | 333,045 | 1,874 | 33,620 | 7,983 | 149,207 | 987 | 18,801 | 12,601 | 245,703 | |||||||||||||||||||||||||||||||||||||
| 15,847 | 319,309 | 4,363 | 93,070 | 4,037 | 69,796 | 1,172 | 21,356 | 16,655 | 305,349 | 5,138 | 98,989 | |||||||||||||||||||||||||||||||||||||
| 414 | 8,313 | 157 | 3,333 | — | — | — | — | 9,743 | 176,840 | 2,353 | 45,087 | |||||||||||||||||||||||||||||||||||||
| 702 | 14,236 | 472 | 10,080 | — | — | — | — | 2,578 | 47,525 | 872 | 16,924 | |||||||||||||||||||||||||||||||||||||
| 1,831 | 36,924 | 663 | 14,134 | 475 | 8,215 | 153 | 2,791 | 516 | 9,773 | 126 | 2,510 | |||||||||||||||||||||||||||||||||||||
| 21,769 | 443,439 | 3,259 | 70,571 | 3,989 | 69,446 | 859 | 15,862 | 14,607 | 271,393 | 7,746 | 151,273 | |||||||||||||||||||||||||||||||||||||
| 25,905 | 528,980 | 13,791 | 296,988 | 18,517 | 323,120 | 9,281 | 170,105 | 24,763 | 450,581 | 11,265 | 215,784 | |||||||||||||||||||||||||||||||||||||
| 3,920 | 79,620 | 1,765 | 37,821 | 1,338 | 23,229 | 492 | 8,985 | 4,505 | 83,435 | 1,903 | 37,092 | |||||||||||||||||||||||||||||||||||||
| (22,188 | ) | (458,132 | ) | (17,588 | ) | (384,126 | ) | (6,078 | ) | (108,803 | ) | (12,856 | ) | (234,967 | ) | (50,322 | ) | (932,603 | ) | (184,344 | ) | (3,547,224 | ) | |||||||||||||||||||||||||
| — | — | (214 | ) | (4,743 | ) | — | — | — | — | (37,256 | ) | (682,953 | ) | (55,702 | ) | (1,055,914 | ) | |||||||||||||||||||||||||||||||
| (3,898 | ) | (82,713 | ) | (4,712 | ) | (102,260 | ) | — | — | — | — | (3,273 | ) | (61,102 | ) | (11,788 | ) | (227,211 | ) | |||||||||||||||||||||||||||||
| (1,685 | ) | (34,938 | ) | (2,304 | ) | (49,752 | ) | (560 | ) | (10,089 | ) | (465 | ) | (8,626 | ) | (30 | ) | (573 | ) | (828 | ) | (16,175 | ) | |||||||||||||||||||||||||
| (42,128 | ) | (891,508 | ) | (49,914 | ) | (1,093,827 | ) | (26,875 | ) | (494,273 | ) | (3,433 | ) | (64,844 | ) | (125,176 | ) | (2,392,466 | ) | (174,487 | ) | (3,404,901 | ) | |||||||||||||||||||||||||
| (247,285 | ) | (5,270,974 | ) | (150,620 | ) | (3,320,055 | ) | (9,750 | ) | (172,646 | ) | (815 | ) | (15,132 | ) | (161,244 | ) | (3,001,207 | ) | (142,315 | ) | (2,735,083 | ) | |||||||||||||||||||||||||
| (39,115 | ) | (792,058 | ) | (15,510 | ) | (343,282 | ) | (12,826 | ) | (220,739 | ) | (1,368 | ) | (25,758 | ) | (105,342 | ) | (1,948,043 | ) | (40,737 | ) | (786,766 | ) | |||||||||||||||||||||||||
| 21,840 | $ | 349,394 | 352,897 | $ | 7,522,753 | 54,845 | $ | 941,315 | 146,896 | $ | 2,731,353 | (165,099 | ) | $ | (3,138,283 | ) | 127,944 | $ | 2,350,183 | |||||||||||||||||||||||||||||
| Semiannual Report | | May 31, 2015 | 333 |
Table of Contents
Notes to Financial Statements (cont’d)
May 31, 2015 (Unaudited)
| AllianzGI Global Allocation | AllianzGI Global Dynamic Allocation | |||||||||||||||||||||||||||||||||
| Six Months ended May 31, 2015 (unaudited) | Year ended November 30, 2014 | Six Months ended May 31, 2015 (unaudited) | Year ended November 30, 2014 | |||||||||||||||||||||||||||||||
| Shares | Amount | Shares | Amount | Shares | Amount | Shares | Amount | |||||||||||||||||||||||||||
Shares sold: | ||||||||||||||||||||||||||||||||||
Class A | 192,123 | $ | 2,273,631 | 488,819 | $ | 5,873,282 | 6,900 | $ | 133,000 | 13,404 | $ | 292,209 | ||||||||||||||||||||||
Class B | 370 | 4,422 | 2,464 | 30,262 | — | — | — | — | ||||||||||||||||||||||||||
Class C | 141,428 | 1,700,184 | 213,160 | 2,598,606 | 2,672 | 50,583 | 4,738 | 101,602 | ||||||||||||||||||||||||||
Class D | 22,395 | 261,366 | 113,628 | 1,360,961 | 3,052 | 57,162 | 4,698 | 104,018 | ||||||||||||||||||||||||||
Class R | — | — | — | — | 2,043 | 39,191 | 6,213 | 141,517 | ||||||||||||||||||||||||||
Class P | 58,408 | 686,826 | 90,351 | 1,093,598 | 273 | 5,156 | 237 | 5,393 | ||||||||||||||||||||||||||
Institutional Class | 1,006,729 | 11,707,581 | 1,399,068 | 16,736,242 | 100,334 | 1,901,137 | 10,994 | 247,967 | ||||||||||||||||||||||||||
Class R6 | — | — | — | — | — | — | — | — | ||||||||||||||||||||||||||
Administrative Class | — | — | 1,043 | 12,798 | 57 | 1,072 | 252 | 5,517 | ||||||||||||||||||||||||||
Issued in reinvestment of dividends and distributions: |
| |||||||||||||||||||||||||||||||||
Class A | 195,954 | 2,289,927 | 107,244 | 1,295,082 | 7,168 | 134,393 | 8,921 | 191,140 | ||||||||||||||||||||||||||
Class B | 4,393 | 52,485 | 2,373 | 29,152 | — | — | — | — | ||||||||||||||||||||||||||
Class C | 161,707 | 1,915,172 | 64,439 | 786,340 | 9,171 | 169,571 | 8,945 | 189,428 | ||||||||||||||||||||||||||
Class D | 8,204 | 95,476 | 2,898 | 34,933 | 869 | 16,211 | 2,579 | 54,881 | ||||||||||||||||||||||||||
Class R | 62 | 722 | 29 | 351 | 1,045 | 19,480 | 774 | 16,508 | ||||||||||||||||||||||||||
Class P | 1,440 | 16,824 | 978 | 11,777 | 307 | 5,748 | 279 | 5,969 | ||||||||||||||||||||||||||
Institutional Class | 284,462 | 3,290,747 | 149,348 | 1,787,276 | 24,081 | 451,512 | 21,933 | 470,228 | ||||||||||||||||||||||||||
Class R6 | — | — | — | — | — | — | — | — | ||||||||||||||||||||||||||
Administrative Class | 84 | 1,004 | 47 | 587 | 184 | 3,446 | 131 | 2,792 | ||||||||||||||||||||||||||
Cost of shares redeemed: | ||||||||||||||||||||||||||||||||||
Class A | (772,714 | ) | (9,112,826 | ) | (1,067,994 | ) | (12,901,939 | ) | (4,243 | ) | (83,043 | ) | (29,245 | ) | (638,957 | ) | ||||||||||||||||||
Class B | (72,004 | ) | (869,287 | ) | (95,177 | ) | (1,166,655 | ) | — | — | — | — | ||||||||||||||||||||||
Class C | (513,577 | ) | (6,142,446 | ) | (940,056 | ) | (11,488,956 | ) | (4,970 | ) | (94,512 | ) | (11,062 | ) | (244,700 | ) | ||||||||||||||||||
Class D | (15,255 | ) | (178,823 | ) | (32,083 | ) | (386,436 | ) | (5,221 | ) | (100,830 | ) | (17,776 | ) | (391,639 | ) | ||||||||||||||||||
Class R | — | — | — | — | (1,435 | ) | (26,974 | ) | (4,815 | ) | (110,410 | ) | ||||||||||||||||||||||
Class P | (47,423 | ) | (558,415 | ) | (80,551 | ) | (982,880 | ) | — | — | (237 | ) | (5,266 | ) | ||||||||||||||||||||
Institutional Class | (850,344 | ) | (9,971,901 | ) | (1,163,787 | ) | (13,963,585 | ) | (9,873 | ) | (198,205 | ) | (11,524 | ) | (264,374 | ) | ||||||||||||||||||
Class R6 | — | — | — | — | — | — | — | — | ||||||||||||||||||||||||||
Administrative Class | (670 | ) | (8,318 | ) | (432 | ) | (5,198 | ) | — | — | — | — | ||||||||||||||||||||||
Net increase (decrease) resulting from Fund share transactions | (194,228 | ) | $ | (2,545,649 | ) | (744,191 | ) | $ | (9,244,402 | ) | 132,414 | $ | 2,484,098 | 9,439 | $ | 173,823 | ||||||||||||||||||
| * | Actual amount rounds to less than 1 share. |
| † | For the period December 22, 2014 (commencement of share class) through May 31, 2015. “Shares sold” includes shares sold to AFI. |
| 334 | May 31, 2015 | | Semiannual Report |
Table of Contents
| AllianzGI Behavioral Advantage Large Cap | AllianzGI Best Styles Emerging Markets Equity | AllianzGI Best Styles Global Equity | ||||||||||||||||||||||||||||||||||||||
| Six Months ended May 31, 2015 (unaudited) | Year ended November 30, 2014 | Period from December 9, 2014** through May 31, 2015 (unaudited) | Six Months ended May 31, 2015 (unaudited) | Period from December 2, 2013** through November 30, 2014 | ||||||||||||||||||||||||||||||||||||
| Shares | Amount | Shares | Amount | Shares | Amount | Shares | Amount | Shares | Amount | |||||||||||||||||||||||||||||||
| 186,233 | $ | 4,097,027 | 162,296 | $ | 3,827,973 | — | — | 14,230 | $ | 232,230 | — | — | ||||||||||||||||||||||||||||
| — | — | — | — | — | — | — | — | — | — | |||||||||||||||||||||||||||||||
| 23,199 | 545,469 | 12,353 | 284,894 | — | — | — | — | — | — | |||||||||||||||||||||||||||||||
| 109,504 | 2,581,364 | 33,945 | 821,450 | — | — | — | — | — | — | |||||||||||||||||||||||||||||||
| — | — | — | — | — | — | — | — | — | — | |||||||||||||||||||||||||||||||
| — | — | 3,788 | 92,492 | — | — | 259,792 | † | 4,267,981 | † | — | — | |||||||||||||||||||||||||||||
| 135,058 | 3,193,866 | 1,871,574 | 44,216,425 | — | — | 5,777 | 93,755 | — | — | |||||||||||||||||||||||||||||||
| — | — | — | — | 38,568 | $ | 565,792 | 6,034,822 | 95,183,054 | 2,418,239 | $ | 36,454,373 | |||||||||||||||||||||||||||||
| — | — | — | — | — | — | — | — | — | — | |||||||||||||||||||||||||||||||
| 11,273 | 236,093 | 1,899 | 42,711 | — | — | 33 | 509 | — | — | |||||||||||||||||||||||||||||||
| — | — | — | — | — | — | — | — | — | — | |||||||||||||||||||||||||||||||
| 10,623 | 215,605 | 468 | 10,364 | — | — | — | — | — | — | |||||||||||||||||||||||||||||||
| 30,443 | 621,362 | 313 | 6,971 | — | — | — | — | — | — | |||||||||||||||||||||||||||||||
| — | — | — | — | — | — | — | — | — | — | |||||||||||||||||||||||||||||||
| 1,427 | 30,275 | 32 | 714 | – | * | 2 | — | — | — | — | ||||||||||||||||||||||||||||||
| 664,256 | 14,293,625 | 96,471 | 2,172,662 | – | * | 3 | 33 | 517 | — | — | ||||||||||||||||||||||||||||||
| — | — | — | — | 111 | 1,617 | 104,130 | 1,633,737 | — | — | |||||||||||||||||||||||||||||||
| — | — | — | — | — | — | — | — | — | — | |||||||||||||||||||||||||||||||
| (48,935 | ) | (1,147,825 | ) | (136,703 | ) | (3,281,256 | ) | — | — | (206 | ) | (3,387 | ) | — | — | |||||||||||||||||||||||||
| — | — | — | — | — | — | — | — | — | — | |||||||||||||||||||||||||||||||
| (3,088 | ) | (64,832 | ) | (3,656 | ) | (89,007 | ) | — | — | — | — | — | — | |||||||||||||||||||||||||||
| (31,798 | ) | (713,935 | ) | (2,052 | ) | (49,299 | ) | — | — | — | — | — | — | |||||||||||||||||||||||||||
| — | — | — | — | — | — | — | — | — | — | |||||||||||||||||||||||||||||||
| (553 | ) | (11,358 | ) | (28 | ) | (684 | ) | — | — | (2,086 | ) | (34,921 | ) | — | — | |||||||||||||||||||||||||
| (2,212,530 | ) | (49,464,122 | ) | (1,134,784 | ) | (27,583,735 | ) | — | — | — | — | — | — | |||||||||||||||||||||||||||
| — | — | — | — | — | — | (1,447,900 | ) | (22,861,620 | ) | (736,256 | ) | (11,914,060 | ) | |||||||||||||||||||||||||||
| — | — | — | — | — | — | — | — | — | — | |||||||||||||||||||||||||||||||
| | (1,124,888 | ) | $ | (25,587,386 | ) | 905,916 | $ | 20,472,675 | 38,680 | $ | 567,414 | 4,968,625 | $ | 78,511,855 | 1,681,983 | $ | 24,540,313 | |||||||||||||||||||||||
| Semiannual Report | | May 31, 2015 | 335 |
Table of Contents
Notes to Financial Statements (cont’d)
May 31, 2015 (Unaudited)
| AllianzGI Best Styles International Equity | AllianzGI Best Styles U.S. Equity | |||||||||||||||||
| Period from December 9, 2014** through May 31, 2015 (unaudited) | Period from December 1, 2014** through May 31, 2015 (unaudited) | |||||||||||||||||
| Shares | Amount | Shares | Amount | |||||||||||||||
Shares sold: | ||||||||||||||||||
Class A | — | — | — | — | ||||||||||||||
Class C | — | — | — | — | ||||||||||||||
Class D | — | — | — | — | ||||||||||||||
Class R | — | — | — | — | ||||||||||||||
Class P | — | — | 1,104 | $ | 16,784 | |||||||||||||
Institutional Class | — | — | 17,597 | 271,325 | ||||||||||||||
Class R6 | 2,299,672 | $ | 34,152,135 | 4,992,087 | 76,087,462 | |||||||||||||
Administrative Class | — | — | — | — | ||||||||||||||
Issued in reinvestment of dividends and distributions: | ||||||||||||||||||
Class A | — | — | — | — | ||||||||||||||
Class C | — | — | — | — | ||||||||||||||
Class D | — | — | — | — | ||||||||||||||
Class R | — | — | — | — | ||||||||||||||
Class P | 1 | 7 | 1 | 14 | ||||||||||||||
Institutional Class | — | * | 7 | 1 | 15 | |||||||||||||
Class R6 | 268 | 3,930 | 309 | 4,632 | ||||||||||||||
Administrative Class | — | — | — | — | ||||||||||||||
Cost of shares redeemed: | ||||||||||||||||||
Class A | — | — | — | — | ||||||||||||||
Class C | — | — | — | — | ||||||||||||||
Class D | — | — | — | — | ||||||||||||||
Class R | — | — | — | — | ||||||||||||||
Class P | — | — | — | — | ||||||||||||||
Institutional Class | — | — | — | — | ||||||||||||||
Class R6 | (486,468 | ) | (7,685,047 | ) | (1,316,759 | ) | (20,076,634 | ) | ||||||||||
Administrative Class | — | — | — | — | ||||||||||||||
Net increase (decrease) resulting from Fund share transactions | 1,813,473 | $ | 26,471,032 | 3,694,340 | $ | 56,303,598 | ||||||||||||
| * | Actual amount rounds to less than 1 share. |
| ** | Commencement of operations. |
| 336 | May 31, 2015 | | Semiannual Report |
Table of Contents
| AllianzGI China Equity | AllianzGI Convertible | AllianzGI Emerging Markets Consumer | ||||||||||||||||||||||||||||||||||||||
| Six Months ended May 31, 2015 (unaudited) | Year ended November 30, 2014 | Six Months ended May 31, 2015 (unaudited) | Year ended November 30, 2014 | Period from December 1, 2014** through May 31, 2015 (unaudited) | ||||||||||||||||||||||||||||||||||||
| Shares | Amount | Shares | Amount | Shares | Amount | Shares | Amount | Shares | Amount | |||||||||||||||||||||||||||||||
| 213,746 | $ | 4,594,283 | 47,977 | $ | 836,508 | 2,202,006 | $ | 76,198,018 | 9,378,536 | $ | 333,949,448 | 2,339 | $ | 36,199 | ||||||||||||||||||||||||||
| 1,257 | 25,607 | 333 | 5,524 | 148,930 | 5,075,349 | 783,892 | 27,624,284 | — | — | |||||||||||||||||||||||||||||||
| 129,156 | 2,784,494 | 97,121 | 1,696,266 | 163,276 | 5,595,784 | 1,531,177 | 54,245,530 | — | — | |||||||||||||||||||||||||||||||
| — | — | — | — | 12,786 | 435,881 | 36,759 | 1,298,733 | — | — | |||||||||||||||||||||||||||||||
| 3,188 | 69,600 | 118,589 | 2,120,128 | 412,986 | 14,152,008 | 2,654,621 | 94,076,352 | — | — | |||||||||||||||||||||||||||||||
| 18,645 | 348,880 | 4,105 | 65,077 | 2,248,614 | 76,807,384 | 16,075,929 | 572,163,253 | 744,085 | 10,663,234 | |||||||||||||||||||||||||||||||
| — | — | — | — | — | — | — | — | — | — | |||||||||||||||||||||||||||||||
| — | — | — | — | 1,192 | 40,792 | 29,719 | 1,046,515 | — | — | |||||||||||||||||||||||||||||||
| 735 | 11,845 | 72 | 1,192 | 1,013,075 | 34,059,857 | 480,991 | 16,815,149 | — | — | |||||||||||||||||||||||||||||||
| 15 | 243 | — | * | 2 | 173,497 | 5,830,710 | 83,150 | 2,880,924 | — | — | ||||||||||||||||||||||||||||||
| 397 | 6,488 | 96 | 1,635 | 168,001 | 5,641,841 | 144,620 | 5,010,224 | — | — | |||||||||||||||||||||||||||||||
| — | — | — | — | 2,715 | 91,065 | 866 | 30,474 | — | — | |||||||||||||||||||||||||||||||
| 9 | 154 | 3 | 45 | 365,029 | 12,246,483 | 206,303 | 7,175,753 | — | — | |||||||||||||||||||||||||||||||
| 8,001 | 129,009 | 1,934 | 31,446 | 1,955,885 | 65,555,713 | 1,272,195 | 44,097,511 | — | — | |||||||||||||||||||||||||||||||
| — | — | — | — | — | — | — | — | — | — | |||||||||||||||||||||||||||||||
| — | — | — | — | 8,114 | 272,585 | 12,056 | 413,373 | — | — | |||||||||||||||||||||||||||||||
| (16,586 | ) | (335,438 | ) | (34,924 | ) | (587,180 | ) | (2,587,271 | ) | (88,809,697 | ) | (5,777,035 | ) | (206,419,460 | ) | — | — | |||||||||||||||||||||||
| — | — | (1,878 | ) | (29,652 | ) | (475,882 | ) | (16,399,103 | ) | (645,134 | ) | (23,108,475 | ) | — | — | |||||||||||||||||||||||||
| (13,705 | ) | (268,743 | ) | (93,591 | ) | (1,640,283 | ) | (538,506 | ) | (18,451,954 | ) | (2,993,607 | ) | (106,473,571 | ) | — | — | |||||||||||||||||||||||
| — | — | — | — | (7,201 | ) | (245,264 | ) | (9,438 | ) | (340,913 | ) | — | — | |||||||||||||||||||||||||||
| (1,288 | ) | (23,652 | ) | (117,198 | ) | (2,030,207 | ) | (1,591,545 | ) | (54,472,174 | ) | (3,911,003 | ) | (139,870,968 | ) | — | — | |||||||||||||||||||||||
| (11,026 | ) | (235,943 | ) | (4,222 | ) | (71,492 | ) | (7,407,303 | ) | (253,549,788 | ) | (13,963,182 | ) | (496,357,887 | ) | (71,621 | ) | (1,102,056 | ) | |||||||||||||||||||||
| — | — | — | — | — | — | — | — | — | — | |||||||||||||||||||||||||||||||
| — | — | — | — | (50,291 | ) | (1,703,146 | ) | (309,931 | ) | (11,049,724 | ) | — | — | |||||||||||||||||||||||||||
| 332,544 | $ | 7,106,827 | 18,417 | $ | 399,009 | (3,781,893 | ) | $ | (131,627,656 | ) | 5,081,484 | $ | 177,206,525 | 674,803 | $ | 9,597,377 | ||||||||||||||||||||||||
| Semiannual Report | | May 31, 2015 | 337 |
Table of Contents
Notes to Financial Statements (cont’d)
May 31, 2015 (Unaudited)
| AllianzGI Emerging Markets Debt | AllianzGI Emerging Markets Small-Cap | |||||||||||||||||||||||||
| Six Months ended May 31, 2015 (unaudited) | Period from September 15, 2014** through November 30, 2014 | Period from December 1, 2014** through May 31, 2015 (unaudited) | ||||||||||||||||||||||||
| Shares | Amount | Shares | Amount | Shares | Amount | |||||||||||||||||||||
Shares sold: | ||||||||||||||||||||||||||
Class A | — | — | — | — | 587 | $ | 9,000 | |||||||||||||||||||
Class C | — | — | — | — | — | — | ||||||||||||||||||||
Class D | — | — | — | — | — | — | ||||||||||||||||||||
Class P | — | — | — | — | — | — | ||||||||||||||||||||
Institutional Class | 29,169 | $ | 424,090 | 201 | $ | 3,000 | 112,607 | 1,702,029 | ||||||||||||||||||
Issued in reinvestment of dividends and distributions: | ||||||||||||||||||||||||||
Class A | 16 | 222 | — | — | — | * | 1 | |||||||||||||||||||
Class C | 13 | 183 | — | — | — | — | ||||||||||||||||||||
Class D | — | — | — | — | — | — | ||||||||||||||||||||
Class P | 16 | 230 | — | — | — | — | ||||||||||||||||||||
Institutional Class | 49,820 | 712,020 | — | — | 53 | 768 | ||||||||||||||||||||
Cost of shares redeemed: | ||||||||||||||||||||||||||
Class A | — | — | — | — | — | — | ||||||||||||||||||||
Class C | — | — | — | — | — | — | ||||||||||||||||||||
Class D | — | — | — | — | — | — | ||||||||||||||||||||
Institutional Class | (461 | ) | (6,626 | ) | — | — | (2,561 | ) | (43,024 | ) | ||||||||||||||||
Net increase (decrease) resulting from Fund share transactions | 78,573 | $ | 1,130,119 | 201 | $ | 3,000 | 110,686 | $ | 1,668,774 | |||||||||||||||||
| * | Actual amount rounds to less than 1 share. |
| ** | Commencement of operations. |
| 338 | May 31, 2015 | | Semiannual Report |
Table of Contents
| AllianzGI Europe Equity Dividend | AllianzGI Global Fundamental Strategy | AllianzGI Global Managed Volatility | ||||||||||||||||||||||||||||||||||||||
| Period from February 2, 2015** through May 31, 2015 (unaudited) | Six Months ended May 31, 2015 (unaudited) | Year ended November 30, 2014 | Six Months ended May 31, 2015 (unaudited) | Year ended November 30, 2014 | ||||||||||||||||||||||||||||||||||||
| Shares | Amount | Shares | Amount | Shares | Amount | Shares | Amount | Shares | Amount | |||||||||||||||||||||||||||||||
| — | $ | — | 529 | $ | 8,200 | 343 | $ | 5,500 | 556 | $ | 9,323 | 7,703 | $ | 139,507 | ||||||||||||||||||||||||||
| 10,079 | 151,690 | — | — | — | — | 5,470 | 89,613 | 4,210 | 72,759 | |||||||||||||||||||||||||||||||
| — | — | 39 | 629 | 132,894 | 2,108,226 | 14,557 | 242,027 | 10,278 | 185,119 | |||||||||||||||||||||||||||||||
| 962 | 15,000 | — | — | — | — | — | — | — | — | |||||||||||||||||||||||||||||||
| 2,855 | 44,063 | 5,284 | 81,058 | 32,885 | 514,733 | 54,727 | 942,143 | 355,169 | 6,347,746 | |||||||||||||||||||||||||||||||
| — | — | 38 | 573 | 8 | 121 | 1,273 | 21,483 | 433 | 7,378 | |||||||||||||||||||||||||||||||
| — | — | 18 | 267 | 5 | 82 | 1,623 | 26,696 | 640 | 10,688 | |||||||||||||||||||||||||||||||
| — | — | — | * | 1 | 8 | 123 | 1,432 | 24,129 | 221 | 3,779 | ||||||||||||||||||||||||||||||
| — | — | 24 | 363 | 8 | 127 | 89 | 1,515 | 45 | 765 | |||||||||||||||||||||||||||||||
| — | — | 50,430 | 766,540 | 17,551 | 266,990 | 104,711 | 1,780,209 | 54,920 | 936,311 | |||||||||||||||||||||||||||||||
| — | — | — | — | — | — | (267 | ) | (4,463 | ) | (4,131 | ) | (74,348 | ) | |||||||||||||||||||||||||||
| — | — | — | — | — | — | (715 | ) | (11,786 | ) | (1,169 | ) | (20,156 | ) | |||||||||||||||||||||||||||
| — | — | (313 | ) | (4,999 | ) | (130,158 | ) | (2,102,958 | ) | (2,936 | ) | (49,458 | ) | (1,907 | ) | (32,956 | ) | |||||||||||||||||||||||
| — | — | (4,202 | ) | (65,396 | ) | (4,577 | ) | (72,550 | ) | (899,901 | ) | (15,269,202 | ) | (341,676 | ) | (6,170,075 | ) | |||||||||||||||||||||||
| 13,896 | $ | 210,753 | 51,847 | $ | 787,236 | 48,967 | $ | 720,394 | (719,381 | ) | $ | (12,197,771 | ) | 84,736 | $ | 1,406,517 | ||||||||||||||||||||||||
| Semiannual Report | | May 31, 2015 | 339 |
Table of Contents
Notes to Financial Statements (cont’d)
May 31, 2015 (Unaudited)
| AllianzGI Global Water | AllianzGI High Yield Bond | |||||||||||||||||||||||||||||||||
| Six Months ended May 31, 2015 (unaudited) | Year ended November 30, 2014 | Six Months ended May 31, 2015 (unaudited) | Year ended November 30, 2014 | |||||||||||||||||||||||||||||||
| Shares | Amount | Shares | Amount | Shares | Amount | Shares | Amount | |||||||||||||||||||||||||||
Shares sold: | ||||||||||||||||||||||||||||||||||
Class A | 1,250,472 | $ | 16,074,700 | 5,054,690 | $ | 65,144,593 | 960,406 | $ | 9,306,197 | 6,399,597 | $ | 65,986,882 | ||||||||||||||||||||||
Class C | 569,220 | 7,095,772 | 2,639,550 | 33,090,769 | 214,190 | 2,063,098 | 364,999 | 3,734,373 | ||||||||||||||||||||||||||
Class D | 719,294 | 9,253,733 | 1,045,385 | 13,370,723 | 1,212,872 | 11,417,909 | 5,266,270 | 52,650,764 | ||||||||||||||||||||||||||
Class R | — | — | — | — | 38,175 | 358,203 | 85,466 | 850,770 | ||||||||||||||||||||||||||
Class P | 1,341,703 | 17,273,036 | 4,361,682 | 56,618,924 | 5,700,081 | 53,630,226 | 4,704,306 | 46,908,733 | ||||||||||||||||||||||||||
Institutional Class | 1,027,054 | 13,010,487 | 1,221,512 | 15,284,070 | 6,459,463 | 60,962,022 | 8,139,958 | 81,218,091 | ||||||||||||||||||||||||||
Administrative Class | — | — | — | — | 535,109 | 5,017,331 | 975,031 | 9,674,170 | ||||||||||||||||||||||||||
Issued in reinvestment of dividends and distributions: |
| |||||||||||||||||||||||||||||||||
Class A | 18,859 | 239,882 | 16,616 | 206,530 | 115,387 | 1,115,736 | 478,710 | 4,882,230 | ||||||||||||||||||||||||||
Class C | 3 | 35 | 2 | 24 | 50,819 | 490,652 | 132,332 | 1,350,402 | ||||||||||||||||||||||||||
Class D | 4,513 | 57,175 | 2,130 | 26,435 | 123,077 | 1,154,509 | 559,184 | 5,567,301 | ||||||||||||||||||||||||||
Class R | — | — | — | — | 4,891 | 45,630 | 14,407 | 142,605 | ||||||||||||||||||||||||||
Class P | 22,371 | 285,226 | 3,092 | 38,644 | 247,138 | 2,311,704 | 164,872 | 1,616,090 | ||||||||||||||||||||||||||
Institutional Class | 10,993 | 138,288 | 14,188 | 174,654 | 629,504 | 5,905,055 | 1,231,774 | 12,214,737 | ||||||||||||||||||||||||||
Administrative Class* | — | — | — | — | 124,081 | 1,158,674 | 267,511 | 2,642,365 | ||||||||||||||||||||||||||
Cost of shares redeemed: | ||||||||||||||||||||||||||||||||||
Class A | (1,572,071 | ) | (20,113,645 | ) | (3,715,316 | ) | (47,547,688 | ) | (4,844,172 | ) | (47,183,960 | ) | (6,267,650 | ) | (64,238,196 | ) | ||||||||||||||||||
Class C | (715,227 | ) | (8,910,822 | ) | (659,979 | ) | (8,184,199 | ) | (535,123 | ) | (5,169,409 | ) | (792,200 | ) | (8,123,429 | ) | ||||||||||||||||||
Class D | (341,758 | ) | (4,320,110 | ) | (649,666 | ) | (8,288,640 | ) | (1,156,779 | ) | (10,881,408 | ) | (12,671,964 | ) | (125,729,678 | ) | ||||||||||||||||||
Class R | — | — | — | — | (231,567 | ) | (2,187,209 | ) | (87,196 | ) | (864,515 | ) | ||||||||||||||||||||||
Class P | (1,336,206 | ) | (17,079,533 | ) | (1,132,432 | ) | (14,452,539 | ) | (2,545,335 | ) | (23,794,037 | ) | (7,622,734 | ) | (75,348,847 | ) | ||||||||||||||||||
Institutional Class | (576,173 | ) | (7,298,941 | ) | (524,519 | ) | (6,774,923 | ) | (4,419,220 | ) | (41,391,055 | ) | (6,073,414 | ) | (60,369,062 | ) | ||||||||||||||||||
Administrative Class* | — | — | — | — | (407,175 | ) | (3,815,923 | ) | (859,602 | ) | (8,497,846 | ) | ||||||||||||||||||||||
Net increase (decrease) resulting from Fund share transactions | 423,047 | $ | 5,705,283 | 7,676,935 | $ | 98,707,377 | 2,275,822 | $ | 20,513,945 | (5,590,343 | ) | $ | (53,732,060 | ) | ||||||||||||||||||||
| * | The Administrative Class of AllianzGI International Small-Cap liquidated on May 21, 2014 |
| 340 | May 31, 2015 | | Semiannual Report |
Table of Contents
| AllianzGI International Growth | AllianzGI International Small-Cap | AllianzGI Micro Cap | ||||||||||||||||||||||||||||||||||||||
| Period from February 2, 2015** through May 31, 2015 (unaudited) | Six Months ended May 31, 2015 (unaudited) | Year ended November 30, 2014 | Six Months ended May 31, 2015 (unaudited) | Year ended November 30, 2014 | ||||||||||||||||||||||||||||||||||||
| Shares | Amount | Shares | Amount | Shares | Amount | Shares | Amount | Shares | Amount | |||||||||||||||||||||||||||||||
| 65 | $ | 992 | 142,474 | $ | 5,088,084 | 73,277 | $ | 2,791,007 | 219,448 | $ | 3,299,897 | 399,661 | $ | 6,160,930 | ||||||||||||||||||||||||||
| — | — | 27,134 | 959,087 | 16,672 | 631,732 | — | — | — | — | |||||||||||||||||||||||||||||||
| — | — | 85,980 | 3,098,312 | 37,572 | 1,458,900 | — | — | — | — | |||||||||||||||||||||||||||||||
| — | — | 732 | 25,984 | 1,648 | 65,427 | — | — | — | — | |||||||||||||||||||||||||||||||
| — | — | 301,059 | 10,774,232 | 62,438 | 2,371,208 | 163,619 | 2,486,600 | 114,922 | 1,727,101 | |||||||||||||||||||||||||||||||
| 2,133 | 34,965 | 512,160 | 18,638,997 | 617,404 | 24,247,569 | 321,410 | 4,780,260 | 523,355 | 8,114,834 | |||||||||||||||||||||||||||||||
| — | — | — | — | — | — | — | — | — | — | |||||||||||||||||||||||||||||||
| — | — | 3,515 | 112,387 | 3,662 | 139,022 | 29,336 | 397,207 | 6,704 | 96,626 | |||||||||||||||||||||||||||||||
| — | — | 3,043 | 95,904 | 1,882 | 70,221 | — | — | — | — | |||||||||||||||||||||||||||||||
| — | — | 4,516 | 146,117 | 1,781 | 67,541 | — | — | — | — | |||||||||||||||||||||||||||||||
| — | — | 237 | 7,459 | 126 | 4,691 | — | — | — | — | |||||||||||||||||||||||||||||||
| — | — | 88,587 | 2,821,915 | 84,995 | 3,203,373 | 9,656 | 131,124 | 8,303 | 121,008 | |||||||||||||||||||||||||||||||
| — | — | 173,226 | 5,694,741 | 167,967 | 6,493,882 | 203,545 | 2,776,351 | 168,032 | 2,457,259 | |||||||||||||||||||||||||||||||
| — | — | — | — | 32 | 1,233 | — | — | — | — | |||||||||||||||||||||||||||||||
| — | — | (17,172 | ) | (599,894 | ) | (37,081 | ) | (1,424,052 | ) | (109,097 | ) | (1,547,298 | ) | (157,911 | ) | (2,360,756 | ) | |||||||||||||||||||||||
| — | — | (4,057 | ) | (136,072 | ) | (3,235 | ) | (121,551 | ) | — | — | — | — | |||||||||||||||||||||||||||
| — | — | (28,537 | ) | (998,491 | ) | (7,002 | ) | (270,483 | ) | — | — | — | — | |||||||||||||||||||||||||||
| — | — | (112 | ) | (4,093 | ) | (338 | ) | (12,555 | ) | — | — | — | — | |||||||||||||||||||||||||||
| — | — | (48,220 | ) | (1,630,821 | ) | (165,391 | ) | (6,340,580 | ) | (160,324 | ) | (2,397,135 | ) | (155,672 | ) | (2,371,249 | ) | |||||||||||||||||||||||
| (2,133 | ) | (34,901 | ) | (547,377 | ) | (19,445,944 | ) | (939,731 | ) | (36,977,150 | ) | (518,982 | ) | (7,568,452 | ) | (1,038,064 | ) | (16,274,113 | ) | |||||||||||||||||||||
| — | — | — | — | (395 | ) | (15,734 | ) | — | — | — | — | |||||||||||||||||||||||||||||
| 65 | $ | 1,056 | 697,188 | $ | 24,647,904 | (83,717 | ) | $ | (3,616,299 | ) | 158,611 | $ | 2,358,554 | (130,670 | ) | $ | (2,328,360 | ) | ||||||||||||||||||||||
| Semiannual Report | | May 31, 2015 | 341 |
Table of Contents
Notes to Financial Statements (cont’d)
May 31, 2015 (Unaudited)
| AllianzGI Multi-Asset Real Return | AllianzGI NFJ Emerging Markets Value | |||||||||||||||||||||||||||||||||
| Six Months ended May 31, 2015 (unaudited) | Year ended November 30, 2014 | Six Months ended May 31, 2015 (unaudited) | Year ended November 30, 2014 | |||||||||||||||||||||||||||||||
| Shares | Amount | Shares | Amount | Shares | Amount | Shares | Amount | |||||||||||||||||||||||||||
Shares sold: | ||||||||||||||||||||||||||||||||||
Class A | 843 | $ | 12,307 | 8,570 | $ | 136,109 | 3,131 | $ | 45,235 | 6,386 | $ | 104,381 | ||||||||||||||||||||||
Class C | 896 | 12,938 | 2,305 | 36,791 | 2,291 | 35,526 | 4,960 | 77,501 | ||||||||||||||||||||||||||
Class D | 204 | 2,940 | 2,801 | 45,392 | 20,700 | 325,281 | 32,709 | 498,303 | ||||||||||||||||||||||||||
Class P | — | — | — | — | — | — | — | — | ||||||||||||||||||||||||||
Institutional Class | 16,513 | 235,517 | 63,174 | 1,009,479 | 56,253 | 805,074 | 145,860 | 2,193,154 | ||||||||||||||||||||||||||
Issued in reinvestment of dividends and distributions: | ||||||||||||||||||||||||||||||||||
Class A | 120 | 1,726 | 67 | 1,027 | 322 | 4,569 | 82 | 1,302 | ||||||||||||||||||||||||||
Class C | 49 | 703 | 101 | 1,522 | 182 | 2,589 | 40 | 619 | ||||||||||||||||||||||||||
Class D | 16 | 237 | 16 | 247 | 4,156 | 59,458 | 1,798 | 27,988 | ||||||||||||||||||||||||||
Class P | 8 | 113 | 13 | 206 | 31 | 443 | 16 | 251 | ||||||||||||||||||||||||||
Institutional Class | 5,207 | 75,299 | 7,729 | 117,589 | 22,973 | 328,898 | 11,041 | 171,834 | ||||||||||||||||||||||||||
Cost of shares redeemed: | ||||||||||||||||||||||||||||||||||
Class A | (533 | ) | (7,902 | ) | (1,962 | ) | (30,566 | ) | (500 | ) | (7,086 | ) | (555 | ) | (8,452 | ) | ||||||||||||||||||
Class C | (1,025 | ) | (15,000 | ) | — | — | (2,388 | ) | (35,712 | ) | (1,911 | ) | (30,191 | ) | ||||||||||||||||||||
Class D | (105 | ) | (1,539 | ) | (1,948 | ) | (31,022 | ) | (20,242 | ) | (291,197 | ) | (8,879 | ) | (138,625 | ) | ||||||||||||||||||
Class P | — | — | — | — | — | — | — | — | ||||||||||||||||||||||||||
Institutional Class | (78,880 | ) | (1,174,191 | ) | (3,081 | ) | (47,323 | ) | (88,140 | ) | (1,294,516 | ) | (68,819 | ) | (1,079,616 | ) | ||||||||||||||||||
Net increase (decrease) resulting from Fund share transactions | (56,687 | ) | $ | (856,852 | ) | 77,785 | $ | 1,239,451 | (1,231 | ) | $ | (21,438 | ) | 122,728 | $ | 1,818,449 | ||||||||||||||||||
| * | Actual amount rounds to less than 1 share. |
| ** | Commencement of operations. |
| 342 | May 31, 2015 | | Semiannual Report |
Table of Contents
| AllianzGI NFJ Global Dividend Value | AllianzGI NFJ International Small-Cap Value | AllianzGI NFJ International Value II | ||||||||||||||||||||||||||||||||||||||||||||||
| Six Months ended May 31, 2015 (unaudited) | Year ended November 30, 2014 | Six Months ended May 31, 2015 (unaudited) | Year ended November 30, 2014 | Six Months ended May 31, 2015 (unaudited) | Year ended November 30, 2014 | |||||||||||||||||||||||||||||||||||||||||||
| Shares | Amount | Shares | Amount | Shares | Amount | Shares | Amount | Shares | Amount | Shares | Amount | |||||||||||||||||||||||||||||||||||||
| 111,800 | $ | 2,233,294 | 162,083 | $ | 3,477,503 | 23,276 | $ | 469,823 | 48,712 | $ | 1,066,486 | 2,862 | $ | 53,923 | 8,104 | $ | 151,790 | |||||||||||||||||||||||||||||||
| 79,632 | 1,581,471 | 39,372 | 842,560 | 5,810 | 115,233 | 40,730 | 871,407 | 4,851 | 83,290 | 1,926 | 37,144 | |||||||||||||||||||||||||||||||||||||
| 29,243 | 603,098 | 153,952 | 3,252,570 | 18,967 | 386,241 | 29,335 | 652,498 | — | — | 26 | 500 | |||||||||||||||||||||||||||||||||||||
| 14,340 | 296,871 | 33,279 | 725,436 | 728 | 15,000 | 1,118 | 23,872 | 25,150 | 440,988 | 5,818 | 111,255 | |||||||||||||||||||||||||||||||||||||
| 157,662 | 3,127,073 | 694,994 | 14,914,749 | 235,725 | 4,636,976 | 410,371 | 9,023,170 | 437,608 | 7,896,122 | 2,121,556 | 39,404,304 | |||||||||||||||||||||||||||||||||||||
| 14,952 | 296,719 | 17,710 | 379,306 | 15,155 | 289,859 | 3,742 | 76,805 | 93 | 1,613 | 305 | 5,554 | |||||||||||||||||||||||||||||||||||||
| 14,869 | 291,411 | 17,882 | 378,057 | 7,389 | 139,615 | 1,339 | 27,556 | 32 | 558 | 161 | 2,894 | |||||||||||||||||||||||||||||||||||||
| 11,467 | 229,790 | 2,747 | 59,528 | 8,103 | 155,355 | 1,400 | 28,792 | 8 | 134 | 47 | 858 | |||||||||||||||||||||||||||||||||||||
| 5,022 | 100,258 | 5,717 | 123,263 | 222 | 4,299 | 22 | 458 | 152 | 2,691 | 83 | 1,546 | |||||||||||||||||||||||||||||||||||||
| 115,693 | 2,285,778 | 188,251 | 4,014,390 | 66,020 | 1,278,612 | 22,916 | 475,973 | 27,036 | 473,424 | 47,479 | 890,282 | |||||||||||||||||||||||||||||||||||||
| (60,459 | ) | (1,210,572 | ) | (103,941 | ) | (2,256,133 | ) | (17,284 | ) | (336,337 | ) | (32,328 | ) | (702,239 | ) | (802 | ) | (14,882 | ) | (3,021 | ) | (54,207 | ) | |||||||||||||||||||||||||
| (39,740 | ) | (770,424 | ) | (54,948 | ) | (1,154,599 | ) | (3,463 | ) | (66,723 | ) | (3,342 | ) | (68,903 | ) | — | — | (110 | ) | (2,017 | ) | |||||||||||||||||||||||||||
| (99,032 | ) | (1,993,018 | ) | (10,177 | ) | (219,368 | ) | (14,162 | ) | (280,658 | ) | (11,231 | ) | (243,022 | ) | — | — | — | — | |||||||||||||||||||||||||||||
| (12,316 | ) | (244,562 | ) | (30,781 | ) | (649,884 | ) | (209 | ) | (4,000 | ) | — | — | (483 | ) | (8,482 | ) | (25 | ) | (473 | ) | |||||||||||||||||||||||||||
| (1,423,178 | ) | (28,625,238 | ) | (1,200,205 | ) | (25,678,653 | ) | (330,936 | ) | (6,528,303 | ) | (343,755 | ) | (7,612,375 | ) | (244 | ) | (4,125 | ) | (223,854 | ) | (4,349,794 | ) | |||||||||||||||||||||||||
| (1,080,045 | ) | $ | (21,798,051 | ) | (84,065 | ) | $ | (1,791,275 | ) | 15,341 | $ | 274,992 | 169,029 | $ | 3,620,478 | 496,263 | $ | 8,925,254 | 1,958,495 | $ | 36,199,636 | |||||||||||||||||||||||||||
| Semiannual Report | | May 31, 2015 | 343 |
Table of Contents
Notes to Financial Statements (cont’d)
May 31, 2015 (Unaudited)
| AllianzGI Short Duration High Income | AllianzGI Structured Return | |||||||||||||||||||||||||||||||||
| Six Months ended May 31, 2015 (unaudited) | Year ended November 30, 2014 | Six Months ended May 31, 2015 (unaudited) | Year ended November 30, 2014 | |||||||||||||||||||||||||||||||
| Shares | Amount | Shares | Amount | Shares | Amount | Shares | Amount | |||||||||||||||||||||||||||
Shares sold: | ||||||||||||||||||||||||||||||||||
Class A | 2,266,045 | $ | 35,190,076 | 8,802,328 | $ | 139,766,217 | 154,750 | $ | 2,383,294 | 189,741 | $ | 2,890,355 | ||||||||||||||||||||||
Class C | 986,190 | 15,274,528 | 2,765,867 | 43,795,323 | 80,431 | 1,221,841 | 5,533 | 85,059 | ||||||||||||||||||||||||||
Class D | 523,493 | 8,137,683 | 1,731,511 | 27,518,112 | 161,046 | 2,468,172 | 349,214 | 5,418,511 | ||||||||||||||||||||||||||
Class R | — | — | — | — | — | — | — | — | ||||||||||||||||||||||||||
Class P | 4,924,517 | 76,554,516 | 14,537,631 | 230,330,859 | 5,777 | 88,873 | — | — | ||||||||||||||||||||||||||
Institutional Class | 9,815,361 | 152,898,556 | 7,422,378 | 117,961,273 | 250,365 | 3,880,395 | 505,005 | 7,704,923 | ||||||||||||||||||||||||||
Issued in reinvestment of dividends and distributions: |
| |||||||||||||||||||||||||||||||||
Class A | 212,820 | 3,291,514 | 452,185 | 7,148,746 | 6,615 | 98,822 | 2,455 | 37,417 | ||||||||||||||||||||||||||
Class C | 113,028 | 1,744,761 | 176,297 | 2,778,106 | 370 | 5,432 | 365 | 5,488 | ||||||||||||||||||||||||||
Class D | 49,047 | 758,553 | 92,995 | 1,467,256 | 17,884 | 267,391 | 4,562 | 69,417 | ||||||||||||||||||||||||||
Class R | — | — | — | — | — | — | — | — | ||||||||||||||||||||||||||
Class P | 279,572 | 4,322,249 | 354,585 | 5,582,863 | 95 | 1,429 | 184 | 2,794 | ||||||||||||||||||||||||||
Institutional Class | 411,471 | 6,374,479 | 665,136 | 10,513,478 | 41,891 | 628,993 | 26,958 | 410,919 | ||||||||||||||||||||||||||
Cost of shares redeemed: | ||||||||||||||||||||||||||||||||||
Class A | (2,890,139 | ) | (44,676,836 | ) | (9,381,755 | ) | (148,623,880 | ) | (63,174 | ) | (971,614 | ) | (61,661 | ) | (949,899 | ) | ||||||||||||||||||
Class C | (1,062,426 | ) | (16,428,154 | ) | (1,177,178 | ) | (18,572,287 | ) | (322 | ) | (4,905 | ) | (1,683 | ) | (25,011 | ) | ||||||||||||||||||
Class D | (948,896 | ) | (14,629,524 | ) | (713,830 | ) | (11,264,468 | ) | (13,455 | ) | (204,525 | ) | (76,704 | ) | (1,180,937 | ) | ||||||||||||||||||
Class R | — | — | — | — | — | — | — | — | ||||||||||||||||||||||||||
Class P | (5,811,148 | ) | (89,738,576 | ) | (6,601,562 | ) | (104,185,257 | ) | — | — | (1,646 | ) | (25,650 | ) | ||||||||||||||||||||
Institutional Class | (4,792,886 | ) | (74,160,811 | ) | (4,901,969 | ) | (77,529,321 | ) | (114,640 | ) | (1,775,027 | ) | (70,361 | ) | (1,089,070 | ) | ||||||||||||||||||
Net increase (decrease) resulting from Fund share transactions | 4,076,049 | $ | 64,913,014 | 14,224,619 | $ | 226,687,020 | 527,633 | $ | 8,088,571 | 871,962 | $ | 13,354,316 | ||||||||||||||||||||||
| 344 | May 31, 2015 | | Semiannual Report |
Table of Contents
| AllianzGI U.S. Equity Hedged | AllianzGI U.S. Small-Cap Growth | AllianzGI Ultra Micro Cap | ||||||||||||||||||||||||||||||||||||||||||||||
| Six Months ended May 31, 2015 (unaudited) | Year ended November 30, 2014 | Six Months ended May 31, 2015 (unaudited) | Year ended November 30, 2014 | Six Months ended May 31, 2015 (unaudited) | Year ended November 30, 2014 | |||||||||||||||||||||||||||||||||||||||||||
| Shares | Amount | Shares | Amount | Shares | Amount | Shares | Amount | Shares | Amount | Shares | Amount | |||||||||||||||||||||||||||||||||||||
| 2,853 | $ | 48,475 | 5,702 | $ | 98,134 | 35,584 | $ | 577,447 | 116,635 | $ | 2,074,433 | 68,434 | $ | 1,682,859 | 1,370,175 | $ | 33,698,669 | |||||||||||||||||||||||||||||||
| 6,039 | 102,000 | 2,695 | 46,001 | 8,597 | 136,952 | 13,014 | 221,431 | — | — | — | — | |||||||||||||||||||||||||||||||||||||
| 764 | 12,930 | 56,879 | 1,009,584 | 349 | 5,904 | 4,249 | 75,185 | — | — | — | — | |||||||||||||||||||||||||||||||||||||
| — | — | — | — | 720 | 11,338 | 1,768 | 31,487 | — | — | — | — | |||||||||||||||||||||||||||||||||||||
| — | — | — | — | 9,101 | 159,299 | 60,907 | 1,091,044 | 14,395 | 359,609 | 534,674 | 12,662,933 | |||||||||||||||||||||||||||||||||||||
| 85,589 | 1,464,198 | 396,021 | 7,063,457 | 563,139 | 9,665,600 | 735,980 | 13,220,216 | 227,603 | 5,596,211 | 1,150,490 | 28,475,146 | |||||||||||||||||||||||||||||||||||||
| 3,391 | 57,526 | 5,505 | 93,117 | 3,731 | 58,238 | 5,794 | 99,232 | 19,448 | 451,977 | 12,155 | 280,120 | |||||||||||||||||||||||||||||||||||||
| 412 | 6,864 | 673 | 11,251 | 4,071 | 61,355 | 3,724 | 61,995 | — | — | — | — | |||||||||||||||||||||||||||||||||||||
| 3,253 | 55,438 | 958 | 16,282 | 658 | 10,288 | 436 | 7,436 | — | — | — | — | |||||||||||||||||||||||||||||||||||||
| — | — | — | — | 163 | 2,525 | 155 | 2,639 | — | — | — | — | |||||||||||||||||||||||||||||||||||||
| 30 | 508 | 40 | 685 | 1,149 | 18,156 | 716 | 12,307 | 3,789 | 88,470 | 517 | 11,847 | |||||||||||||||||||||||||||||||||||||
| 33,044 | 565,337 | 35,110 | 598,382 | 178,643 | 2,835,068 | 161,597 | 2,795,276 | 17,561 | 411,280 | 10,825 | 251,234 | |||||||||||||||||||||||||||||||||||||
| (1,798 | ) | (30,539 | ) | (9,234 | ) | (161,102 | ) | (17,305 | ) | (285,534 | ) | (195,058 | ) | (3,411,792 | ) | (427,655 | ) | (10,317,856 | ) | (1,670,308 | ) | (39,729,663 | ) | |||||||||||||||||||||||||
| — | — | (162 | ) | (2,818 | ) | (10,702 | ) | (165,790 | ) | (10,068 | ) | (173,417 | ) | — | — | — | — | |||||||||||||||||||||||||||||||
| (49,790 | ) | (854,386 | ) | (6,414 | ) | (114,397 | ) | (545 | ) | (9,232 | ) | (1,565 | ) | (27,694 | ) | — | — | — | — | |||||||||||||||||||||||||||||
| — | — | — | — | (1,010 | ) | (15,905 | ) | (1,645 | ) | (29,492 | ) | — | — | — | — | |||||||||||||||||||||||||||||||||
| — | — | — | — | (3,127 | ) | (52,055 | ) | (55,190 | ) | (995,922 | ) | (118,928 | ) | (2,889,431 | ) | (127,739 | ) | (2,926,317 | ) | |||||||||||||||||||||||||||||
| (16,544 | ) | (283,232 | ) | (34,082 | ) | (592,691 | ) | (260,342 | ) | (4,376,792 | ) | (529,922 | ) | (9,622,916 | ) | (560,884 | ) | (13,894,597 | ) | (1,650,136 | ) | (39,661,168 | ) | |||||||||||||||||||||||||
| | 67,243 | | $ | 1,145,119 | 453,691 | $ | 8,065,885 | 512,874 | $ | 8,636,862 | 311,527 | $ | 5,431,448 | (756,237 | ) | $ | (18,511,478 | ) | (369,347 | ) | $ | (6,937,199 | ) | |||||||||||||||||||||||||
| Semiannual Report | | May 31, 2015 | 345 |
Table of Contents
Notes to Financial Statements (cont’d)
May 31, 2015 (Unaudited)
| 10. | SIGNIFICANT ACCOUNT HOLDERS |
From time to time, a Fund may have a concentration of shareholders, which may include the Investment Manager or affiliates of the Investment Manager, holding a significant percentage of shares outstanding. Investment activities of these shareholders could have a material impact to a Fund.
At May 31, 2015, the significant account-holders (owners of 5% or greater of each respective Fund’s outstanding shares) were as follows:
| Unaffiliated | Affiliated Approximate Ownership | |||||||||||||||||||||||||||||||||||||||||||||||||||
| Number of Account Holders | Approximate Ownership | AFI | AllianzGI Global Allocation | AllianzGI Global Dynamic Allocation | AllianzGI 2015 | AllianzGI 2020 | AllianzGI 2025 | AllianzGI 2030 | AllianzGI 2035 | AllianzGI 2040 | AllianzGI 2045 | AllianzGI 2045 | ||||||||||||||||||||||||||||||||||||||||
AllianzGI Retirement 2015 | 7 | 86 | % | — | — | — | — | — | — | — | — | — | — | — | ||||||||||||||||||||||||||||||||||||||
AllianzGI Retirement 2020 | 6 | 85 | % | — | — | — | — | — | — | — | — | — | — | — | ||||||||||||||||||||||||||||||||||||||
AllianzGI Retirement 2025 | 7 | 91 | % | — | — | — | — | — | — | — | — | — | — | — | ||||||||||||||||||||||||||||||||||||||
AllianzGI Retirement 2030 | 5 | 79 | % | — | — | — | — | — | — | — | — | — | — | — | ||||||||||||||||||||||||||||||||||||||
AllianzGI Retirement 2035 | 5 | 80 | % | — | — | — | — | — | — | — | — | — | — | — | ||||||||||||||||||||||||||||||||||||||
AllianzGI Retirement 2040 | 6 | 86 | % | — | — | — | — | — | — | — | — | — | — | — | ||||||||||||||||||||||||||||||||||||||
AllianzGI Retirement 2045 | 5 | 79 | % | — | — | — | — | — | — | — | — | — | — | — | ||||||||||||||||||||||||||||||||||||||
AllianzGI Retirement 2050 | 3 | 76 | % | — | — | — | — | — | — | — | — | — | — | — | ||||||||||||||||||||||||||||||||||||||
AllianzGI Retirement 2055 | 2 | 23 | % | 51 | % | — | — | — | — | — | — | — | — | — | — | |||||||||||||||||||||||||||||||||||||
AllianzGI Retirement Income | 6 | 69 | % | — | — | — | — | — | — | — | — | — | — | — | ||||||||||||||||||||||||||||||||||||||
AllianzGI Global Allocation | 7 | 77 | % | — | — | — | — | — | — | — | — | — | — | — | ||||||||||||||||||||||||||||||||||||||
AllianzGI Global Dynamic Allocation | 2 | 32 | % | 41 | % | — | — | — | — | — | — | — | — | — | — | |||||||||||||||||||||||||||||||||||||
AllianzGI Global Megatrends | — | — | 100 | % | — | — | — | — | — | — | — | — | — | — | ||||||||||||||||||||||||||||||||||||||
AllianzGI Behavioral Advantage Large Cap | 5 | 86 | % | — | — | — | — | — | — | — | — | — | — | — | ||||||||||||||||||||||||||||||||||||||
AllianzGI Best Styles Emerging Markets Equity | — | — | 90 | % | — | 8 | % | — | — | — | — | — | — | — | — | |||||||||||||||||||||||||||||||||||||
AllianzGI Best Styles Global Equity | — | — | — | 92 | % | — | — | — | — | — | — | — | — | — | ||||||||||||||||||||||||||||||||||||||
AllianzGI Best Styles International Equity | — | — | 16 | % | — | — | — | 8 | % | 10 | % | 14 | % | 12 | % | 12 | % | 8 | % | 7 | % | |||||||||||||||||||||||||||||||
AllianzGI Best Styles U.S. Equity | — | — | 5 | % | — | — | 6 | % | 13 | % | 14 | % | 15 | % | 13 | % | 11 | % | 6 | % | 6 | % | ||||||||||||||||||||||||||||||
AllianzGI China Equity | 4 | 49 | % | 40 | % | — | — | — | — | — | — | — | — | — | — | |||||||||||||||||||||||||||||||||||||
AllianzGI Convertible | 5 | 65 | % | — | — | — | — | — | — | — | — | — | — | — | ||||||||||||||||||||||||||||||||||||||
AllianzGI Emerging Markets Consumer | — | — | 23 | % | — | — | — | 9 | % | 10 | % | 10 | % | 8 | % | 6 | % | 5 | % | — | ||||||||||||||||||||||||||||||||
AllianzGI Emerging Markets Debt | — | — | 99 | % | — | — | — | — | — | — | — | — | — | — | ||||||||||||||||||||||||||||||||||||||
AllianzGI Emerging Markets Small-Cap | 1 | 35 | % | 65 | % | — | — | — | — | — | — | — | — | — | — | |||||||||||||||||||||||||||||||||||||
AllianzGI Europe Equity Dividend | 1 | 6 | % | 94 | % | — | — | — | — | — | — | — | — | — | — | |||||||||||||||||||||||||||||||||||||
AllianzGI Global Fundamental Strategy | — | — | 97 | % | — | — | — | — | — | — | — | — | — | — | ||||||||||||||||||||||||||||||||||||||
AllianzGI Global Managed Volatility | 2 | 47 | % | 34 | % | — | — | — | — | — | — | — | — | — | — | |||||||||||||||||||||||||||||||||||||
AllianzGI Global Sustainability | — | — | 100 | % | — | — | — | — | — | — | — | — | — | — | ||||||||||||||||||||||||||||||||||||||
AllianzGI Global Water | 8 | 88 | % | — | — | — | — | — | — | — | — | — | — | — | ||||||||||||||||||||||||||||||||||||||
AllianzGI High Yield Bond | 4 | 71 | % | — | — | — | — | — | — | — | — | — | — | — | ||||||||||||||||||||||||||||||||||||||
| 346 | May 31, 2015 | | Semiannual Report |
Table of Contents
| Unaffiliated | Affiliated Approximate Ownership | |||||||||||||||||||||||||||||||||||||||||||||||||||
| Number of Account Holders | Approximate Ownership | AFI | AllianzGI Global Allocation | AllianzGI Global Dynamic Allocation | AllianzGI 2015 | AllianzGI 2020 | AllianzGI 2025 | AllianzGI 2030 | AllianzGI 2035 | AllianzGI 2040 | AllianzGI 2045 | AllianzGI 2045 | ||||||||||||||||||||||||||||||||||||||||
AllianzGI International Growth | — | — | 100 | % | — | — | — | — | — | — | — | — | — | — | ||||||||||||||||||||||||||||||||||||||
AllianzGI International Small-Cap | 5 | 72 | % | — | — | — | — | — | — | — | — | — | — | — | ||||||||||||||||||||||||||||||||||||||
AllianzGI Micro Cap | 4 | 80 | % | — | — | — | — | — | — | — | — | — | — | — | ||||||||||||||||||||||||||||||||||||||
AllianzGI Multi-Asset Real Return | 1 | 19 | % | 77 | % | — | — | — | — | — | — | — | — | — | — | |||||||||||||||||||||||||||||||||||||
AllianzGI NFJ Emerging Markets Value | 1 | 57 | % | 36 | % | — | — | — | — | — | — | — | — | — | — | |||||||||||||||||||||||||||||||||||||
AllianzGI NFJ Global Dividend Value | 6 | 79 | % | — | — | — | — | — | — | — | — | — | — | — | ||||||||||||||||||||||||||||||||||||||
AllianzGI NFJ International Small-Cap Value | 5 | 65 | % | 26 | % | — | — | — | — | — | — | — | — | — | — | |||||||||||||||||||||||||||||||||||||
AllianzGI NFJ International Value II | 1 | 96 | % | — | — | — | — | — | — | — | — | — | — | — | ||||||||||||||||||||||||||||||||||||||
AllianzGI Short Duration High Income | 7 | 67 | % | — | — | — | — | — | — | — | — | — | — | — | ||||||||||||||||||||||||||||||||||||||
AllianzGI Structured Return | 3 | 67 | % | 22 | % | — | — | — | — | — | — | — | — | — | — | |||||||||||||||||||||||||||||||||||||
AllianzGI U.S. Equity Hedged | 4 | 75 | % | 24 | % | — | — | — | — | — | — | — | — | — | — | |||||||||||||||||||||||||||||||||||||
AllianzGI U.S. Small-Cap Growth | 3 | 63 | % | — | — | — | — | — | — | — | 5 | % | — | — | — | |||||||||||||||||||||||||||||||||||||
AllianzGI Ultra Micro Cap | 6 | 82 | % | — | — | — | — | — | — | — | — | — | — | — | ||||||||||||||||||||||||||||||||||||||
| 11. | AFFILIATED TRANSACTIONS |
An affiliate includes any company in which a Sub-Adviser owns 5% or more of a company’s outstanding voting securities at any point during the fiscal year. The table below represents transactions in and earnings from these affiliated issuers during the period or six months ended May 31, 2015.
| AllianzGI Best Styles Emerging Markets Equity: | ||||||||||||||||||||||||||||
| Market Value 12/9/2014* | Purchases at Cost | Proceeds from Sales | Unrealized Appreciation (Depreciation) | Market Value 5/31/2015 | Dividend Income | Net Realized Gain | ||||||||||||||||||||||
Ju Teng International Holdings Ltd. | — | $ | 24,021 | $ | (17,583 | ) | $ | 2,321 | $ | 12,330 | $ | 387 | $ | 3,571 | ||||||||||||||
| AllianzGI Best Styles Global Equity: | ||||||||||||||||||||||||||||
| Market Value 11/30/2014 | Purchases at Cost | Proceeds from Sales | Unrealized Appreciation (Depreciation) | Market Value 5/31/2015 | Dividend Income | Net Realized Gain (Loss) | ||||||||||||||||||||||
Aareal Bank AG | $ | 36,768 | $ | 135,346 | — | $ | (11,621 | ) | $ | 162,680 | $ | 4,020 | — | |||||||||||||||
Andersons, Inc.† | 12,375 | 23,415 | $ | (26,846 | ) | — | — | 32 | $ | (9,951 | ) | |||||||||||||||||
Bechtle AG | 15,843 | 28,549 | — | (2,924 | ) | 41,774 | — | — | ||||||||||||||||||||
DCC PLC†† | 15,877 | 28,721 | — | 22,863 | 65,564 | 824 | — | |||||||||||||||||||||
Freenet AG | 46,886 | 81,741 | — | 13,968 | 145,058 | 7,281 | — | |||||||||||||||||||||
Home Loan Servicing Solutions Ltd.† | 42,031 | 87,188 | — | (19,865 | ) | 4,544 | 3,954 | — | ||||||||||||||||||||
Iconix Brand Group, Inc.†,†† | 22,145 | 33,190 | — | (15,824 | ) | 39,221 | — | — | ||||||||||||||||||||
Jenoptik AG† | 8,274 | 16,375 | (28,888 | ) | — | — | — | 1,077 | ||||||||||||||||||||
Mentor Graphics Corp.† | 40,000 | 71,355 | — | 19,421 | 130,341 | 365 | — | |||||||||||||||||||||
Montpelier Re Holdings Ltd.† | 19,715 | 37,150 | (57,570 | ) | — | — | 116 | 3,770 | ||||||||||||||||||||
NCC AB†† | 14,944 | 27,205 | — | 1,084 | 42,945 | 831 | — | |||||||||||||||||||||
| Semiannual Report | | May 31, 2015 | 347 |
Table of Contents
Notes to Financial Statements (cont’d)
May 31, 2015 (Unaudited)
| AllianzGI Best Styles Global Equity (cont’d) | ||||||||||||||||||||||||||||
| Market Value 11/30/2014 | Purchases at Cost | Proceeds from Sales | Unrealized Appreciation (Depreciation) | Market Value 5/31/2015 | Dividend Income | Net Realized Loss | ||||||||||||||||||||||
Olin Corp.† | $ | 15,297 | $ | 25,257 | $ | — | $ | 9,247 | $ | 50,995 | $ | 698 | $ | — | ||||||||||||||
Sanderson Farms, Inc.† | 33,596 | 154,986 | — | 5,710 | 188,253 | 744 | — | |||||||||||||||||||||
Select Medical Holdings Corp.† | 17,893 | 32,945 | (45,002 | ) | — | — | 344 | (4,870 | ) | |||||||||||||||||||
j2 Global, Inc.† | 19,393 | 38,406 | — | 9,117 | 63,090 | 563 | — | |||||||||||||||||||||
Totals | $ | 361,037 | $ | 821,829 | $ | (158,306 | ) | $ | 31,176 | $ | 934,465 | $ | 19,772 | $ | (9,974 | ) | ||||||||||||
| AllianzGI Best Styles International Equity: | ||||||||||||||||||||||||||||
| Market Value 12/9/2014* | Purchases at Cost | Proceeds from Sales | Unrealized Appreciation (Depreciation) | Market Value 5/31/2015 | Dividend Income | Net Realized Gain (Loss) | ||||||||||||||||||||||
bpost S.A. | — | $ | 67,212 | — | $ | 10,062 | $ | 77,274 | $ | 502 | — | |||||||||||||||||
Coface S.A. | — | 53,071 | — | (8,151 | ) | 44,920 | 1,778 | — | ||||||||||||||||||||
Ontex Group NV | — | 58,936 | — | 5,139 | 64,075 | 323 | — | |||||||||||||||||||||
Totals | — | $ | 179,219 | — | $ | 7,050 | $ | 186,269 | $ | 2,603 | — | |||||||||||||||||
| AllianzGI Best Styles U.S. Equity: | ||||||||||||||||||||||||||||
| Market Value 12/1/2014* | Purchases at Cost | Proceeds from Sales | Unrealized Appreciation (Depreciation) | Market Value 5/31/2015 | Dividend Income | Net Realized Gain (Loss) | ||||||||||||||||||||||
Andersons, Inc.† | — | $ | 62,485 | $ | (46,144 | ) | — | — | $ | 315 | $ | (16,341 | ) | |||||||||||||||
Cal-Maine Foods, Inc. | — | 70,265 | — | $ | 31,777 | $ | 102,042 | 630 | — | |||||||||||||||||||
Home Loan Servicing Solutions Ltd.† | — | 150,423 | (129,973 | ) | (12,527 | ) | 4,166 | 3,614 | (3,757 | )�� | ||||||||||||||||||
Iconix Brand Group, Inc.† | — | 213,449 | (211,957 | ) | — | — | — | (1,492 | ) | |||||||||||||||||||
Mentor Graphics Corp.† | — | 82,093 | (88,224 | ) | — | — | 211 | 6,131 | ||||||||||||||||||||
Montpelier Re Holdings Ltd.† | — | 171,920 | (101,192 | ) | 4,052 | 81,546 | 996 | 6,766 | ||||||||||||||||||||
Olin Corp.† | — | 69,312 | (94,860 | ) | — | — | 592 | 25,548 | ||||||||||||||||||||
Sanderson Farms, Inc.† | — | 163,404 | (81,687 | ) | (3,983 | ) | 69,790 | 605 | (7,944 | ) | ||||||||||||||||||
TAL International Group, Inc.† | — | 58,164 | (55,161 | ) | — | — | — | (3,003 | ) | |||||||||||||||||||
j2 Global, Inc.† | — | 474,079 | (421,731 | ) | 4,238 | 78,696 | 2,562 | 22,110 | ||||||||||||||||||||
Totals | — | $ | 1,515,594 | $ | (1,230,929 | ) | $ | 23,557 | $ | 336,240 | $ | 9,525 | $ | 28,018 | ||||||||||||||
| AllianzGI China Equity: | ||||||||||||||||||||||||||||
| Market Value 11/30/2014 | Purchases at Cost | Proceeds from Sales | Unrealized Appreciation (Depreciation) | Market Value 5/31/2015 | Dividend Income | Net Realized Gain (Loss) | ||||||||||||||||||||||
Comba Telecom Systems Holdings Ltd.† | $ | 119,408 | — | $ | (91,034 | ) | — | — | — | $ | (22,475 | ) | ||||||||||||||||
CSR Corp. Ltd.† | 320,473 | $ | 24,065 | (431,638 | ) | $ | 90,469 | $ | 166,373 | — | 216,375 | |||||||||||||||||
Digital China Holdings Ltd. | 252,956 | 58,941 | — | 166,831 | 550,450 | — | — | |||||||||||||||||||||
Qingling Motors Co., Ltd. | 300,075 | 97,722 | (26,270 | ) | 77,595 | 422,867 | — | 2,837 | ||||||||||||||||||||
Totals | $ | 992,912 | $ | 180,728 | $ | (548,942 | ) | $ | 334,895 | $ | 1,139,690 | — | $ | 196,737 | ||||||||||||||
| AllianzGI Europe Equity Dividend: | ||||||||||||||||||||||||||||
| Market Value 2/2/2015* | Purchases at Cost | Proceeds from Sales | Unrealized Appreciation (Depreciation) | Market Value 5/31/2015 | Dividend Income | Net Realized Gain (Loss) | ||||||||||||||||||||||
Ashmore Group PLC | — | $ | 67,613 | — | $ | 12,322 | $ | 79,934 | $ | 936 | — | |||||||||||||||||
CTT-Correios de Portugal S.A.†† | — | 36,256 | — | (1,555 | ) | 34,701 | 1,305 | — | ||||||||||||||||||||
Cembra Money Bank AG†† | — | 44,978 | — | 2,584 | 47,562 | 1,961 | — | |||||||||||||||||||||
Cia de Distribucion Integral Logista Holdings S.A.†† | — | 67,472 | — | 5,027 | 72,499 | 1,464 | — | |||||||||||||||||||||
Coface S.A.† | — | 39,085 | — | (3,436 | ) | 35,649 | 1,411 | — | ||||||||||||||||||||
| 348 | May 31, 2015 | | Semiannual Report |
Table of Contents
| AllianzGI Europe Equity Dividend (cont’d) | ||||||||||||||||||||||||||||
| Market Value 2/2/2015* | Purchases at Cost | Proceeds from Sales | Unrealized Appreciation (Depreciation) | Market Value 5/31/2015 | Dividend Income | Net Realized Gain | ||||||||||||||||||||||
Drillisch AG | — | $ | 60,796 | — | $ | 10,866 | $ | 71,662 | $ | 2,635 | — | |||||||||||||||||
EVS Broadcast Equipment S.A. | — | 26,792 | — | (1,977 | ) | 24,815 | 638 | — | ||||||||||||||||||||
Freenet AG | — | 88,034 | — | 8,474 | 96,508 | 4,844 | — | |||||||||||||||||||||
MARR SpA | — | 24,831 | — | 1,365 | 26,196 | 717 | — | |||||||||||||||||||||
NCC AB†† | — | 63,949 | — | (2,333 | ) | 61,616 | 1,162 | — | ||||||||||||||||||||
Sunrise Communications Group AG | — | 68,618 | — | 3,728 | 72,346 | — | — | |||||||||||||||||||||
Tullett Prebon PLC | — | 41,095 | $ | (7,389 | ) | 6,969 | 41,524 | 1,331 | $ | 849 | ||||||||||||||||||
UBM PLC | — | 61,535 | — | 3,052 | 64,587 | 1,595 | — | |||||||||||||||||||||
bpost S.A.†† | — | 86,352 | (18,758 | ) | 6,914 | 76,206 | 495 | 1,698 | ||||||||||||||||||||
Totals | — | $ | 777,406 | $ | (26,147 | ) | $ | 52,000 | $ | 805,805 | $ | 20,494 | $ | 2,547 | ||||||||||||||
| AllianzGI Global Fundamental Strategy: | ||||||||||||||||||||||||||||
| Market Value 11/30/2014 | Purchases at Cost | Proceeds from Sales | Unrealized Appreciation (Depreciation) | Market Value 5/31/2015 | Dividend Income | Net Realized Gain | ||||||||||||||||||||||
bpost S.A.†† | $ | 220,476 | — | $ | (64,586 | ) | $ | 35,302 | $ | 173,195 | $ | 6,877 | $ | 7,108 | ||||||||||||||
CTT-Correios de Portugal S.A.†† | — | $ | 200,470 | — | 1,278 | 201,748 | 7,586 | — | ||||||||||||||||||||
TLG Immobilien AG | 85,144 | — | — | 20,704 | 106,253 | — | — | |||||||||||||||||||||
Totals | $ | 305,620 | $ | 200,470 | $ | (64,586 | ) | $ | 57,284 | $ | 481,196 | $ | 14,463 | $ | 7,108 | |||||||||||||
| AllianzGI Global Sustainability: | ||||||||||||||||||||||||||||
| Market Value 12/9/2014* | Purchases at Cost | Proceeds from Sales | Unrealized Appreciation (Depreciation) | Market Value 5/31/2015 | Dividend Income | Net Realized Loss | ||||||||||||||||||||||
Bureau Veritas S.A. | — | $ | 46,961 | $ | (992 | ) | $ | 681 | $ | 46,537 | — | $ | (113 | ) | ||||||||||||||
| AllianzGI Global Water: | ||||||||||||||||||||||||||||
| Market Value 11/30/2014 | Purchases at Cost | Proceeds from Sales | Unrealized Appreciation (Depreciation) | Market Value 5/31/2015 | Dividend Income | Net Realized Gain (Loss) | ||||||||||||||||||||||
Norma Group SE | $ | 6,347,615 | — | $ | (3,180,758 | ) | $ | 452,130 | $ | 3,603,814 | $ | 41,222 | $ | 175,756 | ||||||||||||||
Rotork PLC†,†† | 8,571,420 | $ | 3,019,920 | (12,623,400 | ) | — | — | — | (1,412,552 | ) | ||||||||||||||||||
Spectris PLC† | 3,235,788 | 1,621,582 | — | 400,015 | 5,539,612 | 72,271 | — | |||||||||||||||||||||
Totals | $ | 18,154,823 | $ | 4,641,502 | $ | (15,804,158 | ) | $ | 852,145 | $ | 9,143,426 | $ | 113,493 | $ | (1,236,796 | ) | ||||||||||||
| AllianzGI International Growth: | ||||||||||||||||||||||||||||
| Market Value 2/2/2015* | Purchases at Cost | Proceeds from Sales | Unrealized Appreciation (Depreciation) | Market Value 5/31/2015 | Dividend Income | Net Realized Gain (Loss) | ||||||||||||||||||||||
Bureau Veritas S.A. | — | $ | 34,759 | — | $ | 3,194 | $ | 37,953 | — | — | ||||||||||||||||||
DSV A/S | — | 53,006 | — | 5,566 | 58,572 | $ | 278 | — | ||||||||||||||||||||
Hexpol AB† | — | 50,334 | — | 3,935 | 54,269 | 611 | — | |||||||||||||||||||||
HUGO BOSS AG | — | 61,399 | — | (7,337 | ) | 54,062 | 1,432 | — | ||||||||||||||||||||
Infineon Technologies AG | — | 46,660 | — | 7,824 | 54,484 | 856 | — | |||||||||||||||||||||
Norma Group SE | — | 27,056 | — | 594 | 27,650 | 316 | — | |||||||||||||||||||||
Rotork PLC | — | 29,972 | — | 3,436 | 33,408 | 393 | — | |||||||||||||||||||||
SimCorp A/S | — | 28,301 | — | 8,413 | 36,714 | 470 | — | |||||||||||||||||||||
Spirax-Sarco Engineering PLC | — | 29,094 | — | 4,350 | 33,444 | 434 | — | |||||||||||||||||||||
Trelleborg AB, Class B | — | 30,277 | — | 2,599 | 32,876 | 622 | — | |||||||||||||||||||||
Totals | — | �� | $ | 390,858 | — | $ | 32,574 | $ | 423,432 | $ | 5,412 | — | ||||||||||||||||
| Semiannual Report | | May 31, 2015 | 349 |
Table of Contents
Notes to Financial Statements (cont’d)
May 31, 2015 (Unaudited)
| AllianzGI International Small-Cap: | ||||||||||||||||||||||||||||
| Market Value 11/30/2014 | Purchases at Cost | Proceeds from Sales | Unrealized Appreciation (Depreciation) | Market Value 5/31/2015 | Dividend Income | Net Realized Gain (Loss) | ||||||||||||||||||||||
Aareal Bank AG†† | $ | 2,013,786 | $ | 315,169 | — | $ | 730,427 | $ | 2,125,095 | $ | 52,523 | — | ||||||||||||||||
ams AG† | 1,970,177 | — | $ | (172,005 | ) | 1,423,034 | 2,952,282 | — | $ | 61,274 | ||||||||||||||||||
Bechtle AG | 1,425,359 | 208,396 | — | (153,104 | ) | 1,563,881 | — | — | ||||||||||||||||||||
Bertrandt AG† | 549,674 | 208,502 | — | (111,183 | ) | 734,059 | 8,327 | — | ||||||||||||||||||||
Burckhardt Compression Holding AG | 958,931 | 209,875 | — | (85,880 | ) | 1,345,296 | — | — | ||||||||||||||||||||
CANCOM SE | 1,376,429 | 208,971 | — | (311,467 | ) | 1,416,231 | — | — | ||||||||||||||||||||
De’ Longhi†† | 1,058,073 | 209,672 | — | 166,450 | 1,497,353 | 23,561 | — | |||||||||||||||||||||
GameLoft SE | 768,891 | — | — | (788,667 | ) | 813,742 | — | — | ||||||||||||||||||||
Gerry Weber International AG | 878,846 | 208,072 | — | (423,065 | ) | 901,500 | 16,878 | — | ||||||||||||||||||||
Interroll Holding AG | 1,172,740 | — | — | 137,676 | 1,277,600 | — | — | |||||||||||||||||||||
Ju Teng International Holdings Ltd. | 724,037 | 88,432 | (136,199 | ) | 227,285 | 805,128 | 22,640 | 43,876 | ||||||||||||||||||||
Kingspan Group PLC†† | — | 1,861,101 | — | 228,857 | 2,089,958 | 9,899 | — | |||||||||||||||||||||
NetEnt AB | 53,570 | 208,092 | — | 689,728 | 2,066,486 | 32,317 | — | |||||||||||||||||||||
Ontex Group NV†† | 1,297,510 | 210,134 | — | 300,826 | 1,743,230 | 8,783 | — | |||||||||||||||||||||
Opera Software ASA†† | — | 945,185 | — | (67,482 | ) | 877,703 | — | — | ||||||||||||||||||||
Primax Electronics Ltd. | 691,691 | 153,010 | (163,360 | ) | 1,873 | 741,509 | — | (33,111 | ) | |||||||||||||||||||
Rotork PLC†† | 1,332,511 | — | — | 412,725 | 1,502,725 | 17,677 | — | |||||||||||||||||||||
Schoeller-Bleckmann Oilfield Equipment AG | 1,093,104 | — | — | (253,464 | ) | 913,866 | 17,410 | — | ||||||||||||||||||||
Senior PLC†† | 594,969 | 209,675 | — | 36,430 | 887,233 | 11,013 | — | |||||||||||||||||||||
SimCorp A/S | 1,407,495 | — | — | 1,102,288 | 1,929,520 | 24,681 | — | |||||||||||||||||||||
Spirax-Sarco Engineering PLC | 1,915,720 | 318,190 | (288,753 | ) | 795,070 | 2,312,509 | 30,030 | 64,765 | ||||||||||||||||||||
Totals | $ | 21,283,513 | $ | 5,562,476 | $ | (760,317 | ) | $ | 4,058,357 | $ | 30,496,906 | $ | 275,739 | $ | 136,804 | |||||||||||||
| AllianzGI Micro Cap: | ||||||||||||||||||||||||||||
| Market Value 11/30/2014 | Purchases at Cost | Proceeds from Sales | Unrealized Appreciation (Depreciation) | Market Value 5/31/2015 | Dividend Income | Net Realized Gain (Loss) | ||||||||||||||||||||||
Cowen Group, Inc.†† | $ | 335,613 | $ | 42,795 | $ | (51,738 | ) | $ | 171,015 | $ | 450,264 | — | $ | 7,159 | ||||||||||||||
HCI Group, Inc.†† | 346,364 | 44,232 | (116,233 | ) | 193,749 | 297,466 | $ | 5,108 | 46,588 | |||||||||||||||||||
IGI Laboratories, Inc.†,†† | 757,567 | 60,453 | (201,728 | ) | 78,662 | 308,243 | — | 9,923 | ||||||||||||||||||||
Neenah Paper, Inc. | 413,044 | 49,497 | (58,933 | ) | 290,369 | 424,020 | 4,278 | 29,463 | ||||||||||||||||||||
Strattec Security Corp.†† | 300,904 | 9,746 | (71,077 | ) | (30,864 | ) | 138,434 | 682 | (17,002 | ) | ||||||||||||||||||
Totals | $ | 2,153,492 | $ | 206,723 | $ | (499,709 | ) | $ | 702,931 | $ | 1,618,427 | $ | 10,068 | $ | 76,131 | |||||||||||||
| AllianzGI NFJ International Small-Cap Value: | ||||||||||||||||||||||||||||
| Market Value 11/30/2014 | Purchases at Cost | Proceeds from Sales | Unrealized Appreciation (Depreciation) | Market Value 5/31/2015 | Dividend Income | Net Realized Gain (Loss) | ||||||||||||||||||||||
Aareal Bank AG†† | — | $ | 136,520 | — | $ | (12,562 | ) | $ | 123,958 | $ | 3,064 | |||||||||||||||||
Beach Energy Ltd.†† | $ | 125,795 | — | $ | (27,925 | ) | (47,103 | ) | 93,225 | 871 | $ | (9,840 | ) | |||||||||||||||
Cembra Money Bank AG†† | 205,294 | 41,307 | (116,119 | ) | 12,301 | 140,775 | 7,347 | (8,228 | ) | |||||||||||||||||||
Cia de Distribucion Integral Logista Holdings S.A.†† | — | 126,766 | — | 9,898 | 136,664 | 3,373 | — | |||||||||||||||||||||
Coface S.A.† | 205,388 | 31,433 | (236,010 | ) | — | — | — | (26,572 | ) | |||||||||||||||||||
Freenet AG | 197,458 | 31,332 | (97,021 | ) | 29,498 | 148,517 | 7,456 | 14,126 | ||||||||||||||||||||
Totals | $ | 733,935 | $ | 367,358 | $ | (477,075 | ) | $ | (7,968 | ) | $ | 643,139 | $ | 22,111 | $ | (30,514 | ) | |||||||||||
| 350 | May 31, 2015 | | Semiannual Report |
Table of Contents
| AllianzGI NFJ International Value II: | ||||||||||||||||||||||||||||
| Market Value 11/30/2014 | Purchases at Cost | Proceeds from Sales | Unrealized Appreciation (Depreciation) | Market Value 5/31/2015 | Dividend Income | Net Realized Gain (Loss) | ||||||||||||||||||||||
Aareal Bank AG | $ | 392,542 | $ | 57,318 | — | $ | (41,142 | ) | $ | 409,482 | $ | 10,121 | — | |||||||||||||||
Beach Energy Ltd.†† | 230,191 | 187,736 | — | (187,701 | ) | 423,913 | 3,959 | — | ||||||||||||||||||||
Totals | $ | 622,733 | $ | 245,054 | — | $ | (228,843 | ) | $ | 833,395 | $ | 14,080 | — | |||||||||||||||
| AllianzGI U.S. Small-Cap Growth: | ||||||||||||||||||||||||||||
| Market Value 11/30/2014 | Purchases at Cost | Proceeds from Sales | Unrealized Appreciation (Depreciation) | Market Value 5/31/2015 | Dividend Income | Net Realized Gain (Loss) | ||||||||||||||||||||||
Cowen Group, Inc.†† | — | $ | 365,388 | — | $ | 15,186 | $ | 380,574 | — | — | ||||||||||||||||||
IGI Laboratories, Inc.†,†† | — | 272,082 | $ | (171,549 | ) | — | — | — | $ | (100,533 | ) | |||||||||||||||||
Mentor Graphics Corp.† | $ | 382,723 | 54,330 | (67,407 | ) | 241,719 | 436,168 | $ | 1,656 | 8,292 | ||||||||||||||||||
Meritor, Inc.†,†† | 239,515 | — | (212,070 | ) | — | — | — | (16,846 | ) | |||||||||||||||||||
Ryland Group, Inc.†† | — | 335,192 | — | (37,504 | ) | 297,688 | 184 | — | ||||||||||||||||||||
Totals | $ | 622,238 | $ | 1,026,992 | $ | (451,026 | ) | $ | 219,401 | $ | 1,114,430 | $ | 1,840 | $ | (109,087 | ) | ||||||||||||
| AllianzGI Ultra Micro Cap: | ||||||||||||||||||||||||||||
| Market Value 11/30/2014 | Purchases at Cost | Proceeds from Sales | Unrealized Appreciation (Depreciation) | Market Value 5/31/2015 | Dividend Income | Net Realized Gain (Loss) | ||||||||||||||||||||||
HCI Group, Inc.†† | $ | 1,146,878 | — | $ | (434,580 | ) | $ | 508,298 | $ | 804,121 | $ | 14,624 | $ | 163,662 | ||||||||||||||
IGI Laboratories, Inc.†,†† | 2,390,290 | — | (689,699 | ) | 236,292 | 877,663 | — | 213,867 | ||||||||||||||||||||
Strattec Security Corp.†† | 1,526,725 | — | (504,940 | ) | 20,148 | 509,708 | 2,928 | (3,272 | ) | |||||||||||||||||||
Totals | $ | 5,063,893 | — | $ | (1,629,219 | ) | $ | 764,738 | $ | 2,191,492 | $ | 17,552 | $ | 374,257 | ||||||||||||||
| † | Not affiliated at May 31, 2015. |
| †† | Not affiliated at November 30, 2014. |
| * | Commencement of operations |
Certain additional purchases of existing portfolio holdings that were not considered affiliated in prior years, resulted in the Funds owning in excess of 5% of the outstanding shares of certain issues at May 31, 2015. The percentages and market values of the affiliated transactions represent below include both acquisitions of new investments and prior year holdings that became affiliated during the fiscal year.
| AllianzGI Best Styles Emerging Markets Equity: | ||||||||||||
| Issuer Name | Sub-Adviser’s % Holding | Market Value | Market Value as a Net Assets | |||||||||
Ju Teng International Holdings Ltd. | 5.18 | % | $ | 12,330 | 0.21 | % | ||||||
| AllianzGI Best Styles Global Equity: | ||||||||||||
| Issuer Name | Sub-Adviser’s % Holding | Market Value | Market Value as a % of Fund’s Net Assets | |||||||||
Aareal Bank AG | 7.83 | % | $ | 162,680 | 0.14 | % | ||||||
Bechtle AG | 7.30 | % | 41,774 | 0.04 | % | |||||||
DCC PLC | 5.49 | % | 65,564 | 0.06 | % | |||||||
Freenet AG | 8.50 | % | 145,058 | 0.12 | % | |||||||
NCC AB | 5.27 | % | 42,945 | 0.04 | % | |||||||
Totals | $ | 458,021 | 0.40 | % | ||||||||
| Semiannual Report | | May 31, 2015 | 351 |
Table of Contents
Notes to Financial Statements (cont’d)
May 31, 2015 (Unaudited)
| AllianzGI Best Styles International Equity: | ||||||||||||
| Issuer Name | Sub-Adviser’s % Holding | Market Value | Market Value as a % of Fund’s Net Assets | |||||||||
bpost S.A. | 5.67 | % | $ | 77,274 | 0.23 | % | ||||||
Coface S.A. | 11.38 | % | 44,920 | 0.13 | % | |||||||
Ontex Group NV | 8.38 | % | 64,075 | 0.19 | % | |||||||
Totals | $ | 186,269 | 0.55 | % | ||||||||
| AllianzGI Best Styles U.S. Equity: | ||||||||||||
| Issuer Name | Sub-Adviser’s % Holding | Market Value | Market Value as a % of Fund’s Net Assets | |||||||||
Cal-Maine Foods, Inc. | 5.34 | % | $ | 102,042 | 0.17 | % | ||||||
| AllianzGI China Equity: | ||||||||||||
| Issuer Name | Sub-Adviser’s % Holding | Market Value | Market Value as a % of Fund’s Net Assets | |||||||||
Digital China Holdings Ltd. | 8.83 | % | $ | 550,450 | 4.14 | % | ||||||
Qingling Motors Co., Ltd. | 8.82 | % | 422,867 | 3.18 | % | |||||||
Totals | $ | 973,317 | 7.32 | % | ||||||||
| AllianzGI Europe Equity Dividend: | ||||||||||||
| Issuer Name | Sub-Adviser’s % Holding | Market Value | Market Value as a % of Fund’s Net Assets | |||||||||
Ashmore Group PLC | 5.24 | % | $ | 79,934 | 2.42 | % | ||||||
bpost S.A. | 5.67 | % | 76,206 | 2.31 | % | |||||||
Cembra Money Bank AG | 5.59 | % | 47,562 | 1.44 | % | |||||||
Cia de Distribucion Integral Logista Holdings S.A. | 6.36 | % | 72,499 | 2.20 | % | |||||||
Coface S.A. | 11.38 | % | 35,649 | 1.08 | % | |||||||
CTT-Correios de Portugal S.A. | 8.35 | % | 34,701 | 1.05 | % | |||||||
Drillisch AG | 7.70 | % | 71,662 | 2.17 | % | |||||||
EVS Broadcast Equipment S.A. | 10.82 | % | 24,815 | 0.75 | % | |||||||
Freenet AG | 8.50 | % | 96,508 | 2.93 | % | |||||||
MARR SpA | 5.84 | % | 26,196 | 0.79 | % | |||||||
NCC AB | 5.27 | % | 61,616 | 1.87 | % | |||||||
Sunrise Communications Group AG | 5.70 | % | 72,346 | 2.19 | % | |||||||
Tullett Prebon PLC | 6.33 | % | 41,524 | 1.26 | % | |||||||
UBM PLC | 7.45 | % | 64,587 | 1.96 | % | |||||||
Totals | $ | 805,805 | 24.42 | % | ||||||||
| AllianzGI Global Fundamental Strategy: | ||||||||||||
| Issuer Name | Sub-Adviser’s % Holding | Market Value | Market Value as a % of Fund’s | |||||||||
bpost S.A. | 5.67 | % | $ | 173,195 | 0.77 | % | ||||||
CTT-Correios de Portugal S.A. | 8.35 | % | 201,748 | 0.90 | % | |||||||
TLG Immobilien AG | 8.47 | % | 106,253 | 0.47 | % | |||||||
Totals | $ | 481,196 | 2.14 | % | ||||||||
| 352 | May 31, 2015 | | Semiannual Report |
Table of Contents
| AllianzGI Global Sustainability: | ||||||||||||
| Issuer Name | Sub-Adviser’s % Holding | Market Value | Market Value as a % of Fund’s Net Assets | |||||||||
Bureau Veritas S.A. | 5.48 | % | $ | 46,537 | 1.48 | % | ||||||
| AllianzGI Global Water: | ||||||||||||
| Issuer Name | Sub-Adviser’s % Holding | Market Value | Market Value as a % of Fund’s Net Assets | |||||||||
Norma Group SE | 6.39 | % | $ | 3,603,814 | 0.98 | % | ||||||
| AllianzGI International Growth: | ||||||||||||
| Issuer Name | Sub-Adviser’s % Holding | Market Value | Market Value as a % of Fund’s Net Assets | |||||||||
Bureau Veritas S.A. | 5.48 | % | $ | 37,953.00 | 1.18 | % | ||||||
DSV A/S | 5.71 | % | 58,572 | 1.83 | % | |||||||
HUGO BOSS AG | 9.88 | % | 54,062 | 1.69 | % | |||||||
Infineon Technologies AG | 7.13 | % | 54,484 | 1.70 | % | |||||||
Norma Group SE | 6.39 | % | 27,650.0 | 0.86 | % | |||||||
Rotork PLC | 6.03 | % | 33,408 | 1.04 | % | |||||||
SimCorp A/S | 14.15 | % | 36,714 | 1.15 | % | |||||||
Spirax-Sarco Engineering PLC | 5.77 | % | 33,444 | 1.04 | % | |||||||
Trelleborg AB | 5.39 | % | 32,876 | 1.03 | % | |||||||
Totals | $ | 369,163 | 11.52 | % | ||||||||
| AllianzGI International Small-Cap: | ||||||||||||
| Issuer Name | Sub-Adviser’s % Holding | Market Value | Market Value as a % of Fund’s Net Assets | |||||||||
Aareal Bank AG | 7.83 | % | $ | 2,125,095 | 1.75 | % | ||||||
Bechtle AG | 7.30 | % | 1,563,881 | 1.29 | % | |||||||
Burckhardt Compression Holding AG | 5.77 | % | 1,345,296 | 1.11 | % | |||||||
CANCOM SE | 14.27 | % | 1,416,231 | 1.17 | % | |||||||
De’ Longhi | 5.37 | % | 1,497,353 | 1.24 | % | |||||||
GameLoft SE | 12.71 | % | 813,742 | 0.67 | % | |||||||
Gerry Weber International AG | 6.33 | % | 901,500 | 0.75 | % | |||||||
Interroll Holding AG | 10.85 | % | 1,277,600 | 1.06 | % | |||||||
Ju Teng International Holdings Ltd. | 5.18 | % | 805,128 | 0.67 | % | |||||||
Kingspan Group PLC | 7.76 | % | 2,089,958 | 1.73 | % | |||||||
NetEnt AB | 6.86 | % | 2,066,486 | 1.71 | % | |||||||
Ontex Group NV | 8.38 | % | 1,743,230 | 1.44 | % | |||||||
Opera Software ASA | 5.11 | % | 877,703 | 0.73 | % | |||||||
Primax Electronics Ltd. | 7.37 | % | 741,509 | 0.61 | % | |||||||
Rotork PLC | 6.03 | % | 1,502,725 | 1.24 | % | |||||||
Schoeller-Bleckmann Oilfield Equipment AG | 5.53 | % | 913,866 | 0.76 | % | |||||||
Senior PLC | 5.37 | % | 887,233 | 0.73 | % | |||||||
SimCorp A/S | 14.15 | % | 1,929,520 | 1.59 | % | |||||||
Spirax-Sarco Engineering PLC | 5.77 | % | 2,312,509 | 1.91 | % | |||||||
Totals | $ | 26,810,565 | 22.16 | % | ||||||||
| Semiannual Report | | May 31, 2015 | 353 |
Table of Contents
Notes to Financial Statements (cont’d)
May 31, 2015 (Unaudited)
| AllianzGI Micro Cap: | ||||||||||||
| Issuer Name | Sub-Adviser’s % Holding | Market Value | Market Value as a % of Fund’s Net Assets | |||||||||
Cowen Group, Inc. | 5.19 | % | $ | 450,264 | 1.04 | % | ||||||
HCI Group, Inc. | 6.56 | % | 297,466 | 0.69 | % | |||||||
Neenah Paper, Inc. | 6.00 | % | 424,020 | 0.99 | % | |||||||
Strattec Security Corp. | 5.30 | % | 138,434 | 0.32 | % | |||||||
Totals | $ | 1,310,184 | 3.04 | % | ||||||||
| AllianzGI NFJ International Small-Cap Value: | ||||||||||||
| Issuer Name | Sub-Adviser’s % Holding | Market Value | Market Value as a % of Fund’s Net Assets | |||||||||
Aareal Bank AG | 7.83 | % | $ | 123,958 | 0.64 | % | ||||||
Beach Energy Ltd. | 6.26 | % | 93,225 | 0.48 | % | |||||||
Cembra Money Bank AG | 5.59 | % | 140,775 | 0.72 | % | |||||||
Cia de Distribucion Integral Logista Holdings S.A. | 6.36 | % | 136,664 | 0.70 | % | |||||||
Freenet AG | 8.50 | % | 148,517 | 0.76 | % | |||||||
Totals | $ | 643,139 | 3.30 | % | ||||||||
| AllianzGI NFJ International Value II: | ||||||||||||
| Issuer Name | Sub-Adviser’s % Holding | Market Value | Market Value as a % of Fund’s Net Assets | |||||||||
Aareal Bank AG | 7.83 | % | $ | 409,482 | 0.82 | % | ||||||
Beach Energy Ltd. | 6.26 | % | 423,913 | 0.84 | % | |||||||
Totals | $ | 833,395 | 1.66 | % | ||||||||
| AllianzGI U.S. Small-Cap Growth: | ||||||||||||
| Issuer Name | Sub-Adviser’s % Holding | Market Value | Market Value as a % of Fund’s Net Assets | |||||||||
Cowen Group, Inc. | 5.19 | % | $ | 380,574 | 0.84 | % | ||||||
Ryland Group, Inc. | 5.36 | % | 297,688 | 0.66 | % | |||||||
Totals | $ | 678,262 | 1.50 | % | ||||||||
| AllianzGI Ultra Micro Cap: | ||||||||||||
| Issuer Name | Sub-Adviser’s % Holding | Market Value | Market Value as a % of Fund’s Net Assets | |||||||||
HCI Group, Inc. | 6.56 | % | $ | 804,121 | 0.79 | % | ||||||
Strattec Security Corp. | 5.30 | % | 509,708 | 0.50 | % | |||||||
Totals | $ | 1,313,829 | 1.29 | % | ||||||||
| 354 | May 31, 2015 | | Semiannual Report |
Table of Contents
The tables below show the transactions in and earnings from affiliates for the period or six months ended May 31, 2015:
| AllianzGI Retirement 2015: | ||||||||||||||||||||||||||||||||
| Market Value 11/30/2014 | Purchases at Cost | Proceeds from Sales | Unrealized Appreciation (Depreciation) | Market Value 5/31/2015 | Dividend Income | Net Realized Gain (Loss) | Net Capital Gain Distributions Received | |||||||||||||||||||||||||
AllianzGI Behavioral Advantage Large Cap | $ | 732,722 | $ | 47,183 | $ | (740,328 | ) | — | — | $ | 7,058 | $ | 70,687 | $ | 40,125 | |||||||||||||||||
AllianzGI Best Styles Global Equity | 835,957 | 85,482 | (878,210 | ) | — | — | 20,720 | 48,734 | 21,400 | |||||||||||||||||||||||
AllianzGI Best Styles International Equity | — | 1,853,234 | (850,386 | ) | $ | 74,268 | $ | 1,114,967 | — | 37,851 | — | |||||||||||||||||||||
AllianzGI Best Styles U.S. Equity | — | 6,052,649 | (2,729,602 | ) | 77,794 | 3,402,292 | — | 1,451 | — | |||||||||||||||||||||||
AllianzGI Emerging Markets Consumer | — | 733,200 | (223,962 | ) | 21,091 | 549,108 | — | 18,779 | — | |||||||||||||||||||||||
AllianzGI Emerging Markets Opportunities | 344,434 | 138,092 | (467,688 | ) | — | — | 6,616 | (14,903 | ) | — | ||||||||||||||||||||||
AllianzGI Global Managed Volatility | 345,294 | 59,981 | (367,934 | ) | — | — | 9,873 | 15,719 | 29,993 | |||||||||||||||||||||||
AllianzGI Global Natural Resources | 449,184 | 498,205 | (284,415 | ) | 52,394 | 689,986 | 955 | (4,230 | ) | — | ||||||||||||||||||||||
AllianzGI Income & Growth | 687,634 | 60,589 | (722,693 | ) | — | — | 5,212 | 84,780 | — | |||||||||||||||||||||||
AllianzGI International Managed Volatility | 342,803 | 322,567 | (229,928 | ) | 7,516 | 426,593 | 14,516 | (1,114 | ) | — | ||||||||||||||||||||||
AllianzGI NFJ Dividend Value | 509,118 | 42,042 | (547,894 | ) | — | — | 2,958 | 139,703 | — | |||||||||||||||||||||||
AllianzGI NFJ International Value | 510,111 | 57,842 | (551,556 | ) | — | — | 2,110 | 25,347 | — | |||||||||||||||||||||||
AllianzGI NFJ Mid-Cap Value | 338,834 | 799,690 | (221,851 | ) | 11,492 | 930,659 | 6,213 | 1,223 | — | |||||||||||||||||||||||
AllianzGI Short Duration High Income | 2,232,732 | 2,071,333 | (1,889,994 | ) | 30,549 | 2,440,322 | 82,007 | (34,004 | ) | — | ||||||||||||||||||||||
AllianzGI U.S. Managed Volatility | 2,319,627 | 638,487 | (2,730,073 | ) | 243 | 1,350 | 44,480 | (49,222 | ) | 181,646 | ||||||||||||||||||||||
AllianzGI U.S. Small-Cap Growth | 338,511 | 483,887 | (183,239 | ) | (2,221 | ) | 627,975 | — | (8,613 | ) | 31,752 | |||||||||||||||||||||
PIMCO 1-5 Year U.S. TIPS Index | 6,584,871 | 427,764 | (6,933,995 | ) | — | — | — | (154,666 | ) | — | ||||||||||||||||||||||
PIMCO 15+ Year U.S. TIPS Index | — | 1,913,012 | (516,803 | ) | (53,512 | ) | 1,327,968 | — | (14,729 | ) | — | |||||||||||||||||||||
PIMCO 25+ Year Zero Coupon U.S. Treasury Index | — | 436,169 | — | 20,623 | 456,792 | — | — | — | ||||||||||||||||||||||||
PIMCO Broad U.S. TIPS Index | — | 7,027,714 | (2,190,971 | ) | (3,322 | ) | 4,788,335 | — | (45,086 | ) | — | |||||||||||||||||||||
PIMCO CommoditiesPLUS® Strategy | — | 929,378 | (285,746 | ) | 34,286 | 697,456 | — | 19,538 | — | |||||||||||||||||||||||
PIMCO Commodity RealReturn Strategy | 890,836 | 203,687 | (956,719 | ) | — | — | — | (251,135 | ) | — | ||||||||||||||||||||||
PIMCO Floating Income | — | 1,781,605 | (1,782,140 | ) | — | — | 8,656 | 535 | — | |||||||||||||||||||||||
PIMCO Foreign Bond (U.S. Dollar-Hedged) | — | 939,428 | (212,342 | ) | (8,457 | ) | 717,914 | 5,153 | (715 | ) | — | |||||||||||||||||||||
PIMCO Income | 4,893,441 | 1,752,690 | (2,989,794 | ) | 164,071 | 3,582,231 | 182,952 | (47,309 | ) | 11,725 | ||||||||||||||||||||||
PIMCO Long-Term Credit | — | 1,524,817 | (321,759 | ) | (36,905 | ) | 1,154,554 | 22,323 | (11,599 | ) | — | |||||||||||||||||||||
PIMCO Mortgage Opportunities | 1,719,811 | 2,824,547 | (1,976,631 | ) | 18,357 | 2,576,226 | 39,083 | 5,398 | — | |||||||||||||||||||||||
PIMCO Real Return | 5,850,474 | 717,081 | (6,402,855 | ) | — | — | 145,781 | 55,530 | 1,879 | |||||||||||||||||||||||
PIMCO Senior Floating Rate | 1,032,636 | 63,894 | (1,076,124 | ) | — | — | 1,856 | (28,148 | ) | 2,035 | ||||||||||||||||||||||
PIMCO StocksPLUS® International (U.S. Dollar-Hedged) | 1,031,092 | 215,492 | (974,211 | ) | 31,878 | 283,545 | 80,168 | 29,934 | — | |||||||||||||||||||||||
PIMCO TRENDS Managed Futures Strategy | — | 1,143,159 | (264,556 | ) | (42,611 | ) | 837,018 | — | 1,026 | — | ||||||||||||||||||||||
Totals | $ | 31,990,122 | $ | 35,844,900 | $ | (40,504,399 | ) | $ | 397,534 | $ | 26,605,291 | $ | 688,690 | $ | (109,238 | ) | $ | 320,555 | ||||||||||||||
| AllianzGI Retirement 2020: | ||||||||||||||||||||||||||||||||
| Market Value 11/30/2014 | Purchases at Cost | Proceeds from Sales | Unrealized Appreciation (Depreciation) | Market Value 5/31/2015 | Dividend Income | Net Realized Gain (Loss) | Net Capital Gain Distributions Received | |||||||||||||||||||||||||
AllianzGI Behavioral Advantage Large Cap | $ | 1,353,780 | $ | 86,742 | $ | (1,367,738 | ) | — | — | $ | 12,975 | $ | 148,639 | $ | 73,767 | |||||||||||||||||
AllianzGI Best Styles Global Equity | 1,580,708 | 219,782 | (1,716,160 | ) | — | — | 40,490 | 102,650 | 41,818 | |||||||||||||||||||||||
AllianzGI Best Styles International Equity | — | 3,660,111 | (1,059,389 | ) | $ | 186,655 | $ | 2,822,934 | — | 35,557 | — | |||||||||||||||||||||
AllianzGI Best Styles U.S. Equity | — | 10,669,173 | (3,122,062 | ) | 166,963 | 7,704,268 | — | (9,806 | ) | — | ||||||||||||||||||||||
AllianzGI Emerging Markets Consumer | — | 1,280,912 | (114,209 | ) | 46,924 | 1,221,666 | — | 8,039 | — | |||||||||||||||||||||||
AllianzGI Emerging Markets Opportunities | 636,829 | 373,377 | (983,893 | ) | — | — | 12,149 | (27,073 | ) | — | ||||||||||||||||||||||
| Semiannual Report | | May 31, 2015 | 355 |
Table of Contents
Notes to Financial Statements (cont’d)
May 31, 2015 (Unaudited)
| AllianzGI Retirement 2020 (cont’d) | ||||||||||||||||||||||||||||||||
| Market Value 11/30/2014 | Purchases at Cost | Proceeds from Sales | Unrealized Appreciation (Depreciation) | Market Value 5/31/2015 | Dividend Income | Net Realized Gain (Loss) | Net Capital Gain Distributions Received | |||||||||||||||||||||||||
AllianzGI Global Managed Volatility | $ | 630,637 | $ | 124,676 | $ | (686,095 | ) | — | — | $ | 18,307 | $ | 13,104 | $ | 55,612 | |||||||||||||||||
AllianzGI Global Natural Resources | 882,672 | 892,563 | (244,911 | ) | $ | 56,732 | $ | 1,560,361 | 1,907 | (27,857 | ) | — | ||||||||||||||||||||
AllianzGI Income & Growth | 1,397,999 | 119,910 | (1,466,841 | ) | — | — | 10,555 | 68,986 | — | |||||||||||||||||||||||
AllianzGI International Managed Volatility | 625,578 | 713,117 | (370,973 | ) | 17,162 | 948,192 | 27,070 | (10,408 | ) | — | ||||||||||||||||||||||
AllianzGI NFJ Dividend Value | 934,687 | 93,000 | (1,022,221 | ) | — | — | 5,418 | 228,309 | — | |||||||||||||||||||||||
AllianzGI NFJ International Value | 1,069,648 | 98,787 | (1,132,405 | ) | — | — | 4,286 | (4,886 | ) | — | ||||||||||||||||||||||
AllianzGI NFJ Mid-Cap Value | 870,755 | 1,443,851 | (189,151 | ) | 212,186 | 2,157,832 | 15,869 | (1,106 | ) | — | ||||||||||||||||||||||
AllianzGI Short Duration High Income | 4,098,179 | 3,558,047 | (2,251,155 | ) | 38,742 | 5,452,634 | 150,479 | (61,352 | ) | — | ||||||||||||||||||||||
AllianzGI U.S. Managed Volatility | 4,548,262 | 1,360,407 | (4,832,683 | ) | 60,247 | 621,063 | 88,542 | (160,103 | ) | 360,077 | ||||||||||||||||||||||
AllianzGI U.S. Small-Cap Growth | 813,714 | 889,452 | (223,143 | ) | 404 | 1,461,130 | — | (7,945 | ) | 74,338 | ||||||||||||||||||||||
PIMCO 1-5 Year U.S. TIPS Index | 11,199,634 | 1,061,369 | (12,121,225 | ) | — | — | — | (279,900 | ) | — | ||||||||||||||||||||||
PIMCO 15+ Year U.S. TIPS Index | — | 3,189,852 | (454,407 | ) | (109,639 | ) | 2,623,572 | — | (2,234 | ) | — | |||||||||||||||||||||
PIMCO 25+ Year Zero Coupon U.S. Treasury Index | — | 646,226 | — | 30,554 | 676,780 | — | — | — | ||||||||||||||||||||||||
PIMCO Broad U.S. TIPS Index | — | 11,771,563 | (1,109,050 | ) | (51,307 | ) | 10,586,160 | — | (25,046 | ) | — | |||||||||||||||||||||
PIMCO Commodities | 589,706 | 2,121,499 | (780,393 | ) | 92,873 | 1,889,222 | 17,416 | (228,350 | ) | 946 | ||||||||||||||||||||||
PIMCO Commodity RealReturn Strategy | 1,680,506 | 500,440 | (1,913,936 | ) | — | — | — | (541,681 | ) | — | ||||||||||||||||||||||
PIMCO Floating Income | — | 3,321,841 | (3,324,881 | ) | — | — | 15,934 | 3,040 | — | |||||||||||||||||||||||
PIMCO Foreign Bond (U.S. Dollar-Hedged) | — | 1,637,299 | (24,558 | ) | (20,392 | ) | 1,592,481 | 9,628 | 132 | — | ||||||||||||||||||||||
PIMCO Income | 8,961,393 | 1,711,685 | (2,617,897 | ) | 118,451 | 7,923,036 | 294,477 | (59,836 | ) | 21,737 | ||||||||||||||||||||||
PIMCO Long-Term Credit | — | 2,508,440 | (37,070 | ) | (81,100 | ) | 2,390,149 | 37,373 | (121 | ) | — | |||||||||||||||||||||
PIMCO Mortgage Opportunities | 2,823,319 | 4,545,905 | (1,920,522 | ) | 31,752 | 5,462,076 | 68,153 | 4,934 | — | |||||||||||||||||||||||
PIMCO Real Return | 9,194,165 | 1,945,735 | (10,854,611 | ) | — | — | 251,907 | (61,955 | ) | 2,982 | ||||||||||||||||||||||
PIMCO Senior Floating Rate | 1,883,833 | 160,957 | (2,007,030 | ) | — | — | 3,439 | (54,058 | ) | 3,768 | ||||||||||||||||||||||
PIMCO StocksPLUS® International (U.S. Dollar-Hedged) | 2,241,544 | 409,899 | (1,921,582 | ) | 81,917 | 767,681 | 106,338 | 40,767 | — | |||||||||||||||||||||||
PIMCO TRENDS Managed Futures Strategy | — | 2,067,503 | (86,691 | ) | (94,702 | ) | 1,886,376 | — | 266 | — | ||||||||||||||||||||||
Totals | $ | 58,017,548 | $ | 63,184,120 | $ | (59,956,882 | ) | $ | 784,422 | $ | 59,747,613 | $ | 1,192,712 | $ | (909,294 | ) | $ | 635,045 | ||||||||||||||
| AllianzGI Retirement 2025: | ||||||||||||||||||||||||||||||||
| Market Value 11/30/2014 | Purchases at Cost | Proceeds from Sales | Unrealized Appreciation (Depreciation) | Market Value 5/31/2015 | Dividend Income | Net Realized Gain (Loss) | Net Capital Gain Distributions Received | |||||||||||||||||||||||||
AllianzGI Behavioral Advantage Large Cap | $ | 1,799,756 | $ | 82,853 | $ | (1,812,853 | ) | — | — | $ | 12,393 | $ | 256,756 | $ | 70,460 | |||||||||||||||||
AllianzGI Best Styles Global Equity | 1,643,457 | 138,274 | (1,700,588 | ) | — | — | 40,032 | 113,763 | 40,486 | |||||||||||||||||||||||
AllianzGI Best Styles International Equity | — | 4,196,833 | (1,071,705 | ) | $ | 224,373 | $ | 3,385,580 | — | 36,079 | — | |||||||||||||||||||||
AllianzGI Best Styles U.S. Equity | — | 11,433,929 | (2,938,348 | ) | 182,296 | 8,668,890 | — | (8,987 | ) | — | ||||||||||||||||||||||
AllianzGI Emerging Markets Consumer | — | 1,335,041 | (80,816 | ) | 50,386 | 1,311,807 | — | 7,196 | — | |||||||||||||||||||||||
AllianzGI Emerging Markets Opportunities | 657,324 | 373,581 | (1,005,051 | ) | — | — | 12,044 | (23,013 | ) | — | ||||||||||||||||||||||
AllianzGI Global Managed Volatility | 856,028 | 112,621 | (879,356 | ) | — | — | 23,599 | 18,328 | 71,687 | |||||||||||||||||||||||
AllianzGI Global Natural Resources | 1,216,646 | 965,337 | (253,401 | ) | 60,934 | 1,977,567 | 2,514 | (22,472 | ) | — | ||||||||||||||||||||||
AllianzGI Income & Growth | 1,642,920 | 46,439 | (1,629,389 | ) | — | — | 11,894 | 24,895 | — | |||||||||||||||||||||||
AllianzGI International Managed Volatility | 653,739 | 717,680 | (338,732 | ) | 18,860 | 1,013,943 | 26,838 | (5,704 | ) | — | ||||||||||||||||||||||
AllianzGI International Small-Cap | 967,565 | 505,491 | (1,473,786 | ) | — | — | 2,587 | 29,501 | 129,771 | |||||||||||||||||||||||
AllianzGI NFJ Dividend Value | 972,997 | 30,398 | (998,245 | ) | — | — | 5,373 | 232,843 | — | |||||||||||||||||||||||
AllianzGI NFJ International Small-Cap Value | 327,456 | — | (326,546 | ) | — | — | — | 10,146 | — | |||||||||||||||||||||||
| 356 | May 31, 2015 | | Semiannual Report |
Table of Contents
| AllianzGI Retirement 2025 (cont’d) | ||||||||||||||||||||||||||||||||
| Market Value 11/30/2014 | Purchases at Cost | Proceeds from Sales | Unrealized Appreciation (Depreciation) | Market Value 5/31/2015 | Dividend Income | Net Realized Gain (Loss) | Net Capital Gain Distributions Received | |||||||||||||||||||||||||
AllianzGI NFJ International Value | $ | 1,298,789 | $ | 96,498 | $ | (1,355,354 | ) | — | — | $ | 5,184 | $ | 9,383 | — | ||||||||||||||||||
AllianzGI NFJ Mid-Cap Value | 971,280 | 1,818,066 | (85,117 | ) | $ | 247,038 | $ | 2,748,702 | 16,862 | (238 | ) | — | ||||||||||||||||||||
AllianzGI Short Duration High Income | 4,263,208 | 3,517,167 | (1,972,380 | ) | 34,276 | 5,859,188 | 155,118 | (53,913 | ) | — | ||||||||||||||||||||||
AllianzGI U.S. Managed Volatility | 4,605,053 | 1,575,601 | (5,010,149 | ) | 59,081 | 692,836 | 91,934 | (127,661 | ) | $ | 375,129 | |||||||||||||||||||||
AllianzGI U.S. Small-Cap Growth | 980,604 | 852,216 | (64,231 | ) | (6,548 | ) | 1,747,724 | — | (2,799 | ) | 85,066 | |||||||||||||||||||||
PIMCO 1-5 Year U.S. TIPS Index | 9,801,982 | 283,615 | (9,979,698 | ) | — | — | — | (223,220 | ) | — | ||||||||||||||||||||||
PIMCO 15+ Year U.S. TIPS Index | — | 3,382,307 | (472,322 | ) | (102,424 | ) | 2,805,228 | — | (2,333 | ) | — | |||||||||||||||||||||
PIMCO 25+ Year Zero Coupon U.S. Treasury Index | — | 691,037 | — | 32,673 | 723,710 | — | — | — | ||||||||||||||||||||||||
PIMCO Broad U.S. TIPS Index | — | 11,040,242 | (1,545,278 | ) | (52,894 | ) | 9,401,687 | — | (40,383 | ) | — | |||||||||||||||||||||
PIMCO CommoditiesPLUS® Strategy | 611,342 | 2,254,953 | (804,175 | ) | 99,777 | 2,029,646 | 17,275 | (215,924 | ) | 938 | ||||||||||||||||||||||
PIMCO Commodity RealReturn Strategy | 1,939,647 | 395,531 | (2,041,492 | ) | — | — | — | (587,416 | ) | — | ||||||||||||||||||||||
PIMCO EqS Long/Short | — | 1,040,075 | — | (6,032 | ) | 1,034,043 | — | — | — | |||||||||||||||||||||||
PIMCO Floating Income | — | 3,283,012 | (3,283,281 | ) | — | — | 16,020 | 269 | — | |||||||||||||||||||||||
PIMCO Foreign Bond (U.S. Dollar-Hedged) | — | 1,735,874 | — | (21,842 | ) | 1,714,032 | 10,226 | — | — | |||||||||||||||||||||||
PIMCO Income | 9,208,903 | 1,471,395 | (2,714,540 | ) | 67,570 | 7,822,073 | 312,066 | (75,524 | ) | 21,251 | ||||||||||||||||||||||
PIMCO Long-Term Credit | — | 2,500,296 | — | (86,081 | ) | 2,414,215 | 32,920 | — | — | |||||||||||||||||||||||
PIMCO Mortgage Opportunities | 2,626,379 | 4,352,739 | (1,482,617 | ) | 30,012 | 5,509,661 | 67,634 | 4,623 | — | |||||||||||||||||||||||
PIMCO Real Return | 8,865,189 | 977,257 | (9,602,245 | ) | — | — | 217,085 | (105,466 | ) | 2,801 | ||||||||||||||||||||||
PIMCO Senior Floating Rate | 1,969,358 | 44,064 | (1,975,844 | ) | — | — | 3,412 | (54,123 | ) | 3,736 | ||||||||||||||||||||||
PIMCO StocksPLUS® International (U.S. Dollar-Hedged) | 2,634,560 | 406,240 | (1,914,969 | ) | 119,696 | 1,123,393 | 188,822 | (15,189 | ) | — | ||||||||||||||||||||||
PIMCO TRENDS Managed Futures Strategy | — | 2,540,242 | (48,460 | ) | (120,058 | ) | 2,372,850 | — | 1,126 | — | ||||||||||||||||||||||
Totals | $ | 60,514,182 | $ | 64,196,904 | $ | (58,860,968 | ) | $ | 831,093 | $ | 64,356,775 | $ | 1,271,832 | $ | (819,457 | ) | $ | 801,325 | ||||||||||||||
| AllianzGI Retirement 2030: | ||||||||||||||||||||||||||||||||
| Market Value 11/30/2014 | Purchases at Cost | Proceeds from Sales | Unrealized Appreciation (Depreciation) | Market Value 5/31/2015 | Dividend Income | Net Realized Gain (Loss) | Net Capital Gain Distributions Received | |||||||||||||||||||||||||
AllianzGI Behavioral Advantage Large Cap | $ | 1,961,100 | $ | 85,897 | $ | (1,974,856 | ) | — | — | $ | 12,849 | $ | 315,384 | $ | 73,048 | |||||||||||||||||
AllianzGI Best Styles Global Equity | 1,984,999 | 179,661 | (2,065,188 | ) | — | — | 48,284 | 133,837 | 49,169 | |||||||||||||||||||||||
AllianzGI Best Styles International Equity | — | 5,422,318 | (1,120,861 | ) | $ | 298,567 | $ | 4,631,797 | — | 31,773 | — | |||||||||||||||||||||
AllianzGI Best Styles U.S. Equity | — | 11,805,856 | (2,832,940 | ) | 189,911 | 9,150,596 | — | (12,231 | ) | — | ||||||||||||||||||||||
AllianzGI Emerging Markets Consumer | — | 1,335,888 | (107,951 | ) | 49,372 | 1,285,412 | — | 8,103 | — | |||||||||||||||||||||||
AllianzGI Emerging Markets Opportunities | 647,721 | 721,486 | (723,354 | ) | 142,736 | 649,683 | 12,273 | 6,031 | — | |||||||||||||||||||||||
AllianzGI Global Managed Volatility | 998,630 | 129,144 | (1,023,654 | ) | — | — | 27,474 | 35,022 | 83,458 | |||||||||||||||||||||||
AllianzGI Global Natural Resources | 1,218,767 | 962,511 | (265,029 | ) | 111,333 | 1,962,326 | 2,550 | (18,610 | ) | — | ||||||||||||||||||||||
AllianzGI Income & Growth | 1,752,327 | 101,274 | (1,790,322 | ) | — | — | 13,053 | 84,716 | — | |||||||||||||||||||||||
AllianzGI International Managed Volatility | 1,601,557 | 1,145,811 | (1,357,361 | ) | 33,122 | 1,323,207 | 67,315 | (12,593 | ) | — | ||||||||||||||||||||||
AllianzGI International Small-Cap | 972,106 | 536,829 | (1,516,312 | ) | — | — | 2,631 | 107,320 | 131,987 | |||||||||||||||||||||||
AllianzGI NFJ Dividend Value | 971,079 | 51,394 | (1,017,100 | ) | — | — | 5,487 | 324,355 | — | |||||||||||||||||||||||
AllianzGI NFJ International Small-Cap Value | 326,118 | — | (325,212 | ) | — | — | — | 9,955 | — | |||||||||||||||||||||||
AllianzGI NFJ International Value | 1,292,347 | 98,576 | (1,349,759 | ) | — | — | 5,158 | 44,319 | — | |||||||||||||||||||||||
AllianzGI NFJ Mid-Cap Value | 1,154,731 | 2,584,901 | (115,440 | ) | 329,901 | 3,697,739 | 20,437 | (1,102 | ) | — | ||||||||||||||||||||||
AllianzGI Short Duration High Income | 4,166,696 | 3,550,245 | (2,652,729 | ) | 45,604 | 5,109,486 | 147,603 | (66,771 | ) | — | ||||||||||||||||||||||
AllianzGI U.S. Managed Volatility | 4,544,976 | 1,856,012 | (5,223,253 | ) | 67,564 | 680,698 | 95,508 | (113,151 | ) | 387,070 | ||||||||||||||||||||||
| Semiannual Report | | May 31, 2015 | 357 |
Table of Contents
Notes to Financial Statements (cont’d)
May 31, 2015 (Unaudited)
| AllianzGI Retirement 2030 (cont’d) | ||||||||||||||||||||||||||||||||
| Market Value 11/30/2014 | Purchases at Cost | Proceeds from Sales | Unrealized Appreciation (Depreciation) | Market Value 5/31/2015 | Dividend Income | Net Realized Gain (Loss) | Net Capital Gain Distributions Received | |||||||||||||||||||||||||
AllianzGI U.S. Small-Cap Growth | $ | 1,163,697 | $ | 1,109,884 | $ | (188,789 | ) | $ | 116,405 | $ | 2,054,661 | — | $ | (10,875 | ) | $ | 103,728 | |||||||||||||||
AllianzGI Ultra Micro Cap | 321,522 | 43,761 | (40,272 | ) | 25,122 | 349,922 | — | 864 | 3,013 | |||||||||||||||||||||||
PIMCO 1-5 Year U.S. TIPS Index | 6,720,505 | 394,235 | (7,038,784 | ) | — | — | — | (165,655 | ) | — | ||||||||||||||||||||||
PIMCO 15+ Year U.S. TIPS Index | — | 2,960,964 | (483,641 | ) | (75,538 | ) | 2,399,438 | — | (2,347 | ) | — | |||||||||||||||||||||
PIMCO 25+ Year Zero Coupon U.S. Treasury Index | — | 337,760 | — | 15,970 | 353,730 | — | — | — | ||||||||||||||||||||||||
PIMCO Broad U.S. TIPS Index | — | 9,061,952 | (1,889,692 | ) | (56,241 | ) | 7,065,627 | — | (50,392 | ) | — | |||||||||||||||||||||
PIMCO CommoditiesPLUS® Strategy | 1,205,828 | 1,718,163 | (793,609 | ) | (2,248 | ) | 1,971,521 | $ | 35,931 | (324,255 | ) | 1,851 | ||||||||||||||||||||
PIMCO Commodity RealReturn Strategy | 2,161,718 | 364,333 | (2,200,749 | ) | — | — | — | (668,552 | ) | — | ||||||||||||||||||||||
PIMCO EqS Long/Short | — | 1,967,365 | — | 41,109 | 2,008,474 | — | — | — | ||||||||||||||||||||||||
PIMCO Floating Income | — | 3,322,658 | (3,325,282 | ) | — | — | 15,980 | 2,624 | — | |||||||||||||||||||||||
PIMCO Foreign Bond (U.S. Dollar-Hedged) | — | 1,712,680 | (41,796 | ) | (20,816 | ) | 1,650,532 | 9,969 | 466 | — | ||||||||||||||||||||||
PIMCO Income | 8,392,384 | 1,439,665 | (3,608,226 | ) | 130,383 | 6,091,428 | 260,349 | (79,995 | ) | 19,869 | ||||||||||||||||||||||
PIMCO Long-Term Credit | — | 2,493,577 | (51,749 | ) | (82,130 | ) | 2,359,740 | 32,111 | 42 | — | ||||||||||||||||||||||
PIMCO Mortgage Opportunities | 2,573,626 | 2,533,836 | (1,408,311 | ) | 26,229 | 3,706,107 | 44,645 | 3,606 | — | |||||||||||||||||||||||
PIMCO Real Return | 7,749,971 | 766,303 | (8,324,488 | ) | — | — | 195,989 | (77,078 | ) | 2,460 | ||||||||||||||||||||||
PIMCO Senior Floating Rate | 1,935,383 | 98,687 | (1,996,177 | ) | — | — | 3,447 | (54,103 | ) | 3,774 | ||||||||||||||||||||||
PIMCO StocksPLUS® International (U.S. Dollar-Hedged) | 3,294,195 | 551,415 | (2,445,846 | ) | 137,139 | 1,372,384 | 234,309 | (62,515 | ) | — | ||||||||||||||||||||||
PIMCO TRENDS Managed Futures Strategy | — | 2,588,529 | (161,588 | ) | (113,977 | ) | 2,318,599 | — | 5,635 | — | ||||||||||||||||||||||
Totals | $ | 59,111,983 | $ | 64,033,570 | $ | (59,460,320 | ) | $ | 1,409,517 | $ | 62,193,107 | $ | 1,293,352 | $ | (606,173 | ) | $ | 859,427 | ||||||||||||||
| AllianzGI Retirement 2035: | ||||||||||||||||||||||||||||||||
| Market Value 11/30/2014 | Purchases at Cost | Proceeds from Sales | Unrealized Appreciation (Depreciation) | Market Value 5/31/2015 | Dividend Income | Net Realized Gain (Loss) | Net Capital Gain Distributions Received | |||||||||||||||||||||||||
AllianzGI Behavioral Advantage Large Cap | $ | 1,790,460 | $ | 92,584 | $ | (1,805,248 | ) | — | — | $ | 13,849 | $ | 272,744 | $ | 78,735 | |||||||||||||||||
AllianzGI Best Styles Global Equity | 2,974,801 | 142,481 | (2,970,784 | ) | — | — | 70,092 | 116,802 | 72,389 | |||||||||||||||||||||||
AllianzGI Best Styles International Equity | — | 4,749,140 | (967,528 | ) | $ | 266,884 | $ | 4,078,888 | — | 30,392 | — | |||||||||||||||||||||
AllianzGI Best Styles U.S. Equity | — | 10,157,769 | (2,231,442 | ) | 158,299 | 8,079,243 | — | (5,383 | ) | — | ||||||||||||||||||||||
AllianzGI Emerging Markets Consumer | — | 1,097,426 | (74,342 | ) | 40,994 | 1,067,287 | — | 3,209 | — | |||||||||||||||||||||||
AllianzGI Emerging Markets Opportunities | 811,230 | 600,265 | (611,597 | ) | 71,523 | 802,308 | 14,563 | (5,066 | ) | — | ||||||||||||||||||||||
AllianzGI Global Managed Volatility | 1,354,429 | 147,757 | (1,363,504 | ) | — | — | 36,594 | (35,215 | ) | 111,163 | ||||||||||||||||||||||
AllianzGI Global Natural Resources | 1,000,972 | 731,307 | (155,982 | ) | 46,503 | 1,610,552 | 1,943 | (16,169 | ) | — | ||||||||||||||||||||||
AllianzGI Income & Growth | 1,622,088 | 11,500 | (1,575,959 | ) | — | — | 11,500 | 19,399 | — | |||||||||||||||||||||||
AllianzGI International Managed Volatility | 1,613,605 | 593,120 | (1,072,972 | ) | 55,192 | 1,087,739 | 64,208 | (14,339 | ) | — | ||||||||||||||||||||||
AllianzGI International Small-Cap | 847,848 | 324,921 | (1,205,945 | ) | — | — | 2,083 | 91,378 | 104,483 | |||||||||||||||||||||||
AllianzGI NFJ Dividend Value | 1,067,393 | 5,760 | (1,070,040 | ) | — | — | 5,760 | 300,821 | — | |||||||||||||||||||||||
AllianzGI NFJ International Small-Cap Value | 269,426 | — | (268,677 | ) | — | — | — | 8,472 | — | |||||||||||||||||||||||
AllianzGI NFJ International Value | 1,068,596 | 3,973 | (1,038,661 | ) | — | — | 3,973 | 45,027 | — | |||||||||||||||||||||||
AllianzGI NFJ Mid-Cap Value | 1,065,519 | 2,201,576 | (20,937 | ) | 327,108 | 3,316,258 | 17,986 | (669 | ) | — | ||||||||||||||||||||||
AllianzGI Short Duration High Income | 2,967,976 | 2,089,734 | (1,211,147 | ) | 16,487 | 3,883,575 | 109,584 | (28,098 | ) | — | ||||||||||||||||||||||
AllianzGI U.S. Managed Volatility | 3,897,002 | 1,172,223 | (3,548,206 | ) | 74,157 | 1,113,947 | 74,342 | (78,471 | ) | 306,355 | ||||||||||||||||||||||
AllianzGI U.S. Small-Cap Growth | 1,237,220 | 1,277,208 | (83,775 | ) | 80,094 | 2,410,240 | — | (9,974 | ) | 105,603 | ||||||||||||||||||||||
AllianzGI Ultra Micro Cap | 706,801 | 63,186 | (94,966 | ) | 66,192 | 728,418 | — | 5,274 | 6,150 | |||||||||||||||||||||||
PIMCO 1-5 Year U.S. TIPS Index | 4,301,188 | 55,934 | (4,307,885 | ) | — | — | — | (105,464 | ) | — | ||||||||||||||||||||||
| 358 | May 31, 2015 | | Semiannual Report |
Table of Contents
| AllianzGI Retirement 2035 (cont’d) | ||||||||||||||||||||||||||||||||
| Market Value 11/30/2014 | Purchases at Cost | Proceeds from Sales | Unrealized Appreciation (Depreciation) | Market Value 5/31/2015 | Dividend Income | Net Realized Gain (Loss) | Net Capital Gain Distributions Received | |||||||||||||||||||||||||
PIMCO 15+ Year U.S. TIPS Index | — | $ | 1,813,347 | $ | (360,109 | ) | $ | (43,305 | ) | $ | 1,408,682 | — | $ | (1,251 | ) | — | ||||||||||||||||
PIMCO 25+ Year Zero Coupon U.S. Treasury Index | — | 277,543 | — | 13,123 | 290,666 | — | — | — | ||||||||||||||||||||||||
PIMCO Broad U.S. TIPS Index | — | 5,302,013 | (1,152,171 | ) | (39,314 | ) | 4,079,224 | — | (31,304 | ) | — | |||||||||||||||||||||
PIMCO CommoditiesPLUS® Strategy | $ | 1,005,925 | 1,396,874 | (421,636 | ) | (64,957 | ) | 1,888,328 | $ | 26,951 | (165,702 | ) | $ | 1,464 | ||||||||||||||||||
PIMCO Commodity RealReturn Strategy | 2,110,582 | 343,115 | (2,150,555 | ) | — | — | — | (608,671 | ) | — | ||||||||||||||||||||||
PIMCO EqS Long/Short | — | 1,898,938 | — | 42,652 | 1,941,590 | — | — | — | ||||||||||||||||||||||||
PIMCO Floating Income | — | 2,615,863 | (2,615,709 | ) | — | — | 12,801 | (154 | ) | — | ||||||||||||||||||||||
PIMCO Foreign Bond (U.S. Dollar-Hedged) | — | 1,110,879 | (4,988 | ) | (13,173 | ) | 1,092,736 | 6,536 | 18 | — | ||||||||||||||||||||||
PIMCO Income | 6,494,774 | 777,492 | (2,706,222 | ) | 55,814 | 4,450,943 | 198,172 | (76,312 | ) | 14,666 | ||||||||||||||||||||||
PIMCO Long-Term Credit | — | 1,604,351 | (1,757 | ) | (52,780 | ) | 1,549,834 | 22,101 | 20 | — | ||||||||||||||||||||||
PIMCO Mortgage Opportunities | 1,080,640 | 1,969,712 | (562,837 | ) | 14,565 | 2,492,422 | 24,240 | 2,999 | — | |||||||||||||||||||||||
PIMCO Real Return | 5,403,242 | 303,891 | (5,601,847 | ) | — | — | 114,748 | (72,684 | ) | 1,611 | ||||||||||||||||||||||
PIMCO Senior Floating Rate | 1,620,231 | 3,012 | (1,592,856 | ) | — | — | 2,766 | (44,325 | ) | 3,012 | ||||||||||||||||||||||
PIMCO StocksPLUS® International (U.S. Dollar-Hedged) | 3,251,478 | 336,904 | (2,149,531 | ) | 134,669 | 1,409,868 | 217,105 | (68,410 | ) | — | ||||||||||||||||||||||
PIMCO TRENDS Managed Futures Strategy | — | 2,136,144 | (142,854 | ) | (95,079 | ) | 1,903,601 | — | 5,390 | — | ||||||||||||||||||||||
Totals | $ | 49,563,426 | $ | 47,407,942 | $ | (45,142,669 | ) | $ | 1,155,648 | $ | 50,686,349 | $ | 1,051,897 | $ | (465,716 | ) | $ | 805,631 | ||||||||||||||
| AllianzGI Retirement 2040: | ||||||||||||||||||||||||||||||||
| Market Value 11/30/2014 | Purchases at Cost | Proceeds from Sales | Unrealized Appreciation (Depreciation) | Market Value 5/31/2015 | Dividend Income | Net Realized Gain (Loss) | Net Capital Gain Distributions Received | |||||||||||||||||||||||||
AllianzGI Behavioral Advantage Large Cap | $ | 1,539,363 | $ | 96,169 | $ | (1,554,847 | ) | — | — | $ | 14,385 | $ | 249,144 | $ | 81,784 | |||||||||||||||||
AllianzGI Best Styles Global Equity | 3,515,152 | 336,010 | (3,674,754 | ) | — | — | 85,909 | 151,703 | 87,872 | |||||||||||||||||||||||
AllianzGI Best Styles International Equity | — | 4,382,594 | (766,925 | ) | $ | 250,214 | $ | 3,889,772 | — | 23,889 | — | |||||||||||||||||||||
AllianzGI Best Styles U.S. Equity | — | 8,467,705 | (1,769,916 | ) | 130,917 | 6,818,541 | — | (10,165 | ) | — | ||||||||||||||||||||||
AllianzGI Emerging Markets Consumer | — | 863,187 | (59,316 | ) | 32,212 | 838,649 | — | 2,566 | — | |||||||||||||||||||||||
AllianzGI Emerging Markets Opportunities | 667,120 | 891,475 | (718,650 | ) | 165,864 | 851,408 | 12,371 | 5,198 | — | |||||||||||||||||||||||
AllianzGI Global Managed Volatility | 1,542,148 | 206,855 | (1,587,649 | ) | — | — | 42,613 | (44,501 | ) | 129,446 | ||||||||||||||||||||||
AllianzGI Global Natural Resources | 829,708 | 584,593 | (141,874 | ) | 79,431 | 1,298,923 | 1,648 | (9,538 | ) | — | ||||||||||||||||||||||
AllianzGI Income & Growth | 1,452,990 | 51,777 | (1,453,503 | ) | — | — | 10,596 | 104,076 | — | |||||||||||||||||||||||
AllianzGI International Managed Volatility | 1,309,757 | 528,856 | (540,592 | ) | 93,835 | 1,289,460 | 53,949 | 2,680 | — | |||||||||||||||||||||||
AllianzGI International Small-Cap | 871,302 | 438,406 | (1,324,740 | ) | — | — | 2,263 | 136,129 | 113,546 | |||||||||||||||||||||||
AllianzGI NFJ Dividend Value | 1,085,310 | 44,783 | (1,128,285 | ) | — | — | 6,066 | 389,575 | — | |||||||||||||||||||||||
AllianzGI NFJ International Small-Cap Value | 266,756 | — | (266,015 | ) | — | — | — | 9,897 | — | |||||||||||||||||||||||
AllianzGI NFJ International Value | 1,095,142 | 75,164 | (1,136,544 | ) | — | — | 4,345 | 37,645 | — | |||||||||||||||||||||||
AllianzGI NFJ Mid-Cap Value | 874,373 | 1,774,088 | (84,523 | ) | 298,037 | 2,617,919 | 15,197 | (616 | ) | — | ||||||||||||||||||||||
AllianzGI Short Duration High Income | 2,177,612 | 1,516,223 | (760,144 | ) | 7,802 | 2,960,316 | 79,825 | (19,924 | ) | — | ||||||||||||||||||||||
AllianzGI U.S. Managed Volatility | 3,734,952 | 1,022,295 | (3,054,609 | ) | 130,773 | 1,317,017 | 70,574 | (94,562 | ) | 289,130 | ||||||||||||||||||||||
AllianzGI U.S. Small-Cap Growth | 1,098,885 | 1,048,224 | (132,906 | ) | 122,826 | 1,991,480 | — | (10,130 | ) | 97,127 | ||||||||||||||||||||||
AllianzGI Ultra Micro Cap | 659,528 | 53,614 | (102,289 | ) | 53,767 | 659,012 | — | 3,460 | 5,962 | |||||||||||||||||||||||
| Semiannual Report | | May 31, 2015 | 359 |
Table of Contents
Notes to Financial Statements (cont’d)
May 31, 2015 (Unaudited)
| AllianzGI Retirement 2040 (cont’d) | ||||||||||||||||||||||||||||||||
| Market Value 11/30/2014 | Purchases at Cost | Proceeds from Sales | Unrealized Appreciation (Depreciation) | Market Value 5/31/2015 | Dividend Income | Net Realized Gain (Loss) | Net Capital Gain Distributions Received | |||||||||||||||||||||||||
PIMCO 1-5 Year U.S. TIPS Index | $ | 2,178,178 | $ | 54,852 | $ | (2,204,004 | ) | — | — | — | $ | (58,666 | ) | — | ||||||||||||||||||
PIMCO 15+ Year U.S. TIPS Index | — | 942,585 | (253,729 | ) | $ | (21,507 | ) | $ | 667,051 | — | (298 | ) | — | |||||||||||||||||||
PIMCO 25+ Year Zero Coupon U.S. Treasury Index | — | 219,062 | — | 10,357 | 229,419 | — | — | — | ||||||||||||||||||||||||
PIMCO Broad U.S. TIPS Index | — | 1,547,801 | (230,685 | ) | (20,720 | ) | 1,294,317 | — | (2,079 | ) | — | |||||||||||||||||||||
PIMCO CommoditiesPLUS® Strategy | 862,101 | 1,432,294 | (342,643 | ) | (63,104 | ) | 1,872,886 | $ | 25,282 | (136,389 | ) | $ | 1,280 | |||||||||||||||||||
PIMCO Commodity RealReturn Strategy | 2,017,889 | 333,890 | (2,056,150 | ) | — | — | — | (574,955 | ) | — | ||||||||||||||||||||||
PIMCO EqS Long/Short | — | 1,899,279 | (76,331 | ) | 39,989 | 1,864,040 | — | 1,103 | — | |||||||||||||||||||||||
PIMCO Floating Income | — | 1,981,742 | (1,983,310 | ) | — | — | 9,531 | 1,568 | — | |||||||||||||||||||||||
PIMCO Foreign Bond (U.S. Dollar-Hedged) | — | 920,761 | (24,913 | ) | (9,995 | ) | 885,982 | 5,139 | 129 | — | ||||||||||||||||||||||
PIMCO Income | 4,598,106 | 417,664 | (2,291,473 | ) | 50,226 | 2,635,563 | 133,960 | (67,771 | ) | 10,599 | ||||||||||||||||||||||
PIMCO Long-Term Credit | — | 1,285,008 | (31,643 | ) | (37,616 | ) | 1,215,464 | 16,654 | (285 | ) | — | |||||||||||||||||||||
PIMCO Mortgage Opportunities | — | 1,538,989 | (13,158 | ) | 4,385 | 1,530,249 | 13,012 | 33 | — | |||||||||||||||||||||||
PIMCO Real Return | 3,508,059 | 214,373 | (3,651,138 | ) | — | — | 63,923 | (79,799 | ) | 1,081 | ||||||||||||||||||||||
PIMCO Senior Floating Rate | 874,988 | 26,410 | (884,632 | ) | — | — | 1,525 | (24,657 | ) | 1,658 | ||||||||||||||||||||||
PIMCO StocksPLUS® International (U.S. Dollar-Hedged) | 3,313,772 | 400,069 | (2,208,115 | ) | 147,778 | 1,557,762 | 145,141 | 7,456 | — | |||||||||||||||||||||||
PIMCO TRENDS Managed Futures Strategy | — | 1,967,972 | (49,495 | ) | (91,864 | ) | 1,827,527 | — | 914 | — | ||||||||||||||||||||||
Totals | $ | 40,073,191 | $ | 37,564,769 | $ | (36,559,500 | ) | $ | 1,373,607 | $ | 40,112,757 | $ | 813,908 | $ | (7,170 | ) | $ | 819,485 | ||||||||||||||
| AllianzGI Retirement 2045: | ||||||||||||||||||||||||||||||||
| Market Value 11/30/2014 | Purchases at Cost | Proceeds from Sales | Unrealized Appreciation (Depreciation) | Market Value 5/31/2015 | Dividend Income | Net Realized Gain (Loss) | Net Capital Gain Distributions Received | |||||||||||||||||||||||||
AllianzGI Behavioral Advantage Large Cap | $ | 1,205,983 | $ | 57,307 | $ | (1,215,099 | ) | — | — | $ | 8,572 | $ | 167,447 | $ | 48,735 | |||||||||||||||||
AllianzGI Best Styles Global Equity | 2,412,208 | 115,535 | (2,408,950 | ) | — | — | 56,837 | 94,577 | 58,699 | |||||||||||||||||||||||
AllianzGI Best Styles International Equity | — | 3,311,345 | (756,710 | ) | $ | 171,777 | $ | 2,758,840 | — | 32,428 | — | |||||||||||||||||||||
AllianzGI Best Styles U.S. Equity | — | 5,282,114 | (1,427,822 | ) | 74,932 | 3,934,335 | — | 5,111 | — | |||||||||||||||||||||||
AllianzGI Emerging Markets Consumer | — | 782,123 | (115,994 | ) | 27,022 | 703,519 | — | 10,368 | — | |||||||||||||||||||||||
AllianzGI Emerging Markets Opportunities | 535,994 | 684,731 | (643,307 | ) | 58,041 | 590,436 | 9,622 | 5,818 | — | |||||||||||||||||||||||
AllianzGI Global Managed Volatility | 1,073,867 | 117,150 | (1,081,015 | ) | — | — | 29,014 | (35,191 | ) | 88,136 | ||||||||||||||||||||||
AllianzGI Global Natural Resources | 496,005 | 318,669 | (114,512 | ) | 26,343 | 721,448 | 961 | 1,399 | — | |||||||||||||||||||||||
AllianzGI Income & Growth | 937,779 | 6,648 | (910,762 | ) | — | — | 6,648 | 16,990 | — | |||||||||||||||||||||||
AllianzGI International Managed Volatility | 879,557 | 262,520 | (304,961 | ) | 73,202 | 841,138 | 34,999 | 2,020 | — | |||||||||||||||||||||||
AllianzGI International Small-Cap | 738,767 | 324,419 | (1,085,960 | ) | — | — | 1,854 | 77,098 | 93,031 | |||||||||||||||||||||||
AllianzGI NFJ Dividend Value | 661,157 | 3,568 | (663,653 | ) | — | — | 3,568 | 205,256 | — | |||||||||||||||||||||||
AllianzGI NFJ International Small-Cap Value | 240,308 | — | (239,640 | ) | — | — | — | 8,148 | — | |||||||||||||||||||||||
AllianzGI NFJ International Value | 794,296 | 12,621 | (781,492 | ) | — | — | 2,989 | 40,095 | — | |||||||||||||||||||||||
AllianzGI NFJ Mid-Cap Value | 686,407 | 1,222,104 | (168,350 | ) | 241,523 | 1,780,917 | 11,586 | 1,832 | — | |||||||||||||||||||||||
AllianzGI Short Duration High Income | 1,203,345 | 36,635 | (663,707 | ) | (3,090 | ) | 571,675 | 21,028 | (22,568 | ) | — | |||||||||||||||||||||
AllianzGI U.S. Managed Volatility | 2,628,396 | 856,964 | (2,220,794 | ) | 67,362 | 980,849 | 51,325 | (98,333 | ) | 211,504 | ||||||||||||||||||||||
AllianzGI U.S. Small-Cap Growth | 746,389 | 592,437 | (141,031 | ) | 53,973 | 1,187,581 | — | (6,533 | ) | 63,708 | ||||||||||||||||||||||
AllianzGI Ultra Micro Cap | 404,148 | 14,042 | (93,908 | ) | 34,520 | 355,293 | — | 5,932 | 3,517 | |||||||||||||||||||||||
PIMCO 1-5 Year U.S. TIPS Index | 521,121 | — | (515,751 | ) | — | — | — | (7,554 | ) | — | ||||||||||||||||||||||
| 360 | May 31, 2015 | | Semiannual Report |
Table of Contents
| AllianzGI Retirement 2045 (cont’d) | ||||||||||||||||||||||||||||||||
| Market Value 11/30/2014 | Purchases at Cost | Proceeds from Sales | Unrealized Appreciation (Depreciation) | Market Value 5/31/2015 | Dividend Income | Net Realized Gain (Loss) | Net Capital Gain Distributions Received | |||||||||||||||||||||||||
PIMCO 15+ Year U.S. TIPS Index | — | $ | 579,939 | $ | (197,388 | ) | $ | (7,052 | ) | $ | 374,926 | — | $ | (573 | ) | — | ||||||||||||||||
PIMCO Broad U.S. TIPS Index | — | 1,115,043 | (361,650 | ) | (11,504 | ) | 732,928 | — | (8,961 | ) | — | |||||||||||||||||||||
PIMCO CommoditiesPLUS® Strategy | $ | 548,268 | 876,226 | (300,475 | ) | (15,147 | ) | 1,079,338 | $ | 15,050 | (106,283 | ) | $ | 818 | ||||||||||||||||||
PIMCO Commodity RealReturn Strategy | 1,275,364 | 247,192 | (1,336,013 | ) | — | — | — | (363,597 | ) | — | ||||||||||||||||||||||
PIMCO EqS Long/Short | — | 1,144,833 | (126,480 | ) | 25,593 | 1,045,329 | — | 1,383 | — | |||||||||||||||||||||||
PIMCO Floating Income | — | 1,039,943 | (1,039,767 | ) | — | — | 5,071 | (176 | ) | — | ||||||||||||||||||||||
PIMCO Income | 2,547,779 | 613,473 | (1,400,818 | ) | 26,457 | 1,717,956 | 76,580 | (38,679 | ) | 5,738 | ||||||||||||||||||||||
PIMCO Long-Term Credit | — | 675,526 | (60,946 | ) | (19,191 | ) | 595,895 | 8,906 | 506 | — | ||||||||||||||||||||||
PIMCO Real Return | 1,350,693 | 565,237 | (1,903,712 | ) | — | — | 19,214 | (6,133 | ) | 406 | ||||||||||||||||||||||
PIMCO Senior Floating Rate | 267,621 | 498 | (263,099 | ) | — | — | 457 | (7,366 | ) | 497 | ||||||||||||||||||||||
PIMCO StocksPLUS® International (U.S. Dollar-Hedged) | 2,282,537 | 234,282 | (1,286,891 | ) | 110,780 | 1,243,614 | 159,576 | (35,597 | ) | — | ||||||||||||||||||||||
PIMCO TRENDS Managed Futures Strategy | — | 1,237,677 | (150,313 | ) | (52,328 | ) | 1,039,735 | — | 4,699 | — | ||||||||||||||||||||||
Totals | $ | 24,437,989 | $ | 22,330,801 | $ | (23,980,970 | ) | $ | 883,213 | $ | 22,255,752 | $ | 523,857 | $ | (56,437 | ) | $ | 574,789 | ||||||||||||||
| AllianzGI Retirement 2050: | ||||||||||||||||||||||||||||||||
| Market Value 11/30/2014 | Purchases at Cost | Proceeds from Sales | Unrealized Appreciation (Depreciation) | Market Value 5/31/2015 | Dividend Income | Net Realized Gain (Loss) | Net Capital Gain Distributions Received | |||||||||||||||||||||||||
AllianzGI Behavioral Advantage Large Cap | $ | 976,820 | $ | 53,937 | $ | (985,432 | ) | — | — | $ | 8,068 | $ | 156,185 | $ | 45,869 | |||||||||||||||||
AllianzGI Best Styles Global Equity | 2,166,603 | 176,432 | (2,238,722 | ) | — | — | 50,424 | 89,199 | 51,712 | |||||||||||||||||||||||
AllianzGI Best Styles International Equity | — | 2,914,697 | (619,851 | ) | $ | 150,107 | $ | 2,467,315 | — | 22,362 | — | |||||||||||||||||||||
AllianzGI Best Styles U.S. Equity | — | 4,643,703 | (1,162,524 | ) | 70,207 | 3,549,995 | — | (1,391 | ) | — | ||||||||||||||||||||||
AllianzGI Emerging Markets Consumer | — | 656,615 | (84,726 | ) | 22,325 | 601,557 | — | 7,343 | — | |||||||||||||||||||||||
AllianzGI Emerging Markets Opportunities | 478,354 | 646,724 | (528,501 | ) | 145,461 | 609,171 | 8,447 | 8,516 | — | |||||||||||||||||||||||
AllianzGI Global Managed Volatility | 860,382 | 93,441 | (866,057 | ) | — | — | 23,142 | (16,233 | ) | 70,299 | ||||||||||||||||||||||
AllianzGI Global Natural Resources | 506,521 | 283,167 | (88,441 | ) | 56,097 | 720,875 | 960 | (2,211 | ) | — | ||||||||||||||||||||||
AllianzGI Income & Growth | 732,025 | 9,013 | (715,027 | ) | — | — | 5,155 | 98,239 | — | |||||||||||||||||||||||
AllianzGI International Managed Volatility | 704,518 | 258,879 | (156,664 | ) | 69,368 | 816,537 | 28,227 | 1,398 | — | |||||||||||||||||||||||
AllianzGI International Small-Cap | 646,511 | 298,995 | (961,879 | ) | — | — | 1,649 | 143,298 | 82,718 | |||||||||||||||||||||||
AllianzGI NFJ Dividend Value | 644,311 | 3,425 | (647,244 | ) | — | — | 3,425 | 276,651 | — | |||||||||||||||||||||||
AllianzGI NFJ International Small-Cap Value | 216,817 | — | (216,215 | ) | — | — | — | 6,322 | — | |||||||||||||||||||||||
AllianzGI NFJ International Value | 642,574 | 2,389 | (624,573 | ) | — | — | 2,389 | 27,636 | — | |||||||||||||||||||||||
AllianzGI NFJ Mid-Cap Value | 597,590 | 1,127,994 | (146,705 | ) | 168,595 | 1,616,026 | 10,032 | 992 | — | |||||||||||||||||||||||
AllianzGI Short Duration High Income | 958,321 | 27,019 | (972,146 | ) | — | — | 4,930 | (27,226 | ) | — | ||||||||||||||||||||||
AllianzGI U.S. Managed Volatility | 2,201,900 | 703,829 | (1,635,182 | ) | 102,035 | 1,040,627 | 40,897 | (75,479 | ) | 168,532 | ||||||||||||||||||||||
AllianzGI U.S. Small-Cap Growth | 644,262 | 503,998 | (88,221 | ) | 101,517 | 1,050,461 | — | (2,673 | ) | 54,228 | ||||||||||||||||||||||
AllianzGI Ultra Micro Cap | 386,149 | 27,511 | (89,978 | ) | 32,178 | 354,279 | — | 6,517 | 3,299 | |||||||||||||||||||||||
PIMCO 15+ Year U.S. TIPS Index | — | 341,111 | (121,587 | ) | (7,039 | ) | 212,063 | — | (422 | ) | — | |||||||||||||||||||||
PIMCO Broad U.S. TIPS Index | — | 782,779 | (153,880 | ) | (9,514 | ) | 615,967 | — | (3,418 | ) | — | |||||||||||||||||||||
PIMCO CommoditiesPLUS® Strategy | 481,242 | 846,793 | (259,221 | ) | (10,351 | ) | 1,035,959 | 13,211 | (84,900 | ) | 716 | |||||||||||||||||||||
PIMCO Commodity RealReturn Strategy | 1,128,875 | 214,553 | (1,176,761 | ) | — | — | — | �� | (314,173 | ) | — | |||||||||||||||||||||
PIMCO EqS Long/Short | — | 1,004,175 | (93,080 | ) | 20,170 | 932,106 | — | 841 | — | |||||||||||||||||||||||
PIMCO Floating Income | — | 723,785 | (723,742 | ) | — | — | 3,542 | (43 | ) | — | ||||||||||||||||||||||
| Semiannual Report | | May 31, 2015 | 361 |
Table of Contents
Notes to Financial Statements (cont’d)
May 31, 2015 (Unaudited)
| AllianzGI Retirement 2050 (cont’d) | ||||||||||||||||||||||||||||||||
| Market Value 11/30/2014 | Purchases at Cost | Proceeds from Sales | Unrealized Appreciation (Depreciation) | Market Value 5/31/2015 | Dividend Income | Net Realized Gain (Loss) | Net Capital Gain Distributions Received | |||||||||||||||||||||||||
PIMCO Income | $ | 1,396,484 | $ | 474,331 | $ | (1,010,965 | ) | $ | 25,688 | $ | 834,489 | $ | 41,355 | $ | (17,027 | ) | $ | 3,145 | ||||||||||||||
PIMCO Long-Term Credit | — | 587,027 | (38,889 | ) | (16,267 | ) | 532,186 | 7,432 | 315 | — | ||||||||||||||||||||||
PIMCO Real Return | 1,072,223 | 364,198 | (1,424,019 | ) | — | — | 15,307 | (8,307 | ) | 326 | ||||||||||||||||||||||
PIMCO StocksPLUS® International (U.S. Dollar-Hedged) | 2,194,928 | 275,148 | (1,413,876 | ) | 96,560 | 1,056,184 | 135,422 | (45,010 | ) | — | ||||||||||||||||||||||
PIMCO TRENDS Managed Futures Strategy | — | 1,081,871 | (114,374 | ) | (46,313 | ) | 924,497 | — | 3,313 | — | ||||||||||||||||||||||
Totals | $ | 19,637,410 | $ | 19,127,539 | $ | (19,358,482 | ) | $ | 970,824 | $ | 18,970,294 | $ | 404,014 | $ | 250,614 | $ | 480,844 | |||||||||||||||
| AllianzGI Retirement 2055: | ||||||||||||||||||||||||||||||||
| Market Value 11/30/2014 | Purchases at Cost | Proceeds from Sales | Unrealized Appreciation (Depreciation) | Market Value 5/31/2015 | Dividend Income | Net Realized Gain (Loss) | Net Capital Gain Distributions Received | |||||||||||||||||||||||||
AllianzGI Behavioral Advantage Large Cap | $ | 401,624 | $ | 23,373 | $ | (405,395 | ) | — | — | $ | 3,496 | $ | 56,949 | $ | 19,877 | |||||||||||||||||
AllianzGI Best Styles Global Equity | 791,484 | 37,313 | (790,349 | ) | — | — | 18,356 | 28,450 | 18,957 | |||||||||||||||||||||||
AllianzGI Best Styles International Equity | — | 1,074,483 | (131,918 | ) | $ | 60,114 | $ | 1,006,906 | — | 4,227 | — | |||||||||||||||||||||
AllianzGI Best Styles U.S. Equity | — | 1,768,366 | (261,692 | ) | 29,367 | 1,535,619 | — | (422 | ) | — | ||||||||||||||||||||||
AllianzGI Emerging Markets Consumer | — | 247,634 | (13,127 | ) | 8,759 | 244,330 | — | 1,065 | — | |||||||||||||||||||||||
AllianzGI Emerging Markets Opportunities | 174,816 | 296,886 | (229,986 | ) | 29,803 | 246,206 | 3,072 | 1,058 | — | |||||||||||||||||||||||
AllianzGI Global Managed Volatility | 358,473 | 38,237 | (360,728 | ) | — | — | 9,470 | (7,803 | ) | 28,767 | ||||||||||||||||||||||
AllianzGI Global Natural Resources | 185,017 | 120,010 | (17,367 | ) | 11,799 | 294,226 | 349 | (2,716 | ) | — | ||||||||||||||||||||||
AllianzGI Income & Growth | 237,959 | 1,655 | (231,332 | ) | — | — | 1,655 | 17,144 | — | |||||||||||||||||||||||
AllianzGI International Managed Volatility | 284,711 | 108,570 | (61,843 | ) | 33,973 | 333,564 | 11,202 | (4,229 | ) | — | ||||||||||||||||||||||
AllianzGI International Small-Cap | 244,683 | 103,078 | (354,281 | ) | — | — | 600 | 39,563 | 30,087 | |||||||||||||||||||||||
AllianzGI NFJ Dividend Value | 274,044 | 1,453 | (275,458 | ) | — | — | 1,453 | 91,659 | — | |||||||||||||||||||||||
AllianzGI NFJ International Small-Cap Value | 78,301 | — | (78,084 | ) | — | — | — | 1,943 | — | |||||||||||||||||||||||
AllianzGI NFJ International Value | 274,601 | 12,747 | (278,901 | ) | — | — | 1,040 | 35,650 | — | |||||||||||||||||||||||
AllianzGI NFJ Mid-Cap Value | 234,506 | 442,600 | (14,250 | ) | 89,348 | 677,098 | 3,909 | (210 | ) | — | ||||||||||||||||||||||
AllianzGI Short Duration High Income | 340,760 | 6,245 | (342,434 | ) | — | — | 1,794 | (8,063 | ) | — | ||||||||||||||||||||||
AllianzGI U.S. Managed Volatility | 838,657 | 265,180 | (591,950 | ) | 28,280 | 425,125 | 15,257 | (30,595 | ) | 62,873 | ||||||||||||||||||||||
AllianzGI U.S. Small-Cap Growth | 234,490 | 229,620 | (31,389 | ) | 26,959 | 429,137 | — | (1,165 | ) | 19,706 | ||||||||||||||||||||||
AllianzGI Ultra Micro Cap | 158,028 | 18,820 | (18,861 | ) | 14,343 | 169,706 | — | 249 | 1,333 | |||||||||||||||||||||||
PIMCO 15+ Year U.S. TIPS Index | — | 91,046 | — | (4,850 | ) | 86,195 | — | — | — | |||||||||||||||||||||||
PIMCO Broad U.S. TIPS Index | — | 246,569 | (41,206 | ) | (3,125 | ) | 200,980 | — | (1,258 | ) | — | |||||||||||||||||||||
PIMCO CommoditiesPLUS® Strategy | 185,873 | 302,836 | (51,257 | ) | (17,859 | ) | 422,860 | 5,004 | (19,831 | ) | 272 | |||||||||||||||||||||
PIMCO Commodity RealReturn Strategy | 418,671 | 84,836 | (442,804 | ) | — | — | — | (114,314 | ) | — | ||||||||||||||||||||||
PIMCO EqS Long/Short | — | 378,336 | (1,673 | ) | 7,037 | 383,704 | — | 4 | — | |||||||||||||||||||||||
PIMCO Floating Income | — | 248,364 | (248,349 | ) | — | — | 1,215 | (15 | ) | — | ||||||||||||||||||||||
PIMCO Income | 397,475 | 70,520 | (288,874 | ) | 8,394 | 170,911 | 10,342 | (4,151 | ) | 880 | ||||||||||||||||||||||
PIMCO Long-Term Credit | — | 223,837 | — | (6,782 | ) | 217,056 | 2,846 | — | — | |||||||||||||||||||||||
PIMCO Real Return | 317,595 | 162,067 | (477,264 | ) | — | — | 3,769 | (986 | ) | 95 | ||||||||||||||||||||||
PIMCO StocksPLUS® International (U.S. Dollar-Hedged) | 792,926 | 118,069 | (409,669 | ) | 40,806 | 517,734 | 43,444 | (8,660 | ) | — | ||||||||||||||||||||||
PIMCO TRENDS Managed Futures Strategy | — | 408,422 | (11,354 | ) | (19,865 | ) | 377,282 | — | 79 | — | ||||||||||||||||||||||
Totals | $ | 7,224,694 | $ | 7,131,172 | $ | (6,461,795 | ) | $ | 336,501 | $ | 7,738,639 | $ | 138,273 | $ | 73,622 | $ | 182,847 | |||||||||||||||
| 362 | May 31, 2015 | | Semiannual Report |
Table of Contents
| AllianzGI Retirement Income: | ||||||||||||||||||||||||||||||||
| Market Value 11/30/2014 | Purchases at Cost | Proceeds from Sales | Unrealized Appreciation (Depreciation) | Market Value 5/31/2015 | Dividend Income | Net Realized Gain (Loss) | Net Capital Gain Distributions Received | |||||||||||||||||||||||||
AllianzGI Behavioral Advantage Large Cap | $ | 614,440 | $ | 37,930 | $ | (620,544 | ) | — | — | $ | 5,674 | $ | 68,873 | $ | 32,256 | |||||||||||||||||
AllianzGI Best Styles Global Equity | 594,407 | 28,470 | (593,604 | ) | — | — | 14,005 | 41,428 | 14,465 | |||||||||||||||||||||||
AllianzGI Best Styles International Equity | — | 1,254,266 | (337,671 | ) | $ | 59,884 | $ | 989,325 | — | 12,846 | — | |||||||||||||||||||||
AllianzGI Best Styles U.S. Equity | — | 4,266,488 | (1,576,173 | ) | 63,241 | 2,755,414 | — | 1,858 | — | |||||||||||||||||||||||
AllianzGI Emerging Markets Consumer | — | 553,547 | (100,603 | ) | 18,397 | 478,973 | — | 7,632 | — | |||||||||||||||||||||||
AllianzGI Emerging Markets Opportunities | 294,966 | 5,295 | (287,526 | ) | — | — | 5,295 | (11,443 | ) | — | ||||||||||||||||||||||
AllianzGI Global Managed Volatility | 295,593 | 32,247 | (297,633 | ) | — | — | 7,987 | 25,836 | 24,260 | |||||||||||||||||||||||
AllianzGI Global Natural Resources | 332,962 | 313,865 | (123,965 | ) | 36,597 | 534,898 | 662 | (2,618 | ) | — | ||||||||||||||||||||||
AllianzGI Income & Growth | 588,835 | 16,217 | (584,761 | ) | — | — | 4,175 | 87,108 | — | |||||||||||||||||||||||
AllianzGI International Managed Volatility | 293,357 | 11,673 | (291,170 | ) | — | — | 11,673 | 4,528 | — | |||||||||||||||||||||||
AllianzGI NFJ Dividend Value | 437,961 | — | (433,680 | ) | — | — | 2,364 | 129,891 | — | |||||||||||||||||||||||
AllianzGI NFJ International Value | 436,458 | 22,393 | (446,646 | ) | — | — | 1,706 | 36,964 | — | |||||||||||||||||||||||
AllianzGI NFJ Mid-Cap Value | 290,478 | 610,525 | (94,126 | ) | 9,877 | 817,765 | 4,903 | 32 | — | |||||||||||||||||||||||
AllianzGI Short Duration High Income | 1,911,038 | 1,203,527 | (1,006,275 | ) | 18,955 | 2,127,755 | 65,044 | (22,695 | ) | — | ||||||||||||||||||||||
AllianzGI U.S. Managed Volatility | 1,867,974 | 393,477 | (2,090,415 | ) | — | — | 34,017 | (11,371 | ) | 138,065 | ||||||||||||||||||||||
AllianzGI U.S. Small-Cap Growth | 290,097 | 342,947 | (71,926 | ) | (3,424 | ) | 554,746 | — | (2,468 | ) | 24,761 | |||||||||||||||||||||
PIMCO 1-5 Year U.S. TIPS Index | 6,053,514 | 106,088 | (6,089,201 | ) | — | — | — | (140,390 | ) | — | ||||||||||||||||||||||
PIMCO 15+ Year U.S. TIPS Index | — | 1,374,712 | (187,693 | ) | (48,902 | ) | 1,137,177 | — | (940 | ) | — | |||||||||||||||||||||
PIMCO 25+ Year Zero Coupon U.S. Treasury Index | — | 373,458 | — | 17,657 | 391,115 | — | — | — | ||||||||||||||||||||||||
PIMCO Broad U.S. TIPS Index | — | 5,167,640 | (916,901 | ) | (18,747 | ) | 4,214,549 | — | (17,443 | ) | — | |||||||||||||||||||||
PIMCO CommoditiesPLUS® Strategy | — | 692,204 | (107,704 | ) | 29,936 | 620,701 | — | 6,265 | — | |||||||||||||||||||||||
PIMCO Commodity RealReturn Strategy | 704,264 | 71,664 | (675,077 | ) | — | — | — | (202,497 | ) | — | ||||||||||||||||||||||
PIMCO Floating Income | — | 1,461,077 | (1,462,579 | ) | — | — | 6,894 | 1,502 | — | |||||||||||||||||||||||
PIMCO Foreign Bond (U.S. Dollar-Hedged) | — | 710,424 | (73,865 | ) | (7,620 | ) | 629,667 | 3,947 | 728 | — | ||||||||||||||||||||||
PIMCO Income | 4,191,035 | 1,074,049 | (1,561,339 | ) | 237,348 | 3,652,553 | 147,975 | (16,605 | ) | 9,421 | ||||||||||||||||||||||
PIMCO Long-Term Credit | — | 1,155,757 | (106,449 | ) | (33,705 | ) | 1,015,306 | 17,062 | (297 | ) | — | |||||||||||||||||||||
PIMCO Mortgage Opportunities | 1,473,910 | 2,272,067 | (1,236,264 | ) | 14,150 | 2,516,481 | 32,365 | 4,018 | — | |||||||||||||||||||||||
PIMCO Real Return | 5,009,648 | 138,651 | (5,009,709 | ) | — | — | 117,649 | 107,644 | 1,510 | |||||||||||||||||||||||
PIMCO Senior Floating Rate | 885,030 | 1,645 | (870,077 | ) | — | — | 1,511 | (24,250 | ) | 1,645 | ||||||||||||||||||||||
PIMCO StocksPLUS® International (U.S. Dollar-Hedged) | 882,592 | 88,631 | (732,480 | ) | 27,171 | 253,719 | 41,089 | 40,087 | — | |||||||||||||||||||||||
PIMCO TRENDS Managed Futures Strategy | — | 733,239 | (94,418 | ) | (30,441 | ) | 611,226 | — | 2,846 | — | ||||||||||||||||||||||
Totals | $ | 27,448,559 | $ | 24,514,173 | $ | (28,080,474 | ) | $ | 390,374 | $ | 23,301,370 | $ | 525,997 | $ | 127,069 | $ | 246,383 | |||||||||||||||
| AllianzGI Global Allocation: | ||||||||||||||||||||||||||||||||
| Market Value 11/30/2014 | Purchases at Cost | Proceeds from Sales | Unrealized Appreciation (Depreciation) | Market Value 5/31/2015 | Dividend Income | Net Realized Gain (Loss) | Net Capital Gain Distributions Received | |||||||||||||||||||||||||
AllianzGI Behavioral Advantage Large Cap | $ | 8,221,846 | $ | 702,703 | $ | (8,336,164 | ) | — | — | $ | 105,112 | $ | 1,299,423 | $ | 597,591 | |||||||||||||||||
AllianzGI Best Styles Global Equity | 8,498,079 | 94,247,770 | (688,138 | ) | $ | 5,991,052 | $ | 107,104,967 | 217,003 | (20,791 | ) | 206,793 | ||||||||||||||||||||
AllianzGI Emerging Markets Opportunities | 4,255,106 | 76,386 | (4,112,314 | ) | — | — | 76,386 | 1,367,215 | — | |||||||||||||||||||||||
AllianzGI Global Managed Volatility | 6,380,384 | 740,726 | (6,501,421 | ) | — | — | 172,387 | 629,309 | 523,659 | |||||||||||||||||||||||
AllianzGI Global Natural Resources | 3,932,452 | 7,077 | (3,928,150 | ) | — | — | 7,077 | 842,869 | — | |||||||||||||||||||||||
AllianzGI Income & Growth | 4,210,588 | 29,851 | (4,194,897 | ) | — | — | 29,851 | 879,273 | — | |||||||||||||||||||||||
AllianzGI International Managed Volatility | 8,350,024 | 949,553 | (193,633 | ) | 1,843,503 | 9,350,549 | 332,262 | (1,320 | ) | — | ||||||||||||||||||||||
AllianzGI International Small-Cap | 3,313,156 | 308,463 | (3,364,633 | ) | — | — | 6,028 | 1,130,595 | 302,435 | |||||||||||||||||||||||
| Semiannual Report | | May 31, 2015 | 363 |
Table of Contents
Notes to Financial Statements (cont’d)
May 31, 2015 (Unaudited)
| AllianzGI Global Allocation (cont’d) | ||||||||||||||||||||||||||||||||
| Market Value 11/30/2014 | Purchases at Cost | Proceeds from Sales | Unrealized Appreciation (Depreciation) | Market Value 5/31/2015 | Dividend Income | Net Realized Gain (Loss) | Net Capital Gain Distributions Received | |||||||||||||||||||||||||
AllianzGI NFJ Dividend Value | $ | 12,510,549 | $ | 67,517 | $ | (12,616,792 | ) | — | — | $ | 67,517 | $ | 3,467,315 | — | ||||||||||||||||||
AllianzGI NFJ Global Dividend Value | 11,632,095 | 623,053 | (11,496,513 | ) | — | — | 177,173 | 1,733,845 | $ | 445,880 | ||||||||||||||||||||||
AllianzGI NFJ International Small-Cap Value | 2,096,762 | 218,899 | (2,071,911 | ) | — | — | 55,102 | (195,968 | ) | 163,797 | ||||||||||||||||||||||
AllianzGI NFJ International Value | 10,472,618 | 38,936 | (10,179,246 | ) | — | — | 38,936 | 777,520 | — | |||||||||||||||||||||||
AllianzGI NFJ Mid-Cap Value | 6,059,886 | 102,289 | (6,124,303 | ) | — | — | 102,289 | 609,236 | — | |||||||||||||||||||||||
AllianzGI Short Duration High Income | 10,412,267 | 4,380,945 | (689,740 | ) | $ | (11,975 | ) | $ | 14,196,150 | 355,347 | (22,769 | ) | — | |||||||||||||||||||
AllianzGI U.S. Managed Volatility | 16,976,055 | 1,665,122 | (5,801,706 | ) | 1,131,896 | 11,070,236 | 276,036 | (365,261 | ) | 1,137,518 | ||||||||||||||||||||||
PIMCO 15+ Year U.S. TIPS Index | — | 3,963,576 | (651,009 | ) | (258,397 | ) | 3,021,075 | — | (33,095 | ) | — | |||||||||||||||||||||
PIMCO 7-15 Year U.S. Treasury Index | — | 4,124,941 | — | 4,317 | 4,129,258 | 23,026 | — | 8,247 | ||||||||||||||||||||||||
PIMCO Commodities | 5,915,364 | 221,725 | (5,381,453 | ) | — | — | 151,843 | (1,907,976 | ) | — | ||||||||||||||||||||||
PIMCO Commodity RealReturn Strategy | — | 2,043,834 | — | (89,446 | ) | 1,954,388 | — | — | — | |||||||||||||||||||||||
PIMCO Emerging Markets Bond | 8,369,850 | 98,321 | (7,942,640 | ) | — | — | 36,852 | (728,378 | ) | 98,321 | ||||||||||||||||||||||
PIMCO Floating Income | 10,450,702 | — | (10,107,252 | ) | — | — | 55,452 | (677,655 | ) | — | ||||||||||||||||||||||
PIMCO Foreign Bond (U.S. Dollar-Hedged) | 3,179,318 | 181,388 | (3,208,764 | ) | — | — | 175,667 | 428,951 | 11,156 | |||||||||||||||||||||||
PIMCO Income | 17,235,145 | 8,367,844 | (8,411,223 | ) | 1,749,549 | 16,926,021 | 639,953 | (35,894 | ) | 38,611 | ||||||||||||||||||||||
PIMCO Investment Grade Corporate Bond | — | 9,047,548 | — | (282,636 | ) | 8,764,912 | 95,919 | — | — | |||||||||||||||||||||||
PIMCO Long-Term Credit | — | 10,215,983 | (10,718,893 | ) | — | — | 41,786 | 502,910 | — | |||||||||||||||||||||||
PIMCO Long-Term U.S. Government | — | 5,107,892 | (5,477,086 | ) | — | — | 9,010 | 369,194 | — | |||||||||||||||||||||||
PIMCO Mortgage Opportunities | 4,189,877 | 6,135,803 | (10,343,721 | ) | — | — | 38,395 | 68,362 | — | |||||||||||||||||||||||
PIMCO Real Return | — | 10,213,662 | (10,543,076 | ) | — | — | 10,035 | 329,414 | — | |||||||||||||||||||||||
PIMCO Senior Floating Rate | 7,321,724 | 14,713 | (7,235,613 | ) | — | — | 28,723 | (188,669 | ) | 13,611 | ||||||||||||||||||||||
PIMCO Short-Term | 8,334,726 | 637,898 | (8,830,608 | ) | — | — | 50,431 | (23,628 | ) | 40,611 | ||||||||||||||||||||||
PIMCO StocksPLUS® International (U.S. Dollar-Hedged) | 10,654,336 | 584,741 | (10,527,517 | ) | — | — | 596,449 | 64,200 | — | |||||||||||||||||||||||
Totals | $ | 192,972,909 | $ | 165,119,159 | $ | (179,678,416 | ) | $ | 10,077,863 | $ | 176,517,556 | $ | 3,972,047 | $ | 10,298,227 | $ | 3,588,230 | |||||||||||||||
| AllianzGI Global Dynamic Allocation: | ||||||||||||||||||||||||||||||||
| Market Value 11/30/2014 | Purchases at Cost | Proceeds from Sales | Unrealized Appreciation (Depreciation) | Market Value 5/31/2015 | Dividend Income | Net Realized Gain (Loss) | Net Capital Gain Distributions Received | |||||||||||||||||||||||||
AllianzGI Behavioral Advantage Large Cap | $ | 317,663 | $ | 26,221 | $ | (321,862 | ) | — | — | $ | 3,922 | $ | 49,644 | $ | 22,299 | |||||||||||||||||
AllianzGI Best Styles Emerging Markets Equity | — | 421,769 | — | $ | 27,320 | $ | 449,089 | — | — | — | ||||||||||||||||||||||
AllianzGI Best Styles Global Equity | 508,334 | 23,621 | (507,553 | ) | — | — | 11,620 | 23,689 | 12,001 | |||||||||||||||||||||||
AllianzGI Best Styles International Equity | — | 1,150,858 | — | 71,308 | 1,222,166 | — | — | — | ||||||||||||||||||||||||
AllianzGI Best Styles U.S. Equity | — | 1,230,895 | — | 26,263 | 1,257,158 | — | — | — | ||||||||||||||||||||||||
AllianzGI Emerging Markets Opportunities | 95,731 | 1,719 | (92,519 | ) | — | — | 1,719 | 35,417 | — | |||||||||||||||||||||||
AllianzGI Global Managed Volatility | 252,019 | 27,038 | (254,129 | ) | — | — | 6,696 | 24,406 | 20,342 | |||||||||||||||||||||||
AllianzGI Global Natural Resources | 145,991 | 9,912 | (155,347 | ) | — | — | 280 | 46,008 | — | |||||||||||||||||||||||
AllianzGI Income & Growth | 158,086 | 1,096 | (157,467 | ) | — | — | 1,096 | 38,737 | — | |||||||||||||||||||||||
| 364 | May 31, 2015 | | Semiannual Report |
Table of Contents
| AllianzGI Global Dynamic Allocation (cont’d) | ||||||||||||||||||||||||||||||||
| Market Value 11/30/2014 | Purchases at Cost | Proceeds from Sales | Unrealized Appreciation (Depreciation) | Market Value 5/31/2015 | Dividend Income | Net Realized Gain (Loss) | Net Capital Gain Distributions Received | |||||||||||||||||||||||||
AllianzGI International Managed Volatility | $ | 311,847 | $ | 94,694 | $ | (93,142 | ) | $ | 43,802 | $ | 323,906 | $ | 12,295 | $ | (756 | ) | — | |||||||||||||||
AllianzGI International Small-Cap | 155,170 | 15,529 | (155,002 | ) | — | — | 304 | 62,908 | $ | 15,225 | ||||||||||||||||||||||
AllianzGI NFJ Dividend Value | 254,570 | 1,325 | (256,707 | ) | — | — | 1,325 | 73,370 | — | |||||||||||||||||||||||
AllianzGI NFJ Emerging Markets Value | 49,089 | 1,933 | (46,818 | ) | — | — | 1,138 | (302 | ) | 795 | ||||||||||||||||||||||
AllianzGI NFJ Global Dividend Value | 251,415 | 13,282 | (248,434 | ) | — | — | 3,777 | 39,863 | 9,505 | |||||||||||||||||||||||
AllianzGI NFJ International Small-Cap Value | 156,054 | 16,292 | (154,204 | ) | — | — | 4,101 | 1,296 | 12,191 | |||||||||||||||||||||||
AllianzGI NFJ International Value | 217,398 | 808 | (211,308 | ) | — | — | 808 | 35,681 | — | |||||||||||||||||||||||
AllianzGI NFJ Mid-Cap Value | 281,142 | 4,706 | (284,082 | ) | — | — | 4,706 | 28,546 | — | |||||||||||||||||||||||
AllianzGI Short Duration High Income | 187,083 | 32,114 | (65,977 | ) | 593 | 153,168 | 4,322 | (1,453 | ) | — | ||||||||||||||||||||||
AllianzGI U.S. Managed Volatility | 505,573 | 146,969 | (249,633 | ) | 71,255 | 357,315 | 8,074 | 1,512 | 33,271 | |||||||||||||||||||||||
AllianzGI Ultra Micro Cap | 154,900 | 1,348 | (157,518 | ) | — | — | — | 18,165 | 1,348 | |||||||||||||||||||||||
PIMCO Broad U.S. TIPS Index | — | 210,041 | (203,884 | ) | — | — | — | (6,157 | ) | — | ||||||||||||||||||||||
PIMCO CommoditiesPLUS® Strategy | 293,978 | 17,029 | (271,466 | ) | — | — | 7,973 | (86,484 | ) | 433 | ||||||||||||||||||||||
PIMCO Commodity RealReturn Strategy | 149,678 | — | (137,306 | ) | — | — | — | (23,316 | ) | — | ||||||||||||||||||||||
PIMCO Emerging Markets Bond | — | 162,746 | — | (1,996 | ) | 160,750 | 643 | — | — | |||||||||||||||||||||||
PIMCO Income | 220,099 | 229,480 | (214,734 | ) | 2,587 | 231,578 | 5,890 | 18,509 | 489 | |||||||||||||||||||||||
PIMCO Investment Grade Corporate Bond | — | 897,681 | (431,523 | ) | 4,803 | 466,762 | 10,121 | (4,199 | ) | — | ||||||||||||||||||||||
PIMCO Long-Term Credit | — | 150,887 | — | (2,125 | ) | 148,762 | 3,028 | — | — | |||||||||||||||||||||||
PIMCO Mortgage Opportunities | 125,821 | 104,744 | (3,113 | ) | 2,094 | 228,211 | 3,244 | 6 | — | |||||||||||||||||||||||
PIMCO Mortgage-Backed Securities | — | 652,059 | (177,427 | ) | 1,876 | 477,678 | 3,976 | 1,170 | — | |||||||||||||||||||||||
PIMCO Short-Term | 437,032 | 2,089 | (433,896 | ) | — | — | 2,458 | (3,684 | ) | 2,089 | ||||||||||||||||||||||
PIMCO StocksPLUS® International (U.S. Dollar-Hedged) | 444,843 | — | (415,132 | ) | — | — | 24,815 | 4,202 | — | |||||||||||||||||||||||
Totals | $ | 5,673,516 | $ | 5,648,885 | $ | (5,700,183 | ) | $ | 247,780 | $ | 5,476,543 | $ | 128,331 | $ | 376,778 | $ | 129,988 | |||||||||||||||
| AllianzGI Global Megatrends: | ||||||||||||||||||||||||||||||||
| Market Value 2/2/2015* | Purchases at Cost | Proceeds from Sales | Unrealized Appreciation (Depreciation) | Market Value 5/31/2015 | Dividend Income | Net Realized Gain (Loss) | Net Capital Gain Distributions Received | |||||||||||||||||||||||||
AllianzGI Emerging Markets Consumer | — | $ | 600,000 | — | $ | 13,443 | $ | 613,443 | — | — | — | |||||||||||||||||||||
AllianzGI Global Natural Resources | — | 600,000 | — | 20,524 | 620,524 | — | — | — | ||||||||||||||||||||||||
AllianzGI Global Water | — | 600,000 | — | 28,015 | 628,015 | — | — | — | ||||||||||||||||||||||||
AllianzGI Health Sciences | — | 600,000 | — | 88,051 | 688,051 | — | — | — | ||||||||||||||||||||||||
AllianzGI Technology | — | 600,000 | — | 62,982 | 662,982 | — | — | — | ||||||||||||||||||||||||
Totals | — | $ | 3,000,000 | — | $ | 213,015 | $ | 3,213,015 | — | — | — | |||||||||||||||||||||
| AllianzGI Multi-Asset Real Return: | ||||||||||||||||||||||||||||||||
| Market Value 11/30/2014 | Purchases at Cost | Proceeds from Sales | Unrealized Appreciation (Depreciation) | Market Value 5/31/2015 | Dividend Income | Net Realized Gain (Loss) | Net Capital Gain Distributions Received | |||||||||||||||||||||||||
AllianzGI Global Natural Resources | $ | 953,434 | $ | 415,716 | — | $ | 79,218 | $ | 1,412,605 | $ | 1,716 | — | — | |||||||||||||||||||
PIMCO Commodity RealReturn Strategy | 1,128,836 | 264,000 | — | (294,403 | ) | 1,252,264 | — | — | — | |||||||||||||||||||||||
PIMCO Emerging Markets Bond | 299,666 | 3,520 | $ | (284,371 | ) | — | — | 1,320 | $ | (19,369 | ) | $ | 3,520 | |||||||||||||||||||
Rayonier Advanced Materials, Inc.† | 1,602 | — | — | (1,444 | ) | 1,072 | 9 | — | — | |||||||||||||||||||||||
Totals | $ | 2,383,538 | $ | 683,236 | $ | (284,371 | ) | $ | (216,629 | ) | $ | 2,665,941 | $ | 3,045 | $ | (19,369 | ) | $ | 3,520 | |||||||||||||
| † | Not affiliated at May 31, 2015. |
| * | Commencement of operations. |
| Semiannual Report | | May 31, 2015 | 365 |
Table of Contents
Notes to Financial Statements (cont’d)
May 31, 2015 (Unaudited)
| 12. | FUND EVENTS |
(a) New Funds
On December 1, 2014, AllianzGI Best Styles U.S. Equity Fund commenced operations as a series of the Trust, offering Class P, Institutional Class and Class R6 shares.
On December 1, 2014, AllianzGI Emerging Markets Consumer Fund and AllianzGI Emerging Markets Small-Cap Fund commenced operations as series of the Trust, offering Class A and Institutional Class shares.
On December 9, 2014, AllianzGI Best Styles Emerging Markets Equity Fund and AllianzGI Best Styles International Equity Fund commenced operations as series of the Trust, offering Class P, Institutional Class and Class R6 shares.
On December 9, 2014, AllianzGI Global Sustainability Fund commenced operations as a series of the Trust, offering Class A, Class P and Institutional Class shares.
On February 2, 2015, AllianzGI Global Megatrends Fund commenced operations as a series of the Trust, offering Class A, Class P and Institutional Class shares.
On February 2, 2015, AllianzGI Europe Equity Dividend Fund commenced operations as a series of the Trust, offering Class A, Class C, Class P and Institutional Class shares.
On February 2, 2015, AllianzGI International Growth Fund commenced operations as a series of the Trust, offering Class A and Institutional Class shares.
(b) New Share Classes
Effective December 22, 2014, AllianzGI Best Styles Global Equity Fund began offering Class P shares.
(c) Policy Change
Effective January 1, 2015, AllianzGI Global Allocation Fund revised its principal investment strategies, principal risks fees and expenses. The Fund seeks to achieve its investment objective through a combination of active allocation between asset classes and actively managed strategies within those asset classes. The Fund targets a long-term average strategic asset allocation of 60% to global equity exposure and 40% to fixed income exposure. Depending on market conditions, the equity component of the portfolio may range between approximately 50% and 70% of the Fund’s assets and the fixed income component of the portfolio may range between approximately 30% and 50% of the Fund’s assets. The Fund’s principal risks were revised to correspond with the changes to the Fund’s principal investment strategies.
Effective January 1, 2015, AllianzGI Global Dynamic Allocation Fund revised its principal investment strategies, principal risks, benchmarks and fees and expenses. The Fund seeks to achieve its investment objective through a combination of active allocation between asset classes and actively managed strategies within those asset classes. The Fund targets a long-term average strategic asset allocation of 60% to global equity exposure and 40% to fixed income exposure. Depending
on market conditions, the equity component of the portfolio may range between approximately 20% and 80% of the Fund’s assets and the fixed income component of the portfolio may range between approximately 20% and 80% of the Fund’s assets. The Fund’s principal risks were revised to correspond with the changes to the Fund’s principal investment strategies. The Fund added the Barclays U.S. Aggregate Bond Index and a custom blended index comprised of 60% MSCI ACWI and 40% Barclays U.S. Aggregate Bond Index as benchmarks.
Effective April 1, 2015, the Target Date Funds implemented a derivatives strategy that would enable each Target Date Fund to invest up to 10% of its assets in equity index futures and up to 10% of its assets in interest rate futures.
Effective April 1, 2015, AllianzGI Best Styles U.S. Equity Fund and AllianzGI U.S. Small-Cap Growth Fund define “U.S. companies” as those companies whose securities are traded in U.S. markets and that (i) are organized or headquartered in the United States or (ii) are designated as U.S. companies by commonly recognized market data services.
(d) Name Change
Effective February 2, 2015, AllianzGI Global Growth Allocation Fund changed its name to AllianzGI Global Dynamic Allocation Fund.
(e) Sales Charge Change
Effective April 1, 2015, AllianzGI Short Duration High Income Fund changed the sales charge for Class A and Class C. For Class A purchases in excess of $250,000, CDSC decreased from 1.00% to 0.50% and the CDSC period decreased from 18 months to 12 months. Class C upfront dealer commission increased from 0.55% to 0.75%.
(f) Reorganization
On March 23, 2015, the Board approved an Agreement and Plan of Reorganization pursuant to which the AllianzGI Behavioral Advantage Large Cap Fund would be reorganized on a tax-free basis with and into the Fuller & Thaler Behavioral Core Equity Fund, a corresponding, newly-created series of Capitol Series Trust (the “Reorganization”). The Reorganization is subject to the satisfaction of a number of conditions, including approval by the shareholders at a special meeting of the shareholders expected to be held in the fourth quarter of 2015. If the Reorganization is approved, Fuller & Thaler, the current sub-adviser of the AllianzGI Behavioral Advantage Large Cap, will serve as investment adviser to the Fuller & Thaler Behavioral Core Equity Fund.
| 13. | PAYMENTS FROM AFFILIATES |
During the fiscal year ended November 30, 2014, AllianzGI U.S. reimbursed AllianzGI Convertible, AllianzGI Global Fundamental Strategy, AllianzGI High Yield Bond and AllianzGI U.S. Equity Hedged $475,282, $575, $174,513 and $317, respectively for realized losses resulting from trading errors.
| 14. | SUBSEQUENT EVENTS |
In preparing these financial statements, the Funds’ management has evaluated events and transactions for potential recognition or disclosure through the date the financial statements were issued.
| 366 | May 31, 2015 | | Semiannual Report |
Table of Contents
On June 3, 2015, the Board approved a change to the Trust’s fiscal year end from November 30 to September 30. The change will be effective September 30, 2015.
Effective June 5, 2015, AllianzGI NFJ Global Dividend Value revised its principal investment strategy as follows: The Fund seeks to achieve its objective by normally investing primarily in common stocks of U.S. and non-U.S. companies with market capitalizations in excess of $100 million.
On June 18, 2015, the following Funds declared per-share net investment income dividends to shareholders, payable June 18, 2015 to shareholders of record on June 17, 2015.
| Fund Name | Class A | Class B | Class C | Class D | Class R | Class P | Institutional Class | Class R6 | Administrative Class | |||||||||||||||||||||||||||
AllianzGI Retirement Income | $ | 0.10448 | NA | $ | 0.07217 | $ | 0.10031 | $ | 0.08745 | $ | 0.11674 | NA | $ | 0.12330 | $ | 0.10693 | ||||||||||||||||||||
AllianzGI Global Allocation | 0.02673 | $ | 0.00001 | 0.00378 | 0.02691 | 0.02213 | 0.03396 | $ | 0.03407 | NA | 0.02625 | |||||||||||||||||||||||||
AllianzGI Convertible | 0.08616 | NA | 0.01641 | 0.07852 | 0.05784 | 0.10555 | 0.11402 | NA | 0.09062 | |||||||||||||||||||||||||||
AllianzGI Emerging Markets Debt | 0.12530 | NA | 0.09806 | NA | NA | 0.13077 | 0.13444 | NA | NA | |||||||||||||||||||||||||||
AllianzGI High Yield Bond | 0.04570 | NA | 0.04113 | 0.04764 | 0.04276 | 0.04960 | 0.05000 | NA | 0.04729 | |||||||||||||||||||||||||||
AllianzGI International Value II | 0.14328 | NA | 0.10770 | 0.14748 | NA | 0.15238 | 0.15184 | NA | NA | |||||||||||||||||||||||||||
AllianzGI NFJ Emerging Markets Value | 0.11022 | NA | 0.09037 | 0.10850 | NA | 0.10957 | 0.11669 | NA | NA | |||||||||||||||||||||||||||
AllianzGI NFJ Global Dividend Value | 0.18995 | NA | 0.15269 | 0.16453 | NA | 0.18318 | 0.20243 | NA | NA | |||||||||||||||||||||||||||
AllianzGI Short Duration High Income | 0.06000 | NA | 0.05620 | 0.05980 | NA | 0.06297 | 0.06383 | NA | NA | |||||||||||||||||||||||||||
On July 16, 2015, the following Funds declared per-share net investment income dividends to shareholders, payable July 16, 2015 to shareholders of record on July 15, 2015.
| Fund Name | Class A | Class C | Class D | Class R | Class P | Institutional Class | Administrative Class | |||||||||||||||||||||
AllianzGI High Yield Bond | $ | 0.04554 | $ | 0.04070 | $ | 0.04751 | $ | 0.04267 | $ | 0.04959 | $ | 0.05000 | $ | 0.04712 | ||||||||||||||
AllianzGI Short Duration High Income | 0.06000 | 0.05598 | 0.05988 | NA | 0.06255 | 0.06399 | NA | |||||||||||||||||||||
On July 23, 2015, the following Funds declared per-share net investment income dividends and/or short-term and long-term capital gain distributions to shareholders, payable July 23, 2015 to shareholders of record on July 22, 2015.
| Fund Name | Class A | Class C | Class D | Class R | Class P | Institutional Class | ||||||||||||||||||
AllianzGI China Equity | $ | 0.11524 | $ | 0.05304 | $ | 0.09343 | NA | $ | 0.00039 | $ | 0.00875 | |||||||||||||
AllianzGI International Small-Cap | 0.05389 | 0.03388 | 0.05760 | $ | 0.01987 | 0.01776 | 0.00001 | |||||||||||||||||
| Fund Name | Short-Term Capital Gains | Long-Term Capital Gains | ||||||||||||||
AllianzGI Retirement 2015 | NA | $ | 0.00697 | |||||||||||||
AllianzGI Retirement 2020 | NA | 0.02363 | ||||||||||||||
AllianzGI Retirement 2025 | NA | 0.01345 | ||||||||||||||
AllianzGI Retirement 2030 | NA | 0.03423 | ||||||||||||||
AllianzGI Retirement 2035 | NA | 0.03618 | ||||||||||||||
AllianzGI Retirement 2040 | NA | 0.06437 | ||||||||||||||
AllianzGI Retirement 2045 | NA | 0.07877 | ||||||||||||||
AllianzGI Retirement 2050 | NA | 0.09755 | ||||||||||||||
AllianzGI Retirement 2055 | NA | 0.13127 | ||||||||||||||
AllianzGI Retirement Income | NA | 0.02178 | ||||||||||||||
AllianzGI Global Allocation | NA | 0.00950 | ||||||||||||||
AllianzGI Global Dynamic Allocation | NA | 0.00693 | ||||||||||||||
AllianzGI Best Styles Global Equity | $ | 0.00226 | 0.00202 | |||||||||||||
AllianzGI China Equity | NA | 0.23855 | ||||||||||||||
AllianzGI Global Managed Volatility | NA | 0.38776 | ||||||||||||||
| Semiannual Report | | May 31, 2015 | 367 |
Table of Contents
Notes to Financial Statements (cont’d)
May 31, 2015 (Unaudited)
| Fund Name | Short-Term Capital Gains | Long-Term Capital Gains | ||||||||||||||
AllianzGI NFJ Global Dividend Value | NA | $ | 0.65455 | |||||||||||||
AllianzGI NFJ International Small-Cap Value | NA | 0.10143 | ||||||||||||||
AllianzGI NFJ International Value II | NA | 0.01950 | ||||||||||||||
AllianzGI Structured Return | NA | 0.00034 | ||||||||||||||
AllianzGI U.S. Equity Hedged | $ | 0.31119 | NA | |||||||||||||
On or about August 24, 2015, AllianzGI International Small-Cap is expected to revise its principal investment strategy as follows: The Fund seeks to achieve its objective by normally investing at least 80% of its net assets (plus borrowings made for investment purposes) in companies with smaller market capitalizations. The Fund currently defines companies with smaller market capitalizations as those with market capitalizations comparable to companies included in the MSCI World Small-Cap Index (between $18.4 million and $8.9 billion as of April 30, 2015). Under normal market and other conditions, the Fund expects to maintain a weighted-average market capitalization between 50% and 200% of the weighted-average market capitalization of the securities in the MSCI World Small-Cap Index, which as of April 30, 2015 would result in a weighted-average market capitalization ranging from $625 million to $2.5 billion.
There were no other subsequent events identified that require recognition or disclosure.
| 368 | May 31, 2015 | | Semiannual Report |
Table of Contents
Unaudited
Shareholder Meeting Results/Changes to Board of Trustees
Shareholder Meeting Results:
The Trust held a special shareholder meeting on December 18, 2014 for the election of Trustees to the Board.
Shareholders of the Trust voted as indicated below:
| Affirmative | Withholding Authority | |||||||
Re-election of Deborah A. Decotis | 169,787,171 | 3,064,959 | ||||||
Re-election of Bradford K. Gallagher | 169,677,709 | 3,174,421 | ||||||
Re-election of James A. Jacobson | 169,735,425 | 3,116,705 | ||||||
Re-election of Hans W. Kertess | 169,675,709 | 3,176,421 | ||||||
Re-election of William B. Ogden, IV | 169,655,209 | 3,196,921 | ||||||
Re-election of Alan Rappaport | 169,446,660 | 3,405,470 | ||||||
Election of F. Ford Drummond | 169,904,261 | 2,947,869 | ||||||
Election of Susan M. King* | 169,523,449 | 3,328,681 | ||||||
Election of James S. MacLeod | 169,879,451 | 2,972,679 | ||||||
Election of Davey S. Scoon | 169,833,621 | 3,018,509 | ||||||
Election of Julian Sluyters* | 169,609,020 | 3,243,110 | ||||||
| * | Interested Trustee |
There were no abstentions or broker non-votes with regards to this election.
Changes to Board of Trustees:
Effective December 18, 2014, John C. Maney resigned as a Trustee of the Trust.
Effective December 18, 2014, F. Ford Drummond, Susan M. King, James S. MacLeod, Davey S. Scoon and Julian Sluyters were elected as Trustees of the Trust.
| Semiannual Report | | May 31, 2015 | 369 |
Table of Contents
Unaudited
Matters Relating to the Trustees’ Consideration of the Investment Management and Sub-Advisory Agreements
The Investment Company Act of 1940, as amended (the “1940 Act”), requires that both the full Board of Trustees (the “Trustees”) and a majority of the Trustees who are not interested persons of the Trust (the “Independent Trustees”), voting separately, annually approve the continuation of (i) the Trust’s Amended and Restated Investment Management Agreement (the “Investment Management Agreement”) on behalf of each Renewal Fund (as defined below) with Allianz Global Investors Fund Management LLC (the “Investment Manager”), and (ii) the Sub-Advisory Agreements between the Investment Manager and the applicable sub-adviser for each Renewal Fund. The Investment Management Agreement and the Sub-Advisory Agreements are collectively referred to herein as the “Agreements.” The sub-advisers for the Renewal Funds include Allianz Global Investors U.S. LLC (“AllianzGI U.S.”), Fuller & Thaler Asset Management, Inc. (“F&T”) and NFJ Investment Group LLC (“NFJ”) (collectively, the “Sub-Advisers”).
The 1940 Act also requires that the Trustees and the Independent Trustees initially approve any new investment management or subadvisory agreement for a Fund (as defined below). New agreements approved for Funds covered by this report relate to the organization of AllianzGI Europe Equity Dividend Fund (the “Europe Equity Dividend Fund”), AllianzGI Global Megatrends Fund (the “Global Megatrends Fund”) and AllianzGI International Growth Fund (the “International Growth Fund”, and together with the Europe Equity Dividend Fund and the Global Megatrends Fund, the “New Funds”). At an in-person meeting held on December 17, 2014, the Board and the Independent Trustees unanimously approved, for an initial two-year term, (i) the Investment Management Agreement on behalf of each of the New Funds, each a new series of the Trust, and the Sub-Advisory Agreement between the Investment Manager and AllianzGI U.S. for each of the New Funds. The New Funds commenced operations on February 2, 2015.
With respect to the Renewal Funds, the Independent Trustees had a pre-meeting on March 4-5, 2015 with independent counsel to discuss the materials provided by the Investment Manager in response to the Independent Trustees’ written request for information regarding the annual renewals. Representatives from Fund management attended portions of that meeting to, among other topics, review the comparative fee and expense information and comparative performance information prepared and provided by Lipper, Inc. (“Lipper”) for each Renewal Fund and its Lipper peer group.
At an in-person meeting held on March 23, 2015, the Board and the Independent Trustees unanimously approved the continuation of the Agreements for an additional one-year period from April 1, 2015 through March 31, 2016 with respect to AllianzGI Retirement 2015 Fund (the “2015 Fund”), AllianzGI Retirement 2020 Fund (the “2020 Fund”), AllianzGI Retirement 2025 Fund (the “2025 Fund”), AllianzGI Retirement 2030 Fund (the “2030 Fund”), AllianzGI Retirement 2035 Fund (the “2035 Fund”), AllianzGI Retirement 2040 Fund (the “2040 Fund”), AllianzGI Retirement 2045 Fund (the “2045 Fund”), AllianzGI
Retirement 2050 Fund (the “2050 Fund”), AllianzGI Retirement 2055 Fund (the “2055 Fund”), AllianzGI Retirement Income Fund (the “Retirement Income Fund” and, together with the 2015 Fund, the 2020 Fund, the 2025 Fund, the 2030 Fund, the 2035 Fund, the 2040 Fund, the 2045 Fund, the 2050 Fund and the 2055 Fund, the “Retirement Funds”), AllianzGI Global Allocation Fund (the “Global Allocation Fund”), AllianzGI Global Dynamic Allocation Fund (the “Global Dynamic Fund” and, together with the Global Allocation Fund, the “Allocation Funds”), AllianzGI Best Styles Global Equity Fund (the “Best Styles Global Equity Fund”), AllianzGI China Equity Fund (the “China Equity Fund”), AllianzGI Convertible Fund (the “Convertible Fund”), AllianzGI Global Fundamental Strategy Fund (the “Global Fundamental Strategy Fund”), AllianzGI Global Managed Volatility Fund (the “Global Managed Volatility Fund”), AllianzGI Global Water Fund (the “Global Water Fund”), AllianzGI High Yield Bond Fund (the “High Yield Bond Fund”), AllianzGI International Small-Cap Fund (the “International Small-Cap Fund”), AllianzGI Micro Cap Fund (the “Micro Cap Fund”), AllianzGI Multi-Asset Real Return Fund (the “Multi-Asset Real Return Fund”), AllianzGI Short Duration High Income Fund (the “Short Duration High Income Fund”), AllianzGI Structured Return Fund (the “Structured Return Fund”), AllianzGI Ultra Micro Cap Fund (the “Ultra Micro Cap Fund”), AllianzGI U.S. Equity Hedged Fund (the “U.S. Equity Hedged Fund”), AllianzGI U.S. Small-Cap Growth Fund (“U.S. Small-Cap Growth Fund”, and, together with the Best Styles Global Equity Fund, the China Equity Fund, the Convertible Fund, the Global Fundamental Strategy Fund, the Global Managed Volatility Fund, the Global Water Fund, the High Yield Bond Fund, the International Small-Cap Fund, the Micro Cap Fund, the Multi-Asset Real Return Fund, the Short Duration High Income Fund, the Structured Return Fund, the Ultra Micro Cap Fund and the U.S. Equity Hedged Fund, the “AllianzGI Funds”), AllianzGI NFJ Emerging Markets Value Fund (the “NFJ Emerging Markets Value Fund”), AllianzGI NFJ Global Dividend Value Fund (the “NFJ Global Dividend Value Fund”), AllianzGI NFJ International Small-Cap Value Fund (the “NFJ International Small-Cap Value Fund”), AllianzGI NFJ International Value II Fund (the “NFJ International Value II Fund” and, together with the NFJ Emerging Markets Value Fund, the NFJ Global Dividend Fund and the NFJ International Small-Cap Value Fund, the “NFJ Funds”), and AllianzGI Behavioral Advantage Large Cap Fund (the “F&T Fund” and, together with the Retirement Funds, the Allocation Funds, the AllianzGI Funds and the NFJ Funds, the “Renewal Funds” and, together with the New Funds, the “Funds”).
The material factors and conclusions that formed the basis of these approvals for the Funds are discussed below.
The Independent Trustees were assisted in their evaluation of the Agreements and the factors that they deemed to be material, including those factors described below, by independent legal counsel, from whom they received separate legal advice and with whom they met separately from Fund management during their contract review meetings.
| 370 | May 31, 2015 | | Semiannual Report |
Table of Contents
In connection with their deliberations regarding the approval of the Agreements, the Trustees, including the Independent Trustees, considered such information and factors as they believed, in light of the legal advice furnished to them and their own business judgment, to be relevant. As described below, the Trustees considered the nature, extent and quality of the various investment management, administrative and other services to be performed by the Investment Manager and the Sub-Advisers under the Agreements.
In connection with their contract review meetings, the Trustees received and relied upon materials provided by the Investment Manager including, among other items: (i) information provided by Lipper, an independent third party, for the Renewal Funds on the investment performance of a group of funds with investment classifications and/or objectives comparable to those of the Renewal Funds identified by Lipper (the “Lipper performance universe”), the performance of applicable benchmark indices and the total return investment performance (based on net assets) of the Renewal Funds for various time periods; (ii) information compiled from Morningstar Direct (“Morningstar”), an independent third party, for the New Funds on the investment performance for various time periods, including annualized return performance information for certain time periods, of a group of funds with investment classifications and/or objectives comparable to those proposed for the New Funds; (iii) information on the New Funds’ management fees and other anticipated expenses and on the Renewal Funds’ management fees and other expenses and information compiled from Morningstar or provided by Lipper, as applicable, on the management fees and other expenses of comparable funds identified by Morningstar or Lipper, as applicable; (iv) to the extent applicable, information regarding the investment performance and fees for other funds and accounts managed by the Investment Manager and the Sub-Advisers, including institutional and separate accounts, with similar investment objective(s) and policies to those of the Renewal Funds; (v) with respect to the New Funds, information regarding the performance and fees of other accounts managed by the Investment Manager, AllianzGI U.S. or an affiliate with similar investment objective(s) and policies to those of the New Funds; (vi) an estimate of the profitability to the Investment Manager from its relationship with the New Funds during its first year and the estimated profitability to the Investment Manager from its relationship with the Renewal Funds for the twelve months ended December 31, 2014; (vii) descriptions of various functions performed or to be performed by the Investment Manager and the Sub-Advisers for the Funds, such as portfolio management, compliance monitoring and portfolio trading practices; and (viii) information regarding the overall organization of the Investment Manager and the Sub-Advisers, including information regarding senior management, portfolio managers and other personnel providing or proposed to provide investment management, administrative and other services to the Funds.
The Trustees’ conclusions as to the approval of the Agreements were based on a comprehensive consideration of all information provided
to the Trustees and not the result of any single factor. Some of the factors that figured particularly in the Trustees’ deliberations are described below, although individual Trustees may have evaluated the information presented differently from one another, giving different weights to various factors. The Trustees recognized that the fee arrangements for the Renewal Funds are the result of years of review and discussion between the Independent Trustees and the Investment Manager, that certain aspects of such arrangements may receive greater scrutiny in some years than in others, and that the Trustees’ conclusions may be based, in part, on their consideration of these same arrangements during the course of the year and in prior years. The Trustees evaluated information available to them on a Fund-by-Fund basis, and their determinations were made separately in respect of each Fund. However, they also took into account the common interests of all series of the Trust in their review. The Trustees also took into account that the Investment Manager had proposed the continuation of certain advisory fee waivers and expense caps for the Renewal Funds, with certain modifications for certain Renewal Funds and individual share classes, and had proposed to observe certain management fee waivers and/or expense limitations for the New Funds. The Trustees also considered the risk profiles of the Funds.
Performance Information
Fund-specific performance results for the Renewal Funds reviewed by the Trustees are discussed below. The comparative performance information was prepared and provided by Lipper and was not independently verified by the Trustees. Due to the passage of time, these performance results may differ from the performance results for more recent periods, including those shown elsewhere in this report. With respect to all Renewal Funds, the Trustees reviewed, among other information, comparative information showing performance for Class A and Institutional Class (or, in the case of the Retirement Funds, Class R6) shares of the Renewal Funds against their respective Lipper performance universes for the one-year, three-year, five-year and ten-year periods (to the extent each such Renewal Fund had been in existence) ended November 30, 2014. For Renewal Funds that commenced operations during the Trust’s fiscal year ended November 30, 2014, the Trustees reviewed comparative information showing performance for Class A and Institutional Class shares of the Renewal Funds against their respective Lipper performance universes for the period from the Renewal Fund’s inception through November 30, 2014. Institutional Class performance (or, in the case of the Retirement Funds, Class R6 performance) relative to the median for each Renewal Fund’s Lipper performance universe is described below, and for those Renewal Funds with performance that ranked below the median for their respective Lipper performance universes, the specific quintile rankings for Institutional Class shares are also noted below with respect to the relevant periods of underperformance.
Retirement Funds and Allocation Funds. For the 2015 Fund, performance was below median (in the fifth quintile) for the one-year,
| Semiannual Report | | May 31, 2015 | 371 |
Table of Contents
Unaudited
Matters Relating to the Trustees’ Consideration of the Investment Management and Sub-Advisory Agreements (cont’d)
three-year and five-year periods. For the 2020 Fund, performance was below median (in the fifth quintile) for the one-year, three-year and five-year periods. For the 2025 Fund, performance was below median (in the fifth quintile) for the one-year period. For the 2030 Fund, performance was below median (in the fifth quintile) for the one-year, three-year and five-year periods. For the 2035 Fund, performance was below median (in the fifth quintile) for the one-year period. For the 2040 Fund, performance was below median (in the fifth quintile) for the one-year, three-year and five-year periods. For the 2045 Fund, performance was below median (in the fifth quintile) for the one-year period. For the 2050 Fund, performance was below median (in the fifth quintile) for the one-year, three-year and five-year periods. For the 2055 Fund, performance was below median (in the fifth quintile) for the one-year period. For the Retirement Income Fund, performance was below median for the one-year, three-year and five-year periods (in the fourth quintile for the one-year and three-year periods and the third quintile for the five-year period). For the Global Dynamic Allocation Fund, performance was below median (in the fourth quintile) for the one-year and above median for the three-year and five-year periods. For the Global Allocation Fund, performance was below median for the one-year, three-year and five-year periods (in the fifth quintile for the one-year period and the fourth quintile for the three- and five-year periods) and above median for the ten-year period.
AllianzGI Funds. For the Best Styles Global Equity Fund, performance was above median in the period since the Fund’s inception. For the Convertible Fund, performance was above median for the one-year, three-year, five-year and ten-year periods. For the High Yield Bond Fund, performance was below median for the one-year and three-year periods (in the fourth and third quintile, respectively), and above median for the five-year and ten-year periods. For the Global Managed Volatility Fund, performance was above median for the one-year period. For the Micro Cap Fund, performance was below median for the one-year and five-year periods (in the fourth and third quintile, respectively), and above median for the three-year and ten-year periods. For the Multi-Asset Real Return Fund, performance was below median (in the fifth quintile) for the one-year period. For the Structured Return Fund, performance was above median for the one-year period. For the Ultra Micro Cap Fund, performance was below median (in the fifth quintile) for the one-year period, and above median for the three-year and five-year periods. For the U.S. Small-Cap Growth Fund, performance was below median (in the fourth quintile) for the one-year and five-year periods, and above median for the three-year and ten-year periods. For the U.S. Equity Hedged Fund, performance was above median for the one-year period. For the China Equity Fund, performance was above median for the one-year period, and below median (in the fourth quintile) for the three-year period. For the Global Water Fund, performance was above median for the one-year, three-year and five-year periods. For the International Small-Cap Fund, performance was below median (in the fifth quintile) for the one-year period, and above median for the three-year, five-year
and ten-year periods. For the Short Duration High Income Fund, performance was below median (in the fourth and fifth quintile, respectively) for the one-year and three-year periods. For the Global Fundamental Strategy Fund, performance was above median for the one-year period.
NFJ Funds. For the NFJ Emerging Markets Value Fund, performance was above median for the one-year period. For the NFJ Global Dividend Value Fund, performance was below median (in the fourth quintile) for the one-year and five-year periods, and above median for the three-year period. For the NFJ International Small-Cap Value Fund, performance was above median for the one-year period. For the NFJ International Value II Fund, performance was above median for the one-year period.
F&T Fund. For the F&T Fund, performance was above median for the one-year period and three-year periods.
In addition, the Trustees considered matters bearing on the Renewal Funds and their advisory arrangements at their meetings throughout the year, including a review of performance data at each regular meeting.
As part of their review, the Trustees examined the ability of the Investment Manager and the Sub-Advisers to provide high-quality investment management and other services to the Funds. Among other information, the Trustees considered the investment philosophy and research and decision making processes of the Sub-Advisers; the experience of key advisory personnel of the Sub-Advisers or their affiliates, as applicable, responsible for portfolio management of the Funds; the ability of the Investment Manager and the Sub-Advisers to attract and retain capable personnel; and the capability of the senior management and staff of the Investment Manager and the Sub-Advisers. In addition, the Trustees reviewed the quality of the Investment Manager’s and the Sub-Advisers’ services or expected services with respect to regulatory compliance and ability to comply with the investment and compliance policies and procedures of the Funds; the nature, extent and quality of certain administrative services the Investment Manager is responsible for providing to the Renewal Funds and would be responsible for providing to the New Funds; and conditions that might affect the ability of the Investment Manager or the Sub-Advisers to provide high quality services to the Funds in the future under the Agreements, including each organization’s respective financial condition and operational stability. Based on the foregoing, the Trustees concluded that the Sub-Advisers’ investment process, research capabilities and philosophy were well-suited to each Fund given its investment objectives and policies, and that the Investment Manager and the Sub-Advisers would be able to meet and/or continue to meet any reasonably foreseeable obligations under each Agreement.
Fee and Expense Information
In assessing the reasonableness of the Renewal Funds’ fees and expenses under the Agreements, the Trustees considered, among
| 372 | May 31, 2015 | | Semiannual Report |
Table of Contents
other information, each Renewal Fund’s management fee (or, in the case of the Retirement Funds, each Retirement Fund’s advisory fee) and the Renewal Fund’s total expense ratio as a percentage of average daily net assets and the management fees and total expense ratios of peer groups of funds based on information provided by Lipper. The Trustees also noted the management fee waiver and/or expense limitation agreements observed by the Investment Manager for the Renewal Funds that cap fees or expenses of their various share classes, as certain were proposed to be modified by the Investment Manager. The Trustees also considered, among other items: (i) the level of the Funds’ Sub-Advisory fees; (ii) the allocation of the Management Fee between the Investment Manager and the Sub-Advisers, and the services provided by the Investment Manager, on the one hand, and the Sub-Advisers, on the other hand; and (iii) that the Investment Manager (and not the Funds) pays the Sub-Advisory fees.
In assessing the reasonableness of the New Funds’ proposed fees under the Agreements, the Trustees considered, among other information, the New Funds’ proposed management fee and its expected net expense ratio as a percentage of anticipated average daily net assets, taking into account the management fee waiver and/or expense limitation arrangements that the Investment Manager would observe, and the advisory fees and net expense ratios of a peer group of funds based on information compiled from Morningstar.
The Trustees considered how the net expense ratio of each New Fund was expected to compare to its Morningstar peers, and considered comparisons of each New Fund’s proposed management fee with the advisory fees of the peer funds. The Trustees took into account that a comparison of the Europe Equity Dividend Fund’s and the International Growth Fund’s proposed management fee to the advisory fee of peer funds is complicated because the Europe Equity Dividend Fund’s and the International Growth Fund’s proposed management fee includes a component for administrative services while many peer funds have separate advisory and administration agreements with separate fees. The Trustees therefore placed significant emphasis on the estimated net expense ratio of the Europe Equity Dividend Fund and the International Growth Fund compared to the net expense ratios of the Morningstar peer funds, recognizing that the fees for investment advisory, administrative services and fund operating expenses would be subsumed within the net expense ratio of all funds. The Trustees noted that Global Megatrends Fund is proposed to have no management fee, but would indirectly bear the management fees and other expenses of the affiliated underlying funds in which it would invest. The Independent Trustees placed significant emphasis on the estimated net expense ratios of Global Megatrends Fund compared to the net expense ratios of the Morningstar peer funds.
In comparing the Renewal Funds to their respective Lipper peers, with respect to expenses, the Trustees noted that the Renewal Funds (other than the Retirement Funds) were not charged a separate administration fee, recognizing that their management fee includes a
component for administrative services, while many peer funds in the Lipper categories have separate advisory and administration agreements with separate fees. The Trustees also took into account the “unitary” administrative fee structure applicable to the Retirement Funds, under which certain third-party services that are ordinarily the financial responsibility of a mutual fund (e.g., audit, custody, accounting, legal, transfer agency, and printing services) are, in the case of the Retirement Funds, paid for by the Investment Manager out of the administrative fee.
The Trustees also considered information showing the advisory fees charged by the Investment Manager and Sub-Advisers to other funds and accounts, including institutional and separate accounts, with similar investment objective(s) and policies to those of the Renewal Funds, if any. In comparing these fees, the Trustees considered information provided by the Investment Manager as to the generally broader and more extensive services provided to the Renewal Funds in comparison to institutional or separate accounts, the higher demands placed on the Investment Manager’s investment personnel and trading infrastructure as a result of the daily cash in-flows and out-flows of the Renewal Funds, the greater entrepreneurial risk in managing retail mutual funds, and the impact on the Investment Manager and expenses associated with the more extensive regulatory regime to which the Renewal Funds are subject in comparison to institutional or separate accounts.
With respect to the New Funds, the Trustees also considered the management fees charged by the Investment Manager, AllianzGI U.S. or an affiliate to other funds and accounts with similar investment strategies to the New Funds.
The Trustees noted that Global Megatrends Fund would have no management fee, and that the estimated net expense ratio for Class A shares of Global Megatrends Fund was lower than the median for Class A shares of the Fund’s peer funds, and that the estimated net expense ratio for Institutional Class shares of Global Megatrends Fund was higher than the median for Institutional Class shares of the Fund’s peer funds, measured as of October 30, 2014.
The Trustees noted that the proposed management fees and estimated net expense ratios for Class A and Institutional Class shares of Europe Equity Dividend Fund were lower than the median for Class A and Institutional Class shares, respectively, of the Fund’s peer funds, measured as of October 30, 2014.
The Trustees noted that the proposed management fees and estimated net expense ratios for Class A and Institutional Class shares of International Growth Fund were lower than the median for Class A and Institutional Class shares, respectively, of the Fund’s peer funds, measured as of October 30, 2014.
The Trustees reviewed information provided by Lipper comparing each Renewal Fund’s advisory fee or management fee, as applicable, and ratios of total expenses to net assets (“total expense ratios”) for two share classes (Class A and Institutional Class share classes (or, in
| Semiannual Report | | May 31, 2015 | 373 |
Table of Contents
Unaudited
Matters Relating to the Trustees’ Consideration of the Investment Management and Sub-Advisory Agreements (cont’d)
the case of the Retirement Funds, Class R6)) to those of a group of comparable funds for the most recent fiscal year ended November 30, 2014. Class A shares of the applicable Lipper-selected group of comparable funds are referred to below as the “retail expense group,” and Institutional Class or Class R6 shares, as applicable, are referred to as the “institutional expense group.” The Trustees noted that the Lipper data takes into account any fee reductions or expense limitations that were in effect during a Renewal Fund’s last fiscal year. The Fund-specific fee and expense results discussed below were prepared and provided by Lipper and were not independently verified by the Trustees. The Renewal Funds’ fee and expense rankings are discussed below relative to the median of the applicable Lipper-selected group of comparable funds. A Renewal Fund whose fees and expenses were below median had fees and expenses that were less than the median fees and expenses of its peer group, while a Renewal Fund whose fees and expenses were above median had fees and expenses that were higher than the median fees and expenses of its peer group. For those Renewal Funds whose fees or expenses were higher than the median, the specific quintile rankings are also noted below with respect to the relevant above-median fee or expense categories (unless quintile rankings were not provided to the Trustees by Lipper, in which case fund rankings are provided). For these purposes, higher fees and expenses result in a lower quintile ranking, with the first quintile being the highest and the fifth quintile being the lowest ranking. For example, a Renewal Fund with the highest fees and expenses relative to its peer group would rank in the fifth quintile, while a Renewal Fund with the lowest fees and expenses relative to its peer group would rank in the first quintile.
Retirement Funds and Allocation Funds. For the 2025 Fund, 2030 Fund, 2040 Fund, 2050 Fund and Retirement Income Fund, advisory fees and total expense ratios (taking fee waivers and/or expense limitations into account) were below median for both the retail and institutional expense groups. For the 2015 Fund, 2020 Fund, 2035 Fund and 2045 Fund, advisory fees were below median for both the retail and institutional expense groups, and total expense ratios (taking fee waivers and/or expense limitations into account) were at median for the retail expense group and below median for the institutional expense group. For the 2055 Fund, advisory fees were below median for both the retail and institutional expense groups, and total expense ratios (taking fee waivers and/or expense limitations into account) were above median (in the fourth quintile) for the retail expense group and below median for the institutional expense group. For the Global Dynamic Allocation Fund, management fees were above median (in the fourth quintile) for both the retail and institutional expense groups, and total expense ratios (taking fee waivers and/or expense limitations into account) were below median for both the retail and institutional expense groups. For the Global Allocation Fund, management fees were above median (in the fifth quintile) for both the retail and institutional expense groups, and total expense ratios (taking fee waivers and/or expense limitations into account) were below median for both the retail and institutional expense groups.
AllianzGI Funds. For the Convertible Fund, management fees were at the median for both the retail and institutional expense groups, and total expense ratios (taking fee waivers and/or expense limitations into account) were below median for both the retail and institutional expense groups. For the Best Styles Global Equity Fund, Global Fundamental Strategy Fund, Global Managed Volatility Fund, High Yield Bond Fund, Multi-Asset Real Return Fund, Short Duration High Income Fund, Structured Return Fund and U.S. Equity Hedged Fund, management fees and total expense ratios (taking fee waivers and/or expense limitations into account) were below median for both the retail and institutional expense groups. For the Micro Cap Fund, management fees were above median (in the fourth quintile) for both the retail and institutional expense groups, and total expense ratios (taking fee waivers and/or expense limitations into account) were below median for the retail expense group and above median (in the fourth quintile) for the institutional expense group. For the Ultra Micro Cap Fund, management fees and total expense ratios (taking fee waivers and/or expense limitations into account) were above median (in the fifth quintile) for both the retail and institutional expense groups. For the China Equity Fund, management fees and total expense ratios (taking fee waivers and/or expense limitations into account) were below median for the retail expense group and at median for the institutional expense group. For the Global Water Fund, management fees were above median (in the fourth quintile and fifth quintile, respectively) for both the retail and institutional expense groups, and total expense ratios (taking fee waivers and/or expense limitations into account) were above median (in the fourth quintile) for both the retail and institutional expense groups. For the International Small-Cap Fund, management fees were below median for both the retail and institutional expense groups, and total expense ratios (taking fee waivers and/or expense limitations into account) were below median for the retail expense group and above median (in the fourth quintile) for the institutional expense group. For the U.S. Small-Cap Growth Fund, management fees were below median for both the retail and institutional expense groups, and total expense ratios (taking fee waivers and/or expense limitations into account) were below median for the retail expense group and above median (in the fifth quintile) for the institutional expense group.
NFJ Funds. For the NFJ Emerging Markets Value Fund and the NFJ International Value II Fund, management fees and total expense ratios (taking fee waivers and/or expense limitations into account) were below median for both the retail and institutional expense groups. For the NFJ Global Dividend Value Fund, management fees were above the median (in the fourth quintile) for both the retail and institutional expense groups, and total expense ratios (taking fee waivers and/or expense limitations into account) were below median for both the retail and institutional expense groups. For the NFJ International Small-Cap Value Fund, management fees were below median for the retail expense group and at median for the institutional expense group, and total expense ratios (taking fee waivers and/or expense limitations into account) were at median for the retail expense group and below median for the institutional expense group.
| 374 | May 31, 2015 | | Semiannual Report |
Table of Contents
F&T Fund. For the F&T Fund, management fees and total expense ratios (taking fee waivers and/or expense limitations into account) were below median for both the retail and institutional expense groups.
The Trustees considered the estimated profitability to the Investment Manager of its relationship with each Renewal Fund and the estimated profitability to the Investment Manager of its relationship with each New Fund and determined that such profitability did not appear to be excessive. The Trustees considered the extent to which the Investment Manager and Sub-Advisers may realize economies of scale or other efficiencies in managing and supporting the Funds. The Trustees took into account that, as open-end investment companies, the Funds intend to raise additional assets, so as the assets of the Funds grow over time, certain economies of scale and other efficiencies may be realized through spreading certain fixed costs across a larger asset base or across a variety of products and services, while also taking into account the fee waiver and expense limitation arrangements observed by the Investment Manager for applicable Funds. Additionally, the Trustees considered so-called “fall-out benefits” to the Investment Manager, the Sub-Advisers and their affiliates, such as reputational value derived from serving as Investment Manager and Sub-Advisers to the Funds.
After reviewing these and other factors described herein, the Trustees concluded, within the context of their overall conclusions regarding the Agreements, that they were satisfied with the Investment Manager’s and Sub-Advisers’ responses and efforts relating to the investment performance of the Renewal Funds, including efforts to improve performance for underperforming Renewal Funds. With respect to the Renewal Funds, the Trustees also concluded that the fees payable under each Agreement represent reasonable compensation in light of the nature, extent and quality of services provided by the Investment Manager or Sub-Advisers, as the case may be, and should be continued. With respect to the New Funds, the Trustees also concluded the proposed fees payable under each Agreement represent reasonable compensation in light of the nature, extent and quality of services to be provided by the Investment Manager or the Sub-Adviser, as the case may be, and should be approved for an initial two-year period. Based on their evaluation of factors that they deemed to be material, including those factors described above, the Trustees, including the Independent Trustees, unanimously concluded that the continuation of the Agreements with respect to the Renewal Funds and initial approval of the Agreements with respect to the New Funds were in the interests of the applicable Funds and their shareholders, and should be approved.
| Semiannual Report | | May 31, 2015 | 375 |
Table of Contents
Unaudited
Please read this Policy carefully. It gives you important information about how Allianz Global Investors U.S. and its U.S. affiliates (“AllianzGI US,” “we” or “us”) handle non-public personal information (“Personal Information”) that we may receive about you. It applies to all of our past, present and future clients and shareholders of AllianzGI US and the funds and accounts it manages, advises, sub-advises, administers or distributes, and will continue to apply when you are no longer a client or shareholder. As used throughout this Policy, “AllianzGI US” means Allianz Global Investors U.S. LLC, Allianz Global Investors Fund Management LLC, Allianz Global Investors Distributors LLC, NFJ Investment Group LLC and the family of registered and unregistered funds managed by one or more of these firms. AllianzGI US is part of a global investment management group, and the privacy policies of other Allianz Global Investors entities outside of the United States may have provisions in their policies that differ from this Privacy Policy. Please refer to the website of the specific non-US Allianz Global Investors entity for its policy on privacy.
We Care about Your Privacy
We consider your privacy to be a fundamental aspect of our relationship with you, and we strive to maintain the confidentiality, integrity and security of your Personal Information. To ensure your privacy, we have developed policies that are designed to protect your Personal Information while allowing your needs to be served.
Information We May Collect
In the course of providing you with products and services, we may obtain Personal Information about you, which may come from sources such as account application and other forms, from other written, electronic, or verbal communications, from account transactions, from a brokerage or financial advisory firm, financial advisor or consultant, and/or from information you provide on our website.
You are not required to supply any of the Personal Information that we may request. However, failure to do so may result in us being unable to open and maintain your account, or to provide services to you.
How Your Information Is Shared
We do not disclose your Personal Information to anyone for marketing purposes. We disclose your Personal Information only to those service providers, affiliated and non-affiliated, who need the information for everyday business purposes, such as to respond to your inquiries, to perform services, and/or to service and maintain your account. This applies to all of the categories of Personal Information we collect about you. The affiliated and non-affiliated service providers who receive your Personal Information also may use it to process your transactions, provide you with materials (including preparing and mailing prospectuses and shareholder reports and gathering shareholder proxies), and provide you with account statements and other materials relating to your account. These service providers provide services at our direction, and under their agreements with us, are required to keep your Personal Information confidential and to use it only for providing the contractually required services. Our service providers may not use your Personal Information to market products and services to you except in conformance with applicable laws and regulations. We also may provide your Personal Information to your respective brokerage or financial advisory firm, custodian, and/or to your financial advisor or consultant.
In addition, we reserve the right to disclose or report Personal Information to non-affiliated third parties, in limited circumstances, where we believe in good faith that disclosure is required under law, to cooperate with regulators or law enforcement authorities or pursuant to other legal process, or to protect our rights or property, including to enforce our Privacy Policy or other agreements with you. Personal Information collected by us may also be transferred as part of a corporate sale, restructuring, bankruptcy, or other transfer of assets.
Security of Your Information
We maintain your Personal Information for as long as necessary for legitimate business purposes or otherwise as required by law. In maintaining this information, we have implemented appropriate procedures that are designed to restrict access to your Personal Information only to those who need to know that information in order to provide products and/or services to you. In addition, we have implemented physical, electronic and procedural safeguards to help protect your Personal Information.
| 376 | May 31, 2015 | | Semiannual Report |
Table of Contents
Privacy and the Internet
The Personal Information that you provide through our website, as applicable, is handled in the same way as the Personal Information that you provide by any other means, as described above. This section of the Policy gives you additional information about the way in which Personal Information that is obtained online is handled.
| n | Online Enrollment, Account Access and Transactions: When you visit our website, you can visit pages that are open to the general public, or, where available, log into protected pages to enroll online, access information about your account, or conduct certain transactions. Access to the secure pages of our website is permitted only after you have created a User ID and Password. The User ID and Password must be supplied each time you want to access your account information online. This information serves to verify your identity. When you enter Personal Information into our website (including your Social Security Number or Taxpayer Identification Number and your password) to enroll or access your account online, you will log into secure pages. By using our website, you consent to this Privacy Policy and to the use of your Personal Information in accordance with the practices described in this Policy. If you provide Personal Information to effect transactions on our website, a record of the transactions you have performed while on the site is retained by us. For additional terms and conditions governing your use of our website, please refer to the Investor Mutual Fund Access — Disclaimer which is incorporated herein by reference and is available on our website. |
| n | Cookies and Similar Technologies: Cookies are small text files stored in your computer’s hard drive when you visit certain web pages. Cookies and similar technologies help us to provide customized services and information. We use these technologies on our website to improve our website and services, including to evaluate the effectiveness of our site, and to enhance the site user experience. Because an industry-standard Do-Not-Track protocol is not yet established, our website will continue to operate as described in this Privacy Policy and will not be affected by any Do-Not-Track signals from any browser. |
Changes to Our Privacy Policy
We may modify this Privacy Policy from time-to-time to reflect changes in related practices and procedures, or applicable laws and regulations. If we make changes, we will notify you on our website and the revised Policy will become effective immediately upon posting to our website. We also will provide account owners with a copy of our Privacy Policy annually. We encourage you to visit our website periodically to remain up to date on our Privacy Policy. You acknowledge that by using our website after we have posted changes to this Privacy Policy, you are agreeing to the terms of the Privacy Policy as modified.
Obtaining Additional Information
If you have any questions about this Privacy Policy or our privacy related practices in the United States, you may contact us via our dedicated email at PrivacyUS@allianzgi.com.
| Semiannual Report | | May 31, 2015 | 377 |
Table of Contents
Allianz Multi-Strategy Funds
Trustees
Davey S. Scoon
Chairman of the Board of Trustees
Deborah A. DeCotis
F. Ford Drummond
Bradford K. Gallagher
James A. Jacobson
Hans W. Kertess
Susan M. King
James S. MacLeod
William B. Ogden, IV
Alan Rappaport
Julian Sluyters
Officers
Julian Sluyters
President & Chief Executive Officer
Lawrence G. Altadonna
Treasurer, Principal Financial & Accounting Officer
Thomas J. Fuccillo
Vice President, Secretary & Chief Legal Officer
Scott Whisten
Assistant Treasurer
Richard J. Cochran
Assistant Treasurer
Orhan Dzemaili
Assistant Treasurer
Thomas L. Harter
Chief Compliance Officer
Richard H. Kirk
Assistant Secretary
Paul Koo(1)
Assistant Secretary
Morley D. Campbell(2)
Assistant Secretary
Thomas W. Oliver(2)
Assistant Secretary
Investment Manager
Allianz Global Investors Fund Management LLC
1633 Broadway
New York, NY 10019
Sub-Advisers
Allianz Global Investors U.S. LLC
1633 Broadway
New York, NY 10019
Fuller & Thaler Asset Management, Inc.(3)
411 Borel Avenue, Suite 300
San Mateo, CA 94402
NFJ Investment Group LLC
2100 Ross Avenue, Suite 700
Dallas, TX 75201
Distributor
Allianz Global Investors Distributors LLC
1633 Broadway
New York, NY 10019
Custodian & Accounting Agent
State Street Bank & Trust Co.
801 Pennsylvania Avenue
Kansas City, MO 64105
Shareholder Servicing and Transfer Agents
Boston Financial Data Services, Inc.
(Class A, Class B, Class C, Class D and Class R shares)
P.O. Box 8050
Boston, MA 02266-8050
(Class P, Institutional Class, Class R6, and Administrative Class shares)
330 West 9th Street, 5th Floor
Kansas City, MO 64105
Independent Registered Public Accounting Firm
PricewaterhouseCoopers LLP
300 Madison Avenue
New York, NY 10017
Legal Counsel
Ropes & Gray LLP
Prudential Tower
800 Boylston Street
Boston, MA 02199
This report, including the financial information herein, is transmitted to the shareholders of the Funds for their information. It is not a prospectus, circular or representation intended for use in the purchase of shares of each Fund or any securities mentioned in this report.
The Financial information included herein is taken from the records of the Funds without examination by an independent registered public accounting firm, who did not express an opinion herein.
For Account Information
Contact your financial adviser, or if you receive account statements directly from Allianz Global Investors, you can also call (800) 988-8380 for Class A, B, C and R shares or (800) 498-5413 for Class D, P, Institutional, R6 and Administrative shares. Telephone representatives are available Monday-Friday 8:30 am to 6:00 pm Eastern Time. Or visit our website, us.allianzgi.com.
| (1) | Paul Koo is Assistant Secretary of the Trust with a limited authority to open, maintain and close certain custodial and trading accounts for all series of the Trust. |
| (2) | Morley D. Campbell and Thomas W. Oliver are Assistant Secretaries of the Trust with a limited authority to open, maintain and close certain custodial and trading accounts for AllianzGI NFJ Emerging Markets Value Fund. |
| (3) | Fuller & Thaler Asset Management, Inc. is an independently owned investment firm. |
Table of Contents
About Allianz Global Investors
Understand. Act. This two-word philosophy is at the core of what we do. To stand out as the investment partner our clients trust, we listen closely to understand their needs, then act decisively to deliver solutions. We are a diversified active investment manager with a strong parent company, a culture of risk management and $488 billion in assets under management.* With 24 offices in 18 countries and over 500 investment professionals, we provide global investment and research capabilities with consultative local delivery.
For more information about any of our investment solutions or client services, call your financial advisor or visit us.allianzgi.com.
Investors should consider the investment objectives, risks, charges and expenses of the above mentioned Funds carefully before investing. This and other information is contained in the Fund’s prospectus, which may be obtained by contacting your financial advisor, by visiting us.allianzgi.com or by calling 1-800-988-8380 (retail classes: A, B, C & R) or 1-800-498-5413 (Class P, Class R6, D, Institutional & Administrative classes). Please read the prospectus carefully before you invest or send money.
* Combined worldwide AUM as of March 31, 2015
Allianz Global Investors Fund Management LLC serves as the investment manager for the Allianz Funds and the Allianz Multi-Strategy Funds. Allianz Funds and the Allianz Multi-Strategy Funds are distributed by Allianz Global Investors Distributors LLC. © 2015. For information about any product, contact your financial advisor.
us.allianzgi.com
Receive this report electronically and eliminate paper mailings.
To enroll, go to us.allianzgi.com/edelivery
| AZ750SA_053115 |
AGI-2015-05-20-12330
Table of Contents
| ITEM 2. | CODE OF ETHICS |
| (a) | Not required in this filing. |
| ITEM 3. | AUDIT COMMITTEE FINANCIAL EXPERT |
Not required in this filing.
| ITEM 4. | PRINCIPAL ACCOUNTANT FEES AND SERVICES |
Not required in this filing.
| ITEM 5. | AUDIT COMMITTEE OF LISTED REGISTRANT |
Disclosure not required for open-end management investment companies.
| ITEM 6. | SCHEDULE OF INVESTMENTS |
| (a) | Schedule of Investments is included as part of the report to shareholders filed under Item 1 of this form. |
| (b) | Not applicable. |
| ITEM 7. | DISCLOSURE OF PROXY VOTING POLICIES AND PROCEDURES FOR CLOSED-END MANAGEMENT INVESTMENT COMPANIES |
Disclosure not required for open-end management investment companies.
| ITEM 8. | PORTFOLIO MANAGERS OF CLOSED-END MANAGEMENT INVESTMENT COMPANIES |
Disclosure not required for open-end management investment companies.
| ITEM 9. | PURCHASES OF EQUITY SECURITIES BY CLOSED-END MANAGEMENT INVESTMENT COMPANY AND AFFILIATED COMPANIES. |
Disclosure not required for open-end management investment companies.
| ITEM 10. | SUBMISSION OF MATTERS TO A VOTE OF SECURITY HOLDERS |
There were no material changes to the procedures by which shareholders may recommend nominees to the Fund’s Board of Trustees since the Fund’s last provided disclosure in response to this item.
| ITEM 11. | CONTROLS AND PROCEDURES |
| (a) | The registrant’s President and Treasurer, Principal Financial & Accounting Officer have concluded that the registrant’s disclosure controls and procedures (as defined in Rule 30a-3(c) under the Act (17 CFR 270.30a-3(c))), are effective based on their evaluation of these controls and procedures as of a date within 90 days of the filing date of this document. |
| (b) | There were no significant changes in the registrant’s internal control over financial reporting (as defined in Rule 30a-3(d) under the Act (17 CFR 270.30a-3(d))) that occurred during the second fiscal quarter of the period covered by this report that has materially affected, or is reasonably likely to materially affect, the registrant’s internal control over financial reporting. |
Table of Contents
| ITEM 12. | EXHIBITS |
(a) (1) Not required in this filing.
(a) (2) Exhibit 99.302 Cert. — Certification pursuant to Section 302 of the Sarbanes-Oxley Act of 2002
(a) (3) Not applicable
(b) Exhibit 99.906 Cert. — Certification pursuant to Section 906 of the Sarbanes-Oxley Act of 2002
Table of Contents
Signatures
Pursuant to the requirements of the Securities Exchange Act of 1934 and the Investment Company Act of 1940, the registrant has duly caused this report to be signed on its behalf by the undersigned, thereunto duly authorized.
| (Registrant) Allianz Funds Multi-Strategy Trust | ||
| By: | /s/ Julian Sluyters | |
| Julian Sluyters, | ||
| President & Chief Executive Officer | ||
| Date: | July 31, 2015 | |
| By: | /s/ Lawrence G. Altadonna | |
| Lawrence G. Altadonna | ||
| Treasurer, Principal Financial & Accounting Officer | ||
| Date: | July 31, 2015 | |
Pursuant to the requirements of the Securities Exchange Act of 1934 and the Investment Company Act of 1940, this report has been signed below by the following persons on behalf of the registrant and in the capacities and on the dates indicated.
| By: | /s/ Julian Sluyters | |
| Julian Sluyters, | ||
| President & Chief Executive Officer | ||
| Date: | July 31, 2015 | |
| By: | /s/ Lawrence G. Altadonna | |
| Lawrence G. Altadonna, | ||
| Treasurer, Principal Financial & Accounting Officer | ||
| Date: | July 31, 2015 | |